Embed Size (px)
Citation preview
The 2000 IAEA intercomparison of PIXE spectrumanalysis software
M. Blaauw a, J.L. Campbell b, S. Fazini�cc c,*, M. Jak�ssi�cc d, I. Orlic e, P. Van Espen f
a Interfaculty Reactor Institute, Delft University of Technology, Mekelweg 15, 2629 JB Delft, The Netherlandsb Guelph-Waterloo Program for Graduate Work in Physics, University of Guelph, Guelph, Canada, N1G 2W1
c International Atomic Energy Agency, P.O. Box 100, Wagramerstrasse 5, A-1400 Vienna, Austriad Rudjer Boskovic Institute, Bijenicka c. 54, 10000 Zagreb, Croatia
e Australian Nuclear Science and Technology Organization, Private Mail Bag 1, Menai, NSW 2234, Australiaf MiTAC, Department of Chemistry, University of Antwerp, Universiteitsplein 1, B-2610 Antwerp, Belgium
Abstract
Seven programs for analysis of PIXE spectra were compared using the 2000 IAEA test spectra, i.e. Geopixe, Gupix,
Pixan, Pixeklm, Sapix, Winaxil and Witshex. A systematic statistical study of the analysis results was performed based
on z-scores. The results indicate that most of the programs perform reasonably well with respect to peak areas. Except
for a very rare exception, the statistical analysis shows that the participants generally reported smaller uncertainties
than would have been expected from the reference uncertainty values. The results show that all the participants reported
a number of statistically significant ‘‘false hits’’ and ‘‘misses’’ in their reports. All this indicates that programs in general
still leave room for further improvements. � 2002 Elsevier Science B.V. All rights reserved.
1. Introduction
The IAEA has organized several intercompari-sons to compare the ability of computer programsfor spectral analysis to extract peak areas andcorresponding uncertainties. In all these inter-comparisons, the intention has been to isolate onlythe uncertainties of the spectral analysis from allother aspects of a method. The first intercompar-ison, organized in 1995, involved gamma ray anal-ysis software packages [1,2], and the second one,organized in 1997 involved alpha particle spectro-
metry software packages [3,4]. For both inter-comparisons, dedicated sets of test spectra wereprepared [5,6]. These test spectra are available fromthe IAEA [7,8].During the year 2000, the IAEA organized an
intercomparison of PIXE spectrum analysis soft-ware. Seven programs for analysis of PIXE spectraparticipated in the exercise. A systematic statisticalstudy of the analysis results has been performedbased on z-scores. A new set of test, reference andcalibration spectra was prepared for the inter-comparison. This set of spectra may be also usefulfor future intercomparisons or for testing newprograms in the development stage, and thereforeit is available from the IAEA.A somewhat similar intercomparison of spectral
data processing techniques in PIXE was organized
Nuclear Instruments and Methods in Physics Research B 189 (2002) 113–122
www.elsevier.com/locate/nimb
*Corresponding author. Tel.: +43-1-2600-21706; fax: +43-1-
26007.
E-mail address: [email protected] (S. Fazinic).
0168-583X/02/$ - see front matter � 2002 Elsevier Science B.V. All rights reserved.
PII: S0168-583X(01 )01016-3
in 1985 by Campbell et al. [9]. However, in themeantime new programs have been developed,the old ones improved and some are no longerin use. As in the case of gamma, alpha and otherspectroscopy methods, most PIXE laboratoriestoday tend to use one of the several existing easilyavailable data analysis computer codes. Severallaboratories use their own developed programs.Altogether there are about 10 computer codes usedby PIXE laboratories to process the measuredspectra.In a separate paper we described in detail how
the test, reference and calibration spectra wereacquired and reference values established [10]. Inthe current paper we present the intercomparisonresults. However, due to limited space and the hugeamount of data produced during the exercise, herewe will concentrate on selective groups of results,which will indicate general trends and observedproblems. The complete results of the intercom-parison exercise with all details (and with attachedCD-ROM containing all spectra) will be given in areport that is currently in preparation [11].
2. Intercomparison method
The intercomparison has been based on a setof real measured spectra [10]. By using a multi-parameter data acquisition system, a set of highstatistics spectra corresponding to biological, aero-sol, glass and alloy samples were collected in listmode by recording all events one after another in asequential file. ‘‘Low statistics’’ test spectra wereprepared by taking every 10th count from themeasured list files. The rest of the counts were putin the ‘‘high statistics’’ reference spectra. The ex-pected peak area ratios between test spectra andreference spectra are 1:9 exactly. In addition, a setof single element thin film standards was used tomeasure 26 high statistics spectra, to be used forcalibration and establishment of peak area ratios.Peak shapes in PIXE spectra are generally
modeled by a Gaussian function with a low-energyexponential tail and/or shelf, ending in a longhorizontal feature extending to zero energy. Theparameters characterizing these aspects are X-ray-energy dependent and vary among X-ray detec-
tors. Since different peak shape models may beused by different programs, it appears impracticalto impose a specific definition of peak area. Evenafter normalization to e.g. the most intense peak inthe spectrum, the peak area ratios obtained mightvary from program to program. A result thatshould be the same for all analysis programs is theratio of the Ka12 or La12 peak area obtained froma test spectrum to the corresponding area obtainedfrom a single element standard spectrum with ex-cellent statistics (with each participant using his orher own peak area definition). It was thereforedecided to employ these ratios for intercomparisonpurposes.All the spectra (four test spectra and 26 single
element standard spectra) were supplied to possi-ble intercomparison participants in June 2000,with instructions and a questionnaire. Results onpeak areas and associated uncertainties from sevenlaboratories arrived within the specified timeframe. The authors of the current paper then met,processed the high statistics reference spectra toestablish reference ratios, and analyzed all results.The reference ratios Rref used for the inter-
comparison are defined as
Rref ¼1
nAref
Asingle-ref� 106 ¼ 1
9
ArefAsingle-ref
� 106; ð1Þ
where Aref is the principal peak area for a specificelement in the reference sample spectrum (aero,alloy, bio or glass), Asingle-ref is the correspond-ing peak area in the single element standard spec-trum, and n is a ratio of total number of counts ina reference spectrum and its corresponding testspectrum ðn ¼ 9Þ.The procedure used to extract the reference
ratios is explained in [10]. These ratios are com-pared with reported ratios Rrep defined as
Rrep ¼Arep
Asingle-rep� 106; ð2Þ
where Arep is the principal peak area for a specificelement in a test spectrum (aero, alloy, bio orglass) as reported by the intercomparison partici-pants, and Asingle-rep is the corresponding peak areafor the same element as above in the single elementstandard spectrum, also as reported by the inter-comparison participants.
114 M. Blaauw et al. / Nucl. Instr. and Meth. in Phys. Res. B 189 (2002) 113–122
The uncertainties in these ratios were taken tobe the relative uncertainties of the Arep ðArefÞ asreported by the intercomparison participants, i.e.the thin standard peak area uncertainties wereconsidered to be negligible.A statistical comparison of reported and refer-
ence peak area ratios was performed, based onstandardized residuals or z-scores, i.e. the differ-ences between reported values and reference valuesdivided by their own uncertainties.In the case of a ‘‘hit’’ (ratio reported both in the
reference results and in the test results), two z-scores could be computed: a z-score related to thequality of ratio determination based on the un-certainties in the reference files,
zref ¼Rrep � Rrefffiffiffiffiffiffiffiffiffiffiffiffiffiffiffiffiffiffiffiffiffiffinr2ref þ r2ref
p ¼ Rrep � Rrefffiffiffiffiffiffiffiffiffiffiffiffi10r2ref
p ; ð3Þ
and a z-score related to the statistical control ofthe analysis program based on both the referenceuncertainty and the uncertainty reported by theanalysis program,
zrep ¼Rrep � Rrefffiffiffiffiffiffiffiffiffiffiffiffiffiffiffiffiffiffiffiffir2rep þ r2ref
q ; ð4Þ
where Rref and Rrep are the reference and reportedpeak area ratios, rref and rrep their uncertainties,and n is defined by Eq. (1). The uncertainties arethe overall uncertainties at the 68% confidencelevel (i.e. 1r errors). While zref may be used toidentify potential biases in results, zrep indicates ifRref and Rrep are statistically different. The generallyaccepted criteria used to interpret the zrep valuesare as follows [12,13]:
From the z-scores, reduced sums of squares v2rcan be computed for any category of results with
v2r ¼1
N
XNi¼1
z2i ; ð5Þ
where N is the number of results in the category.If the reference ratio was missing, the reported
ratio was considered to be a false hit and only thesecond z-score could be computed, using zero bothas the reference ratio and as its uncertainty. If thereported ratio was missing, it was considered amiss and only the first z-score was computed.Missing a noisy peak or reporting a false hit with ahigh uncertainty in the ratio do not result in highz-scores and are therefore ‘‘allowed’’ in this test.From the z-scores, reduced sums of squares v2r
were computed for different categories of peaks:
• High-precision ratios: hits for which the ratio ofreference peak ratio and reference ratio uncer-tainty is larger than 10
ffiffiffin
p ðn ¼ 9Þ. The factorffiffiffin
ptakes account for the rref values being
ffiffiffin
p
smaller than the corresponding rrep.• Low-precision ratios: hits for which the ratio ofpeak area ratio and uncertainty was less than10
ffiffiffin
p.
• All matches: all peaks belonging to the previoustwo categories.
• Misses.• False hits.• Total: all previous categories.
For the three hit categories, two v2r -values werecomputed: one based on zrep values denoted v2r;rep,and one based on zref values denoted v2r;ref .
3. The participating programs
The participating programs are Geopixe [14],Gupix [15], Pixan [16], Pixeklm [17], Sapix [18],Winaxil [19] and Witshex [20].The peak area results reported by Geopixe
show the areas of the major line Ka (i.e. the sumof Ka1 and Ka2) up to Fe. It uses split Ka1, Ka2for higher Z. There is a similar strategy for Llines. Peak tails are considered for fitting the peakareas.Peak area ratios reported by Gupix were cal-
culated by using as a principal line Ka for all
Zrep score value Are Rref and Rrepstatistically different?
jzrepj < 1:64 No1:64 < jzrepj < 1:95 Probably not, but
more data is needed1:95 < jzrepj < 2:58 Not clear2:58 < jzrepj < 3:29 Probably yes, but more
data needed3:29 < jzrepj Yes
M. Blaauw et al. / Nucl. Instr. and Meth. in Phys. Res. B 189 (2002) 113–122 115
elements up to Z ¼ 16, Ka1 for all elements aboveZ ¼ 17 and La1 for heavy elements. Comptonpeak tails were considered and used for peaksabove 12 keV.The peak area results reported by Pixan were
given for Ka (i.e. the sum of Ka1 and Ka2) or infew cases for the La X-ray lines. Peak tails wereincluded in the fit and the corresponding tail areasadded to the total peak area. Spectra were fittedindividually (not in batch mode) and the back-ground shape was modified until a visually satis-factory fit was obtained.The peak area results reported by Pixeklm show
the areas of the major line Ka (i.e. the sum of Ka1and Ka2).The peak area results reported by Sapix for all
spectra are given as a list of Ka and Kb areas forall elements except Si where a K peak area is given.For elements where L lines were used, results weregiven as areas of up to 10 different lines of L series.In this case La1;2 areas were used for ratio com-putations. Only areas of principal lines (K, Ka andLa) were used to obtain ratios. Since no separationin overlapping peaks of Pb-La and As-Ka wasgiven in the case of the ‘‘bio’’ sample, Pb-Lb and
As-Kb were used to obtain area ratios in both testand single element spectrum.In case of Winaxil, for Al, Si and P, the area of
the K line (i.e. Ka þKb) was reported. For theelement S to Zr the area of the Ka (i.e. Ka1 þKa2)was reported. Areas of L lines are reported as La(i.e. La1 þ La2). The program was used and sepa-rate results reported in two modes: without (Win-axil1) and with (Winaxil2) peak tails accounted for.In case of Witshex, the results for all spectra
were given as a list of areas for the principal linesof elements. In all cases, Ka or La were used.Witshex was operated and separate results re-ported in two modes: by using the ‘‘parametricbackground’’ and by using the ‘‘rolling ball back-ground’’, to be referenced as Witshex1 and Wits-hex2 in the remainder of this report.
4. Results and discussion
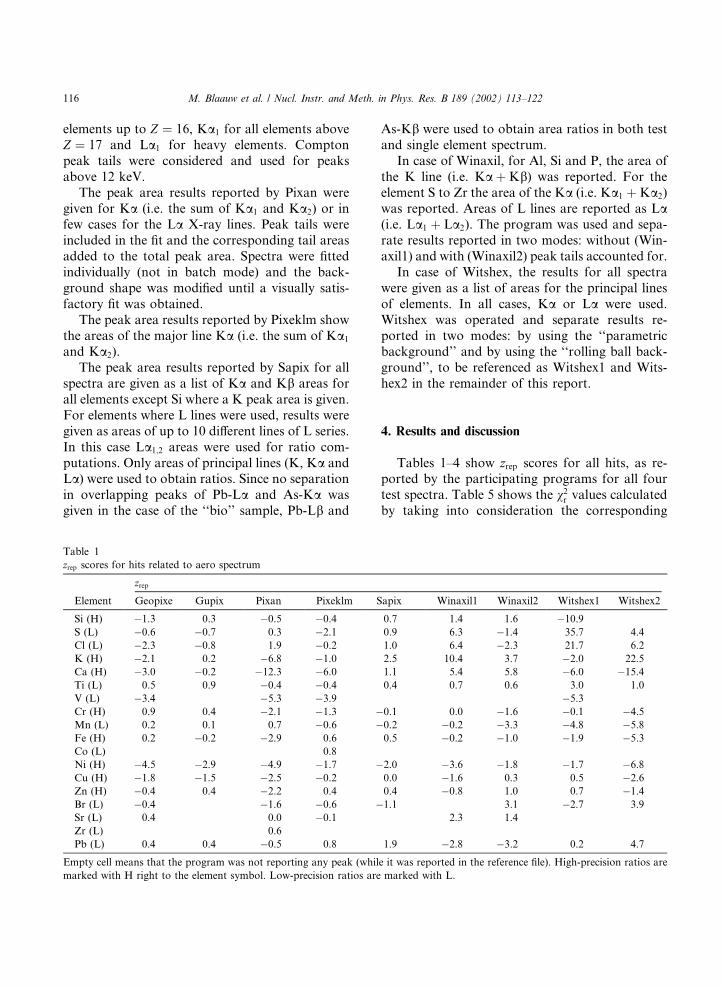
Tables 1–4 show zrep scores for all hits, as re-ported by the participating programs for all fourtest spectra. Table 5 shows the v2r values calculatedby taking into consideration the corresponding
Table 1
zrep scores for hits related to aero spectrum
zrep
Element Geopixe Gupix Pixan Pixeklm Sapix Winaxil1 Winaxil2 Witshex1 Witshex2
Si (H) �1.3 0.3 �0.5 �0.4 0.7 1.4 1.6 �10.9S (L) �0.6 �0.7 0.3 �2.1 0.9 6.3 �1.4 35.7 4.4
Cl (L) �2.3 �0.8 1.9 �0.2 1.0 6.4 �2.3 21.7 6.2
K (H) �2.1 0.2 �6.8 �1.0 2.5 10.4 3.7 �2.0 22.5
Ca (H) �3.0 �0.2 �12.3 �6.0 1.1 5.4 5.8 �6.0 �15.4Ti (L) 0.5 0.9 �0.4 �0.4 0.4 0.7 0.6 3.0 1.0
V (L) �3.4 �5.3 �3.9 �5.3Cr (H) 0.9 0.4 �2.1 �1.3 �0.1 0.0 �1.6 �0.1 �4.5Mn (L) 0.2 0.1 0.7 �0.6 �0.2 �0.2 �3.3 �4.8 �5.8Fe (H) 0.2 �0.2 �2.9 0.6 0.5 �0.2 �1.0 �1.9 �5.3Co (L) 0.8
Ni (H) �4.5 �2.9 �4.9 �1.7 �2.0 �3.6 �1.8 �1.7 �6.8Cu (H) �1.8 �1.5 �2.5 �0.2 0.0 �1.6 0.3 0.5 �2.6Zn (H) �0.4 0.4 �2.2 0.4 0.4 �0.8 1.0 0.7 �1.4Br (L) �0.4 �1.6 �0.6 �1.1 3.1 �2.7 3.9
Sr (L) 0.4 0.0 �0.1 2.3 1.4
Zr (L) 0.6
Pb (L) 0.4 0.4 �0.5 0.8 1.9 �2.8 �3.2 0.2 4.7
Empty cell means that the program was not reporting any peak (while it was reported in the reference file). High-precision ratios are
marked with H right to the element symbol. Low-precision ratios are marked with L.
116 M. Blaauw et al. / Nucl. Instr. and Meth. in Phys. Res. B 189 (2002) 113–122
z-scores summed for all four test spectra. Thesetables will be used as a basis for further discussionrelated to the reported peak area ratios, relateduncertainties and peak discrimination.
4.1. Peak area ratios
The intercomparison results of primary interestare, of course, the peak area ratios reported by the
participating programs. Because of the inherentuncertainties in the peak areas, a perfect match tothe reference ratios cannot be expected and theresults are tested in the statistical sense.The ‘‘aero’’ test spectrum has 8 high-precision
and 10 low-precision ratios. Table 1 shows thatmost of the ratios reported are not statistically dif-ferent from the reference values. In case of the high-precision ratios, there is statistical disagreement
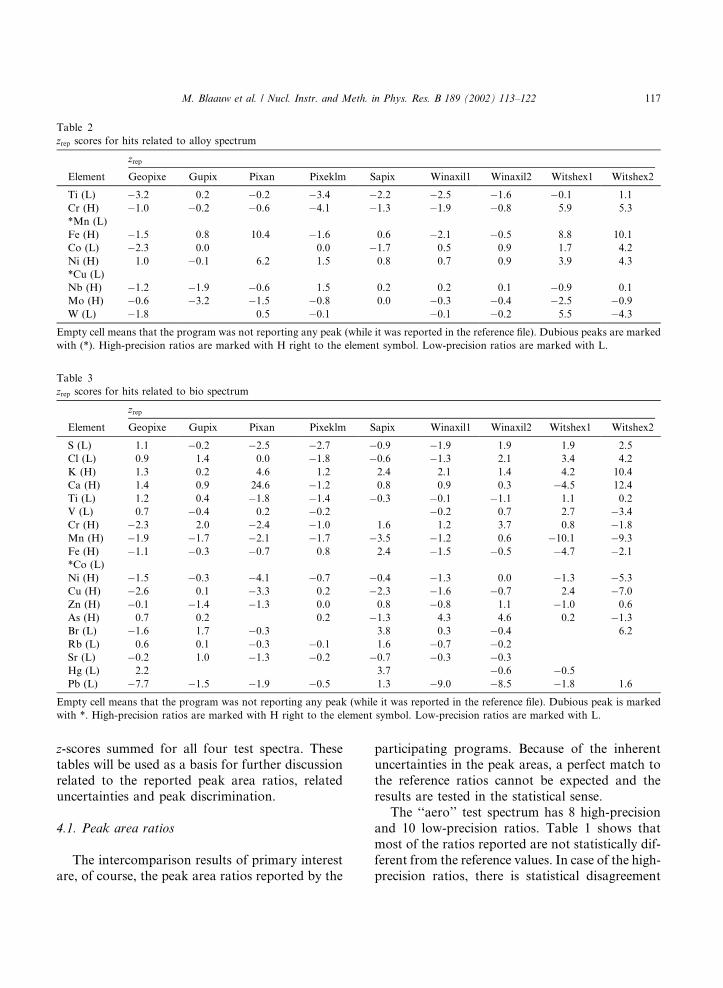
Table 2
zrep scores for hits related to alloy spectrum
zrep
Element Geopixe Gupix Pixan Pixeklm Sapix Winaxil1 Winaxil2 Witshex1 Witshex2
Ti (L) �3.2 0.2 �0.2 �3.4 �2.2 �2.5 �1.6 �0.1 1.1
Cr (H) �1.0 �0.2 �0.6 �4.1 �1.3 �1.9 �0.8 5.9 5.3
*Mn (L)
Fe (H) �1.5 0.8 10.4 �1.6 0.6 �2.1 �0.5 8.8 10.1
Co (L) �2.3 0.0 0.0 �1.7 0.5 0.9 1.7 4.2
Ni (H) 1.0 �0.1 6.2 1.5 0.8 0.7 0.9 3.9 4.3
*Cu (L)
Nb (H) �1.2 �1.9 �0.6 1.5 0.2 0.2 0.1 �0.9 0.1
Mo (H) �0.6 �3.2 �1.5 �0.8 0.0 �0.3 �0.4 �2.5 �0.9W (L) �1.8 0.5 �0.1 �0.1 �0.2 5.5 �4.3
Empty cell means that the program was not reporting any peak (while it was reported in the reference file). Dubious peaks are marked
with (*). High-precision ratios are marked with H right to the element symbol. Low-precision ratios are marked with L.
Table 3
zrep scores for hits related to bio spectrum
zrep
Element Geopixe Gupix Pixan Pixeklm Sapix Winaxil1 Winaxil2 Witshex1 Witshex2
S (L) 1.1 �0.2 �2.5 �2.7 �0.9 �1.9 1.9 1.9 2.5
Cl (L) 0.9 1.4 0.0 �1.8 �0.6 �1.3 2.1 3.4 4.2
K (H) 1.3 0.2 4.6 1.2 2.4 2.1 1.4 4.2 10.4
Ca (H) 1.4 0.9 24.6 �1.2 0.8 0.9 0.3 �4.5 12.4
Ti (L) 1.2 0.4 �1.8 �1.4 �0.3 �0.1 �1.1 1.1 0.2
V (L) 0.7 �0.4 0.2 �0.2 �0.2 0.7 2.7 �3.4Cr (H) �2.3 2.0 �2.4 �1.0 1.6 1.2 3.7 0.8 �1.8Mn (H) �1.9 �1.7 �2.1 �1.7 �3.5 �1.2 0.6 �10.1 �9.3Fe (H) �1.1 �0.3 �0.7 0.8 2.4 �1.5 �0.5 �4.7 �2.1*Co (L)
Ni (H) �1.5 �0.3 �4.1 �0.7 �0.4 �1.3 0.0 �1.3 �5.3Cu (H) �2.6 0.1 �3.3 0.2 �2.3 �1.6 �0.7 2.4 �7.0Zn (H) �0.1 �1.4 �1.3 0.0 0.8 �0.8 1.1 �1.0 0.6
As (H) 0.7 0.2 0.2 �1.3 4.3 4.6 0.2 �1.3Br (L) �1.6 1.7 �0.3 3.8 0.3 �0.4 6.2
Rb (L) 0.6 0.1 �0.3 �0.1 1.6 �0.7 �0.2Sr (L) �0.2 1.0 �1.3 �0.2 �0.7 �0.3 �0.3Hg (L) 2.2 3.7 �0.6 �0.5Pb (L) �7.7 �1.5 �1.9 �0.5 1.3 �9.0 �8.5 �1.8 1.6
Empty cell means that the program was not reporting any peak (while it was reported in the reference file). Dubious peak is marked
with *. High-precision ratios are marked with H right to the element symbol. Low-precision ratios are marked with L.
M. Blaauw et al. / Nucl. Instr. and Meth. in Phys. Res. B 189 (2002) 113–122 117
between the Ca reported and reference value formost of the programs. The reason for observeddifferences may be due to the overlapping Ca-Kaand K-Kb peaks with the high background in thearea of these two peaks in the aero test spectrum.There is also a level of statistical disagreementbetween the Ni ratios. The reason may be due tothe overlapping of Co-Kb and Cu-Ka peaks.Among the low-precision ratios, three programshave not reported the V ratio and the others show
statistical disagreement. The reason for this maybe due to the peak overlaps between the Ti, V andCr with the relatively high background. The peakarea ratios for Co and Zr have been reported byonly one program. A difficulty with the Co ratiosmay be due to the Fe, Co and Ni peak overlaps,while the Zr-Ka is very noisy peak, almost invisi-ble.The ‘‘alloy’’ spectrum has 5 high-precision and 5
low-precision ratios (two of them being dubious).
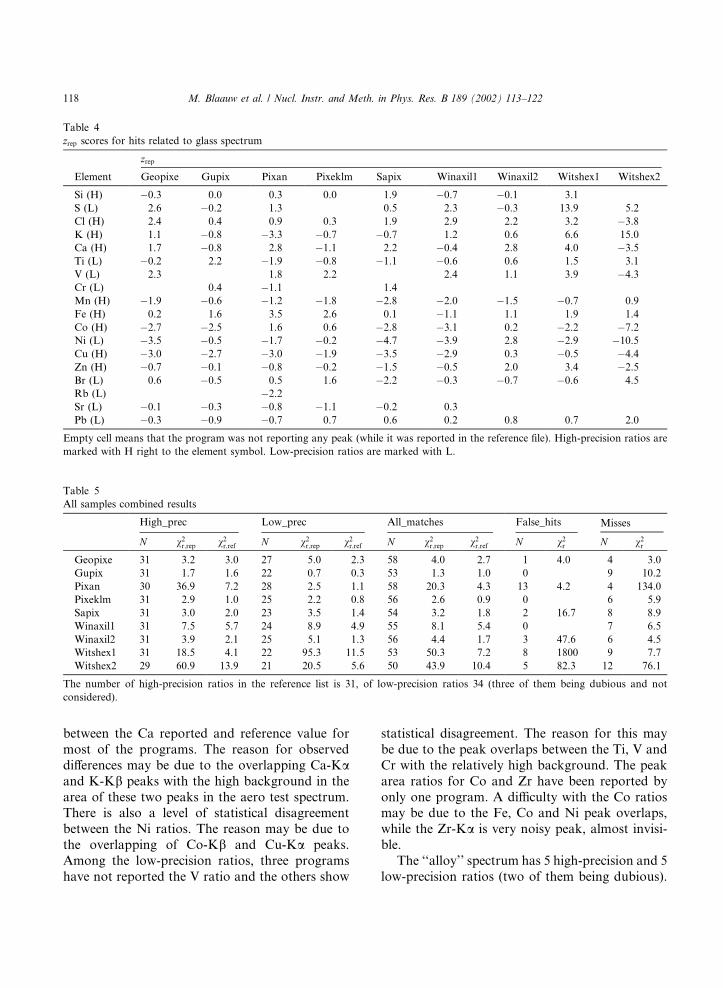
Table 4
zrep scores for hits related to glass spectrum
zrep
Element Geopixe Gupix Pixan Pixeklm Sapix Winaxil1 Winaxil2 Witshex1 Witshex2
Si (H) �0.3 0.0 0.3 0.0 1.9 �0.7 �0.1 3.1
S (L) 2.6 �0.2 1.3 0.5 2.3 �0.3 13.9 5.2
Cl (H) 2.4 0.4 0.9 0.3 1.9 2.9 2.2 3.2 �3.8K (H) 1.1 �0.8 �3.3 �0.7 �0.7 1.2 0.6 6.6 15.0
Ca (H) 1.7 �0.8 2.8 �1.1 2.2 �0.4 2.8 4.0 �3.5Ti (L) �0.2 2.2 �1.9 �0.8 �1.1 �0.6 0.6 1.5 3.1
V (L) 2.3 1.8 2.2 2.4 1.1 3.9 �4.3Cr (L) 0.4 �1.1 1.4
Mn (H) �1.9 �0.6 �1.2 �1.8 �2.8 �2.0 �1.5 �0.7 0.9
Fe (H) 0.2 1.6 3.5 2.6 0.1 �1.1 1.1 1.9 1.4
Co (H) �2.7 �2.5 1.6 0.6 �2.8 �3.1 0.2 �2.2 �7.2Ni (L) �3.5 �0.5 �1.7 �0.2 �4.7 �3.9 2.8 �2.9 �10.5Cu (H) �3.0 �2.7 �3.0 �1.9 �3.5 �2.9 0.3 �0.5 �4.4Zn (H) �0.7 �0.1 �0.8 �0.2 �1.5 �0.5 2.0 3.4 �2.5Br (L) 0.6 �0.5 0.5 1.6 �2.2 �0.3 �0.7 �0.6 4.5
Rb (L) �2.2Sr (L) �0.1 �0.3 �0.8 �1.1 �0.2 0.3
Pb (L) �0.3 �0.9 �0.7 0.7 0.6 0.2 0.8 0.7 2.0
Empty cell means that the program was not reporting any peak (while it was reported in the reference file). High-precision ratios are
marked with H right to the element symbol. Low-precision ratios are marked with L.
Table 5
All samples combined results
High_prec Low_prec All_matches False_hits Misses
N v2r;rep v2r;ref N v2r;rep v2r;ref N v2r;rep v2r;ref N v2r N v2r
Geopixe 31 3.2 3.0 27 5.0 2.3 58 4.0 2.7 1 4.0 4 3.0
Gupix 31 1.7 1.6 22 0.7 0.3 53 1.3 1.0 0 9 10.2
Pixan 30 36.9 7.2 28 2.5 1.1 58 20.3 4.3 13 4.2 4 134.0
Pixeklm 31 2.9 1.0 25 2.2 0.8 56 2.6 0.9 0 6 5.9
Sapix 31 3.0 2.0 23 3.5 1.4 54 3.2 1.8 2 16.7 8 8.9
Winaxil1 31 7.5 5.7 24 8.9 4.9 55 8.1 5.4 0 7 6.5
Winaxil2 31 3.9 2.1 25 5.1 1.3 56 4.4 1.7 3 47.6 6 4.5
Witshex1 31 18.5 4.1 22 95.3 11.5 53 50.3 7.2 8 1800 9 7.7
Witshex2 29 60.9 13.9 21 20.5 5.6 50 43.9 10.4 5 82.3 12 76.1
The number of high-precision ratios in the reference list is 31, of low-precision ratios 34 (three of them being dubious and not
considered).
118 M. Blaauw et al. / Nucl. Instr. and Meth. in Phys. Res. B 189 (2002) 113–122
All high-precision ratios reported by the partici-pants are in relatively good statistical agreementwith the reference values (Table 2). Regarding thelow-precision ratios, two programs have not re-ported the W ratio, and one of the programs re-ported the ratio in statistical disagreement withthe corresponding reference value. The reason forthese problems may be in the W-La and Ni-Kbpeak overlap, the W-L1 and Ni-Ka overlap, andinterference of the W-Lb/Lc peaks with the pile-uparea of the spectrum (between channels 420 and550). The two dubious ratios, for Mn and Cu, havenot been reported by any program.The ‘‘bio’’ spectrum has 9 high-precision and 10
low-precision ratios (one of them being dubious).Table 3 shows good statistical agreement betweenreported and reference ratios for almost all theprograms and the reported ratios. In case of thelow-precision ratios, there is some statistical dis-agreement for the Br, Hg and Pb ratios. Threeprograms have not reported the Hg peak ratio. Incase of Br, it may be due to the Br-Ka overlap withthe As-Kb and Br-Kb overlap with the Rb-Ka. Incase of Pb, the Pb-La overlaps with the As-Ka.Regarding Hg, its La peak is in the noisy areabetween the Zn-Kb and As-Ka peaks, and thegroup of its Lb peaks overlap with the As-Kb andBr-Ka.The ‘‘glass’’ spectrum has 9 high-precision and
9 low-precision ratios. Table 4 shows relativelygood statistical agreement between the reportedand the reference values for all the high-precisionpeak area ratios except for the Cu ratios. It is notclear why disagreement for the Cu ratios exists,since the Cu-Ka is a clear, high intensity peak. ItsKb peak slightly overlaps with the Zn-Ka but thisdoes not seem to be a problem. Regarding the low-precision ratios, the Rb ratio has been reported byonly one program. The Rb-Ka is a very low in-tensity peak close to the high energy side of thegroup of the higher intensity Pb-Lb lines. V and Crratios were not reported by two (four) programs.Their corresponding peaks are very small and onthe relatively high background. The V-Kb over-laps with the Cr-Ka, and Cr-Kb is almost lost inthe very high intensity Mn-Ka peak. Results forthe Ni ratios indicate a level of statistical dis-agreement between the reported and the reference
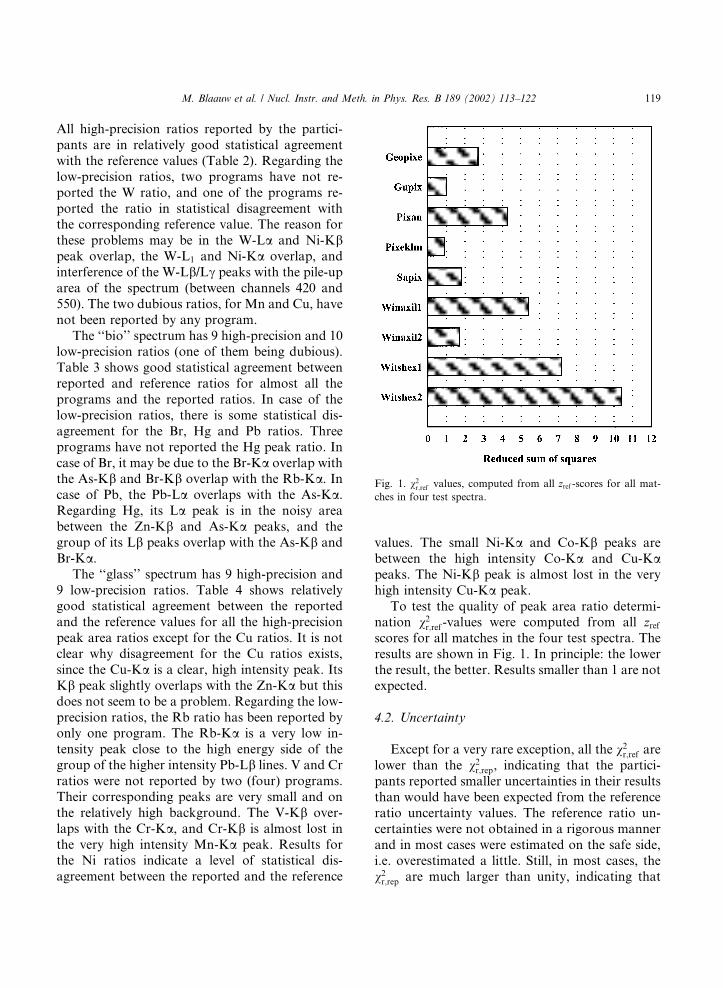
values. The small Ni-Ka and Co-Kb peaks arebetween the high intensity Co-Ka and Cu-Kapeaks. The Ni-Kb peak is almost lost in the veryhigh intensity Cu-Ka peak.To test the quality of peak area ratio determi-
nation v2r;ref -values were computed from all zrefscores for all matches in the four test spectra. Theresults are shown in Fig. 1. In principle: the lowerthe result, the better. Results smaller than 1 are notexpected.
4.2. Uncertainty
Except for a very rare exception, all the v2r;ref arelower than the v2r;rep, indicating that the partici-pants reported smaller uncertainties in their resultsthan would have been expected from the referenceratio uncertainty values. The reference ratio un-certainties were not obtained in a rigorous mannerand in most cases were estimated on the safe side,i.e. overestimated a little. Still, in most cases, thev2r;rep are much larger than unity, indicating that
Fig. 1. v2r;ref values, computed from all zref -scores for all mat-ches in four test spectra.
M. Blaauw et al. / Nucl. Instr. and Meth. in Phys. Res. B 189 (2002) 113–122 119
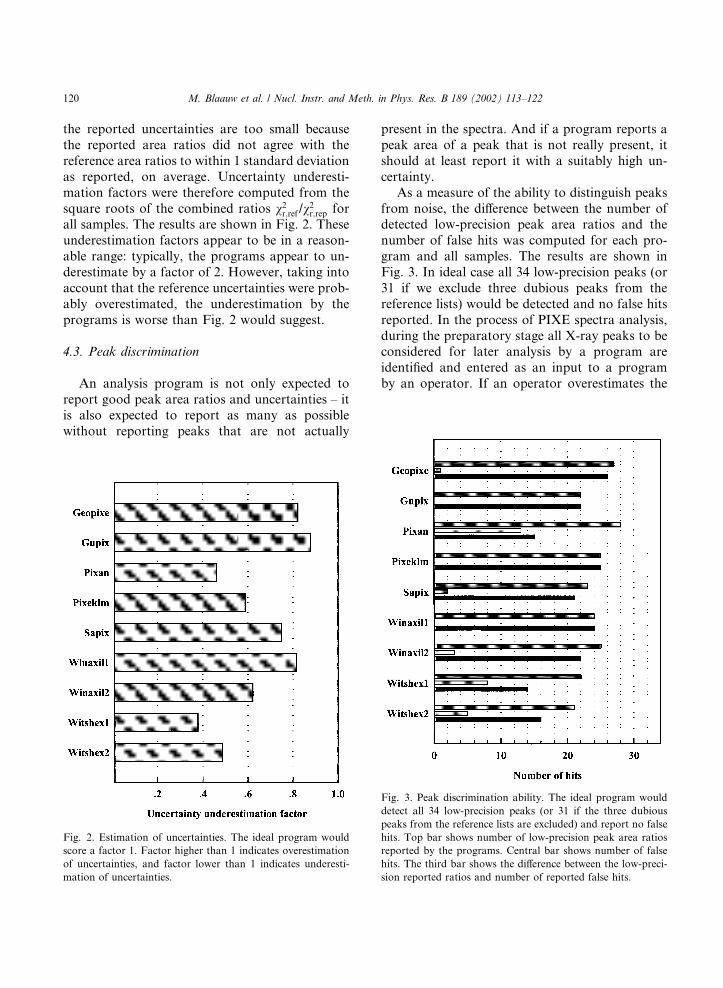
the reported uncertainties are too small becausethe reported area ratios did not agree with thereference area ratios to within 1 standard deviationas reported, on average. Uncertainty underesti-mation factors were therefore computed from thesquare roots of the combined ratios v2r;ref /v
2r;rep for
all samples. The results are shown in Fig. 2. Theseunderestimation factors appear to be in a reason-able range: typically, the programs appear to un-derestimate by a factor of 2. However, taking intoaccount that the reference uncertainties were prob-ably overestimated, the underestimation by theprograms is worse than Fig. 2 would suggest.
4.3. Peak discrimination
An analysis program is not only expected toreport good peak area ratios and uncertainties – itis also expected to report as many as possiblewithout reporting peaks that are not actually
present in the spectra. And if a program reports apeak area of a peak that is not really present, itshould at least report it with a suitably high un-certainty.As a measure of the ability to distinguish peaks
from noise, the difference between the number ofdetected low-precision peak area ratios and thenumber of false hits was computed for each pro-gram and all samples. The results are shown inFig. 3. In ideal case all 34 low-precision peaks (or31 if we exclude three dubious peaks from thereference lists) would be detected and no false hitsreported. In the process of PIXE spectra analysis,during the preparatory stage all X-ray peaks to beconsidered for later analysis by a program areidentified and entered as an input to a programby an operator. If an operator overestimates the
Fig. 2. Estimation of uncertainties. The ideal program would
score a factor 1. Factor higher than 1 indicates overestimation
of uncertainties, and factor lower than 1 indicates underesti-
mation of uncertainties.
Fig. 3. Peak discrimination ability. The ideal program would
detect all 34 low-precision peaks (or 31 if the three dubious
peaks from the reference lists are excluded) and report no false
hits. Top bar shows number of low-precision peak area ratios
reported by the programs. Central bar shows number of false
hits. The third bar shows the difference between the low-preci-
sion reported ratios and number of reported false hits.
120 M. Blaauw et al. / Nucl. Instr. and Meth. in Phys. Res. B 189 (2002) 113–122
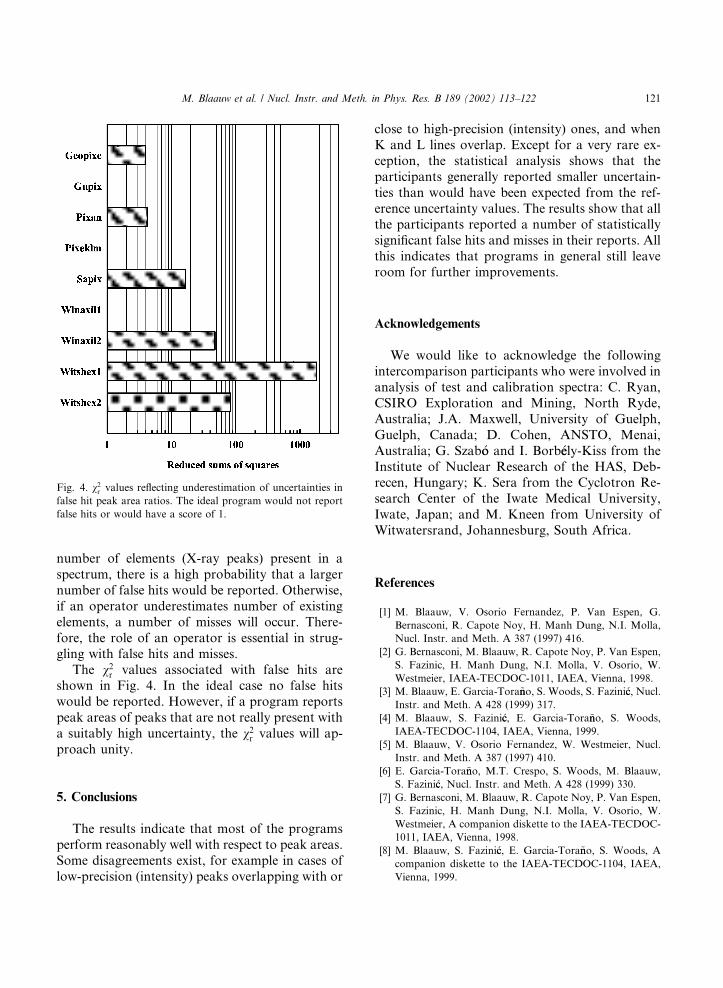
number of elements (X-ray peaks) present in aspectrum, there is a high probability that a largernumber of false hits would be reported. Otherwise,if an operator underestimates number of existingelements, a number of misses will occur. There-fore, the role of an operator is essential in strug-gling with false hits and misses.The v2r values associated with false hits are
shown in Fig. 4. In the ideal case no false hitswould be reported. However, if a program reportspeak areas of peaks that are not really present witha suitably high uncertainty, the v2r values will ap-proach unity.
5. Conclusions
The results indicate that most of the programsperform reasonably well with respect to peak areas.Some disagreements exist, for example in cases oflow-precision (intensity) peaks overlapping with or
close to high-precision (intensity) ones, and whenK and L lines overlap. Except for a very rare ex-ception, the statistical analysis shows that theparticipants generally reported smaller uncertain-ties than would have been expected from the ref-erence uncertainty values. The results show that allthe participants reported a number of statisticallysignificant false hits and misses in their reports. Allthis indicates that programs in general still leaveroom for further improvements.
Acknowledgements
We would like to acknowledge the followingintercomparison participants who were involved inanalysis of test and calibration spectra: C. Ryan,CSIRO Exploration and Mining, North Ryde,Australia; J.A. Maxwell, University of Guelph,Guelph, Canada; D. Cohen, ANSTO, Menai,Australia; G. Szab�oo and I. Borb�eely-Kiss from theInstitute of Nuclear Research of the HAS, Deb-recen, Hungary; K. Sera from the Cyclotron Re-search Center of the Iwate Medical University,Iwate, Japan; and M. Kneen from University ofWitwatersrand, Johannesburg, South Africa.
References
[1] M. Blaauw, V. Osorio Fernandez, P. Van Espen, G.
Bernasconi, R. Capote Noy, H. Manh Dung, N.I. Molla,
Nucl. Instr. and Meth. A 387 (1997) 416.
[2] G. Bernasconi, M. Blaauw, R. Capote Noy, P. Van Espen,
S. Fazinic, H. Manh Dung, N.I. Molla, V. Osorio, W.
Westmeier, IAEA-TECDOC-1011, IAEA, Vienna, 1998.
[3] M. Blaauw, E. Garcia-Tora~nno, S. Woods, S. Fazini�cc, Nucl.
Instr. and Meth. A 428 (1999) 317.
[4] M. Blaauw, S. Fazini�cc, E. Garcia-Tora~nno, S. Woods,
IAEA-TECDOC-1104, IAEA, Vienna, 1999.
[5] M. Blaauw, V. Osorio Fernandez, W. Westmeier, Nucl.
Instr. and Meth. A 387 (1997) 410.
[6] E. Garcia-Tora~nno, M.T. Crespo, S. Woods, M. Blaauw,S. Fazini�cc, Nucl. Instr. and Meth. A 428 (1999) 330.
[7] G. Bernasconi, M. Blaauw, R. Capote Noy, P. Van Espen,
S. Fazinic, H. Manh Dung, N.I. Molla, V. Osorio, W.
Westmeier, A companion diskette to the IAEA-TECDOC-
1011, IAEA, Vienna, 1998.
[8] M. Blaauw, S. Fazini�cc, E. Garcia-Tora~nno, S. Woods, A
companion diskette to the IAEA-TECDOC-1104, IAEA,
Vienna, 1999.
Fig. 4. v2r values reflecting underestimation of uncertainties infalse hit peak area ratios. The ideal program would not report
false hits or would have a score of 1.
M. Blaauw et al. / Nucl. Instr. and Meth. in Phys. Res. B 189 (2002) 113–122 121
[9] J.L. Campbell, W. Maenhaut, E. Bombelka, E. Clayton,
K. Malmqvist, J.A. Maxwell, J. Pallon, J. Vandenhaute,
Nucl. Instr. and Meth. B 14 (1986) 204.
[10] S. Fazini�cc, M. Jak�ssi�cc, J.L. Campbell, P. Van Espen, M.
Blaauw, I. Orlic, Nucl. Instr. and Meth. B 183 (2001)
439.
[11] S. Fazini�cc, M. Jak�ssi�cc, J.L. Campbell, P. Van Espen, M.Blaauw, I. Orlic, Separate issue of the IAEA-TECDOC,
in press.
[12] M.J. Woods, S.M. Jerome, J.C.J. Dean, E.M.E. Perkin,
Appl. Radiat. Isot. 47 (9/10) (1996) 971.
[13] Report on evaluation of interlaboratory comparison for
PIXE analysis of fly ash embeded in filters, Internal report
IAEA/AL/112, IAEA Laboratories, Seibersdorf, 1997.
[14] C.G. Ryan, D.R. Cousens, S.H. Sie, W.L. Griffin, Nucl.
Instr. and Meth. B 49 (1990) 271.
[15] J.A. Maxwell, J.L. Campbell, W.J. Teesdale, Nucl. Instr.
and Meth. B 43 (1989) 218.
[16] E. Clayton, PIXAN, The Lucas Heights PIXE Analysis
Computer Package, AAEC/M113, 1986.
[17] G. Szabo, I. Borbely-Kiss, Nucl. Instr. and Meth. B 75
(1993) 123.
[18] K. Sera, S. Futatsugawa, Nucl. Instr. and Meth. B 109 &
110 (1996) 99.
[19] B. Vekemans, K. Jensens, L. Vincze, F. Adams, P. Van
Espen, X-Ray Spectrom. 23 (1994) 278.
[20] A.D. Lipworth, H.J. Annegarn, M.A. Kneen, Nucl. Instr.
and Meth. B 75 (1993) 127.
122 M. Blaauw et al. / Nucl. Instr. and Meth. in Phys. Res. B 189 (2002) 113–122


