Embed Size (px)
Citation preview
(2006) 492–507www.elsevier.com/locate/yqres
Quarternary Research 65
Tephrostratigraphy of the Bedded Tuff Member(Kapthurin Formation, Kenya) and the nature of archaeological
change in the later middle Pleistocene
Christian A. Tryon a,b,⁎, Sally McBrearty c,1
a Department of Anthropology, George Washington University, 2110 G St. NW, Washington, DC 20052, USAb Human Origins Program, National Museum of Natural History, Smithsonian Institution MS 112, Washington, DC 20560-0112, USA
c Department of Anthropology, University of Connecticut, Box U-2176, Storrs, CT 06269, USA
Received 18 November 2004Available online 10 March 2006
Abstract
Correlation of volcaniclastic deposits of the Bedded Tuff Member (K4) of the Kapthurin Formation (Kenya) provides the means to assess thenature of archaeological change during the later middle Pleistocene, a time period critical to human evolution but poorly represented at otherAfrican localities. Field stratigraphic evidence, and petrographic and electron microprobe geochemical analyses of volcanic glass and phenocrysts,define eight subdivisions of K4 tephra. These include a succession of deposits from a local volcanic source that erupted intermittently, as well asother tuffs likely from different sources outside the Baringo basin. Upper portions of the Bedded Tuff Member date to ∼235,000 yr. The BeddedTuff Member is underlain by sediments that include the Grey Tuff, dated to 509,000 ± 9000 yr. The tephrostratigraphic framework defined here isused to place Acheulian and Middle Stone Age (MSA) archaeological sites in chronological order. Results show the persistence of Acheulian largecutting tool manufacture after the advent of points, considered an MSA artifact type. Two assemblages from the site of Koimilot record theappearance at ∼200,000–250,000 yr of a variety of Levallois flake production methods, an integral if incompletely understood feature of theMSA, here likely derived from local technological antecedents. Combined evidence from the tools and flake production methods suggest anincremental and mosaic pattern of change in hominin adaptive strategies during the Acheulian–MSA transition.© 2006 University of Washington. All rights reserved.
Keywords: Tephrostratigraphy; Acheulian; Middle Stone Age; Acheulian–MSA transition; Kapthurin Formation; Baringo
Introduction
The later middle Pleistocene in Africa is an importantperiod for understanding the origin of our species. One keyarchaeological characteristic of this time is the replacement ofsites of the Acheulian Industrial Complex by those withdiverse Middle Stone Age (MSA) industries (Clark, 1988,1999; McBrearty, 2001; McBrearty and Brooks, 2000; Tryonand McBrearty, 2002). This change is marked by thedisappearance of a long-lived, widespread use of handaxes,
⁎ Corresponding author. Department of Anthropology, George WashingtonUniversity, 2110 G St. NW, Washington, DC 20052, USA. Fax: +1 202 9946097.
E-mail addresses: [email protected] (C.A. Tryon), [email protected](S. McBrearty).
0033-5894/$ - see front matter © 2006 University of Washington. All rights reservdoi:10.1016/j.yqres.2006.01.008
cleavers, and knives; their replacement by smaller stone andbone points; and increased emphasis on various Levalloismethods of flake production. The earliest sites attributed to theMSA are from the Kapthurin Formation of Kenya and date to>284,000 yr, but Acheulian technology persists until ∼160,000yr in the Middle Awash region of Ethiopia, suggesting that thetiming of the Acheulian–MSA transition varied across Africa(Tryon and McBrearty, 2002; Clark et al., 2003). Althoughdefined by differences in lithic technology, MSA sites alsodiffer from those of the Acheulian in ways that may suggestthe origin of behavioral modernity at a time when fossil andgenetic evidence support the earliest appearance of the Homosapiens lineage (e.g., Lahr and Foley, 1998; Howell, 1999;McBrearty and Brooks, 2000; Stringer, 2002; Tishkoff andWilliams, 2002; Henshilwood and Marean, 2003; White et al.,2003; McDougall et al., 2005).
ed.
493C.A. Tryon, S. McBrearty / Quarternary Research 65 (2006) 492–507
Although no longer the ‘muddle in the middle’ that it onceappeared (Isaac, 1975), the archaeological record remainschronologically poorly resolved for much of the African middlePleistocene, defined by the onset of the last interglacial and theMatuyama–Brunhes boundary as ∼130,000–790,000 yr ago(e.g., Yamei et al., 2000; Singer et al., 2002; Gibbard, 2003; cf.Sarna-Wojcicki et al., 2000). Poor chronological resolutionlimits our understanding of the processes of adaptive changerepresented by the Acheulian–MSA transition. Two factors mayexaggerate differences between Acheulian and MSA sites. First,few locations preserve dated, relatively complete sedimentaryand hominin occupational records that span the end of theAcheulian and the advent of the Middle Stone Age. WhereMSA strata overlie those of the Acheulian, they are oftenseparated by pronounced unconformities (see Tryon andMcBrearty, 2002). Second, most MSA sites are later Pleistocenein age and, at <130,000 yr, substantially postdate the youngestAcheulian sites (Klein, 1999; McBrearty and Brooks, 2000;McBrearty and Tryon, 2006). Clearly, hypotheses regardingthe relation between the changes in hominin behavior seen inthe archaeological record of the Acheulian–MSA transition,and biological changes seen in the earliest fossil remains ofHomo sapiens, can proceed only from well-defined temporalframeworks.
We emphasize here data from the Kapthurin Formation ofKenya and detail a stratigraphic framework for a succession ofvolcanic tephra and archaeological sites that provides the meansto assess temporal change across the Acheulian–MSA transi-tion. The Kapthurin Formation joins a limited but growingnumber of artifact and hominin fossil localities, particularlyfrom eastern Africa, that demonstrate the complexity anddiversity of hominin adaptations during the later middlePleistocene (e.g., Barham, 2000; Clark et al., 2003; Van Peeret al., 2003). Deciphering hominin behavioral adaptationsthrough time must proceed from basic observations of the orderof events, achieved here through an integration of archaeolog-ical data with tephra correlated by field stratigraphic, petro-graphic, and geochemical means.
The Kapthurin Formation
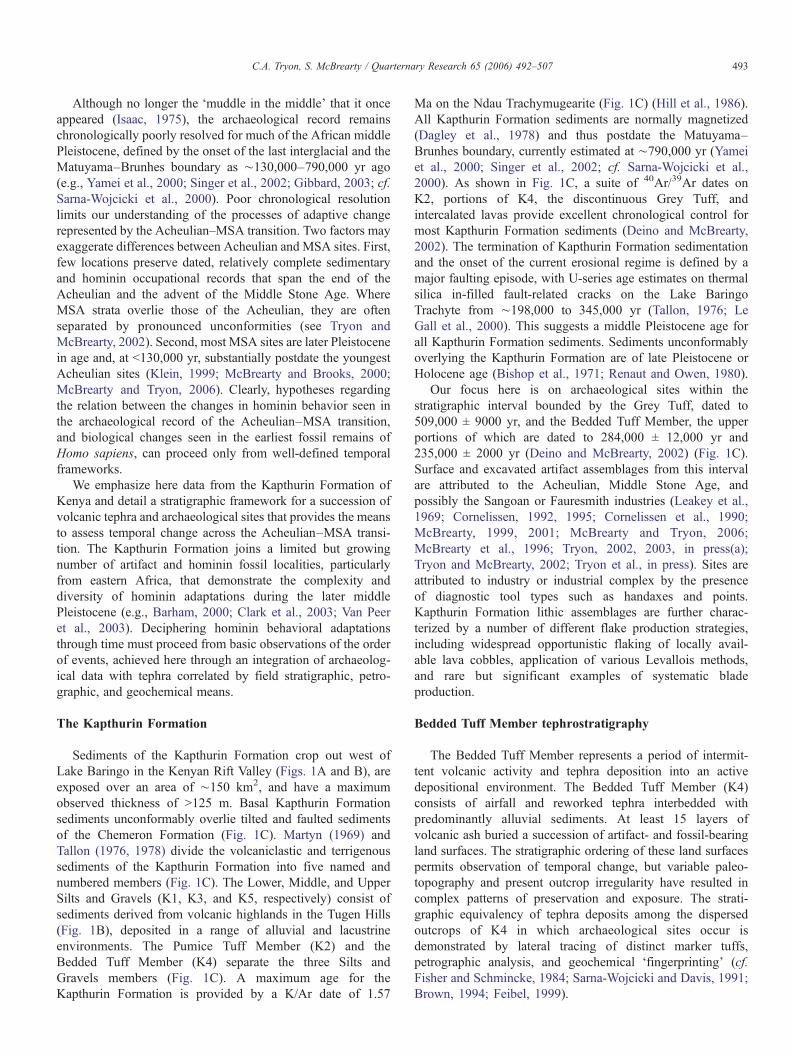
Sediments of the Kapthurin Formation crop out west ofLake Baringo in the Kenyan Rift Valley (Figs. 1A and B), areexposed over an area of ∼150 km2, and have a maximumobserved thickness of >125 m. Basal Kapthurin Formationsediments unconformably overlie tilted and faulted sedimentsof the Chemeron Formation (Fig. 1C). Martyn (1969) andTallon (1976, 1978) divide the volcaniclastic and terrigenoussediments of the Kapthurin Formation into five named andnumbered members (Fig. 1C). The Lower, Middle, and UpperSilts and Gravels (K1, K3, and K5, respectively) consist ofsediments derived from volcanic highlands in the Tugen Hills(Fig. 1B), deposited in a range of alluvial and lacustrineenvironments. The Pumice Tuff Member (K2) and theBedded Tuff Member (K4) separate the three Silts andGravels members (Fig. 1C). A maximum age for theKapthurin Formation is provided by a K/Ar date of 1.57
Ma on the Ndau Trachymugearite (Fig. 1C) (Hill et al., 1986).All Kapthurin Formation sediments are normally magnetized(Dagley et al., 1978) and thus postdate the Matuyama–Brunhes boundary, currently estimated at ∼790,000 yr (Yameiet al., 2000; Singer et al., 2002; cf. Sarna-Wojcicki et al.,2000). As shown in Fig. 1C, a suite of 40Ar/39Ar dates onK2, portions of K4, the discontinuous Grey Tuff, andintercalated lavas provide excellent chronological control formost Kapthurin Formation sediments (Deino and McBrearty,2002). The termination of Kapthurin Formation sedimentationand the onset of the current erosional regime is defined by amajor faulting episode, with U-series age estimates on thermalsilica in-filled fault-related cracks on the Lake BaringoTrachyte from ∼198,000 to 345,000 yr (Tallon, 1976; LeGall et al., 2000). This suggests a middle Pleistocene age forall Kapthurin Formation sediments. Sediments unconformablyoverlying the Kapthurin Formation are of late Pleistocene orHolocene age (Bishop et al., 1971; Renaut and Owen, 1980).
Our focus here is on archaeological sites within thestratigraphic interval bounded by the Grey Tuff, dated to509,000 ± 9000 yr, and the Bedded Tuff Member, the upperportions of which are dated to 284,000 ± 12,000 yr and235,000 ± 2000 yr (Deino and McBrearty, 2002) (Fig. 1C).Surface and excavated artifact assemblages from this intervalare attributed to the Acheulian, Middle Stone Age, andpossibly the Sangoan or Fauresmith industries (Leakey et al.,1969; Cornelissen, 1992, 1995; Cornelissen et al., 1990;McBrearty, 1999, 2001; McBrearty and Tryon, 2006;McBrearty et al., 1996; Tryon, 2002, 2003, in press(a);Tryon and McBrearty, 2002; Tryon et al., in press). Sites areattributed to industry or industrial complex by the presenceof diagnostic tool types such as handaxes and points.Kapthurin Formation lithic assemblages are further charac-terized by a number of different flake production strategies,including widespread opportunistic flaking of locally avail-able lava cobbles, application of various Levallois methods,and rare but significant examples of systematic bladeproduction.
Bedded Tuff Member tephrostratigraphy
The Bedded Tuff Member represents a period of intermit-tent volcanic activity and tephra deposition into an activedepositional environment. The Bedded Tuff Member (K4)consists of airfall and reworked tephra interbedded withpredominantly alluvial sediments. At least 15 layers ofvolcanic ash buried a succession of artifact- and fossil-bearingland surfaces. The stratigraphic ordering of these land surfacespermits observation of temporal change, but variable paleo-topography and present outcrop irregularity have resulted incomplex patterns of preservation and exposure. The strati-graphic equivalency of tephra deposits among the dispersedoutcrops of K4 in which archaeological sites occur isdemonstrated by lateral tracing of distinct marker tuffs,petrographic analysis, and geochemical ‘fingerprinting’ (cf.Fisher and Schmincke, 1984; Sarna-Wojcicki and Davis, 1991;Brown, 1994; Feibel, 1999).
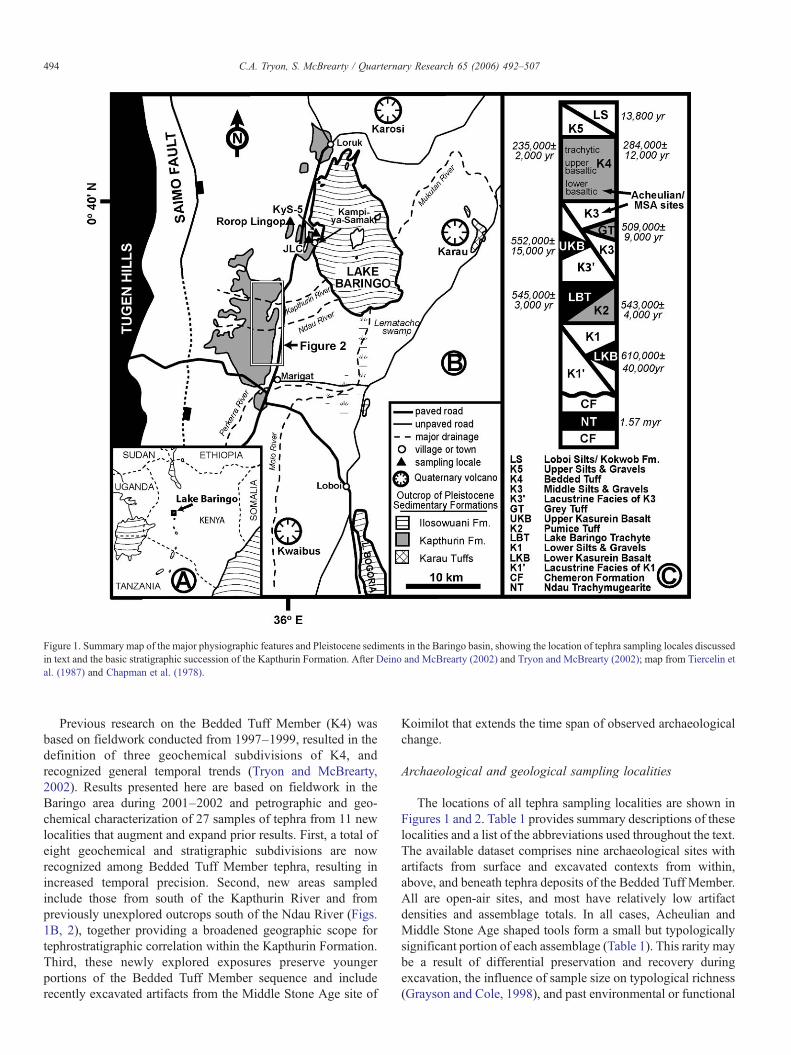
Figure 1. Summary map of the major physiographic features and Pleistocene sediments in the Baringo basin, showing the location of tephra sampling locales discussedin text and the basic stratigraphic succession of the Kapthurin Formation. After Deino and McBrearty (2002) and Tryon and McBrearty (2002); map from Tiercelin etal. (1987) and Chapman et al. (1978).
494 C.A. Tryon, S. McBrearty / Quarternary Research 65 (2006) 492–507
Previous research on the Bedded Tuff Member (K4) wasbased on fieldwork conducted from 1997–1999, resulted in thedefinition of three geochemical subdivisions of K4, andrecognized general temporal trends (Tryon and McBrearty,2002). Results presented here are based on fieldwork in theBaringo area during 2001–2002 and petrographic and geo-chemical characterization of 27 samples of tephra from 11 newlocalities that augment and expand prior results. First, a total ofeight geochemical and stratigraphic subdivisions are nowrecognized among Bedded Tuff Member tephra, resulting inincreased temporal precision. Second, new areas sampledinclude those from south of the Kapthurin River and frompreviously unexplored outcrops south of the Ndau River (Figs.1B, 2), together providing a broadened geographic scope fortephrostratigraphic correlation within the Kapthurin Formation.Third, these newly explored exposures preserve youngerportions of the Bedded Tuff Member sequence and includerecently excavated artifacts from the Middle Stone Age site of
Koimilot that extends the time span of observed archaeologicalchange.
Archaeological and geological sampling localities
The locations of all tephra sampling localities are shown inFigures 1 and 2. Table 1 provides summary descriptions of theselocalities and a list of the abbreviations used throughout the text.The available dataset comprises nine archaeological sites withartifacts from surface and excavated contexts from within,above, and beneath tephra deposits of the Bedded Tuff Member.All are open-air sites, and most have relatively low artifactdensities and assemblage totals. In all cases, Acheulian andMiddle Stone Age shaped tools form a small but typologicallysignificant portion of each assemblage (Table 1). This rarity maybe a result of differential preservation and recovery duringexcavation, the influence of sample size on typological richness(Grayson and Cole, 1998), and past environmental or functional
Figure 2. Location of main Bedded Tuff Member (K4) exposures with sampling localities shown. K4 outcrop shown in grey; base map after Tallon (1976). Also shownare schematic stratigraphic sections of areas sampled in 2001–2002. The MBTU (Massive Buff Tuff Unit) and KT (Koimilot Tuff) are local field marker beds. Section2, C3, Loc. 35, and TPS grab-sampled only. The location of Kampi-ya-Samaki Beds 5 sampling locale is shown in Figure 1. Remaining sites are described in Tryonand McBrearty (2002). For each sampling locale, abbreviated sample numbers are listed; see Table 2 for details.
495C.A. Tryon, S. McBrearty / Quarternary Research 65 (2006) 492–507
variability causing spatial differences in tool discard patternscharacteristic among mobile foraging populations in seasonalenvironments (e.g., Potts et al., 1999).
Ten non-archaeological locales were sampled to increasethe number of studied Bedded Tuff Member deposits and to
strengthen proposed correlations. They include layers dated bythe 40Ar/39Ar method and others examined to detail lateralvariation within a single bed, to verify the presence of amarker tuff, or to limit long-distance correlation between areasby providing an intervening reference point. Most samples
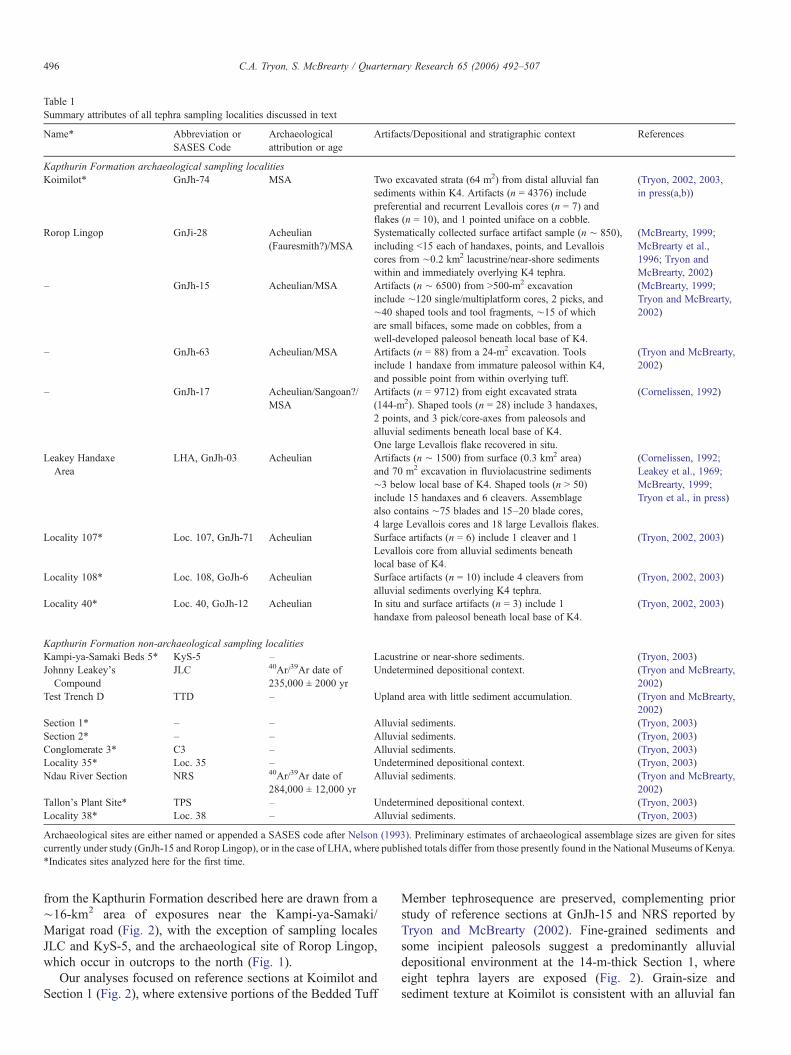
Table 1Summary attributes of all tephra sampling localities discussed in text
Name* Abbreviation orSASES Code
Archaeologicalattribution or age
Artifacts/Depositional and stratigraphic context References
Kapthurin Formation archaeological sampling localitiesKoimilot* GnJh-74 MSA Two excavated strata (64 m2) from distal alluvial fan
sediments within K4. Artifacts (n = 4376) includepreferential and recurrent Levallois cores (n = 7) andflakes (n = 10), and 1 pointed uniface on a cobble.
(Tryon, 2002, 2003,in press(a,b))
Rorop Lingop GnJi-28 Acheulian(Fauresmith?)/MSA
Systematically collected surface artifact sample (n ∼ 850),including <15 each of handaxes, points, and Levalloiscores from ∼0.2 km2 lacustrine/near-shore sedimentswithin and immediately overlying K4 tephra.
(McBrearty, 1999;McBrearty et al.,1996; Tryon andMcBrearty, 2002)
– GnJh-15 Acheulian/MSA Artifacts (n ∼ 6500) from >500-m2 excavationinclude ∼120 single/multiplatform cores, 2 picks, and∼40 shaped tools and tool fragments, ∼15 of whichare small bifaces, some made on cobbles, from awell-developed paleosol beneath local base of K4.
(McBrearty, 1999;Tryon and McBrearty,2002)
– GnJh-63 Acheulian/MSA Artifacts (n = 88) from a 24-m2 excavation. Toolsinclude 1 handaxe from immature paleosol within K4,and possible point from within overlying tuff.
(Tryon and McBrearty,2002)
– GnJh-17 Acheulian/Sangoan?/MSA
Artifacts (n = 9712) from eight excavated strata(144-m2). Shaped tools (n = 28) include 3 handaxes,2 points, and 3 pick/core-axes from paleosols andalluvial sediments beneath local base of K4.One large Levallois flake recovered in situ.
(Cornelissen, 1992)
Leakey HandaxeArea
LHA, GnJh-03 Acheulian Artifacts (n ∼ 1500) from surface (0.3 km2 area)and 70 m2 excavation in fluviolacustrine sediments∼3 below local base of K4. Shaped tools (n > 50)include 15 handaxes and 6 cleavers. Assemblagealso contains ∼75 blades and 15–20 blade cores,4 large Levallois cores and 18 large Levallois flakes.
(Cornelissen, 1992;Leakey et al., 1969;McBrearty, 1999;Tryon et al., in press)
Locality 107* Loc. 107, GnJh-71 Acheulian Surface artifacts (n = 6) include 1 cleaver and 1Levallois core from alluvial sediments beneathlocal base of K4.
(Tryon, 2002, 2003)
Locality 108* Loc. 108, GoJh-6 Acheulian Surface artifacts (n = 10) include 4 cleavers fromalluvial sediments overlying K4 tephra.
(Tryon, 2002, 2003)
Locality 40* Loc. 40, GoJh-12 Acheulian In situ and surface artifacts (n = 3) include 1handaxe from paleosol beneath local base of K4.
(Tryon, 2002, 2003)
Kapthurin Formation non-archaeological sampling localitiesKampi-ya-Samaki Beds 5* KyS-5 – Lacustrine or near-shore sediments. (Tryon, 2003)Johnny Leakey'sCompound
JLC 40Ar/39Ar date of235,000 ± 2000 yr
Undetermined depositional context. (Tryon and McBrearty,2002)
Test Trench D TTD – Upland area with little sediment accumulation. (Tryon and McBrearty,2002)
Section 1* – – Alluvial sediments. (Tryon, 2003)Section 2* – – Alluvial sediments. (Tryon, 2003)Conglomerate 3* C3 – Alluvial sediments. (Tryon, 2003)Locality 35* Loc. 35 – Undetermined depositional context. (Tryon, 2003)Ndau River Section NRS 40Ar/39Ar date of
284,000 ± 12,000 yrAlluvial sediments. (Tryon and McBrearty,
2002)Tallon's Plant Site* TPS – Undetermined depositional context. (Tryon, 2003)Locality 38* Loc. 38 – Alluvial sediments. (Tryon, 2003)
Archaeological sites are either named or appended a SASES code after Nelson (1993). Preliminary estimates of archaeological assemblage sizes are given for sitescurrently under study (GnJh-15 and Rorop Lingop), or in the case of LHA, where published totals differ from those presently found in the National Museums of Kenya.*Indicates sites analyzed here for the first time.
496 C.A. Tryon, S. McBrearty / Quarternary Research 65 (2006) 492–507
from the Kapthurin Formation described here are drawn from a∼16-km2 area of exposures near the Kampi-ya-Samaki/Marigat road (Fig. 2), with the exception of sampling localesJLC and KyS-5, and the archaeological site of Rorop Lingop,which occur in outcrops to the north (Fig. 1).
Our analyses focused on reference sections at Koimilot andSection 1 (Fig. 2), where extensive portions of the Bedded Tuff
Member tephrosequence are preserved, complementing priorstudy of reference sections at GnJh-15 and NRS reported byTryon and McBrearty (2002). Fine-grained sediments andsome incipient paleosols suggest a predominantly alluvialdepositional environment at the 14-m-thick Section 1, whereeight tephra layers are exposed (Fig. 2). Grain-size andsediment texture at Koimilot is consistent with an alluvial fan
497C.A. Tryon, S. McBrearty / Quarternary Research 65 (2006) 492–507
depositional environment near a fluctuating lake shoreline,where nine tuffs are found in exposures >20 m thick (Fig. 2).
Classification of Bedded Tuff Member deposits
Bedded Tuff Member (K4) tephra consist of two distinctlithologies. Widespread beds of coarse mafic ash are overlain inplaces by sparse deposits of felsic tephra of variable grain sizethat are locally pumiceous (Tallon, 1976, 1978). The coarsemafic ash is a vitric–lithic tuff of alkali olivine basalticcomposition. Thin-section inspection reveals pale brown glassshards (∼0.3 mm), crystals of forsteritic (Mg-rich) olivine(∼Fo69–84), plagioclase, rare spinel and magnetite, and micro-crystalline basalt and trachyte clasts in a fine-grained, glassygroundmass (Tryon and McBrearty, 2002). Bedded TuffMember basaltic tephra lack suitable material for preciseradiometric dating (Deino and McBrearty, 2002).
Grain size readily subdivides the overlying Bedded TuffMember felsic deposits into fine and coarse categories (afterSchmid, 1981), with additional classification based on theresults of geochemical analyses described below. Vitric fine ordust tuffs consist of translucent, siliceous glass shards≤10 μm derived from a range of magmas of intermediatecomposition (Table 2). Pumiceous coarse (1/16–2 mm) andlapilli (2–64 mm) tuffs contain glass shards predominantly oftrachytic composition and rounded pumice fragments≤30 mm, in addition to feldspars and pyroxenes (aegerineand titaniferrous augite) (Tryon and McBrearty, 2002). Pumicefragments from JLC and NRS have been dated by 40Ar/39Arby Deino and McBrearty (2002) to 235,000 ± 2000 yr and284,000 ± 12,000 yr, respectively (Figs. 1B and C).
Methods of geochemical analysis
Multiple grain-specific analyses of Bedded Tuff Membersamples using wavelength-dispersive electron microprobe(EMP) analysis allows assessment of sample homogeneityand major-element abundance (Froggatt, 1992; Reed, 1996).EMP analyses of 27 samples from 11 geological andarchaeological sites are included in this study (Table 2). Fromeach bed, one or more resin-impregnated polished thin sectionswere prepared. Approximately five shards per bed wereanalyzed directly from thin section as a preliminary assessmentof glass homogeneity. Samples were subdivided where twodistinct glass populations were present. The total availabledataset consists of 272 analyses (Tryon, 2003).
Quantitative chemical analyses were acquired using aJEOL-8600A EMP housed at the Kline Geology Laboratory,Yale University. Secondary electron and back-scatteredelectron imaging capabilities facilitated the detection ofcompositional heterogeneity within a glass shard, as well asthe selection of unaltered glass surfaces for analysis (Reed,1996). For most major element concentrations under standardanalytical conditions, instrumental precision and accuracy areestimated at ∼1%. Analyses of the basaltic glass used 15 kVaccelerating voltage, 20 nA current, and a 10 μm beam.Samples of trachytic coarse and lapilli tuff were analyzed at
15 kV, 7.5 nA, with a 15 μm beam size to minimize Na and Kloss, following the recommendations of Froggatt (1992).Selected samples of each type of tuff were extensively testedfor specimen damage resulting from beam intensity, andoperating conditions were adjusted accordingly. The smallgrain size of some of the felsic dust tuffs necessitated a lowercurrent and smaller beam size. These samples were run using15 kV accelerating voltage and 2.5 nA current with a 10 μmbeam. Olivine phenocryst analyses employed the sameoperating conditions as basaltic glass, with a grain-dependentbeam size of 5–10 μm. All analyses employed 10-s counttimes using off-peak backgrounds with TAP, PET, and LIFcrystals. Raw data were converted to concentrations usingstandard calculations with a PhiRhoZ matrix correction.Standards used for calibration include well-characterizedsilicate and oxide minerals. Analytical totals less than 100%are not normalized, following the argument of Brown et al.(1992) that this procedure makes unwarranted assumptionsabout the composition of the parent magma. The difference isdue largely to water, easily taken up due to the lack ofcrystalline structure within glass (e.g., Fisher and Schmincke,1984; Cerling et al., 1985).
Tephrostratigraphic results
As stressed by Feibel (1999), no single value characterizesglass fragments from a volcanic eruption, which are definedinstead by a range of values of various elements. This rangemay result from instrumental error, post-depositional weather-ing, or natural variation within the parent magma. Accuratecorrelation requires a large database and multiple sources ofevidence to identify potentially equivalent stratigraphic units.Successive field seasons of data collection and analyses havecaused our understanding of the Bedded Tuff Member to beconstantly revised. Each phase of fieldwork from 1997 through2002 has resulted in the discovery of new portions of thetephrosequence, and thus a broad correlative framework isadopted here.
On the basis of stratigraphic, petrographic, and geochemicaldata, as well as the lateral tracing of beds in the field, samplesare assigned to one of eight subdivisions of the Bedded TuffMember. The subdivisions are (1) lower basaltic tuffs, (2)upper basaltic tuffs, (3) the basaltic ‘Massive Buff Tuff Unit’(MBTU), (4) evolved basaltic tuffs, (5) pumiceous trachytictuffs, (6) felsic dust tuffs, (7) the Koimilot Tuff, and (8)redeposited (?) basaltic tuffs. Each of these subdivisionsreflects groups of similar tephra, except for the MBTU andKoimilot Tuff, which are field marker beds. Figure 3 showsattribution of all Kapthurin Formation samples to these eightrecognized subdivisions (defined below) in summary strati-graphic sections. The location of each of these sites is shown inFigures 1 and 2.
Bedded Tuff Member basaltic tephra deposits
Because of substantial within-sample variation, individualbeds of Bedded Tuff Member basaltic tephra cannot be reliably
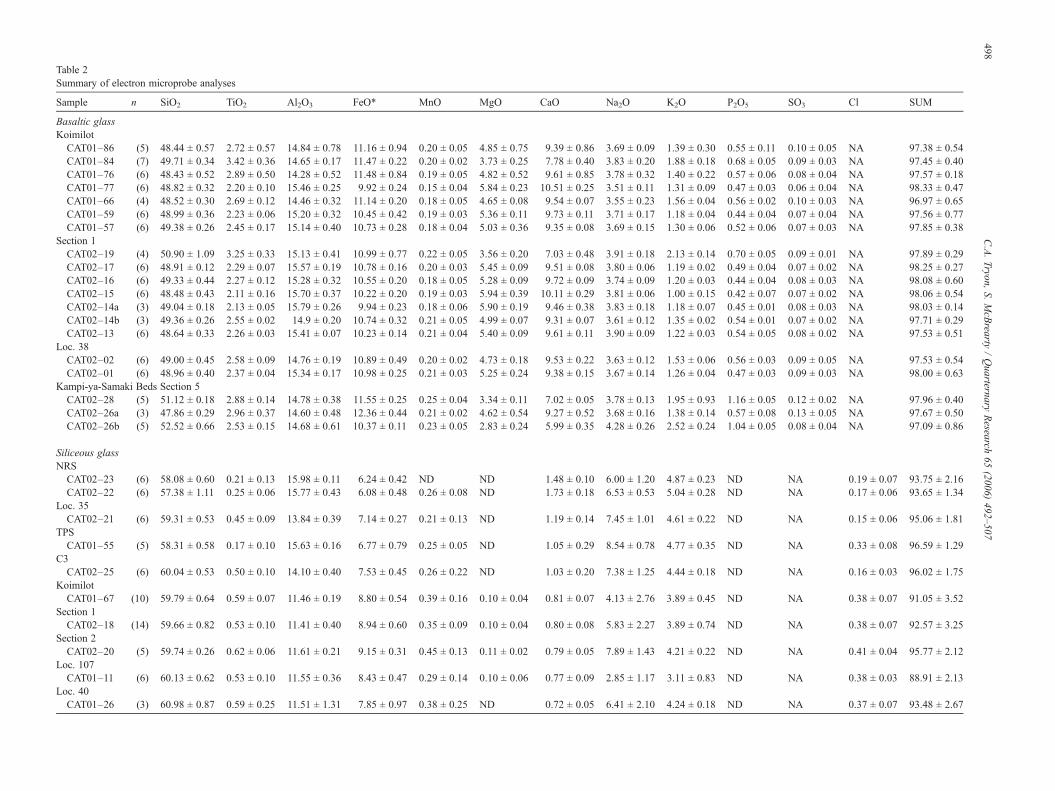
Table 2Summary of electron microprobe analyses
Sample n SiO2 TiO2 Al2O3 FeO* MnO MgO CaO Na2O K2O P2O5 SO3 Cl SUM
Basaltic glassKoimilot
CAT01–86 (5) 48.44 ± 0.57 2.72 ± 0.57 14.84 ± 0.78 11.16 ± 0.94 0.20 ± 0.05 4.85 ± 0.75 9.39 ± 0.86 3.69 ± 0.09 1.39 ± 0.30 0.55 ± 0.11 0.10 ± 0.05 NA 97.38 ± 0.54CAT01–84 (7) 49.71 ± 0.34 3.42 ± 0.36 14.65 ± 0.17 11.47 ± 0.22 0.20 ± 0.02 3.73 ± 0.25 7.78 ± 0.40 3.83 ± 0.20 1.88 ± 0.18 0.68 ± 0.05 0.09 ± 0.03 NA 97.45 ± 0.40CAT01–76 (6) 48.43 ± 0.52 2.89 ± 0.50 14.28 ± 0.52 11.48 ± 0.84 0.19 ± 0.05 4.82 ± 0.52 9.61 ± 0.85 3.78 ± 0.32 1.40 ± 0.22 0.57 ± 0.06 0.08 ± 0.04 NA 97.57 ± 0.18CAT01–77 (6) 48.82 ± 0.32 2.20 ± 0.10 15.46 ± 0.25 9.92 ± 0.24 0.15 ± 0.04 5.84 ± 0.23 10.51 ± 0.25 3.51 ± 0.11 1.31 ± 0.09 0.47 ± 0.03 0.06 ± 0.04 NA 98.33 ± 0.47CAT01–66 (4) 48.52 ± 0.30 2.69 ± 0.12 14.46 ± 0.32 11.14 ± 0.20 0.18 ± 0.05 4.65 ± 0.08 9.54 ± 0.07 3.55 ± 0.23 1.56 ± 0.04 0.56 ± 0.02 0.10 ± 0.03 NA 96.97 ± 0.65CAT01–59 (6) 48.99 ± 0.36 2.23 ± 0.06 15.20 ± 0.32 10.45 ± 0.42 0.19 ± 0.03 5.36 ± 0.11 9.73 ± 0.11 3.71 ± 0.17 1.18 ± 0.04 0.44 ± 0.04 0.07 ± 0.04 NA 97.56 ± 0.77CAT01–57 (6) 49.38 ± 0.26 2.45 ± 0.17 15.14 ± 0.40 10.73 ± 0.28 0.18 ± 0.04 5.03 ± 0.36 9.35 ± 0.08 3.69 ± 0.15 1.30 ± 0.06 0.52 ± 0.06 0.07 ± 0.03 NA 97.85 ± 0.38
Section 1CAT02–19 (4) 50.90 ± 1.09 3.25 ± 0.33 15.13 ± 0.41 10.99 ± 0.77 0.22 ± 0.05 3.56 ± 0.20 7.03 ± 0.48 3.91 ± 0.18 2.13 ± 0.14 0.70 ± 0.05 0.09 ± 0.01 NA 97.89 ± 0.29CAT02–17 (6) 48.91 ± 0.12 2.29 ± 0.07 15.57 ± 0.19 10.78 ± 0.16 0.20 ± 0.03 5.45 ± 0.09 9.51 ± 0.08 3.80 ± 0.06 1.19 ± 0.02 0.49 ± 0.04 0.07 ± 0.02 NA 98.25 ± 0.27CAT02–16 (6) 49.33 ± 0.44 2.27 ± 0.12 15.28 ± 0.32 10.55 ± 0.20 0.18 ± 0.05 5.28 ± 0.09 9.72 ± 0.09 3.74 ± 0.09 1.20 ± 0.03 0.44 ± 0.04 0.08 ± 0.03 NA 98.08 ± 0.60CAT02–15 (6) 48.48 ± 0.43 2.11 ± 0.16 15.70 ± 0.37 10.22 ± 0.20 0.19 ± 0.03 5.94 ± 0.39 10.11 ± 0.29 3.81 ± 0.06 1.00 ± 0.15 0.42 ± 0.07 0.07 ± 0.02 NA 98.06 ± 0.54CAT02–14a (3) 49.04 ± 0.18 2.13 ± 0.05 15.79 ± 0.26 9.94 ± 0.23 0.18 ± 0.06 5.90 ± 0.19 9.46 ± 0.38 3.83 ± 0.18 1.18 ± 0.07 0.45 ± 0.01 0.08 ± 0.03 NA 98.03 ± 0.14CAT02–14b (3) 49.36 ± 0.26 2.55 ± 0.02 14.9 ± 0.20 10.74 ± 0.32 0.21 ± 0.05 4.99 ± 0.07 9.31 ± 0.07 3.61 ± 0.12 1.35 ± 0.02 0.54 ± 0.01 0.07 ± 0.02 NA 97.71 ± 0.29CAT02–13 (6) 48.64 ± 0.33 2.26 ± 0.03 15.41 ± 0.07 10.23 ± 0.14 0.21 ± 0.04 5.40 ± 0.09 9.61 ± 0.11 3.90 ± 0.09 1.22 ± 0.03 0.54 ± 0.05 0.08 ± 0.02 NA 97.53 ± 0.51
Loc. 38CAT02–02 (6) 49.00 ± 0.45 2.58 ± 0.09 14.76 ± 0.19 10.89 ± 0.49 0.20 ± 0.02 4.73 ± 0.18 9.53 ± 0.22 3.63 ± 0.12 1.53 ± 0.06 0.56 ± 0.03 0.09 ± 0.05 NA 97.53 ± 0.54CAT02–01 (6) 48.96 ± 0.40 2.37 ± 0.04 15.34 ± 0.17 10.98 ± 0.25 0.21 ± 0.03 5.25 ± 0.24 9.38 ± 0.15 3.67 ± 0.14 1.26 ± 0.04 0.47 ± 0.03 0.09 ± 0.03 NA 98.00 ± 0.63
Kampi-ya-Samaki Beds Section 5CAT02–28 (5) 51.12 ± 0.18 2.88 ± 0.14 14.78 ± 0.38 11.55 ± 0.25 0.25 ± 0.04 3.34 ± 0.11 7.02 ± 0.05 3.78 ± 0.13 1.95 ± 0.93 1.16 ± 0.05 0.12 ± 0.02 NA 97.96 ± 0.40CAT02–26a (3) 47.86 ± 0.29 2.96 ± 0.37 14.60 ± 0.48 12.36 ± 0.44 0.21 ± 0.02 4.62 ± 0.54 9.27 ± 0.52 3.68 ± 0.16 1.38 ± 0.14 0.57 ± 0.08 0.13 ± 0.05 NA 97.67 ± 0.50CAT02–26b (5) 52.52 ± 0.66 2.53 ± 0.15 14.68 ± 0.61 10.37 ± 0.11 0.23 ± 0.05 2.83 ± 0.24 5.99 ± 0.35 4.28 ± 0.26 2.52 ± 0.24 1.04 ± 0.05 0.08 ± 0.04 NA 97.09 ± 0.86
Siliceous glassNRS
CAT02–23 (6) 58.08 ± 0.60 0.21 ± 0.13 15.98 ± 0.11 6.24 ± 0.42 ND ND 1.48 ± 0.10 6.00 ± 1.20 4.87 ± 0.23 ND NA 0.19 ± 0.07 93.75 ± 2.16CAT02–22 (6) 57.38 ± 1.11 0.25 ± 0.06 15.77 ± 0.43 6.08 ± 0.48 0.26 ± 0.08 ND 1.73 ± 0.18 6.53 ± 0.53 5.04 ± 0.28 ND NA 0.17 ± 0.06 93.65 ± 1.34
Loc. 35CAT02–21 (6) 59.31 ± 0.53 0.45 ± 0.09 13.84 ± 0.39 7.14 ± 0.27 0.21 ± 0.13 ND 1.19 ± 0.14 7.45 ± 1.01 4.61 ± 0.22 ND NA 0.15 ± 0.06 95.06 ± 1.81
TPSCAT01–55 (5) 58.31 ± 0.58 0.17 ± 0.10 15.63 ± 0.16 6.77 ± 0.79 0.25 ± 0.05 ND 1.05 ± 0.29 8.54 ± 0.78 4.77 ± 0.35 ND NA 0.33 ± 0.08 96.59 ± 1.29
C3CAT02–25 (6) 60.04 ± 0.53 0.50 ± 0.10 14.10 ± 0.40 7.53 ± 0.45 0.26 ± 0.22 ND 1.03 ± 0.20 7.38 ± 1.25 4.44 ± 0.18 ND NA 0.16 ± 0.03 96.02 ± 1.75
KoimilotCAT01–67 (10) 59.79 ± 0.64 0.59 ± 0.07 11.46 ± 0.19 8.80 ± 0.54 0.39 ± 0.16 0.10 ± 0.04 0.81 ± 0.07 4.13 ± 2.76 3.89 ± 0.45 ND NA 0.38 ± 0.07 91.05 ± 3.52
Section 1CAT02–18 (14) 59.66 ± 0.82 0.53 ± 0.10 11.41 ± 0.40 8.94 ± 0.60 0.35 ± 0.09 0.10 ± 0.04 0.80 ± 0.08 5.83 ± 2.27 3.89 ± 0.74 ND NA 0.38 ± 0.07 92.57 ± 3.25
Section 2CAT02–20 (5) 59.74 ± 0.26 0.62 ± 0.06 11.61 ± 0.21 9.15 ± 0.31 0.45 ± 0.13 0.11 ± 0.02 0.79 ± 0.05 7.89 ± 1.43 4.21 ± 0.22 ND NA 0.41 ± 0.04 95.77 ± 2.12
Loc. 107CAT01–11 (6) 60.13 ± 0.62 0.53 ± 0.10 11.55 ± 0.36 8.43 ± 0.47 0.29 ± 0.14 0.10 ± 0.06 0.77 ± 0.09 2.85 ± 1.17 3.11 ± 0.83 ND NA 0.38 ± 0.03 88.91 ± 2.13
Loc. 40CAT01–26 (3) 60.98 ± 0.87 0.59 ± 0.25 11.51 ± 1.31 7.85 ± 0.97 0.38 ± 0.25 ND 0.72 ± 0.05 6.41 ± 2.10 4.24 ± 0.18 ND NA 0.37 ± 0.07 93.48 ± 2.67
498C.A.Tryon,
S.McB
rearty/Quarternary
Research
65(2006)
492–507
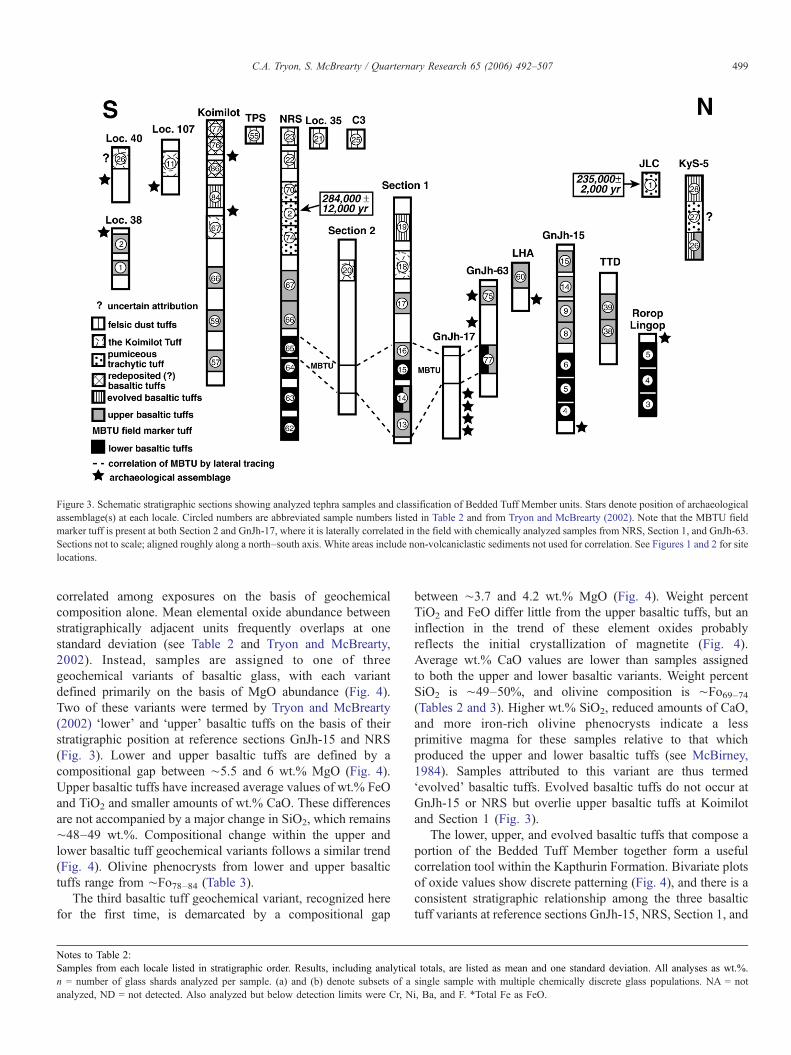
Figure 3. Schematic stratigraphic sections showing analyzed tephra samples and classification of Bedded Tuff Member units. Stars denote position of archaeologicalassemblage(s) at each locale. Circled numbers are abbreviated sample numbers listed in Table 2 and from Tryon and McBrearty (2002). Note that the MBTU fieldmarker tuff is present at both Section 2 and GnJh-17, where it is laterally correlated in the field with chemically analyzed samples from NRS, Section 1, and GnJh-63.Sections not to scale; aligned roughly along a north–south axis. White areas include non-volcaniclastic sediments not used for correlation. See Figures 1 and 2 for sitelocations.
499C.A. Tryon, S. McBrearty / Quarternary Research 65 (2006) 492–507
correlated among exposures on the basis of geochemicalcomposition alone. Mean elemental oxide abundance betweenstratigraphically adjacent units frequently overlaps at onestandard deviation (see Table 2 and Tryon and McBrearty,2002). Instead, samples are assigned to one of threegeochemical variants of basaltic glass, with each variantdefined primarily on the basis of MgO abundance (Fig. 4).Two of these variants were termed by Tryon and McBrearty(2002) ‘lower’ and ‘upper’ basaltic tuffs on the basis of theirstratigraphic position at reference sections GnJh-15 and NRS(Fig. 3). Lower and upper basaltic tuffs are defined by acompositional gap between ∼5.5 and 6 wt.% MgO (Fig. 4).Upper basaltic tuffs have increased average values of wt.% FeOand TiO2 and smaller amounts of wt.% CaO. These differencesare not accompanied by a major change in SiO2, which remains∼48–49 wt.%. Compositional change within the upper andlower basaltic tuff geochemical variants follows a similar trend(Fig. 4). Olivine phenocrysts from lower and upper basaltictuffs range from ∼Fo78–84 (Table 3).
The third basaltic tuff geochemical variant, recognized herefor the first time, is demarcated by a compositional gap
Notes to Table 2:Samples from each locale listed in stratigraphic order. Results, including analytican = number of glass shards analyzed per sample. (a) and (b) denote subsets of aanalyzed, ND = not detected. Also analyzed but below detection limits were Cr, N
between ∼3.7 and 4.2 wt.% MgO (Fig. 4). Weight percentTiO2 and FeO differ little from the upper basaltic tuffs, but aninflection in the trend of these element oxides probablyreflects the initial crystallization of magnetite (Fig. 4).Average wt.% CaO values are lower than samples assignedto both the upper and lower basaltic variants. Weight percentSiO2 is ∼49–50%, and olivine composition is ∼Fo69–74(Tables 2 and 3). Higher wt.% SiO2, reduced amounts of CaO,and more iron-rich olivine phenocrysts indicate a lessprimitive magma for these samples relative to that whichproduced the upper and lower basaltic tuffs (see McBirney,1984). Samples attributed to this variant are thus termed‘evolved’ basaltic tuffs. Evolved basaltic tuffs do not occur atGnJh-15 or NRS but overlie upper basaltic tuffs at Koimilotand Section 1 (Fig. 3).
The lower, upper, and evolved basaltic tuffs that compose aportion of the Bedded Tuff Member together form a usefulcorrelation tool within the Kapthurin Formation. Bivariate plotsof oxide values show discrete patterning (Fig. 4), and there is aconsistent stratigraphic relationship among the three basaltictuff variants at reference sections GnJh-15, NRS, Section 1, and
l totals, are listed as mean and one standard deviation. All analyses as wt.%.single sample with multiple chemically discrete glass populations. NA = noti, Ba, and F. *Total Fe as FeO.
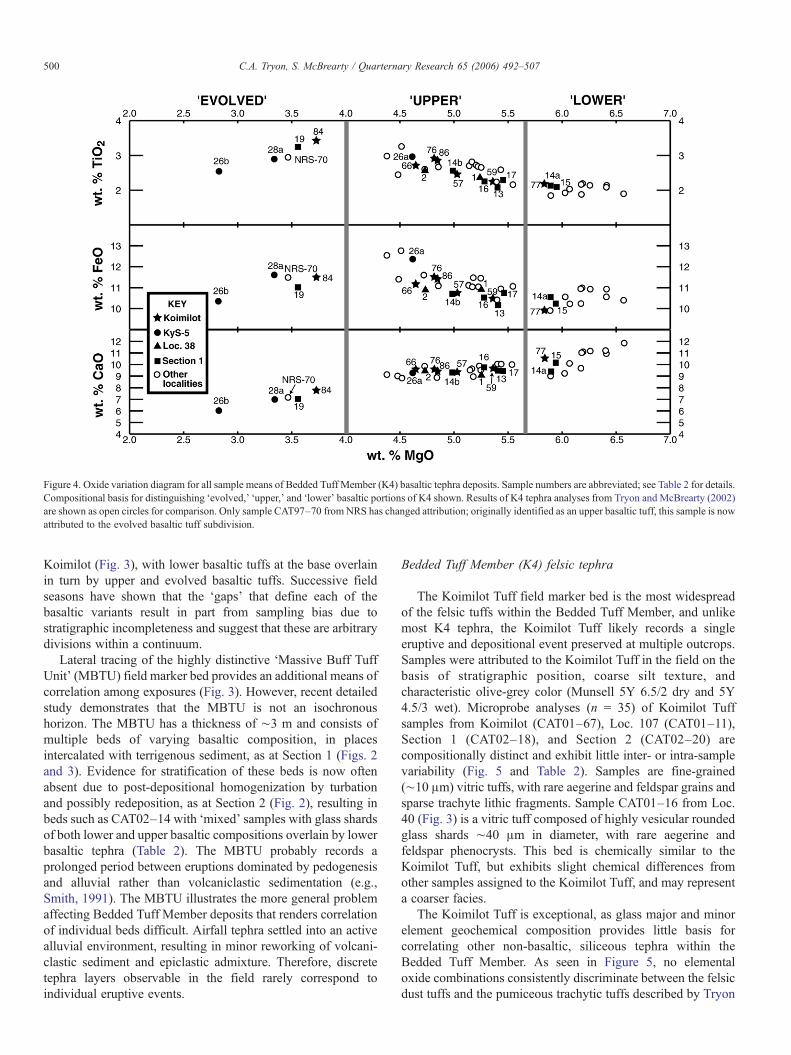
Figure 4. Oxide variation diagram for all sample means of Bedded Tuff Member (K4) basaltic tephra deposits. Sample numbers are abbreviated; see Table 2 for details.Compositional basis for distinguishing ‘evolved,’ ‘upper,’ and ‘lower' basaltic portions of K4 shown. Results of K4 tephra analyses from Tryon and McBrearty (2002)are shown as open circles for comparison. Only sample CAT97–70 from NRS has changed attribution; originally identified as an upper basaltic tuff, this sample is nowattributed to the evolved basaltic tuff subdivision.
500 C.A. Tryon, S. McBrearty / Quarternary Research 65 (2006) 492–507
Koimilot (Fig. 3), with lower basaltic tuffs at the base overlainin turn by upper and evolved basaltic tuffs. Successive fieldseasons have shown that the ‘gaps’ that define each of thebasaltic variants result in part from sampling bias due tostratigraphic incompleteness and suggest that these are arbitrarydivisions within a continuum.
Lateral tracing of the highly distinctive ‘Massive Buff TuffUnit’ (MBTU) field marker bed provides an additional means ofcorrelation among exposures (Fig. 3). However, recent detailedstudy demonstrates that the MBTU is not an isochronoushorizon. The MBTU has a thickness of ∼3 m and consists ofmultiple beds of varying basaltic composition, in placesintercalated with terrigenous sediment, as at Section 1 (Figs. 2and 3). Evidence for stratification of these beds is now oftenabsent due to post-depositional homogenization by turbationand possibly redeposition, as at Section 2 (Fig. 2), resulting inbeds such as CAT02–14 with ‘mixed’ samples with glass shardsof both lower and upper basaltic compositions overlain by lowerbasaltic tephra (Table 2). The MBTU probably records aprolonged period between eruptions dominated by pedogenesisand alluvial rather than volcaniclastic sedimentation (e.g.,Smith, 1991). The MBTU illustrates the more general problemaffecting Bedded Tuff Member deposits that renders correlationof individual beds difficult. Airfall tephra settled into an activealluvial environment, resulting in minor reworking of volcani-clastic sediment and epiclastic admixture. Therefore, discretetephra layers observable in the field rarely correspond toindividual eruptive events.
Bedded Tuff Member (K4) felsic tephra
The Koimilot Tuff field marker bed is the most widespreadof the felsic tuffs within the Bedded Tuff Member, and unlikemost K4 tephra, the Koimilot Tuff likely records a singleeruptive and depositional event preserved at multiple outcrops.Samples were attributed to the Koimilot Tuff in the field on thebasis of stratigraphic position, coarse silt texture, andcharacteristic olive-grey color (Munsell 5Y 6.5/2 dry and 5Y4.5/3 wet). Microprobe analyses (n = 35) of Koimilot Tuffsamples from Koimilot (CAT01–67), Loc. 107 (CAT01–11),Section 1 (CAT02–18), and Section 2 (CAT02–20) arecompositionally distinct and exhibit little inter- or intra-samplevariability (Fig. 5 and Table 2). Samples are fine-grained(∼10 μm) vitric tuffs, with rare aegerine and feldspar grains andsparse trachyte lithic fragments. Sample CAT01–16 from Loc.40 (Fig. 3) is a vitric tuff composed of highly vesicular roundedglass shards ∼40 μm in diameter, with rare aegerine andfeldspar phenocrysts. This bed is chemically similar to theKoimilot Tuff, but exhibits slight chemical differences fromother samples assigned to the Koimilot Tuff, and may representa coarser facies.
The Koimilot Tuff is exceptional, as glass major and minorelement geochemical composition provides little basis forcorrelating other non-basaltic, siliceous tephra within theBedded Tuff Member. As seen in Figure 5, no elementaloxide combinations consistently discriminate between the felsicdust tuffs and the pumiceous trachytic tuffs described by Tryon
Table 3Results of electron microprobe analyses of olivine phenocrysts in tephra of theBedded Tuff Member
Location Sample K4 geochemical variant Fo
Koimilot CAT01–84 Evolved basaltic tuffs 73.9Koimilot CAT01–84 Evolved basaltic tuffs 71.2Koimilot CAT01–84 Evolved basaltic tuffs 71.3Koimilot CAT01–84 Evolved basaltic tuffs 72.5Section 2 CAT02–19 Evolved basaltic tuffs 70.7Section 2 CAT02–19 Evolved basaltic tuffs 69GnJh-15 CAT97–14 Upper basaltic tuffs 80.4GnJh-15 CAT97–10 Upper basaltic tuffs 78.8GnJh-15 CAT97–09 Upper basaltic tuffs 80.4GnJh-15 CAT97–09 Upper basaltic tuffs 84.1Test Trench D CAT97–38 Upper basaltic tuffs 78.4Test Trench D CAT97–38 Upper basaltic tuffs 79.6Test Trench D CAT97–38 Upper basaltic tuffs 80.5Test Trench D CAT97–39 Upper basaltic tuffs 80.7Test Trench D CAT97–39 Upper basaltic tuffs 80.7Test Trench D CAT97–39 Upper basaltic tuffs 80.4LHA CAT97–60 Upper basaltic tuffs 82.6LHA CAT97–60 Upper basaltic tuffs 81.4LHA CAT97–60 Upper basaltic tuffs 75.3Section 1 CAT02–17 Upper basaltic tuffs 81.5Koimilot CAT01–57 Upper basaltic tuffs 77.9Koimilot CAT01–57 Upper basaltic tuffs 81Koimilot CAT01–57 Upper basaltic tuffs 82.2Section 1 CAT02–16 Upper basaltic tuffs/MBTU 81.5Section 1 CAT02–16 Upper basaltic tuffs/MBTU 82.9Section 1 CAT02–16 Upper basaltic tuffs/MBTU 79.5NRS CAT97–64 Lower basaltic tuffs 83.1Koimilot CAT01–76 Redeposited (?)/upper basaltic tuffs 80.8Koimilot CAT01–76 Redeposited (?)/upper basaltic tuffs 73.9Koimilot CAT01–76 Redeposited (?)/upper basaltic tuffs 85.8Koimilot CAT01–77 Redeposited (?)/lower basaltic tuffs 82.2Koimilot CAT01–77 Redeposited (?)/lower basaltic tuffs 84.6
Analyzed elements include: Si, Ti, Al, Fe, Mn, Mg, Ca, Cr, and Ni. Ordered bybasaltic glass subdivision, reported as mole percent forsterite (Fo) and calculatedby stoichiometry.
501C.A. Tryon, S. McBrearty / Quarternary Research 65 (2006) 492–507
and McBrearty (2002), or provide correlation betweenexposures.
Explanation of compositional trends: a hypothesis
Tryon and McBrearty (2002) suggest a shared magmasource for the lower and upper basaltic tuffs and thepumiceous trachytic tephra deposits of the Bedded TuffMember on the basis of the similar geochemical trends andthe stratigraphic superposition of tephra of increasinglyevolved compositions. Proportions of MgO and CaO decreasewith stratigraphic height, from lower to upper to pumiceoustrachytic tuffs, with concomitant increases in FeO and TiO2
(Figs. 4 and 6). This model is supported and augmented byresults presented here. The stratigraphic position of evolvedbasaltic tuffs is demonstrated at Koimilot and Section 1, wherethey overlie upper basaltic tephra (Figs. 2–4). These evolvedbasaltic tuffs conform to the same chemical trend observed forall lower and upper basaltic as well as pumiceous trachyticdeposits of K4 (Fig. 6). The general trend in compositionalvariation among the basaltic layers is interpreted as the result
of chemical evolution of a magma chamber over time.Temporal changes in magma composition are recorded insuccessive deposits from periodic eruptions. A linear trend ofreduced MgO and CaO (Fig. 6) is consistent with fractionationdue to crystallization of olivine (Table 3) and plagioclasephenocryst phases, and suggests a progression from lowerthrough upper to evolved basaltic composition. A sharedvolcanic source for the basaltic and trachytic tephra is furthersuggested by the presence of evolved basaltic glass shardswithin pumiceous trachytic tuff samples from NRS (Tryon,2003: Appendix B). Furthermore, the sample from JLC is asingle pumice fragment of trachytic and evolved basaltic glassapparently fused together during magma ascent (Tryon andMcBrearty, 2002).
The overall stratigraphic and compositional trend of basaltswith increasingly evolved compositions, followed by mixedbasalt/trachyte eruptions, parallels observations of volcanoevolution and magma differentiation in the East African Riftand elsewhere. Bimodal suites of alkali basalt–trachyte lavacharacterize all Kenyan Pleistocene central Rift Valleyvolcanoes north of Lake Baringo, including Korosi (Fig. 1),the inferred source of the Bedded Tuff Member basaltic andpumiceous trachytic deposits. In each case, lavas areseparated by a compositional gap of up to 15 wt.% SiO2,known as the ‘Daly gap,’ common in alkaline igneous suites(Tallon, 1978; Baker, 1987; Macdonald, 1987; Philpotts,1990; Dunkley et al., 1993; Orton, 1996). Thus, unlike thegaps between the lower and upper basaltic tuffs, the absenceof tuffs of compositions intermediate between the basaltic andtrachytic portions of the Bedded Tuff Member (Fig. 6) neednot record an erosional unconformity or the absence ofpreserved strata, but rather reflects the nature of the volcanicprocess itself.
Two tephra groups do not conform to the observed trends:(1) fine-grained tephra with siliceous glass fragments, includingthe felsic dust tuffs and the Koimilot Tuff, and (2) the uppermostbasaltic tuffs at Koimilot. Felsic dust tuffs overlie pumiceoustrachytic tuffs at NRS but are otherwise known only fromisolated beds from locales in the vicinity of the Ndau River(Figs. 2 and 3). No section preserves both the Koimilot Tuff andpumiceous trachytic tuffs. The felsic dust tuffs from NRS(CAT02–22 and CAT02–23) are not clearly associated with theinferred sequence of a single differentiating volcanic source(Figs. 5 and 6). These samples do not fall along thecompositional trend line (MgO:CaO) that defines other BeddedTuff Member samples (Fig. 6 inset). These data, plusdifferences in chemical composition (Fig. 5, Table 2) andsmaller average grain size (≤10 μm), suggest a different, moredistant volcanic source for the felsic dust tuffs and the KoimilotTuff than the pumiceous trachytic samples of the Bedded TuffMember.
Tephra beds above the Koimilot Tuff at the site of Koimilot(Fig. 3) show a reversal of the general stratigraphic andcompositional trend. The lowermost of these, CAT01–84, is ofevolved basaltic composition. Glass chemical composition ofsamples CAT01–86 and CAT01–76 match those of upperbasaltic tuffs, overlain by CAT01–77, which is similar to other
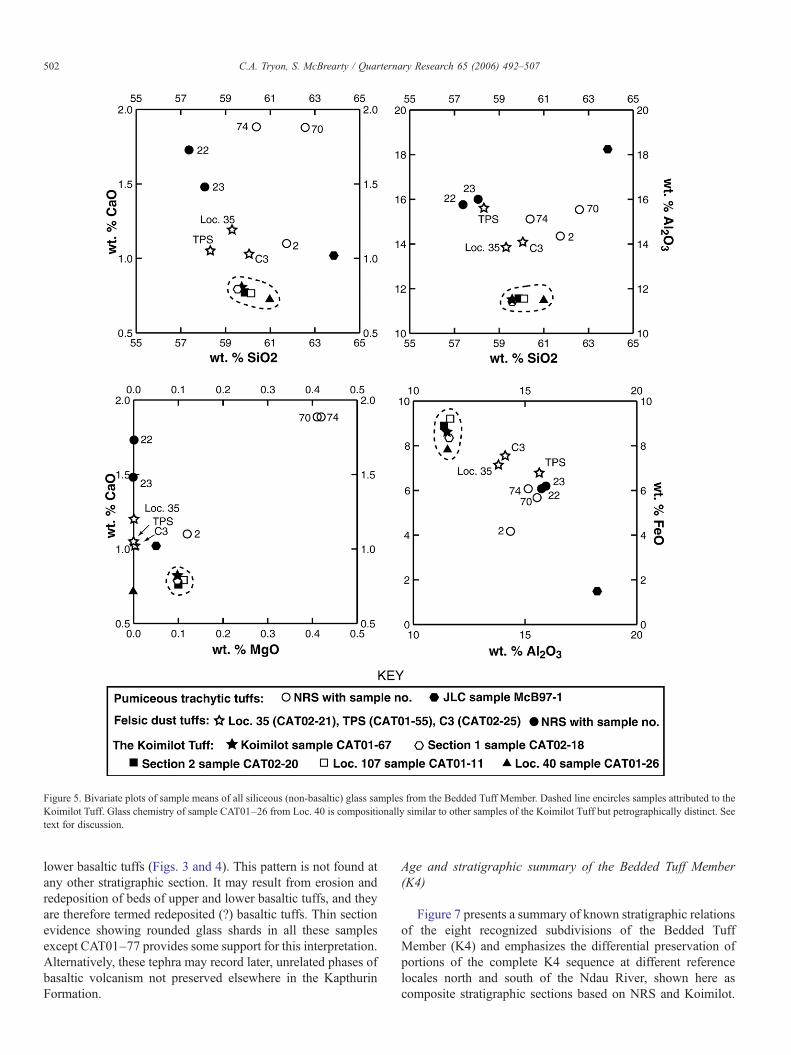
Figure 5. Bivariate plots of sample means of all siliceous (non-basaltic) glass samples from the Bedded Tuff Member. Dashed line encircles samples attributed to theKoimilot Tuff. Glass chemistry of sample CAT01–26 from Loc. 40 is compositionally similar to other samples of the Koimilot Tuff but petrographically distinct. Seetext for discussion.
502 C.A. Tryon, S. McBrearty / Quarternary Research 65 (2006) 492–507
lower basaltic tuffs (Figs. 3 and 4). This pattern is not found atany other stratigraphic section. It may result from erosion andredeposition of beds of upper and lower basaltic tuffs, and theyare therefore termed redeposited (?) basaltic tuffs. Thin sectionevidence showing rounded glass shards in all these samplesexcept CAT01–77 provides some support for this interpretation.Alternatively, these tephra may record later, unrelated phases ofbasaltic volcanism not preserved elsewhere in the KapthurinFormation.
Age and stratigraphic summary of the Bedded Tuff Member(K4)
Figure 7 presents a summary of known stratigraphic relationsof the eight recognized subdivisions of the Bedded TuffMember (K4) and emphasizes the differential preservation ofportions of the complete K4 sequence at different referencelocales north and south of the Ndau River, shown here ascomposite stratigraphic sections based on NRS and Koimilot.
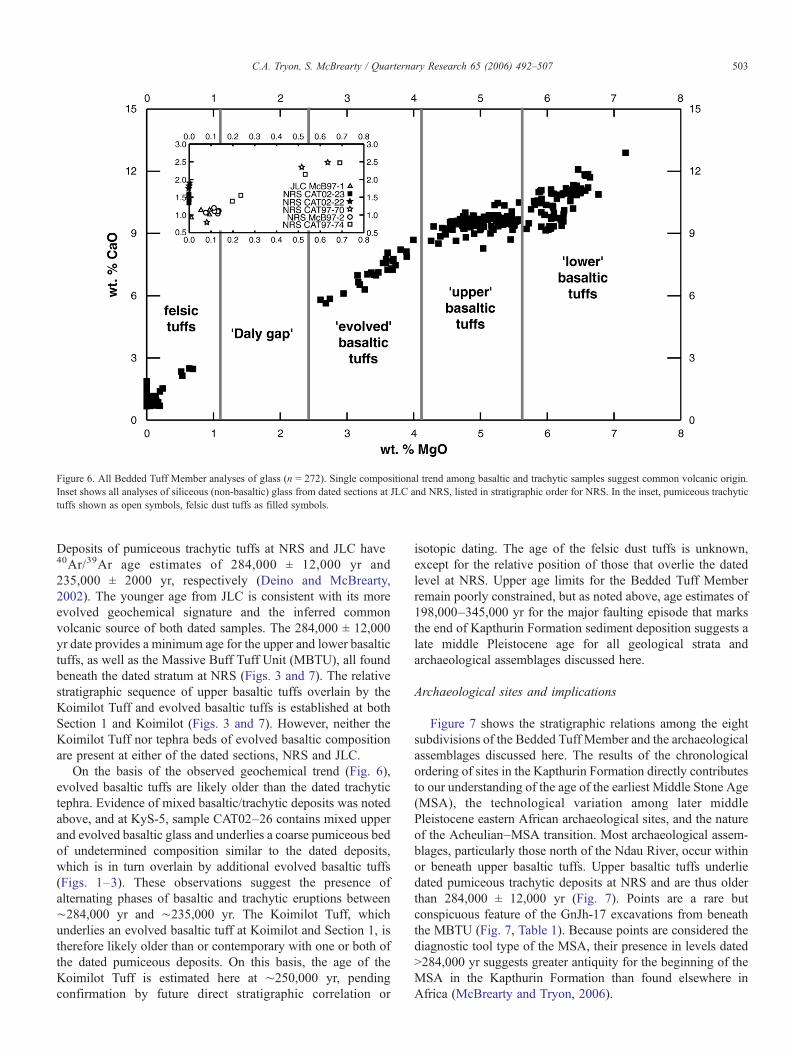
Figure 6. All Bedded Tuff Member analyses of glass (n = 272). Single compositional trend among basaltic and trachytic samples suggest common volcanic origin.Inset shows all analyses of siliceous (non-basaltic) glass from dated sections at JLC and NRS, listed in stratigraphic order for NRS. In the inset, pumiceous trachytictuffs shown as open symbols, felsic dust tuffs as filled symbols.
503C.A. Tryon, S. McBrearty / Quarternary Research 65 (2006) 492–507
Deposits of pumiceous trachytic tuffs at NRS and JLC have40Ar/39Ar age estimates of 284,000 ± 12,000 yr and235,000 ± 2000 yr, respectively (Deino and McBrearty,2002). The younger age from JLC is consistent with its moreevolved geochemical signature and the inferred commonvolcanic source of both dated samples. The 284,000 ± 12,000yr date provides a minimum age for the upper and lower basaltictuffs, as well as the Massive Buff Tuff Unit (MBTU), all foundbeneath the dated stratum at NRS (Figs. 3 and 7). The relativestratigraphic sequence of upper basaltic tuffs overlain by theKoimilot Tuff and evolved basaltic tuffs is established at bothSection 1 and Koimilot (Figs. 3 and 7). However, neither theKoimilot Tuff nor tephra beds of evolved basaltic compositionare present at either of the dated sections, NRS and JLC.
On the basis of the observed geochemical trend (Fig. 6),evolved basaltic tuffs are likely older than the dated trachytictephra. Evidence of mixed basaltic/trachytic deposits was notedabove, and at KyS-5, sample CAT02–26 contains mixed upperand evolved basaltic glass and underlies a coarse pumiceous bedof undetermined composition similar to the dated deposits,which is in turn overlain by additional evolved basaltic tuffs(Figs. 1–3). These observations suggest the presence ofalternating phases of basaltic and trachytic eruptions between∼284,000 yr and ∼235,000 yr. The Koimilot Tuff, whichunderlies an evolved basaltic tuff at Koimilot and Section 1, istherefore likely older than or contemporary with one or both ofthe dated pumiceous deposits. On this basis, the age of theKoimilot Tuff is estimated here at ∼250,000 yr, pendingconfirmation by future direct stratigraphic correlation or
isotopic dating. The age of the felsic dust tuffs is unknown,except for the relative position of those that overlie the datedlevel at NRS. Upper age limits for the Bedded Tuff Memberremain poorly constrained, but as noted above, age estimates of198,000–345,000 yr for the major faulting episode that marksthe end of Kapthurin Formation sediment deposition suggests alate middle Pleistocene age for all geological strata andarchaeological assemblages discussed here.
Archaeological sites and implications
Figure 7 shows the stratigraphic relations among the eightsubdivisions of the Bedded Tuff Member and the archaeologicalassemblages discussed here. The results of the chronologicalordering of sites in the Kapthurin Formation directly contributesto our understanding of the age of the earliest Middle Stone Age(MSA), the technological variation among later middlePleistocene eastern African archaeological sites, and the natureof the Acheulian–MSA transition. Most archaeological assem-blages, particularly those north of the Ndau River, occur withinor beneath upper basaltic tuffs. Upper basaltic tuffs underliedated pumiceous trachytic deposits at NRS and are thus olderthan 284,000 ± 12,000 yr (Fig. 7). Points are a rare butconspicuous feature of the GnJh-17 excavations from beneaththe MBTU (Fig. 7, Table 1). Because points are considered thediagnostic tool type of the MSA, their presence in levels dated>284,000 yr suggests greater antiquity for the beginning of theMSA in the Kapthurin Formation than found elsewhere inAfrica (McBrearty and Tryon, 2006).
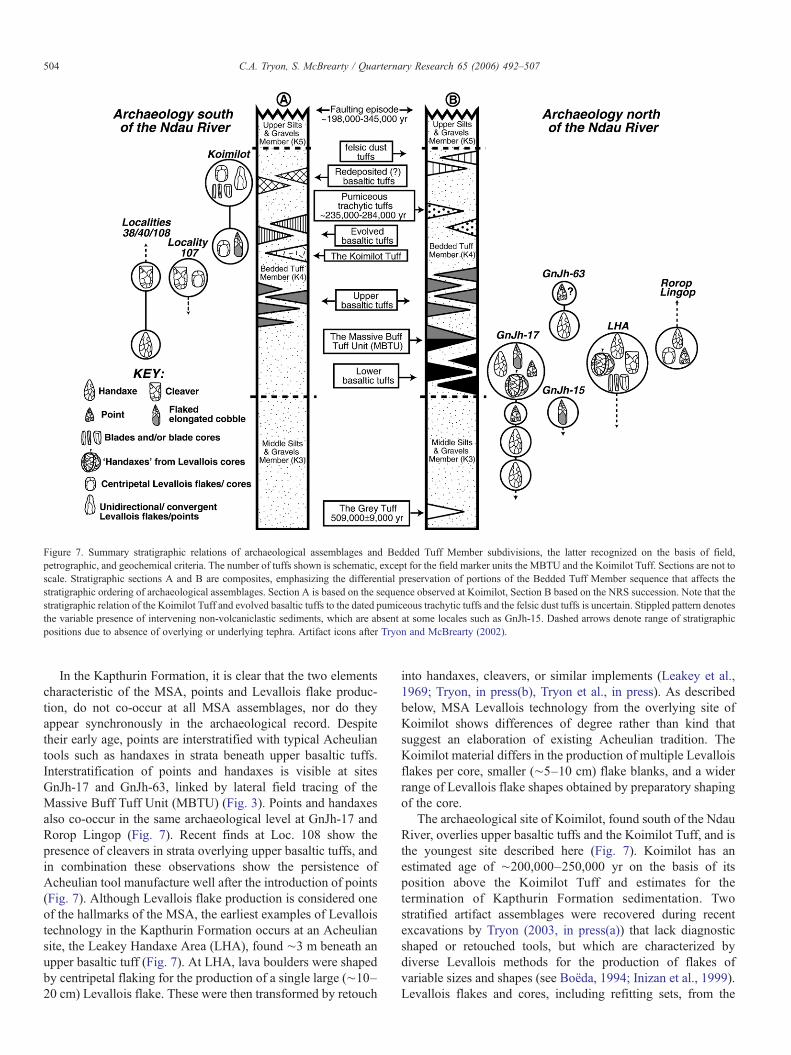
Figure 7. Summary stratigraphic relations of archaeological assemblages and Bedded Tuff Member subdivisions, the latter recognized on the basis of field,petrographic, and geochemical criteria. The number of tuffs shown is schematic, except for the field marker units the MBTU and the Koimilot Tuff. Sections are not toscale. Stratigraphic sections A and B are composites, emphasizing the differential preservation of portions of the Bedded Tuff Member sequence that affects thestratigraphic ordering of archaeological assemblages. Section A is based on the sequence observed at Koimilot, Section B based on the NRS succession. Note that thestratigraphic relation of the Koimilot Tuff and evolved basaltic tuffs to the dated pumiceous trachytic tuffs and the felsic dust tuffs is uncertain. Stippled pattern denotesthe variable presence of intervening non-volcaniclastic sediments, which are absent at some locales such as GnJh-15. Dashed arrows denote range of stratigraphicpositions due to absence of overlying or underlying tephra. Artifact icons after Tryon and McBrearty (2002).
504 C.A. Tryon, S. McBrearty / Quarternary Research 65 (2006) 492–507
In the Kapthurin Formation, it is clear that the two elementscharacteristic of the MSA, points and Levallois flake produc-tion, do not co-occur at all MSA assemblages, nor do theyappear synchronously in the archaeological record. Despitetheir early age, points are interstratified with typical Acheuliantools such as handaxes in strata beneath upper basaltic tuffs.Interstratification of points and handaxes is visible at sitesGnJh-17 and GnJh-63, linked by lateral field tracing of theMassive Buff Tuff Unit (MBTU) (Fig. 3). Points and handaxesalso co-occur in the same archaeological level at GnJh-17 andRorop Lingop (Fig. 7). Recent finds at Loc. 108 show thepresence of cleavers in strata overlying upper basaltic tuffs, andin combination these observations show the persistence ofAcheulian tool manufacture well after the introduction of points(Fig. 7). Although Levallois flake production is considered oneof the hallmarks of the MSA, the earliest examples of Levalloistechnology in the Kapthurin Formation occurs at an Acheuliansite, the Leakey Handaxe Area (LHA), found ∼3 m beneath anupper basaltic tuff (Fig. 7). At LHA, lava boulders were shapedby centripetal flaking for the production of a single large (∼10–20 cm) Levallois flake. These were then transformed by retouch
into handaxes, cleavers, or similar implements (Leakey et al.,1969; Tryon, in press(b), Tryon et al., in press). As describedbelow, MSA Levallois technology from the overlying site ofKoimilot shows differences of degree rather than kind thatsuggest an elaboration of existing Acheulian tradition. TheKoimilot material differs in the production of multiple Levalloisflakes per core, smaller (∼5–10 cm) flake blanks, and a widerrange of Levallois flake shapes obtained by preparatory shapingof the core.
The archaeological site of Koimilot, found south of the NdauRiver, overlies upper basaltic tuffs and the Koimilot Tuff, and isthe youngest site described here (Fig. 7). Koimilot has anestimated age of ∼200,000–250,000 yr on the basis of itsposition above the Koimilot Tuff and estimates for thetermination of Kapthurin Formation sedimentation. Twostratified artifact assemblages were recovered during recentexcavations by Tryon (2003, in press(a)) that lack diagnosticshaped or retouched tools, but which are characterized bydiverse Levallois methods for the production of flakes ofvariable sizes and shapes (see Boëda, 1994; Inizan et al., 1999).Levallois flakes and cores, including refitting sets, from the
505C.A. Tryon, S. McBrearty / Quarternary Research 65 (2006) 492–507
older strata at Koimilot show the production of small (∼5 cm)oval or sub-triangular flakes from centripetally prepared coresby the recurrent and preferential Levallois methods. Theoverlying stratum shows recurrent Levallois flake productionfrom centripetally prepared cores, as well as large (∼10 cm)elongated and triangular preferential Levallois flakes or points,shaped instead by unidirectional or convergent flaking of thecore.
The importance of the Koimilot data is twofold. First, theLevallois concept has itself undergone substantial recentrevision based on European and Levantine material, with awide range of flake production strategies now recognized underthe term ‘Levallois.’ The Koimilot Levallois artifacts showvariability in a late middle Pleistocene African contextcomparable to that found at European and Levantine MiddlePaleolithic sites (e.g., Boëda et al., 1990) in the methods of corereduction and in the shape and size of the flakes produced.Similar variation has also recently been documented from alimited number of African MSA sites that date to the laterPleistocene (Van Peer, 1998; Wurz, 2002; Pleurdeau, 2003).Recognizing the presence and age of different Levallois systemsof flake production found at MSA sites will aid in refining thelimits of regional traditions of artifact manufacture (Clark,1988) and in identifying trajectories of temporal change withinthe MSA, which presently remain poorly defined (Klein, 1999,2000).
Sites from within and immediately beneath the Bedded TuffMember suggest that those elements that characterize the MSA,notably points and Levallois technology, do not appear togetheras a single package but rather reflect two different, and possiblyindependent, elements of hominin tool-assisted adaptivestrategies, each having its own distinct developmental history(e.g., Boëda, 1991). Our emphasis on typology, specifically thepresence or absence of particular forms of tools, cores, or flakes,provides one framework to address change during the Acheu-lian to Middle Stone Age transition. It forms the foundation formore detailed analyses of changes in lithic assemblagecomposition and the methods of tool production and corereduction. However, the interstratification of rare tool types anddifferent expressions of Levallois flake production strategiesamong Acheulian and MSA sites, and even between differentMSA strata at Koimilot, suggests that the Acheulian–MSAtransition in the Kapthurin Formation was a complex process ofchange, rather than a sudden replacement ‘event.’We recognizethat the twofold classification of sites as either Acheulian orMSA based on lithic assemblage composition likely over-simplifies a transition characterized by an incremental or mosaicpattern of change. Technological innovation is additive innature, resulting in the retention of primitive forms, and thismay in part explain the co-occurrence of points and handaxes.
The identity of the hominins responsible for making latermiddle Pleistocene artifacts is a critical question in understand-ing the Acheulian–MSA transition because of its broadtemporal coincidence with the appearance of Homo sapiens.There was probably substantial temporal overlap among earlygroups of H. sapiens and ancestral populations of H.rhodesiensis or other species. Which species, or one of several
species, made the Kapthurin Formation artifacts is unknown,and rarely can the maker of any Pleistocene archaeologicalassemblage be identified with certainty. Close relatives insimilar environmental settings are expected to share manybehavioral features and thus to produce a similar archaeologicalsignature (Lieberman and Shea, 1994). The chronologicalframework provided by the analysis of Bedded Tuff Membertephra can now be used to integrate the traces of toolproduction, use, and discard into a broader context ofpaleoenvironmental variability, in order to explore more fullythe archaeological record for the origin of Homo sapiens.
Conclusions
Detailed stratigraphic, petrographic and electron microprobegeochemical analysis of the Bedded Tuff Member (K4) allowschronological ordering of archaeological sites within theKapthurin Formation. This tephrostratigraphic frameworkprovides a highly resolved sequence for examining archaeo-logical change during the later middle Pleistocene. The BeddedTuff Member (K4) is partitioned into eight subdivisions. Themajority of the tephra that compose K4 consist of basaltic andtrachytic deposits from a local volcanic source. Basaltic tephraof K4 are subdivided into lower, upper, and evolved basalticvariants on the basis of stratigraphic position and glass andolivine phenocryst chemical composition. The MBTU is a fieldmarker bed, but data presented here show that it is chemicallyheterogeneous, likely as a result of post-depositional reworkingof several formerly discrete layers. A compositional (or ‘Daly’)gap separates basaltic tephra of the Bedded Tuff Member fromstratigraphically overlying locally pumiceous trachytic depositsderived from the same volcanic source. These younger eruptivephases are dated by the 40Ar/39Ar method to ∼235,000–284,000 yr. Finer grained deposits with siliceous glasses, suchas the felsic dust tuffs and the Koimilot Tuff marker bed,suggest a different, more distant source than most of theBedded Tuff Member succession. These beds provide thefoundation for future studies correlating Kapthurin Formationtephra with those from other Pleistocene sedimentarysequences outside of the Baringo basin, extending the timespan and geographic scope of our study of hominin behavioralchange.
Archaeological sites within the Kapthurin Formation demon-strate the antiquity and complexity of hominin adaptations inthe later middle Pleistocene. Point-bearing strata are older than284,000 yr, and these are interstratified with those containinghandaxes and cleavers. Replacement of Acheulian tools bycharacteristic Middle Stone Age (MSA) implements was neithersudden nor complete. The MSA site of Koimilot shows diverseexpressions of Levallois flake production technology in stratadated to ∼200,000–250,000 yr. These methods may havedeveloped from existing Acheulian technology. Delimiting thenature and tempo of change that accompanied the appearance ofthe earliest MSA technology has important implications formodels of hominin speciation and dispersal, and provides thearchaeological context for the origin of our species (e.g., Foleyand Lahr, 1997; Lahr and Foley, 1998). The strength of our
506 C.A. Tryon, S. McBrearty / Quarternary Research 65 (2006) 492–507
interpretations of evolutionary change and our ability todecipher archaeological complexity must proceed from basicobservations of the order of events. We have provided a soundstratigraphic framework for archaeological sites in andimmediately beneath the Bedded Tuff Member. Establishingbasic chronologies and culture–historical frameworks in theKapthurin Formation and elsewhere remain vital to ourunderstanding of African prehistory and must precede moreelaborate explanations of the evolution of human behavior.
Acknowledgments
Tryon's research was supported by grants from the USNational Science Foundation (BCS-0118345), the Wenner-GrenFoundation, the Leakey Foundation, the University of Connecti-cut Research Foundation, and the Bill Bishop Memorial Trust,with postdoctoral funding from the Fyssen Foundation (Paris)and the Smithsonian Institution (Human Origins Program,National Museum of Natural History). Additional support wasprovided by grants to McBrearty from the US National ScienceFoundation (SBR-9601419 and BCS-0217728), from the L.S.B.Leakey Foundation, and the University of Connecticut ResearchFoundation. Tryon's field research was conducted underresearch permit MOEST 13/001/30C 229 from the Governmentof the Republic of Kenya and an exploration and excavationlicense from the Kenyan Minister for Heritage and Sports, bothissued to Tryon. McBrearty has operated under a research permit(OP/13/001/C1391/1) and excavation license issued to AndrewHill and the Baringo Paleontological Research Project (BPRP),as did Tryon during early stages of the project. We thankAnthony Philpotts, James Eckert, the Archaeology Division ofthe National Museums of Kenya, Boniface Kimeu, Andrew Hill,and Rhonda Kauffman. We acknowledge Rick Potts, ChrisCampisano, Bax R. Barton, and two anonymous reviewers fortheir challenging yet constructive criticism.
References
Baker, B.H., 1987. Outline of the petrology of the Kenya Rift alkalineprovince. In: Fitton, J.G., Upton, B.G.J. (Eds.), Alkaline Igneous Rocks.Geological Society Special Publication, vol. 30. Geological Society,London, pp. 293–311.
Barham, L.S., 2000. The Middle Stone Age of Zambia, South-Central Africa.Western Academic and Specialist Press, Bristol, England.
Bishop, W.W., Chapman, G.R., Hill, A., Miller, J.A., 1971. Succession ofCainozoic vertebrate assemblages from the northern Kenya Rift Valley.Nature 233, 389–394.
Boëda, É., 1991. Approche de la variabilité des systèmes de production lithiquedes industries du paléolithique inférieur et moyen: chronique d’unevariabilité attendue. Techniques et Cultures 17–18, 37–79.
Boëda, É., 1994. Le concept Levallois: variabilité des méthodes. CentreNational de la Recherche Scientifique Éditions, Paris.
Boëda, É., Geneste, J.-M., Meignen, L., 1990. Identification de chaînesopératoires lithiques du Paléolithique ancien et moyen. Paléo 2, 43–80.
Brown, F.H., 1994. Development of Pliocene and Pleistocene chronology of theTurkana Basin, East Africa, and its relation to other sites. In: Corrucini, R.S.,Ciochon, R.L. (Eds.), Integrative Pathways to the Past. Prentice-Hall,Englewood Cliffs, NJ, pp. 285–312.
Brown, F.H., Sarna-Wojcicki, A.M., Meyer, C.E., Haileab, B., 1992. Correlationof Pliocene and Pleistocene tephra layers between the Turkana Basin of EastAfrica and the Gulf of Aden. Quaternary International 13/14, 55–67.
Cerling, T.E., Brown, F.H., Bowman, J.R., 1985. Low-temperature alteration ofvolcanic glass: hydration, Na, K, 18O and Ar mobility. Chemical Geology52, 281–293.
Chapman, G.R., Lippard, S.J., Martyn, J.E., 1978. The stratigraphy and structureof the Kamasia Range, Kenya Rift Valley. Journal of the Geological Societyof London 135, 265–281.
Clark, J.D., 1988. The Middle Stone Age of East Africa and the beginnings ofregional identity. Journal of World Prehistory 2, 235–305.
Clark, J.D., 1999. Cultural continuity and change in hominid behaviour inAfrica during the Middle to Upper Pleistocene transition. In: Ullrich, H.(Ed.), Hominid Evolution: Lifestyles and Survival Strategies. EditionArchaea. Gelsenkirchen/Schwelm, Germany, pp. 277–292.
Clark, J.D., Beyene, Y., WoldeGabriel, G., Hart, W.K., Renne, P., Gilbert, H.,Defleur, A., Suwa, G., Katoh, S., Ludwig, K.R., Boisserie, J.-R., Asfaw, B.,White, T.D., 2003. Stratigraphic, chronological and behavioural contexts ofPleistocene Homo sapiens from Middle Awash, Ethiopia. Nature 423,747–752.
Cornelissen, E., 1992. Site GnJh-17 and its Implications for the Archaeology ofthe Middle Kapthurin Formation, Baringo, Kenya. Musée Royale del'Afrique Centrale, Annales. Sciences Humaines, vol. 133. Musée Royale del' Afrique Centrale, Tervuren.
Cornelissen, E., 1995. Indications du post-Acheuléen (Sangoen) dans laformation Kapthurin, Baringo, Kenya. L'Anthropologie 99, 55–73.
Cornelissen, E., Boven, A., Dabi, A., Hus, J., Ju Yong, K., Keppens, E.,Langhor, R., Moeyersons, J., Pasteels, P., Pieters, M., Uytterschaut, H., vanNoten, F., Workineh, H., 1990. The Kapthurin Formation revisited. AfricanArchaeological Review 8, 23–75.
Dagley, P., Mussett, A.E., Palmer, H.C., 1978. Preliminary observations on thepalaeomagnetic stratigraphy of the area west of Lake Baringo, Kenya. In:Bishop, W.W. (Ed.), Geological Background to Fossil Man. ScottishAcademic Press, Edinburgh, pp. 225–236.
Deino, A., McBrearty, S., 2002. 40Ar/39Ar chronology for the KapthurinFormation, Baringo, Kenya. Journal of Human Evolution 42, 185–210.
Dunkley, P.N., Smith, M., Allen, D.J., Darling, W.G., 1993. The GeothermalActivity and Geology of the Northern Sector of the Kenya Rift Valley.British Geological Survey International Series Research Report SC/93/1,Keyworth, Nottingham.
Feibel, C.S., 1999. Tephrostratigraphy and geological context in paleoanthro-pology. Evolutionary Anthropology 8, 87–100.
Fisher, R.V., Schmincke, H.-U., 1984. Pyroclastic Rocks. Springer-Verlag, NewYork.
Foley, R., Lahr, M.M., 1997. Mode 3 technologies and the evolution of modernhumans. Cambridge Archaeological Journal 7, 3–36.
Froggatt, P.C., 1992. Standardization of the chemical analysis of tephradeposits. Report of the ICCT Working Group. Quaternary International 13/14, 93–96.
Gibbard, P.L., 2003. Definition of the Middle-Upper Pleistocene boundary.Global and Planetary Change 36, 201–208.
Grayson, D.K., Cole, S.C., 1998. Stone tool assemblage richness during theMiddle and Early Upper Paleolithic in France. Journal of ArchaeologicalScience 25, 927–938.
Henshilwood, C.S., Marean, C.W., 2003. The origin of modern human behavior:critique of the models and their test implications. Current Anthropology 44,627–651.
Hill, A., Curtis, G., Drake, R., 1986. Sedimentary stratigraphy of theTugen Hills, Baringo District, Kenya. In: Frostick, L.E., Renaut, R.W.,Reid, I., Tiercelin, J.-J. (Eds.), Sedimentation in the African Rifts.Geological Society of London Special Publication, vol. 25. Blackwell,Oxford, pp. 285–295.
Howell, F.C., 1999. Paleo-demes, species clades, and extinctions in thePleistocene hominin record. Journal of Anthropological Research 55,191–243.
Inizan, M.-L., Reduron-Ballinger, M., Roche, H., Tixier, J., 1999. Technologyand Terminology of Knapped Stone. CREP, Nanterre.
Isaac, G.L., 1975. Sorting out the muddle in the middle: an anthropologist'spost-conference appraisal. In: Butzer, K.W., Isaac, G.L. (Eds.), After theAustralopithecines: Stratigraphy, Ecology, and Culture Change in theMiddle Pleistocene. Mouton Publishers, The Hague, pp. 875–887.
507C.A. Tryon, S. McBrearty / Quarternary Research 65 (2006) 492–507
Klein, R.G., 1999. The Human Career: Human Biological and Cultural Origins.Chicago Univ. Press, Chicago.
Klein, R.G., 2000. Archaeology and the evolution of human behavior.Evolutionary Anthropology 9, 17–36.
Lahr, M.M., Foley, R., 1998. Towards a theory of modern human origins:geography, demography, and diversity in recent human evolution. Yearbookof Physical Anthropology 41, 137–176.
Le Gall, B., Tiercelin, J.-J., Richert, J.-P., Gente, P., Sturchio, N.C., Stead, D., LeTurdu, C., 2000. A morphotectonic study of an extensional fault zone in amagma-rich rift: the Baringo Trachyte Fault System, central Kenya Rift.Tectonophysics 320, 87–106.
Leakey, M., Tobias, P.V., Martyn, J.E., Leakey, R.E.F., 1969. An Acheulianindustry with prepared core technique and the discovery of a contemporaryhominid mandible at Lake Baringo, Kenya. Proceedings of the PrehistoricSociety 3, 48–76.
Lieberman, D., Shea, J.J., 1994. Behavioral differences between archaic andmodern humans in the Levantine Mousterian. American Anthropologist 96,300–332.
Macdonald, R., 1987. Quaternary peralkaline silicic rocks and caldera volcanoesof Kenya. In: Fitton, J.G., Upton, B.G.J. (Eds.), Alkaline Igneous Rocks.Geological Society Special Publication, vol. 30. Geological Society,London, pp. 313–333.
Martyn, J., 1969. The Geologic History of the Country Between Lake Baringoand the Kerio River, Baringo District Kenya. Unpublished Ph.D. disserta-tion, University of London.
McBirney, A.R., 1984. Igneous Petrology. Freeman, Cooper and Co., SanFrancisco.
McBrearty, S., 1999. Archaeology of the Kapthurin Formation. In: Andrews, P.,Banham, P. (Eds.), Late Cenozoic Environments and Hominid Evolution: ATribute to Bill Bishop. Geological Society, London, pp. 143–156.
McBrearty, S., 2001. The Middle Pleistocene of East Africa. In: Barham, L.H.,Robson-Brown, K. (Eds.), Human Roots: Africa and Asia in the MiddlePleistocene. Western Academic and Specialist Press, Limited, Bristol, UK,pp. 81–97.
McBrearty, S., Brooks, A., 2000. The revolution that wasn't: a newinterpretation of the origin of modern human behavior. Journal of HumanEvolution 39, 453–563.
McBrearty, S., Tryon, C.A., 2006. From Acheulian to Middle Stone Age in theKapthurin Formation of Kenya. In: Hovers, E., Kuhn, S.L. (Eds.),Transitions Before the Transition: Temporal Trends in the Middle Paleolithicand Middle Stone Age. Springer, New York, pp. 257–277.
McBrearty, S., Bishop, L.C., Kingston, J.D., 1996. Variability in traces ofMiddle Pleistocene hominid behavior in the Kapthurin Formation, Baringo,Kenya. Journal of Human Evolution 30, 563–580.
McDougall, I., Brown, F.H., Fleagle, J.G., 2005. Stratigraphic placement andage of modern humans from Kibish, Ethiopia. Nature 433, 733–736.
Nelson, C.M., 1993. A standardized site enumeration system for the continent ofAfrica. Nyame Akuma 40, 62–67.
Orton, G.J., 1996. Volcanic environments, In: Reading, H.G. (Ed.), SedimentaryEnvironments: Processes, Facies and Stratigraphy, third ed. BlackwellScience, London, pp. 485–567.
Philpotts, A.R., 1990. Principles of Igneous and Metamorphic Petrology.Prentice Hall, Englewood Cliffs, NJ.
Pleurdeau, D., 2003. Le Middle Stone Age de la grotte du Porc-Épic (DireDawa, Éthiopie): gestion des matières premières et comportementstechniques. L'Anthropologie 107, 15–48.
Potts, R., Behrensmeyer, A.K., Ditchfield, P., 1999. Paleolandscape variationand Early Pleistocene hominid activities: members 1 and 7, OlorgesailieFormation, Kenya. Journal of Human Evolution 37, 747–788.
Reed, S.J.B., 1996. Electron Microprobe Analysis and Scanning ElectronMicroscopy in Geology. Cambridge Univ. Press, Cambridge.
Renaut, R.W., Owen, R.B., 1980. Late Quaternary fluvio-lacustrine sedimen-tation and lake levels in the Baringo Basin, northern Kenya Rift Valley.Recherches Gologiques en Afrique 5, 130–133.
Sarna-Wojcicki, A.M., Davis, J.O., 1991. Quaternary tephrochronology. In:Morrison, R.B. (Ed.), The Geology of North America: QuaternaryNonglacial Geology; Coterminous United States. Geological Society ofAmerica, Boulder, CO, pp. 93–116.
Sarna-Wojcicki, A.M., Pringle, M.S., Wijbrans, J., 2000. New 40Ar/39Ar age ofthe Bishop Tuff from multiple sites and sediment rate calibration for theMatuyama–Brunhes boundary. Journal of Geophysical Research 105 (B9),21431–21443.
Schmid, R., 1981. Descriptive nomenclature of classification of pyroclasticdeposits and fragments: recommendations of the IUGS subcommission onthe systematics of igneous rocks. Geology 9, 41–43.
Singer, B.S., Relle, M.K., Hoffman, K.A., Battle, A., Laj, C., Guillou, H.,Carracedo, J.C., 2002. Ar/Ar ages from transitionally magnetized lavas onLa Palma, Canary Islands, and the geomagnetic instability timescale. Journalof Geophysical Research 107 (B11), 2307.
Smith, G.A., 1991. Facies sequences and geometries in continental volcani-clastic sequences. In: Fisher, R.V., Smith, G.A. (Eds.), Sedimentation inVolcanic Settings. Society for Sedimentary Geology Special Publication,vol. 45. Society of Sedimentary Geology, Tulsa, pp. 109–122.
Stringer, C., 2002. Modern human origins: progress and prospects. Philoso-phical Transactions of the Royal Society of London, Series B: BiologicalSciences 357, 563–579.
Tallon, P.W.J., 1976. The Stratigraphy, Palaeoenvironments and Geomorphol-ogy of the Pleistocene Kapthurin Formation, Kenya. Unpublished Ph.D.dissertation, Queen Mary College.
Tallon, P.W.J., 1978. Geological setting of the hominid fossils and Acheulianartifacts from the Kapthurin Formation, Baringo District, Kenya. In: Bishop,W.W. (Ed.), Geological Background to Fossil Man. Scottish AcademicPress, Edinburgh, pp. 361–373.
Tiercelin, J.-J., Vincens, A., Barton, C., Carbonel, P., Casanova, J.,Delibrias, G., Gasse, F., Grosdidier, E., Herbin, J.-P., Huc, A.Y., Jardiné,S., Le Fournier, J., Méliéres, F., Owen, R.B., Page, P., Palacios, C.,Paquet, H., Péniguel, G., Peypouquet, J., Raynaud, J., Renaut, R.W., DeRenéville, P., Richert, J.-P., Riff, R., Robert, P., Seyve, C., Vanden-broucke, M., Vidal, G., 1987. Le demi-graben de Baringo-Bogoria, RiftGregory, Kenya. 30,000 ans d'histoire hydrologique et sédimentaire.Bulletin de Centres Recherche Exploration-Production (Elf Aquitaine),vol. 11, pp. 249–540.
Tishkoff, S.A., Williams, S.M., 2002. Genetic analysis of African populations:human evolution and complex disease. Nature Reviews. Genetics 3,611–621.
Tryon, C.A., 2002. Middle Pleistocene sites from the “southern” KapthurinFormation of Kenya. Nyame Akuma 57, 6–13.
Tryon, C.A., 2003. The Acheulian to Middle Stone Age Transition: Tephro-stratigraphic Context for Archaeological Change in the KapthurinFormation, Kenya. Unpublished Ph.D., University of Connecticut.
Tryon, C.A., in press(a). ‘Early’ Middle Stone Age lithic technology of theKapthurin Formation (Kenya). Current Anthropology.
Tryon, C.A., in press(b). Le concept Levallois en Afrique. Annales Fyssen.Tryon, C.A., McBrearty, S., 2002. Tephrostratigraphy and the Acheulian to
Middle Stone Age transition in the Kapthurin Formation, Baringo, Kenya.Journal of Human Evolution 42, 211–235.
Tryon, C.A., McBrearty, S., Texier, P.-J., in press. Levallois lithic technologyfrom the Kapthurin Formation, Kenya: Acheulian origin and Middle StoneAge diversity. African Archaeological Review.
Van Peer, P., 1998. The Nile Corridor and the Out-of-Africa model: anexamination of the archaeological record. Current Anthropology 39,S115–S140.
Van Peer, P., Fullagar, R., Stokes, S., Bailey, R.M., Moeyersons, J., Steenhudt,F., Geerts, A., Vanderbeken, T., De Dapper, M., Geus, F., 2003. The Earlyto Middle Stone Age transition and the emergence of modern humanbehavior at site 8-B-11, Sai Island, Sudan. Journal of Human Evolution 45,187–194.
White, T.D., Asfaw, B., DeGusta, D., Gilbert, H., Richards, G.D., Suwa, G.,Howell, F.C., 2003. Pleistocene Homo sapiens from Middle Awash,Ethiopia. Nature 423, 742–747.
Wurz, S., 2002. Variability in the Middle Stone Age lithic sequence, 115,000–60,000 years ago at Klasies River, South Africa. Journal of ArchaeologicalScience 29, 1001–1015.
Yamei, H., Potts, R., Baoyin, Y., Zhengtang, G., Deino, A., Wei, W., Clark, J.,Guangmao, X., Weiwen, H., 2000. Mid-Pleistocene Acheulean-like stonetechnology of the Bose basin, South China. Science 287, 1622–1626.


