Embed Size (px)
Citation preview
ORIGINAL ARTICLE
Temporal variability in the isotopic niches of rocky shoregrazers and suspension-feedersNicole B. Richoux & Rachel T. Ndhlovu
Department of Zoology and Entomology, Rhodes University, Grahamstown, South Africa
Keywords
Limpets; macroalgae; mussels; niche
partitioning; polychaetes; stable isotopes;
suspended particulate matter; urchins.
Correspondence
Nicole B. Richoux, Department of Zoology
and Entomology, Rhodes University, PO BOX
94, Grahamstown, 6140 South Africa.
E-mail: [email protected]
Accepted: 24 June 2014
doi: 10.1111/maec.12200
Abstract
Carbon and nitrogen stable isotope ratios were measured in rocky inter-tidal
suspension-feeders (brown mussels and cape reef worms) and grazers (goat’s
eye limpets and cape sea urchins) to determine the influences of lifestyle and
time on the diets of consumers. Niche partitioning between consumer species
within the same feeding guild was assessed using isotopic niche area (a proxy
for trophic niche). Specimens were collected monthly at a single site in South-
eastern South Africa from July 2010 to June 2011. Temporal variations in iso-
topic signatures were generally greater in the suspension-feeders compared
with the grazers, isotopic niche widths were smaller in the suspension-feeders
and intra-population variations in isotope signatures were larger in the grazers.
No inter-specific niche overlap (according to standard ellipse areas) was
observed within either feeding guild unless standardization calculations were
used. Temporal variations in the diets of all the consumers appeared uncou-
pled from temporal variability in the isotopic signatures of basal resources in
the region; as such, shifts in the consumer diets most likely pertained to feed-
ing behaviour and food preferences. Our data provide new insights into how
syntopic rocky shore consumers coexist by partitioning their temporally vari-
able food environment.
Introduction
Rocky shore organisms live under physically challenging
and highly dynamic conditions (through space and time),
and different species play varying roles as habitat provid-
ers, consumers and/or food sources. The complex inter-
play of organisms’ feeding relationships contributes sub-
stantially to the structure and dynamics of rocky shore
communities (Bustamante et al. 1995; Menge et al. 1999).
As such, coastal researchers have long been interested in
the feeding habits of animals in this energetic and pro-
ductive ecotone. The fluctuating nature of the habitat
contributes to a diversity of food resources available for
consumers, including macroscopic (i.e. macroalgae, mac-
rozooplankton) and microscopic (i.e. benthic and pelagic
microalgae, detritus, bacteria, microzooplankton, etc.)
material (Bustamante et al. 1995; Bode et al. 2006). Vari-
able inputs of terrestrial detritus via river run-off, or
resuspension of settled benthic material, can cause further
variability in the food available for coastal communities
(Airoldi et al. 1996; Takai et al. 2004; Richoux et al.
2014b).
Besides the obvious fundamental role of food availabil-
ity, lifestyles can differ amongst co-occurring aquatic con-
sumers and so their food is acquired through a variety of
mechanisms and behaviours (Ward & Shumway 2004;
Steinarsd�ottir et al. 2009; Aguilera et al. 2013). As such,
basic dietary compositions may contrast amongst con-
sumers, and different basal resources (e.g. primary pro-
ducers) may respond diversely to biotic and/or abiotic
drivers (e.g. Nordstr€om et al. 2009; Dethier et al. 2013).
This diversity in basal organismal responses can lead to
contrasting qualitative or quantitative fluctuations of pri-
mary producer populations, even over the same time per-
iod and in the same location. For example, macroalgal,
biofilm and phytoplankton communities respond
Marine Ecology (2014) 1–15 ª 2014 Blackwell Verlag GmbH 1
Marine Ecology. ISSN 0173-9565
differentially to changes in nutrient concentration, light
level, temperature and grazing pressure (Pedersen &
Borum 1996; Kinney & Roman 1998; Qian et al. 2003;
Thompson et al. 2004). Even within a feeding guild (e.g.
invertebrate suspension-feeders), different species can
capture suspended particles within a specific size range or
having a certain chemical composition (Kang et al. 2009)
owing to the range in sophistication and specificity of the
filtering structures that have evolved (Ward & Shumway
2004). In contrast to the pelagic feeding habits of suspen-
sion-feeders, invertebrate grazers tend to use scraping
devices to remove material associated with benthic sur-
faces. Such material can include macroalgae, bacteria,
microalgae, settled detritus and invertebrates (Thompson
et al. 2004; Camus et al. 2008). With generally different
feeding habits in the two groups, there can be an ecologi-
cal disconnect between the food sources consumed by
grazers versus suspension-feeders. It follows that we could
expect differences in the temporal variability in the diets
of rocky shore organisms occupying these contrasting
feeding guilds.
Different techniques are available to study the diets of
aquatic invertebrates including gut contents (i.e. direct
observations or DNA analysis) and tracers (i.e. fatty acid
or stable isotope signatures). We adopted stable isotope
concepts to approach our research questions because iso-
topic ratios can provide us with basic information about
consumer diets and the trophic niche occupied by a pop-
ulation (Bearhop et al. 2004; Layman et al. 2012).
Researchers have used isotopic techniques to explore the
diets of coastal invertebrates, and spatial variability has
been a topic of interest (Riera & Richard 1996; Yokoyama
& Ishihi 2007; Vanderklift & Wernberg 2010; Richoux
et al. 2014b). Questions involving seasonality in inverte-
brate community trophic interactions are also becoming
more prevalent in the literature (e.g. Rolff 2000; Decottig-
nies et al. 2007; Lefebvre et al. 2009; Nordstr€om et al.
2009; Woodland et al. 2012), although studies on inter-
tidal rocky shore communities are relatively rare (but see
Schaal et al. 2010; Richoux et al. 2014b). Temporal varia-
tions are commonly considered a source of unwanted
error in a data set, and primary consumers are often pref-
erentially used as baselines in food web studies because
their slower turnover times tend to dampen the effects of
temporal fluctuations in the isotopic signatures of pri-
mary food sources (Fukumori et al. 2008). A general
body size effect (decreased temporal variability in larger
animals; Cabana & Rasmussen 1996; Woodland et al.
2012) has further facilitated the usage of primary con-
sumers (particularly bivalves) as stable baselines for mix-
ing models. In our case, however, we focussed specifically
on temporal variability so that we may learn how com-
munity feeding interactions can change.
Regardless of the general approach taken, the combina-
tion of a diverse pool of resources subject to shifting
environmental conditions through time (all of which can
affect isotope signatures; Sato et al. 2006; Rolff 2000) cre-
ates a potentially variable dietary regime for any rocky
shore consumer. Isotopic data have been particularly suc-
cessful at revealing the range and complexity of diets in
numerous aquatic consumers (Bode et al. 2006; Decottig-
nies et al. 2007; Kang et al. 2009). Furthermore, stable
isotope metrics are becoming increasingly sophisticated
and can represent ecologically relevant proxies for trophic
niches of populations, and can even illuminate trophic
niche partitioning amongst co-occurring consumers
(Jackson et al. 2011; Layman et al. 2012). Broad-scale
patterns in aquatic consumers have been elucidated using
meta-analyses of published isotope literature, and influen-
tial biotic factors include body size and feeding habits of
organisms, whereas abiotic factors such as the trophic
state of the environment (i.e. oligotrophic, mesotrophic
or eutrophic) are equally important (Woodland et al.
2012). We chose to focus on the differences between
organisms from two trophic guilds that occupy the same
rocky inter-tidal site.
Our primary aim was to characterize the temporal vari-
ability in rocky shore consumer diets. We approached
this task by assessing the isotopic signatures of two sus-
pension-feeders and two grazers from one location on a
monthly basis over 1 year. Representative macroalgae and
suspended particulate matter (SPM) were assessed in a
similar manner to gain some understanding of changes in
local basal resources over time. We tested the hypothesis
that isotopic signatures of suspension-feeders are more
variable through time relative to those of grazers owing
to the greater potential variability in basal suspended
food resources relative to benthic algae. We were also
interested in comparing the isotopic niches of popula-
tions within each feeding guild (suspension-feeder and
grazer guilds), as any differences in isotopic niche would
suggest an influence of selective feeding.
Material and Methods
Study area
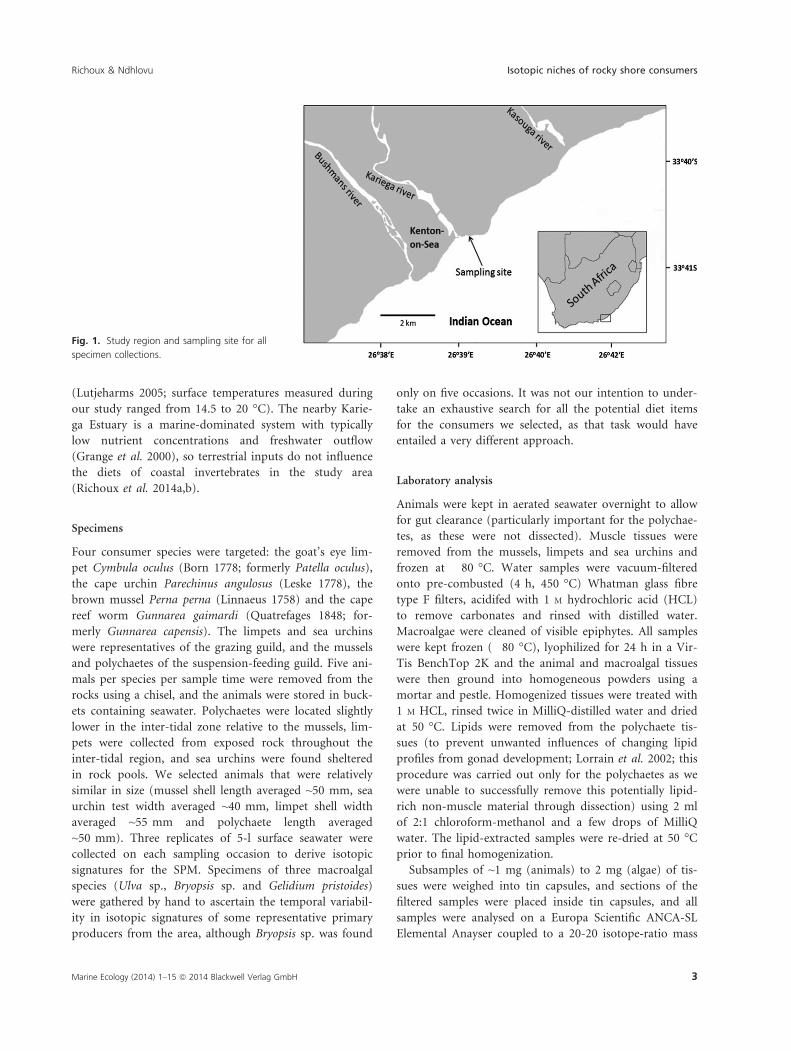
Specimen collections were carried out on a monthly basis
during low-tide dates between July 2010 and June 2011.
The collection location was in a rocky shore region
~2 km northeast of the mouth of the Kariega Estuary,
Kenton-on-Sea (Eastern Cape, South Africa; Fig. 1). The
region is warm-temperate and influenced by the warm
oligotrophic Agulhas Current flowing southeast along the
eastern coast of Southern Africa, so there is relatively
little seasonal variability in surface water temperatures
2 Marine Ecology (2014) 1–15 ª 2014 Blackwell Verlag GmbH
Isotopic niches of rocky shore consumers Richoux & Ndhlovu
(Lutjeharms 2005; surface temperatures measured during
our study ranged from 14.5 to 20 °C). The nearby Karie-
ga Estuary is a marine-dominated system with typically
low nutrient concentrations and freshwater outflow
(Grange et al. 2000), so terrestrial inputs do not influence
the diets of coastal invertebrates in the study area
(Richoux et al. 2014a,b).
Specimens
Four consumer species were targeted: the goat’s eye lim-
pet Cymbula oculus (Born 1778; formerly Patella oculus),
the cape urchin Parechinus angulosus (Leske 1778), the
brown mussel Perna perna (Linnaeus 1758) and the cape
reef worm Gunnarea gaimardi (Quatrefages 1848; for-
merly Gunnarea capensis). The limpets and sea urchins
were representatives of the grazing guild, and the mussels
and polychaetes of the suspension-feeding guild. Five ani-
mals per species per sample time were removed from the
rocks using a chisel, and the animals were stored in buck-
ets containing seawater. Polychaetes were located slightly
lower in the inter-tidal zone relative to the mussels, lim-
pets were collected from exposed rock throughout the
inter-tidal region, and sea urchins were found sheltered
in rock pools. We selected animals that were relatively
similar in size (mussel shell length averaged ~50 mm, sea
urchin test width averaged ~40 mm, limpet shell width
averaged ~55 mm and polychaete length averaged
~50 mm). Three replicates of 5-l surface seawater were
collected on each sampling occasion to derive isotopic
signatures for the SPM. Specimens of three macroalgal
species (Ulva sp., Bryopsis sp. and Gelidium pristoides)
were gathered by hand to ascertain the temporal variabil-
ity in isotopic signatures of some representative primary
producers from the area, although Bryopsis sp. was found
only on five occasions. It was not our intention to under-
take an exhaustive search for all the potential diet items
for the consumers we selected, as that task would have
entailed a very different approach.
Laboratory analysis
Animals were kept in aerated seawater overnight to allow
for gut clearance (particularly important for the polychae-
tes, as these were not dissected). Muscle tissues were
removed from the mussels, limpets and sea urchins and
frozen at �80 °C. Water samples were vacuum-filtered
onto pre-combusted (4 h, 450 °C) Whatman glass fibre
type F filters, acidifed with 1 M hydrochloric acid (HCL)
to remove carbonates and rinsed with distilled water.
Macroalgae were cleaned of visible epiphytes. All samples
were kept frozen (�80 °C), lyophilized for 24 h in a Vir-
Tis BenchTop 2K and the animal and macroalgal tissues
were then ground into homogeneous powders using a
mortar and pestle. Homogenized tissues were treated with
1 M HCL, rinsed twice in MilliQ-distilled water and dried
at 50 °C. Lipids were removed from the polychaete tis-
sues (to prevent unwanted influences of changing lipid
profiles from gonad development; Lorrain et al. 2002; this
procedure was carried out only for the polychaetes as we
were unable to successfully remove this potentially lipid-
rich non-muscle material through dissection) using 2 ml
of 2:1 chloroform-methanol and a few drops of MilliQ
water. The lipid-extracted samples were re-dried at 50 °Cprior to final homogenization.
Subsamples of ~1 mg (animals) to 2 mg (algae) of tis-
sues were weighed into tin capsules, and sections of the
filtered samples were placed inside tin capsules, and all
samples were analysed on a Europa Scientific ANCA-SL
Elemental Anayser coupled to a 20-20 isotope-ratio mass
Fig. 1. Study region and sampling site for all
specimen collections.
Marine Ecology (2014) 1–15 ª 2014 Blackwell Verlag GmbH 3
Richoux & Ndhlovu Isotopic niches of rocky shore consumers
spectrometer. The data were expressed in & in the stan-
dard d unit notation: dX = [(Rsample/Rstandard) � 1]1000,
where X = 13C or 15N and R = 13C/12C or 15N/14N. These
abundances were calculated in relation to in-house stan-
dards (casein and a mixture of beet sugar and ammo-
nium) calibrated against International Atomic Energy
Agency (IAEA)-CH-6 and IAEA-N-1 reference materials.
Data analyses
To address the main hypothesis (that isotopic signatures
of suspension-feeders are more variable through time rel-
ative to those of grazers), we visually examined the
changes in carbon and nitrogen isotope signatures in all
consumers and potential basal sources over time. For
each species, three-one-way analyses of variance (ANO-
VAs) were completed: one with d13C signature as the
dependent variable, the second with d15N signature and
the third with trophic position (see the next paragraph
regarding the calculation for trophic position). ‘Time’
was included as the predictor variable for each ANOVA
to determine whether the isotope signatures differed
amongst sampling dates. When residual analysis indicated
that the parametric model assumptions were not valid, a
non-parametric Kruskal–Wallis test was carried out
instead. ANOVAs were not performed using d13Ccorrected
(parameter described below) as the statistical output was
identical to those of the non-corrected d13C values. Raw
data for each consumer from four different dates were
examined in additional detail using d13C versus d15N bi-
plots to further compare temporal variability within the
suspension-feeder and grazer guilds.
In order to assess whether the isotopic niches of the two
suspension-feeding species were distinct from one another,
and the isotopic niches of the two grazers were distinct
from one another, we calculated the trophic position
(Vander Zanden & Rasmussen 1999) for each individual
consumer relative to a possible food source as a baseline
(SPM, Ulva sp. or Gelidium pristoides): trophic positioncon-
sumer = 1+[(d15Nconsumer � d15Nbaseline) � (TFd15N)�1], where
d15Nconsumer is the d15N value for an individual consumer,
d15Nbaseline represents the reference baseline value at posi-
tion 1 and TFd15N is the mean trophic fractionation factor
of 2& (McCutchan et al. 2003). These trophic position
calculations allowed for incorporation of potential shifts in
baseline food sources over time. As an additional indicator
of isotopic niche space occupied by each consumer, coeffi-
cients of variation (CVs) for d13C and d15N were calculated
on each date to provide standardized values of intra-spe-
cific variability (and mean CVs were calculated from these
monthly values to compute a measure for general intra-
specific variability over the study period). We postulated
that organisms feeding on a larger range of food items
would have larger mean CVs, indicating greater amongst-
individual variability in diet within any given time, relative
to more specialized feeders. Technically, CVs are intended
for data measured on a ratio scale, and as isotope signa-
tures are interval-scale data, we calculated the maximum
change within each time series for each population (Dd15N,Dtrophic position, Dd13C and Dd13Ccorrected, see next para-
graph for the d13Ccorrected calculation) as additional stan-
dardized measures of variability (Olsson et al. 2009;
Woodland et al. 2012).
The isotopic niche width of each consumer population
(data from all dates pooled) was calculated using both
convex hull (Layman et al. 2012) and standard ellipse
areas (SEAs; Jackson et al. 2011). These isotopic metrics
are proxy measures for the trophic niches of populations,
with the convex hull technique describing the niche space
occupied by all samples collected from a population, and
the SEA describing the average niche space occupied by a
population (Layman et al. 2012). As isotopic niche area
for a population can be influenced by variations in base-
line sources over space and time (Matthews & Mazumder
2004; Hoeinghaus & Zeug 2008), we also calculated the
convex hull and SEA metrics using consumer data
corrected for these shifts [trophic position instead of
d15N, and d13Ccorrected instead of d13C; where d13Ccor-
rected = (d13Cconsumer � d13Cmean of baseline)/carbon range of
baseline; Olsson et al. 2009]. The baseline used for the
suspension-feeders was SPM, and the baseline for the sea
urchins was all the macroalgae combined. For the limpets
we utilized Ulva sp. and Corallina sp. (the latter derived
from Allan et al. 2010) as the limpet d13C signatures ran-
ged between these two sources. These statistical proce-
dures using d13Ccorrected served as a sensitivity analysis to
determine how choice of baseline sources can influence
isotopic niche calculations. Isotopic metrics were calcu-
lated using Stable Isotope Analysis in R (SIAR; Parnell
et al. 2010), ANOVA and Kruskal–Wallis tests were per-
formed using SYSTAT 12 and graphics were created in
SIGMAPLOT 10.
Results
Temporal variations in rocky shore organisms
The d15N and d13C signatures of suspension-feeders
(Perna perna and Gunnarea gaimardi) and grazers (Pare-
chinus angulosus and Cymbula oculus) showed different
patterns of variability through time (Fig. 2). ANOVA or
Kruskal–Wallis tests indicated significant shifts in d15Nand d13C signatures and the trophic positions of the sus-
pension-feeders over time (Table 1). The d13C values in
both suspension-feeders were generally increasingly
depleted through summer (November to February;
4 Marine Ecology (2014) 1–15 ª 2014 Blackwell Verlag GmbH
Isotopic niches of rocky shore consumers Richoux & Ndhlovu

Fig. 2B), whereas temporal patterns in d15N values were
very different in Pe. perna and Gu. gaimardi and fluctua-
tions in Gu. gaimardi were much greater overall
(Fig. 2A). Of the two grazers, the d13C signatures of
Pa. angulosus changed significantly [with generally higher
values occurring in summer/autumn (January through to
April); Fig. 1D], but there was no distinctive temporal
pattern in their d15N values (Table 1; Fig. 2C). There was
a significant effect of time on trophic position of Pa. ang-
ulosus (Table 1), a metric that takes into account shifts in
basal resources. The d15N and d13C signatures of the
limpets (C. oculus) were remarkably consistent, although
as in the sea urchins, the trophic position of the limpets
shifted significantly over time (Table 1; Fig. 2C,D).
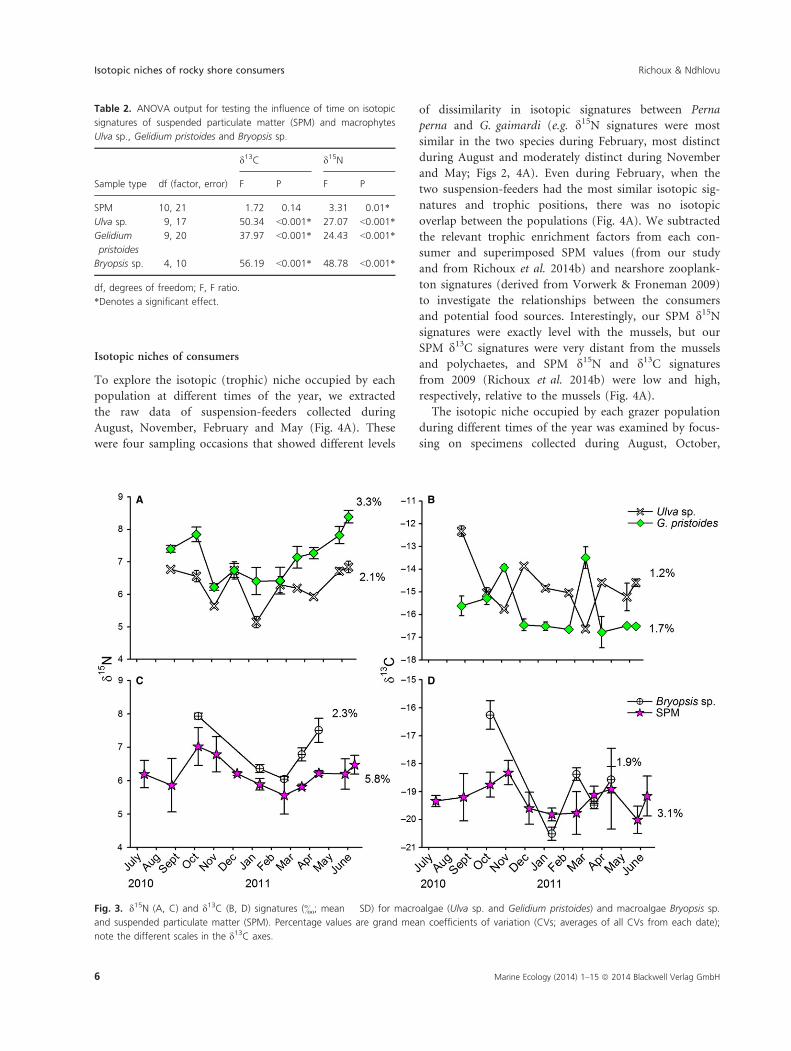
The isotopic signatures of SPM and the three macroal-
gae were highly variable for the most part; only d13C val-
ues of SPM were not significantly influenced by time
(Table 2; Fig. 3). There was a general trend of depletion
in d15N values, particularly in SPM, Bryopsis sp. and Geli-
dium pristoides, during the summer months, but no com-
mon trend occurred in d13C values of the local basal
resources (Fig. 3).
Table 1. ANOVA and Kruskal–Wallis (KW) output for testing the influence of time on isotopic signatures and trophic positions (TP) of suspen-
sion-feeders Perna perna and Gunnarea gaimardi, and grazers Cymbula oculus and Parechinus angulosus.
Species df (factor, error)
d13C d15N TP
F/KW P F P F/KW P
Perna perna 10, 37 4.85 <0.001* 2.42 0.025* 7.86 <0.001*
Gunnarea gaimardi 9, 36 32.97 <0.001* 16.45 <0.001* 31.46 <0.001*
Cymbula oculus 10, 44 10.93 0.36 1.47 0.18 6.12 <0.001*
Parechinus angulosus 10, 30 18.79 0.043* 1.17 0.35 6.38 <0.001*
df, degrees of freedom; F, F ratio.
*Denotes a significant effect.
Underlined values are the Kruskal Wallis outputs.
A B
C D
Fig. 2. d15N (A, C) and d13C (B, D) signatures (&; mean � SD of three to five individuals per species and sample time) for suspension-feeders
(mussels Perna perna and polychaetes Gunnarea gaimardi) and grazers (sea urchins Parechinus angulosus and limpets Cymbula oculus).
Percentage values are grand mean coefficients of variation (CVs; averages of all CVs from each date); note the different scales in the d13C axes.
Marine Ecology (2014) 1–15 ª 2014 Blackwell Verlag GmbH 5
Richoux & Ndhlovu Isotopic niches of rocky shore consumers
Isotopic niches of consumers
To explore the isotopic (trophic) niche occupied by each
population at different times of the year, we extracted
the raw data of suspension-feeders collected during
August, November, February and May (Fig. 4A). These
were four sampling occasions that showed different levels
of dissimilarity in isotopic signatures between Perna
perna and G. gaimardi (e.g. d15N signatures were most
similar in the two species during February, most distinct
during August and moderately distinct during November
and May; Figs 2, 4A). Even during February, when the
two suspension-feeders had the most similar isotopic sig-
natures and trophic positions, there was no isotopic
overlap between the populations (Fig. 4A). We subtracted
the relevant trophic enrichment factors from each con-
sumer and superimposed SPM values (from our study
and from Richoux et al. 2014b) and nearshore zooplank-
ton signatures (derived from Vorwerk & Froneman 2009)
to investigate the relationships between the consumers
and potential food sources. Interestingly, our SPM d15Nsignatures were exactly level with the mussels, but our
SPM d13C signatures were very distant from the mussels
and polychaetes, and SPM d15N and d13C signatures
from 2009 (Richoux et al. 2014b) were low and high,
respectively, relative to the mussels (Fig. 4A).
The isotopic niche occupied by each grazer population
during different times of the year was examined by focus-
sing on specimens collected during August, October,
Table 2. ANOVA output for testing the influence of time on isotopic
signatures of suspended particulate matter (SPM) and macrophytes
Ulva sp., Gelidium pristoides and Bryopsis sp.
Sample type df (factor, error)
d13C d15N
F P F P
SPM 10, 21 1.72 0.14 3.31 0.01*
Ulva sp. 9, 17 50.34 <0.001* 27.07 <0.001*
Gelidium
pristoides
9, 20 37.97 <0.001* 24.43 <0.001*
Bryopsis sp. 4, 10 56.19 <0.001* 48.78 <0.001*
df, degrees of freedom; F, F ratio.
*Denotes a significant effect.
A B
C D
Fig. 3. d15N (A, C) and d13C (B, D) signatures (&; mean � SD) for macroalgae (Ulva sp. and Gelidium pristoides) and macroalgae Bryopsis sp.
and suspended particulate matter (SPM). Percentage values are grand mean coefficients of variation (CVs; averages of all CVs from each date);
note the different scales in the d13C axes.
6 Marine Ecology (2014) 1–15 ª 2014 Blackwell Verlag GmbH
Isotopic niches of rocky shore consumers Richoux & Ndhlovu
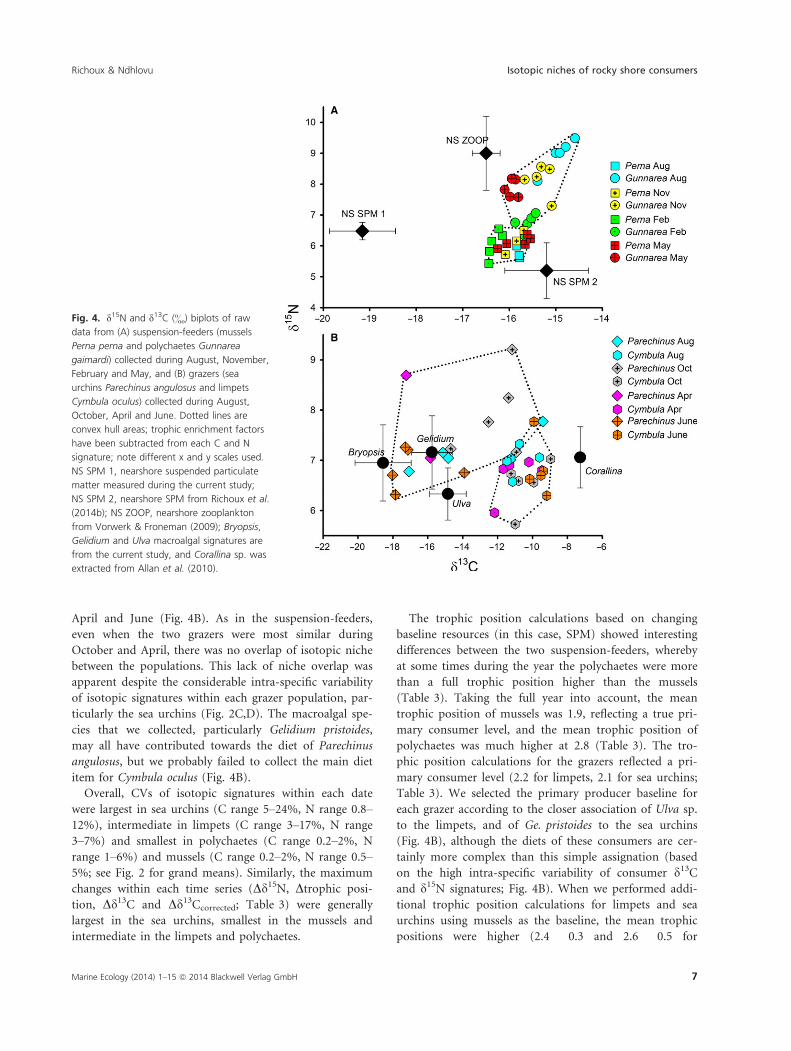
April and June (Fig. 4B). As in the suspension-feeders,
even when the two grazers were most similar during
October and April, there was no overlap of isotopic niche
between the populations. This lack of niche overlap was
apparent despite the considerable intra-specific variability
of isotopic signatures within each grazer population, par-
ticularly the sea urchins (Fig. 2C,D). The macroalgal spe-
cies that we collected, particularly Gelidium pristoides,
may all have contributed towards the diet of Parechinus
angulosus, but we probably failed to collect the main diet
item for Cymbula oculus (Fig. 4B).
Overall, CVs of isotopic signatures within each date
were largest in sea urchins (C range 5–24%, N range 0.8–12%), intermediate in limpets (C range 3–17%, N range
3–7%) and smallest in polychaetes (C range 0.2–2%, N
range 1–6%) and mussels (C range 0.2–2%, N range 0.5–5%; see Fig. 2 for grand means). Similarly, the maximum
changes within each time series (Dd15N, Dtrophic posi-
tion, Dd13C and Dd13Ccorrected; Table 3) were generally
largest in the sea urchins, smallest in the mussels and
intermediate in the limpets and polychaetes.
The trophic position calculations based on changing
baseline resources (in this case, SPM) showed interesting
differences between the two suspension-feeders, whereby
at some times during the year the polychaetes were more
than a full trophic position higher than the mussels
(Table 3). Taking the full year into account, the mean
trophic position of mussels was 1.9, reflecting a true pri-
mary consumer level, and the mean trophic position of
polychaetes was much higher at 2.8 (Table 3). The tro-
phic position calculations for the grazers reflected a pri-
mary consumer level (2.2 for limpets, 2.1 for sea urchins;
Table 3). We selected the primary producer baseline for
each grazer according to the closer association of Ulva sp.
to the limpets, and of Ge. pristoides to the sea urchins
(Fig. 4B), although the diets of these consumers are cer-
tainly more complex than this simple assignation (based
on the high intra-specific variability of consumer d13Cand d15N signatures; Fig. 4B). When we performed addi-
tional trophic position calculations for limpets and sea
urchins using mussels as the baseline, the mean trophic
positions were higher (2.4 � 0.3 and 2.6 � 0.5 for
A
B
Fig. 4. d15N and d13C (&) biplots of raw
data from (A) suspension-feeders (mussels
Perna perna and polychaetes Gunnarea
gaimardi) collected during August, November,
February and May, and (B) grazers (sea
urchins Parechinus angulosus and limpets
Cymbula oculus) collected during August,
October, April and June. Dotted lines are
convex hull areas; trophic enrichment factors
have been subtracted from each C and N
signature; note different x and y scales used.
NS SPM 1, nearshore suspended particulate
matter measured during the current study;
NS SPM 2, nearshore SPM from Richoux et al.
(2014b); NS ZOOP, nearshore zooplankton
from Vorwerk & Froneman (2009); Bryopsis,
Gelidium and Ulva macroalgal signatures are
from the current study, and Corallina sp. was
extracted from Allan et al. (2010).
Marine Ecology (2014) 1–15 ª 2014 Blackwell Verlag GmbH 7
Richoux & Ndhlovu Isotopic niches of rocky shore consumers
limpets and sea urchins, respectively), and although a
temporal effect was absent in the sea urchins
(F10,30 = 1.83, P = 0.098), there remained a significant
effect of time on limpet trophic position (F10,44 = 3.69,
P = 0.001).
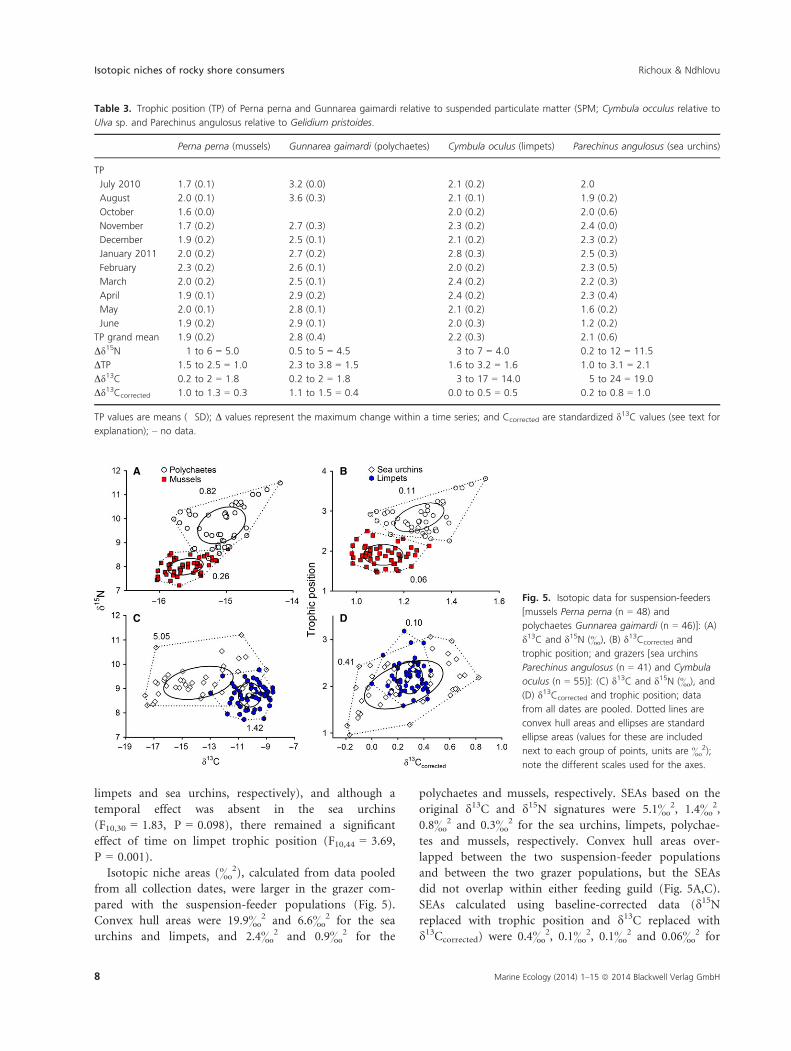
Isotopic niche areas (&2), calculated from data pooled
from all collection dates, were larger in the grazer com-
pared with the suspension-feeder populations (Fig. 5).
Convex hull areas were 19.9&2 and 6.6&2 for the sea
urchins and limpets, and 2.4&2 and 0.9&2 for the
polychaetes and mussels, respectively. SEAs based on the
original d13C and d15N signatures were 5.1&2, 1.4&2,
0.8&2 and 0.3&2 for the sea urchins, limpets, polychae-
tes and mussels, respectively. Convex hull areas over-
lapped between the two suspension-feeder populations
and between the two grazer populations, but the SEAs
did not overlap within either feeding guild (Fig. 5A,C).
SEAs calculated using baseline-corrected data (d15Nreplaced with trophic position and d13C replaced with
d13Ccorrected) were 0.4&2, 0.1&2, 0.1&2 and 0.06&2 for
Table 3. Trophic position (TP) of Perna perna and Gunnarea gaimardi relative to suspended particulate matter (SPM; Cymbula occulus relative to
Ulva sp. and Parechinus angulosus relative to Gelidium pristoides.
Perna perna (mussels) Gunnarea gaimardi (polychaetes) Cymbula oculus (limpets) Parechinus angulosus (sea urchins)
TP
July 2010 1.7 (0.1) 3.2 (0.0) 2.1 (0.2) 2.0
August 2.0 (0.1) 3.6 (0.3) 2.1 (0.1) 1.9 (0.2)
October 1.6 (0.0) � 2.0 (0.2) 2.0 (0.6)
November 1.7 (0.2) 2.7 (0.3) 2.3 (0.2) 2.4 (0.0)
December 1.9 (0.2) 2.5 (0.1) 2.1 (0.2) 2.3 (0.2)
January 2011 2.0 (0.2) 2.7 (0.2) 2.8 (0.3) 2.5 (0.3)
February 2.3 (0.2) 2.6 (0.1) 2.0 (0.2) 2.3 (0.5)
March 2.0 (0.2) 2.5 (0.1) 2.4 (0.2) 2.2 (0.3)
April 1.9 (0.1) 2.9 (0.2) 2.4 (0.2) 2.3 (0.4)
May 2.0 (0.1) 2.8 (0.1) 2.1 (0.2) 1.6 (0.2)
June 1.9 (0.2) 2.9 (0.1) 2.0 (0.3) 1.2 (0.2)
TP grand mean 1.9 (0.2) 2.8 (0.4) 2.2 (0.3) 2.1 (0.6)
Dd15N 1 to 6 = 5.0 0.5 to 5 = 4.5 3 to 7 = 4.0 0.2 to 12 = 11.5
DTP 1.5 to 2.5 = 1.0 2.3 to 3.8 = 1.5 1.6 to 3.2 = 1.6 1.0 to 3.1 = 2.1
Dd13C 0.2 to 2 = 1.8 0.2 to 2 = 1.8 3 to 17 = 14.0 5 to 24 = 19.0
Dd13Ccorrected 1.0 to 1.3 = 0.3 1.1 to 1.5 = 0.4 0.0 to 0.5 = 0.5 �0.2 to 0.8 = 1.0
TP values are means (�SD); D values represent the maximum change within a time series; and Ccorrected are standardized d13C values (see text for
explanation); – no data.
A B
C D
Fig. 5. Isotopic data for suspension-feeders
[mussels Perna perna (n = 48) and
polychaetes Gunnarea gaimardi (n = 46)]: (A)
d13C and d15N (&), (B) d13Ccorrected and
trophic position; and grazers [sea urchins
Parechinus angulosus (n = 41) and Cymbula
oculus (n = 55)]: (C) d13C and d15N (&), and
(D) d13Ccorrected and trophic position; data
from all dates are pooled. Dotted lines are
convex hull areas and ellipses are standard
ellipse areas (values for these are included
next to each group of points, units are &2);
note the different scales used for the axes.
8 Marine Ecology (2014) 1–15 ª 2014 Blackwell Verlag GmbH
Isotopic niches of rocky shore consumers Richoux & Ndhlovu
the sea urchins, limpets, polychaetes and mussels, respec-
tively, and there was complete overlap of SEAs between
the sea urchins and limpets (Fig. 5B,D).
Discussion
Temporal variability in consumers
We investigated the hypothesis that isotopic signatures of
rocky shore suspension-feeders are more variable through
time relative to those of grazers owing to the greater
potential temporal variability in suspended basal food
sources relative to that of benthic algae. Our hypothesis
was partially supported, as there were consistent temporal
effects on both of the suspension-feeding species (for
both d13C and d15N signatures and trophic position), but
generally not for the grazers (except for sea urchin d13Cand trophic position for both grazers; Table 1, Fig. 2).
The trophic position of the grazers changed abruptly
between consecutive months on several occasions
(Table 3), hence leading to the significant effects of time
on trophic position. Grazer trophic position values were
calculated based on Ulva sp. and Gelidium pristoides sig-
natures in the first instance, and temporal shifts in the
macroalgal signatures were large and erratic (particularly
throughout the summer; Fig. 3), so the algae did not rep-
resent ideal baselines from which to calculate grazer tro-
phic positions. However, even when we used mussels as
the baseline, there remained a significant effect of time
on limpet trophic position. Despite any uncertainties or
large variations in basal food sources, the temporal shifts
in diet amongst the different consumers were clearly dis-
tinct for each population, and intra-population variability
during each sampling time (shown using the CV and Dcalculations) was clearly a critical influence on the statis-
tical outcomes. For example, in contrast with the large
intra-population variability in the grazers on each date,
variability within the suspension-feeders was much smal-
ler (especially for the carbon metrics), so even small shifts
from one date to the next were readily apparent. The
smaller within-date intra-population variability in the
suspension-feeders probably reflected their increased feed-
ing specificity compared with grazers, as filtration mecha-
nisms of many species exploit certain components of the
suspended particulates available (Decottignies et al. 2007;
Yokoyama & Ishihi 2007; Kang et al. 2009). One aspect
of our data that did not support our hypothesis was that
temporal variability was generally not greater in the SPM
compared with the macroalgae (Fig. 3; Table 2). In fact,
although mean within-date CVs for SPM d13C and d15Nvalues were larger than those of the macroalgae (Fig. 3),
SPM variations over the year were generally less
pronounced than those in the macroalgae (Fig. 3;
Table 2). As such, consumer feeding behaviour appeared
to be a more important driver for temporal variations in
their own diet signatures than variations within the basal
resources.
The mobility and therefore increased foraging range of
grazers compared with sessile suspension-feeders may
have contributed to the increased within-date intra-popu-
lation variability, but decreased temporal variability,
observed in the grazer guild. Increased amongst-individ-
ual foraging variability in consumers has been expressed
as an increase in population niche width in some terres-
trial consumers (Darimont et al. 2009; Semmens et al.
2009), although the opposite pattern (i.e. greater isotopic
variation in specialist consumers relative to generalists)
can also occur (e.g. Flaherty & Ben-David 2010). Cer-
tainly the spatial scale and relative heterogeneity of the
foraging areas available to consumers (e.g. a rocky inter-
tidal zone available to benthic invertebrates versus the
greater span of terrestrial habitats available to large terres-
trial vertebrates) must also be taken into consideration.
Bearhop et al. (2004) predicted that increased foraging
range could lead to increased variation in isotopic signa-
tures of consumers, and our larger within-date intra-pop-
ulation variability in the limpets and sea urchins supports
their prediction. It also makes intuitive sense that
increased intra-population variations would dampen tem-
poral effects. Woodland et al. (2012) completed a large-
scale meta-analysis of published studies that spanned
freshwater, estuarine and coastal habitats. They found an
effect of feeding group on the temporal variability of con-
sumers, with generally increased variability in grazers rel-
ative to suspension-feeders or detritivores (Woodland
et al. 2012), so our data did not fit their overall pattern.
Bearhop et al. (2004) predicted that populations with
individuals that feed from different trophic levels will
have increased isotopic variance; this prediction seems
particularly relevant to the sea urchins in our study,
which had the largest variation in trophic position of all
the consumers that we assessed (Table 3). Potential diet
items for the different consumers in our study, with
respect to how they may affect trophic position, are
described in the next two sections. The short answer to
our first hypothesis about the temporal variability of
grazers versus suspension-feeders is that grazers were less
variable through time, but probably not because their
food was more consistent through time.
Large-scale (inter-annual) and small- to medium-scale
(daily to monthly) changes in the isotopic signatures of
nearshore SPM and rocky inter-tidal macroalgae occur
within different biogeographical regions of the South
African coastline (Hill et al. 2006, 2008). At some loca-
tions, mean d13C values of SPM changed by more than
4& from 1 year to the next (and by up to 3& during a
Marine Ecology (2014) 1–15 ª 2014 Blackwell Verlag GmbH 9
Richoux & Ndhlovu Isotopic niches of rocky shore consumers
tidal cycle within 1 day), and the macroalgal signatures
(including Ulva sp. and Ge. pristoides) were largely and
erratically variable so that no temporal patterns could be
extracted and no direct links to local primary consumers
were possible (Hill et al. 2006, 2008). A clear nearshore
to offshore gradient (from the shoreline to 10 km off-
shore) of increased depletion in SPM d13C values was
apparent; thus, large- and medium-scale temporal
changes in coastal SPM signatures could arise from vari-
able nearshore oceanographic dynamics, shifts in the
position of the Agulhas Current and perhaps variable
mixing of offshore and nearshore waters (Hill et al.
2006). In these previous studies, the shifts in SPM signa-
tures were not reflected in Perna perna so there was a dis-
connect between food and consumer, and the mussels
seemed to have fairly constant diets over large time peri-
ods (i.e. months to years; Hill et al. 2006, 2008). Tempo-
ral variations in the SPM can be caused or enhanced by
periodic upwelling conditions (or any other process that
produces changes in temperature, light, resuspension
events, sources of inorganic carbon or circulation pat-
terns) or shifts in phytoplankton community composition
(Goering et al. 1990; Rolff 2000; Takai et al. 2004; Nord-
str€om et al. 2009), whereas consumer diets can be greatly
dampened by their relatively slow tissue turnover rates
(Rolff 2000; O’Reilly et al. 2002). We observed a similar
uncoupling between SPM and the suspension-feeders that
we assessed (Pe. perna and Gunnarea gaimardi), as the
SPM d13C signatures were fairly low relative to the con-
sumers (whereas our SPM values measured during previ-
ous years were higher; Richoux et al. 2014b; Fig. 4A),
and the temporal dynamics of food and consumer did
not match. All of our water collections were completed
during low tide, when d13C signatures can be most
depleted in a tidal cycle (Hill et al. 2008), whereas the
average of SPM signatures measured throughout an entire
tidal cycle were enriched probably by about 2&.
Researchers studying the rocky inter-tidal zone in a
region of the Sea of Japan demonstrated how the physical
resuspension of microphytobenthos caused significant 13C
enrichment in the suspended particulates, and in that
case this enrichment was reflected in the local suspen-
sion-feeders (Takai et al. 2004). However, mismatches
between isotopic signatures of food and benthic consum-
ers are not uncommon in the literature (e.g. Goering
et al. 1990; Lorrain et al. 2002; Nordstr€om et al. 2009)
and are an important reflection of alternative isotopic
turnover dynamics at different trophic levels.
Studies of temporal dynamics in basal food sources
and consumers have been carried out in some soft- and
hard-substrate coastal regions. Nordstr€om et al. (2009)
noted temporal changes in isotopic signatures of infaunal
invertebrates in the Baltic Sea resulting from seasonal
shifts in food availability and in consumer feeding habits,
with no time lags observed between basal resources and
consumers. These researchers showed some evidence for
potential resource partitioning amongst different species
within the same feeding guilds in a shallow subtidal
coastal community (Nordstr€om et al. 2009), and it would
be interesting to explore their data set using isotopic met-
rics. Relatively small seasonal changes were observed in
isotopic signatures of many rocky shore consumers in
Western Brittany, France, occupying several feeding guilds
(filter-feeders, grazers and carnivores; Schaal et al. 2010),
although the sampling events during that study were nei-
ther numerous nor frequent. Our own data suggest that
the temporal scale chosen for any particular study may
greatly influence the clarity regarding shifts in producers
or consumers occupying different trophic guilds, as dif-
ferent components of a food web can shift isotopically in
very different manners.
Isotopic niches of suspension-feeders
As the SPM isotopic signatures were not statistically more
temporally variable than those of the representative
attached macroalgae (Table 2), the increased temporal
variations in suspension-feeder diets were probably influ-
enced by differences in particle selection between the two
species relative to changing food availability. Some sus-
pension-feeders have exceptional abilities to select specific
types of particles from a complex seston mixture (Ward
& Shumway 2004), so regardless of the composition of
the SPM, they can regulate their diets (to a point). This
premise led us to test whether the isotopic niches of the
two suspension-feeders differed, potentially owing to dis-
parate particle selection behaviours.
Most bivalves tend to have excellent selective abilities
(Ward & Shumway 2004). Mussels such as Perna perna
use cilia located along highly folded gills to actively create
feeding currents and trap suspended particles brought in
with the incurrent flow (Riisg�ard & Larsen 2010). Perna
mussels can retain particles as small as 0.46 lm and as
large as 2 mm (Schleyer 1981; Berry & Schleyer 1983;
Wong & Levinton 2006), a range that encompasses a
large variety of organisms from bacteria to microzoo-
plankton, but they tend to preferentially select and ingest
particles between 2 and 100 lm (Riisg�ard & Larsen
2010). Through flexible selection abilities and physiologi-
cal plasticity, Pe. perna can regulate the organic content
of the food it ingests to maximize its energy gain
throughout periods of changing food supply (Suplicy
et al. 2003).
Sabellid reef-building polychaetes such as Gunnarea
gaimardi use ciliated tentacles to create water currents
and trap suspended particles, and most research has
10 Marine Ecology (2014) 1–15 ª 2014 Blackwell Verlag GmbH
Isotopic niches of rocky shore consumers Richoux & Ndhlovu
indicated that these animals feed on particles between 1
and 20 lm (Nichol 1930; Merz 1984; Mayer 1994; Ri-
isg�ard & Larsen 2010). Suspended particles in this size
range generally include items such as phytoplankton,
detritus and bacteria. In contrast with these foundation
feeding studies on suspension-feeding polychaetes, the
growing isotopic literature indicates that a variety of
polychaete species occupy relatively high level trophic
positions relative to other co-occurring suspension-feed-
ers including mussels, oysters, ascidians and sometimes
barnacles (Dubois et al. 2007; Lefebvre et al. 2009; Ric-
houx et al. 2014b). A higher trophic position would indi-
cate that the polychaetes are feeding on primary
consumers such as microzooplankton. It is difficult to
reconcile the existing divergent evidence for polychaete
feeding dynamics from traditional and isotopic methods,
but this interesting contrast deserves additional attention
so that the question about polychaete diets may be better
resolved.
Previous research on the diet of the cape reef worm
Gu. gaimardi revealed that it fed at a higher trophic level
than the brown mussel Pe. perna (trophic positions 2.6
and 2, respectively; Richoux et al. 2014b). In this earlier
study, the trophic position of 2 for Pe. perna was
assigned, and the polychaete trophic position was calcu-
lated in reference to the mussels (Richoux et al. 2014b).
In our temporal study, we calculated the trophic posi-
tion of mussels at 1.9 � 0.2SD relative to the SPM, and
the position of the polychaetes was 2.8 � 0.4 (Table 3),
further confirming a wide distinction between the feed-
ing habits of these species. In comparing the shifts in
polychaete and mussel diets through time, it appears
that during winter the polychaetes had larger contribu-
tions from zooplankton (or some other enriched food
source) in their diets; hence, their trophic positions were
highest during this period (Fig. 2; Table 3). However, in
the summer, the polychaetes approached the isotope
profiles of the mussels, which fed consistently at a pri-
mary consumer level for the entire year. As such, differ-
ential microzooplankton availability through time may
be influential on the polychaete diets, whereas mussels
consistently selected a smaller size fraction of the SPM
that was potentially more isotopically constant through-
out the year. The small intra-population variance of
polychaetes at each sampling time indicated that the
switch away from the 15N-enriched diet after August
2010 was occurring synchronously within the polychaete
population (otherwise the variation would have increased
at times of the year when different individuals were
selecting different components from the seston). Data on
the temporal variability of stable isotope signatures and
availability of microzooplankton as food for coastal con-
sumers in the study area are virtually absent; thus, future
studies involving these aspects of the rocky shore habitat
will only help to clarify the speculations that we have
made above regarding the temporal dynamics of the
polychaete diets.
Temporally fluctuating feeding niche relationships have
also been observed in co-occurring invasive suspension-
feeders, the slippersnail Crepidula fornicata and the oyster
Crassostrea gigas, in Bourgneuf Bay, France (Decottignies
et al. 2007). Species-specific differentiation in particle
selection abilities and behaviour helped to explain the
temporal variability, as the oysters were capable of
actively selecting higher quality particles during phyto-
plankton bloom periods, whereas the slippersnails fed
indiscriminately throughout the year (Decottignies et al.
2007). In that case, inter-specific competition was proba-
bly occurring only during winter and spring when food
quality was decreased in the environment (Decottignies
et al. 2007). Similar limited trophic competition between
co-occurring suspension-feeding consumers has been
observed in other studies (Riera et al. 2002; Dubois et al.
2007; Kang et al. 2009). In our study of mussels and
polychaetes, both the convex hull and SEAs for specimens
collected over the entire year showed that the isotopic
niches of the two populations were completely distinct
(Fig. 5A,B).
Isotopic niches of grazers
Temporal variability of macroalgal isotopic signatures was
greater than that of the SPM (Fig. 3, Table 2), which
may have contributed to the high within-month intra-
population variability observed in the sea urchin isotope
signatures (Table 3). Less temporal and within-month
intra-population variability occurred in the limpets rela-
tive to the sea urchins (Fig. 2, Table 1); therefore, the
limpets probably consumed a less complex and more iso-
topically consistent food source mixture. We expected
that the two grazer species consumed different sources
throughout the year, and that the isotopic niches of the
grazers would differ, potentially owing to alternative food
preferences in the consumers.
The goat’s eye limpet Cymbula oculus is a non-territo-
rial limpet that travels to and from a feeding scar and
can consume foliose macroalgae such as Ulva sp. (but
not Gelidium pristoides), coralline algae, algal spores and
benthic diatoms (Branch 1971; Whittington-Jones 1997;
Maneveldt et al. 2006). Branch (1971) described C. oculus
as having a wide dietary range. However, C. oculus can
occur on rocky shores devoid of macroalgae (sometimes
owing to their own grazing actions), so their diets can
also consist mainly of one source such as microalgal bio-
film (Maneveldt et al. 2009). Most of the metrics that we
calculated to describe the diet in the limpets showed no
Marine Ecology (2014) 1–15 ª 2014 Blackwell Verlag GmbH 11
Richoux & Ndhlovu Isotopic niches of rocky shore consumers

temporal variability, little within-month intra-population
variability and a moderately small isotopic niche; these
findings contradict the idea of C. oculus having a wide
dietary range. High macroalgal contributions relative to
microalgae were found in the diets of two limpets typi-
cally identified as microalgal grazers in the Eastern Cape
of South Africa (Siphonaria capensis and Scutellastra gran-
ularis; Hill & McQuaid 2008), so there appears to be
regional differentiations within species based on local
food availability. An in-depth study focussing on isotopic
signatures of specific limpet species and all potential food
sources in the area would help to clarify the trophic
niches occupied by co-occurring limpets.
Depending on their location and the food availability,
sea urchins can have a highly varied diet and may act as
drift trappers or direct grazers of macro- or microalgae
(Anderson & Velimirov 1982; Day & Branch 2002). On
the west coast of South Africa where expansive kelp for-
ests occur, drift trapping behaviour in Parechinus angulo-
sus has been emphasized (Day & Branch 2002), and these
urchins can show preferential selection of specific macro-
algae under experimental situations (Anderson & Velimi-
rov 1982). Less is known about the diet preference of
Pa. angulosus in oligotrophic or mesotrophic regions that
do not support kelp, such as the Eastern Cape of South
Africa (our study region). The large within-month intra-
population variability observed in sea urchin isotopic sig-
natures (especially d13C), which dampened potential tem-
poral effects (Fig. 2; Table 1), supported the idea that the
sea urchins feed on a wide variety of food items in their
environment. Similar high amongst-individual variation
in the sea urchin Phyllacanthus irregularis was observed
on the west coast of Australia, most likely arising from
their consumption of a variety of food sources or the
consumption of changing proportions of the same food
sources (Hyndes et al. 2013). The wide dietary range of
the sea urchins at our study site was further reflected in
the largest SEAs of all of the consumers in our study,
regardless of whether raw or standardized values were
examined (Fig. 5). However, the form of data used (raw
or standardized) affected the level of niche overlap
between the sea urchins and limpets, with no overlap
occurring using the raw data, and complete overlap with
the standardized data. These contrasting results indicate
how large an effect data treatment can have on an analy-
sis of isotopic niches. The apparent isotopic niche overlap
between the grazer populations (Fig. 5D) was largely
affected by the wide range of d13C basal signatures incor-
porated into the correction factors (Ulva sp. signatures
were very low relative to the limpets, and Corallina sp.
signatures were very high; Fig. 4B); thus, the main limpet
diet was probably something with an intermediate isoto-
pic signature, more similar to the limpets. Although it is
technically possible that individual limpets were all feed-
ing on equal parts of widely dissimilar food sources such
as Ulva sp. and Corallina sp., this scenario is highly unli-
kely considering the small within-month variations in the
population. Examination of the literature published on
macroalgal signatures along the southeast coast of South
Africa revealed few candidates for the primary food of
the limpets (i.e. with d13C values approximating �11&;
Fig. 4B), as published values of different species were
either too high (e.g. Corallina sp. at �7&, biofilm at
�4.3&, Hill & McQuaid 2008; Allan et al. 2010) or too
low (various green and brown algae all less than �14&;
Allan et al. 2010). Caution must be used when consider-
ing published isotopic values of food sources potentially
collected at limited temporal scales, although one brown
alga (Sargassum incisifolium, with mean d13C values of
�12 � 0.9& and d15N values of 6.3 � 0.2&; Hill &
McQuaid 2008) could be a potential food candidate for
the limpets to assess in future investigations as these sig-
natures match those of the limpets very closely (C:
�11 � 1&; N: 6.7 � 0.5&) after subtracting fraction-
ation factors. Biofilm is not a likely food option for
C. oculus as the d15N signatures are too low (2.4 �0.4&) and the d13C signatures too high (�4.3 � 0.6&;
signatures were derived from material collected from a
rocky inter-tidal location only a few km from our study
location; Hill & McQuaid 2008). However, detailed
small-scale spatial analysis of rocky shore microphytoben-
thos in the Sea of Japan has shown that large variations
in community structure and isotopic signatures can occur
(Takai et al. 2004); therefore, a detailed spatial (and also
temporal) study on South African microphytobenthic
communities could be very illuminating. Either way, the
potential niche overlap between sea urchins and limpets
is probably much smaller than that indicated in Fig. 5D,
and no niche overlap (Fig. 5C) is more ecologically realis-
tic. Once we increase the spatial and temporal resolution
of isotopic signatures for all potential food sources and
consumers in the rocky inter-tidal, we can convert the
data that we have reported here in d-space to p-space
(i.e. calculate dietary proportions of different foods for
each consumer; Newsome et al. 2007) to further refine
the sources of isotopic variability in the consumers.
Conclusions
Temporally related questions about consumer diets and
food web relationships are becoming more prevalent in
the aquatic literature, and particular attention has been
focussed on aquacultured or invasive animals. Informa-
tion on natural rocky inter-tidal communities remains
relatively scarce, and studies lacking in frequent sampling
over at least an annual cycle certainly have the potential
12 Marine Ecology (2014) 1–15 ª 2014 Blackwell Verlag GmbH
Isotopic niches of rocky shore consumers Richoux & Ndhlovu
to miss ecologically important fluctuations, even to the
point that consumer relationships appear to be seasonally
stable. For those researchers who wish to address tempo-
ral hypotheses, we strongly suggest a sampling regime of
greater than quarterly collections per year – preferentially
at least monthly collections. Our own data indicate that
this kind of detailed approach is necessary to describe the
potentially intricate temporal variability in basal resources
and consumers. We strongly agree with the conclusion by
Dethier et al. (2013) that further exploration of natural
variations in biomarkers will provide meaningful ecologi-
cal insights into coastal food webs.
Acknowledgements
We thank J. A. Iitembu and E. S. Antonio for assistance
in the field, and G. Schaal for assistance with the map fig-
ure. This research was funded by the National Research
Foundation of South Africa (NRF) and Rhodes University
(RU), with bursary funding to R.T.N. provided by the
NRF and RU. Stable isotope analysis was carried out by
S. Kaehler at IsoEnvironmental cc, RU.
References
Aguilera M.A., Navarrete S.A., Broitman B.R. (2013)
Differential effects of grazer species on periphyton of a
temperate rocky shore. Marine Ecology Progress Series, 484,
63–78.
Airoldi L., Fabiano M., Cinelli F. (1996) Sediment deposition
and movement over a turf assemblage in a shallow rocky
coastal area of the Ligurian Sea. Marine Ecology Progress
Series, 133, 241–251.
Allan E.L., Ambrose S.T., Richoux N.B., Froneman P.W.
(2010) Determining spatial changes in the diet of nearshore
suspension-feeders along the South African coastline: stable
isotope and fatty acid signatures. Estuarine, Coastal and
Shelf Science, 87, 463–471.
Anderson R.J., Velimirov B. (1982) An experimental
investigation of the palatability of kelp bed algae to the sea
urchin Parechinus angulosus LESKE. Marine Ecology, 3,
357–373.
Bearhop S., Adams C.E., Waldron S., Fuller R.A., Macleod H.
(2004) Determining trophic niche width: a novel approach
using stable isotope analysis. Journal of Animal Ecology, 73,
1007–1012.
Berry P.F., Schleyer M.H. (1983) The brown mussel Perna
perna on the Natal coast, South Africa: utilization of
available food and energy budget. Marine Ecology Progress
Series, 13, 201–210.
Bode A., Alvarez-Ossorio M.T., Varela M. (2006)
Phytoplankton and macrophyte contributions to littoral
food webs in the galician upwelling estimated from stable
isotopes. Marine Ecology Progress Series, 318, 89–102.
Branch G.M. (1971) The ecology of Patella Linnaeus from the
Cape Peninsula, South Africa: zonation, movements and
feeding. Zoologica Africana, 6, 1–38.
Bustamante R.H., Branch G.M., Eekhout S. (1995) Maintenance
of an exceptional intertidal grazer biomass in South Africa:
subsidy by subtidal kelps. Ecology, 76, 2314–2329.
Cabana G., Rasmussen J.B. (1996) Comparison of aquatic food
chains using nitrogen isotopes. Proceedings of the National
Academy of Sciences, 93, 10844–10847.
Camus P.A., Daroch K., Opazo L.F. (2008) Potential for
omnivory and apparent intraguild predation in rocky
intertidal herbivore assemblages from northern Chile.
Marine Ecology Progress Series, 361, 35–45.
Darimont C.T., Paquet P.C., Reimchen T.E. (2009) Landscape
heterogeneity and marine subsidy generate extensive
intrapopulation niche diversity in a large terrestrial
vertebrate. Journal of Animal Ecology, 78, 126–133.
Day E., Branch G.M. (2002) Effects of sea urchins (Parechinus
angulosus) in recruits and juveniles of abalone (Haliotis
midae). Ecological Monographs, 72, 133–149.
Decottignies P., Beninger P.G., Rinc�e Y., Riera P. (2007)
Trophic interactions between two introduced
suspension-feeders, Crepidula fornicata and Crassostrea gigas,
are influenced by seasonal effects and qualitative selection
capacity. Journal of Experimental Marine Biology and
Ecology, 342, 231–241.
Dethier M.N., Sosik E., Galloway A.W.E., Duggins D.O.,
Simenstad C.A. (2013) Addressing assumptions: variation in
stable isotopes and fatty acids of marine macrophytes can
confound conclusions of food web studies. Marine Ecology
Progress Series, 478, 1–14.
Dubois S., Orvain F., Marin-L�eal J., Ropert M., Lefebvre S.
(2007) Small-scale spatial variability of food partitioning
between cultivated oysters and associated suspension-feeding
species, as revealed by stable isotopes. Marine Ecology
Progress Series, 336, 151–160.
Flaherty E.A., Ben-David M. (2010) Overlap and partitioning
of the ecological and isotopic niches. Oikos, 119, 1409–1416.
Fukumori K., Oi M., Doi H., Takahashi D., Okuda N., Miller
T., Kuwae M., Miyasaka H., Genkai-Kato M., Koizumi Y.,
Omori K., Takeoka H. (2008) Bivalve tissue as a carbon and
nitrogen isotope baseline indicator in coastal ecosystems.
Estuarine, Coastal and Shelf Science, 79, 45–50.
Goering J., Alexander V., Haubenstock N. (1990) Seasonal
variability of stable carbon and nitrogen isotope ratios of
organisms in a North Pacific bay. Estuarine Coastal and
Shelf Science, 30, 239–260.
Grange N., Whitfield A.K., De Villiers C.J., Allanson B.R.
(2000) The response of two South African east estuaries to
altered river flow regimes. Aquatic Conservation: Marine and
Freshwater Ecosystems, 10, 155–177.
Hill J.M., McQuaid C.D. (2008) d13C and d15N biogeographic
trends in rocky intertidal communities along the coast of
South Africa: evidence of strong environmental signatures.
Estuarine, Coastal and Shelf Science, 80, 261–268.
Marine Ecology (2014) 1–15 ª 2014 Blackwell Verlag GmbH 13
Richoux & Ndhlovu Isotopic niches of rocky shore consumers
Hill J.M., McQuaid C.D., Kaehler S. (2006) Biogeographic and
nearshore-offshore trends in isotope ratios of intertidal
mussels and their food sources around the coast of southern
Africa. Marine Ecology Progress Series, 318, 63–73.
Hill J.M., McQuaid C.D., Kaehler S. (2008) Temporal and
spatial variability in stable isotope ratios of SPM link to
local hydrography and longer term SPM averages suggest
heavy dependence of mussels on nearshore production.
Marine Biology, 154, 899–909.
Hoeinghaus D., Zeug S. (2008) Can stable isotope ratios
provide for community-wide measures of trophic structure?
comment. Ecology, 89, 2353–2357.
Hyndes G.A., Hanson C.E., Vanderklift M.A. (2013) The
magnitude of spatial and temporal variation in d15N and
d13C differs between taxonomic groups: implications for
food web studies. Estuarine, Coastal and Shelf Science, 119,
176–187.
Jackson A.L., Inger R., Parnell A.C., Bearhop S. (2011)
Comparing isotopic niche widths among and within
communities: SIBER – Stable Isotope Bayesian Ellipses in R.
Journal of Animal Ecology, 80, 595–602.
Kang C., Choy E.J., Hur Y., Myeong J. (2009) Isotopic
evidence of particle size-dependent food partitioning in
cocultured sea squirt Halocynthia roretzi and Pacific oyster
Crassostrea gigas. Aquatic Biology, 6, 289–302.
Kinney E.H., Roman C.T. (1998) Response of primary
producers to nutrient enrichment in a shallow estuary.
Marine Ecology Progress Series, 163, 89–98.
Layman C.A., Ara�ujo M.S., Boucek R., Hammerschlag-Peyer
C.M., Harrison E., Jud Z.R., Matich P., Rosenblatt A.E.,
Vaudo J.J., Yeager L.A., Post D.M., Bearhop S. (2012)
Applying stable isotopes to examine food-web structure: an
overview of analytical tools. Biological Reviews, 87, 545–562.
Lefebvre S., Mar�ın Leal J.C., Dubois S., Orvain F., Blin J.-L.,
Bataill�e M.-P., Ourry A., Galois R. (2009) Seasonal
dynamics of trophic relationships among co-occurring
suspension-feeders in two shellfish culture dominated
ecosystems. Estuarine, Coastal and Shelf Science, 82, 415–
425.
Lorrain A., Paulet Y.-M., Chauvaud L., Savoye N., Donval A.,
Saout C. (2002) Differential d13C and d15N signatures
among scallop tissues: implications for ecology and
physiology. Journal of Experimental Marine Biology and
Ecology, 275, 47–61.
Lutjeharms J.R.E. (2005) The coastal oceans of south-eastern
Africa. In: Robinson A.R., Brink K. (Eds), The Sea. Chicago
University Press, Chicago: 781–832.
Maneveldt G.W., Wilby D., Potgieter M., Hendricks M.G.J.
(2006) The role of encrusting coralline algae in the diets of
selected intertidal herbivores. Journal of Applied Phycology,
18, 619–627.
Maneveldt G.W., Eager R.C., Bassier A. (2009) Effects of
long-term exclusion of the limpet Cymbula oculus (Born) on
the distribution of intertidal organisms on a rocky shore.
African Journal of Marine Science, 31, 171–179.
Matthews B., Mazumder A. (2004) A critical evaluation of
intrapopulation variation of d13C and isotopic evidence of
individual specialization. Oecologia, 140, 361–371.
Mayer S. (1994) Particle capture in the crown of the ciliary
suspension feeding polychaete Sabella penicillus: videotape
recordings and interpretations. Marine Biology, 119, 571–
582.
McCutchan J. Jr, Lewis W. Jr, Kendall C., McGrath C. (2003)
Variation in trophic shift for stable isotope ratios of carbon,
nitrogen, and sulfur. Oikos, 102, 378–390.
Menge B.A., Daley B.A., Lubchenco J., Sanford E., Dahlhoff E.,
Halpin P.M., Hudson G., Burnaford J.L. (1999) Top-down
and bottom-up regulation of New Zealand rocky intertidal
communities. Ecological Monographs, 69, 297–330.
Merz R.A. (1984) Self-generated versus environmentally
produced feeding currents: a comparison for the sabellid
polychaete Eudistylia vancouveri. The Biological Bulletin, 167,
200–209.
Newsome S.D., Martinez del Rio C., Bearhop S., Phillips D.L.
(2007) A niche for isotopic ecology. Frontiers in Ecology and
the Environment, 5, 429–436.
Nichol E.A.T. (1930) The feeding mechanism, formation of
the tube, and physiology of digestion in Sabella pavonina.
Transactions of the Royal Society of Edinburgh, 56, 537–598.
Nordstr€om M., Aarnio K., Bonsdorff E. (2009) Temporal
variability of a benthic food web: patterns and processes in
a low-diversity system. Marine Ecology Progress Series, 378,
13–26.
Olsson K., Stenroth P., Nystr€om P., Gran�eli W. (2009)
Invasions and niche width: does niche width of an
introduced crayfish differ from a native crayfish? Freshwater
Biology, 54, 1731–1740.
O’Reilly C.M., Hecky R.E., Cohen A.S., Plisnier P.-D. (2002)
Interpreting stable isotopes in food webs: Recognizing the
role of time averaging at different trophic levels. Limnology
and Oceanography, 47, 306–309.
Parnell A.C., Inger R., Bearhop S., Jackson A.L. (2010) Source
partitioning using stable isotopes: coping with too much
variation. PLoS ONE, 5, e9672.
Pedersen M., Borum J. (1996) Nutrient control of algal growth
in estuarine waters. Nutrient limitation and the importance
of nitrogen requirements and nitrogen storage among
phytoplankton and species of macroalgae. Marine Ecology
Progress Series, 142, 261–272.
Qian Y., Jochens A.E., Kennicutt M.C. II, Biggs D.C. (2003)
Spatial and temporal variability of phytoplankton biomass
and community structure over the continental margin of
the northeast Gulf of Mexico based on pigment analysis.
Continental Shelf Research, 23, 1–17.
Richoux N.B., Vermeulen I., Froneman P.W. (2014a) Fatty acid
profiles reveal temporal and spatial differentiation in diets
within and among syntopic rocky shore suspension-feeders.
Marine Ecology Progress Series, 495, 143–160.
Richoux N.B., Vermeulen I., Froneman P.W. (2014b) Stable
isotope ratios indicate differential omnivory among
14 Marine Ecology (2014) 1–15 ª 2014 Blackwell Verlag GmbH
Isotopic niches of rocky shore consumers Richoux & Ndhlovu
syntopic rocky shore suspension-feeders. Marine Biology,
161, 971–984.
Riera P., Richard P. (1996) Isotopic determination of food
sources of Crassostrea gigas along a trophic gradient in the
estuarine bay of Marennes Ol�eron. Estuarine Coastal and
Shelf Science, 42, 347–360.
Riera P., Stal L.J., Nieuwenhuize J. (2002) d13C versus d15Nof co-occurring molluscs within a community dominated
by Crassostrea gigas and Crepidula fornicata (Oosterschelde,
The Netherlands). Marine Ecology Progress Series, 240, 291–
295.
Riisg�ard H.U., Larsen P.S. (2010) Particle capture mechanisms
in suspension-feeding invertebrates. Marine Ecology Progress
Series, 418, 255–293.
Rolff C. (2000) Seasonal variation in d13C and d15N of
size-fractionated plankton at a coastal station in the
northern Baltic proper. Marine Ecology Progress Series, 203,
47–65.
Sato T., Miyajima T., Ogawa H., Umezawa Y., Koike I. (2006)
Temporal variability of stable carbon and nitrogen isotopic
composition of size-fractionated particulte organic matter in
the hypertrophic Suymida River Estuary of Tokyo Bay,
Japan. Estuarine, Coastal and Shelf Science, 68, 245–258.
Schaal G., Riera P., Leroux C., Grall J. (2010) A seasonal stable
isotope survey of the food web associated to a peri-urban
rocky shore. Marine Biology, 157, 283–294.
Schleyer M.H. (1981) Microorganisms and detritus in the
water column of a subtidal reef of Natal. Marine Ecology
Progress Series, 4, 307–320.
Semmens B.X., Ward E.J., Moore J.W., Darimont C.T. (2009)
Quantifying inter- and intra-population niche variability
using hierarchical Bayesian stable isotope mixing models.
PLoS ONE, 4, e6187.
Steinarsd�ottir M.B., Ing�olfsson A., �Olafsson E. (2009) Trophic
relationships on a fucoid shore in south-western Iceland as
revealed by stable isotope analyses, laboratory experiments,
field observations and gut analyses. Journal of Sea Research,
61, 206–215.
Suplicy F.M., Schmitt J.F., Moltschaniwskyj N.A., Ferreira J.F.
(2003) Modelling of filter-feeding behaviour in brown
mussel Perna perna (L.): exposed to natural variation of
seston availability in Santa Catarina. Brazil. Journal of
Shellfish Reaserch, 22, 125–134.
Takai N., Yorozu A., Tanimoto T., Hoshika A., Yoshihara K.
(2004) Transport pathways of microphytobenthos-
originating organic carbon in the food web of an exposed
hard bottom shore in the Seto Inland Sea, Japan. Marine
Ecology Progress Series, 284, 97–108.
Thompson R.C., Norton T.A., Hawkins S.J. (2004) Physical
stress and biological control regulate the producer-consumer
balance in intertidal biofilms. Ecology, 85, 1372–1382.
Vander Zanden M., Rasmussen J. (1999) Primary consumer
d13C and d15N and the trophic position of aquatic
consumers. Ecology, 80, 1395–1404.
Vanderklift M.A., Wernberg T. (2010) Stable isotpes reveal a
consistent consumer-diet relationship across hundreds of
kilometres. Marine Ecology Progress Series, 403, 53–61.
Vorwerk P.D., Froneman P.W. (2009) The importance of
estuarine-derived carbon for the nearshore marine
environment: studies on two contrasting South African
estuaries. African Journal of Aquatic Science, 34, 137–146.
Ward J.E., Shumway S.E. (2004) Separating the grain from the
chaff: particle selection in suspension- and deposit-feeding
bivalves. Journal of Experimental Marine Biology and Ecology,
300, 83–130.
Whittington-Jones K.J. (1997) Ecological interactions on a
rocky shore: the control of macroalgal distribution by
intertidal grazers. MSc thesis, Rhodes University,
Grahamstown.
Wong W.H., Levinton J.S. (2006) The trophic linkage between
zooplankton and benthic suspension feeders: direct evidence
from analyses of bivalve faecal pellets. Marine Biology, 148,
799–805.
Woodland R.J., Magnan P., Gl�emet H., Rodr�ıguez M.A.,
Cabana G. (2012) Variability and directionality of temporal
changes in d13C and d15N of aquatic invertebrate primary
consumers. Oecologia, 169, 199–209.
Yokoyama H., Ishihi Y. (2007) Variation in food sources of
the macrobenthos along a land-sea transect: a stable isotope
study. Marine Ecology Progress Series, 346, 127–141.
Marine Ecology (2014) 1–15 ª 2014 Blackwell Verlag GmbH 15
Richoux & Ndhlovu Isotopic niches of rocky shore consumers


