Embed Size (px)
Citation preview
Temperature sensor based on ladder-level assisted thermal coupling and thermal-enhanced
luminescence in NaYF4: Nd3+
Xiuna Tian, Xiantao Wei, Yonghu Chen, Changkui Duan, and Min Yin* Department of Physics, University of Science and Technology of China, Hefei 230026, China
Abstract: NaYF4: Nd3+ microprisms were synthesized by a hydrothermal method. The bands of near-infrared (NIR) luminescence originating from the 4F3/2,
4F5/2 and 4F7/2 levels of Nd3+ ions in NaYF4: Nd3+ microcrystals were measured under 574.8 nm excitation at various temperatures from 323 to 673 K. The fluorescence intensity ratios (FIRs) between any two of the three bands change monotonically with temperature and agree with the prediction assuming thermal couplings. A large relative temperature sensitivity of 1.12% K−1 at 500K is reached with the FIR of 4F7/2 to 4F3/2 levels. In addition, anti-Stokes fluorescence from 4F5/2 level (740 nm) and 4F5/2,7/2 levels (740 nm and 803 nm) of Nd3+ ions was studied meticulously under 793.8 nm and 864.2 nm excitations, respectively. The intensities were shown to be greatly enhanced as temperature increases, and the 740 nm band from 4F7/2 level at 458 K increases in intensity by 170 fold relative to that at 298 K under the 793.8 nm excitation.
©2014 Optical Society of America
OCIS codes: (160.4760) Optical properties; (300.2140) Emission; (280.4788) Optical sensing and sensors.
References and links
1. W. Xu, X. Y. Gao, L. J. Zheng, Z. G. Zhang, and W. W. Cao, “Short-wavelength upconversion emissions in Ho3+/Yb3+ codoped glass ceramic and the optical thermometry behavior,” Opt. Express 20(16), 18127–18137 (2012).
2. V. K. Rai, D. K. Rai, and S. B. Rai, “Pr3+ doped lithium tellurite glass as a temperature sensor,” Sen. Actuators A 128(1), 14–17 (2006).
3. P. V. dos Santos, M. T. de Araujo, A. S. Gouveia-Neto, J. A. Medeiros Neto, and A. S. B. Sombra, “Optical temperature sensing using upconversion fluorescence emission in Er3+/Yb3+ codoped chalcogenide glass,” Appl. Phys. Lett. 73(5), 578–580 (1998).
4. K. Z. Zheng, Z. Y. Liu, C. J. Lv, and W. P. Qin, “Temperature sensor based on the UV upconversion luminescence of Gd3+ in Yb3+-Tm3+-Gd3+ codoped NaLuF4 microcrystals,” J. Mater. Chem. C 1(35), 5502–5507 (2013).
5. S. A. Wade, S. F. Collins, and G. W. Baxter, “Fluorescence intensity ratio technique for optical fiber point temperature sensing,” J. Appl. Phys. 94(8), 4743–4756 (2003).
6. S. A. Wade, J. C. Muscat, S. F. Collins, and G. W. Baxter, “Nd3+-doped optical fiber temperature sensor using the fluorescence intensity ratio technique,” Rev. Sci. Instrum. 70(11), 4279–4282 (1999).
7. W. Xu, H. Zhao, Z. G. Zhang, and W. W. Cao, “Highly sensitive optical thermometry through thermally enhanced near infrared emissions from Nd3+/Yb3+ codoped oxyfluoride glass ceramic,” Sen. Actuators B 178, 520–524 (2013).
8. W. Xu, Q. T. Song, L. J. Zheng, Z. G. Zhang, and W. W. Cao, “Optical temperature sensing based on the near-infrared emissions from Nd³⁺/Yb³⁺ codoped CaWO₄,” Opt. Lett. 39(16), 4635–4638 (2014).
9. G. Tian, Z. J. Gu, L. J. Zhou, W. Y. Yin, X. X. Liu, L. Yan, S. Jin, W. L. Ren, G. M. Xing, S. J. Li, and Y. L. Zhao, “Mn2+ dopant-controlled synthesis of NaYF4:Yb/Er upconversion nanoparticles for in vivo imaging and drug delivery,” Adv. Mater. 24(9), 1226–1231 (2012).
10. G. C. Jiang, X. T. Wei, S. S. Zhou, Y. H. Chen, C. K. Duan, and M. Yin, “Neodymium doped lanthanum oxysulfide as optical temperature sensors,” J. Lumin. 152, 156–159 (2014).
11. A. K. Singh, S. K. Singh, B. K. Gupta, R. Prakash, and S. B. Rai, “Probing a highly efficient dual mode: down-upconversion luminescence and temperature sensing performance of rare-earth oxide phosphors,” Dalton Trans. 42(4), 1065–1072 (2012).
#223562 - $15.00 USD Received 23 Sep 2014; revised 6 Nov 2014; accepted 13 Nov 2014; published 26 Nov 2014(C) 2014 OSA 1 December 2014 | Vol. 22, No. 24 | DOI:10.1364/OE.22.030333 | OPTICS EXPRESS 30333
12. S. S. Zhou, S. Jiang, X. T. Wei, Y. H. Chen, C. K. Duan, and M. Yin, “Optical thermometry based on upconversion luminescence in Yb3+/Ho3+ co-doped NaLuF4,” J. Alloy. Comp. 588, 654–657 (2014).
13. A. S. Oliveira, E. A. Gouveia, M. T. de Araujo, A. S. Gouveia-Neto, C. B. de Araújo, and Y. Messaddeq, “Twentyfold blue upconversion emission enhancement through thermal effects in Pr3+/Yb3+-codoped fluoroindate glasses excited at 1.064 μm,” J. Appl. Phys. 87(9), 4274–4278 (2000).
14. L. de S. Menezes, G. S. Maciel, C. B. de Araújo, and Y. Messaddeq, “Thermally enhanced frequency upconversion in Nd3+-doped fluoroindate glass,” J. Appl. Phys. 90(9), 4498–4501 (2001).
15. F. Auzel, “Multiphonon-assisted anti-Stokes and Stokes fluorescence of triply ionized rare-earth ions,” Phys. Rev. B 13(7), 2809–2817 (1976).
1. Introduction
Temperature is one of the most frequently measured physical quantities in both scientific and industrial fields. Optical temperature sensors, which exploit the temperature-dependent fluorescence intensities of thermally coupled levels (TCLs) of lanthanide ions (Ln3+), such as Ho3+, Pr3+, Er3+, Gd3+, have attracted much attention in recent years, due to their reduced dependence on measurement conditions and improve accuracy and resolution [1–4]. TCLs with large energy gaps are required for high temperature sensitivity. However, when the gap between two adjacent levels increases to a certain extent, the inter-relaxation rates of the population of ions between these two levels tends to slow down exponentially with the gap, resulting into the loss of thermal-coupling when the rates are no longer much faster than the relaxation rates to outside levels. This is especially severe at low temperature, as the thermal excitation rate from the lower to the upper level decreases strongly with temperature. An experimental example of this can be seen from that case of 5D0 and 5D1 levels of Eu3+ ion in Y2O2S: Eu3+, which have a gap of c.a. 1750 cm−1 [5]. It was shown that the population of 5D0 and 5D1 levels of Eu3+ ion did not comply with the Boltzmann distribution and hence thermal-coupling was lost at even 350 K. We realize that the two requirements, large energy gap and thermal coupling between the two levels, could be fulfilled at the same time if there were other intermediate levels in between acting as ladders to effectively decrease the energy gap as so to increase the inter-relaxation rates.
From the energy level diagrams of lanthanide ions in crystals, it can be seen that the 4F7/2 and 4F3/2 levels of Nd3+ are separated by approximately 2000 cm−1, with another level 4F5/2 almost rightly in the middle suitable for the ladder level. It is known that the 4F5/2 and 4F3/2 levels of Nd3+ ion are thermally coupled [6], and actually an outstanding thermometry behaviors of the NIR emissions from Nd3+/Yb3+ codoped oxyfluoride glass ceramic and CaWO4 powder was reported recently by Xu et al. [7,8]. Hence, we choose the three adjacent levels 4F7/2,5/2,3/2 of Nd3+ to test the above idea.
NaYF4 has been reported as one of the most excellent materials as host matrix for luminescence and NaYF4 nanocrystals are being increasingly chosen as optical probes for in vivo imaging [9]. In this work, hexagonal phase sodium yttrium fluoride (β-NaYF4) was chosen as the host material. Under 574.8 nm excitation, the photoluminescence (PL) properties of Nd3+ ions in β-NaYF4: Nd3+ microcrystals were investigated systematically by changing the temperature of the sample. By using FIR technology, we confirmed that the thermal coupling between the 4F7/2 and 4F3/2 levels of Nd3+ had been achieved, just as our prediction. And a large relative temperature sensitivity of 1.12% K−1 at 500 K is reached with the FIR of 4F7/2 to 4F3/2 levels. The thermally enhanced luminescence of 4F7/2 and 4F5/2 level of Nd3+ was also investigated systematically by changing the temperature of the sample. A rate equation model that includes light pumping and multiphonon absorption via thermally coupled electronic excited states of Nd3+ ions was used to explain the experimental results.
2. Experimental procedure
All of the chemicals are of analytical grade reagents and used without further purification. The RE(NO3)3 (RE = Y and Nd) standard solutions were prepared by dissolving the respective rare earth oxide (99.99%) in dilute nitric acid at elevated temperature.
#223562 - $15.00 USD Received 23 Sep 2014; revised 6 Nov 2014; accepted 13 Nov 2014; published 26 Nov 2014(C) 2014 OSA 1 December 2014 | Vol. 22, No. 24 | DOI:10.1364/OE.22.030333 | OPTICS EXPRESS 30334
In a typical procedure for the synthesis of β-NaYF4: x% Nd3+ sample, RE(NO3)3 standard solutions (Y/Nd = 100-x:x, 2 mmol in total) were added into 10 mL aqueous solution containing 2 mmol ethylenediaminetetraacetic acid disodium salt (EDTA-2Na), resulting in a chelated RE-EDTA complex. After vigorous stirring for 30 min, 25 mL of aqueous solution containing 25 mmol of NaF was introduced into the above mixture and kept stirring for 1 h. Then the newly-formed complex precursor solution was transferred into a 50 mL Teflon bottle and sealed for hydrothermal treatment at 180 °C for 24 h. Naturally cooled to room temperature, the precipitates were separated by centrifugation, washed with distilled water and ethanol for three times respectively, and then dried in air at 60 °C for 12 h.
The phase identification was performed by an X-ray diffractometer (Rigaku-TTR-III) with Cu Kα radiation (λ = 0.15418 nm) in the 2θ range from 10° to 70°. The size and morphology were obtained by a Field Emission Scanning Electron Microscope (FESEM, Model FEI, Sirion 200). The PL experiments were conducted using an optical parametric oscillator (pulses of 7 ns, repetition rate: 20 Hz) as excitation source and the spectra were obtained by a Jobin-Yvon HRD-1 double monochromator equipped with a Hamamatsu R928 photomultiplier. The near infrared (NIR) emission was dispersed by a Zolix SBP750 monochromator and was detected by an Acton ID-441-C InGaAs near infrared detector. The signal was analyzed by an EG&G 7265 DSP Lock-in Amplifier and stored into computer memories. Temperature of the sample fixed on a copper post was controlled over the range of 298 K to 673 K by a temperature controller (FOTEKMT48-V-E) with a type-K thermocouple and a heating tube.
3. Results and discussion
3.1 Morphology and structure
The crystal structure of the as-prepared samples was identified by X-ray diffraction measurements. As shown in Fig. 1(e), all diffraction peaks can be indexed by the standard powder diffraction file card no. 16-334 and no other impurity peak is detected, indicating that pure β-NaYF4 has been synthesized. Figures 1(a)–1(d) display the SEM images of the β-NaYF4: 1% Nd3+ synthesized by the hydrothermal method. As depicted in Fig. 1(a), the as-prepared powder sample is composed of three types of specific particles, namely hexagonal microprisms, crossed microprisms and spherical crossed microprisms (Figs. 1(b)–1(d)). However, we notice that the length of the microprisms in the three types of specific particles is almost identical (about 3 μm), from which we infer that the number of growth directions should have been determined even at seed crystal stage.
#223562 - $15.00 USD Received 23 Sep 2014; revised 6 Nov 2014; accepted 13 Nov 2014; published 26 Nov 2014(C) 2014 OSA 1 December 2014 | Vol. 22, No. 24 | DOI:10.1364/OE.22.030333 | OPTICS EXPRESS 30335

Fig. 1. (a,b,c,d) SEM images of β-NaYF4: 1% Nd3+. (e) The X-ray diffraction patterns of four samples and index data of β-NaYF4.
3.2 Photoluminescence properties
The fluorescence spectra of Nd3+ ions excited with 793.8 nm to the 4F5/2 multiplet at room temperature are shown in Fig. 2. Under 793.8 nm excitation, the upconversion luminescence spectra were observed with several emission bands located from 340 nm to 785 nm as shown in Figs. 2(a) and 2(b). The spectra show the Nd3+ PL lines (corresponding transitions) at 354 nm (4D3/2-
4I9/2), 381 nm (2P3/2-4I9/2;
4D3/2-4I11/2), 413 nm (2P3/2-
4I11/2; 4D3/2-
4I13/2), 428 nm (2D5/2-
4I11/2), 450 nm (4D3/2-4I15/2), 522 nm (4G7/2,
2K13/2-4I9/2), 533 nm (2K15/2-
4I11/2), 573 nm (2H11/2-
4I9/2), 587 nm (2G9/2-4I13/2) and 660 nm (2G9/2-
4I15/2). The intensity of the emission band centered at 740 nm presents an almost linear dependence (n = 1.2) on the excitation laser intensity, as shown in Fig. 3(d). Considering the excitation condition and the intensity dependence of this emission, we concluded that this signal is dominated by a process which starts with the resonant absorption 4I9/2-
4F5/2 followed by multi-phonon processes that promote the excited ion to the thermally coupled 4F7/2 level, where the PL emissions at 740 nm originates.
Since in the present work we concentrate on the NIR emission and so the concentration of Nd3+ is optimized accordingly. As shown in Figs. 2(c) and 2(d), the β-NaYF4: 1% Nd3+ powder revealed strongest NIR emission with the excitation of 793.8 nm. The NIR emission spectra in Fig. 2(d) show the Nd3+ NIR PL lines (corresponding transitions) at 864 nm (4F3/2-
#223562 - $15.00 USD Received 23 Sep 2014; revised 6 Nov 2014; accepted 13 Nov 2014; published 26 Nov 2014(C) 2014 OSA 1 December 2014 | Vol. 22, No. 24 | DOI:10.1364/OE.22.030333 | OPTICS EXPRESS 30336
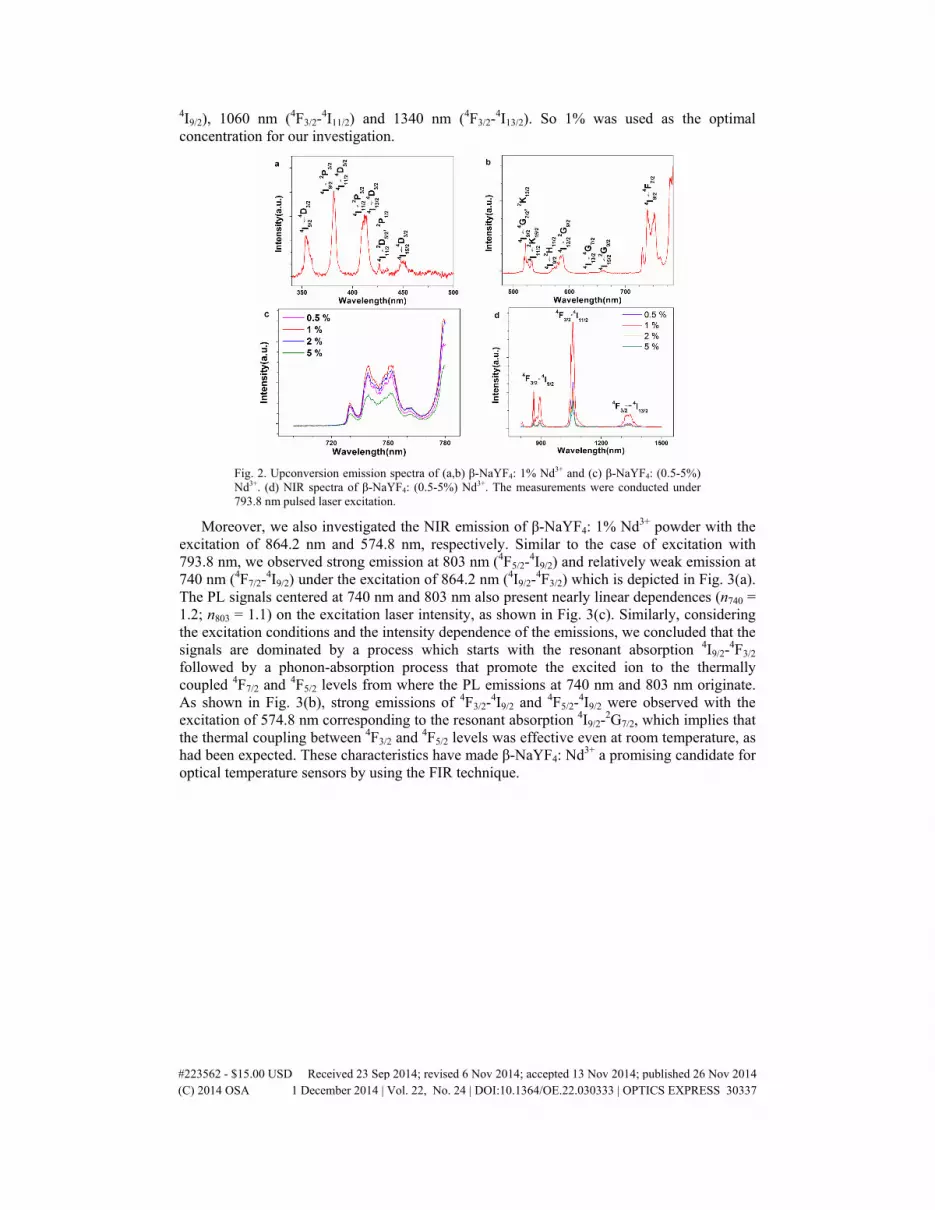
4I9/2), 1060 nm (4F3/2-4I11/2) and 1340 nm (4F3/2-
4I13/2). So 1% was used as the optimal concentration for our investigation.
Fig. 2. Upconversion emission spectra of (a,b) β-NaYF4: 1% Nd3+ and (c) β-NaYF4: (0.5-5%) Nd3+. (d) NIR spectra of β-NaYF4: (0.5-5%) Nd3+. The measurements were conducted under 793.8 nm pulsed laser excitation.
Moreover, we also investigated the NIR emission of β-NaYF4: 1% Nd3+ powder with the excitation of 864.2 nm and 574.8 nm, respectively. Similar to the case of excitation with 793.8 nm, we observed strong emission at 803 nm (4F5/2-
4I9/2) and relatively weak emission at 740 nm (4F7/2-
4I9/2) under the excitation of 864.2 nm (4I9/2-4F3/2) which is depicted in Fig. 3(a).
The PL signals centered at 740 nm and 803 nm also present nearly linear dependences (n740 = 1.2; n803 = 1.1) on the excitation laser intensity, as shown in Fig. 3(c). Similarly, considering the excitation conditions and the intensity dependence of the emissions, we concluded that the signals are dominated by a process which starts with the resonant absorption 4I9/2-
4F3/2 followed by a phonon-absorption process that promote the excited ion to the thermally coupled 4F7/2 and 4F5/2 levels from where the PL emissions at 740 nm and 803 nm originate. As shown in Fig. 3(b), strong emissions of 4F3/2-
4I9/2 and 4F5/2-4I9/2 were observed with the
excitation of 574.8 nm corresponding to the resonant absorption 4I9/2-2G7/2, which implies that
the thermal coupling between 4F3/2 and 4F5/2 levels was effective even at room temperature, as had been expected. These characteristics have made β-NaYF4: Nd3+ a promising candidate for optical temperature sensors by using the FIR technique.
#223562 - $15.00 USD Received 23 Sep 2014; revised 6 Nov 2014; accepted 13 Nov 2014; published 26 Nov 2014(C) 2014 OSA 1 December 2014 | Vol. 22, No. 24 | DOI:10.1364/OE.22.030333 | OPTICS EXPRESS 30337
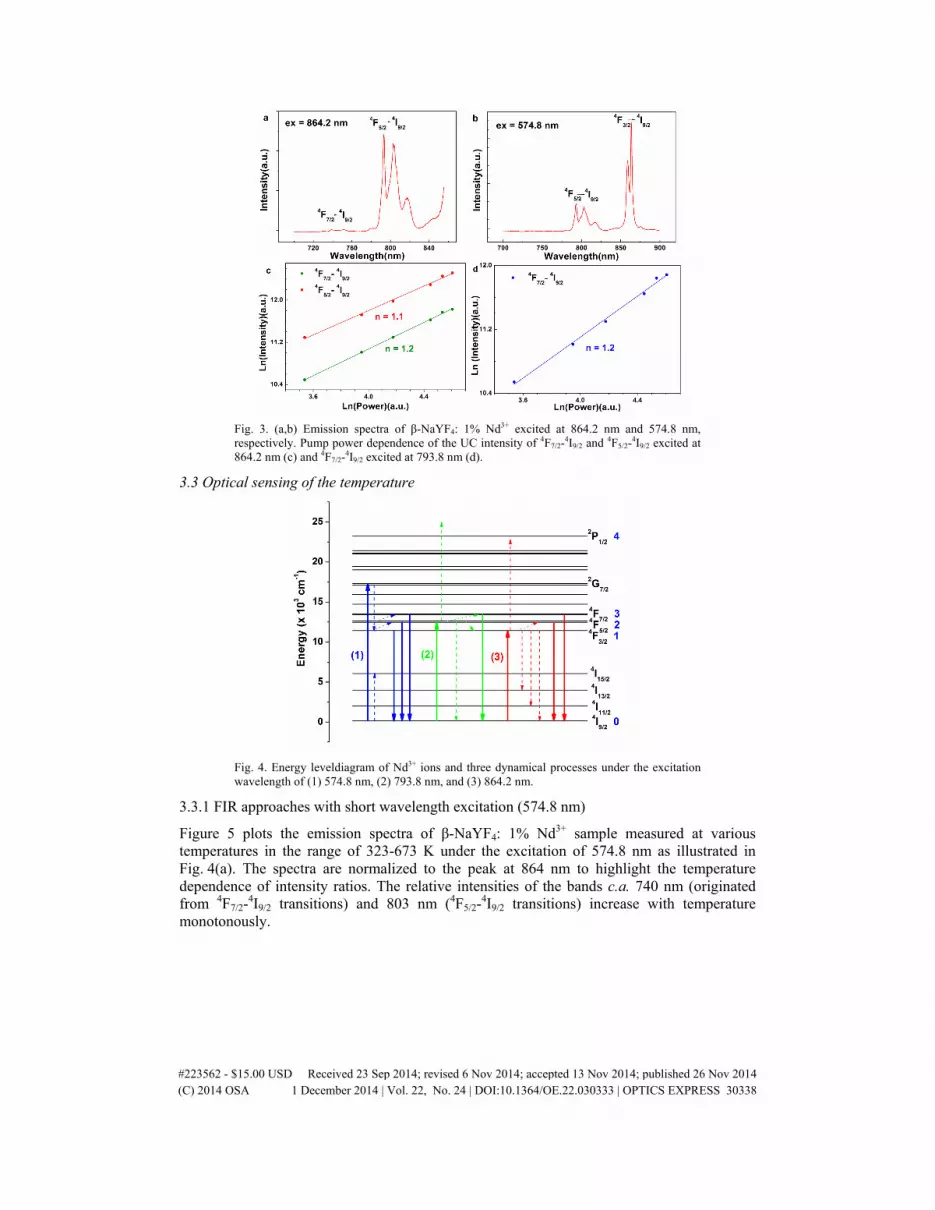
Fig. 3. (a,b) Emission spectra of β-NaYF4: 1% Nd3+ excited at 864.2 nm and 574.8 nm, respectively. Pump power dependence of the UC intensity of 4F7/2-
4I9/2 and 4F5/2-4I9/2 excited at
864.2 nm (c) and 4F7/2-4I9/2 excited at 793.8 nm (d).
3.3 Optical sensing of the temperature
Fig. 4. Energy leveldiagram of Nd3+ ions and three dynamical processes under the excitation wavelength of (1) 574.8 nm, (2) 793.8 nm, and (3) 864.2 nm.
3.3.1 FIR approaches with short wavelength excitation (574.8 nm)
Figure 5 plots the emission spectra of β-NaYF4: 1% Nd3+ sample measured at various temperatures in the range of 323-673 K under the excitation of 574.8 nm as illustrated in Fig. 4(a). The spectra are normalized to the peak at 864 nm to highlight the temperature dependence of intensity ratios. The relative intensities of the bands c.a. 740 nm (originated from 4F7/2-
4I9/2 transitions) and 803 nm (4F5/2-4I9/2 transitions) increase with temperature
monotonously.
#223562 - $15.00 USD Received 23 Sep 2014; revised 6 Nov 2014; accepted 13 Nov 2014; published 26 Nov 2014(C) 2014 OSA 1 December 2014 | Vol. 22, No. 24 | DOI:10.1364/OE.22.030333 | OPTICS EXPRESS 30338
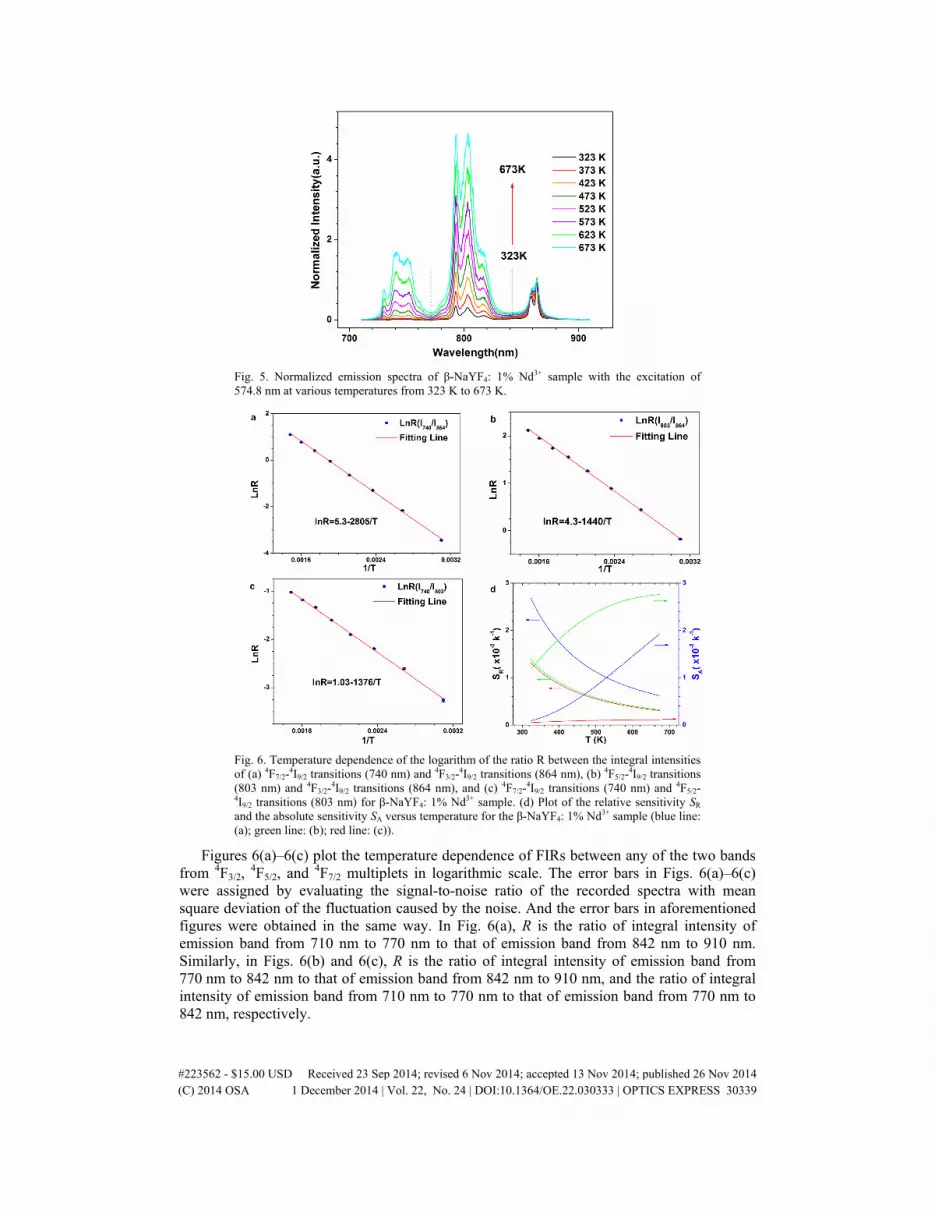
Fig. 5. Normalized emission spectra of β-NaYF4: 1% Nd3+ sample with the excitation of 574.8 nm at various temperatures from 323 K to 673 K.
Fig. 6. Temperature dependence of the logarithm of the ratio R between the integral intensities of (a) 4F7/2-
4I9/2 transitions (740 nm) and 4F3/2-4I9/2 transitions (864 nm), (b) 4F5/2-
4I9/2 transitions (803 nm) and 4F3/2-
4I9/2 transitions (864 nm), and (c) 4F7/2-4I9/2 transitions (740 nm) and 4F5/2-
4I9/2 transitions (803 nm) for β-NaYF4: 1% Nd3+ sample. (d) Plot of the relative sensitivity SR and the absolute sensitivity SA versus temperature for the β-NaYF4: 1% Nd3+ sample (blue line: (a); green line: (b); red line: (c)).
Figures 6(a)–6(c) plot the temperature dependence of FIRs between any of the two bands from 4F3/2,
4F5/2, and 4F7/2 multiplets in logarithmic scale. The error bars in Figs. 6(a)–6(c) were assigned by evaluating the signal-to-noise ratio of the recorded spectra with mean square deviation of the fluctuation caused by the noise. And the error bars in aforementioned figures were obtained in the same way. In Fig. 6(a), R is the ratio of integral intensity of emission band from 710 nm to 770 nm to that of emission band from 842 nm to 910 nm. Similarly, in Figs. 6(b) and 6(c), R is the ratio of integral intensity of emission band from 770 nm to 842 nm to that of emission band from 842 nm to 910 nm, and the ratio of integral intensity of emission band from 710 nm to 770 nm to that of emission band from 770 nm to 842 nm, respectively.
#223562 - $15.00 USD Received 23 Sep 2014; revised 6 Nov 2014; accepted 13 Nov 2014; published 26 Nov 2014(C) 2014 OSA 1 December 2014 | Vol. 22, No. 24 | DOI:10.1364/OE.22.030333 | OPTICS EXPRESS 30339
If the Boltzmann distribution is reached within the set of levels of 4F3/2, 4F5/2, and 4F7/2
multiplets, the FIR of any of the two emission bands will obey:
exp( ),B
ER B
k T
Δ= − (1)
where ΔE is the corresponding effective energy gap, kB is the Boltzmann constant, T is the absolute temperature, and B is a temperature-independent constant [5]. Fitting of the measured data via Eq. (1) is shown as solid lines in Figs. 6(a)–6(c). The energy gaps ΔE obtained are 1948 cm−1 (4F3/2-
4F7/2), 1000 cm−1 (4F3/2-4F5/2), and 956 cm−1 (4F5/2-
4F7/2), respectively. Self-consistence is fulfilled by the sum of 1000 cm−1 and 956 cm−1 being very close to 1948 cm−1, with an allowed difference considering the approximation of a band with a single degenerated level. The good fitting shows that the ratios of population of levels 4F7/2 to that of 4F3/2 obey the Boltzmann distribution very well in the whole temperature range. This indicates that thermal coupling is fulfilled among the three multiplets 4F3/2,
4F5/2, and 4F7/2. Since the direct inter-relaxation between 4F7/2 and 4F3/2 is expected to be very slow for the big energy separation of 1948 cm−1, the thermal coupling between them is helped by the presence of the intermediate level 4F5/2 as a ladder for inter-relaxation.
The strong temperature dependence of the FIR between 4F7/2 and 4F3/2 due to large gap can be used for high-sensitive temperature sensing. The absolute sensitivity (SA) and relative sensitivity (SR) for temperature measurement follow from their definitions as
2
.A
dR ES R
dT kT
Δ= = (2)
2
1R
dR ES
R dT kT
Δ= = (3)
The temperature sensitivities curves obtained from Eqs. (2) and (3) for the three FIRs are plotted in Fig. 6(d). The SR values of Figs. 6(a)–6(c) at 500 K derived from Eq. (3) are 1.12% K−1, 0.58% K−1, and 0.55% K−1, respectively. For comparison, Table 1 lists several typical temperature sensors based on FIR technique doped with different RE3+ ions. The corresponding SR values evaluated at 500 K for other temperature sensors were derived from Refs [4]. and [10–12]. It is clear that the thermally coupled pathway by the intermediate level as a ladder in Fig. 6(a) exhibit the highest relative sensitivity. In addition, the SA values of Figs. 6(a)–6(c) at 500 K derived from Eq. (2) in the β-NaYF4: 1% Nd3+ sample are 0.823 × 10⁻² K−1, 2.581 × 10⁻² K−1, and 0.098 × 10⁻² K−1, respectively. The SA for Fig. 6(b) which corresponds to the FIR of 4F5/2-
4I9/2 transition to 4F3/2-4I9/2 transition is far better than others.
#223562 - $15.00 USD Received 23 Sep 2014; revised 6 Nov 2014; accepted 13 Nov 2014; published 26 Nov 2014(C) 2014 OSA 1 December 2014 | Vol. 22, No. 24 | DOI:10.1364/OE.22.030333 | OPTICS EXPRESS 30340
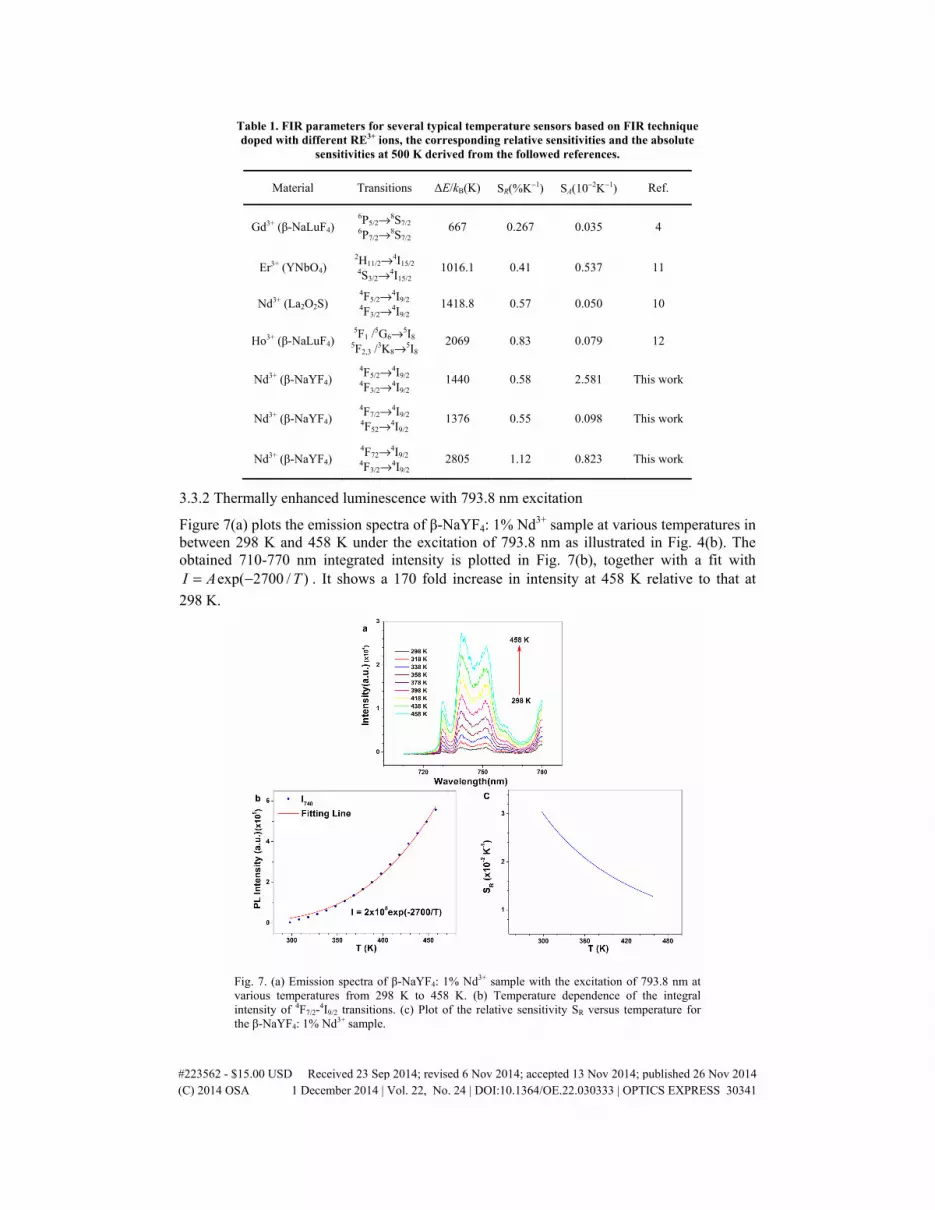
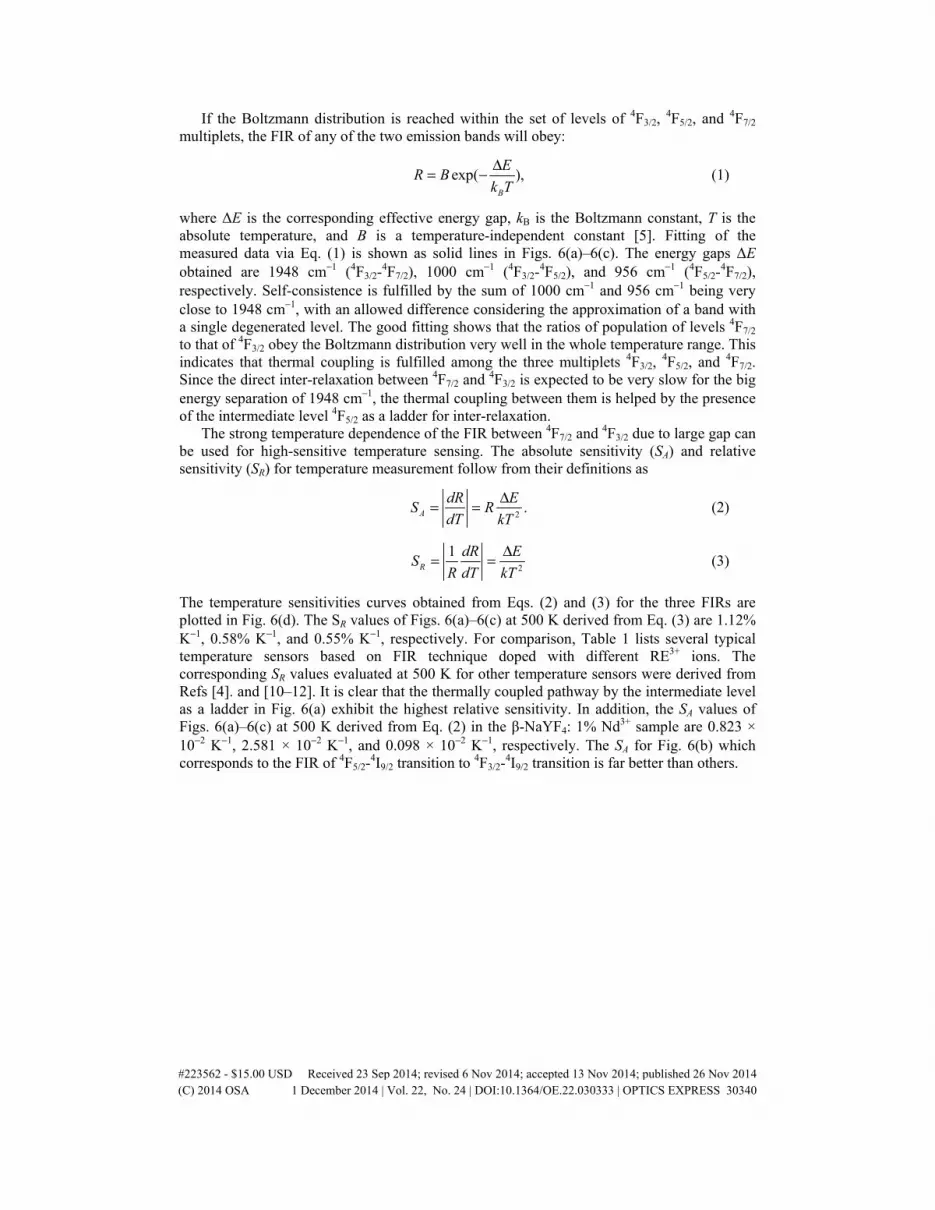
Table 1. FIR parameters for several typical temperature sensors based on FIR technique doped with different RE3+ ions, the corresponding relative sensitivities and the absolute
sensitivities at 500 K derived from the followed references.
Material Transitions ΔE/kB(K) SR(%K−1) SA(10−2K−1) Ref.
Gd3+ (β-NaLuF4) 6P5/2→8S7/2 6P7/2→8S7/2
667 0.267 0.035 4
Er3+ (YNbO4) 2H11/2→4I15/2 4S3/2→4I15/2
1016.1 0.41 0.537 11
Nd3+ (La2O2S) 4F5/2→4I9/2 4F3/2→4I9/2
1418.8 0.57 0.050 10
Ho3+ (β-NaLuF4) 5F1 /
5G6→5I8 5F2,3 /
3K8→5I8 2069 0.83 0.079 12
Nd3+ (β-NaYF4) 4F5/2→4I9/2 4F3/2→4I9/2
1440 0.58 2.581 This work
Nd3+ (β-NaYF4) 4F7/2→4I9/2 4F52→4I9/2
1376 0.55 0.098 This work
Nd3+ (β-NaYF4) 4F72→4I9/2 4F3/2→4I9/2
2805 1.12 0.823 This work
3.3.2 Thermally enhanced luminescence with 793.8 nm excitation
Figure 7(a) plots the emission spectra of β-NaYF4: 1% Nd3+ sample at various temperatures in between 298 K and 458 K under the excitation of 793.8 nm as illustrated in Fig. 4(b). The obtained 710-770 nm integrated intensity is plotted in Fig. 7(b), together with a fit with
exp( 2700 / )TI A −= . It shows a 170 fold increase in intensity at 458 K relative to that at
298 K.
Fig. 7. (a) Emission spectra of β-NaYF4: 1% Nd3+ sample with the excitation of 793.8 nm at various temperatures from 298 K to 458 K. (b) Temperature dependence of the integral intensity of 4F7/2-
4I9/2 transitions. (c) Plot of the relative sensitivity SR versus temperature for the β-NaYF4: 1% Nd3+ sample.
#223562 - $15.00 USD Received 23 Sep 2014; revised 6 Nov 2014; accepted 13 Nov 2014; published 26 Nov 2014(C) 2014 OSA 1 December 2014 | Vol. 22, No. 24 | DOI:10.1364/OE.22.030333 | OPTICS EXPRESS 30341
However, we noticed that the fitting at low temperature deviated obviously from the experimental data. The model, used in Fig. 7(b), was that n2 and n3 as the population densities of thermally coupled levels 2 and 3 (Fig. 4) follow approximately Boltzmann distribution, namely 3 2/ ~ exp( / )Bn En k T−Δ , where ΔE is the effective energy gap between 4F5/2 and 4F7/2 multiplets, kB is the Boltzmann constant and T is the absolute temperature. In the model, we treated n2 as a constant independent of temperature. However, it was not too difficult to recognize that n2 should be a temperature-dependent variable. Therefore, a model which is closer to the nature of the process was adopted, illustrated in Fig. 4(b). In the model, a rate equation written for the population densities n2 (ni, i = 0, 1, 2, 3, 4) is
NR20 0 23 2 2 2 2
rad[ ( ) ( ) ( ) ] ,T T Tdn
n W ndt
σ σ γ= Φ − Λ + Φ + + (4)
where Φ is the photon flux, σ0 is the absorption cross section corresponding to the transition 4I9/2-
4F5/2, and σ2(T) is the phonon assisted one-photon absorption cross section between states 2 and 4, from which other transitions occur contributing to UC emissions in the visible and UV. The temperature-dependent absorption cross section is given by
0( ) [exp( / k ) 1] ,qi i BT Tσ σ ω −= − (5)
where the exponent q accounts for the number of effective phonons participating in the absorption process [13]. The multiphonon excitation rates are given by Λij(T) = Cij
epPij(T), where Cij
ep is a parameter proportional to the electron-phonon coupling strength and Pij(T) is the phonon occupancy numbers given by
[ ]( ) exp( / k ) 1 , ijq
ij BT TP ω −= − (6)
where qij is the number of effective phonons with energy ħω involved in the multiphonon excitation from level i to level j [14]. Wi
NR(T) is the nonradiative relaxation rate from level i due to multiphonon relaxation processes. A reference temperature (T0) was chosen and Wi
NR(T) was determined through the following expression obtained from Ref [15]:
00
1 exp( / )( ) ( ) ,
1 exp( / )
iq
NR NR Bi i
B
k TW T W T
k T
ωω
− − −
= − −
(7)
where qi represents the number of effective phonons involved in the relaxation of level i to the closest low energy level. The parameter γ2
rad included in the model is the radiative decay rate. However, our model is not much sensitive to these parameters, since the associated NR rate dominates in the range of temperatures studied here because the levels of interest are close-lying states. Thus, we considered γ2
rad as a constant. From Eq. (4) the steady-state population of the level i = 2 can be found and it is given by:
0 02
23 2 2 2
( ) .( ) ( ) W ) (
NR rad
nn T
T T T
σσ γ
Φ=
Λ + Φ + + (8)
Considering the Boltzmann distribution, we concluded that
0 0NR rad3
23 2 2 2
exp( / )( ) ,
( ) ( ) ) W (BA n E k T
TT T T
nσ
σ γΦ −Δ
=Λ + Φ + +
(9)
where A is a constant. Then we can conclude that
3 ( ) ( ) exp( / ), Bn A ET T k T= −Δ (10)
#223562 - $15.00 USD Received 23 Sep 2014; revised 6 Nov 2014; accepted 13 Nov 2014; published 26 Nov 2014(C) 2014 OSA 1 December 2014 | Vol. 22, No. 24 | DOI:10.1364/OE.22.030333 | OPTICS EXPRESS 30342
where
0 0
23 2 2 2
( ) .( ) ( ) W ( )NR
A nA T
T T T
σσ γ
Φ=
Λ + Φ + +
From Eqs. (5)–(7) the parameters Λ23(T), σ2(T) and W2NR(T) increase monotonously with
temperature. So A(T) decreases monotonously with the raise of temperature. The signal intensity shown in Fig. 7(b) is proportional to n3(T). So the previous model, used in Fig. 7(b), which treated A(T) as a constant, is oversimplified. However, we can see that the experimental data at a higher temperature range (~340−458 K) can be well fitted with the equation in Fig. 7(b). In Fig. 7(c), it shows the relative sensitivity SR of β-NaYF4: 1% Nd3+ sample as a function of temperature derived from Equation in Fig. 7(b) and Eq. (3). The SR value of Fig. 7(b) at a medium temperature of 400 K calculated from Eq. (3) is 1.69% K−1.
3.3.3 Thermally enhanced luminescence with 864.2 nm excitation
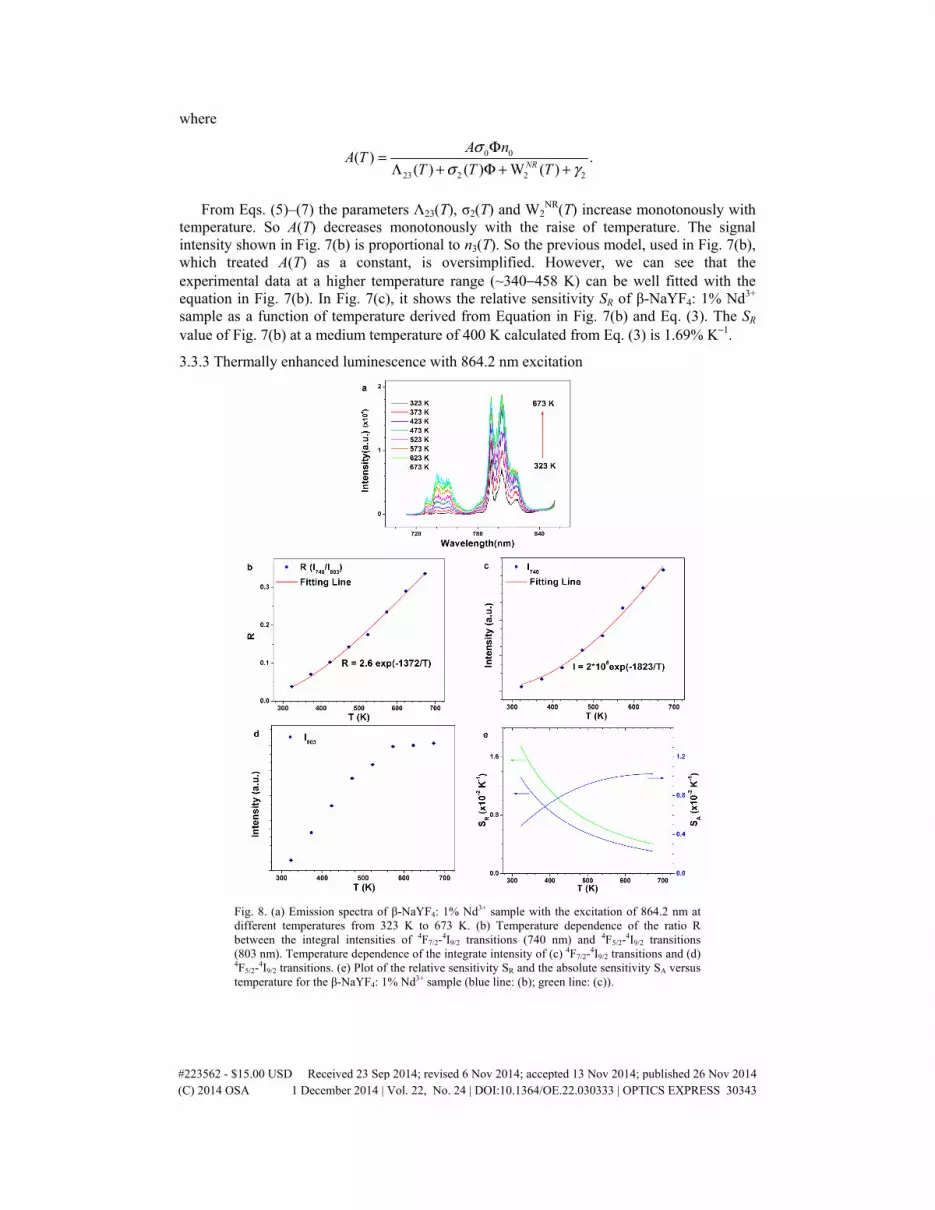
Fig. 8. (a) Emission spectra of β-NaYF4: 1% Nd3+ sample with the excitation of 864.2 nm at different temperatures from 323 K to 673 K. (b) Temperature dependence of the ratio R between the integral intensities of 4F7/2-
4I9/2 transitions (740 nm) and 4F5/2-4I9/2 transitions
(803 nm). Temperature dependence of the integrate intensity of (c) 4F7/2-4I9/2 transitions and (d)
4F5/2-4I9/2 transitions. (e) Plot of the relative sensitivity SR and the absolute sensitivity SA versus
temperature for the β-NaYF4: 1% Nd3+ sample (blue line: (b); green line: (c)).
#223562 - $15.00 USD Received 23 Sep 2014; revised 6 Nov 2014; accepted 13 Nov 2014; published 26 Nov 2014(C) 2014 OSA 1 December 2014 | Vol. 22, No. 24 | DOI:10.1364/OE.22.030333 | OPTICS EXPRESS 30343
As shown in Fig. 8(a), emission spectra of β-NaYF4: 1% Nd3+ sample were obtained at different temperatures from 323 K to 673 K with the excitation of 864.2 nm, which correspond to the stimulated process of Fig. 4(c). The data obtained are presented in Figs. 8(c) and 8(d), which shows a signal increase by a factor of 28.6-fold and 3.3-fold when the temperature is varied from 323 to 673 K. As shown in Fig. 8(c), we can see that the intensity of emission bands originated from 4F7/2-
4I9/2 transitions (740 nm) increase monotonously with temperature. The solid line in the Fig. 8(c) represents theoretical results which are fitted with the equation in Fig. 8(c). In this case the data in Fig. 8(c) can be well fitted with the simplified model in this temperature range.
However, it is noteworthy that the integrated intensity of 4F5/2-4I9/2 transitions in Fig. 8(d)
increases monotonously with the raise of temperature at first and then tends to be saturated, which could not be explained with the simplified equation. Thus the similar model as used in the explanation of Fig. 7(b) is employed again to get an understanding of the steady-state population of the 4F5/2 level. We can conclude that
2 ( ) ( ) exp( / k ),Bn T B T E T= −Δ (11)
0 0
12 1 1
( ) ,( ) ( ) ( )
TT
n
T
BB
T
σγ σ
Φ=
Λ + + Φ (12)
where rad NR1 1 1( ) ( )T W Tγ γ= + , with γ1
rad being the radiative decay rate and W1NR(T) being the
temperature dependent nonradiative (NR) relaxation rate from level i = 1 due to multiphonon relaxation processes. From Eqs. (5)–(7) the parameters Λ12(T), σ1(T) and W1
NR(T) increase monotonously with the raise of temperature. That means B(T) decreases monotonously with the raise of temperature. So the experimental result in Fig. 8(d) is reasonable since the signal intensity of the 4F5/2 level is proportional to n2(T) and the increase of exp(-ΔE/kBT) with the raise of temperature is balanced by a decrease of B(T) for the high temperature region.
In Fig. 8(b), R is the ratio of integral intensity of emission band from 710 nm to 770 nm to that of emission band from 770 nm to 842 nm. The solid line in the Fig. 8(b) represents theoretical results which are fitted with the equation in Fig. 8(b). From the well-fitted equation, the energy gap ΔE is obtained to be 953 cm−1 (4F5/2-
4F7/2). The result about the energy gap is self-consistent with the previous result in 3.3.1 (956 cm−1). In Fig. 8(e), it shows the relative sensitivity SR and the absolute sensitivity SA of β-NaYF4: 1% Nd3+ sample as a function of temperature from 323 K to 673 K with the excitation of 864.2 nm. The SR values of Figs. 8(b) and 8(c) at 500 K derived from Eq. (3) are 0.55% K−1, and 0.73% K−1, respectively.
4. Conclusion
In summary, Nd3+ doped β-NaYF4 microprisms were synthesized through a facile EDTA-assisted hydrothermal method. In the temperature range from 323 K to 673 K, the FIRs of I740/I864, I803/I864 and I740/I803 increased gradually with the raise of temperature upon the excitation of 574.8 nm and their population ratios were fitted well by the Boltzmann distributions. The strong temperature dependence of the FIR between two multiplets 4F7/2 and 4F3/2 that are thermally-coupled via an intermediate ladder level 4F5/2 can be used for high-sensitive temperature sensing. The obtained maximum relative sensitivity at 500K is 1.12% K−1, higher than several typical temperature sensors based on FIRs. Further improvements of temperature sensitivities are promising by finding ladder-level assisted thermal coupling levels with a larger gap.
We also studied the thermally-enhanced anti-Stokes luminescence in β-NaYF4: Nd3+ sample by resonant excitation of transitions 4I9/2-
4F5/2 and 4I9/2-4F3/2 at 793.8 nm and 864.2 nm,
respectively. The luminescence at 740 nm due to transition 4F7/2-4I9/2 presented linear intensity
dependence versus the laser intensity and experienced 170-fold enhancement when the
#223562 - $15.00 USD Received 23 Sep 2014; revised 6 Nov 2014; accepted 13 Nov 2014; published 26 Nov 2014(C) 2014 OSA 1 December 2014 | Vol. 22, No. 24 | DOI:10.1364/OE.22.030333 | OPTICS EXPRESS 30344

temperature changes from 298 K to 458 K. A model considering the relevant energy levels populations, including temperature-dependent absorption cross-sections and nonradiative transition rates, was proposed to describe this thermal behavior.
Acknowledgement
This work was financially supported by the National Key Basic Research Program of China (Grant No. 2013CB921800), the National Natural Science Foundation of China (Grant Nos. 11204292 and 11274299, 11374291 and 11311120047) and the Fundamental Research Funds for the Central Universities (WK2030020021).
#223562 - $15.00 USD Received 23 Sep 2014; revised 6 Nov 2014; accepted 13 Nov 2014; published 26 Nov 2014(C) 2014 OSA 1 December 2014 | Vol. 22, No. 24 | DOI:10.1364/OE.22.030333 | OPTICS EXPRESS 30345


