Embed Size (px)
Citation preview

Coulon, Augustin de; Koslowski, AlisonTeenage learners and teachers’ job satisfaction in vocational education
Empirical research in vocational education and training 2 (2010) 1, S. 1-19
urn:nbn:de:0111-opus-51642
in Kooperation mit / in cooperation with:
http://www.skbf-csre.ch
Nutzungsbedingungen / conditions of useGewährt wird ein nicht exklusives, nicht übertragbares, persönliches und beschränktes Recht auf Nutzung dieses Dokuments. DiesesDokument ist ausschließlich für den persönlichen, nicht-kommerziellen Gebrauch bestimmt. Die Nutzung stellt keine Übertragung desEigentumsrechts an diesem Dokument dar und gilt vorbehaltlich der folgenden Einschränkungen: Auf sämtlichen Kopien diesesDokuments müssen alle Urheberrechtshinweise und sonstigen Hinweise auf gesetzlichen Schutz beibehalten werden. Sie dürfendieses Dokument nicht in irgendeiner Weise abändern, noch dürfen Sie dieses Dokument für öffentliche oder kommerzielle Zweckevervielfältigen, öffentlich ausstellen, aufführen, vertreiben oder anderweitig nutzen.
We grant a non-exclusive, non-transferable, individual and limited right to using this document.This document is solely intended for your personal, non-commercial use. Use of this document does not include any transfer ofproperty rights and it is conditional to the following limitations: All of the copies of this documents must retain all copyright informationand other information regarding legal protection. You are not allowed to alter this document in any way, to copy it for public orcommercial purposes, to exhibit the document in public, to perform, distribute or otherwise use the document in public.
Mit der Verwendung dieses Dokuments erkennen Sie die Nutzungsbedingungen an.By using this particular document, you accept the above-stated conditions of use.
Kontakt / Contact:
peDOCSDeutsches Institut für Internationale Pädagogische Forschung (DIPF)Mitglied der Leibniz-GemeinschaftInformationszentrum (IZ) BildungSchloßstr. 29, D-60486 Frankfurt am MainE-Mail: [email protected]: www.pedocs.de

Empirical Research in Vocational Education and Training Vol. 2(1), 2010, 1-19
Teenage learners and teachers’ job satisfactionin vocational education
Augustin de Coulona,∗, Alison Koslowskib
aDepartment of Management, Kings CollegebSocial Policy, School of Social & Political Science, University of Edinburgh
Abstract
An increasing number of adult basic skills teachers in England have a largeproportion of teenage learners in their classes. In this paper, we explore whetherthis development affects their job satisfaction. We draw on longitudinal data ofteachers involved with basic skills provision. Using a range of statistical mod-els, our main finding is that adult basic skills teachers who face more teenagersin the classroom are less satisfied with their experience of learners than thosewho teach mainly adults.
Keywords: Teachers, job satisfaction, literacy skills
1. Introduction
The problems of low numeracy and literacy levels for a large proportion of the UKadult population have been documented at key points in the last two decades (e.g.the 1999 Moser Report, the 2003 Skills Survey and the 2006 Leitch report). In 1999,it was documented that approximately 20% of adults in England had severe literacydifficulties, whilst around 40% had some numeracy problems. Having poor literacyand/or numeracy is harmful both to low-skilled individuals (who are at greater riskof unemployment, unstable jobs and fewer prospects for career advancement) and tothe economy at large (that increasingly needs a more highly qualified workforce).
Before 2003, teachers in this area of work may or may not have had professionalqualifications in their own subject. A variety of certificates and diplomas were avail-able. After that, from 2003 to 2007, the first phase of qualifications for specialistteachers of adult literacy, numeracy and ESOL1 were introduced.
An interesting consequence of current policy is that a third of existing basic skillsteachers in England teach to groups containing a majority of teenage learners (age16 to 19) and more than half of the qualifications counting towards government tar-gets between 2001 and 2007 were gained by teenagers (16-18 years old)2. There arenumerous reasons why teaching teenagers might be considered as a distinct experi-ence from teaching other post-compulsory education learners beyond this age range.∗Corresponding author: [email protected], tel.: + 44 (0)20 7848 45301English to Speakers of Other Languages2See National Audit Office (2008)
c© 2010 Sense Publishers. All rights reserved.

2 A. de Coulon and A. Koslowski
Given that many of these teachers find themselves in classrooms with a high propor-tion of teenage learners, we investigate whether this development affects their jobsatisfaction. More specifically, we investigate the link between the satisfaction ofteachers towards their learners and the proportion of teenage learners in their class-rooms.
Rich micro-level data are provided by the National Research and DevelopmentCentre for Adult Literacy and Numeracy (NRDC), who have conducted a longitudi-nal study of adult literacy and numeracy teachers in England over the period 2004to 2007. Our empirical strategy relies on two approaches. We first introduce a largenumber of potential confounders in our regressions. And the data sets being a panel,we are also able to account for time constant unobserved heterogeneity in our esti-mations.
Assuming that a lower level of satisfaction is associated with higher quittingrates, our findings have important implications for basic skills teachers’ attrition fromthe profession. Teacher attrition has serious negative consequences. It affects learn-ers first and foremost, as they are more likely to be taught by novice teachers and thelower quality of teaching by novice teachers is well documented (Hanushek, Kain &Rivkin, 2005; Clotfelter, Ladd & Vigdor, 2006). Secondly, it also affects governmentspending, as from high attrition rates follow increased training costs. Thirdly, it ispotentially costly to teachers who drop out, as their investment in training is lost inthe process (there are also psychological costs induced by the shift to another job).
The layout of the paper is as follows: in Section 2, we provide contextual in-formation on the recent skills strategy in England (Skills for Life) and review theliterature on job satisfaction and teacher attrition. In section 3 we present the datathat are used in section 4 for the empirical analysis. We summarise and discuss ourresults in section 5.
2. Theory and context
The Skills for Life (SfL) strategy
Publicly funded adult literacy, language and numeracy learning in England has beendominated by the SfL strategy in recent years. Set out by the UK Labour governmentin March 2001, the aim of the strategy has been to improve adult literacy and numer-acy skills in England (Appleby & Bathmaker, 2006). Whilst the aim of the strategyis to explicitly improve adult skills, the SfL strategy is set out to cater for the needsof all post-16 learners3. Skills for Life provision covers all literacy and numeracylearning from pre-entry level up to and including level 2 (see appendix A for an ex-planation of these stages of the National Qualifications Framework). This includesevery type of provision in a wide range of contexts. Where teaching and learning
3The Skills for Life targets cover people aged 16 and over in England who have left compulsoryeducation, excluding students in school sixth forms, but including those in sixth form colleges (NAO,2004).

Teenage learners and teachers’ job satisfaction in vocational education 3
in the 1980s and early 1990s may have been mainly in ”adult basic education” anddelivered in the community or adult colleges, SfL is now a feature of Further Edu-cation college, workplace, work-based, offender, learndirect, community, JobcentrePlus and other types of provision. SfL may be delivered as stand alone, as part ofa vocational programme, or as a ”bolt-on” course. SfL targets for achievement ofqualifications are at Entry Level 3, Level 1 and Level 2. But Entry Level 1 and 2 andPre-Entry courses are also publicly funded.
An important element of the SfL strategy is the improvement of teacher qual-ifications as well as an increase in the number of teachers holding these qualifica-tions. However, until recently there were few professional development guides orprogrammes preparing teachers for engaging with teenage rather than with adultlearners.
Teacher exit attrition and job satisfaction
This paper focuses on one potentially important contributor to the rate or turnoveramong SfL teachers in England, namely job satisfaction. Limited information isavailable as to the rate of turnover among SfL teachers in England. However, almostevery major evaluation or survey cites it as a problem (Smith & Hofer, 2002). Muchof the literature referred to below comes from American research as there is a relativepaucity of work in the European context.
Attrition is to be avoided given the overall general problems of teacher supplyin England, particularly in mathematics and English language (see White, Gorard& Huat, 2006). Teacher attrition can cause financial hardship to the employing or-ganisation due to a channelling of scarce resources toward recruiting, hiring andattracting new prospective teachers and providing training. In addition, high teacherturnover has negative impacts on student learning (Hanushek et al., 2005; Clotfelteret al., 2006).
The market for teachers generally can be said to differ from that of a well-functioning neoclassical labour market. This is because salaries are determined notby the market clearing level, but instead through a political process involving sev-eral levels of government and often teachers’ unions (Mont & Rees, 1996). Thus, ashortage of teachers becomes a possibility, or at least of appropriately trained teach-ers (Mont & Rees, 1996). An important issue for the UK government is how toprovide enough reward, monetary or otherwise, to induce high quality individualsto stay in the profession, specifically those teachers with the hardest jobs (Cheva-lier & Dolton, 2005)4. Compensating the non-satisfied teachers with a higher wagewould be the standard labour economics approach. Increased teacher salaries arealso associated with increased teacher quality (Figlio, 1997).
Other research has claimed that the most important influence on retention deci-sions is job satisfaction rather than wage level (Stockard & Lehman, 2004). Voke
4It should be further noted that salaries in Further Education are not being set nationally but by eachemployer, unlike the compulsory education teaching scales.

4 A. de Coulon and A. Koslowski
(2002) notes that new teachers enter the profession primarily for intrinsic rather thanextrinsic rewards. That is to say, they want to become teachers for the opportunitythis will give them to engage in meaningful work, or for the love of a particularsubject, for example, rather than for salary or status (Lortie, 1975; Goodlad, 1984;Liu, Kardos, Kauffman, Peske & Johnson, 2000). However, Voke (2002) goes on toobserve that while the extrinsic rewards may not attract people into the profession,dissatisfaction with them is cited as a reason for quitting. Stockard and Lehman(2004) further note that teachers with lower salaries, as well as those who are in more”difficult” assignments, are more likely to express dissatisfaction or leave teaching(Billingsley, 1993; Murnane, Singer, Willet, Kemple & Olsen, 1991; Stinebrickner,1998). When receipt of intrinsic rewards is thwarted, through, for example, disci-pline problems (which in our case is more likely to happen given the increasing pres-ence of teenage learners), teachers become less willing to tolerate the low salaries.Compulsory education teachers in England get paid more than post-compulsory ed-ucation teachers. Indeed graduates within the Further Education sector are paidless than any other graduates in regressions that control for large numbers of poten-tial confounders (i.e. sectors of activity, degree specialisation, highest qualificationattained and the usual socio-economic: age, gender, ethnicity, marital status), seeWalker, Vignoles and Collins (2007). This may be compensated for by the nature ofthe audience. Adults are less cost intensive to teach than children. It may reflect theincreased desirability as an intrinsic motivation to teach adults. If this intrinsic mo-tivation is thwarted, financial compensation may become more important. Work byImazeki (2005) suggests that salary increases can reduce exit attrition, but that theseincreases need to be fairly substantial. Thus, with regard to reducing exit attrition,the most efficient strategy is to ensure that the intrinsic rewards, such as satisfactionwith learners, are retained.
Appropriate professional development has been identified as a crucial factor inreducing teacher attrition (see Comings & Zachry, 2006 and Latham & Vogt, 2007).Furthermore, asking teachers to teach outside their areas of certification has beenshown to correlate with higher turnover (Mont & Rees, 1996). Many teenagers ar-riving in the post-compulsory education sector will have an unsuccessful career incompulsory education behind them. It may be that a teacher has left the compulsoryeducation sector precisely to avoid teaching teenage learners. As such, it is assumedthat satisfaction will be affected if they find a large proportion of teenage learners intheir classes5.
Learners in the 16 to 19 age bracket are distinct in their learning needs fromother adult learners. Furthermore, pedagogical theories suppose that adult learnersare distinct from adolescent and child learners, and that teachers need to support andstructure their students’ learning accordingly (e.g. Knight & Sutton, 2004). Thus, thenew qualifications, which are specifically targeted at adults and not teenage learners
5There may be other reasons why teachers teaching teenagers are less satisfied. It might be that thecourse materials are less relevant, or that facilities and class sizes are different. It could even be thatteaching these learners is easier and so less fulfilling.

Teenage learners and teachers’ job satisfaction in vocational education 5
will, to some degree, fail this group of young people and fail the teacher trainees.Such inappropriate skilling appears to be happening in the basic education sectordespite the rigorous new teacher training frameworks brought in by the recent SfLstrategy. This is perhaps all the more surprising given an historical context whereteenagers have always made up a substantial part of the constituency of vocational(or Further Education in Britain) colleges for O-Level/GCSE retakes as well as aplethora of other qualifications not typically available in the compulsory educationsector (Appleby & Bathmaker, 2006).
Drawing on the literature discussed above, we set out to address whether adulteducation teachers experience greater dissatisfaction with aspects of their job relatedto their learners when their learners comprise of a greater proportion of teenagers.
3. The data
The data used in this paper are drawn from a longitudinal study commissioned bythe Department for Education and Skills (now replaced by DIUS) and managed byNRDC. Research findings from this study are used to inform on-going policy devel-opment in the SfL sector. The study surveyed approximately 1000 teachers workingin a range of educational programmes across England. The same teachers partici-pated in the study over a 3-year period from 2004 to 2007. The first two waves of theSkills for Life teachers survey conducted in 2004-5 and 2006 respectively are used.The data set appears reasonably representative of the whole SfL workforce (NRDC,2006; LLUK, 2007). Current estimates are that the entire SfL teachers workforcenumbers 18,800, implying that teachers interviewed for this survey account for morethan 5% of this workforce, an unusually large percentage for this type of survey. In aprevious report (NRDC, 2006), this sample was compared to a sample of compulsoryschoolteachers interviewed in the Labour Force Survey (LFS) over the same period.Compared to post-secondary teachers, individuals in our sample are older (5 yearsolder), more likely to be female, have longer working hours, are more likely to be ontemporary contract, and earned about 22% less.
We give the main characteristics of the sample used in waves 1 and 2 in Table1. We observe that the sector consists largely of female teachers (80%). We alsoobserve that across the two waves an upward shift appears in the qualification lev-els. A larger number (40% rather than 25%) of teachers report holding the highestrecorded level of qualification in 20066. This increase is not explained by attritionbetween wave 1 and 2 as the proportion of teachers with level 5 present in bothwaves was 25% in wave 1. The proportion of teachers with a temporary contracthas decreased slightly (from 23% to 20%). The proportion of those with a full-timecontract has also decreased (from 58% to 49%). Hourly pay has increased by 6%,which is slightly higher than inflation. Tenure is slightly lower than in the secondary
6But not the new professional SfL level 5 qualifications, which were not yet available during thisperiod.

6 A. de Coulon and A. Koslowski
compulsory education sector, which suggests that attrition could be higher in the SfLsector (NRDC, 2006).
Table 1: Mean characteristics of the sample in wave 1 and 2
Sweep 1 (2004-5) Sweep 2 (2006)(n=1027) (n=667)
Mean SD Mean SDAge 46.5 9.9 46.8 9.8Female (%) 79.2 1.2 79.8 1.4Ethnicity: British white (%) 93.2 0.7 94.7 0.8Highest level of qualifications:Level 3 and below (%) 8.6 0.8 2.2 0.5Level 4 (%) 65.3 1.4 57.6 1.9Level 5 (%) 25.9 1.4 40.2 1.9Temporary contract (%) 22.9 1.3 20.1 1.5Full-time (%) 58.2 1.5 49.5 1.8Mean hourly wage 13.5a 7.7 14.3b 8.9Mean paid weekly hours 28.4c 10.8 28.1c 11.1Mainly teach numeracy 48.9 1.9. 43.2 1.9Mainly teach literacy 37.2 1.8 34.7 1.8Mainly teach ESOL 14.6 1.4 22.7 1.6Proportion of teenage learners 32.4 38.4 31.9 37.6Taught impaired learners 49.2 1.9 50.0 1.9
Note: aThis is for the 784 individuals who agreed to provide information about their earnings. bThis isfor 444 individuals who agreed to provide information about their earnings. cMean paid weekly hours are36 for full-time teachers in both sweeps 1 and 2. Similar increase in qualifications level is observed whenrestricting the Sweep 1 sample to the 667 interviewed in both sweeps.
For the initial sweep, 784 teachers agreed to provide information about their earn-ings, out of 1027. We constructed the hourly wage by dividing the income (yearlytranslated) by the contracted hours.
The proportion of a teacher’s learners that are teenagers is captured in the databy the following question: ”In the last three months of your teaching, what has beenthe proportion of your learners who were age 16 to 19?”. The teacher is then di-rected to choose a number on a scale between 1 and 100. The opening comment:”In the last three months of your teaching” has been used extensively in the dataas a screening device to ensure only current and actual teachers are included in thedata. The purpose of this was to exclude individuals who may have taught some-times (and therefore were included initially) but who moved to other managementor administrative positions within the sector. Whether our measure of the proportionof teenagers aptly translates as the true proportion is open to question. As this studyanalyses the job satisfaction of teachers, however, it is a teacher’s perception rather

Teenage learners and teachers’ job satisfaction in vocational education 7
than the true proportion, which is of primary interest. However, to the extent that theover-estimation is constant across teachers, our slope estimates are also valid for theassociation between the true proportion of teenagers and teacher satisfaction. Themean proportion of all learners who are teenage learners is around 31 per cent in oursample. Behind this mean, there is considerable variability (as can be seen by thesize of the standard deviation in Table 1). Approximately 25 per cent of teachersreport having no teenage learners at all, while 7 per cent state that their learners areexclusively teenagers.
4. Empirical analysis
In this section, we investigate the main assumption of this paper: that SfL teachersexperience greater dissatisfaction with aspects of their job related to their learnerswhen teaching a greater proportion of teenagers. We first provide a discussion ofteacher job satisfaction.
There is no agreed definition of teachers’ satisfaction. It is a broad term thatincludes well-being, efficacy and commitment. The survey has investigated elevenaspects where teachers were asked to choose a number between 1 (very dissatisfied)and 5 (very satisfied). Satisfaction can only be addressed by the answers coveredin those eleven aspects of the job (listed in Appendix B) and this paper is thereforelimited in its scope as a result.
We further focus on teachers’ satisfaction with their learners, which is measuredin the survey by three aspects that were: ”learner behaviour”, ”learner progressand achievement”, ”appreciation of your work by learners”. To give a preliminaryoverview of the questions investigated, we provide some basic descriptive statisticsin Table 2.
Table 2: Job satisfaction according to the proportion of teenage learners (%)
All teachers Teachers with Teachers with lessmore than 60% of than 60% of teenageteenage learners learners
Job satisfaction with aspects 9.3 (1.9) 8.2 (2.3) 9.8 (1.5)related to learners (min: 0,max: 12)Job satisfaction with other 17.5 (5.5) 17.5 (5.4) 17.6 (5.6)aspects unrelated to learners(min: 0, max: 32)
Note: Standard-errors in parenthesis. This is based on teachers self-reported proportion of teenagers theywere teaching in the last three months before the interview took place.
There are differences in job satisfaction related to the learners as displayed inthe first row of Table 2 (i.e. teachers’ satisfaction with: learner behaviour, learner

8 A. de Coulon and A. Koslowski
progress and achievement and appreciation of their work by learners). Teachers witha majority of teenage learners report a lower level of satisfaction (8.2 versus 9.8 ona scale from 0 to 12).
Interestingly, this difference is absent for satisfaction with other aspects of thejob. If we aggregate those in one index, we find no significant difference accordingto whether the teachers taught a greater or lesser number of teenage learners (secondrow). But one cannot draw a strong conclusion on the basis of such a descriptive ta-ble. First, the cut-off at 60% of teenage learners is arbitrarily chosen. It is importantto investigate other parts of the teachers’ satisfaction distribution. Second, it doesnot take into account other characteristics of the teaching environment that may con-found this simple correlation. One obvious example could be that teachers with moreteenagers are systematically situated in regions with higher levels of deprivation.
We therefore proceed to a multivariate analysis of teachers’ satisfaction withtheir learners to include other aspects of the teaching environment. The dependent(explained) variable is the teachers’ satisfaction with their learners (Table 3). Themain variable of interest is the proportion of learners who are teenagers, but weinclude the full range of potentially confounding factors available in the data. Theseare: teachers’ age, their highest qualifications, whether they work full-time or part-time, whether they have a fractional or hourly paid contract, whether they mainlyteach numeracy, literacy or English as a second language (ESOL), whether they areon a temporary contract, white, the proportion of impaired learners, geographicalregion (of which there are nine7), the type of institutions taught at (further educationcolleges, adult community learning, work based learning, Job Centre plus, prisonsand Learndirect). We only provide the main variables of interest in Table 3, but thefull list of estimated coefficients is provided in Appendix C.
The three columns give coefficients of similar magnitude, all negative and highlysignificant. This means that a 10 percentage point increase in the proportion ofteenage learners is associated with a 0.22 decrease in the satisfaction scale.
The other variables are introduced as controls only, we comment briefly on theirestimated coefficients (shown in Appendix C). The satisfaction with learners is lowerfor male teachers, unrelated to age, unrelated to being on a temporary contract8, un-related to the subject area (numeracy, literacy and ESOL), unrelated to teachers’ethnicity, and unrelated to the proportion of impaired learners. For the geograph-ical region dummies, only teachers based in the West-Midlands are less satisfiedwith learners, but the coefficient is significant at the 10 per cent level only. Finally,those teachers in further education colleges and adult community learning appear tobe less satisfied with the learners once we account for the employing organisationfixed effects (the reference group comprises work based learning, Job Centre plus,Learndirect and prisons).
7The 9 regions are (10 if including unknown as a category): East Midlands, East of England, London,North East, North West, South East, South West, West Midlands, Yorkshire and Humberside.
8In regressions (not shown) of teacher satisfaction with other aspects of the job (not related to thelearners), it is negative and very significant.

Teenage learners and teachers’ job satisfaction in vocational education 9
Table 3: Regressions of teachers satisfaction with their learners on the proportion ofteenage learners
Proportion of teenage learners -0.020*** -0.023*** -0.022**(0.002) (0.007) (0.010)
Age yes yes yesHighest qualification levels yes yes yesFull/part-time yes yes yesHourly paid yes yes yesNumeracy/Literacy/Esol yes yes yesTemporary yes yes yesEthnicity yes yes yes% of impaired learners yes yes yesRegion of teaching yes yes yesType of institution (FE colleges, ACL, UFI) yes yes yesProportion of teenagers squared no yes yesOrganisations fixed effects (304) no no yesN 1027 1027 1026R2 0.207 0.208 0.469Adjusted R2 0.188 0.188 0.229
Note: Figures in parenthesis are standard-errors. A table with the full list of estimates is provided inAppendix C.
Now, the question some might wish to raise at this stage is whether some char-acteristics unobserved in our data could explain both the proportion of teachers’satisfaction and the proportion of teenage learners in their classes. Potential candi-date characteristics might include an individual teacher’s personality traits such asoptimism, dynamism, and/or natural ability to teach. The subsequent bias could bedownward or upward depending on whether this unobserved trait is more or lessattractive to teenage learners, assuming learners are able to self-select into a partic-ular teacher’s class. As we said earlier, some teachers have been interviewed twice.It is therefore possible to perform a first differenced estimation, which effectivelycontrols for the effect of unobserved time constant heterogeneity. This allows us toinvestigate further potential bias in the coefficients presented in Table 3. We presentthese further findings in the first column of Table 4. Time constant variables disap-pear in the differentiation, and only time varying variables, which might explain thechange in teachers (dis)satisfaction with teenage learners, remain in the regression.The coefficient for the proportion of teenage learners remains highly significant andnegative, if slightly reduced in magnitude. This is consistent with Freeman (1984)and Griliches and Hausman (1986) where bias from measurement error tends to beaggravated by controlling for individual fixed effects (see Angrist & Krueger, 1999for a discussion).
To further address the selection process by learners into a particular teacher’s
10 A. de Coulon and A. Koslowski
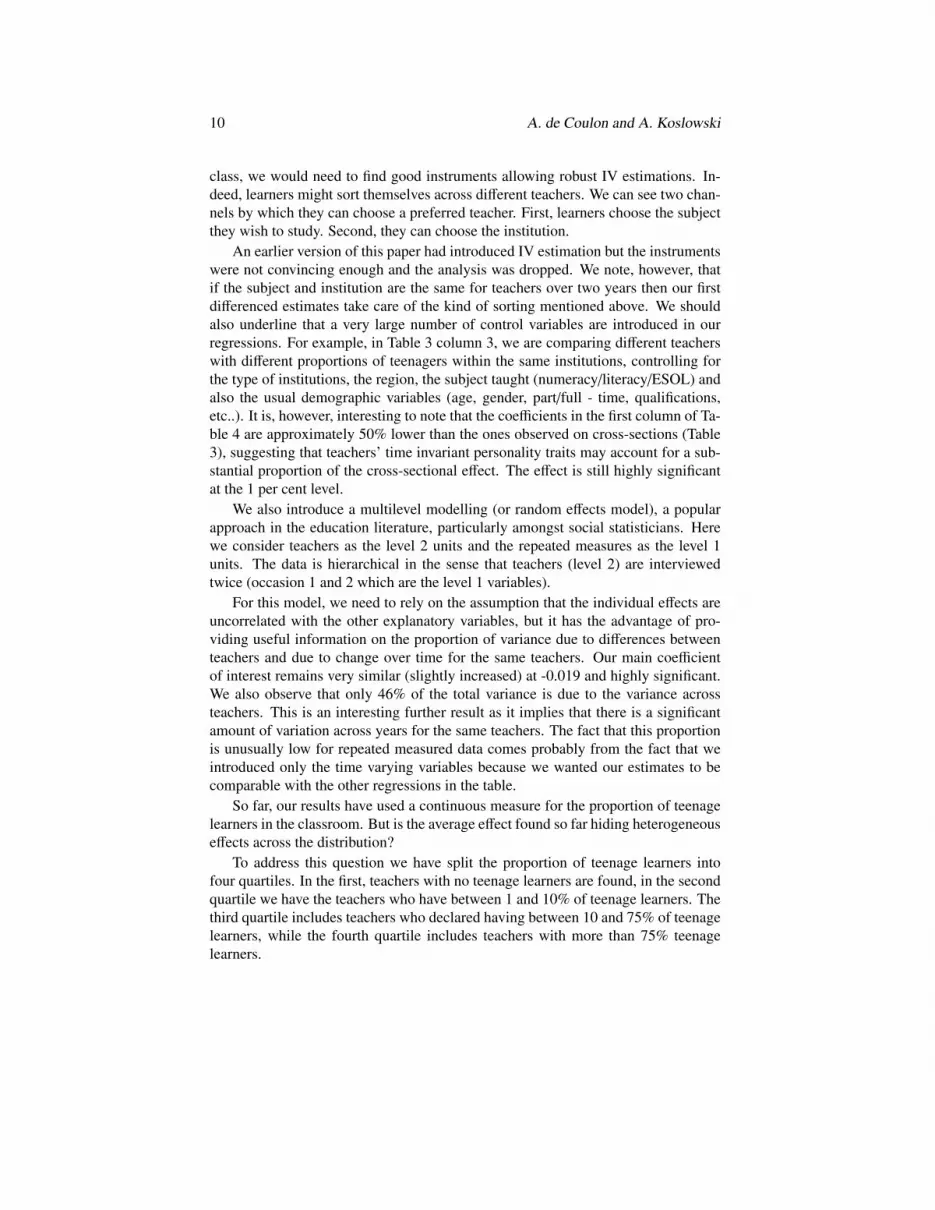
class, we would need to find good instruments allowing robust IV estimations. In-deed, learners might sort themselves across different teachers. We can see two chan-nels by which they can choose a preferred teacher. First, learners choose the subjectthey wish to study. Second, they can choose the institution.
An earlier version of this paper had introduced IV estimation but the instrumentswere not convincing enough and the analysis was dropped. We note, however, thatif the subject and institution are the same for teachers over two years then our firstdifferenced estimates take care of the kind of sorting mentioned above. We shouldalso underline that a very large number of control variables are introduced in ourregressions. For example, in Table 3 column 3, we are comparing different teacherswith different proportions of teenagers within the same institutions, controlling forthe type of institutions, the region, the subject taught (numeracy/literacy/ESOL) andalso the usual demographic variables (age, gender, part/full - time, qualifications,etc..). It is, however, interesting to note that the coefficients in the first column of Ta-ble 4 are approximately 50% lower than the ones observed on cross-sections (Table3), suggesting that teachers’ time invariant personality traits may account for a sub-stantial proportion of the cross-sectional effect. The effect is still highly significantat the 1 per cent level.
We also introduce a multilevel modelling (or random effects model), a popularapproach in the education literature, particularly amongst social statisticians. Herewe consider teachers as the level 2 units and the repeated measures as the level 1units. The data is hierarchical in the sense that teachers (level 2) are interviewedtwice (occasion 1 and 2 which are the level 1 variables).
For this model, we need to rely on the assumption that the individual effects areuncorrelated with the other explanatory variables, but it has the advantage of pro-viding useful information on the proportion of variance due to differences betweenteachers and due to change over time for the same teachers. Our main coefficientof interest remains very similar (slightly increased) at -0.019 and highly significant.We also observe that only 46% of the total variance is due to the variance acrossteachers. This is an interesting further result as it implies that there is a significantamount of variation across years for the same teachers. The fact that this proportionis unusually low for repeated measured data comes probably from the fact that weintroduced only the time varying variables because we wanted our estimates to becomparable with the other regressions in the table.
So far, our results have used a continuous measure for the proportion of teenagelearners in the classroom. But is the average effect found so far hiding heterogeneouseffects across the distribution?
To address this question we have split the proportion of teenage learners intofour quartiles. In the first, teachers with no teenage learners are found, in the secondquartile we have the teachers who have between 1 and 10% of teenage learners. Thethird quartile includes teachers who declared having between 10 and 75% of teenagelearners, while the fourth quartile includes teachers with more than 75% teenagelearners.

Teenage learners and teachers’ job satisfaction in vocational education 11
Table 4: Dependent variable: teachers satisfaction with their learners
(1) (2) (3) (4)First Random Non-linear First
difference effects effects for differenceestimates tenage with non-
learners lineareffects
Proportion of -0.13*** -0.019***teenage learners (0.003) (0.002)
Prop of teenage -0.148 -0.249learners (2nd quartile) (0.173) (0.151)Prop. of teenage -0.882*** -0.646***learners (3rd quartile) (0.215) (0.232)Prop. of teenage lear- -1.636*** -1.05***ners (4th quartile) (0.252) (0.333)
Number of teachers 661 661 1026 661
Rho (intra unit 0.462correlation)
Note: Models in col. 1, 2 and 4 include the same independent variables as in the first column of Table 3.Model in column 3 include the full sets of control included in Table 3, column 3. The reference for Model3 and 4 is teachers who teach no teenage learners (i.e. the first quartile). The second quartile includesteachers who have between 1 and 10 percent of teenagers, the third quartile includes proportions between10 and 75 percent, and the highest quartile includes teachers with more than 75% of teenage learners.
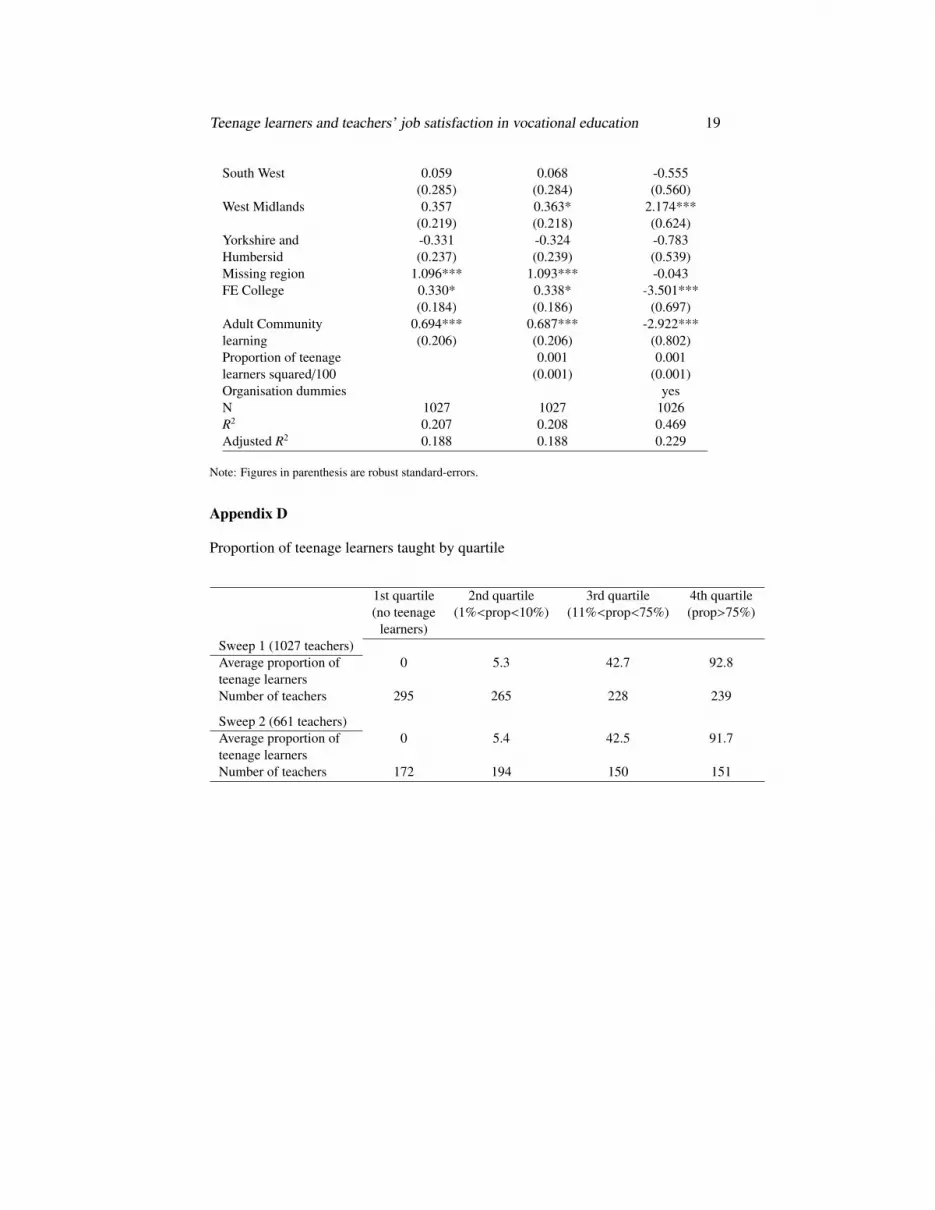
We give in Appendix D, the average proportions of teenage learners by quartilefor sweep 1 and 2, together with the total number of teachers in each quartile. Wechoose cut-off points in order to be as close as possible to 25% of the distribution butwere constrained by the bunching at certain values. There were, for example, 26.8%of teachers with no teenage learners in the first sweep (25.8% in sweep 2).
We introduce proportion of teenage learners by quartile in Table 4, column 3 forthe first sweep. We include the full set of controls used in the fully controlled regres-sion in Table 2 (column 3). We find that the relationship between teenage learnersand teachers satisfaction is highly non-linear. Teachers who face between 1 and 10%of teenagers do not express lower level of satisfaction than those without teenagelearners. But teachers with a higher percentage of teenagers display a much lowerlevel of satisfaction with their learners. This is particularly the case for teachers whohave more than 75% of teenagers. Compared to teachers with no teenage students,teacher satisfaction is reduced by 1.6 units on a 12-point scale.
Another way to investigate this non-linearity is to use first differenced estima-tions. Here the comparison is made using teachers who face substantial changes in
12 A. de Coulon and A. Koslowski
the proportion of teenagers in their class across the two sweeps. The results pre-sented in column 4 of Table 4, show again that the effect is higher at the top of thedistribution, teachers who had seen their classes with more than 75% teenagers whentheir earlier proportion was lower are the most dissatisfied with this shift.
Another interesting aspect to investigate is whether the average effect observedusing the continuous measure of teenage proportion hides substantial heterogene-ity. Are particular teachers more affected than others by an increased proportion ofteenagers? To address this, we introduced interactions in our fully interacted modelof Table 3, column 3. We did not, however, find much support for an average ef-fect being differentiated by characteristics such as male, age, qualifications, whetherfull-time, fractional or hourly paid (results not shown).
Our main finding so far is, therefore, that teachers who teach mainly teenagersare less satisfied with the aspects of their job related to their learners. Now, thequestion is whether this lower satisfaction with their learners is compensated in anyway. One possibility could be that teachers who teach mainly teenagers are relievedfrom some other tasks generally not enjoyed by teachers. One way of checking thatis to look at the satisfaction with other aspects of the job (not related to learners).We did underline in Table 2 that teachers with a majority of teenage learners wereactually not expressing a different level of job satisfaction from those teaching toa majority of adult (not teenage) learners for aspect of the jobs that are unrelatedto the learners. We can actually look at each of the 8 different items of the jobsatisfaction individually to check whether the overall picture is obscuring differentlevels of satisfaction compensating each other. We produce in Table 5, the estimatedcoefficients for the proportion of teenagers on the 8 aspects of the job not related tolearners.
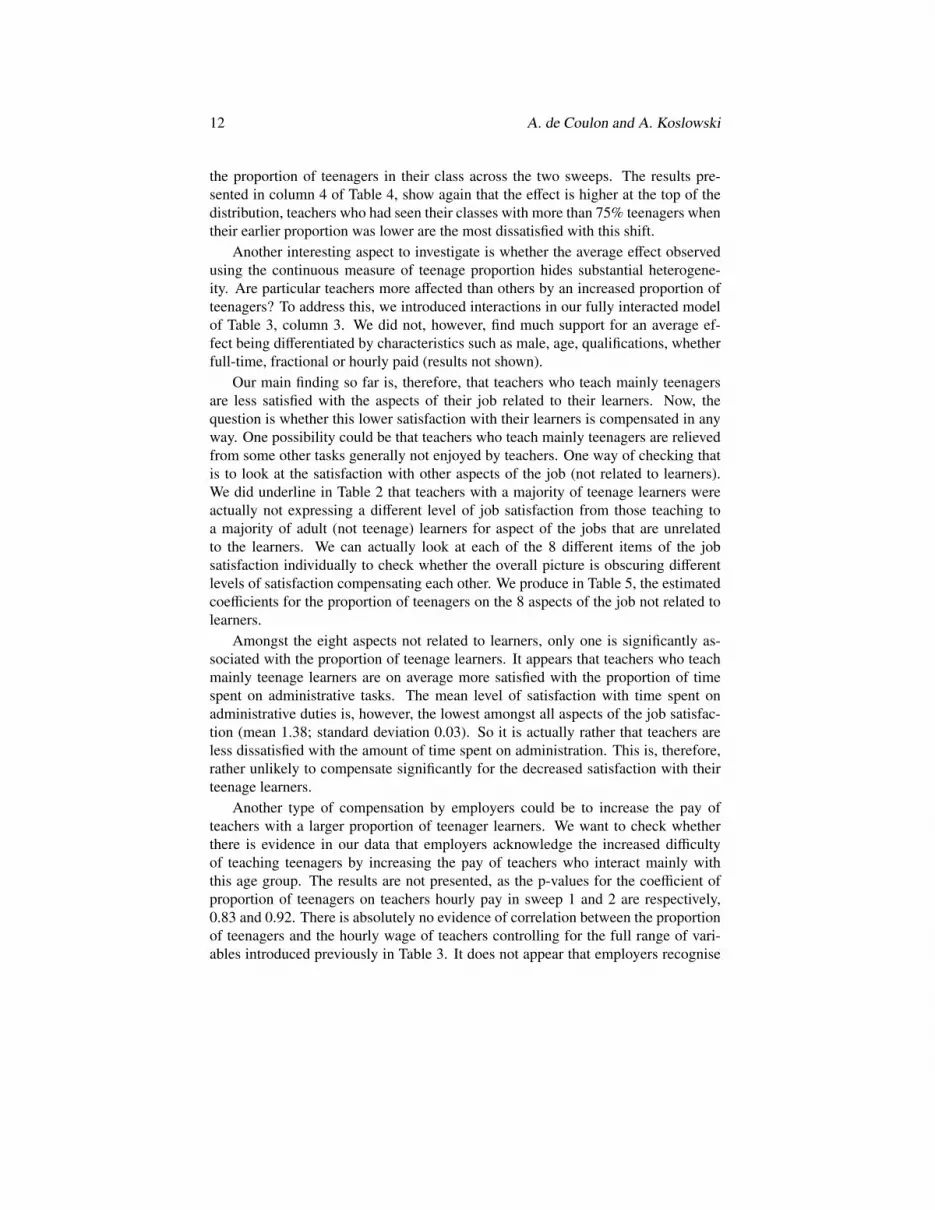
Amongst the eight aspects not related to learners, only one is significantly as-sociated with the proportion of teenage learners. It appears that teachers who teachmainly teenage learners are on average more satisfied with the proportion of timespent on administrative tasks. The mean level of satisfaction with time spent onadministrative duties is, however, the lowest amongst all aspects of the job satisfac-tion (mean 1.38; standard deviation 0.03). So it is actually rather that teachers areless dissatisfied with the amount of time spent on administration. This is, therefore,rather unlikely to compensate significantly for the decreased satisfaction with theirteenage learners.
Another type of compensation by employers could be to increase the pay ofteachers with a larger proportion of teenager learners. We want to check whetherthere is evidence in our data that employers acknowledge the increased difficultyof teaching teenagers by increasing the pay of teachers who interact mainly withthis age group. The results are not presented, as the p-values for the coefficient ofproportion of teenagers on teachers hourly pay in sweep 1 and 2 are respectively,0.83 and 0.92. There is absolutely no evidence of correlation between the proportionof teenagers and the hourly wage of teachers controlling for the full range of vari-ables introduced previously in Table 3. It does not appear that employers recognise

Teenage learners and teachers’ job satisfaction in vocational education 13
Table 5: Regressions of teenage learners proportion on teachers satisfaction withother aspect of the job
Job Time on Salary and Training Balancesecurity admin benefits and devlpt. work/life
Proportion -0.001 0.010** 0.002 -0.002 0.002of teenage (0.004) (0.004) (0.004) (0.004) (0.004)learners
N 1027 1027 1027 1027 1027Adjusted R2 0.169 0.021 0.019 0.030 0.053
Support/help resources Careerfrom managt. /facilities prospects
Proportion 0.003 0.002 0.001of teenage (0.005) (0.004) (0.004)learners
N 1027 1027 1027Adjusted R2 0.007 0.009 0.015
Note: All regressions include the same control variables as described for the second column of table 3.
the increased challenge faced by teachers with large proportions of teenage learnersthrough a pay increase for this group of teachers.
5. Conclusion
We unambiguously find that basic skills teachers, who predominantly teach teenagelearners, experience greater dissatisfaction with their job and that the difference ismostly accounted for by aspects of the job related to their learners. The range ofthis effect is very consistent across different specifications and allowing for a largenumber of potential confounders. Using two sweeps of our data set, we also intro-duced panel data analysis. By introducing a first differences (FD) estimation, wewere able to remove the potentially confounding effect of time constant heterogene-ity. To summarise our results, our estimates fall in the range of -0.013 to -0.023.Taking the middle of the range as reference, the interpretation is that an increase often percentage points of the proportion of teenage learners decreases the satisfactionof teachers by 0.18 on a scale of 0 to 12, with a mean of 9.3 (and a standard-deviationof 1.9). To take an example, this study predicts that the 7 per cent of teachers fac-ing exclusively teenage learners express a satisfaction level 1.8 points lower than the25 per cent of teachers working with classes containing no teenage learners. Thisamounts to around 100% of a standard deviation in teachers’ satisfaction with theirlearners.

14 A. de Coulon and A. Koslowski
We further checked whether there was any evidence that teachers are compen-sated when facing a larger proportion of teenage learners. We can unambiguouslyreject the assumption that better pay was offered to teachers facing extra numbersof teenagers. There was evidence that teachers with a larger proportion of teenagelearners experienced less dissatisfaction with the amount of time spent on adminis-tration. However, the dissatisfaction with the amount of time spent on administrationis so high for all teachers, that it is unlikely that the small decreased dissatisfactionfound for this group of teachers, will compensate the dissatisfaction accrued as aresult of a larger proportion of teenage learners.
Thus, both intrinsic and extrinsic motivational factors associated with job sat-isfaction are negatively associated with larger numbers of teenage learners. If thepaper were to inform policy makers, it would suggest that teachers’ turnover may beadversely affected by the increasing proportion of teenage learners. Also the impli-cations of our findings may be underestimated as the proportion of teenage learnersage 14 to 19 (and not just 16 to 19) in the Basic Skills sector in England has increasedsince the collection of the data sets. One problem associated with our conclusionsis that we do not have good measures of teachers’ quitting behaviours and how ourmeasures of job satisfaction might correlate. Our conclusion and recommendationshave, therefore, to be taken with care until further work directly addressing this linkis undertaken.
References
Angrist, J. & Krueger, A. (1999). Empirical strategies in labor economics. In O. Ashenfelter & D. Card(Eds.) Handbook of Labor Economics, Vol. 3A.Amsterdam: Elsevier.
Appleby, Y & Bathmaker, A.M. (2006). The new skills agenda: increased lifelong learning or new sitesof inequality?. British Educational Research Journal, 32 (5), 703-717.
Bathmaker, A. M. (2005). Achieving the Skills for Life adult basic skills targets in England. Paperpresented at the British Educational Research Association Conference, University of Glamorgan,15-17 September.
Billingsley, B. S. (1993). Teacher retention and attrition in special and general education: A criticalreview of the literature. Journal of Special Education, 27, 137-174.
Billingsley, B. S. (2004). Special education teacher retention and attrition: A critical analysis of theresearch literature. The Journal of Special Education, 38 (1), 39-55.
Brewer, D. J. (1996). Career paths and quit decisions: evidence from teaching. Journal of LaborEconomics, 14 (2), 313-339.
Comings, J. & Zachry. E. (2006). How do you teach content in adult education?. NCSALL OccasionalPaper, Harvard Graduate School of Education.
Clotfelter, C., Ladd, H., & Vigdor, J. (2006). Teacher-student matching and the assessment of teachereffectiveness. Journal of Human Resources, 41(4), 778-820.
Chevalier, A. & Dolton, P. (2005). The labour market for teachers. In S. Machin & A. Vignoles (Eds.)What’s the Worth of Education. NJ: Princeton University Press.
DFES. (2000). National standards for adult literacy and numeracy. Reference number NSALN.DFES. (2001). Skills for Life: The national strategy for improving adult literacy and numeracy skills.
Reference number SFLLN, Executive summary version. Retrieved August, 13, 2007 fromhttp://www.dfes.gov.uk/readwriteplus/publications.
DFES. (2003). Skills for Life teaching and qualifications framework: A user’s guide. Reference numberSFLTQG.

Teenage learners and teachers’ job satisfaction in vocational education 15
DFES. (2003). Skills for Life, the national strategy for improving adult literacy and numeracy skills:Focus on delivery to 2007. Reference number SFLNS2.
Figlio, D. N. (1997). Teacher salaries and teacher quality. Economics Letters, 55 (2), 267-271.Freeman, R. (1984). Longitudinal analysis of the effects of trade unions. Journal of Labor Economics,
2, 1-26.Griliches, Z. & Hausman, J. (1986). Errors in variables in panel data. Journal of Econometrics, 31 (1),
93-118.Goodlad, J. (1984). A place called school. New York: McGraw-Hill.Hanushek, E.A., Kain, J.F. & Rivkin, S.G. (2005). Teachers, schools, and academic achievement.
Econometrica, 73 (2), 417-458.Harell, P., Leavell, A., Van Tassll, F., & McKee, K. (2004). No teacher left behind: A five year study of
teacher attrition. Action in Teacher Education, 26(2), 46-59.Imazeki, J. (2005). Teacher salaries and teacher attrition. Economics of Education Review, 24 (4),
431-449.Ingersoll, R. M. (2001). Teacher turnover and teacher shortages: An organizational analysis. American
Education Research Journal, 38(3), 499-534.Johnson, S. M. (2004). Finders and keepers: Helping new teachers survive and thrive in our schools.
San Francisco: Jossey-Bass.Knight, C. C. & Sutton, R. E. (2004). Neo-Piagetian theory and research: enhancing pedagogical prac-
tice for educators of adults. London Review of Education, 2 (1), 47-60.Latham, N. I. & Vogt, W. P. (2007). Do professional development schools reduce teacher attrition?:
Evidence from a longitudinal study of 1,000 graduates. Journal of Teacher Education, 58 (2),153-167.
Liu, E., Kardos, S., Kauffman, D., Peske, H. & Johnson, S. M. (2000). Barely breaking even: In-centives, rewards, and the high costs of choosing to teach. Retrieved April 24, 2007 fromhttp://www.gse.harvard.edu/ ngt/Barely%20Breaking%20Even%200700.PDF.
LLUK. (2007). Skills for Life workforce data collection and analysis. Retrieved August 13, 2007 fromhttp://www.talent.ac.uk/news details.asp?NewsID=1103.
Lortie, D. (1975). Schoolteacher. Chicago: University of Chicago Press.Murnane, R. , Singer, J. D., Willet, J B., Kemple, J.J., Olsen, R. J. (1991). Who will teach? Policies that
matter. Cambridge, MA: Harvard University Press.Mont, D. & Rees, D. (1996). The influence of classroom characteristics on high school teacher turnover.
Economic Inquiry, 34 (1), 152-167.NAO (National Audit Office). (2004). Skills for Life: Improving adult literacy and numeracy. Retrieved
November 7, 2007 from http://www.nao.org.uk/publications/nao reports/04-05/040520.pdf.NAO (National Audit Office). (2008). Skills for Life: Progress in improving adult literacy and nu-
meracy. Retrieved November 7, 2007 from http://www.nao.org.uk/publications/nao reports/07-08/0708482.pdf.
NRDC. (2006). First report on the teachers study. Working Paper of the National Research and Devel-opment Centre for Adult Numeracy and Literacy, Institute of Education, University of London.
Smith, C. & Hofer, J. (2002). Pathways to change: A summary of findings from NCSALL’s staff
development study. Focus on Basics, 5 (D), 1-7.Stinebrickner, T. R. (1998). An empirical investigation of teacher attrition. Economics of Education
Review, 17 (2), 127-136.Stockard, J. & Lehman, M. B. (2004). Influences of the satisfaction and retention of 1st year teachers:
The importance of effective school management. Educational Administration Quarterly, 40 (5),742-771.
Voke, H. (2002). Understanding and responding to the teacher shortage. Association for Supervisionand Curriculum Development Infobrief, 29, 1-17.
Walker, J., Vignoles, A., & Collins, M. (2007). Higher education academic salaries in the UK. LondonSchool of Economics, Centre for Economics of Education Discussion Paper No. 75.
White, P., Gorard, S. & Huat See, B. (2006). What are the problems with teacher supply?. Teaching andTeacher Education, 22 (3), 315-326.

16 A. de Coulon and A. Koslowski
Appendix A
The National Qualifications Framework (for more information go to the QCA web-site at www.qca.org.uk)
Revised Level of General Vocationally OccupationalNQF from qualification relatedSeptember20047 5 higher level qualifications65 4 level 5 NVQ4 level 4 NVQ3 3 advanced A-levels and Vocational level 3 NVQ
AVCE qualifications2 2 GCSE level 2 NVQ
intermediate grade A* - C1 1 foundation GCSE level 1 NVQ
grade D - GEntry Entry levels
E1 to E3Pre-Entry Pre-Entry
levelsmilestones 1to 8

Teenage learners and teachers’ job satisfaction in vocational education 17
Appendix B
Judging by your experience in the last three months, how satisfied or dissatisfied areyou personally with each of these aspects of a teacher’s job?
Very Mainly Neither Mainly Verysatisfied satisfied satisfied nor dissatisfied dissatisfied
dissatisfied1. Learner behaviour2. Job security3. Learner progress andachievement4. Proportion of time onadministration5. Salary and related benefits6. Training and developmentopportunities7. Balance between work andpersonal life8. Support and help receivedfrom managers9. Appreciation of your workby learners10. Availability of resourcesand facilities11. Prospects for careeradvance
18 A. de Coulon and A. Koslowski
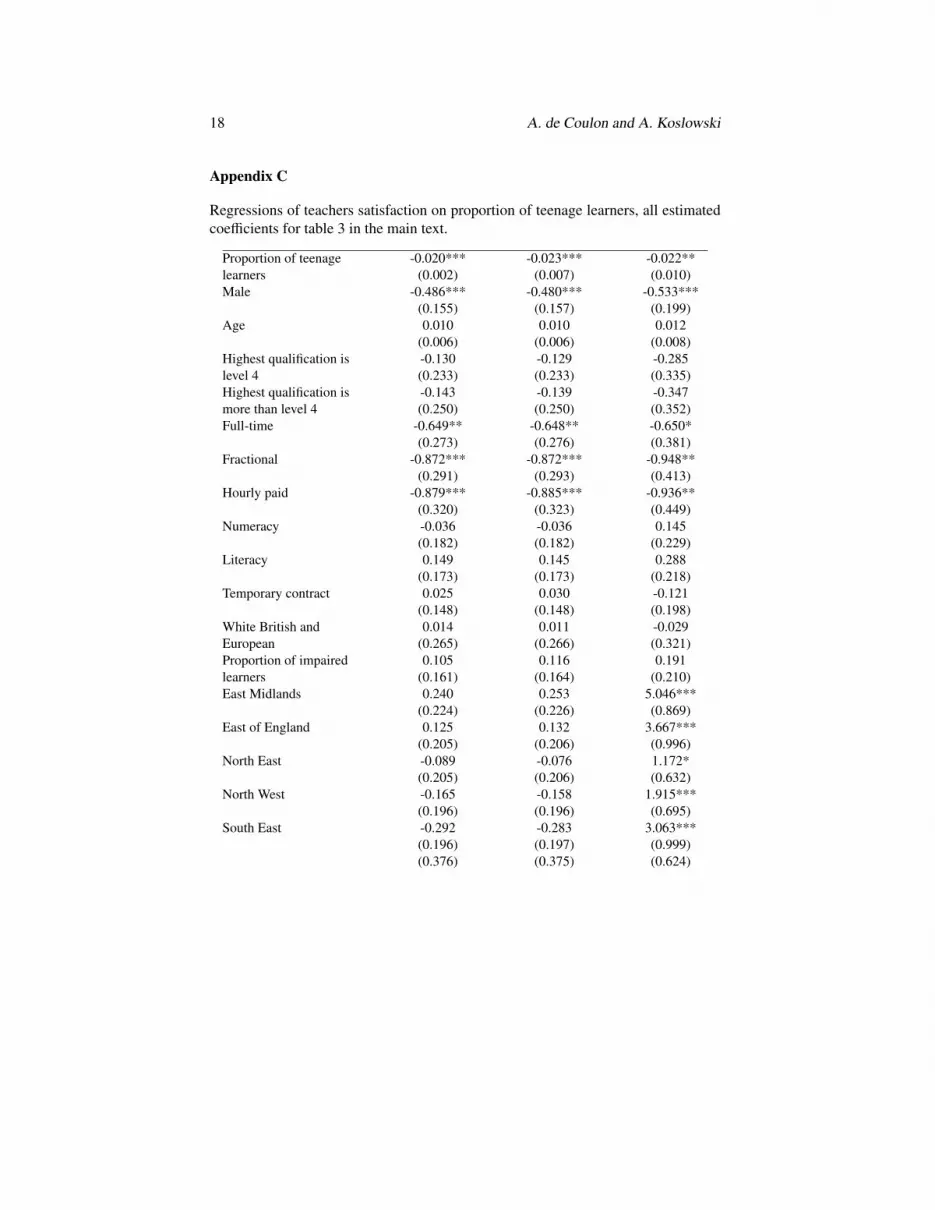
Appendix C
Regressions of teachers satisfaction on proportion of teenage learners, all estimatedcoefficients for table 3 in the main text.
Proportion of teenage -0.020*** -0.023*** -0.022**learners (0.002) (0.007) (0.010)Male -0.486*** -0.480*** -0.533***
(0.155) (0.157) (0.199)Age 0.010 0.010 0.012
(0.006) (0.006) (0.008)Highest qualification is -0.130 -0.129 -0.285level 4 (0.233) (0.233) (0.335)Highest qualification is -0.143 -0.139 -0.347more than level 4 (0.250) (0.250) (0.352)Full-time -0.649** -0.648** -0.650*
(0.273) (0.276) (0.381)Fractional -0.872*** -0.872*** -0.948**
(0.291) (0.293) (0.413)Hourly paid -0.879*** -0.885*** -0.936**
(0.320) (0.323) (0.449)Numeracy -0.036 -0.036 0.145
(0.182) (0.182) (0.229)Literacy 0.149 0.145 0.288
(0.173) (0.173) (0.218)Temporary contract 0.025 0.030 -0.121
(0.148) (0.148) (0.198)White British and 0.014 0.011 -0.029European (0.265) (0.266) (0.321)Proportion of impaired 0.105 0.116 0.191learners (0.161) (0.164) (0.210)East Midlands 0.240 0.253 5.046***
(0.224) (0.226) (0.869)East of England 0.125 0.132 3.667***
(0.205) (0.206) (0.996)North East -0.089 -0.076 1.172*
(0.205) (0.206) (0.632)North West -0.165 -0.158 1.915***
(0.196) (0.196) (0.695)South East -0.292 -0.283 3.063***
(0.196) (0.197) (0.999)(0.376) (0.375) (0.624)
Teenage learners and teachers’ job satisfaction in vocational education 19
South West 0.059 0.068 -0.555(0.285) (0.284) (0.560)
West Midlands 0.357 0.363* 2.174***(0.219) (0.218) (0.624)
Yorkshire and -0.331 -0.324 -0.783Humbersid (0.237) (0.239) (0.539)Missing region 1.096*** 1.093*** -0.043FE College 0.330* 0.338* -3.501***
(0.184) (0.186) (0.697)Adult Community 0.694*** 0.687*** -2.922***learning (0.206) (0.206) (0.802)Proportion of teenage 0.001 0.001learners squared/100 (0.001) (0.001)Organisation dummies yesN 1027 1027 1026R2 0.207 0.208 0.469Adjusted R2 0.188 0.188 0.229
Note: Figures in parenthesis are robust standard-errors.
Appendix D
Proportion of teenage learners taught by quartile
1st quartile 2nd quartile 3rd quartile 4th quartile(no teenage (1%<prop<10%) (11%<prop<75%) (prop>75%)
learners)Sweep 1 (1027 teachers)Average proportion of 0 5.3 42.7 92.8teenage learnersNumber of teachers 295 265 228 239
Sweep 2 (661 teachers)Average proportion of 0 5.4 42.5 91.7teenage learnersNumber of teachers 172 194 150 151


