Embed Size (px)
Citation preview
Page 1 of 97
Form RDSC-Sub (2011)
Technological Development of Speedway: A Review and Analysis
Natasha May Roberts
14095833
MSc by Research
In Collaboration with IMG
Thesis submitted in partial fulfilment
of the requirements of the award of
MA/MSc/LLM by Research
May 2016
Page 2 of 97
ABSTRACT
From the available literature it is clear that very little experimental testing
has been conducted on Speedway frames to date, yet investigations into
the physical parameters are fundamental if the sport is to continue to
progress technically. The literature suggests that additional investigations
into Speedway could provide a beneficial outcome to the sport and produce
an increase in the performance of the bike whilst keeping costs low.
A technology road map of Speedway was created to assess the technical
development of the sport since its establishment and determined the trend
in the mainstream popularity of the sport. Torsional and virtual testing was
carried out on the Speedway frame, determining key performance
parameters and behaviour characteristics of the frame and resulted in a
validated FEA model of the Speedway frame being developed.
The work reported here facilitates the potential for further development to
be undertaken on areas relating to Speedway and in particular the frame.
Whilst a validated FEA model was created, the design of the frame could
be further optimised to provide a beneficial performance outcome for
Speedway.

Page 3 of 97
To everyone that got me through this.
Firstly I would like to thank Dr Colin Bell, Dr Matt
Clarke and Adam Stevens for their constant support and
guidance throughout this project.
I would also like to thank Mike Hartman and all the
workshop staff at Oxford Brookes University for all their
help and assistance with the project.
Finally I would like to thank Torben Olsen and IMG for
the opportunity to complete this project and for all the
support provided.
Page 4 of 97
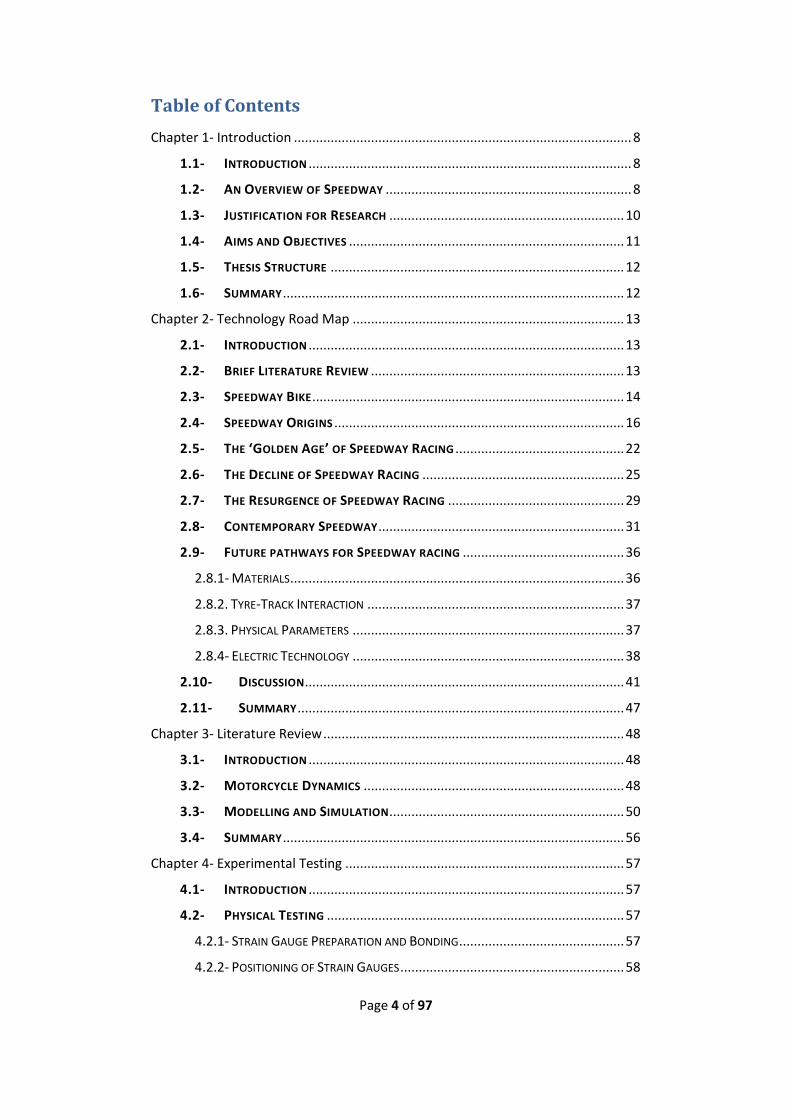
Table of Contents
Chapter 1- Introduction ............................................................................................ 8
1.1- INTRODUCTION ........................................................................................ 8
1.2- AN OVERVIEW OF SPEEDWAY ................................................................... 8
1.3- JUSTIFICATION FOR RESEARCH ................................................................ 10
1.4- AIMS AND OBJECTIVES ........................................................................... 11
1.5- THESIS STRUCTURE ................................................................................ 12
1.6- SUMMARY ............................................................................................. 12
Chapter 2- Technology Road Map .......................................................................... 13
2.1- INTRODUCTION ...................................................................................... 13
2.2- BRIEF LITERATURE REVIEW ..................................................................... 13
2.3- SPEEDWAY BIKE ..................................................................................... 14
2.4- SPEEDWAY ORIGINS ............................................................................... 16
2.5- THE ‘GOLDEN AGE’ OF SPEEDWAY RACING .............................................. 22
2.6- THE DECLINE OF SPEEDWAY RACING ....................................................... 25
2.7- THE RESURGENCE OF SPEEDWAY RACING ................................................ 29
2.8- CONTEMPORARY SPEEDWAY ................................................................... 31
2.9- FUTURE PATHWAYS FOR SPEEDWAY RACING ............................................ 36
2.8.1- MATERIALS ........................................................................................... 36
2.8.2. TYRE-TRACK INTERACTION ...................................................................... 37
2.8.3. PHYSICAL PARAMETERS .......................................................................... 37
2.8.4- ELECTRIC TECHNOLOGY .......................................................................... 38
2.10- DISCUSSION....................................................................................... 41
2.11- SUMMARY ......................................................................................... 47
Chapter 3- Literature Review .................................................................................. 48
3.1- INTRODUCTION ...................................................................................... 48
3.2- MOTORCYCLE DYNAMICS ....................................................................... 48
3.3- MODELLING AND SIMULATION ................................................................ 50
3.4- SUMMARY ............................................................................................. 56
Chapter 4- Experimental Testing ............................................................................ 57
4.1- INTRODUCTION ...................................................................................... 57
4.2- PHYSICAL TESTING ................................................................................. 57
4.2.1- STRAIN GAUGE PREPARATION AND BONDING ............................................. 57
4.2.2- POSITIONING OF STRAIN GAUGES ............................................................. 58
Page 5 of 97
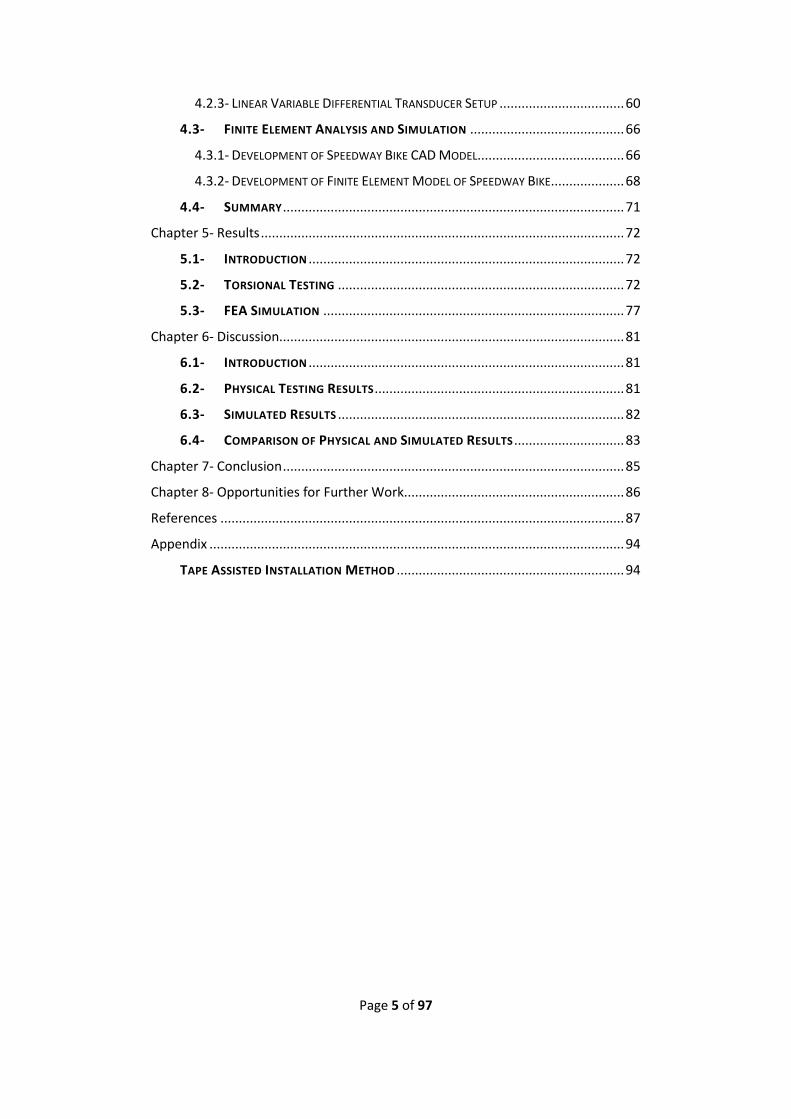
4.2.3- LINEAR VARIABLE DIFFERENTIAL TRANSDUCER SETUP .................................. 60
4.3- FINITE ELEMENT ANALYSIS AND SIMULATION .......................................... 66
4.3.1- DEVELOPMENT OF SPEEDWAY BIKE CAD MODEL........................................ 66
4.3.2- DEVELOPMENT OF FINITE ELEMENT MODEL OF SPEEDWAY BIKE .................... 68
4.4- SUMMARY ............................................................................................. 71
Chapter 5- Results ................................................................................................... 72
5.1- INTRODUCTION ...................................................................................... 72
5.2- TORSIONAL TESTING .............................................................................. 72
5.3- FEA SIMULATION .................................................................................. 77
Chapter 6- Discussion.............................................................................................. 81
6.1- INTRODUCTION ...................................................................................... 81
6.2- PHYSICAL TESTING RESULTS .................................................................... 81
6.3- SIMULATED RESULTS .............................................................................. 82
6.4- COMPARISON OF PHYSICAL AND SIMULATED RESULTS .............................. 83
Chapter 7- Conclusion ............................................................................................. 85
Chapter 8- Opportunities for Further Work............................................................ 86
References .............................................................................................................. 87
Appendix ................................................................................................................. 94
TAPE ASSISTED INSTALLATION METHOD .............................................................. 94
Page 6 of 97
Figure 1- Speedway track layout at British round of the Speedway GP held at Millennium Stadium, Cardiff ........................................................................... 14
Figure 2 - Annotated diagram of standard Speedway motorcycle (Speedway GP, 2015) ......................................................................................... 15
Figure 3- Leading Link Suspension System (Speedway GB, 2005) ............ 15
Figure 4- A Speedway rider showing the art of broadsiding (The Riders Digest, 2013)......................................................................................................... 16
Figure 5- 1929 Douglas DT5 (Black Country Biker, 2010) ............................ 18
Figure 6- 1928 Rudge Speedway Bike (Paternoster, 2009) .......................... 18
Figure 7- Trailing Leg and Foot Forward Riding Styles (Defunct Speedway, 2005) ...................................................................................................................... 20
Figure 8- 1939 JAP Engine Speedway bike with a Martin Cornerford Chassis (Newcastle Speedway, 2005) ............................................................. 23
Figure 9- 1949 JAP Speedway Bike (Vintage Motorcycles, 2013) ............... 24
Figure 10- Cutaway drawing of JAWA's new 85 x 87mm 4 valve Speedway engine (Motorcycle Weekly, 1982) .................................................................... 28
Figure 11- JAWA 894 and 895 engine designs (Motorcycle on paper, 2012)
................................................................................................................................ 29
Figure 12- Wall Phillips Laydown Bike (Speedway Forum, 2009) ................ 33
Figure 13- Current Speedway bike showing the use of a dirt deflector (Monster Energy SWC, 2014) ............................................................................ 34
Figure 14- Electric Speedway Bike (Eliseo Hummer, 2012) ......................... 35
Figure 15- Technology roadmap of Speedway showing the potential future pathways ................................................................................................................ 40
Figure 16- Flow Chart highlighting a trend within Speedway ........................ 42
Figure 17- Popularity trend of Speedway since its establishment in 1928 .. 46
Figure 18- 11 Degree of Freedom Motorcycle Model (Cossalter, 2002) ..... 52
Figure 19- Root locus plot in steady state cornering with varying speed (Cossalter, 2002) .................................................................................................. 53
Figure 20- Stability of out of plane mode in straight running and in cornering (Cossalter, 2002) .................................................................................................. 54
Figure 21- Strain Gauge Bonded to the Test Specimen ................................ 58
Figure 22- Speedway Main Frame with Strain Gauges ................................. 58
Figure 23- Speedway Sub-Frame with Strain Gauges ................................... 58
Page 7 of 97
Figure 24- Speedway mainframe and sub-frame assembled on the test bed ................................................................................................................................ 59
Figure 25- Calibration Equipment ...................................................................... 61
Figure 26- Voltage against Displacement for the LVDT's .............................. 63
Figure 27- Torsion Test Rig ................................................................................ 65
Figure 28- CAD of Speedway Frame ................................................................ 67
Figure 29- Alternative angle of Speedway bike CAD model ......................... 67
Figure 30- FEA model of Speedway bike ......................................................... 69
Figure 31- Close up image of meshing of FEA model .................................... 69
Figure 32- Cylindrical extrusion attached to the front wheel spindle ............ 70
Figure 33- Fixed geometry applied to the rear of the frame .......................... 71
Figure 34- Principal Strain values in line with the strain axis ........................ 73
Figure 35- Principal Strains at 90 degrees to the strain axis ......................... 73
Figure 36- Displacement against Torque for the LVDT's ............................... 74
Figure 37- Torque vs Twist Uncalibrated .......................................................... 75
Figure 38- Torque vs Twist Calibrated .............................................................. 75
Figure 39- Deformation of the Frame at 100Nm- Top and Side View ......... 77
Figure 40- Deformation of the frame at 100Nm- Front and rear view .......... 78
Figure 41- Resultant torque value for FEA simulation at maximum rotational displacement ......................................................................................................... 79
Figure 42- Comparison between FEA and physical testing results .............. 80
Page 8 of 97
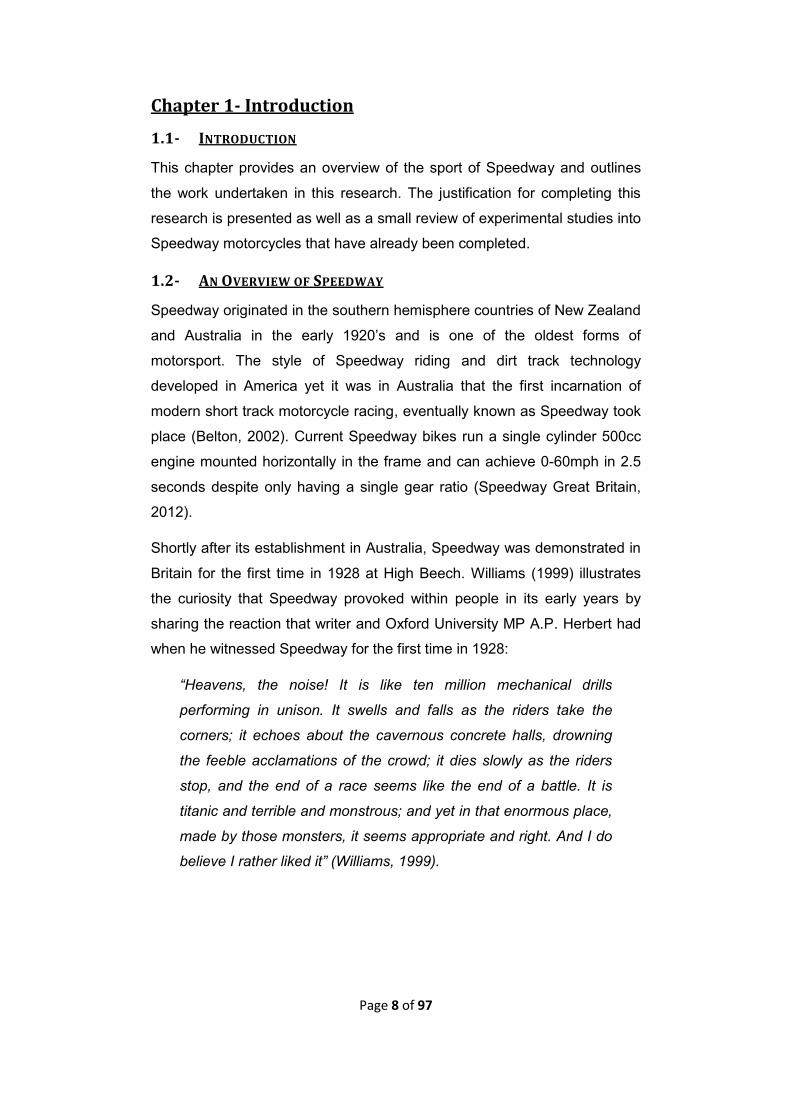
Chapter 1- Introduction
1.1- INTRODUCTION
This chapter provides an overview of the sport of Speedway and outlines
the work undertaken in this research. The justification for completing this
research is presented as well as a small review of experimental studies into
Speedway motorcycles that have already been completed.
1.2- AN OVERVIEW OF SPEEDWAY
Speedway originated in the southern hemisphere countries of New Zealand
and Australia in the early 1920’s and is one of the oldest forms of
motorsport. The style of Speedway riding and dirt track technology
developed in America yet it was in Australia that the first incarnation of
modern short track motorcycle racing, eventually known as Speedway took
place (Belton, 2002). Current Speedway bikes run a single cylinder 500cc
engine mounted horizontally in the frame and can achieve 0-60mph in 2.5
seconds despite only having a single gear ratio (Speedway Great Britain,
2012).
Shortly after its establishment in Australia, Speedway was demonstrated in
Britain for the first time in 1928 at High Beech. Williams (1999) illustrates
the curiosity that Speedway provoked within people in its early years by
sharing the reaction that writer and Oxford University MP A.P. Herbert had
when he witnessed Speedway for the first time in 1928:
“Heavens, the noise! It is like ten million mechanical drills
performing in unison. It swells and falls as the riders take the
corners; it echoes about the cavernous concrete halls, drowning
the feeble acclamations of the crowd; it dies slowly as the riders
stop, and the end of a race seems like the end of a battle. It is
titanic and terrible and monstrous; and yet in that enormous place,
made by those monsters, it seems appropriate and right. And I do
believe I rather liked it” (Williams, 1999).
Page 9 of 97
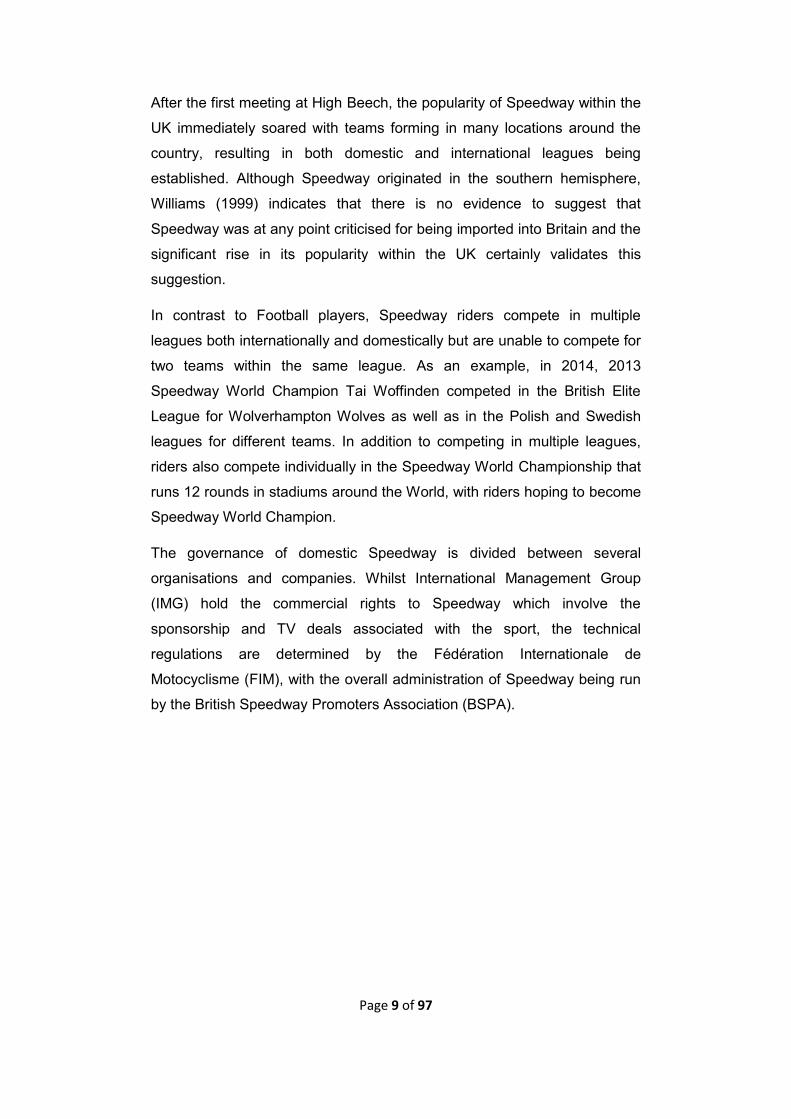
After the first meeting at High Beech, the popularity of Speedway within the
UK immediately soared with teams forming in many locations around the
country, resulting in both domestic and international leagues being
established. Although Speedway originated in the southern hemisphere,
Williams (1999) indicates that there is no evidence to suggest that
Speedway was at any point criticised for being imported into Britain and the
significant rise in its popularity within the UK certainly validates this
suggestion.
In contrast to Football players, Speedway riders compete in multiple
leagues both internationally and domestically but are unable to compete for
two teams within the same league. As an example, in 2014, 2013
Speedway World Champion Tai Woffinden competed in the British Elite
League for Wolverhampton Wolves as well as in the Polish and Swedish
leagues for different teams. In addition to competing in multiple leagues,
riders also compete individually in the Speedway World Championship that
runs 12 rounds in stadiums around the World, with riders hoping to become
Speedway World Champion.
The governance of domestic Speedway is divided between several
organisations and companies. Whilst International Management Group
(IMG) hold the commercial rights to Speedway which involve the
sponsorship and TV deals associated with the sport, the technical
regulations are determined by the Fédération Internationale de
Motocyclisme (FIM), with the overall administration of Speedway being run
by the British Speedway Promoters Association (BSPA).
Page 10 of 97
1.3- JUSTIFICATION FOR RESEARCH
Belton (2002) suggests that the limited nature of the Speedway market
deterred many manufacturers from building new Speedway bikes. The
hope throughout the majority of the history of Speedway is that either
Japan or the USA would invent something that would spike an upward turn
in the prosperity of Speedway (Williams, 1999). This perception of
Speedway racing has also influenced the amount of research that has been
completed on the sport to date. Technical papers on Speedway racing are
few with the majority of knowledge about Speedway being held by people
who have been involved in the sport since a young age.
One such research into Speedway bikes was conducted by Nick Goozee
between 2005 and 2008 and presented by Wagstaff (2011). Goozee and a
small group of employees from Penske cars worked with former Speedway
World Champion Tony Rickardsson to design and manufacture an
improved frame design. They determined that current Speedway frames
are particularly weak in the rear sub frame and around the headstock. Tony
Rickardsson confirmed that Speedway bikes tend to ‘shimmy’ with a series
of vibrations when they hit a rut on the track, which is particularly noticeable
on the start/finish line and into the first corner (Wagstaff, 2011). The
outcome of the research was a specially designed frame that was rigid
enough not to ‘shimmy’ but still flexible enough to give the rider a sense of
feel. Although the frame produced a significant increase in the performance
of the bike, the final manufactured frame was approximately 4 times more
expensive than current frames and as a result never entered into serial
production (Wagstaff, 2011). Nick Goozee summarises in the article the
reason behind this as that “Speedway does everything for cost” and whilst
the final design had the potential to revolutionise the sport, the cost would
have been too extreme for the sport to sustain financially (Wagstaff, 2011).
Whilst this design never entered put into production, the nature of the
research suggests that additional investigations into Speedway
technologies could provide a beneficial outcome to the sport and that the
technology currently in operation has the potential to be improved to
produce an increase in the performance of the bike, whilst keeping costs
low.
Page 11 of 97
1.4- AIMS AND OBJECTIVES
Overall Aim
The overall aim of the project is to document the evolution and
development of Speedway technology and with the use of physical testing
and simulation develop a validated CAD and FEA model of a Speedway
motorcycle frame.
Objectives
Conduct a comprehensive review of relevant literature related to
Speedway
Produce a technology roadmap that documents the evolution of
Speedway
Determine trends in the popularity of Speedway and suggest
possible future advancements
Design a test rig and experiment that can be used to determine the
physical properties of a Speedway frame
Conduct physical testing on a Speedway frame to determine its
physical parameters
Produce a CAD model to determine the relevant properties of the
current Speedway frame to validate the FEA model
Develop a validated FEA model of the Speedway bike using results
obtained from physical testing

Page 12 of 97
1.5- THESIS STRUCTURE
The remainder of this research thesis will follow the subsequent structure.
Chapter 2 documents the technical and business evolutions of Speedway
and a technology road map is presented, which project the future possible
pathways for the sport. The literature reviewed in Chapter 2 does not
provide insight into the technical characteristics of Speedway motorcycles
hence an extensive literature review on areas relating to Speedway such as
motorcycle dynamics is presented in Chapter 3. The methodology used
during physical testing and the development of the CAD and FE models is
given in Chapter 4 with the results presented in Chapter 5 and compared
and discussed in Chapter 6.
1.6- SUMMARY
Speedway is one of the oldest forms of motorsport in the world yet extent of
the research into the motorcycles performance and underlying dynamics is
minimal. Previous research suggests that there is a requirement for further
work to be undertaken to progress the sport forwards and to prevent it from
stagnating. The aim of this research project is to document the evolution
and development of Speedway technology and with the use of physical
testing and simulation develop a validated FEA model. The experimental
methodology for physical testing and simulation is outlined in Chapter 4
with the results and discussion presented in Chapters 5 and 6 respectively.
Page 13 of 97
Chapter 2- Technology Road Map
2.1- INTRODUCTION
In this Chapter, a documentation of the technical and business evolution of
Speedway is provided and an assessment on their effect on the
mainstream popularity of the sport to date. In addition to this, a technology
road map of Speedway is presented that shows the potential future
pathways for the sport.
2.2- BRIEF LITERATURE REVIEW
Technology road mapping is a planning process that simultaneously
considers markets, products, technologies as well as research and
development. The popularity of road mapping within industry is rapidly
increasing as it helps to predict a markets future technologies based on
product trends and consumer needs (Technology Commercialisation,
2015). Brindle (2013) explains that road maps define technology pathways
showing how incremental innovations happening in parallel add up to new
technologies and products in the future. Roadmaps heavily focus on the
future pathways for the product and assess how different potential
pathways are likely to affect the success of a market or product.
The success of future products and technologies is explained by the
Diffusion of Innovation Theory which explains at what rate new ideas and
technologies spread through a specific population and why. The theory
does not take into account the social support to adopt the new idea and
Rogers (2003) explains that failed diffusion does not necessarily mean that
the technology or product was not adopted by anyone but rather that full
diffusion was not achieved due to either competition from other products or
a lack of awareness of the product.
Page 14 of 97
2.3- SPEEDWAY BIKE
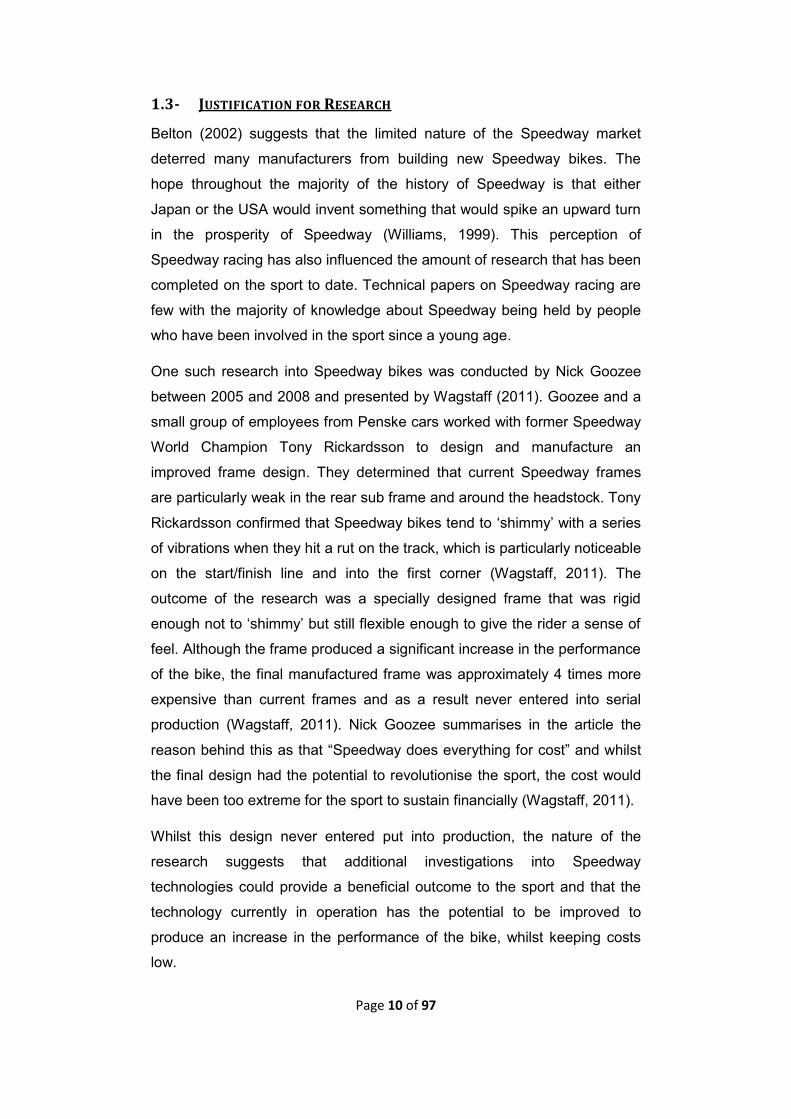
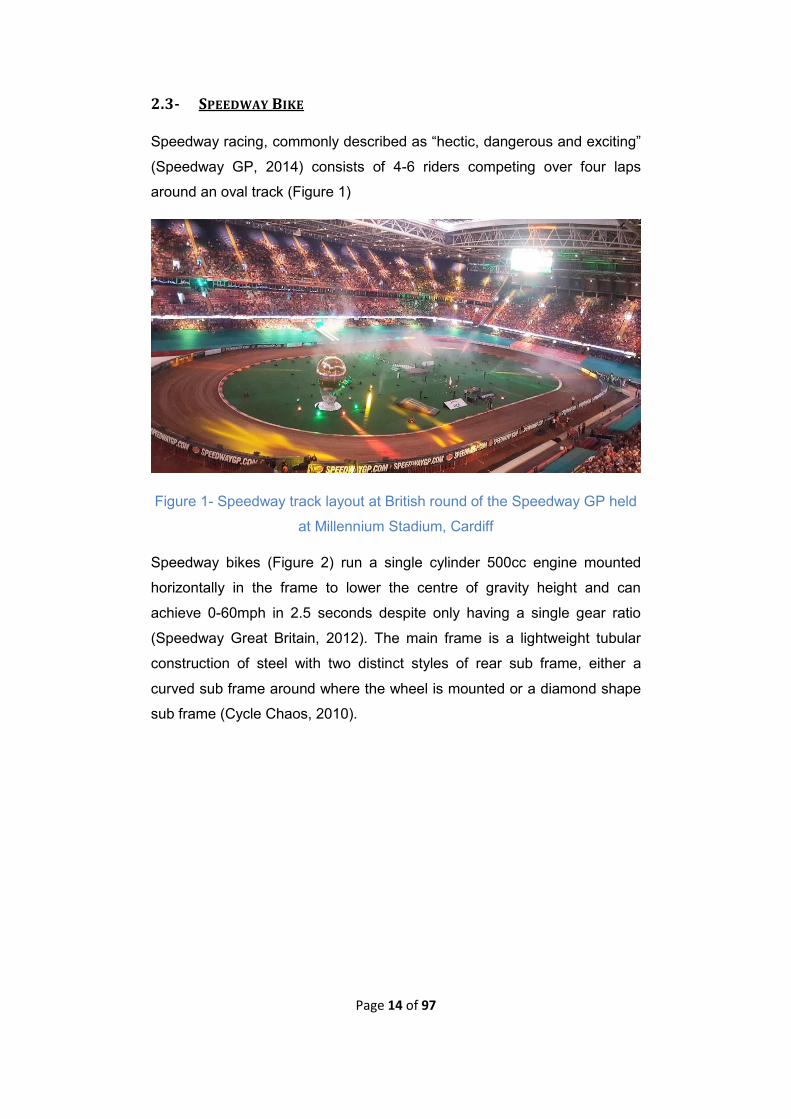
Speedway racing, commonly described as “hectic, dangerous and exciting”
(Speedway GP, 2014) consists of 4-6 riders competing over four laps
around an oval track (Figure 1)
Figure 1- Speedway track layout at British round of the Speedway GP held
at Millennium Stadium, Cardiff
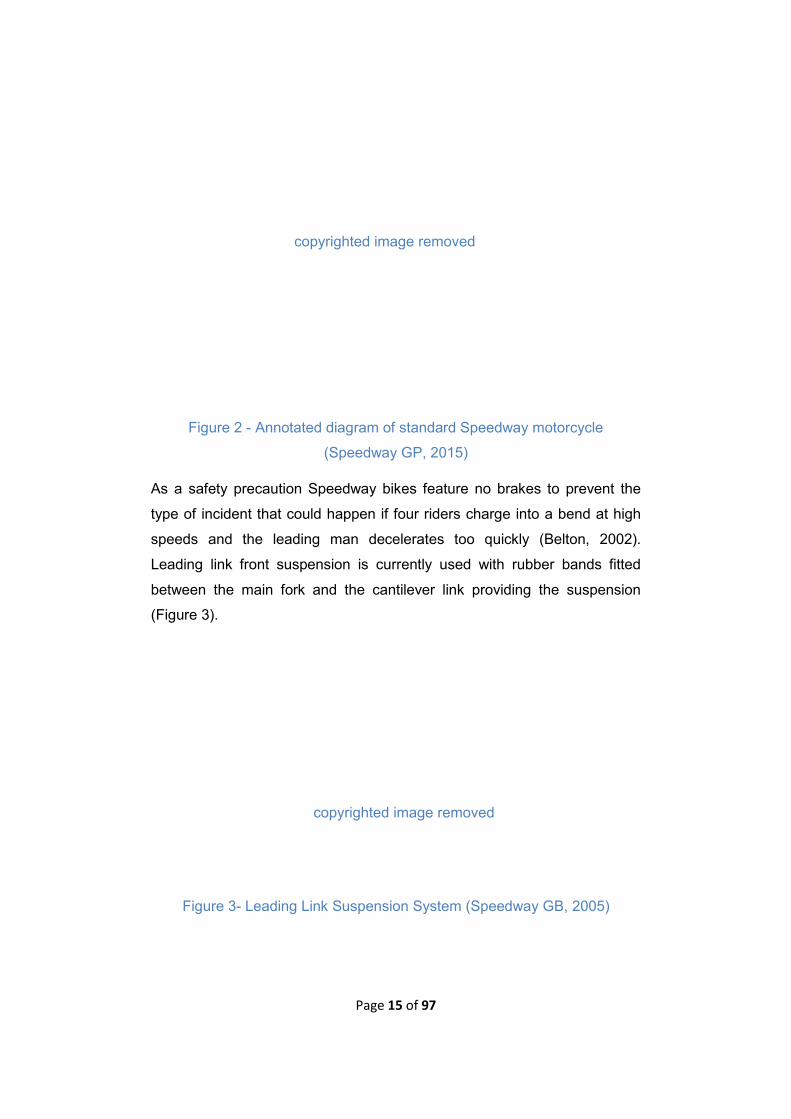
Speedway bikes (Figure 2) run a single cylinder 500cc engine mounted
horizontally in the frame to lower the centre of gravity height and can
achieve 0-60mph in 2.5 seconds despite only having a single gear ratio
(Speedway Great Britain, 2012). The main frame is a lightweight tubular
construction of steel with two distinct styles of rear sub frame, either a
curved sub frame around where the wheel is mounted or a diamond shape
sub frame (Cycle Chaos, 2010).
Page 15 of 97
Figure 2 - Annotated diagram of standard Speedway motorcycle
(Speedway GP, 2015)
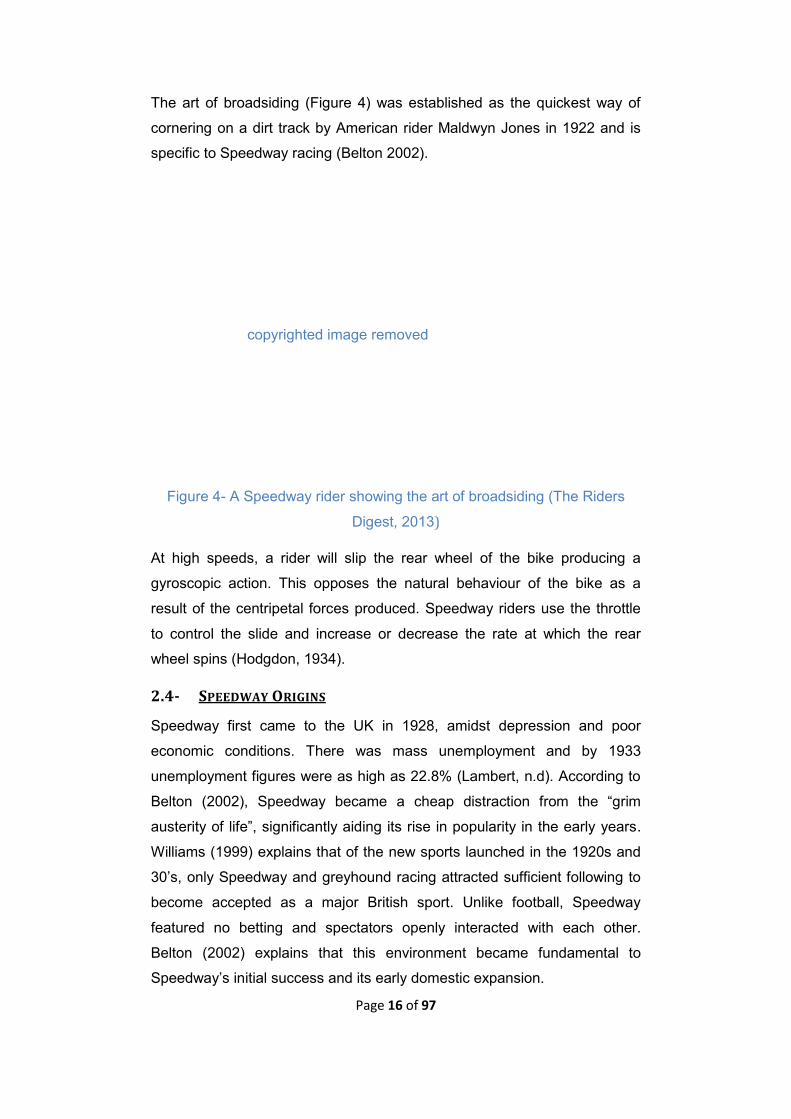
As a safety precaution Speedway bikes feature no brakes to prevent the
type of incident that could happen if four riders charge into a bend at high
speeds and the leading man decelerates too quickly (Belton, 2002).
Leading link front suspension is currently used with rubber bands fitted
between the main fork and the cantilever link providing the suspension
(Figure 3).
Figure 3- Leading Link Suspension System (Speedway GB, 2005)
copyrighted image removed
copyrighted image removed
Page 16 of 97
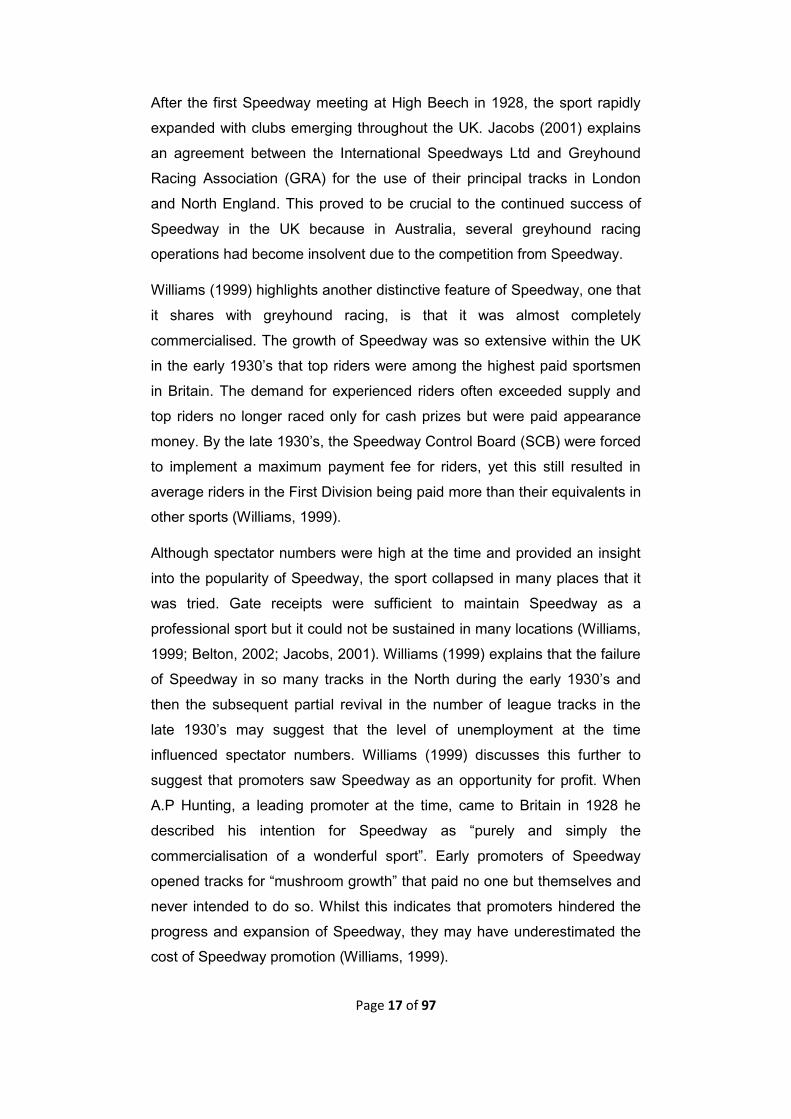
The art of broadsiding (Figure 4) was established as the quickest way of
cornering on a dirt track by American rider Maldwyn Jones in 1922 and is
specific to Speedway racing (Belton 2002).
Figure 4- A Speedway rider showing the art of broadsiding (The Riders
Digest, 2013)
At high speeds, a rider will slip the rear wheel of the bike producing a
gyroscopic action. This opposes the natural behaviour of the bike as a
result of the centripetal forces produced. Speedway riders use the throttle
to control the slide and increase or decrease the rate at which the rear
wheel spins (Hodgdon, 1934).
2.4- SPEEDWAY ORIGINS
Speedway first came to the UK in 1928, amidst depression and poor
economic conditions. There was mass unemployment and by 1933
unemployment figures were as high as 22.8% (Lambert, n.d). According to
Belton (2002), Speedway became a cheap distraction from the “grim
austerity of life”, significantly aiding its rise in popularity in the early years.
Williams (1999) explains that of the new sports launched in the 1920s and
30’s, only Speedway and greyhound racing attracted sufficient following to
become accepted as a major British sport. Unlike football, Speedway
featured no betting and spectators openly interacted with each other.
Belton (2002) explains that this environment became fundamental to
Speedway’s initial success and its early domestic expansion.
copyrighted image removed
Page 17 of 97
After the first Speedway meeting at High Beech in 1928, the sport rapidly
expanded with clubs emerging throughout the UK. Jacobs (2001) explains
an agreement between the International Speedways Ltd and Greyhound
Racing Association (GRA) for the use of their principal tracks in London
and North England. This proved to be crucial to the continued success of
Speedway in the UK because in Australia, several greyhound racing
operations had become insolvent due to the competition from Speedway.
Williams (1999) highlights another distinctive feature of Speedway, one that
it shares with greyhound racing, is that it was almost completely
commercialised. The growth of Speedway was so extensive within the UK
in the early 1930’s that top riders were among the highest paid sportsmen
in Britain. The demand for experienced riders often exceeded supply and
top riders no longer raced only for cash prizes but were paid appearance
money. By the late 1930’s, the Speedway Control Board (SCB) were forced
to implement a maximum payment fee for riders, yet this still resulted in
average riders in the First Division being paid more than their equivalents in
other sports (Williams, 1999).
Although spectator numbers were high at the time and provided an insight
into the popularity of Speedway, the sport collapsed in many places that it
was tried. Gate receipts were sufficient to maintain Speedway as a
professional sport but it could not be sustained in many locations (Williams,
1999; Belton, 2002; Jacobs, 2001). Williams (1999) explains that the failure
of Speedway in so many tracks in the North during the early 1930’s and
then the subsequent partial revival in the number of league tracks in the
late 1930’s may suggest that the level of unemployment at the time
influenced spectator numbers. Williams (1999) discusses this further to
suggest that promoters saw Speedway as an opportunity for profit. When
A.P Hunting, a leading promoter at the time, came to Britain in 1928 he
described his intention for Speedway as “purely and simply the
commercialisation of a wonderful sport”. Early promoters of Speedway
opened tracks for “mushroom growth” that paid no one but themselves and
never intended to do so. Whilst this indicates that promoters hindered the
progress and expansion of Speedway, they may have underestimated the
cost of Speedway promotion (Williams, 1999).

Page 18 of 97
At the time of domestic expansion within the UK, there was also a surge in
the technical development of Speedway bikes. Initially there was no
specifically designed Speedway bikes, with riders instead competing on
stripped down road bikes that were tuned for racing on loose dirt. The
Douglas (Figure 5) and Rudge (Figure 6) were the most popular bikes yet
varied significantly in design and favoured different riding styles.
Figure 5- 1929 Douglas DT5 (Black Country Biker, 2010)
Figure 6- 1928 Rudge Speedway Bike (Paternoster, 2009)
copyrighted image removed
copyrighted image removed
Page 19 of 97
The power output of the Douglas was characteristically steady and
consistent due to the bikes lower centre of gravity, resulting in it being
easier to steer and broadside (Dropbears, 1997). The Douglas (Figure 5)
had a noticeably longer wheelbase base than the Rudge (Figure 6) as a
result of the flat twin cylinder engine that was horizontally mounted within
the frame. Early flat twin engines were arranged with the cylinders on
opposite sides of the crankshaft, i.e. in line with the frame, which later
became known was the boxer twin crank configuration. This caused
uneven cooling of the cylinders and required the motorcycle to have a
longer wheelbase to provide sufficient cooling. In this configuration, the
primary force generated by one piston counteracts that generated by the
other at all times, resulting in excellent primary engine balance in a 4 stroke
cycle regardless of the number of cylinders (Hanlon, 2007). The Douglas
was described by many as being able to “look fast even when standing still”
and was possibly the first specifically designed Speedway machine
(Dropbears, 1997).
In contrast to the Douglas, the Rudge (Figure 6) featured a 4-valve single
cylinder engine mounted vertically upright within the frame. It had a
considerably shorter wheelbase compared to the Douglas, making it faster
over a single lap and easier to maintain (Newcastle Speedway, 2005). The
Rudge is noticeably taller than the Douglas as the frame needs to be high
enough above the engine to allow the cylinder heads to have sufficient
banking clearance. This also raises the centre of mass position of the bike,
affecting the handling characteristics of the bike. Although both the Rudge
and Douglas were competitive, the variations in design resulted in them
being suited to different riding styles. The long wheelbase of the Douglas
was the choice of bike for the leg-trailing riders whilst the shorter Rudge
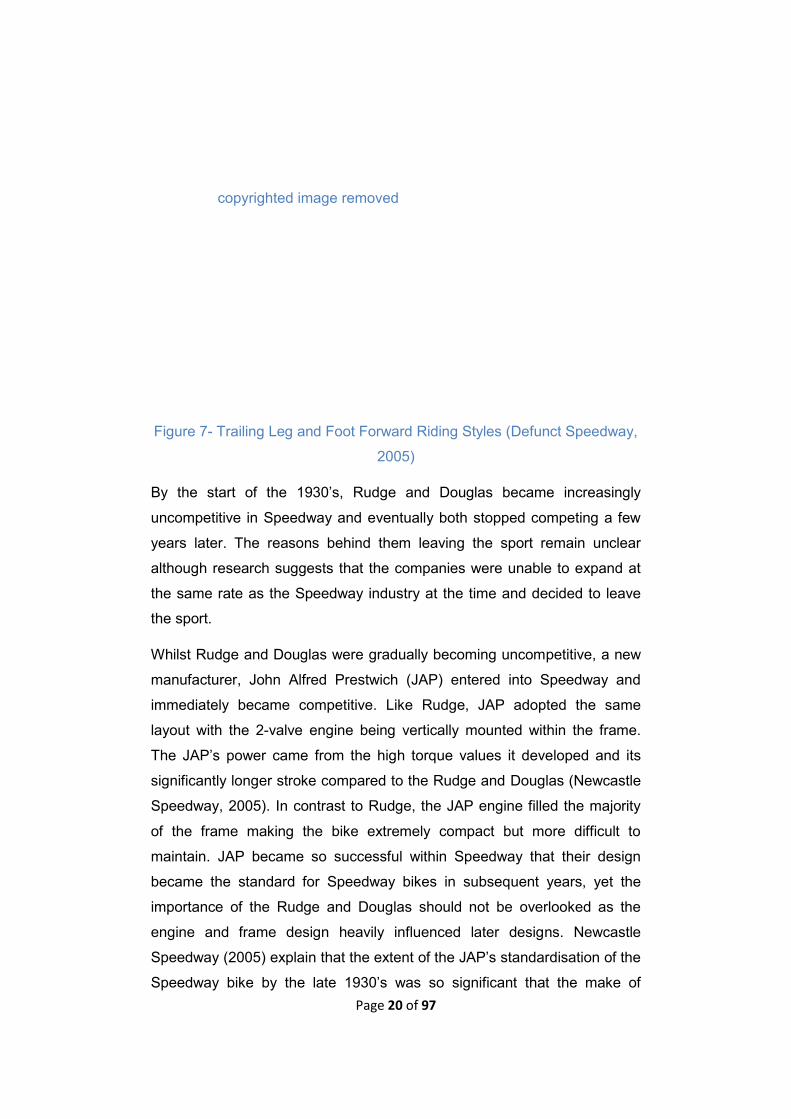
wheelbase suited the foot forward riding style (Figure 7).
Page 20 of 97
Figure 7- Trailing Leg and Foot Forward Riding Styles (Defunct Speedway,
2005)
By the start of the 1930’s, Rudge and Douglas became increasingly
uncompetitive in Speedway and eventually both stopped competing a few
years later. The reasons behind them leaving the sport remain unclear
although research suggests that the companies were unable to expand at
the same rate as the Speedway industry at the time and decided to leave
the sport.
Whilst Rudge and Douglas were gradually becoming uncompetitive, a new
manufacturer, John Alfred Prestwich (JAP) entered into Speedway and
immediately became competitive. Like Rudge, JAP adopted the same
layout with the 2-valve engine being vertically mounted within the frame.
The JAP’s power came from the high torque values it developed and its
significantly longer stroke compared to the Rudge and Douglas (Newcastle
Speedway, 2005). In contrast to Rudge, the JAP engine filled the majority
of the frame making the bike extremely compact but more difficult to
maintain. JAP became so successful within Speedway that their design
became the standard for Speedway bikes in subsequent years, yet the
importance of the Rudge and Douglas should not be overlooked as the
engine and frame design heavily influenced later designs. Newcastle
Speedway (2005) explain that the extent of the JAP’s standardisation of the
Speedway bike by the late 1930’s was so significant that the make of
copyrighted image removed

Page 21 of 97
machine was no longer listed in the event programme or even discussed
during the race meetings.
As the JAP bike continued to develop and dominate Speedway, several
modifications were implemented to improve the reliability of the machine
and to aid the riders in the transportation between events. Belton (2002)
suggests that the changes made to the bikes were subtle, taking place over
many years and were usually adaptions of the original model to
accommodate changing tracks and technology. As Speedway bikes
continued to evolve in the mid 1930’s, the gearbox was maintained but
intermediate gear pinions used previously by Douglas were removed,
resulting in the option of a single gear. The gear ratio was altered using the
sprocket on the countershaft yet most riders changed either the rear wheel
sprocket or the engine sprocket (Belton, 2002).
Further modifications were brought in to aid riders’ performance at a wider
variety of tracks and to further accommodate individual riding styles. The
rear spindle slots were lengthened to enable the wheelbase to be changed
to suit a specific circuit, an arrangement that is still used today (Newcastle
Speedway, 2005). Frames were manufactured with the headstock set
round because they twisted during riding and riders find that the bike
handled better when they were bent (Newcastle Speedway, 2005).
In spite of the developments to the bikes technology, the most significant
technical advancement during this time was the establishment of the first
engine test procedure created by JAP in 1931 (Speedway Forum, 2005). At
this time, standardised engine testing was not done in any other form of
motorsport, demonstrating that at this moment in time, Speedway was at
the forefront of technology and would have set the standard for engine
testing in other forms of motorsport.
Speedway bikes became significantly quicker throughout the 1930’s,
causing a significant rise in the number of false starts at race meetings. To
prevent Speedway attendances declining, electric starting gates were
demonstrated for the first time in a competitive Speedway race in 1933 as a
replacement for the rolling start. The trial was so successful that the
Speedway Control Board made the use of an electric start gate compulsory
for all tracks in 1934 (Jacobs, 2001). Belton (2002) suggests that the
Page 22 of 97
introduction of a starting gate, which is still in operation today, prevented
spectators becoming disengaged with the sport, with many of them
becoming irritated at the high number of false starts.
The technology advancements made by JAP during the 1930’s allowed
Speedway to continue to expand domestically as it encouraged an
increased involvement in the sport. Such was the domestic success of
Speedway it soon expanded internationally and became fully established in
many countries by the mid 1930’s. By 1936, many European countries such
as Poland, Sweden and Denmark were hosting events yet league racing
was not established in Poland and Sweden until 1948 and as late as 1970
in Denmark.
2.5- THE ‘GOLDEN AGE’ OF SPEEDWAY RACING
By the late 1930’s, Speedway was thriving within the UK as teams
continued to emerge. Speedway stopped hosting race meetings in 1939, as
both riders and promoters became involved in the war effort. In contrast to
football, which continued to operate as normal during the war, Speedway
largely disappeared, yet when it returned it became arguably the most
popular sport at the time (Dalling, 2011).
Fully competitive Speedway returned to Britain on 22nd April 1946 and with
attendance figures at race meetings comparable to that of football matches,
Speedway gained a “position of honour” within British sporting life at the
time (Dalling, 2011). Recordings of capacity attendances became regular
and crowd restrictions were required at several London clubs in order to
ensure the safety of spectators, riders and support staff (Belton, 2002).
Several leading social commentators at the time acknowledged
Speedway’s importance in post war society with Richard Hoggart (1957)
describing Speedway riders as on par with footballers and boxers as the
“true working class heroes” of the era. Dalling (2011) describes
Speedway’s brief period of glory in the years immediately following the
Second World War as a phenomenon. The reasons behind the sports
unprecedented popularity in the late 1940’s lie in the defining factors behind
Speedway as a sport. In contrast to football and rugby, Speedway fostered
a real sense of community and togetherness, which people needed after
the war (Dalling, 2011).
Page 23 of 97
When competitive Speedway returned to the UK, it felt like nothing had
changed and there was a real sense of continuity within the sport. The six
years of war had left young men with little time for Speedway so the
majority of the 1946 teams consisted of pre-war veterans. Transport issues
meant that the American and Australian riders that had dominated British
Speedway in the late 1930’s were unable to return to Speedway (Dalling,
2011). The riders competing at this time were much older having returned
from war, but a new generation of riders would take time to emerge
(Dalling, 2011).
In addition to the cultural continuity there was also a degree of technical
continuity within Speedway. Before the war, JAP emerged as the leading
Speedway manufacturer and when the sport restarted in 1946, riders
quickly started riding their pre-war JAP’s and the manufacturer continued to
dominate Speedway throughout the 1940’s and 1950’s.
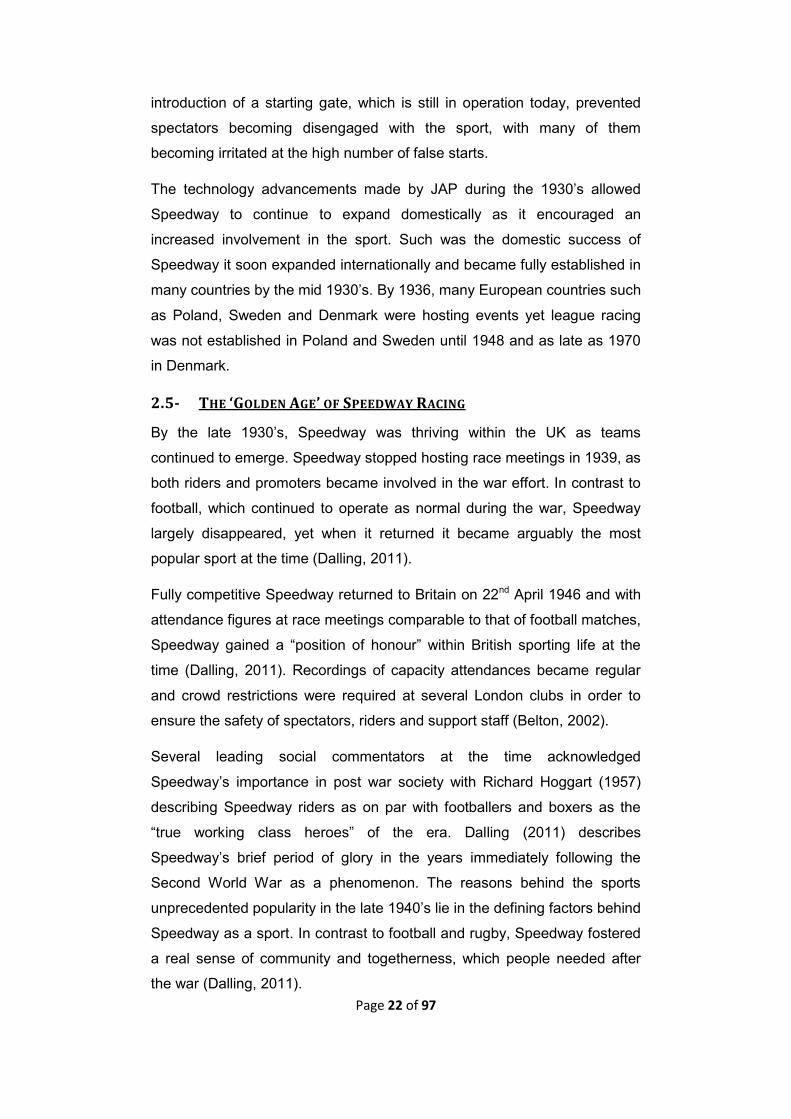
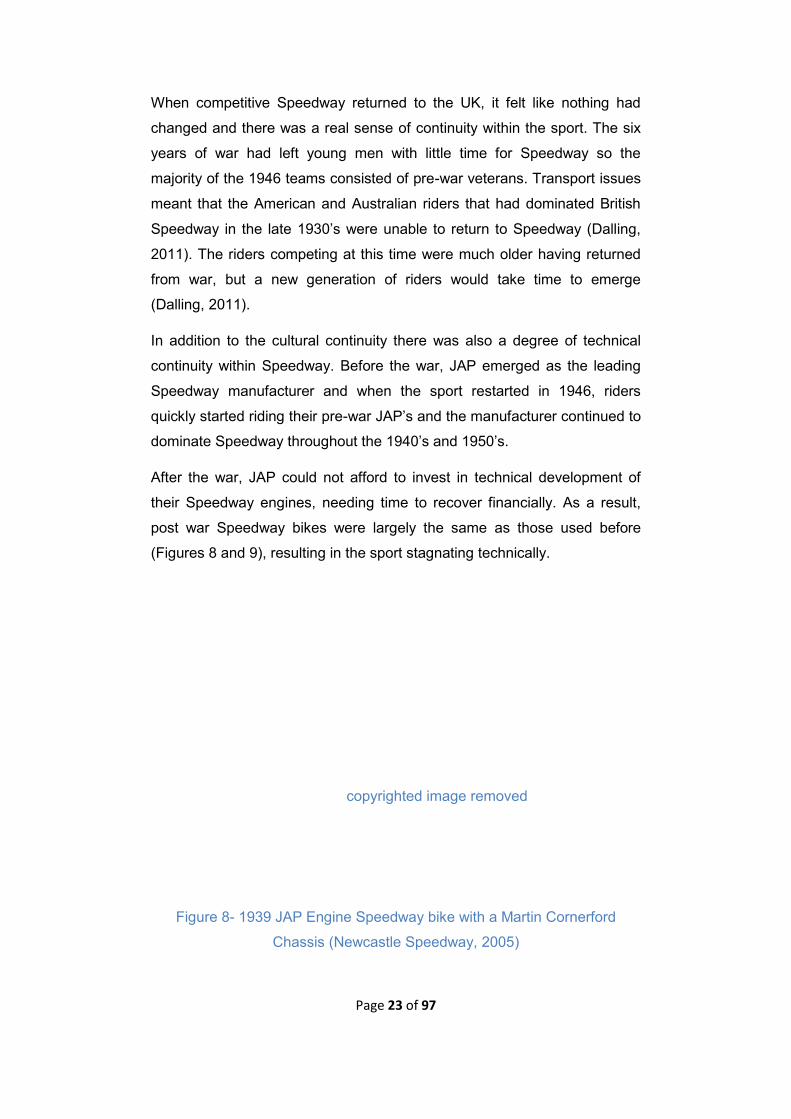
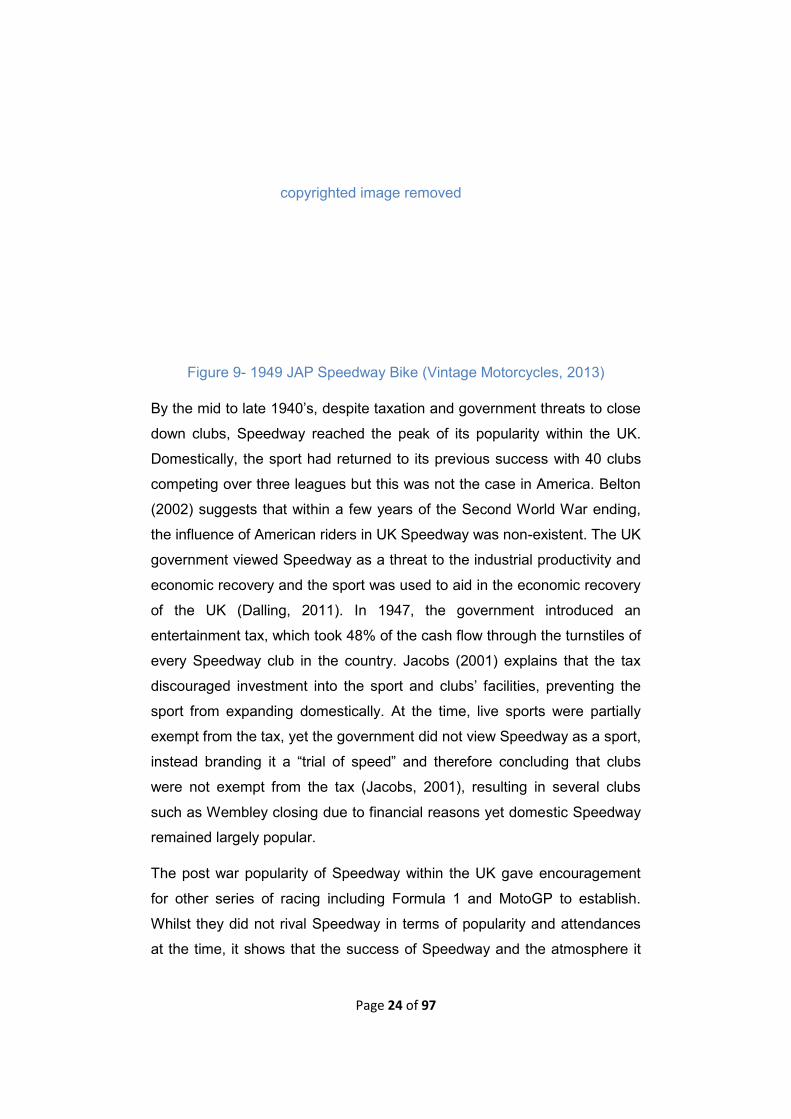
After the war, JAP could not afford to invest in technical development of
their Speedway engines, needing time to recover financially. As a result,
post war Speedway bikes were largely the same as those used before
(Figures 8 and 9), resulting in the sport stagnating technically.
Figure 8- 1939 JAP Engine Speedway bike with a Martin Cornerford
Chassis (Newcastle Speedway, 2005)
copyrighted image removed
Page 24 of 97
Figure 9- 1949 JAP Speedway Bike (Vintage Motorcycles, 2013)
By the mid to late 1940’s, despite taxation and government threats to close
down clubs, Speedway reached the peak of its popularity within the UK.
Domestically, the sport had returned to its previous success with 40 clubs
competing over three leagues but this was not the case in America. Belton
(2002) suggests that within a few years of the Second World War ending,
the influence of American riders in UK Speedway was non-existent. The UK
government viewed Speedway as a threat to the industrial productivity and
economic recovery and the sport was used to aid in the economic recovery
of the UK (Dalling, 2011). In 1947, the government introduced an
entertainment tax, which took 48% of the cash flow through the turnstiles of
every Speedway club in the country. Jacobs (2001) explains that the tax
discouraged investment into the sport and clubs’ facilities, preventing the
sport from expanding domestically. At the time, live sports were partially
exempt from the tax, yet the government did not view Speedway as a sport,
instead branding it a “trial of speed” and therefore concluding that clubs
were not exempt from the tax (Jacobs, 2001), resulting in several clubs
such as Wembley closing due to financial reasons yet domestic Speedway
remained largely popular.
The post war popularity of Speedway within the UK gave encouragement
for other series of racing including Formula 1 and MotoGP to establish.
Whilst they did not rival Speedway in terms of popularity and attendances
at the time, it shows that the success of Speedway and the atmosphere it
copyrighted image removed
Page 25 of 97
produced inspired other forms of motorsport to be created. Far from being a
‘second rate’ motorsport, Speedway was leading the way.
By 1950, Speedway was still in its golden era. 93,000 people witnessed the
World Championship final and with more than 50 clubs in operation across
the country, the future of Speedway looked secure.
2.6- THE DECLINE OF SPEEDWAY RACING
Speedway continued to be popular domestically in the early 1950’s, but by
1955, clubs reported a huge slump in the number of people attending
races, with crowds in the north were often considerably lower than in the
south (Dalling, 2011). During the ‘Golden Era’ clubs such as West Ham,
Wembley and Wimbledon formed the backbone of Speedway within the UK
but were unable to avoid the decline in attendance figures. Belton (2002)
suggests multiple reasons behind Speedway’s domestic decline, such as
the rapid expansion of the sport after the war as well as the introduction of
TV viewing.
In 1960, domestic Speedway was restructured to revitalise the popularity of
the sport. A group of Speedway enthusiasts and former riders came
together to form the Provincial League. Several old tracks that closed due
to taxation were revived and new clubs were introduced into the league. As
a result, the number of operational tracks within the UK more than doubled
(Belton, 2002).
Although this was a successful restructure at the time, it was only a
temporary solution and within a few years of its introduction, domestic
Speedway was again declining. By 1963, there were two divisions of
Speedway in the UK but only six teams competing in the top tier. This was
not the case internationally and although Australian interest in Speedway
declined, the scene in Europe was continuing to grow after the ‘Golden Era’
(Belton, 2002). The international expansion of Speedway was so
substantial that in 1960, the World Team Cup was introduced and in 1961,
the Speedway World Championship Final was held outside of Wembley for
the first time in Speedway history in Malmo, Sweden (Belton, 2002).
Page 26 of 97
To avoid further domestic crisis, the National League was created by a
group of Speedway promoters. The league operated until 1965, where it
merged with the Provincial League to form the British League (Belton,
2002). In 1965, promoters of the sport also established the British
Speedway Promoters Association (BSPA) and gained more influence into
Speedway administration. This established an effective and efficient
structure, progressing Speedway and increasing its popularity within the
UK. This resulted in domestic expansion in the years following the merger
and by 1968, 10 new Speedway teams had been established (Belton,
2002). The restructure and rebuilding of Speedway during the 1960’s led to
a new era of popularity in the late 1960’s to early 1970’s.
In contrast to the technical continuity that occurred in the years following
the end of the Second World War, a considerable amount of technical
developments were made between the 1950’s and 1970’s which assisted in
the renewed popularity of Speedway at the start of the 1970’s
JAP had been the dominant manufacturer within Speedway and had
remained relatively unchallenged. In 1952, Czech motorcycle company
ESO emerged as competition to JAP. Although ESO eventually competed
with a specially designed Speedway engine, during their first competitive
season they raced using a JAP engine whilst design plans and
manufacturing of their engine was finalised. ESO bikes became
immediately competitive against the previously dominant JAP bikes. They
were fundamentally cheaper to run, more reliable and easier to maintain
than the JAP bike although not necessarily quicker over a single lap
(Newcastle Speedway, 2005).
Whilst JAP was still competitive, ESO brought in a series of developments
to their custom built Speedway engines. Although ESO had specifically
designed their engine for classic Speedway (300-400m tracks), the
crankshaft assembly was modified so that the engine could be used on the
larger tracks whilst also increasing the reliability of the bike for shorter
distances. The main bearing of the crankpin on the drive side was enlarged
so that one set of rollers were shifted closer to the engine sprocket. The
rigidity of the crankshaft assembly was also further increased by reinforcing
the connecting rod pin by introducing a ring of special material (Cyber
Page 27 of 97
Motorcycle, 2004). ESO paid much attention to the connecting rod, which
they completely redesigned, into a new shape. The optimised design
featured enlarged pins, which go around both the small and big end to
ensure the rigidity of the connecting rod when maximum loads are applied.
The most significant design that ESO introduced originated from track
design and went on to revolutionise Speedway technology. A new design of
telescopic front fork suspension was trialled on a Speedway bike for the
first time, significantly increasing the handling capabilities. The frame was
also re-designed to make the saddle sit as low as possible in order to lower
the centre of mass to further assist the handling capabilities of the bike
(Cyber Motorcycle, 2004).
Cossalter (2006) explains that by lowering the centre of mass, the rear end
of the bike tends to slip during acceleration as a result of the rear slip angle
being significantly greater than that of the front. This allows the rider to slide
the rear end and broadside much easier, resulting in the rider being
substantially quicker over a single lap. Due to the increased handling
capabilities, the engine and gearbox were shifted rearwards slightly,
allowing the drive chain to be much shorter, reducing the risk of it becoming
detached (Cyber Motorcycle, 2006).
The speed of the ESO bike combined with its reliability gained attention
from many riders competing on a JAP and as a result of their inability to
adapt and bring in new development, JAP stopped competing in Speedway
in the early 1960’s. ESO later merged with Czechoslovakian motorcycle
company JAWA, who became the leading manufacturer within Speedway
in the mid to late 1960’s (Newcastle Speedway, 2005).
Like ESO, JAWA continued the development process of the bikes, focusing
specifically on the engine. Until now, the Speedway engines that had been
used by Douglas, JAP and ESO had been two valve single cylinder engines
but JAWA saw potential to increase performance. In 1966, JAWA modified
their Speedway engines by increasing the number of valves from two to
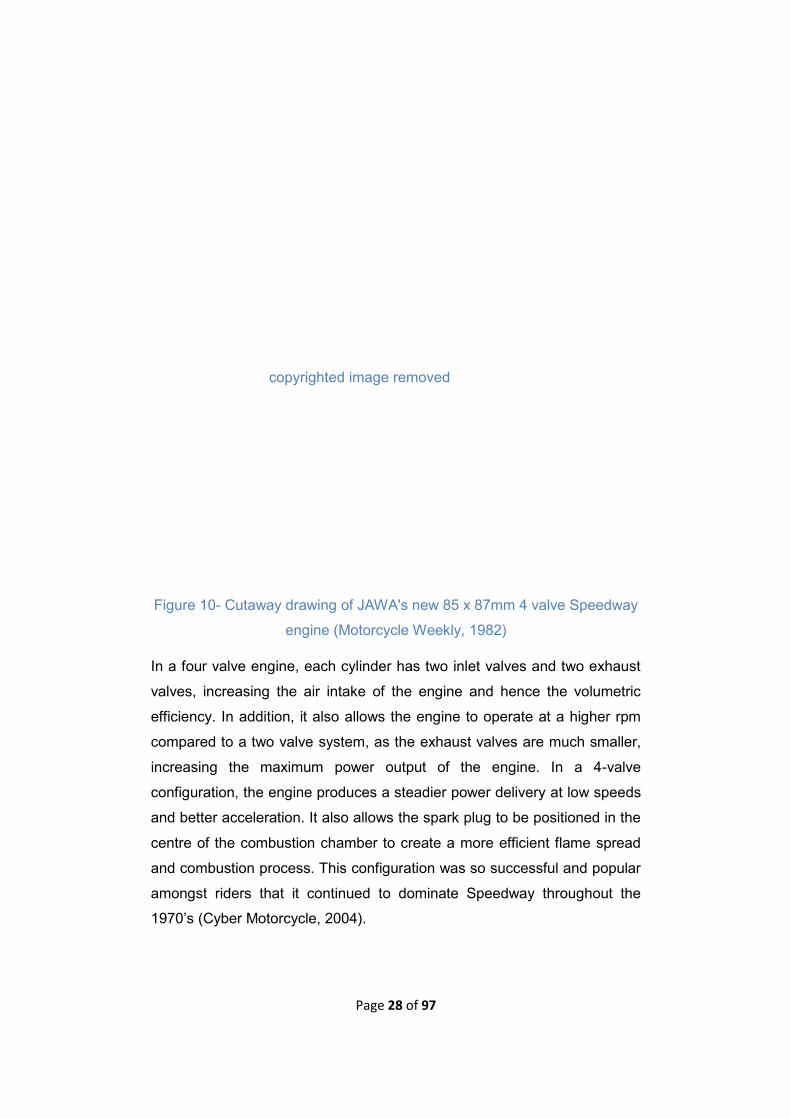
four (Figure 10) favouring riders who wanted extra power.
Page 28 of 97
Figure 10- Cutaway drawing of JAWA's new 85 x 87mm 4 valve Speedway
engine (Motorcycle Weekly, 1982)
In a four valve engine, each cylinder has two inlet valves and two exhaust
valves, increasing the air intake of the engine and hence the volumetric
efficiency. In addition, it also allows the engine to operate at a higher rpm
compared to a two valve system, as the exhaust valves are much smaller,
increasing the maximum power output of the engine. In a 4-valve
configuration, the engine produces a steadier power delivery at low speeds
and better acceleration. It also allows the spark plug to be positioned in the
centre of the combustion chamber to create a more efficient flame spread
and combustion process. This configuration was so successful and popular
amongst riders that it continued to dominate Speedway throughout the
1970’s (Cyber Motorcycle, 2004).
copyrighted image removed
Page 29 of 97
2.7- THE RESURGENCE OF SPEEDWAY RACING
Speedway entered into its second boom of popularity at the start of the
1970’s as a result of the business and technological developments
introduced during the 1950’s and 60’s. As a result of the establishment of
the BSPA and new league structure, Speedway now had a stable and
effective foundation, which continued until the late 1970’s.
After becoming the leading Speedway manufacturer, JAWA continued the
technical development of their bike. In 1976 JAWA designed their first
bespoke Speedway engine, the ‘894’ (Figure 11), underlining their intention
to be competitive in Speedway for many years.
Figure 11- JAWA 894 and 895 engine designs (Motorcycle on paper, 2012)
The 894 focused on the ‘simplicity of strength’ (Cyber Motorcycle, 2004)
which was incorporated into the engine design. The crankshaft was split
vertically, with each individual half consisting of thick wall castings. The
additional strength was necessary in order to cope with the large forces
generated by the crank, which in combination with the flywheel, con rod
and large pistons amount to a considerable mass. In order to maximise the
torque output of the engine when operating at low speeds the flywheels
required were made extremely large and heavy. Additionally, the crank runs
copyrighted image removed
Page 30 of 97
on cylindrical rolling bearings and to handle the additional stresses, two
sets of rollers were used on the drive side of the engine as opposed to the
single set on the timing side (Cyber Motorcycle, 2004). When the engine
was tested in race conditions, JAWA noted that there was a large amount
of vertical movement in the connecting rod and after further investigation
concluded that the movement was necessary for the engine to rev freely.
The JAWA 894 engine was widely used by Speedway riders throughout the
1970’s and 80’s but in 1986 JAWA introduced the ‘895’ Speedway engine
as an alternative for riders (Figure 11). The 895 engine proved to be the
final developments introduced to the JAWA Speedway series and was the
last JAWA engine to be vertically mounted within the frame before the
orientation change in the 1994 (Cyber Motorcycle, 2004).
In the late 1970’s, Weslake emerged as a competitor to JAWA but were
only involved in Speedway until 1983. During this time, they won two
Speedway World Championships and were popular with many top riders.
In contrast to JAP bikes where the engine filled the frame and featured a
long stroke cylinder, the Weslake was very compact and had a much
shorter stroke with its power coming from its high revving capabilities
(Newcastle Speedway, 2005).
Whilst Weslake was starting to deteriorate in Speedway in the early 1980’s,
Italian engine manufacturer Guiseppe Marzotto (GM) emerged. Their first
version of a complete Speedway machine was produced in 1979 and they
obtained their first major success in 1983 (Newcastle Speedway, n.d).
When Weslake ceased competing, GM and JAWA became the only two
manufacturers in Speedway, which still remains today.
In contrast to Speedway, where the majority of modifications to the bike are
subtle adaptations of the original model, other forms of Motorsport such as
MotoGP were introducing technical developments that were far more
sophisticated and advanced than what was being used in Speedway
despite being a much younger form of motorsport. MotoGP teams were
continuously introducing modifications to their bikes, assisted by changes in
regulations. This reflected the need for technical progression and
innovation within the sport whilst keeping with the development of
production bikes (MotoGP, 2001). As a result of the limited applicability of
Page 31 of 97
Speedway technology outside of the sport, it has minimal external
influences to push the technology forward, causing Speedway to fail to
strive for continuous technical development to maintain the sports
progression.
2.8- CONTEMPORARY SPEEDWAY
By the mid 1980’s, Speedway entered into another period of decline, a
trend which has continued into the modern era of the sport. Although there
had been a series of technical developments introduced, the lack of
competition between manufacturers resulted in a certain amount of
excitement being lost from the sport causing Speedway’s domestic
popularity to decline. The foundation of Speedway remained secure since
its restructure during the 1960’s, no additional adaptations to the structure
had been made since then, causing the sport to stagnate. In an attempt to
solve the situation, Speedway was restructured for both domestic and
international competitions. This solution had worked previously to revitalise
the sport and regain its popularity and there was much hope that it would
have the same effect again. In 1995, the British League was replaced by
the Premier League. This was only a temporary setup as 2 years later the
format was modified into three tiers to create the British Elite League, which
is still in operation today. The top tier was renamed the Elite League with
the second and third tiers called the Premier and National Leagues
respectively (Belton, 2002). Currently, there are 30 teams competing over
all 3 leagues yet there is growing concern that some of them will not remain
open for much longer, with several teams reporting up to 6 figure losses for
last season. This causes potential issues for the Sky Sports contract for
Elite League Speedway broadcasting as at least eight teams need to
compete to fulfil the contractual terms (Keep Turning Left, 2010).
To aid in the restoration of domestic popularity, a series of technical
advancements were introduced were also introduced. In 1992, leading link
suspension was introduced into Speedway as a replacement for the
previously used telescopic fork suspension with several people involved in
the sport considering it as the most significant technical development
introduced into Speedway to date.
Page 32 of 97
Leading link suspension comprises of a tubular connecting the steering
column to the link pivots, which incorporates anchorages for the
suspension struts (Foale, 2006). The system has the advantage that when
the bike is cornering they do not twist like telescopic suspension,
preventing alteration to the steering geometry. In contrast to telescopic
forks which require a lot of maintenance and have reduced damping and
absorption capabilities, leading link suspension systems are much stronger.
They also have a greater rigidity and feature a damper that absorbs the
impact of the bump, providing smoother handling and improving stability.
Although technical development of the front suspension system had been
introduced, it is necessary that the rear sub-frame of the Speedway bike
remains rigid as the riders slide the bikes around a corner resulting in rear
suspension not being possible (Foale, 2006).
In 1994, the configuration of Speedway bikes was further modified when
the majority of riders opted to change the orientation of the engine
mounting from being vertically mounted within the frame to being laydown
along the base of the frame (Figure 13). Although this modification was not
adopted by mainstream Speedway until 1994, there is evidence that
laydown engines were tested in Speedway from as early as 1948 when
engineer and rider Wal Phillips experimented with the concept (Figure 12).
After conducting multiple tests, it was determined that due to the deep dirt
track surface that was being used at the time, the bike was too difficult to
ride (Speedway Forum, 2009).
Page 33 of 97
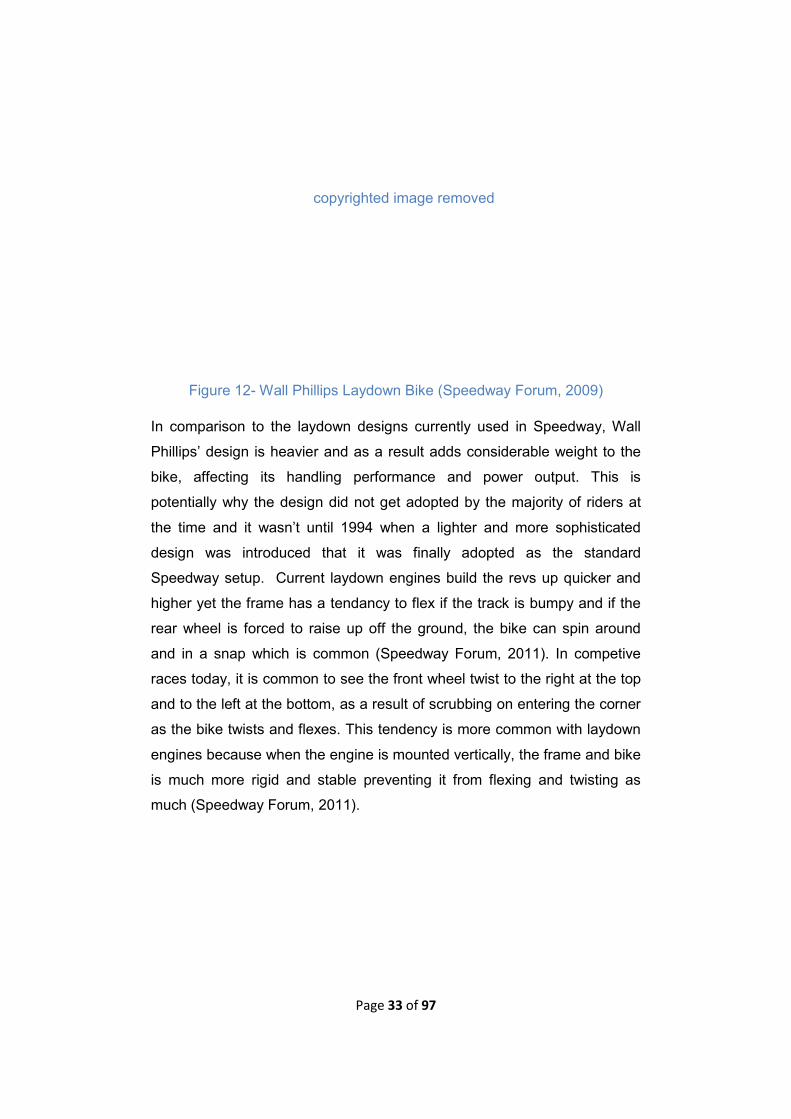
Figure 12- Wall Phillips Laydown Bike (Speedway Forum, 2009)
In comparison to the laydown designs currently used in Speedway, Wall
Phillips’ design is heavier and as a result adds considerable weight to the
bike, affecting its handling performance and power output. This is
potentially why the design did not get adopted by the majority of riders at
the time and it wasn’t until 1994 when a lighter and more sophisticated
design was introduced that it was finally adopted as the standard
Speedway setup. Current laydown engines build the revs up quicker and
higher yet the frame has a tendancy to flex if the track is bumpy and if the
rear wheel is forced to raise up off the ground, the bike can spin around
and in a snap which is common (Speedway Forum, 2011). In competive
races today, it is common to see the front wheel twist to the right at the top
and to the left at the bottom, as a result of scrubbing on entering the corner
as the bike twists and flexes. This tendency is more common with laydown
engines because when the engine is mounted vertically, the frame and bike
is much more rigid and stable preventing it from flexing and twisting as
much (Speedway Forum, 2011).
copyrighted image removed

Page 34 of 97
In the modern era of Speedway racing it is also now compulsory for all
Speedway bikes to run with a dirt deflector (Figure 13) yet many people feel
that they ruin the image of Speedway and need to be integrated more fully
into the overall aesthetics of the bike.
Figure 13- Current Speedway bike showing the use of a dirt deflector
(Monster Energy SWC, 2014)
An early adaptation of the dirt deflector was first seen in 1983, yet the
design was more of long rear mudguard and had a tendency to fall off. A
later version of the dirt deflector, which closely resembles what is used
today was trialled in 1994 but it was only temporary, as a short way into the
season Speedway decided not to proceed with the design. This was later
reversed in 1997 and deflectors are still used on all competing Speedway
bikes.
In 2011, in an attempt to please local residents and safeguard clubs close
to residential areas by reducing the motorcycle’s noise, Speedway’s
governing body the FIM introduced new homologated silencers. The new
silencer designs are restricted to 96 decibels yet riders have reported that
the bike’s power disappears through the exhaust and a significant amount
of torque is removed from the engine, causing it to stall (Speedway Forum,
2011). This increases the risk of the riders crashing as the rear wheel tends
to rise of the ground as a result of the engine stalling. Mechanics are now
copyrighted image removed
Page 35 of 97
having to service engines after 15 races instead of the previous 30 as the
new silencer design features plates which block the exhaust gases from
leaving quickly, resulting in a build-up of back pressure within the exhaust
pipe and engine, causing the silencer and the exhaust pipes to get hot
which damages the engine (BBC Sport, 2011). In addition to the
backpressure build up, the new design is also substantially heavier than the
silencers previously used and the additional weight produced a change in
the handling characteristics of the bike which was not beneficial to riders.
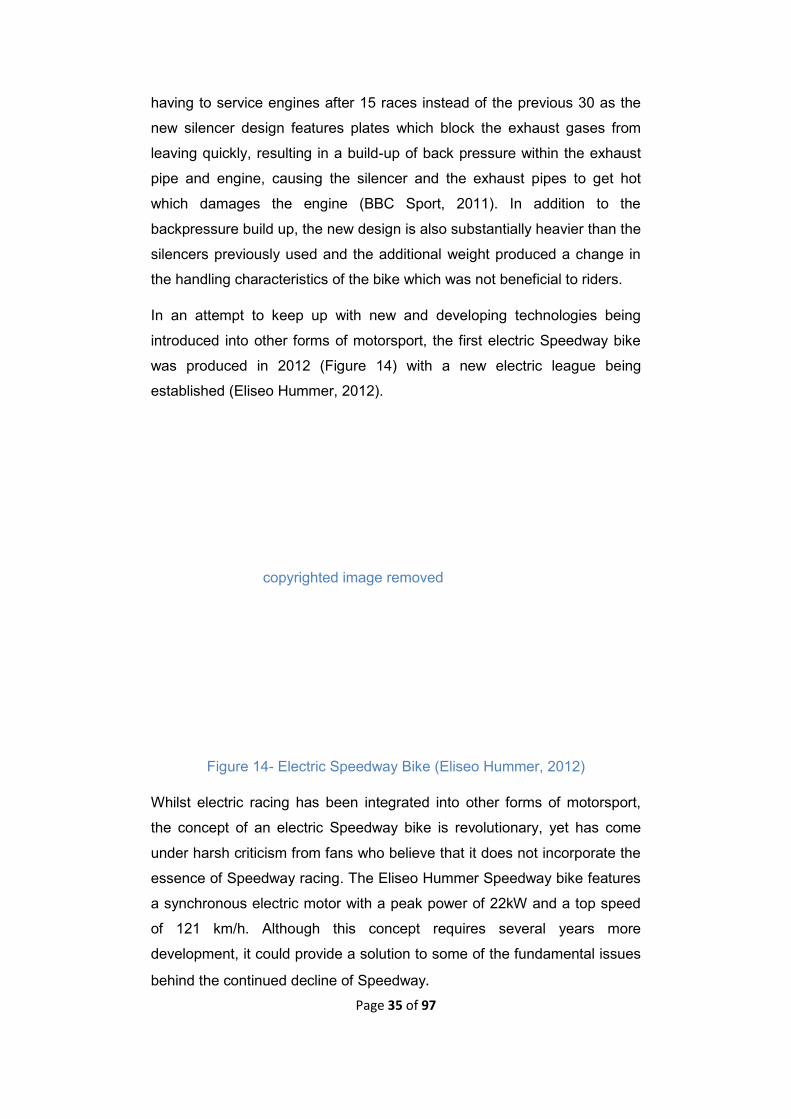
In an attempt to keep up with new and developing technologies being
introduced into other forms of motorsport, the first electric Speedway bike
was produced in 2012 (Figure 14) with a new electric league being
established (Eliseo Hummer, 2012).
Figure 14- Electric Speedway Bike (Eliseo Hummer, 2012)
Whilst electric racing has been integrated into other forms of motorsport,
the concept of an electric Speedway bike is revolutionary, yet has come
under harsh criticism from fans who believe that it does not incorporate the
essence of Speedway racing. The Eliseo Hummer Speedway bike features
a synchronous electric motor with a peak power of 22kW and a top speed
of 121 km/h. Although this concept requires several years more
development, it could provide a solution to some of the fundamental issues
behind the continued decline of Speedway.
copyrighted image removed
Page 36 of 97
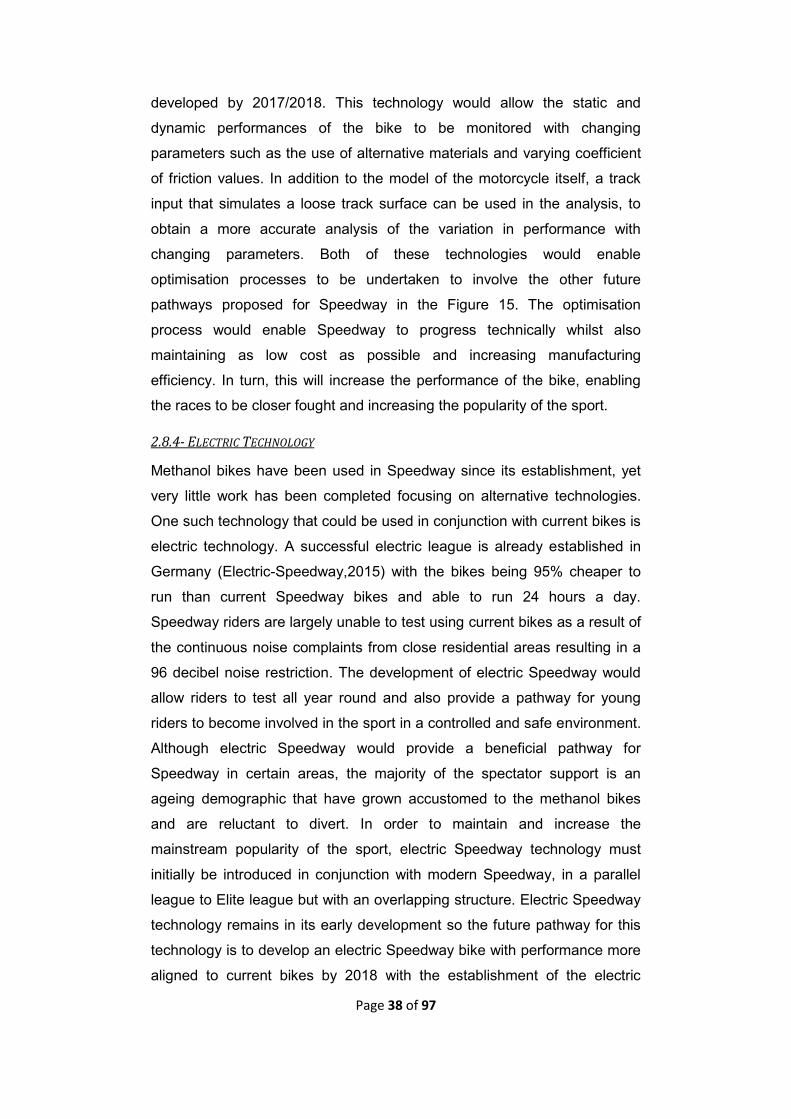
2.9- FUTURE PATHWAYS FOR SPEEDWAY RACING
Technology roadmaps are used within industries to define technical
pathways that show how parallel incremental innovations, result in new
technologies and products (Brindle, 2013). In essence, they highlight
factors most likely to drive the continued development of a product and
assess the potential benefit of the development to the product. The
technology road map of Speedway racing is presented in Figure 15 and
shows the technical development of the sport in last 25 years, giving an
assessment of its current technology whilst also providing the pathways for
future development in a vision timeline. The following subsections go into
further detail about each of the pathways and outline their potential effect
on Speedway.
2.8.1- MATERIALS
Figure 15 shows four possible future pathways for Speedway that would
enable to the sport to continue to progress technically and aid in its
popularity expansion within the UK, whilst also increasing the safety of
riders and reducing injury. The first potential future pathway is the use of
alternative materials such as aluminium, titanium and carbon fibre in the
frame designs of Speedway motorcycles. Steel has been used as the core
material for frames since the sports establishment yet the use of alternative
materials could provide a safety and performance gain to riders. Whilst
carbon fibre is very light it does not provide as much benefit compared to
the other two materials due to its characteristics and properties. Although
carbon fibre is strong, with a high strength-to-weight ratio, it is also rigid and
with the little damping capabilities of both the frame and the bike, it will
most likely cause an adverse effect on motorcycle dynamic performance
and increase rider injury. An additional design limitation of carbon fibre is
the occurrence of galvanic corrosion of parts that are interfaced to
aluminium parts, which is a likely occurrence within Speedway. The most
promising material pathway in terms of performance, safety and cost is the
use of aluminium and titanium in the frame design. Both materials are stiff
and light, providing increased performance of the bike whilst also reducing
the risk of rider injury. The use of these materials would result in the bike
being considerably lighter overall and with a minimum weight of 77kg being
imposed in Speedway, the lighter frame weight would enable additional
Page 37 of 97
weight to be put elsewhere on the bike resulting in a better weight
distribution of the bike. The bike would also have less momentum due to
the reduced weight resulting in a reduction in rider injury caused at high
speeds. The use of titanium on the frame is currently prohibited under the
current regulations, so the future pathway is to initially use aluminium as an
alternative to steel frames by 2018, then a regulation change to be
introduced in 2020, allowing the first titanium Speedway frame to be used
in a competitive race by 2022.
2.8.2. TYRE-TRACK INTERACTION
In recent years, the amount of riders being injured in race meetings or the
race meet getting cancelled all together has increased due to the limited
understanding of the tyre-track interaction of loose shale. The specification
of the loose surfaces varies from track to track, as the organisers of the
individual event are responsible for the specification of the track surfaces,
with many different variations and compositions used. Figure 15 shows the
future pathway for studies into the tyre-track interaction and specifically an
assessment of the coefficient of friction to be initiated in 2018 leading to a
better understanding of the variations in grip levels of the motorcycles. If a
better understanding of this concept was gained, the performance of riders
in the races would increase, aiding in the viewing spectacle and the
occurrence of rider injury would be reduced, both leading to a positive drive
in the popularity of the sport whilst also driving technical development.
Furthermore to the grip level studies, a number of race meets are currently
cancelled due to rain, as the track surface becomes largely un-rideable
when wet. A beneficial future pathway to Speedway is the introduction of a
water- resistant track surface by 2025, enabling race meets to always take
place and giving satisfaction to spectators attending meets, as the chances
of cancellation would be void.
2.8.3. PHYSICAL PARAMETERS
As a result of the limited applicability of Speedway technology, little
research has been conducted into the physical parameters and
characteristics of both the complete bike and individual assemblies. To
assist in the continued technical progression of Speedway aiding gains in
performance, a full dynamic model of a Speedway bike should aim to be
Page 38 of 97
developed by 2017/2018. This technology would allow the static and
dynamic performances of the bike to be monitored with changing
parameters such as the use of alternative materials and varying coefficient
of friction values. In addition to the model of the motorcycle itself, a track
input that simulates a loose track surface can be used in the analysis, to
obtain a more accurate analysis of the variation in performance with
changing parameters. Both of these technologies would enable
optimisation processes to be undertaken to involve the other future
pathways proposed for Speedway in the Figure 15. The optimisation
process would enable Speedway to progress technically whilst also
maintaining as low cost as possible and increasing manufacturing
efficiency. In turn, this will increase the performance of the bike, enabling
the races to be closer fought and increasing the popularity of the sport.
2.8.4- ELECTRIC TECHNOLOGY
Methanol bikes have been used in Speedway since its establishment, yet
very little work has been completed focusing on alternative technologies.
One such technology that could be used in conjunction with current bikes is
electric technology. A successful electric league is already established in
Germany (Electric-Speedway,2015) with the bikes being 95% cheaper to
run than current Speedway bikes and able to run 24 hours a day.
Speedway riders are largely unable to test using current bikes as a result of
the continuous noise complaints from close residential areas resulting in a
96 decibel noise restriction. The development of electric Speedway would
allow riders to test all year round and also provide a pathway for young
riders to become involved in the sport in a controlled and safe environment.
Although electric Speedway would provide a beneficial pathway for
Speedway in certain areas, the majority of the spectator support is an
ageing demographic that have grown accustomed to the methanol bikes
and are reluctant to divert. In order to maintain and increase the
mainstream popularity of the sport, electric Speedway technology must
initially be introduced in conjunction with modern Speedway, in a parallel
league to Elite league but with an overlapping structure. Electric Speedway
technology remains in its early development so the future pathway for this
technology is to develop an electric Speedway bike with performance more
aligned to current bikes by 2018 with the establishment of the electric

Page 39 of 97
Speedway league to run in parallel with the Elite league to start in 2020.
Although this technology does not directly influence the performance of the
bikes, it does provide a pathway for Speedway to reinvent itself with
modern technology and allow a new age of riders to come through.
Page 40 of 97
Figure 15- Technology roadmap of Speedway showing the potential future pathways
Page 41 of 97
2.10- DISCUSSION
Speedway has experienced multiple periods of success throughout its
history yet these have been unsustained. Speedway became the first
established form of motorsport within the UK in the 1930’s and as the
mainstream popularity of the sport increased, clubs emerged throughout
the country. This popularity continued throughout the 1940’s and well into
the 1950’s. As a result of the six-year war absence, Speedway failed to
develop throughout this period and although the continuity of the sport was
what fans needed, it was detrimental to the sport in the long term. The lack
of development into Speedway resulted in the sport stagnating and
Speedways appeal started to decline by the mid 1950’s. This lack of
development is rare in any other form of motorsport but at the time
Speedways’ administration did not act on the situation.
As a result of the decline in mainstream popularity in the late 1950’s, a
restructure was implemented to revitalise the sport. The new structure of
Speedway introduced an administration which had never been seen in
Speedway before and the operation and foundation of the sport became
effective and efficient. This in conjunction with a series of technical
developments introduced throughout the 1960’s not only revitalised the
sport but entered it into a second boom of popularity in the late 1960’s.
This second surge in popularity could not be sustained and by the early
1980’s, Speedway began another general decline. The reasons behind the
decline are not fully defined but research suggests that the lack of
competition between manufacturers caused spectators to become
disengaged with the sport. Whilst there was technical development during
this time, the administration of Speedway remained effective and as a
result they implemented no developments to the administration of
Speedway to aid in its domestic expansion. The general decline of
mainstream popularity of Speedway initiated in the1980’s and has
continued into the modern era of Speedway, affecting attendance figures
and the money invested in the sport. When considering the rise and fall in
popularity of the sport, a trend emerges which repeats periodically
throughout the history of the sport (Figure 16).
Page 42 of 97
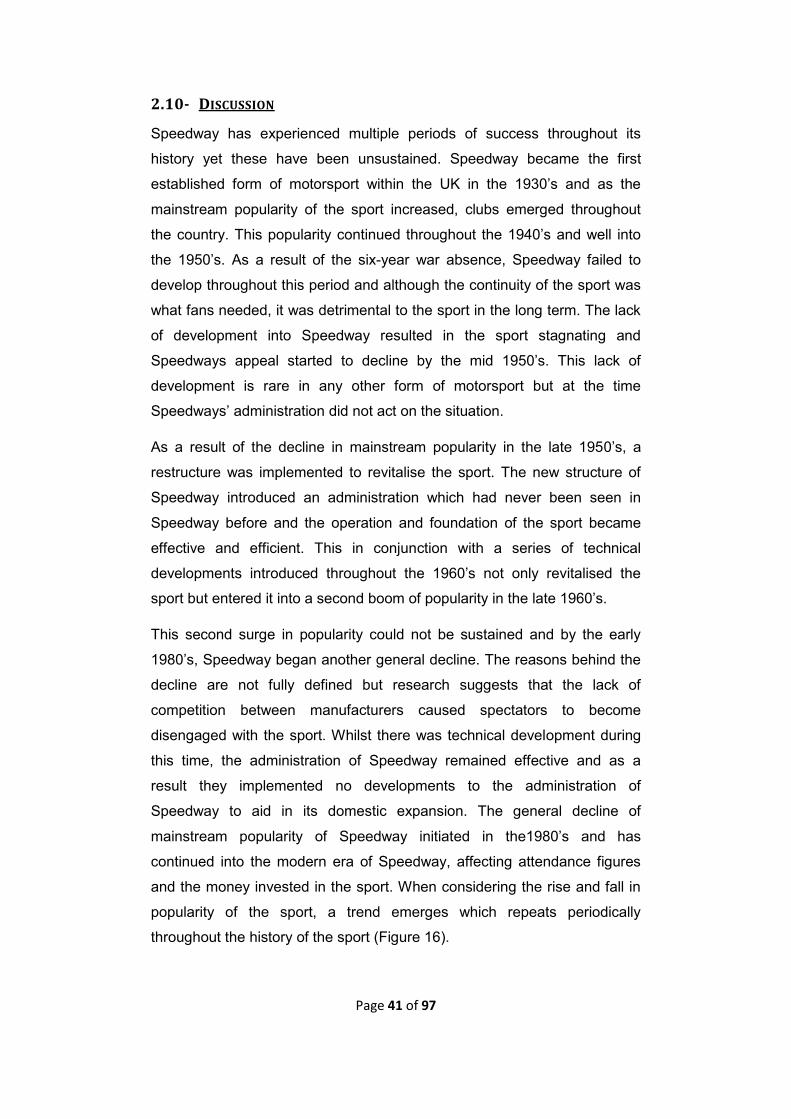
Figure 16- Flow Chart highlighting a trend within Speedway
The above cycle (Figure 16) was deduced by considering the timeline of
Speedway history. This cycle is an example of diffusion innovation theory,
where the rate at which an idea spreads through a specific population is
monitored. An example of this cycle is in the 1930’s, when at this time
Speedway was at one of the highest points in its popularity, yet over the
next 30 years very little technical or business developments were
introduced, causing a stagnation of the sport. As a result of Speedway
stagnating, there was a drop in the popularity of the sport and Speedway
started to decline. In an attempt to restore popularity, the structure and
format of Speedway was modified and a series of technical developments
introduced, a combination of which helped restore the popularity of
Speedway. This cycle was repeated later in the 1970’s and most recently in
the 1990’s, yet this time the popularity of the sport has not returned and
even with restructure, the sport has continued a general decline
domestically.
After the most recent restructure of Speedway in 1997, the sport has been
unable to restore its mainstream domestic popularity suggesting that an
alternative approach needs to be taken, yet the reason behind the decline
is not yet fully defined. Technical developments that have been introduced
Speedway popular
No development
brought in due to success
Sport stagnates as lack of
development
Speedway declines
Sport needs to be restructured and technical development
introduced
Page 43 of 97
have more often than not been subtle adaptations to the original model.
The last revolutionary technology introduced into Speedway was in 1992,
when leading link suspension as first trialled. When considering the ‘feel’ of
Speedway throughout its history, there is a sense that the sport has lost
sight of its original goal and purpose. Speedway started as a group of
people racing around an oval track and when people became interested in
the sport and started going to watch the race, the focus shifted to
entertaining the spectators. When Speedway started to prosper, this focus
died away and more effort was spent on making money as promoters
became more heavily involved in the sport. With the current situation of
Speedway, focus is starting to shift back to making it more of a spectator
sport, so that domestic Speedway can remain financially sustainable. At
times when Speedway prospered financially, promoters of the sport
established several new clubs within a very small area and as a result the
Speedway fan base was spread too thin. In addition, Speedway also
became nationalised and as a result lost the ‘community feeling’ that made
it so popular before and after the war. Speedway declined because
spectators no longer felt the same connection or loyalty to a specific club
and instead became passive observers.
The trend in mainstream popularity of Speedway since its establishment is
demonstrated in Figure 17, which is a qualitative representation of the
popularity trend. Although there is no published evidence to support the
data, the trend is developed from the literature and research presented in
the technology road map. There are a number of limitations to the graph as
the relationship is based on the authors’ interpretation of the popularity at
the time as a result of the technical and business developments introduced
at the time and the trend is unable to be quantified.
When Speedway established itself in the UK after the first official meet at
High Beech in 1928, the sport quickly expanded as shown by the sharp
trend gradient of the first peak (Figure 17) and as a result of the rapid
expansion throughout the 1930’s, both team and league racing were
established. Speedway experienced a six-year absence from 1939 due to
World War 2, yet continued to expand in popularity upon returning. The
summation of this post war popularity came in 1950, where Speedway
reached its highest point of mainstream popularity, with 93,000 people
Page 44 of 97
witnessing the 1950 World Championship Final, yet shortly after, Speedway
experienced a severe drop in mainstream appeal (Figure 17). A potential
reason behind such a significant rise and fall of the first peak is the lack of
structure that was in place within Speedway at the time and although a
league structure was in place, the administration was not effective. When
Speedway became regularised and a more effective structure was
established in 1965, due to the creation of the BSPA, the mainstream
popularity of the sport began to increase again. This suggests that the
business development and structure of the sport is a driving factor behind
the popularity of Speedway. As a result of a more effective structure being
introduced in 1965, the subsequent declines in the sport after this date are
not as substantial as the first.
An anomaly arises in the trend curve (Figure 17) between 1982 and 1987,
where there is a significant bump in the trend line. During this time, JAWA
introduced a series of modifications to their engine, yet more importantly,
GM emerged as a fellow leading manufacturer. The competition that
developed between the manufacturers became a spectacle and the sport
increased in popularity. This period of prosperity was short lived and
Speedway initiated another steady decline.
The general decline of Speedway continued until 1995 when Speedway
underwent its most extensive restructure to date. The recovery pattern in
the 90’s was repeated in the same fashion during the 1970’s although it did
not work immediately as seen by the long duration of the trough in Figure
17. The structure change implemented in 1995 had to be further modified in
1997 for the mainstream popularity of Speedway to start increasing again.
This suggests that whilst technical development is important, it is the
business structure that is current driving force behind Speedway. The
strong structure in place after 1997 is also evident by the duration of the
peaks as whilst the first two peaks are relatively comparable in size and
duration the length of the final peak is almost double, indicating that the
most effective structure is in place by this point. The significant drop in the
height of the final peak in comparison to the first two could be a result of a
lack of technical development. Whilst there is a good structure in place, the
technical structure of Speedway is being left behind in terms of technical
advancements and development in comparison to other forms of

Page 45 of 97
motorsport. As a result of experiencing a technical stagnation, it is possible
that many supporters have lost interest in the sport, become disengaged
and have taken their audience elsewhere.
In addition to demonstrating the popularity trend of Speedway since 1928,
Figure 17 shows that there are potential future pathways for the sport
(Figure 15), resulting in an upward surge in the popularity of the sport.
Figure 18 suggests that a simple restructure of the sport is insufficient,
hence the focus of the future pathways is on increasing the technical
development of Speedway.
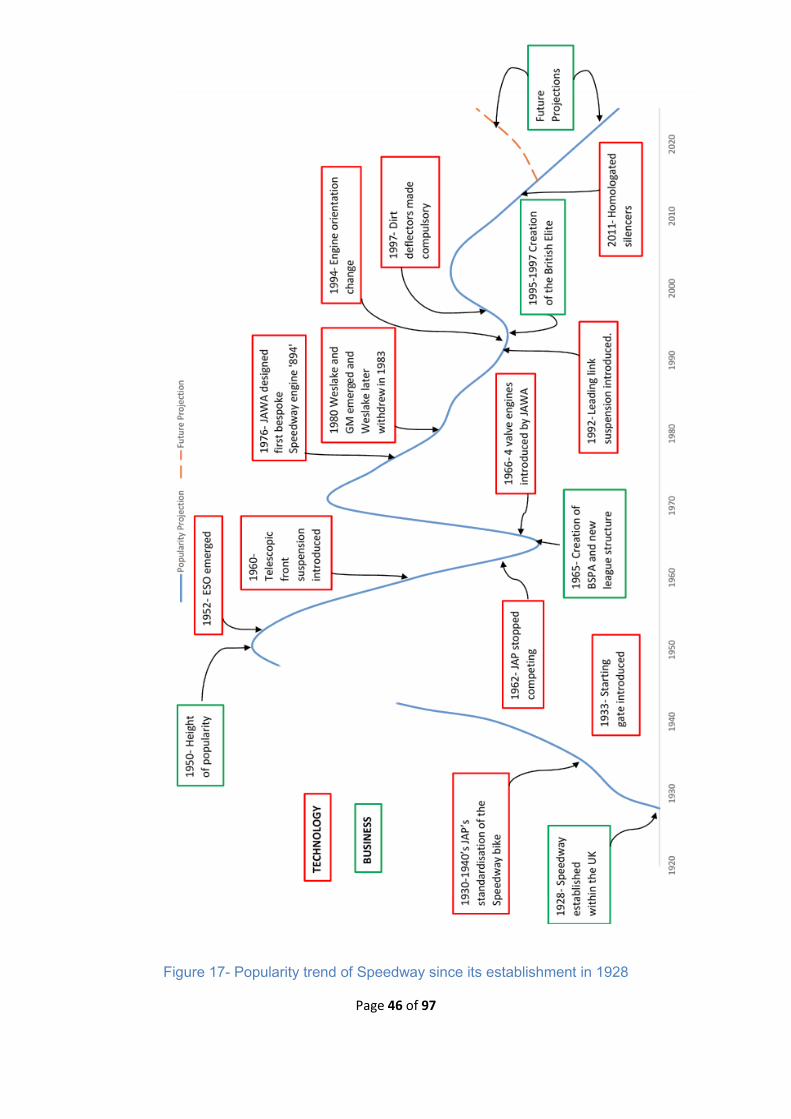
Page 46 of 97
Figure 17- Popularity trend of Speedway since its establishment in 1928
Page 47 of 97
In conclusion, the business structure in place has been the driving force
behind the mainstream popularity of Speedway to date, as only when
business developments are introduced has there been an increase in the
popularity of Speedway after a general decline.
Although technical developments are important, they have only been a
catalyst to popularity and have been unable to independently influence
popularity to date. An interesting concept to consider is the potential effect
of introducing revolutionary technical development into Speedway and
whether that would then become a parallel driving factor. The potential
future technical pathways are presented in the roadmap and if introduced
would increase performance and rider safety whilst also providing an
avenue for young riders to become involved in the sport. In turn, all of these
pathways will lead to the continued development of the sport and increase
its popularity, preventing the sport from stagnating and eventually dying
out.
2.11- SUMMARY
The technology road map presents the trends in the business and technical
developments since the sports establishment in 1928. It shows that
although there has been considerable technical development of the
motorcycles, it has been more adaptations rather than original
advancements. The technology road map suggests that the frame is the
least developed area of the bike despite its significant influence on the
safety of riders and their long term health as outlined in the literature
review. Previous experimental research carried out by Goozee (Wagstaff,
2011) shows the potential for frame development and gives some insight
into the performance benefit providing the cost can be kept low to sustain
the sports financial impact. The aim in undertaking this project is that the
work achieved within this thesis can be used to build the foundation for
future work into frame development to take place.
Page 48 of 97
Chapter 3- Literature Review
3.1- INTRODUCTION
In this Chapter a review of the published literature on areas relating to
Speedway such as motorcycle dynamics is presented. The literature
available on Speedway is relatively sparse and generally based on the
experience of riders and people involved in the sport. The majority of books
that have been published, inform readers of the history of a specific team or
an era of racing, such as the books published by Belton (2002) and Dalling
(2011), but often do not contain information regarding the technology
involved in Speedway.
3.2- MOTORCYCLE DYNAMICS
Whilst there are no apparent technical papers on Speedway technology, a
number of papers have looked at other areas related to the sport,
specifically motorcycle dynamics and the injuries of Speedway riders. One
such paper by Skyrme et al. (2003) discusses the previously unreported
condition of traction osteophyte. They claim that “traction osteophyte
formation at the base of the fifth metatarsal is directly related to the activity
of Speedway riding and the condition only presents itself in the right foot of
riders”. This long-term injury could perhaps be mitigated by having riders
ride alternatively clockwise and counter-clockwise but the sport has
historically run counter-clockwise.
As Speedway is a repetitive sport compared to other forms of motorcycle
racing, it has been used in a number of investigations for handlebar
vibration, which could result in “white finger” (Matsumoto et al., 1986;
Mirbod et al., 1997; Yokomori et al., 1986). Yokomori et al. (1986) explains
that the vibrational sources in motorcycles that cause “white finger” are
transmitted along three paths in the motorcycle; handlebars, saddle and the
footrest. As all three vibrational paths are connected through the main
frame of the motorcycle, it suggests the importance of the frame in rider
safety as well as the instrumental impact of the frame characteristics on
rider injury.
Cossalter et al. (2015) discusses the important role that the flexibility of
frames has on the motorcycle’s dynamics and their effect on the stability
characteristics of the motorcycle. It is explained that the optimal flexibility of
Page 49 of 97
a motorcycle remains an open research topic and an established method
for frame flexibility measurement has yet to be defined, with different
manufacturers currently using a range of measurement approaches.
Raines and Thorpe (1986) conducted static tests, focusing on the torsional
stiffness of the frame using a framework of tubes similar to some
motorcycle chassis’ and defined the twist axis along which no lateral
displacement takes place when a torque is applied about it. Further
investigations into structural flexibility have since been conducted by
Bocciolone et al. (2005) and Cossalter et al. (2002) amongst others with the
latter paper using a method of modal analysis to study the vibrations of the
whole motorcycle, showing the presence of various out of plane modes of
vibration in a frequency range below 50Hz. Kalsule et al. (1999) explains
that modal analysis is an established technique that provides definition of
the dynamic properties of a structure which are related to the stiffness,
mass and damping properties of the structure. In his later work on the
subject Cossalter et al. (2015) outlined the importance of considering that
the static compliance is a combination of the modal compliances of various
modes of vibration.
In a similar manner to Cossalter, Bocciolone et al. (2005) used numerical
and experimental studies to investigate the static and dynamic properties of
motorcycles frames by determining the static stiffness, natural frequencies
and vibrational modes with the aid of a specifically designed test rig that
loaded the chassis in torsional and flexural configurations. The investigation
was developed from previous work by Wilson-Jones (1951), Cossalter
(1999) and Dohring (1956) who all determined the presence of three
instabilities that occur during vehicle running. The characteristics of the
vehicle instabilities has been extensively researched throughout the years
to gain a better understanding of their identity and overall effect on the
performance and stability of motorcycles. Later papers by Sharp (1978) and
Roe and Thorpe (1989) discuss how motorcycles are prone to two basic
oscillatory steering instabilities, a low speed high frequency flapping of the
handlebars, known as “wobble” or “shimmy” and a `high speed low
frequency snaking of the whole machine, known as “weave”. The third
instability, “capsize” is non-oscillatory and is the tendency of a motorcycle
to fall down when moving at low speeds.
Page 50 of 97
Of the two oscillatory modes, weave is the first one that a rider will
experience, occurring at a frequency band between 2-4Hz and involves the
steer, roll and yaw motions of the motorcycle. Wobble occurs at a slightly
higher frequency range of between 6-8Hz and involves mainly steering
oscillations (Cossalter, 2006). Roe and Thorpe (1989) concluded in their
investigation into the influence of frame structure on the dynamics of
motorcycle stability that to obtain wobble stability, the frame must have a
high stiffness both in torsion and laterally but in particular torsional. They
went on further to suggest that variations in the frame stiffness do not
influence weave instability in the same way that it affects wobble and
suggested that the stiffness of the front forks is the dominant parameter on
weave stability. For high speeds normally experienced by Speedway bikes,
this is not necessarily the case. With the frames traditionally having a high
torsional stiffness to reduce the wobble instabilities common to the sport,
the handling can often become twitchy, resulting in the bikes “chopping”
sideways when cornering at high speeds on a bumpy track (Roe and
Thorpe, 1989).
3.3- MODELLING AND SIMULATION
In their study on closed loop simulation, Beghi and Frezza (2007) highlight
that the motorcycle industry lags behind the automotive industry in the use
of simulation technology but suggests that the motorcycle development
process is innovative and the use of virtual prototyping is rapidly increasing.
Sharp et al. (2004) explains that the increased use of automated multibody
dynamics software has further opened up the topic of motorcycle dynamics
in recent years. A paper by Beghi et al. (2007) on modelling using virtual
prototyping agreed with this and further explains that the increased use of
virtual prototyping tools in the motorcycle industry focuses on reducing the
development time of new models and increasing the speed of performance
optimisation.
Although the topic has opened up in recent years, modelling of single track
vehicles has been investigated for many years with the first seminal
technical papers on the subject being published by R.S Sharp in 1971
(Rajput et al., 2007)on the stability of motorcycles in a straight line. In the
study the vehicles were treated as two rigid frames joined together by a
revolute joint, with freedom of the front frame to steer relative to the rear

Page 51 of 97
frame. The model featured a 4 degree of freedom (DOF) model
corresponding to the lateral, yaw, roll and steer motions. The author
assumed that the bike only experienced small perturbations, allowing the
model to become linearised and the rider was modelled as being rigidly
attached to the main frame and was restrained from body lean movements.
The tyre forces were modelled as a linear function of the sideslip and wheel
camber angles (Sharp, 1971). After his seminal paper Sharp (1971)
developed the model further and published an advanced motorcycle model
that featured four rigid bodies connected together to simulate eight DOF
(Sharp, 1994). According to Nehaoua et al. (2013) the originality of this
model lies in the integration of the frame flexibilities and the riding tilting
motion.
Beghi et al. (2007) suggests in his paper on the modelling of a motorcycle
shock absorber for virtual prototyping applications that the conventional
linear models that are often used are often inadequate to describe the
behaviour of complex non-linear components. Alternative modelling
techniques are often required when dealing such components in a
suspension system, given that the shock absorber, which is arguably the
most important part of the system, exhibits non-linear and time variant
behaviour (Beghi et al., 2007).
Sharp et al. (2004) and Beghi et al. (2007) both highlight that the accuracy
of the predicted motorcycle behaviour depends heavily on the choice of
model selected as well as the accurate input parameter values. Sharp et al.
(2004) suggests that during cornering, the interaction between the in-plane
and out-of-plane modes makes effective analysis of the vehicle dynamics
complicated. The major issues regarding accurate modelling relate to the
representation of the frame flexibility, tyre-road contact geometry and the
tyre shear forces. Sharp et al. (2004) goes on further to suggest that many
previous authors findings relate to motorcycle and tyre descriptions which
are somewhat dated and use tyre models which have a limited domain of
applicability suggesting that significant development in this field could be
made.

Page 52 of 97
In one such paper by Breuer and Pruckner (1998), the possibility of using
multibody simulation tools such as ADAMS to simulate accurate motorbike
vehicle dynamics was discussed and in particular the weave mode
characteristics of the bike. The motorbike model constructed for the
simulation was simplified to consist of four parts: the main body with the
driver fixed on it, the steering system and both wheels with four DOF. This
is a significantly simplified model with many other authors such as Sharp
(1994) and Cossalter (2002) adopting to use motorcycle models with 8 and
11 DOF (Figure 18) respectively.
Figure 18- 11 Degree of Freedom Motorcycle Model (Cossalter, 2002)
Breuer and Pruckner (1998) identify in their paper using multibody
simulation that weave mode is an eigenvalue vibration, where the damping
coefficient of the system decreases with an increasing vehicle speed. They
use an eigenvalue analysis to ascertain different complex eigenvalue
results and explain that the real term produced by the eigenvalue analysis
indicates the damping ratio of the system whilst the imaginary term
presents the damped frequency. Figure 19 shows a comparison between
the eigenvalues in straight running (grey spots) and during cornering (black
spots) for a set lateral acceleration of 5m/s² as determined by Cossalter
(2002). The set lateral acceleration corresponds to a roll angle of 30° and
the velocity was varied from 3m/s to 60m/s during the simulation.
copyrighted image removed

Page 53 of 97
Figure 19- Root locus plot in steady state cornering with varying speed
(Cossalter, 2002)
If a given system is critically damped then the eigenvalue analysis will
provide no imaginary term with the sign of the real term in each eigenvalue
indicating the stability of the mode. A negative real term means stable
eigenvalues, a real term that is zero results in permanent yet limited
oscillatory behaviour and a positive real term relates to unstable system
behaviour (Figure 19 and 20) (Breuer and Pruckner, 1998; Cossalter et al.,
2002; Rajput et al., 2007).
copyrighted image removed
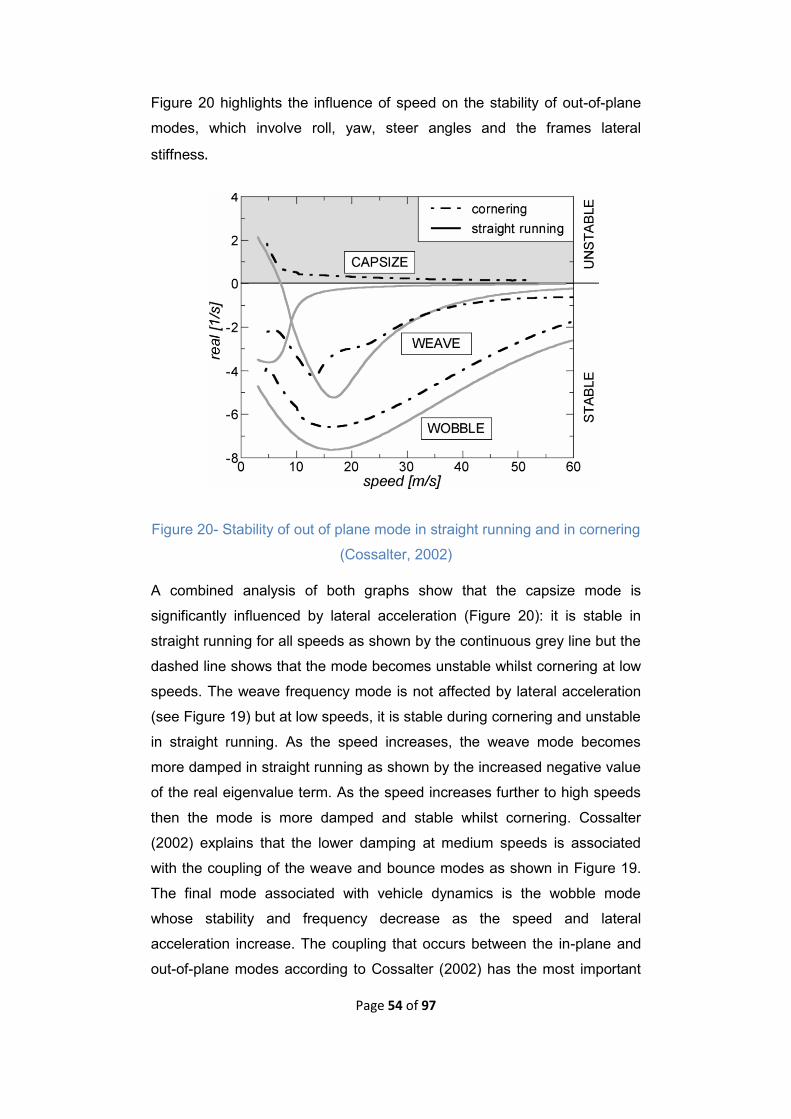
Page 54 of 97
Figure 20 highlights the influence of speed on the stability of out-of-plane
modes, which involve roll, yaw, steer angles and the frames lateral
stiffness.
Figure 20- Stability of out of plane mode in straight running and in cornering
(Cossalter, 2002)
A combined analysis of both graphs show that the capsize mode is
significantly influenced by lateral acceleration (Figure 20): it is stable in
straight running for all speeds as shown by the continuous grey line but the
dashed line shows that the mode becomes unstable whilst cornering at low
speeds. The weave frequency mode is not affected by lateral acceleration
(see Figure 19) but at low speeds, it is stable during cornering and unstable
in straight running. As the speed increases, the weave mode becomes
more damped in straight running as shown by the increased negative value
of the real eigenvalue term. As the speed increases further to high speeds
then the mode is more damped and stable whilst cornering. Cossalter
(2002) explains that the lower damping at medium speeds is associated
with the coupling of the weave and bounce modes as shown in Figure 19.
The final mode associated with vehicle dynamics is the wobble mode
whose stability and frequency decrease as the speed and lateral
acceleration increase. The coupling that occurs between the in-plane and
out-of-plane modes according to Cossalter (2002) has the most important
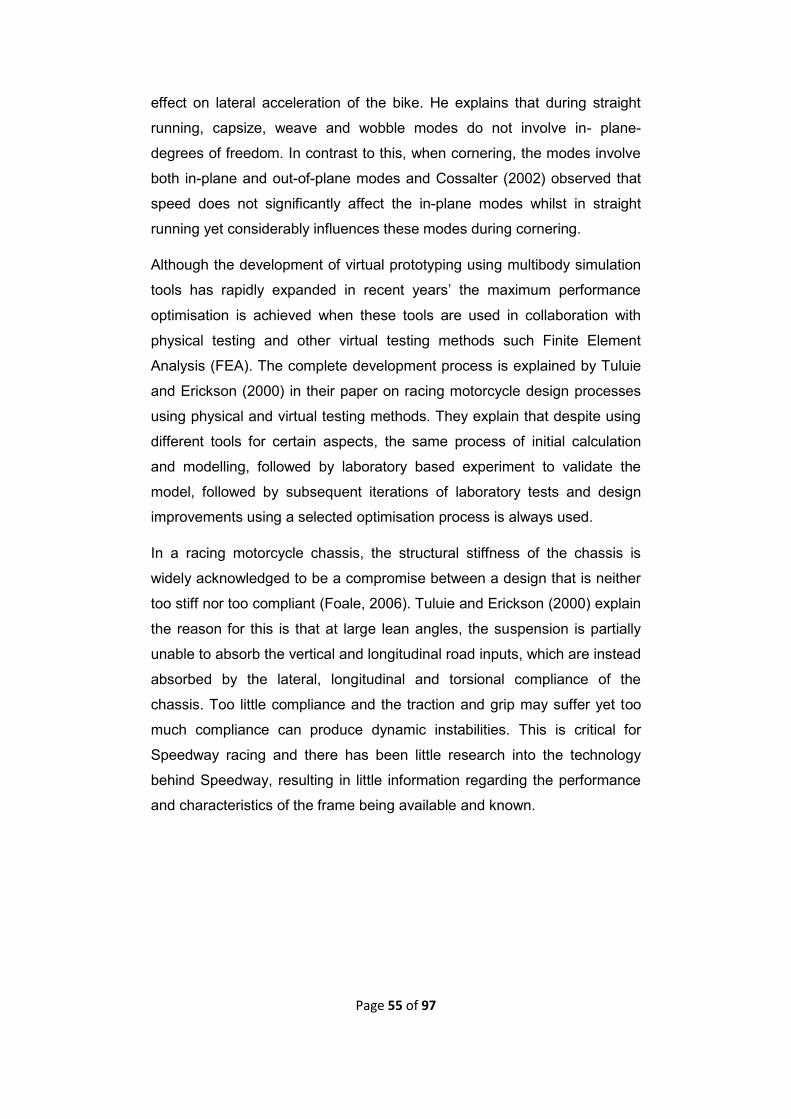
Page 55 of 97
effect on lateral acceleration of the bike. He explains that during straight
running, capsize, weave and wobble modes do not involve in- plane-
degrees of freedom. In contrast to this, when cornering, the modes involve
both in-plane and out-of-plane modes and Cossalter (2002) observed that
speed does not significantly affect the in-plane modes whilst in straight
running yet considerably influences these modes during cornering.
Although the development of virtual prototyping using multibody simulation
tools has rapidly expanded in recent years’ the maximum performance
optimisation is achieved when these tools are used in collaboration with
physical testing and other virtual testing methods such Finite Element
Analysis (FEA). The complete development process is explained by Tuluie
and Erickson (2000) in their paper on racing motorcycle design processes
using physical and virtual testing methods. They explain that despite using
different tools for certain aspects, the same process of initial calculation
and modelling, followed by laboratory based experiment to validate the
model, followed by subsequent iterations of laboratory tests and design
improvements using a selected optimisation process is always used.
In a racing motorcycle chassis, the structural stiffness of the chassis is
widely acknowledged to be a compromise between a design that is neither
too stiff nor too compliant (Foale, 2006). Tuluie and Erickson (2000) explain
the reason for this is that at large lean angles, the suspension is partially
unable to absorb the vertical and longitudinal road inputs, which are instead
absorbed by the lateral, longitudinal and torsional compliance of the
chassis. Too little compliance and the traction and grip may suffer yet too
much compliance can produce dynamic instabilities. This is critical for
Speedway racing and there has been little research into the technology
behind Speedway, resulting in little information regarding the performance
and characteristics of the frame being available and known.
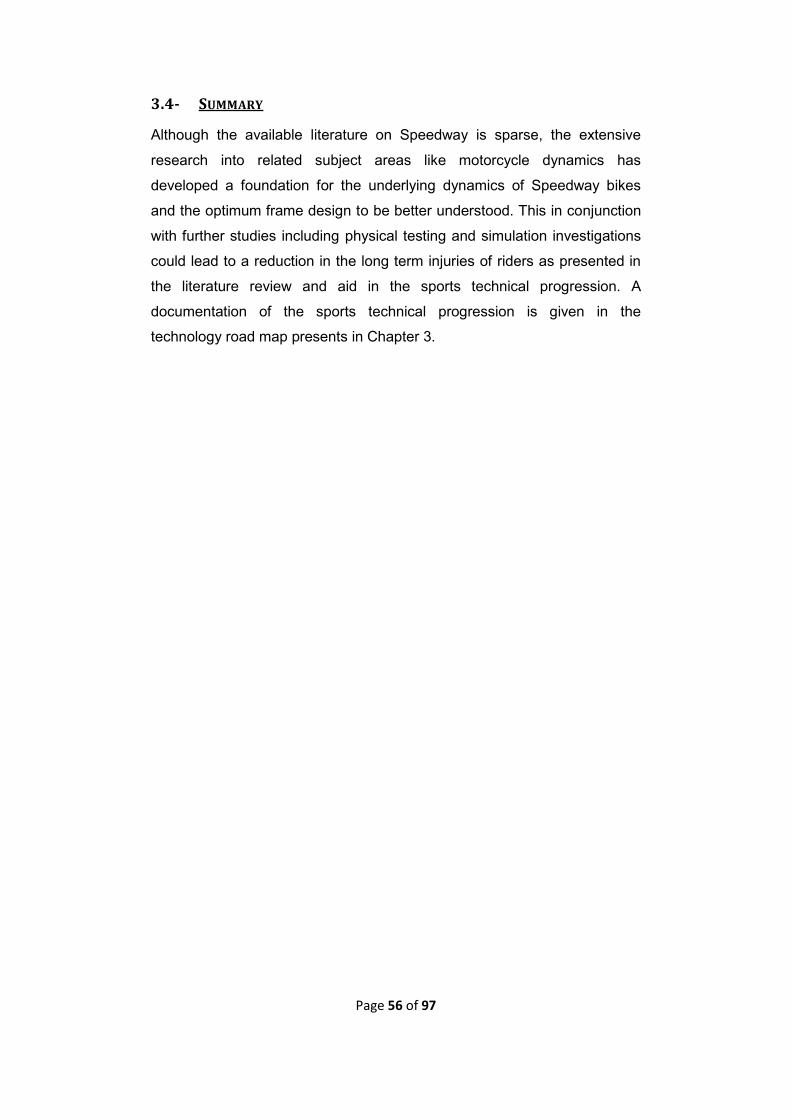
Page 56 of 97
3.4- SUMMARY
Although the available literature on Speedway is sparse, the extensive
research into related subject areas like motorcycle dynamics has
developed a foundation for the underlying dynamics of Speedway bikes
and the optimum frame design to be better understood. This in conjunction
with further studies including physical testing and simulation investigations
could lead to a reduction in the long term injuries of riders as presented in
the literature review and aid in the sports technical progression. A
documentation of the sports technical progression is given in the
technology road map presents in Chapter 3.
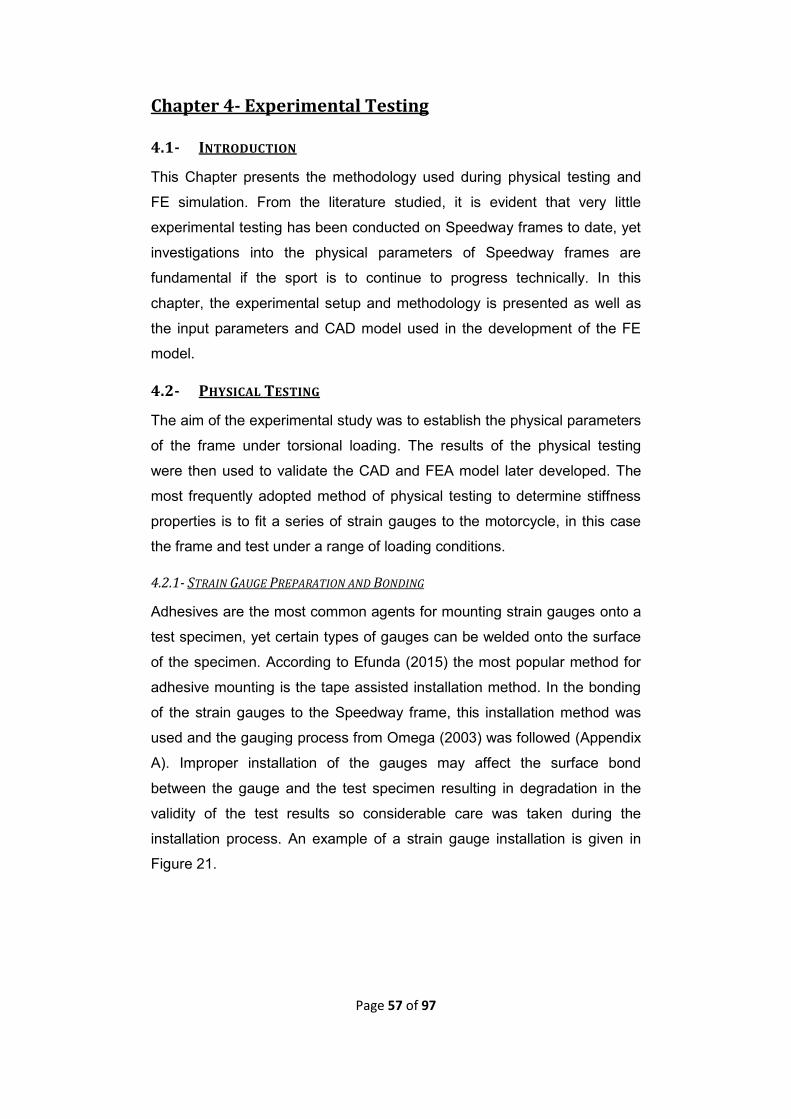
Page 57 of 97
Chapter 4- Experimental Testing
4.1- INTRODUCTION
This Chapter presents the methodology used during physical testing and
FE simulation. From the literature studied, it is evident that very little
experimental testing has been conducted on Speedway frames to date, yet
investigations into the physical parameters of Speedway frames are
fundamental if the sport is to continue to progress technically. In this
chapter, the experimental setup and methodology is presented as well as
the input parameters and CAD model used in the development of the FE
model.
4.2- PHYSICAL TESTING
The aim of the experimental study was to establish the physical parameters
of the frame under torsional loading. The results of the physical testing
were then used to validate the CAD and FEA model later developed. The
most frequently adopted method of physical testing to determine stiffness
properties is to fit a series of strain gauges to the motorcycle, in this case
the frame and test under a range of loading conditions.
4.2.1- STRAIN GAUGE PREPARATION AND BONDING
Adhesives are the most common agents for mounting strain gauges onto a
test specimen, yet certain types of gauges can be welded onto the surface
of the specimen. According to Efunda (2015) the most popular method for
adhesive mounting is the tape assisted installation method. In the bonding
of the strain gauges to the Speedway frame, this installation method was
used and the gauging process from Omega (2003) was followed (Appendix
A). Improper installation of the gauges may affect the surface bond
between the gauge and the test specimen resulting in degradation in the
validity of the test results so considerable care was taken during the
installation process. An example of a strain gauge installation is given in
Figure 21.
Page 58 of 97
Figure 21- Strain Gauge Bonded to the Test Specimen
4.2.2- POSITIONING OF STRAIN GAUGES
In total there were seven strain gauges bonded to the Speedway bike
frame in various positions on the main frame and sub frame assemblies
(Figures 22 and 23).
Figure 22- Speedway Main Frame with Strain Gauges
Figure 23- Speedway Sub-Frame with Strain Gauges
SG1
SG2
SG3
SG4
SG5
SG6
SG7
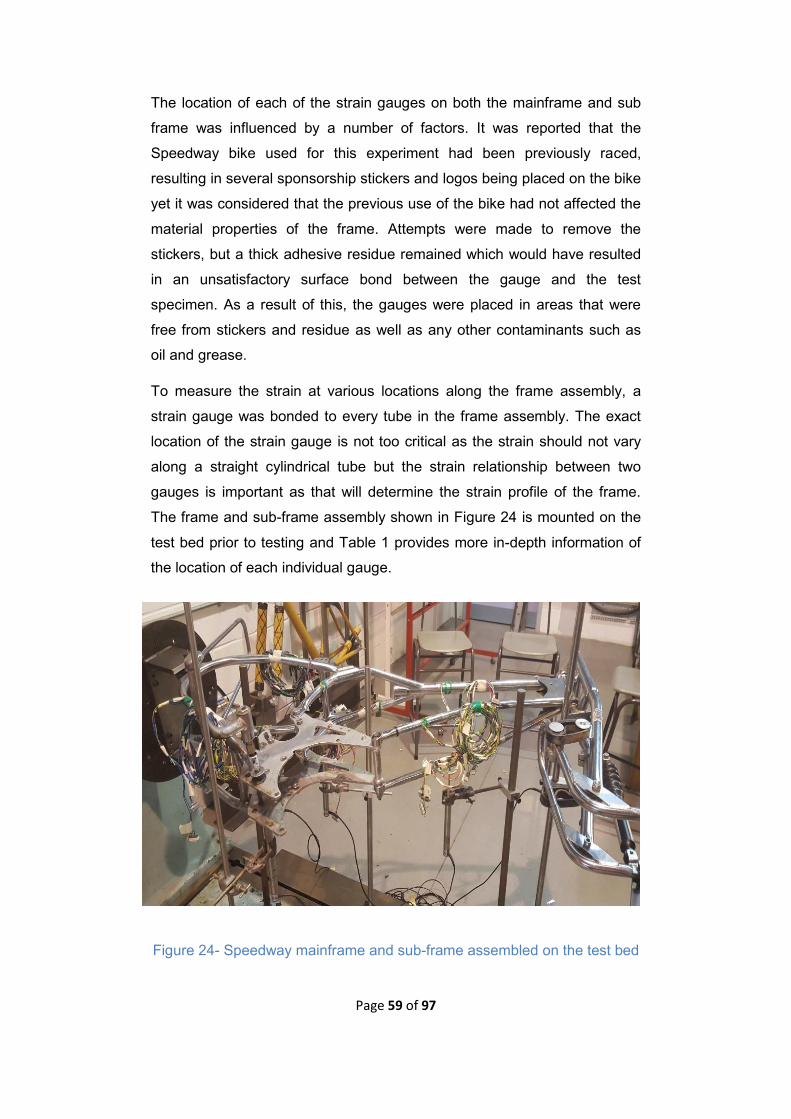
Page 59 of 97
The location of each of the strain gauges on both the mainframe and sub
frame was influenced by a number of factors. It was reported that the
Speedway bike used for this experiment had been previously raced,
resulting in several sponsorship stickers and logos being placed on the bike
yet it was considered that the previous use of the bike had not affected the
material properties of the frame. Attempts were made to remove the
stickers, but a thick adhesive residue remained which would have resulted
in an unsatisfactory surface bond between the gauge and the test
specimen. As a result of this, the gauges were placed in areas that were
free from stickers and residue as well as any other contaminants such as
oil and grease.
To measure the strain at various locations along the frame assembly, a
strain gauge was bonded to every tube in the frame assembly. The exact
location of the strain gauge is not too critical as the strain should not vary
along a straight cylindrical tube but the strain relationship between two
gauges is important as that will determine the strain profile of the frame.
The frame and sub-frame assembly shown in Figure 24 is mounted on the
test bed prior to testing and Table 1 provides more in-depth information of
the location of each individual gauge.
Figure 24- Speedway mainframe and sub-frame assembled on the test bed
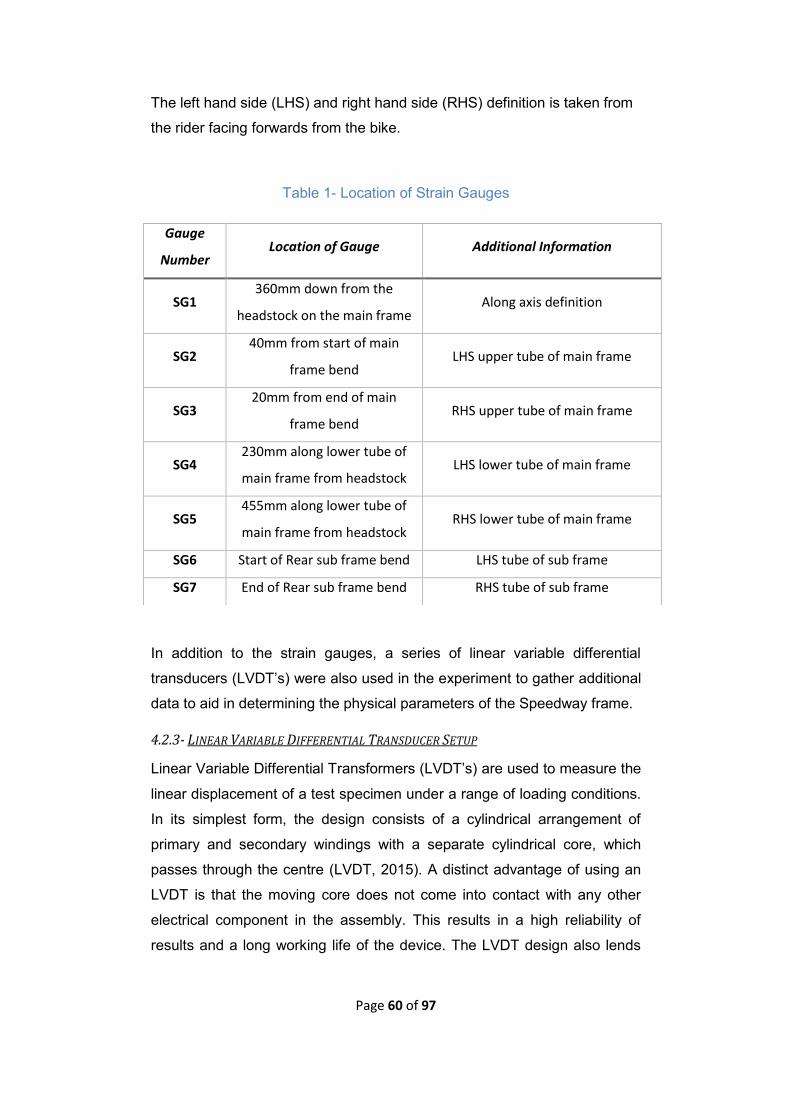
Page 60 of 97
The left hand side (LHS) and right hand side (RHS) definition is taken from
the rider facing forwards from the bike.
Table 1- Location of Strain Gauges
In addition to the strain gauges, a series of linear variable differential
transducers (LVDT’s) were also used in the experiment to gather additional
data to aid in determining the physical parameters of the Speedway frame.
4.2.3- LINEAR VARIABLE DIFFERENTIAL TRANSDUCER SETUP
Linear Variable Differential Transformers (LVDT’s) are used to measure the
linear displacement of a test specimen under a range of loading conditions.
In its simplest form, the design consists of a cylindrical arrangement of
primary and secondary windings with a separate cylindrical core, which
passes through the centre (LVDT, 2015). A distinct advantage of using an
LVDT is that the moving core does not come into contact with any other
electrical component in the assembly. This results in a high reliability of
results and a long working life of the device. The LVDT design also lends
Gauge
Number Location of Gauge Additional Information
SG1 360mm down from the
headstock on the main frame Along axis definition
SG2 40mm from start of main
frame bend LHS upper tube of main frame
SG3 20mm from end of main
frame bend RHS upper tube of main frame
SG4 230mm along lower tube of
main frame from headstock LHS lower tube of main frame
SG5 455mm along lower tube of
main frame from headstock RHS lower tube of main frame
SG6 Start of Rear sub frame bend LHS tube of sub frame
SG7 End of Rear sub frame bend RHS tube of sub frame
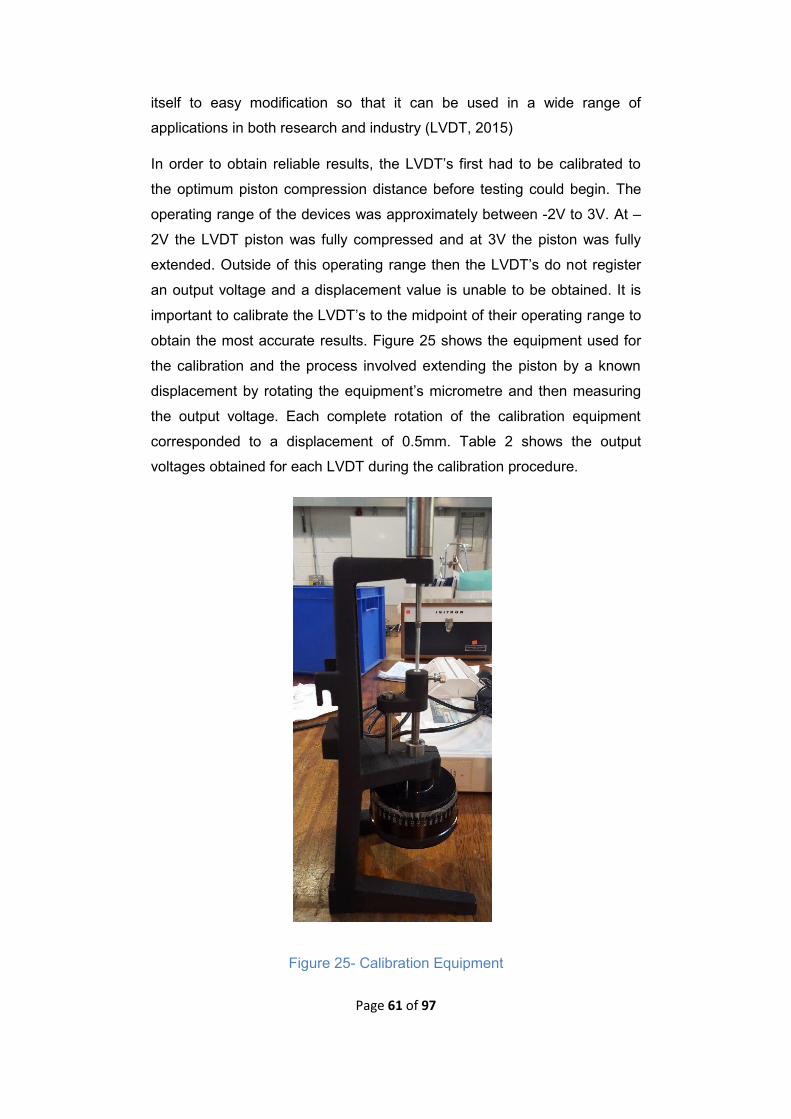
Page 61 of 97
itself to easy modification so that it can be used in a wide range of
applications in both research and industry (LVDT, 2015)
In order to obtain reliable results, the LVDT’s first had to be calibrated to
the optimum piston compression distance before testing could begin. The
operating range of the devices was approximately between -2V to 3V. At –
2V the LVDT piston was fully compressed and at 3V the piston was fully
extended. Outside of this operating range then the LVDT’s do not register
an output voltage and a displacement value is unable to be obtained. It is
important to calibrate the LVDT’s to the midpoint of their operating range to
obtain the most accurate results. Figure 25 shows the equipment used for
the calibration and the process involved extending the piston by a known
displacement by rotating the equipment’s micrometre and then measuring
the output voltage. Each complete rotation of the calibration equipment
corresponded to a displacement of 0.5mm. Table 2 shows the output
voltages obtained for each LVDT during the calibration procedure.
Figure 25- Calibration Equipment
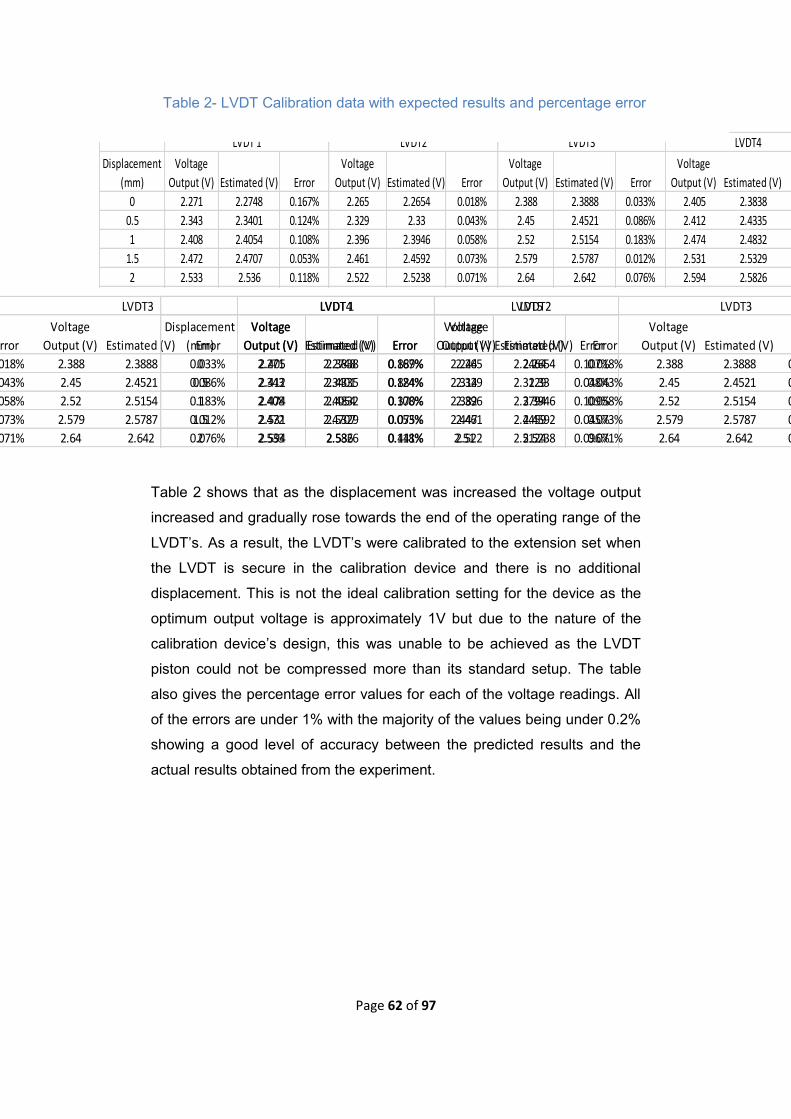
Page 62 of 97
Table 2 shows that as the displacement was increased the voltage output
increased and gradually rose towards the end of the operating range of the
LVDT’s. As a result, the LVDT’s were calibrated to the extension set when
the LVDT is secure in the calibration device and there is no additional
displacement. This is not the ideal calibration setting for the device as the
optimum output voltage is approximately 1V but due to the nature of the
calibration device’s design, this was unable to be achieved as the LVDT
piston could not be compressed more than its standard setup. The table
also gives the percentage error values for each of the voltage readings. All
of the errors are under 1% with the majority of the values being under 0.2%
showing a good level of accuracy between the predicted results and the
actual results obtained from the experiment.
Displacement
(mm)
Voltage
Output (V) Estimated (V) Error
Voltage
Output (V) Estimated (V) Error
Voltage
Output (V) Estimated (V) Error
Voltage
Output (V) Estimated (V) Error
Voltage
Output (V) Estimated (V) Error
0 2.271 2.2748 0.167% 2.265 2.2654 0.018% 2.388 2.3888 0.033% 2.405 2.3838 0.889% 2.244 2.2464 0.107%
0.5 2.343 2.3401 0.124% 2.329 2.33 0.043% 2.45 2.4521 0.086% 2.412 2.4335 0.884% 2.314 2.3129 0.048%
1 2.408 2.4054 0.108% 2.396 2.3946 0.058% 2.52 2.5154 0.183% 2.474 2.4832 0.370% 2.382 2.3794 0.109%
1.5 2.472 2.4707 0.053% 2.461 2.4592 0.073% 2.579 2.5787 0.012% 2.531 2.5329 0.075% 2.447 2.4459 0.045%
2 2.533 2.536 0.118% 2.522 2.5238 0.071% 2.64 2.642 0.076% 2.594 2.5826 0.441% 2.51 2.5124 0.096%
LVDT2 LVDT3 LVDT4 LVDT5LVDT 1
Table 2- LVDT Calibration data with expected results and percentage error
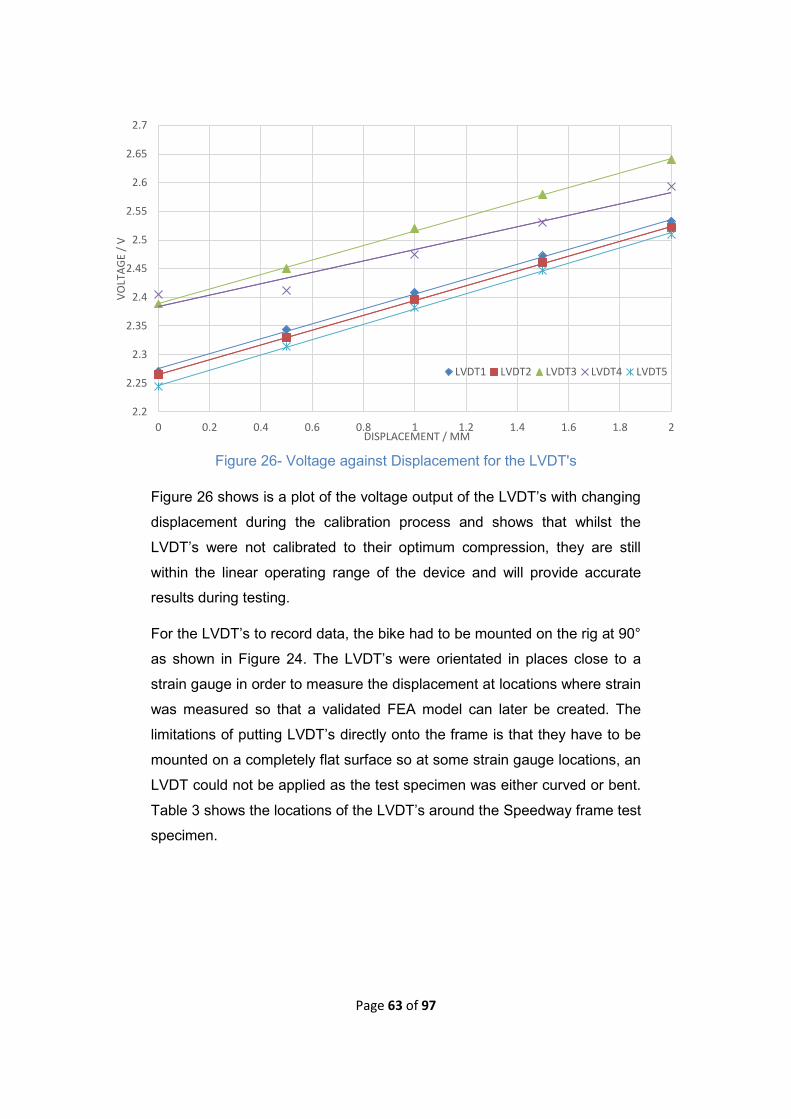
Page 63 of 97
2.2
2.25
2.3
2.35
2.4
2.45
2.5
2.55
2.6
2.65
2.7
0 0.2 0.4 0.6 0.8 1 1.2 1.4 1.6 1.8 2
VO
LTA
GE
/ V
DISPLACEMENT / MM
LVDT1 LVDT2 LVDT3 LVDT4 LVDT5
Figure 26- Voltage against Displacement for the LVDT's
Figure 26 shows is a plot of the voltage output of the LVDT’s with changing
displacement during the calibration process and shows that whilst the
LVDT’s were not calibrated to their optimum compression, they are still
within the linear operating range of the device and will provide accurate
results during testing.
For the LVDT’s to record data, the bike had to be mounted on the rig at 90°
as shown in Figure 24. The LVDT’s were orientated in places close to a
strain gauge in order to measure the displacement at locations where strain
was measured so that a validated FEA model can later be created. The
limitations of putting LVDT’s directly onto the frame is that they have to be
mounted on a completely flat surface so at some strain gauge locations, an
LVDT could not be applied as the test specimen was either curved or bent.
Table 3 shows the locations of the LVDT’s around the Speedway frame test
specimen.

Page 64 of 97
Table 3 - Location of LVDT's
The data obtained from the LVDT’s and strain gauges during testing were
recorded using a Spider 8 data acquisition system (HBM, 2007.). The
system was set up to calculate additional parameters such as the principal
strains and principal angle using the data obtained from the gauges in
addition to material properties such as the Young’s modulus and Poissons
ratio.
As a result of the number of gauges bonded to the frame and the number of
available ports on the Spider 8, the frame was tested in two stages to allow
all of the gauges to be tested. In the first test, gauges 1, 3, 4 and 7 were
tested and the second run consisted of the remaining three gauges.
A Radicon- Avery Denison torsion test rig (Figure 27) was used in the
experiment and whilst the equipment has no facility for outputting an
electrical torque signal, the value can be read from the dial on the rig. The
machine works by engaging a clutch and motor system and applying a
rotational displacement to the test specimen.
LVDT
Number Location of LVDT Additional Notes
LVDT 1 In the centre of the headstock plate
LVDT 2 175mm from top rear sub frame
connecting spindle
15mm from Gauge 6
(LHS sub frame)
LVDT 3 140mm from SG4 60% of way down LHS
lower main frame tube
LVDT 4 50% of way down LHS main tube
frame Close to SG2
LVDT 5 Engine plate Towards outer edge of
plate
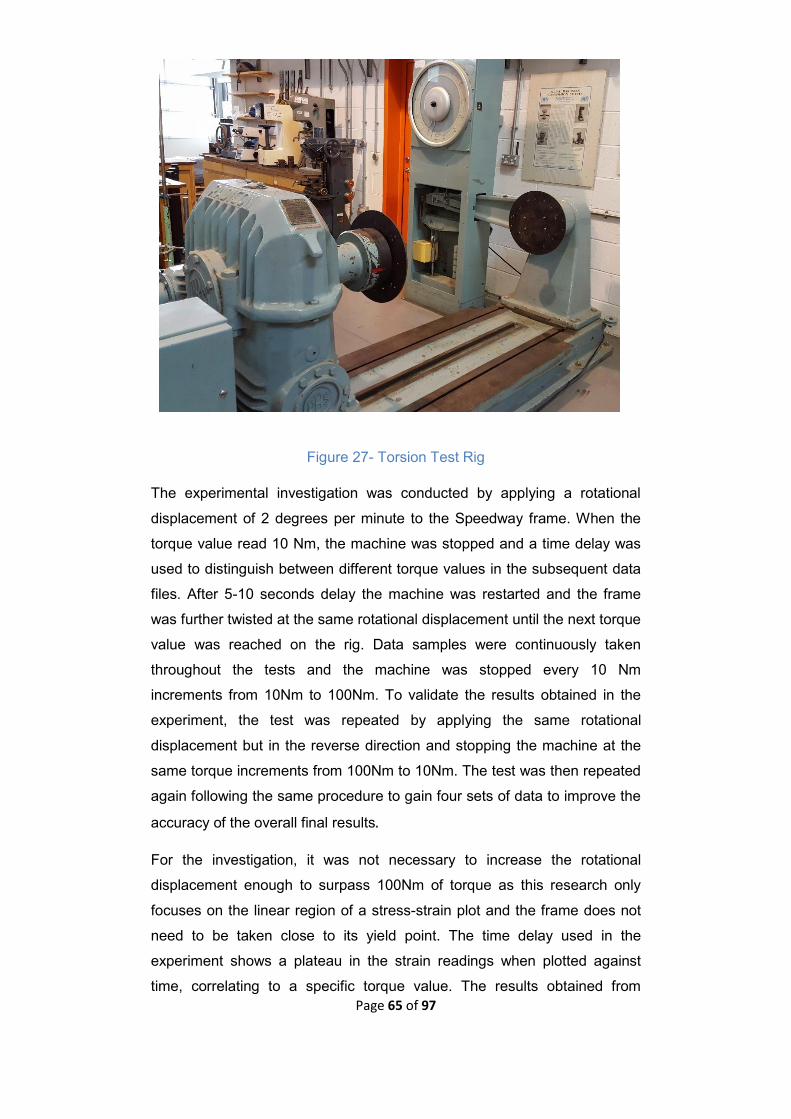
Page 65 of 97
Figure 27- Torsion Test Rig
The experimental investigation was conducted by applying a rotational
displacement of 2 degrees per minute to the Speedway frame. When the
torque value read 10 Nm, the machine was stopped and a time delay was
used to distinguish between different torque values in the subsequent data
files. After 5-10 seconds delay the machine was restarted and the frame
was further twisted at the same rotational displacement until the next torque
value was reached on the rig. Data samples were continuously taken
throughout the tests and the machine was stopped every 10 Nm
increments from 10Nm to 100Nm. To validate the results obtained in the
experiment, the test was repeated by applying the same rotational
displacement but in the reverse direction and stopping the machine at the
same torque increments from 100Nm to 10Nm. The test was then repeated
again following the same procedure to gain four sets of data to improve the
accuracy of the overall final results.
For the investigation, it was not necessary to increase the rotational
displacement enough to surpass 100Nm of torque as this research only
focuses on the linear region of a stress-strain plot and the frame does not
need to be taken close to its yield point. The time delay used in the
experiment shows a plateau in the strain readings when plotted against
time, correlating to a specific torque value. The results obtained from
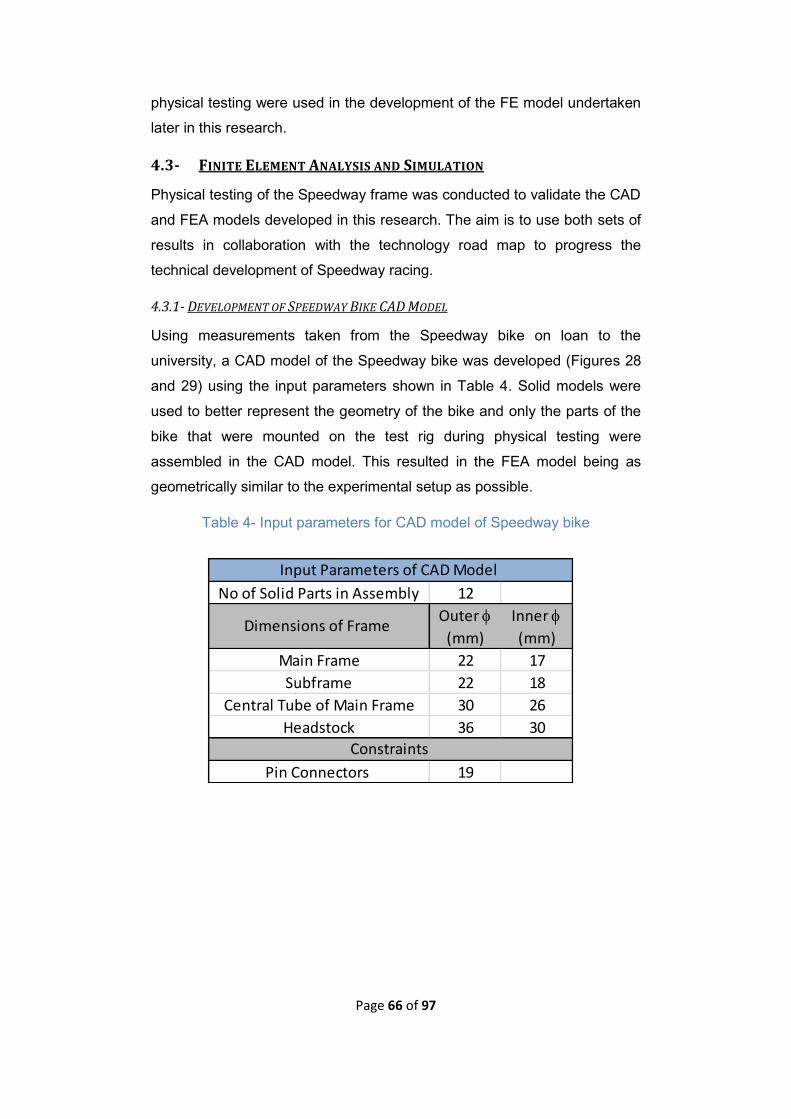
Page 66 of 97
physical testing were used in the development of the FE model undertaken
later in this research.
4.3- FINITE ELEMENT ANALYSIS AND SIMULATION
Physical testing of the Speedway frame was conducted to validate the CAD
and FEA models developed in this research. The aim is to use both sets of
results in collaboration with the technology road map to progress the
technical development of Speedway racing.
4.3.1- DEVELOPMENT OF SPEEDWAY BIKE CAD MODEL
Using measurements taken from the Speedway bike on loan to the
university, a CAD model of the Speedway bike was developed (Figures 28
and 29) using the input parameters shown in Table 4. Solid models were
used to better represent the geometry of the bike and only the parts of the
bike that were mounted on the test rig during physical testing were
assembled in the CAD model. This resulted in the FEA model being as
geometrically similar to the experimental setup as possible.
Table 4- Input parameters for CAD model of Speedway bike
No of Solid Parts in Assembly 12
Outer f Inner f
(mm) (mm)
Main Frame 22 17
Subframe 22 18
Central Tube of Main Frame 30 26
Headstock 36 30
Pin Connectors 19
Input Parameters of CAD Model
Dimensions of Frame
Constraints
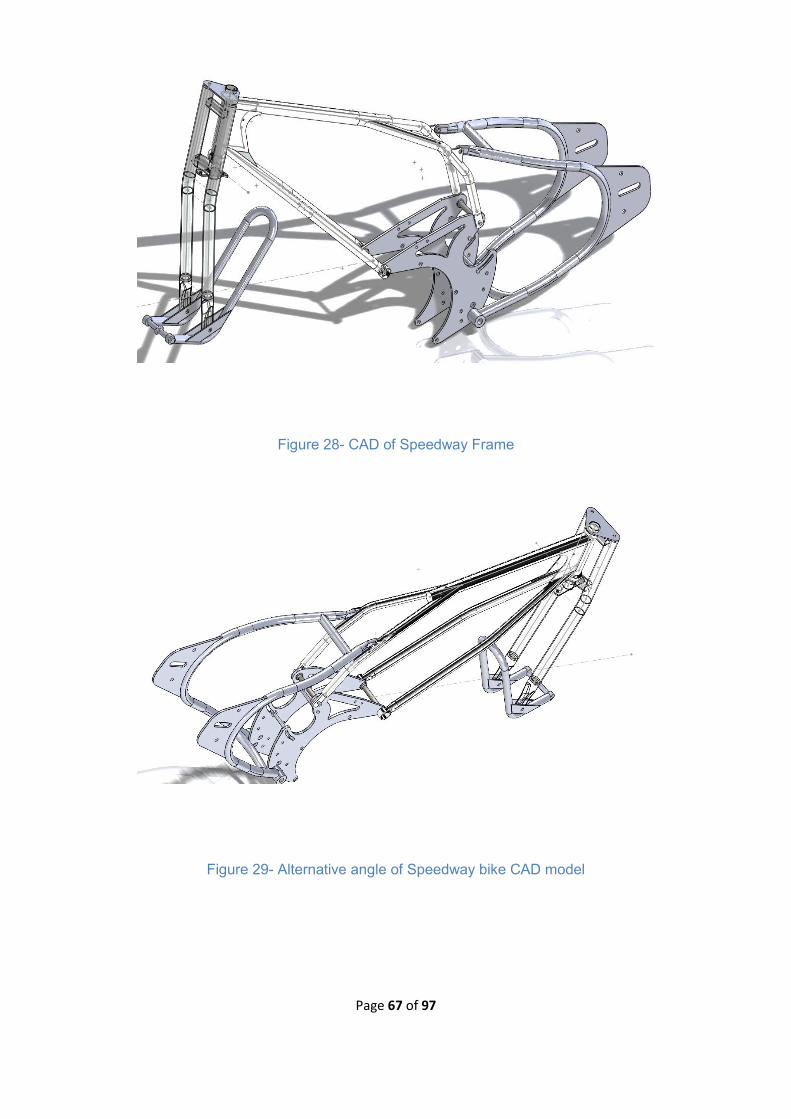
Page 67 of 97
Figure 28- CAD of Speedway Frame
Figure 29- Alternative angle of Speedway bike CAD model
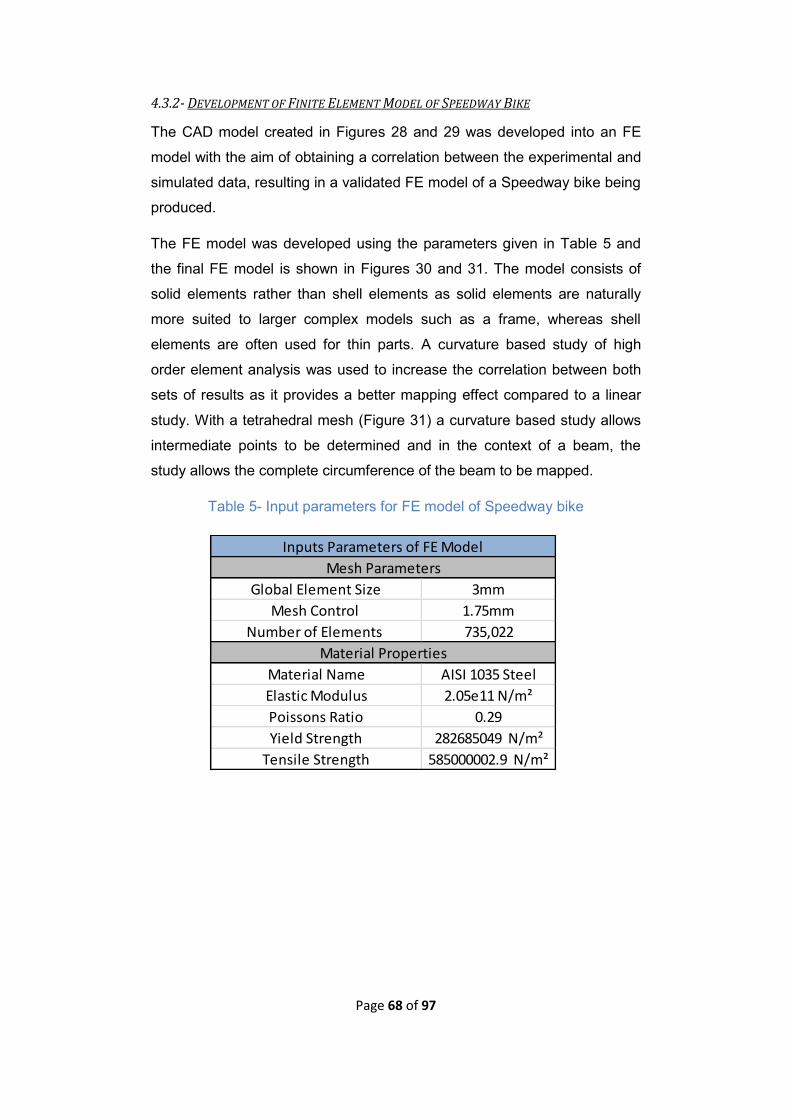
Page 68 of 97
4.3.2- DEVELOPMENT OF FINITE ELEMENT MODEL OF SPEEDWAY BIKE
The CAD model created in Figures 28 and 29 was developed into an FE
model with the aim of obtaining a correlation between the experimental and
simulated data, resulting in a validated FE model of a Speedway bike being
produced.
The FE model was developed using the parameters given in Table 5 and
the final FE model is shown in Figures 30 and 31. The model consists of
solid elements rather than shell elements as solid elements are naturally
more suited to larger complex models such as a frame, whereas shell
elements are often used for thin parts. A curvature based study of high
order element analysis was used to increase the correlation between both
sets of results as it provides a better mapping effect compared to a linear
study. With a tetrahedral mesh (Figure 31) a curvature based study allows
intermediate points to be determined and in the context of a beam, the
study allows the complete circumference of the beam to be mapped.
Table 5- Input parameters for FE model of Speedway bike
Global Element Size 3mm
Mesh Control 1.75mm
Number of Elements 735,022
Material Name AISI 1035 Steel
Elastic Modulus 2.05e11 N/m²
Poissons Ratio 0.29
Yield Strength 282685049 N/m²
Tensile Strength 585000002.9 N/m²
Mesh Parameters
Inputs Parameters of FE Model
Material Properties
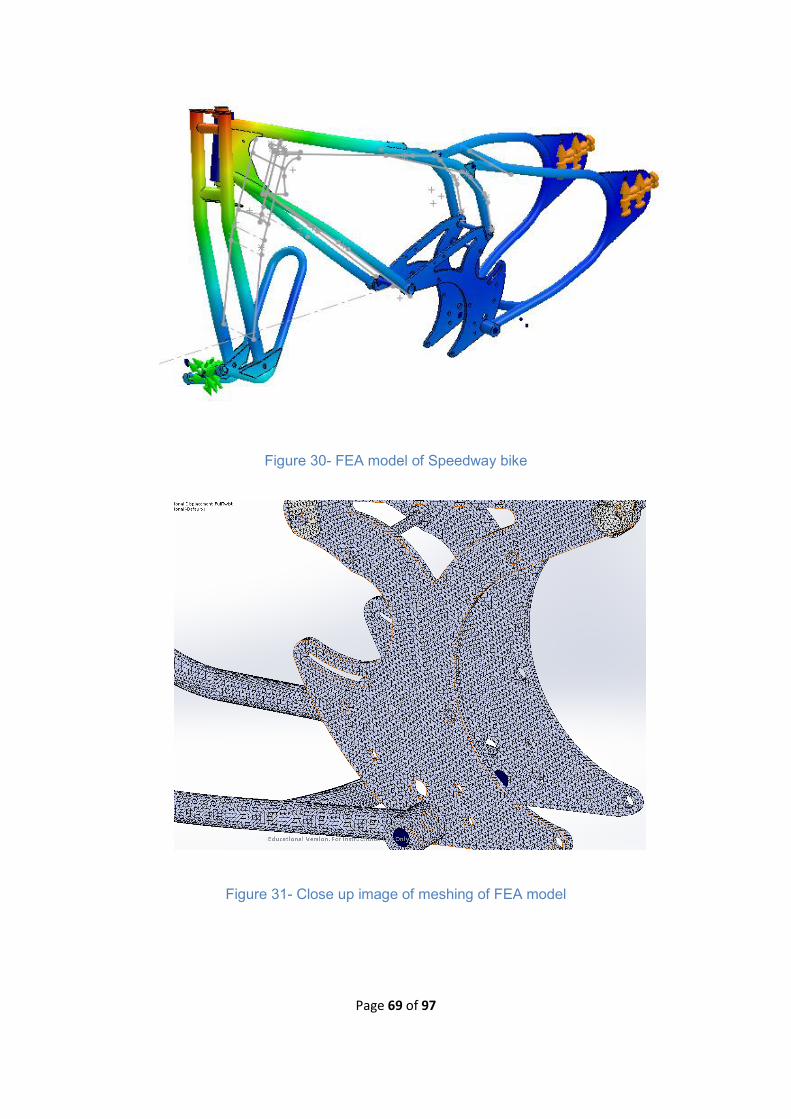
Page 69 of 97
Figure 30- FEA model of Speedway bike
Figure 31- Close up image of meshing of FEA model
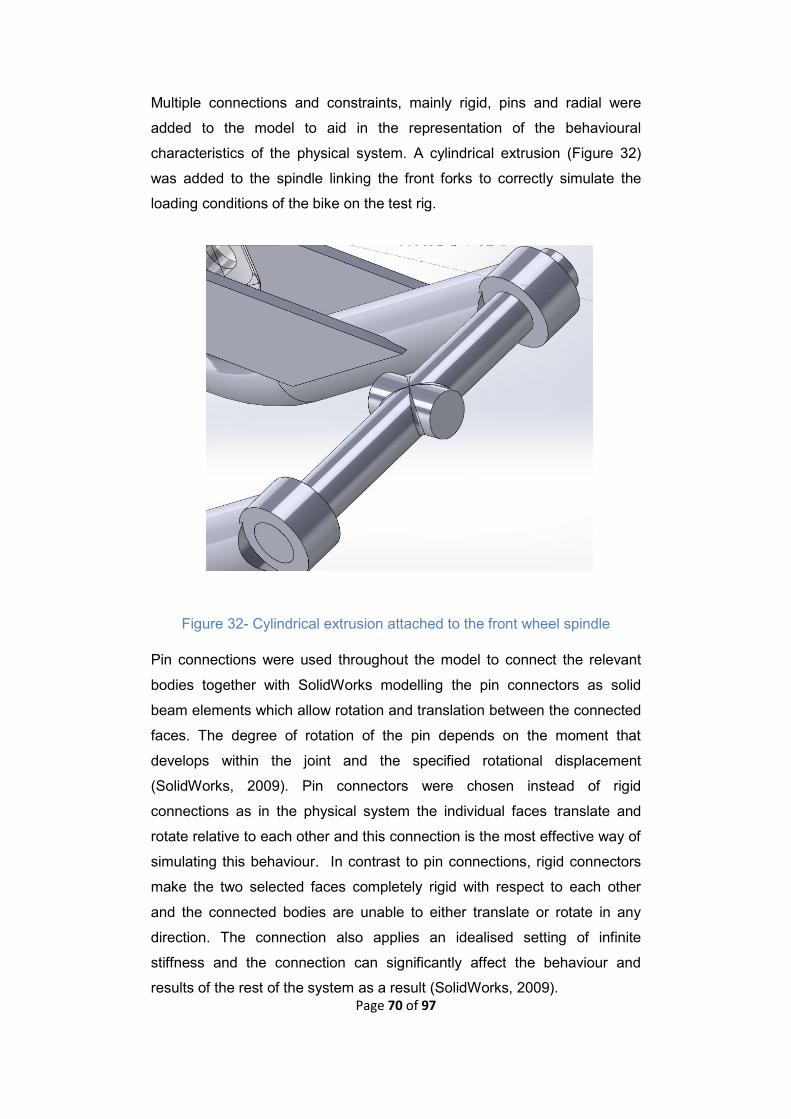
Page 70 of 97
Multiple connections and constraints, mainly rigid, pins and radial were
added to the model to aid in the representation of the behavioural
characteristics of the physical system. A cylindrical extrusion (Figure 32)
was added to the spindle linking the front forks to correctly simulate the
loading conditions of the bike on the test rig.
Figure 32- Cylindrical extrusion attached to the front wheel spindle
Pin connections were used throughout the model to connect the relevant
bodies together with SolidWorks modelling the pin connectors as solid
beam elements which allow rotation and translation between the connected
faces. The degree of rotation of the pin depends on the moment that
develops within the joint and the specified rotational displacement
(SolidWorks, 2009). Pin connectors were chosen instead of rigid
connections as in the physical system the individual faces translate and
rotate relative to each other and this connection is the most effective way of
simulating this behaviour. In contrast to pin connections, rigid connectors
make the two selected faces completely rigid with respect to each other
and the connected bodies are unable to either translate or rotate in any
direction. The connection also applies an idealised setting of infinite
stiffness and the connection can significantly affect the behaviour and
results of the rest of the system as a result (SolidWorks, 2009).
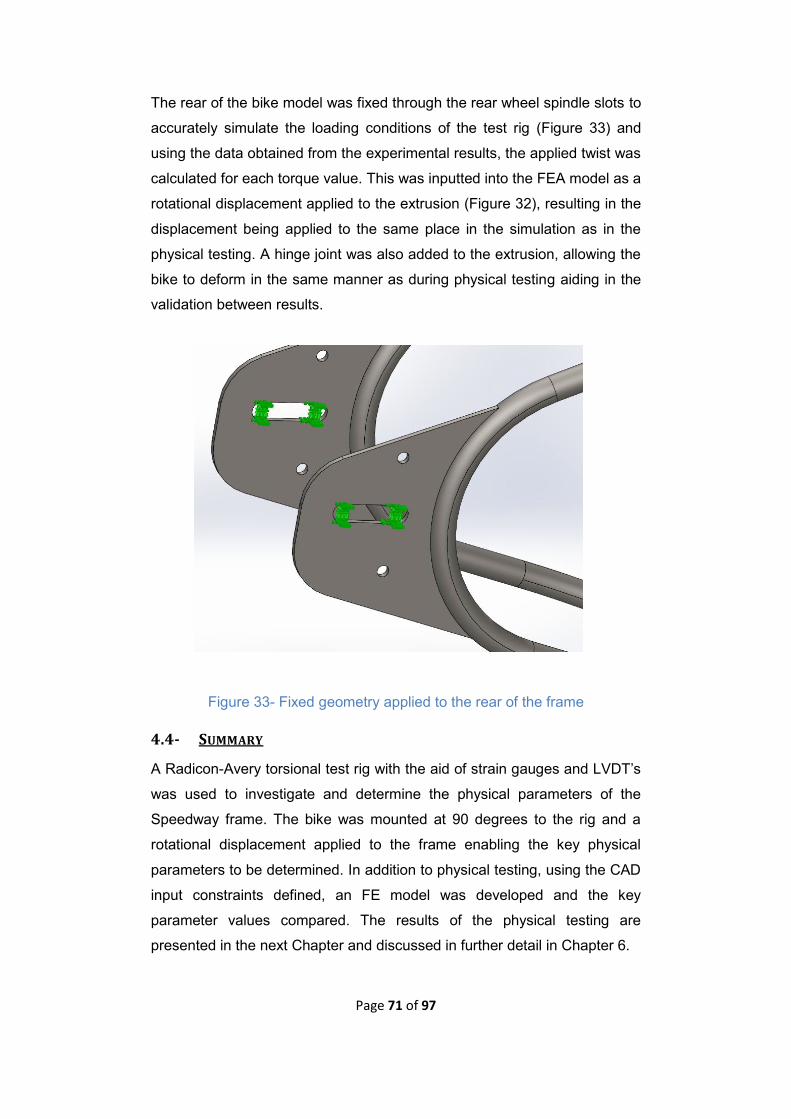
Page 71 of 97
The rear of the bike model was fixed through the rear wheel spindle slots to
accurately simulate the loading conditions of the test rig (Figure 33) and
using the data obtained from the experimental results, the applied twist was
calculated for each torque value. This was inputted into the FEA model as a
rotational displacement applied to the extrusion (Figure 32), resulting in the
displacement being applied to the same place in the simulation as in the
physical testing. A hinge joint was also added to the extrusion, allowing the
bike to deform in the same manner as during physical testing aiding in the
validation between results.
Figure 33- Fixed geometry applied to the rear of the frame
4.4- SUMMARY
A Radicon-Avery torsional test rig with the aid of strain gauges and LVDT’s
was used to investigate and determine the physical parameters of the
Speedway frame. The bike was mounted at 90 degrees to the rig and a
rotational displacement applied to the frame enabling the key physical
parameters to be determined. In addition to physical testing, using the CAD
input constraints defined, an FE model was developed and the key
parameter values compared. The results of the physical testing are
presented in the next Chapter and discussed in further detail in Chapter 6.
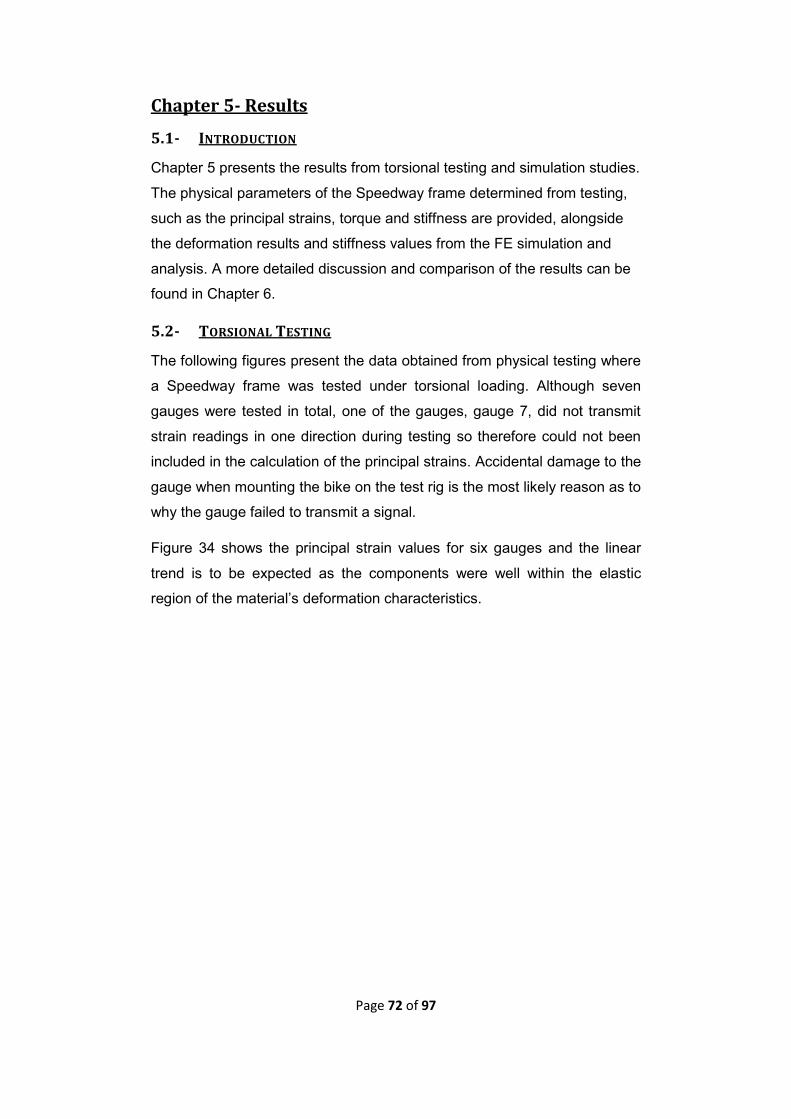
Page 72 of 97
Chapter 5- Results
5.1- INTRODUCTION
Chapter 5 presents the results from torsional testing and simulation studies.
The physical parameters of the Speedway frame determined from testing,
such as the principal strains, torque and stiffness are provided, alongside
the deformation results and stiffness values from the FE simulation and
analysis. A more detailed discussion and comparison of the results can be
found in Chapter 6.
5.2- TORSIONAL TESTING
The following figures present the data obtained from physical testing where
a Speedway frame was tested under torsional loading. Although seven
gauges were tested in total, one of the gauges, gauge 7, did not transmit
strain readings in one direction during testing so therefore could not been
included in the calculation of the principal strains. Accidental damage to the
gauge when mounting the bike on the test rig is the most likely reason as to
why the gauge failed to transmit a signal.
Figure 34 shows the principal strain values for six gauges and the linear
trend is to be expected as the components were well within the elastic
region of the material’s deformation characteristics.
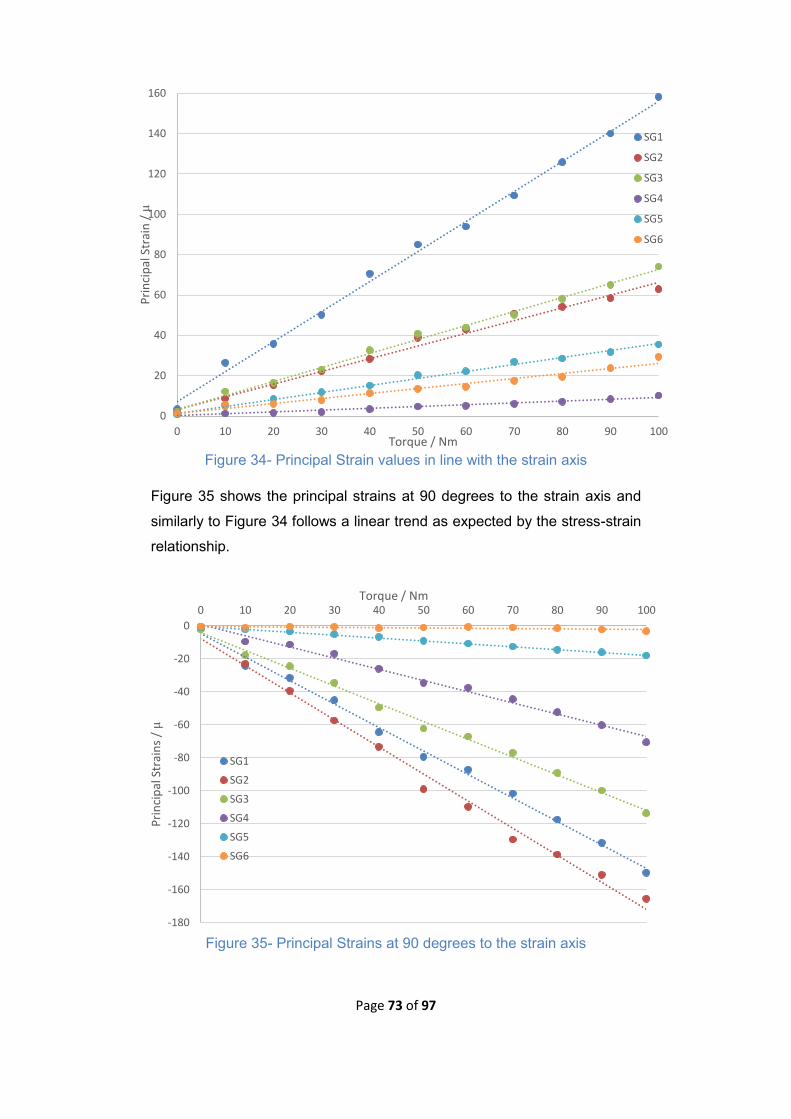
Page 73 of 97
Figure 34- Principal Strain values in line with the strain axis
Figure 35 shows the principal strains at 90 degrees to the strain axis and
similarly to Figure 34 follows a linear trend as expected by the stress-strain
relationship.
Figure 35- Principal Strains at 90 degrees to the strain axis -180
-160
-140
-120
-100
-80
-60
-40
-20
0
0 10 20 30 40 50 60 70 80 90 100
Pri
nci
pal
Str
ain
s / μ
Torque / Nm
SG1
SG2
SG3
SG4
SG5
SG6
0
20
40
60
80
100
120
140
160
0 10 20 30 40 50 60 70 80 90 100
Pri
nci
pal
Str
ain
/ μ
Torque / Nm
SG1
SG2
SG3
SG4
SG5
SG6
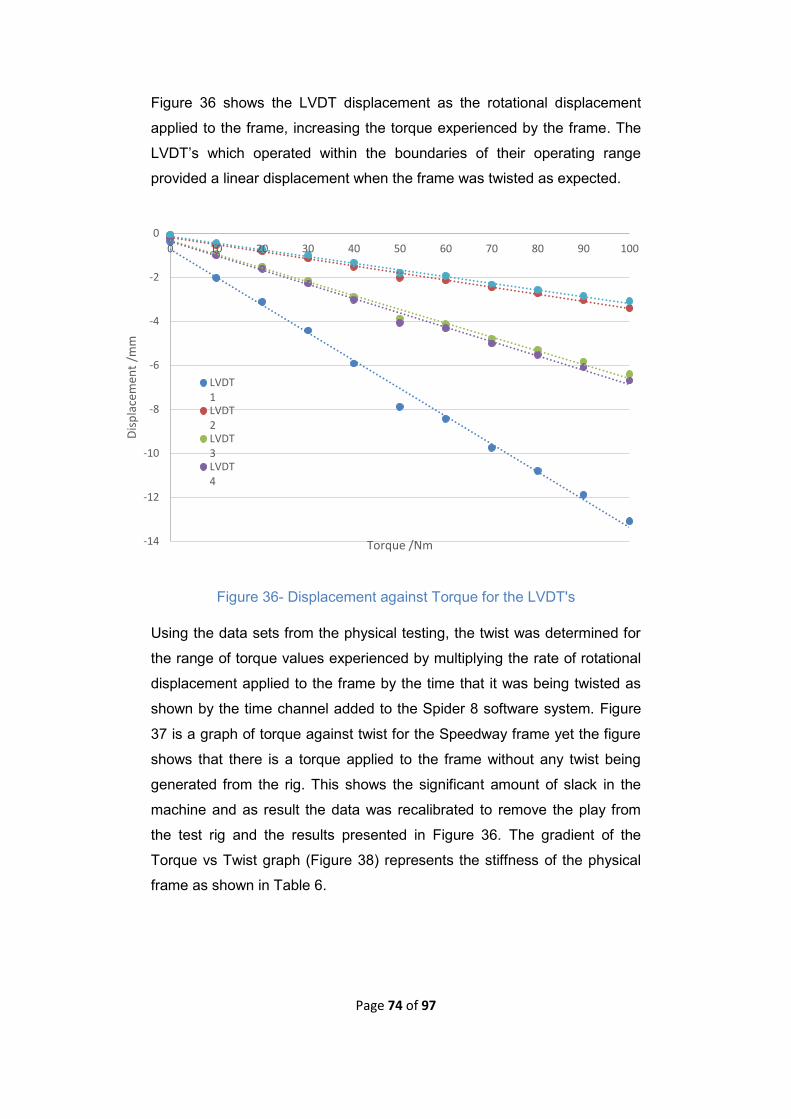
Page 74 of 97
Figure 36 shows the LVDT displacement as the rotational displacement
applied to the frame, increasing the torque experienced by the frame. The
LVDT’s which operated within the boundaries of their operating range
provided a linear displacement when the frame was twisted as expected.
Figure 36- Displacement against Torque for the LVDT's
Using the data sets from the physical testing, the twist was determined for
the range of torque values experienced by multiplying the rate of rotational
displacement applied to the frame by the time that it was being twisted as
shown by the time channel added to the Spider 8 software system. Figure
37 is a graph of torque against twist for the Speedway frame yet the figure
shows that there is a torque applied to the frame without any twist being
generated from the rig. This shows the significant amount of slack in the
machine and as result the data was recalibrated to remove the play from
the test rig and the results presented in Figure 36. The gradient of the
Torque vs Twist graph (Figure 38) represents the stiffness of the physical
frame as shown in Table 6.
-14
-12
-10
-8
-6
-4
-2
0
0 10 20 30 40 50 60 70 80 90 100
Dis
pla
cem
ent
/mm
Torque /Nm
LVDT1LVDT2LVDT3LVDT4
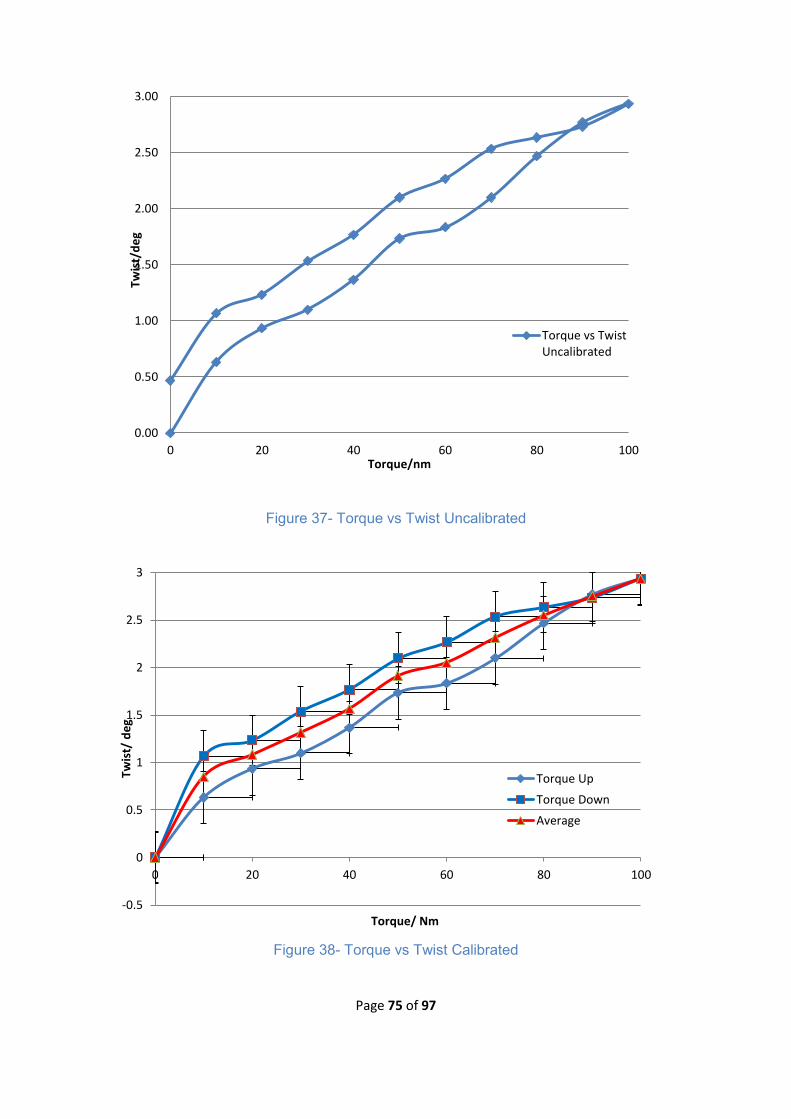
Page 75 of 97
Figure 37- Torque vs Twist Uncalibrated
Figure 38- Torque vs Twist Calibrated
0.00
0.50
1.00
1.50
2.00
2.50
3.00
0 20 40 60 80 100
Twis
t/d
eg
Torque/nm
Torque vs TwistUncalibrated
-0.5
0
0.5
1
1.5
2
2.5
3
0 20 40 60 80 100
Twis
t/ d
eg
Torque/ Nm
Torque Up
Torque Down
Average
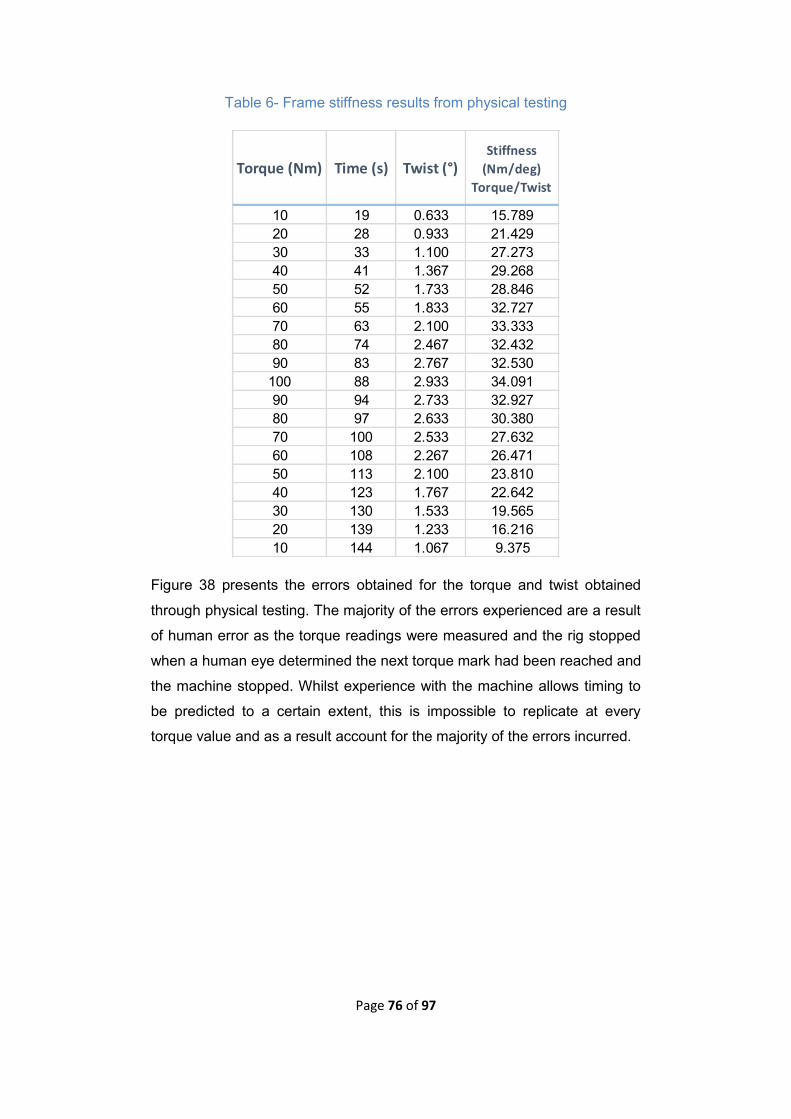
Page 76 of 97
Table 6- Frame stiffness results from physical testing
Figure 38 presents the errors obtained for the torque and twist obtained
through physical testing. The majority of the errors experienced are a result
of human error as the torque readings were measured and the rig stopped
when a human eye determined the next torque mark had been reached and
the machine stopped. Whilst experience with the machine allows timing to
be predicted to a certain extent, this is impossible to replicate at every
torque value and as a result account for the majority of the errors incurred.
Torque (Nm) Time (s) Twist (°)Stiffness
(Nm/deg)
Torque/Twist
10 19 0.633 15.78920 28 0.933 21.42930 33 1.100 27.27340 41 1.367 29.26850 52 1.733 28.84660 55 1.833 32.72770 63 2.100 33.33380 74 2.467 32.43290 83 2.767 32.530
100 88 2.933 34.09190 94 2.733 32.92780 97 2.633 30.38070 100 2.533 27.63260 108 2.267 26.47150 113 2.100 23.81040 123 1.767 22.64230 130 1.533 19.56520 139 1.233 16.21610 144 1.067 9.375
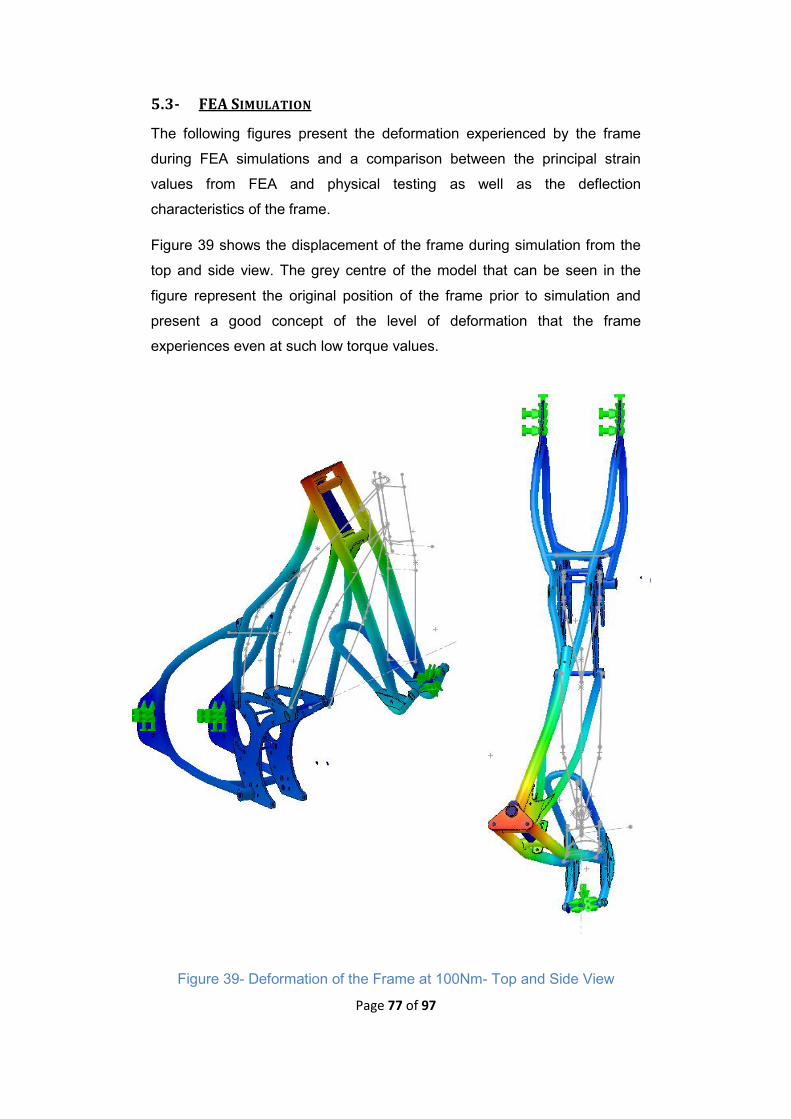
Page 77 of 97
5.3- FEA SIMULATION
The following figures present the deformation experienced by the frame
during FEA simulations and a comparison between the principal strain
values from FEA and physical testing as well as the deflection
characteristics of the frame.
Figure 39 shows the displacement of the frame during simulation from the
top and side view. The grey centre of the model that can be seen in the
figure represent the original position of the frame prior to simulation and
present a good concept of the level of deformation that the frame
experiences even at such low torque values.
Figure 39- Deformation of the Frame at 100Nm- Top and Side View
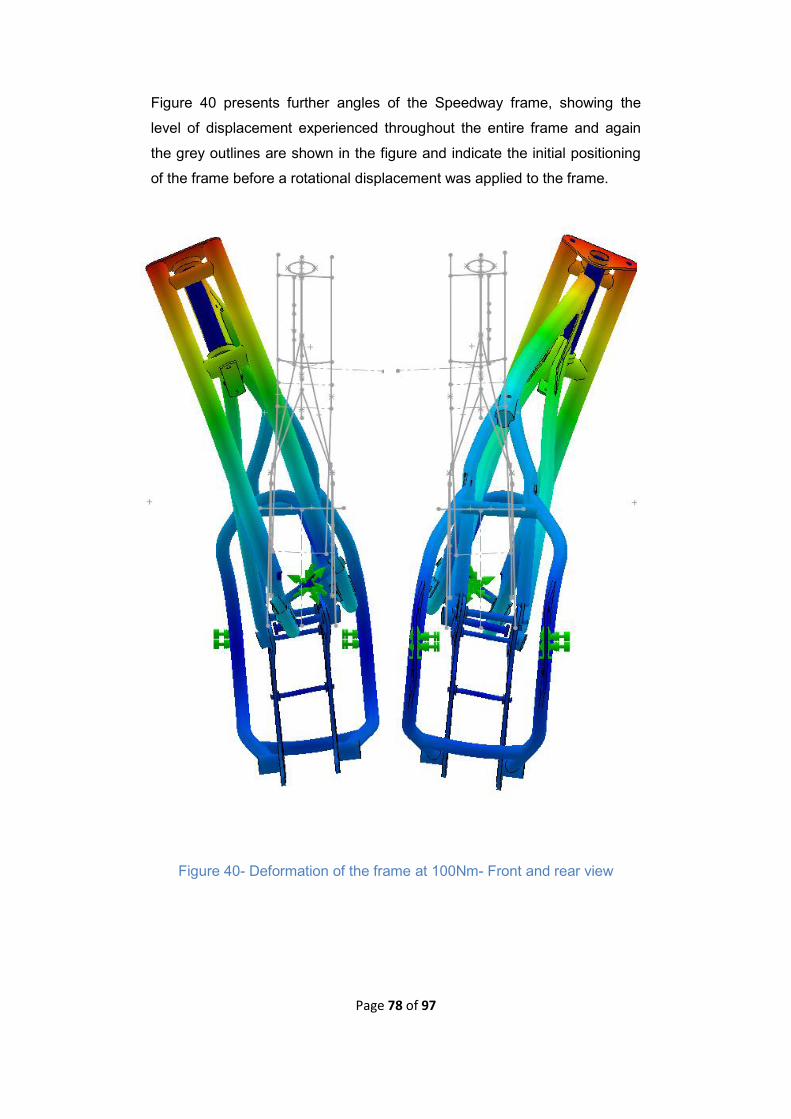
Page 78 of 97
Figure 40 presents further angles of the Speedway frame, showing the
level of displacement experienced throughout the entire frame and again
the grey outlines are shown in the figure and indicate the initial positioning
of the frame before a rotational displacement was applied to the frame.
Figure 40- Deformation of the frame at 100Nm- Front and rear view
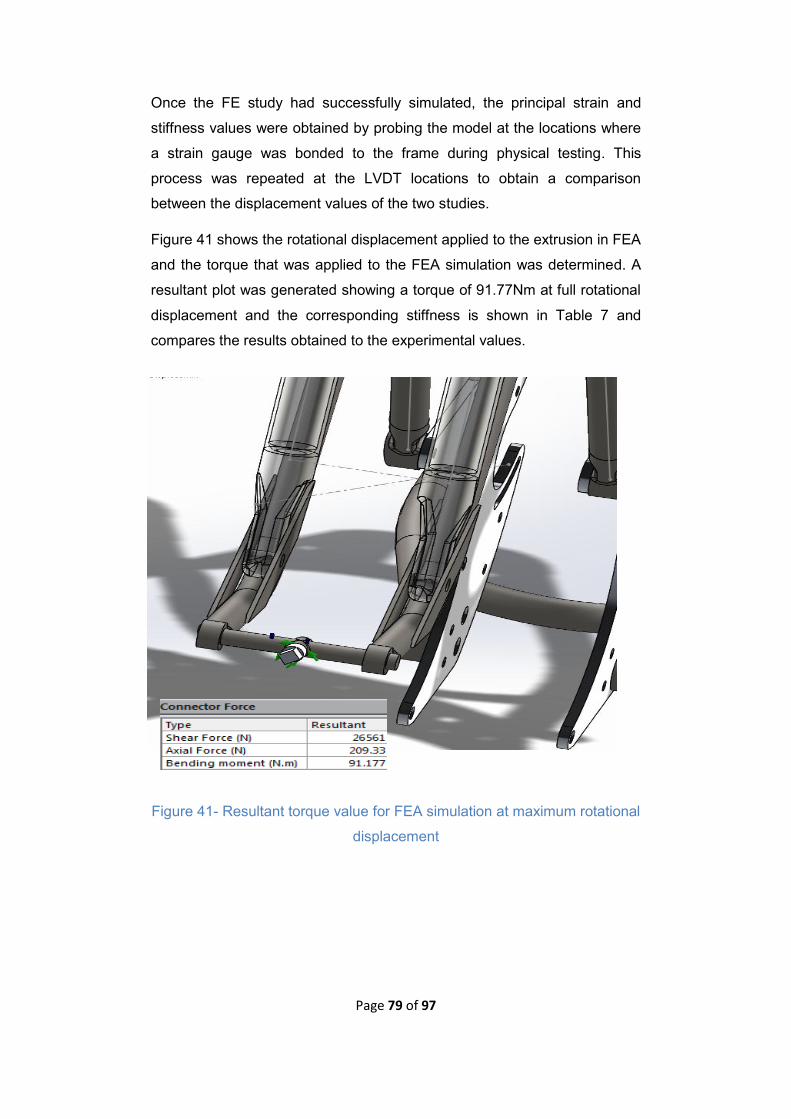
Page 79 of 97
Once the FE study had successfully simulated, the principal strain and
stiffness values were obtained by probing the model at the locations where
a strain gauge was bonded to the frame during physical testing. This
process was repeated at the LVDT locations to obtain a comparison
between the displacement values of the two studies.
Figure 41 shows the rotational displacement applied to the extrusion in FEA
and the torque that was applied to the FEA simulation was determined. A
resultant plot was generated showing a torque of 91.77Nm at full rotational
displacement and the corresponding stiffness is shown in Table 7 and
compares the results obtained to the experimental values.
Figure 41- Resultant torque value for FEA simulation at maximum rotational
displacement
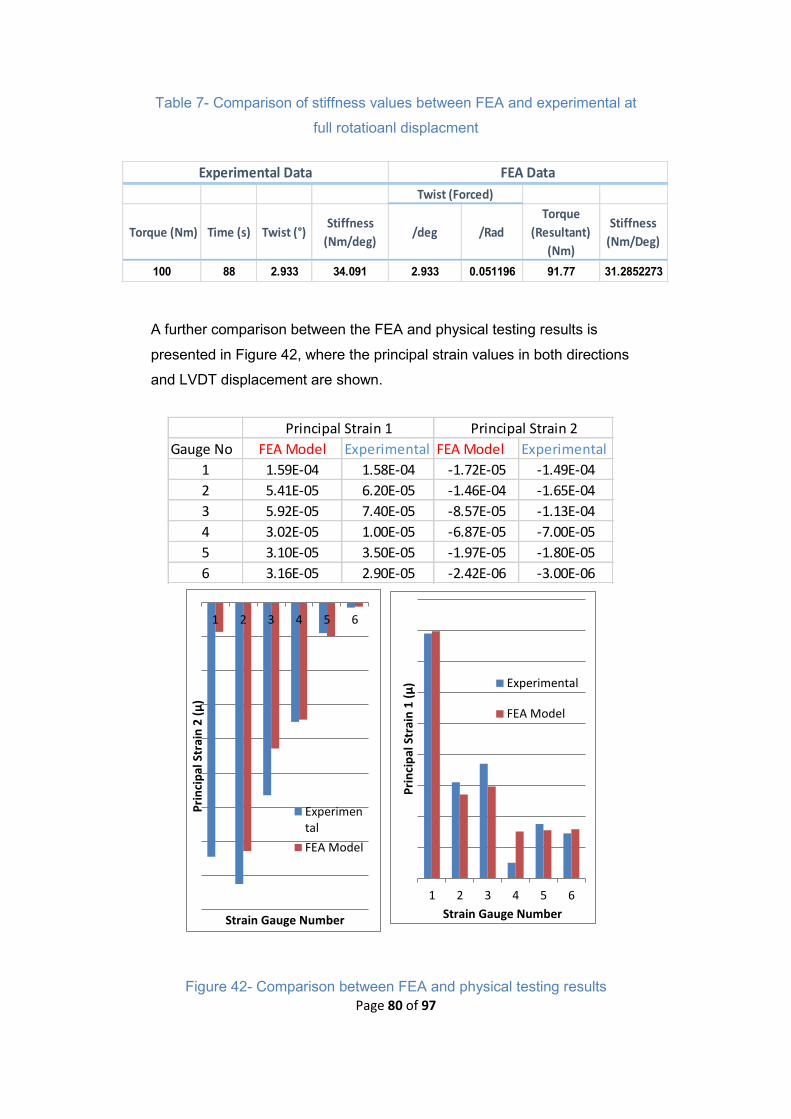
Page 80 of 97
Table 7- Comparison of stiffness values between FEA and experimental at
full rotatioanl displacment
A further comparison between the FEA and physical testing results is
presented in Figure 42, where the principal strain values in both directions
and LVDT displacement are shown.
Figure 42- Comparison between FEA and physical testing results
Gauge No FEA Model Experimental FEA Model Experimental
1 1.59E-04 1.58E-04 -1.72E-05 -1.49E-04
2 5.41E-05 6.20E-05 -1.46E-04 -1.65E-04
3 5.92E-05 7.40E-05 -8.57E-05 -1.13E-04
4 3.02E-05 1.00E-05 -6.87E-05 -7.00E-05
5 3.10E-05 3.50E-05 -1.97E-05 -1.80E-05
6 3.16E-05 2.90E-05 -2.42E-06 -3.00E-06
Principal Strain 1 Principal Strain 2
Torque (Nm) Time (s) Twist (°)Stiffness
(Nm/deg) /deg /Rad
Torque
(Resultant)
(Nm)
Stiffness
(Nm/Deg)
100 88 2.933 34.091 2.933 0.051196 91.77 31.2852273
Experimental Data
Twist (Forced)
FEA Data
1 2 3 4 5 6
Pri
nci
pal
Str
ain
1 (
µ)
Strain Gauge Number
Experimental
FEA Model
1 2 3 4 5 6
Pri
nci
pal
Str
ain
2 (
µ)
Strain Gauge Number
Experimental
FEA Model
Page 81 of 97
Chapter 6- Discussion
6.1- INTRODUCTION
Chapter 6 discusses in further detail the results obtained in physical testing
and simulated presented in the previous Chapter. Key frame parameters
such as principal strains, torque, deflection and stiffness are analysed and
a comparison between the simulated and physically tested frames is
discussed.
6.2- PHYSICAL TESTING RESULTS
According to a materials stress-strain relationship, whilst a material remains
within its elastic region and the applied stress is not above the yield stress,
then both the stress and strain should increase linearly with torque up to
the point of yield. This relationship was validated for the Speedway frame
as shown in Figures 34 and 35 as all of the tested gauges present a linear
relationship of strain with an increasing torque. The strain trend line for SG1
in the first principal direction (Figure 34) is significantly steeper compared to
the remaining gauges, with the maximum strain also being substantially
greater. This is a result of the application of load and torque to the frame in
this area, hence a higher strain is experienced by the system.
The secondary principal strain, at 90 degrees to the strain axis (Figure 35)
also follows the expected linear relationship, although the trend lines of the
gauges are much closer together. This suggests that either the diameter
size of the tube does not significantly influence the strain in this direction or
that SG1 is not bonded at exactly 90 degrees to the strain axis. Figure 35
also shows that for strain gauge 6, located at the start of the rear sub-frame
bend (Figure 23) a negligible amount of strain is experienced by the frame
in the secondary principal strain direction and hence the beam is in uni-
axial strain, suggesting that the tube is being loaded in pure bending.
Figure 36 demonstrates the displacement recorded by the LVDT’s when
the torque transmitted to the frame is increased. All of the LVDT’s present a
negative trend line suggesting that when the bike was twisted, the piston of
the LVDT contracts in length. LVDT 1 which was positioned on the flat plate
connecting the central horizontal tube to the lower main frame tubes
presents the greatest amount of displacement. Figure 34 shows that this is
to be expected as the highest levels of strain were recorded by SG1 in a
Page 82 of 97
similar position to the LVDT during physical testing, resulting in the greatest
amount of displacement being experienced relative to the rest of the bike.
Using the gradient of the torque twist graph (Figure 38), the stiffness of the
frame was calculated for the full range of torque values, as presented in
Table 6 and shows that as the torque and twist increase so does the
stiffness of the frame. This means that as the frame is displaced more, its
resistance to deformation increases. Whilst the determined stiffness of the
frames is far below the maximum strength of the material, the experiment
lays the foundation for future work to be undertaken, with Cossalter (2015)
discussing in his work the important role that the structural characteristics
of the frame have on motorcycle dynamics and stability. Further to this,
Yokomori et al. (1986) explains the instrumental impact of the frame
characteristics on rider injury and safety and further shows the need for
additional research in this area.
6.3- SIMULATED RESULTS
The deformation experienced by the bike when simulated is shown in
Figures 39 and 37. As the rear of the frame was fixed, the rotational
displacement was applied to the cylindrical extrusion between the front
forks, resulting in significant deformation along the front forks and their
adjacent tubes as shown by the grey outline depicting the original location
of the frame prior to simulation. The red, orange and green colouring in
these areas compared to the blue in the remaining parts of the bike further
show the significant displacement of the frame as validated by the results
presented by the physical testing where greater strain values were
recorded in the same area.
Figure 40 demonstrated further the extensive deformation experienced by
the front forks and main frame at 100Nm. In this alternative view it also
shows more clearly the deformation of the rear subframe, which deforms
significantly, especially the top half of the frame. The reason behind the top
half of the rear subframe deforming substantially more than the bottom is
that the bottom beam of the subframe is manufactured slayed out from the
wheel centre and back in to accommodate for wheel movement. This
results in the structure have a greater stiffer compared to the top hence
there is less deformation in this area. Due to the nature of Speedway
Page 83 of 97
racing, this is important for Speedway bikes as the bottom part of the
subframe is continuously being pushed into the ground so a greater
stiffness in this area aids in the performance of the bike.
In addition, Figure 40 also shows that the main frame experiences a
significant amount of bending when loaded. This in conjunction with the
level of deflection experienced at such a small torque value suggests that
the Speedway frame has a low stiffness. This is surprising for a Speedway
bike as a greater frame rigidity and stiffness would increase the feel and
responsiveness of the bike, which when racing on a loose track surface
would seem preferable. However, with a greater rigidity and stiffness, the
vibrational modes experienced by the bike are intensified as suggested by
Foale (2006), especially if the frame has limited damping capabilities as in
the case of Speedway. Work presented by Wagstaff (2011) has verified
that Speedway bikes are prone to significant amounts of front end wobble
or shimmy and with no rear suspension to aid in damping, using a frame
with a low stiffness and rigidity may lead to the best compromised
performance and safety setup currently possible.
6.4- COMPARISON OF PHYSICAL AND SIMULATED RESULTS
A comparison between the FEA simulated results and those obtained
through physical testing is presented in Table 7 and Figure 42. The tables
present a comparison of principal strains, LVDT displacement and stiffness
values at a range of rotational displacements.
The comparison between the stiffness values of the frame obtained through
physical testing and FEA (Table 7) shows that at a maximum rotational
displacement of 2.933° the resulting applied torque to the frame is 100Nm
and 91.77Nm in physical testing and FEA simulation respectively. On the
physical frame, this corresponds to a torsional stiffness of 34.091 in
comparison to the 31.285 recorded torsional stiffness value of the
simulated model. Although the simulated stiffness was only determined at
maximum rotational displacement, as a result of the model being linear, it
can be assumed that the FE model would follow this trend for stiffness at
the remaining rotational displacements applied during physical testing. The
significant correlation between the stiffness values of the physical and FEA
Page 84 of 97
testing shows that a validated FE model of a Speedway frame has been
obtained.
The validation of both models is further verified by the consistent correlation
of the strain results for both the FEA and physical models as shown in
Figure 42. A slight exception to this correlation is the secondary principal
strain readings for SG1, where the experimental system is significantly
greater. The exact reason behind the significant different is undetermined,
but it is possible that it could be a result of a bad connection between the
strain gauge and the Spider 8 data logging machine or potentially a
defective strain gauge. The good correlation between the results suggests
that this is not significant and is a mere anomaly in an otherwise good set
of results.
Table 7 and Figure 42 demonstrate that the torsional stiffness, principal
strains and displacement values obtained through physical testing and FEA
are largely within an acceptable margin of each other with the exception of
an anomaly as discussed above. This good consistent correlation validates
the objective that through this research a validated model has been
developed.
Page 85 of 97
Chapter 7- Conclusion
During this research project, the technical and business evolution of
Speedway racing was mapped,and used to assess the trends in the
mainstream popularity of the sport. It identified that the majority of technical
development introduced to date has bas subtle adaptations of the original
concept and that revolutionary technical design and development has rarely
been seen in the sport to date. The analysis of Speedway’s popularity trend
suggests that the business structure of Speedway has been the primary
driver behind the popularity of the sport, yet also highlights the potential for
technology to become a secondary driver in the future. A technology road
map of Speedway was also developed to present the possible future
pathways of the sport to enable technical progression and prevent further
stagnation or decline.
A review of relevant literature identified the potential for technical
development, resulting in physical and virtual testing to be completed.
Physical testing was conducted on the frame using a torsion test rig with
the strain and displacement values being measured using rosette gauges
and LVDT’s. The torsional testing produced linear principal strain trends in
both directions, and a linear displacement trend from the LVDT’s. The
torsional stiffness of the physical frame was then calculated from the
rotational displacement applied to the frame and compared to the torsional
stiffness of the simulated model. At full rotational displacement, there is a
clear correlation between both models.
The results obtained through physical testing were used to develop a
validated CAD and FE model. The CAD model was created to
geometrically mirror the physical system as closely as possible and was
then developed into a validated model. The FEA results gathered present a
good correlation with the experimental data in terms of strains,
displacement and stiffness and hence the physical testing validated the
FEA model developed in this research.
Page 86 of 97
Chapter 8- Opportunities for Further Work
The work completed in this research lays the foundation for future work to
be completed on various areas relating to Speedway. Whilst a validated
FEA model of a Speedway frame was created, this could be developed
further to modify the geometry and design of the frame through extensive
optimisation process that would result in an increased performance of the
bike whilst keeping costs low. In addition to this there is also the proposed
work to be undertaken from the technology road map which would see an
increase in performance of the bike and prevent the sport from further
stagnation.
Page 87 of 97
References
BBC Sport (2011) Wolverhampton’s Tai Woffinden Wants Silencers
Scrapped. Available at:
http://news.bbc.co.uk/sport1/hi/motorsport/motorbikes/speedway/9432657.s
tm (Accessed 26th November 2014).
Beghi et al. (2007). ‘Grey Box Modelling of a Motorcycle Shock Absorber
for Virtual Prototyping Applications’ Simulation Modelling Practice and
Theory. Science Direct [Online]. Available at:
http://www.sciencedirect.com/science/article/pii/S1569190X07000561
(Accessed 7th August 2015)
Belton, B. (2002) Hammerin Around: Speedway in the East End. First
Edition. Stroud: The History Press
Black Country Biker (2010) 1929 Douglas DT5 Speedway Bike. Available
at: http://blackcountrybiker.blogspot.co.uk/2010/11/original-1929-douglas-
dirt-track-bikes.html (Accessed 27th January 2015)
Bocciolone, M., Cheli, F., Pezzola, M., and Vigano, R., (2005). ‘Static and
Dynamic Properties of a Motorcycle Frame: Experimental and Numerical
Approach. Computational Methods and Experimental Measurements. WIT
Press [Online]. Available at: http://www.witpress.com/ (Accessed 26th July
2015)
Brindle, R., (2013). Ten tips for successful technology road map –part1.
Available at: http://nexightgroup.com/ten-tips-for-successful-technology-
roadmapping-part-1/ (Accessed 4th May 2016)
Bruer. T and Prucker. A. (1998) ‘Advanced Dynamic Motorbike Analysis
and Driver Simulation’ Institut für Kraftfahrwesen Aachen [Online]. Available
at:
http://citeseerx.ist.psu.edu/viewdoc/download?doi=10.1.1.540.5323&rep=re
p1&type=pd
Brocca, M., and Bazant, Z.P., (2001). Size Effect in Concrete Columns:
Finite Element Analysis with Microplane Model. Journal of Structural
Engineering. 1382-1390.

Page 88 of 97
Cossalter, V. (2006). Motorcycle Dynamics. Second Edition. Morrisville,
N.C. Lulu.
Cossalter, V., (1999). Cinematica e dinamica della motocicletta. Second
Edition. Edizione Progetto.
Cossalter, V., Lot, R. and Maggio, F. (2002). ‘The Influence of Tire
Properties on the Stability of a Motorcycle in Straight Running and Curves’.
Society of Automotive Engineers. 2002-01-1572. SAE Digital Library
[Online]. Available at: http://digitallibrary.sae.org (Accessed: 5th December
2014)
Cossalter, V., Doria, A. and Mitolo, L. (2002)’ Inertial and Modal Properties
of Racing Motorcycles’. Society of Automotive Engineers. 2002-01-3347.
SAE Digital Library [Online]. Available at: http://digitallibrary.sae.org
(Accessed: 5th December 2014)
Cossalter, V., Doria, A., Massaro, M. and Taraborrelli, L. (2015)
‘Experimental and Numerical Investigation on the Motorcycle Front Frame
Flexibility and its Effect on Stability. Mechanical Systems Signal Process
[Online]. Available at:
http://www.sciencedirect.com/science/article/pii/S0888327015000849
(Accessed 18th June 2015)
Cybermotorcycle (2004) Eso Review of 1957. Available at:
http://cybermotorcycle.com/archives/speedwaybikes/esostory.htm
(Accessed 15th October 2014)
Cybermotorcycle (2004) Speedway and Grass Track Machines: The
Workshop. Available at
http://cybermotorcycle.com/archives/speedwaybikes/ (Accessed: 15th
October 2014)
Cybermotorcycle (2004) The JAWA 894 and 895. Available at:
http://cybermotorcycle.com/archives/speedwaybikes/895.htm (Accessed
18th February 2015)
Cycle Chaos (2010) Diamond Shaped Rear Sub Frame. Available at:
http://www.cyclechaos.com/wiki/File:Single_cradle_frame.jpg (Accessed
18th October 2015)
Page 89 of 97
Dalling, P. (2011) Golden Age of Speedway. First Edition. Stroud: The
History Press
Defunct Speedway (2005) The Ivan Stephenson Photographic Collection.
Available at:
http://defunctspeedway.co.uk/Ivan%20stephenson%20photographs.htm
(Accessed 27th January 2015)
Defunct Speedway (2005) John Chaplin Photographs. Available at:
http://www.defunctspeedway.co.uk/Ivan%20Stephenson%20Photographs.h
tm (Accessed 28th January 2015)
Dohring, E., (1956). Steering Wobble in Single Track Vehicles. A.T.Z.
Volume 58. 282-286
Dropbears (1997) Douglas Collection for Sale. Available at
http://dropbears.com/m/motorcycles/douglas_motorcycles.htm (Accessed
27th January 2015)
Efunda (2015) In-Plane Rosette. Available at:
http://www.efunda.com/formulae/solid_mechanics/mat_mechanics/strain_g
age_rosette.cfm (Accessed 10th August 2015)
Eliseo Hummer (2012) Electric Speedway Bike. Available at:
http://www.electric-speedway.com/ (Accessed 24th February 2015)
Frezza, R., and Beghi, A., (2006). A Virtual Motorcycle Driver for Closed
Loop Simulation. IEEE Control Systems Magazine. October 2006.
Foale, T. (2006) Motorcycle Handling and Chassis Design: The Art and
Science. Second Edition. Spain: Tony Foale Designs
Hanlon, M., (2001). The World’s First Horizontally Opposed Turbo Diesel
Engine. Available at: http://www.gizmag.com/go/6800/
HBM (2007). Spider 8 Operating Manual. Available at:
http://www.hbm.com.pl/pdf/b0405.pdf
(Accessed 5th June 2015)
Hodgdon, T.A. (1934) ‘With The Short Track Racers’, Popular Mechanics
Magazine, July 1934, pg 61
Page 90 of 97
Hoggart, R. (1957) The Uses of Literacy: Aspects of Working Class Life.
First Edition. London: Penguin Group
Jacobs, N. (2001) Speedway in London. First Edition. Stroud: Tempus
Publishing
Kalsule, D.J., Askhedkar, R.R., and Sajanpawar, P.R., (1999). ‘Engine
Induced Vibration Control for a Motorcycle Chassis Frame by Right
Combination of Finite Element Method and Experimental Techniques.
1999-01-1754. SAE Digital Library [Online]. Available at:
http://digitallibrary.sae.org (Accessed: 5th December 2014)
Keep Turning Left (2010). British Speedway in Crisis. Available at:
http://keep-turning-left.blogspot.co.uk/2010/12/british-speedway-in-
crisis.html (Accessed 25th February 2015)
Lambert, T. (n.d) Everyday Life in Britain in the 1930’s. Available at:
http://www.localhistories.org/1930slife.html (Accessed 23rd January 2015)
Liu, Y. and Glass, G. (2013). ‘Effects of Mesh Density on Finite Element
Analysis’ 2013-01-1375. SAE Digital Library [Online]. Available at:
http://digitallibrary.sae.org (Accessed: 5th December 2014)
LVDT (2015). Linear Variable Differential Transformer. Available at:
http://www.lvdt.co.uk/how-lvdts-work/ (Accessed 26th July 2015)
Matsumoto, T., Fukaya, Y., & Yokomori, M. (1986). Effects of different
weight loads on the body during motorcycle riding. Scandinavian journal of
work, environment & health, 385-388.
Micro Measurement (2014) Stress Analysis Strain Gauges. Available at:
http://www.vishaypg.com/micro-measurements/stress-analysis-strain-
gages/ (Accessed 19th August 2015)
Mirbod, S. M., Yoshida, H., Jamali, M., Masamura, K., Inaba, R., & Iwata,
H. (1997). Assessment of hand-arm vibration exposure among traffic police
motorcyclists. International Archives of occupational and Environmental
health, 70(1), 22-28.
Page 91 of 97
MotoGP (2001). MotoGP Basics: Engines. Available at:
http://www.motogp.com/en/MotoGP+Basics/engines (Accessed: 18th
February 2015)
Motorcycle on Paper (2012). JAWA 894 and 895 engine designs. Available
at: http://www.motorcycleonpaper.nl/tweewielers/motorcycle-brochures/.
(Accessed 26/4/16)
Motorcycle Weekly (1982). Drawing of JAWA 85 x 87mm new Speedway
engine. Available at:
http://speedwayondisc.blogspot.co.uk/2011/02/feature-on-jawa-engines-
from-1982.html (Accessed 26/4/16)
Monster Energy SWC (2014). Worrall Slams Argentine Circus. Available at:
http://www.monsterenergyswc.com/news/article/3890/worrall-slams-
argentine-circus (Accessed 25th February 2015)
Nehaoua, L., Arioui, H., Seguy, N., and Mammar, S. (2013). Dynamic
Modelling of a Two Wheeled Vehicle: Jourdain Formalism. Vehicle System
Dynamics. Taylor & Francis. 2013. Pg 648-670.
Newcastle Speedway (2005). 1939 JAP Engine Speedway Bike with a
Martin Cornerford Chassis. Available at:
http://www.newcastlespeedwayhistory.co.uk/more_old_bikes.htm
(Accessed 10th February 2015)
Newcastle Speedway( 2005) Speedway Bikes. Available at:
http://www.newcastlespeedwayhistory.co.uk/old%20bikes.htm (Accessed
4th October 2014)
Omega (2013) Stacked Rosette. Available at:
http://www.omega.com/pptst/Rosettes_Stackedgrid_Strain_SG.html
(Accessed 18th August 2015)
Paternoster (2009). 1928 Rudge Speedway Bike. Available at:
http://www.flickr.com/photos/maxwellp/3627781758 (Accessed 15th June
2015)
Perillo-Marcone, A., Alonso-Vazquez, A., and Taylor, M., (2003).
Assessment of the Effect of Mesh Density on the Material Property
Discretisation within QCT based FE Models: A Practical Example using the
Page 92 of 97
Implanted Proximal Tibia. Computer Methods in Biomechanics and
Biomedical Engineering. 17-26
Rajput, B.A., Bayliss, M. and Crolla, D.A. (2007). ‘A Simplified Motorcycle
Model’ Society of Automotive Engineers. 2007-01-0829. SAE Digital Library
[Online]. Available at: http://digitallibrary.sae.org (Accessed: 5th December
2014)
Roe, G.E. and Thorpe, T.E. (1989). ‘The influence of Frame Structure on
the Dynamics of Motorcycle Stability’. Society of Automotive Engineers.
891772. SAE Digital Library [Online]. Available at:
http://digitallibrary.sae.org (Accessed: 5th December 2014)
Roe, G.E. and Thorpe, T.E. (1989). ‘Motorcycle Instability on Undulating
Road Surfaces’. Society of Automotive Engineers. 911307. SAE Digital
Library [Online]. Available at: http://digitallibrary.sae.org (Accessed: 5th
December 2014)
Rogers, E.,(2003). Diffusion of Innovations. 5th Edition. Free Press.
Sharp, R.S. (1978). ‘A Review of Motorcycle Steering Behaviour and
Straight Line Stability Characteristics’. Society of Automotive Engineers.
780303. SAE Digital Library [Online]. Available at:
http://digitallibrary.sae.org (Accessed 5th December 2014)
Sharp, R.S., Evangelou, S., and Limebeer, D.J.N., (2004). Advances in the
Modelling of Motorcycle Dynamics. Multibody System Dynamics, 251-283.
Sharp, R.S., (1971). The Stability and Control of Motorcycles. Journal for
Mechanical Engineering Science. Vol 13-14. 316-329
Sharp, R.S., (1994). Vibrational Modes of Motorcycles and their Design
Parameter Sensitivity. Vehicle NVH and Refinement. Proceedings of
IMECHE. Pp107-122
Skyrme, A. D., Selmon, G. P. F., Rajaratnam, S. S., & Groom, A. F. G.
(2003). Traction osteophyte formation of the fifth metatarsal:‘Speedway
rider's foot’. Foot and ankle surgery, 9(3), 147-150.
Page 93 of 97
Speedway Forum (2005) JAP Technical. Available at:
http://www.speedway-forum.co.uk/forums/index.php?showtopic=20613
(Accessed 9th October 2014)
Speedway Forum (2005) JAP Engine Test Procedure. Available at:
http://www.speedway-forum.co.uk/forums/index.php?showtopic=20613
(Accessed 28th January 2015)
Speedway GB (2009) Front Forks. Available at:
http://www.speedwaygb.co/frontforks (Accessed 25th February 2015)
Speedway GP (2015) About Speedway. Available at:
http://speedwaygp.com/about (Accessed 29th October 2014)
Solidworks (2015) Finite Element Analysis. Available at:
http://www.solidworks.co.uk/sw/products/simulation/finite-element-
analysis.htm (Accessed 17th August 2015)
Technology Commercialization Handbook (2015) Introduction. Available at:
https://commercialization-handbook.wikispaces.com/Introduction (Accessed
30th June 2015)
Tuluie, R., and Erickson, G., (2000). ‘Racing Motorcycle Design Process
using Physical and Virtual Testing Methods. Society of Automotive
Engineers. 2000-11-13. SAE Digital Library [Online]. Available at:
http://digitallibrary.sae.org (Accessed 5th December 2014)
Wagstaff, I. (2011) ‘Middlo Earth’, Race Car Engineering, March 2011, p.58
Williams, J. (1999). ‘A Wild Orgy of Speed’ Responses to Speedway in
Britain Before the Second World War. Sports Historian, 19(1), 1-15.
Wilson-Jones, R.A., (1951). Steering and Stability of Single Track Vehicles.
Proc Institute of Mechanical Engineers. 191-199
Yokomori, M., Nakagawa, T., & Matsumoto, T. (1986). Handlebar vibration
of a motorcycle during operation on different road surfaces. Scandinavian
journal of work, environment & health, 332-337.
Page 94 of 97
Appendix
TAPE ASSISTED INSTALLATION METHOD
Surface Preparation
The test specimen surface must be prepared before the strain gages and
bondable terminal pads can be installed. Cleanliness is important for
successful strain gage bonding. The object of preparation is to create a
smooth surface which can be wetted so it can receive the adhesive. Some
steps may be disregarded or modified, based on the condition of the test
piece and the type of material.
Coarse Cleaning
Rust, scale, paint and other contaminants must be removed from the
location where strain gages will be installed. Remove any surface coating
by sand blasting or by abrading with coarse grade emery paper.
Smoothing Surface
Surface imperfections must be removed. Pitting, scratches, protrusions, etc
can be removed by grinding, filing or other suitable methods to smooth the
surface where strain gages will be installed. Follow with a light sanding with
a fine grit (240 grit) silicon carbide or emery paper.
De-Grease the Surface
Use a solvent, and a soft tissue to remove all excess oil and grease. Select
a solvent. Check the chemical resistance of the material, making sure that
the solvent will not damage the test piece.
Clean Surface with Metal Conditioner and Neutralizer
Clean the surface with a mild acid or metal conditioner. Sand lightly with
the metal conditioner and wipe clean with a clean tissue or gauze pad.
Clean the surface with a mild base, or metal neutralizer, wipe with a clean
tissue or gauze pad. Brush with lint-free brush to remove any dust particles
that may have settled. Bonding Procedure Specific instructions may be
provided with strain gage adhesives. Instructions may vary with the type of
adhesive that has been selected. For example, a two-part epoxy may need
to be mixed, clamped and cured at an elevated temperature. Some
Page 95 of 97
adhesives, like the cold cure SG496 (typically used for metals) and SG401
contain solvents. Check the chemical resistance of the material, making
sure that the solvent used in the adhesive will not damage the test piece.
For best strain gage installation results consider the following procedures.
Clean Tools and Surfaces
Clean and degrease the tools that will be used to handle the strain gages.
Prepare a clean and degreased work surface. A piece of glass can be used
as a work surface. Do not handle the strain gages or bondable terminal
pads with your hands, as you may introduce oils and contaminants that will
cause bonding problems.
Orienting, Handling, and Bonding the Strain Gage
Use tweezers to remove the strain gage from the package. Place the strain
gage onto the work surface making sure that the ribbon leads or solder
pads are facing up. Use cellophane tape, placed gently on top of the strain
gage to lift it from the work surface. PTFE tape may be required for use
with adhesive that will need to be cured at an elevated temperature.
Position the strain gage onto the transducer or test specimen. Secure one
end of the tape onto the test specimen. Gently, lift the other end of the tape,
lifting the strain gage assembly being careful not to stretch the gage. Leave
a hinge of tape so that access to the bottom of the strain gage is available,
yet the position is fixed. Continue onto bonding of the strain gage. Adhesive
can be applied to the bottom surface of the strain gage and it can be
returned to the correct position. Follow instructions that were provided with
the strain gages adhesive. Clamping and curing instructions vary with the
adhesive selected. Repeat the procedure for the bondable terminal pad.
Locate the bondable terminal pad within reach of the ribbon leads or in a
convenient position for connection to the strain gage solder pads. When
bonding has been completed, remove the tape. Peel the tape back
carefully. Lift the edge of the tape, lay it back onto its self, and peel the tape
back so that the tape is not pulling the strain gage up off the surface. You
may need to use a small tool to hold the edge of the strain gage, or ribbon
leads down to avoid pulling them up or damaging them.
Page 96 of 97
Inspect the Strain Gage Installation
Take a close look at the strain gage installation. Inspect to make sure that
there are no loose edges, bubbles or voids beneath the strain gage. The
color should be consistent. Check the strain gage resistance and verify that
it is correct. Measure from solder-pad to solder-pad, or lead to lead. Check
the resistance from the strain gage to ground. Measure from one
solderpad/lead on the strain gage, to the metal test piece, to make sure that
the resistance to ground is 100MΩ or higher. Replace the strain gage if any
problem is found.
Wiring
Remove oxidation from the bondable terminal pads. An eraser on the back
of a pencil can be used to gently rub the terminal pad, making the copper
tabs shinny. Tin the bondable terminal pads using rosin core solder and a
small soldering pencil. If you have ribbon leads, bring the lead over to the
bondable terminal pad leaving a small flex loop. Solder down onto the
bondable terminal pad. Trim the end of the ribbon lead to length if required.
With solder pads or tabs, you will need to make up a small jumper wire. For
example, you can use the TFCP-010-50 spool of cable, and cut a small
length, strip the PTFE coating from each end, tin the ends of the jumper
wire. Solder one end of the jumper wire onto the strain gage solder tab,
again, leave a flex loop, and bring the other end of the jumper onto the
bondable terminal pad, solder it in place. Next, you will attach your
insulated instrumentation wire. For example, you can use the TX4-100,
which is colour coded, 4-conductor, PVC coated, shielded cable. This can
be used for short 2-wire runs, 3-wire bridge (compensates for effect of
temperature on the lead wire), 1⁄2 bridge, or 4-wire full Wheatstone bridge.
Solder the instrumentation onto the bondable terminal pad. Again, check
the strain gage resistance, now at the end of the instrumentation lead wire,
and verify correct. Check the resistance from the strain gage to ground.
Page 97 of 97
Complete the Strain Gage Installation
Clean the area using Rosin Solvent. Allow the area to dry, and then apply
protective coating.
Safety Precautions
Personnel who are working with solvents, metal conditioners, neutralizers,
adhesives, epoxy and cements should receive proper instruction from their
company prior to handling of these materials. The strain gage installation
area should be well ventilated. Personnel should avoid prolonged contact of
these materials with the skin. MSDS sheets are available at
omegadyne.com