Embed Size (px)
Citation preview
University of Wollongong University of Wollongong
Research Online Research Online
University of Wollongong Thesis Collection 1954-2016 University of Wollongong Thesis Collections
2016
Technical Efficiency of the Vietnamese Banking Sector: An Empirical Technical Efficiency of the Vietnamese Banking Sector: An Empirical
Analysis Encompassing Pre- and Post-WTO Entry Analysis Encompassing Pre- and Post-WTO Entry
Le Thanh Phuong University of Wollongong
Follow this and additional works at: https://ro.uow.edu.au/theses
University of Wollongong University of Wollongong
Copyright Warning Copyright Warning
You may print or download ONE copy of this document for the purpose of your own research or study. The University
does not authorise you to copy, communicate or otherwise make available electronically to any other person any
copyright material contained on this site.
You are reminded of the following: This work is copyright. Apart from any use permitted under the Copyright Act
1968, no part of this work may be reproduced by any process, nor may any other exclusive right be exercised,
without the permission of the author. Copyright owners are entitled to take legal action against persons who infringe
their copyright. A reproduction of material that is protected by copyright may be a copyright infringement. A court
may impose penalties and award damages in relation to offences and infringements relating to copyright material.
Higher penalties may apply, and higher damages may be awarded, for offences and infringements involving the
conversion of material into digital or electronic form.
Unless otherwise indicated, the views expressed in this thesis are those of the author and do not necessarily Unless otherwise indicated, the views expressed in this thesis are those of the author and do not necessarily
represent the views of the University of Wollongong. represent the views of the University of Wollongong.
Recommended Citation Recommended Citation Phuong, Le Thanh, Technical Efficiency of the Vietnamese Banking Sector: An Empirical Analysis Encompassing Pre- and Post-WTO Entry, Doctor of Philosophy thesis, School of Accounting, Economics and Finance, University of Wollongong, 2016. https://ro.uow.edu.au/theses/4809
Research Online is the open access institutional repository for the University of Wollongong. For further information contact the UOW Library: [email protected]
Faculty of Business
Technical Efficiency of the Vietnamese Banking
Sector: An Empirical Analysis Encompassing Pre-
and Post-WTO Entry
by
Le Thanh Phuong
"This thesis is presented as part of the requirements for the award of the Degree of
Doctor of Philosophy
of the
University of Wollongong"
January, 2016
i
CERTIFICATION
I, Le Thanh Phuong, declare that this thesis, submitted in fulfilment of the
requirements for the award of Doctor of Philosophy, in the school of Accounting,
Economics and Finance, Faculty of Business, University of Wollongong, is wholly
my own work unless otherwise referenced or acknowledged. The document has not
been submitted for qualifications at any other academic institution.
Le Thanh Phuong
January, 2016
ii
TABLE OF CONTENTS
CERTIFICATION ........................................................................................................ i
TABLE OF CONTENTS ............................................................................................. ii
ABSTRACT ................................................................................................................ vi
ACKNOWLEDGEMENTS ......................................................................................... x
LIST OF PAPERS AND AWARD ............................................................................. xi
LIST OF FIGURES ................................................................................................... xii
LIST OF TABLES .................................................................................................... xiii
ABBREVIATIONS ................................................................................................... xv
Chapter 1: Introduction ................................................................................................ 1
1.1 Background, motivation and objective .................................................................. 1
1.2 Research questions and Hypotheses ...................................................................... 5
1.3 Methodology and Data ........................................................................................... 9
1.4 Contribution of the study ..................................................................................... 13
1.5 Organisation of the dissertation ........................................................................... 13
Chapter 2: Banking Sector of Vietnam 1988−2015 ................................................... 16
2.1 Introduction .......................................................................................................... 16
2.2 A Brief History of Vietnam‘s Banking Sector ..................................................... 17
2.2.1 Establishing a Market-Oriented Banking System (1988−1997) ................... 19
2.2.2 The Second Banking Sector Reform period (1998−2006) ............................ 26
2.2.3 Accelerating after WTO Entry (2007−2009) ................................................ 35
2.2.4 A Slowdown after the Global Financial Crisis and Restructuring the Banking
Sector (2010−2015) ................................................................................................ 38
2.3 Vietnam‘s Commercial Banks in the Post-WTO Entry Period (2007−2015) ...... 42
2.3.1 Performance of Vietnam‘s Commercial Banks ............................................ 42
2.3.2 Ownership Structure...................................................................................... 47
2.3.3 Effects of Asset Price Bubbles ...................................................................... 50
2.3.4 Non-Performing Loans.................................................................................. 52
2.4 Summary .............................................................................................................. 57
Chapter 3: Literature Review on Banking Efficiency ................................................ 60
iii
3.1 Introduction .......................................................................................................... 60
3.2 Techniques related to Measuring and Analysing Banking Efficiency ................. 61
3.2.1 Techniques for Measuring Banking Efficiency ............................................ 61
3.2.2 Approaches to Analysing the Effect of Environmental Variables on Banking
Efficiency ............................................................................................................... 65
3.2.3 Selection of Inputs and Outputs for an Analysis of Bank Efficiency ........... 68
3.3 Impact of Financial Liberalisation on Banking Efficiency in a Global Context.. 71
3.4 Banking Efficiency in Transition Economies ...................................................... 78
3.4.1 An Overview of Bank Efficiency in Transition Economies ......................... 78
3.4.2 The Impacts of Financial Liberalisation on Banking Efficiency in Transition
Countries ................................................................................................................ 81
3.5. Literature on Banking Efficiency in Vietnam ..................................................... 86
3.6 Summary .............................................................................................................. 92
Chapter 4: Methodology .......................................................................................... 110
4.1 Introduction ........................................................................................................ 110
4.2 A proposed methodology – Meta-frontier analysis ............................................ 113
4.2.1 The meta-frontier ........................................................................................ 114
4.2.2 Group frontiers ............................................................................................ 115
4.2.3 Meta-technology ratios................................................................................ 116
4.3 DEA technical efficiency ................................................................................... 117
4.3.1 Measuring technical efficiency ................................................................... 117
4.3.2 Measuring group technical efficiency ......................................................... 120
4.3.3 Regressing environmental variables on technical efficiency ...................... 127
4.4 Li test for equality of efficiency densities .......................................................... 135
4.5 Aggregate Malmquist Productivity Index (AMPI) ............................................ 141
4.6 Hicks−Moorsteen productivity index ................................................................. 147
4.7 Summary ............................................................................................................ 151
Chapter 5: Data and analysis of Vietnamese banking efficiency ............................. 154
5.1 Introduction ........................................................................................................ 154
5.2 Data and model specification ............................................................................. 155
5.2.1 Data source .................................................................................................. 155
5.2.2 Sample ......................................................................................................... 156
5.2.3 Input/output specification in the DEA model ............................................. 158
iv
5.2.4 Specification of the regression model ......................................................... 162
5.2.4.1 Bank-specific variables ........................................................................ 162
5.2.4.2 Policy-change related variables ........................................................... 164
5.3 A comparison of technical efficiency between the pre- and post-WTO periods 167
5.4 A comparison of aggregate technical efficiency amongst bank groups in
accordance with ownership ...................................................................................... 174
5.4.1 Simar and Zelenyuk (2007) test on the performance of bank groups ......... 174
5.4.2 Li test on the performance of bank groups.................................................. 181
5.5 Summary ............................................................................................................ 185
Chapter 6: Analysis of Vietnamese bank efficiency and productivity ..................... 187
6.1 Introduction ........................................................................................................ 187
6.2 Technology gap analysis .................................................................................... 188
6.3 Analysis of the impact of environmental variables on bank efficiency ............. 190
6.3.1 Impact of reform measures conducted in the post–WTO period on bank
efficiency .............................................................................................................. 193
6.3.2 Specific bank characteristics (control variables) ........................................ 197
6.4 Productivity analysis using the aggregate Malmquist total factor productivity
index ......................................................................................................................... 201
6.4.1 Intermediation approach.............................................................................. 202
6.4.2 Operating approach ..................................................................................... 205
6.5 Productivity analysis using the Hicks−Moorsteen total factor productivity index
.................................................................................................................................. 207
6.5.1 Intermediation approach.............................................................................. 207
6.5.2 Operating approach ..................................................................................... 211
6.6 Summary ............................................................................................................ 213
Chapter 7: Policy implications and recommendations ............................................. 215
7.1 Introduction ........................................................................................................ 215
7.2 Establishing a competitive and fair banking market .......................................... 219
7.3 Improving relevant institutions/banks ................................................................ 224
7.4 Consolidating the legal and regulatory framework ............................................ 226
7.5 Summary ............................................................................................................ 230
Chapter 8: Summary and conclusions ...................................................................... 234
8.1 Introduction ........................................................................................................ 234
v
8.2 Summary of empirical findings .......................................................................... 236
8.2.1 Findings for the research questions ............................................................. 236
8.2.2 Findings for the research hypotheses .......................................................... 241
8.3 Policy implications and recommendations......................................................... 244
8.4 Limitations ......................................................................................................... 245
8.5 Areas for further research................................................................................... 246
Appendix A: Technical efficiency between pre- and post-GFC period ................... 248
Appendix B: Confidence interval of coefficients in meta- and group models ......... 250
BIBLIOGRAPHY .................................................................................................... 253
vi
ABSTRACT
The nexus between finance and economic growth has been theoretically and
empirically examined in the literature. A well-functioning financial system is an
essential factor that ensures the sustainable development of economies.
Measurements of efficiency and productivity can be used to identify good/bad
financial systems. In Vietnam, commercial banks dominate and contribute 90% of
the total assets of the financial system (IMF, 2014). Thus, the efficiency and
productivity of the banking sector is pivotal to the attainment of economic growth
and development in Vietnam. In joining the WTO in 2007 Vietnam had to implement
reform measures aimed at further liberalising and increasing the competitiveness of
the banking sector. Nonetheless, the existing literature lacks a comprehensive and
rigorous analysis of the impact of WTO entry on the performance of Vietnamese
banks.
The objective of this research is to conduct an empirical investigation of the
performance of the Vietnamese banking sector over the years from 2005 to 2012,
encompassing the pre- and post-WTO entry periods. Using measures of efficiency
and productivity this thesis sheds light on the following questions: (1) How has the
Vietnamese banking sector evolved since its transformation from a one-tier to two-
tier system in 1988? (2) Which methods can be utilised to measure and analyse the
efficiency and productivity of a banking sector? (3) What has been the level of
efficiency and extent of productivity changes in Vietnam‘s banks encompassing the
pre- and post-WTO entry? (4) What has been the impact of policy changes
implemented after WTO entry on Vietnam‘s banks? (5) What are the important
sources of inefficiency from the perspective of the Vietnamese banking system?
vii
Data envelopment analysis, a common non-parametric method, is utilised to
empirically analyse the technical efficiency and productivity changes of the
Vietnamese banking sector. To examine the efficiency difference between periods or
bank groups, the Li test and Simar and Zelenyuk (2007) test are utilised. By
combining the meta-frontier approach and double-bootstrap two-stage DEA method
of Simar and Wilson (2007), the impact of environmental variables on bank
efficiency is investigated. A variant of the Malmquist index (so-called aggregate
Malmquist productivity index) and Hicks−Moorsteen index (a multiplicatively
complete TFP index) is employed to measure and analyse the evolution of the
productivity of the Vietnamese banking sector.
Using data for Vietnamese banks covering the post-WTO period (2005-2012), it is
found that there is no obvious change of efficiency between the pre- and post-WTO
era. State-owned bank groups are the most efficient and have the smallest technology
gap relative to that of industry technology. By contrast, and contrary to the
mainstream view, joint stock banks are the least efficient group and have the biggest
gap relative to the meta-frontier. The impact of reform measures such as
transforming rural to urban banks and allowing industrial groups to become involved
in the banking sector have contributed negatively to bank performance. There is
evidence to suggest that SOCBs privatisation has improved their capability to earn
profit but has reduced their efficiency in terms of providing loans. The participation
of foreign investors has improved the efficiency of joint stock banks. Regardless of
ownership the results illustrate a negative relationship between bank capitalisation
and performance as well as a positive impact on profitability. Foreign and joint
venture banks are found to be less dependent on lending activities and are more
diversified in their operations than domestic banks.
viii
The responses of various bank types can be different to the same explanatory factors.
For example, the income efficiency of state-owned banks is positively related with
the loan to asset ratio while a negative relationship is recorded in the case of joint
stock banks. While financial soundness facilitates the magnitude of lending in the
case of foreign and joint venture banks, we observe a negative relationship in the
case of domestic banks. The profitability of foreign rivals is independent of
intermediation services but a significant dependence is recorded for domestic banks.
The analysis of productivity showed that the banking system witnessed a decline
during the period 2007–2012 under both the operating and intermediation approach.
This issue can be explained by regression of the technical component while the
efficiency component was largely unchanged.
This thesis has created a number of contributions to the literature on efficiency and
banking. First, this is the first study to take into account the heterogeneity of the
business environment when measuring and analysing bank efficiency. Second, by
combining the meta-frontier analysis with double-bootstrap two-stage DEA, the
author has provided a new approach to analyse the impact of variables on bank
efficiency in separate groups operating under different technology sets. Accordingly,
ownership is employed as an ex ante rather than an ex post factor, unlike previous
studies, when examining the influence of this environmental variable. Third,
outcomes from this study clarify the impact of policy changes‘ on Vietnamese
banking performance in the post WTO era. Fourth, this is the first time that the
aggregate Malmquist productivity index that allows accounting for the contribution
of individual firms to a whole industry‘s productivity has been applied in the context
of a banking system. Fifth, from the empirical results, a number of policies have been
recommended to improve the performance of Vietnamese banking sector from the
ix
perspective of economic integration that Vietnam has been officially a member of
ASEAN Economic Community at the end of 2015 and the Trans Pacific Partnership
agreement has been signed in December of 2015.

x
ACKNOWLEDGEMENTS
Firstly, I would like to express my sincere gratitude to my principal supervisor
Associate Professor Charles Harvie for his continuous support of my Ph.D study and
related research, for his patience, motivation, and immense knowledge. His guidance
helped me in all the time of research and writing of this thesis. I could not have
imagined having a better supervisor for my Ph.D study.
Besides my principal supervisor, I would like to thank Dr. Amir Arjomandi, my co-
supervisor, for his insightful comments, encouragement and specially his
methodological support, but also for the hard question which incented me to widen
my research methodology from various perspectives.
I thank my friends at the University of Wollongong for the stimulating discussions,
and for all the fun we have had in the last four years.
Last but not the least, I would like to thank my family: my parents, my wife, and my
kids for supporting me spiritually throughout writing this thesis and my life in
general.
xi
LIST OF PAPERS AND AWARD
Refereed article:
Le, P.T., Harvie, C. and Arjomandi, A. (2016).'Testing for differences in technical
efficiency among groups within an industry', Applied Economics Letters,
forthcoming.
Refereed conference papers:
Phuong, L. T., Harvie, C., &Arjomandi, A. (2015). Does ownership affect bank
performance? An analysis of Vietnamese banks in the post-WTO entry period, paper
presented and publishedat the 4th Global Business and Finance Research
Conference, Melbourne, Australia, May, 2015.
Phuong, L. T., Harvie, C., &Arjomandi, A. (2014). Private versus State-owned
Banks: A Comparison of Technical Efficiency in the Vietnamese Banking Sector,
paper presented and published at the Asia Pacific Productivity Analysis 2014
Conference, Brisbane, Australia, July, 2014.
Award:
The best paper of banking award at the 4th Global Business and Finance Research
Conference, Melbourne, Australia, May, 2015.
xii
LIST OF FIGURES
Figure 2.1: NPL rate of the entire banking sector ...................................................... 39
Figure 2.2: Banking sector growth ............................................................................. 43
Figure 2.3: Number of JSBs with state chartered capital and amounts involved ...... 49
Figure 3.1: A comparison between DEA and FDH ................................................... 62
Figure 5.1: Trend lines of group efficiency ............................................................. 172
Figure 5.2: Kernel estimation densities of individual efficiency scores .................. 174
Figure 5.3: Kernel estimation densities of individual efficiency scores .................. 184
xiii
LIST OF TABLES
Table 2.1: Financial deepening, end-1997 (%) .......................................................... 21
Table 2.2: Gross domestic savings (% of GDP) ........................................................ 21
Table 2.3: Sources of Bank Credit ............................................................................. 22
Table 2.4: Distribution of bank credit ........................................................................ 22
Table 2.5: Relative size of SOCBs (trillion dong) ..................................................... 33
Table 2.6: Banking market shares (percentage) ........................................................ 44
Table 2.7: Structure of the banking system‘s assets (percentage) ............................ 45
Table 2.8: Structure of the banking system‘s liabilities (percentage) ........................ 46
Table 2.9: The ratio of loan-related revenue to total revenue (percentage) ............... 47
Table 2.10: Overdue and bad loans of Vietnam‘s banking system, 2010-2011 ........ 54
Table 2.11: A summary of key policy changes by the Government since WTO
accession ............................................................................................................ 56
Table 2.12: A summary of differences in the business environment across bank
ownerships ......................................................................................................... 57
Table 3.1: A Summary of Financial Liberalisation and Deregulation Impacts on Bank
Efficiency ........................................................................................................... 94
Table 3.2: A Summary of Financial Liberalisation and Deregulation Impacts on Bank
Efficiency in Transition Economies ................................................................. 102
Table 3.3: A Summary of Studies on the Efficiency and Productivity of the
Vietnamese Banking Sector ............................................................................. 108
Table 5.1: The equity structure of banks according to ownership ........................... 156
Table 5.2: Number of banks by ownership category ............................................... 157
Table 5.3: Market share of assets by ownership ...................................................... 158
Table 5.4: A statistical description of inputs and outputs (in USD ‗000) ................ 161
Table 5.5: A summary of the employed regression variables .................................. 166
Table 5.6: Statistical description of environmental and bank-specific variables ..... 167
Table 5.7: A comparison of technical efficiency between the pre- and post-WTO
periods .............................................................................................................. 171
Table 5.8: Li test on the technical efficiency density of banks ................................ 173
Table 5.9: Simar and Zelenyuk (2007) tests on the differences in efficiency between
SOCBs, JSBs and FJVBs ................................................................................. 178
xiv
Table 5.10: Ranking efficiency of Vietnamese banks in 2012 ................................ 180
Table 5.11: Li test on the technical efficiency density of bank groups.................... 182
Table 6.1: MTRs of Vietnamese bank groups for the period 2005–2012 ................ 190
Table 6.2: Regressing environmental variables on bank technical efficiency scores
estimated by meta- and different group-frontiers using double-bootstrap two-
stage DEA. ....................................................................................................... 192
Table 6.3: Productivity of the Vietnamese banking sector over the years 2007–2012
under the intermediation approach ................................................................... 204
Table 6.4: Productivity of the Vietnamese banking sector over the years 2007–2012
under the operating approach ........................................................................... 207
Table 6.5: Changes in total factor productivity and its components using
Hicks−Moorsteen Index under intermediation approach ................................. 210
Table 6.6: Changes in output-oriented scale-mix efficiency under intermediation
approach ........................................................................................................... 210
Table 6.7: Changes in total factor productivity and its components using
Hicks−Moorsteen Index under operating approach ......................................... 212
Table 6.8: Changes in output-oriented scale-mix efficiency under operating approach
.......................................................................................................................... 212
Table 7.1: A summary of the key challenges and implications for policy makers
relating to the Vietnamese banking sector ....................................................... 232
xv
ABBREVIATIONS
ADB Asian Development Bank
AMPI Aggregate Malmquist Productivity Index
ATM Automated Teller Machine
BFSP Bank for Social Policy
BIDV Bank for Investment and Development of Vietnam
BTMU Bank of Tokyo-Mitsubishi
CAR Capital adequacy ratio
CC Credit Cooperative
CIC Credit Information Centre
DAF Development Aid Fund
DEA Data Envelopment Analysis
DFA Distribution Free Approach
DGP Data Generating Process
DMU Decision Making Unit
EAFC East Asian Financial Crisis
FB Foreign Bank
FDH Free Disposal Hull
FDI Foreign Direct Investment
FJVB Foreign and Joint-Venture Bank
GFC Global Financial Crisis
HSBC Hong Kong and Shanghai Banking Corporation
IAS International Accounting Standard
IFC International Finance Corporation
IMF International Monetary Fund
IPO Initial Public Offering
JSB Joint-stock bank
JVB Joint-Venture Bank
MOF Ministry of Finance
MTR Meta Technology Ratio
NAEC National Assembly Economic Commission
xvi
NFSC National Financial Supervisory Commission
NPL Non-performing loans
ODA Official Development Aid
OLS Ordinary Least Square
SBV State Bank of Vietnam
SEDP Social and Economic Development Program
SFA Stochastic Frontier Analysis
SME Small- and medium-sized enterprises
SOCB State-owned commercial bank
SOE State-owned enterprise
TFA Thick Frontier Approach
VAS Vietnam Accounting Standards
VBARD Vietnam Bank for Agriculture and Rural Development
VCB Vietnam Commercial Bank
VELP Vietnam Executive Leadership Program
VND Vietnam Dong
VRS Variable Returns to Scale
WB World Bank
WTO World Trade Organization
1
Chapter 1: Introduction
1.1 Background, motivation and objective
It is undeniable that a sound and efficient financial system provides a solid foundation
to foster economic growth due to its critical role of providing financial resources in an
efficient and effective manner to the rest of the economy (Levine, 2001; Barth et al.,
2004). This function is implemented via facilitating the trading of risk, allocating
capital, monitoring managers, mobilising savings, and easing the trading of goods,
services and financial contracts (Levine, 1997). A well-functioning financial sector
facilitates a more effective and sustainable usage of an economy‘s scarce financial
resources. However, the quality and functioning of the financial system depends on the
financial structure - the mix of financial instruments, markets, institutions and the
soundness of the regulatory-supervisory framework.
Over the last two decades, so-called transition economies1 have been transforming their
financial structure from rigid state control to a free market model in which the banking
sector has played the predominant role in the financial system. Substantial efforts have
been made to build a new financial structure suitable to a market driven economy
1 According to the Oxford dictionary of economics (the online 4
th edition), a transition economy can be
understood as ―An economy in the process of major changes in its mode of economic organization. This
may be from a centrally planned economy to a market-based economy, as in the former Soviet Union and
many countries of Eastern Europe [also as in China and Vietnam in East Asia]. It may also be from a
policy regime with considerable state intervention to a more liberalized one, as in many developing
countries. Transitional economies face special microeconomic difficulties, as they may need to reform
their institutions, for example by creating clear property laws and introducing bankruptcy procedures.
They also face special macroeconomic problems, as they may need to reform their tax systems, and their
monetary authorities may lack relevant experience on which to base their policies. Many transitional
economies have experienced slumps in real output and bursts of inflation in the early stages of transition‖.
Downloaded from: http://www.oxfordreference.com/view/10.1093/acref/9780199696321.001.0001/acref-
9780199696321-e-3186?rskey=YihSUx&result=3
2
subject to the limitations and legacies arising from the old central-planning regime2. The
infrastructure of the banking sector has been transformed from a mono-3 into a two-
tiered structure including the central bank and a system of commercial banks totally
owned by the state. Financial liberalisation has occurred in all transition economies in
order to increase competition and the performance of domestic banks that,
consequently, have decreased state-ownership of the sector. The range and speed of
liberalisation of banking systems in transition economies has been divergent and can be
divided into two categories.
First, full liberalisation which does not impose limits on liberalising measures, such as,
for example, regulating the maximal proportion of bank equity possibly owned by
foreign investors. Furthermore, governments of transition economies treat banks equally
regardless of ownership type and they do not see public banks as a tool to conduct their
macroeconomic policies. This type of liberalisation can be observed in the former
transition countries in Central and Eastern Europe, where transformation to a
competitive and privately-controlled banking sector has been implemented (Bonin and
Schnabel, 2011). The second category consists of partial liberalisation in which
2The liberalization of former centrally planned economies is logical and essential due to a number of
factors including: (1)inefficient resource distribution, critics of planned economies argue that planners
cannot detect consumer preferences, shortages, and surpluses with sufficient accuracy and therefore
cannot efficiently co-ordinate production (Machan, 2002); (2) suppression of economic democracy and
self-management, planners could never have delivered economic self-management, they would always
have been slow to innovate as apathy and frustration took their inevitable toll, and they would always
have been susceptible to growing inequities and inefficiencies as the effects of differential economic
power grew (see Hahnel, 2015); and (3) economic instability, Zielinski (1977) shows that greater
fluctuations in output in planned economies compared with market economies is recorded during the
same period. 3 In centrally planned economies, the mono-bank system was responsible for issuing currency, receiving
saving deposits, providing payment services among the state-owned enterprises as well as granting
financial resources to facilitate the undertaking of various investments, and financing state budget
deficits. The collapse of the Communist bloc in the late 1980s and early 1990s triggered a transition of the
mono-banking systems in these former centrally planned economies. The first aspect of the transition
process was conducted by introducing new central banks with new banking laws, and establishing a two-
tier banking system with separate functions for the central bank and commercial banks (Kenjegalievaet
al., 2009).
3
liberalising measures are limited and state-owned banks still dominate the banking
sector, ensuring the states‘ control, and consists of countries such as China, Russia and
Vietnam. While partial liberalisation, on the one hand, brings private sector
opportunities from entering the banking market, it can create a heterogeneous business
environment favouring public banks and discriminating against private banks. In the
literature the relationship between environmental heterogeneity by ownership type and
bank performance has not been examined.
Vietnam has been in the process of transitioning to a fully market oriented economy
since the implementation of Doi Moi in 1986. However, the state-owned enterprise
sector (SOE), including state-owned commercial banks (SOCBs), still plays a central
role in Vietnam‘s economic development strategies and the Government expects the
sector to be a key driver of growth; and to be the material force for the State to orient,
regulate and stabilise the macro-economy (Beresford, 2008; Anh et al., 2013). By
transforming SOEs in general, and SOCBs in particular, into business groups and
eventually sizable corporations, the State has not only favoured them with many
resources (especially land, capital, credits, public purchase contracts) but has also
created an unfair field of competition, notably a legal framework and policies that
discriminate against the private sector, especially domestic private enterprises (Anh et
al., 2013). This discriminatory policy has resulted in an asymmetric business
environment by ownership type between public and private sector enterprises. Hence,
Vietnam is an appropriate case study for research on the association between
environmental heterogeneity and enterprise performance.
The entry of Vietnam to the WTO in 2007 marked an important point for liberalisation
of the country‘s banking sector; accordingly, a number of policy measures were
4
conducted to improve bank performance and competitiveness. As part of the country‘s
commitments to the WTO, overseas banks were now allowed to open 100% foreign-
invested banks that operated with advanced technology and a high quality of
governance. Foreign investors were allowed to take part in domestic banks as minority
shareholders. Rural banks were permitted to transform to urban banks under inadequate
selective processes (NAEC, 2012; IMF 2014). Four of the five state-owned banks were
equitized but the bulk of equity is still held by the State ensuring its continuous control
over this important sector.4 Moreover, foreign strategic investors were encouraged to
participate under the expectation that they would bring in their advanced banking
technologies as well as expertise.
The pre- and post-WTO entry periods experienced rapid credit growth at an average rate
of 35% annually. In an infant financial system with a weak regulatory and supervisory
framework such as Vietnam‘s, the booming credit resulted in high non-performing
loans (NPLs) and systemic problems (Pincus 2009; IMF 2014). These above-mentioned
policy changes after WTO entry are likely to have significantly impacted bank
efficiency; however, no study has been carried out to assess these possible impacts.
Therefore, using data for the years 2005–2012, the main aim of this study is to shed
light on the impact of WTO entry on bank performance in Vietnam.
This study investigates the performance of the Vietnamese banking system under the
impact of WTO entry with the objectives described as below:
4 After being equitized the shares of these banks are traded in the stock exchange.
5
First, this study investigates the level of bank efficiency and whether there has been an
improvement and convergence of the technical efficiency of the Vietnamese banking
sector since accession to the WTO.
Second, this study will identify the key determinants of efficiency change in the
banking system in the pre and post-WTO entry periods.
Third, this study will measure and analyse the sources of total factor productivity
changes of Vietnam‘s commercial banks.
Finally, this study will identify effective policy measures that will improve the technical
efficiency and productivity of the Vietnamese banking sector.
1.2 Research questions and Hypotheses
The conduct of this study is to answer the following questions:
1) How has the Vietnamese banking sector evolved during its transforming from a one-
tier to two-tier system starting in 1988?
2) What methods can be utilised to measure and analyse the efficiency and productivity
of a banking sector, especially in the case of a transition economy such as Vietnam‘s?
3) What has been the level of efficiency and productivity changes in Vietnam‘s banks
encompassing pre- and post-WTO entry?
4) What has been the impact of policy changes implemented after WTO accession?
5) What are the important sources of inefficiency in the Vietnamese banking system?
6
Hypotheses
The SBV did not consistently supervise the capital participation by business groups into
banks, and especially that of SOEs. The chartered capital invested in the JSBs by SOEs
increased from 1 trillion dong in 2005 to 15 trillion dong in 2012 (World Bank, 2012).
The expansion of industrial group involvement in the financial sector raised questions
over the allocative efficiency of credit when these groups have used the banks as a
source of financing for their own business activities (intra lending) rather than profitable
projects. It is assumed that permitting business groups to take part in the banking sector
would decrease banking efficiency. Hence:
Hypothesis 1:
The capital participation of several large SOEs and private business groups decreased
the efficiency scores of banks.
The privatisation of SOCBs was a logical and essential step in order to increase their
competitiveness and market-orientation in their operation.5 Lending by the SOCBs is
significantly affected by the SBV which still holds the majority ownership of these
banks. Furthermore, local governments can influence the allocation of credit due to an
administrative relationship between these local authorities and SOCBs‘ branches in
provinces and cities (Oh, 1999; Kovsted et al, 2005). These interventions can lead to
adverse selections; consequently less profitable, and politically driven, projects are
funded while commercially viable projects are abandoned. When their loans became
riskier the expected profits of the SOCBs declined sharply as a result of high loan-loss
5 Via privatisation, public banks can reduce the proportion of shares held by the state, therefore the
problem of agency can be diminished (Bonin et al., 2005b).
7
provisioning (Kovsted et al, 2005; WB, 2007). One important solution against this
problem is to privatise the SOCBs and list these banks in the domestic stock exchange
(WB, 2007). To do so, SOCBs have had to be audited by international independent
auditing companies and disclose financial statements to the public and investors. Via
privatisation the management model of joint stock corporate has been applied and
private investors can take part in the board of directors of these banks. Such changes
have resulted in a more transparent and perhaps efficient operation of the SOCBs. In
fact, in this way, privatisation can reduce agency problem and therefore increase the
private banks‘ input/output management (Bonin et al., 2005a; b). Thus, the impact of
privatisation on SOCBs‘ performance will be tested in this thesis with below
hypotheses:‖
Hypothesis 2:
Privatisation of SOCBs has increased the technical efficiency of these banks.
As a requirement of WTO entry Vietnam has had to open its banking market. Foreign
investors are now allowed to partly own domestic banks through purchasing banks‘
shares. Through assigning their staff to the Board of Directors, and Board of
Management, foreign banks can positively contribute to the decision making process to
improve technology, quality of management, and develop new banking services and
products.6 Moreover, through capital participation foreign banks can refinance domestic
6 Some may argue that there are three potential impacts of foreign involvement in domestic banks. Firstly,
it improves the quality of management (technical efficiency). Second, foreign participation can help
improve technologies using in these banks (technical progress). Lastly, more products and banking
services originating from foreign investors can be provided to customers (economies of scope). However,
only technical efficiency of domestic banks can be considered. Because to make the regression results
significant, we need a large size of sample and so the annual data was pooled. Consequently, the
movement of production frontiers over time (technical regress/progress) and a variety of efficiency
8
banks, helping these banks achieve the capital adequacy ratio imposed by the SBV.
Consequently, the involvement of foreign investors can be expected to have a positive
impact on banking development in Vietnam. In this thesis, the impact of foreign
involvement on the quality of management leading to an improvement of technical
efficiency of Vietnamese banks will be tested via the following hypothesis:
Hypothesis 3:
Foreign involvement in domestic banks (both SOCBs and JSBs) has exerted a positive
impact on the technical efficiency of Vietnamese banks.
The post-WTO duration has witnessed deregulation of banking authority. During
2005−2007, 13 rural banks, which had a narrow scope of operation in rural areas and
low-quality management, were permitted to transform into urban banks. As a result,
these banks were forced to increase their equity by 10-20 times more than that in 2011
(NAEC, 2012). A dramatic growth in the equity and assets of these banks raised
questions about their loans and asset quality. It is assumed that the transformed banks
would reduce the efficiency of the banking sector; accordingly the below hypothesis
will be considered:
Hypothesis 4:
The deregulation7 of rural banks into urban banks by the SBV reduced the mean
efficiency of the banking sector.
measures including economies of scope cannot be observed. It is worth noting that only technical
efficiency can be measured when annual data is pooled. 7Transforming rural to urban banks is a policy measure in order to increase competitiveness and
efficiency of Vietnamese banking system and this measure is allowed by the regulators. However, this
process is inadequately selective and so the term ―deregulation‖ was used to present this process.
9
1.3 Methodology and Data
The above mentioned research questions and hypotheses will be addressed utilising an
appropriate methodology that can be applied in the context of a transition economy such
as Vietnam‘s.
Hughes and Mester (2008) argue that there are two common approaches to measuring
the performance of banks: non-structural and structural. The non-structural approach,
based on a variety of financial ratios which capture a specific aspect of performance,
compares bank performance based upon different investment strategies adopted and
characteristics of governance. For example, the return to assets ratio demonstrates the
correlation of profitability and the quality of banks‘ governance. Despite the fact that a
number of formal and informal theories advocate such investigation, no general theory
of performance provides a unifying framework for these studies (Das and Ghosh, 2006;
Richard et al., 2009). The structural approach is grounded on so-called traditional
microeconomic theory of the production process and the concept of optimisation
(Hughes and Mester, 2008). The advantage of this method relative to the non-structural
is that it accounts for the multidimensional character of bank performance which is not
the case for the non-structural approach (Berger and Humphrey, 1997). Therefore, the
structural approach is the focus of this study and will involve deriving an efficient
production frontier for Vietnamese commercial banks during the 2005−2012 period.
A unique aspect of this study is recognition of the heterogeneous nature of the business
environment in Vietnam due to discriminatory policies by government favouring state-
owned enterprises over those in the private sector, for the economy as a whole and the
10
banking system in particular. Accordingly, public banks may be in a better position to
reach the best-practice performance than their private counterparts. To address this issue
a new technical approach will be applied based on the meta-frontier approach of
O‘Donnell et al. (2008), which allows for measuring and analysing firm efficiency in
separate groups belonging to different technology sets. This approach can account for
the heterogeneity of the economic environment based upon using various group-
frontiers.
There are two popular methods to estimate an efficiency frontier in empirical studies:
stochastic frontier analysis (SFA) and data envelopment analysis (DEA). The DEA
method, however, is preferable in this study because, unlike SFA, it does not make
assumptions about the functional form of the relationship between inputs and outputs.
Instead, a production set is established from the inputs/output combinations consisting
of a piecewise linear boundary identifying the best-practice firms or efficient firms and
interior including the inefficient firms. The second reason behind this preference is that
DEA is a non-parametric technique; hence, it is more suitable to apply in small-sample-
size studies in comparison with SFA, a parametric one, requiring big data sets (Sathye,
2001). DEA models allow multiple-outputs which is a significant advantage when
compared to SFA where a single output is regressed against a set of inputs under an ad
hoc production function. Based on the above comparisons this thesis is more suited to
using the DEA method in the context of the Vietnamese banking sector where there are
a limited number of banks but a variety of products relating to lending and payments.
11
Despite these mentioned merits of DEA it is, however, exposed to the limitation that
technical efficiency estimated by this method is downward biased and it is impossible to
build a confidence interval with a given degree of accuracy. Simar (1992) suggests
applying bootstrapping, a statistical technique for making inferences of certain
estimates, as a solution to this problem. In this study, several bootstrap-based DEA
models are utilised to acquire consistent results of banking performance in Vietnam. To
investigate differences in efficiency amongst groups the Simar and Zelenyuk (2007)
test, based on the subsampling bootstrap technique and the concept of aggregate
efficiency, is used. The Li (1996) test, adapted in the context of efficiency analysis by
Simar and Zelenyuk (2006) on the equality of the efficiency distribution, is used to
examine the capability of different groups to mimic the efficient production frontier. In
addition, the study chooses a truncated regression suggested by Simar and Wilson
(2007) (the so-called double-bootstrap two-stage DEA) to examine the influence of
environmental variables on bank efficiency as the appropriate method that can
overcome the biased nature of DEA estimates in comparison with that of the OLS and
Tobit methods.
In terms of productivity analysis a modified and aggregate version of the Malmquist
index, based on aggregate technical efficiency, is used to measure and analyse the
productivity of banks, accounting for the relative importance of individual banks in the
index. The aggregate Malmquist index enables decomposition of the causes of
productivity changes into two different sources: efficiency change and technical change.
By cross-tabulating the productivity index to types of ownership (public versus private)
12
the impact of different types of ownership on the performance of Vietnamese banks can
be identified.
Data
Panel data is collected from the financial statements of commercial banks in Vietnam,
including their balance sheet and income reports. These statements are compiled under
Vietnamese Accounting Standards (VAS), which are regarded as being of a lower
standard than that of international accounting standards. Being a transition economy,
Vietnam experiences data problems that are relevant to all other similar countries
(Havrylchyk, 2006). Banks do not compile their financial statements strictly by
accounting standards; and non-compliance to the rules set by the supervisory authorities
is widespread. Additionally, the other serious problem is unequal treatment between
private and public banks, which has deteriorated the transparency of the banking sector.
The period of coverage of the data is from 2005 to 2012. Due to a significant change of
regulations on bad loan classification and loan-loss provisioning in 2005, only data from
2005 forwards ensures homogeneity. Furthermore, the studied period should cover the
pre- and post-WTO era to observe the impact of policy changes on bank efficiency.
Nonetheless, the data is unbalanced due to new bank entries and bank mergers during
the post-WTO period.
With a two-digit inflation rate on average covering the period 2005−2012 (about 11-
12%), the balance sheet of banks has significantly deteriorated. It is, therefore,
appropriate and essential to convert all data into real terms.
13
1.4 Contribution of the study
This study contributes to the literature of bank efficiency in several unique ways. First,
this thesis takes into account the heterogeneity of the business environment when
analysing the performance of the banking sector in Vietnam - a transition economy. All
previous studies have overlooked the significance of environmental differences when
examining the impact of financial liberalisation on bank performance. Hence, this thesis
conducts an in-depth analysis on the impact of reform measures on bank efficiency
under the assumption that ownership can result in a divergence of technologies utilised
by bank groups. Accordingly, the author employs ownership as an ex ante rather than an
ex post factor, unlike previous studies, when observing the influence of this
environmental variable. Second, this is the first study to investigate the impact of
joining the WTO on a country‘s banking sector, where the government of that country
has to remove restrictions against foreign investors. Third, it is the first study to apply
the method of aggregating technical efficiency in a banking system to measure and
compare the bank efficiency of different bank sub groups. Fourth, by combining a meta-
frontier analysis with double-bootstrap two-stage DEA this study provides a new and
unique approach to analyse the asymmetric impact of variables on bank efficiency in
separate groups operating under different technologies.
1.5 Organisation of the dissertation
This thesis consists of eight chapters. After this introductory chapter the rest of the
study is structured as follows: Chapter 2 overviews the evolution of the Vietnamese
banking system from 1988 to the present. An historical approach is adopted in this
14
chapter due to the fact that historical events and structures have had an enduring effect
on recent banking issues. Development of the Vietnamese banking sector is divided into
four different phases. In each phase, both positive and negative changes in policies,
legislation and institutions which have influenced the performance of banks are
reviewed.
Chapter 3 reviews the literature on banking efficiency including methods used in
previous studies to measure and analyse bank performance; furthermore, the impact of
liberalisation on the banking sector is overviewed under a reversed pyramid model
starting with the worldwide context, next to transition economies and lastly to the
Vietnamese circumstance.
Chapter 4 presents the methods used to obtain the empirical results from this study. In
general, a meta-frontier analysis is demonstrated to be an appropriate approach to
analyse the Vietnamese banking sector where the business environment is
heterogeneous. Production frontiers at both the industry and group levels are estimated
by DEA, a linear programming technique. The methods of Simar and Zelenyuk (2006;
2007) are used to investigate differences in the efficiency of bank groups in this chapter.
To investigate the variation of bank efficiency, the double-bootstrap two-stage DEA of
Simar and Wilson (2007) is adapted, giving consistent and unbiased coefficients.
Productivity change is also measured using a variant of the Malmquist index, grounded
in the concept of aggregate efficiency.
Chapter 5 provides a description of the data and presents the technical efficiency results.
Specifically, the efficiency of banks between pre- and post-WTO accession is compared
using the Li (1996) and Simar and Zelenyuk (2007) tests. These tests are also applied to
15
investigate differences in efficiency amongst three groups (state-owned, private and
foreign banks).
Chapter 6 provides an in depth interpretation and explanation of efficiency variation by
employing the double-bootstrap two-stage DEA. In detail, variables consisting of those
proxied for policy changes, bank characteristics and time trends are separately
investigated. In addition, bank productivity and sources of productivity changes are
considered using the aggregate Malmquist index.
Chapter 7, based on the empirical results and findings of the two previous chapters,
proposes several policy implications and recommendations to the relevant authority in
order to improve the efficiency and productivity of the Vietnamese banking sector.
The last chapter, chapter 8, summarises the major contents of this thesis and highlights
its contributions as well as limitations; accordingly, further research is also suggested. It
also discusses major findings relating to the research questions posed in Chapter 1.
16
Chapter 2: Banking Sector of Vietnam 1988−2015
2.1 Introduction
There is evidence to suggest that economic growth is closely and positively related with
a country‘s level of financial development (Levine, 1997; Beck et al, 2000a; 2000b;
Bonin and Wachtel, 2003; Fethi and Pasiouras, 2010). In particular, economies with
larger banks and more dynamic stock markets achieve higher growth rates even after
controlling for many other factors underlying economic growth (Levine, 1997).8 The
positive impact of financial development on growth has been recorded in both
developing countries and developed countries (Levine, 1997; 1998; Sarazervos, 1998).
Through functions such as allocating capital, monitoring managers, mobilising saving
and easing the trading of goods/services a well-functioning financial system contributes
to efficient resource allocation, which in turn generates higher efficiency and
productivity in the production process (Levine, 1998; Sarazervos, 1998).
The banking sector is the traditional component of financial systems in transition or
newly emerging market economies, where non-bank financial institutions9 did not exist
before the transition process from centralised to market oriented economies started
(Harsan and Marton, 2003). In Vietnam, after the initiation of the transition process
began in 1986 under the slogan of ―Renovation‖ -―Doimoi‖, the banking sector has
dominated the financial system (O‘Connor, 2000; Kovsted et al., 2005; Leung, 2009).
Regardless of the development of non-bank financial institutions in recent years,
commercial banks maintain a crucial and dominating role in the Vietnamese financial
8 The size of banks in particular countries was measured by total assets or liabilities relative to GDP. The
author used market capitalisation relative to GDP to measure the size of stock markets. 9 Non-banks include insurance companies, investment banks, finance companies and pension funds.
17
system. Therefore, this explains the explicit concentration on one type of financial
intermediation – the banking sector, in this thesis.
The objective of this chapter is to perform an analysis of the evolution and development
of the banking sector over the period 1988−2015. In addition, the performance of the
commercial banks will be analysed in depth for the post-WTO entry period
(2007−2015).
The remainder of this chapter is structured as follows. A brief history of the banking
sector is conducted in Section 2.2. The performance of commercial banks in the post-
WTO entry period (2007−2015) will be focused upon in section 2.3. Lastly, a summary
of the key issues identified in this chapter will be discussed in section 2.4.
2.2 A Brief History of Vietnam’s Banking Sector
A reasonable explanation for the historical approach adopted in this section is that
historical events and structures continue to exert large and significant effects on the
contemporary problems and issues of the Vietnamese financial sector (Kovsted et al,
2005). In line with analyses of external financial crises (the East Asian Financial Crisis
triggered in 1997 and the Global Financial Crisis triggered in 2008) as well as internal
changes, the historical background of the Vietnamese banking system can be usefully
divided into several phases:
1. The first phase was marked by a transition of the banking system from 1988 to
1997. The transition process resulted in the creation of a two-tier banking system
that consisted of the State Bank of Vietnam (SBV) playing the role of a central
18
bank, and a number of commercial banks. This phase ended with the onset of the
East Asian Financial Crisis (EAFC) in 1997.
2. The second phase started in 1998 with a substantial change in the legal system.
The issuance of the Banking Law strengthened the autonomy and functions of
the SBV, and eliminated direct political control over the interest rate. The
banking sector was urged to reform not only the State-Owned Commercial
Banks (SOCBs) but also the Joint Stock Banks (JSBs). Furthermore, preparation
for WTO entry10
was initiated with a master plan11
for the banking sector.
3. The third phase witnessed a dramatic growth in the banking sector after joining
the WTO in 2007. Large capital inflows from the world market were directed to
Vietnam with the prospect of financial liberalisation. However, hidden risks
from financial asset bubbles or intra-lending activities have threatened the
stability and sustainability of this sector. The Global Financial Crisis (GFC)
exposed these risks and brought the banking sector to the brink of a crisis in
2009.
4. The fourth phase started from 2010 up to the present 2015 with a series of
measures in order to stabilise the system. These measures consisted of applying
restrictive monetary policy, imposing a credit growth rate for each bank, issuing
a new capital adequacy ratio, and consistently supervising weak banks.
However, the results and efficiency gains arising from these measures remain
questionable for both the public and the authorities.
10 Vietnam was accepted to be a member of the WTO in November 2006 and officially became a WTO
member from 1 January 2007. 11
The master plan included all the changes as part of the agreement for WTO entry through establishing a
legal framework. Furthermore, the plan also referred to solutions which aimed to improve the banking
sector including SOCBs privatisation, strategic foreign investors, and increasing minimum capital
requirements.
19
2.2.1 Establishing a Market-Oriented Banking System (1988−1997)
In the centrally planned economy of Vietnam (1975−1986)12
the state had monopoly
control over all financial transactions through the SBV, which operated both as a central
bank and as a commercial bank (Irvin, 1995). Furthermore, the state controlled two
other specified banks, namely the Vietnam Commercial Bank (VCB) a foreign trade
bank, and the Bank for Investment and Development of Vietnam (BIDV). The SBV and
these two specified banks were responsible for providing credit to SOEs or
compensating for budget deficits (Harvie and Hoa, 1997; Beresford and Phong, 2000).
The functions of the banking system were restricted, being seen primarily as an
instrument of government for executing its economic policies (IMF, 1998).
At its sixth National Congress in December 1986, Vietnam‘s Communist Party made a
decisive step to abandon the centralised economic model and to adopt a socialist
market-oriented economy – also known as ―DoiMoi‖ (Renovation) (Harvie and Hoa,
1997; Beresford, 2008). A wide scope of reforms consisted of those relating to State-
Owned Enterprises (SOEs), foreign trade liberalisation, tax reform and banking reform
(Harvie and Hoa, 1997; Oh, 1999; Beresford and Phong, 2000; Phan et al., 2006). In the
banking sector the mono-bank system, which only served the needs and demands of the
state sector, was split into a two-tier banking system, including the SBV as the central
bank and four SOCBs13
.
12The North and South of Vietnam were unified in 1975, and in the aftermath the country adopted a
centrally planned model of economic development, imitating the Soviet Union.
13
VCB and BIVD are two SOCBs established during the time of the centrally planned economy. In 1988
the government established two other SOCBs, they are the Vietnamese Bank for Agriculture and Rural
Development and the Industrial and Commercial Bank of Vietnam.
20
From 1990 entry into the banking sector has been liberalised with the participation of
private sector and foreign investors (WB, 1993; IMF, 1998). This was one of the most
impressive reforms implemented by the government (WB, 1993). At the end of 1992 the
structure of the banking sector included the following:
- The four SOCBs (VCB, BIDV, Agribank -Vietnamese Bank for Agriculture and
Rural Development, and ICB -Industrial and Commercial Bank of Vietnam);
- Five branches of foreign banks (including Natixis (France), ANZ (Australia),
Credit Agricole (France), Bangkok Bank (Thailand), and BNP (France));
- Two Joint-Venture Banks (JVBs): Indovina with a 50-50 partnership between
ICB and Cathay United Bank (Taiwan); and VID-Public Bank also with a 50-50
partnership between BIDV and Maybank (Malaysia), and;
- 24 JSBs with various ownership forms including private and public firms,
cooperatives, peoples‘ committees, and individuals.
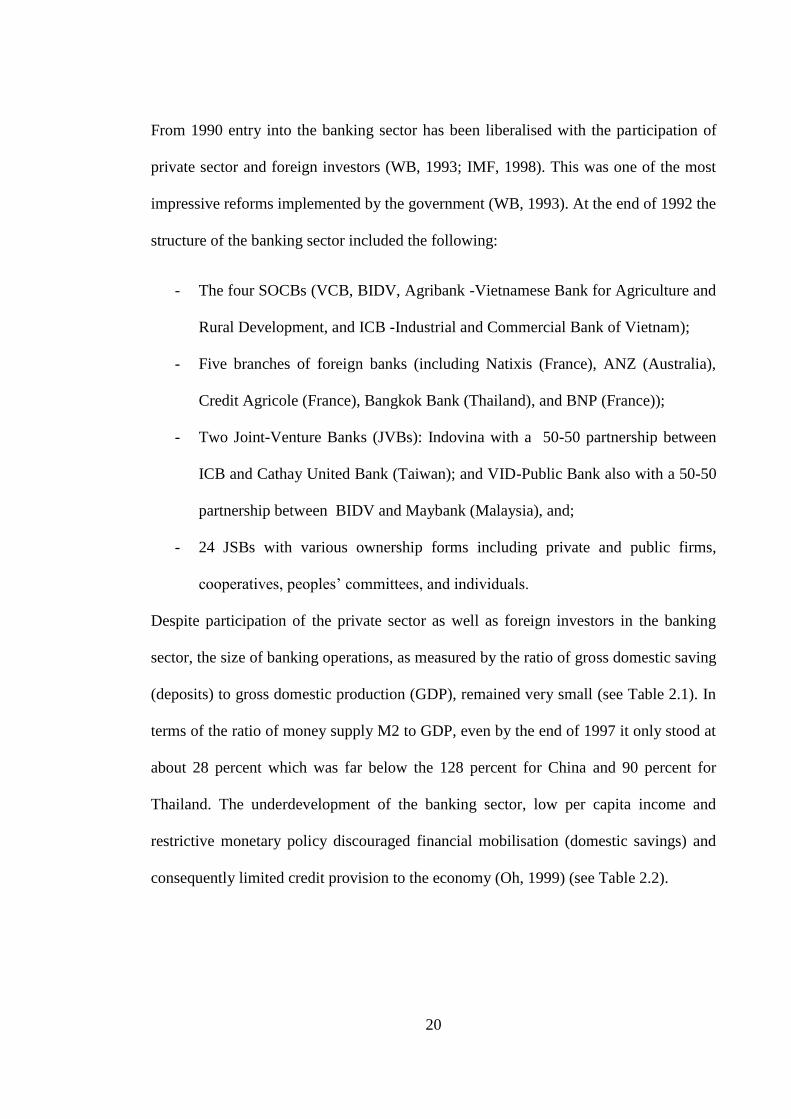
Despite participation of the private sector as well as foreign investors in the banking
sector, the size of banking operations, as measured by the ratio of gross domestic saving
(deposits) to gross domestic production (GDP), remained very small (see Table 2.1). In
terms of the ratio of money supply M2 to GDP, even by the end of 1997 it only stood at
about 28 percent which was far below the 128 percent for China and 90 percent for
Thailand. The underdevelopment of the banking sector, low per capita income and
restrictive monetary policy discouraged financial mobilisation (domestic savings) and
consequently limited credit provision to the economy (Oh, 1999) (see Table 2.2).
21
1Table 2.1: Financial deepening, end-1997 (%)
Items
Viet
nam
Ja
pan
Hong
Kong
Singa
pore
Ko
rea
Chi
na
Thai
land
Indo
nesia
Malay
sia
M2/GDP 27.6 143.8 205.7 93.1 48.3 119.6 89.9 57.0 116.9
Deposits/GDP 10.0 103.7 165.0 85.0 46.8 88.5 82.8 40.8 100.5
Currency/Deposits 42.7 11.8 3.7 9.5 7.8 15.1 8.4 12.1 8.5
Source: Adapted from Oh (1999)
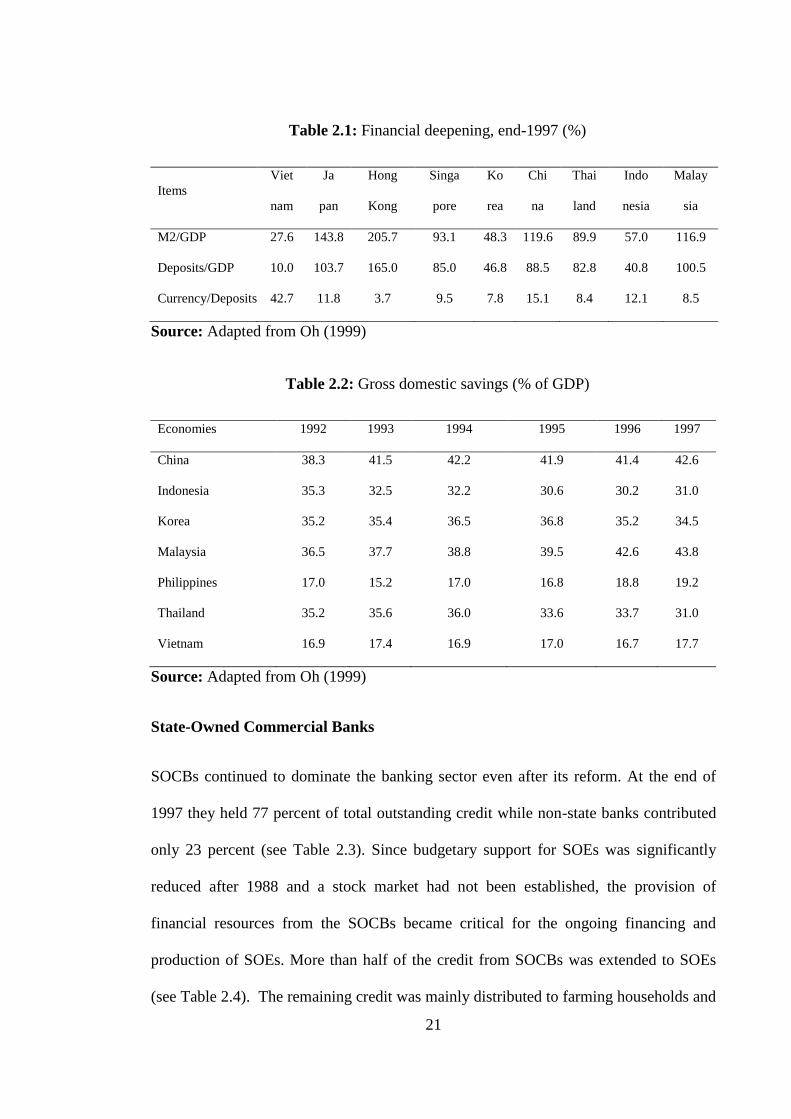
2Table 2.2: Gross domestic savings (% of GDP)
Economies 1992 1993 1994 1995 1996 1997
China 38.3 41.5 42.2 41.9 41.4 42.6
Indonesia 35.3 32.5 32.2 30.6 30.2 31.0
Korea 35.2 35.4 36.5 36.8 35.2 34.5
Malaysia 36.5 37.7 38.8 39.5 42.6 43.8
Philippines 17.0 15.2 17.0 16.8 18.8 19.2
Thailand 35.2 35.6 36.0 33.6 33.7 31.0
Vietnam 16.9 17.4 16.9 17.0 16.7 17.7
Source: Adapted from Oh (1999)
State-Owned Commercial Banks
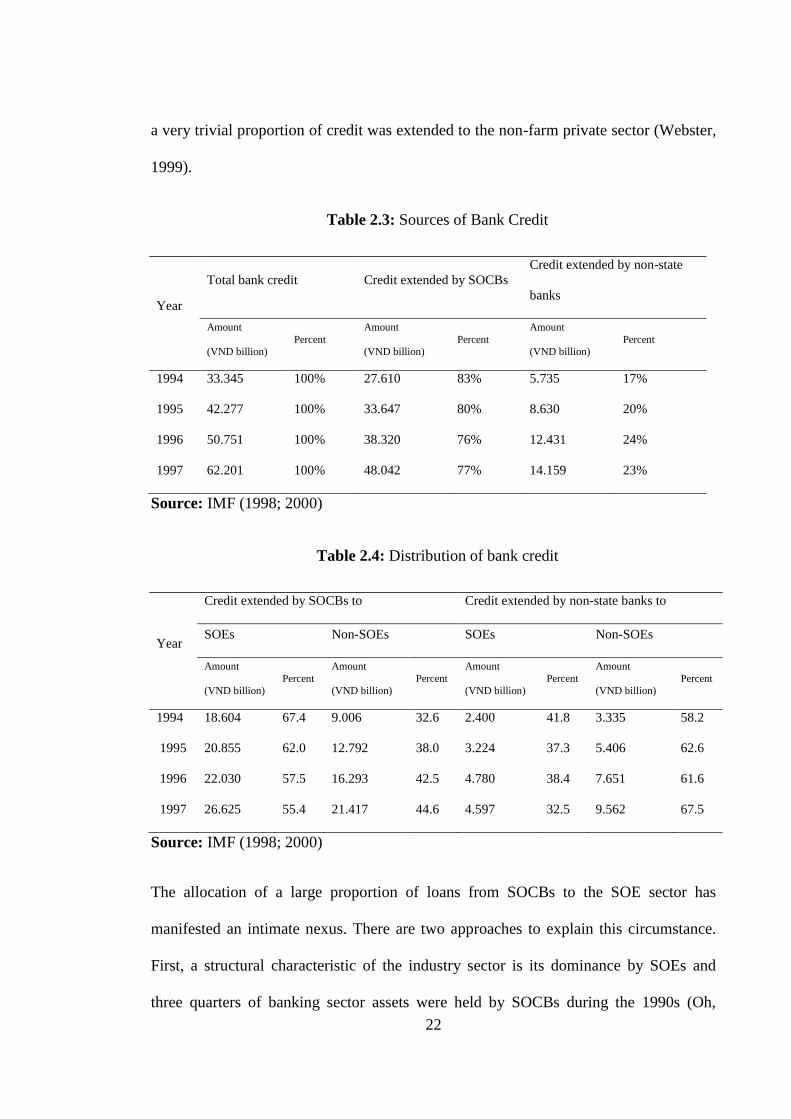
SOCBs continued to dominate the banking sector even after its reform. At the end of
1997 they held 77 percent of total outstanding credit while non-state banks contributed
only 23 percent (see Table 2.3). Since budgetary support for SOEs was significantly
reduced after 1988 and a stock market had not been established, the provision of
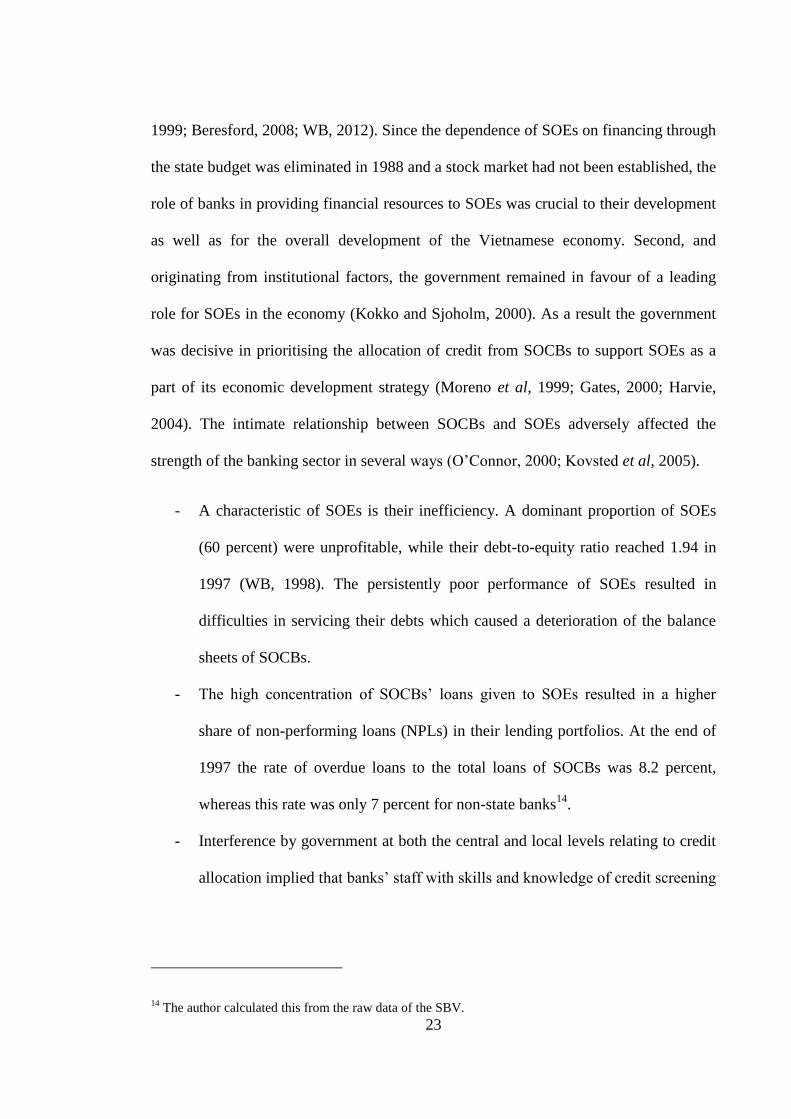
financial resources from the SOCBs became critical for the ongoing financing and
production of SOEs. More than half of the credit from SOCBs was extended to SOEs
(see Table 2.4). The remaining credit was mainly distributed to farming households and
22
a very trivial proportion of credit was extended to the non-farm private sector (Webster,
1999).
3Table 2.3: Sources of Bank Credit
Year
Total bank credit Credit extended by SOCBs
Credit extended by non-state
banks
Amount
(VND billion) Percent
Amount
(VND billion) Percent
Amount
(VND billion) Percent
1994 33.345 100% 27.610 83% 5.735 17%
1995 42.277 100% 33.647 80% 8.630 20%
1996 50.751 100% 38.320 76% 12.431 24%
1997 62.201 100% 48.042 77% 14.159 23%
Source: IMF (1998; 2000)
4Table 2.4: Distribution of bank credit
Year
Credit extended by SOCBs to Credit extended by non-state banks to
SOEs Non-SOEs SOEs Non-SOEs
Amount
(VND billion) Percent
Amount
(VND billion) Percent
Amount
(VND billion) Percent
Amount
(VND billion) Percent
1994 18.604 67.4 9.006 32.6 2.400 41.8 3.335 58.2
1995 20.855 62.0 12.792 38.0 3.224 37.3 5.406 62.6
1996 22.030 57.5 16.293 42.5 4.780 38.4 7.651 61.6
1997 26.625 55.4 21.417 44.6 4.597 32.5 9.562 67.5
Source: IMF (1998; 2000)
The allocation of a large proportion of loans from SOCBs to the SOE sector has
manifested an intimate nexus. There are two approaches to explain this circumstance.
First, a structural characteristic of the industry sector is its dominance by SOEs and
three quarters of banking sector assets were held by SOCBs during the 1990s (Oh,
23
1999; Beresford, 2008; WB, 2012). Since the dependence of SOEs on financing through
the state budget was eliminated in 1988 and a stock market had not been established, the
role of banks in providing financial resources to SOEs was crucial to their development
as well as for the overall development of the Vietnamese economy. Second, and
originating from institutional factors, the government remained in favour of a leading
role for SOEs in the economy (Kokko and Sjoholm, 2000). As a result the government
was decisive in prioritising the allocation of credit from SOCBs to support SOEs as a
part of its economic development strategy (Moreno et al, 1999; Gates, 2000; Harvie,
2004). The intimate relationship between SOCBs and SOEs adversely affected the
strength of the banking sector in several ways (O‘Connor, 2000; Kovsted et al, 2005).
- A characteristic of SOEs is their inefficiency. A dominant proportion of SOEs
(60 percent) were unprofitable, while their debt-to-equity ratio reached 1.94 in
1997 (WB, 1998). The persistently poor performance of SOEs resulted in
difficulties in servicing their debts which caused a deterioration of the balance
sheets of SOCBs.
- The high concentration of SOCBs‘ loans given to SOEs resulted in a higher
share of non-performing loans (NPLs) in their lending portfolios. At the end of
1997 the rate of overdue loans to the total loans of SOCBs was 8.2 percent,
whereas this rate was only 7 percent for non-state banks14
.
- Interference by government at both the central and local levels relating to credit
allocation implied that banks‘ staff with skills and knowledge of credit screening
14
The author calculated this from the raw data of the SBV.
24
and monitoring became superfluous. Consequently, adverse selection and moral
hazard turned out to be common in lending activities (Kokko, 1998).
The above-mentioned problem in the banking sector was viably observed in the first
phase (1988−1997). Due to the close relationship between SOEs and SOCBs, reform in
SOEs would be the precondition to conduct measures that increased efficiency and
transparency in the banking sector (WB, 2000).
Joint Stock Banks
JSBs are private banks established by pooling the capital from shareholders who are
individuals, private or state-owned companies. According to O‘Connor (2000), there
were three factors that contributed to the rapid expansions of JSBs in the mid-1990s.
The first and most important was the process of financial liberalisation itself where the
government issued regulations permitting private entities to enter the banking sector.
Second, the government wanted to hold SOCBs accountable for their loan-losses;
hence, they were more cautious when providing loans. The last factor was the desire of
several SOEs to establish their own JSBs in order to ensure their own sources of
finance.
However, the quality of these JSBs at that time was very weak and unsustainable. Many
JSBs were established from the ailing credit cooperatives15
in the early 1990s and some
JSBs were founded by business families or a group of related SOEs, which were seen as
influential shareholders (IMF, 1998). Moreover, undercapitalisation was a common
15 Credit cooperatives (CCs) are credit institutions which are collectively owned. Playing the role as the
sole funding source in local areas CCs mobilised the majority of local savings by offering very high
interest rates. Nonetheless, these CCs began to encounter problems since the early 1990s. A number of
CCs collapsed with billions of dong of unpaid deposits. A number of agricultural CCs had to close as
government subsidies dried up. This panicked depositors. They rushed to withdraw their money causing
most CCs to go bankrupt (Fforde and De Vylder, 1996).
25
characteristic of JSBs, as 70 percent of JSBs failed to meet the minimum chartered
capital requirement set down by the SBV. In 1998, there were more than 40 JSBs
operating in the banking market, but they accounted for only 7 percent of total banking
sector assets.
JSBs were not only faced with difficulties in terms of financial capacity but also in
terms of management capability. They were engaged in financing high-risk projects
such as properties for residential development, which subsequently experienced a
serious downturn. With the East Asia Financial Crisis (EAFC) of 1997-98 a bursting of
real estate bubbles occurred and spread throughout the region including some of
Vietnam‘s major cities. The JSBs were left exposed and some went insolvent when the
collateral value of their clients plummeted (O‘Connor, 2000). Furthermore, lending
decisions were significantly affected by influential shareholders who had positions on
the Board of Directors, and who encouraged extending credit to related parties (IMF,
1998; WB, 2000).
In general, the operation of JSBs during this phase exposed them to more risk resulting
in high NPLs and insolvency. Intervention by the government and the SBV to improve
the quality and increase the capability of JSVs had become a high priority.
Foreign Bank Branches
From 1991 Vietnam permitted the entry of foreign investors into the banking sector by
establishing foreign bank branches. However, the operation of foreign bank branches
was restrictive due to regulations imposed by the SBV which favoured domestic banks.
For instance, the time length of business licences given to the branches of foreign banks
was only 20 years. They could take Vietnamese dong deposits but only up to an
26
equivalent value of US$1.5 million. In addition, private enterprises in Vietnam were not
allowed to collateralise land-use rights to borrow from foreign bank branches.
In summary, the weaknesses of the banking sector as highlighted above can be
explained using several arguments. First, the existence of a dominant but inefficient
state sector contributed to structural weaknesses in the banking sector. Second, both
central and local government authorities interfered in the lending decisions of banks.
Hence, lending policy became politicised and not determined on the basis of
commercial viability. Other important reasons included the capability and competence
of the SBV in conducting its roles as both the regulator and supervisor of the banking
sector. These limitations needed to be solved to prevent a possible banking crisis and
facilitate the longer term growth and development of the economy.
2.2.2 The Second Banking Sector Reform period (1998−2006)
In contrast with other countries in the East Asian region such as Korea, Thailand,
Indonesia or the Philippines, the Vietnamese banking sector was spared much of the
trauma arising from the impact of the EAFC. This was due to the absence of a
liberalised capital account in combination with an inconvertible currency (Kovsted et al,
2005). The primary indirect impact of the EAFC was on enterprises which experienced
deteriorating export earnings and a reduction of FDI capital inflows. Furthermore,
Vietnamese enterprises had borrowed heavily in foreign currency as well as from
commercial banks so as to take advantage of a low interest rate in a stable exchange rate
environment. However, a ten-percent devaluation of the official exchange rate (the
dong) to the US dollar in August 1998 worsened the condition of both enterprises and
banks‘ asset quality.
27
To protect the state sector from the negative influences of the EAFC the government
implemented favourable measures to assist SOCBs during 1998, including: (1)
abolishing the requirement for SOEs to put up collateral when borrowing from SOCBs;
(2) permitting SOCBs to lend to unprofitable SOEs; (3) writing off the bad loans of the
SOCBs; (4) lowering lending interest rates; (5) and lengthening the loan maturity of
troubled SOEs. These measures placed a heavier financial burden on SOCBs which
were already struggling with many difficulties.
A combination of a three-year economic slowdown (1998−2000) and a fear of repeating
the mistakes in other East Asian countries‘ banking sectors encouraged the government
to commit towards a comprehensive and far-reaching reform of the banking sector. The
scope of this reform covered several dimensions: (1) establishing a consistent and
transparent legal and regulatory environment; (2) improving the quality of domestic
banks; (3) and preparing for WTO accession.
Establishing a consistent legal and regulatory environment
The Law on the State Bank of Vietnam was approved by the National Assembly and
promulgated in October 1998, defining the roles and functions of the SBV in
implementing monetary policy as well as regulating credit institutions (WB, 1998).
While the new law was believed to be a milestone in the development process of
Vietnam‘s banking system or at least a first step in the right direction (Murray, 1999),
Oh (1999) and Kovsted et al (2005) questioned the independence of the SBV. They
supposed that the SBV was assigned as a ministry under the control of government, so
that it must follow the government‗s decisions or even be interfered with in the conduct
of monetary policy.
28
The Law on Credit Institutions also took effect at the same time, aimed at building a
Vietnamese banking system with provisions on prudential operations and putting credit
institutions on a legal basis to facilitate the conduct of monetary policy and stimulate
economic growth (Hall, 2003). The role of credit institutions was described as being
―contributors to a socialist-oriented, multi-sector market economy operating under the
management of the state‖ (the Law on Credit Institutions 1998). Financial resources
would continue to be favourably allocated to SOEs and cooperatives which played a
leading role in the economy, as well as to poor and needy regions.
The two above-mentioned laws included regulations on the following items (Oh, 1999):
- Improvement of credit rules;
- Strengthening the legal framework for banks‘ loan collateral, mortgages and
guarantees;
- Loan-loss provisioning;
- Credit line for clients;
- External debt management
Following the two laws there were 24 decrees which helped detail the contents in the
laws (WB, 1998). These decrees pointed to three main goals: (1) providing quantitative
regulations on banks‘ activities; (2) defining responsibilities of related parties in a credit
relationship consisting of depositors, borrowers, and banks; (3) and providing the
measures to enforce the borrowers‘ repayment obligations.
In order to increase the level of safety and stability in the banking sector in the aspects
of deposit-taking, lending and portfolio investment, the SBV promulgated a series of
quantitative regulations on commercial banks. These included the following:
29
- Increasing the chartered capital and limiting capital transfers;
- Imposing a minimum ratio on equities to assets at 5 percent;
- Liquidity ratio to at least three days of business repayment;
- Limitation of deposit-taking (not to exceed 20 times a bank‘s equity);
- The maximum credit amount to a client (not to exceed 15 percent of a bank‘s
equity);
- The maximum credit to the 10 biggest clients (not to exceed 30 percent of total
outstanding credit).
However, the regulatory framework did not impose an adequate requirement on loan
classification and loan-loss provisioning which could build up a standard for identifying
non-performing loans and financial sources to solve bad-loans.
In April 2005 the SBV issued Decision 493 on loan classification and provisioning16
.
The Decision was an important step towards bringing Vietnamese loan classification
and provisioning practices up to International Accounting Standards (IAS) (WB, 2006;
2007). One of the differences between Decision 493 and IAS is that Decision 493
mostly depends on the quantitative assessment of the loan quality based on the number
of days that servicing of a loan is overdue. Observers from the IMF and WB expected
that it would take several years to transform the current standard of loan classification to
the international qualitative standard based on the expected solvency of the borrowers.
Despite ongoing improvement of the assessment on loan quality under Decision 493,
there remains a substantial gap in loan-loss provisioning as measured by Vietnamese
Accounting Standards (VAS) and IAS. For instance, in 2004 and based on IAS the
16This Decision was subsequently supplemented by Decision 18 issued in 2007.
30
amount of loan-loss provisioning was estimated to be around 15 percent of the
outstanding credit, but this figure was approximately halved from 8 to 10 percent when
employing VAS after writing off bad debts (WB, 2007). This was less than many
observers had expected but twice as high as the estimates based on the old VAS17
.
Improving the quality of domestic banks
The weakness of the banking sector during the 1990s was reflected in low profitability
and inefficient financial intermediation (Oh, 1999; Hall, 2003). Moreover, the
contribution of commercial banks needed to be enhanced to stimulate economic
growth.18
It was widely accepted that both SOCBs and JSBs needed to be restructured,
but simultaneous restructuring both types of banks was impossible. This was due to the
limited capability of both the SBV and government, and fears of losing control by the
Vietnamese Communist Party over the banking sector made the restructuring plan
piecemeal and cautious (Kovsted et al, 2005). Another important reason was the
intimate relationship between SOEs and SOCBs, which required the restructuring plan
of SOCBs to be conducted in parallel with the SOE reform plan. Consequently, the
SBV chose JSBs to be restructured first and then SOCBs (WB, 1998).
The restructuring process involving JSBs was implemented in two steps. In the first step
(cleaning up), depending on financial capability JSBs were classified into three groups:
(i) strong banks which had a low level of NPLs, high liquidity, and a relatively high
capital base; (ii) banks with a temporary lack of liquidity and moderate level of NPLs;
17Only from 2005 has data for the banking sector become more accurate and homogenous.
18Levine (1997) pointed out the relationship between development of the financial system and economic
growth. Accordingly, a more efficient financial system would provide more loans and financial services
that corporates can use in their production process. In Vietnam, the banking sector dominates the financial
system, contributing up to 90% of the total assets of the system (IMF, 2014). Thus, the banking sector
would substantially impact on Vietnam‘s economy.
31
(iii) banks with a persistent lack of liquidity and a very high level of NPLs. Strong
banks in the first group were encouraged to be audited by IAS and improve their
operations, corporate governance and develop new products and services for specific
segments (Oh, 1999; WB, 2006). In contrast, the two other weak JSB groups were
subject to strict measures imposed by the SBV. These JSBs were to be consolidated
through the establishment of explicit and timely procedures for merging, or even closing
non-viable banks. By the end of 2000, 13 of the 48 JSBs were placed under special
supervision of the SBV; three banks‘ licences were revoked; two banks were merged
(Kovsted et al, 2005).
The second step involved strengthening the financial capability of JSBs through loss
allocation and increasing their capital (recapitalisation). To maintain the right incentives
during the process of restructuring any losses were allocated first to shareholders, next
to borrowers and eventually to large depositors. Current shareholders were given time to
raise their additional capital to at least the minimum capital requirement (WB, 1998;
Hall, 2003). If the requirements from the SBV were not satisfied the government would
take control and close insolvent banks.
Restructuring SOCBs was more problematic than JSBs. Three reasons can explain this.
First, the plan for restructuring SOCBs had to ensure that after restructuring SOCBs
would lend only on the basis of commercial criteria and manage their business
efficiently. The IMF and WB worried that as long as the government remained the sole
owner of SOCBs, incentives for SOCBs to reform remained weak. Second, due to a
predominant proportion of loans belonging to SOEs, and they were still in trouble, the
restructuring plan of SOCBs had to go hand in hand with SOE reform. Third, any
unrecoverable capital deficiency would be covered by the national budget.
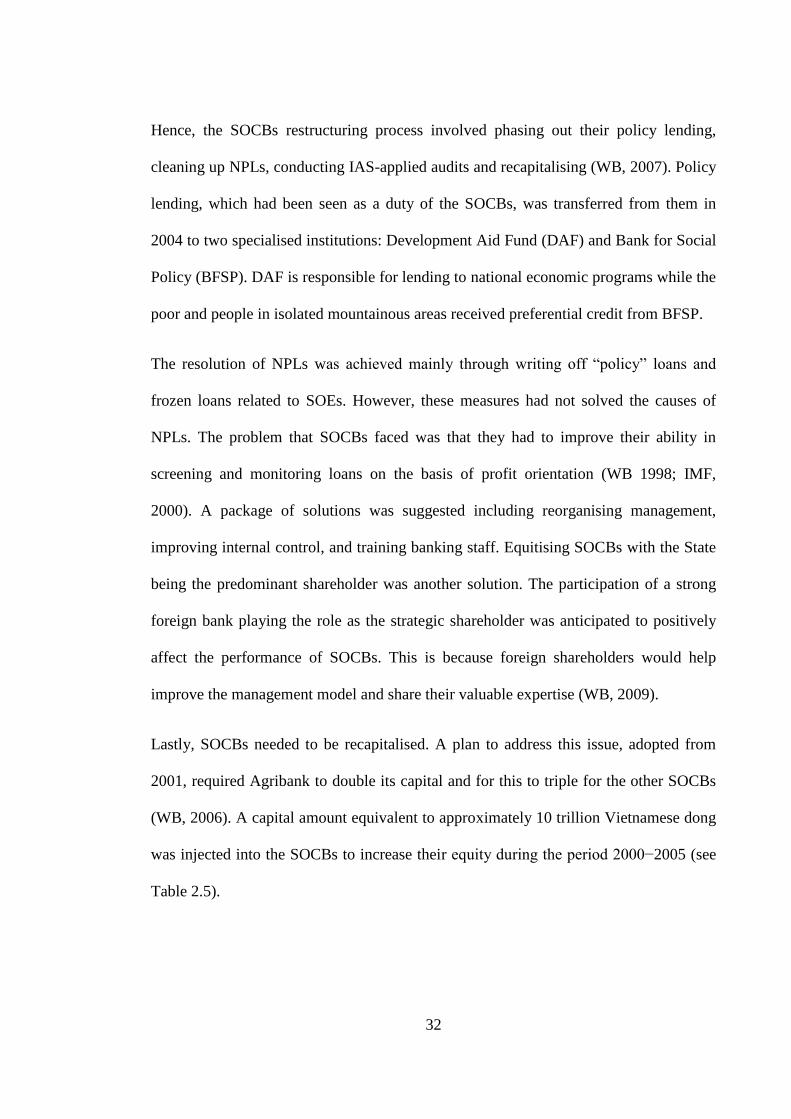
32
Hence, the SOCBs restructuring process involved phasing out their policy lending,
cleaning up NPLs, conducting IAS-applied audits and recapitalising (WB, 2007). Policy
lending, which had been seen as a duty of the SOCBs, was transferred from them in
2004 to two specialised institutions: Development Aid Fund (DAF) and Bank for Social
Policy (BFSP). DAF is responsible for lending to national economic programs while the
poor and people in isolated mountainous areas received preferential credit from BFSP.
The resolution of NPLs was achieved mainly through writing off ―policy‖ loans and
frozen loans related to SOEs. However, these measures had not solved the causes of
NPLs. The problem that SOCBs faced was that they had to improve their ability in
screening and monitoring loans on the basis of profit orientation (WB 1998; IMF,
2000). A package of solutions was suggested including reorganising management,
improving internal control, and training banking staff. Equitising SOCBs with the State
being the predominant shareholder was another solution. The participation of a strong
foreign bank playing the role as the strategic shareholder was anticipated to positively
affect the performance of SOCBs. This is because foreign shareholders would help
improve the management model and share their valuable expertise (WB, 2009).
Lastly, SOCBs needed to be recapitalised. A plan to address this issue, adopted from
2001, required Agribank to double its capital and for this to triple for the other SOCBs
(WB, 2006). A capital amount equivalent to approximately 10 trillion Vietnamese dong
was injected into the SOCBs to increase their equity during the period 2000−2005 (see
Table 2.5).
33
5Table 2.5: Relative size of SOCBs (trillion dong)
Chartered Capital Outstanding Loans
2003 2004 2003 2004
Four large SOCBs 14.53 17.37 214.80 296.07
Agribank 5.45 6.14 87.08 123.47
VCB 2.42 4.03 30.00 46.49
BIDV 3.75 3.87 48.09 64.01
ICB 2.91 3.33 49.63 62.10
DAF 4.98 4.98 64.81 76.93
Source: Adapted from World Bank Report 2006
Preparing for global integration
Vietnam submitted its first application to be a WTO member in 2002. After many
rounds of negotiation Vietnam was accepted to be the 150th
member of the world‘s
largest trade organisation – WTO from January 2007. This event marked a milestone in
the transition process of Vietnam, committing it to open markets to potential foreign
competitors and to reduce and eliminate any subsidies and technical barriers to trade
(WB, 2006).
In the banking sector technical barriers were to be gradually removed from 2007, and
Vietnam committed to totally eliminating all obstacles applying to foreign investors
from 2011. From April 2007 overseas banks were allowed to open 100 percent foreign-
invested banks in Vietnam and joint-venture banks with a foreign capital contribution
not exceeding 50 percent. Foreign banks were allowed to provide all services which
were provided by domestic banks. However, during the first 5 years from the date of
accession, Vietnam was permitted to limit the right of foreign bank branches to take
34
deposits in Vietnamese dong. The total equity held by foreign institutions and
individuals in each of Vietnam's joint-stock commercial bank was limited to 30 percent
of the bank's chartered capital.
Capital participation in the banking market by foreign investors generated concerns
among the authorities on the competiveness of domestic banks. Both SOCBs and JSBs
faced difficulties including low efficiency, out-of-date technology and a small size of
capital. Consequently, WTO accession challenged domestic banks with foreign banks
having high competitiveness, modern technology, and strong financial capability.
Responding to this threat a strategy providing a comprehensive roadmap to improve the
quality of the banking sector was issued through Decision 112 in May 2006 (WB,
2007). The main measures included the following:
- Elaborating a legal and regulatory framework
Two new laws, the Law of State Bank and the Law of Credit Institutions would be
submitted to the National Assembly after 2007. Moreover, the Law of Deposit
Insurance and the Law of Banking Supervision would be developed to ensure stability
and public confidence in the banking sector.
- Strengthening the financial capability of domestic banks
Decree 141 issued in November 2006 identified the minimum capital requirement and a
roadmap for domestic banks to implement. Accordingly, by the end of 2008 the
minimum level of capital was 1000 billion Vietnamese dong rising to 3000 billion by
the end of 2010. Any bank that could not satisfy these requirements would be specially
supervised and stringent measures would be applied including bankruptcy.
- Increasing the quality of management
35
The SBV applied a modern joint stock corporation model to bank management
including a Shareholder Assembly, a Board of Directors, and Internal Control.
Independent auditing was obligatory in order to ensure a transparent environment and
maintain the confidence of depositors. Foreign investors were offered to buy the shares
of domestic banks. The participation of foreign investors with their expertise and high
technology as members of the Board of Directors was expected to raise the efficiency of
domestic banks.
- Developing banking technology
Domestic banks modernised their banking services based on information technology
such as internet banking, automated teller machines (ATM), and payment cards. The
SBV upgraded its electronic system for interbank settlement.
2.2.3 Accelerating after WTO Entry (2007−2009)19
The subsequent period after WTO accession was characterised by an acceleration of
credit and assets in the banking sector. This rapid growth can be explained by several
factors.
Liberalisation
Vietnam has to implement commitments on liberalising its banking sector. Foreign
banks are allowed to provide their customers with all types of services such as
acceptance deposits and other repayable funds from the public, lending of all types,
financial leasing, all payment and money transmission services, guarantees and
19 A detailed analysis of this phase will be presented in Section 2.3
36
commitments. Foreign credit institutions are permitted to establish a commercial
presence in Vietnam.
Foreign banks with expertise, advanced technology, good trademarks and financial
capability may establish 100 percent foreign-invested banks in Vietnam. Foreign banks
may contribute up to 30 percent of shares in a domestic bank. The participation of
foreign banks as dominant shareholders supports domestic banks. Through assigning
their staff in the Board of Directors, and Board of Management, foreign banks can
positively contribute to the decision making process in order to improve technology,
quality of management, and develop new banking services and products (Claessens et
al., 2001). Moreover, through capital participation foreign banks can facilitate the
refinancing of domestic banks, helping these banks achieve the capital adequacy ratio
imposed by the SBV.
At present there are two SOCBs with capital participation from Japanese banks. The
first is Vietcombank which received US$567 million, equivalent to 15 percent of total
equity, from Mizuho bank in 2011. In 2012 Vietinbank chose the third largest bank
worldwide – The Bank of Tokyo-Mitsubishi UFJ (BTMU) as its strategic foreign
investor. BTMU purchased 20 percent of Vietinbank‘s shares equivalent to US$743
million20
.
Large JSBs were even earlier than SOCBs in calling for capital participation from
foreign investors. HSBC acquired a 10 percent stake in Techcombank in December
20Japanese banks are favoured by the Vietnamese government to be strategic foreign investors of SOCBs
because Japan is the most important partner of Vietnam in terms of Foreign Direct Investment (FDI) as
well as Official Development Aid (ODA). Through capital participation in SOCBs, Japanese banks drive
the activities of these banks in order to support their clients (Japanese companies having businesses in
Vietnam).
37
2005, and increased it to 15 percent in 2007. The International Finance Corporation
(IFC) of the World Bank, ANZ Bank, and Dragon Financial Holdings jointly hold the
maximum allowable of 30 percent of Sacombank, the biggest JSB in terms of chartered
capital.
Financial deregulation
The SBV implemented a more expansionary monetary policy after WTO entry.
Between 2001 and 2006 banking credit grew at an average rate of 28.5 percent in
nominal terms. A considerable acceleration occurred from 2007 onwards (WB, 2009;
Vo and Nguyen, 2009). When Vietnam officially became a member of the WTO capital
inflows started accelerating in the form of FDI and portfolio investment. Concerning the
related appreciation of the Vietnamese dong the SBV intervened in the foreign
exchange market by purchasing foreign currency up to a value of 10.1 billion dollars in
just one year (2007). Consequently, the banking system received significant additional
liquidity. Moreover, an overheating real estate market with high expected returns
attracted more credit from banks. The result was a ballooning of banking credit, peaking
at an annual growth rate of 63.2 percent in nominal terms in March 2008.
An undesirable outcome in the post-WTO entry period was the venturing of economic
groups from both state and private sectors into non-core business including banking,
insurance and real estate (WB, 2009; 2012; Leung, 2010). This circumstance occurred
during 2007 and early 2008 when these groups expected that mobilising financial
resources would make substantial profits. In fact, the number of JSBs partly owned by
SOEs increased from 4 in 2005 to 22 by 2010 (WB, 2012). The participation of business
38
groups in the banking sector reduced the efficiency of credit allocation when they
channelled bank credit to themselves.
The SBV substantially loosened its regulations when permitting 12 rural banks to
transform into urban banks during the period 2006-2007 (NAEC, 2012). In 2005, the
total capital of these banks was estimated at 165 billion Vietnamese dong, or 13.75
billion dong on average for each bank. However, according to Decision 141 issued in
May 2006, by the end of 2008 each urban bank had to achieve a chartered capital level
of at least 1,000 billion Vietnamese dong. Consequently, transformed banks raced to
increase their capital and they called upon capital contributions from the other big banks
and business groups.
2.2.4 A Slowdown after the Global Financial Crisis and Restructuring the Banking
Sector (2010−2015)
The past decade has recorded an extremely rapid expansion of the banking sector in
Vietnam. The ratio of bank credit to GDP increased from 20 percent in the late 1990s to
136 percent at the end of 2010 (VELP, 2012). While credit expansion in the first half of
the 2000s resulted from the financial deepening plan, in recent years, after WTO
accession, it was the result of a loosening of monetary policy. In the context of a
shallow financial market and weak governance, rapid credit expansion could result in
banking system problems (Tornell, 1999; Keeton, 1999; Kawai et al, 2001). The quality
of bank assets considerably deteriorated during this period. Non-performing loans
surged during the 2010-2012 period as a result of a plummeting property market,
defaults of SOEs and the impact of the GFC. There is no consensus on the NPL rate
computed by different organisations (individual banks, the National Financial
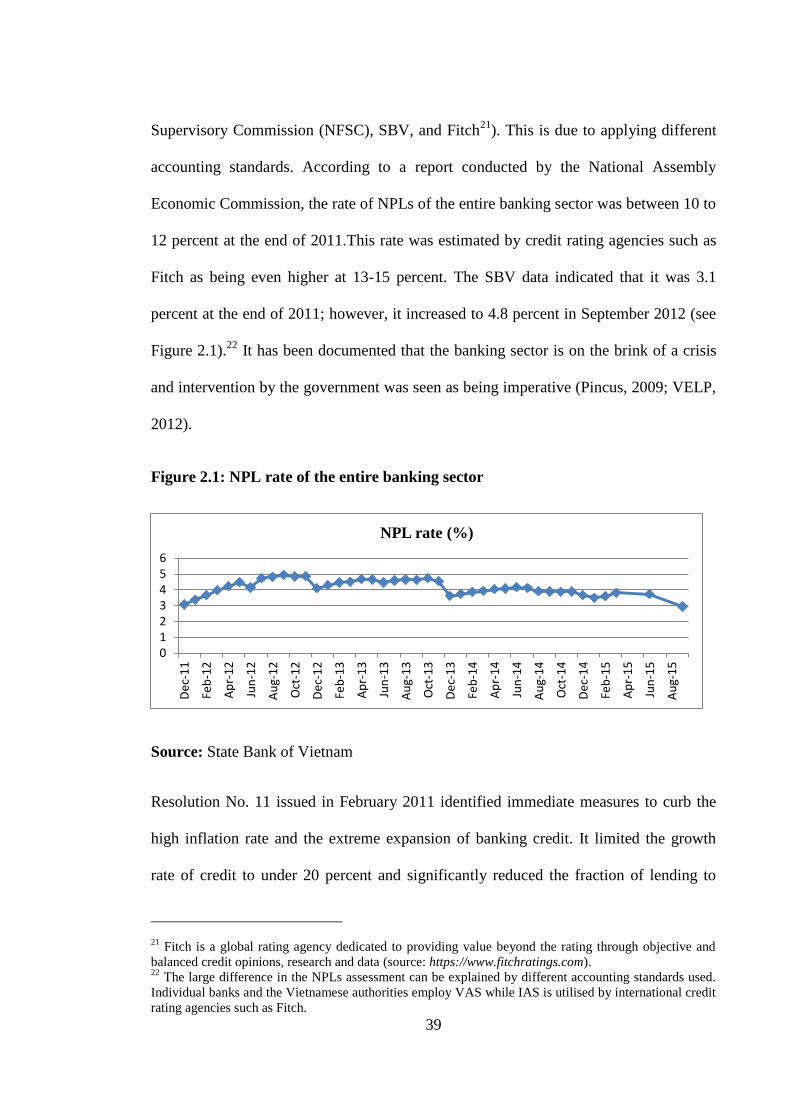
39
Supervisory Commission (NFSC), SBV, and Fitch21
). This is due to applying different
accounting standards. According to a report conducted by the National Assembly
Economic Commission, the rate of NPLs of the entire banking sector was between 10 to
12 percent at the end of 2011.This rate was estimated by credit rating agencies such as
Fitch as being even higher at 13-15 percent. The SBV data indicated that it was 3.1
percent at the end of 2011; however, it increased to 4.8 percent in September 2012 (see
Figure 2.1).22
It has been documented that the banking sector is on the brink of a crisis
and intervention by the government was seen as being imperative (Pincus, 2009; VELP,
2012).
Figure 2.1: NPL rate of the entire banking sector
Source: State Bank of Vietnam
Resolution No. 11 issued in February 2011 identified immediate measures to curb the
high inflation rate and the extreme expansion of banking credit. It limited the growth
rate of credit to under 20 percent and significantly reduced the fraction of lending to
21 Fitch is a global rating agency dedicated to providing value beyond the rating through objective and
balanced credit opinions, research and data (source: https://www.fitchratings.com). 22
The large difference in the NPLs assessment can be explained by different accounting standards used.
Individual banks and the Vietnamese authorities employ VAS while IAS is utilised by international credit
rating agencies such as Fitch.
0123456
De
c-1
1
Feb
-12
Ap
r-1
2
Jun
-12
Au
g-1
2
Oct
-12
De
c-1
2
Feb
-13
Ap
r-1
3
Jun
-13
Au
g-1
3
Oct
-13
De
c-1
3
Feb
-14
Ap
r-1
4
Jun
-14
Au
g-1
4
Oct
-14
De
c-1
4
Feb
-15
Ap
r-1
5
Jun
-15
Au
g-1
5
NPL rate (%)
40
financial markets. The priority in credit allocation was to be to agriculture, small and
medium enterprises and supportive industries.
Moreover, a long-run restructuring plan under Decision 254 was issued in March 2012.
The overall objective of this was to restructure comprehensively the banking system
with the 2020 vision to develop modern, safe, efficient, and sustainable banks capable
of competing with foreign banks. In particular, in the period 2011-2015, emphasis was
placed on improving financial conditions, safety, legal compliance, efficiency of banks
and consolidating operational capabilities. A set of measurements has been drawn up,
which includes:
Measures vis-a-vis SOCBs:
- SOCBs to keep up the pace of equitising but ensure that the State must hold the
dominant share in these banks and develop from one to two SOCBs competing
regionally.
- SOCBs raise their equity through additional public offerings and from budgetary
resources in order to meet the Basel II capital standard by 2015.
- Solving and decreasing NPLs to below 3 percent according to the domestic
standard by 2015.
- Improving internal control and supervision, especially the risk management
system.
- Reducing the credit-to-deposit ratio to below 90 percent by 2015.
Measures vis-a-vis JSBs:
41
- Healthy JSBs will be consolidated to increase their sale and competitiveness in
terms of size, service quality, administration, and technology. They are expected
to support weak banks by increasing their liquidity, or through merging.
- In the case of temporarily illiquid JSBs the SBV will refinance them to ensure
their liquidity. These JSBs are required to strengthen their financial condition,
operations, and management under the close supervision and consultation of the
SBV.
- Weak JSBs are defined as those banks that cannot ensure liquidity in either the
short- or long-term. Their rate of NPLs is so high that the volume of NPLs
exceeds their equities. In other words, they are technically insolvent. These
banks will be refinanced by the SBV up to their level of chartered capital and
put under special supervision. Their good assets should be purchased by healthy
banks and they are put under special control, dividends and other payments are
limited, weak banks are forced to merge and foreign investors are allowed to
acquire or directly inject capital.
However, the government‘s bank restructuring plan exposed several limitations. First,
although the plan provided a framework for comprehensive reform of the banking
sector, the lack of implementation details implied that its application would be ad hoc
and it suggested reluctance to close insolvent banks23
depriving the authorities of an
important coercive tool (IMF, 2012). The cost that must be paid by the economy would
be bigger if the government was still indecisive in dealing with weak banks. Merging
them together was no solution in itself and extending liquidity should only be to solvent
banks. Second, the plan lacked regulatory and supervisory measures that would
23 The SBV makes no distinction between illiquid and insolvent banks.
42
introduce specific and progressive enforcement measures to prevent problems leading to
insolvency, as well as a special bank resolution and insolvency regime. This would
prevent the possibility of a reversal of supervisory authorities‘ decisions by the court
system, and protect them from personal liabilities. Third, to support supervision the
regulations should have been strengthened in line with the best international practices,
especially for loan classification and loan-loss provisioning.
2.3 Vietnam’s Commercial Banks in the Post-WTO Entry Period (2007−2015)
2.3.1 Performance of Vietnam’s Commercial Banks
Rapid Growth
The immediate influence of banking liberalisation and deregulation has been the rapid
growth of this sector in the post-WTO period. In 2001, banking credit accounted for
only 39.3 percent of GDP, but it jumped up to 99 percent in 2007 and then to 125
percent in 2010 (see Figure 2.2). This compares with the period 2001−2006 where the
average annual growth rate of bank credit was only 28.5 percent. A considerable
acceleration occurred from 2007 to 2010, as the average annual growth rate increased to
37.8 percent. The restrictive monetary policy applied from 2011 imposed a ceiling on
the credit growth of the banking sector to under 16 percent. As a result the rate of credit
growth decreased significantly to 14.3 percent in 2011 and 8.9 percent in 2012.
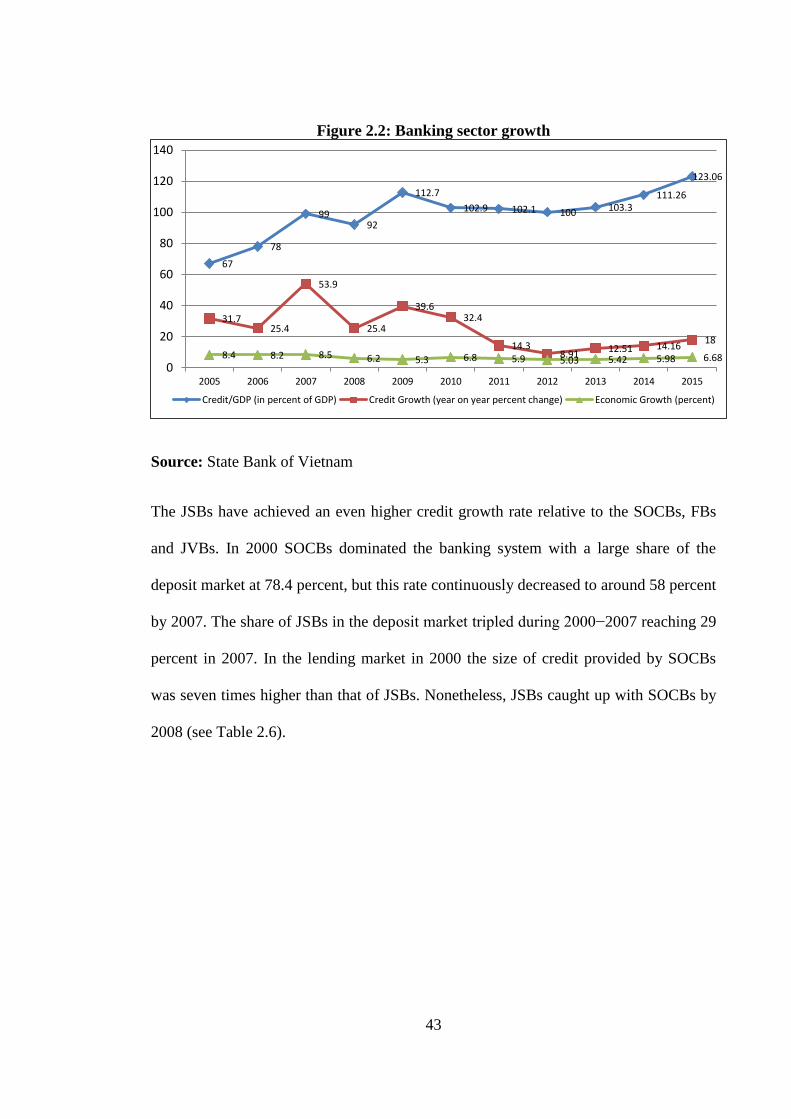
43
Figure 2.2: Banking sector growth
Source: State Bank of Vietnam
The JSBs have achieved an even higher credit growth rate relative to the SOCBs, FBs
and JVBs. In 2000 SOCBs dominated the banking system with a large share of the
deposit market at 78.4 percent, but this rate continuously decreased to around 58 percent
by 2007. The share of JSBs in the deposit market tripled during 2000−2007 reaching 29
percent in 2007. In the lending market in 2000 the size of credit provided by SOCBs
was seven times higher than that of JSBs. Nonetheless, JSBs caught up with SOCBs by
2008 (see Table 2.6).
67
78
99 92
112.7
102.9 102.1 100 103.3 111.26
123.06
31.7 25.4
53.9
25.4
39.6 32.4
14.3 8.91
12.51 14.16 18
8.4 8.2 8.5 6.2 5.3 6.8 5.9 5.03 5.42 5.98 6.68 0
20
40
60
80
100
120
140
2005 2006 2007 2008 2009 2010 2011 2012 2013 2014 2015
Credit/GDP (in percent of GDP) Credit Growth (year on year percent change) Economic Growth (percent)
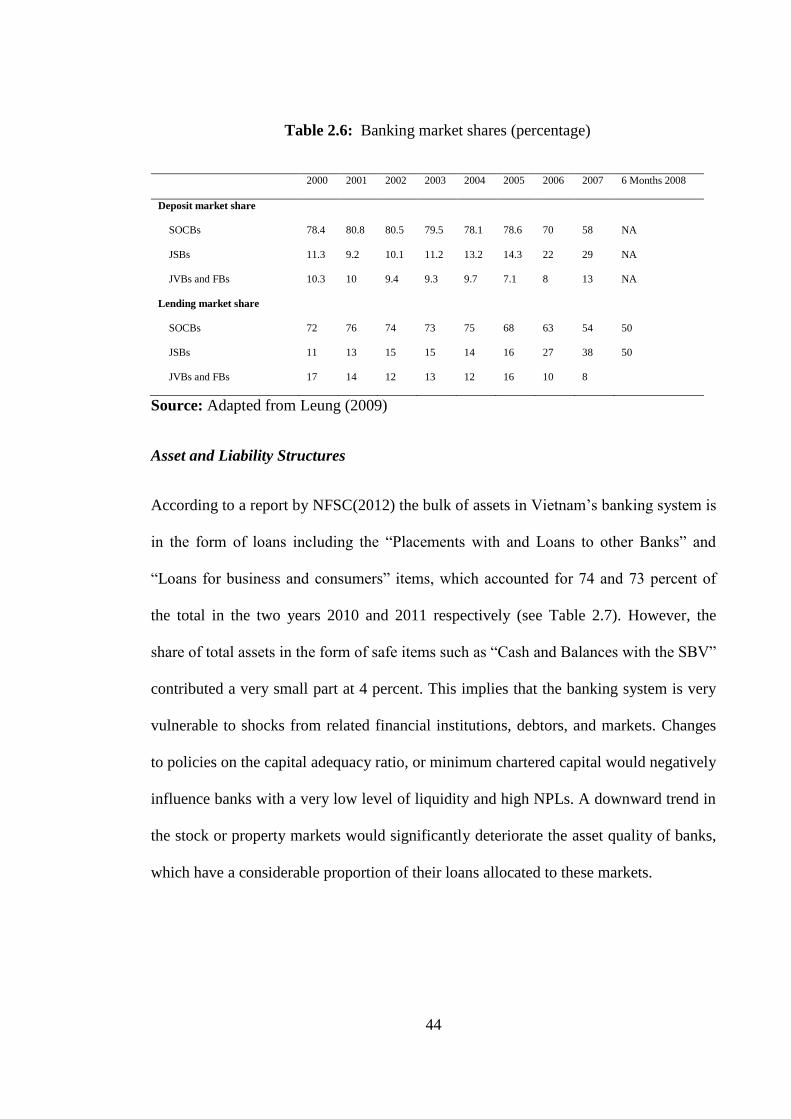
44
6Table 2.6: Banking market shares (percentage)
2000 2001 2002 2003 2004 2005 2006 2007 6 Months 2008
Deposit market share
SOCBs 78.4 80.8 80.5 79.5 78.1 78.6 70 58 NA
JSBs 11.3 9.2 10.1 11.2 13.2 14.3 22 29 NA
JVBs and FBs 10.3 10 9.4 9.3 9.7 7.1 8 13 NA
Lending market share
SOCBs 72 76 74 73 75 68 63 54 50
JSBs 11 13 15 15 14 16 27 38 50
JVBs and FBs 17 14 12 13 12 16 10 8
Source: Adapted from Leung (2009)
Asset and Liability Structures
According to a report by NFSC(2012) the bulk of assets in Vietnam‘s banking system is
in the form of loans including the ―Placements with and Loans to other Banks‖ and
―Loans for business and consumers‖ items, which accounted for 74 and 73 percent of
the total in the two years 2010 and 2011 respectively (see Table 2.7). However, the
share of total assets in the form of safe items such as ―Cash and Balances with the SBV‖
contributed a very small part at 4 percent. This implies that the banking system is very
vulnerable to shocks from related financial institutions, debtors, and markets. Changes
to policies on the capital adequacy ratio, or minimum chartered capital would negatively
influence banks with a very low level of liquidity and high NPLs. A downward trend in
the stock or property markets would significantly deteriorate the asset quality of banks,
which have a considerable proportion of their loans allocated to these markets.
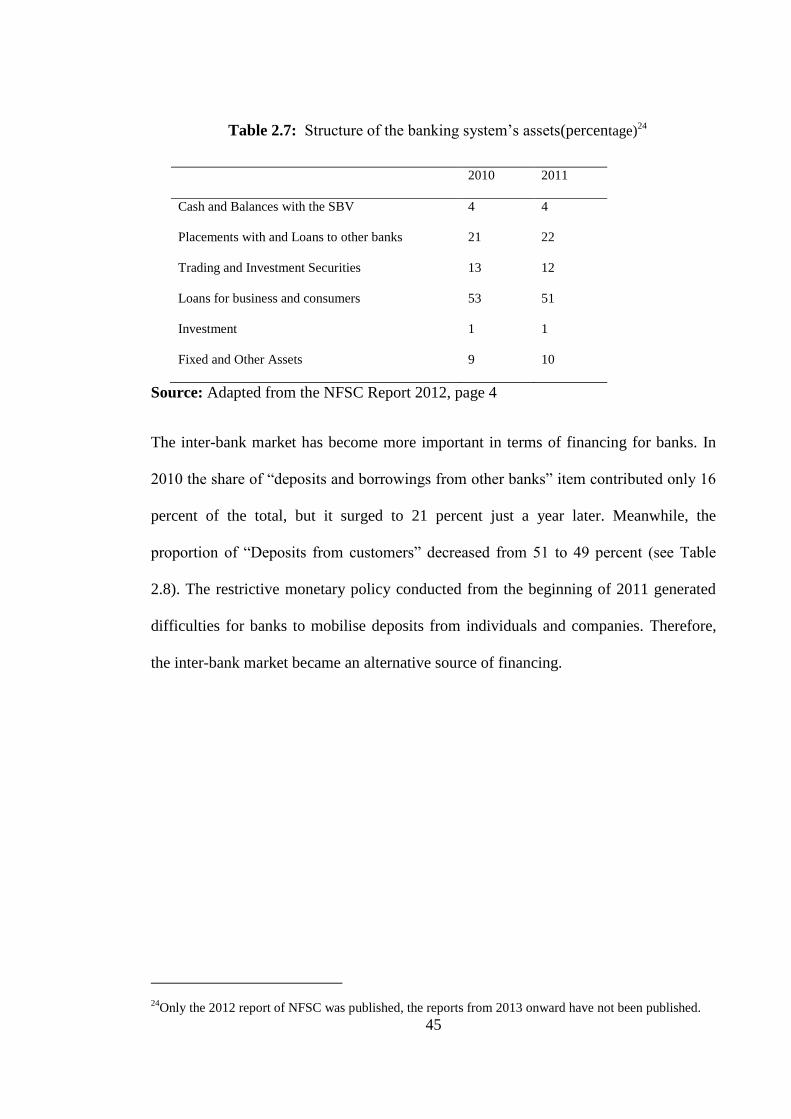
45
7Table 2.7: Structure of the banking system‘s assets(percentage)24
2010 2011
Cash and Balances with the SBV 4 4
Placements with and Loans to other banks 21 22
Trading and Investment Securities 13 12
Loans for business and consumers 53 51
Investment 1 1
Fixed and Other Assets 9 10
Source: Adapted from the NFSC Report 2012, page 4
The inter-bank market has become more important in terms of financing for banks. In
2010 the share of ―deposits and borrowings from other banks‖ item contributed only 16
percent of the total, but it surged to 21 percent just a year later. Meanwhile, the
proportion of ―Deposits from customers‖ decreased from 51 to 49 percent (see Table
2.8). The restrictive monetary policy conducted from the beginning of 2011 generated
difficulties for banks to mobilise deposits from individuals and companies. Therefore,
the inter-bank market became an alternative source of financing.
24Only the 2012 report of NFSC was published, the reports from 2013 onward have not been published.
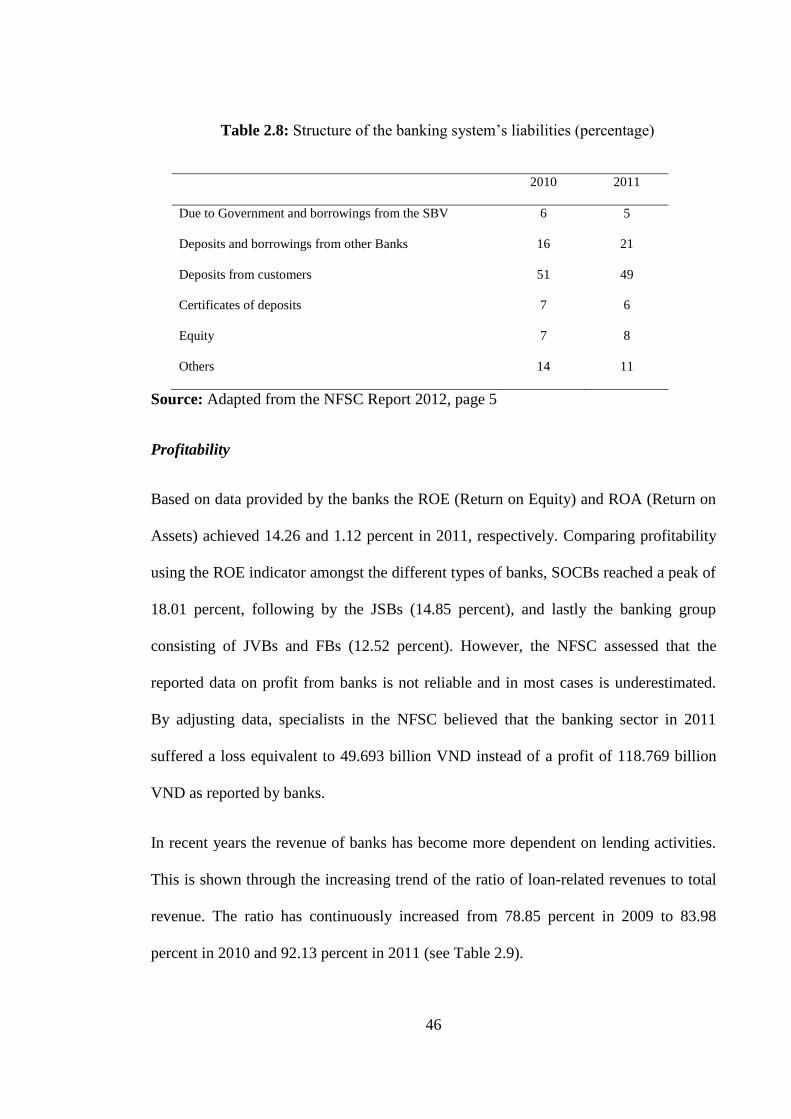
46
8Table 2.8: Structure of the banking system‘s liabilities (percentage)
2010 2011
Due to Government and borrowings from the SBV 6 5
Deposits and borrowings from other Banks 16 21
Deposits from customers 51 49
Certificates of deposits 7 6
Equity 7 8
Others 14 11
Source: Adapted from the NFSC Report 2012, page 5
Profitability
Based on data provided by the banks the ROE (Return on Equity) and ROA (Return on
Assets) achieved 14.26 and 1.12 percent in 2011, respectively. Comparing profitability
using the ROE indicator amongst the different types of banks, SOCBs reached a peak of
18.01 percent, following by the JSBs (14.85 percent), and lastly the banking group
consisting of JVBs and FBs (12.52 percent). However, the NFSC assessed that the
reported data on profit from banks is not reliable and in most cases is underestimated.
By adjusting data, specialists in the NFSC believed that the banking sector in 2011
suffered a loss equivalent to 49.693 billion VND instead of a profit of 118.769 billion
VND as reported by banks.
In recent years the revenue of banks has become more dependent on lending activities.
This is shown through the increasing trend of the ratio of loan-related revenues to total
revenue. The ratio has continuously increased from 78.85 percent in 2009 to 83.98
percent in 2010 and 92.13 percent in 2011 (see Table 2.9).
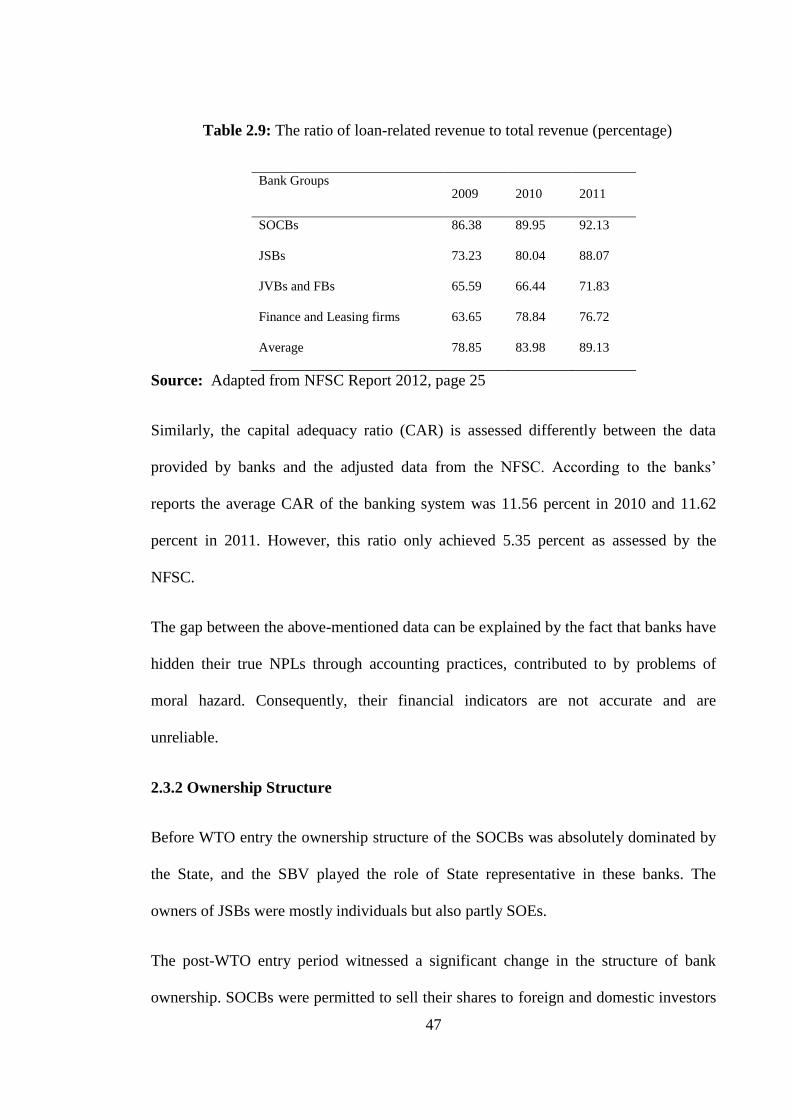
47
9Table 2.9: The ratio of loan-related revenue to total revenue (percentage)
Bank Groups
2009 2010 2011
SOCBs 86.38 89.95 92.13
JSBs 73.23 80.04 88.07
JVBs and FBs 65.59 66.44 71.83
Finance and Leasing firms 63.65 78.84 76.72
Average 78.85 83.98 89.13
Source: Adapted from NFSC Report 2012, page 25
Similarly, the capital adequacy ratio (CAR) is assessed differently between the data
provided by banks and the adjusted data from the NFSC. According to the banks‘
reports the average CAR of the banking system was 11.56 percent in 2010 and 11.62
percent in 2011. However, this ratio only achieved 5.35 percent as assessed by the
NFSC.
The gap between the above-mentioned data can be explained by the fact that banks have
hidden their true NPLs through accounting practices, contributed to by problems of
moral hazard. Consequently, their financial indicators are not accurate and are
unreliable.
2.3.2 Ownership Structure
Before WTO entry the ownership structure of the SOCBs was absolutely dominated by
the State, and the SBV played the role of State representative in these banks. The
owners of JSBs were mostly individuals but also partly SOEs.
The post-WTO entry period witnessed a significant change in the structure of bank
ownership. SOCBs were permitted to sell their shares to foreign and domestic investors
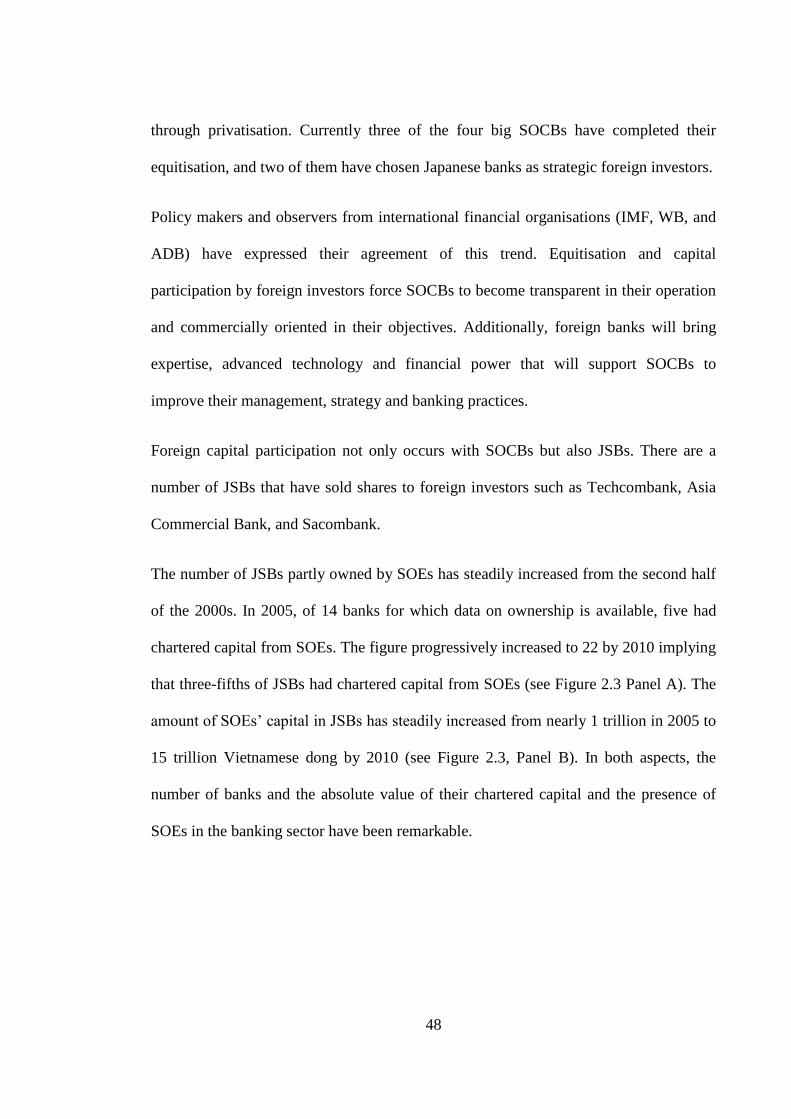
48
through privatisation. Currently three of the four big SOCBs have completed their
equitisation, and two of them have chosen Japanese banks as strategic foreign investors.
Policy makers and observers from international financial organisations (IMF, WB, and
ADB) have expressed their agreement of this trend. Equitisation and capital
participation by foreign investors force SOCBs to become transparent in their operation
and commercially oriented in their objectives. Additionally, foreign banks will bring
expertise, advanced technology and financial power that will support SOCBs to
improve their management, strategy and banking practices.
Foreign capital participation not only occurs with SOCBs but also JSBs. There are a
number of JSBs that have sold shares to foreign investors such as Techcombank, Asia
Commercial Bank, and Sacombank.
The number of JSBs partly owned by SOEs has steadily increased from the second half
of the 2000s. In 2005, of 14 banks for which data on ownership is available, five had
chartered capital from SOEs. The figure progressively increased to 22 by 2010 implying
that three-fifths of JSBs had chartered capital from SOEs (see Figure 2.3 Panel A). The
amount of SOEs‘ capital in JSBs has steadily increased from nearly 1 trillion in 2005 to
15 trillion Vietnamese dong by 2010 (see Figure 2.3, Panel B). In both aspects, the
number of banks and the absolute value of their chartered capital and the presence of
SOEs in the banking sector have been remarkable.
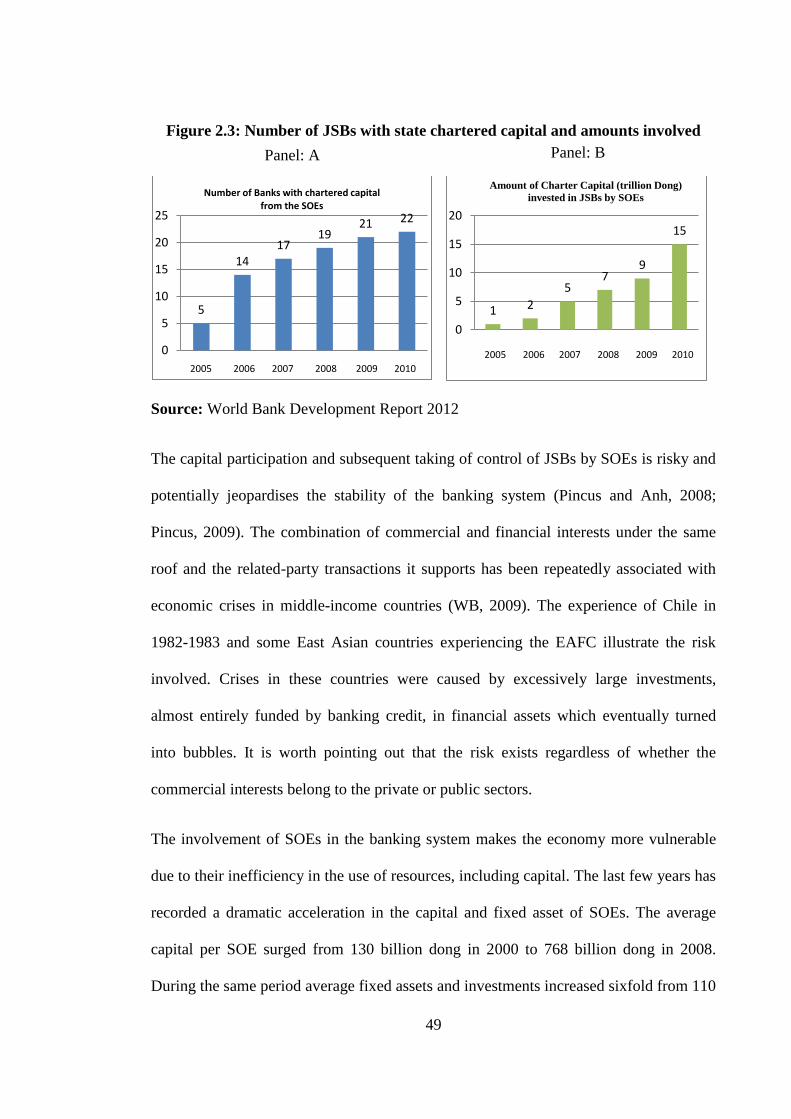
49
Figure 2.3: Number of JSBs with state chartered capital and amounts involved
Source: World Bank Development Report 2012
The capital participation and subsequent taking of control of JSBs by SOEs is risky and
potentially jeopardises the stability of the banking system (Pincus and Anh, 2008;
Pincus, 2009). The combination of commercial and financial interests under the same
roof and the related-party transactions it supports has been repeatedly associated with
economic crises in middle-income countries (WB, 2009). The experience of Chile in
1982-1983 and some East Asian countries experiencing the EAFC illustrate the risk
involved. Crises in these countries were caused by excessively large investments,
almost entirely funded by banking credit, in financial assets which eventually turned
into bubbles. It is worth pointing out that the risk exists regardless of whether the
commercial interests belong to the private or public sectors.
The involvement of SOEs in the banking system makes the economy more vulnerable
due to their inefficiency in the use of resources, including capital. The last few years has
recorded a dramatic acceleration in the capital and fixed asset of SOEs. The average
capital per SOE surged from 130 billion dong in 2000 to 768 billion dong in 2008.
During the same period average fixed assets and investments increased sixfold from 110
5
14 17
19 21 22
0
5
10
15
20
25
Number of Banks with chartered capital from the SOEs
2005 2006 2007 2008 2009 2010
1 2
5 7
9
15
0
5
10
15
20
Amount of Charter Capital (trillion Dong)
invested in JSBs by SOEs
2005 2006 2007 2008 2009 2010
Panel: A Panel: B
50
to 677 billion dong. Assets generated in the state sector were mainly financed by bank
credit. SOEs are also found to be less financially prudent (Pincus, 2009). During
2007−2009 the debt-to-equity ratio of SOEs averaged 307 percent relative to 183
percent for non-state firms and 145 percent for foreign firms. However, SOEs have been
proven to be very inefficient and wasteful in using capital and credit. SOEs use several
times more capital to produce one unit of output than the industry average. In 2000 the
average ratio of turnover to capital (a proxy of capital productivity) in SOEs was 1.6
compared to 8.8 for non-state enterprises. This circumstance was even more alarming in
2009. The turnover to capital ratio in SOEs fell to 1.1 while in private and foreign
sectors it reached 21.0 in manufacturing industry (WB, 2012). It is obvious that while
enterprises owned by the state are getting worse in terms of their efficient usage of
capital, by contrast their private counterparts are becoming more economically efficient
in their capital usage.
In the post-WTO accession period SOEs have, therefore, mobilised a significant amount
of capital mainly through banking credit. Nonetheless, inefficient production, non-
transparency and non-accountability in the state sector easily turned banking credit into
NPLs over a short time period.
2.3.3 Effects of Asset Price Bubbles
The period 2007-2008 recorded a drastic increase in asset prices which were seen as
dangerous bubbles (Pincus, 2009; Leung, 2009). There are two types of assets: stocks
and real estate. In the first year of being a WTO member the stock market index in Ho
Chi Minh City (VN-index) tripled in value from around 350 in 2006 to a peak of 1171
in March of 2007, and property doubled in price every few months. The former vice
51
minister of the Vietnam Ministry of Natural Resources and Environment – Dang Hung
Vo stated that, on average, a Vietnamese citizen needs saving from 75 working years to
buy a house25
.
The overheating growth of asset markets can be driven partly by the influence of WTO
accession. The one remarkable influence of accession into the WTO is the substantial
surge of foreign capital inflows from late 2006 (Leung, 2009). In 2007 alone a sum of
foreign capital worth US$17.5 billion through channels such as Foreign Direct
Investment (FDI), portfolio investment and Official Development Assistance (ODA)
flowed into Vietnam. When remittances are added, total capital inflow reached US$24
billion dollars in 2007. Absorbing such a large capital inflow in a short period of time is
not easy even for a developed country with mature financial markets. To keep the
Vietnamese dong from appreciating relative to foreign currency the SBV bought the
foreign cash inflows. Therefore, it injected dong into the economy which led to
considerable excess liquidity in the banking system. This in turn resulted in a rapid
growth of credit. In a shallow financial market like Vietnam it was anticipated that a
significant fraction of credit would move into asset markets and fuel asset prices.26
The second argument to explaining asset price bubbles is the movement of large SOEs
into the financial sector. These enterprises have broadened their business into non-core
areas including banks, securities firms, real estate companies and insurers27
. SOEs insist
25 The source is from http://vef.vn/2012-01-31-trang-page-3
26Positive and normative theory of regulation can be applied to explain the relationship between credit
growth and asset price bubbles in a shallow financial market such as Vietnam‘s. A lack of relevant
regulations may result in high-risk investments by banks in the stock or property markets and this can
lead to a spike in asset prices. Furthermore, the experiences of emerging countries such as Thailand or
Indonesia during Asian Financial Crisis also show that rapid growth of credit fuelled speculative activity
that resulted in asset price bubbles (Keeton, 1999; Kawai and Schmukler, 2001). 27
For example, Petro Vietnam, the state oil and gas group, has six financial firms, two banks, security and
real estate companies.
52
that they have only invested 30 percent of their capital outside of their core business
(Pincus, 2008). Nonetheless, it is difficult to measure the extent to which the data is real
and accurate. In a non-transparent environment large SOEs have the privilege of not
being audited annually by independent audit companies and not having to publish their
financial statements.
The influence of asset price bubbles on the banking system is extremely serious. Data
on the size of loans in the stock and property markets has not yet been revealed,
however according to VELP (2012) it would be very significant. Speculators raised the
real estate and stock prices so as to achieve high capital gains. These actions will lead to
bubble prices for assets. Therefore, under the upward trend of markets, the loans of
banks are excessive and inefficiently allocated. On the other hand, when asset price
bubbles burst these loans will be quickly turned into bad loans. The second negative
effect of asset bubbles on the banking system is that approximately 70-percent of loans
are backed by real estate as collateral. In the case where loans turn into NPLs and the
banks have to liquidate collateral with a market value much lower than its book value, a
significant proportion of loans will not be repaid.
2.3.4 Non-Performing Loans
International experience has shown that rapid growth in the banking sector under weak
governance conditions will eventually result in instability of this sector (Gorton and
Winton, 1998). Using the event method Demirguc-Kunt and Detragiache (1998)
identify a set of indicators which determine the crisis status of a banking system. They
are the ratio of non-performing assets to total assets in the banking system exceeding 10
53
percent; the cost of the rescue operation28
of a particular country was at least 2 percent
of its GDP; banking sector problems resulted in a large scale nationalisation of banks;
extensive bank runs took place.
In Vietnam, where the predominant assets in banks are loans, the rate of NPLs to total
outstanding loans can be used to replace the above-mentioned indicators. The true NPLs
in Vietnam are difficult to identify due to conflicting outcomes from different related
institutions29
. Moreover, Vietnam is applying out of date accounting standards30
in
calculating NPLs which are considerably lower than that computed using ISAs. A report
by the National Assembly Economic Commission declared that the rate of NPLs during
2010−2012 was between 10 to 12 percent (see Table 2.10). On the other hand,
according to experts from international financial intermediates (IMF, WB) the rate of
NPLs computed by the ISA is three to four times higher.
28The rescue operation funded by budgetary resources entails a number of measures to stabilise the
banking system, for instance lending from central banks to ensure the liquidity of banks or
recapitalisation of the banking sector (Demirguc-Kunt and Detragiache, 1998). 29The Fitch report ―2013 Outlook: Vietnamese Banks‖ presented three very different assessments of
NPLs. These are from the banks, the SBV, and Fitch. 30
The new standards which seem to be closer to ISAs were supposed to be implemented but were
postponed because they would immediately double or even triple the NPLs of banks, and quickly classify
them as bankrupt. To keep the banking system in a ―stable‖ condition the outdated standards are still in
effect (IMF, 2014).
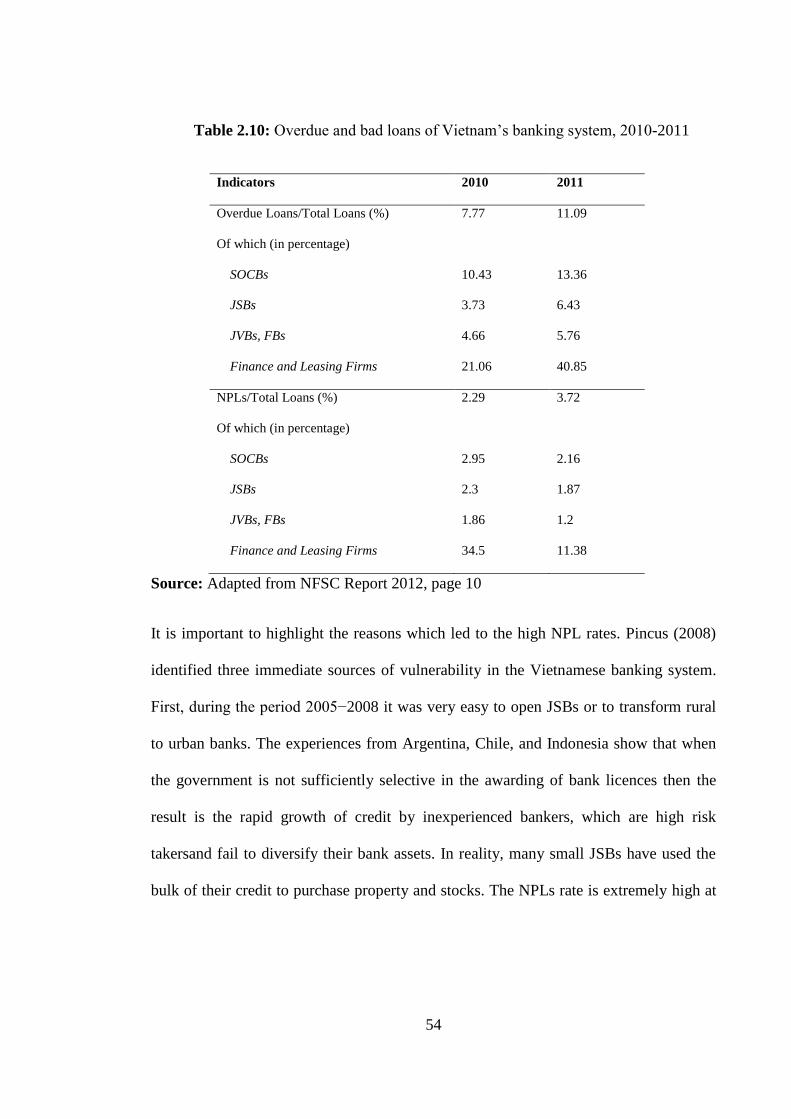
54
10Table 2.10: Overdue and bad loans of Vietnam‘s banking system, 2010-2011
Indicators 2010 2011
Overdue Loans/Total Loans (%) 7.77 11.09
Of which (in percentage)
SOCBs 10.43 13.36
JSBs 3.73 6.43
JVBs, FBs 4.66 5.76
Finance and Leasing Firms 21.06 40.85
NPLs/Total Loans (%) 2.29 3.72
Of which (in percentage)
SOCBs 2.95 2.16
JSBs 2.3 1.87
JVBs, FBs 1.86 1.2
Finance and Leasing Firms 34.5 11.38
Source: Adapted from NFSC Report 2012, page 10
It is important to highlight the reasons which led to the high NPL rates. Pincus (2008)
identified three immediate sources of vulnerability in the Vietnamese banking system.
First, during the period 2005−2008 it was very easy to open JSBs or to transform rural
to urban banks. The experiences from Argentina, Chile, and Indonesia show that when
the government is not sufficiently selective in the awarding of bank licences then the
result is the rapid growth of credit by inexperienced bankers, which are high risk
takersand fail to diversify their bank assets. In reality, many small JSBs have used the
bulk of their credit to purchase property and stocks. The NPLs rate is extremely high at
55
about 60 percent in some banks. The solution put forward by the SBV is to put these
banks under special supervision and force them to restructure or even merge together31
.
Second, Vietnam allowed industry groups in both the state and private sectors to
participate in and open banks. It repeated the mistakes of other countries such as Japan,
Indonesia, and Chile when conglomerates employed banks as a source for funding their
industrial and commercial projects. Subsequently, the allocation of credit became
distorted when financial resources were not channelled to the most efficient projects.
Third, Vietnam lacks a rigorous framework of regulation, supervision and enforcement
to ensure a sustainable and consistent development of the banking system. Banking
sector weaknesses that have persisted for a long time need to be effectively addressed
by the SBV. Moreover, bad banks after having been identified and accused are not
subsequently punished stringently and immediately. Therefore, the accumulation of
negative behaviours in banks such as intra-lending, over-lending to the stock and
property markets and moral hazard problems brings the banks to the verge of
insolvency.
31See ―The Scheme for Bank Restructuring Period 2011-2015‖ of the Vietnamese Government issued in
March 2012.
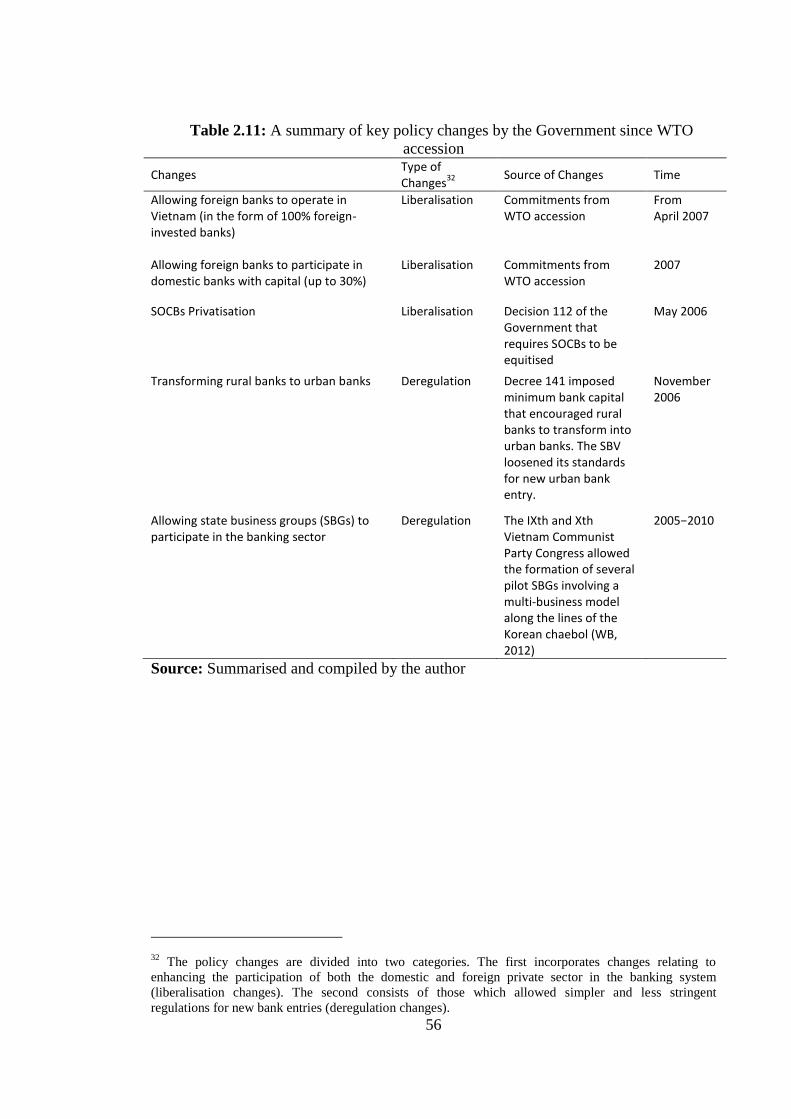
56
11Table 2.11: A summary of key policy changes by the Government since WTO
accession
Changes Type of Changes
32
Source of Changes Time
Allowing foreign banks to operate in Vietnam (in the form of 100% foreign-invested banks)
Liberalisation Commitments from WTO accession
From April 2007
Allowing foreign banks to participate in domestic banks with capital (up to 30%)
Liberalisation Commitments from WTO accession
2007
SOCBs Privatisation Liberalisation Decision 112 of the Government that requires SOCBs to be equitised
May 2006
Transforming rural banks to urban banks Deregulation Decree 141 imposed minimum bank capital that encouraged rural banks to transform into urban banks. The SBV loosened its standards for new urban bank entry.
November 2006
Allowing state business groups (SBGs) to participate in the banking sector
Deregulation The IXth and Xth Vietnam Communist Party Congress allowed the formation of several pilot SBGs involving a multi-business model along the lines of the Korean chaebol (WB, 2012)
2005−2010
Source: Summarised and compiled by the author
32 The policy changes are divided into two categories. The first incorporates changes relating to
enhancing the participation of both the domestic and foreign private sector in the banking system
(liberalisation changes). The second consists of those which allowed simpler and less stringent
regulations for new bank entries (deregulation changes).
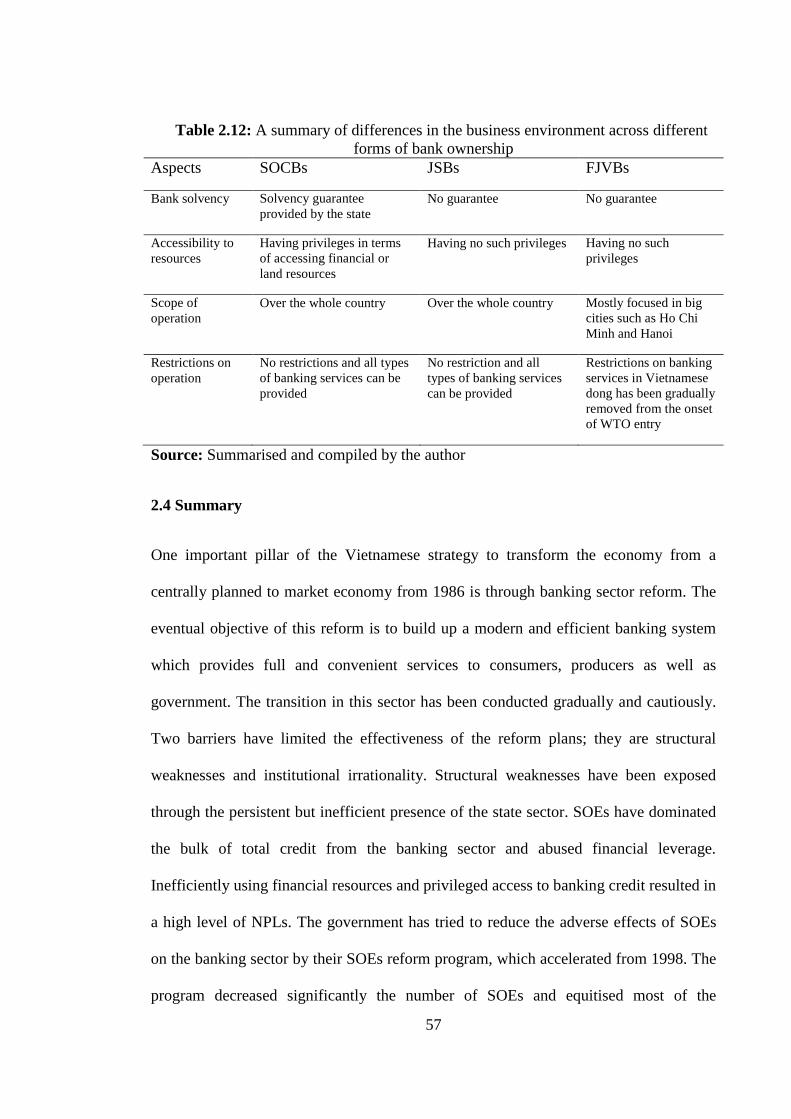
57
12Table 2.12: A summary of differences in the business environment across different
forms of bank ownership
Aspects SOCBs JSBs FJVBs
Bank solvency Solvency guarantee
provided by the state
No guarantee No guarantee
Accessibility to
resources
Having privileges in terms
of accessing financial or
land resources
Having no such privileges Having no such
privileges
Scope of
operation
Over the whole country Over the whole country Mostly focused in big
cities such as Ho Chi
Minh and Hanoi
Restrictions on
operation
No restrictions and all types
of banking services can be
provided
No restriction and all
types of banking services
can be provided
Restrictions on banking
services in Vietnamese
dong has been gradually
removed from the onset
of WTO entry
Source: Summarised and compiled by the author
2.4 Summary
One important pillar of the Vietnamese strategy to transform the economy from a
centrally planned to market economy from 1986 is through banking sector reform. The
eventual objective of this reform is to build up a modern and efficient banking system
which provides full and convenient services to consumers, producers as well as
government. The transition in this sector has been conducted gradually and cautiously.
Two barriers have limited the effectiveness of the reform plans; they are structural
weaknesses and institutional irrationality. Structural weaknesses have been exposed
through the persistent but inefficient presence of the state sector. SOEs have dominated
the bulk of total credit from the banking sector and abused financial leverage.
Inefficiently using financial resources and privileged access to banking credit resulted in
a high level of NPLs. The government has tried to reduce the adverse effects of SOEs
on the banking sector by their SOEs reform program, which accelerated from 1998. The
program decreased significantly the number of SOEs and equitised most of the
58
remainder. Consequently, the operation of SOEs became more efficient and the rate of
NPLs in the following period tended to decline. Nonetheless, in the post-WTO
accession period (2007-present) a number of unsuitable policies have been issued which
have contributed to widening the size of the state sector and made the banking system
unstable. First, the government has permitted some large SOEs to transform their
organisational model to that of business groups. These groups quickly established a
series of subsidiaries which needed a substantial amount of credit with numerous
privileges from government. Second, these groups and some large SOEs were allowed
to expand their business into the banking sector through capital participation in
operating banks or opening new banks. As a result it is not surprising that intra-lending
became very popular for the banks which were partly owned by state enterprises. The
existence of a large but inefficient state sector has negatively influenced the banking
sector, an issue to be explored in more detail in Chapter 6.
The second very important factor that has affected efficiency in the banking sector is
institutional irrationality. The decisions of government, SBV, or MOF (Ministry of
Finance) are affected by the SEDPs of the Communist Party and interest groups
(Pincus, 2008; Beresford, 2008). The consequence of this is that the SBV cannot
conduct its roles as an independent regulator and supervisor of the banking sector, and
the capability and efficiency of the SBV is undermined. Another irrationality of the
SBV is that it cannot comprehensively control banks‘ activities. The overheating growth
of financial markets such as the stock and real estate markets from 2007 attracted a
significant amount of credit from banks. However, the function of regulating and
supervising these markets has been allocated to the MOF. Weak cooperation between
the SBV and MOF to control the capital flow from the banking sector into financial
59
markets resulted in an increase of speculative behaviour as well as moral hazard
problems (NFSC report). Eventually, this has resulted in a low level of credibility from
the market and the public and its faith in the government in general, and the SBV in
particular, to conduct monetary policy. The limited information which the public has is
always different from various sources of information. For political purposes this is
because the SBV possibly intends to provide biased information, and is even not willing
to provide some important information to the public who wish to have it. Policy actions
have been inconsistent due to the gap between what the government announces and
what they do. In other words, when the public has weak credibility of the SBV and
government policy the banking sector is very vulnerable to external shocks.
This chapter has provided an overview of the Vietnamese banking sector and possible
factors influencing the efficiency and stability of commercial banks in this country. It is
necessary to put the situation of the banking sector in Vietnam in context. The next
chapter reviews research on bank efficiency in the literature drawing upon the
experiences of a number of countries.
60
Chapter 3: Literature Review on Banking Efficiency
3.1 Introduction
This chapter reviews methods used in previous studies to measure and analyse bank
efficiency as well as the impact of financial liberalisation policies on bank efficiency.
Both parametric and nonparametric methods used to measure bank efficiency are
reviewed in this chapter. The scope of these studies includes not only those for a single
country but also those for cross-country cases including countries at different stages of
development (Maudos et al, 2002; Bonin et al., 2005a; 2005b; Kraft et al., 2006;
Denizer et al., 2007; Jiang et al., 2009; Berger et al., 2009; Chortareas et al., 2013). Of
particular interest are those for transition economies specifically, of which Vietnam is
one. A consensus from relevant studies is that liberalising the banking sector will
improve banking sector performance in terms of technical efficiency (Levine, 2001;
Hermes and Nhung, 2010; Chortareas et al., 2013). For transition economies an
important finding is that a high efficiency level can be achieved rapidly if transitional
banking systems transform to foreign dominated ones (Bonin and Schnabel, 2011).
The structure of this chapter is as follows. Section 3.2 summarises methods used in the
literature to estimate bank efficiency including parametric and non-parametric types.
Moreover, methods used to analyse the impact of environmental variables on bank
efficiency are also discussed. Section 3.3 reviews studies on the impact of financial
liberalisation on bank efficiency in a single-country or cross-country context. Section
3.4 provides an overview of bank efficiency in transition countries when these countries
have changed the banking sector from one dominated by government ownership to one
dominated by foreign ownership. Section 3.5 critically analyses previous studies on
61
bank efficiency and productivity in Vietnam, identifying gaps in this literature that this
study will address. Finally, section 3.6 provides a summary of the major conclusions
from this chapter.
3.2 Techniques related to Measuring and Analysing Banking Efficiency
3.2.1 Techniques for Measuring Banking Efficiency
Over the past several decades there has been substantial research effort on measuring
the efficiency of financial institutions, and especially commercial banks (Berger and
Humphrey, 1997; Fethi and Pasiouras, 2010). Measuring and evaluating the
performance of banks is aimed at classifying those banks that are performing well and
those that are performing badly (Berger and Humphrey, 1997). Based on the
classification of ―best practice‖ and ―worst practice‖ banks, bankers can improve
managerial performance by encouraging the former practices as well as discouraging
the latter.
This section concentrates on the derivation of frontier efficiency which can assist in
measuring how close a commercial bank is to a ―best practice‖ frontier. There are two
types of production frontiers; they are nonparametric and parametric frontiers.
Nonparametric frontiers
The nonparametric approach is based on linear programming techniques which do not
require specification of production functions33
. Most research using this approach
applies the Data Envelopment Analysis (DEA) and Free Disposal Hull (FDH) methods.
33The parametric approach uses regression techniques to estimate efficient frontiers, so that production
functions need to be specified.
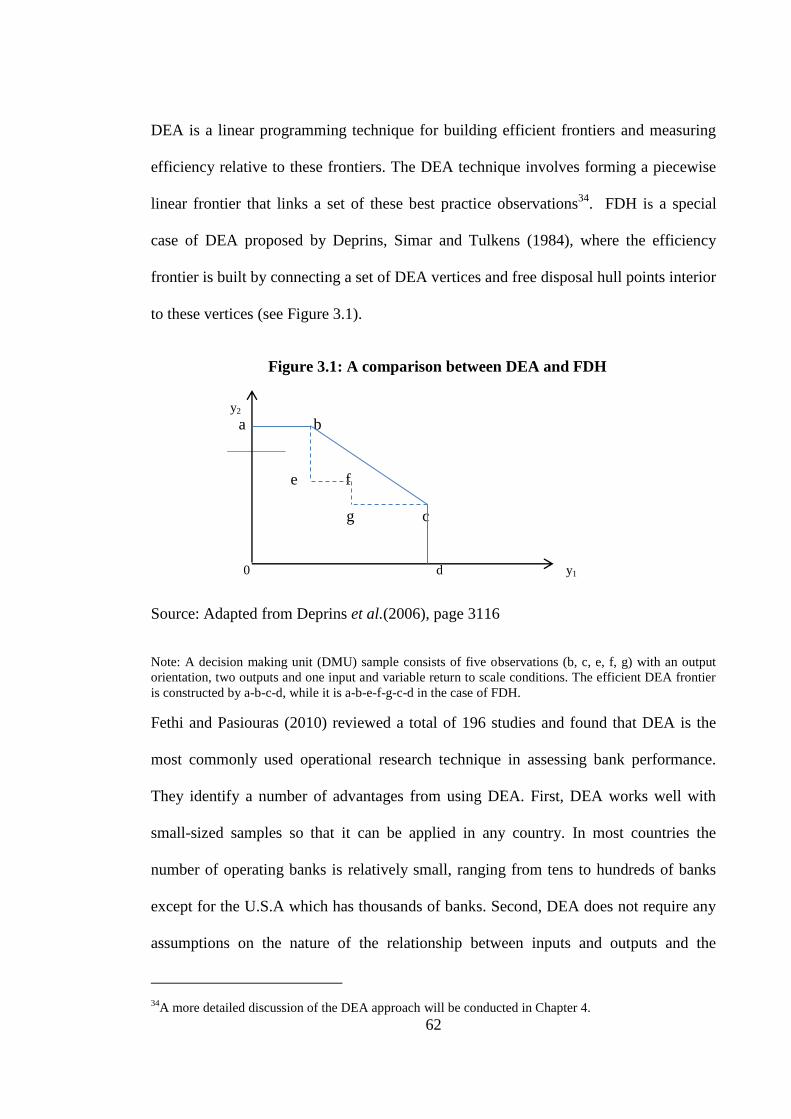
62
DEA is a linear programming technique for building efficient frontiers and measuring
efficiency relative to these frontiers. The DEA technique involves forming a piecewise
linear frontier that links a set of these best practice observations34
. FDH is a special
case of DEA proposed by Deprins, Simar and Tulkens (1984), where the efficiency
frontier is built by connecting a set of DEA vertices and free disposal hull points interior
to these vertices (see Figure 3.1).
4Figure 3.1: A comparison between DEA and FDH
Source: Adapted from Deprins et al.(2006), page 3116
Note: A decision making unit (DMU) sample consists of five observations (b, c, e, f, g) with an output
orientation, two outputs and one input and variable return to scale conditions. The efficient DEA frontier
is constructed by a-b-c-d, while it is a-b-e-f-g-c-d in the case of FDH.
Fethi and Pasiouras (2010) reviewed a total of 196 studies and found that DEA is the
most commonly used operational research technique in assessing bank performance.
They identify a number of advantages from using DEA. First, DEA works well with
small-sized samples so that it can be applied in any country. In most countries the
number of operating banks is relatively small, ranging from tens to hundreds of banks
except for the U.S.A which has thousands of banks. Second, DEA does not require any
assumptions on the nature of the relationship between inputs and outputs and the
34A more detailed discussion of the DEA approach will be conducted in Chapter 4.
y2
a b
e f
g c
0 d y1
63
distribution function of inefficiency in order to determine the frontier. Consequently,
DEA is simple and convenient for users.
Nonetheless, DEA also has a number of limitations (Coelli et al., 2005). DEA does not
identify the measurement error and other noise which may influence the shape and
position of the efficiency frontier. The exclusion or inclusion of only one input or output
will lead to biased results. Moreover, treating inputs/outputs as homogenous
commodities while they are heterogeneous may bias the result. In the DEA model only
inputs and outputs are included while other managerial factors influencing the level of
outputs generated from given inputs or the level of inputs used to produce a given
output level are neglected. Thus, not accounting for environmental variables may give
misleading indications of relative managerial competence.
According to Assaf et al., (2013), NPLs need to be included in a mix-production
process to ensure the unbiasedness of results. The exclusion of bad loans in an
efficiency measuring process would lead to biased outcomes because the more efficient
banks can produce a higher proportion of undesirable outputs. There are a number of
techniques that enable the incorporation of bad loans into DEA models. First,
directional distance functions are based on the idea that a reduction of bad outputs is
feasible only if good outputs are simultaneously reduced, given a fixed level of inputs.
Second, slack-based measurement of inefficiency based on slacks including input
excesses and output short-falls along with the computational scheme for defining
efficiency. These two types of efficiency measurement can be combined with the
network approach and dynamic approach in order to comprehensively measure bank
efficiency including NPLs as a bad output (Fujii et al., 2014; Avkiran, 2015).However,
64
inclusion of bad loans in DEA models is impossible to conduct in this thesis due to
unavailability of relevant data.
Parametric Frontier
The parametric approach uses estimation techniques to build an efficient production
frontier based upon an assumed production functional form. According to Berger and
Humphrey (1997), there are three approaches to building parametric frontiers: the
Stochastic Frontier Approach (SFA); the Distribution Free Approach (DFA); and the
Thick Frontier Approach (TFA). These approaches are similar at specifying the form of
the production function. There are various forms that the production function can take:
Cobb-Douglas, constant elasticity of substitution (CES) and translog. Nonetheless, they
are different when it comes to assumptions about the distribution of random errors and
inefficiency. The random error and inefficiency in the cases of SFA and DFA are
assumed to be distributed following one of many types of distribution functions: half-
normal, nonnegative, symmetric, or exponential functions. In contrast, there are no such
assumptions in the case of TFA.
The DFA also specifies a functional form for the frontier; however, it separates
inefficiency from the random error. This approach draws no strong assumptions on the
distributional function of inefficiency or random errors. It supposes that efficiency is
stable and the mean of the random error is equal to zero over time. Inefficiency can
follow either a nonnegative or symmetric distribution form.
The TFA approach assumes a given specification of the functional form and that
deviations from predicted performance values between the highest and lowest
performance quartiles of observations indicate random error; and the deviations of
65
predicted performance between the highest and lowest quartiles represent inefficiency.
This approach does not make assumptions about the distributional form of either the
random error or inefficiency.
The advantages of using the parametric method are that it includes identification of
measurement errors and random effects in the model, allowing estimation of confidence
intervals as well as statistical inference of the efficiency scores. Nevertheless, this
method also manifests several disadvantages. For example, it imposes a specification
for the production function which may result in function misspecification errors. Since
the method is based on estimation techniques it requires a large number of
observations35
to make the estimated results reliable (Simar and Wilson, 1998; Coelli et
al., 2005); hence the scope of this method is narrowed substantially and particularly for
the case of small sample size.
3.2.2 Approaches to Analysing the Effect of Environmental Variables on Banking
Efficiency
According to Fried et al. (1999) there are three approaches to analysing the effects of
environmental variables on technical efficiency. They are the frontier separation
approach, the all-in-one approach and the two-stage approach.
The Frontier Separation Approach
Charneset al. (1981) was the first to use the frontier separation approach, specifically to
analyse the effect of environment variables on managerial efficiency in U.S schools.
Based on a single categorical variable that characterises the different environment
35 SFA can be applied for measuring bank efficiency with large-size samples (for example: banks in U.S,
or Europe).
66
conditions (e.g., ownership, gender), the data set is stratified into sub-samples.
Nonparametric frontiers are solved for each sub-sample as well as for all observed data
points. The effect of environment variables can be observed through comparing the
efficiency scores of sub-samples and the pooled data.
Nevertheless, when the data set is divided into smaller sub-samples the efficiency scores
tend to increase; consequently, the discriminatory power of the analysis is reduced.
Furthermore, this approach has a problem in that it requires the environmental variables
to be categorical ones.
The All-in-One Approach
In this approach all the external operating variables can be directly incorporated into a
linear programming formulation along with traditional inputs and outputs. This
approach allows an environmental variable not to be restricted to being a categorical
one. The influential direction of the environmental variables needs to be prior identified
before being included in the linear program (Fried et al., 1999; Coelliet al., 2005). If the
variable is believed to be positive to the efficiency scores then it should be seen as a
non-discretionary output. In contrast, it would be included as a non-discretionary input.
However, the prior classification of environmental variables to be inputs or outputs is
unsuitable if the objective is to investigate whether the effect of the variables is
favourable or unfavourable.
The Two-Stage Approach
Regression of efficiency scores against a set of environmental variables are mostly
based on the two-stage method. In the first stage the method involves calculating the
efficiency scores with traditional inputs and outputs based upon an assumed production
67
functional form. In the second stage efficiency scores obtained from the previous stage
are regressed upon a set of environmental variables. The influential direction of these
variables on efficiency is determined by the signs of the coefficients.
Coelliet al. (2005) recommend utilising multivariate analysis in most cases due to its
advantages against univariate analysis. The advantages are:
- More than one variable can be accommodated;
- Both categorical and continuous variables can be accommodated;
- Assumptions on the direction of variables are not necessary;
- One can test hypotheses on the significance of variables on efficiency;
- The method is simple and transparent.
However, there is a disadvantage with the two-stage method. If the input and output
variables used in the first stage are highly correlated with the environmental variables,
then in the second stage the estimates are likely to be biased.
In the DEA context there are three regression methods that have been used in the second
stage. Two of these are ordinary least square (OLS) and Tobit; however, both methods
also experience a bound problem. OLS could predict efficiency scores greater or smaller
than the bound - unity (Coelliet al, 2005). Tobit allows regressing one-value efficiency
scores on explanatory variables, but in fact they cannot equal one when the true efficient
frontier is unobservable. A more serious problem is that both OLS and Tobit methods
generate serially correlated efficiency scores.36
Hence, statistical inferences resulting
from these two regression methods are invalid (Xue and Harker, 1992; Hirschberg and
36 The best practice DMUs in the sample are given efficient values of one and the inefficient others obtain
their efficiency scores by comparing their performance relative to the best observations. Subsequently,
DEA estimates are dependent and serially correlated.
68
Lloyd, 2002). Moreover, Simar and Wilson (2007) suppose that no studies employing
either Tobit or OLS regression describe a data generating process (DGP). Therefore, the
coefficients obtained in the second stage are not reliable. To overcome these problems
Simar and Wilson (2007) propose a third method, the so-called truncated regression in
two algorithms. The Monte Carlo simulation procedure reveals a preference for
Algorithm 237
which helps correct for bias of the estimated coefficients (Delis et al.,
2011). Simar and Wilson (2007) start the procedure with a simple truncated regression,
the estimates of which are corrected in a number of bootstrapping38
steps.
3.2.3 Selection of Inputs and Outputs for an Analysis of Bank Efficiency
In order to measure bank efficiency, input and output variables need to be specified.
There have been a number of approaches to choosing input and output variables in the
context of measuring bank efficiency (Berger and Humphrey, 1997; Worthington, 2000;
Das and Ghosh, 2006; Arjomandi et al., 2011; 2012). First and foremost, banks are
financial intermediaries which link lenders to borrowers (Intermediation approach).
To mobilise deposits from households and firms, banks hire staff and invest in fixed
assets such as offices, software, hardware and other equipment. On the other hand,
banks need staff, fixed assets and deposits to lend to firms and individuals which
eventually generate loans. Furthermore, through the stock market, banks provide capital
by purchasing securities which are issued by firms. Banks also finance themselves in
the form of investments in associated companies. In general, in the context of the
intermediation approach, the input variables consist of labour cost, value of fixed assets,
37The algorithm will be explained in detail in Chapter 4.
38Efron (1979) introduced the concept of ―Bootstrap‖, which works satisfactorily on a variety of
estimation problems. The bootstrap is a statistical technique for making inferences of certain estimates.
Based on an original sample, a bootstrap generates a magnitude of pseudo samples (bootstrap samples)
which will build the empirical distribution function of the given statistics.
69
and deposits. The output variables include loans, securities and investment. However,
there is still controversy over whether a deposit should be classified as an input or
output variable (Das and Ghosh, 2006).
A variation of the intermediation approach is the value-added approach. Asset and
liability items that have a significant impact on value added are used as outputs.
Application of the value-added approach requires identifying the major categories of
deposits (demand, time and savings) and loans (for real estate, business, and
instalments) as outputs. Purchased funds such as large certificates of deposits, foreign
deposits, and other liabilities for borrowed money are treated as inputs (Berger et al.,
1987). Using the value-added approach, Das and Ghosh (2006) use employee expenses,
capital related operating expenses, and interest expenses as inputs producing outputs
such as deposits (demand, saving, and fixed deposits), investments, and loans. Lozano-
Vivas et al. (2002) applied the value-added approach to estimate efficiency of ten
European banking industries using loans, deposits, and other earning assets as outputs
and two inputs including personnel expenses and non-interest expenses.
An important responsibility of banks is to provide retail banking services to their
customers, which include demand and time deposits, instalment loans, mortgage loans,
business loans, and securities. The production approach is based on this responsibility
and facilitates the estimation of banking efficiency scores. Physical variables (such as
number of employers, number of computers) are used to estimate banking efficiency.
The volume of services provided can be measured by the number of accounts, number
of transactions, average number of instalment loans outstanding, or activity items
(cheques, deposits, and transit items) (Benston, 1965). Inputs also include wages per
employee and number of banking offices. Due to the fact that bank branches are where
70
retail banking activities occur and the clients are served, the production approach is
most frequently used to estimate the efficiency of bank branches (Berger et al., 1997).
Banks can be seen as a specific type of enterprise earning profit through intermediating
between lenders and borrowers and providing banking services (Leightner and Lovell,
1998). Banks receive revenues (or incomes) from services provided to customers. There
are two types of revenues which are interest and non-interest incomes. Equivalently,
there are two types of expenses including interest and non-interest expenses. The
approach to using these variables based on the function of banks as profit earners is
called the operating approach. A study on Malaysian banking efficiency in the post-
EAFC period and conducted by Sufian (2009) employs the operating approach. The
inputs are interest and non-interest income, and the outputs are interest and non-interest
expenses. Das and Ghosh (2006) used interest expenses, employee expenses, and capital
related operating expenses as the inputs and interest income, non-interest income as
outputs in analysing the efficiency of Indian banks during the post-reform period.
According to Berger and Humphrey (1997) the two dominant approaches for selecting
inputs and outputs are the production approach and intermediation approach.
Nonetheless, neither of these two approaches is perfect, as neither of these approaches
can capture the dual roles of banks as providers of transaction/processing services as
well as being financial intermediaries.
Sathye (2003) found that the intermediation approach is frequently used in DEA studies.
Moreover, this approach is commonly used together with other approaches such as the
value-added approach, or operating approach. Das and Ghosh (2006) employ
simultaneously the intermediation, value-added, and operating approaches in one study.
71
Banker et al. (2010) estimate Korean banking productivity using both the
intermediation and operating approaches.
There is no consensus on the results from estimated efficiency scores using the different
approaches. Berger et al. (1997) compare the production and intermediation approaches
by applying the same data base of bank branches. The result is that the correlation index
between the technical efficiency scores obtained from the two approaches is relatively
low at 0.40. In another study the estimates of technical efficiency were consistently
higher under the value-added approach than that of the intermediation and operating
approaches (Das and Ghosh, 2006).
3.3 Impact of Financial Liberalisation on Banking Efficiency in a Global Context
The world has experienced a continuous and wide integration process of national
economies in general and financial sectors in particular (Coleman and Underhill, 2012;
Balassa, 2013). Since the 1990s governments in newly emerging market and transition
countries have intensified policies towards liberalising their financial sectors (Hermes
and Vu, 2010). The aim of financial liberalisation is to eliminate government control
and intervention in the financial system of an economy. As a result the financial system
becomes more competitive and efficient, but also subject to greater probability of a
financial crisis (Radelet and Sachs, 2000; Claessens and Laeven, 2003; Reinhart and
Rogoff, 2008). Nevertheless, financial liberalisation itself cannot guarantee financial
sector efficiency and soundness without the necessary supervisory framework in place.
Lessons from the East Asia Financial Crisis in several Asian countries such as Thailand,
Indonesia and Korea indicate that financial freedom can lead to rapid credit growth,
rising bad debt, asset price bubbles and eventually the onset of financial crises
72
(Radeletand and Sachs, 2000). Hence, financial liberalisation needs to be conducted in
parallel with strengthening the supervisory and regulatory framework.
The term financial liberalisation covers a number of measures: autonomy of the
Central Bank from government; free capital flows with the exception of short term
capital flows ; elimination of interest rate or exchange rate controls; abandonment of
policy lending to priority sectors; and removal of restrictions on bank ownership
(Demirgüç-Kunt and Detragiache, 1998; Levine, 2001; Chinn and Ito, 2008). In the case
of newly emerging market and transition economies where governments have
stringently controlled financial systems further measures of financial liberalisation
include opening markets for foreign entry and private investors and privatising state
owned banks (Abarbanell and Bonin 1997; Zoli, 2001; Bonin and Wachtel, 2003).
According to Berger and Humphrey (1997) the primary goal of financial liberalisation
and deregulation is to improve the efficiency of banks or intermediaries as well as their
financial sustainability. Nevertheless, the outcomes are different depending on
macroeconomic instability and in some cases banking crises triggered by overly
ambitious financial deregulation (Denizer et al., 2007). The rest of this section will be
used to review the impact of financial liberalisation on banking efficiency in different
economies and by stage of economic development (emerging, developing and
developed).
Global financial liberalisation experience
Most empirical studies find that liberalisation of the banking sector improves efficiency
in a wide range of countries, from developing and transition countries to developed
73
countries (Boubakri et al., 2005; Hermes and Nhung, 2010; Chortareas et al., 2013).39
For example, Ataullah et al. (2004) used DEA with two input-output specifications to
compare the technical efficiency of commercial banks in India and Pakistan during a
period of financial liberalisation from 1988 to 1998. Numerous measures were
conducted to deregulate the banking system including a gradual deregulation of interest
rates, reduction of reserve requirements, entry of non-bank financial institutions,
allowing the entry of private banks (domestic and foreign); gradual abandonment of
state-directed credit policies. They found that these measures positively impacted the
overall technical efficiency of the banking sector, especially after 1995. Chen et al.
(2005) and Kumbhakar & Wang (2007) investigated the efficiency and productivity of
Chinese banks in the 1990s before accession to the WTO in 2001. The 1990s witnessed
reform in the banking sector when the central government deregulated interest rates,
eliminated local government intervention in SOCB lending and allowed entry by
privately owned banks (only domestic investors). These policies generated pressure on
the SOCBs to innovating their activities and services and become more commercially
oriented. This resulted in a modest improvement in banking efficiency and productivity.
After the collapse of centrally planned economies in Central and Eastern Europe at the
end of the 1980s and early 1990s, a number of these transition economies implemented
a ―big-bang‖ reform in the banking sector by privatising state owned banks and
permitting the entry of foreign banks. Due to political issues Croatia initiated banking
reform and liberalisation later than other transition countries40
. Kraft et al. (2006)
conducted research on the impact of banking liberalisation in this country during the
39 For a summary on the impact of financial liberalisation on bank efficiency in a global perspective, see
Table 3.1. 40
Croatia only became an independent country in October 1991
74
period 1994–2000. Using the SFA approach to estimate a Fourier-flexible frontier cost
function the authors showed that an increase in bank efficiency is not immediate with
privatisation, but only for new foreign banks with good management and reputation41
.
In contrast, Hungary, as a transition economy during the period of the late 1980s and
much of the 1990s, started banking reform and liberalisation relatively early when the
government accepted several foreign banks to establish business activities in the early
1980s (Hasan and Marton, 2003). Adopting the SFA method and a translog production
functional form, Hasan and Marton (2003) estimated the profit and cost frontiers for
banks during the period 1993−1998. They found that foreign banks outperformed
domestic banks in Hungary and their capital involvement with local banks facilitated an
improvement in their efficiency. Foreign entry and privatisation with flexible
approaches were effective liberalisation measures in order to pave the way for a
stronger banking sector in a short period of time.
The difference between developing and transition countries with developed countries is
that the latter have mature institutions and a transparent business environment. These
conditions ensure that policies focusing on financial liberalisation would be conducted
effectively to improve banking efficiency. Sturm and William (2004) compared the
efficiency of Australian domestic banks to that of foreign banks in the post-deregulation
period 1988 – 2001. Both DEA and SFA methods are applied to measure efficiency.
The DEA results found that foreign banks experienced superior scale efficiency. The
source of productivity gain was technological progress rather than technical efficiency
improvement as a result of new technologies transferred from foreign banks. Even in a
41Kraft et al. (2006) measured the reputation of foreign banks by the asset size of their holding
corporation and number of operating years .
75
liberal banking sector such as that in Hong Kong, an even more liberal policy can
improve banking efficiency. Drake et al. (2006) using the DEA method showed that
financial deregulation during their study period of 1995 – 2001, and involving the
removal of remaining interest rate caps, increased the mean efficiency of Hong Kong
banks.
In some cases the impact of financial liberalisation was not as expected by policy
makers. There is evidence about the negative effects of the liberalising process on
banking efficiency. Denizer et al. (2007) measured bank efficiency in Turkey using data
covering a 25-year period from 1970−1994. The authors suggested that the resultant
outcomes of opening up the financial market were not as expected by policy makers
when they assumed that more highly motivated management would facilitate more
efficiency in resource usage. Bank efficiency scores were found to have decreased and
varied unstably against a backdrop of a turbulent macroeconomic environment. In terms
of developed countries, Grifell-Tatje and Lovell (1996) investigated productive
efficiency and total factor productivity change in Spanish savings banks in the post-
deregulation period (1986−1991). This period witnessed all interest rates and service
charges being liberalised and savings banks being permitted to open branches outside
their traditional geographic regions. The productivity decline was caused by an
expansion of branch networks creating costly excess capacity. Another example is
Korea which implemented a set of financial liberalisation measures under a series of
revisions to the General Banking Act from 1991 – 1997 (Park and Weber, 2006). Policy
loans were abandoned, interest rates were liberalised, the exchange rate was deregulated
and a restructure of bank ownership allowed individual shareholders a 12 percent equity
76
stake. However, these deregulations made the banks more inefficient in the years prior
to the EAFC.
Several studies have shown mixed results from liberalisation measures on bank
efficiency in the case of countries during a similar study period. For example, Berger et
al. (2009) analysed the impact of foreign entry and involvement on banking efficiency
in China in the pre- and post-WTO42
accession period (1994−2003). They found that the
Big Four43
group were the least efficient due primarily to poor revenue and high NPLs,
while foreign banks were found to be the most profitable and efficient banks. In
contrast, research conducted by Jiang et al. (2009) found that joint-stock banks were the
most efficient while foreign owned banks and city commercial banks were the least
efficient. However, both studies advocated the positive impact of foreign involvement
on banking efficiency in the long-run. Such conflicting outcomes for bank efficiency
and productivity also appeared for the case of Spain during a deregulatory period
(1986−1991), characterised by freeing interest rates, allowing saving banks to widen
their networks, lowering reserve requirements and phasing out investment requirements.
Maudoset al. (2002) analysed the influence of specialisation in services provided by
banks to explain the cost efficiency difference between bank types during the period
1985−1996. Using DEA to estimate the production frontiers for specific bank types they
found that the cost efficiency of saving banks experienced an appreciable improvement
and that there was a positive correlation between the size of banks and their level of cost
efficiency. In contrast, a decline in the productivity of Spanish banks was recorded by
42China joined the WTO in December 2001
43 The Big Four group consists of the four largest state owned banks in China (Bank of China, China
Construction Bank, Industrial and Commercial Bank of China and Agricultural Bank of China), and they
held 77.1 percent of all banking sector assets in 2003 (source: Berger et al. (2009)).
77
Grifell-Tatje and Lovell (1996); moreover, there they found no apparent link between
bank size and performance.
To explain such mixed results from financial liberalisation on bank efficiency, Kraft et
al. (2006) supposed that differences in the regulatory and economic environment across
countries are very strong so that the policies towards liberalising financial markets
would result in different outcomes. Second, most of the studies are inconsistent when
using just one or a few dimensions of financial liberalisation (Hermes and Vu, 2010).
The solution to these limitations is to conduct research based on a cross-country
comparison with data covering a set of countries at a similar stage of development such
as developing or developed countries. Cross-country based studies all indicate a positive
relationship between financial liberalisation and bank efficiency. For example, Casu and
Molyneux (2003) investigated banking efficiency in leading European economies when
the Single Market Program (SMP) was implemented in 1993. Implementation of SMP
created the largest and most open banking market in the world through abandoning
contemporary barriers by establishing minimum regulatory requirements across the
European Union; accordingly, SMP could lead to a more efficient banking sector in
Europe. It was found that there was a slight improvement of average efficiency scores
over the period 1993−1997; nevertheless, the gap among countries grew even wider due
to country-specific aspects relating to the adoption of banking technology. One other
study by Chortateas et al. (2013) investigated the impact of financial freedom on bank
performance in 27 European Union countries during 2001−2009. This was the first
study to explicitly characterise the effects of ―financial freedom‖ indices on bank
efficiency by controlling for banking, economic, and institutional variables. The results
showed a clear positive association between the financial counterpart of the economic
78
freedom indices and bank efficiency scores. Moreover, a higher level of economic and
financial liberalisation would result in a relatively higher degree of efficiency on the
cost side.
In the context of emerging market economies, Hermes and Vu (2010) used data
consisting of 4000 bank-year observations from 10 countries in Latin America and
South East Asia in the period 1991−2000. The index developed by Laeven (2003)
included six aspects: interest rates, entry barriers, reserve requirements, credit controls,
and privatisation and prudential regulation was employed to measure the degree of
financial liberalisation. The results from the empirical analysis strongly supported a
positive impact of financial freedom programs on bank efficiency. Hence, studies based
on cross-country samples have generally found a positive relationship between financial
liberalisation measures and bank efficiency.
3.4 Banking Efficiency in Transition Economies
3.4.1 An Overview of Bank Efficiency in Transition Economies
Before 1989 the banking system of transition countries consisted of a mono bank which
acted as both a central bank and a commercial bank, and was designed to meet the needs
of a centrally planned economy (Koivu, 2002). The collapse of the Socialist Bloc at the
end of the 1980s triggered a transition process which transformed centrally planned
economies into market economies. Consequently, the mono banking system was split
into two tiers including a central bank and a number of commercial banks.
The importance of banking efficiency in transitional economies has been recognised in
the literature. A number of studies have shown a close and positive relationship between
79
the level of banking efficiency and economic growth (Levine, 1997; Lucchetti et al.,
2001; Berger et al., 2004). Koivu (2002) investigated whether an efficient banking
sector accelerates economic growth in terms of transitional countries. The study was
conducted for 25 transitional countries during the period 1993−2000, and it provided
support for the view that banking efficiency is very important for economic
development. This is because an efficient banking sector allocates financial resources to
the most profitable and productive enterprises. Gordon and Winton (1998) investigated
the relationship between banking efficiency and banking instability. A paradox between
the efficiency and instability of the banking sector in transition economies was
discovered. When the banking sector operates efficiently it mobilises more deposits and
lends more to the economy. Nonetheless, the state sector (mostly SOEs) still dominates
many transitional economies but operating inefficiently generates high non-performing
loans for banks. Subsequently, the banking sector would become vulnerable and
unstable.
It is important to highlight specific characteristics of the banking sector in transition
countries. There is evidence to suggest that these characteristics substantially influence
banking efficiency (Weill, 2003; Bonin et al., 2005a).
- First, the banking sector suffered structural weaknesses when the transition
process began. The public sector dominated the economies of transition
countries, but was inefficient in its operation. Consequently, governments had to
conduct reform programs so as to increase the efficiency and competitiveness of
the economy in general and the banking sector in particular (Fries and Taci,
2005; Chen et al., 2005). Program measures included: rehabilitating SOCBs;
permitting the growth and development of the private sector; liberalising and
80
opening the banking sector to foreign investors; conducting banking sector
reform in parallel with SOE reform (Hasan and Marton, 2003; Haas and
Lelyveld, 2006; Fries et al., 2006). The results of reform have not been
consistent across transition economies, and depend on specific country
characteristics and approaches (models of transition, feasibility of programs,
quality of institutions and speed of the reform process).
- Second, financial markets in transition countries have only been developing for
just over 20 years (from the end of the 1980s to the present); hence, they are still
shallow and narrowly based44
. While in modern economies there are a wide
range of financial institutions and derivatives to support economic growth,
commercial banks have been the major source of finance in transitional
economies (Bonin and Wachtel, 2003; Hasan and Marton, 2003). The
underdevelopment of capital markets and non-bank financial intermediaries has
burdened the commercial banks with having to provide long-term financing for
corporate investment and supporting the mortgage market. Moreover,
macroeconomic instability, such as high inflation during the transition process,
distorted the structure and flows of deposits. High inflation rates eroded the
value of deposits so that depositors reduced the maturity of their deposits or
even transferred their saving to non-productive assets (gold, strong foreign
currency, and real estate).
- Bonin and Wachtel (2003) suggested two pillars underpinning an efficient
banking sector. The first is strong banks in terms of financial capability with
44Financial markets in transition and emerging markets are said to be shallow and narrowly based because
of the small size of their financial sectors and the dominance of the banking sector relative to non-bank
financial intermediaries (Zoli, 2001; Hasan and Marton, 2003).
81
good corporate governance aiming to improve efficiency. Second, is a consistent
regulatory agency which regulates and supervises all banking activities. Most
regulatory agencies in transition countries automatically apply western-style
regulations which have been developed for hundreds of years in the U.S or
European economies. Meanwhile, elements necessary for conducting these
regulations such as the quality of staff and symmetric information between the
bankers (or clients) and regulators are weak (Mitchell, 2001). Furthermore, non-
transparency of the business environment distorts or stifles fair implementation
(Zoli, 2001). It is certain that a regulatory and supervisory framework based on
solid foundations contributes significantly to the efficiency and stability of
banking systems in transition economies.
The last two decades have witnessed a substantial transformation from dominant state-
owned to foreign controlled banking sectors in emerging market countries, including
transitional ones. The transformation helps these transition economies surmount the
above-mentioned characteristics and orient to market based banking sectors. The results
brought about from the transforming process advocate government policies that open
and liberalise banking sectors.
3.4.2 The Impacts of Financial Liberalisation on Banking Efficiency in Transition
Countries
Studies of bank efficiency in the former transition economies in Central and Eastern
Europe, former Soviet Union countries, or East Asia mostly focus on the impact of
financial liberalisation in terms of bank privatisation and foreign involvement (see
Table 3.2 for a summary). These studies have been conducted in both single-country
82
and cross-country cases. Both SFA and DEA methods have been employed to estimate
efficiency scores.
The intermediation approach to efficiency analysis is commonly applied because the
most important role of banks in transition economies is to transfer savings into loans. In
several studies the intermediation approach is used together with other approaches such
as the production or operating approach (Jing et al., 2009; Karas et al., 2010).
There is evidence to suggest that foreign bank entry has a positive impact on bank
efficiency in transition countries. Studies conducted in single-country cases support
foreign banks outperforming domestic banks. Havrylchyk (2006) investigated the
efficiency of the Polish banking industry between 1997 and 2001 using the DEA
method. The author found that inputs were employed more efficiently and the right mix
of inputs was chosen in foreign banks. In line with other research conducted in other
transition countries, foreign banks exhibited higher efficiency than domestic banks due
to the successful performance of greenfield foreign banks. Other studies conducted in
Russia (Karaset al., 2010), Croatia (Kraft et al., 2006) and Ukraine (Kyj and Isik, 2008)
also found that foreign banks had advantages in terms of corporate governance, risk
management, financial capability as well having a sound reputation of utilising inputs
optimally and more efficiently in allocating credit to firms and individuals.
Consequently, they achieved the highest efficiency in comparison with domestic banks.
Studies based on cross-country comparisons give more consistent results to that of
studies with a single country focus. However, the results are mixed depending on the
study period or the geographical scope. For example, Fang et al. (2011) estimated the
efficiency of six South East European countries from 1998 to 2008 and found that
83
foreign owned banks were less cost efficient but more profit efficient than domestic
banks. In contrast, Yildirim and Philippatos (2007) show that foreign banks achieved
higher cost efficiency but lower profit efficiency in a sample consisting of 12 countries
in Central and Eastern European countries from 1993−2000. On the other hand, Kasman
and Yildirim (2006) showed a consistent superiority in terms of both cost efficiency and
profit efficiency for foreign banks when measuring bank efficiency in eight Central and
Eastern European economies during the period 1995−2002.
There are two types of foreign banks. The first are greenfield banks, which have been
established as new entities by foreign investors. The second type, so-called takeover or
foreign-acquired bank, resulted from the acquisition of former domestically owned
institutions during the privatisation process. Although these two types of foreign banks
are totally owned and managed by foreign investors, their level of efficiency is
dissimilar. Results from research conducted by Havrylchyk (2006) indicated that
greenfield banks achieved higher levels of efficiency than domestic banks, and takeover
banks failed in enhancing their efficiency. With respect to both cost and profit, foreign
greenfield banks are the most efficient of all bank types in six transition countries in a
study conducted by Bonin et al. (2005b). Poghosyan and Poshosyan (2010) investigated
the influence of foreign bank entry in the banking sectors of 11 transition countries
(1992 – 2006), and concluded that foreign greenfield banks experienced superior
efficiency in comparison to that of domestic or foreign-acquired banks. The reasons are
argued by the fact that greenfield banks inherited overseas customers of their parents
banks operating in the same host countries. Moreover, the efficiency of takeover banks
did not improve significantly at the early stage of foreign entry as a result of poor
managerial and financial characteristics of the targeted banks. Foreign investors are not
84
only permitted to establish totally foreign-owned banks but also to participate their
capital in domestic banks. In some transition countries foreign investors are allowed to
be majority owners of domestic banks. However, foreign investors commonly hold a
percentage that exceeds 50 percent of domestic bank equity (these banks are so-called
majority foreign banks). On the other hand, transition countries in Asia such as China
and Vietnam impose an upper bound on capital participation from foreign entities. The
bound is generally below 50 percent of bank equity to ensure that domestic shareholders
can take control of these banks (these banks are so-called minority foreign banks, see
Berger et al., 2009). In both mentioned bank types private banks with foreign
involvement have been shown to achieve higher levels of efficiency than domestic
private banks or state-owned banks. Fries and Taci (2005) empirically examined the
efficiency of 289 banks in 15 post-communist countries in East Europe and found that
private banks were more efficient than state-owned banks. However, there was
substantial dispersion amongst private bank groups. Privatised banks with majority
foreign ownership were the most efficient. In a single country study conducted by
Hasan and Marton (2003) in Hungary, they showed that in the short-term policies
towards enhancing foreign involvement in domestic financial institutions facilitated the
way for a stronger banking sector. Among foreign-involved banks a higher share of
foreign ownership was associated with a lower degree of inefficiency. The positive
influence of foreign involvement not only stemmed from majority foreign ownership
but also minority foreign ownership. Berger et al. (2009) showed that for both profit
and cost efficiency as well as for both categories of domestic banks with minority
ownership (private and state-owned banks); minority owned foreign banks are
85
associated with higher efficiency. In addition, this result is robust after checking for
selection effects that efficiency improved after foreign investment.
At the early stage of transforming the banking system in transition economies, state or
government ownership has dominated the banking sector. Nonetheless, this type of
ownership is recognised as an encumbrance for improving the efficiency and
profitability of banks (Zoli, 2001; Hasan&Marton, 2003; Havrylchyk, 2006). This is due
to the fact that governments tend to orient the banks they dominate in terms of
ownership to a policy rather than commercial orientation (La Porta et al., 2002). As a
result, decreasing substantially or even eliminating government ownership is seen to be
a critical policy towards improving the efficiency and productivity of the banking
sector. Cross-country studies conducted by Fries and Taci (2005), Bonin et al. (2005a;
2005b), Fries et al. (2006) together advocate that private banks are superior to state-
owned banks in aspects of both cost and profit efficiency. Moreover, single-country
studies conducted in China (Jiang et al., 2009; Berger et al., 2009) and Bulgaria
(Tochkov and Nenovsky, 2011) also support the outperforming of private banks to
public banks. Nonetheless, several studies have shown a reversed relationship between
state ownership and bank efficiency. Karas et al. (2010) investigated bank performance
in Russia and showed that there were no differences between private and public banks
in terms of technical efficiency. Yao et al. (2009) measured Chinese bank efficiency
and productivity during the period 1998−2005 and concluded that large privatised state-
owned banks achieved higher technical efficiency and productivity after their IPOs
(Initial Public Offering).
Bonin and Schnabel (2011) describe a great transformation from government-owned to
foreign controlled banking sector and that this is an unprecedented change in banking
86
systems to have occurred in transition economies. The shift to market-based operations
is accompanied by an improvement in the financial environment generally, and bank
efficiency in particular.
3.5. Literature on Banking Efficiency in Vietnam
To the best of the author‘s knowledge, Nguyen (2007) is the first study to investigate
the efficiency and productivity of Vietnamese banks covering the period 2001−2003
with a limited sample of banks (13 of about 50 commercial banks). Using a basic DEA
method he found that the average bank cost efficiency score was a low 60.6 percent and
the sources of this inefficiency derived from both allocative and technical components
of cost efficiency. The Malmquist productivity index decreased during the period
2001−2003. However, the results do not reflect the entire banking sector due to the
short period of the study as well as the small sample size. Moreover, the period
2001−2003 witnessed a significant change in the banking sector such as the
recapitalisation of the SOCBs, and the merging or even revoking of the banking licenses
of small Joint Stocks Banks (JSBs) after the East Asia Financial Crisis (EAFC).
Nonetheless, the determinants of banking efficiency and productivity were not
mentioned or determined in the study.
Quang and De Borger (2008) used a bootstrap technique to construct confidence
intervals for DEA-based efficiency and productivity of the Vietnamese banking sector
for the period 2003-2006. The technical efficiency scores were very high at 94 and 95
percent in 2003 and 2004, respectively; and then substantially declined to 85 percent in
2006. Nonetheless, such a high level of efficiency is doubtful. A suitable reason is that
the sample of banks does not include the small rural banks which were seen to be
87
inefficient in their operation. The state-owned banks were found to be more efficient
than private banks. However, the explanation provided on this comparison in the study
is weak with no empirical evidence provided to support it.
Minh et al. (2013) estimated the efficiency of Vietnam‘s banking sector using a sample
of 32 banks during the period 2001−2005. They used a super-efficiency measure
through a slacks-based model under the assumption of variable returns to scale (VRS).
The average efficiency score was found to be about 80 percent during this period, and it
tended to increase. Furthermore, a set of determinants were emphasised including
ownership type, bank size, labour quality and market share through a Tobit model
regression. They found that state ownership negatively affected efficiency. Nonetheless,
this result was not consistent because the SOCBs were recorded as achieving a high
ranking during 2001−2005. A positive relationship between efficiency and bank size
and market share was also found.
Vu and Turnell (2010) firstly employed an SFA method to measure bank efficiency in
the context of Vietnam. The bank sample in this study covered almost all banks and
foreign-bank branches operating in Vietnam during the period 2000−2006. The authors
concluded that, on average, cost efficiency was mostly unchanged and SOCBs reached a
higher efficiency level than private banks (JSBs and foreign-bank branches). The
authors argue that the improvement of SOCBs‘ efficiency resulted from the
implementation of the Overall Restructuring Framework which aimed to recapitalise
and phase out policy lending by the SOCBs. The reduction in efficiency found for 2005
was due to implementation of new regulations on debt classification and loan-loss
provisioning that forced banks to increase their non-interest cost. Implementation of this
88
regulation is likely to have contributed to a structural break in the data after 2005, and
hence data homogeneity is questionable.
Vu and Turnell (2012) provided a parametric measure of productivity change using a
hyperbolic distance function with the same data sample as Vu and Turnell (2010). The
results showed that the Vietnamese banking industry experienced modest productivity
growth due to technological progress. Moreover, FBs achieved the highest productivity
growth because they possessed advanced technology infrastructure and operated at an
appropriate scale.
Nalm and Vu (2013) reused the sample data of Vu and Turnell (2010) to estimate the
efficiency and productivity of Vietnamese banks. Based on a directional distance
function the authors measured profit efficiency and its components of technical and
allocative efficiency. A generalised Malmquist productivity index was also derived and
decomposed into pure technical efficiency change, scale efficiency change and
technological change. The findings are: (1) in terms of profit efficiency average banks
operated quite far below the frontier of the best practice banks mainly due to allocative
inefficiency rather than technical inefficiency; (2) price efficiency and profit efficiency
scores of SOCBs were much higher than JSBs and FBs due to their market power in
setting prices; (3) during 2000−2006 the banking industry achieved modest productivity
growth due to technological progress. The reused data still faced the limitation of data
heterogeneity as mentioned above.
Generally, pre-WTO entry studies on banking efficiency in Vietnam provided
conflicting results on the trend of efficiency. This is possibly because the bank samples
were different, and the data was not homogenous. Except for the study conducted by Vu
89
and Turnell (2010), the others totally ignored the effects of the restructuring plan on the
efficiency of banks. Moreover, technological progress should be analysed in depth
because the period 2000−2006 experienced a substantial change in banking operations
when all banks applied the core banking system based on the internet, inter-bank
payment system, and the Automatic Teller Machine (ATM) system.
The post-WTO accession period witnessed a number of policies aimed at improving the
efficiency of domestic banks under the threat from foreign bank penetration. The
policies included: (1) equitising SOCBs; (2) permitting foreign financial institutions to
have capital participation in domestic banks; (3) transforming 13 rural to urban banks
and granting new bank licenses; (4) allowing SOEs and private business groups to
engage in the banking sector. These policies are likely to have influenced banking
efficiency and are necessary to be analysed in depth. Moreover, the booming property
market, which essentially depended on banking credit, can be expected to have strongly
exerted an effect on banking efficiency. Although a lot of important changes occurred
after Vietnam joined the WTO a limited number of studies have been conducted to
investigate their impact on banking efficiency.
Dang-Thanh (2010) used a basic DEA model to measure the efficiency scores of banks
in Vietnam using a sample of 22 banks in 2008. The results suggested that the mean
technical efficiency scores under the variable returns to scale (VRS) assumption or
constant returns to scale (CRS) assumption are close to one. However, this finding is
not reliable because it is based on banking performance in only one year (2008).
Additionally, this research does not mention the possible influences of policy changes in
the post-WTO entry period.
90
Nguyen (2012) employed a similar DEA method to measure the efficiency and
productivity of Vietnamese banks during the period 2007−2010 using a sample of 20
banks. The author found that the efficiency scores continuously increased from
2007−2010. Mean technical efficiency in 2008 was found to be 0.686 which is very
different compared with that obtained by Ngo (2010). The difference can be explained
by the different sample, and by the different sources of data. In addition, the technical
efficiency scores of SOCBs are significantly lower than that of JSBs. Given there are
many major policy changes during this period, those studies however did not consider
these changes. Ngo (2012) conducted another study using macro data to analyse the
relationship between DEA-based banking efficiency and liberalisation from 1990−2010.
To measure liberalisation in the banking sector a KAOPEN index developed by Chinn
and Ito (2008) was used. However, the results obtained did not support his hypothesis
that financial liberalisation positively impacted banking efficiency in Vietnam.
Homogeneity of the data is doubtful due to significant changes in accounting standards
and national statistical practices during the research period.
There have been nine studies in total on Vietnamese banking efficiency to date (see
Table 3.3). Most of these studies have focused on measuring and analysing the technical
efficiency and productivity of the banking sector in the pre-WTO accession period
(2000−2006)45
. There are a number of studies measuring technical efficiency in the
post-WTO; however changes in policies as well as from the business environment
influencing the banking sector have not been mentioned and analysed. This study is the
first to evaluate the technical efficiency of Vietnam‘s commercial banks covering the
period 2005−2012, which incorporates both the pre- and post-WTO period. In addition,
45 Vietnam officially became the 150
th member of the WTO from January 2007.
91
it is the first study to test for a linkage between banking sector related policy changes
and banking efficiency.
The Vietnamese economy in general and its banking sector in particular are in a
transition process from a planned to a complete market economy. Consequently, the
characteristics of the banking sector46
in a transition economy have to be accounted for
in analysing efficiency. Nonetheless, previous research has not adequately addressed or
only slightly considered these characteristics. As a result the roots of the
underperformance in the banking sector are largely ignored when analysing banking
efficiency and productivity.
According to Simar and Wilson (1998), efficient firms are inadequately included in the
sample and so DEA estimates can be biased. These previous studies, however, do not
address these issues; therefore it is likely that their estimates may suffer from these
problems. Moreover, all regressions of technical efficiency scores on the determinants
are inconsistent due to a serial correlation defect of the dependent variable (Xue and
Hacker, 1999). Obviously, the results attained are not reliable and a better method that
overcomes these restrictions should be discovered and applied in such studies. In this
context, this study addresses such issues to produce unbiased and more accurate results.
Due to the issuance of new accounting standards in 2005, all studies using before-2005
data need to be adjusted to fit new accounting standards due to the fact that the loan-loss
provisioning cost which takes up a substantial part of total cost was excluded before
2005. Consequently, studies using data from 2005 are much more consistent and
accurate.
46 These characteristics are referred to in Section 3.4.1.
92
To the author‘s knowledge, in the relevant literature, there have been studies on the
impact of WTO accession on banking efficiency but only for the case of China –
another transition country in Asia (Yao et al., 2007; Berger et al., 2009; Jiang et al.,
2009). China and Vietnam together conducted a similar gradualist approach to banking
sector transition. Before joining the WTO their banking sectors were relatively closed to
foreign investors. In contrast, transition countries in Europe conducted a ―big-bang‖
approach; and most of them definitively liberalised their banking sectors at an early
stage of their transition so that the impact of their subsequent WTO accession was
insignificant. Studies on banking efficiency in Vietnam in the post-WTO accession in
comparison with that of China are important to discover the common characteristics of
the banking sectors in these gradualist transition countries.
3.6 Summary
This chapter has reviewed several important aspects relating to bank efficiency in the
literature, including a summary of methods that have been used for estimating
efficiency, and regression techniques for regressing efficiency scores on environmental
variables. Financial liberalisation and its impact on banking efficiency has been
analysed in both a single-country and cross-country framework. Additionally, a review
of the transformation process in transition countries from a government dominated
banking sector to a foreign controlled one has also been highlighted. Lastly, previous
studies on Vietnamese banking efficiency have also been summarised so as to identify
the limitations, weaknesses as well as the research gap to be filled by this thesis.
In the following chapter, conceptual framework on efficiency and methods used to
estimate and analyse technical efficiency scores will be presented. Specifically,
93
bootstrap techniques are employed as the unique solution to overcome biased and
dependent nature of DEA-estimated efficiency scores.
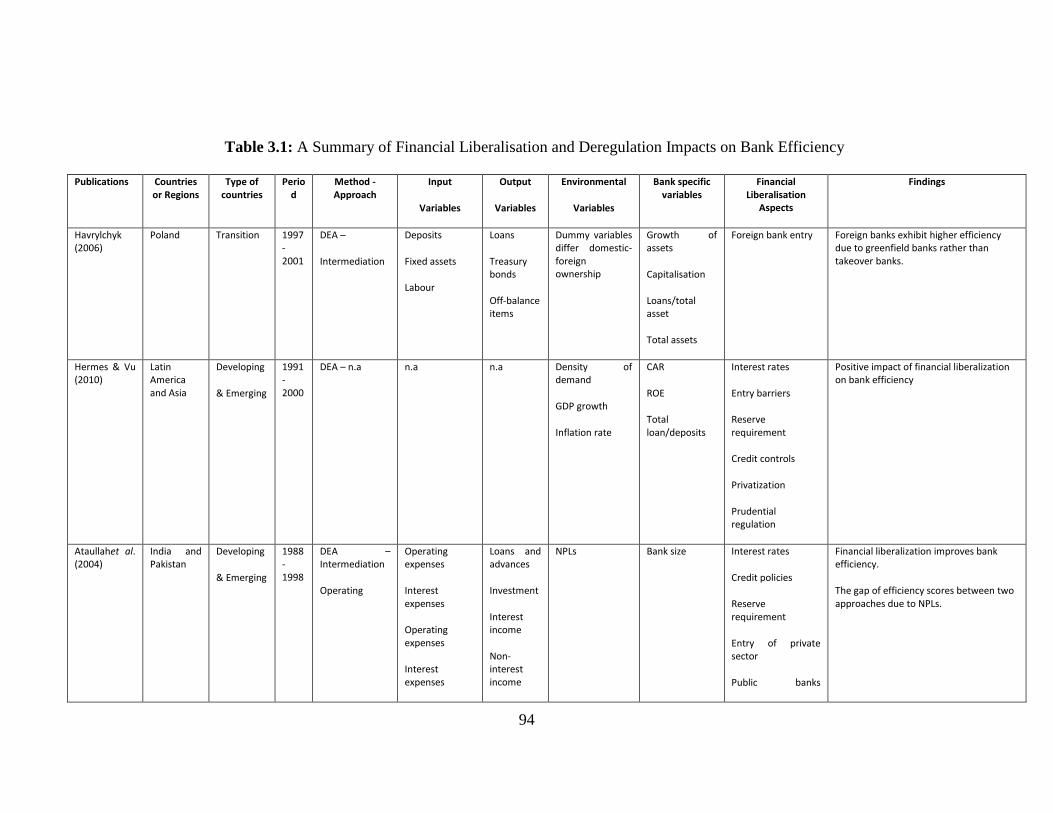
94
13Table 3.1: A Summary of Financial Liberalisation and Deregulation Impacts on Bank Efficiency
Publications Countries
or Regions Type of
countries Perio
d Method - Approach
Input
Variables
Output
Variables
Environmental
Variables
Bank specific variables
Financial Liberalisation
Aspects
Findings
Havrylchyk (2006)
Poland Transition 1997-2001
DEA –
Intermediation
Deposits
Fixed assets
Labour
Loans
Treasury bonds
Off-balance items
Dummy variables differ domestic-foreign ownership
Growth of assets
Capitalisation
Loans/total asset
Total assets
Foreign bank entry Foreign banks exhibit higher efficiency due to greenfield banks rather than takeover banks.
Hermes & Vu (2010)
Latin America and Asia
Developing
& Emerging
1991 - 2000
DEA – n.a
n.a n.a
Density of demand
GDP growth
Inflation rate
CAR
ROE
Total loan/deposits
Interest rates
Entry barriers
Reserve requirement
Credit controls
Privatization
Prudential regulation
Positive impact of financial liberalization on bank efficiency
Ataullahet al. (2004)
India and Pakistan
Developing
& Emerging
1988 - 1998
DEA – Intermediation
Operating
Operating expenses
Interest expenses
Operating expenses
Interest expenses
Loans and advances
Investment
Interest income
Non-interest income
NPLs
Bank size Interest rates
Credit policies
Reserve requirement
Entry of private sector
Public banks
Financial liberalization improves bank efficiency.
The gap of efficiency scores between two approaches due to NPLs.
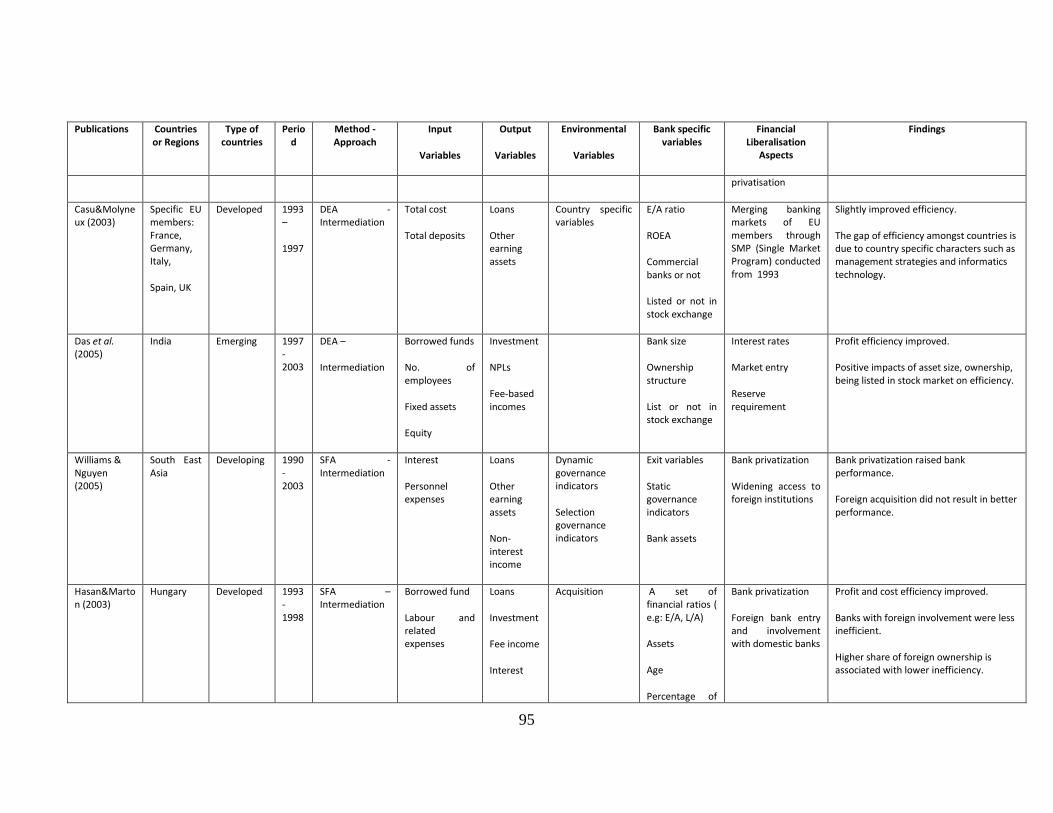
95
Publications Countries or Regions
Type of countries
Period
Method - Approach
Input
Variables
Output
Variables
Environmental
Variables
Bank specific variables
Financial Liberalisation
Aspects
Findings
privatisation
Casu&Molyneux (2003)
Specific EU members: France, Germany, Italy,
Spain, UK
Developed 1993 –
1997
DEA - Intermediation
Total cost
Total deposits
Loans
Other earning assets
Country specific variables
E/A ratio
ROEA
Commercial banks or not
Listed or not in stock exchange
Merging banking markets of EU members through SMP (Single Market Program) conducted from 1993
Slightly improved efficiency.
The gap of efficiency amongst countries is due to country specific characters such as management strategies and informatics technology.
Das et al. (2005)
India Emerging 1997 - 2003
DEA –
Intermediation
Borrowed funds
No. of employees
Fixed assets
Equity
Investment
NPLs
Fee-based incomes
Bank size
Ownership structure
List or not in stock exchange
Interest rates
Market entry
Reserve requirement
Profit efficiency improved.
Positive impacts of asset size, ownership, being listed in stock market on efficiency.
Williams & Nguyen (2005)
South East Asia
Developing 1990 - 2003
SFA - Intermediation
Interest
Personnel expenses
Loans
Other earning assets
Non-interest income
Dynamic governance indicators
Selection governance indicators
Exit variables
Static governance indicators
Bank assets
Bank privatization
Widening access to foreign institutions
Bank privatization raised bank performance.
Foreign acquisition did not result in better performance.
Hasan&Marton (2003)
Hungary Developed 1993 - 1998
SFA – Intermediation
Borrowed fund
Labour and related expenses
Loans
Investment
Fee income
Interest
Acquisition A set of financial ratios ( e.g: E/A, L/A)
Assets
Age
Percentage of
Bank privatization
Foreign bank entry and involvement with domestic banks
Profit and cost efficiency improved.
Banks with foreign involvement were less inefficient.
Higher share of foreign ownership is associated with lower inefficiency.
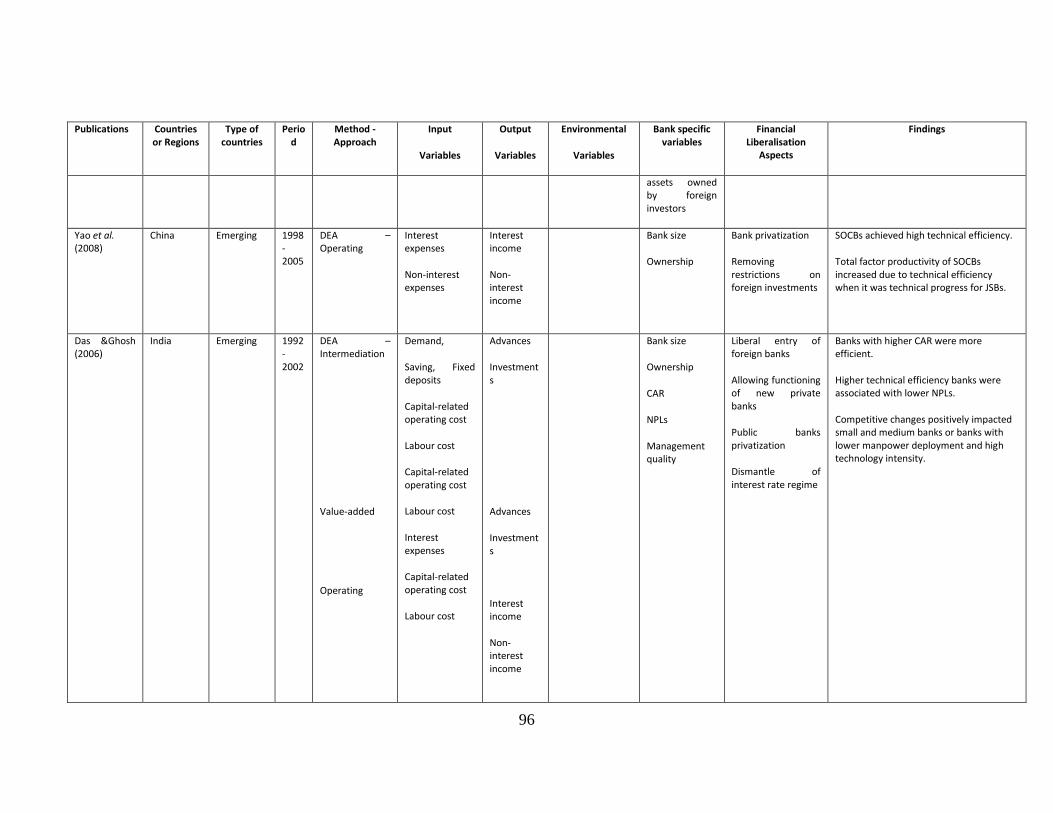
96
Publications Countries or Regions
Type of countries
Period
Method - Approach
Input
Variables
Output
Variables
Environmental
Variables
Bank specific variables
Financial Liberalisation
Aspects
Findings
assets owned by foreign investors
Yao et al. (2008)
China Emerging 1998 - 2005
DEA – Operating
Interest expenses
Non-interest expenses
Interest income
Non-interest income
Bank size
Ownership
Bank privatization
Removing restrictions on foreign investments
SOCBs achieved high technical efficiency.
Total factor productivity of SOCBs increased due to technical efficiency when it was technical progress for JSBs.
Das &Ghosh (2006)
India Emerging 1992 - 2002
DEA – Intermediation
Value-added
Operating
Demand,
Saving, Fixed deposits
Capital-related operating cost
Labour cost
Capital-related operating cost
Labour cost
Interest expenses
Capital-related operating cost
Labour cost
Advances
Investments
Advances
Investments
Interest income
Non-interest income
Bank size
Ownership
CAR
NPLs
Management quality
Liberal entry of foreign banks
Allowing functioning of new private banks
Public banks privatization
Dismantle of interest rate regime
Banks with higher CAR were more efficient.
Higher technical efficiency banks were associated with lower NPLs.
Competitive changes positively impacted small and medium banks or banks with lower manpower deployment and high technology intensity.
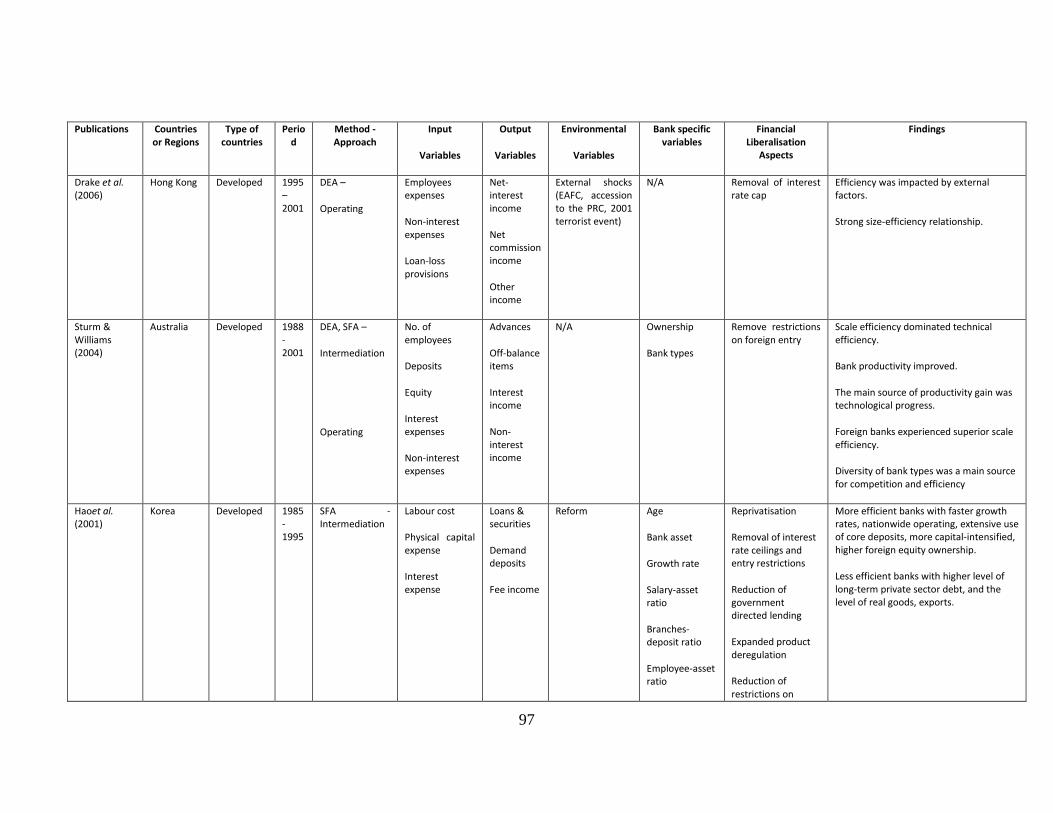
97
Publications Countries or Regions
Type of countries
Period
Method - Approach
Input
Variables
Output
Variables
Environmental
Variables
Bank specific variables
Financial Liberalisation
Aspects
Findings
Drake et al. (2006)
Hong Kong Developed 1995 – 2001
DEA –
Operating
Employees expenses
Non-interest expenses
Loan-loss provisions
Net-interest income
Net commission income
Other income
External shocks (EAFC, accession to the PRC, 2001 terrorist event)
N/A Removal of interest rate cap
Efficiency was impacted by external factors.
Strong size-efficiency relationship.
Sturm & Williams (2004)
Australia Developed 1988 - 2001
DEA, SFA –
Intermediation
Operating
No. of employees
Deposits
Equity
Interest expenses
Non-interest expenses
Advances
Off-balance items
Interest income
Non-interest income
N/A Ownership
Bank types
Remove restrictions on foreign entry
Scale efficiency dominated technical efficiency.
Bank productivity improved.
The main source of productivity gain was technological progress.
Foreign banks experienced superior scale efficiency.
Diversity of bank types was a main source for competition and efficiency
Haoet al. (2001)
Korea Developed 1985-1995
SFA - Intermediation
Labour cost
Physical capital expense
Interest expense
Loans & securities
Demand deposits
Fee income
Reform Age
Bank asset
Growth rate
Salary-asset ratio
Branches-deposit ratio
Employee-asset ratio
Reprivatisation
Removal of interest rate ceilings and entry restrictions
Reduction of government directed lending
Expanded product deregulation
Reduction of restrictions on
More efficient banks with faster growth rates, nationwide operating, extensive use of core deposits, more capital-intensified, higher foreign equity ownership.
Less efficient banks with higher level of long-term private sector debt, and the level of real goods, exports.
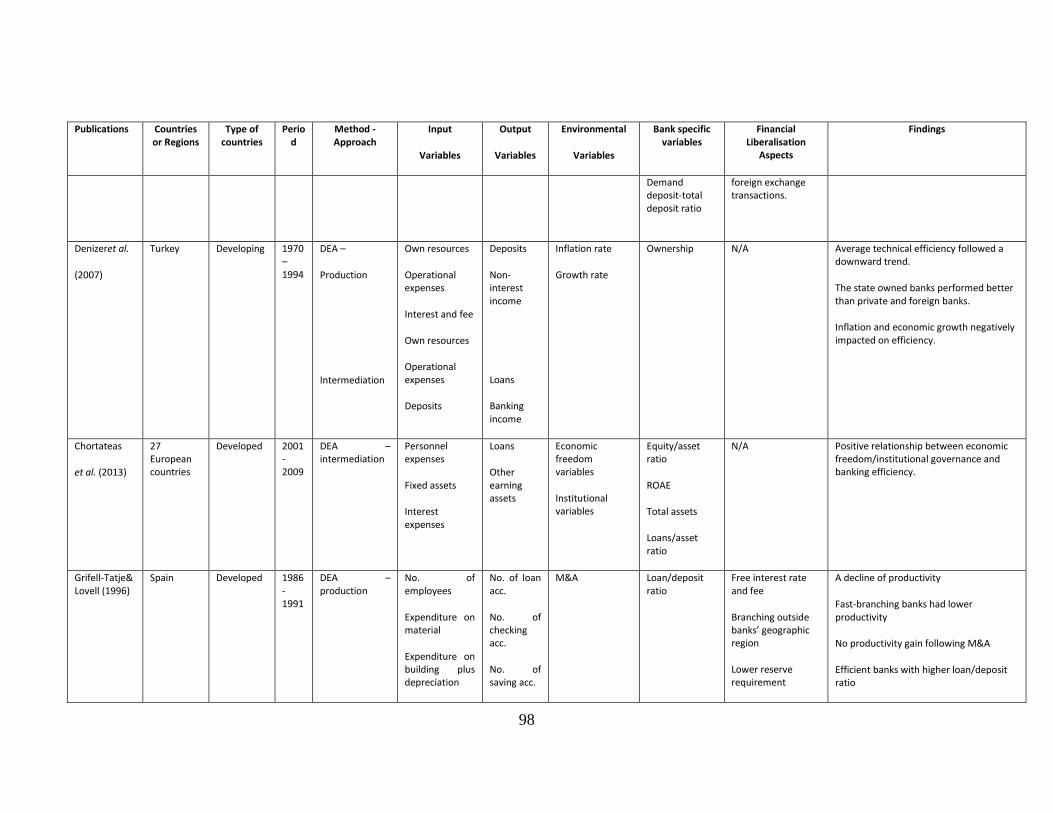
98
Publications Countries or Regions
Type of countries
Period
Method - Approach
Input
Variables
Output
Variables
Environmental
Variables
Bank specific variables
Financial Liberalisation
Aspects
Findings
Demand deposit-total deposit ratio
foreign exchange transactions.
Denizeret al.
(2007)
Turkey
Developing 1970 – 1994
DEA –
Production
Intermediation
Own resources
Operational expenses
Interest and fee
Own resources
Operational expenses
Deposits
Deposits
Non-interest income
Loans
Banking income
Inflation rate
Growth rate
Ownership N/A Average technical efficiency followed a downward trend.
The state owned banks performed better than private and foreign banks.
Inflation and economic growth negatively impacted on efficiency.
Chortateas
et al. (2013)
27 European countries
Developed 2001 - 2009
DEA – intermediation
Personnel expenses
Fixed assets
Interest expenses
Loans
Other earning assets
Economic freedom variables
Institutional variables
Equity/asset ratio
ROAE
Total assets
Loans/asset ratio
N/A Positive relationship between economic freedom/institutional governance and banking efficiency.
Grifell-Tatje& Lovell (1996)
Spain Developed 1986 - 1991
DEA – production
No. of employees
Expenditure on material
Expenditure on building plus depreciation
No. of loan acc.
No. of checking acc.
No. of saving acc.
M&A Loan/deposit ratio
Free interest rate and fee
Branching outside banks’ geographic region
Lower reserve requirement
A decline of productivity
Fast-branching banks had lower productivity
No productivity gain following M&A
Efficient banks with higher loan/deposit ratio
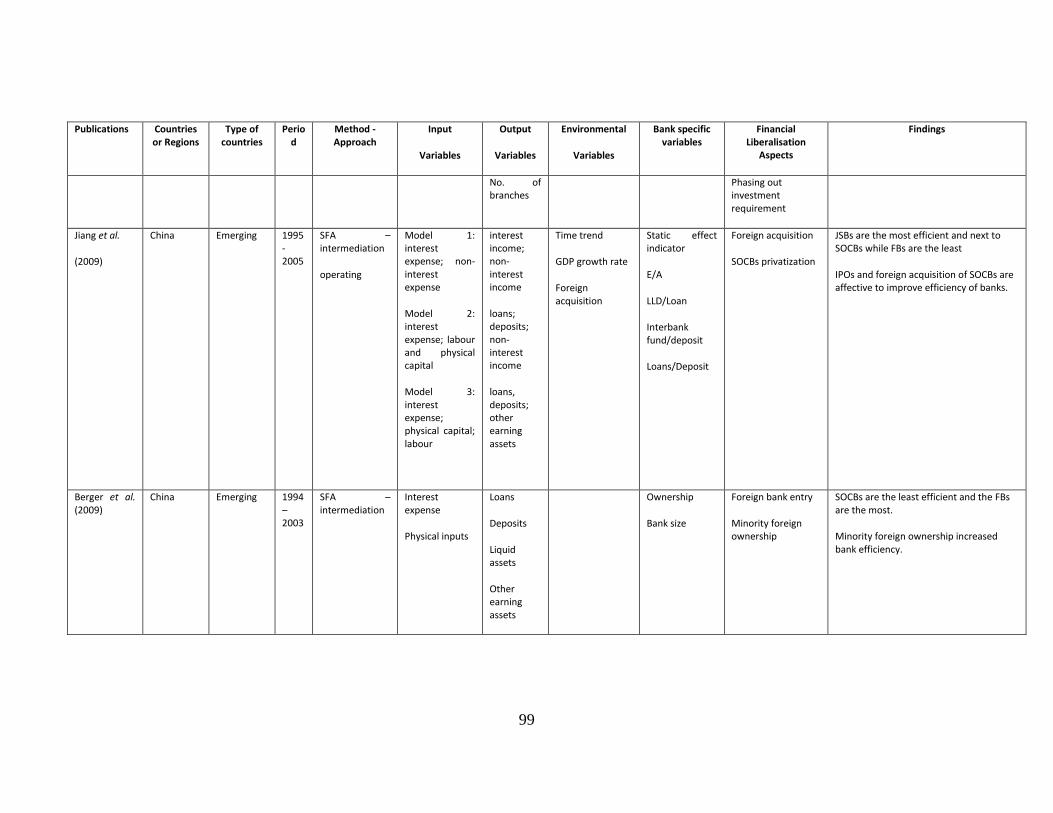
99
Publications Countries or Regions
Type of countries
Period
Method - Approach
Input
Variables
Output
Variables
Environmental
Variables
Bank specific variables
Financial Liberalisation
Aspects
Findings
No. of branches
Phasing out investment requirement
Jiang et al.
(2009)
China Emerging 1995 - 2005
SFA – intermediation
operating
Model 1: interest expense; non-interest expense
Model 2: interest expense; labour and physical capital
Model 3: interest expense; physical capital; labour
interest income; non-interest income
loans; deposits; non-interest income
loans, deposits; other earning assets
Time trend
GDP growth rate
Foreign acquisition
Static effect indicator
E/A
LLD/Loan
Interbank fund/deposit
Loans/Deposit
Foreign acquisition
SOCBs privatization
JSBs are the most efficient and next to SOCBs while FBs are the least
IPOs and foreign acquisition of SOCBs are affective to improve efficiency of banks.
Berger et al. (2009)
China Emerging 1994 – 2003
SFA – intermediation
Interest expense
Physical inputs
Loans
Deposits
Liquid assets
Other earning assets
Ownership
Bank size
Foreign bank entry
Minority foreign ownership
SOCBs are the least efficient and the FBs are the most.
Minority foreign ownership increased bank efficiency.
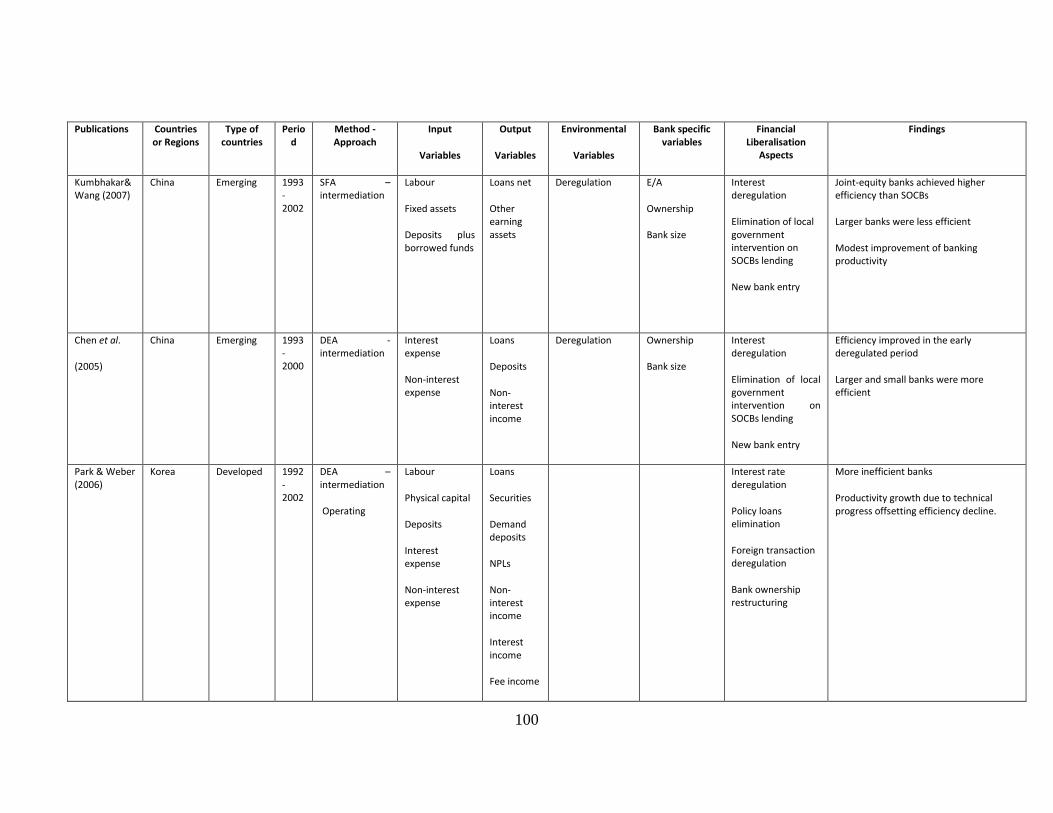
100
Publications Countries or Regions
Type of countries
Period
Method - Approach
Input
Variables
Output
Variables
Environmental
Variables
Bank specific variables
Financial Liberalisation
Aspects
Findings
Kumbhakar& Wang (2007)
China Emerging 1993 - 2002
SFA – intermediation
Labour
Fixed assets
Deposits plus borrowed funds
Loans net
Other earning assets
Deregulation E/A
Ownership
Bank size
Interest deregulation
Elimination of local government intervention on SOCBs lending
New bank entry
Joint-equity banks achieved higher efficiency than SOCBs
Larger banks were less efficient
Modest improvement of banking productivity
Chen et al.
(2005)
China Emerging 1993 - 2000
DEA - intermediation
Interest expense
Non-interest expense
Loans
Deposits
Non-interest income
Deregulation Ownership
Bank size
Interest deregulation
Elimination of local government intervention on SOCBs lending
New bank entry
Efficiency improved in the early deregulated period
Larger and small banks were more efficient
Park & Weber (2006)
Korea Developed 1992 - 2002
DEA – intermediation
Operating
Labour
Physical capital
Deposits
Interest expense
Non-interest expense
Loans
Securities
Demand deposits
NPLs
Non-interest income
Interest income
Fee income
Interest rate deregulation
Policy loans elimination
Foreign transaction deregulation
Bank ownership restructuring
More inefficient banks
Productivity growth due to technical progress offsetting efficiency decline.
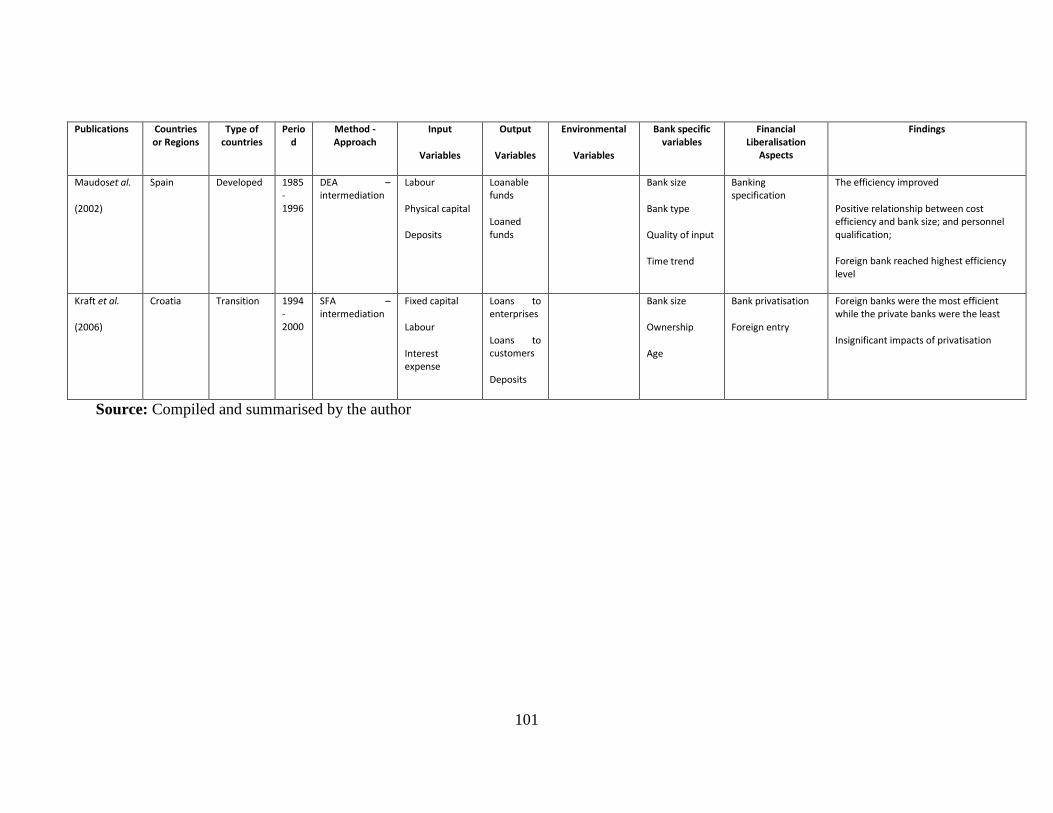
101
Publications Countries or Regions
Type of countries
Period
Method - Approach
Input
Variables
Output
Variables
Environmental
Variables
Bank specific variables
Financial Liberalisation
Aspects
Findings
Maudoset al.
(2002)
Spain Developed 1985 - 1996
DEA – intermediation
Labour
Physical capital
Deposits
Loanable funds
Loaned funds
Bank size
Bank type
Quality of input
Time trend
Banking specification
The efficiency improved
Positive relationship between cost efficiency and bank size; and personnel qualification;
Foreign bank reached highest efficiency level
Kraft et al.
(2006)
Croatia Transition 1994 - 2000
SFA – intermediation
Fixed capital
Labour
Interest expense
Loans to enterprises
Loans to customers
Deposits
Bank size
Ownership
Age
Bank privatisation
Foreign entry
Foreign banks were the most efficient while the private banks were the least
Insignificant impacts of privatisation
Source: Compiled and summarised by the author
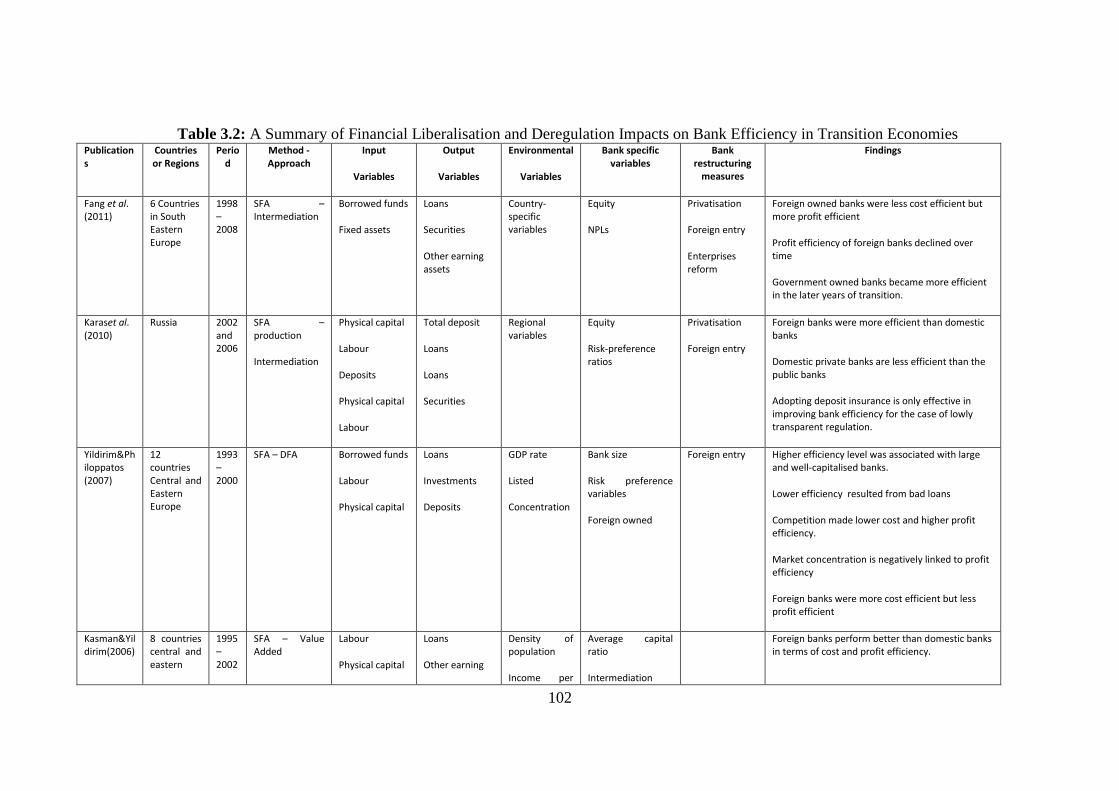
102
14Table 3.2: A Summary of Financial Liberalisation and Deregulation Impacts on Bank Efficiency in Transition Economies Publications
Countries or Regions
Period
Method - Approach
Input
Variables
Output
Variables
Environmental
Variables
Bank specific variables
Bank restructuring
measures
Findings
Fang et al. (2011)
6 Countries in South Eastern Europe
1998 – 2008
SFA – Intermediation
Borrowed funds
Fixed assets
Loans
Securities
Other earning assets
Country-specific variables
Equity
NPLs
Privatisation
Foreign entry
Enterprises reform
Foreign owned banks were less cost efficient but more profit efficient
Profit efficiency of foreign banks declined over time
Government owned banks became more efficient in the later years of transition.
Karaset al. (2010)
Russia 2002 and 2006
SFA – production
Intermediation
Physical capital
Labour
Deposits
Physical capital
Labour
Total deposit
Loans
Loans
Securities
Regional variables
Equity
Risk-preference ratios
Privatisation
Foreign entry
Foreign banks were more efficient than domestic banks
Domestic private banks are less efficient than the public banks
Adopting deposit insurance is only effective in improving bank efficiency for the case of lowly transparent regulation.
Yildirim&Philoppatos (2007)
12 countries Central and Eastern Europe
1993 – 2000
SFA – DFA Borrowed funds
Labour
Physical capital
Loans
Investments
Deposits
GDP rate
Listed
Concentration
Bank size
Risk preference variables
Foreign owned
Foreign entry Higher efficiency level was associated with large and well-capitalised banks.
Lower efficiency resulted from bad loans
Competition made lower cost and higher profit efficiency.
Market concentration is negatively linked to profit efficiency
Foreign banks were more cost efficient but less profit efficient
Kasman&Yildirim(2006)
8 countries central and eastern
1995 – 2002
SFA – Value Added
Labour
Physical capital
Loans
Other earning
Density of population
Income per
Average capital ratio
Intermediation
Foreign banks perform better than domestic banks in terms of cost and profit efficiency.
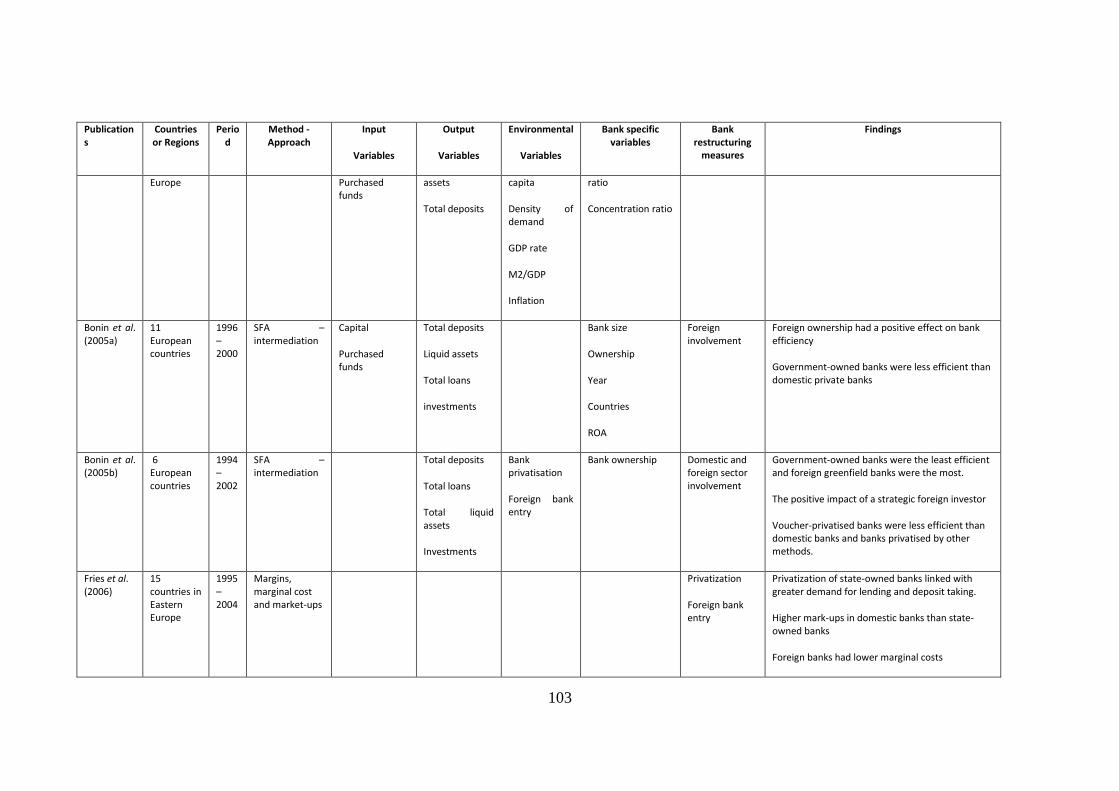
103
Publications
Countries or Regions
Period
Method - Approach
Input
Variables
Output
Variables
Environmental
Variables
Bank specific variables
Bank restructuring
measures
Findings
Europe Purchased funds
assets
Total deposits
capita
Density of demand
GDP rate
M2/GDP
Inflation
ratio
Concentration ratio
Bonin et al. (2005a)
11 European countries
1996 – 2000
SFA – intermediation
Capital
Purchased funds
Total deposits
Liquid assets
Total loans
investments
Bank size
Ownership
Year
Countries
ROA
Foreign involvement
Foreign ownership had a positive effect on bank efficiency
Government-owned banks were less efficient than domestic private banks
Bonin et al. (2005b)
6 European countries
1994 – 2002
SFA – intermediation
Total deposits
Total loans
Total liquid assets
Investments
Bank privatisation
Foreign bank entry
Bank ownership
Domestic and foreign sector involvement
Government-owned banks were the least efficient and foreign greenfield banks were the most.
The positive impact of a strategic foreign investor
Voucher-privatised banks were less efficient than domestic banks and banks privatised by other methods.
Fries et al. (2006)
15 countries in Eastern Europe
1995 – 2004
Margins, marginal cost and market-ups
Privatization
Foreign bank entry
Privatization of state-owned banks linked with greater demand for lending and deposit taking.
Higher mark-ups in domestic banks than state-owned banks
Foreign banks had lower marginal costs
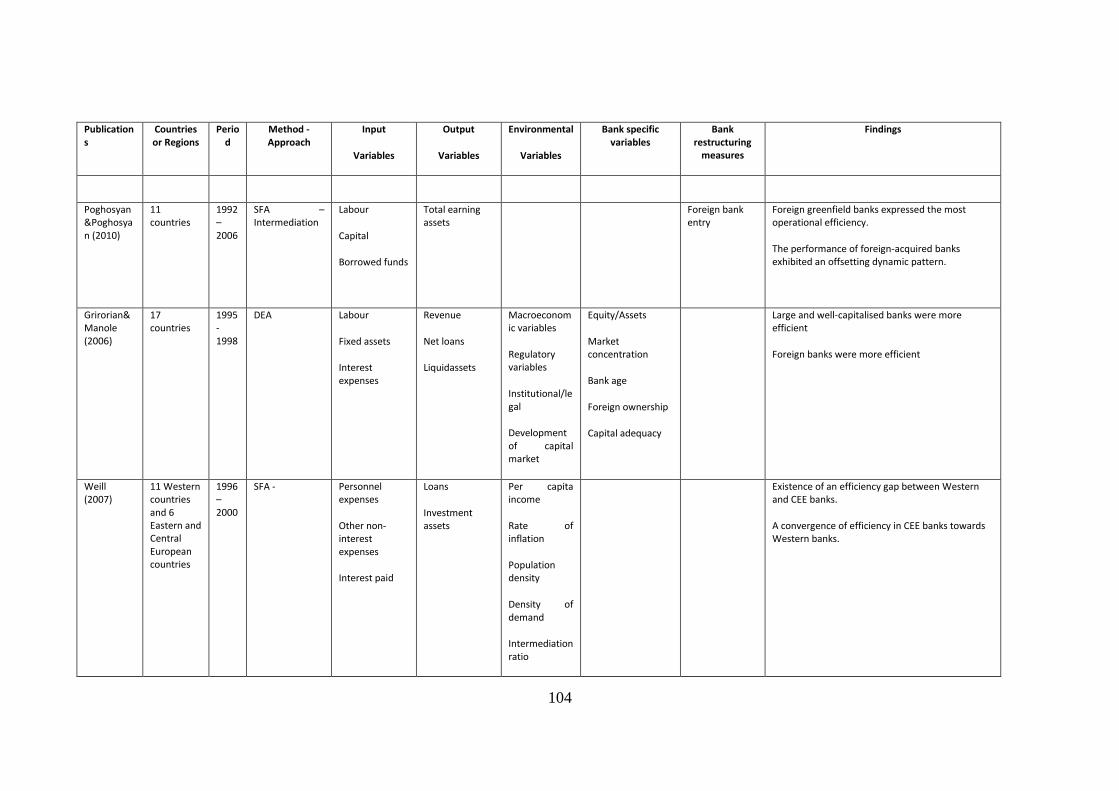
104
Publications
Countries or Regions
Period
Method - Approach
Input
Variables
Output
Variables
Environmental
Variables
Bank specific variables
Bank restructuring
measures
Findings
Poghosyan&Poghosyan (2010)
11 countries
1992 – 2006
SFA – Intermediation
Labour
Capital
Borrowed funds
Total earning assets
Foreign bank entry
Foreign greenfield banks expressed the most operational efficiency.
The performance of foreign-acquired banks exhibited an offsetting dynamic pattern.
Grirorian&Manole (2006)
17 countries
1995 - 1998
DEA Labour
Fixed assets
Interest expenses
Revenue
Net loans
Liquidassets
Macroeconomic variables
Regulatory variables
Institutional/legal
Development of capital market
Equity/Assets
Market concentration
Bank age
Foreign ownership
Capital adequacy
Large and well-capitalised banks were more efficient
Foreign banks were more efficient
Weill (2007)
11 Western countries and 6 Eastern and Central European countries
1996 – 2000
SFA - Personnel expenses
Other non-interest expenses
Interest paid
Loans
Investment assets
Per capita income
Rate of inflation
Population density
Density of demand
Intermediation ratio
Existence of an efficiency gap between Western and CEE banks.
A convergence of efficiency in CEE banks towards Western banks.
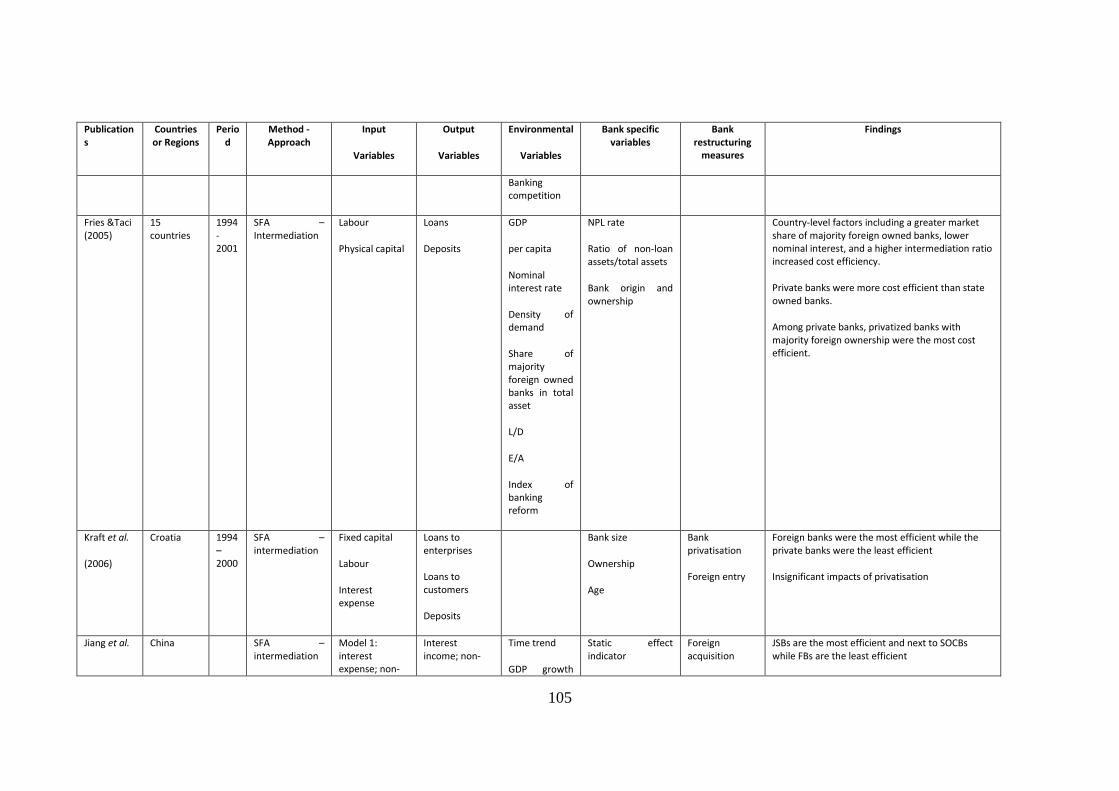
105
Publications
Countries or Regions
Period
Method - Approach
Input
Variables
Output
Variables
Environmental
Variables
Bank specific variables
Bank restructuring
measures
Findings
Banking competition
Fries &Taci (2005)
15 countries
1994 - 2001
SFA – Intermediation
Labour
Physical capital
Loans
Deposits
GDP
per capita
Nominal interest rate
Density of demand
Share of majority foreign owned banks in total asset
L/D
E/A
Index of banking reform
NPL rate
Ratio of non-loan assets/total assets
Bank origin and ownership
Country-level factors including a greater market share of majority foreign owned banks, lower nominal interest, and a higher intermediation ratio increased cost efficiency.
Private banks were more cost efficient than state owned banks.
Among private banks, privatized banks with majority foreign ownership were the most cost efficient.
Kraft et al.
(2006)
Croatia 1994 – 2000
SFA – intermediation
Fixed capital
Labour
Interest expense
Loans to enterprises
Loans to customers
Deposits
Bank size
Ownership
Age
Bank privatisation
Foreign entry
Foreign banks were the most efficient while the private banks were the least efficient
Insignificant impacts of privatisation
Jiang et al. China SFA – intermediation
Model 1: interest expense; non-
Interest income; non-
Time trend
GDP growth
Static effect indicator
Foreign acquisition
JSBs are the most efficient and next to SOCBs while FBs are the least efficient
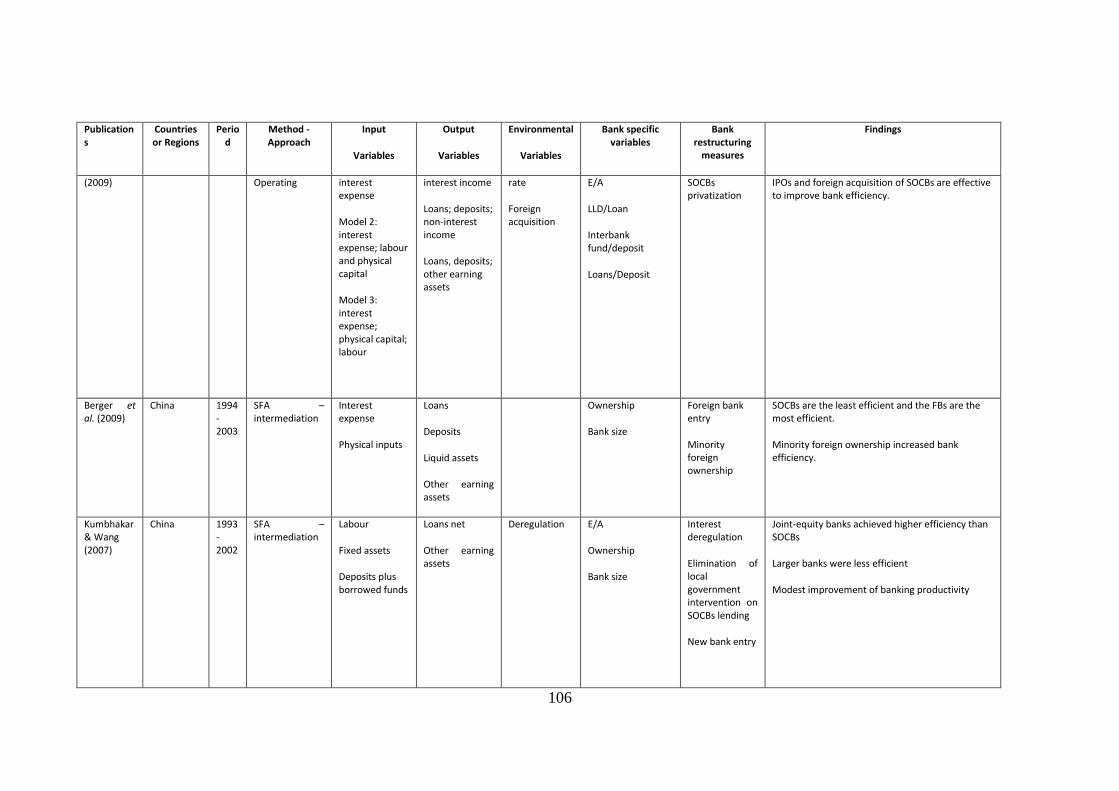
106
Publications
Countries or Regions
Period
Method - Approach
Input
Variables
Output
Variables
Environmental
Variables
Bank specific variables
Bank restructuring
measures
Findings
(2009) Operating interest expense
Model 2: interest expense; labour and physical capital
Model 3: interest expense; physical capital; labour
interest income
Loans; deposits; non-interest income
Loans, deposits; other earning assets
rate
Foreign acquisition
E/A
LLD/Loan
Interbank fund/deposit
Loans/Deposit
SOCBs privatization
IPOs and foreign acquisition of SOCBs are effective to improve bank efficiency.
Berger et al. (2009)
China 1994-2003
SFA – intermediation
Interest expense
Physical inputs
Loans
Deposits
Liquid assets
Other earning assets
Ownership
Bank size
Foreign bank entry
Minority foreign ownership
SOCBs are the least efficient and the FBs are the most efficient.
Minority foreign ownership increased bank efficiency.
Kumbhakar& Wang (2007)
China 1993-2002
SFA – intermediation
Labour
Fixed assets
Deposits plus borrowed funds
Loans net
Other earning assets
Deregulation E/A
Ownership
Bank size
Interest deregulation
Elimination of local government intervention on SOCBs lending
New bank entry
Joint-equity banks achieved higher efficiency than SOCBs
Larger banks were less efficient
Modest improvement of banking productivity
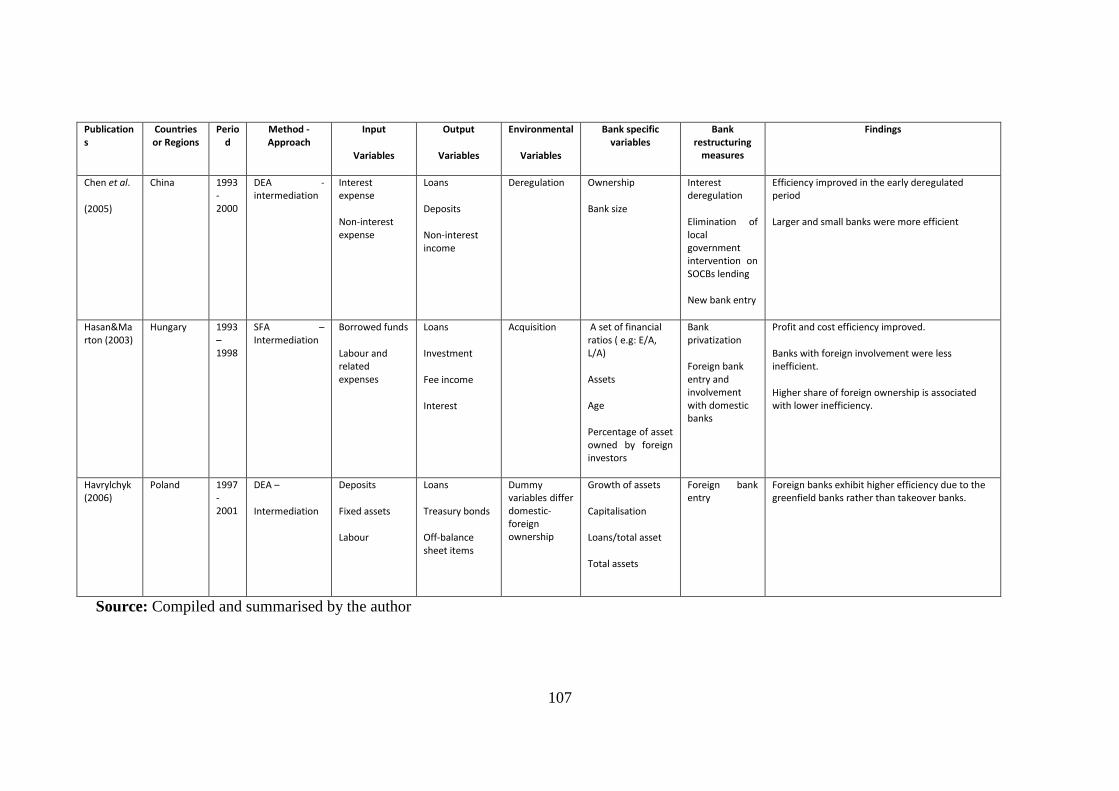
107
Publications
Countries or Regions
Period
Method - Approach
Input
Variables
Output
Variables
Environmental
Variables
Bank specific variables
Bank restructuring
measures
Findings
Chen et al.
(2005)
China 1993-2000
DEA - intermediation
Interest expense
Non-interest expense
Loans
Deposits
Non-interest income
Deregulation Ownership
Bank size
Interest deregulation
Elimination of local government intervention on SOCBs lending
New bank entry
Efficiency improved in the early deregulated period
Larger and small banks were more efficient
Hasan&Marton (2003)
Hungary 1993 – 1998
SFA – Intermediation
Borrowed funds
Labour and related expenses
Loans
Investment
Fee income
Interest
Acquisition A set of financial ratios ( e.g: E/A, L/A)
Assets
Age
Percentage of asset owned by foreign investors
Bank privatization
Foreign bank entry and involvement with domestic banks
Profit and cost efficiency improved.
Banks with foreign involvement were less inefficient.
Higher share of foreign ownership is associated with lower inefficiency.
Havrylchyk (2006)
Poland 1997-2001
DEA –
Intermediation
Deposits
Fixed assets
Labour
Loans
Treasury bonds
Off-balance sheet items
Dummy variables differ domestic-foreign ownership
Growth of assets
Capitalisation
Loans/total asset
Total assets
Foreign bank entry
Foreign banks exhibit higher efficiency due to the greenfield banks rather than takeover banks.
Source: Compiled and summarised by the author
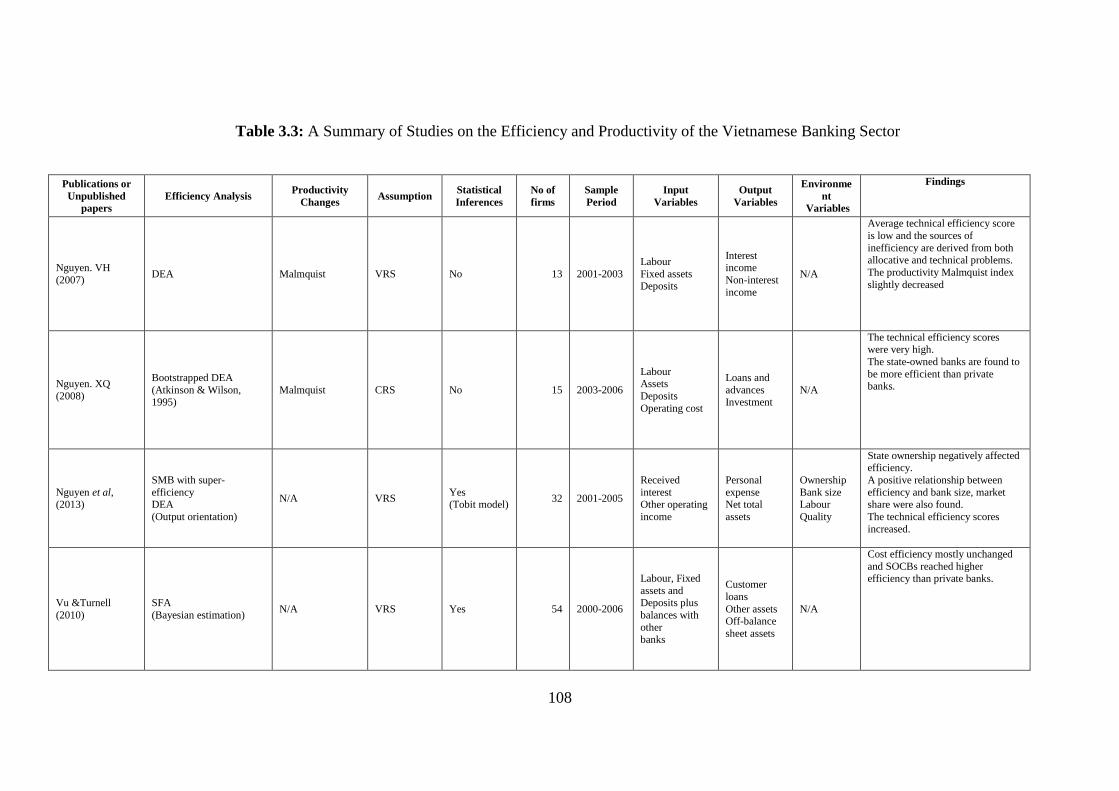
108
15Table 3.3: A Summary of Studies on the Efficiency and Productivity of the Vietnamese Banking Sector
Publications or
Unpublished
papers
Efficiency Analysis Productivity
Changes Assumption
Statistical
Inferences
No of
firms
Sample
Period
Input
Variables
Output
Variables
Environme
nt
Variables
Findings
Nguyen. VH
(2007) DEA Malmquist VRS No 13 2001-2003
Labour
Fixed assets Deposits
Interest
income
Non-interest
income
N/A
Average technical efficiency score
is low and the sources of
inefficiency are derived from both
allocative and technical problems.
The productivity Malmquist index
slightly decreased
Nguyen. XQ
(2008)
Bootstrapped DEA
(Atkinson & Wilson, 1995)
Malmquist CRS No 15 2003-2006
Labour Assets
Deposits
Operating cost
Loans and
advances Investment
N/A
The technical efficiency scores were very high.
The state-owned banks are found to
be more efficient than private banks.
Nguyen et al, (2013)
SMB with super-
efficiency DEA
(Output orientation)
N/A VRS Yes (Tobit model)
32 2001-2005
Received
interest Other operating
income
Personal
expense Net total
assets
Ownership
Bank size Labour
Quality
State ownership negatively affected efficiency.
A positive relationship between
efficiency and bank size, market share were also found.
The technical efficiency scores
increased.
Vu &Turnell
(2010)
SFA
(Bayesian estimation) N/A VRS Yes 54 2000-2006
Labour, Fixed
assets and Deposits plus
balances with
other banks
Customer
loans
Other assets Off-balance
sheet assets
N/A
Cost efficiency mostly unchanged
and SOCBs reached higher efficiency than private banks.
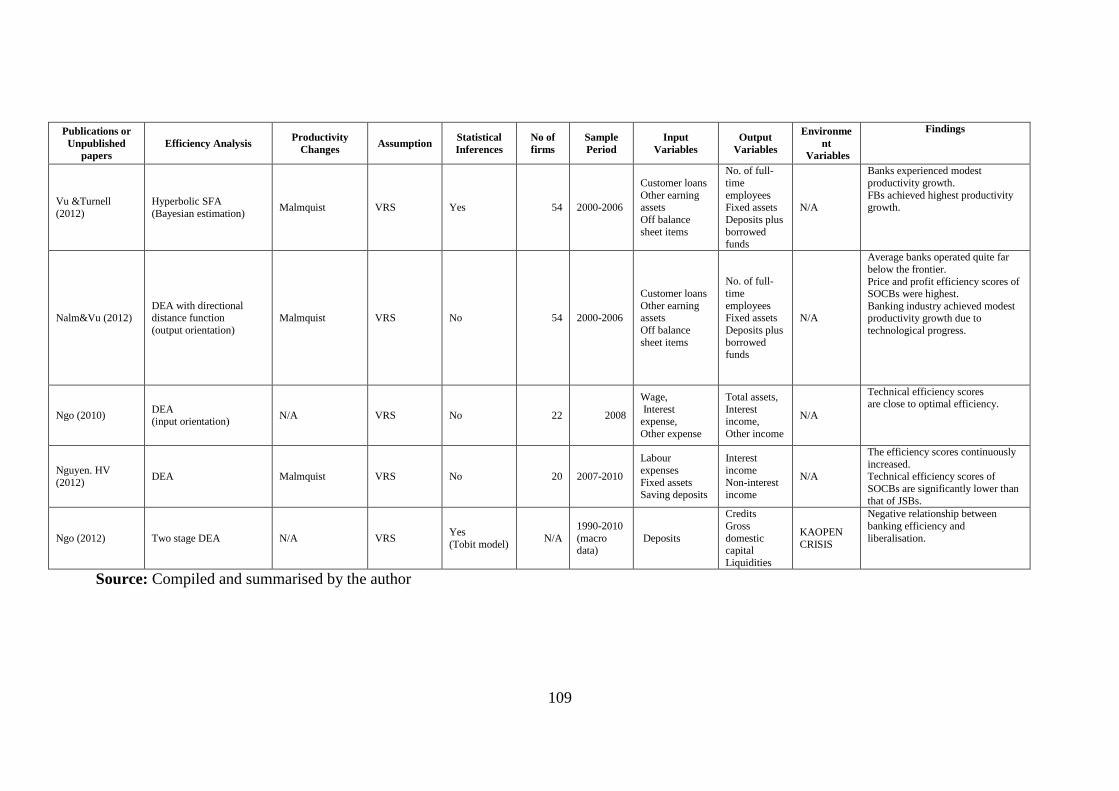
109
Publications or
Unpublished
papers
Efficiency Analysis Productivity
Changes Assumption
Statistical
Inferences
No of
firms
Sample
Period
Input
Variables
Output
Variables
Environme
nt
Variables
Findings
Vu &Turnell
(2012)
Hyperbolic SFA
(Bayesian estimation) Malmquist VRS Yes 54 2000-2006
Customer loans
Other earning assets
Off balance
sheet items
No. of full-
time
employees Fixed assets
Deposits plus
borrowed funds
N/A
Banks experienced modest
productivity growth.
FBs achieved highest productivity growth.
Nalm&Vu (2012) DEA with directional distance function
(output orientation)
Malmquist VRS No 54 2000-2006
Customer loans
Other earning assets
Off balance
sheet items
No. of full-
time
employees Fixed assets
Deposits plus
borrowed funds
N/A
Average banks operated quite far
below the frontier.
Price and profit efficiency scores of SOCBs were highest.
Banking industry achieved modest productivity growth due to
technological progress.
Ngo (2010) DEA (input orientation)
N/A VRS No 22 2008
Wage,
Interest expense,
Other expense
Total assets,
Interest income,
Other income
N/A
Technical efficiency scores are close to optimal efficiency.
Nguyen. HV
(2012) DEA Malmquist VRS No 20 2007-2010
Labour
expenses
Fixed assets Saving deposits
Interest
income
Non-interest income
N/A
The efficiency scores continuously
increased. Technical efficiency scores of
SOCBs are significantly lower than
that of JSBs.
Ngo (2012) Two stage DEA N/A VRS Yes
(Tobit model) N/A
1990-2010
(macro data)
Deposits
Credits
Gross
domestic capital
Liquidities
KAOPEN
CRISIS
Negative relationship between
banking efficiency and
liberalisation.
Source: Compiled and summarised by the author
110
Chapter 4: Methodology
4.1 Introduction
The objective of this thesis is to investigate the performance of Vietnamese commercial
banks and identify possible impacts of the country‘s entry into the WTO on bank
performance. Hence, it is important to identify reliable measures of bank performance
aimed at identifying which banks or bank groups have performed better than others. In
the literature on banking operations two methods have been used to quantify bank
performance: the financial ratio method and the production frontier method (Das and
Ghosh, 2006; Hughes and Mester, 2008). The financial ratio method is based on
financial profitability using indexes such as return on assets (ROA), return on equity
(ROE) and net interest margin (NIM) to measure the extent to which output (as
measured by profit, revenue and cost) is generated from one unit of input (as measured
by total assets, number of employees and deposits). However, this method has a number
of disadvantages:
(1) it is strongly influenced by accounting practices within each bank47
; and
(2) it is a unilateral measure because only one input and one output variable are
considered for each ratio.
Moreover, using different financial ratios to compare the performance of different banks
may bring about conflicting results. For example, bank A may be better than bank B
when using ROA but the result could be reversed in the case of NIM. Consequently, the
47 The frontier-based method is less influenced by accounting practices within individual banks because
this method is based on accounting data for the whole banking system (Hughes and Mester, 2008).
111
production frontier method, which employs many inputs and many outputs to measure
bank performance, is preferable and is the approach used in this study.
There are two methods widely used to estimate production frontiers: stochastic frontier
analysis (SFA) and data envelopment analysis (DEA) (Kenjegalieva et al., 2009; Fethi
and Pasiouras, 2010). The SFA approach assumes a given form of the production
function showing the relationship between inputs and output before estimation of the
parameters is conducted (Coelli et al., 2005; Kumbhakar and Wang, 2007). Then the
estimated production functions are used to measure the efficiency scores of firms. The
other method, DEA, which is based on linear programming, is used in the literature to
build a piecewise production frontier that acts as a benchmark for measuring relative
efficiency. In this thesis, DEA is employed mainly because this method can be utilised
with a small sample size and allows for multiple outputs while only one output is
allowed in SFA models48
(Coelli et al., 2005). In the banking sector, banks provide
numerous services to customers and generate many outputs and therefore DEA can be
seen to be the more suitable method.
Vietnam is an interesting case study as it is one of the few transition economies where
the banking sector is still dominated by state-owned commercial banks (SOCBs). In
contrast, transforming to a competitive and privately-controlled banking sector has been
implemented in most other transition countries (Bonin and Schnabel, 2011). This
difference in approaches to reform financial sectors can be explained by the different
policies adopted. If governments conduct consistent reform measures to construct a
48Due to the fact that SFA is based on regression techniques and so only one output can be employed as
the dependent variable while a set of inputs play the role of independent variables. This issue can be
solved by using specific statistical techniques, for example, Ruggiero (1998) utilised canonical correlation
analysis to measure technical efficiency for multi output production correspondences.
112
competitive and fair49
business environment for banks, private banks with profit-based
incentives can be expected to perform better than their publicly owned counterparts and
play a more substantial role in the banking sector. By contrast, governments desiring to
maintain control and exert influence over the banking sector for political purposes
would implement supportive measures for SOCBs and discriminate against domestic
and foreign private banks (Karas et al., 2010; Vernikov, 2012). The consequence of this
is that a level and homogenous business environment for SOCB and private bank
groups is not present. It is, therefore, necessary to take the heterogeneity of the business
environment into account when measuring and analysing bank performance, and this is
obviously required in the case of Vietnam. Thus, in this study, a meta-frontier analysis,
as proposed by Battese and Rao (2002), Battese et al. (2004) and O‘Donnell et al.
(2008) is adopted which is a production frontier approach that can separate bank groups
by ownership to measure their efficiency and allow environmental variables to be
regressed against each group‘s efficiency.
Using a meta-frontier approach is more advantageous than using a conventional single
frontier approach. This is due to the fact that the latter sees all firms as having the same
technology set and that they are homogeneous across different groups. However, this is
not the case in the context of Vietnam where the business environment is heterogeneous
due to the discriminatory policies implemented by the state. Furthermore, only a meta-
frontier approach can examine which group of firms is technically more advanced
relative to the others via utilising the so-called technology gap ratio criteria.
The rest of this chapter is structured as follows: Section 4.2 provides a definition of, and
conditions necessary to use, a meta-frontier analysis approach; Section 4.3 explains how
49 The term ―fair‖ as used here refers to ―non-discrimination‖ between different bank ownership types.
113
the DEA efficiency scores of individual firms (banks) and firm (bank) groups used in
this study are estimated and regressed against a set of explanatory variables. In addition,
the bootstrap-based method is introduced in this section as a good tool to overcome the
biased nature of DEA estimates as highlighted in Chapter 3; Section 4.4 introduces the
Li (1996) test which will be used to investigate the equality of efficiency distributions;
Section 4.5 presents a measure of total factor productivity, the so-called Aggregate
Malmquist Productivity Index (AMPI), which is constructed based on an extension of
the concept of aggregate technical efficiency; and finally, Section 4.6 summarises the
key findings from this chapter.
4.2 A proposed methodology – Meta-frontier analysis
O‘Donnell et al. (2008) states that ―firms in different industries, regions and/or
countries face different production opportunities. Technically, they make choices from
different sets of feasible input–output combinations. These so-called technology sets
differ because of differences in available stocks of physical, human and financial capital
(e.g., type of machinery, size and quality of the labour force, access to foreign
exchange), economic infrastructure (e.g., number of ports, access to markets), resource
endowments (e.g., quality of soils, climate, energy resources) and any other
characteristics of the physical, social and economic environment in which production
takes place.‖ The authors highlight the impact of the operating environment on firm
efficiency and conclude that ―such differences have led efficiency researchers to
estimate separate production frontiers for different groups of firms‖ (O‘Donnell et al.,
2008, p.231-232).
114
The efficiency of firms within such groups can be measured by comparing them to the
best practice performance firms which construct each group‘s frontier. Nonetheless,
there is still a question of how best to measure the relative efficiency of firms across
groups. Based on the concept of a meta-production function50
, a meta-frontier is
estimated by enveloping all group frontiers. Thus, the technical efficiency of firms
belonging to different groups can be compared by using the distances of these firms
from the meta-frontier.
As mentioned in Section 4.1, Vietnamese banks that have different ownership forms
operate in different business environments due to discriminatory government policies.
The discriminatory policies applied to particular bank groups can result in differences of
production technology as the mechanism producing outputs from relevant inputs
(O‘Donnell et al., 2008). For example, under given inputs such as labour and fixed
assets, public banks can attract more saving deposits than their private counterparts
because the former is believed to be more credible due to the guarantee of solvency by
the state. Hence, a meta-frontier analysis that allows for different technology sets in
measuring the efficiency of different groups is employed in this thesis to measure and
analyse bank performance in and across different bank ownership groups.
4.2.1 The meta-frontier
In general terms, this research considers an industry consisting of n firms. Each firm
employs p inputs to produce q outputs. Let
denote a (1×p) vector of inputs and
50Hayami and Ruttan (1970) conceptualised the meta-production function as the envelope of commonly
conceived neoclassical production functions.
115
denote a (1×q) vector of outputs. Under a given technology, following
O‘Donnell et al. (2008) the production set of the industry can be defined by:
*( )
+ (4.1)
The production set is built using two components: boundary and interior. The
production boundary (or meta-frontier) is identified by the best practice firms or
efficient firms. It is convenient to represent technology using the output-oriented51
distance function and the technical efficiency of firm k as being equal to:
( ) * ( ⁄ ) + ( ) (4.2)
If the value of the distance function is equal to unity ( ( ) ), firms are
located on the boundary and considered technically efficient. If the value is not equal to
unity they are inside the production interior ( ( ) ) and are relatively
inefficient.
4.2.2 Group frontiers
The industry can be classified into L groups operating under L different group-specific
technologies. These sub-technologies can be characterised by the following group-
specific production sets and group output distance functions:
{( )
} (4.3)
51 Whether to use the input or output orientation depends on a firm‘s objectives (Coelli et al., 2005). In
the context of the Vietnamese banking sector in the post-WTO period, banks rapidly expanded their
services and customer base under the expansionary monetary policy of the SBV to stimulate economic
growth (Pincus, 2009; WB, 2009; WB, 2012). Banks focused on maximising their outputs (loans) rather
than minimising inputs (which are labour and fixed assets). Thus, in this thesis, output-oriented models
are adopted.
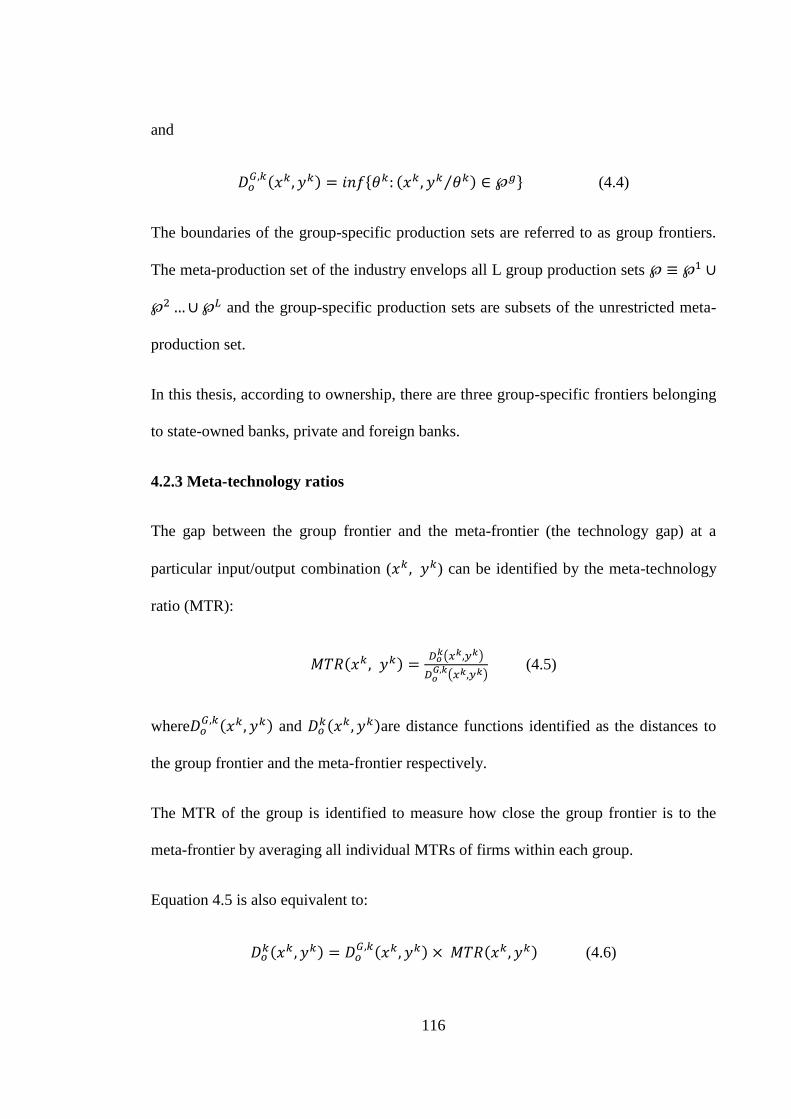
116
and
( ) * ( ⁄ ) + (4.4)
The boundaries of the group-specific production sets are referred to as group frontiers.
The meta-production set of the industry envelops all L group production sets
and the group-specific production sets are subsets of the unrestricted meta-
production set.
In this thesis, according to ownership, there are three group-specific frontiers belonging
to state-owned banks, private and foreign banks.
4.2.3 Meta-technology ratios
The gap between the group frontier and the meta-frontier (the technology gap) at a
particular input/output combination ( ) can be identified by the meta-technology
ratio (MTR):
( )
( )
( )
(4.5)
where ( ) and
( )are distance functions identified as the distances to
the group frontier and the meta-frontier respectively.
The MTR of the group is identified to measure how close the group frontier is to the
meta-frontier by averaging all individual MTRs of firms within each group.
Equation 4.5 is also equivalent to:
( )
( ) ( ) (4.6)
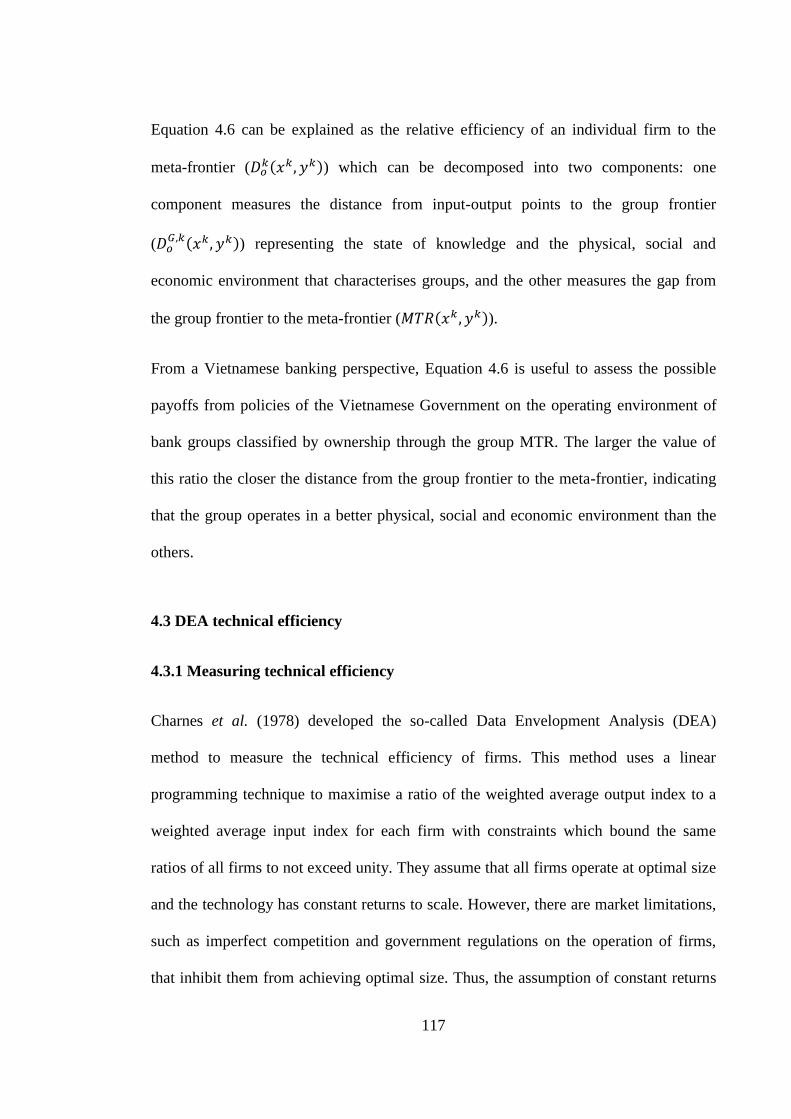
117
Equation 4.6 can be explained as the relative efficiency of an individual firm to the
meta-frontier ( ( )) which can be decomposed into two components: one
component measures the distance from input-output points to the group frontier
( ( )) representing the state of knowledge and the physical, social and
economic environment that characterises groups, and the other measures the gap from
the group frontier to the meta-frontier ( ( )).
From a Vietnamese banking perspective, Equation 4.6 is useful to assess the possible
payoffs from policies of the Vietnamese Government on the operating environment of
bank groups classified by ownership through the group MTR. The larger the value of
this ratio the closer the distance from the group frontier to the meta-frontier, indicating
that the group operates in a better physical, social and economic environment than the
others.
4.3 DEA technical efficiency
4.3.1 Measuring technical efficiency
Charnes et al. (1978) developed the so-called Data Envelopment Analysis (DEA)
method to measure the technical efficiency of firms. This method uses a linear
programming technique to maximise a ratio of the weighted average output index to a
weighted average input index for each firm with constraints which bound the same
ratios of all firms to not exceed unity. They assume that all firms operate at optimal size
and the technology has constant returns to scale. However, there are market limitations,
such as imperfect competition and government regulations on the operation of firms,
that inhibit them from achieving optimal size. Thus, the assumption of constant returns
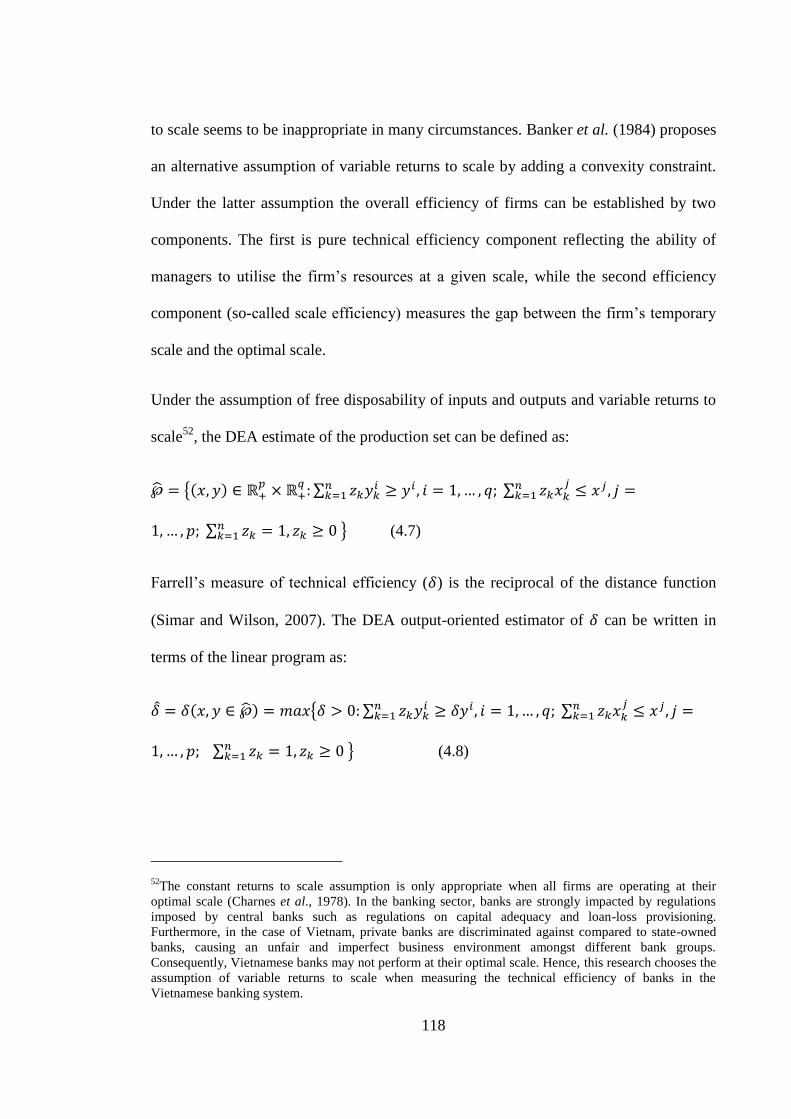
118
to scale seems to be inappropriate in many circumstances. Banker et al. (1984) proposes
an alternative assumption of variable returns to scale by adding a convexity constraint.
Under the latter assumption the overall efficiency of firms can be established by two
components. The first is pure technical efficiency component reflecting the ability of
managers to utilise the firm‘s resources at a given scale, while the second efficiency
component (so-called scale efficiency) measures the gap between the firm‘s temporary
scale and the optimal scale.
Under the assumption of free disposability of inputs and outputs and variable returns to
scale52
, the DEA estimate of the production set can be defined as:
{( )
∑
∑
∑ } (4.7)
Farrell‘s measure of technical efficiency ( ) is the reciprocal of the distance function
(Simar and Wilson, 2007). The DEA output-oriented estimator of can be written in
terms of the linear program as:
( ) { ∑
∑
∑ } (4.8)
52The constant returns to scale assumption is only appropriate when all firms are operating at their
optimal scale (Charnes et al., 1978). In the banking sector, banks are strongly impacted by regulations
imposed by central banks such as regulations on capital adequacy and loan-loss provisioning.
Furthermore, in the case of Vietnam, private banks are discriminated against compared to state-owned
banks, causing an unfair and imperfect business environment amongst different bank groups.
Consequently, Vietnamese banks may not perform at their optimal scale. Hence, this research chooses the
assumption of variable returns to scale when measuring the technical efficiency of banks in the
Vietnamese banking system.
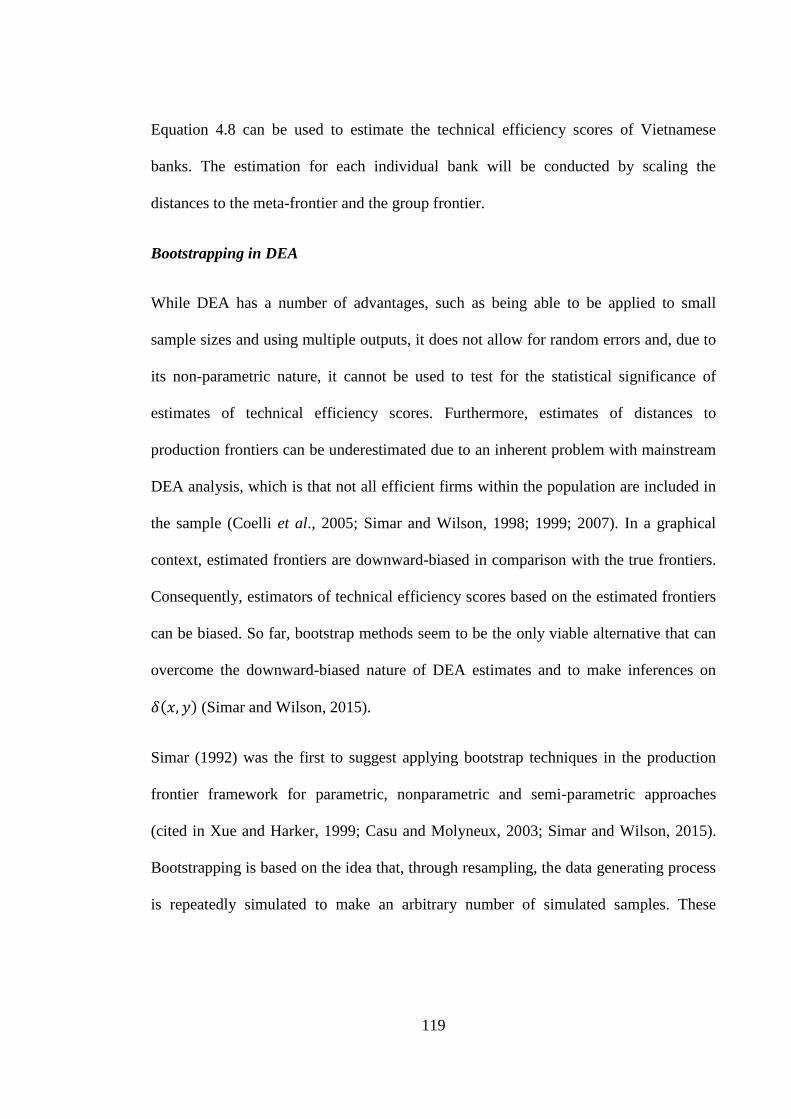
119
Equation 4.8 can be used to estimate the technical efficiency scores of Vietnamese
banks. The estimation for each individual bank will be conducted by scaling the
distances to the meta-frontier and the group frontier.
Bootstrapping in DEA
While DEA has a number of advantages, such as being able to be applied to small
sample sizes and using multiple outputs, it does not allow for random errors and, due to
its non-parametric nature, it cannot be used to test for the statistical significance of
estimates of technical efficiency scores. Furthermore, estimates of distances to
production frontiers can be underestimated due to an inherent problem with mainstream
DEA analysis, which is that not all efficient firms within the population are included in
the sample (Coelli et al., 2005; Simar and Wilson, 1998; 1999; 2007). In a graphical
context, estimated frontiers are downward-biased in comparison with the true frontiers.
Consequently, estimators of technical efficiency scores based on the estimated frontiers
can be biased. So far, bootstrap methods seem to be the only viable alternative that can
overcome the downward-biased nature of DEA estimates and to make inferences on
( ) (Simar and Wilson, 2015).
Simar (1992) was the first to suggest applying bootstrap techniques in the production
frontier framework for parametric, nonparametric and semi-parametric approaches
(cited in Xue and Harker, 1999; Casu and Molyneux, 2003; Simar and Wilson, 2015).
Bootstrapping is based on the idea that, through resampling, the data generating process
is repeatedly simulated to make an arbitrary number of simulated samples. These
120
samples can then be utilised to generate simulated estimates53
. The known bootstrap
distribution of the resulting estimates will mimic the unknown sampling distribution of
the original estimator (Simar and Wilson, 1998). Based on the simulated estimates we
can derive bias-corrected estimators as well as confidence intervals for the true technical
efficiency.
In the next part of this chapter, two bootstrap methods will be presented. First, sub-
sampling bootstrapping will be applied to find confidence intervals for group technical
efficiency. Second, parametric bootstrapping will be used to determine the statistical
properties of coefficients in a double-bootstrap two-stage DEA procedure.
4.3.2 Measuring group technical efficiency
Many studies have applied the simple average method to estimate and compare group
efficiency scores and, based on this, they may conclude that one group is more efficient
than others (Das and Ghosh, 2006; Ataullah and Le, 2006; Denizer et al., 2007; Sufian
and Habibullah, 2011). Their conclusion, however, introduces two issues. First, they
ignore the relative importance of particular firms in each group as all firms are deemed
to be the same. Second, they use point estimates for group efficiency scores to compare
between different groups. Hence, it is possible to make inference errors (Simar and
Zelenyuk, 2007).
The first issue will be addressed by the weighted average method if the weight of each
firm in each group is appropriately identified. Based on the theory of economic
optimisation, Färe and Zelenyuk (2003) propose that industry efficiency is the average
53 In this thesis linear programming is used to generate bootstrap efficiency scores from simulated
input/output data.
121
of the efficiency of individual firms with the weight equal to their cost or revenue shares
in the industry.54
Their theorem is that ―an industry maximum revenue is the sum of its
firms‘ maximal revenues‖ (Färe and Zelenyuk, 2003, p.615). This theorem is adapted in
the context of groups by Simar and Zelenyuk (2007) and becomes ―the maximal
revenue of the groups of firms is equal to the sum of the maximal revenue of all its
member firms‖ (Simar and Zelenyuk, 2007, p.1371). The new theorem can be used to
acquire several important results for efficiency aggregating. The first is that the revenue
efficiency of a group is equal to the weighted sum of individual firm revenue efficiency
where the weight is the revenue share of firms in the group. The second is that the
aggregate technical efficiency of a group is equal to the weighted sum of the firm
technical efficiency (where the weight is that of revenue shares).
As mentioned above, bootstrap methods can be used to make a statistical inference of a
firm‘s technical efficiency. Accordingly, the second issue can also be circumvented if
these methods are applied in the context of groups and can provide confidence intervals
for aggregate technical efficiency. The following presents the algorithm proposed by
Simar and Zelenyuk (2007) to measure bias-corrected aggregate efficiency scores of
groups using subsampling bootstrapping in a DEA context. Kneip et al. (2003) offer the
subsampling bootstrap technique55
for DEA which has proven to be consistent, simple
and faster to compute than others.
This thesis first utilises the method of aggregating technical efficiency by Simar and
Zelenyuk (2007) to measure and compare the performance of different bank ownership
54 This thesis applies revenue shares.
55 Subsampling bootstrapping is a bootstrap technique of generating subsamples by replacement from an
original sample (for any subsamples that have a smaller size than the original sample).
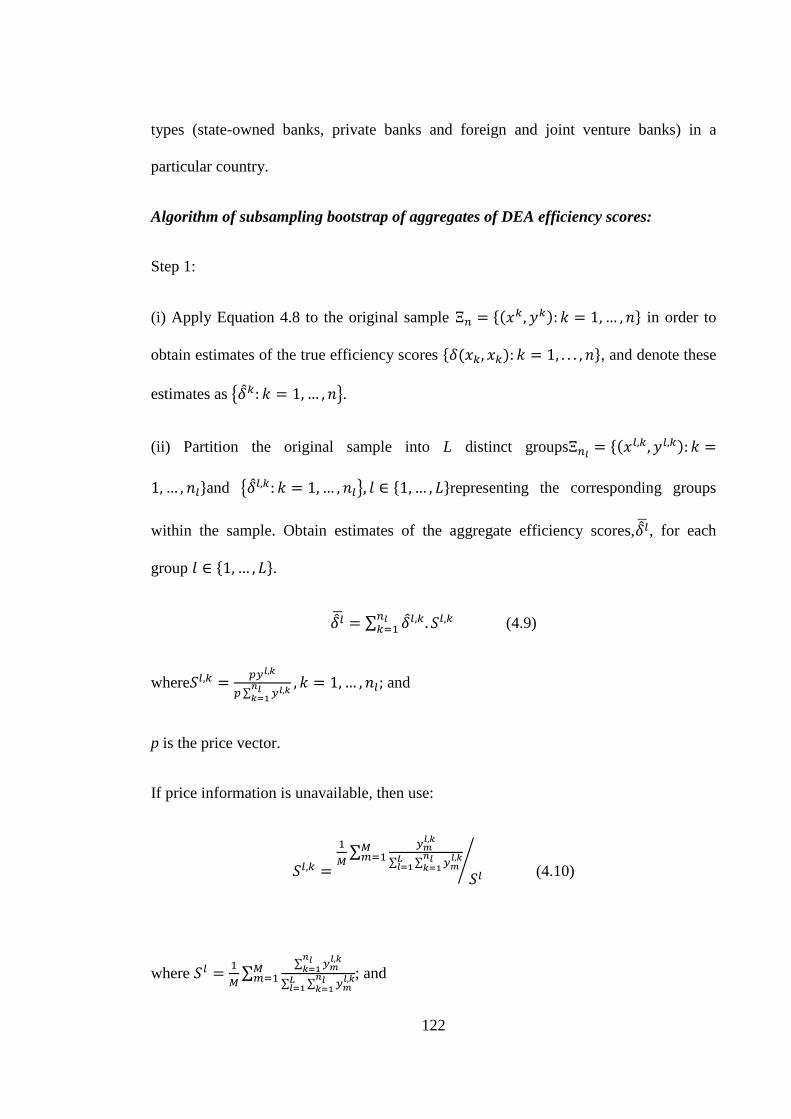
122
types (state-owned banks, private banks and foreign and joint venture banks) in a
particular country.
Algorithm of subsampling bootstrap of aggregates of DEA efficiency scores:
Step 1:
(i) Apply Equation 4.8 to the original sample *( ) + in order to
obtain estimates of the true efficiency scores * ( ) +, and denote these
estimates as { }.
(ii) Partition the original sample into L distinct groups *( )
+and { } * +representing the corresponding groups
within the sample. Obtain estimates of the aggregate efficiency scores, , for each
group * +.
∑ (4.9)
where
∑
and
p is the price vector.
If price information is unavailable, then use:
∑
∑ ∑
⁄ (4.10)
where
∑
∑
∑ ∑
; and
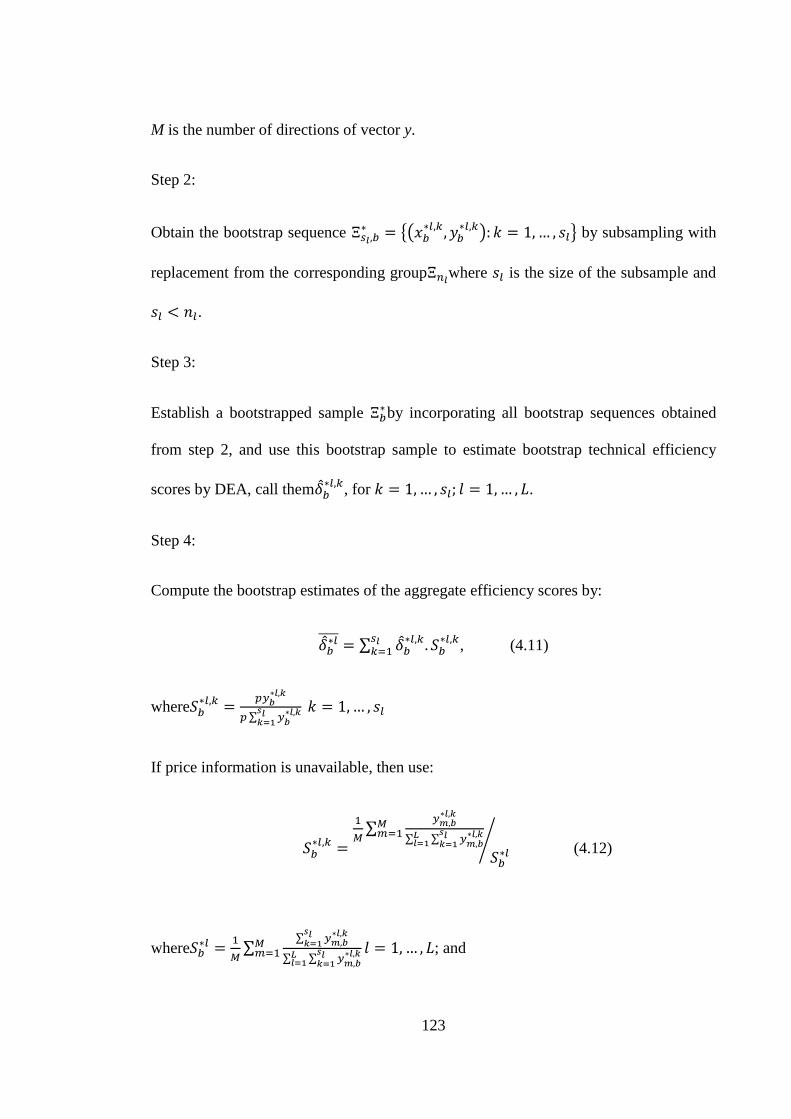
123
M is the number of directions of vector y.
Step 2:
Obtain the bootstrap sequence {(
) } by subsampling with
replacement from the corresponding group where is the size of the subsample and
.
Step 3:
Establish a bootstrapped sample by incorporating all bootstrap sequences obtained
from step 2, and use this bootstrap sample to estimate bootstrap technical efficiency
scores by DEA, call them
, for .
Step 4:
Compute the bootstrap estimates of the aggregate efficiency scores by:
∑
, (4.11)
where
∑
If price information is unavailable, then use:
∑
∑ ∑
⁄ (4.12)
where
∑
∑
∑ ∑
; and
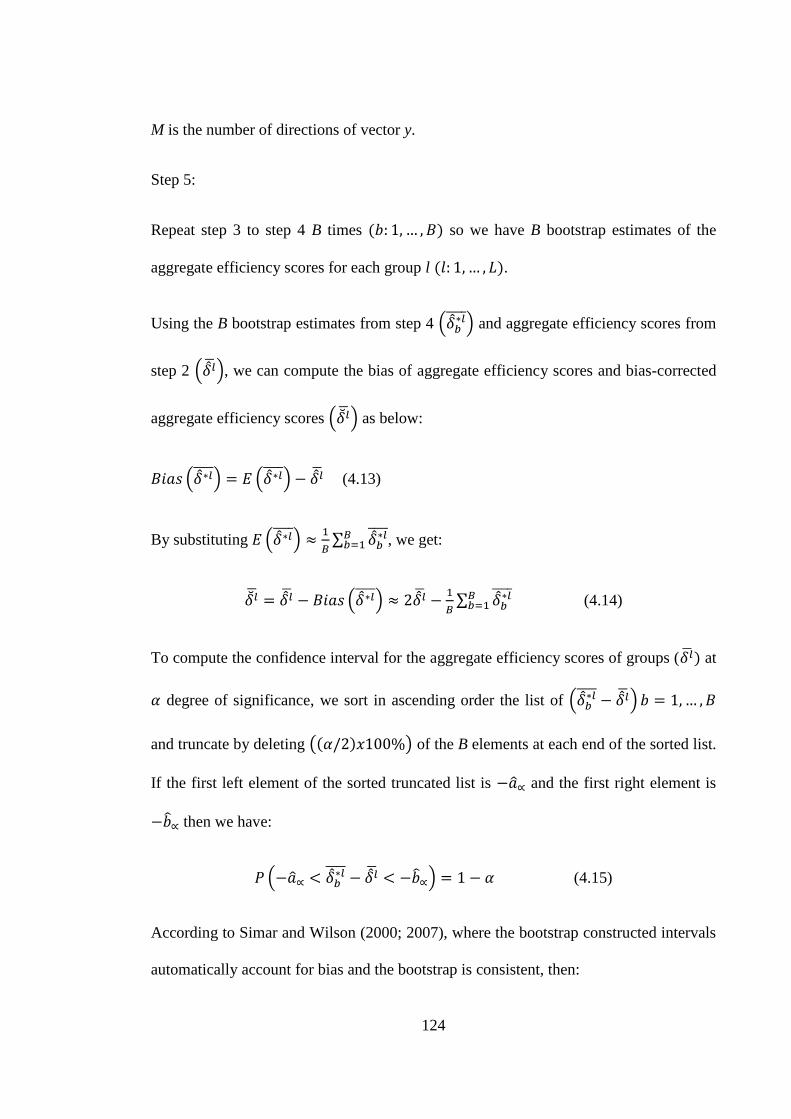
124
M is the number of directions of vector y.
Step 5:
Repeat step 3 to step 4 B times ( ) so we have B bootstrap estimates of the
aggregate efficiency scores for each group l ( ).
Using the B bootstrap estimates from step 4 . / and aggregate efficiency scores from
step 2 . /, we can compute the bias of aggregate efficiency scores and bias-corrected
aggregate efficiency scores . / as below:
. / . / (4.13)
By substituting . /
∑
, we get:
. /
∑
(4.14)
To compute the confidence interval for the aggregate efficiency scores of groups ( ) at
degree of significance, we sort in ascending order the list of . /
and truncate by deleting (( ) ) of the B elements at each end of the sorted list.
If the first left element of the sorted truncated list is and the first right element is
then we have:
. / (4.15)
According to Simar and Wilson (2000; 2007), where the bootstrap constructed intervals
automatically account for bias and the bootstrap is consistent, then:
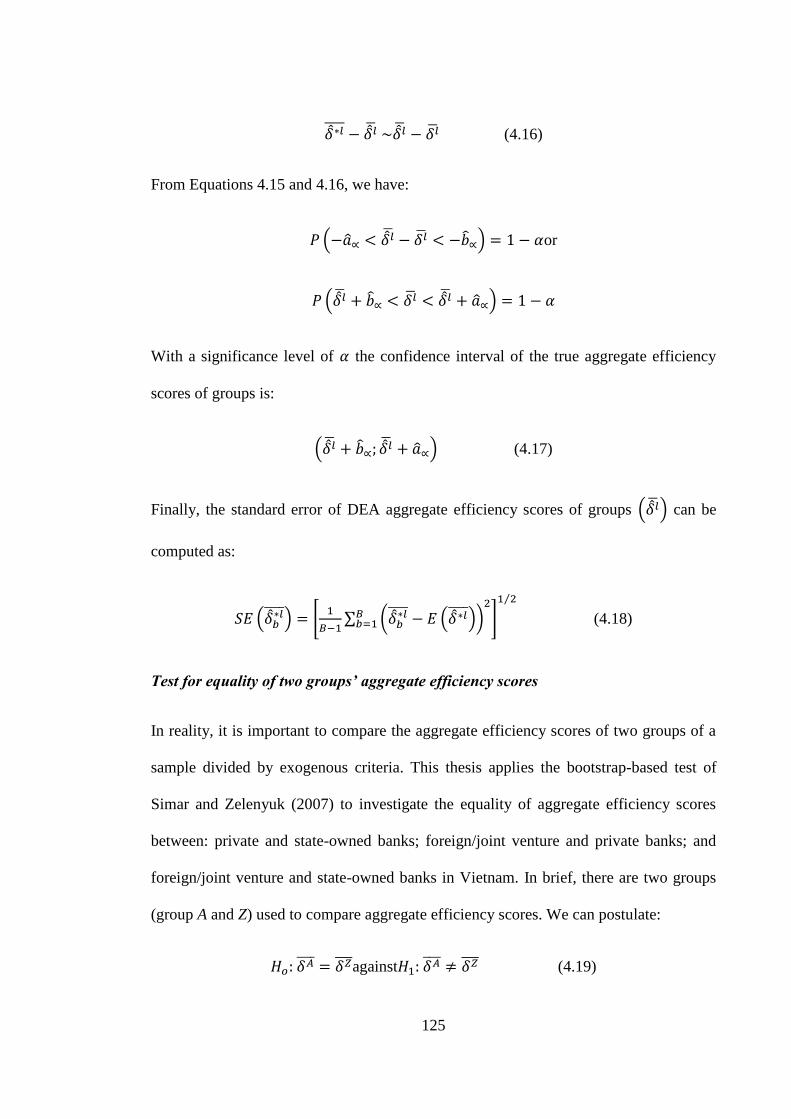
125
(4.16)
From Equations 4.15 and 4.16, we have:
. / or
. /
With a significance level of the confidence interval of the true aggregate efficiency
scores of groups is:
. / (4.17)
Finally, the standard error of DEA aggregate efficiency scores of groups . / can be
computed as:
. / 6
∑ (
. /)
7
⁄
(4.18)
Test for equality of two groups’ aggregate efficiency scores
In reality, it is important to compare the aggregate efficiency scores of two groups of a
sample divided by exogenous criteria. This thesis applies the bootstrap-based test of
Simar and Zelenyuk (2007) to investigate the equality of aggregate efficiency scores
between: private and state-owned banks; foreign/joint venture and private banks; and
foreign/joint venture and state-owned banks in Vietnam. In brief, there are two groups
(group A and Z) used to compare aggregate efficiency scores. We can postulate:
against (4.19)
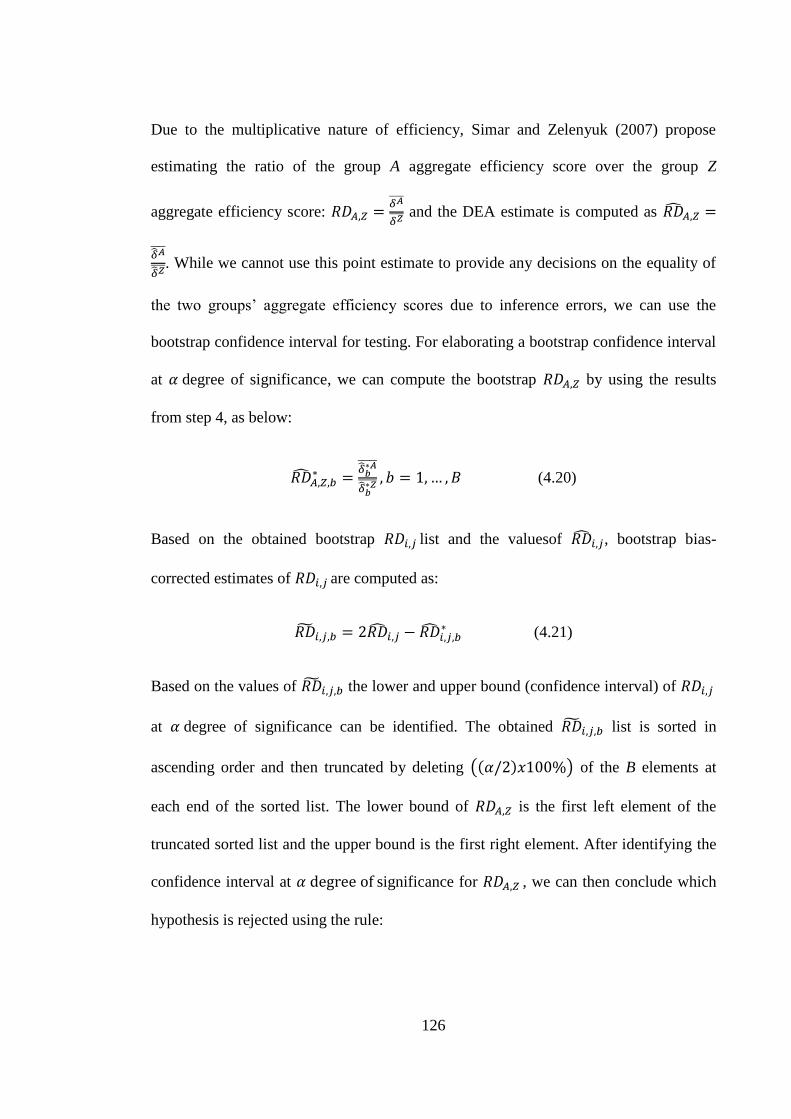
126
Due to the multiplicative nature of efficiency, Simar and Zelenyuk (2007) propose
estimating the ratio of the group A aggregate efficiency score over the group Z
aggregate efficiency score:
and the DEA estimate is computed as
. While we cannot use this point estimate to provide any decisions on the equality of
the two groups‘ aggregate efficiency scores due to inference errors, we can use the
bootstrap confidence interval for testing. For elaborating a bootstrap confidence interval
at degree of significance, we can compute the bootstrap by using the results
from step 4, as below:
(4.20)
Based on the obtained bootstrap list and the valuesof , bootstrap bias-
corrected estimates of are computed as:
(4.21)
Based on the values of the lower and upper bound (confidence interval) of
at degree of significance can be identified. The obtained list is sorted in
ascending order and then truncated by deleting (( ) ) of the B elements at
each end of the sorted list. The lower bound of is the first left element of the
truncated sorted list and the upper bound is the first right element. After identifying the
confidence interval at significance for , we can then conclude which
hypothesis is rejected using the rule:
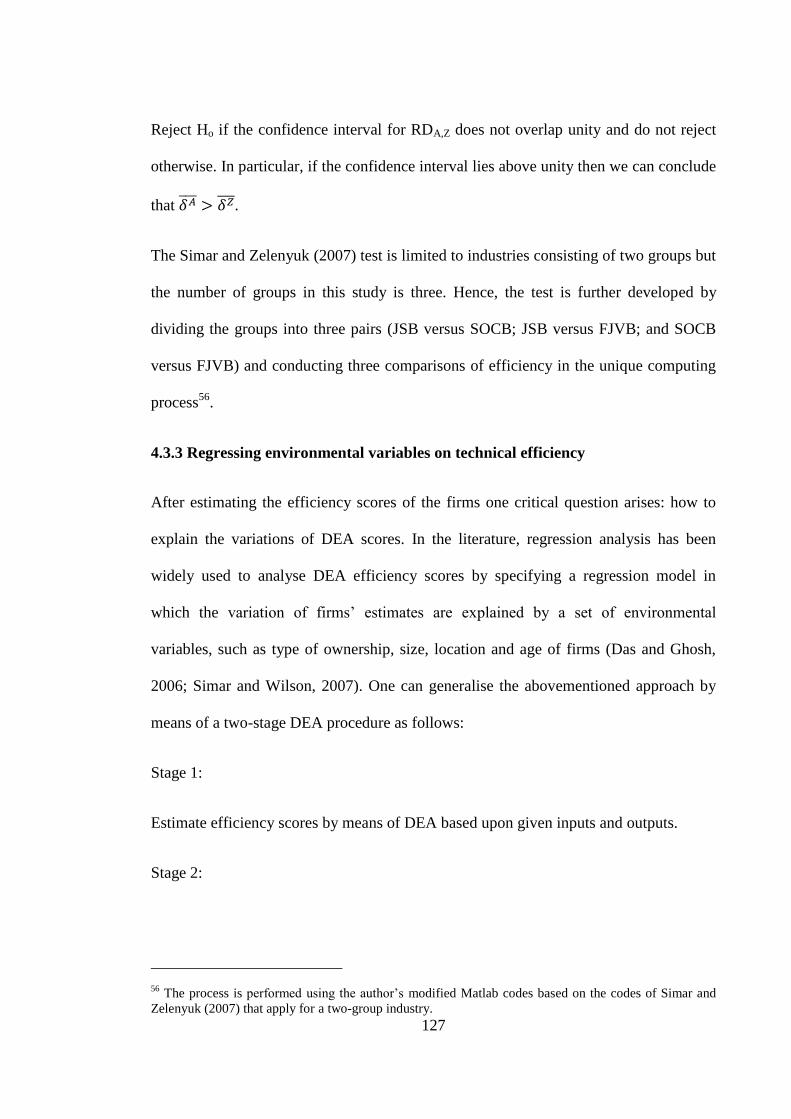
127
Reject Ho if the confidence interval for RDA,Z does not overlap unity and do not reject
otherwise. In particular, if the confidence interval lies above unity then we can conclude
that .
The Simar and Zelenyuk (2007) test is limited to industries consisting of two groups but
the number of groups in this study is three. Hence, the test is further developed by
dividing the groups into three pairs (JSB versus SOCB; JSB versus FJVB; and SOCB
versus FJVB) and conducting three comparisons of efficiency in the unique computing
process56
.
4.3.3 Regressing environmental variables on technical efficiency
After estimating the efficiency scores of the firms one critical question arises: how to
explain the variations of DEA scores. In the literature, regression analysis has been
widely used to analyse DEA efficiency scores by specifying a regression model in
which the variation of firms‘ estimates are explained by a set of environmental
variables, such as type of ownership, size, location and age of firms (Das and Ghosh,
2006; Simar and Wilson, 2007). One can generalise the abovementioned approach by
means of a two-stage DEA procedure as follows:
Stage 1:
Estimate efficiency scores by means of DEA based upon given inputs and outputs.
Stage 2:
56 The process is performed using the author‘s modified Matlab codes based on the codes of Simar and
Zelenyuk (2007) that apply for a two-group industry.
128
Regress the DEA estimates against a group of explanatory variables by a given
regression method (e.g., OLS, Tobit or truncated regression). The results received will
be used to analyse the relationship between the efficiency scores and the explanatory
variables. However, there are some serious problems related to the OLS and Tobit
methods (Simar and Wilson, 2007). The first is that all DEA estimates based on a finite
sample are downward-biased (Simar and Wilson, 1998; Kneipet al., 1998; 2008). This
is because ―best practice‖ observations in the sample are employed to construct the
production frontier rather than true efficient but unobservable observations.
Consequently, coefficients derived from the second stage can also be biased. Secondly,
the DEA methodology ensures that efficiency scores are inherently dependent because
of the calculation process which requires the involvement of all other firms to estimate
the efficiency score of a firm (Xue and Harker, 1999). Bootstrapping is a unique way to
simultaneously solve these two problems. Through bootstrapping, bias-corrected
efficiency scores have been proven to be consistent with the true ones (Kneipet al,
1998; 2008). By employing bias-corrected efficiency scores instead of the DEA
estimates at the regression stage, the coefficients generated are consistent. Bias-
corrected efficiency scores are randomly generated in a bootstrap procedure so that they
are independent and more accurate (Simar and Wilson, 2015). Even when problems
relating to estimated DEA efficiency scores are disentangled, there is some doubt about
what is being estimated in the two-stage approach since no data generating process57
is
described. Simar and Wilson (2007) propose an algorithm based on a double bootstrap
procedure which enables a consistent inference in the second stage of regression. Before
Simar and Wilson (2007), there were no studies describing the underlying data
57 Based on assumptions given by the authors, a data generating process describes how data, including
inputs, outputs and environmental variables, are generated and how they interact.
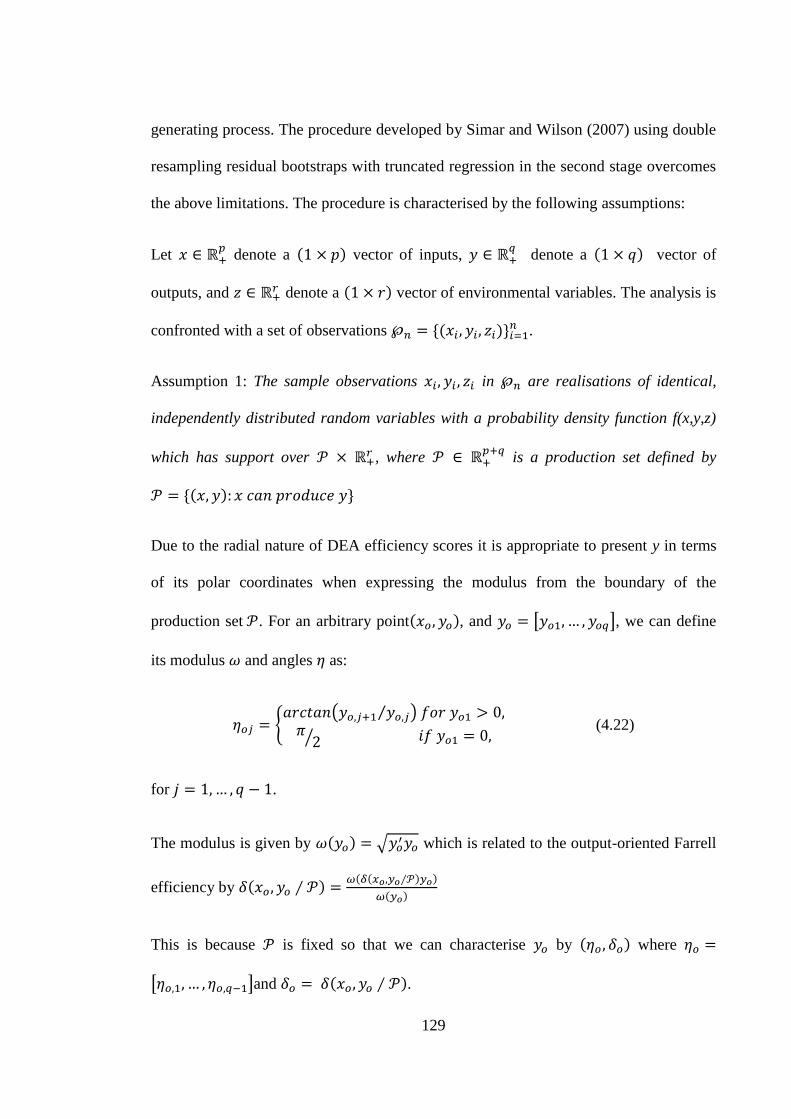
129
generating process. The procedure developed by Simar and Wilson (2007) using double
resampling residual bootstraps with truncated regression in the second stage overcomes
the above limitations. The procedure is characterised by the following assumptions:
Let
denote a ( ) vector of inputs,
denote a ( ) vector of
outputs, and denote a ( ) vector of environmental variables. The analysis is
confronted with a set of observations *( )+ .
Assumption 1: The sample observations in are realisations of identical,
independently distributed random variables with a probability density function f(x,y,z)
which has support over , where
is a production set defined by
*( ) +
Due to the radial nature of DEA efficiency scores it is appropriate to present y in terms
of its polar coordinates when expressing the modulus from the boundary of the
production set . For an arbitrary point( ), and [ ], we can define
its modulus and angles as:
8 ( ⁄ )
⁄
(4.22)
for .
The modulus is given by ( ) √ which is related to the output-oriented Farrell
efficiency by ( ) ( ( ) )
( )
This is because is fixed so that we can characterise by ( ) where
[ ]and ( ).
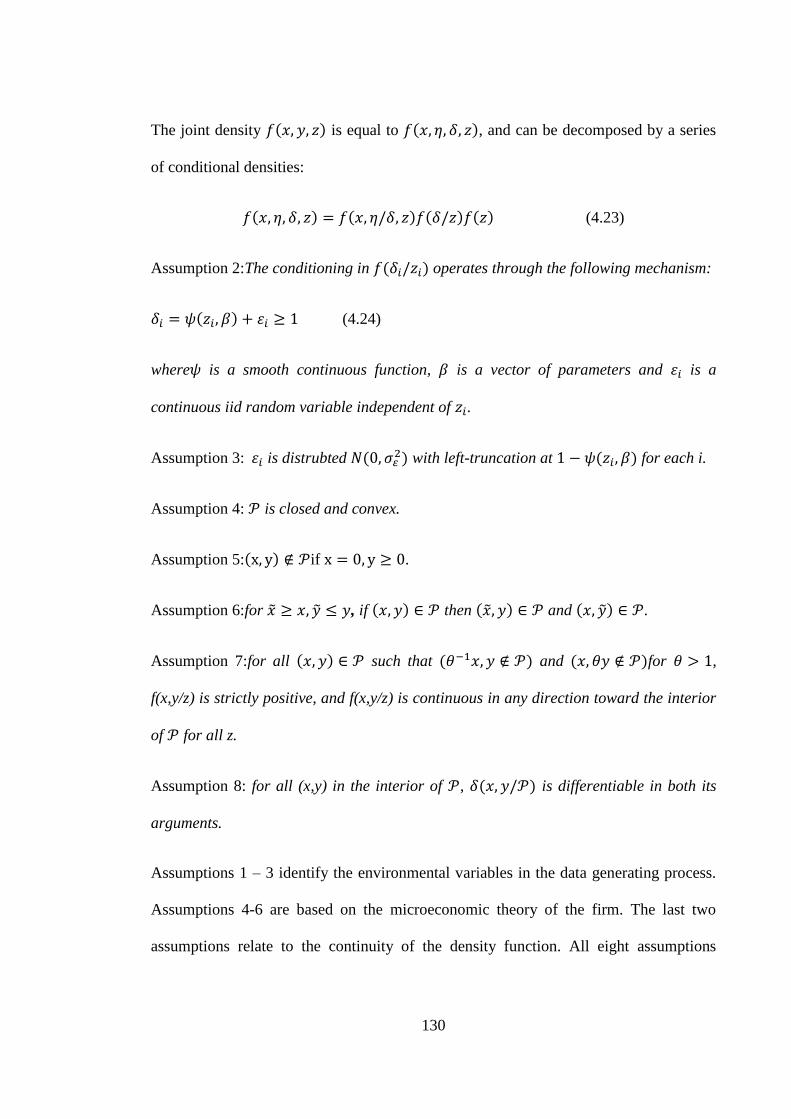
130
The joint density ( ) is equal to ( ), and can be decomposed by a series
of conditional densities:
( ) ( ) ( ) ( ) (4.23)
Assumption 2:The conditioning in ( ) operates through the following mechanism:
( ) (4.24)
where is a smooth continuous function, is a vector of parameters and is a
continuous iid random variable independent of .
Assumption 3: is distrubted ( ) with left-truncation at ( ) for each i.
Assumption 4: is closed and convex.
Assumption 5:( ) if .
Assumption 6:for , if ( ) then ( ) and ( ) .
Assumption 7:for all ( ) such that ( ) and ( )for ,
f(x,y/z) is strictly positive, and f(x,y/z) is continuous in any direction toward the interior
of for all z.
Assumption 8: for all (x,y) in the interior of , ( ) is differentiable in both its
arguments.
Assumptions 1 – 3 identify the environmental variables in the data generating process.
Assumptions 4-6 are based on the microeconomic theory of the firm. The last two
assumptions relate to the continuity of the density function. All eight assumptions
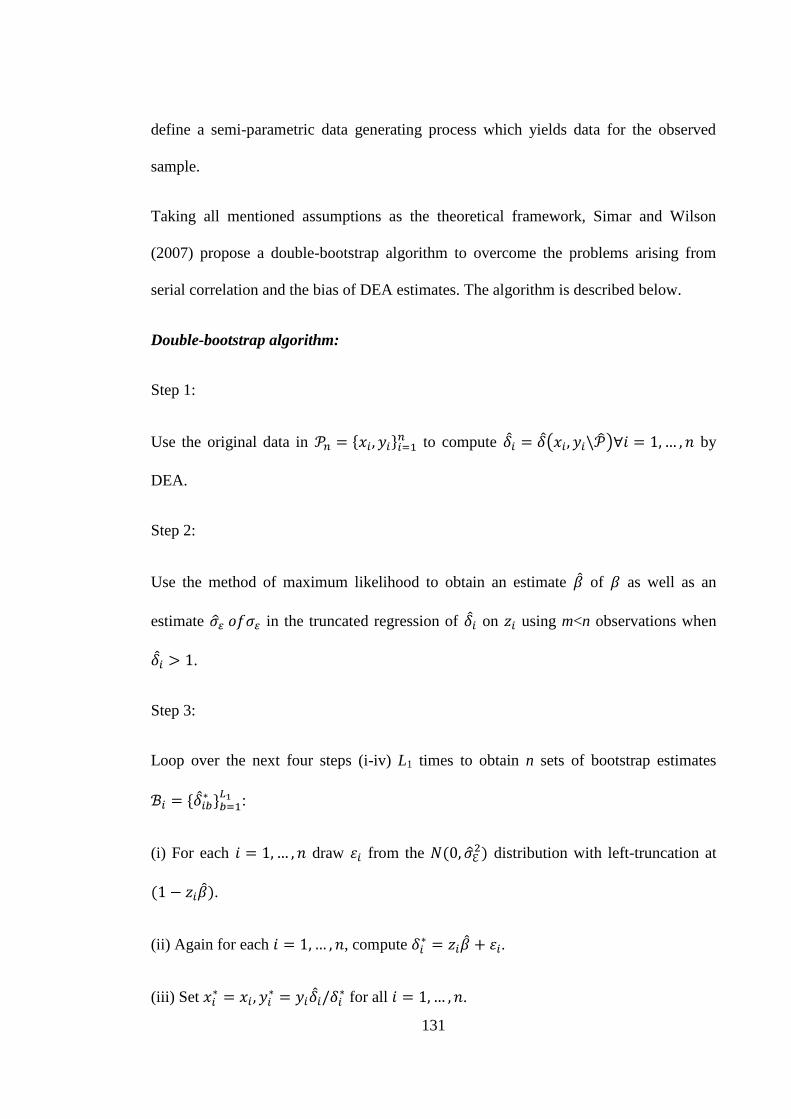
131
define a semi-parametric data generating process which yields data for the observed
sample.
Taking all mentioned assumptions as the theoretical framework, Simar and Wilson
(2007) propose a double-bootstrap algorithm to overcome the problems arising from
serial correlation and the bias of DEA estimates. The algorithm is described below.
Double-bootstrap algorithm:
Step 1:
Use the original data in * + to compute ( ) by
DEA.
Step 2:
Use the method of maximum likelihood to obtain an estimate of as well as an
estimate in the truncated regression of on using m<n observations when
.
Step 3:
Loop over the next four steps (i-iv) L1 times to obtain n sets of bootstrap estimates
* +
:
(i) For each draw from the ( ) distribution with left-truncation at
( ).
(ii) Again for each , compute .
(iii) Set
for all .
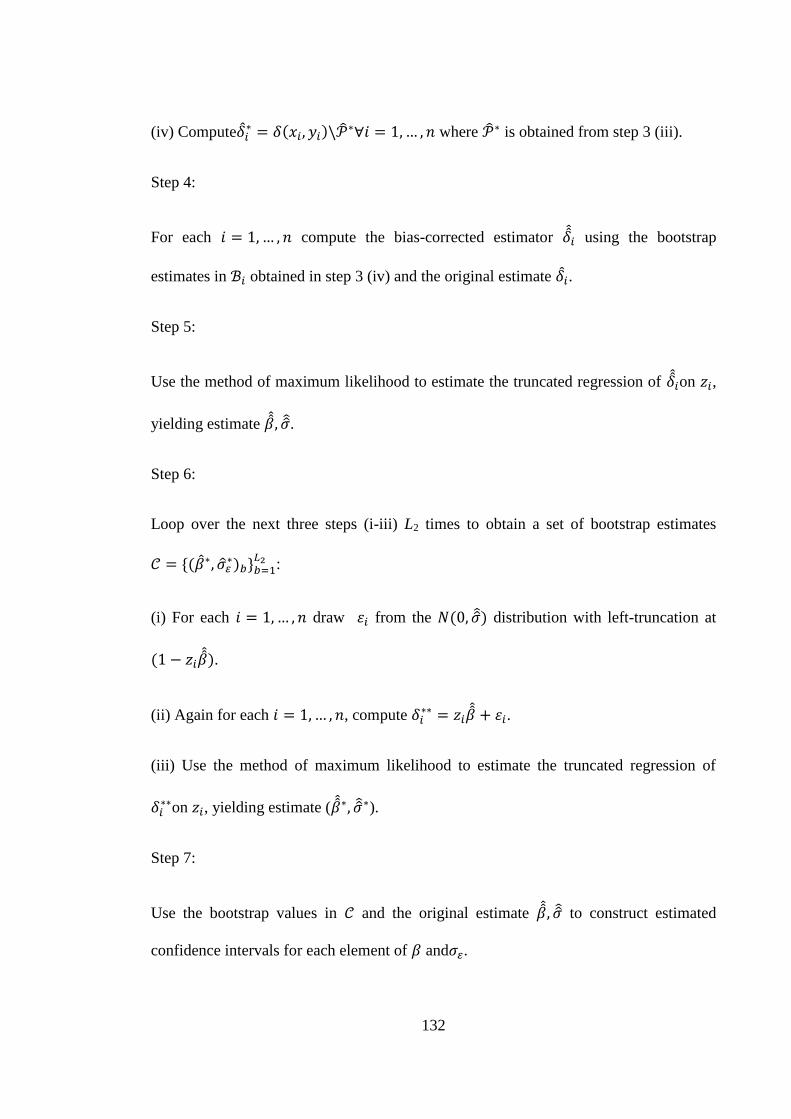
132
(iv) Compute ( )
where is obtained from step 3 (iii).
Step 4:
For each compute the bias-corrected estimator using the bootstrap
estimates in obtained in step 3 (iv) and the original estimate .
Step 5:
Use the method of maximum likelihood to estimate the truncated regression of on ,
yielding estimate .
Step 6:
Loop over the next three steps (i-iii) L2 times to obtain a set of bootstrap estimates
*( ) +
:
(i) For each draw from the ( ) distribution with left-truncation at
( ).
(ii) Again for each , compute .
(iii) Use the method of maximum likelihood to estimate the truncated regression of
on , yielding estimate ( ).
Step 7:
Use the bootstrap values in and the original estimate to construct estimated
confidence intervals for each element of and .
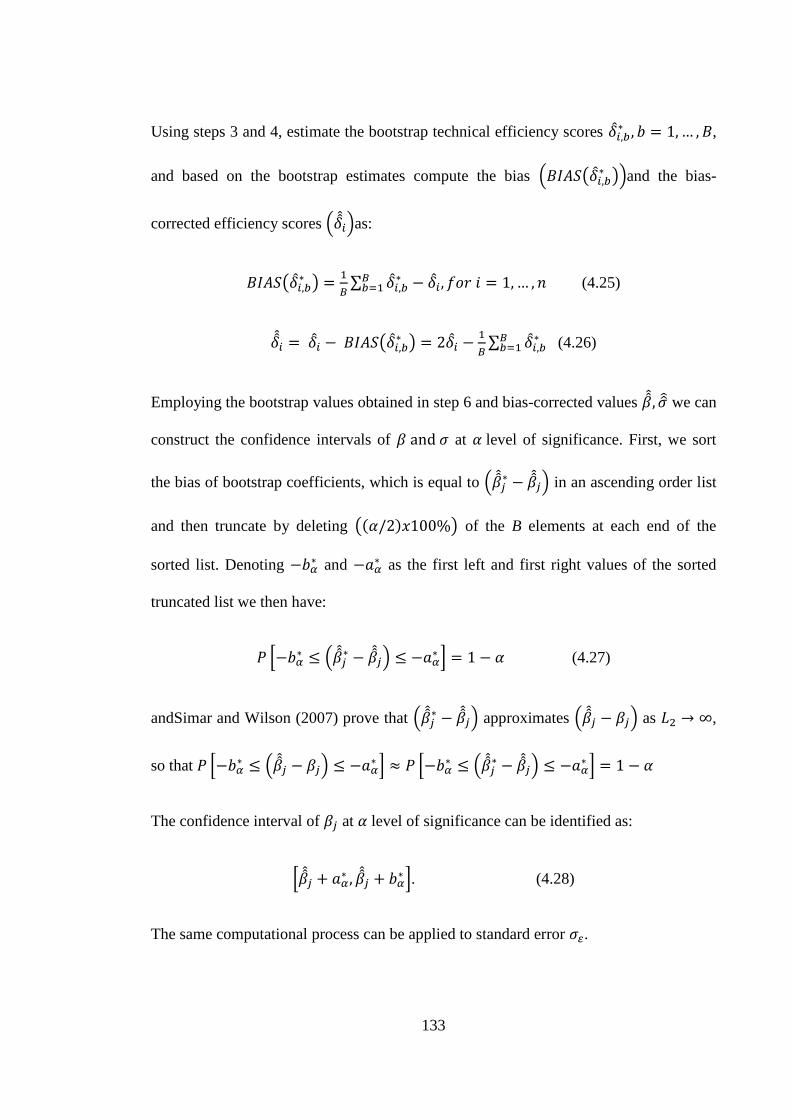
133
Using steps 3 and 4, estimate the bootstrap technical efficiency scores ,
and based on the bootstrap estimates compute the bias . ( )/and the bias-
corrected efficiency scores . /as:
( )
∑
(4.25)
( )
∑
(4.26)
Employing the bootstrap values obtained in step 6 and bias-corrected values we can
construct the confidence intervals of at level of significance. First, we sort
the bias of bootstrap coefficients, which is equal to . / in an ascending order list
and then truncate by deleting (( ) ) of the B elements at each end of the
sorted list. Denoting and
as the first left and first right values of the sorted
truncated list we then have:
0 .
/ 1 (4.27)
andSimar and Wilson (2007) prove that . / approximates . / as ,
so that 0 . /
1 0 .
/ 1
The confidence interval of at level of significance can be identified as:
0
1. (4.28)
The same computational process can be applied to standard error .
134
The simulation requires repeating bootstrap-sampling processes many times in order to
generate bootstrap samples. A critical question emerges of how many replications are
sufficient. In regards to the number of bootstrap replications used to compute the bias-
corrected estimates , Simar and Wilson (2007) found that 100 replications are
typically sufficient. Nonetheless, more information is needed for the bootstrapping
process to estimate confidence intervals so that the number of replications is much
bigger. Hall (1986) suggests 1000 replications for estimating confidence intervals.
Following the works of Simar and Wilson (1998; 1999; 2007), in this thesis, 2000
replications are applied for both bootstrapping processes.
Combining double-bootstrap two-stage DEA with meta-frontier analysis
Ownership is frequently used as an explanatory variable in the literature to explain bank
performance, along with other variables such as bank age and bank asset and
profitability ratios (ROE, ROA, NIM). All earlier studies have considered ownership as
an ex-post factor in regression models (see, for example, Kraft et al., 2006; Das and
Ghosh, 2006; Sturm and Williams, 2004; Denizer et al., 2007; Kumbhakar and Wang,
2007; Berger et al., 2009; Azofra and Santamaria, 2011; Barry et al., 2011; Bertay et
al., 2014; Strobel et al., 2014). These studies analyse the effect of ownership on bank
performance using a two-stage process: first, all banks are pooled to measure their
efficiency; and then bank efficiency is regressed on a set of environmental variables
including ownership. Consequently, the impact of a particular variable on bank
performance is similar regardless of ownership. This approach, however, seems to be
inconsistent if bank ownership types respond differently to the same variable. The
reason for this inconsistency is that bank groups under different ownership models may
operate in environments which differentiate them by regulations, strategy, management
135
objectives and capability of accessing the production frontier. As mentioned in Section
4.1, Vietnamese banks are heterogeneous by ownership so that their performance may
react diversely to the same policy changes or bank characteristics. Thus, it is reasonable
to separate banks by ownership before measuring and regressing bank efficiency against
a set of environmental variables. This can be implemented by combining the double-
bootstrap two-stage DEA with meta-frontier analysis through a three step procedure
suggested by the author of this thesis as below:
(1) Applying the double-bootstrap two-stage DEA for each group we can obtain DEA
estimates and bias-corrected technical efficiency scores. The coefficients are also
obtained reflecting the impact of environmental variables on efficiency within each
group.
(2) A similar procedure is also implemented with the whole sample and equivalent
results are also obtained.
(3) Using Equation 4.5 the meta-technology ratio (MTR) is calculated.
The aforementioned approach, seeing ownership as an ex ante factor, is adopted for the
first time in this thesis in the context of the Vietnamese banking sector. Accordingly,
each explanatory variable will be assessed for its influence on bank efficiency using the
double-bootstrap two-stage DEA method in both the meta-frontier and group-frontier
models.
4.4 Li test for equality of efficiency densities
Kneip et al. (1998) and Simar and Zelenyuk (2003) suppose that, under the same
production set (or technology), all firms are able to access the meta-frontier but have
136
different accessibilities. They explain this issue by identifying different conditions faced
by firms including regulation regime, ownership structure, business environment and
various institutions, pertinent to different groups within the population. Under these
different conditions a problem to consider is that one firm or one firm group may
achieve the production frontier more easily than the others. In terms of the statistical
framework, this problem is similar to the issue covered by Simar and Zelenyuk ―the
different marginal densities that generate technical (in)efficiency might be different
across subgroups, even when they have a common best practice technology‖ (Simar and
Zelenyuk, 2006, p.501). Consequently, investigating whether there is different
accessibility to the frontier amongst various groups is equivalent to testing the
hypothesis that their efficiency densities are different. Simar and Zelenyuk (2006) adapt
the Li test to test this hypothesis.58
This study is the first to employ the bootstrap-Simar-Zelenyuk-adapted Li test to
investigate the disparity of efficiency distributions between public, foreign and private
banks in a particular country, in this case Vietnam. The three bank groups are organised
into pairs to compare their efficiency densities. A brief description of the test is as
follows:
There are two random samples * +and { }, coming
from potentially different distributions characterised at a point xo by the density
functions ( ) and ( ) respectively. Our interest is to test the equality of the
densities of the two samples A and Z. The hypotheses are as below:
58There are several tests used to identify the equality of two unknown densities; however, the Li test is
asymptotically more powerful and computationally simpler. For more detail see Mammen (1992),
Anderson et al. (1994), Li(1996, 1999), and Fan and Ullah (1999).
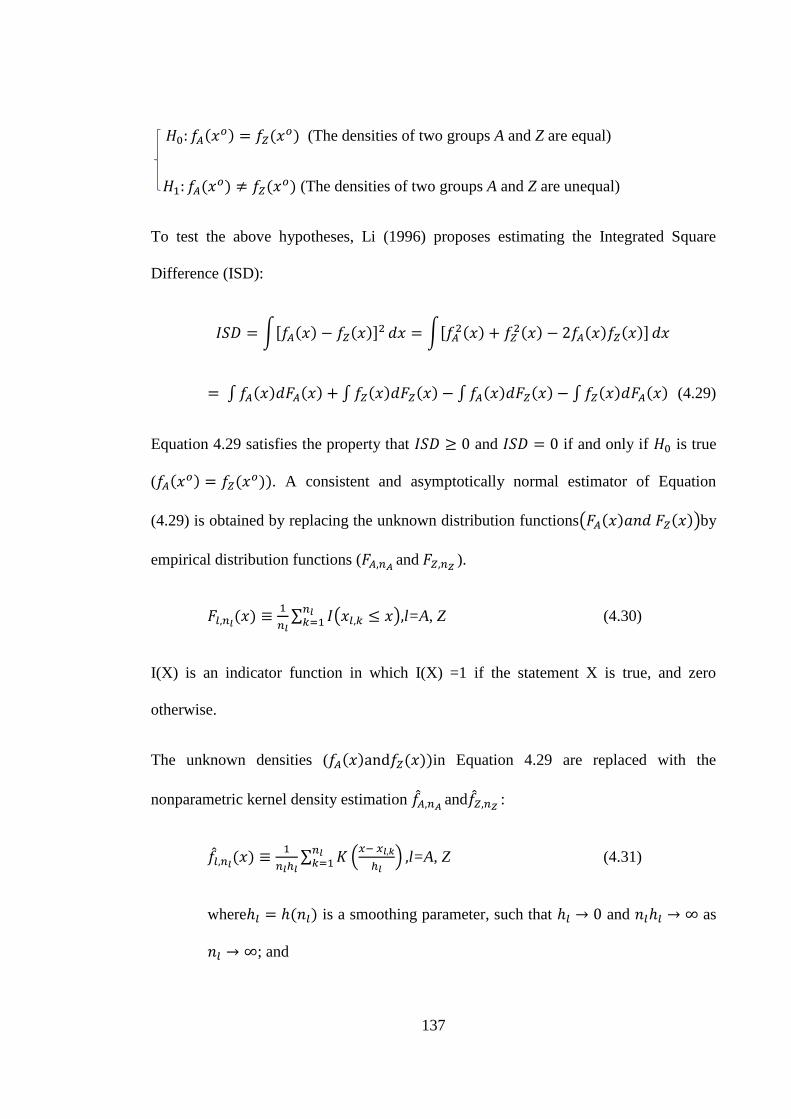
137
( ) ( ) (The densities of two groups A and Z are equal)
( ) ( ) (The densities of two groups A and Z are unequal)
To test the above hypotheses, Li (1996) proposes estimating the Integrated Square
Difference (ISD):
∫, ( ) ( )- ∫, ( )
( ) ( ) ( )-
∫ ( ) ( ) ∫ ( ) ( ) ∫ ( ) ( ) ∫ ( ) ( ) (4.29)
Equation 4.29 satisfies the property that and if and only if is true
( ( ) ( )). A consistent and asymptotically normal estimator of Equation
(4.29) is obtained by replacing the unknown distribution functions( ( ) ( ))by
empirical distribution functions ( and
).
( )
∑ ( )
l=A, Z (4.30)
I(X) is an indicator function in which I(X) =1 if the statement X is true, and zero
otherwise.
The unknown densities ( ( ) ( ))in Equation 4.29 are replaced with the
nonparametric kernel density estimation and
:
( )
∑ .
/
l=A, Z (4.31)
where ( ) is a smoothing parameter, such that and as
; and
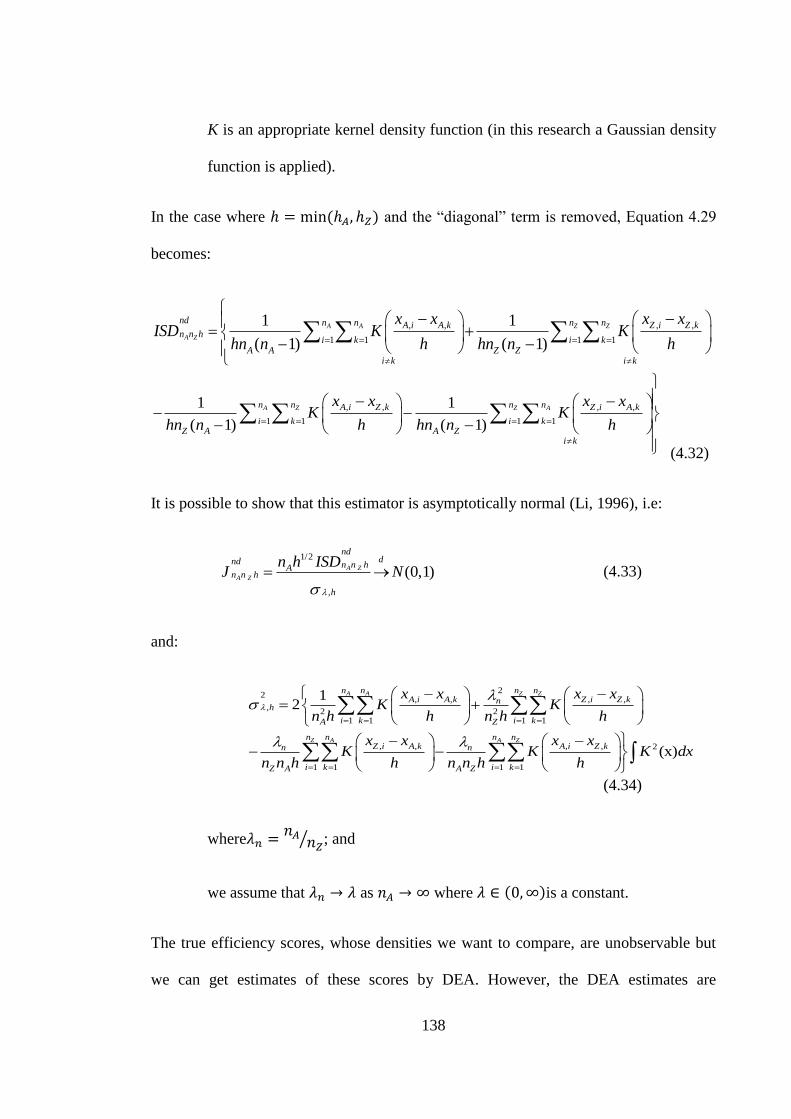
138
K is an appropriate kernel density function (in this research a Gaussian density
function is applied).
In the case where ( ) and the ―diagonal‖ term is removed, Equation 4.29
becomes:
, , , ,
1 1 1 1
1 1
( 1) ( 1)
A A Z Z
A Z
nd n n n nA i A k Z i Z kn n h
i k i kA A Z Z
i k i k
x x x xISD K K
hn n h hn n h
, , , ,
1 1 1 1
1 1
( 1) ( 1)
A Z Z An n n nA i Z k Z i A k
i k i kZ A A Z
i k
x x x xK K
hn n h hn n h
(4.32)
It is possible to show that this estimator is asymptotically normal (Li, 1996), i.e:
1/2
,
(0,1)A Z
A Z
nddnd n n hA
n n h
h
n h ISDJ N
(4.33)
and:
22
, , , ,,
2 21 1 1 1
12
A A Z Zn n n nA i A k Z i Z kn
h
i k i kA Z
x x x xK K
n h h n h h
, , , , 2
1 1 1 1
(x)Z A A Zn n n n
Z i A k A i Z kn n
i k i kZ A A Z
x x x xK K K dx
n n h h n n h h
(4.34)
where
⁄ ; and
we assume that as where ( )is a constant.
The true efficiency scores, whose densities we want to compare, are unobservable but
we can get estimates of these scores by DEA. However, the DEA estimates are
139
downward-biased and dependent (Simar and Wilson, 1998; Xue and Harker, 1999).
Bootstrapping is the unique technique to overcome these limitations (Simar and Wilson,
2015). Li (1999) postulates a bootstrap procedure based on a resampling process from a
sample which is proven to be consistent and demonstrates superior properties. Simar
and Zelenyuk (2006) follow the Li (1999) bootstrap procedure in a DEA context.
Bootstrap-based p-values for the Li test can be obtained from:
Bootstrap p-value =
∑ (
) (4.35)
where I is an indicator function yielding 1 if
is true and 0
otherwise;
B is the number of bootstrap replications;
is the Li-test statistic given above; and
is its bootstrap analogue.
One difficulty when applying the Li test is the bound problem which is observed as
―spurious mass at unity‖ due to the construction, and at least one observation will be on
the estimated frontier. Simar and Zelenyuk (2006) provide two approaches to solve this
problem. The first one is based on computation and bootstrapping the Li statistic using
the sample of DEA estimates without those being equal to unity. However, using this
method would reduce the sample size. The second uses the sample of DEA estimates
where those equal to unity are ―smoothed‖ away from the boundary by adding a small
noise ( ).
Technical efficiency scores are identified as:
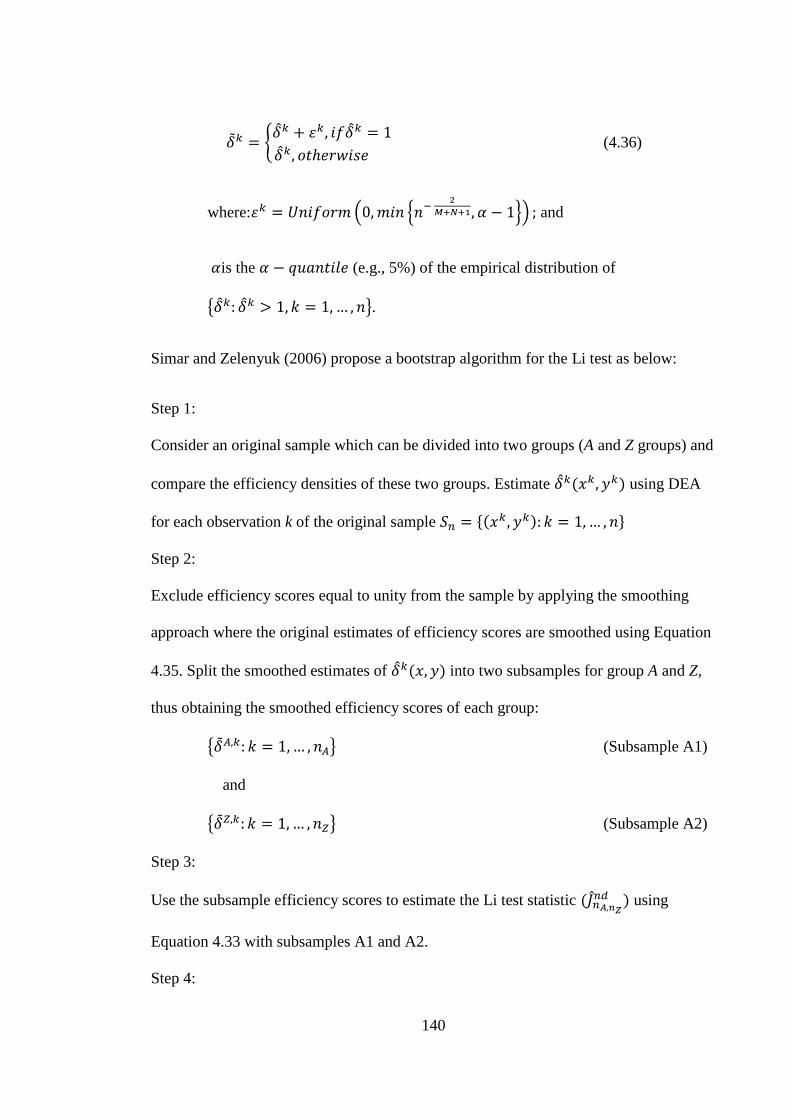
140
8
(4.36)
where: . 2
3/ and
is the (e.g., 5%) of the empirical distribution of
{ }.
Simar and Zelenyuk (2006) propose a bootstrap algorithm for the Li test as below:
Step 1:
Consider an original sample which can be divided into two groups (A and Z groups) and
compare the efficiency densities of these two groups. Estimate ( ) using DEA
for each observation k of the original sample *( ) +
Step 2:
Exclude efficiency scores equal to unity from the sample by applying the smoothing
approach where the original estimates of efficiency scores are smoothed using Equation
4.35. Split the smoothed estimates of ( ) into two subsamples for group A and Z,
thus obtaining the smoothed efficiency scores of each group:
{ } (Subsample A1)
and
{ } (Subsample A2)
Step 3:
Use the subsample efficiency scores to estimate the Li test statistic (
) using
Equation 4.33 with subsamples A1 and A2.
Step 4:
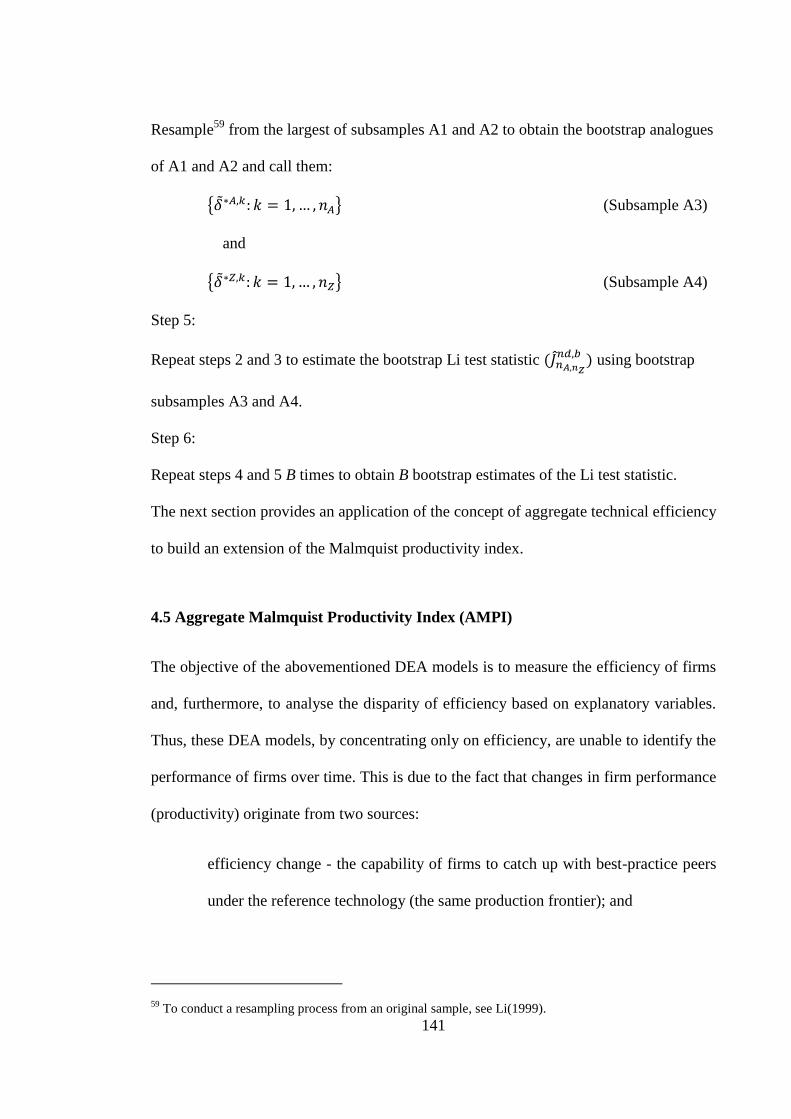
141
Resample59
from the largest of subsamples A1 and A2 to obtain the bootstrap analogues
of A1 and A2 and call them:
{ } (Subsample A3)
and
{ } (Subsample A4)
Step 5:
Repeat steps 2 and 3 to estimate the bootstrap Li test statistic (
) using bootstrap
subsamples A3 and A4.
Step 6:
Repeat steps 4 and 5 B times to obtain B bootstrap estimates of the Li test statistic.
The next section provides an application of the concept of aggregate technical efficiency
to build an extension of the Malmquist productivity index.
4.5 Aggregate Malmquist Productivity Index (AMPI)
The objective of the abovementioned DEA models is to measure the efficiency of firms
and, furthermore, to analyse the disparity of efficiency based on explanatory variables.
Thus, these DEA models, by concentrating only on efficiency, are unable to identify the
performance of firms over time. This is due to the fact that changes in firm performance
(productivity) originate from two sources:
efficiency change - the capability of firms to catch up with best-practice peers
under the reference technology (the same production frontier); and
59 To conduct a resampling process from an original sample, see Li(1999).
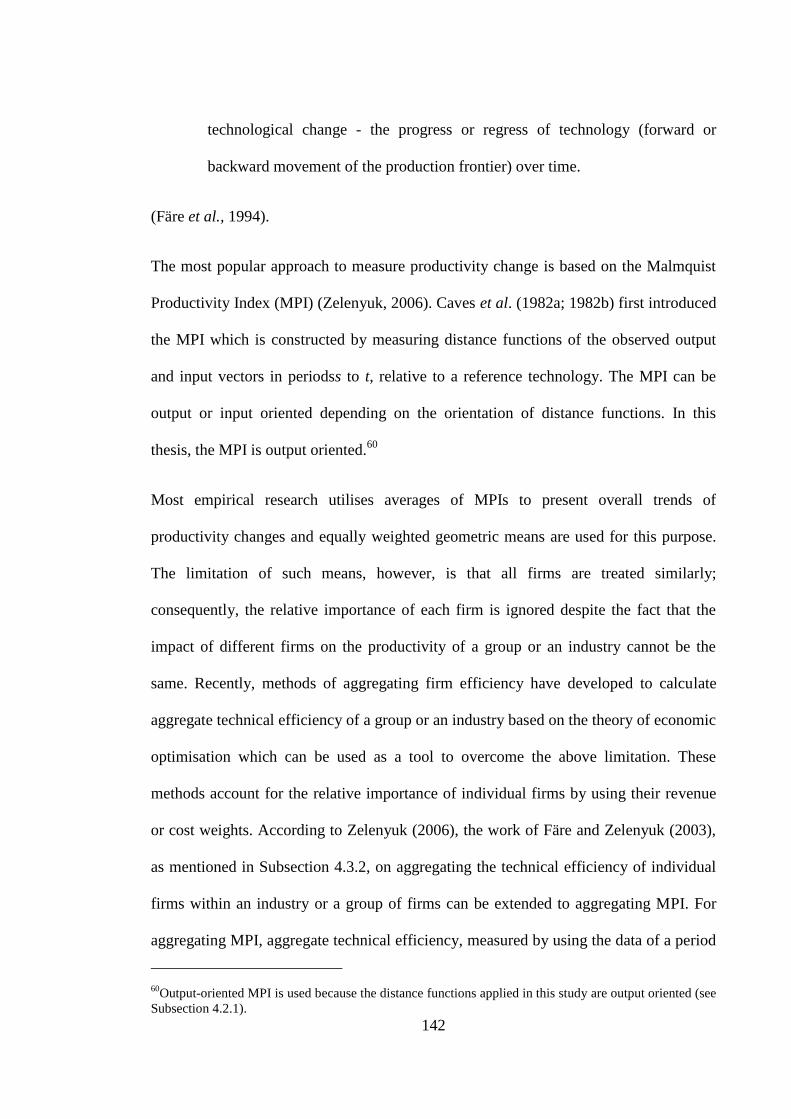
142
technological change - the progress or regress of technology (forward or
backward movement of the production frontier) over time.
(Färe et al., 1994).
The most popular approach to measure productivity change is based on the Malmquist
Productivity Index (MPI) (Zelenyuk, 2006). Caves et al. (1982a; 1982b) first introduced
the MPI which is constructed by measuring distance functions of the observed output
and input vectors in periodss to t, relative to a reference technology. The MPI can be
output or input oriented depending on the orientation of distance functions. In this
thesis, the MPI is output oriented.60
Most empirical research utilises averages of MPIs to present overall trends of
productivity changes and equally weighted geometric means are used for this purpose.
The limitation of such means, however, is that all firms are treated similarly;
consequently, the relative importance of each firm is ignored despite the fact that the
impact of different firms on the productivity of a group or an industry cannot be the
same. Recently, methods of aggregating firm efficiency have developed to calculate
aggregate technical efficiency of a group or an industry based on the theory of economic
optimisation which can be used as a tool to overcome the above limitation. These
methods account for the relative importance of individual firms by using their revenue
or cost weights. According to Zelenyuk (2006), the work of Färe and Zelenyuk (2003),
as mentioned in Subsection 4.3.2, on aggregating the technical efficiency of individual
firms within an industry or a group of firms can be extended to aggregating MPI. For
aggregating MPI, aggregate technical efficiency, measured by using the data of a period
60Output-oriented MPI is used because the distance functions applied in this study are output oriented (see
Subsection 4.2.1).
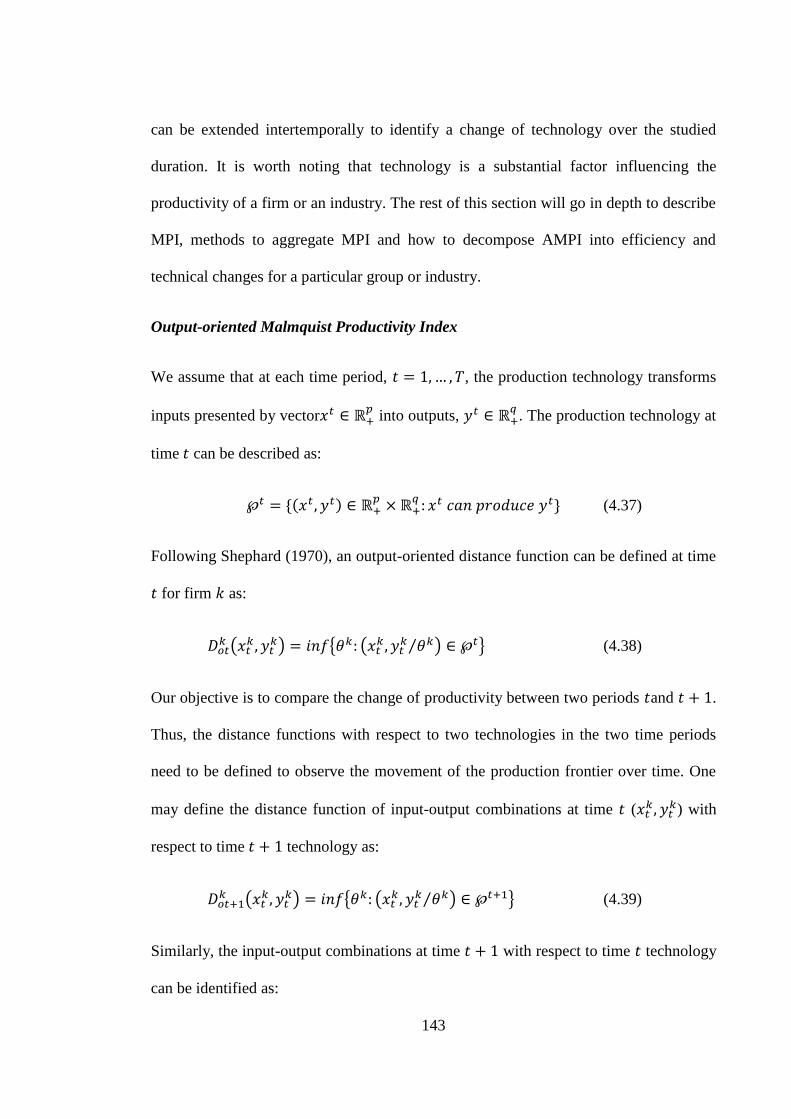
143
can be extended intertemporally to identify a change of technology over the studied
duration. It is worth noting that technology is a substantial factor influencing the
productivity of a firm or an industry. The rest of this section will go in depth to describe
MPI, methods to aggregate MPI and how to decompose AMPI into efficiency and
technical changes for a particular group or industry.
Output-oriented Malmquist Productivity Index
We assume that at each time period, , the production technology transforms
inputs presented by vector
into outputs,
. The production technology at
time can be described as:
*( )
+ (4.37)
Following Shephard (1970), an output-oriented distance function can be defined at time
for firm as:
(
) { (
⁄ ) } (4.38)
Our objective is to compare the change of productivity between two periods and .
Thus, the distance functions with respect to two technologies in the two time periods
need to be defined to observe the movement of the production frontier over time. One
may define the distance function of input-output combinations at time (
) with
respect to time technology as:
(
) { (
⁄ ) } (4.39)
Similarly, the input-output combinations at time with respect to time technology
can be identified as:
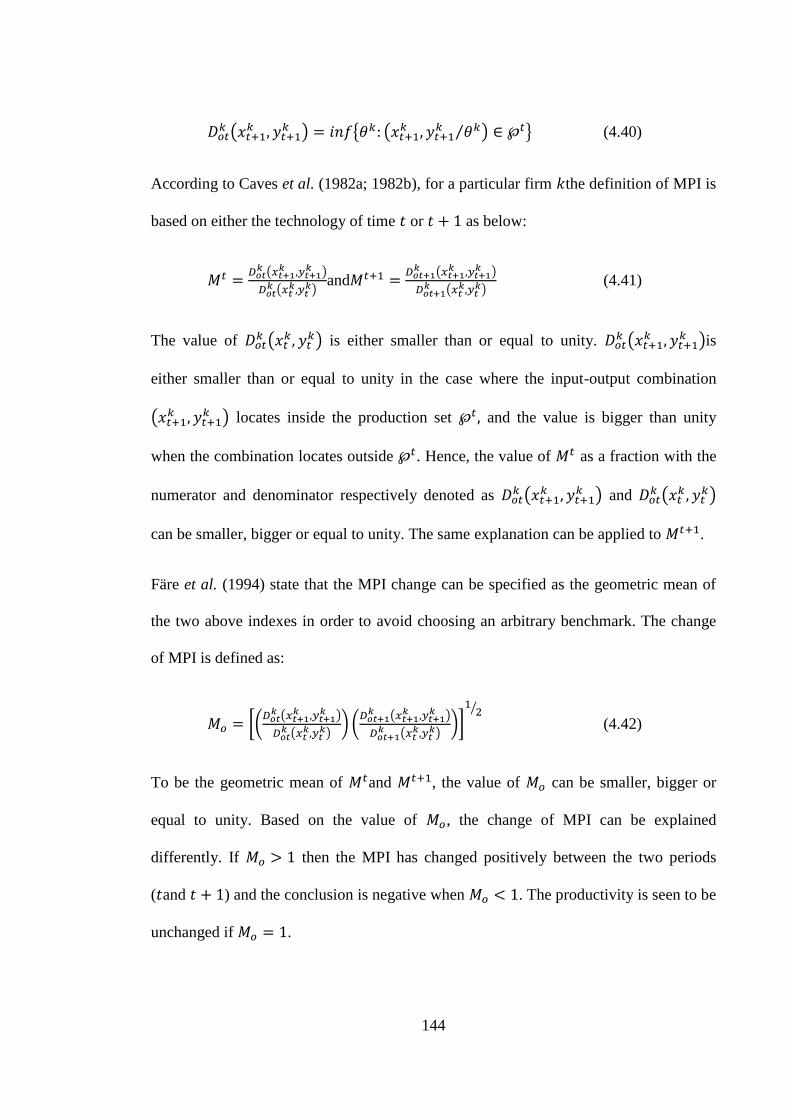
144
(
) { (
⁄ ) } (4.40)
According to Caves et al. (1982a; 1982b), for a particular firm the definition of MPI is
based on either the technology of time or as below:
(
)
(
)
and
(
)
(
)
(4.41)
The value of (
) is either smaller than or equal to unity.
(
)is
either smaller than or equal to unity in the case where the input-output combination
(
) locates inside the production set and the value is bigger than unity
when the combination locates outside . Hence, the value of as a fraction with the
numerator and denominator respectively denoted as (
) and
(
)
can be smaller, bigger or equal to unity. The same explanation can be applied to .
Färe et al. (1994) state that the MPI change can be specified as the geometric mean of
the two above indexes in order to avoid choosing an arbitrary benchmark. The change
of MPI is defined as:
[(
(
)
(
)
) (
(
)
(
)
)]
⁄
(4.42)
To be the geometric mean of and , the value of can be smaller, bigger or
equal to unity. Based on the value of , the change of MPI can be explained
differently. If then the MPI has changed positively between the two periods
( and ) and the conclusion is negative when . The productivity is seen to be
unchanged if .
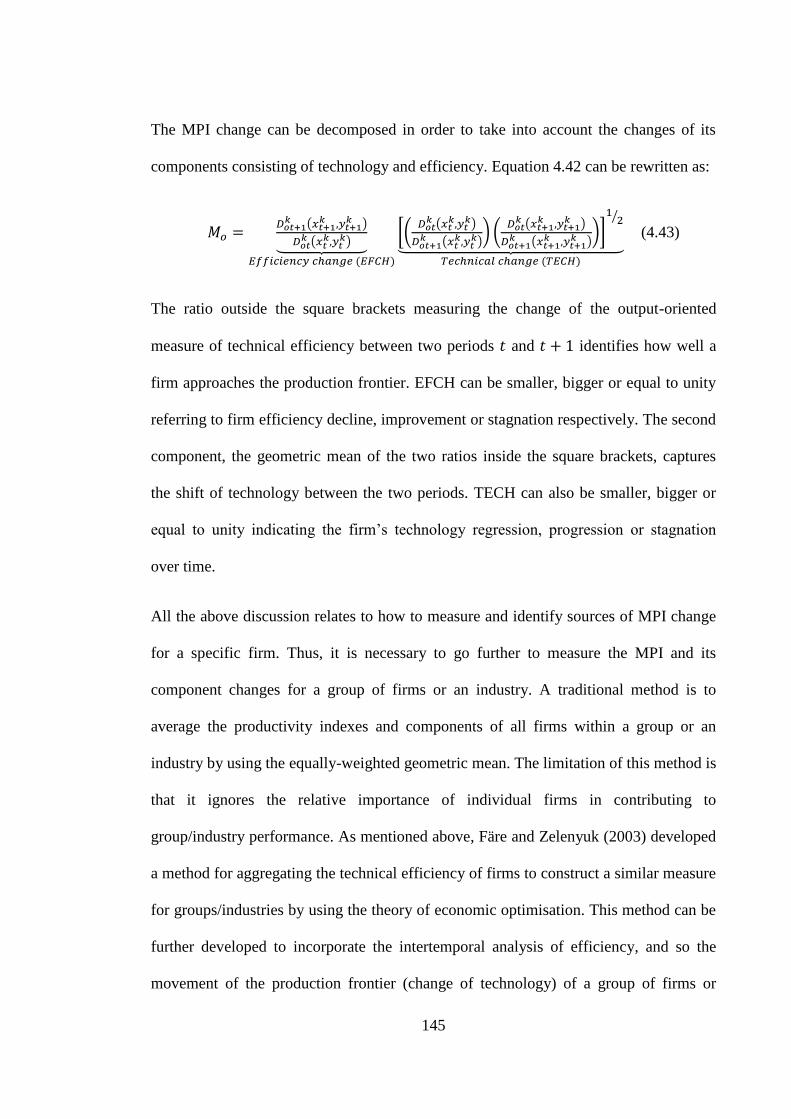
145
The MPI change can be decomposed in order to take into account the changes of its
components consisting of technology and efficiency. Equation 4.42 can be rewritten as:
(
)
(
)⏟
( )
[(
(
)
(
)
) (
(
)
(
)
)]
⁄
⏟ ( )
(4.43)
The ratio outside the square brackets measuring the change of the output-oriented
measure of technical efficiency between two periods and identifies how well a
firm approaches the production frontier. EFCH can be smaller, bigger or equal to unity
referring to firm efficiency decline, improvement or stagnation respectively. The second
component, the geometric mean of the two ratios inside the square brackets, captures
the shift of technology between the two periods. TECH can also be smaller, bigger or
equal to unity indicating the firm‘s technology regression, progression or stagnation
over time.
All the above discussion relates to how to measure and identify sources of MPI change
for a specific firm. Thus, it is necessary to go further to measure the MPI and its
component changes for a group of firms or an industry. A traditional method is to
average the productivity indexes and components of all firms within a group or an
industry by using the equally-weighted geometric mean. The limitation of this method is
that it ignores the relative importance of individual firms in contributing to
group/industry performance. As mentioned above, Färe and Zelenyuk (2003) developed
a method for aggregating the technical efficiency of firms to construct a similar measure
for groups/industries by using the theory of economic optimisation. This method can be
further developed to incorporate the intertemporal analysis of efficiency, and so the
movement of the production frontier (change of technology) of a group of firms or
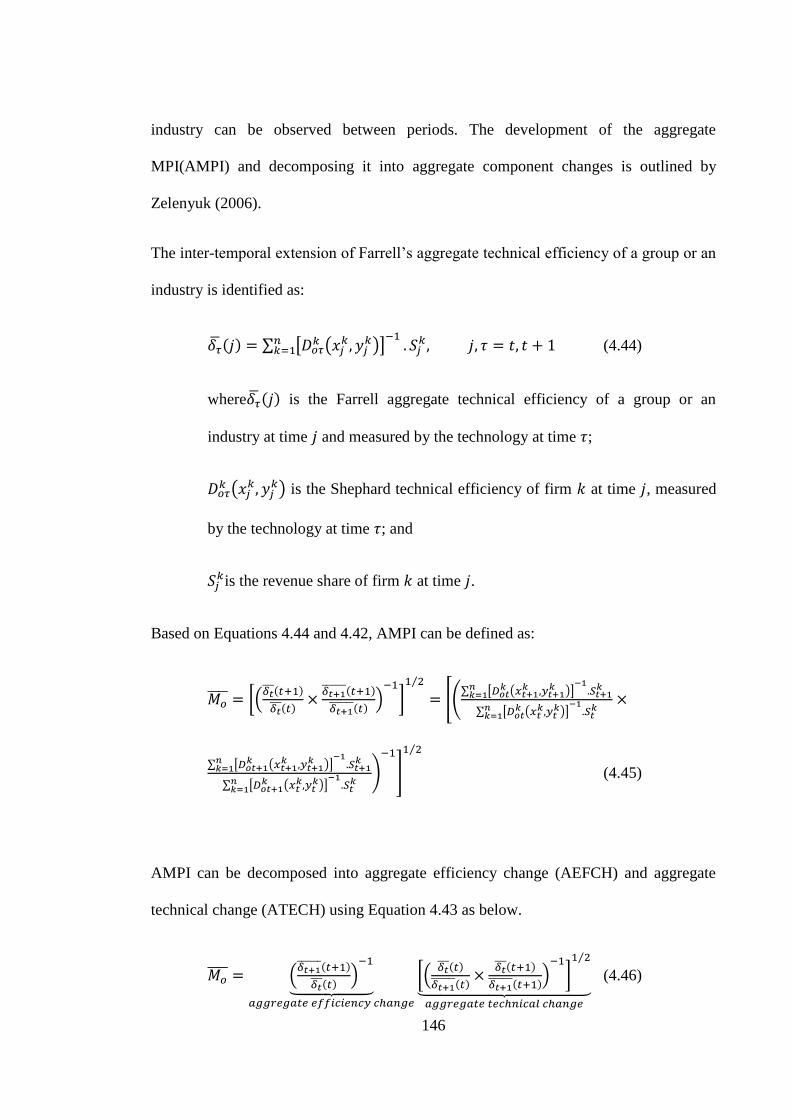
146
industry can be observed between periods. The development of the aggregate
MPI(AMPI) and decomposing it into aggregate component changes is outlined by
Zelenyuk (2006).
The inter-temporal extension of Farrell‘s aggregate technical efficiency of a group or an
industry is identified as:
( ) ∑ [ (
)]
(4.44)
where ( ) is the Farrell aggregate technical efficiency of a group or an
industry at time and measured by the technology at time ;
(
) is the Shephard technical efficiency of firm at time , measured
by the technology at time ; and
is the revenue share of firm at time .
Based on Equations 4.44 and 4.42, AMPI can be defined as:
[.
( )
( )
( )
( )
/
] ⁄
[4∑ [
(
)]
∑ [ (
)]
∑ [ (
)]
∑ [ (
)]
5
]
⁄
(4.45)
AMPI can be decomposed into aggregate efficiency change (AEFCH) and aggregate
technical change (ATECH) using Equation 4.43 as below.
.
( )
( )
/
⏟
[. ( )
( )
( )
( )
/
] ⁄
⏟
(4.46)
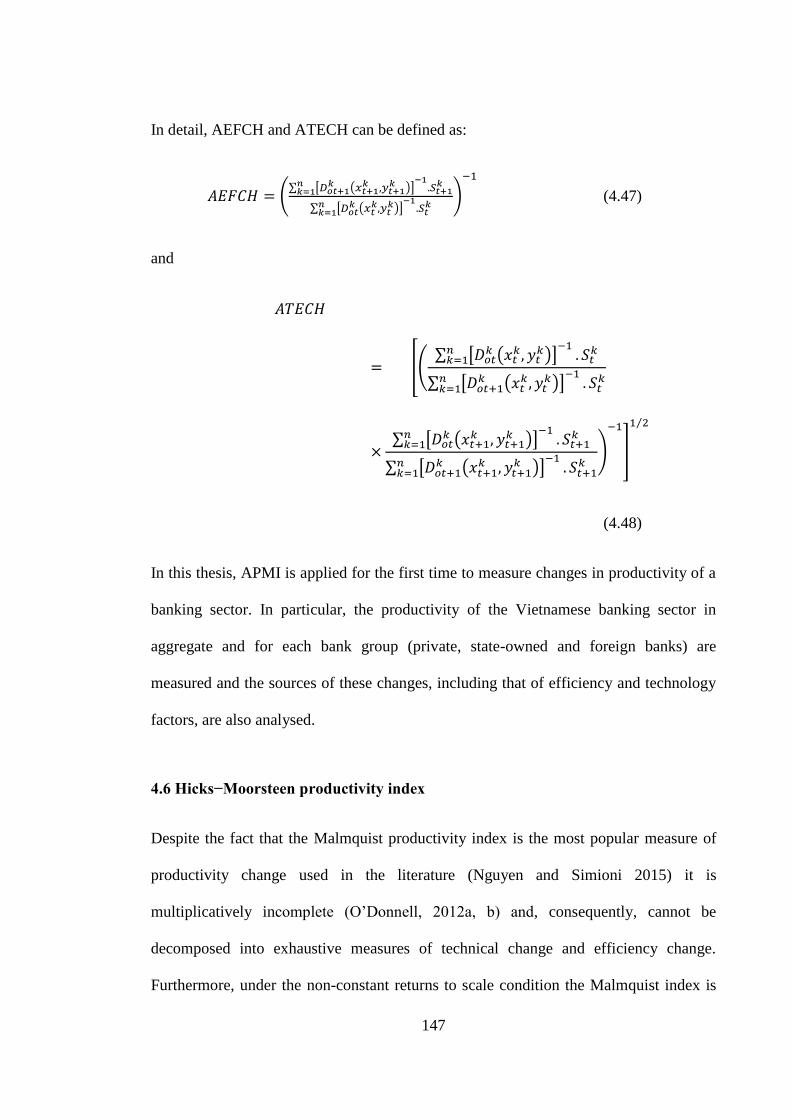
147
In detail, AEFCH and ATECH can be defined as:
4∑ [
(
)]
∑ [ (
)]
5
(4.47)
and
[(∑ [
(
)]
∑ [ (
)]
∑ [
(
)]
∑ [ (
)]
)
]
⁄
(4.48)
In this thesis, APMI is applied for the first time to measure changes in productivity of a
banking sector. In particular, the productivity of the Vietnamese banking sector in
aggregate and for each bank group (private, state-owned and foreign banks) are
measured and the sources of these changes, including that of efficiency and technology
factors, are also analysed.
4.6 Hicks−Moorsteen productivity index
Despite the fact that the Malmquist productivity index is the most popular measure of
productivity change used in the literature (Nguyen and Simioni 2015) it is
multiplicatively incomplete (O‘Donnell, 2012a, b) and, consequently, cannot be
decomposed into exhaustive measures of technical change and efficiency change.
Furthermore, under the non-constant returns to scale condition the Malmquist index is
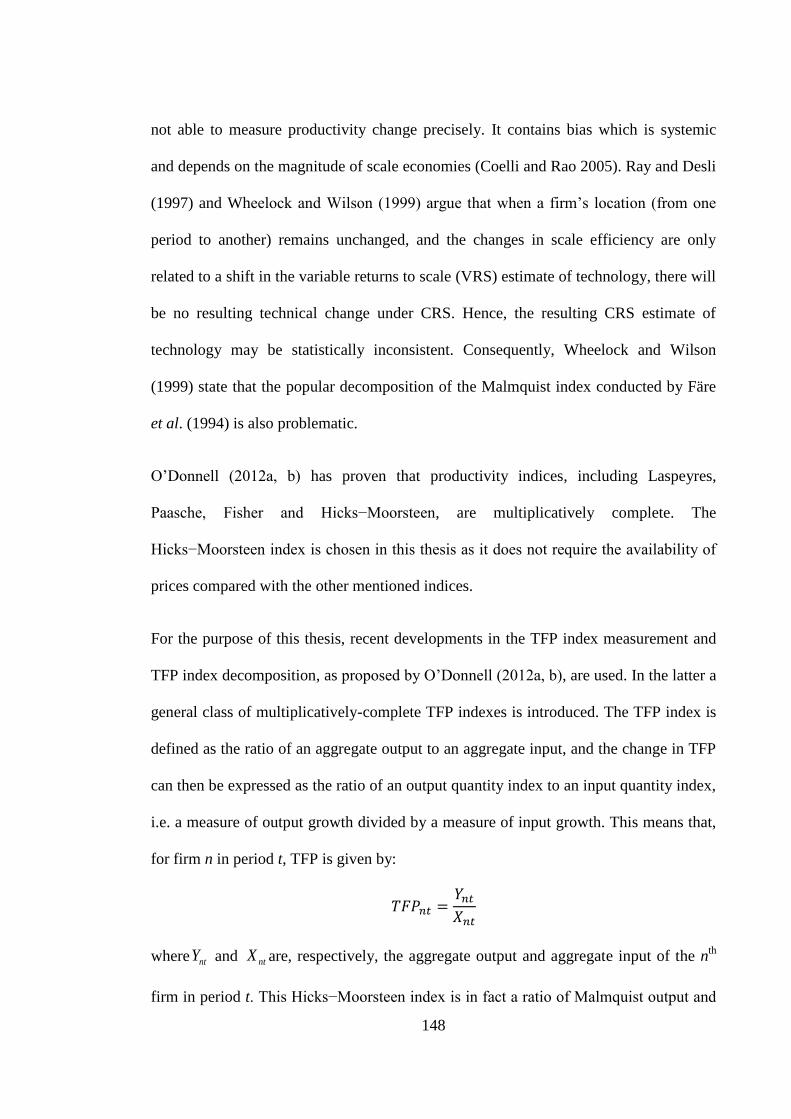
148
not able to measure productivity change precisely. It contains bias which is systemic
and depends on the magnitude of scale economies (Coelli and Rao 2005). Ray and Desli
(1997) and Wheelock and Wilson (1999) argue that when a firm‘s location (from one
period to another) remains unchanged, and the changes in scale efficiency are only
related to a shift in the variable returns to scale (VRS) estimate of technology, there will
be no resulting technical change under CRS. Hence, the resulting CRS estimate of
technology may be statistically inconsistent. Consequently, Wheelock and Wilson
(1999) state that the popular decomposition of the Malmquist index conducted by Färe
et al. (1994) is also problematic.
O‘Donnell (2012a, b) has proven that productivity indices, including Laspeyres,
Paasche, Fisher and Hicks−Moorsteen, are multiplicatively complete. The
Hicks−Moorsteen index is chosen in this thesis as it does not require the availability of
prices compared with the other mentioned indices.
For the purpose of this thesis, recent developments in the TFP index measurement and
TFP index decomposition, as proposed by O‘Donnell (2012a, b), are used. In the latter a
general class of multiplicatively-complete TFP indexes is introduced. The TFP index is
defined as the ratio of an aggregate output to an aggregate input, and the change in TFP
can then be expressed as the ratio of an output quantity index to an input quantity index,
i.e. a measure of output growth divided by a measure of input growth. This means that,
for firm n in period t, TFP is given by:
where ntY and ntX are, respectively, the aggregate output and aggregate input of the nth
firm in period t. This Hicks−Moorsteen index is in fact a ratio of Malmquist output and
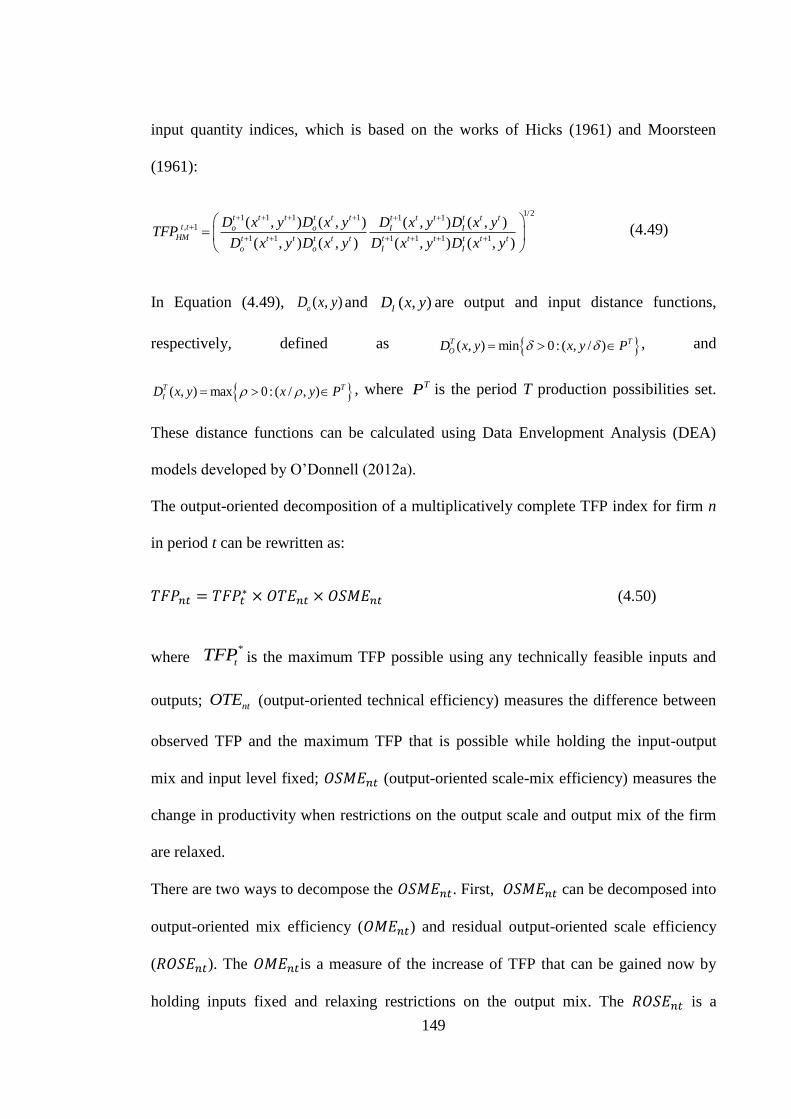
149
input quantity indices, which is based on the works of Hicks (1961) and Moorsteen
(1961):
1/21 1 1 1 1 1
, 1
1 1 1 1 1 1
( , ) ( , ) ( , ) ( , )
( , ) ( , ) ( , ) ( , )
t t t t t t t t t t t tt t o o I I
HM t t t t t t t t t t t t
o o I I
D x y D x y D x y D x yTFP
D x y D x y D x y D x y
(4.49)
In Equation (4.49), ( , )o
D x y and ( , )ID x y are output and input distance functions,
respectively, defined as ( , ) min 0 : ( , / )T T
OD x y x y P , and
( , ) max 0: ( / , )T T
ID x y x y P , where TP is the period T production possibilities set.
These distance functions can be calculated using Data Envelopment Analysis (DEA)
models developed by O‘Donnell (2012a).
The output-oriented decomposition of a multiplicatively complete TFP index for firm n
in period t can be rewritten as:
(4.50)
where *
tTFP is the maximum TFP possible using any technically feasible inputs and
outputs; ntOTE (output-oriented technical efficiency) measures the difference between
observed TFP and the maximum TFP that is possible while holding the input-output
mix and input level fixed; (output-oriented scale-mix efficiency) measures the
change in productivity when restrictions on the output scale and output mix of the firm
are relaxed.
There are two ways to decompose the . First, can be decomposed into
output-oriented mix efficiency ( ) and residual output-oriented scale efficiency
( ). The is a measure of the increase of TFP that can be gained now by
holding inputs fixed and relaxing restrictions on the output mix. The is a

150
measure of the difference between TFP at a technically and mix efficient point and TFP
at the point of maximum attainable productivity. Second, can be decomposed
into output-oriented scale efficiency ( ) and residual mix efficiency ( ). The
measures the gain in TFP a firm can achieve by moving along the mix-invariant
production frontier to the mix-invariant optimal scale point. The measures the
productivity gain when the technically and scale efficient firm achieves the mix-variant
optimal scale point by changing its output mix.
Now the equation (4.50) can be rewritten as:
(4.51)
or
(4.52)
Decompositions of TFP change
O‘Donnell (2012a, b) showed that the TFP index that compares the productivity of the
firm in period and can be decomposed into a measure of technical change and
various measures of efficiency change.
.
/
⏟
.
/ .
/ .
/
⏟
(4.53)
or
.
/
⏟
.
/ .
/ .
/
⏟
(4.54)
The term included in the first parentheses on the right-hand side of equations (4.53) and
(4.54) represents technical changes, measuring the difference between the maximum
TFP possible using any technology feasible at times t and t+1. Hence, the sector
experiences technical improvement or decline, depending on whether
is greater or
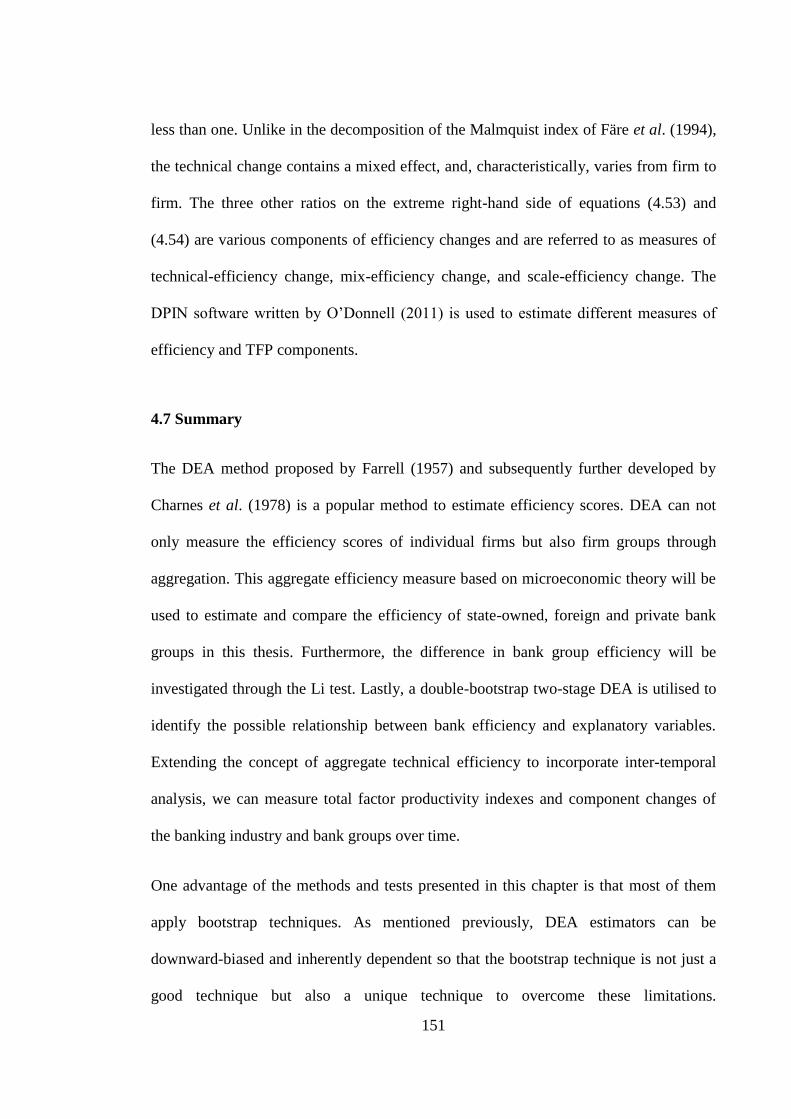
151
less than one. Unlike in the decomposition of the Malmquist index of Färe et al. (1994),
the technical change contains a mixed effect, and, characteristically, varies from firm to
firm. The three other ratios on the extreme right-hand side of equations (4.53) and
(4.54) are various components of efficiency changes and are referred to as measures of
technical-efficiency change, mix-efficiency change, and scale-efficiency change. The
DPIN software written by O‘Donnell (2011) is used to estimate different measures of
efficiency and TFP components.
4.7 Summary
The DEA method proposed by Farrell (1957) and subsequently further developed by
Charnes et al. (1978) is a popular method to estimate efficiency scores. DEA can not
only measure the efficiency scores of individual firms but also firm groups through
aggregation. This aggregate efficiency measure based on microeconomic theory will be
used to estimate and compare the efficiency of state-owned, foreign and private bank
groups in this thesis. Furthermore, the difference in bank group efficiency will be
investigated through the Li test. Lastly, a double-bootstrap two-stage DEA is utilised to
identify the possible relationship between bank efficiency and explanatory variables.
Extending the concept of aggregate technical efficiency to incorporate inter-temporal
analysis, we can measure total factor productivity indexes and component changes of
the banking industry and bank groups over time.
One advantage of the methods and tests presented in this chapter is that most of them
apply bootstrap techniques. As mentioned previously, DEA estimators can be
downward-biased and inherently dependent so that the bootstrap technique is not just a
good technique but also a unique technique to overcome these limitations.
152
Computational processes relating to DEA scores, aggregate DEA scores, regression
analysis and test statistics used in this thesis are conducted using Matlab - the most
common mathematical software61
.
This chapter contributes to the theory of bank efficiency in several ways. First, it shows
how to apply the method of aggregating technical efficiency in a banking system to
measure and compare bank efficiency and productivity. Second, this chapter has
emphasised that the business environment in which banks operate can be different and
that, consequently, this leads to different levels of access to the frontier across various
types of bank ownership. The Li test is also employed as anoriginal measure for
detecting and analysing this difference. Third, by combining a meta-frontier analysis
with a double-bootstrap two-stage DEA, this study has suggested a new approach to
analyse the impact of variables on bank efficiency in separate groups operating under
different technologies. This thesis is the first to employ ownership as an ex ante rather
than an ex post factor, which is how ownership has traditionally been used in all earlier
studies when examining the influence of environmental variables on bank efficiency.
The abovementioned approach has originated from the fact that different bank
ownership forms can result in a divergence of technology sets utilised by bank groups
and can result in different responses to the same explanatory variables (e.g, credit policy
or loan to asset ratios).
The next chapter will describe the data to be used for the empirical analyses conducted
in this thesis in terms of data sources and data statistical description. In addition, DEA
61 The codes in Matlab were provided by Associate Professor Valentin Zelenyuk, University of
Queensland, Australia.
153
models and environmental variables utilised to measure and analyse efficiency scores
will be specified drawing upon the literature review conducted in Chapter 3.
154
Chapter 5: Data and analysis of Vietnamese banking efficiency
5.1 Introduction
The purpose of this chapter is to describe the data sources, specify the explanatory
variables used in the regression models and conduct an empirical analysis of the
technical efficiency of the Vietnamese banking sector in the years 2005–2012
encompassing the pre- and post-WTO entry periods.
The DEA method is applied to measure, compare and explain the technical efficiency
and productivity of Vietnamese banks. To add value to the results obtained by other
relevant studies (e.g., Vu and Turnell, 2010; Minh et al., 2013; Nguyen et al., 2014),
this study employs the aggregate technical efficiency method, accounting for the
relative importance62
of individual banks, to measure the performance of three bank
groups - state-owned banks, private banks and foreign banks - as well as the entire
industry. To examine the difference of banking sector efficiency between the pre- and
post-WTO periods, the Li (1996) test on the efficiency distribution and the Simar and
Zelenyuk (2007) test of efficiency difference are also used. These two tests also allow
us to examine efficiency differences between the different bank groups.
This chapter is structured as follows: Section 5.2 describes the data sources, sample, and
specification of inputs, outputs and variables used in the DEA models for analysis of
banking efficiency; Section 5.3 compares bank efficiency between the pre- and post-
WTO entry periods using the Li (1996; 1999) and Simar and Zelenyuk (2007) tests;
these two tests are also employed in Section 5.4 where the performance of bank groups
62 The relative importance is quantified by the outcome shares when calculating the aggregate efficiency
scores of groups (see Section 4.3.2).
155
are measured and compared; and lastly, a summary reviewing the chapter‘s contents is
included in Section 5.5.
5.2 Data and model specification
5.2.1 Data source
Panel data is collected from the financial statements of individual commercial banks in
Vietnam covering the years 2005–2012, including their balance sheets and income
reports. Other relevant information, including the structure of bank equity, new bank
entries and bank mergers, is collected from the annual reports of the SBV, the SBV
official website and reports of the NFSC. In addition, working papers from academic
institutions such as the ASH Institute for Democratic Governance and Innovation
(Harvard Kennedy School) and development reports from international financial
organisations, such as the World Bank and the International Monetary Fund, are also
used as useful sources of data on equity owned by foreigners and macroeconomic
indicators including the inflation rate and exchange rate.
As mentioned in Section 2.3, only data from 2005 onward ensures homogeneity because
of the first implementation of regulations on loan classification and loan-loss
provisioning. The studied period covers the pre- and post-WTO era to observe the
impact of policy changes, stipulated as part of Vietnam‘s entry to the WTO, on bank
efficiency. With a two-digit inflation rate (about 11-12%), the balance sheets of banks
significantly deteriorated during the period 2005–2012. Hence, the data is also
converted into real terms.
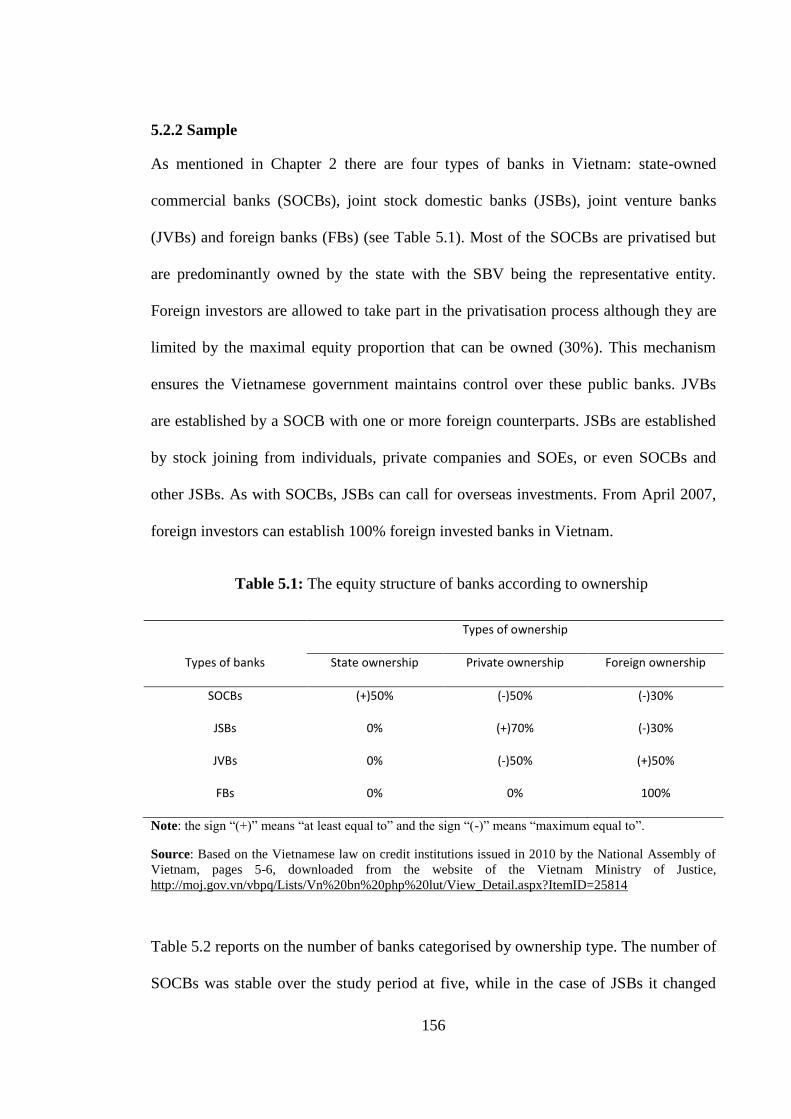
156
5.2.2 Sample
As mentioned in Chapter 2 there are four types of banks in Vietnam: state-owned
commercial banks (SOCBs), joint stock domestic banks (JSBs), joint venture banks
(JVBs) and foreign banks (FBs) (see Table 5.1). Most of the SOCBs are privatised but
are predominantly owned by the state with the SBV being the representative entity.
Foreign investors are allowed to take part in the privatisation process although they are
limited by the maximal equity proportion that can be owned (30%). This mechanism
ensures the Vietnamese government maintains control over these public banks. JVBs
are established by a SOCB with one or more foreign counterparts. JSBs are established
by stock joining from individuals, private companies and SOEs, or even SOCBs and
other JSBs. As with SOCBs, JSBs can call for overseas investments. From April 2007,
foreign investors can establish 100% foreign invested banks in Vietnam.
16Table 5.1: The equity structure of banks according to ownership
Types of ownership
Types of banks State ownership Private ownership Foreign ownership
SOCBs (+)50% (-)50% (-)30%
JSBs 0% (+)70% (-)30%
JVBs 0% (-)50% (+)50%
FBs 0% 0% 100%
Note: the sign ―(+)‖ means ―at least equal to‖ and the sign ―(-)‖ means ―maximum equal to‖.
Source: Based on the Vietnamese law on credit institutions issued in 2010 by the National Assembly of
Vietnam, pages 5-6, downloaded from the website of the Vietnam Ministry of Justice,
http://moj.gov.vn/vbpq/Lists/Vn%20bn%20php%20lut/View_Detail.aspx?ItemID=25814
Table 5.2 reports on the number of banks categorised by ownership type. The number of
SOCBs was stable over the study period at five, while in the case of JSBs it changed
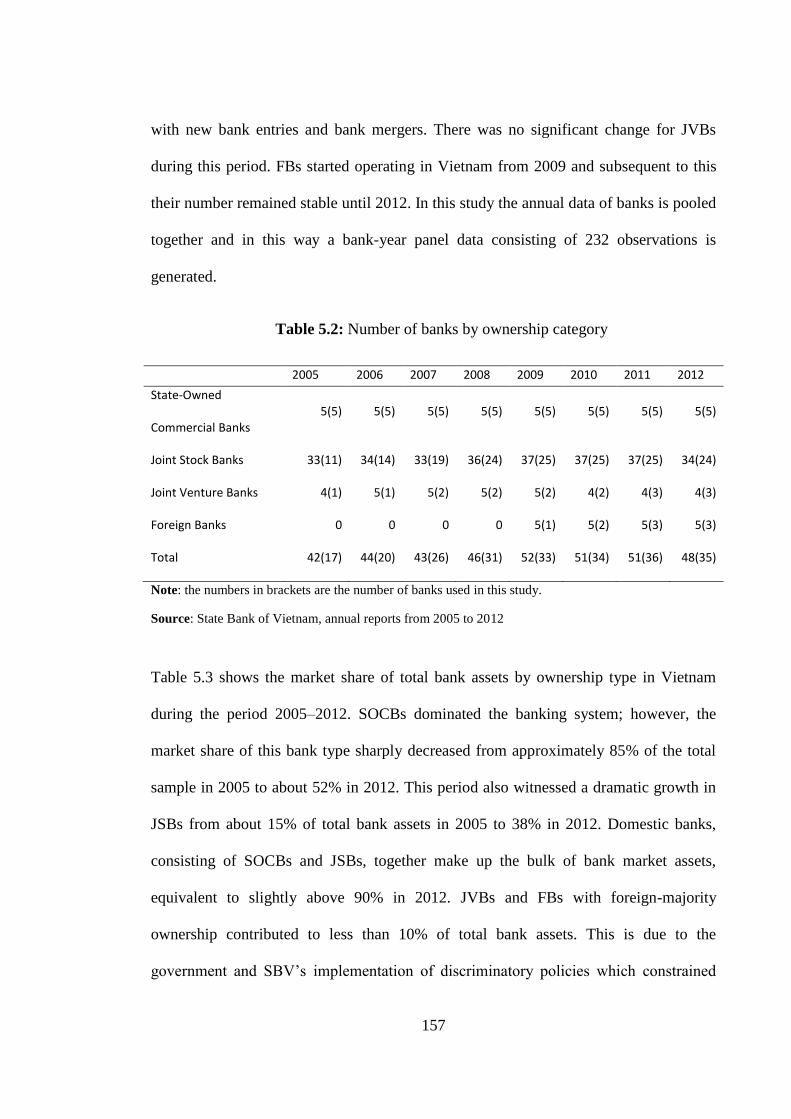
157
with new bank entries and bank mergers. There was no significant change for JVBs
during this period. FBs started operating in Vietnam from 2009 and subsequent to this
their number remained stable until 2012. In this study the annual data of banks is pooled
together and in this way a bank-year panel data consisting of 232 observations is
generated.
17Table 5.2: Number of banks by ownership category
2005 2006 2007 2008 2009 2010 2011 2012
State-Owned
Commercial Banks 5(5) 5(5) 5(5) 5(5) 5(5) 5(5) 5(5) 5(5)
Joint Stock Banks 33(11) 34(14) 33(19) 36(24) 37(25) 37(25) 37(25) 34(24)
Joint Venture Banks 4(1) 5(1) 5(2) 5(2) 5(2) 4(2) 4(3) 4(3)
Foreign Banks 0 0 0 0 5(1) 5(2) 5(3) 5(3)
Total 42(17) 44(20) 43(26) 46(31) 52(33) 51(34) 51(36) 48(35)
Note: the numbers in brackets are the number of banks used in this study.
Source: State Bank of Vietnam, annual reports from 2005 to 2012
Table 5.3 shows the market share of total bank assets by ownership type in Vietnam
during the period 2005–2012. SOCBs dominated the banking system; however, the
market share of this bank type sharply decreased from approximately 85% of the total
sample in 2005 to about 52% in 2012. This period also witnessed a dramatic growth in
JSBs from about 15% of total bank assets in 2005 to 38% in 2012. Domestic banks,
consisting of SOCBs and JSBs, together make up the bulk of bank market assets,
equivalent to slightly above 90% in 2012. JVBs and FBs with foreign-majority
ownership contributed to less than 10% of total bank assets. This is due to the
government and SBV‘s implementation of discriminatory policies which constrained
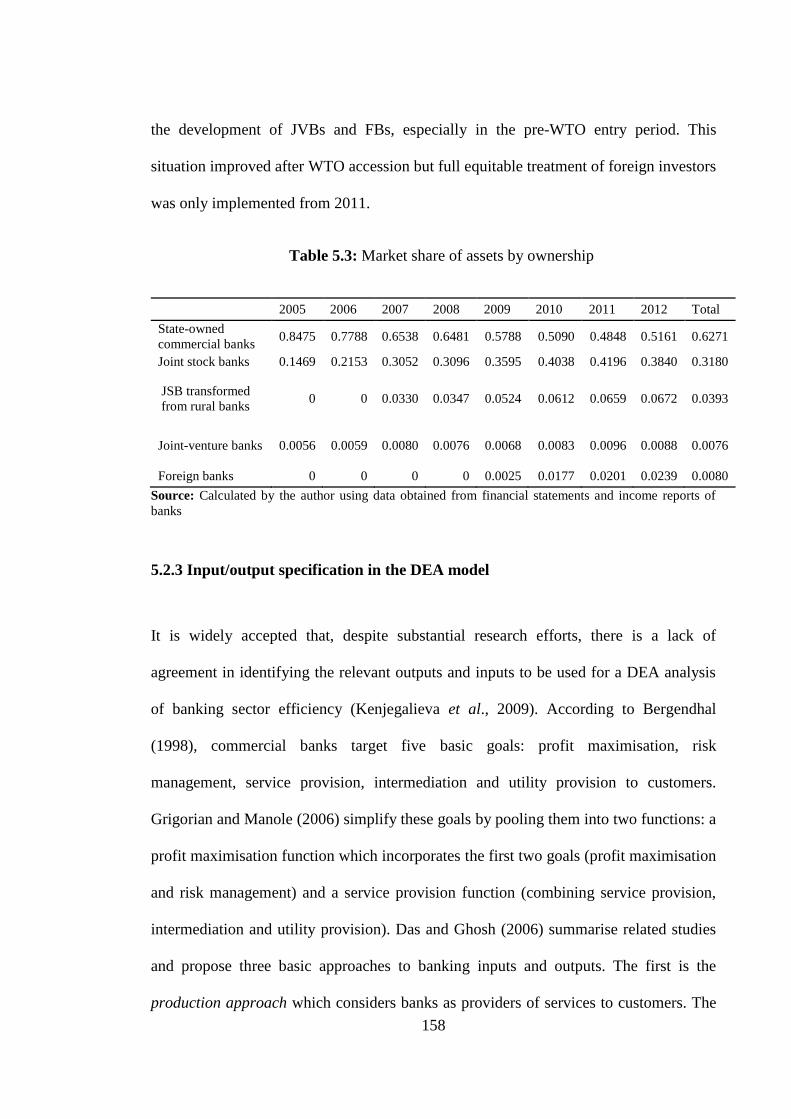
158
the development of JVBs and FBs, especially in the pre-WTO entry period. This
situation improved after WTO accession but full equitable treatment of foreign investors
was only implemented from 2011.
18Table 5.3: Market share of assets by ownership
2005 2006 2007 2008 2009 2010 2011 2012 Total
State-owned
commercial banks 0.8475 0.7788 0.6538 0.6481 0.5788 0.5090 0.4848 0.5161 0.6271
Joint stock banks 0.1469 0.2153 0.3052 0.3096 0.3595 0.4038 0.4196 0.3840 0.3180
JSB transformed
from rural banks 0 0 0.0330 0.0347 0.0524 0.0612 0.0659 0.0672 0.0393
Joint-venture banks 0.0056 0.0059 0.0080 0.0076 0.0068 0.0083 0.0096 0.0088 0.0076
Foreign banks 0 0 0 0 0.0025 0.0177 0.0201 0.0239 0.0080
Source: Calculated by the author using data obtained from financial statements and income reports of
banks
5.2.3 Input/output specification in the DEA model
It is widely accepted that, despite substantial research efforts, there is a lack of
agreement in identifying the relevant outputs and inputs to be used for a DEA analysis
of banking sector efficiency (Kenjegalieva et al., 2009). According to Bergendhal
(1998), commercial banks target five basic goals: profit maximisation, risk
management, service provision, intermediation and utility provision to customers.
Grigorian and Manole (2006) simplify these goals by pooling them into two functions: a
profit maximisation function which incorporates the first two goals (profit maximisation
and risk management) and a service provision function (combining service provision,
intermediation and utility provision). Das and Ghosh (2006) summarise related studies
and propose three basic approaches to banking inputs and outputs. The first is the
production approach which considers banks as providers of services to customers. The
159
second is the intermediation approach in which banks are viewed as intermediating
funds between savers and investors. The last approach is the operating approach that
sees banks as profit-earning entities.
In the context of Vietnam‘s emerging market economy where the capital market is still
shallow, the banking sector has been playing a key role as the main source of funding
for both businesses and households. Thus, the intermediation approach is a reasonable
and logical choice for this study and this is chosen as this study‘s main focus.
In the post-WTO period, banks experienced a significant increase in their capital, assets
and scope of operations. Banks have opened many new branches in cities and
provinces; accordingly, they have recruited more staff and built new offices. As a result,
labour expenditure and fixed assets have become important inputs. One crucial
characteristic of the Vietnamese banking sector is the high level of cash transactions in
the economy, so more branches would lead to more mobilised deposits63
. The
development of a stock market in the post-WTO period has generated new channels for
banks to invest their money other than the traditional channel of loans. New laws for
commercial banks issued in 2006 permitting banks to widen their activities to include
insurance, gold trading, stock trading and housing services has stimulated banks to
increase their investments. Consequently, there has been a shift from the ―loans and
advances‖ item to ―trading securities‖ and ―investments‖ items (or other non-traditional
assets) in banks‘ balance sheets. Therefore, under the intermediation approach, this
63In the literature, there is controversy relating to classifying deposits as an input or an output (Berger and
Humphrey, 1997; Das and Ghosh, 2006). Deposits can be treated as inputs because ―they are paid for in
part by interest payments and the funds raised provide institutions with the raw material of investible
funds‖ (Berger and Humphrey, 1997, page 198). Therefore, considering deposits as an input is
appropriate under the intermediation approach. On the other hand, deposits are related to liquidity,
safekeeping and payment services provided to depositors. Thus, deposits also have an output character
(Berger and Humphrey, 1997). In this case, deposits can be considered as an output under the production
approach.
160
study uses three inputs - labour expenses, fixed assets and deposits - while outputs are
total loans and other earning assets.
In addition to the intermediation approach the operating approach is generally important
in measuring bank efficiency due to the ultimate objective of banks – profit. Hence, this
approach is also used in this study with the aim of providing an insight into the profit-
making performance of banks. There is a consensus in selecting the variables for this
approach: interest expenses and non-interest expenses are inputs, and interest income
and non-interest income are outputs (Ataullah et al., 2004; Yao et al., 2007; Sturm and
Williams, 2004; Jiang et al., 2009).
Table 5.4 statistically describes inputs and outputs using the minimum and maximum
values, and mean and standard deviation. As can be seen in Table 5.4, the period 2005–
2012 witnessed substantial data volatility. For example, the mean value of labour
expenditure by banks surged from USD 16,962,208 in 2005 to USD 38,187,814 in
2012. This significantly increasing trend can be explained by the fact that the
Vietnamese banking sector experienced rapid growth, especially after accession to the
WTO in 2007. The country‘s loose and expansionary monetary policy, which had been
in force for a long period of time, was simultaneously intensified by considerable
capital inflows from overseas64
. Moreover, a number of rural banks were allowed by the
SBV to transform into urban banks. Before the transformation process these rural banks
were very small and mostly focused their operations on lending to SMEs and farmers in
remote areas.
64 To keep the Vietnamese dong from appreciating relative to foreign currency the SBV bought foreign
cash inflows. It injected dong into the economy which led to considerable excess liquidity in the banking
system.
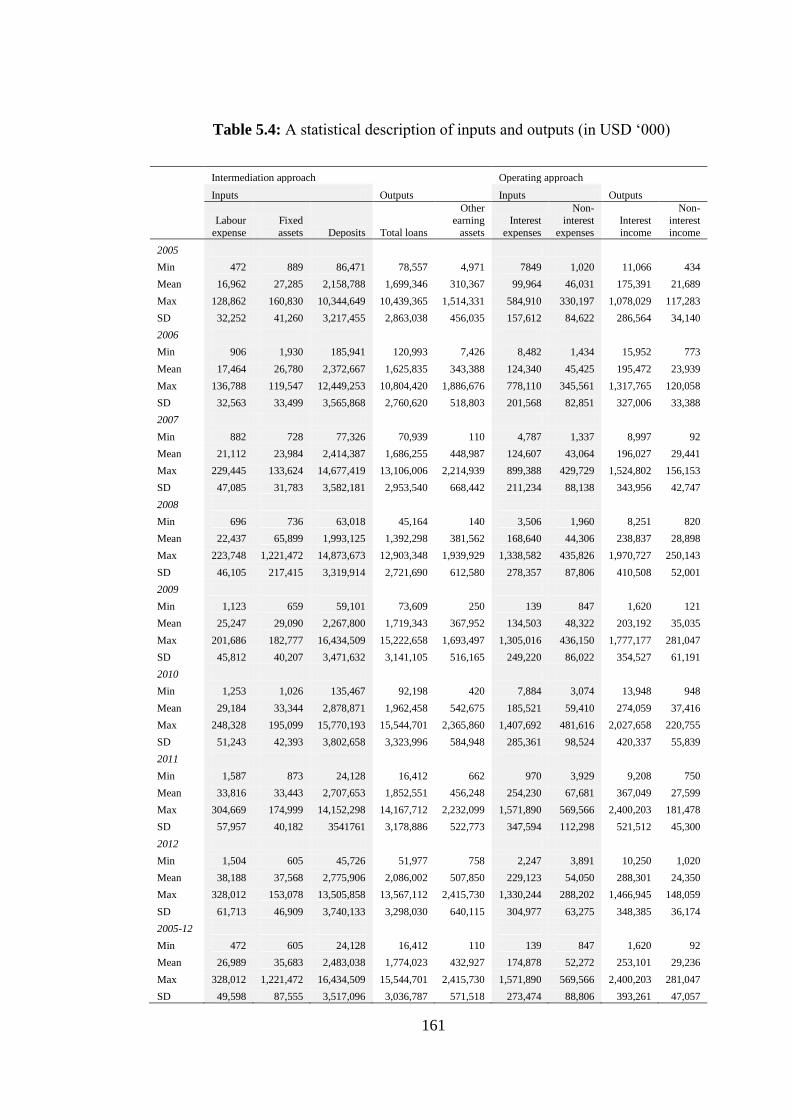
161
19Table 5.4: A statistical description of inputs and outputs (in USD ‗000)
Intermediation approach Operating approach
Inputs Outputs Inputs Outputs
Labour
expense
Fixed
assets Deposits Total loans
Other
earning
assets
Interest
expenses
Non-
interest
expenses
Interest
income
Non-
interest
income
2005
Min 472 889 86,471 78,557 4,971 7849 1,020 11,066 434
Mean 16,962 27,285 2,158,788 1,699,346 310,367 99,964 46,031 175,391 21,689
Max 128,862 160,830 10,344,649 10,439,365 1,514,331 584,910 330,197 1,078,029 117,283
SD 32,252 41,260 3,217,455 2,863,038 456,035 157,612 84,622 286,564 34,140
2006
Min 906 1,930 185,941 120,993 7,426 8,482 1,434 15,952 773
Mean 17,464 26,780 2,372,667 1,625,835 343,388 124,340 45,425 195,472 23,939
Max 136,788 119,547 12,449,253 10,804,420 1,886,676 778,110 345,561 1,317,765 120,058
SD 32,563 33,499 3,565,868 2,760,620 518,803 201,568 82,851 327,006 33,388
2007
Min 882 728 77,326 70,939 110 4,787 1,337 8,997 92
Mean 21,112 23,984 2,414,387 1,686,255 448,987 124,607 43,064 196,027 29,441
Max 229,445 133,624 14,677,419 13,106,006 2,214,939 899,388 429,729 1,524,802 156,153
SD 47,085 31,783 3,582,181 2,953,540 668,442 211,234 88,138 343,956 42,747
2008
Min 696 736 63,018 45,164 140 3,506 1,960 8,251 820
Mean 22,437 65,899 1,993,125 1,392,298 381,562 168,640 44,306 238,837 28,898
Max 223,748 1,221,472 14,873,673 12,903,348 1,939,929 1,338,582 435,826 1,970,727 250,143
SD 46,105 217,415 3,319,914 2,721,690 612,580 278,357 87,806 410,508 52,001
2009
Min 1,123 659 59,101 73,609 250 139 847 1,620 121
Mean 25,247 29,090 2,267,800 1,719,343 367,952 134,503 48,322 203,192 35,035
Max 201,686 182,777 16,434,509 15,222,658 1,693,497 1,305,016 436,150 1,777,177 281,047
SD 45,812 40,207 3,471,632 3,141,105 516,165 249,220 86,022 354,527 61,191
2010
Min 1,253 1,026 135,467 92,198 420 7,884 3,074 13,948 948
Mean 29,184 33,344 2,878,871 1,962,458 542,675 185,521 59,410 274,059 37,416
Max 248,328 195,099 15,770,193 15,544,701 2,365,860 1,407,692 481,616 2,027,658 220,755
SD 51,243 42,393 3,802,658 3,323,996 584,948 285,361 98,524 420,337 55,839
2011
Min 1,587 873 24,128 16,412 662 970 3,929 9,208 750
Mean 33,816 33,443 2,707,653 1,852,551 456,248 254,230 67,681 367,049 27,599
Max 304,669 174,999 14,152,298 14,167,712 2,232,099 1,571,890 569,566 2,400,203 181,478
SD 57,957 40,182 3541761 3,178,886 522,773 347,594 112,298 521,512 45,300
2012
Min 1,504 605 45,726 51,977 758 2,247 3,891 10,250 1,020
Mean 38,188 37,568 2,775,906 2,086,002 507,850 229,123 54,050 288,301 24,350
Max 328,012 153,078 13,505,858 13,567,112 2,415,730 1,330,244 288,202 1,466,945 148,059
SD 61,713 46,909 3,740,133 3,298,030 640,115 304,977 63,275 348,385 36,174
2005-12
Min 472 605 24,128 16,412 110 139 847 1,620 92
Mean 26,989 35,683 2,483,038 1,774,023 432,927 174,878 52,272 253,101 29,236
Max 328,012 1,221,472 16,434,509 15,544,701 2,415,730 1,571,890 569,566 2,400,203 281,047
SD 49,598 87,555 3,517,096 3,036,787 571,518 273,474 88,806 393,261 47,057
162
Note: The figures presented are discounted by the inflation rate for the benchmark year 2005, and
converted to US dollars using the exchange rate between the Vietnamese dong and USD on 31/12/2015.
Source: Calculated by the author using data obtained from financial statements and income reports of
banks
5.2.4 Specification of the regression model
Once technical efficiency scores have been measured it is then important to identify the
possible impact of environmental variables on bank performance through regression
analysis. It is apparent that the efficiency score is the dependent variable. However,
defining the independent variables is more complicated and depends on the specific
nature of the study. In this study, environmental variables are classified into three
categories: 1) bank-specific variables; 2) the time trend variable; and 3) variables
indicating new policies that might impact on the banking sector. It is worth noting that
each variable will appear in the meta-frontier DEA model that pools all bank groups
(state-owned, private domestic and foreign/joint venture bank groups) and the group-
frontier DEA model that includes banks of a specific group.
5.2.4.1 Bank-specific variables
Loan to asset ratio (LA)
During the period 2005–2012 Vietnam experienced a credit boom with an average
annual credit growth rate of 35% (in nominal terms). This lending generates traditional
assets including loans and advances and, in order to understand how this activity
impacts upon bank efficiency, the loan to asset ratio is employed following on from the
works of Hasan and Marton (2003), Havrylchyk (2006), Yildirim and Philoppatos
(2007) and Chortareas et al. (2013).
Equity to asset ratio (EA)
163
The equity to asset ratio (EA) is used as a proxy for financial soundness (Fries and Taci,
2005; Grigorian and Manole, 2006; Kumbhakar and Wang, 2007; Jiang et al., 2009). A
higher ratio relates to stronger capacity to protect banks against risks that could lead to
an equity loss.
Return on assets (ROA)
Return on assets (ROA) is included in the model as a proxy for the profitability of banks
(Das and Ghosh, 2006; Hermes and Nhung, 2010; Glass et al., 2014). A positive
association between the profitability of banks and their efficiency is assumed.65
Time trend (T)
To control for the effect of time a time trend variable (T) is introduced which takes the
value 1 for 2005, 2 for 2006 and so on to capture the evolving nature of efficiency. The
time variable and its effect on bank efficiency have been investigated in the literature.
For example, Williams and Nguyen (2005) utilise a time variable when examining the
impact of bank governance on bank performance in the context of Southeast Asian
countries encompassing the pre- and post-EAFC periods. Lensink et al. (2008) employ
a time variable in SFA models when investigating whether the efficiency of foreign
banks depended on the institutional quality of the host and home country.66
65ROE was also considered but ROA provided more significant results. Both ROE and ROA are regularly
used in the literature. 66
When adding a dummy variable capturing the impact of WTO membership the model runs badly and
this is the result of co-linearity between the WTO dummy and the other dummies that proxy for new
policy reforms adapted after the WTO event. As an alternative, the Li test and Simar and Zelenyuk tests
are used to investigate the difference of bank performance between the pre- and post-WTO entry periods
(see Section 5.3).
164
5.2.4.2 Policy-change related variables
The following variables are chosen to show the association between Vietnam‘s policy
changes in the context of the banking sector and banks‘ performance in the post-WTO
period.
FSI: dummy variable for foreign strategic involvement in domestic banks
Foreign investors can become shareholders of SOCBs and JSBs by purchasing their
equity. However, the proportion of equity sold to foreign investors cannot exceed 30%
of the total. To measure the impact of foreign strategic involvement, a dummy variable,
FSI, is utilised to indicate banks with foreign involvement, following the approach of
Hasan and Marton (2003) and Bonin et al. (2005a, 2005b). From a Vietnamese
perspective, a positive relationship between foreign involvement and domestic bank
performance is also assumed due to the advantages of overseas investors, for example
access to advanced banking technology or stronger financial capabilities.
P: dummy variable for equitised SOCBs
In the post-WTO period it was planned that SOCBs would be privatised but this process
had to ensure that the government continued to hold a dominant portion of banks‘
capital. A dummy variable, P, is used for those SOCBs which were partially privatised
and zero for those not involved in this process. Following agent-principal theory, state
ownership can negatively influence the performance of banks in terms of profit
maximising or providing intermediate services and conversely state-owned banks
become more efficient after being privatised (Shleifer and Vishny, 1997; Altunbas et
al., 2001; La Porta et al., 2002). This is because the participation of private shareholders
in parallel with the state makes SOCBs more accountable and requires much stronger
165
commercial-based incentives. The SOCBs‘ model of management changes from an
administrative unit, in which a director assigned by the government plays the role of
both manager and state-owner representative, into a modern corporation with the
separation of the decision making unit (board of directors) and ownership
(shareholders).
RU: dummy variable for JSBs transformed from rural to urban banks
A number of rural JSBs were permitted to transfer to urban banks. It was expected that
these transformed banks would increase their scope of operation and consequently
improve their efficiency; however, poor management and weak capital capability
represented substantial challenges in comparison with other JSBs (WB, 2012; VELP,
2012). The dummy variable RU is employed to distinguish such transformed JSBs from
others in the same group.
BG: dummy variable for JSBs with SOEs or private business groups being the
shareholders
A number of SOEs and private business groups were allowed by the government to
participate in the banking sector and become holding companies of JSBs. Subsequently,
a complex relationship, so-called cross-ownership, between these SOEs (non-bank
business groups) and JSBs was established. Being major shareholders, SOEs can
influence the decision making processes of these banks and channel bank credit to
projects that are of relevance to them. Thus, cross-ownership can obstruct contestability
and facilitate collusion between banks and SOEs/private business groups (Kraft et al.,
2006). In this case it is assumed that cross-ownership can impact the efficiency of JSBs.
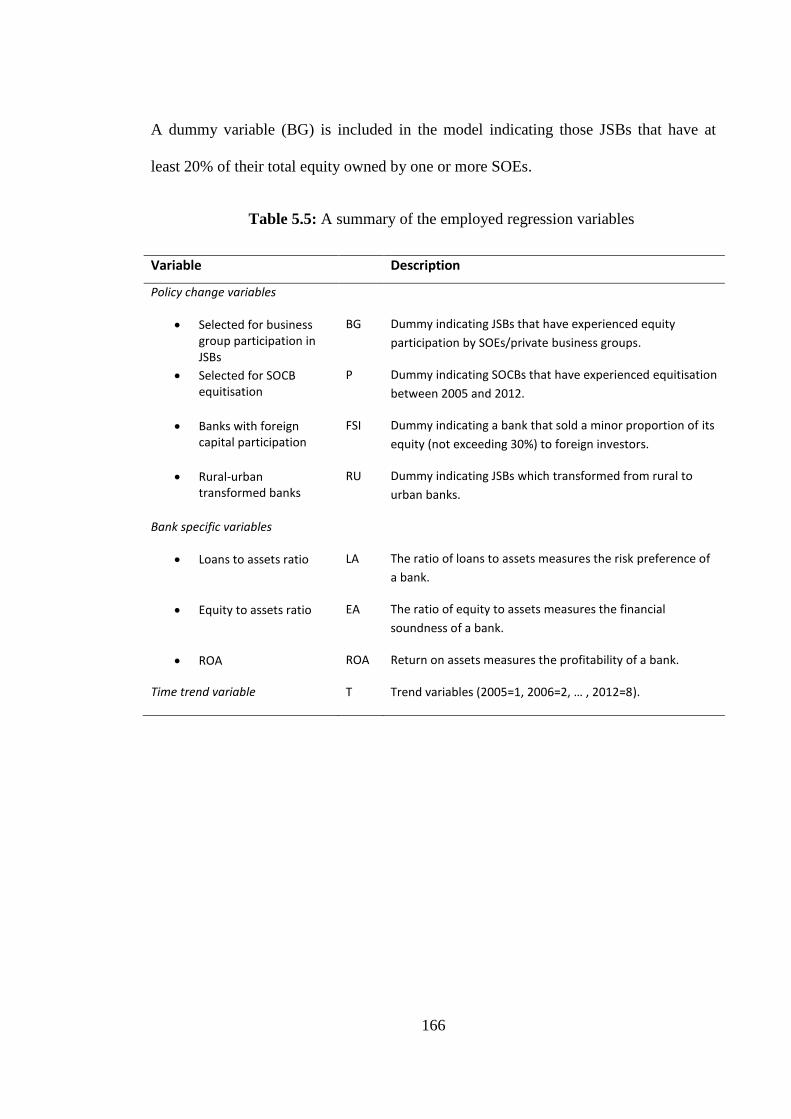
166
A dummy variable (BG) is included in the model indicating those JSBs that have at
least 20% of their total equity owned by one or more SOEs.
20Table 5.5: A summary of the employed regression variables
Variable Description
Policy change variables
Selected for business group participation in JSBs
BG Dummy indicating JSBs that have experienced equity
participation by SOEs/private business groups.
Selected for SOCB equitisation
P Dummy indicating SOCBs that have experienced equitisation
between 2005 and 2012.
Banks with foreign capital participation
FSI Dummy indicating a bank that sold a minor proportion of its
equity (not exceeding 30%) to foreign investors.
Rural-urban transformed banks
RU Dummy indicating JSBs which transformed from rural to
urban banks.
Bank specific variables
Loans to assets ratio LA The ratio of loans to assets measures the risk preference of
a bank.
Equity to assets ratio EA The ratio of equity to assets measures the financial
soundness of a bank.
ROA ROA Return on assets measures the profitability of a bank.
Time trend variable T Trend variables (2005=1, 2006=2, … , 2012=8).
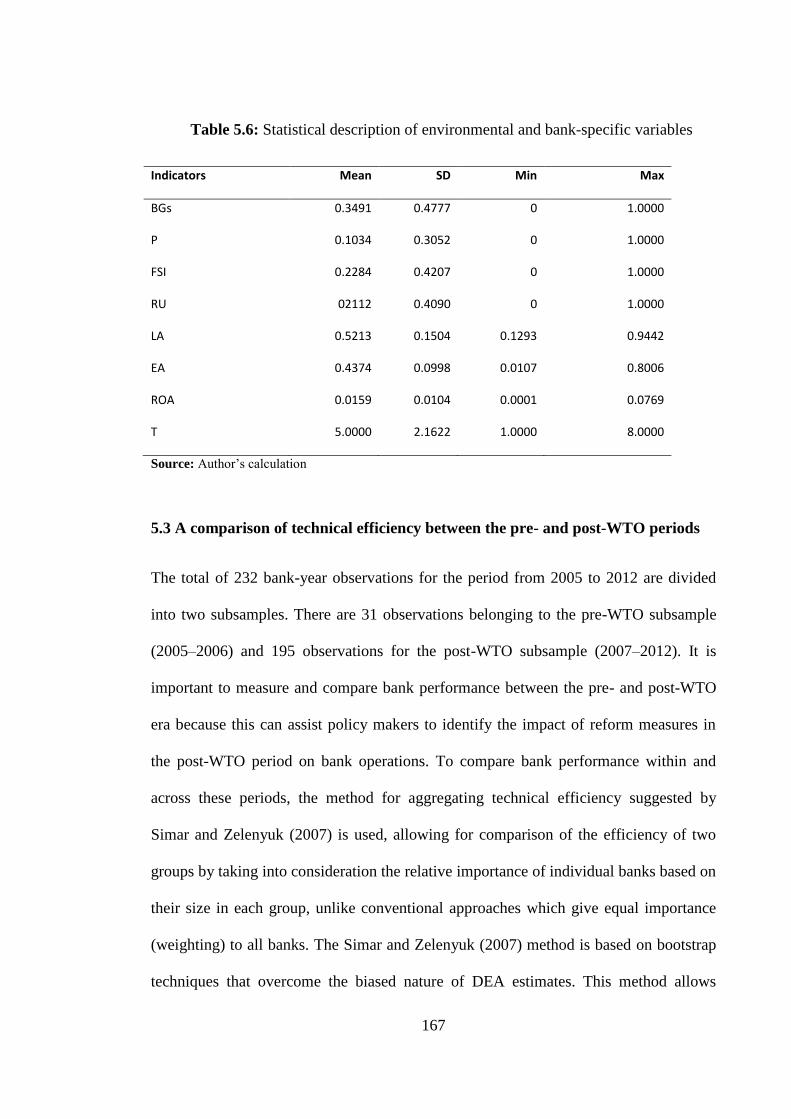
167
21Table 5.6: Statistical description of environmental and bank-specific variables
Indicators Mean SD Min Max
BGs 0.3491 0.4777 0 1.0000
P 0.1034 0.3052 0 1.0000
FSI 0.2284 0.4207 0 1.0000
RU 02112 0.4090 0 1.0000
LA 0.5213 0.1504 0.1293 0.9442
EA 0.4374 0.0998 0.0107 0.8006
ROA 0.0159 0.0104 0.0001 0.0769
T 5.0000 2.1622 1.0000 8.0000
Source: Author‘s calculation
5.3 A comparison of technical efficiency between the pre- and post-WTO periods
The total of 232 bank-year observations for the period from 2005 to 2012 are divided
into two subsamples. There are 31 observations belonging to the pre-WTO subsample
(2005–2006) and 195 observations for the post-WTO subsample (2007–2012). It is
important to measure and compare bank performance between the pre- and post-WTO
era because this can assist policy makers to identify the impact of reform measures in
the post-WTO period on bank operations. To compare bank performance within and
across these periods, the method for aggregating technical efficiency suggested by
Simar and Zelenyuk (2007) is used, allowing for comparison of the efficiency of two
groups by taking into consideration the relative importance of individual banks based on
their size in each group, unlike conventional approaches which give equal importance
(weighting) to all banks. The Simar and Zelenyuk (2007) method is based on bootstrap
techniques that overcome the biased nature of DEA estimates. This method allows
168
recognising the efficiency levels of the pre- and post-WTO periods and testing the
efficiency difference between the two periods. The results are provided in Table 5.7.
Agg.Eff. and M.Eff. represent the aggregate and mean efficiency of the banking sector
in the 2005–2012 period respectively. The bootstrap values of Agg.Eff. and M.Eff. are
found to be 1.2068 and 1.4604 under the intermediation approach and 1.1728 and
1.4187 under the operating approach (Table 5.7)67
. These results reveal that:
1) the mean and aggregate efficiency models provide considerably different
results. The aggregate efficiency values under both approaches are substantially
smaller than the mean values and this confirms the impact of output size on the
efficiency of groups; and
2) inefficiencies under both the intermediation and operating approaches are
greater than unity and those under the intermediation approach are larger than
those under the operating approach, indicating that there is room for Vietnamese
banks to improve their technical efficiencies in terms of both providing
intermediation services and in achieving the profit maximising standard.
On average, using point estimates of efficiency, banks can increase the volume of
intermediation services by 20.68%68
using the bias-corrected aggregate measure or
46.04% in terms of the bias-corrected mean criterion. Using confidence intervals of
efficiency, at a significance level of 5%, intermediation activities can be extended
further than the contemporary volume at a pace between 15.83% and 23.95% in terms
67 The Farrell output-oriented measure of technical efficiency is utilised; thus, the higher value scores
mean that the related banks are less efficient. 68
This increasing rate is compared with the contemporary level of output. Another way in which to
interpret efficiency scores is by transforming the Farrell (1957) type of efficiency as used in this thesis to
the Shephard (1970) type of efficiency. Accordingly, the latter type is equal to the reciprocal form of the
former type. For example, if the score is 1.2068 using the Farrell type of efficiency it would be 0.8286
when applying the Shephard type of efficiency and this figure means that the potential output of banks
can increase by 17.14% with the same level of inputs. The Shephard type way of presenting efficiency
scores can be applied for any similar cases.
169
of the aggregate measure or between 37.72% and 52.69% using the mean measure.
Similarly, interest and non-interest incomes, at a significance level of 5%, can increase
between 12.80% and 20.31% or between 33.34% and 48.86% if the bootstrap aggregate
and mean criterions are used respectively.
The AER (aggregate efficiency ratio), presented in Table 5.7, is the ratio of the pre-
WTO to the post-WTO aggregate efficiency score. Table 5.7 shows that at the 10% and
5% levels of significance, the confidence interval (CI) of AER includes unity (the CIs of
the pre- and post-WTO periods overlap) under both the intermediation and operating
approaches and thus the hypothesis H0 ( )69
, that the efficiency scores for the
pre- and post-WTO era are the same in terms of both providing intermediation services
and also maximising profit, cannot be rejected. The same conclusion can be made using
the MER (mean efficiency ratio), the ratio of pre-WTO to post-WTO mean efficiency
scores (see Table 5.7), on the equality of efficiency scores in the pre- and post-WTO
eras regardless of the input/output approach employed.
In theory, financial liberalisation is expected to improve bank efficiency by eliminating
government control and encouraging the rule of free and fair markets that, in turn,
pressure banks to improve the overall quality of their management and risk management
and to allocate their scarce financial resources more efficiently (Lensink et al., 2008). In
the literature, empirical studies using single-country data have provided mixed results,
indicating that the impact of financial liberalisation can have both positive and negative
effects on bank performance (Hermes and Nhung, 2010). Negative and unexpected
outcomes can be explained by macroeconomic instabilities or even financial crises
occurring during and/or after the liberalisation programs that distort the incentive
69 For more detail on this hypothesis see Subsection 4.3.2.
170
structure of the banks and make the allocation of resources to achieve efficiency a more
difficult task (Denizer et al., 2007). The equality of Vietnamese bank efficiency scores
in the pre- and post-WTO period cannot be rejected, implying that no significant
improvement in bank performance has occurred, contradicting the previously mentioned
empirical literature. In addition, this result is unique when compared to previous studies
which demonstrate either a positive (e.g, Maudos et al., 2007; Berger et al., 2009) or a
negative impact (e.g, Hao et al., 2001; Denizer et al., 2007), but in this case the impact
is insignificant. From 2007 onward, Vietnam has conducted a number of reform
measures and the impact of these on bank efficiency has again been both positive and
negative.70
It is assumed that the influence of positive measures is balanced by the
negative measures resulting in an overall insignificant change to efficiency levels in the
post-WTO period.
70 The studied period (2005–2012) also witnessed the GFC but the impact of this crisis on Vietnamese
bank efficiency was insignificant (see Nguyen et al., 2014). The Simar and Zelenyuk (2007) and Li
(1996) tests can also be utilised to examine the impact of the GFC on Vietnamese bank performance. The
period is divided into two sub-periods, 2005–2007 and 2008–2012. The results are the same as those of
Nguyen et al., pointing to the insignificant impact of the GFC. For more detail see Appendix A.
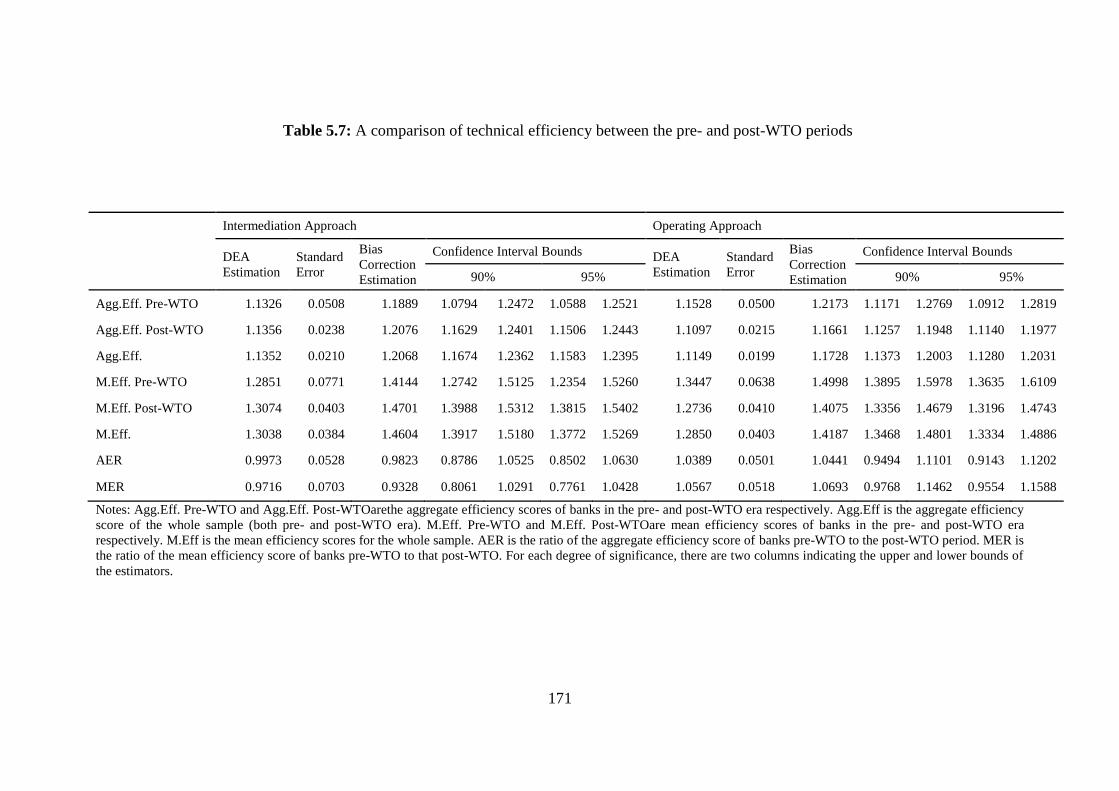
171
22Table 5.7: A comparison of technical efficiency between the pre- and post-WTO periods
Notes: Agg.Eff. Pre-WTO and Agg.Eff. Post-WTOarethe aggregate efficiency scores of banks in the pre- and post-WTO era respectively. Agg.Eff is the aggregate efficiency
score of the whole sample (both pre- and post-WTO era). M.Eff. Pre-WTO and M.Eff. Post-WTOare mean efficiency scores of banks in the pre- and post-WTO era
respectively. M.Eff is the mean efficiency scores for the whole sample. AER is the ratio of the aggregate efficiency score of banks pre-WTO to the post-WTO period. MER is
the ratio of the mean efficiency score of banks pre-WTO to that post-WTO. For each degree of significance, there are two columns indicating the upper and lower bounds of
the estimators.
Intermediation Approach Operating Approach
DEA
Estimation
Standard
Error
Bias
Correction
Estimation
Confidence Interval Bounds DEA
Estimation
Standard
Error
Bias
Correction
Estimation
Confidence Interval Bounds
90% 95% 90% 95%
Agg.Eff. Pre-WTO 1.1326 0.0508 1.1889 1.0794 1.2472 1.0588 1.2521 1.1528 0.0500 1.2173 1.1171 1.2769 1.0912 1.2819
Agg.Eff. Post-WTO 1.1356 0.0238 1.2076 1.1629 1.2401 1.1506 1.2443 1.1097 0.0215 1.1661 1.1257 1.1948 1.1140 1.1977
Agg.Eff. 1.1352 0.0210 1.2068 1.1674 1.2362 1.1583 1.2395 1.1149 0.0199 1.1728 1.1373 1.2003 1.1280 1.2031
M.Eff. Pre-WTO 1.2851 0.0771 1.4144 1.2742 1.5125 1.2354 1.5260 1.3447 0.0638 1.4998 1.3895 1.5978 1.3635 1.6109
M.Eff. Post-WTO 1.3074 0.0403 1.4701 1.3988 1.5312 1.3815 1.5402 1.2736 0.0410 1.4075 1.3356 1.4679 1.3196 1.4743
M.Eff. 1.3038 0.0384 1.4604 1.3917 1.5180 1.3772 1.5269 1.2850 0.0403 1.4187 1.3468 1.4801 1.3334 1.4886
AER 0.9973 0.0528 0.9823 0.8786 1.0525 0.8502 1.0630 1.0389 0.0501 1.0441 0.9494 1.1101 0.9143 1.1202
MER 0.9716 0.0703 0.9328 0.8061 1.0291 0.7761 1.0428 1.0567 0.0518 1.0693 0.9768 1.1462 0.9554 1.1588
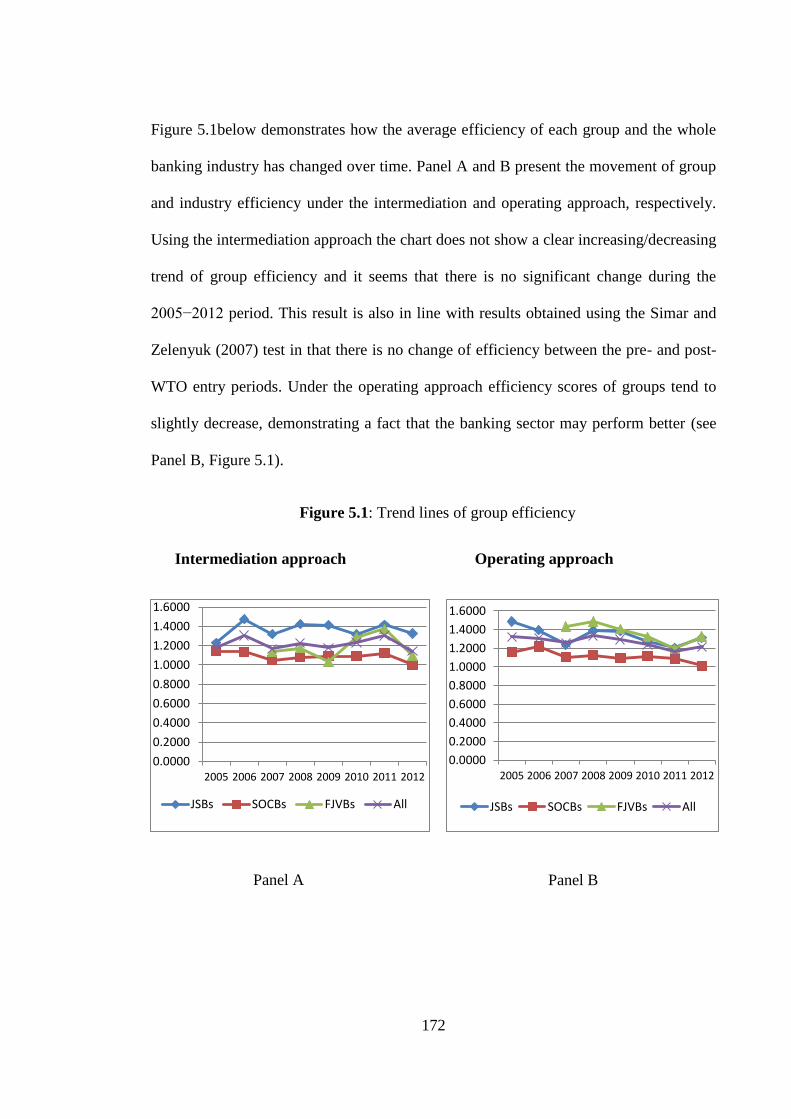
172
Figure 5.1below demonstrates how the average efficiency of each group and the whole
banking industry has changed over time. Panel A and B present the movement of group
and industry efficiency under the intermediation and operating approach, respectively.
Using the intermediation approach the chart does not show a clear increasing/decreasing
trend of group efficiency and it seems that there is no significant change during the
2005−2012 period. This result is also in line with results obtained using the Simar and
Zelenyuk (2007) test in that there is no change of efficiency between the pre- and post-
WTO entry periods. Under the operating approach efficiency scores of groups tend to
slightly decrease, demonstrating a fact that the banking sector may perform better (see
Panel B, Figure 5.1).
5Figure 5.1: Trend lines of group efficiency
Intermediation approach Operating approach
0.0000
0.2000
0.4000
0.6000
0.8000
1.0000
1.2000
1.4000
1.6000
2005 2006 2007 2008 2009 2010 2011 2012
JSBs SOCBs FJVBs All
0.0000
0.2000
0.4000
0.6000
0.8000
1.0000
1.2000
1.4000
1.6000
2005 2006 2007 2008 2009 2010 2011 2012
JSBs SOCBs FJVBs All
Panel A Panel B
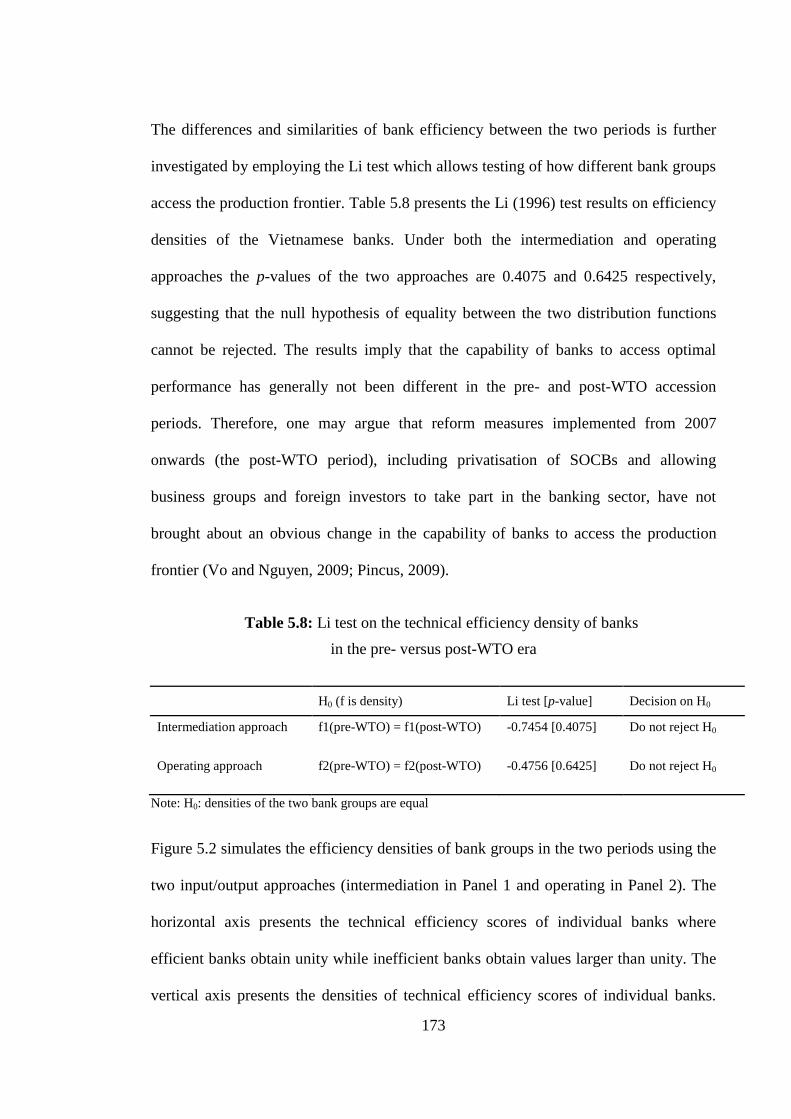
173
The differences and similarities of bank efficiency between the two periods is further
investigated by employing the Li test which allows testing of how different bank groups
access the production frontier. Table 5.8 presents the Li (1996) test results on efficiency
densities of the Vietnamese banks. Under both the intermediation and operating
approaches the p-values of the two approaches are 0.4075 and 0.6425 respectively,
suggesting that the null hypothesis of equality between the two distribution functions
cannot be rejected. The results imply that the capability of banks to access optimal
performance has generally not been different in the pre- and post-WTO accession
periods. Therefore, one may argue that reform measures implemented from 2007
onwards (the post-WTO period), including privatisation of SOCBs and allowing
business groups and foreign investors to take part in the banking sector, have not
brought about an obvious change in the capability of banks to access the production
frontier (Vo and Nguyen, 2009; Pincus, 2009).
23Table 5.8: Li test on the technical efficiency density of banks
in the pre- versus post-WTO era
H0 (f is density) Li test [p-value] Decision on H0
Intermediation approach f1(pre-WTO) = f1(post-WTO) -0.7454 [0.4075] Do not reject H0
Operating approach f2(pre-WTO) = f2(post-WTO) -0.4756 [0.6425] Do not reject H0
Note: H0: densities of the two bank groups are equal
Figure 5.2 simulates the efficiency densities of bank groups in the two periods using the
two input/output approaches (intermediation in Panel 1 and operating in Panel 2). The
horizontal axis presents the technical efficiency scores of individual banks where
efficient banks obtain unity while inefficient banks obtain values larger than unity. The
vertical axis presents the densities of technical efficiency scores of individual banks.
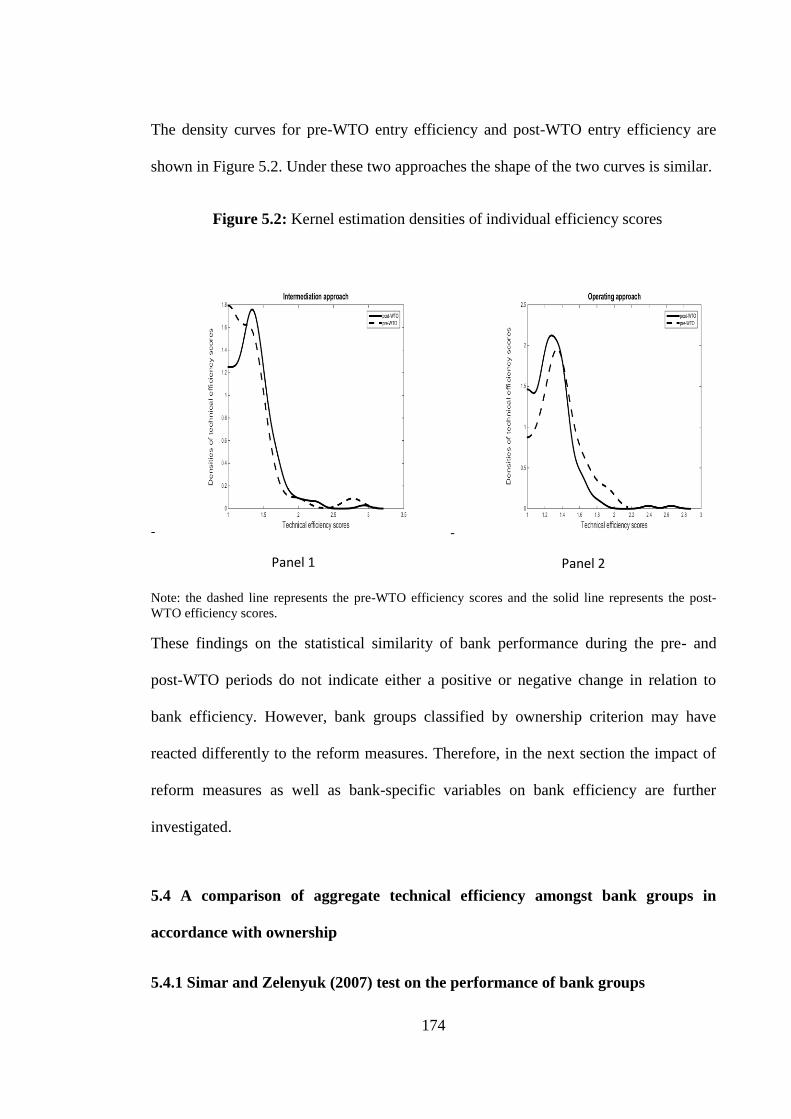
174
The density curves for pre-WTO entry efficiency and post-WTO entry efficiency are
shown in Figure 5.2. Under these two approaches the shape of the two curves is similar.
6Figure 5.2: Kernel estimation densities of individual efficiency scores
Note: the dashed line represents the pre-WTO efficiency scores and the solid line represents the post-
WTO efficiency scores.
These findings on the statistical similarity of bank performance during the pre- and
post-WTO periods do not indicate either a positive or negative change in relation to
bank efficiency. However, bank groups classified by ownership criterion may have
reacted differently to the reform measures. Therefore, in the next section the impact of
reform measures as well as bank-specific variables on bank efficiency are further
investigated.
5.4 A comparison of aggregate technical efficiency amongst bank groups in
accordance with ownership
5.4.1 Simar and Zelenyuk (2007) test on the performance of bank groups
-
Panel 1
-
Panel 2
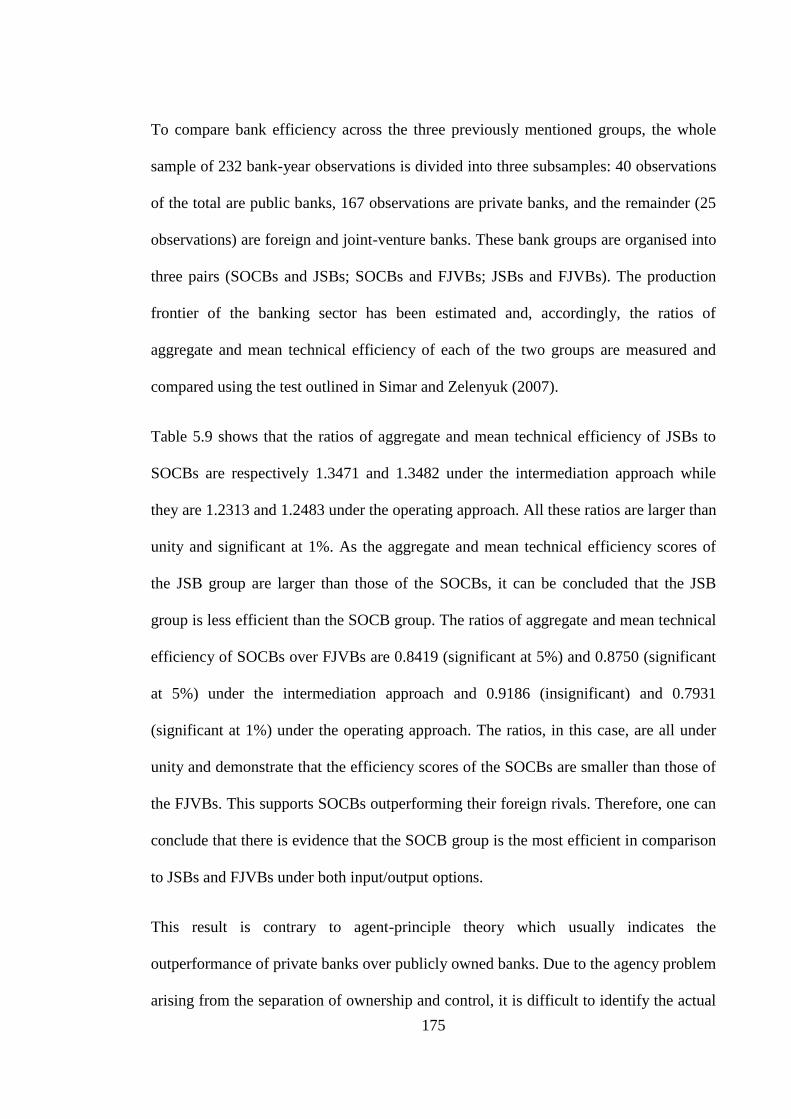
175
To compare bank efficiency across the three previously mentioned groups, the whole
sample of 232 bank-year observations is divided into three subsamples: 40 observations
of the total are public banks, 167 observations are private banks, and the remainder (25
observations) are foreign and joint-venture banks. These bank groups are organised into
three pairs (SOCBs and JSBs; SOCBs and FJVBs; JSBs and FJVBs). The production
frontier of the banking sector has been estimated and, accordingly, the ratios of
aggregate and mean technical efficiency of each of the two groups are measured and
compared using the test outlined in Simar and Zelenyuk (2007).
Table 5.9 shows that the ratios of aggregate and mean technical efficiency of JSBs to
SOCBs are respectively 1.3471 and 1.3482 under the intermediation approach while
they are 1.2313 and 1.2483 under the operating approach. All these ratios are larger than
unity and significant at 1%. As the aggregate and mean technical efficiency scores of
the JSB group are larger than those of the SOCBs, it can be concluded that the JSB
group is less efficient than the SOCB group. The ratios of aggregate and mean technical
efficiency of SOCBs over FJVBs are 0.8419 (significant at 5%) and 0.8750 (significant
at 5%) under the intermediation approach and 0.9186 (insignificant) and 0.7931
(significant at 1%) under the operating approach. The ratios, in this case, are all under
unity and demonstrate that the efficiency scores of the SOCBs are smaller than those of
the FJVBs. This supports SOCBs outperforming their foreign rivals. Therefore, one can
conclude that there is evidence that the SOCB group is the most efficient in comparison
to JSBs and FJVBs under both input/output options.
This result is contrary to agent-principle theory which usually indicates the
outperformance of private banks over publicly owned banks. Due to the agency problem
arising from the separation of ownership and control, it is difficult to identify the actual
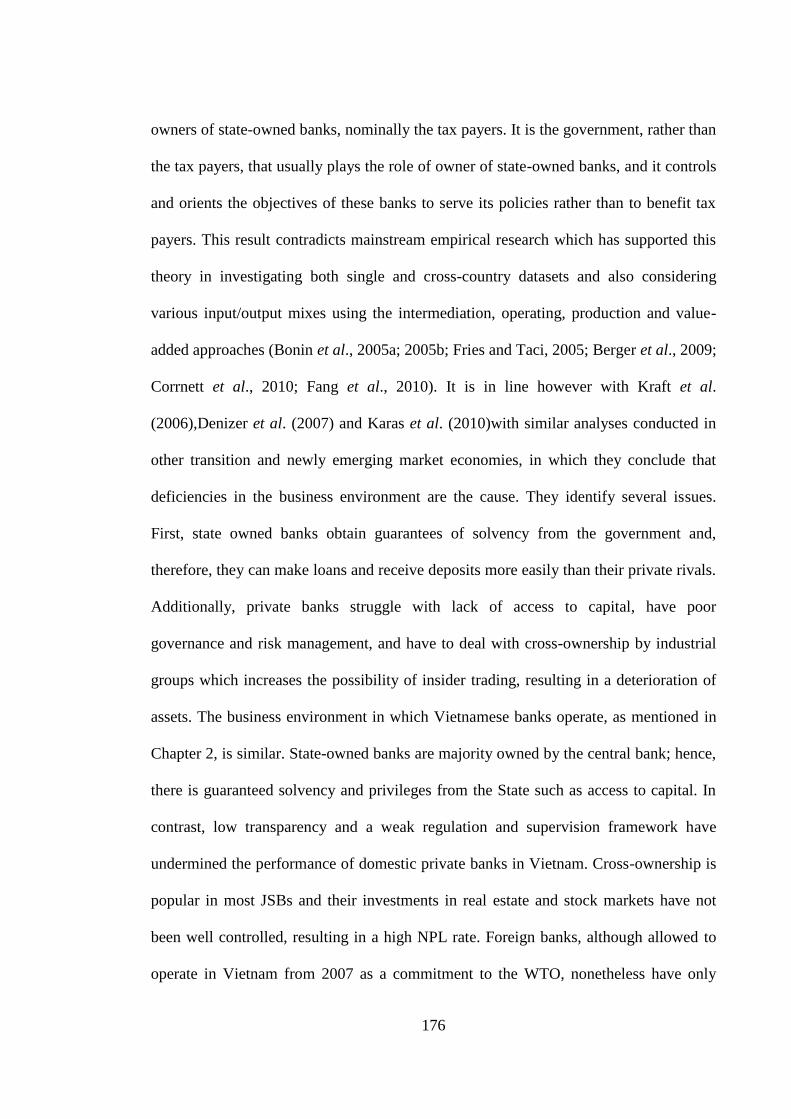
176
owners of state-owned banks, nominally the tax payers. It is the government, rather than
the tax payers, that usually plays the role of owner of state-owned banks, and it controls
and orients the objectives of these banks to serve its policies rather than to benefit tax
payers. This result contradicts mainstream empirical research which has supported this
theory in investigating both single and cross-country datasets and also considering
various input/output mixes using the intermediation, operating, production and value-
added approaches (Bonin et al., 2005a; 2005b; Fries and Taci, 2005; Berger et al., 2009;
Corrnett et al., 2010; Fang et al., 2010). It is in line however with Kraft et al.
(2006),Denizer et al. (2007) and Karas et al. (2010)with similar analyses conducted in
other transition and newly emerging market economies, in which they conclude that
deficiencies in the business environment are the cause. They identify several issues.
First, state owned banks obtain guarantees of solvency from the government and,
therefore, they can make loans and receive deposits more easily than their private rivals.
Additionally, private banks struggle with lack of access to capital, have poor
governance and risk management, and have to deal with cross-ownership by industrial
groups which increases the possibility of insider trading, resulting in a deterioration of
assets. The business environment in which Vietnamese banks operate, as mentioned in
Chapter 2, is similar. State-owned banks are majority owned by the central bank; hence,
there is guaranteed solvency and privileges from the State such as access to capital. In
contrast, low transparency and a weak regulation and supervision framework have
undermined the performance of domestic private banks in Vietnam. Cross-ownership is
popular in most JSBs and their investments in real estate and stock markets have not
been well controlled, resulting in a high NPL rate. Foreign banks, although allowed to
operate in Vietnam from 2007 as a commitment to the WTO, nonetheless have only
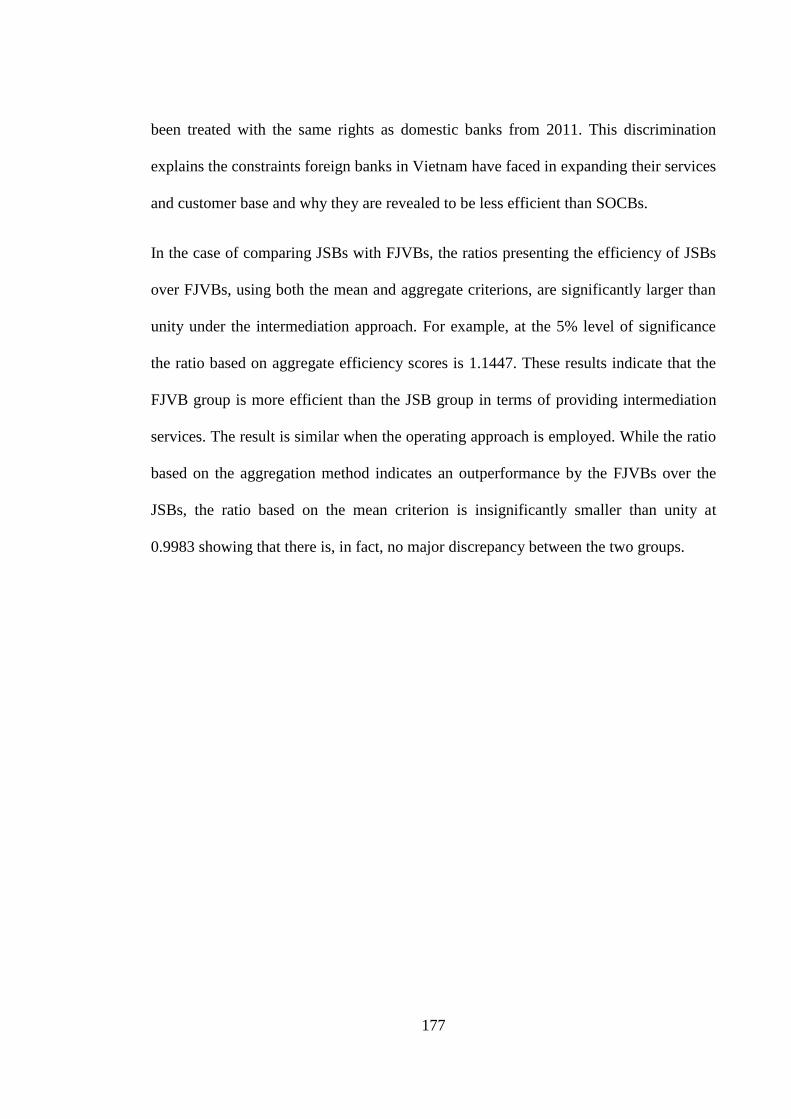
177
been treated with the same rights as domestic banks from 2011. This discrimination
explains the constraints foreign banks in Vietnam have faced in expanding their services
and customer base and why they are revealed to be less efficient than SOCBs.
In the case of comparing JSBs with FJVBs, the ratios presenting the efficiency of JSBs
over FJVBs, using both the mean and aggregate criterions, are significantly larger than
unity under the intermediation approach. For example, at the 5% level of significance
the ratio based on aggregate efficiency scores is 1.1447. These results indicate that the
FJVB group is more efficient than the JSB group in terms of providing intermediation
services. The result is similar when the operating approach is employed. While the ratio
based on the aggregation method indicates an outperformance by the FJVBs over the
JSBs, the ratio based on the mean criterion is insignificantly smaller than unity at
0.9983 showing that there is, in fact, no major discrepancy between the two groups.
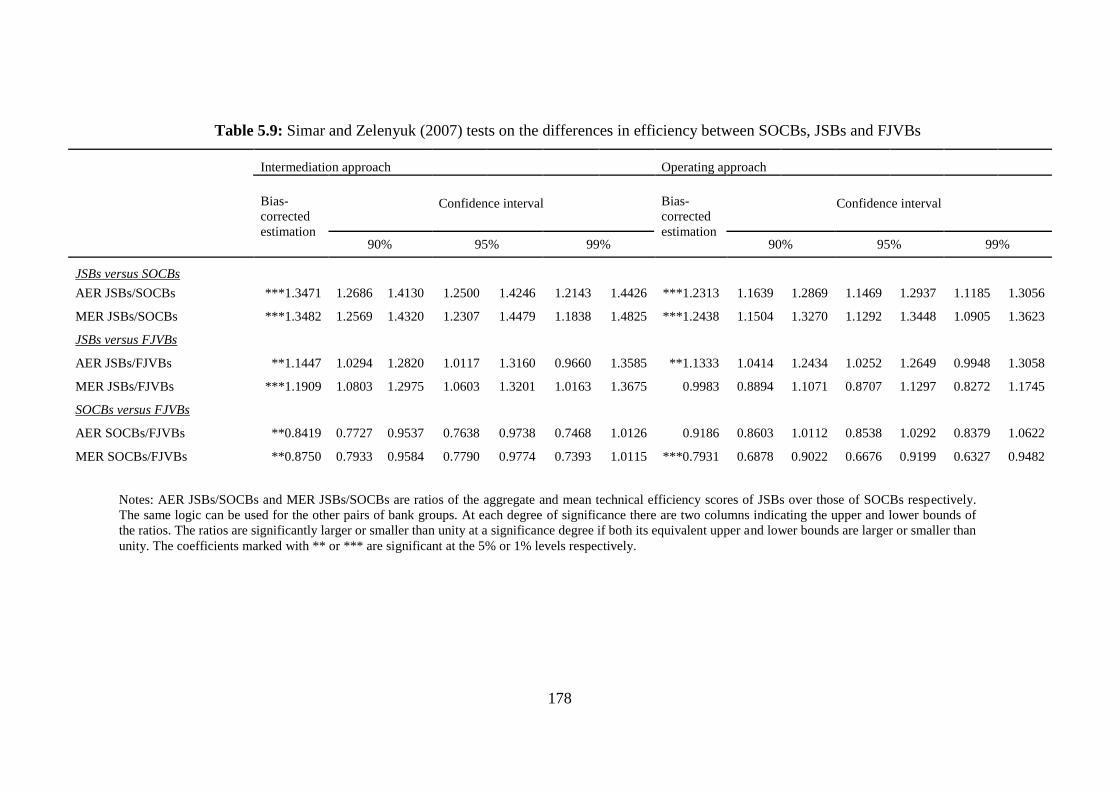
178
24Table 5.9: Simar and Zelenyuk (2007) tests on the differences in efficiency between SOCBs, JSBs and FJVBs
Intermediation approach Operating approach
Bias-
corrected
estimation
Confidence interval Bias-
corrected
estimation
Confidence interval
90% 95% 99% 90% 95% 99%
JSBs versus SOCBs
AER JSBs/SOCBs ***1.3471 1.2686 1.4130 1.2500 1.4246 1.2143 1.4426 ***1.2313 1.1639 1.2869 1.1469 1.2937 1.1185 1.3056
MER JSBs/SOCBs ***1.3482 1.2569 1.4320 1.2307 1.4479 1.1838 1.4825 ***1.2438 1.1504 1.3270 1.1292 1.3448 1.0905 1.3623
JSBs versus FJVBs
AER JSBs/FJVBs **1.1447 1.0294 1.2820 1.0117 1.3160 0.9660 1.3585 **1.1333 1.0414 1.2434 1.0252 1.2649 0.9948 1.3058
MER JSBs/FJVBs ***1.1909 1.0803 1.2975 1.0603 1.3201 1.0163 1.3675 0.9983 0.8894 1.1071 0.8707 1.1297 0.8272 1.1745
SOCBs versus FJVBs
AER SOCBs/FJVBs **0.8419 0.7727 0.9537 0.7638 0.9738 0.7468 1.0126 0.9186 0.8603 1.0112 0.8538 1.0292 0.8379 1.0622
MER SOCBs/FJVBs **0.8750 0.7933 0.9584 0.7790 0.9774 0.7393 1.0115 ***0.7931 0.6878 0.9022 0.6676 0.9199 0.6327 0.9482
Notes: AER JSBs/SOCBs and MER JSBs/SOCBs are ratios of the aggregate and mean technical efficiency scores of JSBs over those of SOCBs respectively.
The same logic can be used for the other pairs of bank groups. At each degree of significance there are two columns indicating the upper and lower bounds of
the ratios. The ratios are significantly larger or smaller than unity at a significance degree if both its equivalent upper and lower bounds are larger or smaller than
unity. The coefficients marked with ** or *** are significant at the 5% or 1% levels respectively.
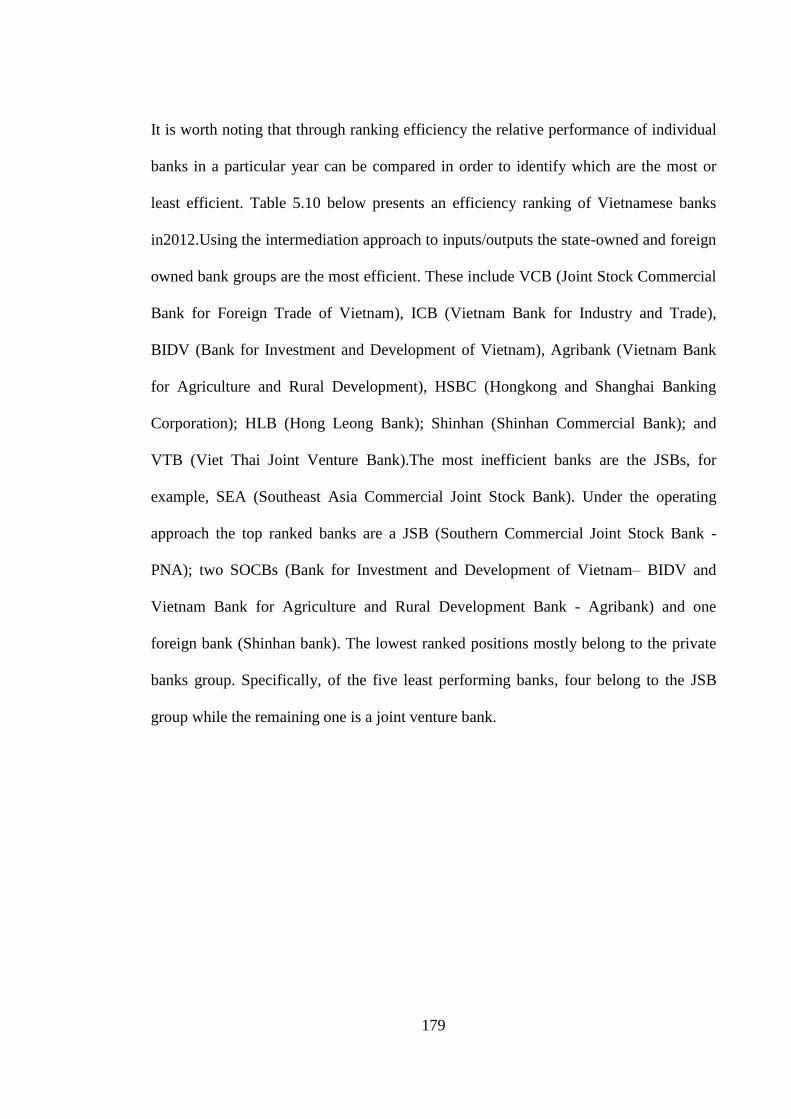
179
It is worth noting that through ranking efficiency the relative performance of individual
banks in a particular year can be compared in order to identify which are the most or
least efficient. Table 5.10 below presents an efficiency ranking of Vietnamese banks
in2012.Using the intermediation approach to inputs/outputs the state-owned and foreign
owned bank groups are the most efficient. These include VCB (Joint Stock Commercial
Bank for Foreign Trade of Vietnam), ICB (Vietnam Bank for Industry and Trade),
BIDV (Bank for Investment and Development of Vietnam), Agribank (Vietnam Bank
for Agriculture and Rural Development), HSBC (Hongkong and Shanghai Banking
Corporation); HLB (Hong Leong Bank); Shinhan (Shinhan Commercial Bank); and
VTB (Viet Thai Joint Venture Bank).The most inefficient banks are the JSBs, for
example, SEA (Southeast Asia Commercial Joint Stock Bank). Under the operating
approach the top ranked banks are a JSB (Southern Commercial Joint Stock Bank -
PNA); two SOCBs (Bank for Investment and Development of Vietnam– BIDV and
Vietnam Bank for Agriculture and Rural Development Bank - Agribank) and one
foreign bank (Shinhan bank). The lowest ranked positions mostly belong to the private
banks group. Specifically, of the five least performing banks, four belong to the JSB
group while the remaining one is a joint venture bank.
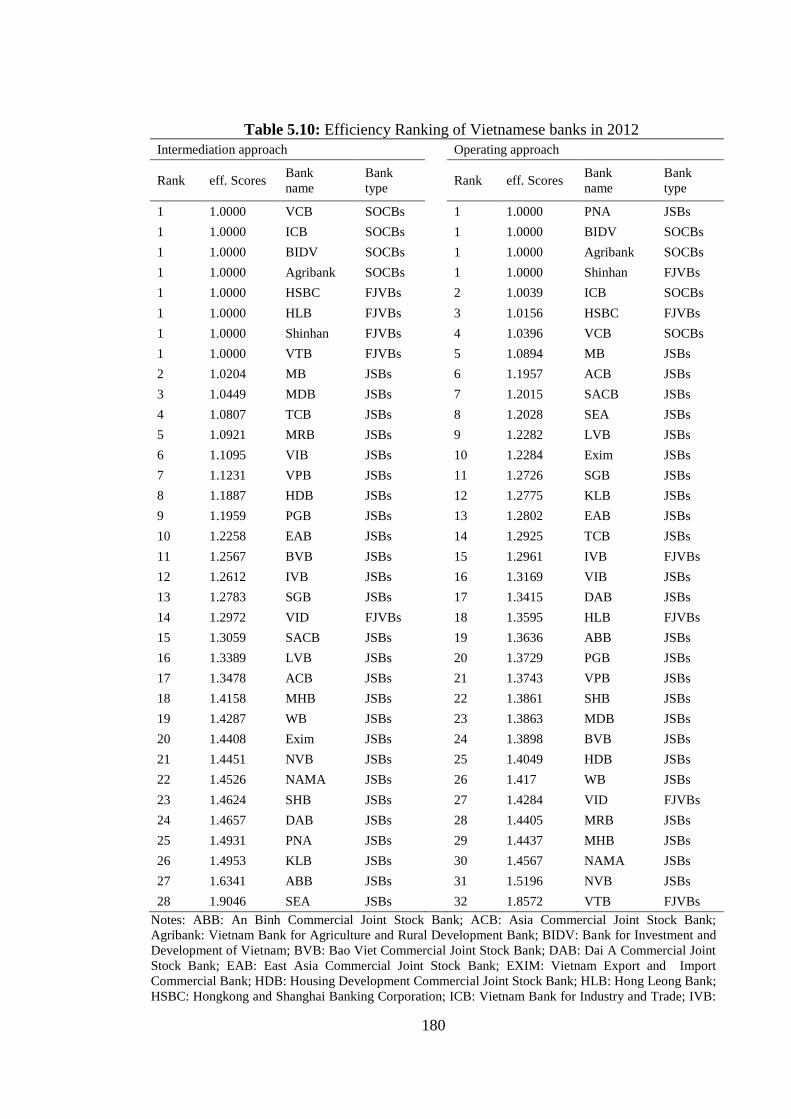
180
25Table 5.10: Efficiency Ranking of Vietnamese banks in 2012
Intermediation approach Operating approach
Rank eff. Scores Bank
name
Bank
type Rank eff. Scores
Bank
name
Bank
type
1 1.0000 VCB SOCBs
1 1.0000 PNA JSBs
1 1.0000 ICB SOCBs
1 1.0000 BIDV SOCBs
1 1.0000 BIDV SOCBs
1 1.0000 Agribank SOCBs
1 1.0000 Agribank SOCBs
1 1.0000 Shinhan FJVBs
1 1.0000 HSBC FJVBs
2 1.0039 ICB SOCBs
1 1.0000 HLB FJVBs
3 1.0156 HSBC FJVBs
1 1.0000 Shinhan FJVBs
4 1.0396 VCB SOCBs
1 1.0000 VTB FJVBs
5 1.0894 MB JSBs
2 1.0204 MB JSBs
6 1.1957 ACB JSBs
3 1.0449 MDB JSBs
7 1.2015 SACB JSBs
4 1.0807 TCB JSBs
8 1.2028 SEA JSBs
5 1.0921 MRB JSBs
9 1.2282 LVB JSBs
6 1.1095 VIB JSBs
10 1.2284 Exim JSBs
7 1.1231 VPB JSBs
11 1.2726 SGB JSBs
8 1.1887 HDB JSBs
12 1.2775 KLB JSBs
9 1.1959 PGB JSBs
13 1.2802 EAB JSBs
10 1.2258 EAB JSBs
14 1.2925 TCB JSBs
11 1.2567 BVB JSBs
15 1.2961 IVB FJVBs
12 1.2612 IVB JSBs
16 1.3169 VIB JSBs
13 1.2783 SGB JSBs
17 1.3415 DAB JSBs
14 1.2972 VID FJVBs
18 1.3595 HLB FJVBs
15 1.3059 SACB JSBs
19 1.3636 ABB JSBs
16 1.3389 LVB JSBs
20 1.3729 PGB JSBs
17 1.3478 ACB JSBs
21 1.3743 VPB JSBs
18 1.4158 MHB JSBs
22 1.3861 SHB JSBs
19 1.4287 WB JSBs
23 1.3863 MDB JSBs
20 1.4408 Exim JSBs
24 1.3898 BVB JSBs
21 1.4451 NVB JSBs
25 1.4049 HDB JSBs
22 1.4526 NAMA JSBs
26 1.417 WB JSBs
23 1.4624 SHB JSBs
27 1.4284 VID FJVBs
24 1.4657 DAB JSBs
28 1.4405 MRB JSBs
25 1.4931 PNA JSBs
29 1.4437 MHB JSBs
26 1.4953 KLB JSBs
30 1.4567 NAMA JSBs
27 1.6341 ABB JSBs
31 1.5196 NVB JSBs
28 1.9046 SEA JSBs 32 1.8572 VTB FJVBs
Notes: ABB: An Binh Commercial Joint Stock Bank; ACB: Asia Commercial Joint Stock Bank;
Agribank: Vietnam Bank for Agriculture and Rural Development Bank; BIDV: Bank for Investment and
Development of Vietnam; BVB: Bao Viet Commercial Joint Stock Bank; DAB: Dai A Commercial Joint
Stock Bank; EAB: East Asia Commercial Joint Stock Bank; EXIM: Vietnam Export and Import
Commercial Bank; HDB: Housing Development Commercial Joint Stock Bank; HLB: Hong Leong Bank;
HSBC: Hongkong and Shanghai Banking Corporation; ICB: Vietnam Bank for Industry and Trade; IVB:
181
International Vietnam Bank; KLB: Kien Long Commercial Joint Stock Bank; LVB: Lien Viet Bank; MB:
Military Commercial Joint Stock Bank; MDB: Mekong Development Bank; MHB: Mekong Housing
Bank; MRB: The Maritime Commercial Joint Stock Bank; NAMA: Nam A Commercial Joint Stock
Bank; NVB: Nam Viet Commercial Joint Stock Bank; PGB: Petrolimex Group Commercial Joint Stock
Bank; PNA: Southern Commercial Joint Stock Bank; SACB: Saigon Thuong Tin Commercial Joint Stock
Bank; SEA: Southeast Asia Commercial Joint Stock Bank; SGB: Saigon Commercial Bank; SHB:
Saigon-Hanoi Commercial Joint Stock Bank; Shinhan: Shinhan Commercial Bank; TCB: Viet Nam
Technological and Commercial Joint Stock Bank; VCB: Joint Stock Commercial Bank for Foreign Trade
of Vietnam; VID: Vid Public Joint Venture Bank; VPB: Vietnam Prosperity Commercial Joint Stock
Bank; VTB: Viet Thai Joint Venture Bank: VIB: Vietnam International Commercial Joint Stock Bank:
WB: Western Commercial Joint Stock Bank.
5.4.2 Li test on the performance of bank groups
To provide another insight on the differences in bank group performance the Li (1996)
test is used to investigate whether accessibility to the production frontier is divergent
across bank groups. Table 5.10 presents Li test results on the three pairs of bank groups
under both the intermediation and operating approaches.
The result for the first pair, being JSBs and SOCBs, shows that the two groups access
the production frontier differently. The Li test statistics are 13.3329 and 14.0204 under
the intermediation and operating approaches respectively. The p-value of both
approaches are 0.0000 suggesting that the efficiency densities for the two groups are not
equal. The same results are obtained for the JSB/FJVB pair. The p-value of Li statistics
are 0.0020 and 0.0030 under the intermediation and operating approaches respectively,
supporting an inequality of efficiency densities between the JSB and FJVB groups.
The above inequalities could have resulted from different responses and treatments in
the business environment which could explain the disparity of the groups‘ accessibility
to the production frontier. In the context of Vietnam, where transition to a market
economy is still at a relatively early stage, a level playing field for private and state-
owned banks has not been established. The State, by controlling and employing the
banking sector as a means to achieve political outcomes, has given a lot of privileges to
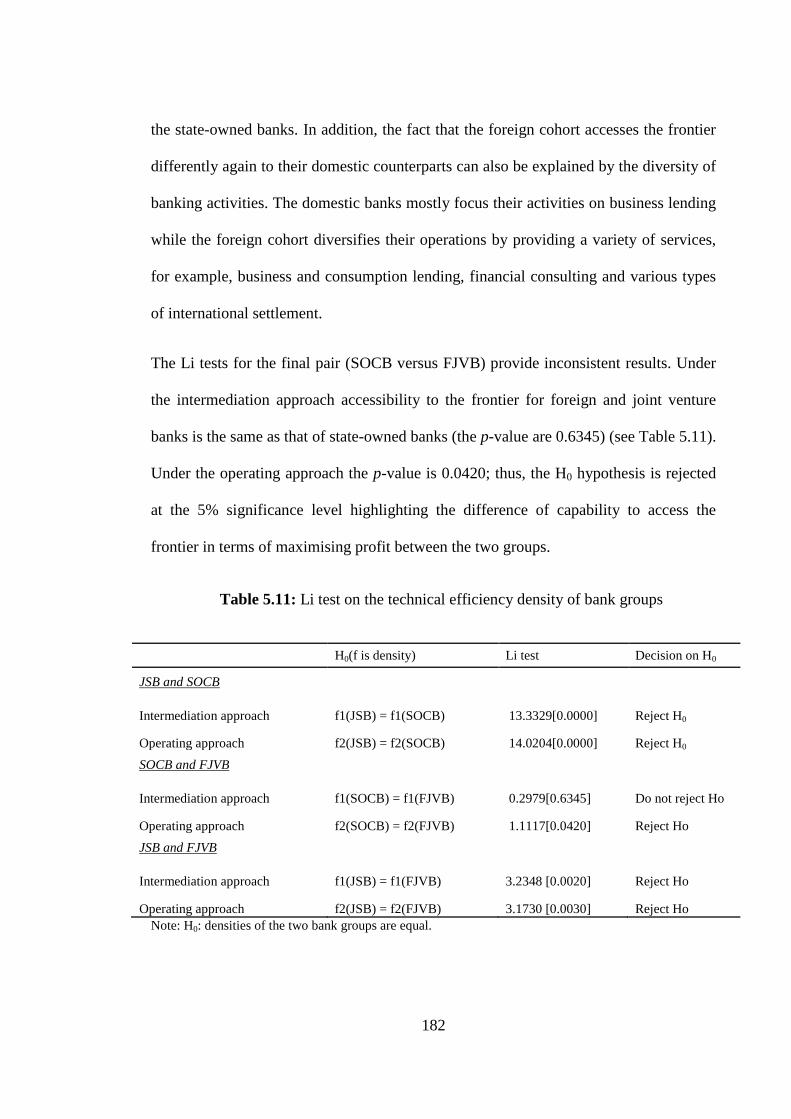
182
the state-owned banks. In addition, the fact that the foreign cohort accesses the frontier
differently again to their domestic counterparts can also be explained by the diversity of
banking activities. The domestic banks mostly focus their activities on business lending
while the foreign cohort diversifies their operations by providing a variety of services,
for example, business and consumption lending, financial consulting and various types
of international settlement.
The Li tests for the final pair (SOCB versus FJVB) provide inconsistent results. Under
the intermediation approach accessibility to the frontier for foreign and joint venture
banks is the same as that of state-owned banks (the p-value are 0.6345) (see Table 5.11).
Under the operating approach the p-value is 0.0420; thus, the H0 hypothesis is rejected
at the 5% significance level highlighting the difference of capability to access the
frontier in terms of maximising profit between the two groups.
26Table 5.11: Li test on the technical efficiency density of bank groups
H0(f is density) Li test Decision on H0
JSB and SOCB
Intermediation approach f1(JSB) = f1(SOCB) 13.3329[0.0000] Reject H0
Operating approach f2(JSB) = f2(SOCB) 14.0204[0.0000] Reject H0
SOCB and FJVB
Intermediation approach f1(SOCB) = f1(FJVB) 0.2979[0.6345] Do not reject Ho
Operating approach f2(SOCB) = f2(FJVB) 1.1117[0.0420] Reject Ho
JSB and FJVB
Intermediation approach f1(JSB) = f1(FJVB) 3.2348 [0.0020] Reject Ho
Operating approach f2(JSB) = f2(FJVB) 3.1730 [0.0030] Reject Ho
Note: H0: densities of the two bank groups are equal.
183
Figure 5.3 shows the Kernel estimation densities of individual efficiency scores of
banks belonging to different groups under the intermediation and operating approaches.
The three groups are organised into pairs: JSBs versus SOCBs (see panel A and B);
SOCBs versus FJVBs (see panel C and D) and JSBs versus FJVBs (see panel E and F).
Each panel is a Cartesian coordinate system with the horizontal axis presenting
technical efficiency scores and the vertical axis presenting densities. The curve inside
the panel, demonstrating possible coordinates of efficiency scores and densities, shows
how the distribution of these scores vary. Observing all the panels, it is clear that the
curves are asymptotic to the horizontal lines when the efficiency score increases.
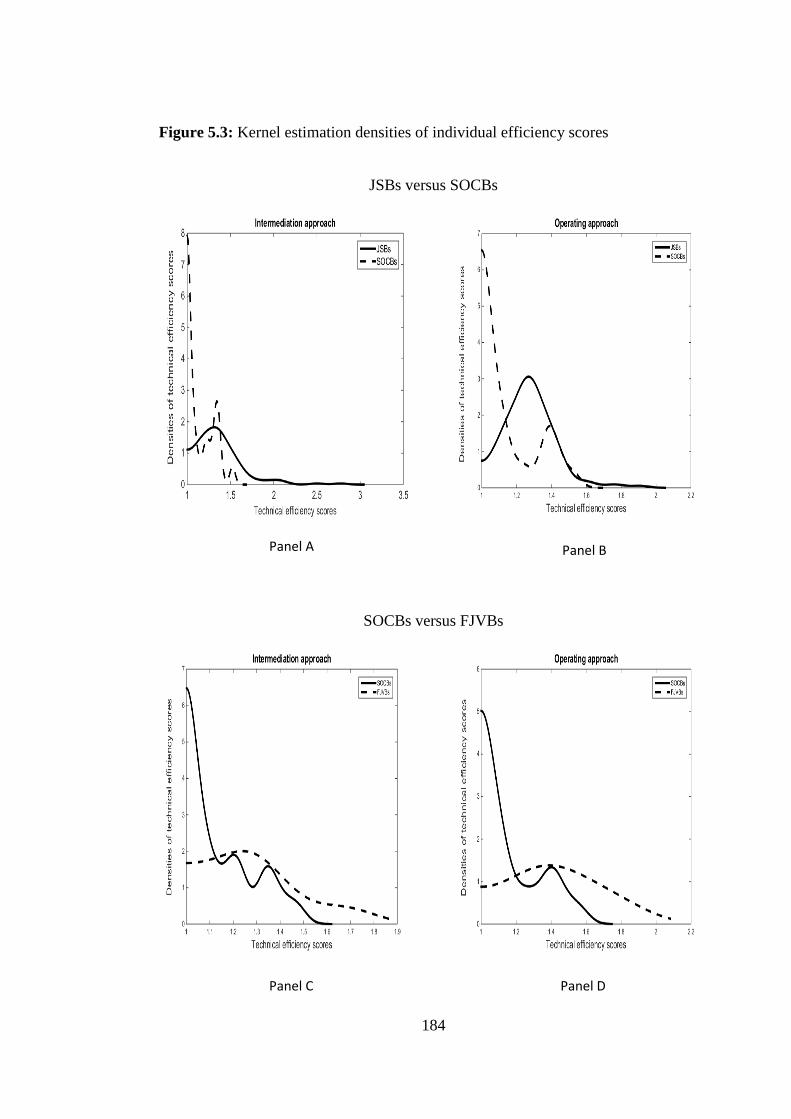
184
7Figure 5.3: Kernel estimation densities of individual efficiency scores
JSBs versus SOCBs
Panel A
Panel B
SOCBs versus FJVBs
Panel C
Panel D
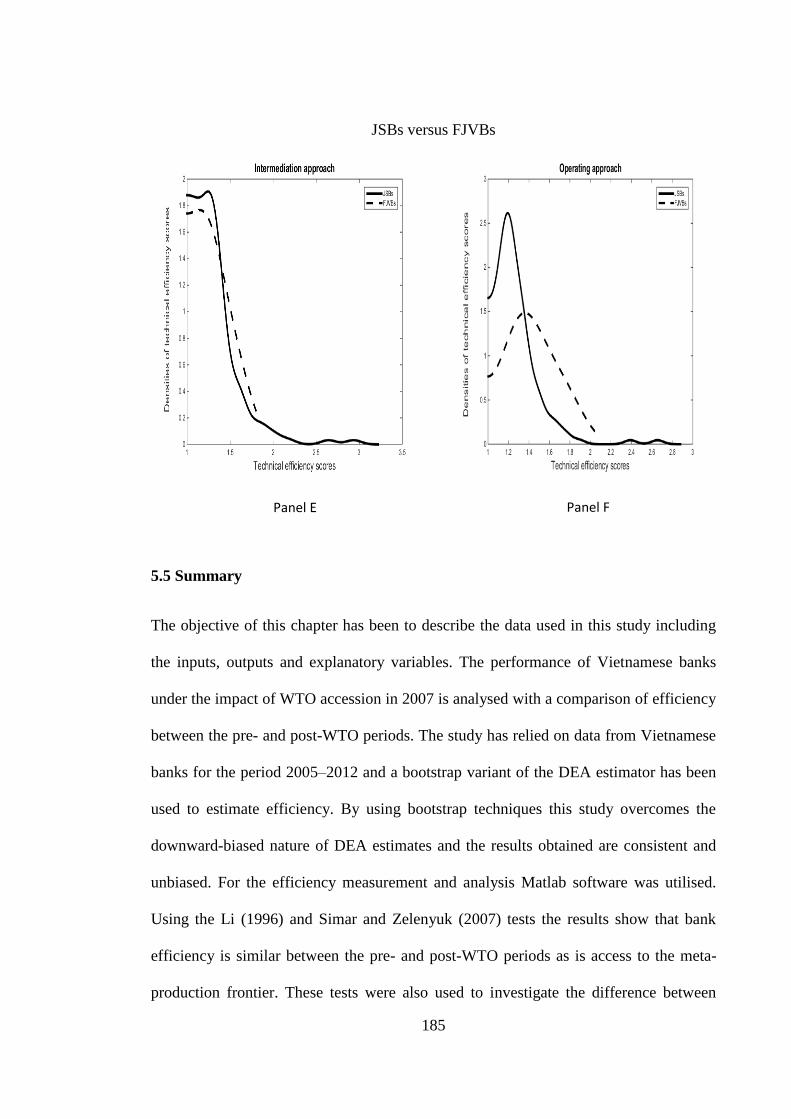
185
JSBs versus FJVBs
Panel E
Panel F
5.5 Summary
The objective of this chapter has been to describe the data used in this study including
the inputs, outputs and explanatory variables. The performance of Vietnamese banks
under the impact of WTO accession in 2007 is analysed with a comparison of efficiency
between the pre- and post-WTO periods. The study has relied on data from Vietnamese
banks for the period 2005–2012 and a bootstrap variant of the DEA estimator has been
used to estimate efficiency. By using bootstrap techniques this study overcomes the
downward-biased nature of DEA estimates and the results obtained are consistent and
unbiased. For the efficiency measurement and analysis Matlab software was utilised.
Using the Li (1996) and Simar and Zelenyuk (2007) tests the results show that bank
efficiency is similar between the pre- and post-WTO periods as is access to the meta-
production frontier. These tests were also used to investigate the difference between
186
bank group performances and there is evidence to suggest that state-owned banks, under
both input/output approaches, have performed the most efficiently, ahead of their
foreign owned rivals, while domestic private banks are the least efficient when
compared to the other two groups.
The next chapter will concentrate on investigating variations of bank efficiency under
the assumption that technology sets utilised by different bank groups can diverge.
Furthermore, the productivity of the banking sector will be examined.
187
Chapter 6: Analysis of Vietnamese bank efficiency and productivity
6.1 Introduction
This chapter investigates the impact of environmental variables on the technical
efficiency of the Vietnamese banking sector and also includes an empirical analysis of
the productivity changes in the Vietnamese banking sector during the post-WTO entry
period. This chapter investigates the impact of financial reforms, bank characteristics
and time trends on the performance of the Vietnamese banking sector under the
assumption that different types of ownership can result in a divergence of technology
sets utilised by different bank groups. By combining a meta-frontier analysis with
double-bootstrap two-stage DEA the impact of environmental variables on bank
efficiency across separate groups operating under different technology sets can be
analysed. Accordingly, this chapter employs ownership as an ex ante rather than an ex
post factor as used in all earlier studies that examined the influence of this
environmental variable on bank efficiency. In addition, an analysis of productivity is
conducted by using a variant of the conventional Malmquist index which is based on the
concept of aggregate technical efficiency. The relative importance of individual banks
(weighting) is accounted for in the index.
The structure of this chapter is as follows: Section 6.2 provides an analysis of the
technology gap between each bank group frontier and the meta-frontier which is also
the production frontier of the entire banking sector; an analysis of the impact of
environmental variables on bank efficiency by a combination of the meta-frontier
analysis approach and the double-bootstrap two-stage DEA method is presented in
Section 6.3;productivity changes in the banking sector over the period 2007–2012 is
188
also measured by means of aggregate Malmquist indexes in Section 6.4; and lastly, a
summary reviewing the chapter‘s contents is included in Section 6.5.
6.2 Technology gap analysis
Table 6.1 reveals that the production frontier of the JSB bank group is located furthest
from the meta-frontier when compared with the other groups based on both basic and
double-bootstrap two-stage DEA results and under the operating and intermediation
input/output approaches. The evidence for this is that the mean and aggregate MTRs71
are relatively smaller than those of the SOCB and FJVB groups. For instance, under the
operating approach the JSB group‘s mean MTR estimated using the bias-corrected
technical efficiency scores (0.9000) is smaller than the SOCB and FJVB groups (0.9476
and 0.9585). It is obvious that it is more difficult for the JSB group, as compared to the
other bank groups, to reach the meta-frontier. Equivalently, the SOCB and FJVB bank
groups are better able to achieve the industry level of efficiency.
O‘Donnell et al. (2008) attribute the technology gaps of different groups in general
(classified by characteristics of the physical, social and economic environment) to the
specific policies and programs adopted to improve efficiency. From the perspective of
the Vietnamese banking sector, different policies have been applied to different bank
groups in the post-WTO era that would likely result in different potential outcomes. For
instance, business groups are allowed to take part in private banks. Accordingly, credit
was channelled to projects that were relevant to the interests of these business groups
rather than the best projects available, resulting in higher NPLs. A weak supervisory
71 The aggregate MTRs are calculated as the ratio of the aggregate technical efficiency scores of groups
estimated by group frontiers over those estimated by the meta-frontier. For details on calculating
aggregate technical efficiency, see Subsection 4.3.2.
189
and regulatory framework has exacerbated this situation. No law on cross-ownership
has been implemented and defaults relating to insider trading have not been detected in
time. These issues are barriers that prevent JSBs from achieving the meta-frontier and
serve to widen the technology gap between their frontier and the meta-frontier.
Meanwhile, SOCBs, under the privatisation process, have conducted a number of
measures aimed at improving their performance, such as equitising and selling shares to
private sector, calling for foreign strategic investors and upgrading their standards of
corporate governance and risk management.
Using mean MTRs, conflicting results were obtained when comparing the technology
gaps of the SOCB group frontier and the FJVB group frontier to the meta-frontier. If the
operating approach is utilised the gap in the SOCB group is bigger than that of the
FJVB group (0.9556 versus 0.9602 using basic DEA estimates or 0.9476 versus 0.9585
using bias-corrected estimates). This difference can be explained by the fact that foreign
and joint venture banks are better in terms of cost and risk management (Havrylchyk,
2006; Lensinket al., 2008). Nevertheless, this result is in contrast to the case of applying
the intermediation approach to calculate group MTRs. Under this approach, the MTR of
the SOCB group is 0.9539, which is larger than that of the FJVB group (0.9400) using
the basic DEA method. The result is similar when the bias-corrected estimates are
considered.
The aggregate MTRs obtained by basic and bootstrap DEA methods give inconsistent
results when comparing the ratios of the SOCB versus FJVB groups. For example,
under the operating approach, the aggregate MTR of SOCBs is larger than that of
FJVBs (0.9920 versus 0.9652) employing basic DEA. However, the result is reversed
when looking at the bootstrap DEA results (0.9515 versus 0.9675). The same
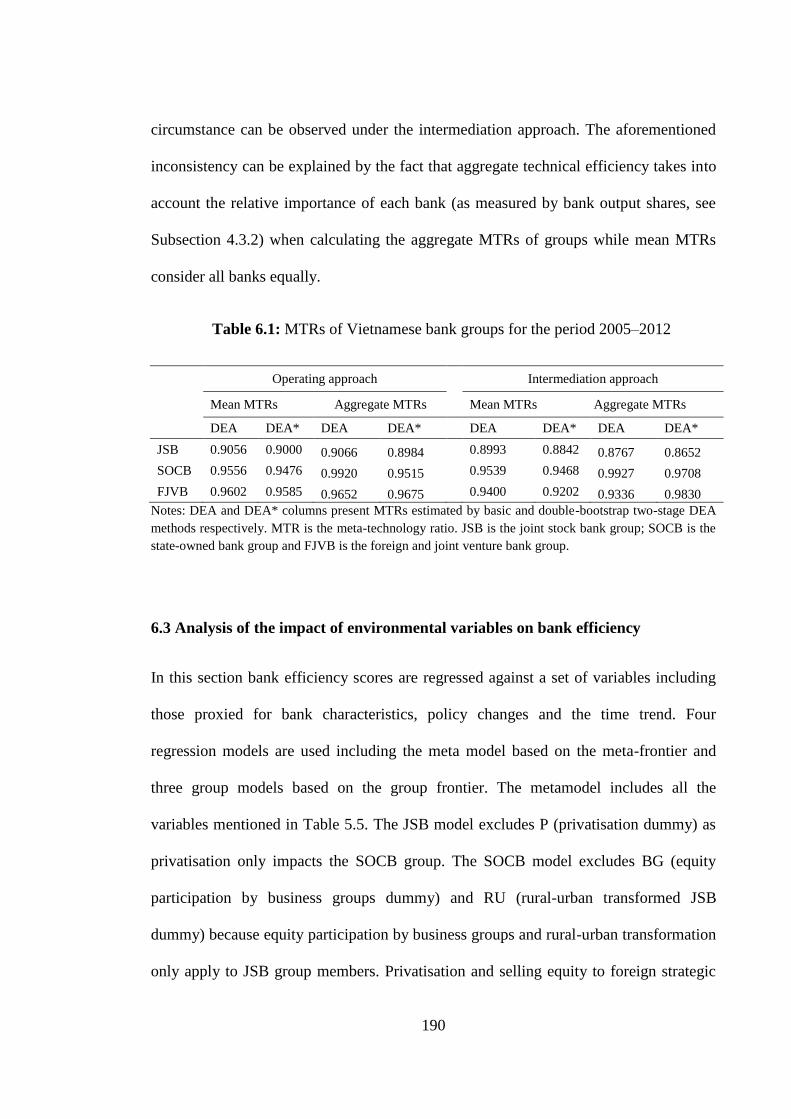
190
circumstance can be observed under the intermediation approach. The aforementioned
inconsistency can be explained by the fact that aggregate technical efficiency takes into
account the relative importance of each bank (as measured by bank output shares, see
Subsection 4.3.2) when calculating the aggregate MTRs of groups while mean MTRs
consider all banks equally.
27Table 6.1: MTRs of Vietnamese bank groups for the period 2005–2012
Operating approach Intermediation approach
Mean MTRs Aggregate MTRs Mean MTRs Aggregate MTRs
DEA DEA* DEA
DEA* DEA DEA* DEA
DEA*
JSB 0.9056 0.9000 0.9066 0.8984 0.8993 0.8842 0.8767 0.8652
SOCB 0.9556 0.9476 0.9920 0.9515 0.9539 0.9468 0.9927 0.9708
FJVB 0.9602 0.9585 0.9652 0.9675 0.9400 0.9202 0.9336 0.9830
Notes: DEA and DEA* columns present MTRs estimated by basic and double-bootstrap two-stage DEA
methods respectively. MTR is the meta-technology ratio. JSB is the joint stock bank group; SOCB is the
state-owned bank group and FJVB is the foreign and joint venture bank group.
6.3 Analysis of the impact of environmental variables on bank efficiency
In this section bank efficiency scores are regressed against a set of variables including
those proxied for bank characteristics, policy changes and the time trend. Four
regression models are used including the meta model based on the meta-frontier and
three group models based on the group frontier. The metamodel includes all the
variables mentioned in Table 5.5. The JSB model excludes P (privatisation dummy) as
privatisation only impacts the SOCB group. The SOCB model excludes BG (equity
participation by business groups dummy) and RU (rural-urban transformed JSB
dummy) because equity participation by business groups and rural-urban transformation
only apply to JSB group members. Privatisation and selling equity to foreign strategic
191
investors as a component of the privatising process happened at the same time so it is
impossible to distinguish between the P and FSI (domestic banks with foreign strategic
investors) dummies in the SOCB model. Thus, the FSI dummy is excluded. All four
reform measures (BG, P, FSI and RU) only occurred for domestic banks, resulting in
their exclusion from the FJVB model. Table 6.2 below presents the empirical results for
the impact of the explanatory variables on bank efficiency for both the operating and
intermediation approaches.
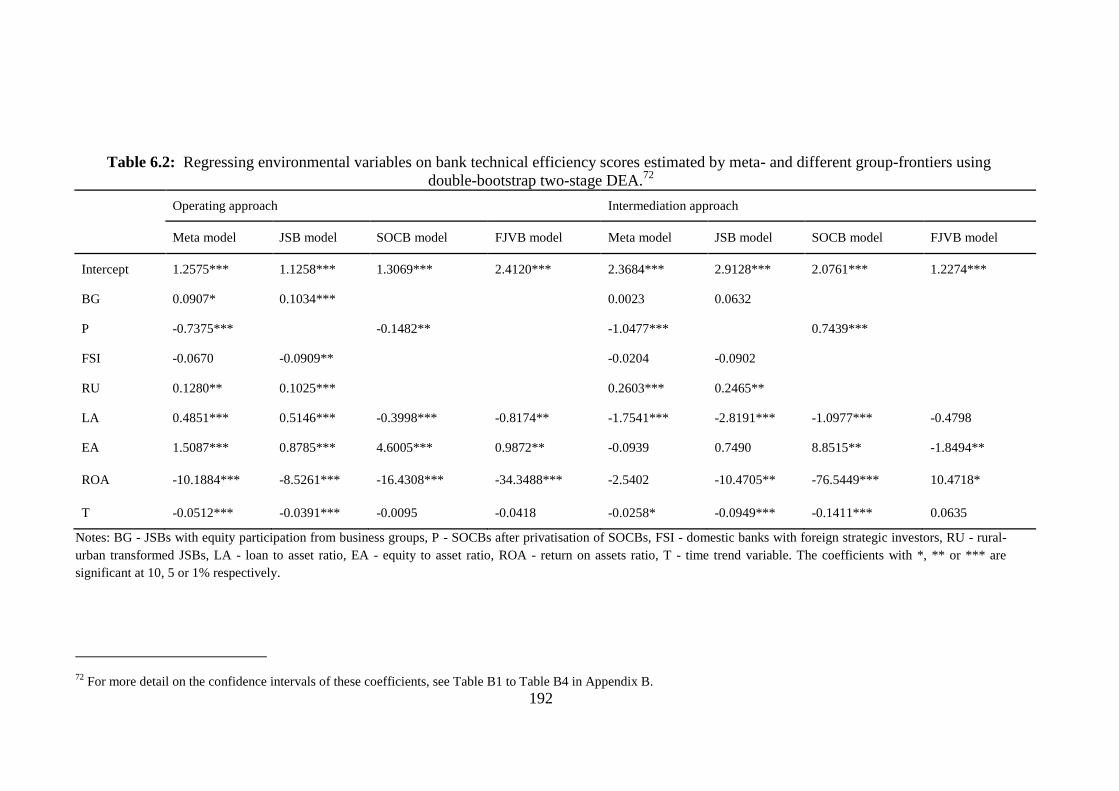
192
28Table 6.2: Regressing environmental variables on bank technical efficiency scores estimated by meta- and different group-frontiers using
double-bootstrap two-stage DEA.72
Operating approach Intermediation approach
Meta model JSB model SOCB model FJVB model Meta model JSB model SOCB model FJVB model
Intercept 1.2575*** 1.1258*** 1.3069*** 2.4120*** 2.3684*** 2.9128*** 2.0761*** 1.2274***
BG 0.0907* 0.1034***
0.0023 0.0632
P -0.7375***
-0.1482**
-1.0477***
0.7439***
FSI -0.0670 -0.0909**
-0.0204 -0.0902
RU 0.1280** 0.1025***
0.2603*** 0.2465**
LA 0.4851*** 0.5146*** -0.3998*** -0.8174** -1.7541*** -2.8191*** -1.0977*** -0.4798
EA 1.5087*** 0.8785*** 4.6005*** 0.9872** -0.0939 0.7490 8.8515** -1.8494**
ROA -10.1884*** -8.5261*** -16.4308*** -34.3488*** -2.5402 -10.4705** -76.5449*** 10.4718*
T -0.0512*** -0.0391*** -0.0095 -0.0418 -0.0258* -0.0949*** -0.1411*** 0.0635
Notes: BG - JSBs with equity participation from business groups, P - SOCBs after privatisation of SOCBs, FSI - domestic banks with foreign strategic investors, RU - rural-
urban transformed JSBs, LA - loan to asset ratio, EA - equity to asset ratio, ROA - return on assets ratio, T - time trend variable. The coefficients with *, ** or *** are
significant at 10, 5 or 1% respectively.
72 For more detail on the confidence intervals of these coefficients, see Table B1 to Table B4 in Appendix B.
193
6.3.1 Impact of reform measures conducted in the post–WTO period on bank
efficiency
Participation in the banking sector of state-owned and private business groups (BG)
One of the reform measures in the post-WTO period is that the SBV required
commercial banks to intensively increase their capital. To catch up with the new capital
requirement, numerous JSBs called for equity contributions from business groups.
Subsequently, cross-ownership between banks and these industrial groups was
established.73
Under the operating approach the BG coefficient, representing the impact of this
relationship, is positively significant in the case of the metamodel at the 10% level and
is significant at the 1% level in the JSB model. Joint stock banks with equity
participation from industrial groups are less efficient than other banks not only in the
same group but also in the other groups. In the intermediation approach case the result
is similar but insignificant. The deterioration of JSB efficiency due to cross-ownership
can be explained by two points. First, cross-ownership can reduce competition by
facilitating collusion among firms that can be implemented by exchanges of practical
information and establishing collusive strategies (see Trivieri, 2007). This obstacle to
competitiveness can lead to an inefficient allocation of a firm‘s resources. The second
point is that under a weak supervisory and regulatory framework, such as Vietnam has,
cross-ownership can result in poor governance and connected lending. This is explained
by the agency problem where companies playing a role as major bank shareholders
pursue different incentives that result in a misallocation of loans to projects they favour
rather than monitoring these banks efficiently and appropriately (Laeven, 1999;
73 For a detailed discussion of cross-ownership, see Chapter 2.
194
Williams and Nguyen, 2005). Other empirical studies also highlight the
abovementioned points. For example, Laeven (1999) shows that company-owned and
family-owned banks in East Asian countries (Thailand, The Philippines, Malaysia and
Korea) are the most risky and were subject to restructuring plans in the post-EAFC
period.
Privatisation of SOCBs (P)
The coefficient for variable P (indicating privatisation of SOCBs) is revealed to be
negative (-0.7375) at the 1% level of significance for the metamodel under the operating
approach. This result demonstrates that privatised SOCBs are more efficient in terms of
profit maximisation than other banks regardless of their ownership. However, it is
important to know whether SOCBs, after being privatised, perform better than non-
privatised SOCBs. Using the SOCB model the value of the P coefficient is negative (-
0.1482) and significant at 5%.Accordingly one can conclude that equitised SOCBs
achieved higher efficiency than non-equitised SOCBs. It can be expected that
privatisation in general, and the participation of foreign investors in particular, have
improved the performance of SOCBs as the operations of these banks are based on
commercial incentives.
Under the intermediation approach and the meta model, the coefficient of P is negative
(-1.0477) and significant at the 1% level indicating that privatised banks perform better
than other banks belonging to different ownership types. However, the result is reversed
in the SOCB model with a positive coefficient (0.7439). This implies that the privatised
banks are less efficient than other SOCBs in terms of providing lending services. Some
may argue that after being privatised the equitised banks become more cautious in their
195
operations under the supervision of domestic and foreign shareholders and, hence, they
take less risks in their lending decisions. While intervention from central or local
government on the operations of these banks is abandoned, this is not the case for the
other non-equitised SOCBs which are still totally owned by the State. These purely
state-owned banks find it easier to lend with support from the State and, therefore, they
make loans under the direction of the government. This explains why they are more
efficient when providing intermediation services but less efficient in terms of profit
maximisation in comparison with privatised banks.
Bonin et al. (2005b) show that partial privatisation of SOCBs, in the cases of Vietnam
and China where the State retains a controlling interest, cannot generate a performance
improvement since, as the dominant shareholder, the State is continuously in a strong
position to run the banks and subsequently there is no change in corporate governance.
Furthermore, Kraft et al. (2006) found that comprehensive privatisation of public banks
but incorporating no management modifications can result in a poorer performance in
comparison with other bank ownership types. This study and that conducted by Berger
et al. (2009) for the case of China under the impact of WTO entry, contradict Bonin et
al. and suggest a positive influence of partial privatisation on SOCB performance. In the
case of a less transparent environment, like that of Vietnam and China, SOCBs have to
increase the quality of their management when being privatised to satisfy the standards
of joint stock companies and as privatisation is in parallel with IPOs, they must upgrade
accountability by publishing and announcing financial reports. These requirements push
the SOCBs to improve their efficiency and competitiveness.
Foreign strategic investors (FSI)
196
In the case of the JSB model, under the operating approach, the nexus between bank
efficiency and FSI is a negative result, significant at 5%. A similar result, but not
significant, is found in the meta model. Under the intermediation approach the
relationship is also negative but insignificant in both the meta and JSB models. It seems
that the participation of foreign investors helps private banks improve their efficiency.
This finding is in line with Berger et al. (2009) where they found a positive relationship
between minority foreign ownership and bank performance in the Chinese banking
sector. Berger et al. investigated mechanisms that transfer the positive impacts of minor
foreign ownership onto domestic bank efficiency. One mechanism is that minority
foreign shareholders can attain positions on the boards of directors of banks and use
these positions to improve the quality of corporate governance and risk management.
The other mechanism is that, through overseas strategic investors, domestic banks are
encouraged and more confident to go public and list equity products on the stock
exchange.
Transforming rural JSBs to urban JSBs (RU)
Transformed JSBs perform more inefficiently than not only other JSBs but also than
banks belonging to any other ownership form. The evidence for this is that estimates of
the RU parameters are positive at 0.1280 (5% significance level) and 0.1025 (1%
significance level) under the meta and JSB models respectively when the operating
approach is applied. In the case of the intermediation approach, these estimates are also
positive at 0.2603 (1% significance level) when estimated by the meta model and
0.2465 (5% significance level) when estimated by the JSB model. There are two
possible reasons for this. First, governance capability is inadequate. Transformed banks
have to cover a significantly larger range of operations than they had done before. To
197
become urban banks their customer base and assets had to increase many times over in
only two or three years and many branches were opened nationwide. The second is that
insufficiently selective decisions by the SBV on awarding licences to rural banks
resulted in a rapid growth of credit by inexperienced bankers which leading to risk
taking and failure to adequately diversify their assets. In reality, many of the small
transformed JSBs used the bulk of their credit to purchase property and stocks.
6.3.2 Specific bank characteristics (control variables)
Loan to asset ratio (LA)
Hasan and Marton (2003) see the LA variable as a proxy that captures variations in
traditional banking services. Under the intermediation approach a positive association
(negative result) between the loan to asset ratio and bank efficiency across the meta and
three group models is found. This outcome is in line with the research conducted by
Chortareas et al. (2013) supporting the argument that banks engaging more in
traditional activities are more efficient. This can be explained by an expansionary
monetary policy that was implemented to stimulate economic growth during the pre-
and post-WTO periods and the fact that loans represent the bulk of bank assets.
Domestic banks were in a race to expand branches nationwide and attract deposits from
households and corporations. Under constraints relating to human and physical
resources, banks maximised their capabilities of providing intermediation services and
expected that the loans would bring back high profitability. This expectation can be
examined by using the profit criteria of efficiency.
Under the operating approach the regression results demonstrate a diversity of bank
group responses to the LA variable. In the JSB model the estimate of the LA parameter
198
is 0.5146 at the 1% significance level, indicating a negative relationship. By contrast a
positive association is obtained with an estimated parameter value of -0.3998 at the
same 1% level in the case of SOCBs and -0.8174 at the 5% level in the case of the
FJVB model. The different responses to LA can be clarified based on the characteristic
of liquidity. The liquidity of private banks is in serious trouble74
which is not the case
for the two other groups. In the illiquid condition, Altunbas et al. (2000) consider the
loan to asset ratio as a proxy for liquidity risk that raises the cost of attracting deposits
and borrowing. Thus, the negative relationship could indicate that the less efficient
banks are more illiquid as recorded in the JSB model. However, the view of Altunbaset
al. (2000) cannot be applied in the SOCB and FJVB models due to the more liquid
condition of these two groups. Instead, the author follows the view of Hasan and
Marton (2003) on the transaction cost of shifting into non-traditional assets75
. Banks,
when decreasing traditional assets (loans and advances) and increasing non-traditional
assets (investments and securities), incurred higher costs; hence, a lower LA ratio can
result in lower profitability.
Equity to asset ratio (EA)
The equity to asset ratio is a criterion to identify the financial soundness of a bank and a
banking system. A bank with a higher EA ratio is safer in terms of capital and is in a
stronger position to defend risks relating to equity losses. In the literature, the positive
link between capital strength and efficiency is theoretically explained. According to
Jeitschko and Jeung (2005), the managers of banks with less capital have more
74 During the credit boom period (2005−2010) in Vietnam, the interest rate on the interbank market
reached a record high of 30%/year caused by a high demand for cash from illiquid JSBs (Pincus, 2009;
NAEC, 2012). 75
The 2005−2012 period witnessed a significant change in banks‘ asset structure. On average, the portion
of traditional assets decreased from 61% in 2005 to 51% in 2012.
199
incentives to engage in moral hazards because they face less shareholder scrutiny than
banks with higher capital ratios. Berger and De Young (1997) point out that banks with
higher risk levels in the medium-term have to employ more inputs to administer these
higher risks which results in a decline of efficiency. Regulators can also force banks to
increase capital and adequately account for risk-related costs commensurate with the
degree of risk taken (Gropp and Heider, 2010). The mainstream empirical studies
support a positive association between capital and efficiency (e.g, Fries and Taci, 2005;
Fiordelisi et al., 2011).
However, in a shallow and weak regulatory/supervisory framework like Vietnam‘s,
these relationships may be reversed. Risk-related costs and equity can be inadequately
accounted for; thus, figures on bank profitability are not commensurate with the level of
risk (Laeven, 1999). Moreover, outdated Vietnamese accounting standards have not
caught up with risks occurring within banks (IMF, 2012). These factors implicitly
stimulate banks to provide more intermediate services (especially loans) and obtain a
higher rate of return. This cycle is repeated many times and creates a negative
relationship between capital and efficiency. Banks that have lower equity to asset ratio,
will provide more intermediate services to customers and achieve a higher level of
profitability. Under the operating approach, all four models give similar and significant
results, showing a negative association (positive result) between the EA ratio and bank
efficiency.76
It is worth noting that domestic banks react differently to the EA variable when
compared with their foreign rivals under the intermediation approach. A negative
76 Rossi et al. (2009) also found a negative relationship between capital and efficiency using the Granger-
causality methodology to investigate the impact of diversification of bank size/industry on cost/profit
efficiency, capital and risk in Austria from 1997−2003.
200
association between the EA and bank efficiency in domestic banks (significant in the
case of the SOCB model but insignificant in the JSB model) was obtained. This can be
explained by the expansionary monetary policy implemented in the pre- and post-WTO
era. Domestic banks were encouraged to lend to the economy in order to stimulate
economic growth. However, this result is reversed in the FJVB model due to the
limitations on attracting deposits and lending in Vietnamese dong imposed on foreign
and joint venture banks.
Return on assets (ROA)
ROA is the ratio of before-tax profit to total assets and is used to measure bank
profitability. The meta model and the other three group models come to a consensus
with a positive relationship between ROA and bank efficiency under the operating
approach, employing interest and non-interest revenues as outputs and interest and non-
interest costs as inputs. This result is also consistent with that obtained by Das and
Ghosh (2006) and Fang et al. (2011).
Nevertheless, these results are reversed if the banks‘ capability to provide
intermediation services is used as the criterion. ROA is positively related to bank
efficiency in the JSB and SOCB models with the relevant coefficients of -10.4705 (5%
significance level) and -76.5449 (1% significance level) respectively. This result shows
that the bulk of domestic banks‘ revenues are created from lending activities.
Meanwhile, the profitability of foreign rivals reacts negatively to bank efficiency. The
proof is that the relevant coefficient in the FJVB model is 10.4718 which is significant
at the 10% level. This is because interest revenue is not a major item and, due to the
201
diversification of banking services, the profit of foreign and joint venture banks is less
dependent on lending services than the domestic banks.
Time trend (T)
The private banks‘ efficiency increased during the period 2005–2012. The evidence for
this is that the coefficients of the time trend variable are -0.0391 (1% significance)
and -0.0949 (1% significance) under both the operating and intermediation approaches
respectively. Only when using the intermediation approach in the SOCB model can an
increasing trend of bank efficiency be observed. By contrast, changes of bank efficiency
in the FJVB model under both approaches are not revealed. The time trend under meta-
models is not obvious (increasing or decreasing), and this result is in line those in
section 5.3 that there is no significant change in terms of efficiency between the pre-
and post-WTO periods.
6.4 Productivity analysis using the aggregate Malmquist total factor productivity
index
Due to the fact that the data sample is unbalanced and balanced data is necessary to
capture productivity over time, a number of banks with the necessary data covering the
years 2007–2012 are chosen. Foreign banks which only started operating in Vietnam
from 2009 were omitted due to their short time period in the market. This leaves 24
banks, consisting of five SOCBs and 19 JSBs, in the sample which can be used for
productivity analysis. Using both the intermediation and operating approaches,
productivity changes and its component changes for each group as well as the whole
banking sector is now measured and compared.
202
6.4.1 Intermediation approach
In general, when viewed under the intermediation approach, banking sector productivity
has slightly regressed (see Table 6.3). This is because the AMPI is 0.9770 indicating
that productivity decreased 2.3% per year during the period from 2007–2012. The
reason for this trend can be found by analysing changes in the productivity components.
The index of aggregate efficiency change is 1.0049 and this is very close to unity
suggesting that the efficiency of the banking sector has remained constant. Thus, the
change of productivity is mostly explained by the other component, technology, with
the technical change index being 0.9722 implying a 2.88% decrease per year. The
negative technology change effect is more serious for JSBs than for SOCBs. Technical
change77
declined at an annual rate of 4.37% in the case of JSBs which is much greater
than the 1.31% decline in the case of SOCBs.
The technology regression can be explained in two ways. First, although the period
2000–2005 witnessed a booming growth of Automatic Teller Machines (ATMs) and all
banks applied core banking software to manage their banking operations, electronic
transactions over the Internet, up to now, have been very limited due to a lack of
regulation and legalisation. Second, the quality of bank governance has not improved
over the period. Due to cross-ownership between business groups and JSBs a number of
senior positions in these banks are held by representatives coming from industry who
are less experienced in the financial sector. Foreign investors are allowed to join the
77 Oh and Lee (2010) apply the meta-frontier approach in the context of Malmquist index. And they use
BPC (best practice change) index to measure the technology change within a group. Furthermore, to
examine which groups leading the growth in the industry, Oh and Lee (2010) use the TGR (technology
gap ratio) and TGC (technology gap change). Although their method has advantages when investigating
the technology changes in groups but it cannot be applied in my thesis. This is because the number of
banks in the SOCB group is too small, five banks; hence, if estimating the SOCB group frontier, it would
lead to unreliable results.
203
banking sector, but only as minority shareholders. Under the regulations set by the
government the maximum equity that can be bought by foreigners is 30%. This
restriction has inhibited long term involvement by foreign investors in the development
of the banking sector and in terms of technology transfer.
The finding of technical regression is in line with the study of Nguyen and Simioni
(2015) when they used the Färe-Primont index to measure Vietnamese banking
productivity during the 2008−2012 period. They attribute the technical regression to
changes occurring in the business environment of banks with two particular major
challenges. First, Vietnam has faced macroeconomic instability since 2007 with a
double-digit inflation rate, large trade and fiscal deficits and substantial volatility in
exchange and interest rates (WB, 2012).78
These uncertainties increase market-risk
relevant costs which cannot be avoided and all banks, including the best practice ones,
suffer. Second, a high level of non-performing loans has deteriorated banks‘ capacity to
provide intermediation services. Increasing the proportion of bad debts in total bank
assets leads to a decline of credit that could otherwise be utilised for new projects.79
In particular, the trend of productivity of the private and public banks is decreasing at
2.25% and 1.35% respectively. These decreases are mainly explained by technical
regression at the rates of 4.37% for JSBs and 1.31% for SOCBs. While there was
seemingly no improvement in efficiency of public banks (with a 0.9996 efficiency
index), the level of efficiency has increased at an annual rate of 2.21% in their private
rivals.
78 The negative real interest rate due to high inflation discouraged depositors from keeping their money in
banks. Instead, they withdrew their deposits and invested in more profitable assets such as property or
gold (NAEC, 2012). 79
For details on bad loans, credit growth and a review of the Vietnamese banking sector during the
2007−2012 period, see Chapter 2.
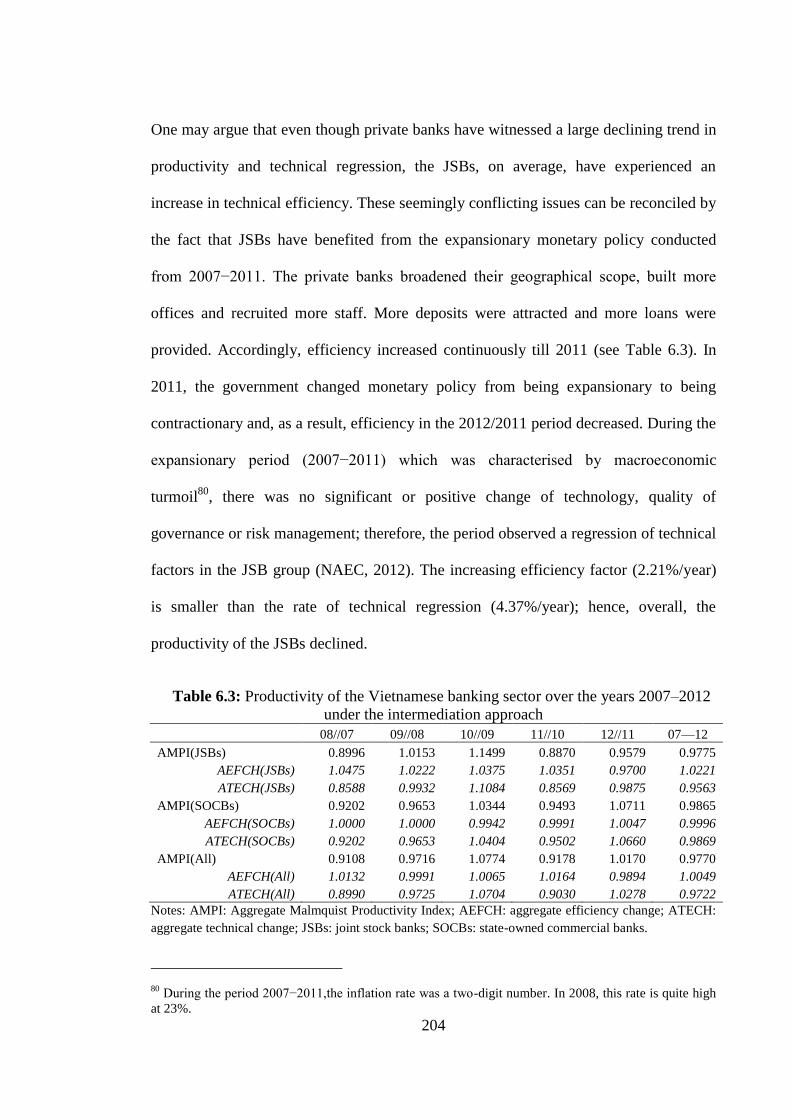
204
One may argue that even though private banks have witnessed a large declining trend in
productivity and technical regression, the JSBs, on average, have experienced an
increase in technical efficiency. These seemingly conflicting issues can be reconciled by
the fact that JSBs have benefited from the expansionary monetary policy conducted
from 2007−2011. The private banks broadened their geographical scope, built more
offices and recruited more staff. More deposits were attracted and more loans were
provided. Accordingly, efficiency increased continuously till 2011 (see Table 6.3). In
2011, the government changed monetary policy from being expansionary to being
contractionary and, as a result, efficiency in the 2012/2011 period decreased. During the
expansionary period (2007−2011) which was characterised by macroeconomic
turmoil80
, there was no significant or positive change of technology, quality of
governance or risk management; therefore, the period observed a regression of technical
factors in the JSB group (NAEC, 2012). The increasing efficiency factor (2.21%/year)
is smaller than the rate of technical regression (4.37%/year); hence, overall, the
productivity of the JSBs declined.
29Table 6.3: Productivity of the Vietnamese banking sector over the years 2007–2012
under the intermediation approach
08//07 09//08 10//09 11//10 12//11 07—12
AMPI(JSBs) 0.8996 1.0153 1.1499 0.8870 0.9579 0.9775
AEFCH(JSBs) 1.0475 1.0222 1.0375 1.0351 0.9700 1.0221
ATECH(JSBs) 0.8588 0.9932 1.1084 0.8569 0.9875 0.9563
AMPI(SOCBs) 0.9202 0.9653 1.0344 0.9493 1.0711 0.9865
AEFCH(SOCBs) 1.0000 1.0000 0.9942 0.9991 1.0047 0.9996
ATECH(SOCBs) 0.9202 0.9653 1.0404 0.9502 1.0660 0.9869
AMPI(All) 0.9108 0.9716 1.0774 0.9178 1.0170 0.9770
AEFCH(All) 1.0132 0.9991 1.0065 1.0164 0.9894 1.0049
ATECH(All) 0.8990 0.9725 1.0704 0.9030 1.0278 0.9722
Notes: AMPI: Aggregate Malmquist Productivity Index; AEFCH: aggregate efficiency change; ATECH:
aggregate technical change; JSBs: joint stock banks; SOCBs: state-owned commercial banks.
80 During the period 2007−2011,the inflation rate was a two-digit number. In 2008, this rate is quite high
at 23%.
205
6.4.2 Operating approach
Productivity of the banking sector under the operating approach has changed between
private and state-owned banks. On average, SOCBs have improved their performance at
a rate of 1.43% annually (see Table 6.4) over the period 2007–2012. This productivity
increase is explained primarily by changes in technology, which grew at 1.49% per
year. Meanwhile, the efficiency factor changed only slightly during the same period (the
efficiency component index is 0.9994, equivalent to a 0.06% decrease). This technical
progress can be explained by the fact that four of the five SOCBs were equitised and
their equity was listed in the stock exchange during the period 2005–2008. When they
went public, their operations had to be properly restructured to comply with the strict
regulations of the Vietnam Security Commission on accounting standards and financial
and operating reports. The participation of domestic and foreign investors also pushed
the SOCBs to improve their productivity as they expected to receive a higher rate of
return on their investments. However, there is a question on the conflicting performance
of SOCBs under the two input/output approaches as it was found to decline under the
intermediation approach. During the equitisation process the SOCBs were forced to turn
from policy-based to commercial-based banking activity, and their priority became
profit, not how best to provide loans for economic growth. Bad loans were resolved
when policy lending was transferred to two specific banks - the Vietnam Development
Bank and the Vietnam Bank for Social Policies. Moreover, foreign strategic investors
play a substantive role in applying advanced technology, risk management and bank
governance when their representatives hold high-ranking positions in SOCBs. These
positive changes explain why the rate of NPLs significantly decreased and resulted in
206
lower costs for loan-loss provisioning in particular and a decrease of total operating
costs in general.
In contrast, the JSBs regressed at a faster rate, 4.67% each year, due to decreases of both
efficiency (-1.63%) and technical change (-3.09%). There are three main reasons that
led to this performance regression in the private banks. First, the SBV substantially
loosened its regulations when permitting 13 rural banks to transform into urban banks in
2006–2007 (NAEC, 2012). The quality of management in these banks was problematic
and could not keep up with their substantially larger scope of operations. Before being
transformed, they had focused on rural areas and most of their loans were allocated to
agricultural activities. On becoming urban banks, they provided services nationwide to
any economic field including commerce and industry. Operating on a larger scope but
with an unchanged quality of management explains the low efficiency of these
transformed banks. Second, cross-ownership between banks and industrial groups
deteriorated bank performance. Under pressure from the SBV to recapitalise, small
JSBs had to increase their capital levels by up to 10 times in a five-year period (NAEC,
2012). Calling for equity participation from large banks, private business groups and
SOEs became a popular option which, in return, resulted in complicated cross-
ownerships with JSBs (NAEC, 2012; IMF, 2012). Most loans were allocated to related
parties rather than to the most profitable projects, resulting in a higher non-performing
loan rates for JSBs81
. In a general sense, this poor allocation of financial resources led to
an inevitable loss of GDP growth. A lack of regulation on cross-ownership and the
weak capability of supervisory departments worsened this situation. Third, a collapse of
81 For example, 80% of total loans of the First bank , a JSB, was lent to its holding company and 40% of
the total loan is non-performing and this data was recorded at the end of 2010 (NAEC, 2012).
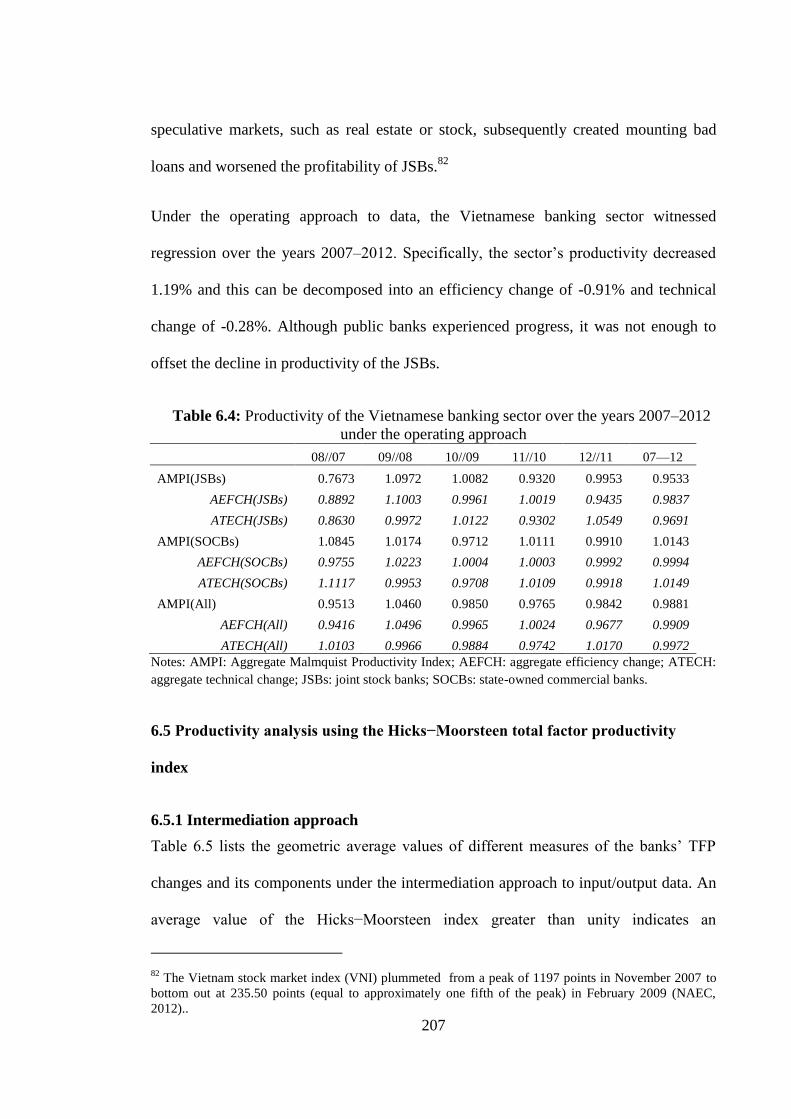
207
speculative markets, such as real estate or stock, subsequently created mounting bad
loans and worsened the profitability of JSBs.82
Under the operating approach to data, the Vietnamese banking sector witnessed
regression over the years 2007–2012. Specifically, the sector‘s productivity decreased
1.19% and this can be decomposed into an efficiency change of -0.91% and technical
change of -0.28%. Although public banks experienced progress, it was not enough to
offset the decline in productivity of the JSBs.
30Table 6.4: Productivity of the Vietnamese banking sector over the years 2007–2012
under the operating approach
08//07 09//08 10//09 11//10 12//11 07—12
AMPI(JSBs) 0.7673 1.0972 1.0082 0.9320 0.9953 0.9533
AEFCH(JSBs) 0.8892 1.1003 0.9961 1.0019 0.9435 0.9837
ATECH(JSBs) 0.8630 0.9972 1.0122 0.9302 1.0549 0.9691
AMPI(SOCBs) 1.0845 1.0174 0.9712 1.0111 0.9910 1.0143
AEFCH(SOCBs) 0.9755 1.0223 1.0004 1.0003 0.9992 0.9994
ATECH(SOCBs) 1.1117 0.9953 0.9708 1.0109 0.9918 1.0149
AMPI(All) 0.9513 1.0460 0.9850 0.9765 0.9842 0.9881
AEFCH(All) 0.9416 1.0496 0.9965 1.0024 0.9677 0.9909
ATECH(All) 1.0103 0.9966 0.9884 0.9742 1.0170 0.9972
Notes: AMPI: Aggregate Malmquist Productivity Index; AEFCH: aggregate efficiency change; ATECH:
aggregate technical change; JSBs: joint stock banks; SOCBs: state-owned commercial banks.
6.5 Productivity analysis using the Hicks−Moorsteen total factor productivity
index
6.5.1 Intermediation approach
Table 6.5 lists the geometric average values of different measures of the banks‘ TFP
changes and its components under the intermediation approach to input/output data. An
average value of the Hicks−Moorsteen index greater than unity indicates an
82 The Vietnam stock market index (VNI) plummeted from a peak of 1197 points in November 2007 to
bottom out at 235.50 points (equal to approximately one fifth of the peak) in February 2009 (NAEC,
2012)..
208
improvement and less than unity implies a regress of the measure. The average value of
the TFP index over the years 2007−2012 is 0.9609, indicating a decrease of the banking
sector‘s productivity by 3.91%. This decrease is due to a large technical regress of this
industry with the component index at 0.8537, indicating a decreasing rate of 14.63%.
This decrease is only partially offset by an increase of overall productive efficiency
(TFPE) by 12.55%.
Both bank groups experienced a decrease of productivity. Private banks experienced a
productivity decline of 2.19% while their public counterparts witnessed a productivity
deterioration of 5.6%. Both groups experienced technical regress and an overall
efficiency improvement. The two components of TFP efficiency including output-
oriented technical efficiency (OTE) and output-oriented scale-mix efficiency (OSME)
improved. In detail the values of dOTE and dOSME are 1.0103 and 1.1140, and both
values are greater than unity. This result shows that the Vietnamese banking sector
improved its management and positively changed the structure and scale of services
provided to their customers in the aftermath of WTO entry. However, the observed
changes in overall productive efficiency originated mainly from scale and mix
efficiency in comparison to technical efficiency (11.40% versus 1.03%).
Table 6.6 shows the development of output-oriented scale and mix efficiency and its
components following the decomposition as mentioned in equations (4.53) and (4.54).
OSME of the whole banking system, on average, increased by 11.4% annually over the
period 2007−2012. Moreover, the results also recorded a higher OSME rate for the JSBs
group at 12.97% while it is 9.86% for the case of SOCBs. This increase in scale and
mix efficiency can be mainly explained by an equal increase in scale efficiency, whether
measured directly by OSE (11.49%) or residually by ROSE (10.83%). In fact, mix

209
efficiency seems to be unchanged over the period as dOME (1.0054) and dRME(0.9993)
are very close to unity.
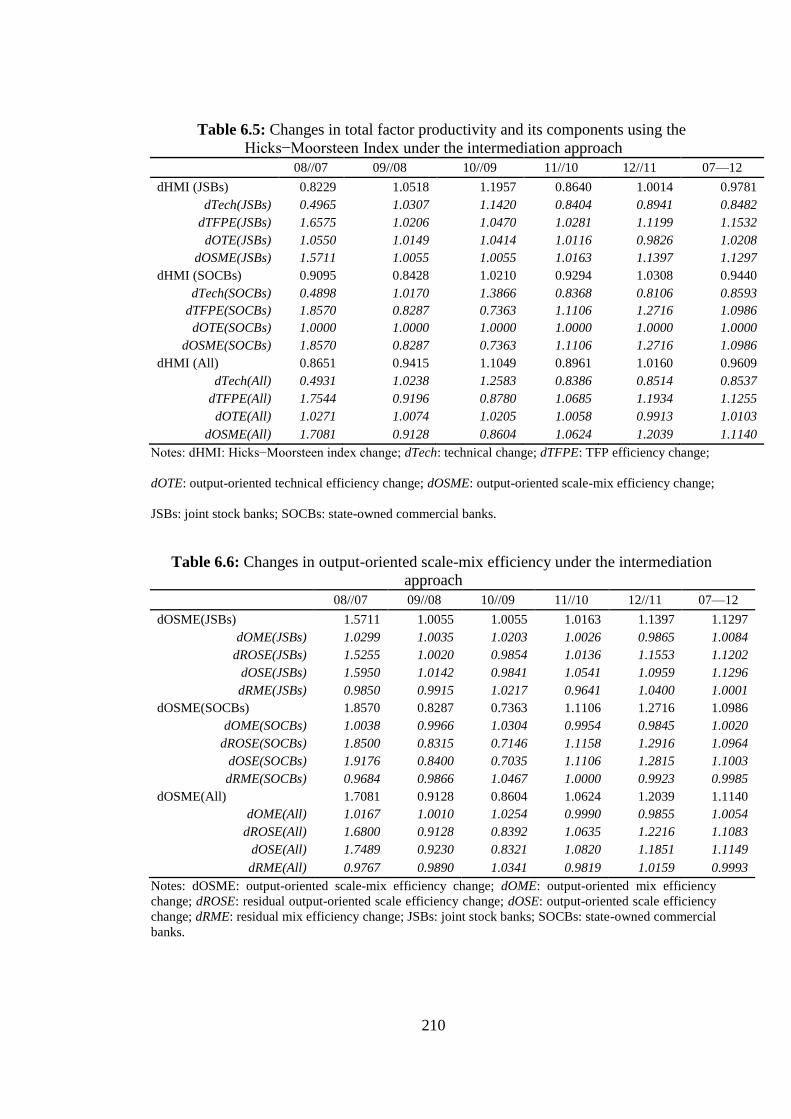
210
31Table 6.5: Changes in total factor productivity and its components using the
Hicks−Moorsteen Index under the intermediation approach
08//07 09//08 10//09 11//10 12//11 07—12
dHMI (JSBs) 0.8229 1.0518 1.1957 0.8640 1.0014 0.9781
dTech(JSBs) 0.4965 1.0307 1.1420 0.8404 0.8941 0.8482
dTFPE(JSBs) 1.6575 1.0206 1.0470 1.0281 1.1199 1.1532
dOTE(JSBs) 1.0550 1.0149 1.0414 1.0116 0.9826 1.0208
dOSME(JSBs) 1.5711 1.0055 1.0055 1.0163 1.1397 1.1297
dHMI (SOCBs) 0.9095 0.8428 1.0210 0.9294 1.0308 0.9440
dTech(SOCBs) 0.4898 1.0170 1.3866 0.8368 0.8106 0.8593
dTFPE(SOCBs) 1.8570 0.8287 0.7363 1.1106 1.2716 1.0986
dOTE(SOCBs) 1.0000 1.0000 1.0000 1.0000 1.0000 1.0000
dOSME(SOCBs) 1.8570 0.8287 0.7363 1.1106 1.2716 1.0986
dHMI (All) 0.8651 0.9415 1.1049 0.8961 1.0160 0.9609
dTech(All) 0.4931 1.0238 1.2583 0.8386 0.8514 0.8537
dTFPE(All) 1.7544 0.9196 0.8780 1.0685 1.1934 1.1255
dOTE(All) 1.0271 1.0074 1.0205 1.0058 0.9913 1.0103
dOSME(All) 1.7081 0.9128 0.8604 1.0624 1.2039 1.1140
Notes: dHMI: Hicks−Moorsteen index change; dTech: technical change; dTFPE: TFP efficiency change;
dOTE: output-oriented technical efficiency change; dOSME: output-oriented scale-mix efficiency change;
JSBs: joint stock banks; SOCBs: state-owned commercial banks.
32Table 6.6: Changes in output-oriented scale-mix efficiency under the intermediation
approach
08//07 09//08 10//09 11//10 12//11 07—12
dOSME(JSBs) 1.5711 1.0055 1.0055 1.0163 1.1397 1.1297
dOME(JSBs) 1.0299 1.0035 1.0203 1.0026 0.9865 1.0084
dROSE(JSBs) 1.5255 1.0020 0.9854 1.0136 1.1553 1.1202
dOSE(JSBs) 1.5950 1.0142 0.9841 1.0541 1.0959 1.1296
dRME(JSBs) 0.9850 0.9915 1.0217 0.9641 1.0400 1.0001
dOSME(SOCBs) 1.8570 0.8287 0.7363 1.1106 1.2716 1.0986
dOME(SOCBs) 1.0038 0.9966 1.0304 0.9954 0.9845 1.0020
dROSE(SOCBs) 1.8500 0.8315 0.7146 1.1158 1.2916 1.0964
dOSE(SOCBs) 1.9176 0.8400 0.7035 1.1106 1.2815 1.1003
dRME(SOCBs) 0.9684 0.9866 1.0467 1.0000 0.9923 0.9985
dOSME(All) 1.7081 0.9128 0.8604 1.0624 1.2039 1.1140
dOME(All) 1.0167 1.0010 1.0254 0.9990 0.9855 1.0054
dROSE(All) 1.6800 0.9128 0.8392 1.0635 1.2216 1.1083
dOSE(All) 1.7489 0.9230 0.8321 1.0820 1.1851 1.1149
dRME(All) 0.9767 0.9890 1.0341 0.9819 1.0159 0.9993
Notes: dOSME: output-oriented scale-mix efficiency change; dOME: output-oriented mix efficiency
change; dROSE: residual output-oriented scale efficiency change; dOSE: output-oriented scale efficiency
change; dRME: residual mix efficiency change; JSBs: joint stock banks; SOCBs: state-owned commercial
banks.
211
6.5.2 Operating approach
Table 6.7 presents changes in TFP and its components under the operating approach.
The productivity of Vietnamese banks as measured by the Hicks−Moorsteen index
experienced a decline by 2.49%/year during the years after WTO entry. This decline is
mostly explained by technical regress at a decreasing rate of 13.18%. Even though the
period witnessed an improvement of overall efficiency, increasing at a rate of 12.3%,
this was inadequate to offset technical regress. Components of efficiency experienced
different changes. While technical efficiency of the banking sector suffered a slight
deterioration (dOTE=0.9941) the two other efficiencies, including scale and mix
efficiency, achieved progress (dOSME=1.1297).
Table 6.8 shows results on how the OSME can be decomposed into two relevant
components. Similar to the results under the intermediation approach the change of
OSME is mostly due to scale efficiency that is either measured directly by dOSE or
residually by dROSE, the respective rates of increase are 11.82% and 11.36%. The
impact of mix efficiency is insignificant using both the OME and RME criterions;
accordingly, they contributed only 1.45% and 1.03% to OSME growth, respectively. It
is worth noting that the change of OSME is quite different across JSBs and SOCBs.
While the data recorded a substantial change of OSME in private banks (22.81%) this is
trivial in the case of their public rivals (3.91%).
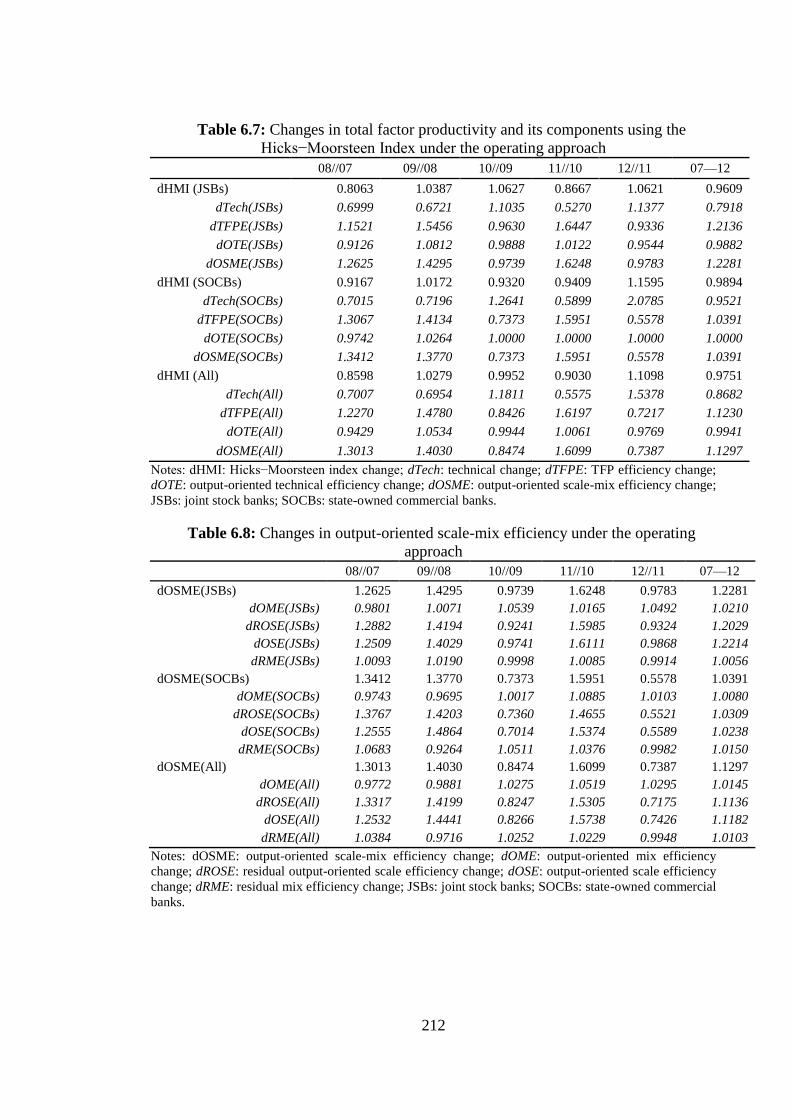
212
33Table 6.7: Changes in total factor productivity and its components using the
Hicks−Moorsteen Index under the operating approach
08//07 09//08 10//09 11//10 12//11 07—12
dHMI (JSBs) 0.8063 1.0387 1.0627 0.8667 1.0621 0.9609
dTech(JSBs) 0.6999 0.6721 1.1035 0.5270 1.1377 0.7918
dTFPE(JSBs) 1.1521 1.5456 0.9630 1.6447 0.9336 1.2136
dOTE(JSBs) 0.9126 1.0812 0.9888 1.0122 0.9544 0.9882
dOSME(JSBs) 1.2625 1.4295 0.9739 1.6248 0.9783 1.2281
dHMI (SOCBs) 0.9167 1.0172 0.9320 0.9409 1.1595 0.9894
dTech(SOCBs) 0.7015 0.7196 1.2641 0.5899 2.0785 0.9521
dTFPE(SOCBs) 1.3067 1.4134 0.7373 1.5951 0.5578 1.0391
dOTE(SOCBs) 0.9742 1.0264 1.0000 1.0000 1.0000 1.0000
dOSME(SOCBs) 1.3412 1.3770 0.7373 1.5951 0.5578 1.0391
dHMI (All) 0.8598 1.0279 0.9952 0.9030 1.1098 0.9751
dTech(All) 0.7007 0.6954 1.1811 0.5575 1.5378 0.8682
dTFPE(All) 1.2270 1.4780 0.8426 1.6197 0.7217 1.1230
dOTE(All) 0.9429 1.0534 0.9944 1.0061 0.9769 0.9941
dOSME(All) 1.3013 1.4030 0.8474 1.6099 0.7387 1.1297
Notes: dHMI: Hicks−Moorsteen index change; dTech: technical change; dTFPE: TFP efficiency change;
dOTE: output-oriented technical efficiency change; dOSME: output-oriented scale-mix efficiency change;
JSBs: joint stock banks; SOCBs: state-owned commercial banks.
34Table 6.8: Changes in output-oriented scale-mix efficiency under the operating
approach
08//07 09//08 10//09 11//10 12//11 07—12
dOSME(JSBs) 1.2625 1.4295 0.9739 1.6248 0.9783 1.2281
dOME(JSBs) 0.9801 1.0071 1.0539 1.0165 1.0492 1.0210
dROSE(JSBs) 1.2882 1.4194 0.9241 1.5985 0.9324 1.2029
dOSE(JSBs) 1.2509 1.4029 0.9741 1.6111 0.9868 1.2214
dRME(JSBs) 1.0093 1.0190 0.9998 1.0085 0.9914 1.0056
dOSME(SOCBs) 1.3412 1.3770 0.7373 1.5951 0.5578 1.0391
dOME(SOCBs) 0.9743 0.9695 1.0017 1.0885 1.0103 1.0080
dROSE(SOCBs) 1.3767 1.4203 0.7360 1.4655 0.5521 1.0309
dOSE(SOCBs) 1.2555 1.4864 0.7014 1.5374 0.5589 1.0238
dRME(SOCBs) 1.0683 0.9264 1.0511 1.0376 0.9982 1.0150
dOSME(All) 1.3013 1.4030 0.8474 1.6099 0.7387 1.1297
dOME(All) 0.9772 0.9881 1.0275 1.0519 1.0295 1.0145
dROSE(All) 1.3317 1.4199 0.8247 1.5305 0.7175 1.1136
dOSE(All) 1.2532 1.4441 0.8266 1.5738 0.7426 1.1182
dRME(All) 1.0384 0.9716 1.0252 1.0229 0.9948 1.0103
Notes: dOSME: output-oriented scale-mix efficiency change; dOME: output-oriented mix efficiency
change; dROSE: residual output-oriented scale efficiency change; dOSE: output-oriented scale efficiency
change; dRME: residual mix efficiency change; JSBs: joint stock banks; SOCBs: state-owned commercial
banks.
213
In summary, there is a consensus under both approaches to input/output data on the
change of productivity as measured by the Hicks−Moorsteen TFP index as well as the
causes of this change in the Vietnamese banking sector over the period 2007−2012.
There is evidence that the banking system experienced productivity deterioration mainly
due to technical regress. Although an improvement of TFP efficiency is recorded it was
inadequate to offset the technology factor. Amongst a variety of efficiency measures,
scale efficiency appears to be the most significant component contributing to the growth
of overall productive efficiency.
The results based on both the Malmquist and Hicks−Moorsteen TFP index reveal a
similarity about developments in the productivity of Vietnamese banks during the
2007−2012 period, which declined and the main cause of which is technical regress
according to both approaches. However, due to the fact that the Malmquist index is not
multiplicatively complete, other measures of efficiency, including scale and mix
efficiency, cannot be seen via this approach (O‘Donnell, 2012a). Consequently, results
for Vietnamese banking productivity, as measured by the Malmquist index, are biased
and incomplete.
6.6 Summary
By combining a meta-frontier analysis and a double-bootstrap two-stage DEA method
this study measured and analysed the technology gap to the meta-frontier of each bank
group frontier. The results showed that JSBs have the greatest technology gap in
comparison with their public and foreign counterparts under both input/output
approaches. SOCBs find it easier to mimic the industry frontier under the intermediation
approach compared with FJVBs; however, the result is reversed when applying the
214
operating approach. Based on the meta and group models the impact on bank efficiency
of environmental variables was examined. Reform measures conducted in the post-
WTO period have had both negative and positive impacts on bank performance. These
measures included equitisation of public banks and allowing foreign investors to take
part in the banking sector, all aimed at fostering efficiency. In contrast, measures such
as cross-ownership and rural-urban transformation have deteriorated the efficiency
performance of the banking sector. Bank-specific variables including the loan to asset
ratio, equity to asset ratio and return on assets responded differently in the different
group models.
The analysis of productivity showed that the banking system witnessed a decline during
the period 2007–2012 under both the operating and intermediation approaches. This
issue can be explained by regression of the technical component. While the efficiency
component slightly increased under the intermediate approach, it decreased under the
operating approach.
The next chapter presents a number of policy implications and recommendations to
improve Vietnamese bank efficiency based on this chapter‘s empirical findings. It
recommends policies geared towards establishing a competitive banking market,
improving related institutions and consolidating the legal and regulatory framework.
215
Chapter 7: Policy implications and recommendations
7.1 Introduction
The technical efficiency and productivity of the Vietnamese banking sector was
empirically analysed in the two previous chapters using different approaches to
inputs/outputs for the period 2005−2012 which encompassed the pre- and post-WTO
periods. The author has found that state-owned banks are the most efficient and have the
smallest technology gap relative to the meta-frontier. In contrast to the mainstream
view, joint stock banks are the least efficient group and have the biggest technology
gap. The impact of reform measures such as transforming rural to urban banks and
allowing business groups to become involved in the banking sector have contributed
negatively to bank performance.
We find evidence that privatisation of the SOCBs can improve their capacity to earn
profit but has reduced intermediation efficiency. The participation of foreign investors
has improved the efficiency of joint stock banks. Regardless of ownership the results
illustrate a negative relationship between bank capitalisation and performance under the
operating approach. Foreign and joint venture banks are less dependent on lending
activities and are more diversified in their operations than domestic banks. However, the
responses of various bank groups to the same explanatory factors can be different. For
example, the operating efficiency of state-owned banks is positively related to the loan
to asset ratio while a negative relationship is recorded in the case of joint stock banks.
The productivity of banks declined during the period studied, mainly due to
technological regress. These findings provide an appropriate framework for relevant
216
authorities who are responsible for the initiation of innovative measures to improve the
efficiency and productivity of the Vietnamese banking sector.
The perspective of economic integration will be a main driving force for the
liberalisation and restructuring of the banking sector in the next decade (Leung, 2015;
Thanh, 2015). The ASEAN Economic Community (AEC), of which Vietnam will be a
member, will be created in December 2015. Restrictions on the banking sector are
targeted to be substantially removed by 2020 for all AEC members. By 2015, among
the sub-sector including Vietnam, Laos and Cambodia, banking services (acceptance of
deposits and other repayable funds from the public, lending of all types, financial
leasing, payment and money transmission, and guarantees) will be freely transacted
across these countries.
The Trans Pacific Partnership (TPP), a regional regulatory and investment treaty led by
the United States and including Vietnam, is expected to be established by 2020. The
TPP covers important issues such as agriculture, intellectual property, services and
investments. In the financial sector, including commercial banks, the TPP allows
financial institutions in a member country to provide services to their clients in other
countries without establishing overseas operations. A supplier of a TPP country may
also provide any financial services in another TPP market if domestic companies in that
market are allowed to do so (Summary of Trans-Pacific Partnership Agreement, Chapter
11: Financial Services).83
The level of financial liberalisation embedded in the TPP is
greater than that of any other free trade agreement to which Vietnam is a party (Thanh,
2015). The AEC and TPP require Vietnam to liberalise the banking market for foreign
83A summary of theTrans-Pacific Partnership Agreement can be downloaded from: https://ustr.gov/about-
us/policy-offices/press-office/press-releases/2015/october/summary-trans-pacific-partnership
217
investors substantially84
and this presents challenges for the SBV and the government to
improve banking sector performance.85
Challenges exist not only from outside but also inside the banking system.
First, the issue of ownership includes public ownership and cross-ownership. Public-
owned banks still dominate the banking system and remain under the control of the
SBV and the government. Some argue that privatisation would drive them in a more
commercially-based direction (Pincus, 2009; IMF, 2012); nonetheless, while three of
the big four banks have been equitised, the bulk of their equity is still owned by the
State, thereby ensuring their ongoing favour and substantial influence. Meanwhile,
cross-ownership within private banks has been overwhelming and resulted in insider
trading and misallocations of financial resources.
In the context of Vietnam‘s transition economy, the second internal challenge emanates
from a business environment where banks/companies belonging to different types of
ownership are not treated equally. Public banks are preferred and receive privileges
from the State which is not the case for their private counterparts. Foreign banks face
84 Vietnam has been a full member of the WTO since 2007. In the banking sector all commitments to the
WTO have been implemented. As mentioned previously the impact of the WTO on Vietnam has been to
open its banking market to foreign investors in terms of: buying equity in domestic state-owned and
domestic private banks; opening of 100% foreign-owned banks in Vietnam (e.g, HSBC, Standard
Chartered Bank); and foreign bank branches being allowed to receive deposits in Vietnamese dong.
However, there are still limits imposed on foreign investors. Specifically, they cannot take over more than
30% of the total equity of a domestic bank and are not permitted to participate in mergers and
acquisitions; furthermore, they bear further constraints in terms of geographical range and services
provision. Hence, we can say that liberalisation of the banking sector in Vietnam is incomplete and quite
different from that which occurred in the Eastern and Central European economies where all restrictions
on foreign investors were removed and there was no discrimination between foreign and domestic
investors. Consequently, there is room for Vietnam to continue liberalising its banking sector
substantially and more comprehensively under the AEC and, especially, the TPP agreement. Further
liberalising measures are mentioned in sections 7.2, 7.3 and 7.4. 85
Thanh (2015) shows that overlapping forms of economic integration (WTO, AEC, TPP) can create a
complex web of commitments and arrangements with huge distortions; however, all economies have to
ensure maximal liberalisation under each scenario and access to benefits of related parties by domestic
institutional and legal reforms accompanying the implementations of these trade agreements.
218
considerable restrictions on their operations in terms of attracting deposits and lending
in Vietnamese dong, and this issue has prevented them from achieving a higher level of
efficiency and approaching the industry production frontier (the meta-frontier discussed
in Chapters 4, 5 and 6).
Third, it is widely accepted that the regulatory and supervisory framework plays a key
role in establishing and maintaining a sound and sustainable financial system (Beck et
al., 2000; Barth et al., 2004). Recent financial crises such as the EAFC and GFC have
pointed out the weakness of domestic regulators and supervisors. Vietnam launched its
transition process in 1986 and since then the financial system has experienced three
decades of development and change. The temporary recession of the economy in
general and the banking sector in particular during the past 5 years (2011−2015) can be
attributed to poor regulation and supervision in Vietnam (Nguyen and Simioni, 2015).
Lastly, cash payments remain common in Vietnam due to consumer habits and
preferences. This issue means the clients of banks do not liketo keep their money in
bank deposits, rather they hold cash for their daily transactions. Banks must ensure that
they have enough cash in their vaults to meet the needs of their clients on the one hand,
but they can lose the chance to exploit earning deposits by providing more
intermediation services on the other hand.
The empirical results derived from this research and the challenges highlighted above
suggest a number of important policies are required, aimed at improving the efficiency
and productivity of Vietnam‘s banking system. The reform measures conducted in the
post-WTO entry period impacted banks both positively and negatively and are a source
of concern for Vietnamese policy makers as they have the potential to constrain the
219
future development of the overall economy. As indicated by the empirical results in the
previous chapter there are no cases in which all banks are efficient and located on the
production frontier. It would be more practicable if the banks were striving for a higher
level of efficiency. In this context the Vietnamese Government must redesign their
policies towards motivating competition in financial markets and guaranteeing a sound
banking system by developing a strict and strong regulatory and supervisory system.
Based on the empirical results presented previously, a number of policy implications are
proposed and these are discussed in the following three sections. Section 7.2 presents
suggestions and solutions to establish a competitive banking market. Measures to
improve the quality of banks and relevant institutions are considered in Section 7.3. For
a sound, safe and sustainable banking system, the legal and regulatory framework
should be continuously consolidated with measures offered in Section 7.4. Section 7.5
concludes and summarises the main policy implications looking towards improving the
efficiency of the Vietnamese banking system.
7.2 Establishing a competitive and fair banking market
7.2.1 Independence of the SBV
A number of studies (e.g, Kraft et al., 2006; Karas et al., 2010) have shown that one of
the reasons for the superior efficiency of public banks over their private counterparts are
the privileges and preferential treatment extended by the central bank (the SBV in
Vietnam) and the government. The equity owned by the State in these SOCBs is
managed by the SBV and this ensures their greater credibility to depositors in terms of
their solvency. However, direct intervention by the SBV in the banking sector has
220
resulted in a heterogeneous banking environment that curbs fair competition and
efficiency improvement. In this context two measures to increase the independence of
the SBV are suggested. First, for the four equitised SOCBs, the government should
decrease the state-owned equity by selling this to overseas investors86
, who would bring
in expertise, advanced technology and more funding. At the moment at least seventy-
five percent of the equity of SOCBs is held by the SBV and this ensures absolute
control by the State. Selling more equity to foreign strategic investors could make
SOCBs less dependent on the SBV and increase the opportunities for these investors to
hold positions on the boards of directors which, in turn, would direct these banks
towards a more commercially based footing.
Second, the independence of the SBV should be increased by transferring all the equity
held by this entity to another state authority. This action would definitely eliminate the
direct influence of the SBV on SOCBs‘ operations.87
It is suggested that the Ministry of
Finance (MOF) should, on behalf of the State, manage the equity transferred from the
SBV. The MOF has the experience to hold the State‘s equity in most of the equitised
SOEs.88
By doing this the SBV could become, relatively, more of a policy maker and
86 In Chapter 6 it was shown that foreign investors have been proven to exert a positive influence on bank
performance. 87
The Open Market Operations measure was established in 1999 according to Decision 340 of the SBV
and this is an important market mechanism for controlling the banking sector and conducting monetary
policy. Some may ask why the SBV utilises such market-based measures while persistently holding onto
the SOCBs as a non-market measure. The explanation of this paradox goes beyond economics, being
politically based. The Vietnamese communist party, known as the unique and State-holding party, sees
SOEs in general and SOCBs in particular as the backbone of the economy and this will be their long-term
role as mentioned in the 2013 Vietnamese Constitution. Article 51 of the Constitution states that the
Vietnamese economy is a socialist-oriented market economy with multiple forms of ownership and a
multi-sector economic structure; the state economic sector plays the leading role. This article requires
SOEs to participate in all important sectors of the economy, of which the banking sector is one, and this
argument clarifies why the SBV, representing the state, continues to control SOCBs even though it has
adequate market-based tools. 88
Transferring the state-owned equity in SOCBs from the SBV to the MOF would increase transparency
and independence in the SBV‘s policies. When the SBV holds state-ownership in SOCBs, it has to be
administratively responsible for all operations of these banks and this explains why the SBV tends to
221
the relationship with public banks would be more transparent and independent.
However, this change of state authority should be seen as a short-term one because, as
the minority proportion of equity in the equitised SOCBs owned by the private sector
remains unchanged, consequently, the problem of agency is still unresolved. In the
long-run the problem can only be addressed when all state-owned equity is sold on the
stock exchange89
as occurred in many of the Eastern and Central European transition
economies (Poghosyan and Poghosyan, 2010; Bonin and Schnabel, 2011).90
It is worth noting that transition economies such as Vietnam and China are conducting a
gradual transformation to market based economies (Beresford, 2008), during which the
banking sector remains mostly under the control of government. The challenge for
policy makers is to reconcile conflicts between: state ownership and bank efficiency;
efficiency and the autonomy of the SBV; and lastly between state ownership and SBV
autonomy. It could be more practical for the State to continue to hold 51% of SOCB
equity, vested in the MOF rather than the SBV, and let the rest be owned by strategic
investors.91
Lessons from the Eastern and Central European transition economies during
directly provide privileges and discriminative treatment (for instance, in terms of lending activities) for
SOCBs. In the case where the MOF holds the state-owned equity in SOCBs, one may argue the MOF
could collude with the SBV and this suggests the monetary authority of the government could continue to
prefer SOCBs. Obviously, this scenario is possible but it would take time to organise due to the increased
number of attending agencies (the MOF, the SBV and the government) and would be hampered by the
requirement for clear explanations from the MOF acting in the role as the owner. When more authorities
take part in the decision making process of the SBV, the policies generated by this agency would become
more transparent and relatively more independent from the SOCBs‘ operations. It is worth noting that,
under either the SBV or MOF management regime, the majority state ownership is unchanged; thus, the
agent-principal problem remains in effect in the public banks. 89
The total value of the stock exchange (USD 65 billion at end 2014) is much larger than the total market
value of all SOCBs (USD 6.6 billion at end 2014) and the market will be strengthened by the involvement
of overseas investors when the TPP becomes effective. 90
Körner and Schnabel (2011) found a negative impact of state-ownership in banking on long-term
economic growth in countries having low financial development and weak political institutions such as
Vietnam has. However, this relationship is no longer clear or even positive in financially developed
economies. 91
The policy should balance two competing objectives: (1) ensuring control by the State over the banking
sector so that state-owned equity can dominate in SOCBs (more than 50%), (2) improving efficiency and
222
the 1990s show that privatisation focusing on foreign strategic investors is more
successful than other approaches92
(Barisitz, 2009). Participation by foreign investors
injects know-how, experience, technology, corporate governance and capital, thus
boosting competitiveness, encouraging competition and enhancing creditability in the
banking system. At the moment the equity proportion owned by overseas investors
cannot exceed 30%. This limit is due to the Vietnamese State‘s desire to control the
banking sector, hence ensuring its absolute sovereignty over the country‘s financial
system in particular and the economy in general (Kovsted et al., 2005; IMF, 2012).93
Nonetheless, the government does expect the public banks to operate efficiently and,
learning from the experiences of other transition countries, foreign investors are likely
to play a strategically important part in the privatisation of SOCBs.
Holding more than half of the equity ensures control by the State; however, this also
makes foreign investors suspicious of the relevant state authority‘s functions within the
SOCBs and their contributions to the long-term strategy of these banks. As a result,
competitiveness in SOCBs, hence increasing the equity owned by foreign strategic investors as much as
possible but not equal to or exceeding 50% of total equity (suggesting a cap at 49%). At the moment,
foreign investors are allowed to hold a maximum 30% of SOCB equity and the empirical evidence in the
literature as well as in this thesis supports their participation in the banking sector. Hence, these
objectives are compatible and achievable. 92
There are other approaches to bank privatisation. Specifically, insider privatisation is an approach in
which shares of state-owned banks are sold to employees of these banks (Barisitz, 2009). In addition,
indirect privatisation occurred in countries such as Croatia where the state-owned banks are owned by
other SOEs. Then when these SOEs were privatised, the banks were indirectly privatised (Kraft et al.,
2006). 93
As long as article 51 of the Vietnamese constitution is effective the government will not remove the
restrictions imposed on foreign investors in the banking sector. Accordingly, the state economic sector
must be the driving force of the economy in general and the banking sector as an important industry in
particular, despite the fact that Vietnam has fully been a WTO member and is going to be a party to the
AEC and TPP. Vietnam does not accept any regulations from these free trade agreements on absolutely
and thoroughly opening its banking sector. However, it is urgent to remove such limits on operations of
foreign investors. This is because the banking sector in Vietnam is in turmoil due to bad loans and weak
governance and it needs a strong and new capital flow from overseas in parallel with advanced expertise
and technology to strengthen itself. The two conflicting issues cannot be thoroughly addressed in the
economic-political context of Vietnam these days. Nonetheless, compromising suggestions as mentioned
in the previous section, such as reducing the state-ownership equity in SOCBs but ensuring the State still
dominates the total and increasing the fraction of equity available to be held by foreign investors up to but
not exceeding 50%, seem practicable and achievable.
223
regulation on the functions and limits on state representatives in the public banks needs
to be issued as a guarantee for the benefit of investors and to ensure the operations of
SOCBs are clear, transparent, accountable and commercially based. The experiences of
other transition economies in Europe show that, to attract overseas strategic investors,
institutional and legal conditions (notably protection of property rights and the rule of
laws and contracts) play a pivotal function (Barisitz, 2009). Moreover, the CEOs of
public banks should be chosen through a competitive and transparent recruitment
process rather than being appointed by a board of directors consisting of the
representatives of both private institutions and state authorities, as it has been. A
contract mechanism94
could be implemented for the CEOs of public banks in which
they have to commit to achieving certain objectives imposed by the board of directors.
7.2.2 Removing barriers against foreign banks/investors
The empirical evidence from Chapter 6 reveals that the participation of foreign investors
in domestic banks helps improve efficiency. However, the government has a limit of
30% on the equity of a bank, either public or domestic private, that foreign investors can
buy. This limitation has prevented technology transfer and long-term co-operation with
foreign investors. Hence, the 30% limit should be eliminated or at least be loosened to a
significantly higher percentage of 49%.
In the Eastern and Central European transition economies during the 1990s there was no
limit on the participation of overseas investors in either private or state-owned banks
(Bonin and Schnabel, 2011). However, in the case of Vietnam, the limit on maximal
equity participation should be completely eliminated for private banks and a limit
94Shleifer and Vishny (1997) state that contract mechanisms alleviate the agent-principal problem and,
therefore, increase firm efficiency.
224
of49% of equity owned by foreign investors can be applied in SOCBs as discussed in
Section 7.2.1. Further participation of foreign investors in the banking sector in Vietnam
could help provide more capital inflow from overseas, and additionally could provide
advanced technology and a high quality of corporate governance.
7.3 Improving relevant institutions/banks
7.3.1 Mergers and acquisitions (M&As)
In the previous chapter it was found that the JSBs that transformed from rural to urban
banks are less efficient under both the intermediation and operating approaches.
Moreover, the Hicks−Moorsteen index based results show that scale effects impact
significantly on productivity changes of the Vietnamese banking system. Consequently,
a possible solution for these small, inefficient banks is that the SBV should require them
to merge or be acquired by larger and sounder domestic banks.95
This argument is also
supported by Wheelock and Wilson (2000) when they empirically show that small and
managerially inefficient banks, in general, are more likely to be acquired or controlled
for leverage. At the moment foreign banks are not permitted to take part in merger and
acquisitionactivities; nonetheless, the experience of Eastern and Central European
transition economies shows that overseas investors are the main driving force of
95 One may argue that the merger and acquisition policy would undermine the capital structure of the
acquiring/merging banks. To avoid such a problem and following the lessons learned from the EAFC
(Williams and Nguyen, 2005), the SBV needs to issue a standard procedure in which the asset and equity
values of acquired/merged banks have to be precisely identified beforehand. For this purpose, bad assets
and loans must be removed from the balance sheet and relevant loan-loss provisioning costs must be
adequately accounted for. In the aftermath, based on the market values of equity of both
acquiring/merging and acquired/merged parties, the transfer rate of acquired/merged bank equity into
acquiring/merging bank equity will be identified. Such measures would ensure the fairness of any merger
and acquisition transactions and the quality of assets and equity of the new banks after the
acquiring/merging processes. Accordingly, the value of capital ratio may change but the quality of capital
and assets of the acquiring/merging banks will not be negatively impacted.
225
mergers and acquisitions (Hasan and Marton, 2003; Bonin et al., 2005a; 2005b; Fang et
al., 2011). Through mergers and acquisitions, transformed banks have the opportunity
to widen their operating range and save operating costs (Wheelock and Wilson, 2000).
Furthermore, they can be supported by their partners to innovate, improve their
governance, and improve risk management and capital capability (Houston et al., 2001;
Worthington, 2001).
7.3.2 Improving the quality of risk management in JSBs
The JSB model shows that private banks with a higher loan to asset ratio (a proxy for
risk preference) are less efficient than other banks in the same group under the operating
approach. This result raises a concern about the quality of risk management in private
banks. Possible policy suggestions for this problem include: 1) issuing stringent
regulations on lending activities, the capital adequacy ratio, credit limitations, the loan
to deposit ratio, the maximum ratio of short-term liabilities over mid- and long-term
loans, and liquidity ratios; 2) calling for foreign strategic investors to take part in private
domestic banks. These investors can help improve the quality of risk management
through banking technology transfers and training of bank staff; and 3) diversification
of banking activities in order to decrease the loan to asset ratio. One of the weaknesses
of domestic banks compared to their foreign rivals is that they concentrate their business
on lending that, in turn, can lead to a risky asset portfolio.96
A diversification of banking
services would help banks avoid systematic risks from the market and become more
resilient to external shocks.
96 Wheelock and Wilson (2000) argue that loans are typically the least liquid and most risky bank assets
and the more the banks concentrate on loans, the greater the likelihood of failure. A study by Laeven
(1999) showed that in emerging markets with weak enforcement of banking regulations, banks with
excessive loan growth would show a high technical efficiency by taking on excessive risk. Rapid growth
of loans in the short- and mid-term is traded off against an increase of credit risk in the long-term.
226
7.4 Consolidating the legal and regulatory framework
7.4.1 Improving Vietnamese bank accounting standards
According to assessments by the IMF, the Vietnamese system relating to banking
regulations is still far from international accounting standards and the Basel Accord I,
and is not capable of catching up with recent developments in the banking sector (IMF
2012; 2014). Vietnamese Accounting Standards (VAS) were mainly established in 2003
by the Law of Accounting and they tend to overstate profitability, asset values and the
solvency situation of reporting entities. In the case of SOEs, the weaknesses of the VAS
are aggravated by supplemental accounting rules against ―the loss of state capital‖ that
hinder recognition of losses and mask the weak performance of several SOEs (IMF,
2014). Moreover, the empirical evidence in the previous chapter shows the weakness of
temporary bank accounting standards. In particular, the negative relationship between
the equity to asset ratio and operating efficiency is due to the fact that risk-related costs
are inadequately accounted for.
Hence, the hidden risks inside the banking system are underestimated. Another
consequence is that the relevant authority may then issue distorted or inadequate
policies on banks when they are not receiving enough reliable information on banking
operations under the weak and poorly enforced bank accounting and regulatory
standards. It is necessary to create a new system of accounting standards for banking
that can handle the evolution of banks and can account for all activities and possible
risks.
7.4.2 The law on internet banking
227
The analysis of productivity from this study has shown that the technical component of
Vietnamese banks regressed during the studied period and this has resulted in a decline
of Vietnamese banking productivity. According to Lin et al. (2015), the percentage of
Vietnamese people using the Internet in 2014 is 40% and of the total 89.6 million
citizens, 24 million were ATM card holders. There are 48 card issuers, 11,000 ATMs
and 38,000 EFT points of sale nationwide in 2012. Moreover, all commercial banks did
have Internet-based services by the end of 2014. However, few people have used these
new Internet banking products as only 1.16% of total transactions were conducted by
this means in the first half of 201497
. The reasons for this fact are: the preference for
cash payments by consumers, weak coordination among banks, worries about security
and privacy, and an inadequate perception of usefulness (Lin et al., 2015).
The consequence of the lack of popularity of Internet banking activities is that banks
still have to maintain a large number of employees and branches and this results in a
high operating cost. By using internet banking, clients could perform banking
transactions at home or at their work and the banks could serve a much larger client
base with a smaller number of staff and branches. The application of internet banking
helps banks to save costs and improve productivity (Wheelock and Wilson, 1999;
Berger, 2003). In order to encourage people to use internet banking services and ensure
that all relevant transactions are guaranteed, the Vietnamese Parliament should issue a
law on internet banking to establish a legal background for this type of service.
97Source:
http://www.sbv.gov.vn/portal/faces/vi/pages/trangchu/hdk/cntt/udptcntt/udptcntt_chitiet?dDocName=SBV
WEBAPP01SBV075439&dID=77608&_afrLoop=3366875192051715&_afrWindowMode=0&_afrWind
owId=null#%40%3FdID%3D77608%26_afrWindowId%3Dnull%26_afrLoop%3D3366875192051715%
26dDocName%3DSBVWEBAPP01SBV075439%26_afrWindowMode%3D0%26_adf.ctrl-
state%3Deyauo4b0w_4
228
7.4.3 The law on cross-ownership
As discussed previously, cross-ownership has been occurring between business groups
and private banks. This includes ownership of JSBs by other banks (SOCBs and other
JSBs) and by business groups (including SOEs), and this complicated shareholding
structure raises concerns about conflicts of interest, connected lending and distorted
credit allocation. The results from Chapter 6 show that this nexus has negatively
impacted bank performance in terms of profit maximisation and the provision of
intermediation services.
The circumstance of the Vietnamese banking sector in the post-WTO period is
somewhat similar to that of countries (including Indonesia, Korea, Malaysia, the
Philippines and Thailand) during the East Asia Financial Crisis. According to Williams
and Nguyen (2005) these economies are characterised by the prevailing dominance of
large, and in some cases family owned, corporations which owned financial
subsidiaries, circumventing restrictions on lending. This interrelated economic model
between finance and ownership lay behind connected lending and was a major root
cause of the EAFC. This potential problem was compounded by an underdeveloped
institutional environment characterised by weak supervision and regulations. In general,
governments in these aforementioned Asian countries responded to the financial distress
by: nationalising banks; closing unviable banks; carrying out compulsory purchases and
transferring assets to healthy and sound banks; creating larger core banks; removing bad
assets to state-owned and managed asset management companies; and injecting capital
to recapitalise banks (Laeven, 1999; Williams and Nguyen, 2005). When these
measures were completed these restructured and nationalised banks were returned to the
private sector through a privatisation process (Lindgren et al., 2000; Radelet and Sachs,
229
2000). Other solutions were also implemented to improve the quality of management
and ensure that these restructured banks would be more transparent, efficient and safer
including: broadening access for foreign-owned banks and allowing majority foreign
ownership; replacing underdeveloped management; and revising managerial incentives.
Furthermore, international standards on supervision and regulation were implemented in
order to improve the institutional environment.
Vietnam can learn from the experiences of these Asian countries to resolve its similar
problems. For example, nationalising or even closing unviable banks; establishing an
asset management corporation98
; allowing majority foreign ownership99
; and applying
international standards to establish a sound regulatory and supervisory framework
including enacting a law on cross-ownership.
7.4.4 The law on bank regulation and supervision
To maintain a sound and efficient banking sector Vietnam has to improve its banking
regulatory and supervisory framework as it currently is underdeveloped and faces
substantial challenges (IMF, 2012; 2014). A law on supervision should be enacted to
address serious gaps in the regulatory framework. These gaps include:
(1) the definition of related parties100
is overly narrow, hindering the
identification and assessment of ultimate beneficiaries. This affects various
98 The Vietnam Asset Management Company was indeed established in 2013.
99Foreign investors should be allowed to hold more than half of the capital of domestic banks. By doing
this they will commit to long-run investments and, by taking control of the domestic banks, the quality of
management will be improved to meet international and far more advanced standards. 100
According to International Accounting Standard 24, a related party is a person or entity that is related
to the entity that is preparing its financial statements. At the moment the definition of related parties in the
banking sector in Vietnam is narrow and it has not caught up with the international criterion and has not
adequately accounted for all people and corporations possibly impacting on the operations of banks (IMF,
2014). As a result, risks relevant to related parties may be ignored.
230
aspects of supervision, including licensing, transfer of ownership, acquisition,
related party lending and capital adequacy (IMF, 2012; 2014);
(2) the framework of authorisation is too prescriptive and does not allow
enough room for supervisors to conduct proper screening and assessment; and
(3) capital adequacy requirements are still based on the Basel I Accord and there
is a lack of guidance on market, operational and interest rate risks (IMF, 2012;
2014).
7.5 Summary
In this chapter, valuable policy implications and recommendations have been drawn
from the empirical evidence presented in this thesis that include:
(1) the impact of policy changes in the post-WTO era and of bank specific
variables on the technical efficiency of the Vietnamese banking sector during the
2005−2012 period using a double-bootstrap two-stage DEA model and meta-
frontier analysis;
(2) comparisons of technical efficiency between public, private, foreign and joint
venture bank groups using the Li (1996) and the Simar and Zelenyuk (2007)
tests; and
(3) analysis of Vietnamese bank productivity using the AMPI.
In order to improve the technical efficiency and productivity of Vietnamese banks,
specific policies should be targeted on:
231
(1) ensuring the independence of the SBV by reducing the volume of equity
owned by the State in SOCBs and transferring the equity to the MOF;
(2) removing all limits relevant to the participation of foreign investors in
domestic banks;
(3) requiring small and inefficient banks to merge/be acquired by bigger,
financially sound banks;
(4) improving the quality of risk management in private banks by issuing
stringent regulations on lending, thereby encouraging foreign investors to take a
larger part in management and diversification of banking activities;
(5) improving Vietnamese bank accounting standards to adequately account for
recent developments in the banking sector;
(6) enacting a law on internet banking to ensure the benefits are taken up and to
enhance its credibility for consumers;
(7) enacting a law regulating cross-ownership in private banks to ensure that
there are no conflicts of interest or connected lending and to avoid distorted
credit allocation; and
(8) consolidating the regulatory and supervisory framework by enacting a law on
bank regulation and supervision.
In the next and final chapter, the major conclusions from the thesis, limitations and
suggestion for further research will be presented.
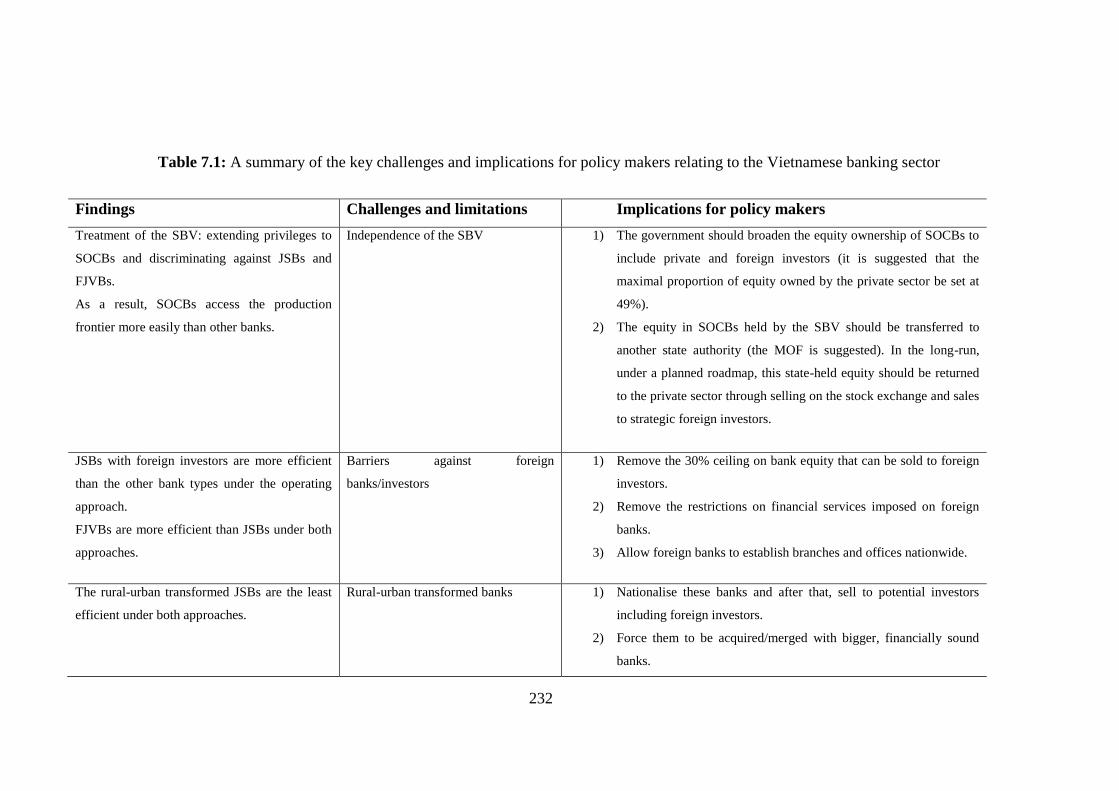
232
35Table 7.1: A summary of the key challenges and implications for policy makers relating to the Vietnamese banking sector
Findings Challenges and limitations Implications for policy makers
Treatment of the SBV: extending privileges to
SOCBs and discriminating against JSBs and
FJVBs.
As a result, SOCBs access the production
frontier more easily than other banks.
Independence of the SBV 1) The government should broaden the equity ownership of SOCBs to
include private and foreign investors (it is suggested that the
maximal proportion of equity owned by the private sector be set at
49%).
2) The equity in SOCBs held by the SBV should be transferred to
another state authority (the MOF is suggested). In the long-run,
under a planned roadmap, this state-held equity should be returned
to the private sector through selling on the stock exchange and sales
to strategic foreign investors.
JSBs with foreign investors are more efficient
than the other bank types under the operating
approach.
FJVBs are more efficient than JSBs under both
approaches.
Barriers against foreign
banks/investors
1) Remove the 30% ceiling on bank equity that can be sold to foreign
investors.
2) Remove the restrictions on financial services imposed on foreign
banks.
3) Allow foreign banks to establish branches and offices nationwide.
The rural-urban transformed JSBs are the least
efficient under both approaches.
Rural-urban transformed banks 1) Nationalise these banks and after that, sell to potential investors
including foreign investors.
2) Force them to be acquired/merged with bigger, financially sound
banks.
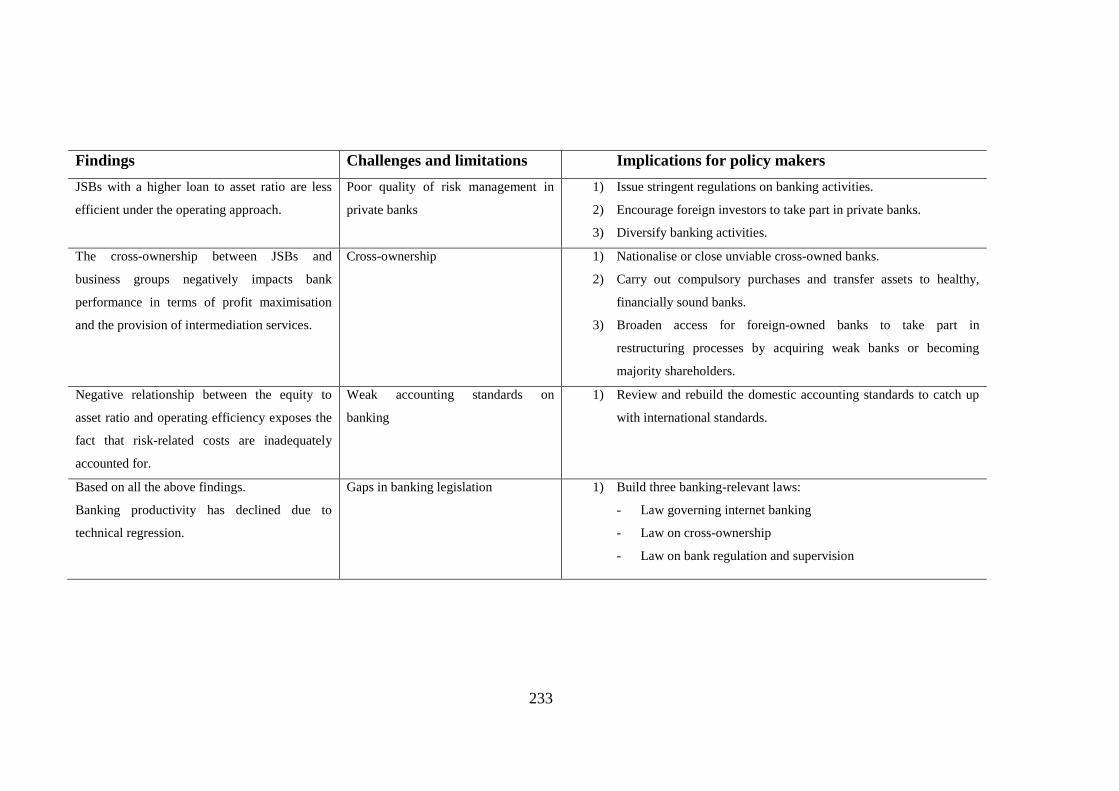
233
Findings Challenges and limitations Implications for policy makers
JSBs with a higher loan to asset ratio are less
efficient under the operating approach.
Poor quality of risk management in
private banks
1) Issue stringent regulations on banking activities.
2) Encourage foreign investors to take part in private banks.
3) Diversify banking activities.
The cross-ownership between JSBs and
business groups negatively impacts bank
performance in terms of profit maximisation
and the provision of intermediation services.
Cross-ownership 1) Nationalise or close unviable cross-owned banks.
2) Carry out compulsory purchases and transfer assets to healthy,
financially sound banks.
3) Broaden access for foreign-owned banks to take part in
restructuring processes by acquiring weak banks or becoming
majority shareholders.
Negative relationship between the equity to
asset ratio and operating efficiency exposes the
fact that risk-related costs are inadequately
accounted for.
Weak accounting standards on
banking
1) Review and rebuild the domestic accounting standards to catch up
with international standards.
Based on all the above findings.
Banking productivity has declined due to
technical regression.
Gaps in banking legislation 1) Build three banking-relevant laws:
- Law governing internet banking
- Law on cross-ownership
- Law on bank regulation and supervision
234
Chapter 8: Summary and conclusions
8.1 Introduction
There is a close and positive relationship between economic growth and a country‘s
level of financial development in both developed and newly emerging market
economies (Levine, 1997; 1998; Beck et al., 2000). In Vietnam, the banking sector
contributes a substantial proportion, 90%, of the total assets of the financial system
(IMF, 2014), and thus plays a pivotal role in providing capital to the economy. As a
consequence, the efficiency and productivity of the Vietnamese banking sector impacts
significantly on the quality and magnitude of economic growth.
Vietnam‘s entry to the WTO in 2007 marked an important point in the banking sector‘s
liberalisation; accordingly, a number of policy measures were conducted to improve
bank performance and competitiveness. For example, as part of its commitments to the
WTO, overseas investors were allowed to open 100% foreign-invested banks in
Vietnam. These banks are recognised as being important because of their advanced
technology and high quality of governance. Foreign investors, furthermore, are allowed
to take part in domestic banks as minority shareholders. Rural banks are permitted to
transform into urban banks. Four of the five state-owned banks were equitised and
foreign strategic investors were encouraged to participate in this process. The pre- and
post-WTO entry period experienced rapid credit growth at an average rate of 35%
annually101
. The relevant policy changes after the WTO event could be expected to have
impacts on bank efficiency and productivity; however, no study has been carried out to
assess these possible impacts. Therefore, the aim of this thesis has been to shed light on
101See Chapter 2 for more details.
235
the impact of WTO entry on bank efficiency and productivity in Vietnam, which is seen
as being critical to the future sustained growth of the economy.
The objective of this study has been to answer the following questions: 1) How has the
Vietnamese banking sector evolved since its transformation from a one-tier to two-tier
system in 1988? 2) Which methods can be best utilised to measure and analyse the
efficiency and productivity of a banking sector, especially in the case of a transition
economy such as Vietnam‘s? 3) What has been the level of efficiency and productivity
changes in Vietnamese banks encompassing the pre- and post-WTO entry periods? 4)
What has been the impact of policy changes implemented after WTO accession? 5)
What are the important sources of inefficiency from the perspective of the Vietnamese
banking system?
This chapter summarises the main findings related to these questions and is structured
as follows. Section 8.2 provides a summary of the main findings presented in previous
chapters and how these findings address the research questions and hypotheses
highlighted in Chapter 1. The policy implications and recommendations for the SBV
and Vietnamese government to improve banking sector performance provide the focus
of Section 8.3. Section 8.4 offers a description of the study‘s limitations. Lastly, Section
8.5 suggests areas for further research based on the limitations and possible extensions
of the thesis.
236
8.2 Summary of empirical findings
8.2.1 Findings for the research questions
As the focus of the thesis, a number of research questions and hypotheses were raised in
chapter 1. The questions and hypotheses concentrated on: estimating and comparing the
technical efficiency and productivity performance of the Vietnamese banking system
during the 2005−2012 period, examining the significance of policy changes
implemented in the post-WTO accession period, identifying bank-specific
characteristics and time trends impacting on bank performance, and identifying key
policy priorities for the government and the SBV concerned with enhancing the
technical efficiency and fostering the productivity of the Vietnamese banking sector.
The main findings for each of these research questions are now discussed.
How has the Vietnamese banking sector evolved during its transformation from a
one-tier to two-tier system starting in 1988?
To answer this question, the literature related to the historical development of
Vietnam‘s banks from initiation of the transformation process from a mono system to a
two-tier system in 1988 to the present was collected, reviewed and analysed. During this
time period both the successes and failures relating to the Vietnamese banking sector
were analysed in depth; moreover, a comparison with other transition countries was also
conducted highlighting differences and similarities. In general, evolution of the
Vietnamese banking sector can be divided into four phases: (1) the first phase
(1988−1997) marked the transition process from a one- to two-tier banking system
which ended with the onset of the EAFC, (2) the second phase (1998−2006) is
characterised by a substantial change in the legal system with the issuance of the
237
banking law that formulated the functions of the SBV and eliminated direct control over
the interest rate, (3) the third phase (2007−2010) recorded a dramatic growth of the
banking sector after Vietnam joined the WTO in 2007; however, turmoil arising from
hidden risks related to financial asset bubbles and intra-lending activities generated
concern for policy makers, (4) the fourth phase began from 2011 up to the present and
was characterised by reform measures to stabilise and sustainably restructure the
banking system. Overall, development of the Vietnamese banking sector has been
significantly impacted by economic liberalisation and integration such as from its
membership of the WTO in 2007 and from its membership of regional free trade
agreements such as the AEC and TPP in 2015.
What methods can be utilised to measure and analyse the efficiency and productivity
of a banking sector, especially in the case of a transition economy such as Vietnam’s?
The non-parametric method – DEA was employed to estimate the production frontiers
and measure the efficiency and productivity of Vietnamese banks and the overall
banking sector during the period 2005–2012. An advantage of this thesis is that the
author employs bootstrap techniques in the context of DEA which can give less biased
and more consistent estimates of efficiency; therefore, the results obtained are more
reliable. The bootstrap-based tests of Simar and Zelenyuk (2006) and Simar and
Zelenyuk (2007) have been utilised to examine bank technical efficiency differences
across different periods and amongst groups. Furthermore, applying the double-
bootstrap two-stage DEA method of Simar and Wilson (2007) to examine the impact of
environmental variables on efficiency is another merit of this study because the method
provides less biased and more consistent coefficients. An aggregate Malmquist
productivity index was initially utilised to measure bank performance. The advantage of
238
this method is that it accounts for the relevant importance of individual banks
(weighting) while conventional Malmquist productivity indexes see banks as having
equal weighting. Furthermore, Hick−Moorsteen index that is knows as a
multiplicatively complete TFP index was also utilisd in this thesis. This better index
provides a comprehensive measures of efficiency changes in a comparison with any
types of Malmquist index. By combining the double-bootstrap two-stage DEA with a
meta-frontier analysis, this approach was proven to be the appropriate methodology for
analysing the Vietnamese banking sector where the business environment in which
banks are operating is heterogeneous. Therefore, the author has addressed the question
of which methodology should be employed to analyse the performance of Vietnamese
banks.
What has been the level of efficiency and productivity changes in Vietnam’s banks
encompassing the pre- and post-WTO entry periods?
In answering this question, DEA-based tests including those of Li (1996) and Simar and
Zelenyuk (2007) were utilised to measure and compare the technical efficiency of
Vietnamese banks between the pre- and post-WTO periods. The analysis was carried
out using unbalanced panel data obtained from the financial reports of commercial
banks in Vietnam consisting of state-owned, domestic and foreign private banks from
2005 to 2012. A total of 232 bank-year observations were used to measure technical
efficiency, as presented in Section 5.2 of Chapter 5. The empirical results indicated that
the banking sector in both the pre- and post-WTO periods operated below its potential
capability using both aggregate and mean technical efficiency, and the values of
efficiency estimated by the intermediation approach were bigger than those estimated
under the operating approach.
239
The Simar and Zelenyuk (2007) test shows that the technical efficiency of the
Vietnamese banking sector in the pre-WTO period is the same as that in the post-WTO
period, using both the aggregate and mean criteria and under both the operating and
intermediation approaches. The equality of efficiency between the two periods implies
that there was no significant improvement in bank performance. The policy measures
implemented in the wake of WTO entry aimed at improving the technical efficiency of
banks, therefore, proved to be largely ineffective. This conclusion is also supported by
the Li (1996) test on the distribution of efficiency scores between the two periods. The
results of the Li (1996) test show that the capability of banks to access the industry
frontier in the pre-WTO period is the same as that in the post-WTO period under both
approaches to input/output data.
What has been the impact of policy changes implemented after WTO accession?
For each policy change a hypothesis was elaborated to postulate its possible impact on
bank performance, as indicated in Chapter 1. In order to identify these impacts, dummy
variables were used as proxies for relevant policy changes and were utilised in the
different models. Under the meta-frontier analysis approach, banks belonging to
different ownership types are assumed to have their own technology sets and this
required estimating the production frontier for each group. There are two types of
models that can be used: (1) a meta-model that embraces all banks regardless of their
ownership, (2) a group model that only includes banks of a specific ownership type, and
there are three group models that are relevant - state, private and foreign ownership. For
each model a regression is conducted to observe the impact of a specific policy change
on bank efficiency and repeated twice under the two approaches to input/output data.
240
The impacts of policy changes in the post-WTO era were hypothesised and they are
presented in detail in section 8.2.2;
What are the important sources of inefficiency in the Vietnamese banking system?
The empirical analysis in this study showed two sources of inefficiency in the
Vietnamese banking sector. First, policy changes in the post-WTO period when
Vietnam had to conduct its commitments after joining this organisation. Details on the
possible impact of these banking-related policy changes are presented in section 8.2.2
below. Second, other control variables including bank characteristics and a time trend
capturing the evolution of bank efficiency along a timeline starting in 2005 (before the
WTO entry event - 2007) and ending in 2012 are also included in the regression models
to see their influence.
To see the impact of asset structure on bank efficiency the loan to asset ratio (LA) was
employed across the meta- and all three group models (JSB, SOCB, and FJVB models).
Under the intermediation approach the results are consistent and show a significant and
positive relationship between the LA ratio and bank efficiency. Nevertheless, the results
are inconsistent under the operating approach. In the JSB model the above mentioned
relationship is negative while it is positive in the two remaining group models (SOCB
and FJVB models).
The equity to asset ratio (EA) represents capital strength and its relationship with bank
efficiency. Using the profit maximising criterion to input/output data, the relevant
coefficients of all meta- and three group models show a consistent result that the EA
ratio has a negative relationship with bank performance. However, results using the
intermediation approach are inconsistent. A negative association between capital
241
strength and bank efficiency is recorded in the JSB and SOCB models but it is positive
in the FJVB model.
The characteristic of bank profitability is proxied by the return on asset ratio (ROA) and
this variable appears in all four regression models. The relationship of ROA with that of
bank efficiency is consistently positive across the different models under the operating
approach. Meanwhile, the impact is inconsistent across different group models under
the intermediation approach to input/output data. Specifically, bank profitability has a
negative impact in the FJVB model while it is positive in the other two group models
including those for private and public banks.
To control for the impact of a time trend on bank performance, the variable T is used
and constructed linearly under the rule that for the first year it receives a value of one
and receives a value of two in the second year. This process is repeated until the last
year of the studied period. The empirical results showed that the time trend is significant
in the meta- and JSB model using the operating approach; meanwhile, under the
intermediation approach the variable is significant in the meta-, JSB, and SOCB models.
The disparity of bank groups‘ reaction to the time variable implies that banks belonging
to different ownership types evolve along a variety of directions, and this is also
significant evidence to support the assumption that the business environment in
Vietnam is heterogeneous and, operating under such conditions, bank groups cannot
have the same trajectory of development.
8.2.2 Findings for the research hypotheses
To know whether the impact of a policy change is significant or not, the values of the
relevant coefficients of the dummy variables were compared to zero. The double-
242
bootstrap two-stage DEA method provided a sampling distribution of each coefficient
and also identified its confidence interval that is characterised by upper and lower
values. At α significance degree, if both bounds are smaller than zero then it can be
concluded that the related coefficient value is significantly negative. On the other hand
if both bounds are bigger than zero then the conclusion is that the coefficient value is
significantly positive. The rest of this section focuses on how the empirical results
answer the hypotheses posed in chapter 1.
Hypothesis 1:
The capital participation of several large SOEs and private business groups decreased
the efficiency performance s of banks.
The dummy variable BG appearing in the meta- and JSB model was used as a proxy to
indicate the capital participation of private and state-owned business groups in JSBs.
There is evidence to suggest that the efficiency of private banks with cross-ownership
from business groups deteriorated under the profit maximising criterion. Specifically,
the coefficients of BG were significantly positive under the meta- and group models.
This empirical proof supports hypothesis 1 that cross-ownership has resulted in a
misallocation of credit that has eventually resulted in bad loans. The resolution of bad
loans takes time, incurs high cost and undermines the efficiency of these banks.
Hypothesis 2:
Privatisation of SOCBs has increased the technical efficiency of these banks.
Privatising public banks is a measure to alleviate the agency problem and increase bank
efficiency as postulated in hypothesis 2. The influence of this policy change was
243
presented by the dummy variable P, referring to privatised SOCBs. This binary variable
appears in both the meta- and SOCB models. Under the operating approach the
empirical results showed a significant and positive impact of P in the two mentioned
models and also provided support for hypothesis 2. Under the intermediation approach
the impact of P was positive in the meta-model but was negative in the SOCB model,
implying that privatised banks are less efficient than non-privatised banks. This result
can be explained by the fact that, after privatisation, SOCBs became more cautious in
their lending activities and more commercially-based when their priority is profit rather
than providing credit as much as possible to targeted economic sectors or areas.
Hypothesis 3:
Foreign involvement in domestic banks (both SOCBs and JSBs) has exerted a positive
impact on the technical efficiency of Vietnamese banks.
To test hypothesis 3 the dummy variable FSI was included in the regression models and
indicates banks with foreign involvement. The variable FSI appears in both the meta-
model and group model. Due to the fact that when SOCBs are privatised their equity is
simultaneously sold to strategic investors; we cannot distinguish between the two
variables FSI and P in the SOCB group model. In addition, allowing overseas
investments in SOCBs is just an important component of the privatisation process and
so FSI is excluded from the SOCB model. Consequently, FSI was included in only the
meta-model and JSB model.
In the JSB model the empirical outcome showed a positive impact of foreign
participation in private banks on income-based efficiency, and this outcome supports
hypothesis 3 that strategic investors from overseas with expertise, advanced technology
244
and strong capital capability can contribute positively to the decision making process of
domestic banks, improve the quality of management, and develop new banking services
and products.
Hypothesis 4:
The deregulation of rural banks into urban banks by the SBV reduced the mean
efficiency of the banking sector.
To examine the impact of transforming rural into urban banks by the SBV the dummy
variable RU was utilised to distinguish transformed banks from others. The RU variable
was included in the meta- and JSB models. The regression outcomes demonstrated a
negative relationship between RU and bank performance under the two approaches and
two mentioned regression models. Accordingly, the results support hypothesis 4 that,
under an inadequately selective process, the decision of the SBV to transform rural
banks into urban ones resulted in their low efficiency in particular and deteriorated the
performance of the banking industry in general.
8.3 Policy implications and recommendations
The empirical analysis presented in this thesis has shown that Vietnamese banks are
operating far from their optimal capability, especially in terms of providing
intermediation services, and it is likely to constrain the development of the financial
system and economic growth. A number of policy implications and recommendations
have been suggested to improve the efficiency and productivity of the banking sector.
First, the authorities need to establish a competitive and fair market for all banks
regardless of which type of ownership they belong to. This could be achieved via
245
reducing or divesting equity in SOCBs held by the SBV, and eliminating or increasing
the maximal proportion of equity that can be owned by foreign investors in Vietnamese
banks.
Second, the SBV has to implement measures to upgrade the quality of banks. Due to the
scale effect, the weak and small banks, especially rural-urban transformed banks, should
be encouraged to merge or be acquired by sound big banks. The quality of risk
management can be improved by issuing stringent regulations on lending, capital
adequacy ratio, credit limitation, loan to deposit ratio; calling for foreign strategic
investors to participate in private banks; and diversifying banking operations. Banks
should be regularly recapitalised and this can be seen as a guarantee against equity-loss
risks.
Third, the legal and regulatory framework needs to be consolidated in order to increase
the transparency and accountability of banks. There are a number of laws on banking
activities suggested for efficiency improvement that need to be constructed, including a
law on the accounting standards of banking, a law on internet banking, a law on cross-
ownership, and a law on banking regulation and supervision.
8.4 Limitations
There are a number of limitations of this thesis. First, due to the long-term process
involved in completing this study, new and advanced techniques relating to DEA have
not been incorporated. The double-bootstrap two-stage DEA of Simar and Wilson
(2007) is based on the strict condition that the production set and environmental
variables are separable. This weakness can be overcome by using conditional efficiency
246
measures as suggested by Bădin et al. (2012; 2014) and Daraio and Simar (2014).
Another limitation is that the aggregate Malmquist productivity index is a DEA-based
method and so it inherits the downward-biased nature of DEA efficiency estimates and
cannot allow for statistical inference. The quality of accounting data is also a limitation
due to out-dated Vietnamese accounting standards if compared with present
international accounting standards. In term of methods to estimate production frontiers,
the parametric methods such as SFA can be applied in this thesis and it has a number of
advantages when compared with DEA, for example, SFA allows for random errors.
Using dummies to examine hypotheses can limit other alternatives to test these
hypotheses in more controlled environment. Lastly, although the author has tried to
collect data on bad loans it has not been possible to obtain this from the SBV. Once the
data for bad loans becomes available the performance of Vietnamese banks can be
analysed using this undesirable output/outcome.
8.5 Areas for further research
The limitations and empirical evidence presented in this thesis propose further academic
work in order to enrich our understanding and knowledge of the banking sector in
general and Vietnamese bank efficiency in particular. An opportunity for future research
is to develop an algorithm to incorporate the bootstrap technique into an aggregate
Malmquist productivity index.
Second, when the data on bad loans become available then this variable can be seen as
an undesirable output because banks have to account for these loans as a provisioning
cost and consequently reduce their profitability. The bad loans and other desirable
outputs such as loans and investments are simultaneously generated from the production
247
process of banks. Thus, the efficiency of Vietnamese banks can be measured more
comprehensively and consistently if incorporating bad loans.
Third, in terms of technical issues, it would be more consistent for empirical analysis of
the impact of environmental variables on bank efficiency if conditional efficiency
measures were utilised. This new method does not require a separability condition on
the relationship between input-output combinations and environmental variables as is
the case for double-bootstrap two-stage DEA.
The second and the third areas for further study can be combined to give a
comprehensive measure of bank efficiency at the first stage and consistent results on the
impact of variables at the second stage.
This study has also highlighted the similarity of China and Vietnam‘s conduct of a
gradual approach to the liberalisation of the banking sector. A comparative study of the
impact of reform measures implemented after the WTO event on bank performance in
these two banking systems would be an interesting area for future research.
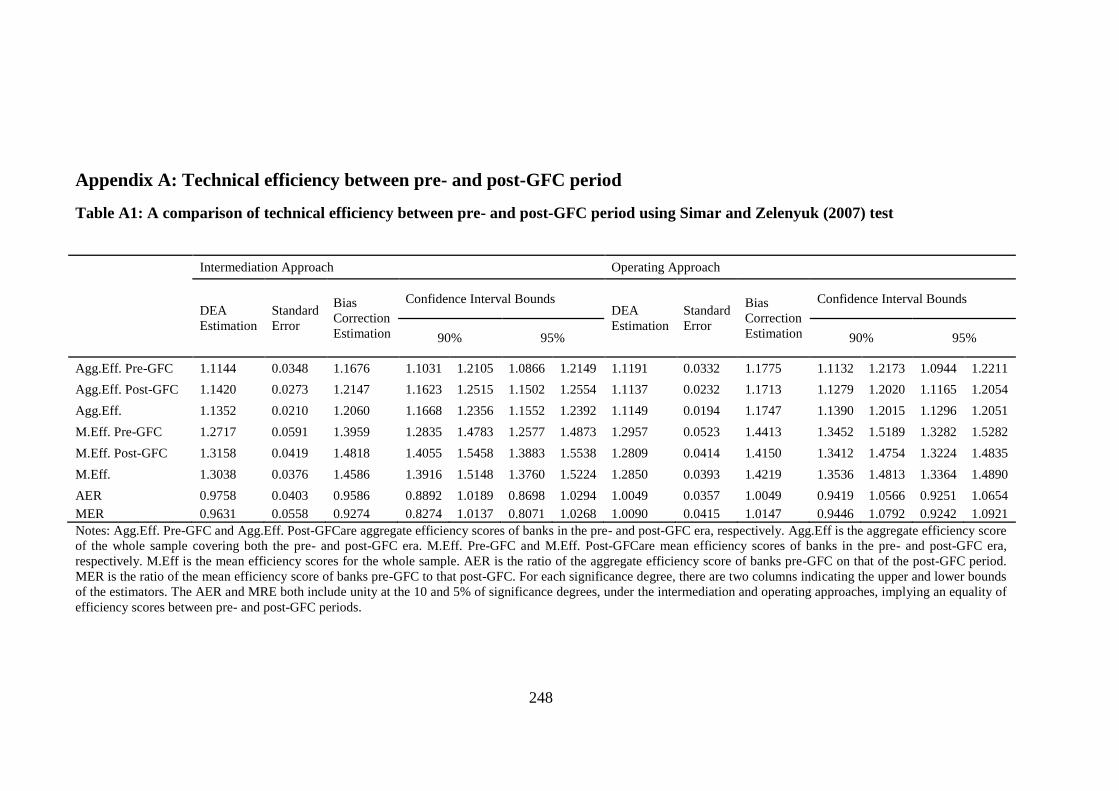
248
Appendix A: Technical efficiency between pre- and post-GFC period
Table A1: A comparison of technical efficiency between pre- and post-GFC period using Simar and Zelenyuk (2007) test
Notes: Agg.Eff. Pre-GFC and Agg.Eff. Post-GFCare aggregate efficiency scores of banks in the pre- and post-GFC era, respectively. Agg.Eff is the aggregate efficiency score
of the whole sample covering both the pre- and post-GFC era. M.Eff. Pre-GFC and M.Eff. Post-GFCare mean efficiency scores of banks in the pre- and post-GFC era,
respectively. M.Eff is the mean efficiency scores for the whole sample. AER is the ratio of the aggregate efficiency score of banks pre-GFC on that of the post-GFC period.
MER is the ratio of the mean efficiency score of banks pre-GFC to that post-GFC. For each significance degree, there are two columns indicating the upper and lower bounds
of the estimators. The AER and MRE both include unity at the 10 and 5% of significance degrees, under the intermediation and operating approaches, implying an equality of
efficiency scores between pre- and post-GFC periods.
Intermediation Approach Operating Approach
DEA
Estimation
Standard
Error
Bias
Correction
Estimation
Confidence Interval Bounds DEA
Estimation
Standard
Error
Bias
Correction
Estimation
Confidence Interval Bounds
90% 95% 90% 95%
Agg.Eff. Pre-GFC 1.1144 0.0348 1.1676 1.1031 1.2105 1.0866 1.2149 1.1191 0.0332 1.1775 1.1132 1.2173 1.0944 1.2211
Agg.Eff. Post-GFC 1.1420 0.0273 1.2147 1.1623 1.2515 1.1502 1.2554 1.1137 0.0232 1.1713 1.1279 1.2020 1.1165 1.2054
Agg.Eff. 1.1352 0.0210 1.2060 1.1668 1.2356 1.1552 1.2392 1.1149 0.0194 1.1747 1.1390 1.2015 1.1296 1.2051
M.Eff. Pre-GFC 1.2717 0.0591 1.3959 1.2835 1.4783 1.2577 1.4873 1.2957 0.0523 1.4413 1.3452 1.5189 1.3282 1.5282
M.Eff. Post-GFC 1.3158 0.0419 1.4818 1.4055 1.5458 1.3883 1.5538 1.2809 0.0414 1.4150 1.3412 1.4754 1.3224 1.4835
M.Eff. 1.3038 0.0376 1.4586 1.3916 1.5148 1.3760 1.5224 1.2850 0.0393 1.4219 1.3536 1.4813 1.3364 1.4890
AER 0.9758 0.0403 0.9586 0.8892 1.0189 0.8698 1.0294 1.0049 0.0357 1.0049 0.9419 1.0566 0.9251 1.0654
MER 0.9631 0.0558 0.9274 0.8274 1.0137 0.8071 1.0268 1.0090 0.0415 1.0147 0.9446 1.0792 0.9242 1.0921
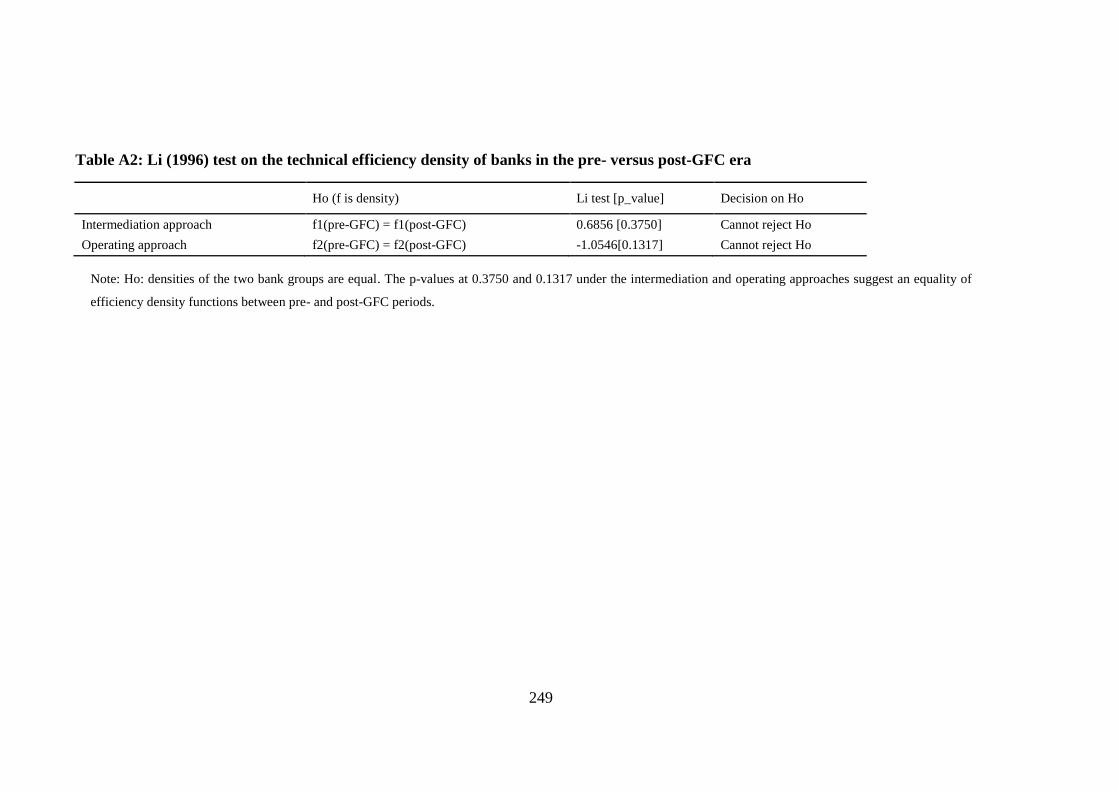
249
Table A2: Li (1996) test on the technical efficiency density of banks in the pre- versus post-GFC era
Ho (f is density) Li test [p_value] Decision on Ho
Intermediation approach f1(pre-GFC) = f1(post-GFC) 0.6856 [0.3750] Cannot reject Ho
Operating approach f2(pre-GFC) = f2(post-GFC) -1.0546[0.1317] Cannot reject Ho
Note: Ho: densities of the two bank groups are equal. The p-values at 0.3750 and 0.1317 under the intermediation and operating approaches suggest an equality of
efficiency density functions between pre- and post-GFC periods.
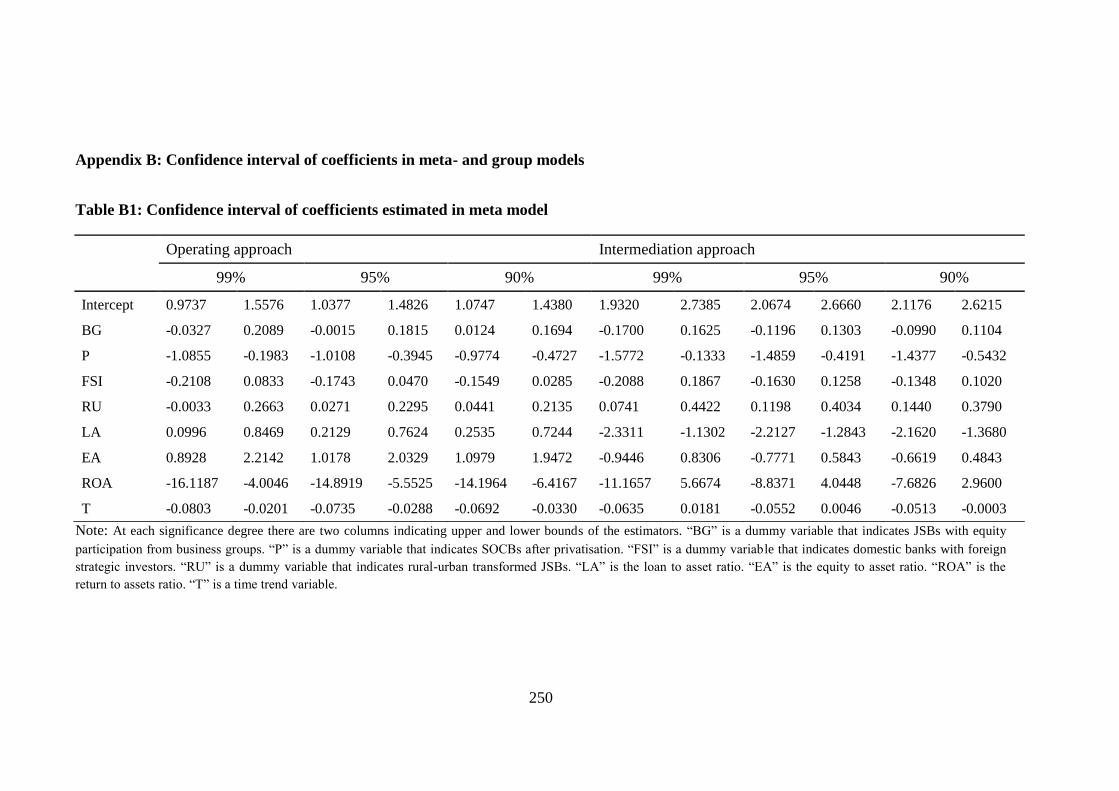
250
Appendix B: Confidence interval of coefficients in meta- and group models
Table B1: Confidence interval of coefficients estimated in meta model
Operating approach Intermediation approach
99% 95% 90% 99% 95% 90%
Intercept 0.9737 1.5576 1.0377 1.4826 1.0747 1.4380 1.9320 2.7385 2.0674 2.6660 2.1176 2.6215
BG -0.0327 0.2089 -0.0015 0.1815 0.0124 0.1694 -0.1700 0.1625 -0.1196 0.1303 -0.0990 0.1104
P -1.0855 -0.1983 -1.0108 -0.3945 -0.9774 -0.4727 -1.5772 -0.1333 -1.4859 -0.4191 -1.4377 -0.5432
FSI -0.2108 0.0833 -0.1743 0.0470 -0.1549 0.0285 -0.2088 0.1867 -0.1630 0.1258 -0.1348 0.1020
RU -0.0033 0.2663 0.0271 0.2295 0.0441 0.2135 0.0741 0.4422 0.1198 0.4034 0.1440 0.3790
LA 0.0996 0.8469 0.2129 0.7624 0.2535 0.7244 -2.3311 -1.1302 -2.2127 -1.2843 -2.1620 -1.3680
EA 0.8928 2.2142 1.0178 2.0329 1.0979 1.9472 -0.9446 0.8306 -0.7771 0.5843 -0.6619 0.4843
ROA -16.1187 -4.0046 -14.8919 -5.5525 -14.1964 -6.4167 -11.1657 5.6674 -8.8371 4.0448 -7.6826 2.9600
T -0.0803 -0.0201 -0.0735 -0.0288 -0.0692 -0.0330 -0.0635 0.0181 -0.0552 0.0046 -0.0513 -0.0003
Note: At each significance degree there are two columns indicating upper and lower bounds of the estimators. ―BG‖ is a dummy variable that indicates JSBs with equity
participation from business groups. ―P‖ is a dummy variable that indicates SOCBs after privatisation. ―FSI‖ is a dummy variable that indicates domestic banks with foreign
strategic investors. ―RU‖ is a dummy variable that indicates rural-urban transformed JSBs. ―LA‖ is the loan to asset ratio. ―EA‖ is the equity to asset ratio. ―ROA‖ is the
return to assets ratio. ―T‖ is a time trend variable.
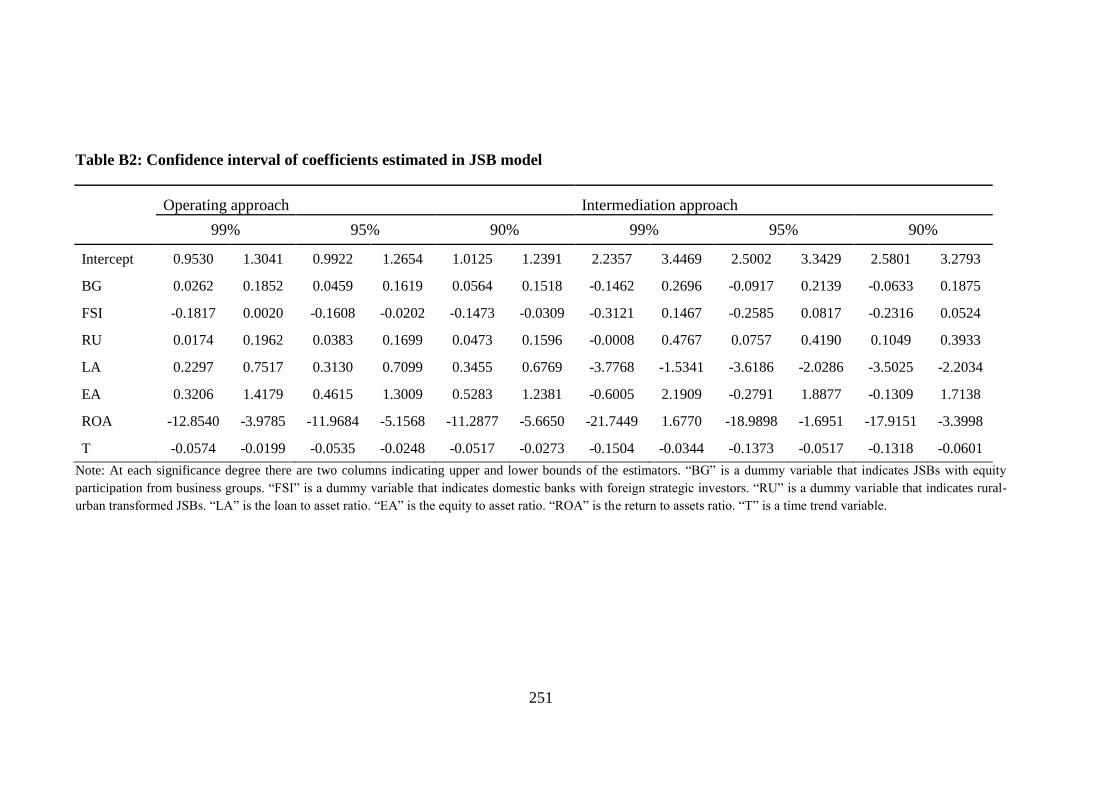
251
Table B2: Confidence interval of coefficients estimated in JSB model
Operating approach Intermediation approach
99% 95% 90% 99% 95% 90%
Intercept 0.9530 1.3041 0.9922 1.2654 1.0125 1.2391 2.2357 3.4469 2.5002 3.3429 2.5801 3.2793
BG 0.0262 0.1852 0.0459 0.1619 0.0564 0.1518 -0.1462 0.2696 -0.0917 0.2139 -0.0633 0.1875
FSI -0.1817 0.0020 -0.1608 -0.0202 -0.1473 -0.0309 -0.3121 0.1467 -0.2585 0.0817 -0.2316 0.0524
RU 0.0174 0.1962 0.0383 0.1699 0.0473 0.1596 -0.0008 0.4767 0.0757 0.4190 0.1049 0.3933
LA 0.2297 0.7517 0.3130 0.7099 0.3455 0.6769 -3.7768 -1.5341 -3.6186 -2.0286 -3.5025 -2.2034
EA 0.3206 1.4179 0.4615 1.3009 0.5283 1.2381 -0.6005 2.1909 -0.2791 1.8877 -0.1309 1.7138
ROA -12.8540 -3.9785 -11.9684 -5.1568 -11.2877 -5.6650 -21.7449 1.6770 -18.9898 -1.6951 -17.9151 -3.3998
T -0.0574 -0.0199 -0.0535 -0.0248 -0.0517 -0.0273 -0.1504 -0.0344 -0.1373 -0.0517 -0.1318 -0.0601
Note: At each significance degree there are two columns indicating upper and lower bounds of the estimators. ―BG‖ is a dummy variable that indicates JSBs with equity
participation from business groups. ―FSI‖ is a dummy variable that indicates domestic banks with foreign strategic investors. ―RU‖ is a dummy variable that indicates rural-
urban transformed JSBs. ―LA‖ is the loan to asset ratio. ―EA‖ is the equity to asset ratio. ―ROA‖ is the return to assets ratio. ―T‖ is a time trend variable.
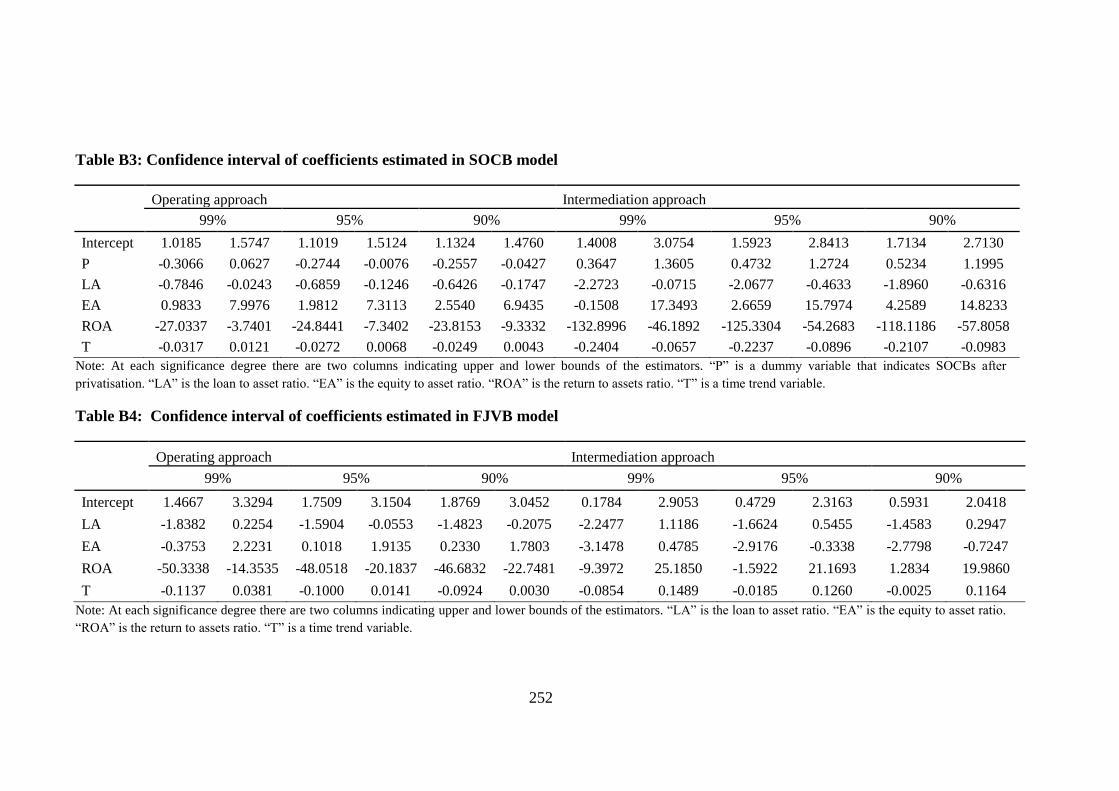
252
Table B3: Confidence interval of coefficients estimated in SOCB model
Operating approach Intermediation approach
99% 95% 90% 99% 95% 90%
Intercept 1.0185 1.5747 1.1019 1.5124 1.1324 1.4760 1.4008 3.0754 1.5923 2.8413 1.7134 2.7130
P -0.3066 0.0627 -0.2744 -0.0076 -0.2557 -0.0427 0.3647 1.3605 0.4732 1.2724 0.5234 1.1995
LA -0.7846 -0.0243 -0.6859 -0.1246 -0.6426 -0.1747 -2.2723 -0.0715 -2.0677 -0.4633 -1.8960 -0.6316
EA 0.9833 7.9976 1.9812 7.3113 2.5540 6.9435 -0.1508 17.3493 2.6659 15.7974 4.2589 14.8233
ROA -27.0337 -3.7401 -24.8441 -7.3402 -23.8153 -9.3332 -132.8996 -46.1892 -125.3304 -54.2683 -118.1186 -57.8058
T -0.0317 0.0121 -0.0272 0.0068 -0.0249 0.0043 -0.2404 -0.0657 -0.2237 -0.0896 -0.2107 -0.0983
Note: At each significance degree there are two columns indicating upper and lower bounds of the estimators. ―P‖ is a dummy variable that indicates SOCBs after
privatisation. ―LA‖ is the loan to asset ratio. ―EA‖ is the equity to asset ratio. ―ROA‖ is the return to assets ratio. ―T‖ is a time trend variable.
Table B4: Confidence interval of coefficients estimated in FJVB model
Operating approach Intermediation approach
99% 95% 90% 99% 95% 90%
Intercept 1.4667 3.3294 1.7509 3.1504 1.8769 3.0452 0.1784 2.9053 0.4729 2.3163 0.5931 2.0418
LA -1.8382 0.2254 -1.5904 -0.0553 -1.4823 -0.2075 -2.2477 1.1186 -1.6624 0.5455 -1.4583 0.2947
EA -0.3753 2.2231 0.1018 1.9135 0.2330 1.7803 -3.1478 0.4785 -2.9176 -0.3338 -2.7798 -0.7247
ROA -50.3338 -14.3535 -48.0518 -20.1837 -46.6832 -22.7481 -9.3972 25.1850 -1.5922 21.1693 1.2834 19.9860
T -0.1137 0.0381 -0.1000 0.0141 -0.0924 0.0030 -0.0854 0.1489 -0.0185 0.1260 -0.0025 0.1164
Note: At each significance degree there are two columns indicating upper and lower bounds of the estimators. ―LA‖ is the loan to asset ratio. ―EA‖ is the equity to asset ratio.
―ROA‖ is the return to assets ratio. ―T‖ is a time trend variable.
253
BIBLIOGRAPHY
Abarbanell, JS & Bonin, JP 1997, 'Bank Privatization in Poland: The Case of Bank
la Ski', Journal of Comparative Economics, vol. 25, no. 1, pp. 31-61.
Altunbas, Y, Evans, L & Molyneux, P 2001, 'Bank Ownership and Efficiency', Journal
of Money, Credit and Banking, pp. 926-954.
Altunbas, Y, Liu, M-H, Molyneux, P & Seth, R 2000, 'Efficiency and Risk in Japanese
Banking', Journal of Banking & Finance, vol. 24, no. 10, pp. 1605-1628.
Anh, VTT, Dapice, D, Nghia, PD, Perkins, D, Thanh, NX & Wilkinson, B 2013,
'Unplugging Institutional Bottlenecks to Restore Growth‘, A Policy Discussion
Paper Prepared for the 2013 Vietnam Executive Leadership Program
(VELP)',Harvard Kennedy School, Harvard University.
Arjomandi, A, Harvie, C & Valadkhani, A 2012, 'An Empirical Analysis of Iran's
Banking Performance', Studies in Economics and Finance, vol. 29, no. 4, pp.
287-300.
Arjomandi, A, Valadkhani, A & Harvie, C 2011, 'Analysing Productivity Changes
Using the Bootstrapped Malmquist Approach: The Case of the Iranian Banking
Industry', Australasian Accounting Business & Finance Journal, vol. 5, no. 3, pp
35−56.
Ataullah*, A, Cockerill, T & Le, H 2004, 'Financial Liberalization and Bank Efficiency:
A Comparative Analysis of India and Pakistan', Applied Economics, vol. 36, no.
17, pp. 1915-1924.
Ataullah, A & Le, H 2006, 'Economic Reforms and Bank Efficiency in Developing
Countries: The Case of the Indian Banking Industry', Applied Financial
Economics, vol. 16, no. 9, pp. 653-663.
Azofra, V & Santamaría, M 2011, 'Ownership, Control, and Pyramids in Spanish
Commercial Banks', Journal of Banking & Finance, vol. 35, no. 6, pp. 1464-
1476.
Balassa, B 2013, The Theory of Economic Integration (Routledge Revivals), Routledge,
New York.
Banker, RD, Chang, H & Lee, S-Y 2010, 'Differential Impact of Korean Banking
System Reforms on Bank Productivity', Journal of Banking & Finance, vol. 34,
no. 7, pp. 1450-1460.
Banker, RD, Charnes, A & Cooper, WW 1984, 'Some Models for Estimating Technical
and Scale Inefficiencies in Data Envelopment Analysis', Management science,
vol. 30, no. 9, pp. 1078-1092.
254
Barisitz, S 2009, 'Banking Transformation 1980-2006 in Central and Eastern Europe–
from Communism to Capitalism', South-Eastern Europe Journal of Economics,
vol. 2, pp. 161-180.
Barry, TA, Lepetit, L & Tarazi, A 2011, 'Ownership Structure and Risk in Publicly Held
and Privately Owned Banks', Journal of Banking & Finance, vol. 35, no. 5, pp.
1327-1340.
Barth, JR, Caprio, G & Levine, R 2004, 'Bank Regulation and Supervision: What
Works Best?', Journal of Financial intermediation, vol. 13, no. 2, pp. 205-248.
Battese, GE & Rao, DP 2002, 'Technology Gap, Efficiency, and a Stochastic
Metafrontier Function', International Journal of Business and Economics, vol. 1,
no. 2, pp. 87-93.
Battese, GE, Rao, DP & O'Donnell, CJ 2004, 'A Metafrontier Production Function for
Estimation of Technical Efficiencies and Technology Gaps for Firms Operating
under Different Technologies', Journal of Productivity Analysis, vol. 21, no. 1,
pp. 91-103.
Beck, T, Demirgüç-Kunt, A & Levine, R 2000, 'A New Database on the Structure and
Development of the Financial Sector', The World Bank Economic Review, vol.
14, no. 3, pp. 597-605.
Beck, T, Levine, R & Loayza, N 2000, 'Finance and the Sources of Growth', Journal of
financial economics, vol. 58, no. 1, pp. 261-300.
Benston, GJ 1965, 'Branch Banking and Economies of Scale', The Journal of Finance,
vol. 20, no. 2, pp. 312-331.
Beresford, M & Phong, D 2000, Economic Transition in Vietnam: Trade and Aid in the
Demise of a Centrally Planned Economy, Edward Elgar, Cheltenham.
Beresford, M 2008, 'Doi Moi in Review: The Challenges of Building Market Socialism
in Vietnam', Journal of Contemporary Asia, vol. 38, no. 2, pp. 221-243.
Bergendahl, G 1998, 'DEA and Benchmarks - an Application to Nordic Banks', Annals
of Operations Research, vol. 82, pp. 233-249.
Berger, AN & DeYoung, R 1997, 'Problem Loans and Cost Efficiency in Commercial
Banks', Journal of Banking & Finance, vol. 21, no. 6, pp. 849-870.
Berger, AN & Humphrey, DB 1997, 'Efficiency of Financial Institutions: International
Survey and Directions for Future Research', European Journal of Operational
Research, vol. 98, no. 2, pp. 175-212.
255
Berger, AN 2003, 'The Economic Effects of Technological Progress: Evidence from the
Banking Industry', Journal of Money, Credit, and Banking, vol. 35, no. 2, pp.
141-176.
Berger, AN, Hanweck, GA & Humphrey, DB 1987, 'Competitive Viability in Banking:
Scale, Scope, and Product Mix Economies', Journal of Monetary Economics,
vol. 20, no. 3, pp. 501-520.
Berger, AN, Hasan, I & Klapper, LF 2004, 'Further Evidence on the Link between
Finance and Growth: An International Analysis of Community Banking and
Economic Performance', Journal of Financial Services Research, vol. 25, no. 2-
3, pp. 169-202.
Berger, AN, Hasan, I & Zhou, M 2009, 'Bank Ownership and Efficiency in China: What
Will Happen in the World‘s Largest Nation?', Journal of Banking & Finance,
vol. 33, no. 1, pp. 113-130.
Bertay, AC, Demirgüç-Kunt, A & Huizinga, H 2014, 'Bank Ownership and Credit over
the Business Cycle: Is Lending by State Banks Less Procyclical?', Journal of
Banking & Finance.
Bonin, J & Wachtel, P 2003, 'Financial Sector Development in Transition Economies:
Lessons from the First Decade', Financial Markets, Institutions & Instruments,
vol. 12, no. 1, pp. 1-66.
Bonin, JP & Schnabel, I 2011, 'The Great Transformation: From Government‐Owned to
Foreign‐Controlled Banking Sectors', Economics of transition, vol. 19, no. 3, pp.
397-405.
Bonin, JP, Hasan, I & Wachtel, P 2005a, 'Bank Performance, Efficiency and Ownership
in Transition Countries', Journal of Banking & Finance, vol. 29, no. 1, pp. 31-
53.
Bonin, JP, Hasan, I & Wachtel, P 2005b, 'Privatization Matters: Bank Efficiency in
Transition Countries', Journal of Banking & Finance, vol. 29, no. 8, pp. 2155-
2178.
Boubakri, N, Cosset, J-C, Fischer, K & Guedhami, O 2005, 'Privatization and Bank
Performance in Developing Countries', Journal of Banking & Finance, vol. 29,
no. 8, pp. 2015-2041.
Casu, B & Molyneux, P 2003, 'A Comparative Study of Efficiency in European
Banking', Applied Economics, vol. 35, no. 17, pp. 1865-1876.
Caves, DW, Christensen, LR & Diewert, WE 1982a, 'The Economic Theory of Index
Numbers and the Measurement of Input, Output, and Productivity',
Econometrica: Journal of the Econometric Society, pp. 1393-1414.
256
Caves, DW, Christensen, LR & Diewert, WE 1982b, 'Multilateral Comparisons of
Output, Input, and Productivity Using Superlative Index Numbers', The
economic journal, pp. 73-86.
Charnes, A, Cooper, WW & Rhodes, E 1978, 'Measuring the Efficiency of Decision
Making Units', European journal of operational research, vol. 2, no. 6, pp. 429-
444.
Charnes, A, Cooper, WW & Rhodes, E 1981, 'Evaluating Program and Managerial
Efficiency: An Application of Data Envelopment Analysis to Program Follow
Through', Management science, vol. 27, no. 6, pp. 668-697.
Chen, X, Skully, M & Brown, K 2005, 'Banking Efficiency in China: Application of
Dea to Pre-and Post-Deregulation Eras: 1993–2000', China Economic Review,
vol. 16, no. 3, pp. 229-245.
Chinn, MD & Ito, H 2008, 'A New Measure of Financial Openness', Journal of
Comparative Policy Analysis, vol. 10, no. 3, pp. 309-322.
Chortareas, GE, Girardone, C & Ventouri, A 2013, 'Financial Freedom and Bank
Efficiency: Evidence from the European Union', Journal of Banking & Finance,
vol. 37, no. 4, pp. 1223-1231.
Claessens, S & Laeven, L 2003, 'Financial Development, Property Rights, and Growth',
The Journal of Finance, vol. 58, no. 6, pp. 2401-2436.
Claessens, S, Demirgüç-Kunt, A & Huizinga, H 2001, 'How Does Foreign Entry Affect
Domestic Banking Markets?', Journal of Banking & Finance, vol. 25, no. 5, pp.
891-911.
Coelli, TJ, Rao, DSP, O'Donnell, CJ & Battese, GE 2005, An Introduction to Efficiency
and Productivity Analysis, 2nd
ed., Springer, Berlin.
Coleman, WD & Underhill, GD 2012, Regionalism and Global Economic Integration:
Europe, Asia and the Americas, Routledge, New York.
Dang-Thanh, N 2010, 'Evaluating the Efficiency of Vietnamese Banking System: An
Application Using Data Envelopment Analysis', Available at SSRN 1626009.
Das, A & Ghosh, S 2006, 'Financial Deregulation and Efficiency: An Empirical
Analysis of Indian Banks During the Post Reform Period', Review of Financial
Economics, vol. 15, no. 3, pp. 193-221.
De Haas, R & Van Lelyveld, I 2006, 'Foreign Banks and Credit Stability in Central and
Eastern Europe. A Panel Data Analysis', Journal of Banking & Finance, vol. 30,
no. 7, pp. 1927-1952.
257
Delis, MD, Molyneux, P & Pasiouras, F 2011, 'Regulations and Productivity Growth in
Banking: Evidence from Transition Economies', Journal of Money, Credit and
Banking, vol. 43, no. 4, pp. 735-764.
Demirguc-Kunt, AD, E 1998, 'The Determinants of Banking Crises in Developing and
Developed Countries', IMF Staff Papers, vol. 45, no. 1, pp. 81-109.
Denizer, CA, Dinc, M & Tarimcilar, M 2007, 'Financial Liberalization and Banking
Efficiency: Evidence from Turkey', Journal of Productivity Analysis, vol. 27, no.
3, pp. 177-195.
Deprins, D & Simar, L 'H. Tulkens (1984), Measuring Labor Inefficiency in Post
Offices', The Performance of Public Enterprises: Concepts and measurements.
M. Marchand, P. Pestieau and H. Tulkens (eds.), Amsterdam, North-Holland,
pp. 243-267.
Drake, L, Hall, MJ & Simper, R 2006, 'The Impact of Macroeconomic and Regulatory
Factors on Bank Efficiency: A Non-Parametric Analysis of Hong Kong‘s
Banking System', Journal of Banking & Finance, vol. 30, no. 5, pp. 1443-1466.
Efron, B 1979, 'Bootstrap Methods: Another Look at the Jackknife', The annals of
Statistics, pp. 1-26.
Fang, Y, Hasan, I & Marton, K 2011, 'Bank Efficiency in South‐Eastern Europe',
Economics of transition, vol. 19, no. 3, pp. 495-520.
Färe, R & Zelenyuk, V 2003, 'On Aggregate Farrell Efficiencies', European journal of
operational research, vol. 146, no. 3, pp. 615-620.
Färe, R, Grosskopf, S, Norris, M & Zhang, Z 1994, 'Productivity Growth, Technical
Progress, and Efficiency Change in Industrialized Countries', The American
Economic Review, pp. 66-83.
Farrell, MJ 1957, 'The Measurement of Productive Efficiency', Journal of the Royal
Statistical Society. Series A (General), vol. 120, no. 3, pp. 253-290.
Fethi, MD & Pasiouras, F 2010, 'Assessing Bank Efficiency and Performance with
Operational Research and Artificial Intelligence Techniques: A Survey',
European journal of operational research, vol. 204, no. 2, pp. 189-198.
Fforde, A & De Vylder, S 1996, From Plan to Market: The Economic Transition in
Vietnam, Westview Press, Boulder, Colo.
Fiordelisi, F, Marques-Ibanez, D & Molyneux, P 2011, 'Efficiency and Risk in
European Banking', Journal of Banking & Finance, vol. 35, no. 5, pp. 1315-
1326.
258
Fried, HO, Schmidt, SS & Yaisawarng, S 1999, 'Incorporating the Operating
Environment into a Nonparametric Measure of Technical Efficiency', Journal of
Productivity Analysis, vol. 12, no. 3, pp. 249-267.
Fries, S & Taci, A 2005, 'Cost Efficiency of Banks in Transition: Evidence from 289
Banks in 15 Post-Communist Countries', Journal of Banking & Finance, vol. 29,
no. 1, pp. 55-81.
Fries, S, Neven, D, Seabright, P & Taci, A 2006, 'Market Entry, Privatization and Bank
Performance in Transition1', Economics of transition, vol. 14, no. 4, pp. 579-
610.
Gates, CL 2000, 'Vietnam's Economic Transformation and Convergence with the
Dynamic Asean Economies', Comparative Economic Studies, vol. 42, no. 4, pp.
7-43.
Glass, JC, McKillop, DG, Quinn, B & Wilson, J 2014, 'Cooperative Bank Efficiency in
Japan: A Parametric Distance Function Analysis', The European Journal of
Finance, vol. 20, no. 3, pp. 291-317.
Gorton, G & Winton, A 1998, 'Banking in Transition Economies: Does Efficiency
Require Instability?', Journal of Money, Credit and Banking, vol. 30, no. 3, pp.
621-650.
Grifell-Tatje, E & Lovell, CK 1996, 'Deregulation and Productivity Decline: The Case
of Spanish Savings Banks', European Economic Review, vol. 40, no. 6, pp.
1281-1303.
Grigorian, DA & Manole, V 2006, 'Determinants of Commercial Bank Performance in
Transition: An Application of Data Envelopment Analysis', Comparative
Economic Studies, vol. 48, no. 3, pp. 497-522.
Gropp, R & Heider, F 2010, 'The Determinants of Bank Capital Structure', Review of
Finance, vol. 14, no.4, pp. 587-622.
Hahnel, R 2015, 'The Abcs of Political Economy', University of Chicago Press
Economics Books.
Hall, M 2003, The International Handbook on Financial Reform, Edward Elgar
Publishing.
Hall, P 1986, 'On the Number of Bootstrap Simulations Required to Construct a
Confidence Interval', The annals of Statistics, vol. 14, no. 4, pp. 1453-1462.
Hao, J, Hunter, WC & Yang, WK 2001, 'Deregulation and Efficiency: The Case of
Private Korean Banks', Journal of Economics and Business, vol. 53, no. 2, pp.
237-254.
259
Harvie, C & Tran, VH 1997, Vietnam's Reforms and Economic Growth, MacMillan
Press Ltd, Houndmills, Basingstoke, Hampshire.
Harvie, C 2004, 'The Contribution of SMEs in the Economic Transition of Vietnam',
Journal for International Business and Entrepreneurship Development, vol. 2,
no. 2, pp. 1-16.
Hasan, I & Marton, K 2003, 'Development and Efficiency of the Banking Sector in a
Transitional Economy: Hungarian Experience', Journal of Banking and Finance,
vol. 27, no. 12, pp. 2249-2271.
Havrylchyk, O 2006, 'Efficiency of the Polish Banking Industry: Foreign Versus
Domestic Banks', Journal of Banking & Finance, vol. 30, no. 7, pp. 1975-1996.
Hayami, Y & Ruttan, VW 1970, 'Agricultural Productivity Differences among
Countries', The American Economic Review, pp. 895-911.
Hermes, N & Nhung, VTH 2010, 'The Impact of Financial Liberalization on Bank
Efficiency: Evidence from Latin America and Asia', Applied Economics, vol. 42,
no. 26, pp. 3351-3365.
Hirschberg, J & Lloyd, PJ 2002, 'Does the Technology of Foreign-Invested Enterprises
Spill over to Other Enterprises in China? An Application of Post-DEA Bootstrap
Regression Analysis', Modelling the Chinese Economy. Edward Elgar Press,
London.
Houston, JF, James, CM & Ryngaert, MD 2001, 'Where Do Merger Gains Come From?
Bank Mergers from the Perspective of Insiders and Outsiders', Journal of
financial economics, vol. 60, no. 2, pp. 285-331.
Hughes, JP & Mester, LJ 2008, 'Efficiency in Banking: Theory, Practice, and Evidence',
in The Oxford handbook of banking,eds Berger, AN, Molyneux, P & Wilson,
JOS, Oxford University Press, Oxford.
IMF 1998, 'Vietnam: Selected Issues and Statistical Annex', IMF staff country report
No.98/30. International Monetary Fund, Washington, D.C.
IMF 2000, 'Vietnam: Statistical Appendix and Background Notes', IMF staff country
report No.00/116. International Monetary Fund, Washington, D.C.
IMF, 2012, 'Vietnam 2012 Article IV Consultation', IMF country report No.12/165.
International Monetary Fund, Washington, D.C.
IMF, 2014, 'Vietnam 2014 Article IV Consultation', IMF country report No.14/311.
International Monetary Fund, Washington, D.C.
Irvin, G 1995, 'Vietnam: Assessing the Achievements of Doi Moi', The Journal of
Development Studies, vol. 31, no. 5, pp. 725-750.
260
Jeitschko, TD & Jeung, SD 2005, 'Incentives for Risk-Taking in Banking–a Unified
Approach', Journal of Banking & Finance, vol. 29, no. 3, pp. 759-777.
Jiang, C, Yao, S & Zhang, Z 2009, 'The Effects of Governance Changes on Bank
Efficiency in China: A Stochastic Distance Function Approach', China
Economic Review, vol. 20, no. 4, pp. 717-731.
Karas, A, Schoors, K & Weill, L 2010, 'Are Private Banks More Efficient Than Public
Banks?', Economics of transition, vol. 18, no. 1, pp. 209-244.
Kawai, MN, R; Schmukler 2001, 'Crisis and Contagion in East Asia', World Bank.
Keeton, WR 1999, 'Does Faster Loan Growth Lead to Higher Loan Losses?',Economic
Review-Federal Reserve Bank of Kansas City, vol. 84, pp. 57-76.
Kenjegalieva, K, Simper, R, Weyman-Jones, T & Zelenyuk, V 2009, 'Comparative
Analysis of Banking Production Frameworks in Eastern European Financial
Markets', European journal of operational research, vol. 198, no. 1, pp. 326-
340.
Kneip, A, Park, BU & Simar, L 1998, 'A Note on the Convergence of Nonparametric
Dea Estimators for Production Efficiency Scores', Econometric theory, vol. 14,
no. 06, pp. 783-793.
Kneip, A, Simar, L & Wilson, PW 2003, 'Asymptotics for Dea Estimators in
Nonparametric Frontier Models', Discussion paper.
Kneip, A, Simar, L & Wilson, PW 2008, 'Asymptotics and Consistent Bootstraps for
Dea Estimators in Nonparametric Frontier Models', Econometric theory, vol. 24,
no. 06, pp. 1663-1697.
Koivu, T 2002, 'Do Efficient Banking Sectors Accelerate Economic Growth in
Transition Countries', Discussion paper no, 14/2002, Bank of Findland.
Kokko, A & Sjoholm, F 2000, 'Some Alternative Scenarios for the Role of the State in
Vietnam', The Pacific Review, vol. 13, no. 2, pp. 257-277.
Kokko, A 1998, 'Vietnam: Ready for Doi Moi Ii?', ASEAN Economic Bulletin, vol. 15,
no. 3, pp. 319-327.
Körner, T & Schnabel, I 2011, 'Public Ownership of Banks and Economic Growth',
Economics of transition, vol. 19, no. 3, pp. 407-441.
Kovsted, J, Rand, J & Tarp, F 2005, From Monobank to Commercial Banking:
Financial Sector Reforms in Vietnam, Nordic Inst of Asian Studies.
261
Kraft, E, Hofler, R & Payne, J 2006, 'Privatization, Foreign Bank Entry and Bank
Efficiency in Croatia: A Fourier-Flexible Function Stochastic Cost Frontier
Analysis', Applied Economics, vol. 38, no. 17, pp. 2075-2088.
Kumbhakar, SC & Wang, D 2007, 'Economic Reforms, Efficiency and Productivity in
Chinese Banking', Journal of Regulatory Economics, vol. 32, no. 2, pp. 105-129.
Kyj, L & Isik, I 2008, 'Bank< I> X</I>-Efficiency in Ukraine: An Analysis of Service
Characteristics and Ownership', Journal of Economics and Business, vol. 60, no.
4, pp. 369-393.
La Porta, R, Lopez‐de‐Silanes, F & Shleifer, A 2002, 'Government Ownership of
Banks', The Journal of Finance, vol. 57, no. 1, pp. 265-301.
Laeven, L 1999, 'Risk and Efficiency in East Asian Banks', World Bank Policy
Research Working Paper, no. 2255.
Laeven, L 2003, 'Does Financial Liberalization Reduce Financing Constraints?',
Financial Management, vol. 32, no. 1, pp. 5-34.
Leightner, JE & Lovell, C 1998, 'The Impact of Financial Liberalization on the
Performance of Thai Banks', Journal of Economics and Business, vol. 50, no. 2,
pp. 115-131.
Lensink, R, Meesters, A & Naaborg, I 2008, 'Bank Efficiency and Foreign Ownership:
Do Good Institutions Matter?', Journal of Banking & Finance, vol. 32, no. 5, pp.
834-844.
Leung, S 2009, 'Banking and Financial Sector Reforms in Vietnam', ASEAN Economic
Bulletin, vol. 26, no. 1, pp. 44-57.
Leung, S 2015, 'The Vietnamese Economy: Seven Years after the Global Financial
Crisis', Journal of Southeast Asian Economies (JSEAE), vol. 32, no. 1, pp. 1-10.
Leung, SE 2010, 'Vietnam: An Economic Survey', Asian‐Pacific Economic Literature,
vol. 24, no. 2, pp. 83-103.
Levine, R 1997, 'Financial Development and Economic Growth: Views and Agenda',
Journal of economic literature, pp. 688-726.
Levine, R 1998, 'The Legal Environment, Banks, and Long-Run Economic Growth',
Journal of Money, Credit & Banking (Ohio State University Press), vol. 30, no.
3.
Levine, R 2001, 'International Financial Liberalization and Economic Growth', Review
of International economics, vol. 9, no. 4, pp. 688-702.
262
Li, Q 1996, 'Nonparametric Testing of Closeness between Two Unknown Distribution
Functions', Econometric Reviews, vol. 15, no. 3, pp. 261-274.
Li, Q 1999, 'Nonparametric Testing the Similarity of Two Unknown Density Functions:
Local Power and Bootstrap Analysis', Journal of Nonparametric Statistics, vol.
11, no. 1-3, pp. 189-213.
Lin, F-T, Wu, H-Y & Tran, TNN 2015, 'Internet Banking Adoption in a Developing
Country: An Empirical Study in Vietnam', Information Systems and e-Business
Management, vol. 13, no. 2, pp. 267-287.
Lindgren, C.-J., Balino, T.J.T., Enoch, C., Gulde, A.-M., Quintyn, M., Teo, L., 2000.
Financial sector crisis and restructuring: Lessons from Asia. IMF Occasional
Paper, 188, Washington, DC.
Lozano-Vivas, A, Pastor, JT & Pastor, JM 2002, 'An Efficiency Comparison of
European Banking Systems Operating under Different Environmental
Conditions', Journal of Productivity Analysis, vol. 18, no. 1, pp. 59-77.
Lucchetti, R, Papi, L & Zazzaro, A 2001, 'Banks‘ Inefficiency and Economic Growth:
A Micro‐Macro Approach', Scottish Journal of Political Economy, vol. 48, no.
4, pp. 400-424.
Machan, TR 2002, Liberty and Research and Development: Science Funding in a Free
Society, Hoover Press.
Maudos, J & de Guevara, JF 2007, 'The Cost of Market Power in Banking: Social
Welfare Loss Vs. Cost Inefficiency', Journal of Banking & Finance, vol. 31, no.
7, pp. 2103-2125.
Maudos, Jn, Pastor, JM, Perez, F & Quesada, J 2002, 'Cost and Profit Efficiency in
European Banks', Journal of International Financial Markets, Institutions and
Money, vol. 12, no. 1, pp. 33-58.
Minh, NK, Long, GT & Hung, NV 2013, 'Efficiency and Super-Efficiency of
Commercial Banks in Vietnam: Performances and Determinants', Asia-Pacific
Journal of Operational Research, vol. 30, no. 01.
Mitchell, J 2001, 'Bad Debts and the Cleaning of Banks' Balance Sheets: An
Application to Transition Economies', Journal of Financial Intermediation, vol.
10, no. 1, pp. 1-27.
Moreno, R, Pasadilla, G & Remolona, E 1999, 'Asia‘s Financial Crisis: Lessons and
Implications for Vietnam‘', Vietnam and the East Asian Crisis, Edward Elgar,
Aldershot.
Murray, A 1999, 'Regulation and Reform for Vietnamese Banks', Standard & Poor’s
Credit Week, vol. 10, pp. 17-21.
263
Nahm, D & Vu, H 2013, 'Profit Efficiency and Productivity of Vietnamese Banks: A
New Index Approach', Journal of Applied Finance and Banking, vol. 3, no. 1,
pp. 45-65.
Nguyen, KM, Giang, TL & Nguyen, VH 2012, 'Efficiency and Super-Efficiency of
Commercial Banks in Vietnam: Performances and Determinants', Asia-Pacific
Journal of Operational Research.
Nguyen, PA & Simioni, M 2015, 'Productivity and Efficiency of Vietnamese Banking
System: New Evidence Using Färe-Primont Index Analysis', Applied
Economics, no. ahead-of-print, pp. 1-13.
Nguyen, TPT, Roca, E & Sharma, P 2014, 'How Efficient Is the Banking System of
Asia‘s Next Economic Dragon? Evidence from Rolling Dea Windows', Applied
Economics, no. ahead-of-print, pp. 1-20.
Nguyen, VH 2007, 'Measuring Efficiency of Vietnamese Commercial Banks: An
Application of Data Envelopment Analysis (DEA)', in Technical Efficiency and
Productivity Growth in Vietnam,Publishing Houser of Social Labour Press,
Hanoi, pp.60-70.
O‘Donnell, C.J. 2010. Measuring and decomposing agricultural productivity and
profitability change, Australian Journal of Agricultural and Resource
Economics, vol 54, no , pp.527–60.
O‘Donnell, C.J. 2011. DPIN version 3.0: A program for decomposing productivity
index numbers. Working paper WP01/2010. Queensland: Centre for Efficiency
and Productivity Analysis.
O‘Donnell, CJ 2012a, 'An Aggregate Quantity Framework for Measuring and
Decomposing Productivity Change', Journal of Productivity Analysis, vol. 38,
no. 3, pp. 255-272.
O‘Donnell, CJ, Rao, DP & Battese, GE 2008, 'Metafrontier Frameworks for the Study
of Firm-Level Efficiencies and Technology Ratios', Empirical Economics, vol.
34, no. 2, pp. 231-255.
O'Connor, D 2000, 'Financial Sector Reform in China and Viet Nam: A Comparative
Perspective', Comparative Economic Studies, vol. 42, no. 4, pp. 45-66.
O'Donnell, CJ 2012b, 'Nonparametric Estimates of the Components of Productivity and
Profitability Change in Us Agriculture', American Journal of Agricultural
Economics, vol. 94, no. 3, pp. 873-890.
Oh, SN 1999, 'Financial deepening in the banking sector–Vietnam. Rising to the
Challenge in Asia: A Study of Financial Markets–The Socialist Republic of Viet
Nam', Asian Development Bank Working Paper, Manila.
264
Oh, D-h & Lee, J-d 2010, 'A Metafrontier Approach for Measuring Malmquist
Productivity Index', Empirical Economics, vol. 38, no. 1, pp. 47-64.
Park, KH & Weber, WL 2006, 'A Note on Efficiency and Productivity Growth in the
Korean Banking Industry, 1992–2002', Journal of Banking & Finance, vol. 30,
no. 8, pp. 2371-2386.
Perkins, D, Anh, VTT, Nghia, PD, Thanh, NX & Wilkinson, B 2012, ' Structural
Reform for Growth, Equity, and National Sovereignty', A Policy Discussion
Paper Prepared for the 2012 Vietnam Executive Leadership Program (VELP)',
Harvard Kennedy School, Harvard University.
Phan, TN, Harvie, C & Tran, VH 2006, Vietnam's Economic Transition: Policies, Issues
and Prospects, ICFAI University Press, Hyderabad, India.
Pincus, J 2009, 'Vietnam: Sustaining Growth in Difficult Times', ASEAN Economic
Bulletin, vol. 26, no. 1, pp. 11-24.
Pincus, JV & Anh, VTT 2008, 'Surviving a Crisis, Returning to Reform', Policy
discussion paper no, 2, Asia programs, Harvard Kennedy School, Harvard
Univerisity.
Poghosyan, T & Poghosyan, A 2010, 'Foreign Bank Entry, Bank Efficiency and Market
Power in Central and Eastern European Countries1', Economics of transition,
vol. 18, no. 3, pp. 571-598.
Quang, NX & De Borger, B 2003, 'Bootstrapping Efficiency and Malmquist
Productivity Indices: An Application to Vietnamese Commercial Banks', Social
policy, vol. 2004, pp. 2005-2006.
Radelet, S & Sachs, JD 2000, 'The Onset of the East Asian Financial Crisis', in
Currency Crises, University of Chicago Press, pp.105-162.
Ray, SC & Desli, E 1997, 'Productivity Growth, Technical Progress, and Efficiency
Change in Industrialized Countries: Comment', The American Economic Review,
vol. 87, no. 5, pp. 1033-1039.
Reinhart, CM & Rogoff, KS 2008, 'This Time Is Different: A Panoramic View of Eight
Centuries of Financial Crises', National Bureau of Economic Research.
Richard, PJ, Devinney, TM, Yip, GS & Johnson, G 2009, 'Measuring Organizational
Performance: Towards Methodological Best Practice', Journal of management,
vol. 35, no. 3, pp. 718-804.
Rossi, SP, Schwaiger, MS & Winkler, G 2009, 'How Loan Portfolio Diversification
Affects Risk, Efficiency and Capitalization: A Managerial Behavior Model for
Austrian Banks', Journal of Banking & Finance, vol. 33, no. 12, pp. 2218-2226.
265
Ruggiero, J 1998, 'A New Approach for Technical Efficiency Estimation in Multiple
Output Production', European Journal of Operational Research, vol. 111, no. 2,
pp. 369-380.
Sarazervos, RL 1998, 'Stock Markets, Banks, and Economic Growth', The American
Economic Review, vol. 88, no. 3, pp. 537-558.
Sathye, M 2001, 'X-Efficiency in Australian Banking: An Empirical Investigation',
Journal of Banking & Finance, vol. 25, no. 3, pp. 613-630.
Sathye, M 2003, 'Efficiency of Banks in a Developing Economy: The Case of India',
European Journal of Operational Research, vol. 148, no. 3, pp. 662-671.
Semih Yildirim, H & Philippatos, GC 2007, 'Efficiency of Banks: Recent Evidence
from the Transition Economies of Europe, 1993–2000', European Journal of
Finance, vol. 13, no. 2, pp. 123-143.
Semih Yildirim, H & Philippatos, GC 2007, 'Efficiency of Banks: Recent Evidence
from the Transition Economies of Europe, 1993–2000', European Journal of
Finance, vol. 13, no. 2, pp. 123-143.
Shephard, RW, Gale, D & Kuhn, HW 1970, Theory of Cost and Production Functions,
Princeton University Press Princeton.
Shleifer, A & Vishny, RW 1997, 'A Survey of Corporate Governance', The Journal of
Finance, vol. 52, no. 2, pp. 737-783.
Simar, L & Wilson, PW 1998, 'Sensitivity Analysis of Efficiency Scores: How to
Bootstrap in Nonparametric Frontier Models', Management science, vol. 44, no.
1, pp. 49-61.
Simar, L & Wilson, PW 1999, 'Estimating and Bootstrapping Malmquist Indices',
European journal of operational research, vol. 115, no. 3, pp. 459-471.
Simar, L & Wilson, PW 2000, 'A General Methodology for Bootstrapping in Non-
Parametric Frontier Models', Journal of applied statistics, vol. 27, no. 6, pp.
779-802.
Simar, L & Wilson, PW 2007, 'Estimation and Inference in Two-Stage, Semi-
Parametric Models of Production Processes', Journal of econometrics, vol. 136,
no. 1, pp. 31-64.
Simar, L & Wilson, PW 2015, 'Statistical Approaches for Non‐Parametric Frontier
Models: A Guided Tour', International Statistical Review, vol. 83, no. 1, pp. 77-
110.
266
Simar, L & Zelenyuk, V 2003, 'Statistical Inference for Aggregates of Farrell-Type
Efficiencies', Discussion Papers 0324, Institut of Statistique, Universite
Catholique de Louvain.
Simar, L & Zelenyuk, V 2006, 'On Testing Equality of Distributions of Technical
Efficiency Scores', Econometric Reviews, vol. 25, no. 4, pp. 497-522.
Simar, L & Zelenyuk, V 2007, 'Statistical Inference for Aggregates of Farrell‐Type
Efficiencies', Journal of Applied Econometrics, vol. 22, no. 7, pp. 1367-1394.
Simar, L 1992, 'Estimating Efficiencies from Frontier Models with Panel Data: A
Comparison of Parametric, Non-Parametric and Semi-Parametric Methods with
Bootstrapping', Journal of Productivity Analysis, vol. 3, no. 1-2, pp. 171-203.
Strobel, F, Bouvatier, V & Lepetit, L 2014, 'Bank Income Smoothing, Ownership
Concentration and the Regulatory Environment', Journal of Banking & Finance,
vol. 41, no. 1, pp. 253-270.
Sturm, J-E & Williams, B 2004, 'Foreign Bank Entry, Deregulation and Bank
Efficiency: Lessons from the Australian Experience', Journal of Banking &
Finance, vol. 28, no. 7, pp. 1775-1799.
Sufian, F & Habibullah, MS 2011, 'Opening the Black Box on Bank Efficiency in
China: Does Economic Freedom Matter?', Global Economic Review, vol. 40, no.
3, pp. 269-298.
Sufian, F 2009, 'Determinants of Bank Efficiency During Unstable Macroeconomic
Environment: Empirical Evidence from Malaysia', Research in International
Business and Finance, vol. 23, no. 1, pp. 54-77.
Thanh, VT 2005, 'Vietnam´ S Trade Liberalization and International Economic
Integration: Evolution, Problems, and Challenges', ASEAN Economic Bulletin,
vol. 22, no. 1, pp. 75-91.
Thanh, VT 2015, 'Vietnam's Perspectives on Regional Economic Integration', Journal
of Southeast Asian Economies (JSEAE), vol. 32, no. 1, pp. 106-124.
Tochkov, K & Nenovsky, N 2011, 'Institutional Reforms, Eu Accession, and Bank
Efficiency in Transition Economies: Evidence from Bulgaria', Emerging
Markets Finance and Trade, vol. 47, no. 1, pp. 113-129.
Tornell, A 1999, 'Common Fundamentals in the Tequila and Asian Crises', National
Bureau of Economic Research.
Trivieri, F 2007, 'Does Cross-Ownership Affect Competition?: Evidence from the
Italian Banking Industry', Journal of International Financial Markets,
Institutions and Money, vol. 17, no. 1, pp. 79-101.
267
Vernikov, A 2012, 'The Impact of State-Controlled Banks on the Russian Banking
Sector', Eurasian geography and economics, vol. 53, no. 2, pp. 250-266.
Vietnam National Assembly Economic Commission (NAEC) 2012, 'From
Macroeconomic Turbulent to Restructuring ', (Giau, NV, Chairperson), Hanoi.
Vo Tri, T & Nguyen Anh, D 2009, 'Vietnam after Two Years of Wto Accession: What
Lessons Can Be Learnt?', ASEAN Economic Bulletin, vol. 26, no. 1, p. 115.
Vu, HT & Turnell, S 2010, 'Cost Efficiency of the Banking Sector in Vietnam: A
Bayesian Stochastic Frontier Approach with Regularity Constraints', Asian
Economic Journal, vol. 24, no. 2, pp. 115-139.
WB 1993, 'Vietnam Transition to the Market an Economic Report', Vietnam
Development Report 1993No.11902-VN, World Bank, Washington, D.C.
WB 1998, 'Vietnam Rising to the Challenge an Economic Report', Vietnam
Development Report 1998No.18632-VN, World Bank, Washington, D.C.
WB 2000, 'Taking Stock', Vietnam Development Report 2000No.26980, World Bank,
Washington, D.C.
WB 2006, 'Vietnam Business', Vietnam Development Report 2006No.34474-VN,
World Bank, Washington, D.C.
WB 2007, 'Vietnam Aiming High', Vietnam Development Report 2007No.38064-VN,
World Bank, Washington, D.C.
WB 2009, 'Capital Matters', Vietnam Development Report 2009No.47023, World Bank,
Washington, D.C.
WB 2012, 'Market Economy for a Middle-Income Vietnam', Vietnam Development
Report 2012No.65980, World Bank, Washington, D.C.
Webster, L 1999, SMEs in Vietnam: On the Road to Prosperity, Private sector
discussion paper no 10, Mekong Private Development Facility, Hanoi.
Weill, L 2003, 'Banking Efficiency in Transition Economies', Economics of transition,
vol. 11, no. 3, pp. 569-592.
Wheelock, DC & Wilson, PW 1999, 'Technical Progress, Inefficiency, and Productivity
Change in Us Banking, 1984-1993', Journal of Money, Credit, and Banking, vol.
31, no. 2, pp. 212-234.
Wheelock, DC & Wilson, PW 2000, 'Why Do Banks Disappear? The Determinants of
Us Bank Failures and Acquisitions', Review of Economics and Statistics, vol. 82,
no. 1, pp. 127-138.
268
Williams, J & Nguyen, N 2005, 'Financial Liberalisation, Crisis, and Restructuring: A
Comparative Study of Bank Performance and Bank Governance in South East
Asia', Journal of Banking & Finance, vol. 29, no. 8, pp. 2119-2154.
Worthington, AC 2001, 'Efficiency in Pre‐Merger and Post‐Merger Non‐Bank Financial
Institutions', Managerial and Decision Economics, vol. 22, no. 8, pp. 439-452.
Xue, M & Harker, PT 1999, 'Overcoming the Inherent Dependency of Dea Efficiency
Scores: A Bootstrap Approach', Unpublished Working Paper, Wharton
Financial Institutions Center, University of Pennsylvania.
Yao, S, Jiang, C, Feng, G & Willenbockel, D 2007, 'WTO Challenges and Efficiency of
Chinese Banks', Applied Economics, vol. 39, no. 5, pp. 629-643.
Zelenyuk, V 2006, 'Aggregation of Malmquist Productivity Indexes', European journal
of operational research, vol. 174, no. 2, pp. 1076-1086.
Zielinski, J. G. (1973). Economic Reforms in Polish Industry. New York: Oxford
University Press.
Zoli, E 2001, 'Cost and Effectiveness of Banking Sector Restructuring in Transition
Economies', IMF Working Paper, WP/01/157, IMF, Washington, D.C.


