Embed Size (px)
Citation preview
Technical Assistance Consultant’s Report
This consultant’s report does not necessarily reflect the views of ADB or the Government concerned, and ADB and the Government cannot be held liable for its contents. (For project preparatory technical assistance: All the views expressed herein may not be incorporated into the proposed project’s design.
Project Number: 49387-001
June 2018
Lao People’s Democratic Republic: Second GMS Tourism Infrastructure for Inclusive Growth Project (Financed by ADB PPTA)
The document is prepared by Norconsult AS(NORWAY) in association with NORCONSULT MANAGEMENT SERVICES, INC. (PHILIPPINES) For Ministry of Information, Culture and Tourism, Lao PDR


Appendix 20: Consultation and Participation Plan
TA9090-REG: Preparing the Second Greater Mekong Subregion Tourism
Infrastructure for Inclusive Growth Project
FINAL REPORT – PART C
June 2018
Lao People’s Democratic Republic:
Second Greater Mekong Subregion Tourism Infrastructure
for Inclusive Growth Project
Appendix 20
711
A. INTRODUCTION
1. ADB’s Safeguards Policy Statement (2009), and the governments of Cambodia, the Lao PDR, and Viet Nam (CLV), promote meaningful stakeholder consultations during the entire project cycle. Meaningful consultation is a process that (i) begins early in the project preparation stage and continues throughout the project cycle; (ii) provides timely disclosure of relevant and adequate information that is understandable and readily accessible to affected people; (iii) is undertaken in an atmosphere free of intimidation or coercion; (iv) is gender inclusive and responsive, and tailored to the needs of disadvantaged and vulnerable groups; and (v) enables all relevant views of affected people and other stakeholders to be incorporated into decision making related to project design, mitigation measures, the sharing of development benefits and opportunities, and implementation issues. ADB requires borrowers/clients to engage with communities, groups, or people affected by projects proposed, and with civil society through information disclosure, consultation, and informed participation in a manner commensurate with the risks to and impacts on affected communities.1 2. Consistent with ADB and CLV’s commitment to meaningful stakeholder engagement, the project’s consultation and participation plan aims to:
fully disclose all information related to the project, its goals and objectives, components and activities to all recipient communities, their constituents, and other project stakeholders;
obtain information from project beneficiaries and other stakeholders regarding their views and opinions, needs, priorities and preferences on how the project should be implemented;
encourage stakeholder participation in project activities that affect them, including civil works, capacity building and enterprise support programs, awareness raising activities, and monitoring;
obtain stakeholder consent and cooperation;
establish a clear, easily accessible and effective grievance redress mechanism; and
ensure transparency in all project activities.
B. CONSULTATION DURING PROJECT DESIGN
3. A stakeholder analysis was prepared by international and national social development specialists. The analysis identified key project actors, their interests in the project, the problems they face in realizing their interests, organizational resources, mandated responsibilities, and strategies to maximize stakeholder participation during implementation. Information was gathered through workshops, focus group discussions, key informant interviews, household surveys, and individual consultations. Intotal, 2 workshops, about 71 stakeholdermeetings/focus group discussion, 18 public consultation meetings, and two surveys (HH and IOL) were conducted in three project provinces ( Vientiane, Champasak and Luang Prabang), involving approximately 1,303 stakeholders ( of which 344 are females)
4. Focus group discussions and key informant interviews with district, commune and village officials clarified project expectations and local priorities for tourism and urban development,
1 ADB. 2009. Safeguard Policy Statement. pp. 20. Manila.
Appendix 20
712
explained the projects potential socioeconomic benefits, and confirmed that these are aligned with national and local development plans. Discussions with commune/village coordinators responsible for women’s and ethnic affairs identified strategies to ensure that the project will equitably benefit women, ethnic groups and other vulnerable groups, considering their specific needs and preferences. The key entities consulted are listed below.
1. Lao People’s Democratic Republic
Tourism Development Department, Ministry of Information, Culture and Tourism; Ministry of Labor and Social Welfare; Ministry of Public Works and Transport; Ministry of Environment and Natural Resources; and Ministry of Finance;
Lao Women’s Union, Lao Front for National Construction, and Lao Youth Union representatives;
provincial departments of information, culture and tourism and public works and transport in Champassak, Vientiane and Luang Prabang; Vang Vieng, Keo Oudom and Khong district tourism offices, and Vang Vieng Urban Development Administration Authority;
provincial, district and village Lao Women’s Union, Lao Front for National Construction and Lao Youth Union representatives;
civil society organizations and development partners (e.g. Deutsche Gesellschaft für Internationale Zusammenarbeit, Japan International Cooperation Agency, Lux-Development, and Swisscontact);
tourism industry associations, e.g. Lao Hotel Association and Lao Association of Travel Agents;
local transport and urban service providers, hotels, guesthouses, restaurants, retail shops, community tourism groups, and other tourism industry actors; and
men and women living within and adjacent to the project sites.
local transport and urban service providers, hotels, guesthouses, restaurants, retail shops, community tourism groups, and other tourism industry actors; and
men and women living within and adjacent to the project sites.
C. CONSULTATION DURING PROJECT IMPLEMENTATION
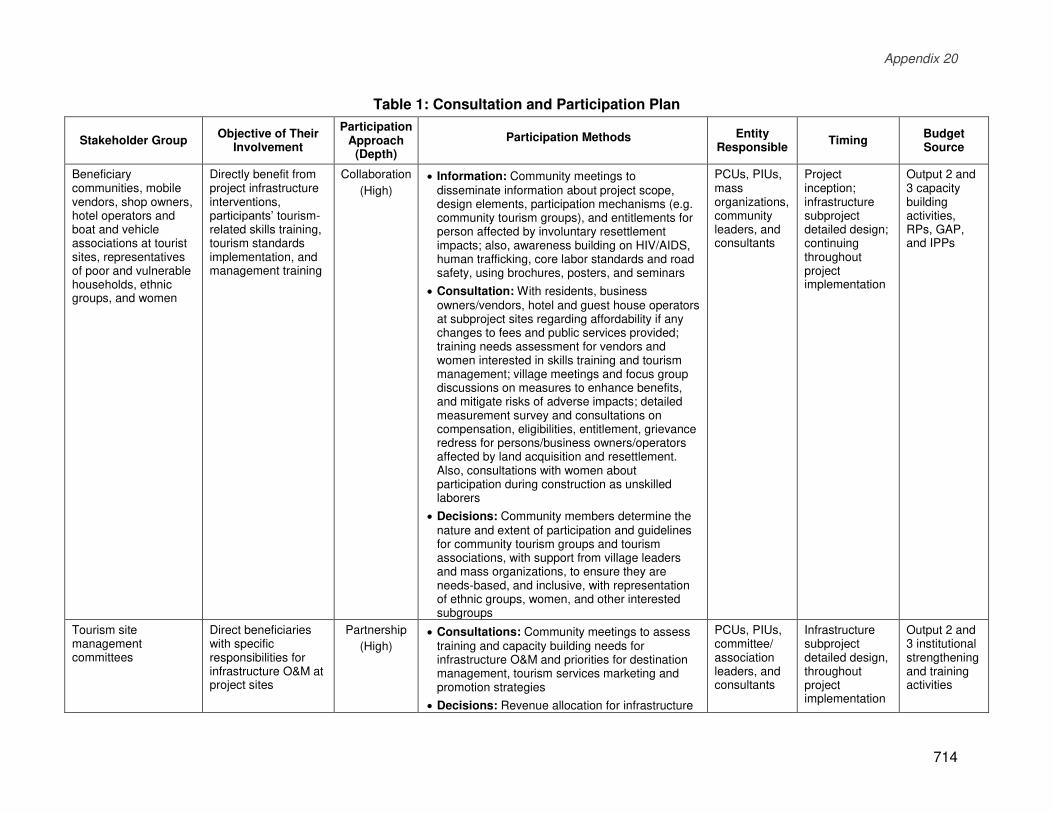
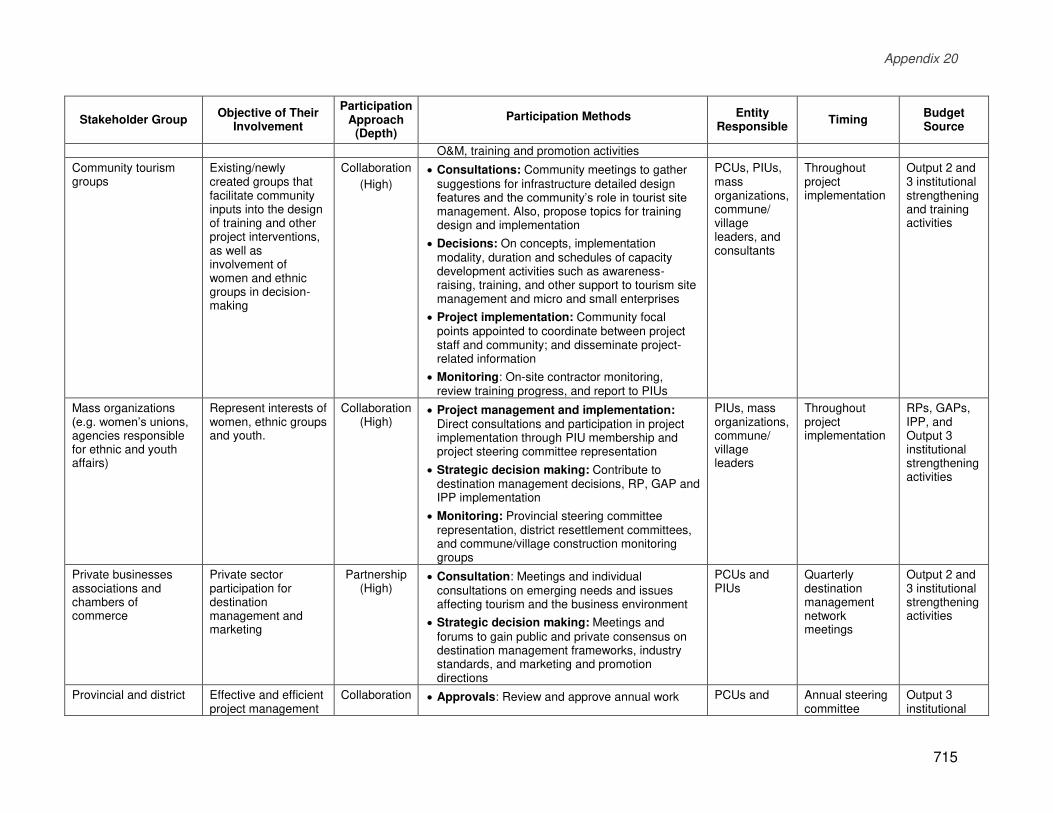
5. Consultations will continue throughout project implementation, regularly referencing the information gathered during initial consultations with various stakeholder groups. The key stakeholders to be consulted, objectives of involvement, mechanisms for participation, agencies responsible for leading/organizing consultations, timing, and budget source are in the consultation and participation plan (Error! Reference source not found.).
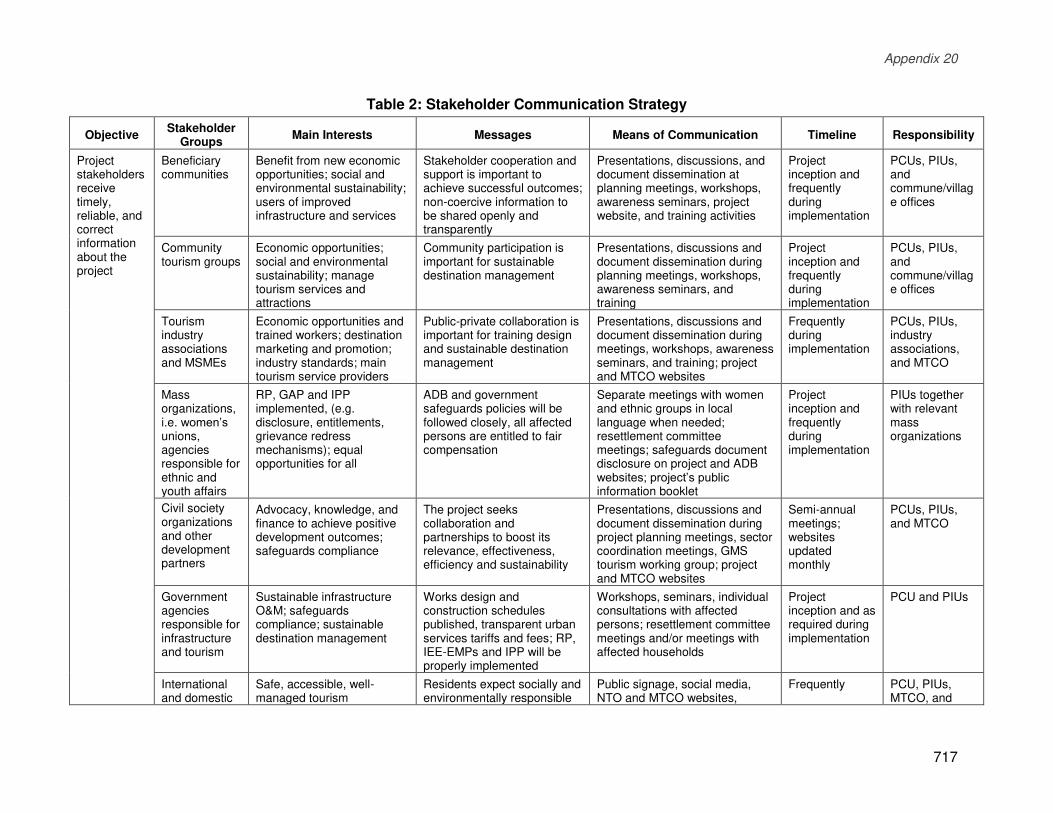
D. STAKEHOLDER COMMUNICATION STRATEGY
Appendix 20
713
6. The project’s stakeholder communication strategy (Error! Reference source not found.2)
draws on good practices outlined in ADB’s Public Communication Policy.2 It is based on the principles of transparency, timeliness, meaningful participation, and inclusion of all project stakeholders, particularly women, ethnic groups, and other intended project beneficiaries. The strategy will ensure project stakeholders receive timely, reliable and correct information about the project and have opportunities to give feedback to address implementation issues. Key stakeholders include: (i) direct and indirect project beneficiaries, emphasizing micro and small enterprises and their employees; (ii) community tourism groups; (iii) mass organizations responsible for ethic, women’s, and youth affairs; (iv) tourism industry associations; (v) civil society organizations and other development partners; (vi) government agencies responsible for tourism and public infrastructure management; and (viii) international and domestic tourists. The strategy informs and supports community and private sector development, institutional strengthening to support sustainable tourism and climate resilient green urban development, and mitigation of any potential negative impacts.
2 ADB. 2011. Public Communication Policy 2011. Disclosure and Exchange of Information. Manila.
Appendix 20
714
Table 1: Consultation and Participation Plan
Stakeholder Group Objective of Their
Involvement
Participation Approach
(Depth)
Participation Methods Entity Responsible
Timing Budget Source
Beneficiary communities, mobile vendors, shop owners, hotel operators and boat and vehicle associations at tourist sites, representatives of poor and vulnerable households, ethnic groups, and women
Directly benefit from project infrastructure interventions, participants’ tourism-related skills training, tourism standards implementation, and management training
Collaboration
(High)
Information: Community meetings to disseminate information about project scope, design elements, participation mechanisms (e.g. community tourism groups), and entitlements for person affected by involuntary resettlement impacts; also, awareness building on HIV/AIDS, human trafficking, core labor standards and road safety, using brochures, posters, and seminars
Consultation: With residents, business owners/vendors, hotel and guest house operators at subproject sites regarding affordability if any changes to fees and public services provided; training needs assessment for vendors and women interested in skills training and tourism management; village meetings and focus group discussions on measures to enhance benefits, and mitigate risks of adverse impacts; detailed measurement survey and consultations on compensation, eligibilities, entitlement, grievance redress for persons/business owners/operators affected by land acquisition and resettlement. Also, consultations with women about participation during construction as unskilled laborers
Decisions: Community members determine the nature and extent of participation and guidelines for community tourism groups and tourism associations, with support from village leaders and mass organizations, to ensure they are needs-based, and inclusive, with representation of ethnic groups, women, and other interested subgroups
PCUs, PIUs, mass organizations, community leaders, and consultants
Project inception; infrastructure subproject detailed design; continuing throughout project implementation
Output 2 and 3 capacity building activities, RPs, GAP, and IPPs
Tourism site management committees
Direct beneficiaries with specific responsibilities for infrastructure O&M at project sites
Partnership
(High)
Consultations: Community meetings to assess training and capacity building needs for infrastructure O&M and priorities for destination management, tourism services marketing and promotion strategies
Decisions: Revenue allocation for infrastructure
PCUs, PIUs, committee/ association leaders, and consultants
Infrastructure subproject detailed design, throughout project implementation
Output 2 and 3 institutional strengthening and training activities
Appendix 20
715
Stakeholder Group Objective of Their
Involvement
Participation Approach
(Depth)
Participation Methods Entity Responsible
Timing Budget Source
O&M, training and promotion activities
Community tourism groups
Existing/newly created groups that facilitate community inputs into the design of training and other project interventions, as well as involvement of women and ethnic groups in decision-making
Collaboration
(High)
Consultations: Community meetings to gather suggestions for infrastructure detailed design features and the community’s role in tourist site management. Also, propose topics for training design and implementation
Decisions: On concepts, implementation modality, duration and schedules of capacity development activities such as awareness-raising, training, and other support to tourism site management and micro and small enterprises
Project implementation: Community focal points appointed to coordinate between project staff and community; and disseminate project-related information
Monitoring: On-site contractor monitoring, review training progress, and report to PIUs
PCUs, PIUs, mass organizations, commune/ village leaders, and consultants
Throughout project implementation
Output 2 and 3 institutional strengthening and training activities
Mass organizations (e.g. women’s unions, agencies responsible for ethnic and youth affairs)
Represent interests of women, ethnic groups and youth.
Collaboration (High)
Project management and implementation: Direct consultations and participation in project implementation through PIU membership and project steering committee representation
Strategic decision making: Contribute to destination management decisions, RP, GAP and IPP implementation
Monitoring: Provincial steering committee representation, district resettlement committees, and commune/village construction monitoring groups
PIUs, mass organizations, commune/ village leaders
Throughout project implementation
RPs, GAPs, IPP, and Output 3 institutional strengthening activities
Private businesses associations and chambers of commerce
Private sector participation for destination management and marketing
Partnership (High)
Consultation: Meetings and individual consultations on emerging needs and issues affecting tourism and the business environment
Strategic decision making: Meetings and forums to gain public and private consensus on destination management frameworks, industry standards, and marketing and promotion directions
PCUs and PIUs
Quarterly destination management network meetings
Output 2 and 3 institutional strengthening activities
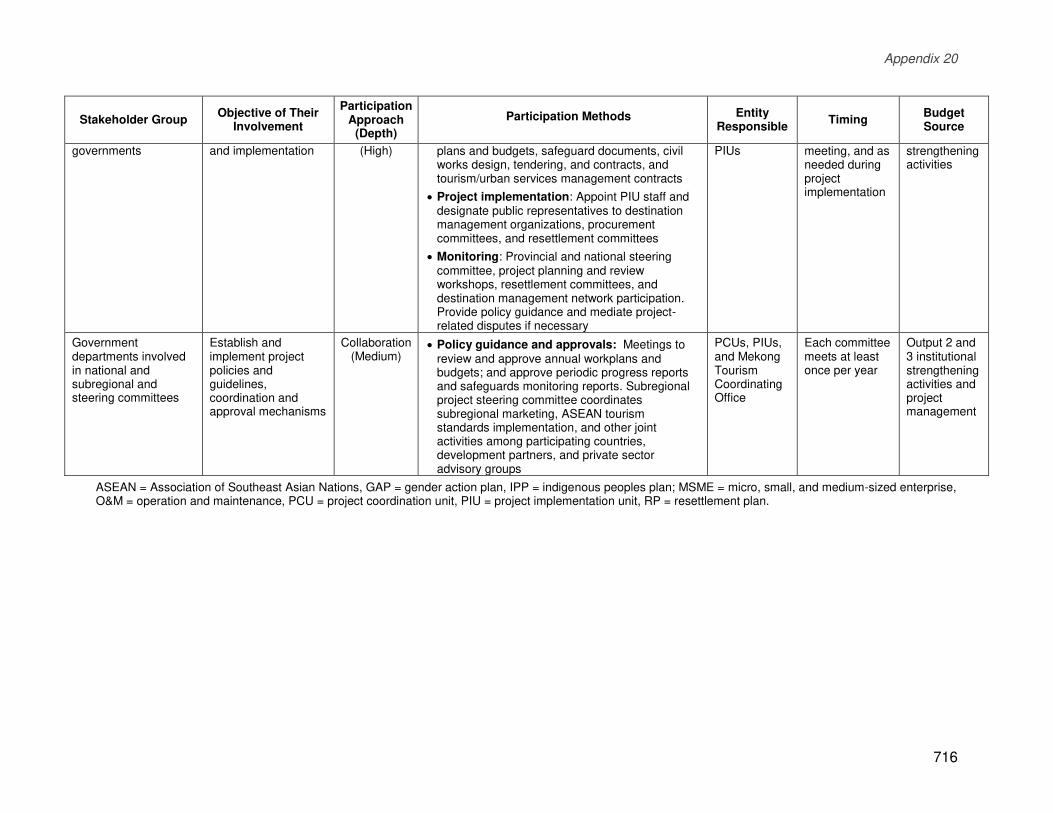
Provincial and district Effective and efficient project management
Collaboration Approvals: Review and approve annual work PCUs and Annual steering committee
Output 3 institutional
Appendix 20
716
Stakeholder Group Objective of Their
Involvement
Participation Approach
(Depth)
Participation Methods Entity Responsible
Timing Budget Source
governments and implementation (High) plans and budgets, safeguard documents, civil works design, tendering, and contracts, and tourism/urban services management contracts
Project implementation: Appoint PIU staff and designate public representatives to destination management organizations, procurement committees, and resettlement committees
Monitoring: Provincial and national steering committee, project planning and review workshops, resettlement committees, and destination management network participation. Provide policy guidance and mediate project-related disputes if necessary
PIUs
meeting, and as needed during project implementation
strengthening activities
Government departments involved in national and subregional and steering committees
Establish and implement project policies and guidelines, coordination and approval mechanisms
Collaboration (Medium)
Policy guidance and approvals: Meetings to review and approve annual workplans and budgets; and approve periodic progress reports and safeguards monitoring reports. Subregional project steering committee coordinates subregional marketing, ASEAN tourism standards implementation, and other joint activities among participating countries, development partners, and private sector advisory groups
PCUs, PIUs, and Mekong Tourism Coordinating Office
Each committee meets at least once per year
Output 2 and 3 institutional strengthening activities and project management
ASEAN = Association of Southeast Asian Nations, GAP = gender action plan, IPP = indigenous peoples plan; MSME = micro, small, and medium-sized enterprise, O&M = operation and maintenance, PCU = project coordination unit, PIU = project implementation unit, RP = resettlement plan.
Appendix 20
717
Table 2: Stakeholder Communication Strategy
Objective Stakeholder
Groups Main Interests Messages Means of Communication Timeline Responsibility
Project stakeholders receive timely, reliable, and correct information about the project
Beneficiary communities
Benefit from new economic opportunities; social and environmental sustainability; users of improved infrastructure and services
Stakeholder cooperation and support is important to achieve successful outcomes; non-coercive information to be shared openly and transparently
Presentations, discussions, and document dissemination at planning meetings, workshops, awareness seminars, project website, and training activities
Project inception and frequently during implementation
PCUs, PIUs, and commune/village offices
Community tourism groups
Economic opportunities; social and environmental sustainability; manage tourism services and attractions
Community participation is important for sustainable destination management
Presentations, discussions and document dissemination during planning meetings, workshops, awareness seminars, and training
Project inception and frequently during implementation
PCUs, PIUs, and commune/village offices
Tourism industry associations and MSMEs
Economic opportunities and trained workers; destination marketing and promotion; industry standards; main tourism service providers
Public-private collaboration is important for training design and sustainable destination management
Presentations, discussions and document dissemination during meetings, workshops, awareness seminars, and training; project and MTCO websites
Frequently during implementation
PCUs, PIUs, industry associations, and MTCO
Mass organizations, i.e. women’s unions, agencies responsible for ethnic and youth affairs
RP, GAP and IPP implemented, (e.g. disclosure, entitlements, grievance redress mechanisms); equal opportunities for all
ADB and government safeguards policies will be followed closely, all affected persons are entitled to fair compensation
Separate meetings with women and ethnic groups in local language when needed; resettlement committee meetings; safeguards document disclosure on project and ADB websites; project’s public information booklet
Project inception and frequently during implementation
PIUs together with relevant mass organizations
Civil society organizations and other development partners
Advocacy, knowledge, and finance to achieve positive development outcomes; safeguards compliance
The project seeks collaboration and partnerships to boost its relevance, effectiveness, efficiency and sustainability
Presentations, discussions and document dissemination during project planning meetings, sector coordination meetings, GMS tourism working group; project and MTCO websites
Semi-annual meetings; websites updated monthly
PCUs, PIUs, and MTCO
Government agencies responsible for infrastructure and tourism
Sustainable infrastructure O&M; safeguards compliance; sustainable destination management
Works design and construction schedules published, transparent urban services tariffs and fees; RP, IEE-EMPs and IPP will be properly implemented
Workshops, seminars, individual consultations with affected persons; resettlement committee meetings and/or meetings with affected households
Project inception and as required during implementation
PCU and PIUs
International and domestic
Safe, accessible, well-managed tourism
Residents expect socially and environmentally responsible
Public signage, social media, NTO and MTCO websites,
Frequently PCU, PIUs, MTCO, and
Appendix 20
718
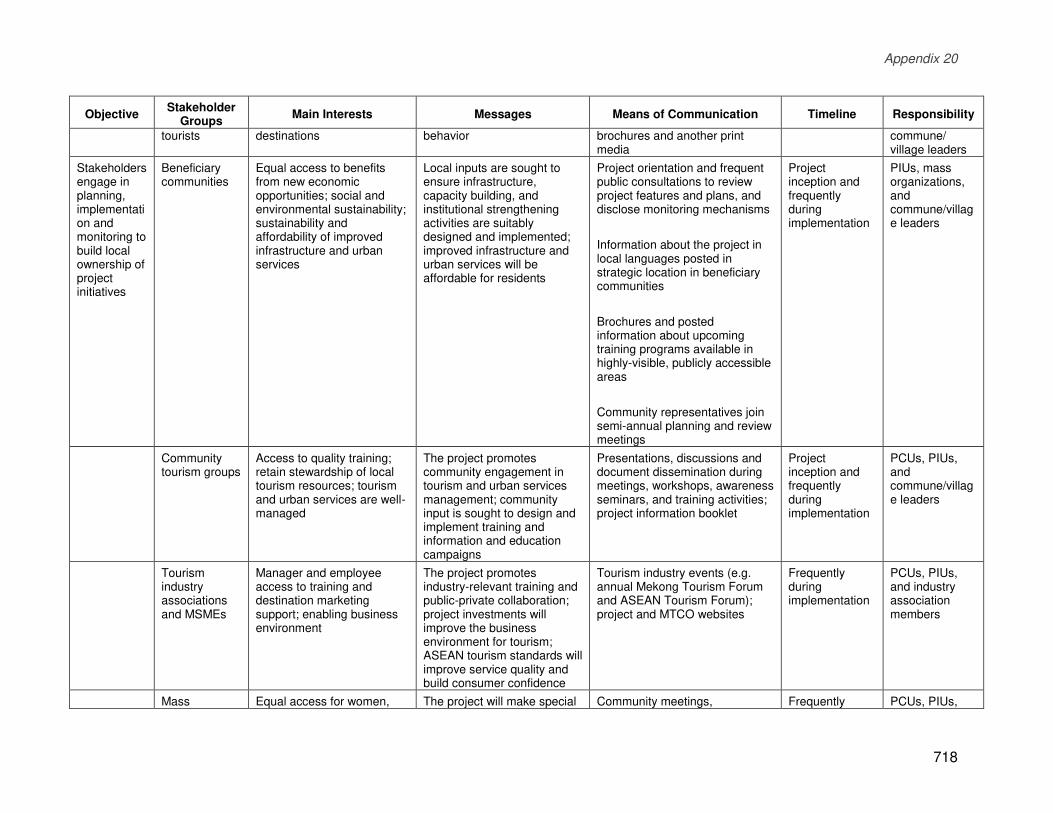
Objective Stakeholder
Groups Main Interests Messages Means of Communication Timeline Responsibility
tourists destinations behavior brochures and another print media
commune/ village leaders
Stakeholders engage in planning, implementation and monitoring to build local ownership of project initiatives
Beneficiary communities
Equal access to benefits from new economic opportunities; social and environmental sustainability; sustainability and affordability of improved infrastructure and urban services
Local inputs are sought to ensure infrastructure, capacity building, and institutional strengthening activities are suitably designed and implemented; improved infrastructure and urban services will be affordable for residents
Project orientation and frequent public consultations to review project features and plans, and disclose monitoring mechanisms
Information about the project in local languages posted in strategic location in beneficiary communities
Brochures and posted information about upcoming training programs available in highly-visible, publicly accessible areas
Community representatives join semi-annual planning and review meetings
Project inception and frequently during implementation
PIUs, mass organizations, and commune/village leaders
Community tourism groups
Access to quality training; retain stewardship of local tourism resources; tourism and urban services are well-managed
The project promotes community engagement in tourism and urban services management; community input is sought to design and implement training and information and education campaigns
Presentations, discussions and document dissemination during meetings, workshops, awareness seminars, and training activities; project information booklet
Project inception and frequently during implementation
PCUs, PIUs, and commune/village leaders
Tourism industry associations and MSMEs
Manager and employee access to training and destination marketing support; enabling business environment
The project promotes industry-relevant training and public-private collaboration; project investments will improve the business environment for tourism; ASEAN tourism standards will improve service quality and build consumer confidence
Tourism industry events (e.g. annual Mekong Tourism Forum and ASEAN Tourism Forum); project and MTCO websites
Frequently during implementation
PCUs, PIUs, and industry association members
Mass Equal access for women, The project will make special Community meetings, Frequently PCUs, PIUs,
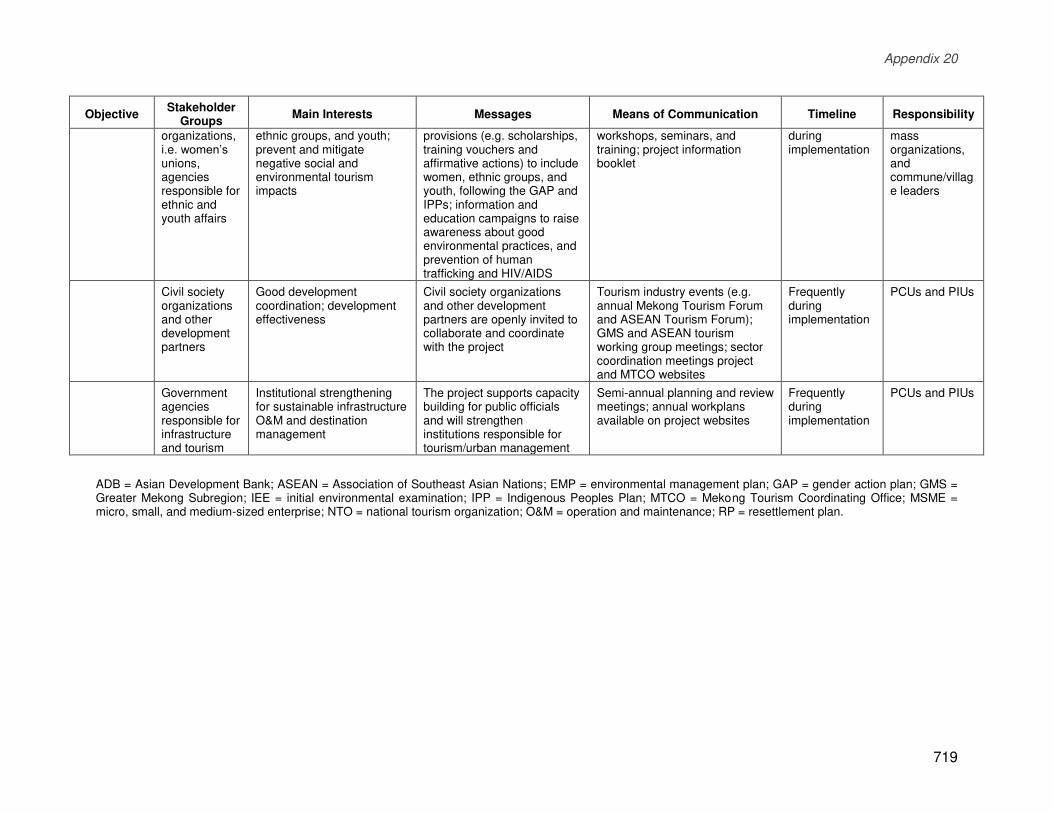
Appendix 20
719
Objective Stakeholder
Groups Main Interests Messages Means of Communication Timeline Responsibility
organizations, i.e. women’s unions, agencies responsible for ethnic and youth affairs
ethnic groups, and youth; prevent and mitigate negative social and environmental tourism impacts
provisions (e.g. scholarships, training vouchers and affirmative actions) to include women, ethnic groups, and youth, following the GAP and IPPs; information and education campaigns to raise awareness about good environmental practices, and prevention of human trafficking and HIV/AIDS
workshops, seminars, and training; project information booklet
during implementation
mass organizations, and commune/village leaders
Civil society organizations and other development partners
Good development coordination; development effectiveness
Civil society organizations and other development partners are openly invited to collaborate and coordinate with the project
Tourism industry events (e.g. annual Mekong Tourism Forum and ASEAN Tourism Forum); GMS and ASEAN tourism working group meetings; sector coordination meetings project and MTCO websites
Frequently during implementation
PCUs and PIUs
Government agencies responsible for infrastructure and tourism
Institutional strengthening for sustainable infrastructure O&M and destination management
The project supports capacity building for public officials and will strengthen institutions responsible for tourism/urban management
Semi-annual planning and review meetings; annual workplans available on project websites
Frequently during implementation
PCUs and PIUs
ADB = Asian Development Bank; ASEAN = Association of Southeast Asian Nations; EMP = environmental management plan; GAP = gender action plan; GMS = Greater Mekong Subregion; IEE = initial environmental examination; IPP = Indigenous Peoples Plan; MTCO = Mekong Tourism Coordinating Office; MSME = micro, small, and medium-sized enterprise; NTO = national tourism organization; O&M = operation and maintenance; RP = resettlement plan.
Appendix 21: Stakeholder Analysis
TA9090-REG: Preparing the Second Greater Mekong Subregion Tourism
Infrastructure for Inclusive Growth Project
FINAL REPORT – PART C
June 2018
Lao People’s Democratic Republic:
Second Greater Mekong Subregion Tourism Infrastructure
for Inclusive Growth Project
Appendix 21
721
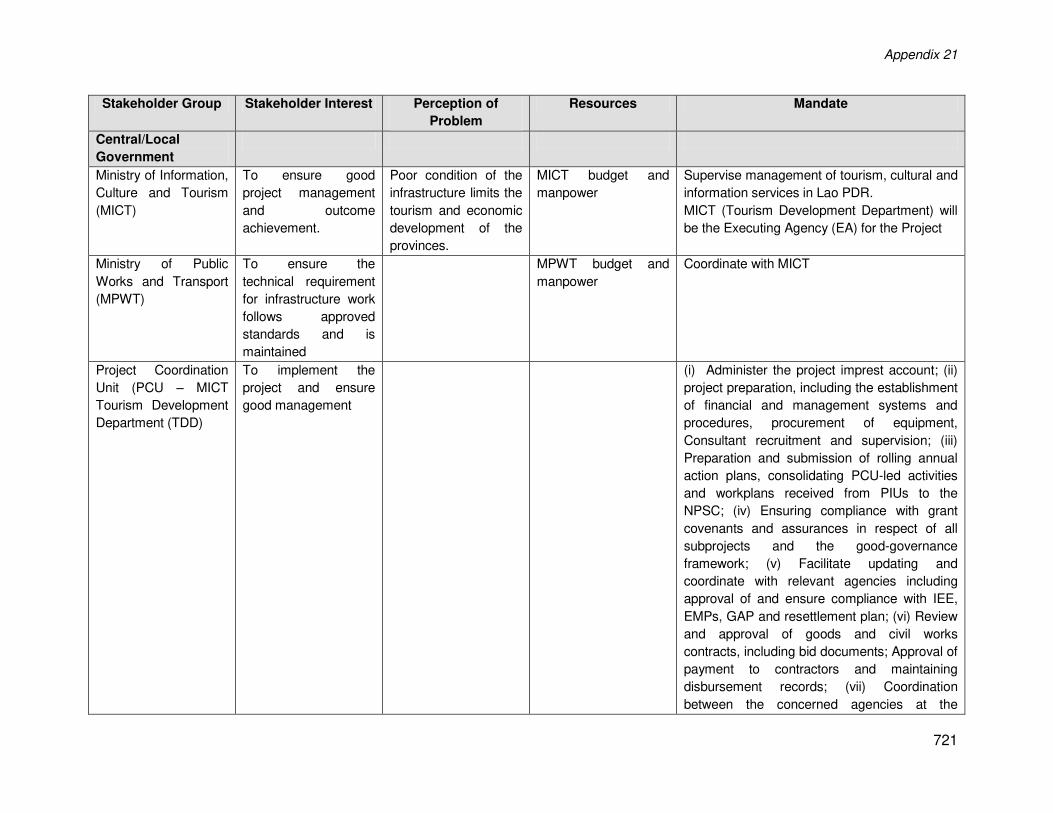
Stakeholder Group Stakeholder Interest Perception of
Problem
Resources Mandate
Central/Local
Government
Ministry of Information,
Culture and Tourism
(MICT)
To ensure good
project management
and outcome
achievement.
Poor condition of the
infrastructure limits the
tourism and economic
development of the
provinces.
MICT budget and
manpower
Supervise management of tourism, cultural and
information services in Lao PDR.
MICT (Tourism Development Department) will
be the Executing Agency (EA) for the Project
Ministry of Public
Works and Transport
(MPWT)
To ensure the
technical requirement
for infrastructure work
follows approved
standards and is
maintained
MPWT budget and
manpower
Coordinate with MICT
Project Coordination
Unit (PCU – MICT
Tourism Development
Department (TDD)
To implement the
project and ensure
good management
(i) Administer the project imprest account; (ii)
project preparation, including the establishment
of financial and management systems and
procedures, procurement of equipment,
Consultant recruitment and supervision; (iii)
Preparation and submission of rolling annual
action plans, consolidating PCU-led activities
and workplans received from PIUs to the
NPSC; (iv) Ensuring compliance with grant
covenants and assurances in respect of all
subprojects and the good-governance
framework; (v) Facilitate updating and
coordinate with relevant agencies including
approval of and ensure compliance with IEE,
EMPs, GAP and resettlement plan; (vi) Review
and approval of goods and civil works
contracts, including bid documents; Approval of
payment to contractors and maintaining
disbursement records; (vii) Coordination
between the concerned agencies at the
Appendix 21
722
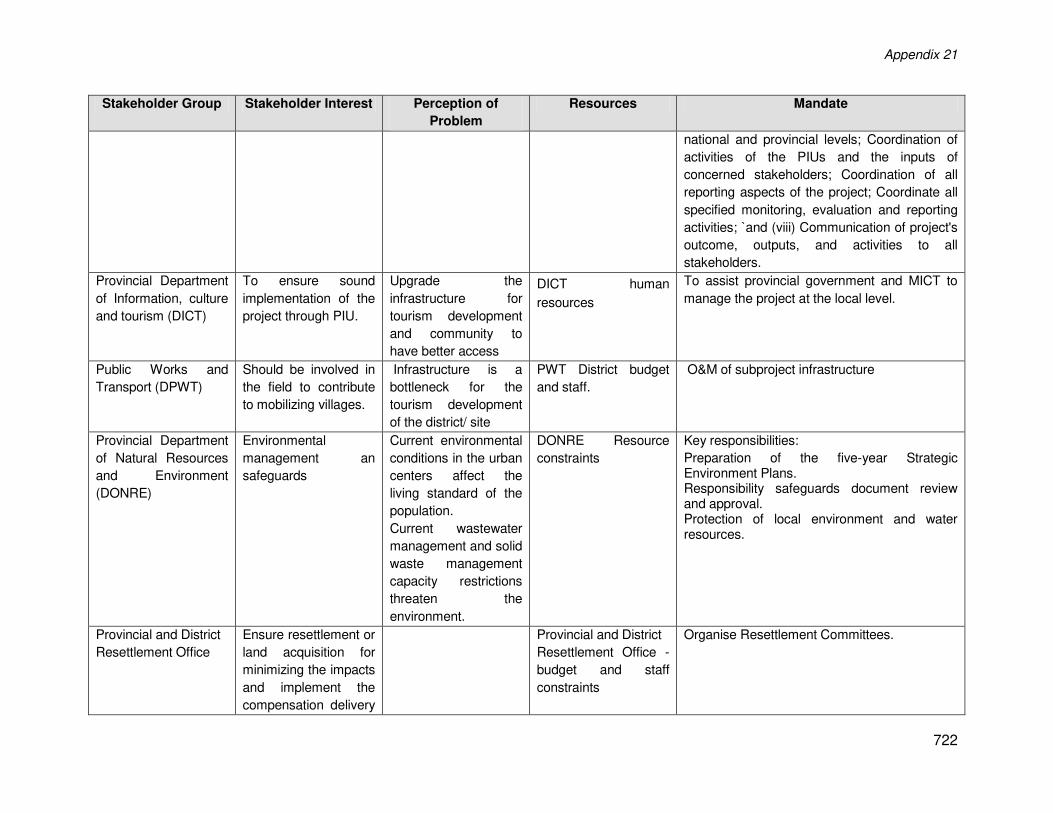
Stakeholder Group Stakeholder Interest Perception of
Problem
Resources Mandate
national and provincial levels; Coordination of
activities of the PIUs and the inputs of
concerned stakeholders; Coordination of all
reporting aspects of the project; Coordinate all
specified monitoring, evaluation and reporting
activities; `and (viii) Communication of project's
outcome, outputs, and activities to all
stakeholders.
Provincial Department
of Information, culture
and tourism (DICT)
To ensure sound
implementation of the
project through PIU.
Upgrade the
infrastructure for
tourism development
and community to
have better access
DICT human
resources
To assist provincial government and MICT to
manage the project at the local level.
Public Works and
Transport (DPWT)
Should be involved in
the field to contribute
to mobilizing villages.
Infrastructure is a
bottleneck for the
tourism development
of the district/ site
PWT District budget
and staff.
O&M of subproject infrastructure
Provincial Department
of Natural Resources
and Environment
(DONRE)
Environmental
management an
safeguards
Current environmental
conditions in the urban
centers affect the
living standard of the
population.
Current wastewater
management and solid
waste management
capacity restrictions
threaten the
environment.
DONRE Resource
constraints
Key responsibilities:
Preparation of the five-year Strategic Environment Plans.
Responsibility safeguards document review and approval.
Protection of local environment and water resources.
Provincial and District
Resettlement Office
Ensure resettlement or
land acquisition for
minimizing the impacts
and implement the
compensation delivery
Provincial and District
Resettlement Office -
budget and staff
constraints
Organise Resettlement Committees.
Appendix 21
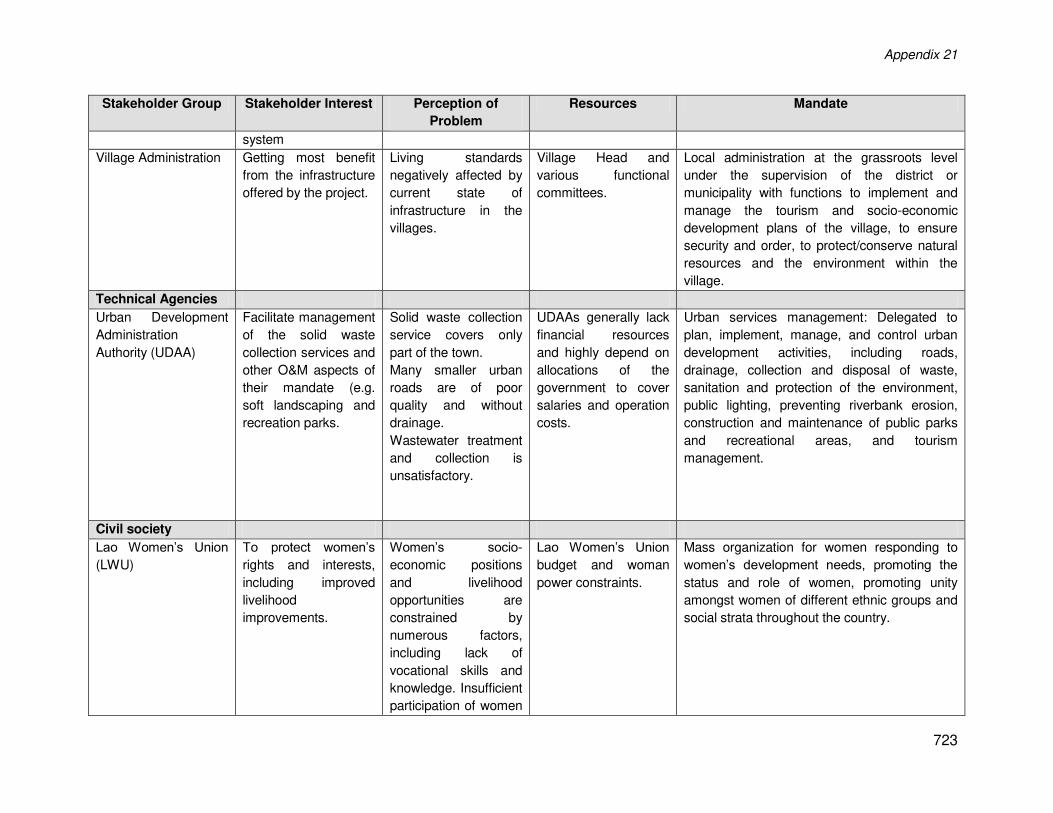
723
Stakeholder Group Stakeholder Interest Perception of
Problem
Resources Mandate
system
Village Administration Getting most benefit
from the infrastructure
offered by the project.
Living standards
negatively affected by
current state of
infrastructure in the
villages.
Village Head and
various functional
committees.
Local administration at the grassroots level
under the supervision of the district or
municipality with functions to implement and
manage the tourism and socio-economic
development plans of the village, to ensure
security and order, to protect/conserve natural
resources and the environment within the
village.
Technical Agencies
Urban Development
Administration
Authority (UDAA)
Facilitate management
of the solid waste
collection services and
other O&M aspects of
their mandate (e.g.
soft landscaping and
recreation parks.
Solid waste collection
service covers only
part of the town.
Many smaller urban
roads are of poor
quality and without
drainage.
Wastewater treatment
and collection is
unsatisfactory.
UDAAs generally lack
financial resources
and highly depend on
allocations of the
government to cover
salaries and operation
costs.
Urban services management: Delegated to
plan, implement, manage, and control urban
development activities, including roads,
drainage, collection and disposal of waste,
sanitation and protection of the environment,
public lighting, preventing riverbank erosion,
construction and maintenance of public parks
and recreational areas, and tourism
management.
Civil society
Lao Women’s Union (LWU)
To protect women’s rights and interests,
including improved
livelihood
improvements.
Women’s socio-
economic positions
and livelihood
opportunities are
constrained by
numerous factors,
including lack of
vocational skills and
knowledge. Insufficient
participation of women
Lao Women’s Union budget and woman
power constraints.
Mass organization for women responding to
women’s development needs, promoting the status and role of women, promoting unity
amongst women of different ethnic groups and
social strata throughout the country.
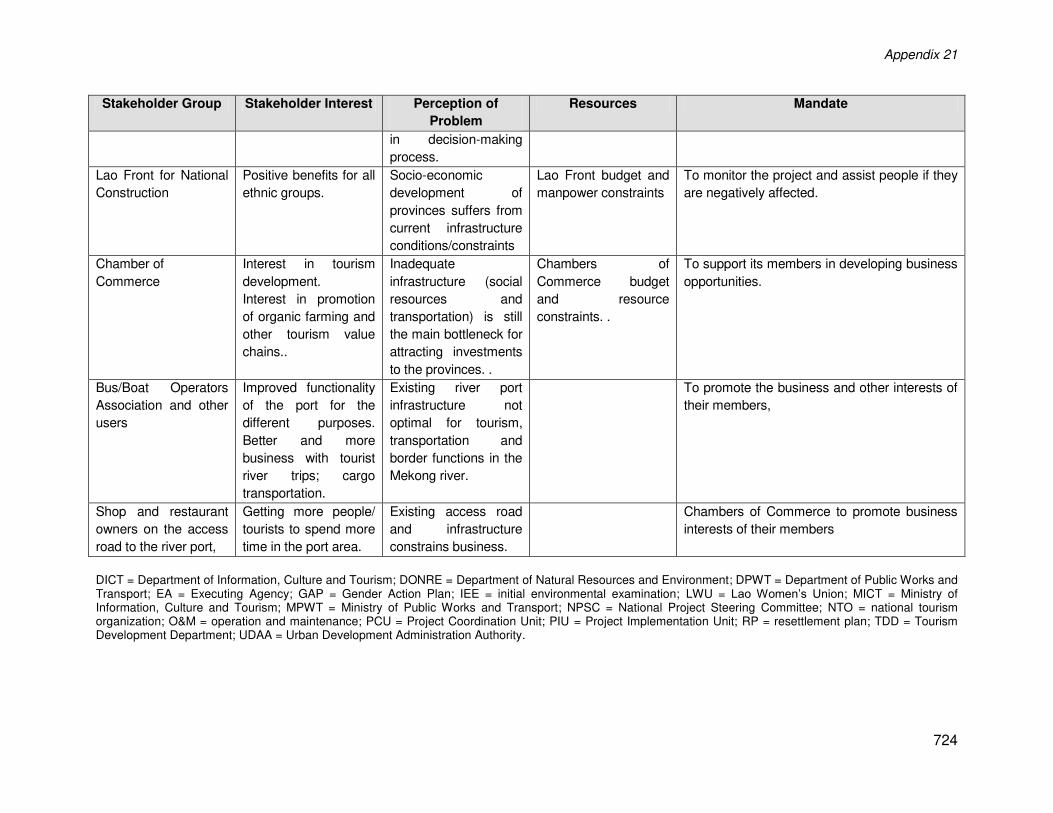
Appendix 21
724
Stakeholder Group Stakeholder Interest Perception of
Problem
Resources Mandate
in decision-making
process.
Lao Front for National
Construction
Positive benefits for all
ethnic groups.
Socio-economic
development of
provinces suffers from
current infrastructure
conditions/constraints
Lao Front budget and
manpower constraints
To monitor the project and assist people if they
are negatively affected.
Chamber of
Commerce
Interest in tourism
development.
Interest in promotion
of organic farming and
other tourism value
chains..
Inadequate
infrastructure (social
resources and
transportation) is still
the main bottleneck for
attracting investments
to the provinces. .
Chambers of
Commerce budget
and resource
constraints. .
To support its members in developing business
opportunities.
Bus/Boat Operators
Association and other
users
Improved functionality
of the port for the
different purposes.
Better and more
business with tourist
river trips; cargo
transportation.
Existing river port
infrastructure not
optimal for tourism,
transportation and
border functions in the
Mekong river.
To promote the business and other interests of
their members,
Shop and restaurant
owners on the access
road to the river port,
Getting more people/
tourists to spend more
time in the port area.
Existing access road
and infrastructure
constrains business.
Chambers of Commerce to promote business
interests of their members
DICT = Department of Information, Culture and Tourism; DONRE = Department of Natural Resources and Environment; DPWT = Department of Public Works and Transport; EA = Executing Agency; GAP = Gender Action Plan; IEE = initial environmental examination; LWU = Lao Women’s Union; MICT = Ministry of Information, Culture and Tourism; MPWT = Ministry of Public Works and Transport; NPSC = National Project Steering Committee; NTO = national tourism organization; O&M = operation and maintenance; PCU = Project Coordination Unit; PIU = Project Implementation Unit; RP = resettlement plan; TDD = Tourism Development Department; UDAA = Urban Development Administration Authority.
Appendix 22
Appendix 22: Supplementary Information and Data
TA9090-REG: Preparing the Second Greater Mekong Subregion Tourism Infrastructure for Inclusive Growth Project FINAL REPORT – PART C June 2018
Lao People’s Democratic Republic: Second Greater Mekong Subregion Tourism Infrastructure for Inclusive Growth Project
Appendix 22
726
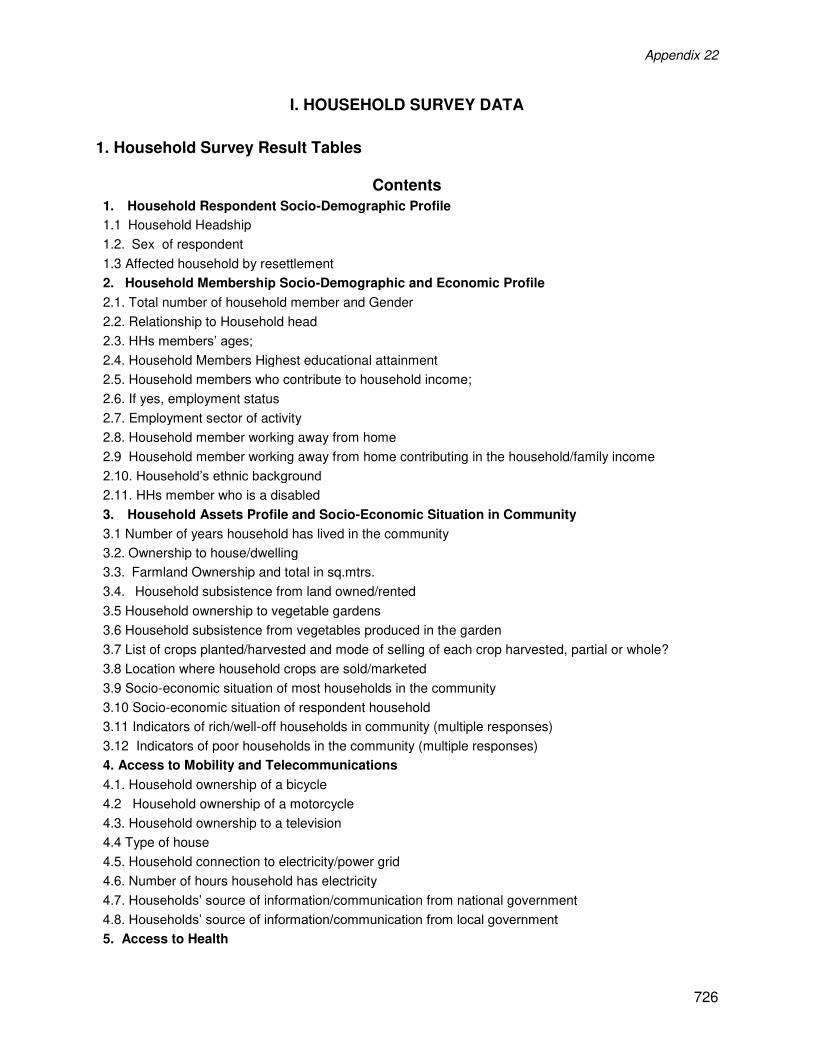
I. HOUSEHOLD SURVEY DATA
1. Household Survey Result Tables
Contents
1. Household Respondent Socio-Demographic Profile
1.1 Household Headship
1.2. Sex of respondent
1.3 Affected household by resettlement
2. Household Membership Socio-Demographic and Economic Profile
2.1. Total number of household member and Gender
2.2. Relationship to Household head
2.3. HHs members’ ages;
2.4. Household Members Highest educational attainment
2.5. Household members who contribute to household income;
2.6. If yes, employment status
2.7. Employment sector of activity
2.8. Household member working away from home
2.9 Household member working away from home contributing in the household/family income
2.10. Household’s ethnic background
2.11. HHs member who is a disabled
3. Household Assets Profile and Socio-Economic Situation in Community
3.1 Number of years household has lived in the community
3.2. Ownership to house/dwelling
3.3. Farmland Ownership and total in sq.mtrs.
3.4. Household subsistence from land owned/rented
3.5 Household ownership to vegetable gardens
3.6 Household subsistence from vegetables produced in the garden
3.7 List of crops planted/harvested and mode of selling of each crop harvested, partial or whole?
3.8 Location where household crops are sold/marketed
3.9 Socio-economic situation of most households in the community
3.10 Socio-economic situation of respondent household
3.11 Indicators of rich/well-off households in community (multiple responses)
3.12 Indicators of poor households in the community (multiple responses)
4. Access to Mobility and Telecommunications
4.1. Household ownership of a bicycle
4.2 Household ownership of a motorcycle
4.3. Household ownership to a television
4.4 Type of house
4.5. Household connection to electricity/power grid
4.6. Number of hours household has electricity
4.7. Households’ source of information/communication from national government
4.8. Households’ source of information/communication from local government 5. Access to Health
Appendix 22
727
5.1. Household’s Morbidity profile: Types of illnesses affecting family members (multiple responses) 5.2 Types of health facilities/personnel where and whom consulted when family member is ill (multiple responses)
5.3 Types of domestic water source of household (multiple responses)
5.4 Distance of house to water source (skip)
5.5. Of those households who accessed domestic water from a public tap ( skip)
5.5.1 Total amount of time consumed for collecting/fetching water (skip)
5.5.2. Who collect this? Gender and age (skip)
5.6 Households’ types of toilet facilities
6. Access to Education
6.1. Availability of primary school in the community;
6.2 Distance of primary school from houses of household respondents
6.3. Availability of secondary school in the community
6.4. Distance of secondary school from houses of household respondents
7. Household Income and Expenditures
7.1. Main source of income of households
7.2 Other sources of household income (multiple responses) 7.3. Amount of monthly and annual income from other non-tourism income sources of households (multiple responses);
7.4. Amount of monthly and annual household income from directly tourism-related sources of income
8. Consultation on Subproject and Tourism Development
8.1 Household Respondents’ Awareness on the Subproject
8.2 If yes, means/media of getting awareness on the subproject;
8.3 Respondents’ knowledge of the subproject plan
8.4 Subprojects Benefits to community, yes? And reasons why beneficial to community? (multiple responses)
8.5 If no benefits, why? (multiple responses)
8.6 People in the community who will benefit from the subproject
8.7 Nature of benefits per type of people in community (multiple responses)
8.8 Benefit of Subproject to respondent household? Yes, why? No why not (multiple responses)
8.9 Subproject’s impact to household respondent during construction (multiple responses) 8.10 Subproject’s impacts to household respondent after subproject completion (multiple responses) 8.11 Recommendations on changes of subproject to make it more beneficial and/or avoid its adverse impact to household respondent (multiple responses)
9. Willingness-to-pay for sanitation and other services
9.1 Household respondents’ approval of the subproject item included in subproject description
9.2 Willingness to pay for additional items to subproject features
9.3 How much is amount of user/rental fee per month?
9.4 Other means of covering up user fees (multiple responses)
9.5 Willingness to participate in consultation meetings with business owners
9.6 Experiences with tourists
9.7 Preference to have more tourists visits the area, Yes, why? (multiple responses)
9.8 Three most important things you would like to show to tourists (multiple responses)
9.9 Three most important things you would not like tourists to do in your community (multiple responses)
9.10 Preferred nature of tourism activities to gain income (multiple responses)
10 Respondents’ Concerns with Natural Disasters and Climate Change
Appendix 22
728
10.1 House/business/shops affected by typhoon and storm surge;
10.2 Yes, frequency of occurrence
10.3 Total amount per year spent for house/shops/business repairs due to typhoons, storm surge, erosions etc.
11. Training and Capacity-Building
11.1 Household member receiving training from government/institutions, if yes, Who among household member? Relationship of Household respondent with HH member who participated in training and gender
11.2 Willingness for HH members to participate in project-related training and capacity-building 11.3 Who among HH members would household respondent recommend for training and capacity-building in project; their gender 11.4 Type and nature of training and capacity-building that HH respondent recommend for HH members participating in these activities. (multiple responses)
12. Community Development and Participation
12.1 Three top priorities for improvement/development in the community (multiple responses)
12.2 Groups or community activities that household members participate in (multiple response
Appendix 22
729
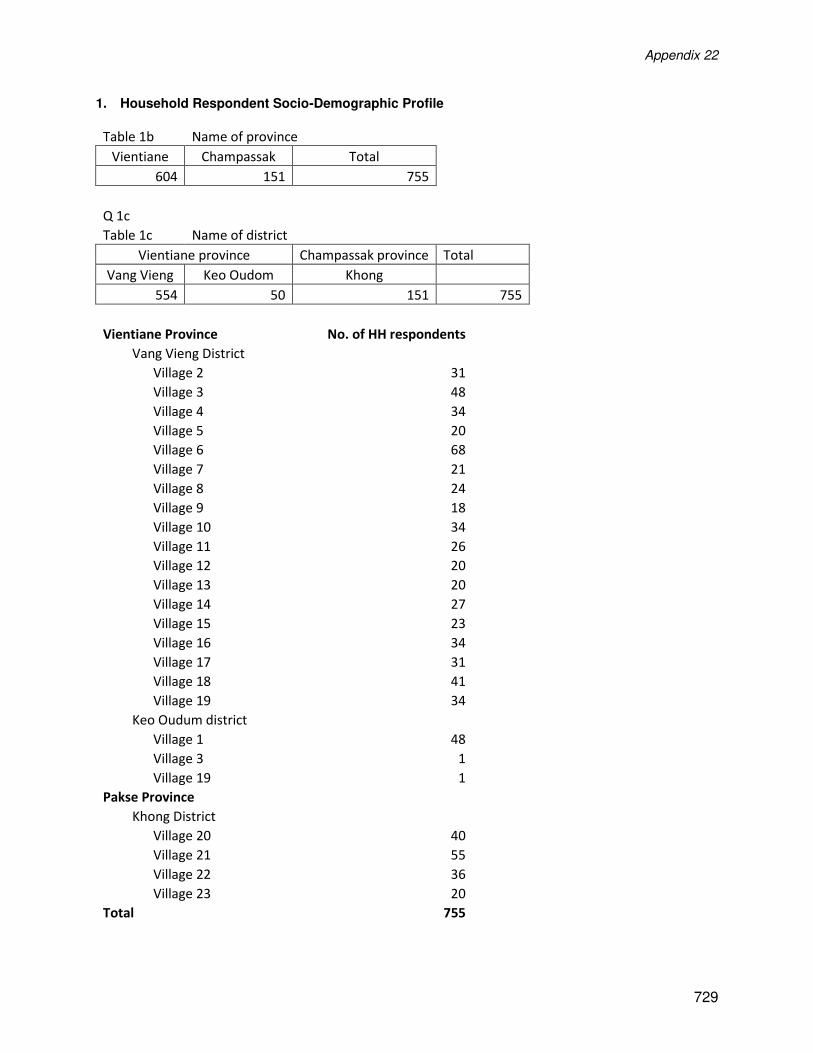
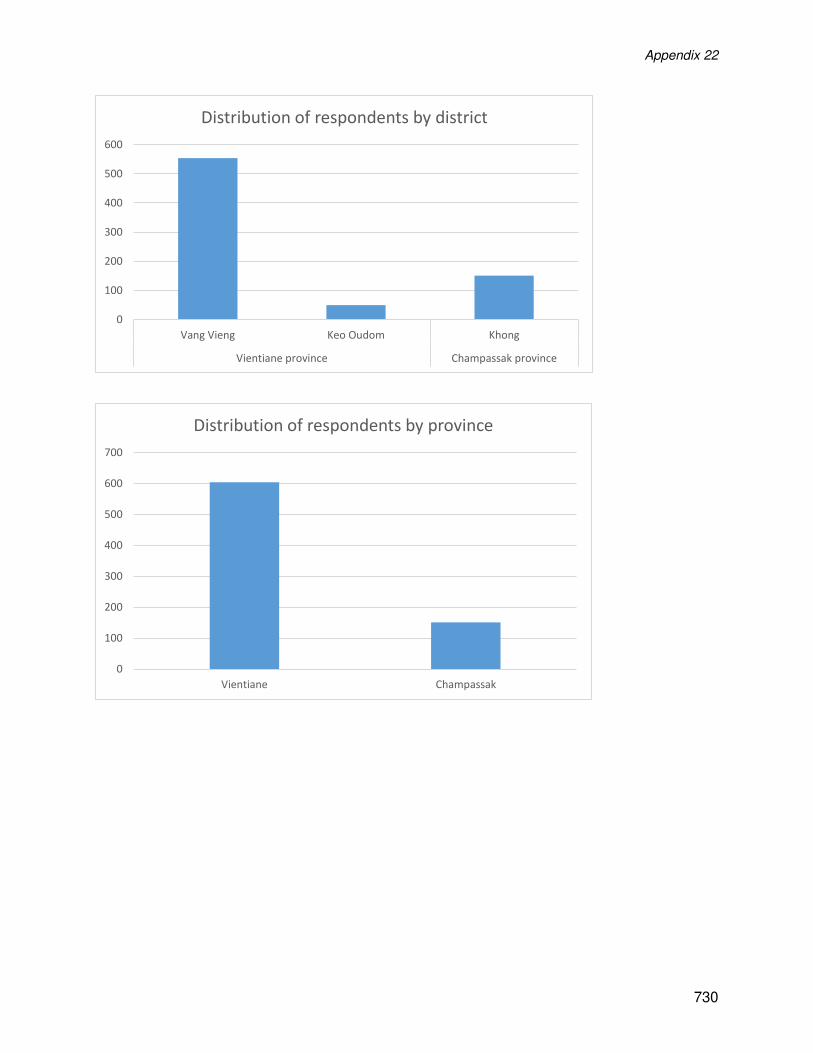
1. Household Respondent Socio-Demographic Profile
Table 1b Name of province
Vientiane Champassak Total
604 151 755
Q 1c
Table 1c Name of district
Vientiane province Champassak province Total
Vang Vieng Keo Oudom Khong
554 50 151 755
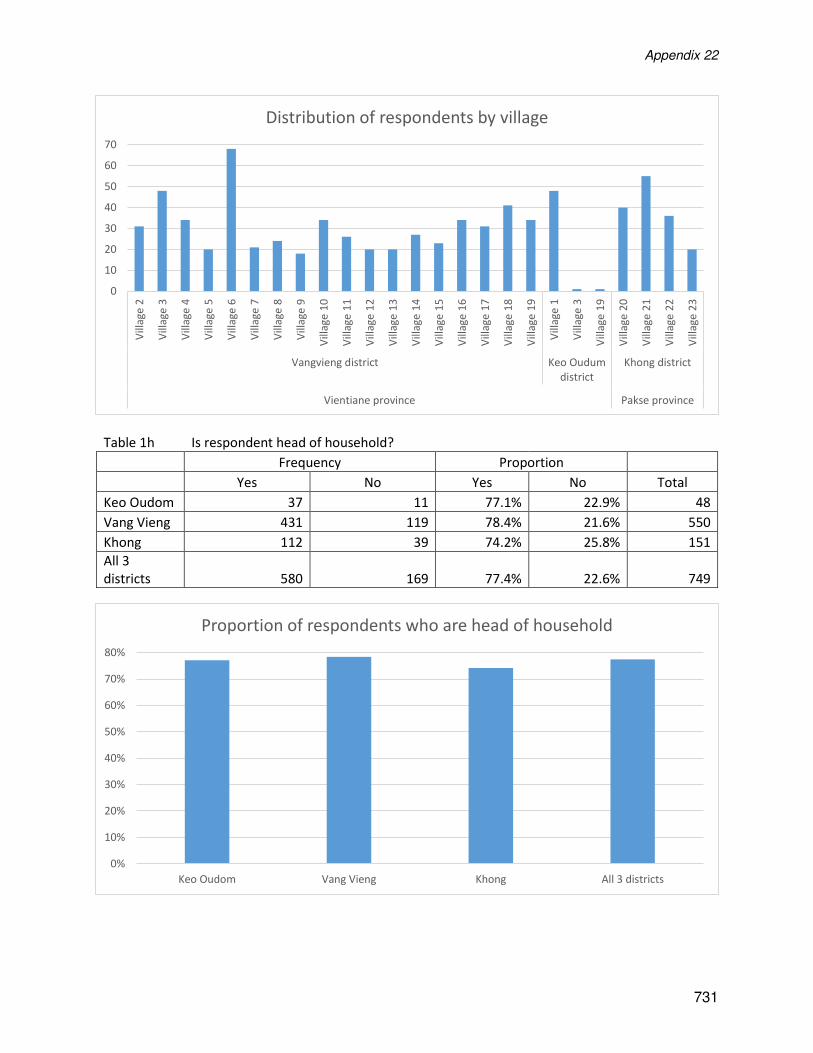
Vientiane Province No. of HH respondents
Vang Vieng District
Village 2 31
Village 3 48
Village 4 34
Village 5 20
Village 6 68
Village 7 21
Village 8 24
Village 9 18
Village 10 34
Village 11 26
Village 12 20
Village 13 20
Village 14 27
Village 15 23
Village 16 34
Village 17 31
Village 18 41
Village 19 34
Keo Oudum district
Village 1 48
Village 3 1
Village 19 1
Pakse Province
Khong District
Village 20 40
Village 21 55
Village 22 36
Village 23 20
Total 755
Appendix 22
730
0
100
200
300
400
500
600
Vang Vieng Keo Oudom Khong
Vientiane province Champassak province
Distribution of respondents by district
0
100
200
300
400
500
600
700
Vientiane Champassak
Distribution of respondents by province
Appendix 22
731
Table 1h Is respondent head of household?
Frequency Proportion
Yes No Yes No Total
Keo Oudom 37 11 77.1% 22.9% 48
Vang Vieng 431 119 78.4% 21.6% 550
Khong 112 39 74.2% 25.8% 151
All 3
districts 580 169 77.4% 22.6% 749
0
10
20
30
40
50
60
70V
illa
ge
2
Vil
lag
e 3
Vil
lag
e 4
Vil
lag
e 5
Vil
lag
e 6
Vil
lag
e 7
Vil
lag
e 8
Vil
lag
e 9
Vil
lag
e 1
0
Vil
lag
e 1
1
Vil
lag
e 1
2
Vil
lag
e 1
3
Vil
lag
e 1
4
Vil
lag
e 1
5
Vil
lag
e 1
6
Vil
lag
e 1
7
Vil
lag
e 1
8
Villa
ge
19
Vil
lag
e 1
Vil
lag
e 3
Vil
lag
e 1
9
Vil
lag
e 2
0
Vil
lag
e 2
1
Vil
lag
e 2
2
Vil
lag
e 2
3
Vangvieng district Keo Oudum
district
Khong district
Vientiane province Pakse province
Distribution of respondents by village
0%
10%
20%
30%
40%
50%
60%
70%
80%
Keo Oudom Vang Vieng Khong All 3 districts
Proportion of respondents who are head of household
Appendix 22
732
Q 1i
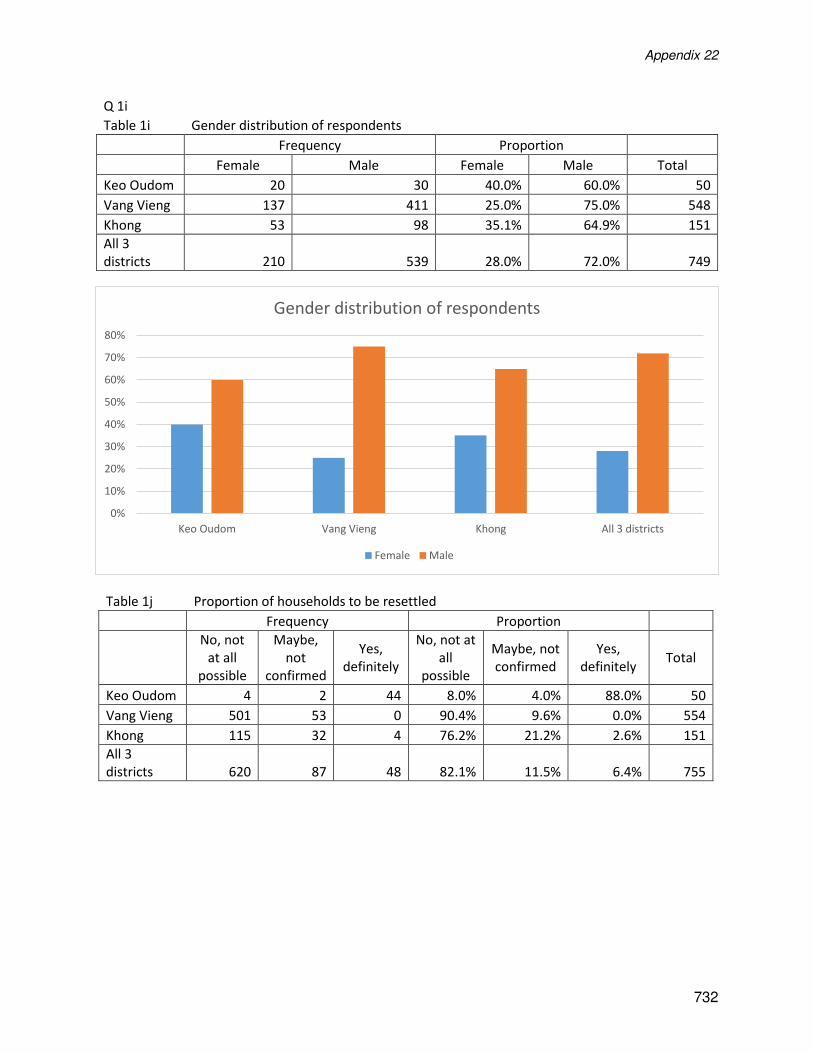
Table 1i Gender distribution of respondents
Frequency Proportion
Female Male Female Male Total
Keo Oudom 20 30 40.0% 60.0% 50
Vang Vieng 137 411 25.0% 75.0% 548
Khong 53 98 35.1% 64.9% 151
All 3
districts 210 539 28.0% 72.0% 749
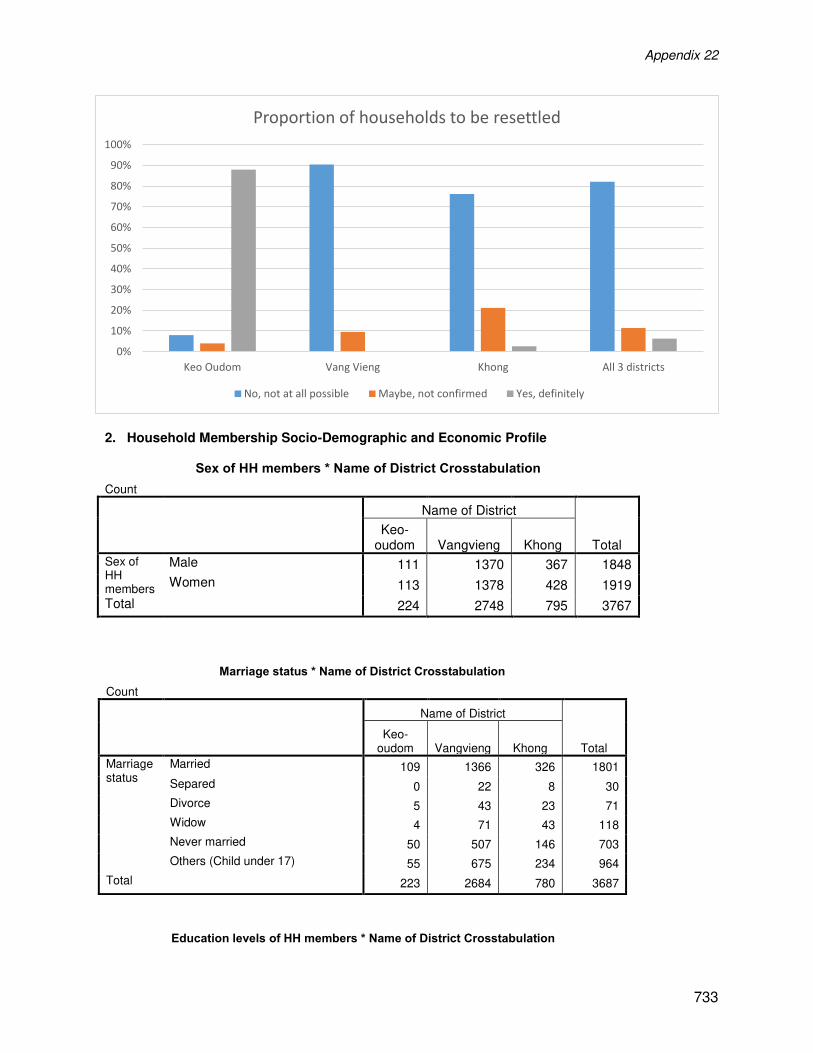
Table 1j Proportion of households to be resettled
Frequency Proportion
No, not
at all
possible
Maybe,
not
confirmed
Yes,
definitely
No, not at
all
possible
Maybe, not
confirmed
Yes,
definitely Total
Keo Oudom 4 2 44 8.0% 4.0% 88.0% 50
Vang Vieng 501 53 0 90.4% 9.6% 0.0% 554
Khong 115 32 4 76.2% 21.2% 2.6% 151
All 3
districts 620 87 48 82.1% 11.5% 6.4% 755
0%
10%
20%
30%
40%
50%
60%
70%
80%
Keo Oudom Vang Vieng Khong All 3 districts
Gender distribution of respondents
Female Male
Appendix 22
733
2. Household Membership Socio-Demographic and Economic Profile
Sex of HH members * Name of District Crosstabulation
Count
Name of District
Total Keo-
oudom Vangvieng Khong
Sex of HH members
Male 111 1370 367 1848
Women 113 1378 428 1919
Total 224 2748 795 3767
Marriage status * Name of District Crosstabulation
Count
Name of District
Total Keo-
oudom Vangvieng Khong
Marriage status
Married 109 1366 326 1801
Separed 0 22 8 30
Divorce 5 43 23 71
Widow 4 71 43 118
Never married 50 507 146 703
Others (Child under 17) 55 675 234 964
Total 223 2684 780 3687
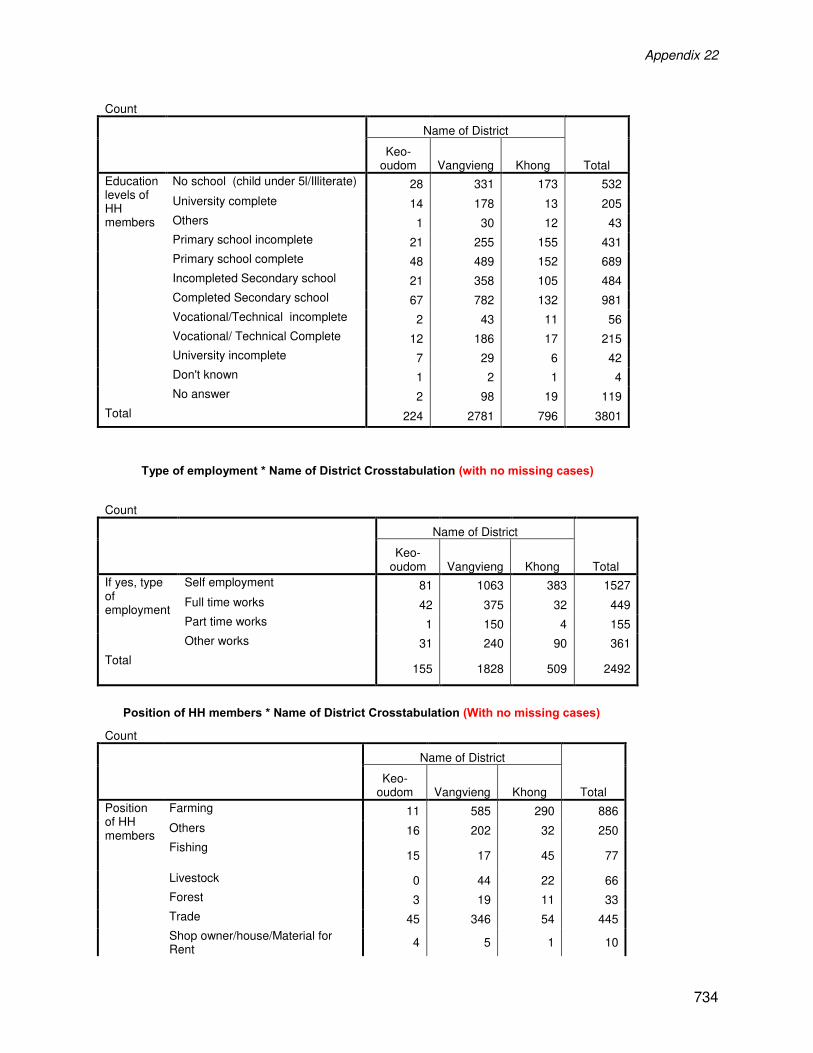
Education levels of HH members * Name of District Crosstabulation
0%
10%
20%
30%
40%
50%
60%
70%
80%
90%
100%
Keo Oudom Vang Vieng Khong All 3 districts
Proportion of households to be resettled
No, not at all possible Maybe, not confirmed Yes, definitely
Appendix 22
734
Count
Name of District
Total Keo-
oudom Vangvieng Khong
Education levels of HH members
No school (child under 5l/Illiterate) 28 331 173 532
University complete 14 178 13 205
Others 1 30 12 43
Primary school incomplete 21 255 155 431
Primary school complete 48 489 152 689
Incompleted Secondary school 21 358 105 484
Completed Secondary school 67 782 132 981
Vocational/Technical incomplete 2 43 11 56
Vocational/ Technical Complete 12 186 17 215
University incomplete 7 29 6 42
Don't known 1 2 1 4
No answer 2 98 19 119
Total 224 2781 796 3801
Type of employment * Name of District Crosstabulation (with no missing cases)
Count
Name of District
Total Keo-
oudom Vangvieng Khong
If yes, type of employment
Self employment 81 1063 383 1527
Full time works 42 375 32 449
Part time works 1 150 4 155
Other works 31 240 90 361
Total 155 1828 509 2492
Position of HH members * Name of District Crosstabulation (With no missing cases)
Count
Name of District
Total Keo-
oudom Vangvieng Khong
Position of HH members
Farming 11 585 290 886
Others 16 202 32 250
Fishing 15 17 45 77
Livestock 0 44 22 66
Forest 3 19 11 33
Trade 45 346 54 445
Shop owner/house/Material for Rent
4 5 1 10
Appendix 22
735
Labor on Farming/construction 37 215 22 274
Government staff 9 278 12 299
Enteprise/Private staff 15 74 9 98
Total 155 1785 498 2438
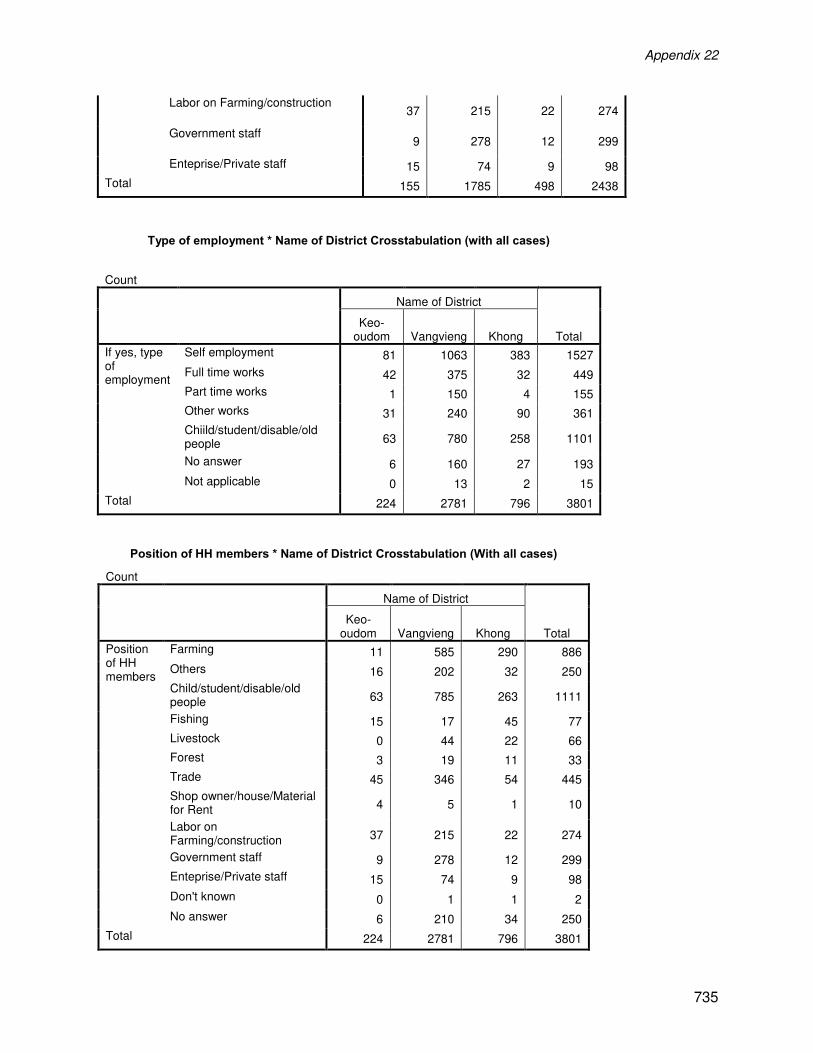
Type of employment * Name of District Crosstabulation (with all cases)
Count
Name of District
Total Keo-
oudom Vangvieng Khong
If yes, type of employment
Self employment 81 1063 383 1527
Full time works 42 375 32 449
Part time works 1 150 4 155
Other works 31 240 90 361
Chiild/student/disable/old people 63 780 258 1101
No answer 6 160 27 193
Not applicable 0 13 2 15
Total 224 2781 796 3801
Position of HH members * Name of District Crosstabulation (With all cases)
Count
Name of District
Total Keo-
oudom Vangvieng Khong
Position of HH members
Farming 11 585 290 886
Others 16 202 32 250
Child/student/disable/old people 63 785 263 1111
Fishing 15 17 45 77
Livestock 0 44 22 66
Forest 3 19 11 33
Trade 45 346 54 445
Shop owner/house/Material for Rent 4 5 1 10
Labor on Farming/construction 37 215 22 274
Government staff 9 278 12 299
Enteprise/Private staff 15 74 9 98
Don't known 0 1 1 2
No answer 6 210 34 250
Total 224 2781 796 3801
Appendix 22
736
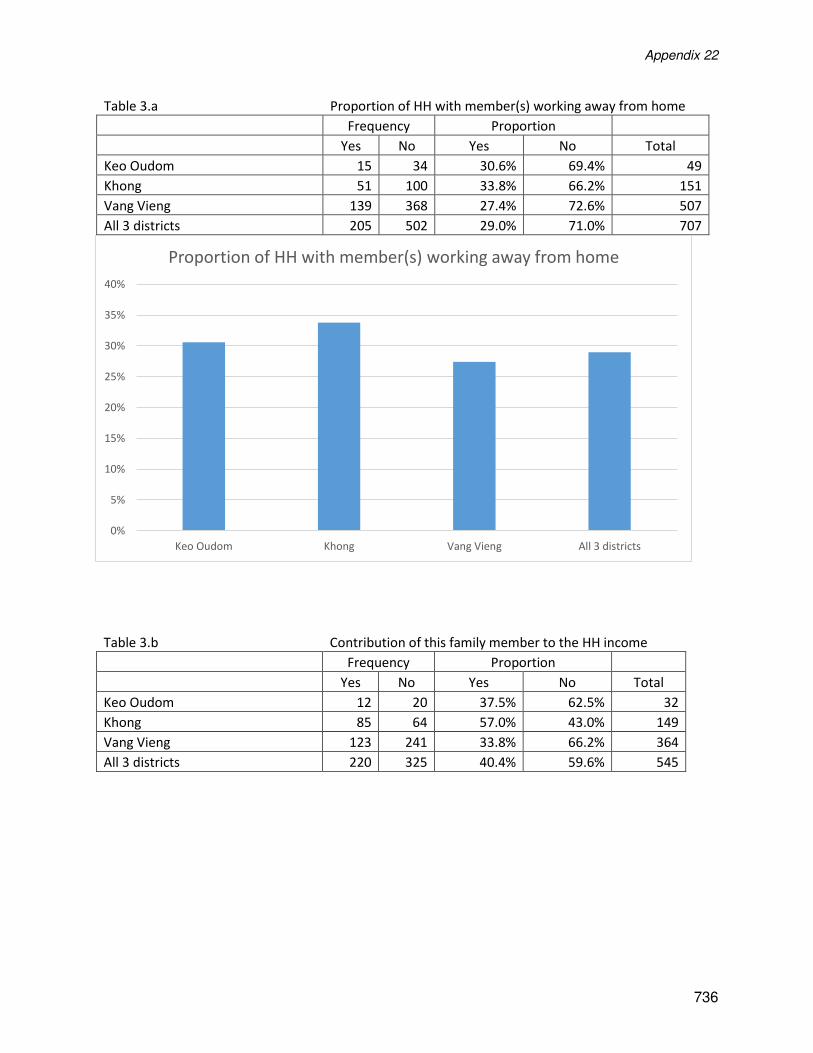
Table 3.a Proportion of HH with member(s) working away from home
Frequency Proportion
Yes No Yes No Total
Keo Oudom 15 34 30.6% 69.4% 49
Khong 51 100 33.8% 66.2% 151
Vang Vieng 139 368 27.4% 72.6% 507
All 3 districts 205 502 29.0% 71.0% 707
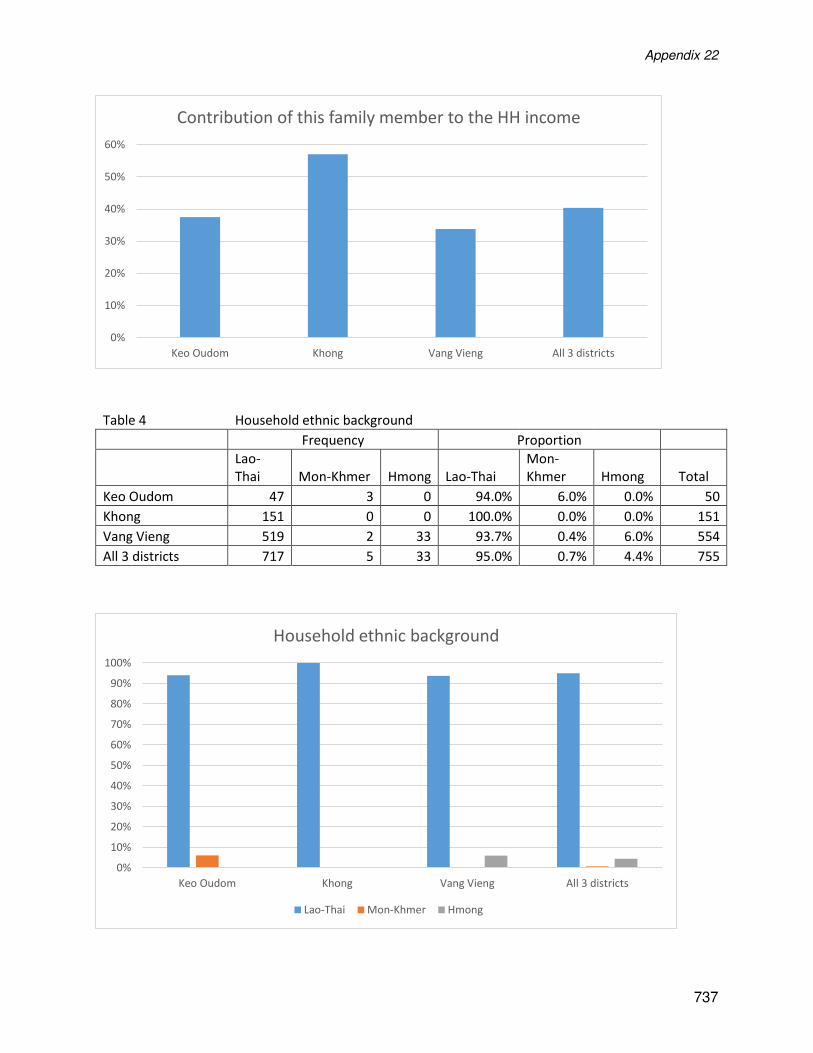
Table 3.b Contribution of this family member to the HH income
Frequency Proportion
Yes No Yes No Total
Keo Oudom 12 20 37.5% 62.5% 32
Khong 85 64 57.0% 43.0% 149
Vang Vieng 123 241 33.8% 66.2% 364
All 3 districts 220 325 40.4% 59.6% 545
0%
5%
10%
15%
20%
25%
30%
35%
40%
Keo Oudom Khong Vang Vieng All 3 districts
Proportion of HH with member(s) working away from home
Appendix 22
737
Table 4 Household ethnic background
Frequency Proportion
Lao-
Thai Mon-Khmer Hmong Lao-Thai
Mon-
Khmer Hmong Total
Keo Oudom 47 3 0 94.0% 6.0% 0.0% 50
Khong 151 0 0 100.0% 0.0% 0.0% 151
Vang Vieng 519 2 33 93.7% 0.4% 6.0% 554
All 3 districts 717 5 33 95.0% 0.7% 4.4% 755
0%
10%
20%
30%
40%
50%
60%
Keo Oudom Khong Vang Vieng All 3 districts
Contribution of this family member to the HH income
0%
10%
20%
30%
40%
50%
60%
70%
80%
90%
100%
Keo Oudom Khong Vang Vieng All 3 districts
Household ethnic background
Lao-Thai Mon-Khmer Hmong
Appendix 22
738
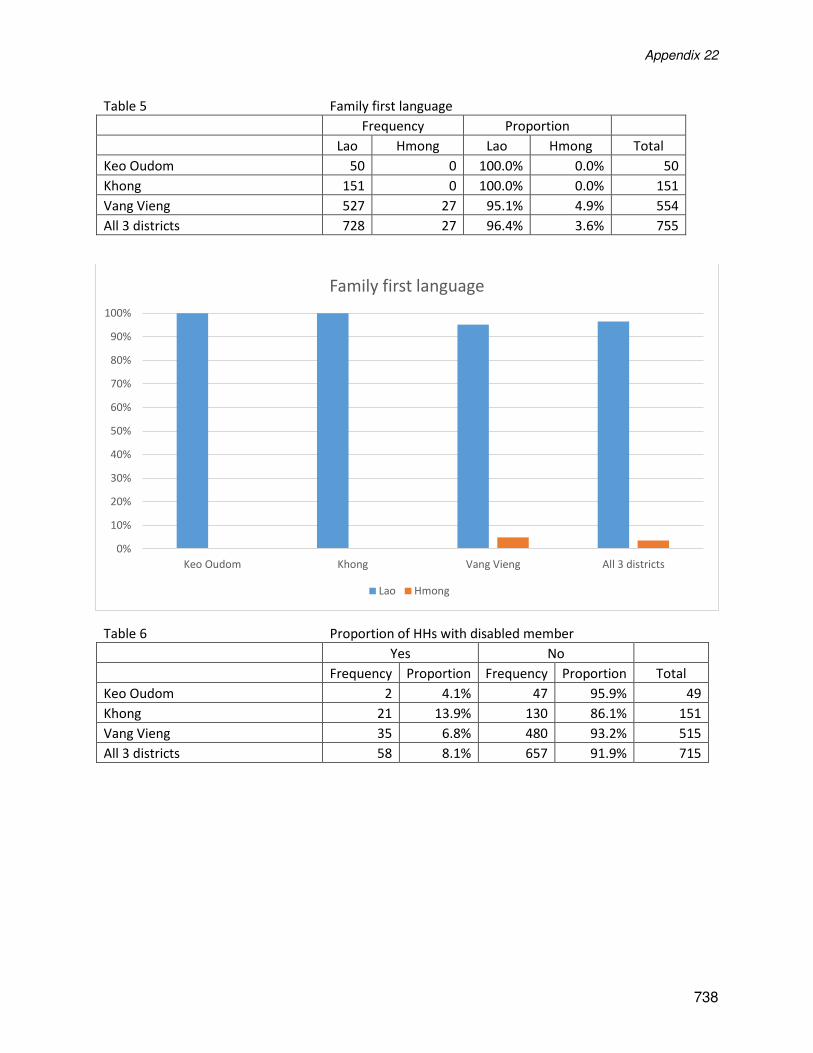
Table 5 Family first language
Frequency Proportion
Lao Hmong Lao Hmong Total
Keo Oudom 50 0 100.0% 0.0% 50
Khong 151 0 100.0% 0.0% 151
Vang Vieng 527 27 95.1% 4.9% 554
All 3 districts 728 27 96.4% 3.6% 755
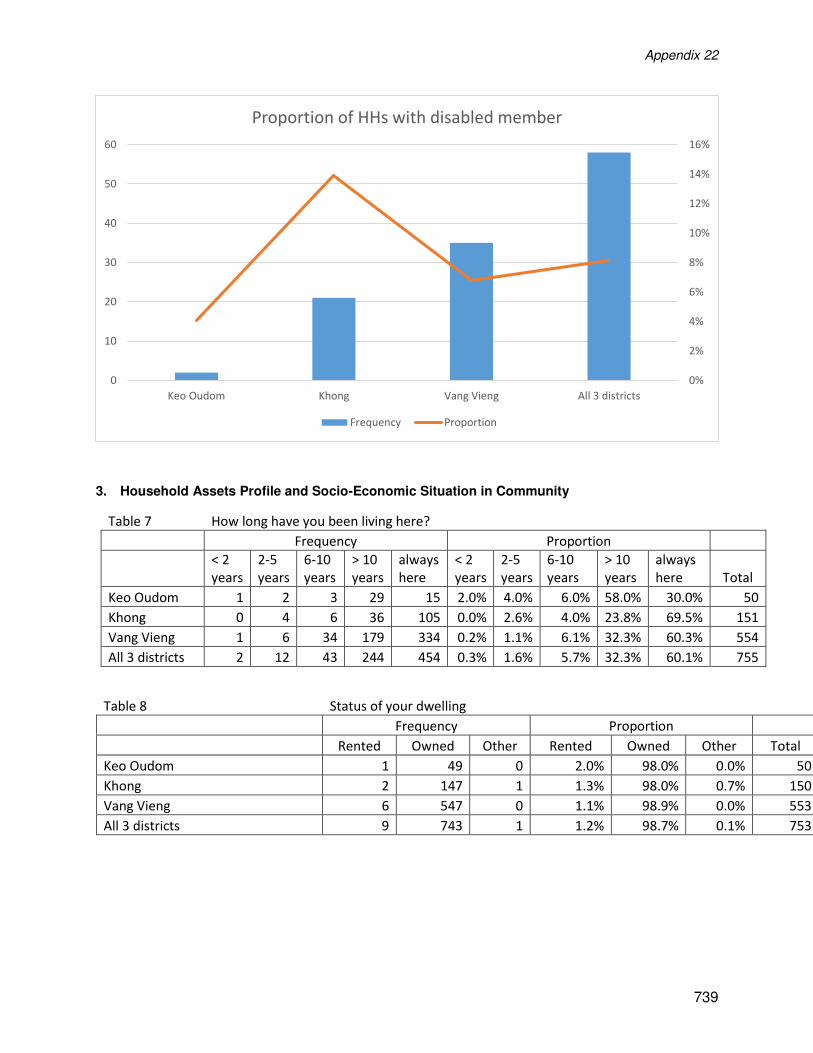
Table 6 Proportion of HHs with disabled member
Yes No
Frequency Proportion Frequency Proportion Total
Keo Oudom 2 4.1% 47 95.9% 49
Khong 21 13.9% 130 86.1% 151
Vang Vieng 35 6.8% 480 93.2% 515
All 3 districts 58 8.1% 657 91.9% 715
0%
10%
20%
30%
40%
50%
60%
70%
80%
90%
100%
Keo Oudom Khong Vang Vieng All 3 districts
Family first language
Lao Hmong
Appendix 22
739
3. Household Assets Profile and Socio-Economic Situation in Community
Table 7 How long have you been living here?
Frequency Proportion
< 2
years
2-5
years
6-10
years
> 10
years
always
here
< 2
years
2-5
years
6-10
years
> 10
years
always
here Total
Keo Oudom 1 2 3 29 15 2.0% 4.0% 6.0% 58.0% 30.0% 50
Khong 0 4 6 36 105 0.0% 2.6% 4.0% 23.8% 69.5% 151
Vang Vieng 1 6 34 179 334 0.2% 1.1% 6.1% 32.3% 60.3% 554
All 3 districts 2 12 43 244 454 0.3% 1.6% 5.7% 32.3% 60.1% 755
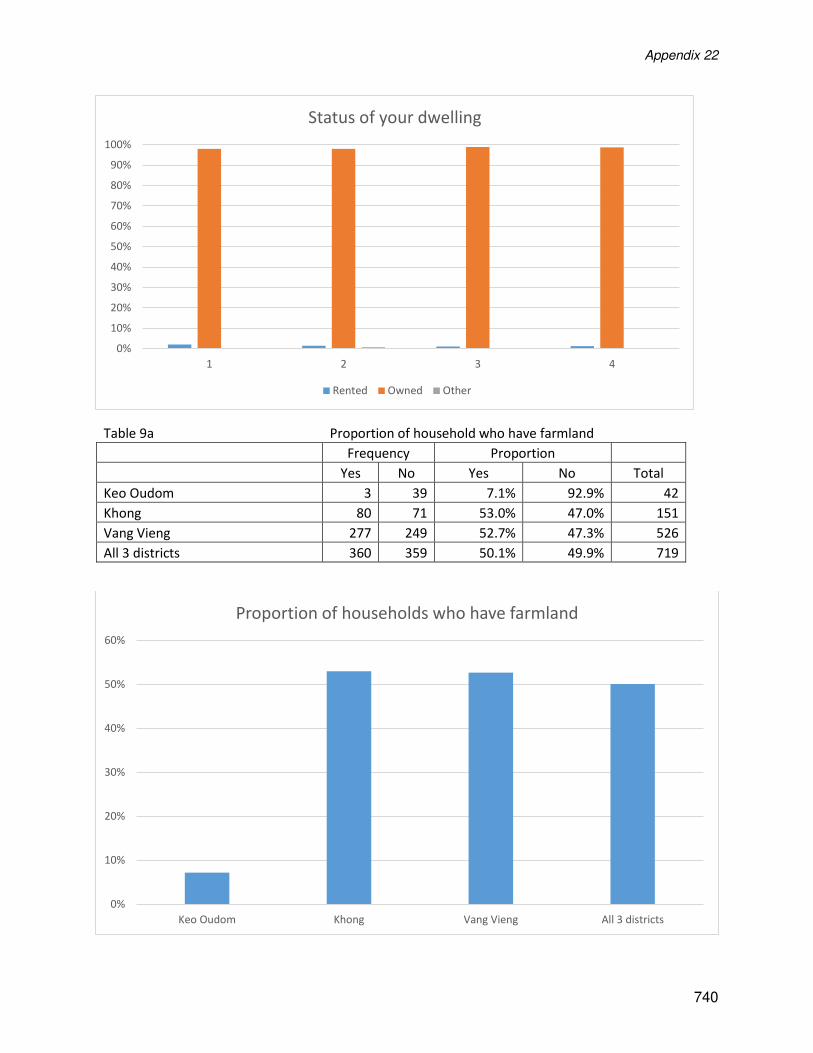
Table 8 Status of your dwelling
Frequency Proportion
Rented Owned Other Rented Owned Other Total
Keo Oudom 1 49 0 2.0% 98.0% 0.0% 50
Khong 2 147 1 1.3% 98.0% 0.7% 150
Vang Vieng 6 547 0 1.1% 98.9% 0.0% 553
All 3 districts 9 743 1 1.2% 98.7% 0.1% 753
0%
2%
4%
6%
8%
10%
12%
14%
16%
0
10
20
30
40
50
60
Keo Oudom Khong Vang Vieng All 3 districts
Proportion of HHs with disabled member
Frequency Proportion
Appendix 22
740
Table 9a Proportion of household who have farmland
Frequency Proportion
Yes No Yes No Total
Keo Oudom 3 39 7.1% 92.9% 42
Khong 80 71 53.0% 47.0% 151
Vang Vieng 277 249 52.7% 47.3% 526
All 3 districts 360 359 50.1% 49.9% 719
0%
10%
20%
30%
40%
50%
60%
70%
80%
90%
100%
1 2 3 4
Status of your dwelling
Rented Owned Other
0%
10%
20%
30%
40%
50%
60%
Keo Oudom Khong Vang Vieng All 3 districts
Proportion of households who have farmland
Appendix 22
741
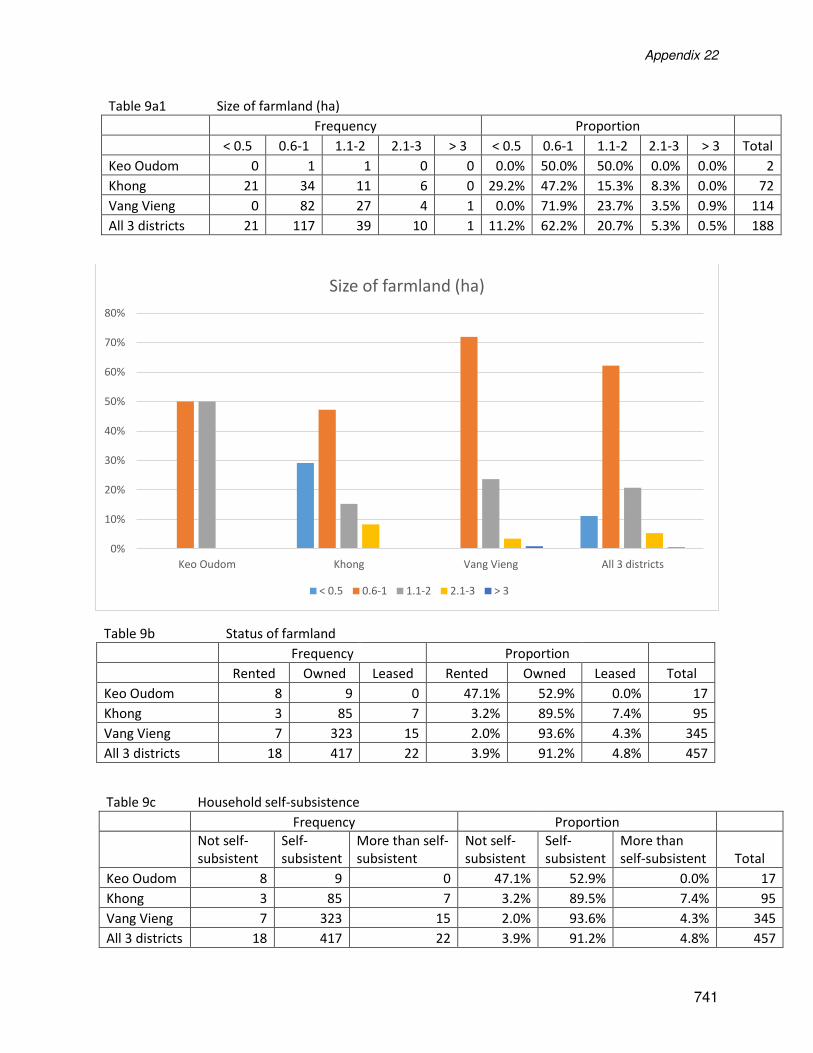
Table 9a1 Size of farmland (ha)
Frequency Proportion
< 0.5 0.6-1 1.1-2 2.1-3 > 3 < 0.5 0.6-1 1.1-2 2.1-3 > 3 Total
Keo Oudom 0 1 1 0 0 0.0% 50.0% 50.0% 0.0% 0.0% 2
Khong 21 34 11 6 0 29.2% 47.2% 15.3% 8.3% 0.0% 72
Vang Vieng 0 82 27 4 1 0.0% 71.9% 23.7% 3.5% 0.9% 114
All 3 districts 21 117 39 10 1 11.2% 62.2% 20.7% 5.3% 0.5% 188
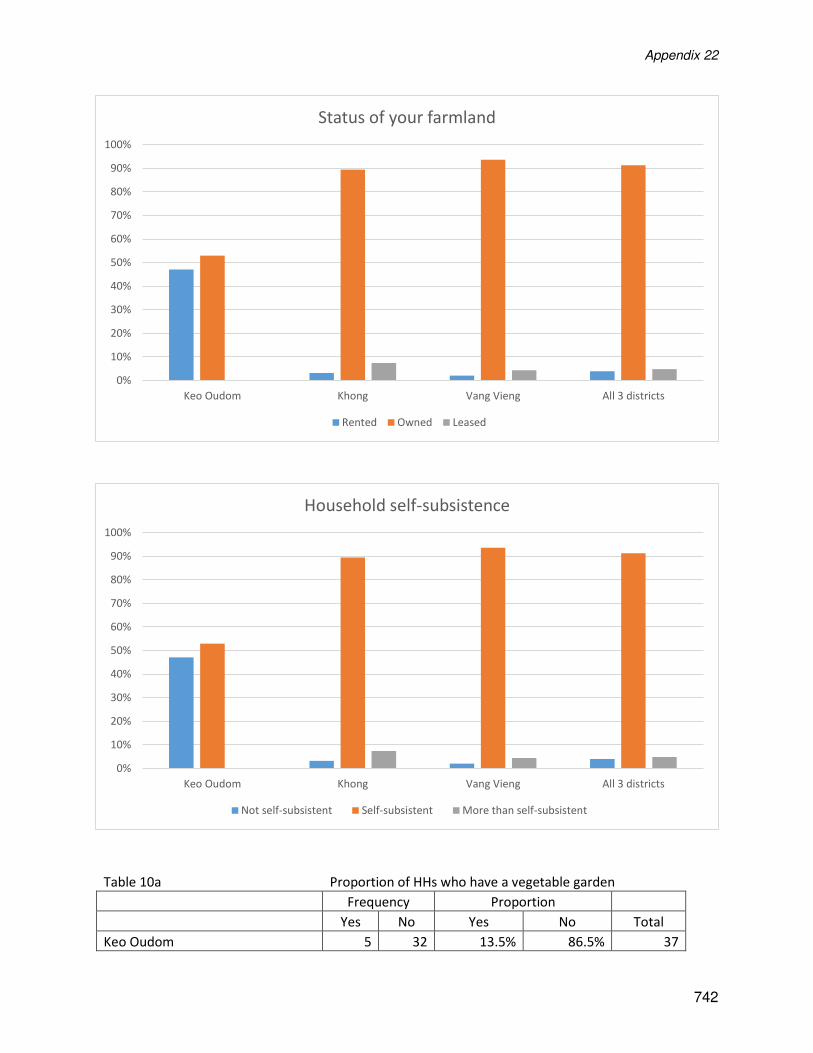
Table 9b Status of farmland
Frequency Proportion
Rented Owned Leased Rented Owned Leased Total
Keo Oudom 8 9 0 47.1% 52.9% 0.0% 17
Khong 3 85 7 3.2% 89.5% 7.4% 95
Vang Vieng 7 323 15 2.0% 93.6% 4.3% 345
All 3 districts 18 417 22 3.9% 91.2% 4.8% 457
Table 9c Household self-subsistence
Frequency Proportion
Not self-
subsistent
Self-
subsistent
More than self-
subsistent
Not self-
subsistent
Self-
subsistent
More than
self-subsistent Total
Keo Oudom 8 9 0 47.1% 52.9% 0.0% 17
Khong 3 85 7 3.2% 89.5% 7.4% 95
Vang Vieng 7 323 15 2.0% 93.6% 4.3% 345
All 3 districts 18 417 22 3.9% 91.2% 4.8% 457
0%
10%
20%
30%
40%
50%
60%
70%
80%
Keo Oudom Khong Vang Vieng All 3 districts
Size of farmland (ha)
< 0.5 0.6-1 1.1-2 2.1-3 > 3
Appendix 22
742
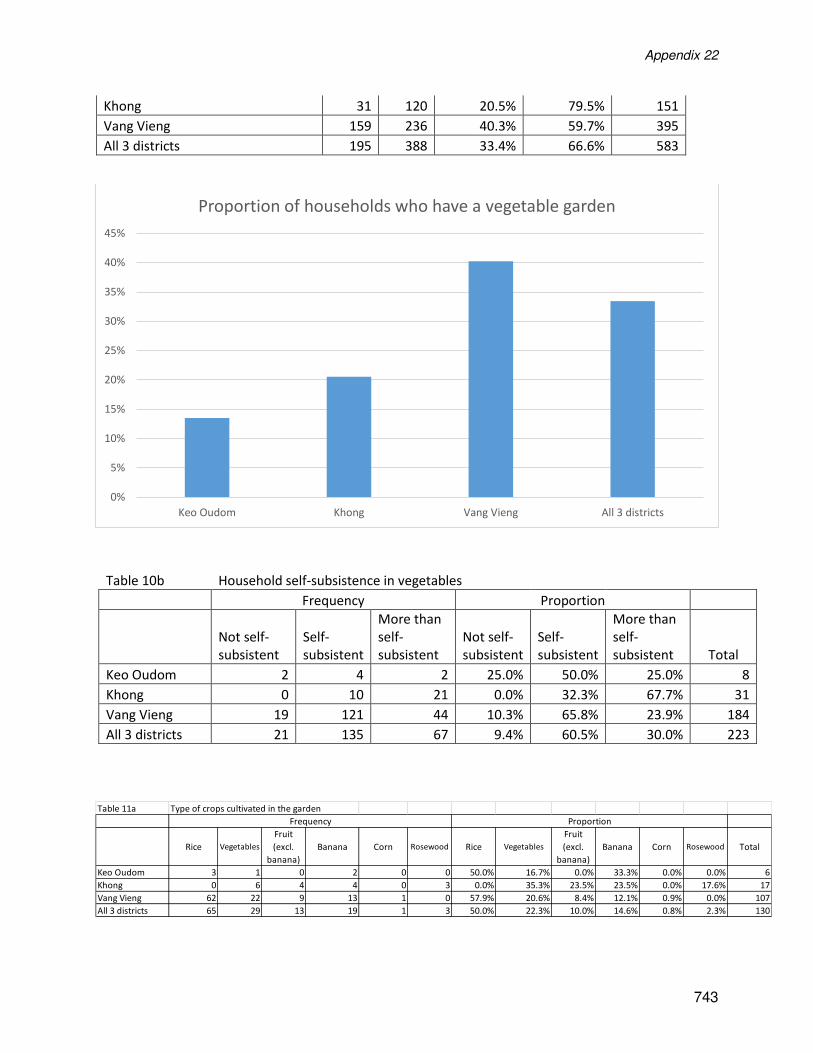
Table 10a Proportion of HHs who have a vegetable garden
Frequency Proportion
Yes No Yes No Total
Keo Oudom 5 32 13.5% 86.5% 37
0%
10%
20%
30%
40%
50%
60%
70%
80%
90%
100%
Keo Oudom Khong Vang Vieng All 3 districts
Status of your farmland
Rented Owned Leased
0%
10%
20%
30%
40%
50%
60%
70%
80%
90%
100%
Keo Oudom Khong Vang Vieng All 3 districts
Household self-subsistence
Not self-subsistent Self-subsistent More than self-subsistent
Appendix 22
743
Khong 31 120 20.5% 79.5% 151
Vang Vieng 159 236 40.3% 59.7% 395
All 3 districts 195 388 33.4% 66.6% 583
Table 10b Household self-subsistence in vegetables
Frequency Proportion
Not self-
subsistent
Self-
subsistent
More than
self-
subsistent
Not self-
subsistent
Self-
subsistent
More than
self-
subsistent Total
Keo Oudom 2 4 2 25.0% 50.0% 25.0% 8
Khong 0 10 21 0.0% 32.3% 67.7% 31
Vang Vieng 19 121 44 10.3% 65.8% 23.9% 184
All 3 districts 21 135 67 9.4% 60.5% 30.0% 223
0%
5%
10%
15%
20%
25%
30%
35%
40%
45%
Keo Oudom Khong Vang Vieng All 3 districts
Proportion of households who have a vegetable garden
Table 11a Type of crops cultivated in the garden
Rice Vegetables
Fruit
(excl.
banana)
Banana Corn Rosewood Rice Vegetables
Fruit
(excl.
banana)
Banana Corn Rosewood Total
Keo Oudom 3 1 0 2 0 0 50.0% 16.7% 0.0% 33.3% 0.0% 0.0% 6
Khong 0 6 4 4 0 3 0.0% 35.3% 23.5% 23.5% 0.0% 17.6% 17
Vang Vieng 62 22 9 13 1 0 57.9% 20.6% 8.4% 12.1% 0.9% 0.0% 107
All 3 districts 65 29 13 19 1 3 50.0% 22.3% 10.0% 14.6% 0.8% 2.3% 130
Frequency Proportion
Appendix 22
744
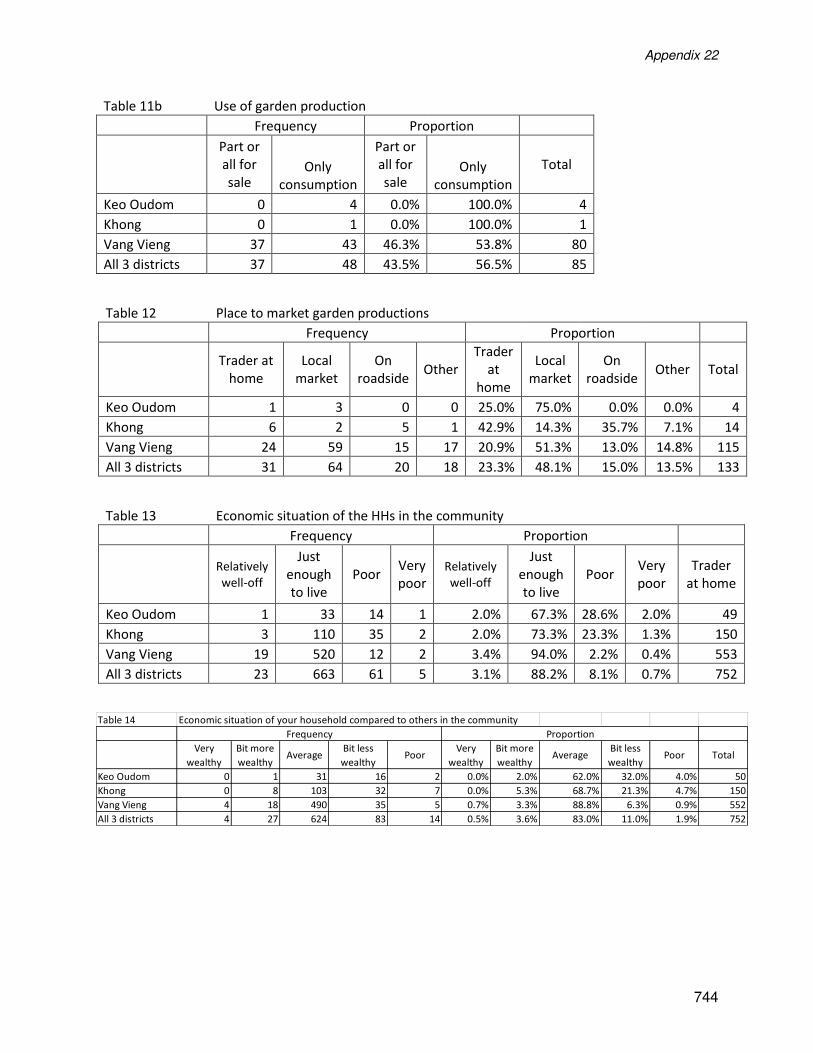
Table 11b Use of garden production
Frequency Proportion
Part or
all for
sale Only
consumption
Part or
all for
sale Only
consumption
Total
Keo Oudom 0 4 0.0% 100.0% 4
Khong 0 1 0.0% 100.0% 1
Vang Vieng 37 43 46.3% 53.8% 80
All 3 districts 37 48 43.5% 56.5% 85
Table 12 Place to market garden productions
Frequency Proportion
Trader at
home
Local
market
On
roadside Other
Trader
at
home
Local
market
On
roadside Other Total
Keo Oudom 1 3 0 0 25.0% 75.0% 0.0% 0.0% 4
Khong 6 2 5 1 42.9% 14.3% 35.7% 7.1% 14
Vang Vieng 24 59 15 17 20.9% 51.3% 13.0% 14.8% 115
All 3 districts 31 64 20 18 23.3% 48.1% 15.0% 13.5% 133
Table 13 Economic situation of the HHs in the community
Frequency Proportion
Relatively
well-off
Just
enough
to live
Poor Very
poor
Relatively
well-off
Just
enough
to live
Poor Very
poor
Trader
at home
Keo Oudom 1 33 14 1 2.0% 67.3% 28.6% 2.0% 49
Khong 3 110 35 2 2.0% 73.3% 23.3% 1.3% 150
Vang Vieng 19 520 12 2 3.4% 94.0% 2.2% 0.4% 553
All 3 districts 23 663 61 5 3.1% 88.2% 8.1% 0.7% 752
Table 14 Economic situation of your household compared to others in the community
Very
wealthy
Bit more
wealthyAverage
Bit less
wealthyPoor
Very
wealthy
Bit more
wealthyAverage
Bit less
wealthyPoor Total
Keo Oudom 0 1 31 16 2 0.0% 2.0% 62.0% 32.0% 4.0% 50
Khong 0 8 103 32 7 0.0% 5.3% 68.7% 21.3% 4.7% 150
Vang Vieng 4 18 490 35 5 0.7% 3.3% 88.8% 6.3% 0.9% 552
All 3 districts 4 27 624 83 14 0.5% 3.6% 83.0% 11.0% 1.9% 752
Frequency Proportion
Appendix 22
745
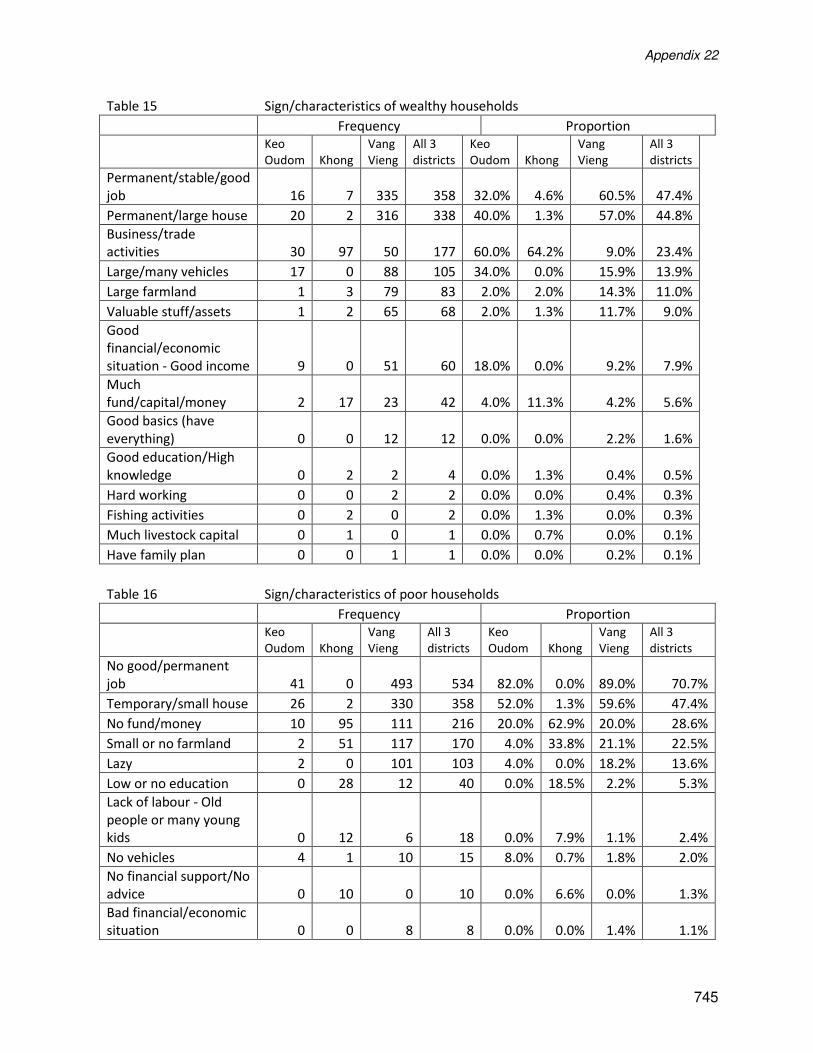
Table 15 Sign/characteristics of wealthy households
Frequency Proportion
Keo
Oudom Khong
Vang
Vieng
All 3
districts
Keo
Oudom Khong
Vang
Vieng
All 3
districts
Permanent/stable/good
job 16 7 335 358 32.0% 4.6% 60.5% 47.4%
Permanent/large house 20 2 316 338 40.0% 1.3% 57.0% 44.8%
Business/trade
activities 30 97 50 177 60.0% 64.2% 9.0% 23.4%
Large/many vehicles 17 0 88 105 34.0% 0.0% 15.9% 13.9%
Large farmland 1 3 79 83 2.0% 2.0% 14.3% 11.0%
Valuable stuff/assets 1 2 65 68 2.0% 1.3% 11.7% 9.0%
Good
financial/economic
situation - Good income 9 0 51 60 18.0% 0.0% 9.2% 7.9%
Much
fund/capital/money 2 17 23 42 4.0% 11.3% 4.2% 5.6%
Good basics (have
everything) 0 0 12 12 0.0% 0.0% 2.2% 1.6%
Good education/High
knowledge 0 2 2 4 0.0% 1.3% 0.4% 0.5%
Hard working 0 0 2 2 0.0% 0.0% 0.4% 0.3%
Fishing activities 0 2 0 2 0.0% 1.3% 0.0% 0.3%
Much livestock capital 0 1 0 1 0.0% 0.7% 0.0% 0.1%
Have family plan 0 0 1 1 0.0% 0.0% 0.2% 0.1%
Table 16 Sign/characteristics of poor households
Frequency Proportion
Keo
Oudom Khong
Vang
Vieng
All 3
districts
Keo
Oudom Khong
Vang
Vieng
All 3
districts
No good/permanent
job 41 0 493 534 82.0% 0.0% 89.0% 70.7%
Temporary/small house 26 2 330 358 52.0% 1.3% 59.6% 47.4%
No fund/money 10 95 111 216 20.0% 62.9% 20.0% 28.6%
Small or no farmland 2 51 117 170 4.0% 33.8% 21.1% 22.5%
Lazy 2 0 101 103 4.0% 0.0% 18.2% 13.6%
Low or no education 0 28 12 40 0.0% 18.5% 2.2% 5.3%
Lack of labour - Old
people or many young
kids 0 12 6 18 0.0% 7.9% 1.1% 2.4%
No vehicles 4 1 10 15 8.0% 0.7% 1.8% 2.0%
No financial support/No
advice 0 10 0 10 0.0% 6.6% 0.0% 1.3%
Bad financial/economic
situation 0 0 8 8 0.0% 0.0% 1.4% 1.1%
Appendix 22
746
No business activities 0 3 0 3 0.0% 2.0% 0.0% 0.4%
Family recently settled 0 0 3 3 0.0% 0.0% 0.5% 0.4%
Selfish 0 0 2 2 0.0% 0.0% 0.4% 0.3%
No head of family 0 1 0 1 0.0% 0.7% 0.0% 0.1%
Rented land 0 1 0 1 0.0% 0.7% 0.0% 0.1%
Lifestyle 1 0 0 1 2.0% 0.0% 0.0% 0.1%
4. Access to Mobility and Telecommunications
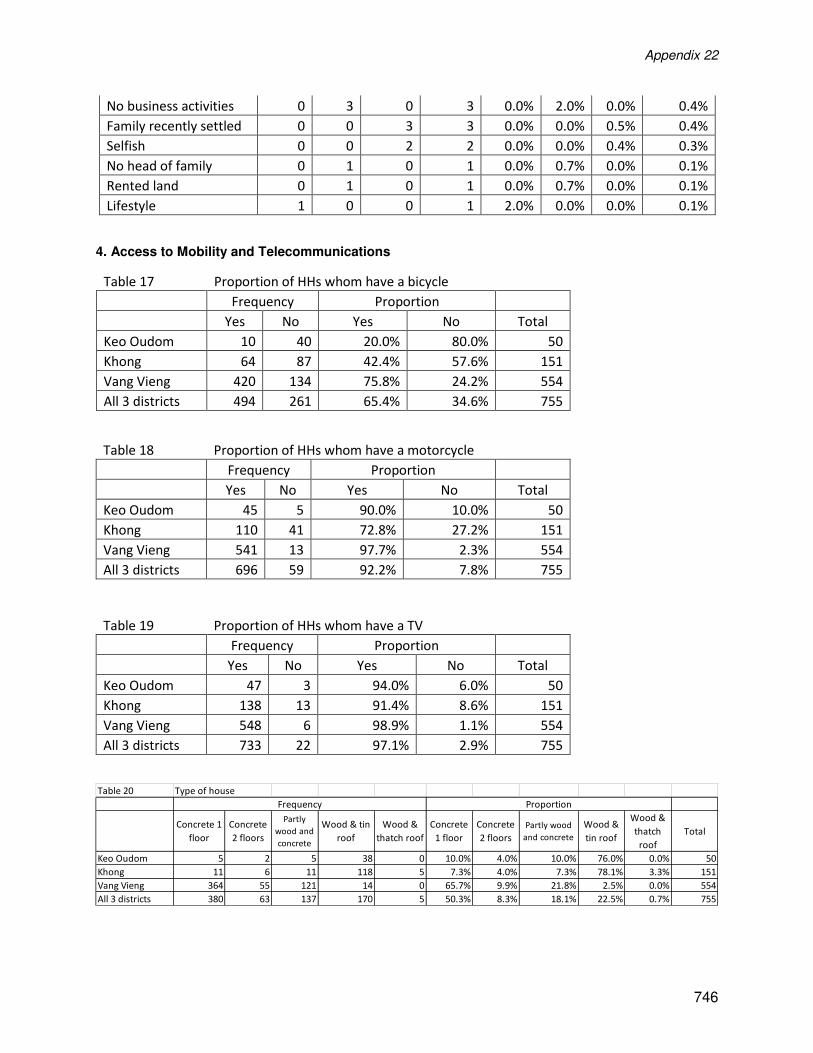
Table 17 Proportion of HHs whom have a bicycle
Frequency Proportion
Yes No Yes No Total
Keo Oudom 10 40 20.0% 80.0% 50
Khong 64 87 42.4% 57.6% 151
Vang Vieng 420 134 75.8% 24.2% 554
All 3 districts 494 261 65.4% 34.6% 755
Table 18 Proportion of HHs whom have a motorcycle
Frequency Proportion
Yes No Yes No Total
Keo Oudom 45 5 90.0% 10.0% 50
Khong 110 41 72.8% 27.2% 151
Vang Vieng 541 13 97.7% 2.3% 554
All 3 districts 696 59 92.2% 7.8% 755
Table 19 Proportion of HHs whom have a TV
Frequency Proportion
Yes No Yes No Total
Keo Oudom 47 3 94.0% 6.0% 50
Khong 138 13 91.4% 8.6% 151
Vang Vieng 548 6 98.9% 1.1% 554
All 3 districts 733 22 97.1% 2.9% 755
Table 20 Type of house
Concrete 1
floor
Concrete
2 floors
Partly
wood and
concrete
Wood & tin
roof
Wood &
thatch roof
Concrete
1 floor
Concrete
2 floors
Partly wood
and concrete
Wood &
tin roof
Wood &
thatch
roof
Total
Keo Oudom 5 2 5 38 0 10.0% 4.0% 10.0% 76.0% 0.0% 50
Khong 11 6 11 118 5 7.3% 4.0% 7.3% 78.1% 3.3% 151
Vang Vieng 364 55 121 14 0 65.7% 9.9% 21.8% 2.5% 0.0% 554
All 3 districts 380 63 137 170 5 50.3% 8.3% 18.1% 22.5% 0.7% 755
ProportionFrequency
Appendix 22
747
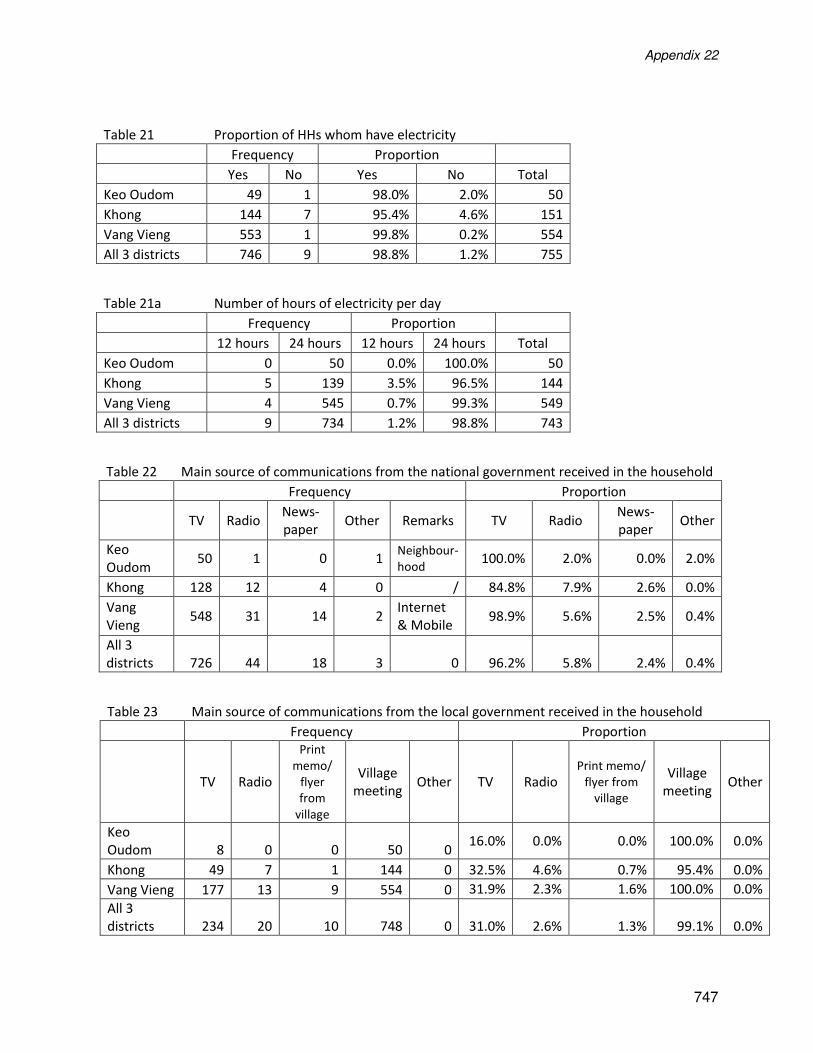
Table 21 Proportion of HHs whom have electricity
Frequency Proportion
Yes No Yes No Total
Keo Oudom 49 1 98.0% 2.0% 50
Khong 144 7 95.4% 4.6% 151
Vang Vieng 553 1 99.8% 0.2% 554
All 3 districts 746 9 98.8% 1.2% 755
Table 21a Number of hours of electricity per day
Frequency Proportion
12 hours 24 hours 12 hours 24 hours Total
Keo Oudom 0 50 0.0% 100.0% 50
Khong 5 139 3.5% 96.5% 144
Vang Vieng 4 545 0.7% 99.3% 549
All 3 districts 9 734 1.2% 98.8% 743
Table 22 Main source of communications from the national government received in the household
Frequency Proportion
TV Radio
News-
paper Other Remarks TV Radio
News-
paper Other
Keo
Oudom 50 1 0 1
Neighbour-
hood 100.0% 2.0% 0.0% 2.0%
Khong 128 12 4 0 / 84.8% 7.9% 2.6% 0.0%
Vang
Vieng 548 31 14 2
Internet
& Mobile 98.9% 5.6% 2.5% 0.4%
All 3
districts 726 44 18 3 0 96.2% 5.8% 2.4% 0.4%
Table 23 Main source of communications from the local government received in the household
Frequency Proportion
TV Radio
memo/
flyer
from
village
Village
meeting Other TV Radio
Print memo/
flyer from
village
Village
meeting Other
Keo
Oudom 8 0 0 50 0 16.0% 0.0% 0.0% 100.0% 0.0%
Khong 49 7 1 144 0 32.5% 4.6% 0.7% 95.4% 0.0%
Vang Vieng 177 13 9 554 0 31.9% 2.3% 1.6% 100.0% 0.0%
All 3
districts 234 20 10 748 0 31.0% 2.6% 1.3% 99.1% 0.0%
Appendix 22
748
5. Access to Health
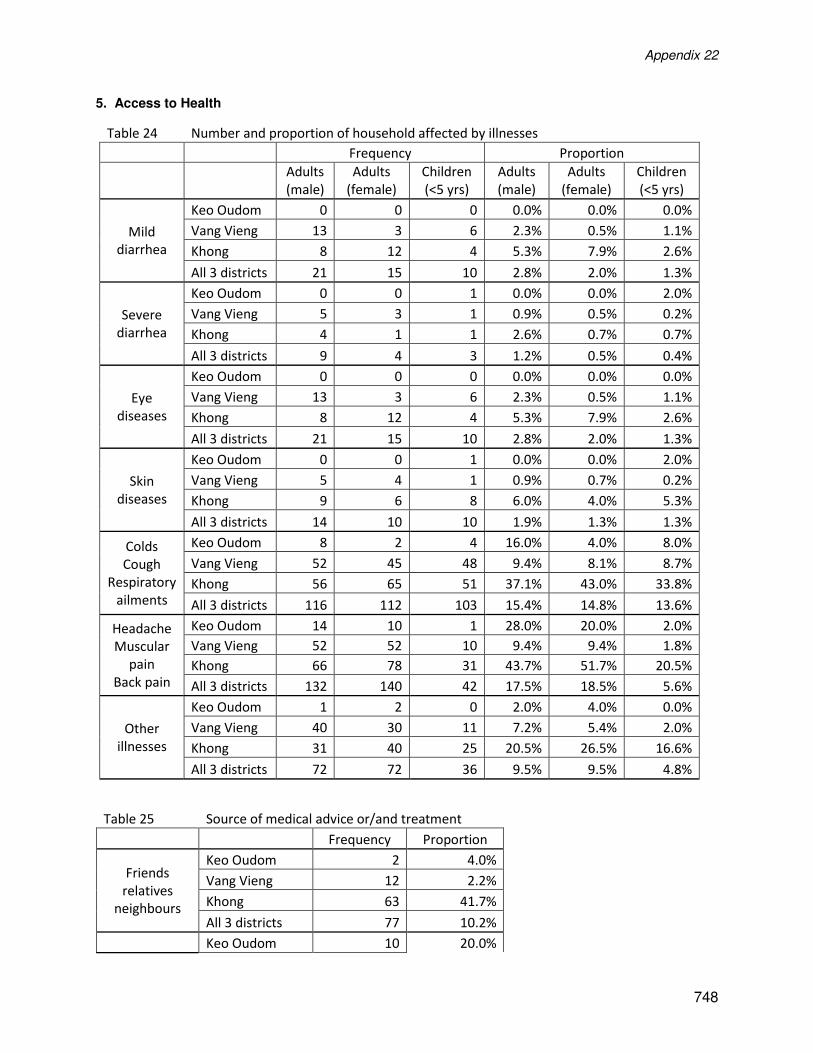
Table 24 Number and proportion of household affected by illnesses
Frequency Proportion
Adults
(male)
Adults
(female)
Children
(<5 yrs)
Adults
(male)
Adults
(female)
Children
(<5 yrs)
Mild
diarrhea
Keo Oudom 0 0 0 0.0% 0.0% 0.0%
Vang Vieng 13 3 6 2.3% 0.5% 1.1%
Khong 8 12 4 5.3% 7.9% 2.6%
All 3 districts 21 15 10 2.8% 2.0% 1.3%
Severe
diarrhea
Keo Oudom 0 0 1 0.0% 0.0% 2.0%
Vang Vieng 5 3 1 0.9% 0.5% 0.2%
Khong 4 1 1 2.6% 0.7% 0.7%
All 3 districts 9 4 3 1.2% 0.5% 0.4%
Eye
diseases
Keo Oudom 0 0 0 0.0% 0.0% 0.0%
Vang Vieng 13 3 6 2.3% 0.5% 1.1%
Khong 8 12 4 5.3% 7.9% 2.6%
All 3 districts 21 15 10 2.8% 2.0% 1.3%
Skin
diseases
Keo Oudom 0 0 1 0.0% 0.0% 2.0%
Vang Vieng 5 4 1 0.9% 0.7% 0.2%
Khong 9 6 8 6.0% 4.0% 5.3%
All 3 districts 14 10 10 1.9% 1.3% 1.3%
Colds
Cough
Respiratory
ailments
Keo Oudom 8 2 4 16.0% 4.0% 8.0%
Vang Vieng 52 45 48 9.4% 8.1% 8.7%
Khong 56 65 51 37.1% 43.0% 33.8%
All 3 districts 116 112 103 15.4% 14.8% 13.6%
Headache
Muscular
pain
Back pain
Keo Oudom 14 10 1 28.0% 20.0% 2.0%
Vang Vieng 52 52 10 9.4% 9.4% 1.8%
Khong 66 78 31 43.7% 51.7% 20.5%
All 3 districts 132 140 42 17.5% 18.5% 5.6%
Other
illnesses
Keo Oudom 1 2 0 2.0% 4.0% 0.0%
Vang Vieng 40 30 11 7.2% 5.4% 2.0%
Khong 31 40 25 20.5% 26.5% 16.6%
All 3 districts 72 72 36 9.5% 9.5% 4.8%
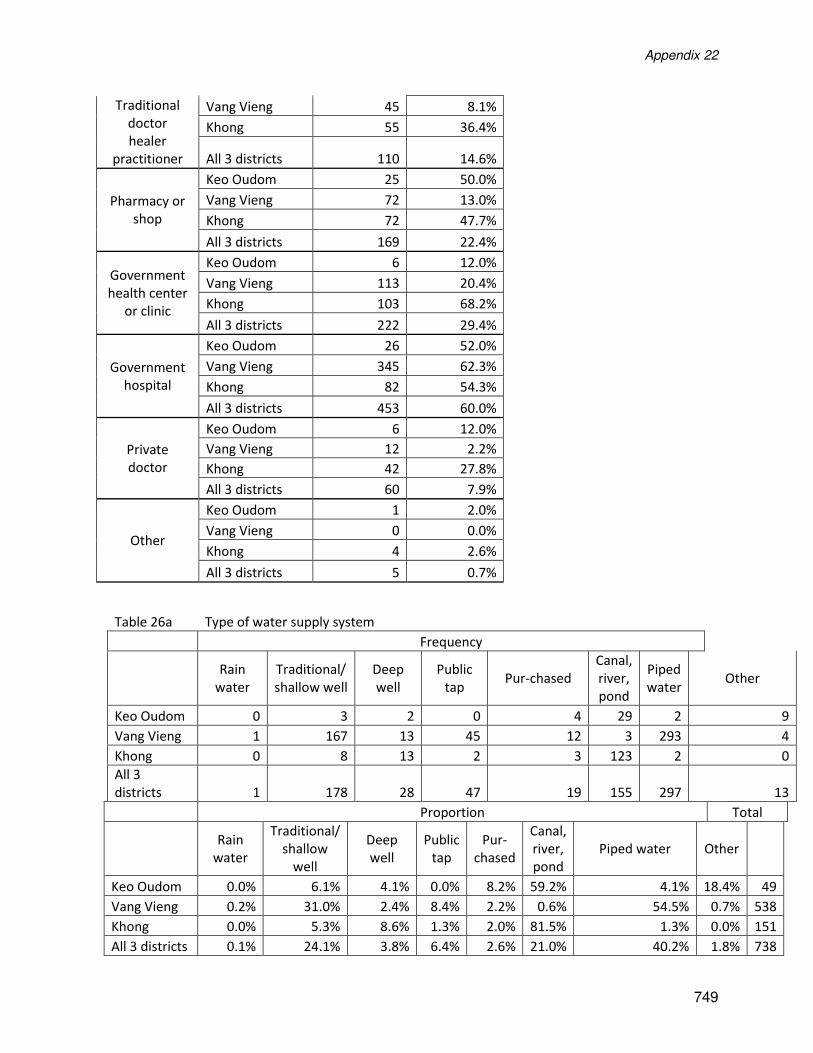
Table 25 Source of medical advice or/and treatment
Frequency Proportion
Friends
relatives
neighbours
Keo Oudom 2 4.0%
Vang Vieng 12 2.2%
Khong 63 41.7%
All 3 districts 77 10.2%
Keo Oudom 10 20.0%
Appendix 22
749
Traditional
doctor
healer
practitioner
Vang Vieng 45 8.1%
Khong 55 36.4%
All 3 districts 110 14.6%
Pharmacy or
shop
Keo Oudom 25 50.0%
Vang Vieng 72 13.0%
Khong 72 47.7%
All 3 districts 169 22.4%
Government
health center
or clinic
Keo Oudom 6 12.0%
Vang Vieng 113 20.4%
Khong 103 68.2%
All 3 districts 222 29.4%
Government
hospital
Keo Oudom 26 52.0%
Vang Vieng 345 62.3%
Khong 82 54.3%
All 3 districts 453 60.0%
Private
doctor
Keo Oudom 6 12.0%
Vang Vieng 12 2.2%
Khong 42 27.8%
All 3 districts 60 7.9%
Other
Keo Oudom 1 2.0%
Vang Vieng 0 0.0%
Khong 4 2.6%
All 3 districts 5 0.7%
Table 26a Type of water supply system
Frequency
Rain
water
Traditional/
shallow well
Deep
well
Public
tap Pur-chased
Canal,
river,
pond
Piped
water Other
Keo Oudom 0 3 2 0 4 29 2 9
Vang Vieng 1 167 13 45 12 3 293 4
Khong 0 8 13 2 3 123 2 0
All 3
districts 1 178 28 47 19 155 297 13
Proportion Total
Rain
water
Traditional/
shallow
well
Deep
well
Public
tap
Pur-
chased
Canal,
river,
pond
Piped water Other
Keo Oudom 0.0% 6.1% 4.1% 0.0% 8.2% 59.2% 4.1% 18.4% 49
Vang Vieng 0.2% 31.0% 2.4% 8.4% 2.2% 0.6% 54.5% 0.7% 538
Khong 0.0% 5.3% 8.6% 1.3% 2.0% 81.5% 1.3% 0.0% 151
All 3 districts 0.1% 24.1% 3.8% 6.4% 2.6% 21.0% 40.2% 1.8% 738
Appendix 22
750
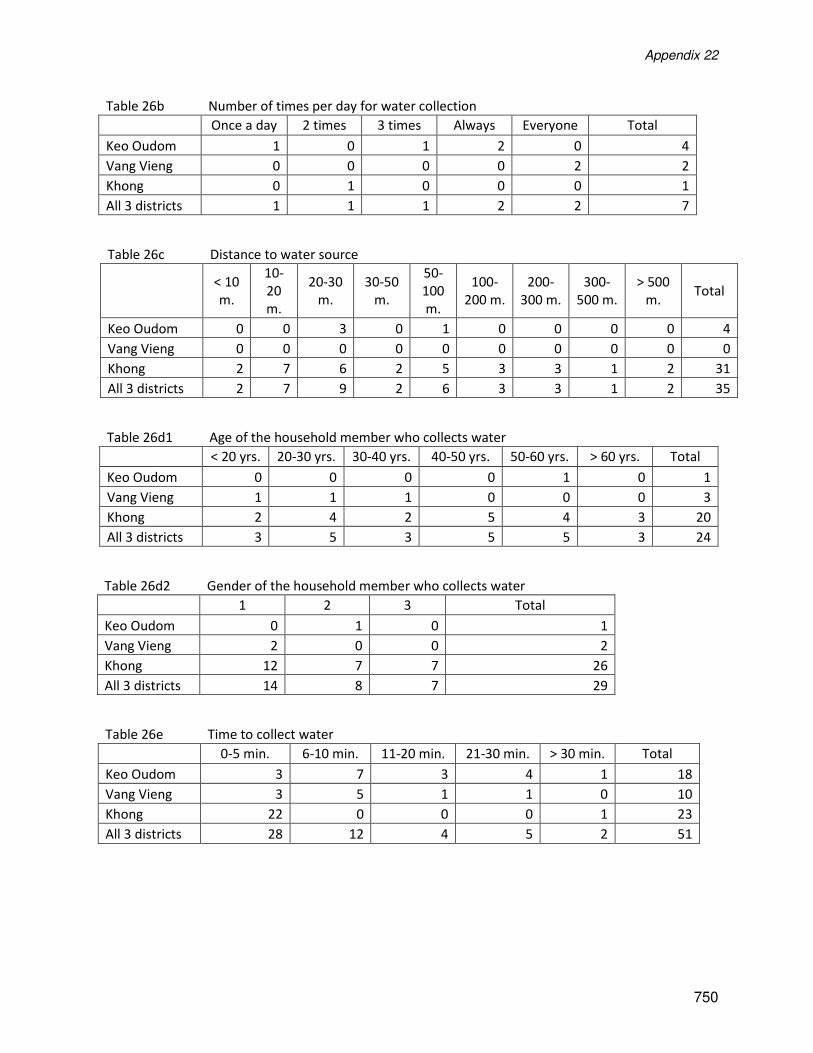
Table 26b Number of times per day for water collection
Once a day 2 times 3 times Always Everyone Total
Keo Oudom 1 0 1 2 0 4
Vang Vieng 0 0 0 0 2 2
Khong 0 1 0 0 0 1
All 3 districts 1 1 1 2 2 7
Table 26c Distance to water source
< 10
m.
10-
20
m.
20-30
m.
30-50
m.
50-
100
m.
100-
200 m.
200-
300 m.
300-
500 m.
> 500
m. Total
Keo Oudom 0 0 3 0 1 0 0 0 0 4
Vang Vieng 0 0 0 0 0 0 0 0 0 0
Khong 2 7 6 2 5 3 3 1 2 31
All 3 districts 2 7 9 2 6 3 3 1 2 35
Table 26d1 Age of the household member who collects water
< 20 yrs. 20-30 yrs. 30-40 yrs. 40-50 yrs. 50-60 yrs. > 60 yrs. Total
Keo Oudom 0 0 0 0 1 0 1
Vang Vieng 1 1 1 0 0 0 3
Khong 2 4 2 5 4 3 20
All 3 districts 3 5 3 5 5 3 24
Table 26d2 Gender of the household member who collects water
1 2 3 Total
Keo Oudom 0 1 0 1
Vang Vieng 2 0 0 2
Khong 12 7 7 26
All 3 districts 14 8 7 29
Table 26e Time to collect water
0-5 min. 6-10 min. 11-20 min. 21-30 min. > 30 min. Total
Keo Oudom 3 7 3 4 1 18
Vang Vieng 3 5 1 1 0 10
Khong 22 0 0 0 1 23
All 3 districts 28 12 4 5 2 51
Appendix 22
751
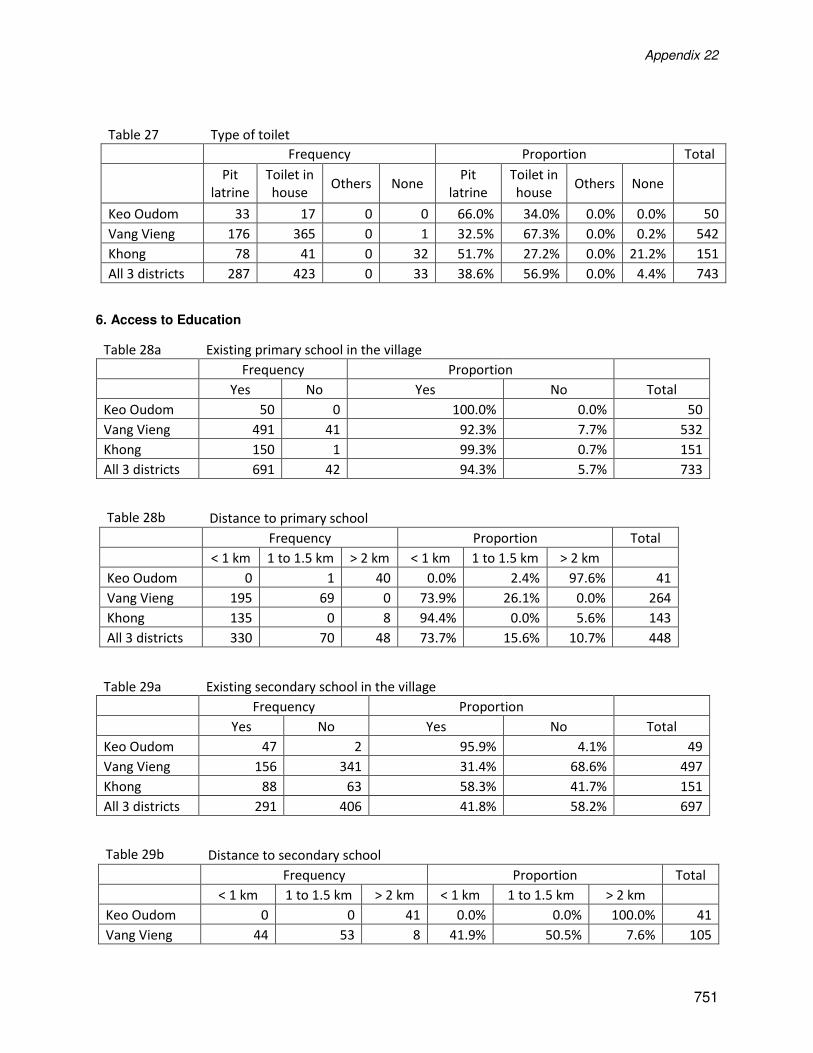
Table 27 Type of toilet
Frequency Proportion Total
Pit
latrine
Toilet in
house Others None
Pit
latrine
Toilet in
house Others None
Keo Oudom 33 17 0 0 66.0% 34.0% 0.0% 0.0% 50
Vang Vieng 176 365 0 1 32.5% 67.3% 0.0% 0.2% 542
Khong 78 41 0 32 51.7% 27.2% 0.0% 21.2% 151
All 3 districts 287 423 0 33 38.6% 56.9% 0.0% 4.4% 743
6. Access to Education
Table 28a Existing primary school in the village
Frequency Proportion
Yes No Yes No Total
Keo Oudom 50 0 100.0% 0.0% 50
Vang Vieng 491 41 92.3% 7.7% 532
Khong 150 1 99.3% 0.7% 151
All 3 districts 691 42 94.3% 5.7% 733
Table 28b Distance to primary school
Frequency Proportion Total
< 1 km 1 to 1.5 km > 2 km < 1 km 1 to 1.5 km > 2 km
Keo Oudom 0 1 40 0.0% 2.4% 97.6% 41
Vang Vieng 195 69 0 73.9% 26.1% 0.0% 264
Khong 135 0 8 94.4% 0.0% 5.6% 143
All 3 districts 330 70 48 73.7% 15.6% 10.7% 448
Table 29a Existing secondary school in the village
Frequency Proportion
Yes No Yes No Total
Keo Oudom 47 2 95.9% 4.1% 49
Vang Vieng 156 341 31.4% 68.6% 497
Khong 88 63 58.3% 41.7% 151
All 3 districts 291 406 41.8% 58.2% 697
Table 29b Distance to secondary school
Frequency Proportion Total
< 1 km 1 to 1.5 km > 2 km < 1 km 1 to 1.5 km > 2 km
Keo Oudom 0 0 41 0.0% 0.0% 100.0% 41
Vang Vieng 44 53 8 41.9% 50.5% 7.6% 105
Appendix 22
752
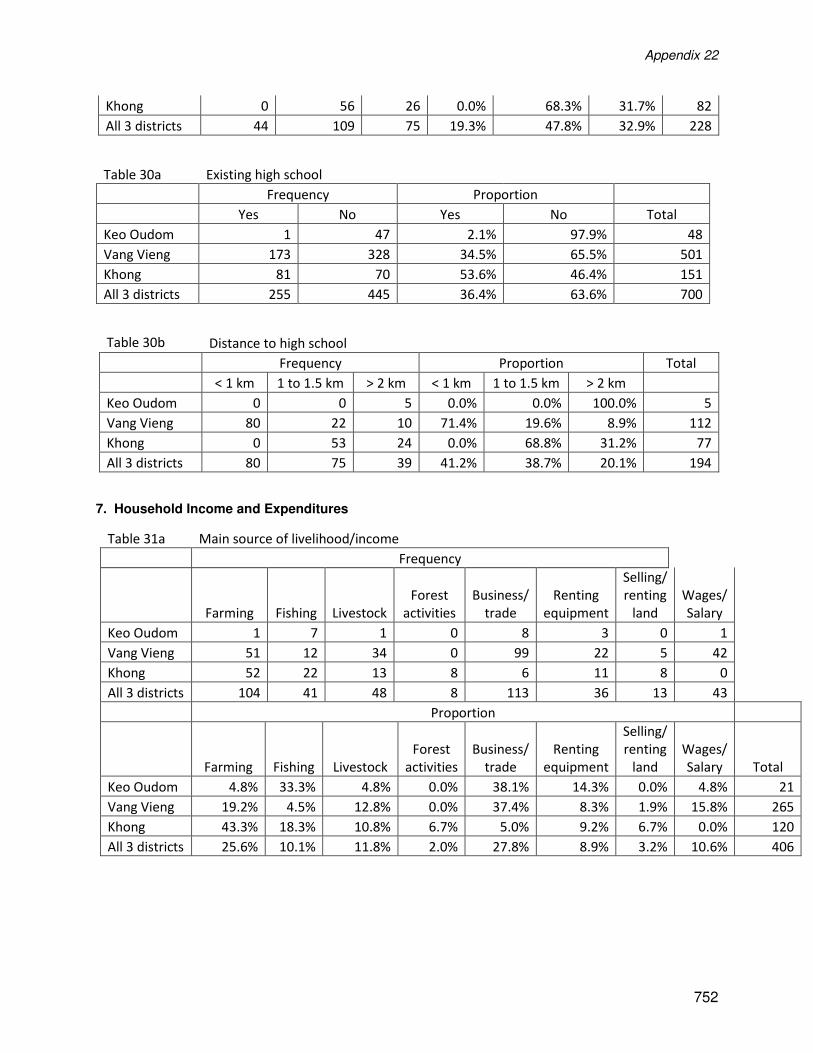
Khong 0 56 26 0.0% 68.3% 31.7% 82
All 3 districts 44 109 75 19.3% 47.8% 32.9% 228
Table 30a Existing high school
Frequency Proportion
Yes No Yes No Total
Keo Oudom 1 47 2.1% 97.9% 48
Vang Vieng 173 328 34.5% 65.5% 501
Khong 81 70 53.6% 46.4% 151
All 3 districts 255 445 36.4% 63.6% 700
Table 30b Distance to high school
Frequency Proportion Total
< 1 km 1 to 1.5 km > 2 km < 1 km 1 to 1.5 km > 2 km
Keo Oudom 0 0 5 0.0% 0.0% 100.0% 5
Vang Vieng 80 22 10 71.4% 19.6% 8.9% 112
Khong 0 53 24 0.0% 68.8% 31.2% 77
All 3 districts 80 75 39 41.2% 38.7% 20.1% 194
7. Household Income and Expenditures
Table 31a Main source of livelihood/income
Frequency
Farming Fishing Livestock
Forest
activities
Business/
trade
Renting
equipment
Selling/
renting
land
Wages/
Salary
Keo Oudom 1 7 1 0 8 3 0 1
Vang Vieng 51 12 34 0 99 22 5 42
Khong 52 22 13 8 6 11 8 0
All 3 districts 104 41 48 8 113 36 13 43
Proportion
Farming Fishing Livestock
Forest
activities
Business/
trade
Renting
equipment
Selling/
renting
land
Wages/
Salary Total
Keo Oudom 4.8% 33.3% 4.8% 0.0% 38.1% 14.3% 0.0% 4.8% 21
Vang Vieng 19.2% 4.5% 12.8% 0.0% 37.4% 8.3% 1.9% 15.8% 265
Khong 43.3% 18.3% 10.8% 6.7% 5.0% 9.2% 6.7% 0.0% 120
All 3 districts 25.6% 10.1% 11.8% 2.0% 27.8% 8.9% 3.2% 10.6% 406
Appendix 22
753
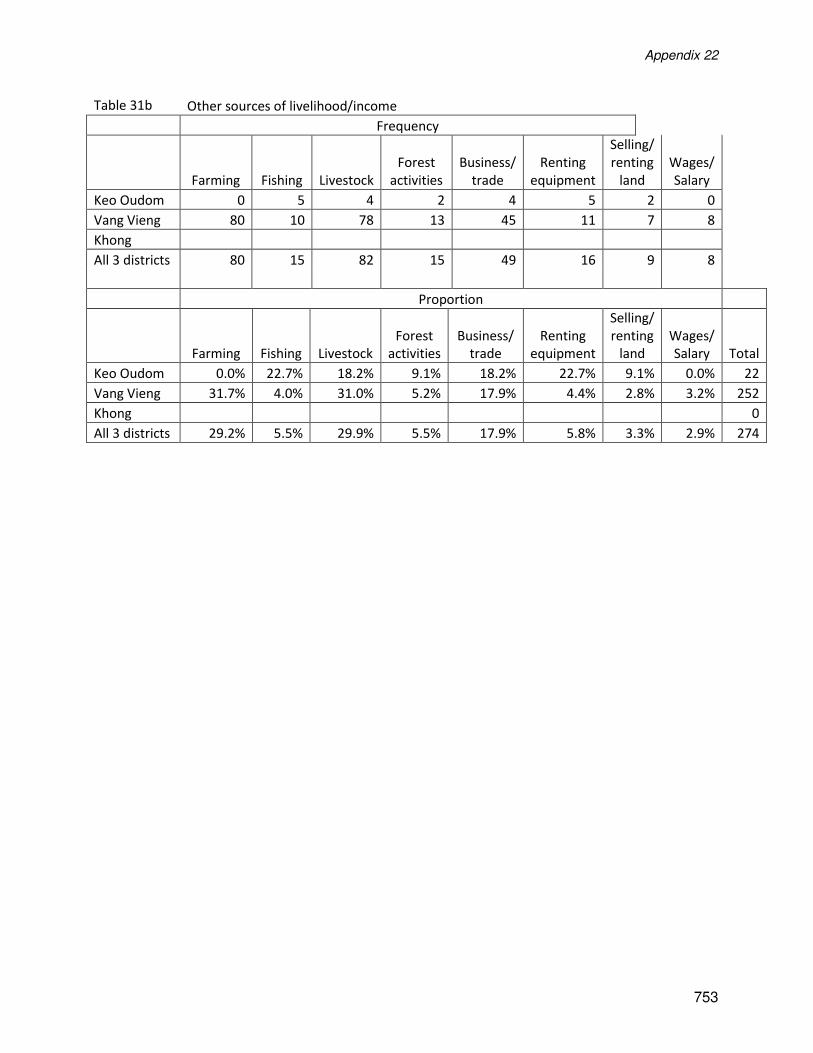
Table 31b Other sources of livelihood/income
Frequency
Farming Fishing Livestock
Forest
activities
Business/
trade
Renting
equipment
Selling/
renting
land
Wages/
Salary
Keo Oudom 0 5 4 2 4 5 2 0
Vang Vieng 80 10 78 13 45 11 7 8
Khong
All 3 districts 80 15 82 15 49 16 9 8
Proportion
Farming Fishing Livestock
Forest
activities
Business/
trade
Renting
equipment
Selling/
renting
land
Wages/
Salary Total
Keo Oudom 0.0% 22.7% 18.2% 9.1% 18.2% 22.7% 9.1% 0.0% 22
Vang Vieng 31.7% 4.0% 31.0% 5.2% 17.9% 4.4% 2.8% 3.2% 252
Khong 0
All 3 districts 29.2% 5.5% 29.9% 5.5% 17.9% 5.8% 3.3% 2.9% 274
Appendix 22
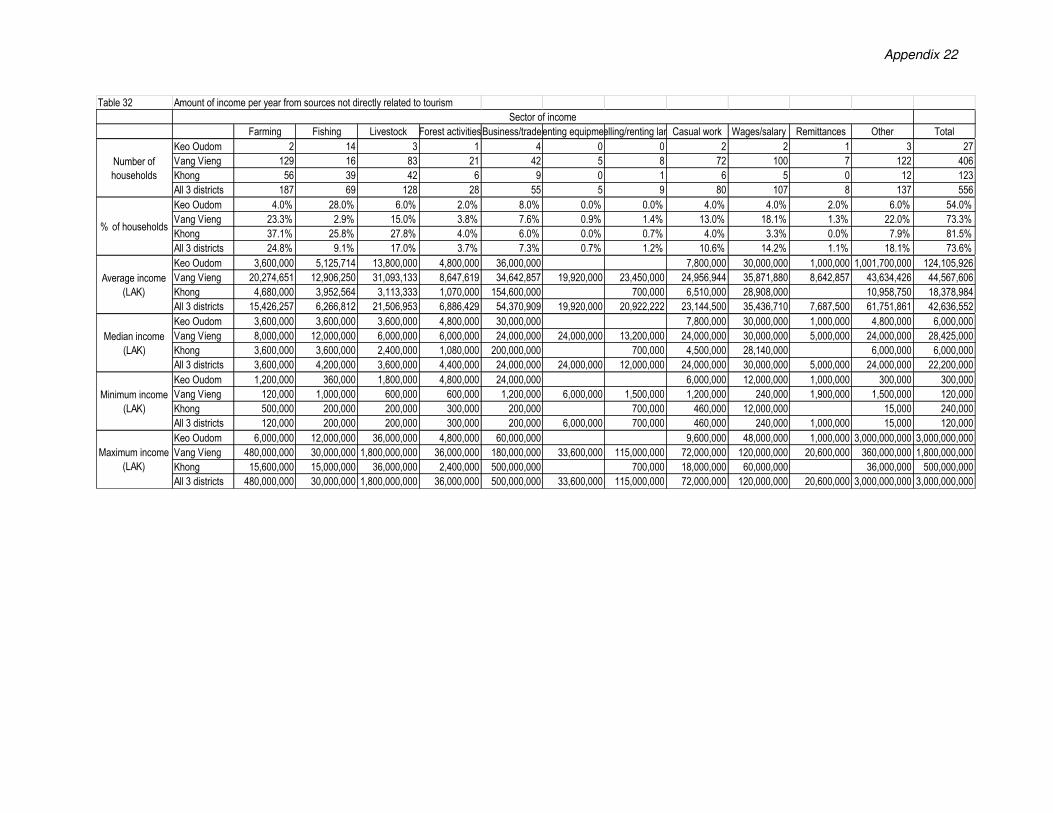
Table 32 Amount of income per year from sources not directly related to tourism
Farming Fishing Livestock Forest activitiesBusiness/tradeRenting equipmenSelling/renting landCasual work Wages/salary Remittances Other Total
Keo Oudom 2 14 3 1 4 0 0 2 2 1 3 27
Vang Vieng 129 16 83 21 42 5 8 72 100 7 122 406
Khong 56 39 42 6 9 0 1 6 5 0 12 123
All 3 districts 187 69 128 28 55 5 9 80 107 8 137 556
Keo Oudom 4.0% 28.0% 6.0% 2.0% 8.0% 0.0% 0.0% 4.0% 4.0% 2.0% 6.0% 54.0%
Vang Vieng 23.3% 2.9% 15.0% 3.8% 7.6% 0.9% 1.4% 13.0% 18.1% 1.3% 22.0% 73.3%
Khong 37.1% 25.8% 27.8% 4.0% 6.0% 0.0% 0.7% 4.0% 3.3% 0.0% 7.9% 81.5%
All 3 districts 24.8% 9.1% 17.0% 3.7% 7.3% 0.7% 1.2% 10.6% 14.2% 1.1% 18.1% 73.6%
Keo Oudom 3,600,000 5,125,714 13,800,000 4,800,000 36,000,000 7,800,000 30,000,000 1,000,000 1,001,700,000 124,105,926
Vang Vieng 20,274,651 12,906,250 31,093,133 8,647,619 34,642,857 19,920,000 23,450,000 24,956,944 35,871,880 8,642,857 43,634,426 44,567,606
Khong 4,680,000 3,952,564 3,113,333 1,070,000 154,600,000 700,000 6,510,000 28,908,000 10,958,750 18,378,984
All 3 districts 15,426,257 6,266,812 21,506,953 6,886,429 54,370,909 19,920,000 20,922,222 23,144,500 35,436,710 7,687,500 61,751,861 42,636,552
Keo Oudom 3,600,000 3,600,000 3,600,000 4,800,000 30,000,000 7,800,000 30,000,000 1,000,000 4,800,000 6,000,000
Vang Vieng 8,000,000 12,000,000 6,000,000 6,000,000 24,000,000 24,000,000 13,200,000 24,000,000 30,000,000 5,000,000 24,000,000 28,425,000
Khong 3,600,000 3,600,000 2,400,000 1,080,000 200,000,000 700,000 4,500,000 28,140,000 6,000,000 6,000,000
All 3 districts 3,600,000 4,200,000 3,600,000 4,400,000 24,000,000 24,000,000 12,000,000 24,000,000 30,000,000 5,000,000 24,000,000 22,200,000
Keo Oudom 1,200,000 360,000 1,800,000 4,800,000 24,000,000 6,000,000 12,000,000 1,000,000 300,000 300,000
Vang Vieng 120,000 1,000,000 600,000 600,000 1,200,000 6,000,000 1,500,000 1,200,000 240,000 1,900,000 1,500,000 120,000
Khong 500,000 200,000 200,000 300,000 200,000 700,000 460,000 12,000,000 15,000 240,000
All 3 districts 120,000 200,000 200,000 300,000 200,000 6,000,000 700,000 460,000 240,000 1,000,000 15,000 120,000
Keo Oudom 6,000,000 12,000,000 36,000,000 4,800,000 60,000,000 9,600,000 48,000,000 1,000,000 3,000,000,000 3,000,000,000
Vang Vieng 480,000,000 30,000,000 1,800,000,000 36,000,000 180,000,000 33,600,000 115,000,000 72,000,000 120,000,000 20,600,000 360,000,000 1,800,000,000
Khong 15,600,000 15,000,000 36,000,000 2,400,000 500,000,000 700,000 18,000,000 60,000,000 36,000,000 500,000,000
All 3 districts 480,000,000 30,000,000 1,800,000,000 36,000,000 500,000,000 33,600,000 115,000,000 72,000,000 120,000,000 20,600,000 3,000,000,000 3,000,000,000
Sector of income
Number of
households
% of households
Average income
(LAK)
Median income
(LAK)
Minimum income
(LAK)
Maximum income
(LAK)
Appendix 22
755
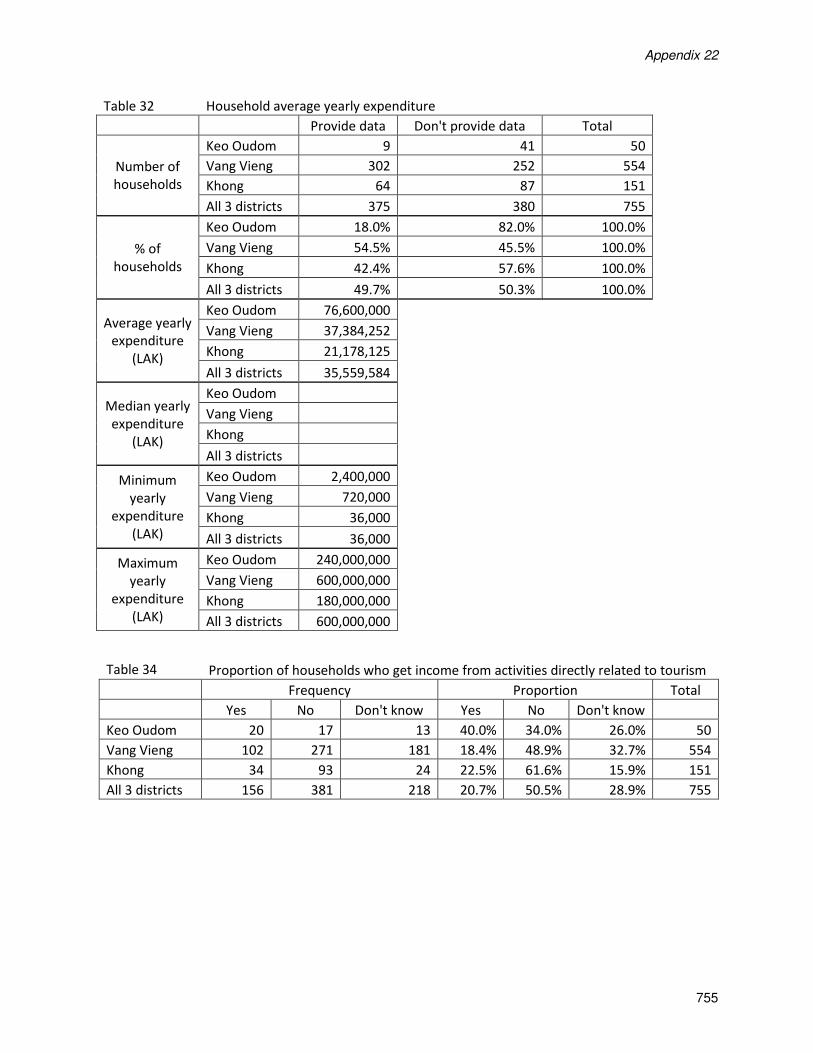
Table 32 Household average yearly expenditure
Provide data Don't provide data Total
Number of
households
Keo Oudom 9 41 50
Vang Vieng 302 252 554
Khong 64 87 151
All 3 districts 375 380 755
% of
households
Keo Oudom 18.0% 82.0% 100.0%
Vang Vieng 54.5% 45.5% 100.0%
Khong 42.4% 57.6% 100.0%
All 3 districts 49.7% 50.3% 100.0%
Average yearly
expenditure
(LAK)
Keo Oudom 76,600,000
Vang Vieng 37,384,252
Khong 21,178,125
All 3 districts 35,559,584
Median yearly
expenditure
(LAK)
Keo Oudom
Vang Vieng
Khong
All 3 districts
Minimum
yearly
expenditure
(LAK)
Keo Oudom 2,400,000
Vang Vieng 720,000
Khong 36,000
All 3 districts 36,000
Maximum
yearly
expenditure
(LAK)
Keo Oudom 240,000,000
Vang Vieng 600,000,000
Khong 180,000,000
All 3 districts 600,000,000
Table 34 Proportion of households who get income from activities directly related to tourism
Frequency Proportion Total
Yes No Don't know Yes No Don't know
Keo Oudom 20 17 13 40.0% 34.0% 26.0% 50
Vang Vieng 102 271 181 18.4% 48.9% 32.7% 554
Khong 34 93 24 22.5% 61.6% 15.9% 151
All 3 districts 156 381 218 20.7% 50.5% 28.9% 755
Appendix 22
756
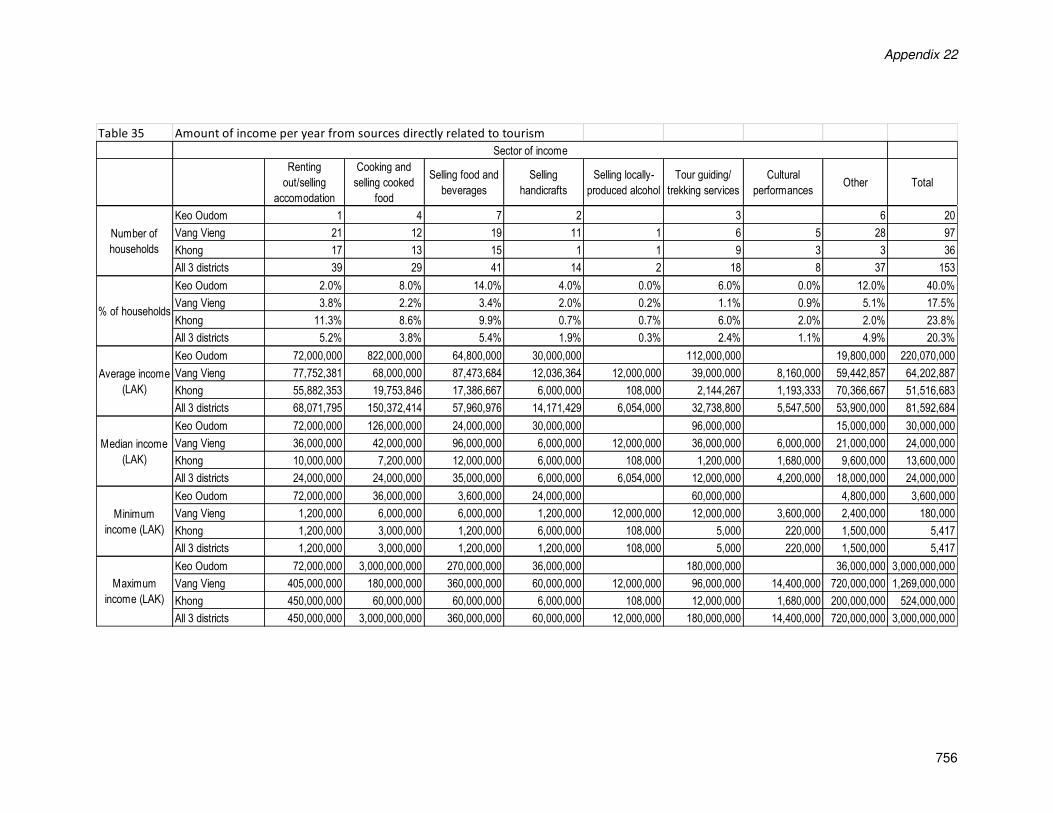
Table 35 Amount of income per year from sources directly related to tourism
Renting
out/selling
accomodation
Cooking and
selling cooked
food
Selling food and
beverages
Selling
handicrafts
Selling locally-
produced alcohol
Tour guiding/
trekking services
Cultural
performancesOther Total
Keo Oudom 1 4 7 2 3 6 20
Vang Vieng 21 12 19 11 1 6 5 28 97
Khong 17 13 15 1 1 9 3 3 36
All 3 districts 39 29 41 14 2 18 8 37 153
Keo Oudom 2.0% 8.0% 14.0% 4.0% 0.0% 6.0% 0.0% 12.0% 40.0%
Vang Vieng 3.8% 2.2% 3.4% 2.0% 0.2% 1.1% 0.9% 5.1% 17.5%
Khong 11.3% 8.6% 9.9% 0.7% 0.7% 6.0% 2.0% 2.0% 23.8%
All 3 districts 5.2% 3.8% 5.4% 1.9% 0.3% 2.4% 1.1% 4.9% 20.3%
Keo Oudom 72,000,000 822,000,000 64,800,000 30,000,000 112,000,000 19,800,000 220,070,000
Vang Vieng 77,752,381 68,000,000 87,473,684 12,036,364 12,000,000 39,000,000 8,160,000 59,442,857 64,202,887
Khong 55,882,353 19,753,846 17,386,667 6,000,000 108,000 2,144,267 1,193,333 70,366,667 51,516,683
All 3 districts 68,071,795 150,372,414 57,960,976 14,171,429 6,054,000 32,738,800 5,547,500 53,900,000 81,592,684
Keo Oudom 72,000,000 126,000,000 24,000,000 30,000,000 96,000,000 15,000,000 30,000,000
Vang Vieng 36,000,000 42,000,000 96,000,000 6,000,000 12,000,000 36,000,000 6,000,000 21,000,000 24,000,000
Khong 10,000,000 7,200,000 12,000,000 6,000,000 108,000 1,200,000 1,680,000 9,600,000 13,600,000
All 3 districts 24,000,000 24,000,000 35,000,000 6,000,000 6,054,000 12,000,000 4,200,000 18,000,000 24,000,000
Keo Oudom 72,000,000 36,000,000 3,600,000 24,000,000 60,000,000 4,800,000 3,600,000
Vang Vieng 1,200,000 6,000,000 6,000,000 1,200,000 12,000,000 12,000,000 3,600,000 2,400,000 180,000
Khong 1,200,000 3,000,000 1,200,000 6,000,000 108,000 5,000 220,000 1,500,000 5,417
All 3 districts 1,200,000 3,000,000 1,200,000 1,200,000 108,000 5,000 220,000 1,500,000 5,417
Keo Oudom 72,000,000 3,000,000,000 270,000,000 36,000,000 180,000,000 36,000,000 3,000,000,000
Vang Vieng 405,000,000 180,000,000 360,000,000 60,000,000 12,000,000 96,000,000 14,400,000 720,000,000 1,269,000,000
Khong 450,000,000 60,000,000 60,000,000 6,000,000 108,000 12,000,000 1,680,000 200,000,000 524,000,000
All 3 districts 450,000,000 3,000,000,000 360,000,000 60,000,000 12,000,000 180,000,000 14,400,000 720,000,000 3,000,000,000
Sector of income
Number of
households
% of households
Average income
(LAK)
Median income
(LAK)
Minimum
income (LAK)
Maximum
income (LAK)
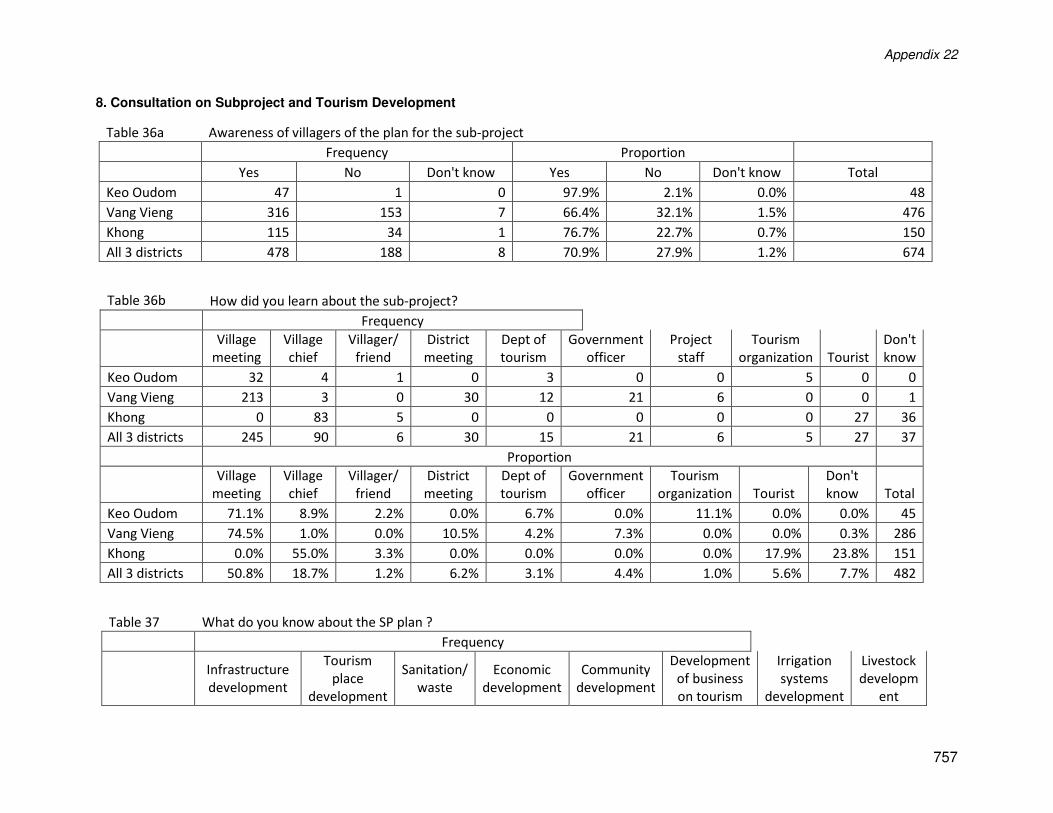
Appendix 22
757
8. Consultation on Subproject and Tourism Development
Table 36a Awareness of villagers of the plan for the sub-project
Frequency Proportion
Yes No Don't know Yes No Don't know Total
Keo Oudom 47 1 0 97.9% 2.1% 0.0% 48
Vang Vieng 316 153 7 66.4% 32.1% 1.5% 476
Khong 115 34 1 76.7% 22.7% 0.7% 150
All 3 districts 478 188 8 70.9% 27.9% 1.2% 674
Table 36b How did you learn about the sub-project?
Frequency
Village
meeting
Village
chief
Villager/
friend
District
meeting
Dept of
tourism
Government
officer
Project
staff
Tourism
organization Tourist
Don't
know
Keo Oudom 32 4 1 0 3 0 0 5 0 0
Vang Vieng 213 3 0 30 12 21 6 0 0 1
Khong 0 83 5 0 0 0 0 0 27 36
All 3 districts 245 90 6 30 15 21 6 5 27 37
Proportion
Village
meeting
Village
chief
Villager/
friend
District
meeting
Dept of
tourism
Government
officer
Tourism
organization Tourist
Don't
know Total
Keo Oudom 71.1% 8.9% 2.2% 0.0% 6.7% 0.0% 11.1% 0.0% 0.0% 45
Vang Vieng 74.5% 1.0% 0.0% 10.5% 4.2% 7.3% 0.0% 0.0% 0.3% 286
Khong 0.0% 55.0% 3.3% 0.0% 0.0% 0.0% 0.0% 17.9% 23.8% 151
All 3 districts 50.8% 18.7% 1.2% 6.2% 3.1% 4.4% 1.0% 5.6% 7.7% 482
Table 37 What do you know about the SP plan ?
Frequency
Infrastructure
development
Tourism
place
development
Sanitation/
waste
Economic
development
Community
development
Development
of business
on tourism
Irrigation
systems
development
Livestock
developm
ent
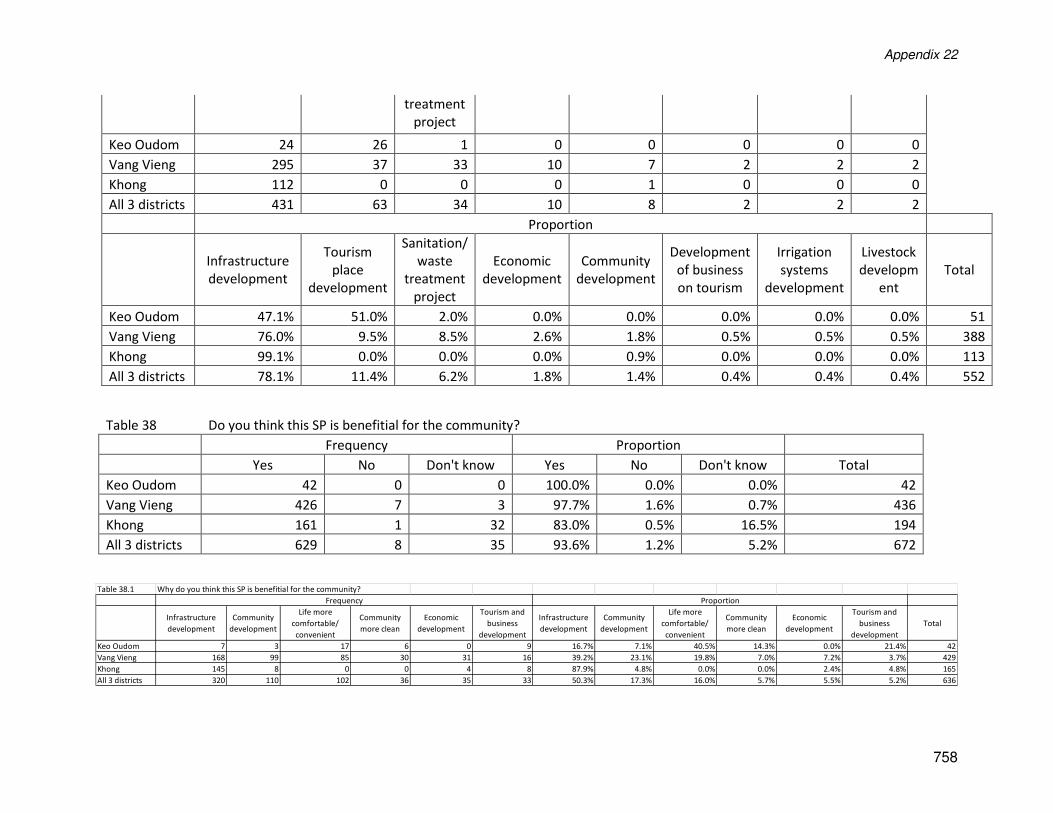
Appendix 22
758
treatment
project
Keo Oudom 24 26 1 0 0 0 0 0
Vang Vieng 295 37 33 10 7 2 2 2
Khong 112 0 0 0 1 0 0 0
All 3 districts 431 63 34 10 8 2 2 2
Proportion
Infrastructure
development
Tourism
place
development
Sanitation/
waste
treatment
project
Economic
development
Community
development
Development
of business
on tourism
Irrigation
systems
development
Livestock
developm
ent
Total
Keo Oudom 47.1% 51.0% 2.0% 0.0% 0.0% 0.0% 0.0% 0.0% 51
Vang Vieng 76.0% 9.5% 8.5% 2.6% 1.8% 0.5% 0.5% 0.5% 388
Khong 99.1% 0.0% 0.0% 0.0% 0.9% 0.0% 0.0% 0.0% 113
All 3 districts 78.1% 11.4% 6.2% 1.8% 1.4% 0.4% 0.4% 0.4% 552
Table 38 Do you think this SP is benefitial for the community?
Frequency Proportion
Yes No Don't know Yes No Don't know Total
Keo Oudom 42 0 0 100.0% 0.0% 0.0% 42
Vang Vieng 426 7 3 97.7% 1.6% 0.7% 436
Khong 161 1 32 83.0% 0.5% 16.5% 194
All 3 districts 629 8 35 93.6% 1.2% 5.2% 672
Table 38.1 Why do you think this SP is benefitial for the community?
Infrastructure
development
Community
development
Life more
comfortable/
convenient
Community
more clean
Economic
development
Tourism and
business
development
Infrastructure
development
Community
development
Life more
comfortable/
convenient
Community
more clean
Economic
development
Tourism and
business
development
Total
Keo Oudom 7 3 17 6 0 9 16.7% 7.1% 40.5% 14.3% 0.0% 21.4% 42
Vang Vieng 168 99 85 30 31 16 39.2% 23.1% 19.8% 7.0% 7.2% 3.7% 429
Khong 145 8 0 0 4 8 87.9% 4.8% 0.0% 0.0% 2.4% 4.8% 165
All 3 districts 320 110 102 36 35 33 50.3% 17.3% 16.0% 5.7% 5.5% 5.2% 636
Frequency Proportion
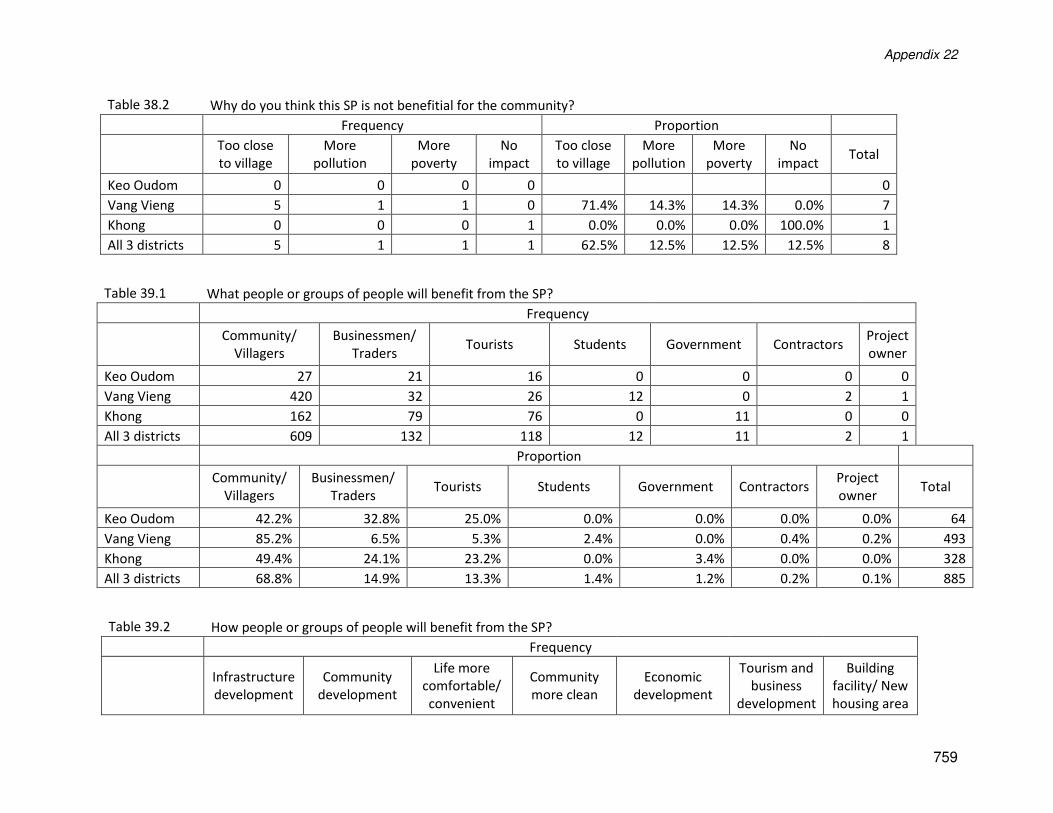
Appendix 22
759
Table 38.2 Why do you think this SP is not benefitial for the community?
Frequency Proportion
Too close
to village
More
pollution
More
poverty
No
impact
Too close
to village
More
pollution
More
poverty
No
impact Total
Keo Oudom 0 0 0 0 0
Vang Vieng 5 1 1 0 71.4% 14.3% 14.3% 0.0% 7
Khong 0 0 0 1 0.0% 0.0% 0.0% 100.0% 1
All 3 districts 5 1 1 1 62.5% 12.5% 12.5% 12.5% 8
Table 39.1 What people or groups of people will benefit from the SP?
Frequency
Community/
Villagers
Businessmen/
Traders Tourists Students Government Contractors
Project
owner
Keo Oudom 27 21 16 0 0 0 0
Vang Vieng 420 32 26 12 0 2 1
Khong 162 79 76 0 11 0 0
All 3 districts 609 132 118 12 11 2 1
Proportion
Community/
Villagers
Businessmen/
Traders Tourists Students Government Contractors
Project
owner Total
Keo Oudom 42.2% 32.8% 25.0% 0.0% 0.0% 0.0% 0.0% 64
Vang Vieng 85.2% 6.5% 5.3% 2.4% 0.0% 0.4% 0.2% 493
Khong 49.4% 24.1% 23.2% 0.0% 3.4% 0.0% 0.0% 328
All 3 districts 68.8% 14.9% 13.3% 1.4% 1.2% 0.2% 0.1% 885
Table 39.2 How people or groups of people will benefit from the SP?
Frequency
Infrastructure
development
Community
development
Life more
comfortable/
convenient
Community
more clean
Economic
development
Tourism and
business
development
Building
facility/ New
housing area
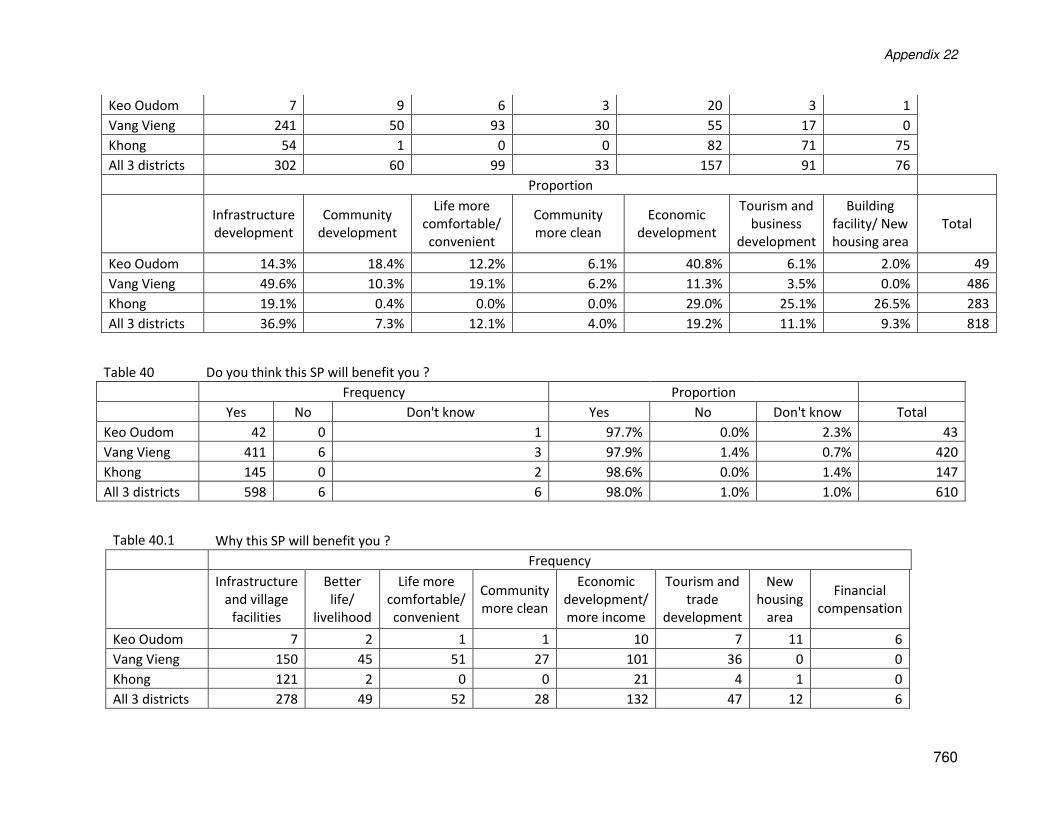
Appendix 22
760
Keo Oudom 7 9 6 3 20 3 1
Vang Vieng 241 50 93 30 55 17 0
Khong 54 1 0 0 82 71 75
All 3 districts 302 60 99 33 157 91 76
Proportion
Infrastructure
development
Community
development
Life more
comfortable/
convenient
Community
more clean
Economic
development
Tourism and
business
development
Building
facility/ New
housing area
Total
Keo Oudom 14.3% 18.4% 12.2% 6.1% 40.8% 6.1% 2.0% 49
Vang Vieng 49.6% 10.3% 19.1% 6.2% 11.3% 3.5% 0.0% 486
Khong 19.1% 0.4% 0.0% 0.0% 29.0% 25.1% 26.5% 283
All 3 districts 36.9% 7.3% 12.1% 4.0% 19.2% 11.1% 9.3% 818
Table 40 Do you think this SP will benefit you ?
Frequency Proportion
Yes No Don't know Yes No Don't know Total
Keo Oudom 42 0 1 97.7% 0.0% 2.3% 43
Vang Vieng 411 6 3 97.9% 1.4% 0.7% 420
Khong 145 0 2 98.6% 0.0% 1.4% 147
All 3 districts 598 6 6 98.0% 1.0% 1.0% 610
Table 40.1 Why this SP will benefit you ?
Frequency
Infrastructure
and village
facilities
Better
life/
livelihood
Life more
comfortable/
convenient
Community
more clean
Economic
development/
more income
Tourism and
trade
development
New
housing
area
Financial
compensation
Keo Oudom 7 2 1 1 10 7 11 6
Vang Vieng 150 45 51 27 101 36 0 0
Khong 121 2 0 0 21 4 1 0
All 3 districts 278 49 52 28 132 47 12 6
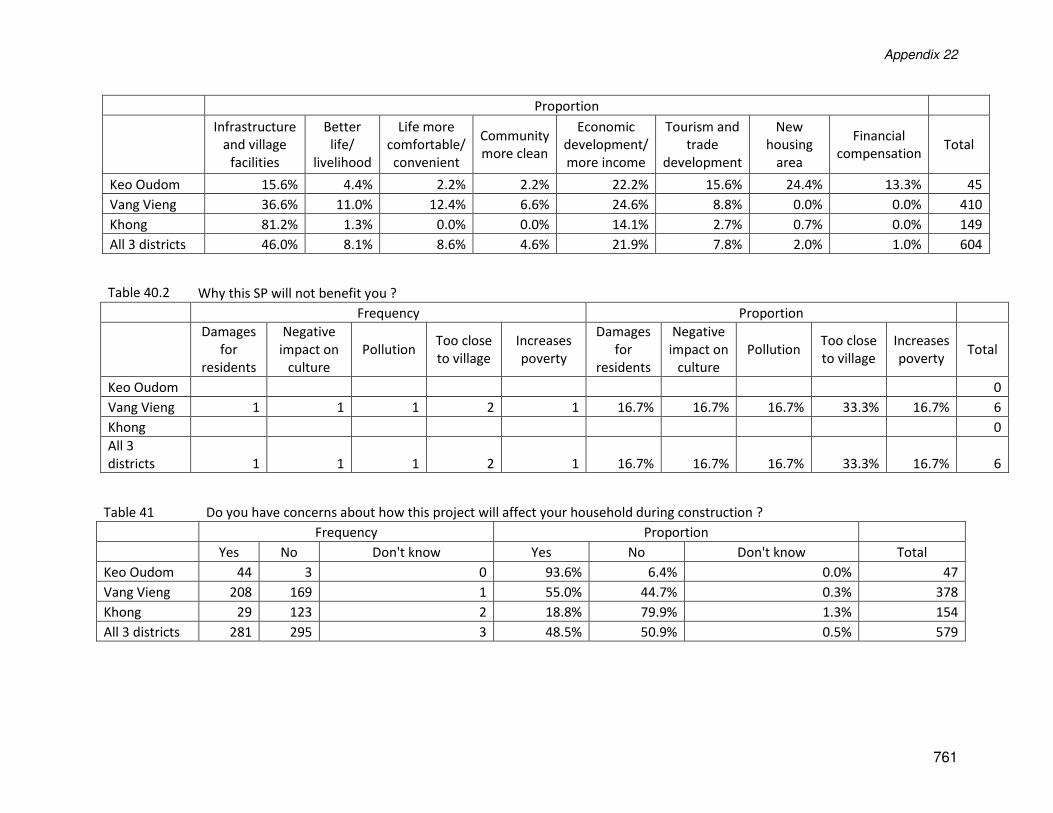
Appendix 22
761
Proportion
Infrastructure
and village
facilities
Better
life/
livelihood
Life more
comfortable/
convenient
Community
more clean
Economic
development/
more income
Tourism and
trade
development
New
housing
area
Financial
compensation Total
Keo Oudom 15.6% 4.4% 2.2% 2.2% 22.2% 15.6% 24.4% 13.3% 45
Vang Vieng 36.6% 11.0% 12.4% 6.6% 24.6% 8.8% 0.0% 0.0% 410
Khong 81.2% 1.3% 0.0% 0.0% 14.1% 2.7% 0.7% 0.0% 149
All 3 districts 46.0% 8.1% 8.6% 4.6% 21.9% 7.8% 2.0% 1.0% 604
Table 40.2 Why this SP will not benefit you ?
Frequency Proportion
Damages
for
residents
Negative
impact on
culture
Pollution Too close
to village
Increases
poverty
Damages
for
residents
Negative
impact on
culture
Pollution Too close
to village
Increases
poverty Total
Keo Oudom 0
Vang Vieng 1 1 1 2 1 16.7% 16.7% 16.7% 33.3% 16.7% 6
Khong 0
All 3
districts 1 1 1 2 1 16.7% 16.7% 16.7% 33.3% 16.7% 6
Table 41 Do you have concerns about how this project will affect your household during construction ?
Frequency Proportion
Yes No Don't know Yes No Don't know Total
Keo Oudom 44 3 0 93.6% 6.4% 0.0% 47
Vang Vieng 208 169 1 55.0% 44.7% 0.3% 378
Khong 29 123 2 18.8% 79.9% 1.3% 154
All 3 districts 281 295 3 48.5% 50.9% 0.5% 579
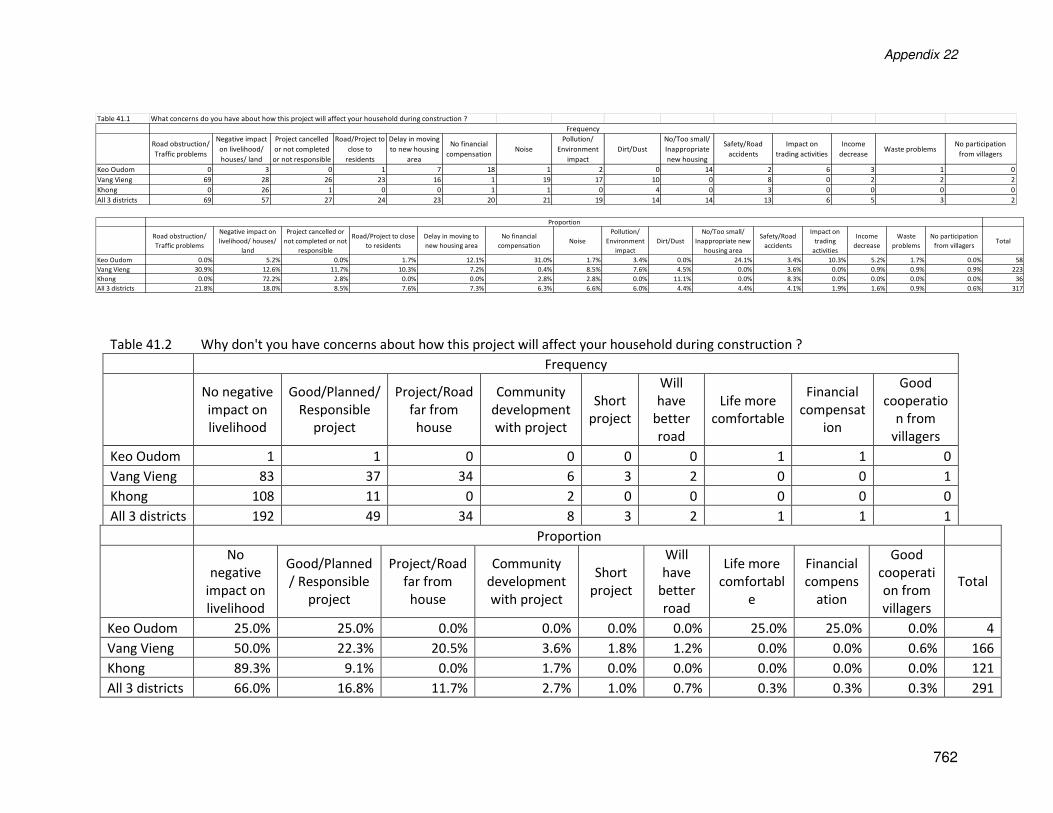
Appendix 22
762
Table 41.2 Why don't you have concerns about how this project will affect your household during construction ?
Frequency
No negative
impact on
livelihood
Good/Planned/
Responsible
project
Project/Road
far from
house
Community
development
with project
Short
project
Will
have
better
road
Life more
comfortable
Financial
compensat
ion
Good
cooperatio
n from
villagers
Keo Oudom 1 1 0 0 0 0 1 1 0
Vang Vieng 83 37 34 6 3 2 0 0 1
Khong 108 11 0 2 0 0 0 0 0
All 3 districts 192 49 34 8 3 2 1 1 1
Proportion
No
negative
impact on
livelihood
Good/Planned
/ Responsible
project
Project/Road
far from
house
Community
development
with project
Short
project
Will
have
better
road
Life more
comfortabl
e
Financial
compens
ation
Good
cooperati
on from
villagers
Total
Keo Oudom 25.0% 25.0% 0.0% 0.0% 0.0% 0.0% 25.0% 25.0% 0.0% 4
Vang Vieng 50.0% 22.3% 20.5% 3.6% 1.8% 1.2% 0.0% 0.0% 0.6% 166
Khong 89.3% 9.1% 0.0% 1.7% 0.0% 0.0% 0.0% 0.0% 0.0% 121
All 3 districts 66.0% 16.8% 11.7% 2.7% 1.0% 0.7% 0.3% 0.3% 0.3% 291
Table 41.1 What concerns do you have about how this project will affect your household during construction ?
Road obstruction/
Traffic problems
Negative impact
on livelihood/
houses/ land
Project cancelled
or not completed
or not responsible
Road/Project to
close to
residents
Delay in moving
to new housing
area
No financial
compensationNoise
Pollution/
Environment
impact
Dirt/Dust
No/Too small/
Inappropriate
new housing
Safety/Road
accidents
Impact on
trading activities
Income
decreaseWaste problems
No participation
from villagers
Keo Oudom 0 3 0 1 7 18 1 2 0 14 2 6 3 1 0
Vang Vieng 69 28 26 23 16 1 19 17 10 0 8 0 2 2 2
Khong 0 26 1 0 0 1 1 0 4 0 3 0 0 0 0
All 3 districts 69 57 27 24 23 20 21 19 14 14 13 6 5 3 2
Frequency
Road obstruction/
Traffic problems
Negative impact on
livelihood/ houses/
land
Project cancelled or
not completed or not
responsible
Road/Project to close
to residents
Delay in moving to
new housing area
No financial
compensationNoise
Pollution/
Environment
impact
Dirt/Dust
No/Too small/
Inappropriate new
housing area
Safety/Road
accidents
Impact on
trading
activities
Income
decrease
Waste
problems
No participation
from villagersTotal
Keo Oudom 0.0% 5.2% 0.0% 1.7% 12.1% 31.0% 1.7% 3.4% 0.0% 24.1% 3.4% 10.3% 5.2% 1.7% 0.0% 58
Vang Vieng 30.9% 12.6% 11.7% 10.3% 7.2% 0.4% 8.5% 7.6% 4.5% 0.0% 3.6% 0.0% 0.9% 0.9% 0.9% 223
Khong 0.0% 72.2% 2.8% 0.0% 0.0% 2.8% 2.8% 0.0% 11.1% 0.0% 8.3% 0.0% 0.0% 0.0% 0.0% 36
All 3 districts 21.8% 18.0% 8.5% 7.6% 7.3% 6.3% 6.6% 6.0% 4.4% 4.4% 4.1% 1.9% 1.6% 0.9% 0.6% 317
Proportion
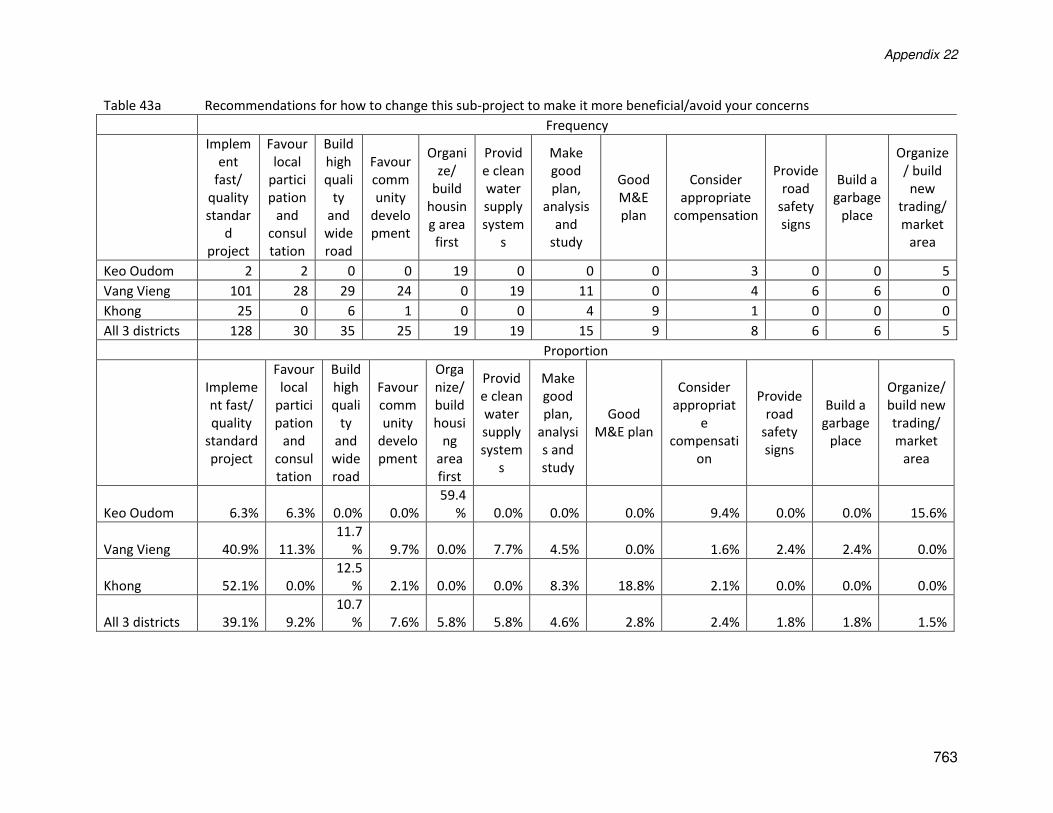
Appendix 22
763
Table 43a Recommendations for how to change this sub-project to make it more beneficial/avoid your concerns
Frequency
Implem
ent
fast/
quality
standar
d
project
Favour
local
partici
pation
and
consul
tation
Build
high
quali
ty
and
wide
road
Favour
comm
unity
develo
pment
Organi
ze/
build
housin
g area
first
Provid
e clean
water
supply
system
s
Make
good
plan,
analysis
and
study
Good
M&E
plan
Consider
appropriate
compensation
Provide
road
safety
signs
Build a
garbage
place
Organize
/ build
new
trading/
market
area
Keo Oudom 2 2 0 0 19 0 0 0 3 0 0 5
Vang Vieng 101 28 29 24 0 19 11 0 4 6 6 0
Khong 25 0 6 1 0 0 4 9 1 0 0 0
All 3 districts 128 30 35 25 19 19 15 9 8 6 6 5
Proportion
Impleme
nt fast/
quality
standard
project
Favour
local
partici
pation
and
consul
tation
Build
high
quali
ty
and
wide
road
Favour
comm
unity
develo
pment
Orga
nize/
build
housi
ng
area
first
Provid
e clean
water
supply
system
s
Make
good
plan,
analysi
s and
study
Good
M&E plan
Consider
appropriat
e
compensati
on
Provide
road
safety
signs
Build a
garbage
place
Organize/
build new
trading/
market
area
Keo Oudom 6.3% 6.3% 0.0% 0.0%
59.4
% 0.0% 0.0% 0.0% 9.4% 0.0% 0.0% 15.6%
Vang Vieng 40.9% 11.3%
11.7
% 9.7% 0.0% 7.7% 4.5% 0.0% 1.6% 2.4% 2.4% 0.0%
Khong 52.1% 0.0%
12.5
% 2.1% 0.0% 0.0% 8.3% 18.8% 2.1% 0.0% 0.0% 0.0%
All 3 districts 39.1% 9.2%
10.7
% 7.6% 5.8% 5.8% 4.6% 2.8% 2.4% 1.8% 1.8% 1.5%
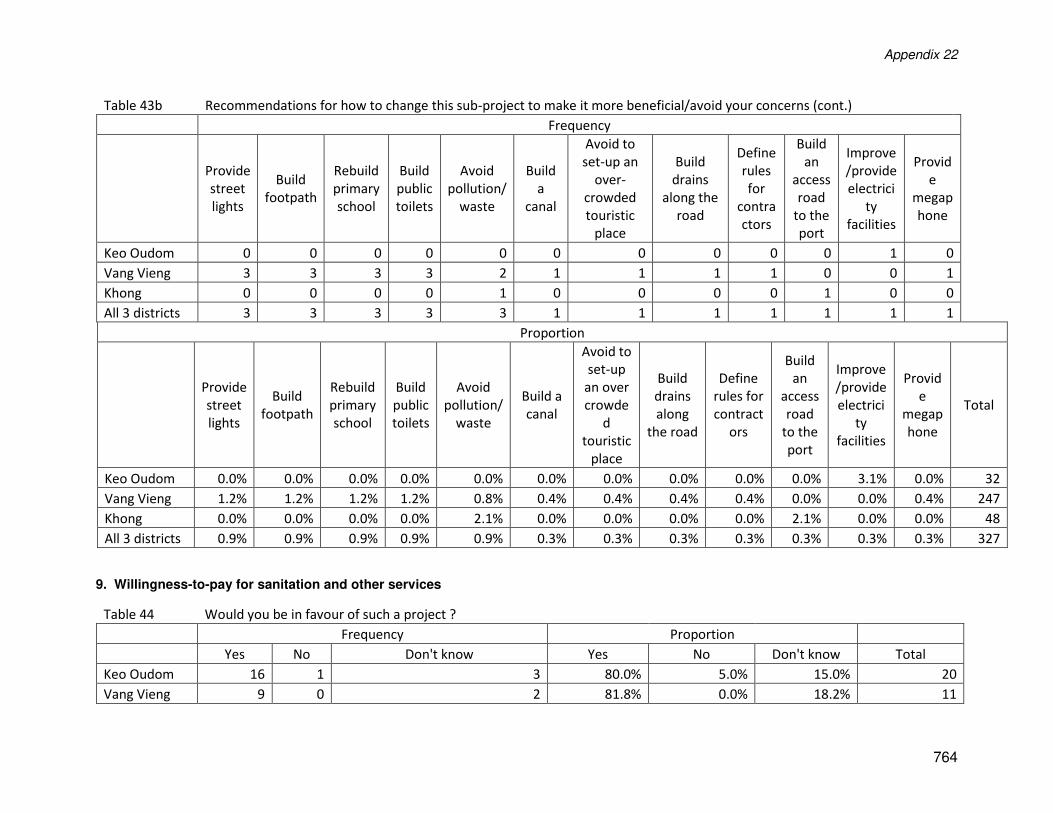
Appendix 22
764
Table 43b Recommendations for how to change this sub-project to make it more beneficial/avoid your concerns (cont.)
Frequency
Provide
street
lights
Build
footpath
Rebuild
primary
school
Build
public
toilets
Avoid
pollution/
waste
Build
a
canal
Avoid to
set-up an
over-
crowded
touristic
place
Build
drains
along the
road
Define
rules
for
contra
ctors
Build
an
access
road
to the
port
Improve
/provide
electrici
ty
facilities
Provid
e
megap
hone
Keo Oudom 0 0 0 0 0 0 0 0 0 0 1 0
Vang Vieng 3 3 3 3 2 1 1 1 1 0 0 1
Khong 0 0 0 0 1 0 0 0 0 1 0 0
All 3 districts 3 3 3 3 3 1 1 1 1 1 1 1
Proportion
Provide
street
lights
Build
footpath
Rebuild
primary
school
Build
public
toilets
Avoid
pollution/
waste
Build a
canal
Avoid to
set-up
an over
crowde
d
touristic
place
Build
drains
along
the road
Define
rules for
contract
ors
Build
an
access
road
to the
port
Improve
/provide
electrici
ty
facilities
Provid
e
megap
hone
Total
Keo Oudom 0.0% 0.0% 0.0% 0.0% 0.0% 0.0% 0.0% 0.0% 0.0% 0.0% 3.1% 0.0% 32
Vang Vieng 1.2% 1.2% 1.2% 1.2% 0.8% 0.4% 0.4% 0.4% 0.4% 0.0% 0.0% 0.4% 247
Khong 0.0% 0.0% 0.0% 0.0% 2.1% 0.0% 0.0% 0.0% 0.0% 2.1% 0.0% 0.0% 48
All 3 districts 0.9% 0.9% 0.9% 0.9% 0.9% 0.3% 0.3% 0.3% 0.3% 0.3% 0.3% 0.3% 327
9. Willingness-to-pay for sanitation and other services
Table 44 Would you be in favour of such a project ?
Frequency Proportion
Yes No Don't know Yes No Don't know Total
Keo Oudom 16 1 3 80.0% 5.0% 15.0% 20
Vang Vieng 9 0 2 81.8% 0.0% 18.2% 11
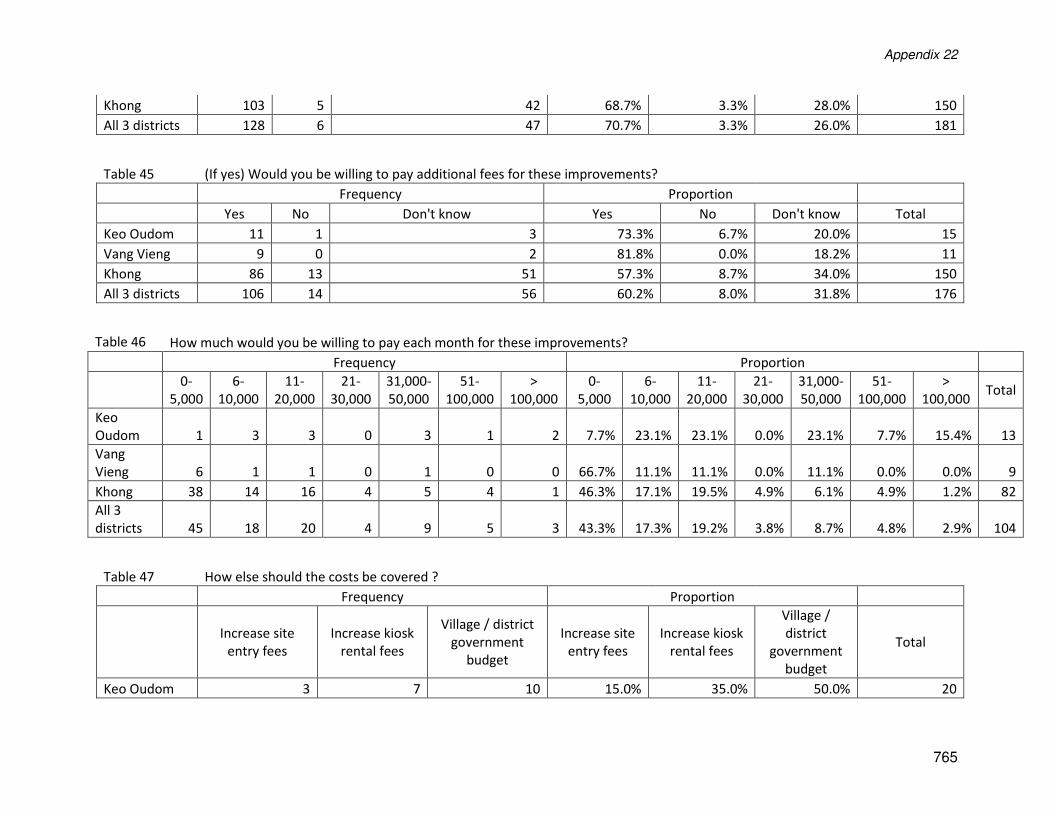
Appendix 22
765
Khong 103 5 42 68.7% 3.3% 28.0% 150
All 3 districts 128 6 47 70.7% 3.3% 26.0% 181
Table 45 (If yes) Would you be willing to pay additional fees for these improvements?
Frequency Proportion
Yes No Don't know Yes No Don't know Total
Keo Oudom 11 1 3 73.3% 6.7% 20.0% 15
Vang Vieng 9 0 2 81.8% 0.0% 18.2% 11
Khong 86 13 51 57.3% 8.7% 34.0% 150
All 3 districts 106 14 56 60.2% 8.0% 31.8% 176
Table 46 How much would you be willing to pay each month for these improvements?
Frequency Proportion
0-
5,000
6-
10,000
11-
20,000
21-
30,000
31,000-
50,000
51-
100,000
>
100,000
0-
5,000
6-
10,000
11-
20,000
21-
30,000
31,000-
50,000
51-
100,000
>
100,000 Total
Keo
Oudom 1 3 3 0 3 1 2 7.7% 23.1% 23.1% 0.0% 23.1% 7.7% 15.4% 13
Vang
Vieng 6 1 1 0 1 0 0 66.7% 11.1% 11.1% 0.0% 11.1% 0.0% 0.0% 9
Khong 38 14 16 4 5 4 1 46.3% 17.1% 19.5% 4.9% 6.1% 4.9% 1.2% 82
All 3
districts 45 18 20 4 9 5 3 43.3% 17.3% 19.2% 3.8% 8.7% 4.8% 2.9% 104
Table 47 How else should the costs be covered ?
Frequency Proportion
Increase site
entry fees
Increase kiosk
rental fees
Village / district
government
budget
Increase site
entry fees
Increase kiosk
rental fees
Village /
district
government
budget
Total
Keo Oudom 3 7 10 15.0% 35.0% 50.0% 20
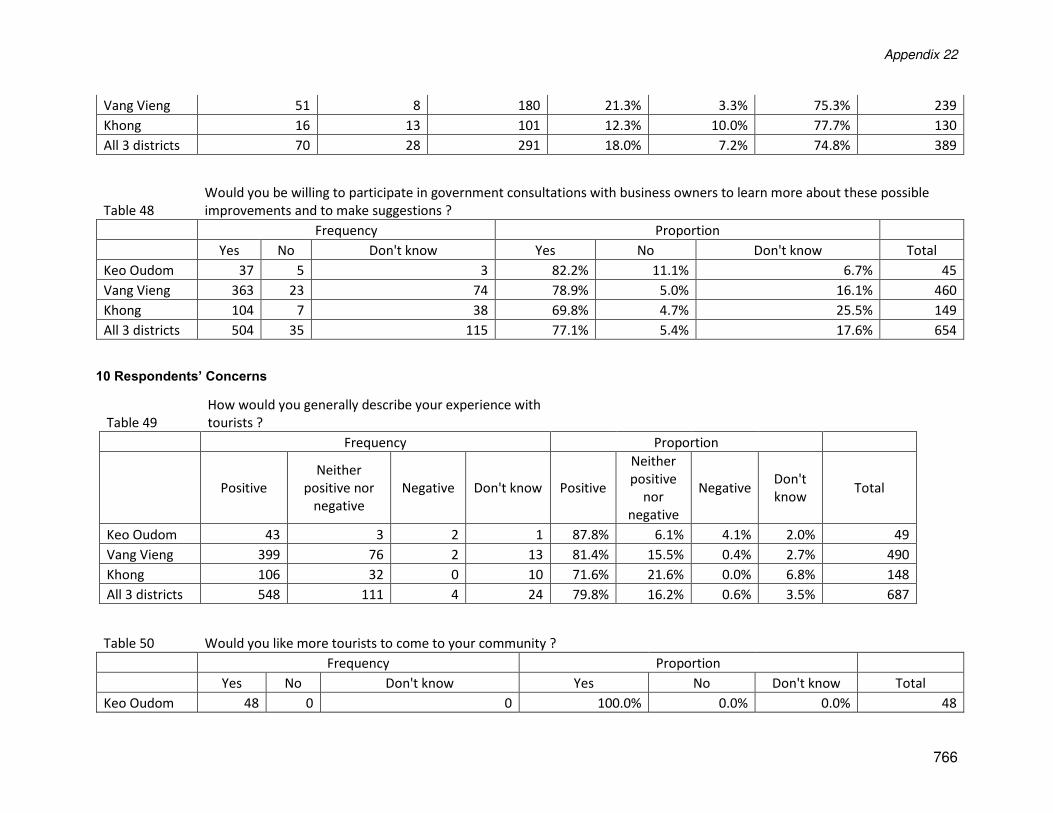
Appendix 22
766
Vang Vieng 51 8 180 21.3% 3.3% 75.3% 239
Khong 16 13 101 12.3% 10.0% 77.7% 130
All 3 districts 70 28 291 18.0% 7.2% 74.8% 389
Table 48
Would you be willing to participate in government consultations with business owners to learn more about these possible
improvements and to make suggestions ?
Frequency Proportion
Yes No Don't know Yes No Don't know Total
Keo Oudom 37 5 3 82.2% 11.1% 6.7% 45
Vang Vieng 363 23 74 78.9% 5.0% 16.1% 460
Khong 104 7 38 69.8% 4.7% 25.5% 149
All 3 districts 504 35 115 77.1% 5.4% 17.6% 654
10 Respondents’ Concerns
Table 49
How would you generally describe your experience with
tourists ?
Frequency Proportion
Positive
Neither
positive nor
negative
Negative Don't know Positive
Neither
positive
nor
negative
Negative Don't
know Total
Keo Oudom 43 3 2 1 87.8% 6.1% 4.1% 2.0% 49
Vang Vieng 399 76 2 13 81.4% 15.5% 0.4% 2.7% 490
Khong 106 32 0 10 71.6% 21.6% 0.0% 6.8% 148
All 3 districts 548 111 4 24 79.8% 16.2% 0.6% 3.5% 687
Table 50 Would you like more tourists to come to your community ?
Frequency Proportion
Yes No Don't know Yes No Don't know Total
Keo Oudom 48 0 0 100.0% 0.0% 0.0% 48
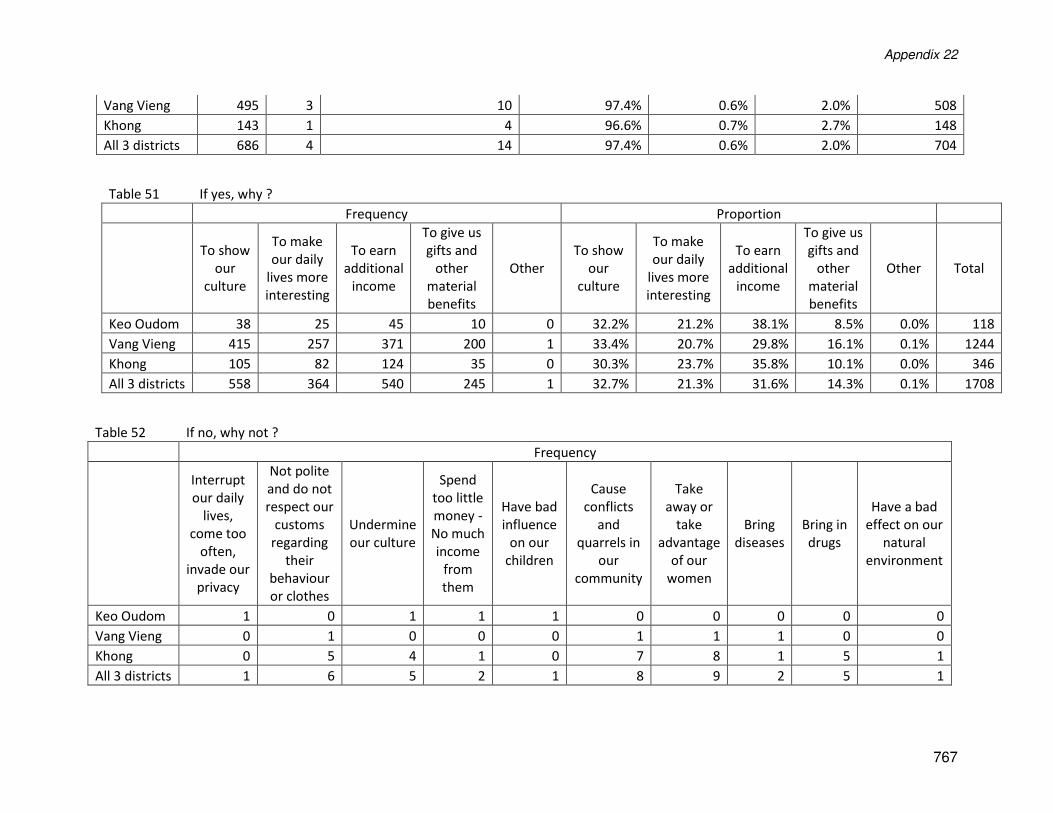
Appendix 22
767
Vang Vieng 495 3 10 97.4% 0.6% 2.0% 508
Khong 143 1 4 96.6% 0.7% 2.7% 148
All 3 districts 686 4 14 97.4% 0.6% 2.0% 704
Table 51 If yes, why ?
Frequency Proportion
To show
our
culture
To make
our daily
lives more
interesting
To earn
additional
income
To give us
gifts and
other
material
benefits
Other
To show
our
culture
To make
our daily
lives more
interesting
To earn
additional
income
To give us
gifts and
other
material
benefits
Other Total
Keo Oudom 38 25 45 10 0 32.2% 21.2% 38.1% 8.5% 0.0% 118
Vang Vieng 415 257 371 200 1 33.4% 20.7% 29.8% 16.1% 0.1% 1244
Khong 105 82 124 35 0 30.3% 23.7% 35.8% 10.1% 0.0% 346
All 3 districts 558 364 540 245 1 32.7% 21.3% 31.6% 14.3% 0.1% 1708
Table 52 If no, why not ?
Frequency
Interrupt
our daily
lives,
come too
often,
invade our
privacy
Not polite
and do not
respect our
customs
regarding
their
behaviour
or clothes
Undermine
our culture
Spend
too little
money -
No much
income
from
them
Have bad
influence
on our
children
Cause
conflicts
and
quarrels in
our
community
Take
away or
take
advantage
of our
women
Bring
diseases
Bring in
drugs
Have a bad
effect on our
natural
environment
Keo Oudom 1 0 1 1 1 0 0 0 0 0
Vang Vieng 0 1 0 0 0 1 1 1 0 0
Khong 0 5 4 1 0 7 8 1 5 1
All 3 districts 1 6 5 2 1 8 9 2 5 1
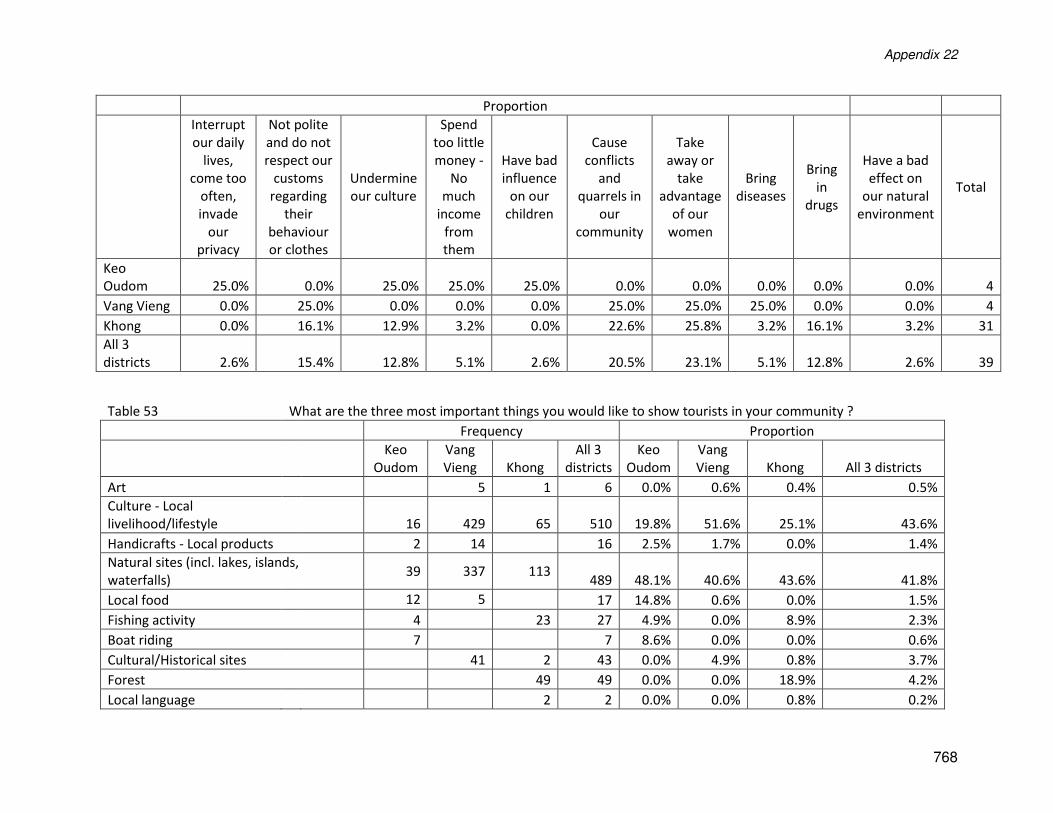
Appendix 22
768
Proportion
Interrupt
our daily
lives,
come too
often,
invade
our
privacy
Not polite
and do not
respect our
customs
regarding
their
behaviour
or clothes
Undermine
our culture
Spend
too little
money -
No
much
income
from
them
Have bad
influence
on our
children
Cause
conflicts
and
quarrels in
our
community
Take
away or
take
advantage
of our
women
Bring
diseases
Bring
in
drugs
Have a bad
effect on
our natural
environment
Total
Keo
Oudom 25.0% 0.0% 25.0% 25.0% 25.0% 0.0% 0.0% 0.0% 0.0% 0.0% 4
Vang Vieng 0.0% 25.0% 0.0% 0.0% 0.0% 25.0% 25.0% 25.0% 0.0% 0.0% 4
Khong 0.0% 16.1% 12.9% 3.2% 0.0% 22.6% 25.8% 3.2% 16.1% 3.2% 31
All 3
districts 2.6% 15.4% 12.8% 5.1% 2.6% 20.5% 23.1% 5.1% 12.8% 2.6% 39
Table 53 What are the three most important things you would like to show tourists in your community ?
Frequency Proportion
Keo
Oudom
Vang
Vieng Khong
All 3
districts
Keo
Oudom
Vang
Vieng Khong All 3 districts
Art 5 1 6 0.0% 0.6% 0.4% 0.5%
Culture - Local
livelihood/lifestyle 16 429 65 510 19.8% 51.6% 25.1% 43.6%
Handicrafts - Local products 2 14 16 2.5% 1.7% 0.0% 1.4%
Natural sites (incl. lakes, islands,
waterfalls) 39 337 113
489 48.1% 40.6% 43.6% 41.8%
Local food 12 5 17 14.8% 0.6% 0.0% 1.5%
Fishing activity 4 23 27 4.9% 0.0% 8.9% 2.3%
Boat riding 7 7 8.6% 0.0% 0.0% 0.6%
Cultural/Historical sites 41 2 43 0.0% 4.9% 0.8% 3.7%
Forest 49 49 0.0% 0.0% 18.9% 4.2%
Local language 2 2 0.0% 0.0% 0.8% 0.2%
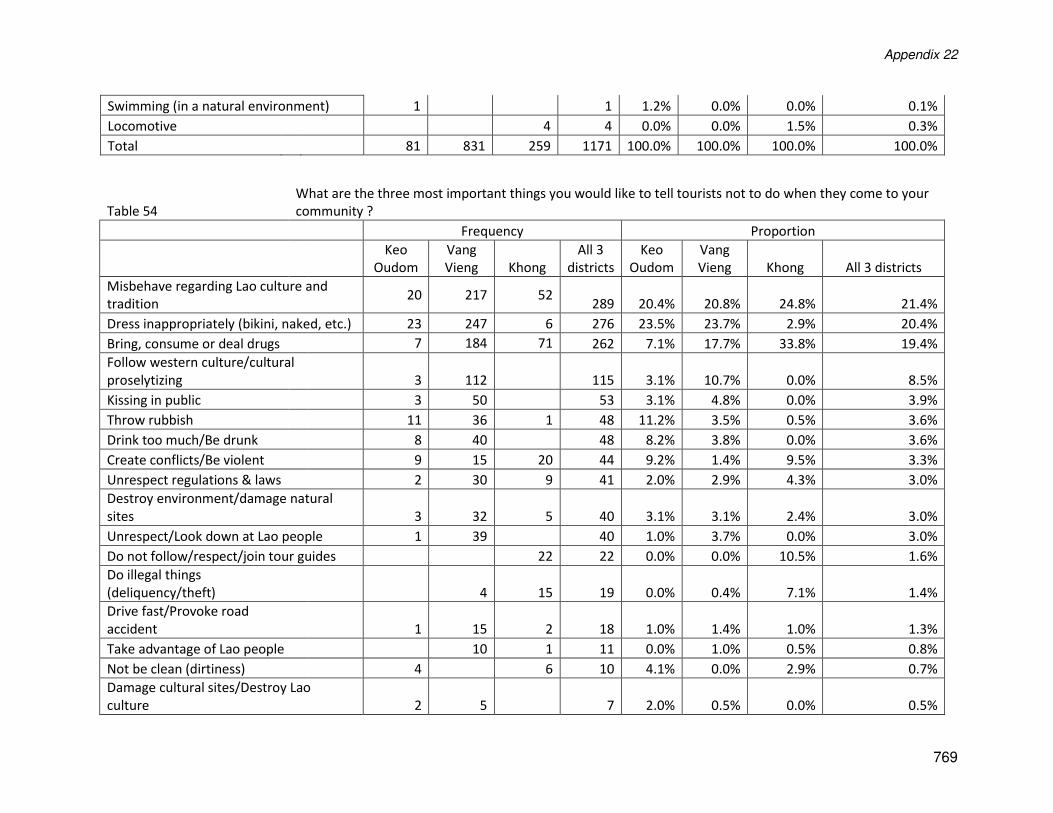
Appendix 22
769
Swimming (in a natural environment) 1 1 1.2% 0.0% 0.0% 0.1%
Locomotive 4 4 0.0% 0.0% 1.5% 0.3%
Total 81 831 259 1171 100.0% 100.0% 100.0% 100.0%
Table 54
What are the three most important things you would like to tell tourists not to do when they come to your
community ?
Frequency Proportion
Keo
Oudom
Vang
Vieng Khong
All 3
districts
Keo
Oudom
Vang
Vieng Khong All 3 districts
Misbehave regarding Lao culture and
tradition 20 217 52
289 20.4% 20.8% 24.8% 21.4%
Dress inappropriately (bikini, naked, etc.) 23 247 6 276 23.5% 23.7% 2.9% 20.4%
Bring, consume or deal drugs 7 184 71 262 7.1% 17.7% 33.8% 19.4%
Follow western culture/cultural
proselytizing 3 112 115 3.1% 10.7% 0.0% 8.5%
Kissing in public 3 50 53 3.1% 4.8% 0.0% 3.9%
Throw rubbish 11 36 1 48 11.2% 3.5% 0.5% 3.6%
Drink too much/Be drunk 8 40 48 8.2% 3.8% 0.0% 3.6%
Create conflicts/Be violent 9 15 20 44 9.2% 1.4% 9.5% 3.3%
Unrespect regulations & laws 2 30 9 41 2.0% 2.9% 4.3% 3.0%
Destroy environment/damage natural
sites 3 32 5 40 3.1% 3.1% 2.4% 3.0%
Unrespect/Look down at Lao people 1 39 40 1.0% 3.7% 0.0% 3.0%
Do not follow/respect/join tour guides 22 22 0.0% 0.0% 10.5% 1.6%
Do illegal things
(deliquency/theft) 4 15 19 0.0% 0.4% 7.1% 1.4%
Drive fast/Provoke road
accident 1 15 2 18 1.0% 1.4% 1.0% 1.3%
Take advantage of Lao people 10 1 11 0.0% 1.0% 0.5% 0.8%
Not be clean (dirtiness) 4 6 10 4.1% 0.0% 2.9% 0.7%
Damage cultural sites/Destroy Lao
culture 2 5 7 2.0% 0.5% 0.0% 0.5%
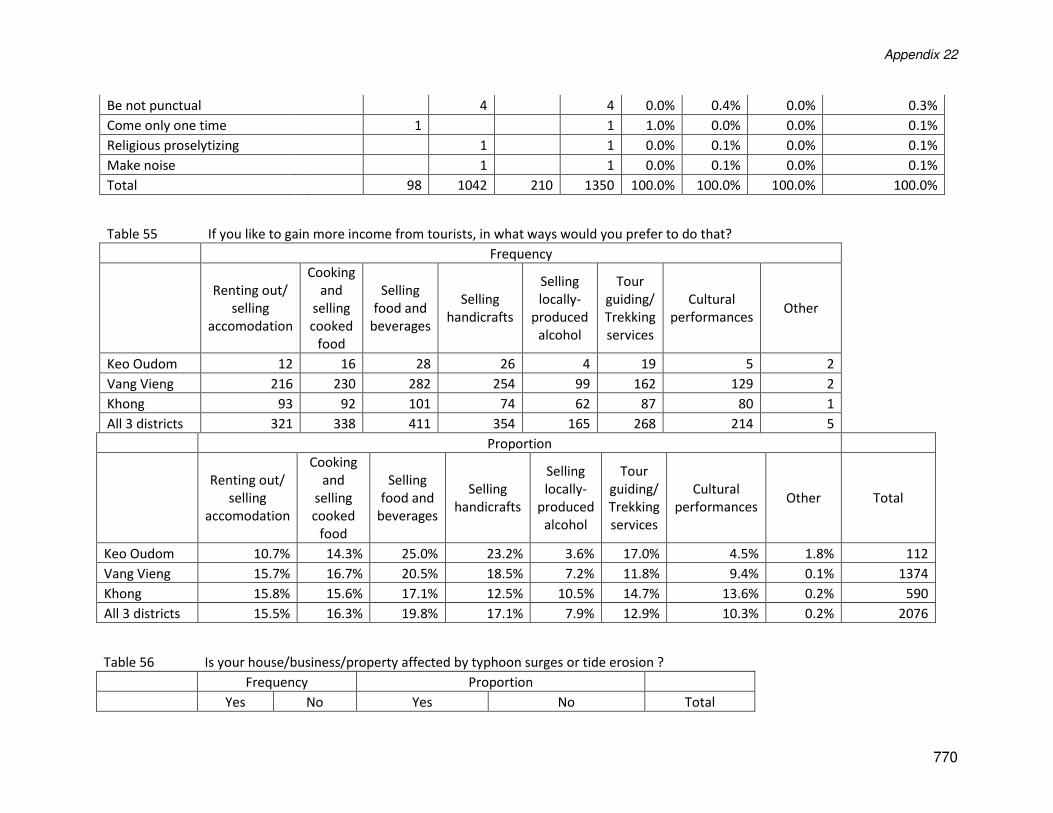
Appendix 22
770
Be not punctual 4 4 0.0% 0.4% 0.0% 0.3%
Come only one time 1 1 1.0% 0.0% 0.0% 0.1%
Religious proselytizing 1 1 0.0% 0.1% 0.0% 0.1%
Make noise 1 1 0.0% 0.1% 0.0% 0.1%
Total 98 1042 210 1350 100.0% 100.0% 100.0% 100.0%
Table 55 If you like to gain more income from tourists, in what ways would you prefer to do that?
Frequency
Renting out/
selling
accomodation
Cooking
and
selling
cooked
food
Selling
food and
beverages
Selling
handicrafts
Selling
locally-
produced
alcohol
Tour
guiding/
Trekking
services
Cultural
performances Other
Keo Oudom 12 16 28 26 4 19 5 2
Vang Vieng 216 230 282 254 99 162 129 2
Khong 93 92 101 74 62 87 80 1
All 3 districts 321 338 411 354 165 268 214 5
Proportion
Renting out/
selling
accomodation
Cooking
and
selling
cooked
food
Selling
food and
beverages
Selling
handicrafts
Selling
locally-
produced
alcohol
Tour
guiding/
Trekking
services
Cultural
performances Other Total
Keo Oudom 10.7% 14.3% 25.0% 23.2% 3.6% 17.0% 4.5% 1.8% 112
Vang Vieng 15.7% 16.7% 20.5% 18.5% 7.2% 11.8% 9.4% 0.1% 1374
Khong 15.8% 15.6% 17.1% 12.5% 10.5% 14.7% 13.6% 0.2% 590
All 3 districts 15.5% 16.3% 19.8% 17.1% 7.9% 12.9% 10.3% 0.2% 2076
Table 56 Is your house/business/property affected by typhoon surges or tide erosion ?
Frequency Proportion
Yes No Yes No Total
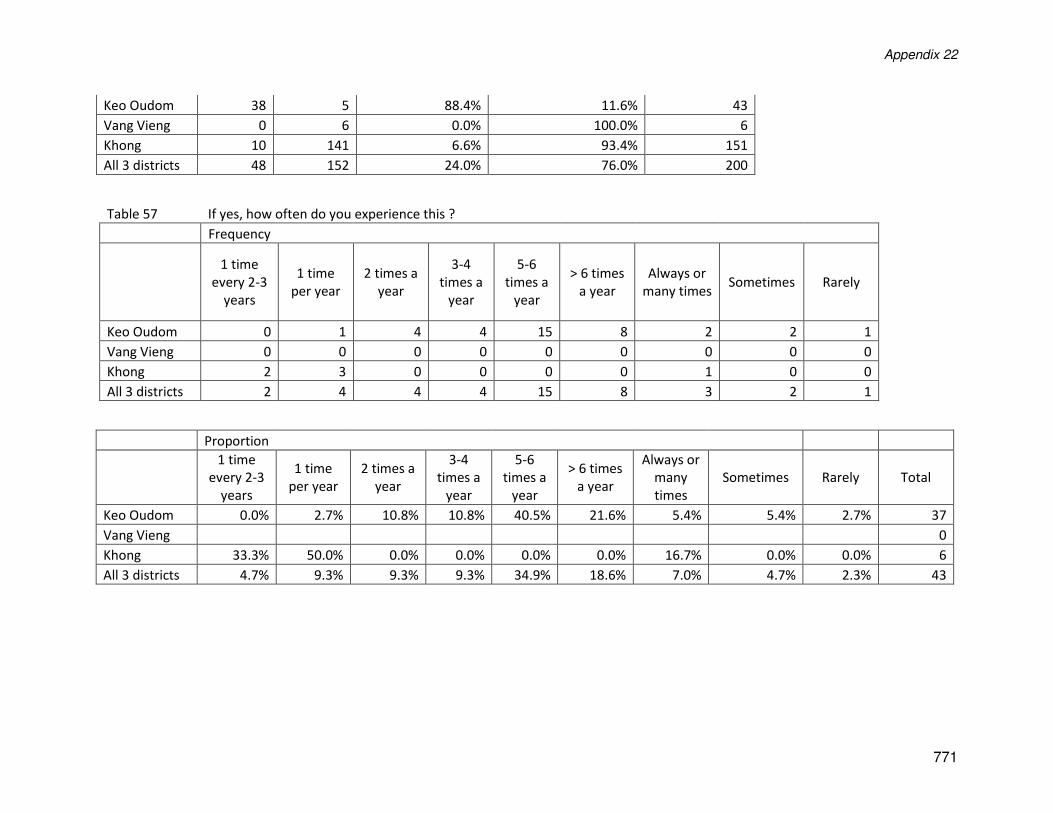
Appendix 22
771
Keo Oudom 38 5 88.4% 11.6% 43
Vang Vieng 0 6 0.0% 100.0% 6
Khong 10 141 6.6% 93.4% 151
All 3 districts 48 152 24.0% 76.0% 200
Table 57 If yes, how often do you experience this ?
Frequency
1 time
every 2-3
years
1 time
per year
2 times a
year
3-4
times a
year
5-6
times a
year
> 6 times
a year
Always or
many times Sometimes Rarely
Keo Oudom 0 1 4 4 15 8 2 2 1
Vang Vieng 0 0 0 0 0 0 0 0 0
Khong 2 3 0 0 0 0 1 0 0
All 3 districts 2 4 4 4 15 8 3 2 1
Proportion
1 time
every 2-3
years
1 time
per year
2 times a
year
3-4
times a
year
5-6
times a
year
> 6 times
a year
Always or
many
times
Sometimes Rarely Total
Keo Oudom 0.0% 2.7% 10.8% 10.8% 40.5% 21.6% 5.4% 5.4% 2.7% 37
Vang Vieng 0
Khong 33.3% 50.0% 0.0% 0.0% 0.0% 0.0% 16.7% 0.0% 0.0% 6
All 3 districts 4.7% 9.3% 9.3% 9.3% 34.9% 18.6% 7.0% 4.7% 2.3% 43
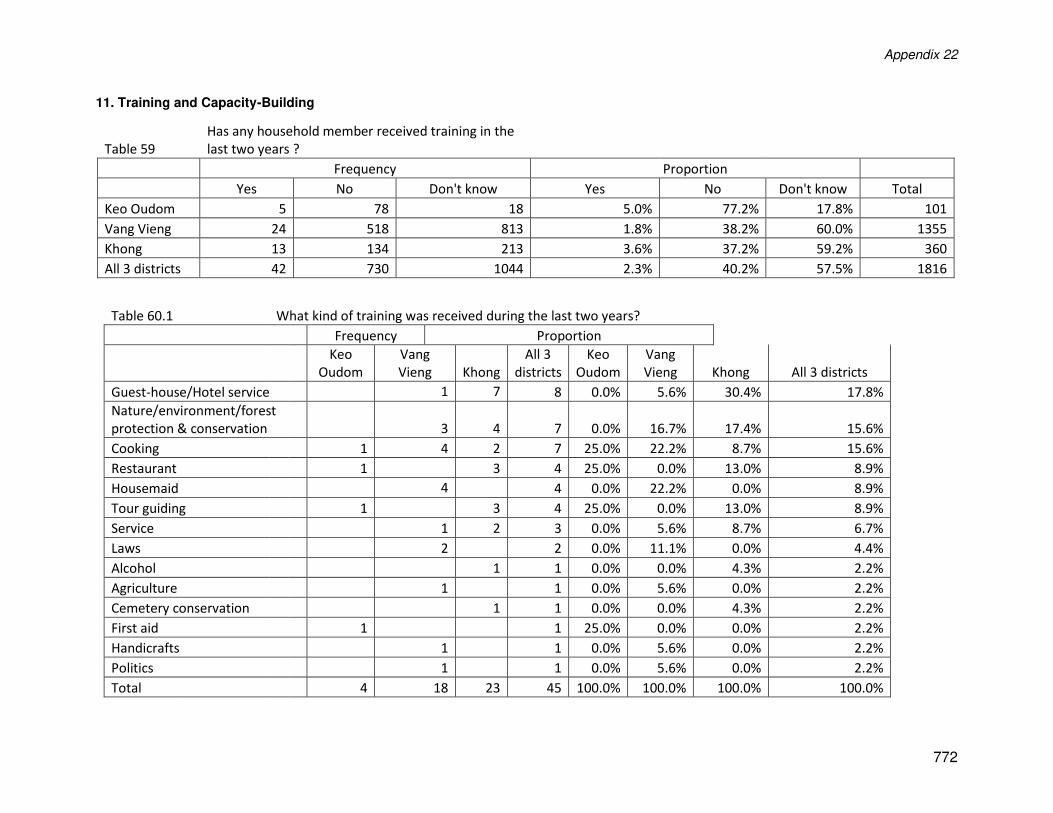
Appendix 22
772
11. Training and Capacity-Building
Table 59
Has any household member received training in the
last two years ?
Frequency Proportion
Yes No Don't know Yes No Don't know Total
Keo Oudom 5 78 18 5.0% 77.2% 17.8% 101
Vang Vieng 24 518 813 1.8% 38.2% 60.0% 1355
Khong 13 134 213 3.6% 37.2% 59.2% 360
All 3 districts 42 730 1044 2.3% 40.2% 57.5% 1816
Table 60.1 What kind of training was received during the last two years?
Frequency Proportion
Keo
Oudom
Vang
Vieng Khong
All 3
districts
Keo
Oudom
Vang
Vieng Khong All 3 districts
Guest-house/Hotel service 1 7 8 0.0% 5.6% 30.4% 17.8%
Nature/environment/forest
protection & conservation 3 4 7 0.0% 16.7% 17.4% 15.6%
Cooking 1 4 2 7 25.0% 22.2% 8.7% 15.6%
Restaurant 1 3 4 25.0% 0.0% 13.0% 8.9%
Housemaid 4 4 0.0% 22.2% 0.0% 8.9%
Tour guiding 1 3 4 25.0% 0.0% 13.0% 8.9%
Service 1 2 3 0.0% 5.6% 8.7% 6.7%
Laws 2 2 0.0% 11.1% 0.0% 4.4%
Alcohol 1 1 0.0% 0.0% 4.3% 2.2%
Agriculture 1 1 0.0% 5.6% 0.0% 2.2%
Cemetery conservation 1 1 0.0% 0.0% 4.3% 2.2%
First aid 1 1 25.0% 0.0% 0.0% 2.2%
Handicrafts 1 1 0.0% 5.6% 0.0% 2.2%
Politics 1 1 0.0% 5.6% 0.0% 2.2%
Total 4 18 23 45 100.0% 100.0% 100.0% 100.0%
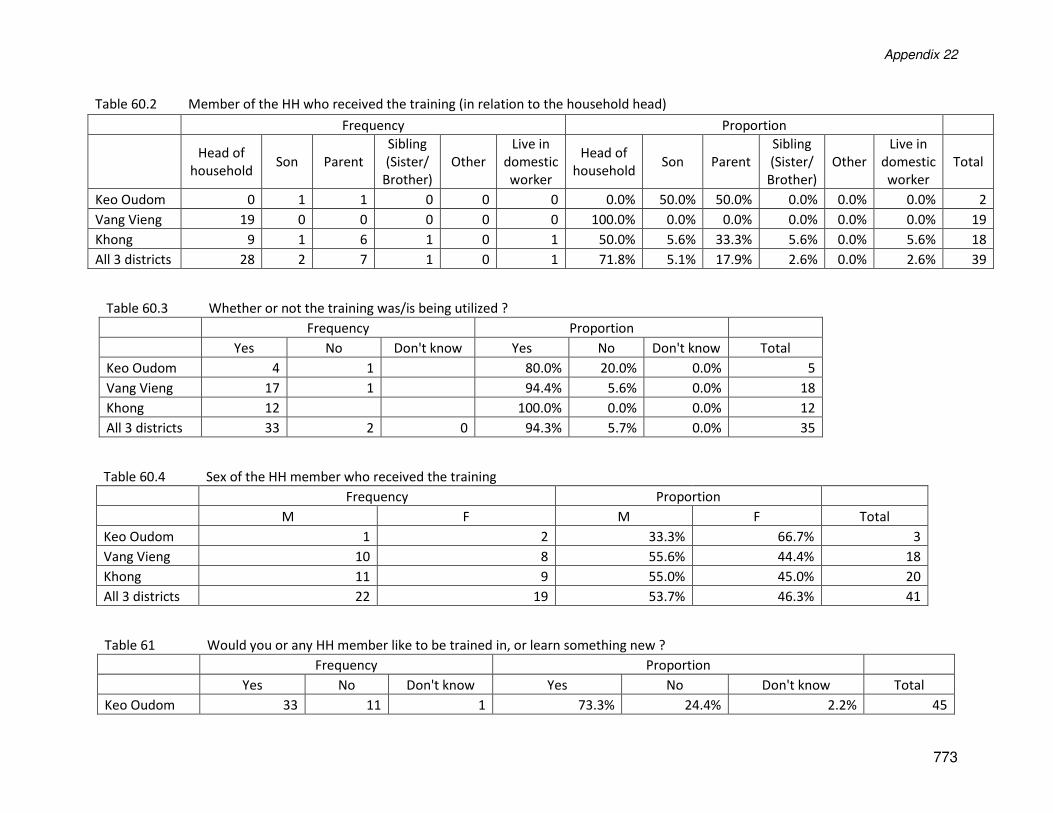
Appendix 22
773
Table 60.2 Member of the HH who received the training (in relation to the household head)
Frequency Proportion
Head of
household Son Parent
Sibling
(Sister/
Brother)
Other
Live in
domestic
worker
Head of
household Son Parent
Sibling
(Sister/
Brother)
Other
Live in
domestic
worker
Total
Keo Oudom 0 1 1 0 0 0 0.0% 50.0% 50.0% 0.0% 0.0% 0.0% 2
Vang Vieng 19 0 0 0 0 0 100.0% 0.0% 0.0% 0.0% 0.0% 0.0% 19
Khong 9 1 6 1 0 1 50.0% 5.6% 33.3% 5.6% 0.0% 5.6% 18
All 3 districts 28 2 7 1 0 1 71.8% 5.1% 17.9% 2.6% 0.0% 2.6% 39
Table 60.3 Whether or not the training was/is being utilized ?
Frequency Proportion
Yes No Don't know Yes No Don't know Total
Keo Oudom 4 1 80.0% 20.0% 0.0% 5
Vang Vieng 17 1 94.4% 5.6% 0.0% 18
Khong 12 100.0% 0.0% 0.0% 12
All 3 districts 33 2 0 94.3% 5.7% 0.0% 35
Table 60.4 Sex of the HH member who received the training
Frequency Proportion
M F M F Total
Keo Oudom 1 2 33.3% 66.7% 3
Vang Vieng 10 8 55.6% 44.4% 18
Khong 11 9 55.0% 45.0% 20
All 3 districts 22 19 53.7% 46.3% 41
Table 61 Would you or any HH member like to be trained in, or learn something new ?
Frequency Proportion
Yes No Don't know Yes No Don't know Total
Keo Oudom 33 11 1 73.3% 24.4% 2.2% 45
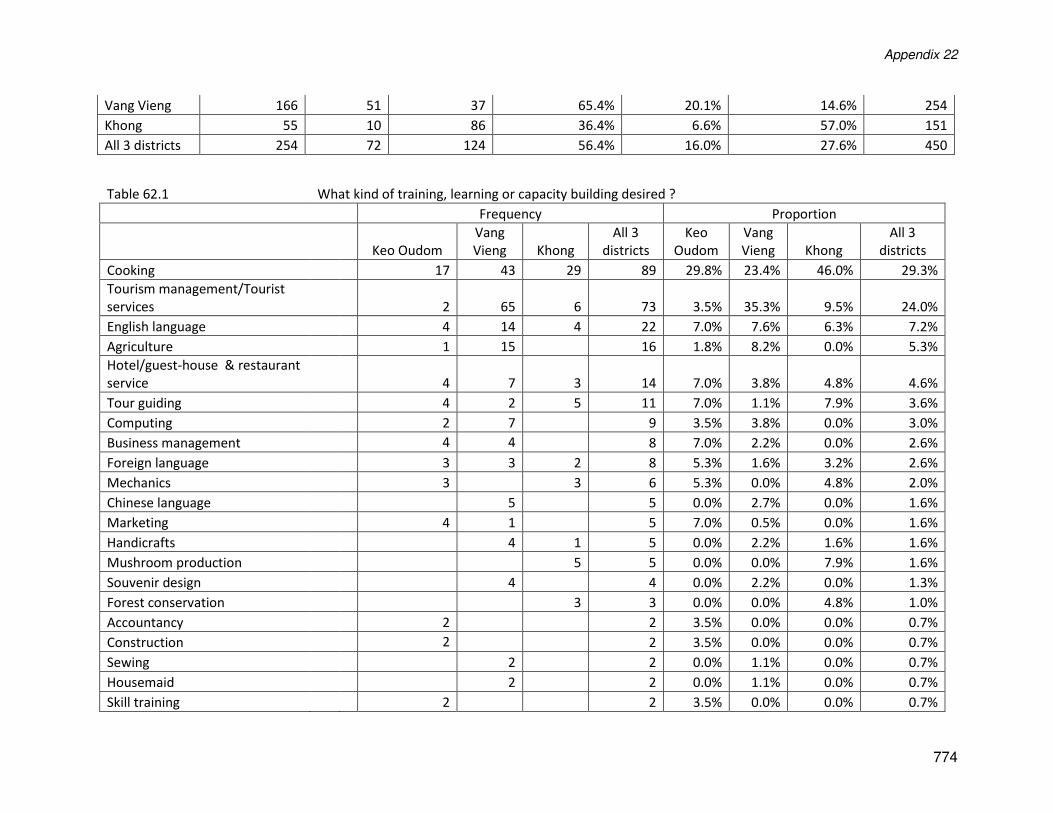
Appendix 22
774
Vang Vieng 166 51 37 65.4% 20.1% 14.6% 254
Khong 55 10 86 36.4% 6.6% 57.0% 151
All 3 districts 254 72 124 56.4% 16.0% 27.6% 450
Table 62.1 What kind of training, learning or capacity building desired ?
Frequency Proportion
Keo Oudom
Vang
Vieng Khong
All 3
districts
Keo
Oudom
Vang
Vieng Khong
All 3
districts
Cooking 17 43 29 89 29.8% 23.4% 46.0% 29.3%
Tourism management/Tourist
services 2 65 6 73 3.5% 35.3% 9.5% 24.0%
English language 4 14 4 22 7.0% 7.6% 6.3% 7.2%
Agriculture 1 15 16 1.8% 8.2% 0.0% 5.3%
Hotel/guest-house & restaurant
service 4 7 3 14 7.0% 3.8% 4.8% 4.6%
Tour guiding 4 2 5 11 7.0% 1.1% 7.9% 3.6%
Computing 2 7 9 3.5% 3.8% 0.0% 3.0%
Business management 4 4 8 7.0% 2.2% 0.0% 2.6%
Foreign language 3 3 2 8 5.3% 1.6% 3.2% 2.6%
Mechanics 3 3 6 5.3% 0.0% 4.8% 2.0%
Chinese language 5 5 0.0% 2.7% 0.0% 1.6%
Marketing 4 1 5 7.0% 0.5% 0.0% 1.6%
Handicrafts 4 1 5 0.0% 2.2% 1.6% 1.6%
Mushroom production 5 5 0.0% 0.0% 7.9% 1.6%
Souvenir design 4 4 0.0% 2.2% 0.0% 1.3%
Forest conservation 3 3 0.0% 0.0% 4.8% 1.0%
Accountancy 2 2 3.5% 0.0% 0.0% 0.7%
Construction 2 2 3.5% 0.0% 0.0% 0.7%
Sewing 2 2 0.0% 1.1% 0.0% 0.7%
Housemaid 2 2 0.0% 1.1% 0.0% 0.7%
Skill training 2 2 3.5% 0.0% 0.0% 0.7%
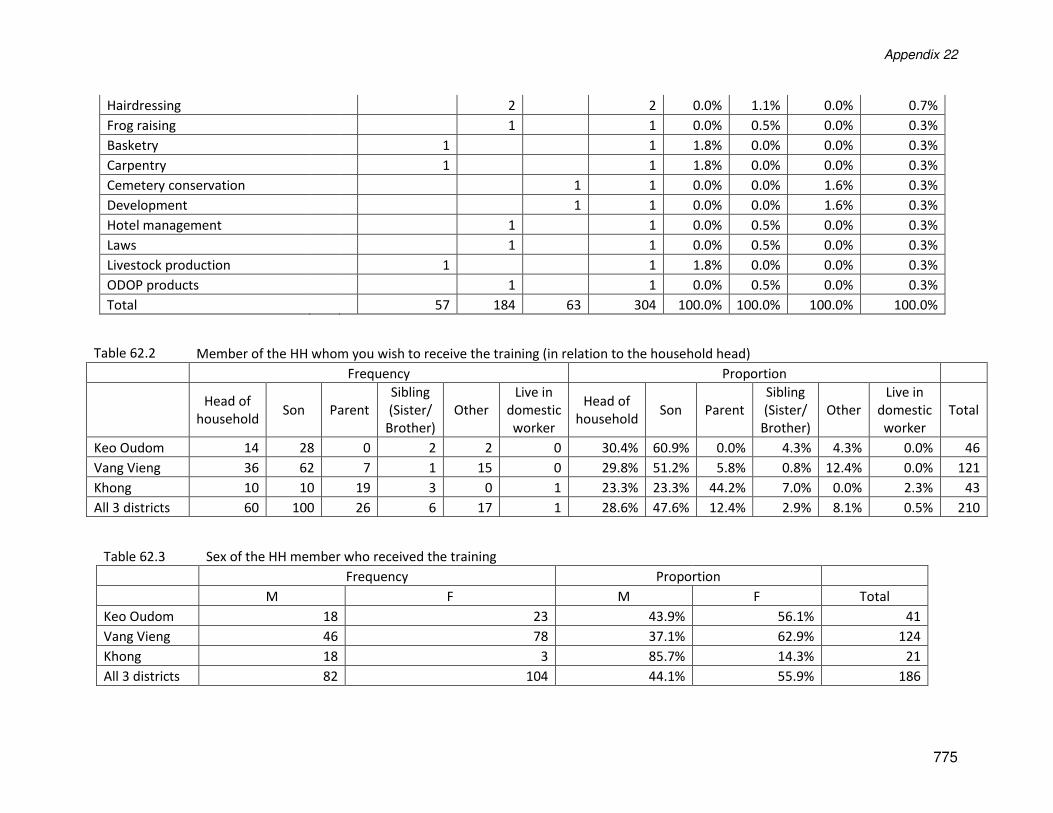
Appendix 22
775
Hairdressing 2 2 0.0% 1.1% 0.0% 0.7%
Frog raising 1 1 0.0% 0.5% 0.0% 0.3%
Basketry 1 1 1.8% 0.0% 0.0% 0.3%
Carpentry 1 1 1.8% 0.0% 0.0% 0.3%
Cemetery conservation 1 1 0.0% 0.0% 1.6% 0.3%
Development 1 1 0.0% 0.0% 1.6% 0.3%
Hotel management 1 1 0.0% 0.5% 0.0% 0.3%
Laws 1 1 0.0% 0.5% 0.0% 0.3%
Livestock production 1 1 1.8% 0.0% 0.0% 0.3%
ODOP products 1 1 0.0% 0.5% 0.0% 0.3%
Total 57 184 63 304 100.0% 100.0% 100.0% 100.0%
Table 62.2 Member of the HH whom you wish to receive the training (in relation to the household head)
Frequency Proportion
Head of
household Son Parent
Sibling
(Sister/
Brother)
Other
Live in
domestic
worker
Head of
household Son Parent
Sibling
(Sister/
Brother)
Other
Live in
domestic
worker
Total
Keo Oudom 14 28 0 2 2 0 30.4% 60.9% 0.0% 4.3% 4.3% 0.0% 46
Vang Vieng 36 62 7 1 15 0 29.8% 51.2% 5.8% 0.8% 12.4% 0.0% 121
Khong 10 10 19 3 0 1 23.3% 23.3% 44.2% 7.0% 0.0% 2.3% 43
All 3 districts 60 100 26 6 17 1 28.6% 47.6% 12.4% 2.9% 8.1% 0.5% 210
Table 62.3 Sex of the HH member who received the training
Frequency Proportion
M F M F Total
Keo Oudom 18 23 43.9% 56.1% 41
Vang Vieng 46 78 37.1% 62.9% 124
Khong 18 3 85.7% 14.3% 21
All 3 districts 82 104 44.1% 55.9% 186
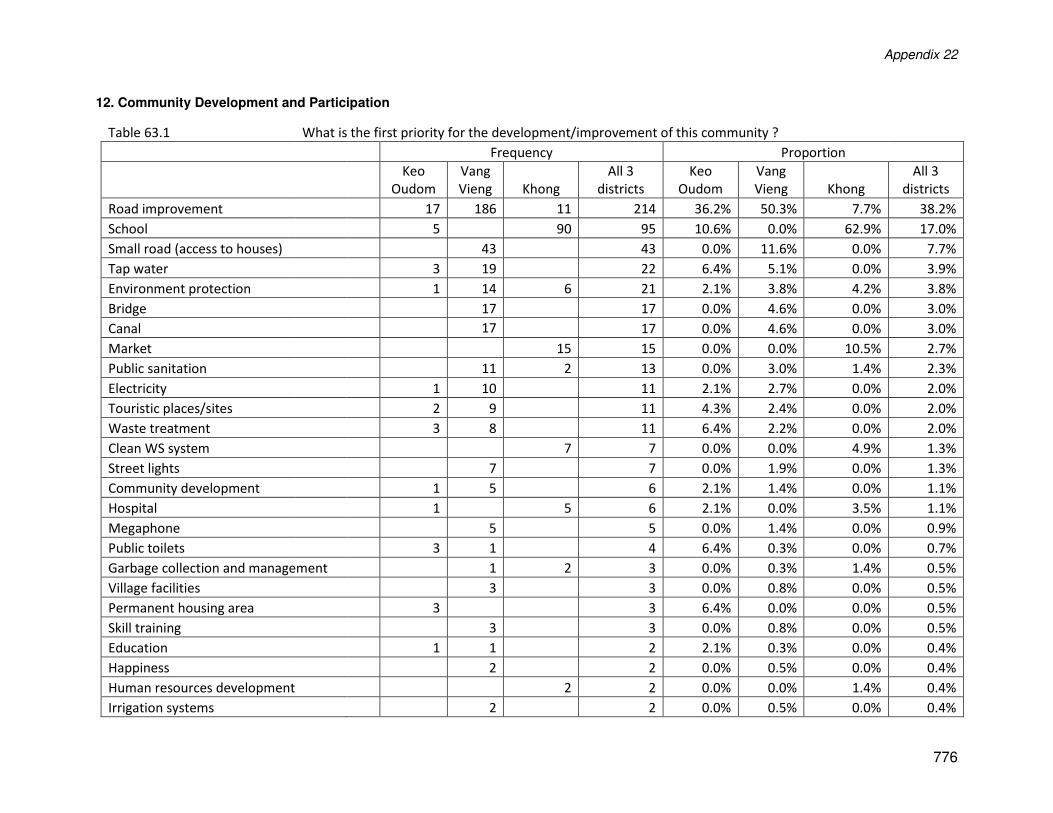
Appendix 22
776
12. Community Development and Participation
Table 63.1 What is the first priority for the development/improvement of this community ?
Frequency Proportion
Keo
Oudom
Vang
Vieng Khong
All 3
districts
Keo
Oudom
Vang
Vieng Khong
All 3
districts
Road improvement 17 186 11 214 36.2% 50.3% 7.7% 38.2%
School 5 90 95 10.6% 0.0% 62.9% 17.0%
Small road (access to houses) 43 43 0.0% 11.6% 0.0% 7.7%
Tap water 3 19 22 6.4% 5.1% 0.0% 3.9%
Environment protection 1 14 6 21 2.1% 3.8% 4.2% 3.8%
Bridge 17 17 0.0% 4.6% 0.0% 3.0%
Canal 17 17 0.0% 4.6% 0.0% 3.0%
Market 15 15 0.0% 0.0% 10.5% 2.7%
Public sanitation 11 2 13 0.0% 3.0% 1.4% 2.3%
Electricity 1 10 11 2.1% 2.7% 0.0% 2.0%
Touristic places/sites 2 9 11 4.3% 2.4% 0.0% 2.0%
Waste treatment 3 8 11 6.4% 2.2% 0.0% 2.0%
Clean WS system 7 7 0.0% 0.0% 4.9% 1.3%
Street lights 7 7 0.0% 1.9% 0.0% 1.3%
Community development 1 5 6 2.1% 1.4% 0.0% 1.1%
Hospital 1 5 6 2.1% 0.0% 3.5% 1.1%
Megaphone 5 5 0.0% 1.4% 0.0% 0.9%
Public toilets 3 1 4 6.4% 0.3% 0.0% 0.7%
Garbage collection and management 1 2 3 0.0% 0.3% 1.4% 0.5%
Village facilities 3 3 0.0% 0.8% 0.0% 0.5%
Permanent housing area 3 3 6.4% 0.0% 0.0% 0.5%
Skill training 3 3 0.0% 0.8% 0.0% 0.5%
Education 1 1 2 2.1% 0.3% 0.0% 0.4%
Happiness 2 2 0.0% 0.5% 0.0% 0.4%
Human resources development 2 2 0.0% 0.0% 1.4% 0.4%
Irrigation systems 2 2 0.0% 0.5% 0.0% 0.4%
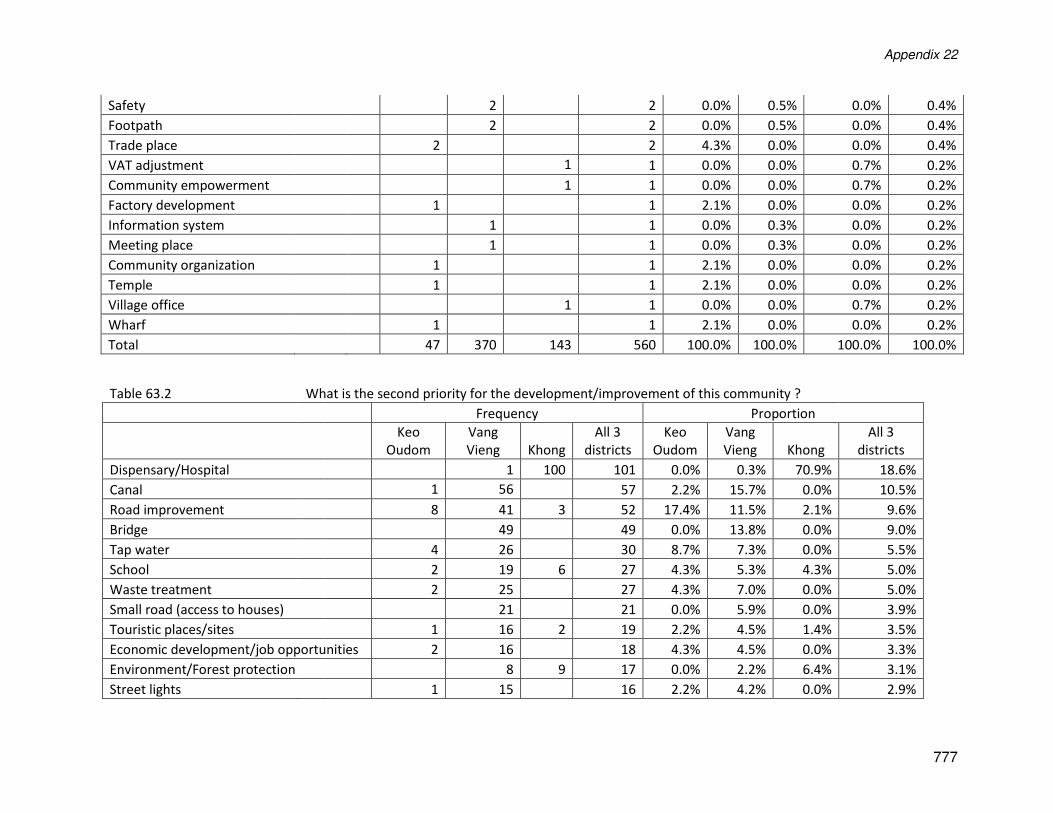
Appendix 22
777
Safety 2 2 0.0% 0.5% 0.0% 0.4%
Footpath 2 2 0.0% 0.5% 0.0% 0.4%
Trade place 2 2 4.3% 0.0% 0.0% 0.4%
VAT adjustment 1 1 0.0% 0.0% 0.7% 0.2%
Community empowerment 1 1 0.0% 0.0% 0.7% 0.2%
Factory development 1 1 2.1% 0.0% 0.0% 0.2%
Information system 1 1 0.0% 0.3% 0.0% 0.2%
Meeting place 1 1 0.0% 0.3% 0.0% 0.2%
Community organization 1 1 2.1% 0.0% 0.0% 0.2%
Temple 1 1 2.1% 0.0% 0.0% 0.2%
Village office 1 1 0.0% 0.0% 0.7% 0.2%
Wharf 1 1 2.1% 0.0% 0.0% 0.2%
Total 47 370 143 560 100.0% 100.0% 100.0% 100.0%
Table 63.2 What is the second priority for the development/improvement of this community ?
Frequency Proportion
Keo
Oudom
Vang
Vieng Khong
All 3
districts
Keo
Oudom
Vang
Vieng Khong
All 3
districts
Dispensary/Hospital 1 100 101 0.0% 0.3% 70.9% 18.6%
Canal 1 56 57 2.2% 15.7% 0.0% 10.5%
Road improvement 8 41 3 52 17.4% 11.5% 2.1% 9.6%
Bridge 49 49 0.0% 13.8% 0.0% 9.0%
Tap water 4 26 30 8.7% 7.3% 0.0% 5.5%
School 2 19 6 27 4.3% 5.3% 4.3% 5.0%
Waste treatment 2 25 27 4.3% 7.0% 0.0% 5.0%
Small road (access to houses) 21 21 0.0% 5.9% 0.0% 3.9%
Touristic places/sites 1 16 2 19 2.2% 4.5% 1.4% 3.5%
Economic development/job opportunities 2 16 18 4.3% 4.5% 0.0% 3.3%
Environment/Forest protection 8 9 17 0.0% 2.2% 6.4% 3.1%
Street lights 1 15 16 2.2% 4.2% 0.0% 2.9%
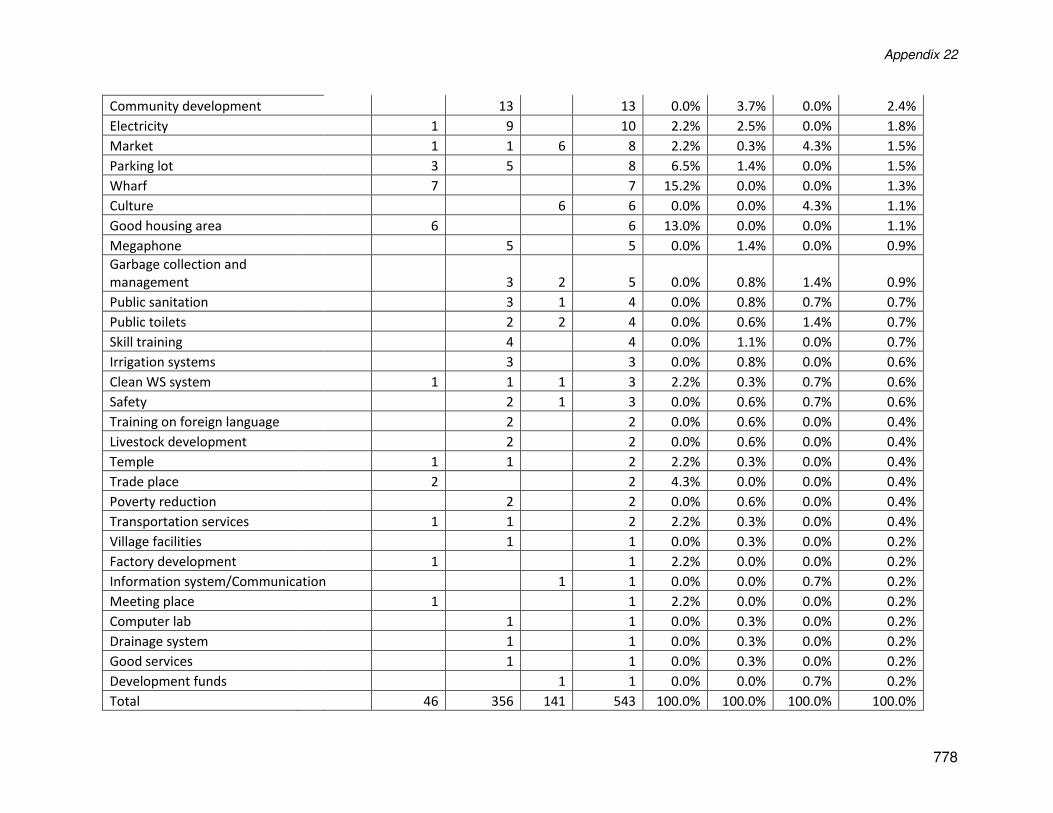
Appendix 22
778
Community development 13 13 0.0% 3.7% 0.0% 2.4%
Electricity 1 9 10 2.2% 2.5% 0.0% 1.8%
Market 1 1 6 8 2.2% 0.3% 4.3% 1.5%
Parking lot 3 5 8 6.5% 1.4% 0.0% 1.5%
Wharf 7 7 15.2% 0.0% 0.0% 1.3%
Culture 6 6 0.0% 0.0% 4.3% 1.1%
Good housing area 6 6 13.0% 0.0% 0.0% 1.1%
Megaphone 5 5 0.0% 1.4% 0.0% 0.9%
Garbage collection and
management 3 2 5 0.0% 0.8% 1.4% 0.9%
Public sanitation 3 1 4 0.0% 0.8% 0.7% 0.7%
Public toilets 2 2 4 0.0% 0.6% 1.4% 0.7%
Skill training 4 4 0.0% 1.1% 0.0% 0.7%
Irrigation systems 3 3 0.0% 0.8% 0.0% 0.6%
Clean WS system 1 1 1 3 2.2% 0.3% 0.7% 0.6%
Safety 2 1 3 0.0% 0.6% 0.7% 0.6%
Training on foreign language 2 2 0.0% 0.6% 0.0% 0.4%
Livestock development 2 2 0.0% 0.6% 0.0% 0.4%
Temple 1 1 2 2.2% 0.3% 0.0% 0.4%
Trade place 2 2 4.3% 0.0% 0.0% 0.4%
Poverty reduction 2 2 0.0% 0.6% 0.0% 0.4%
Transportation services 1 1 2 2.2% 0.3% 0.0% 0.4%
Village facilities 1 1 0.0% 0.3% 0.0% 0.2%
Factory development 1 1 2.2% 0.0% 0.0% 0.2%
Information system/Communication 1 1 0.0% 0.0% 0.7% 0.2%
Meeting place 1 1 2.2% 0.0% 0.0% 0.2%
Computer lab 1 1 0.0% 0.3% 0.0% 0.2%
Drainage system 1 1 0.0% 0.3% 0.0% 0.2%
Good services 1 1 0.0% 0.3% 0.0% 0.2%
Development funds 1 1 0.0% 0.0% 0.7% 0.2%
Total 46 356 141 543 100.0% 100.0% 100.0% 100.0%
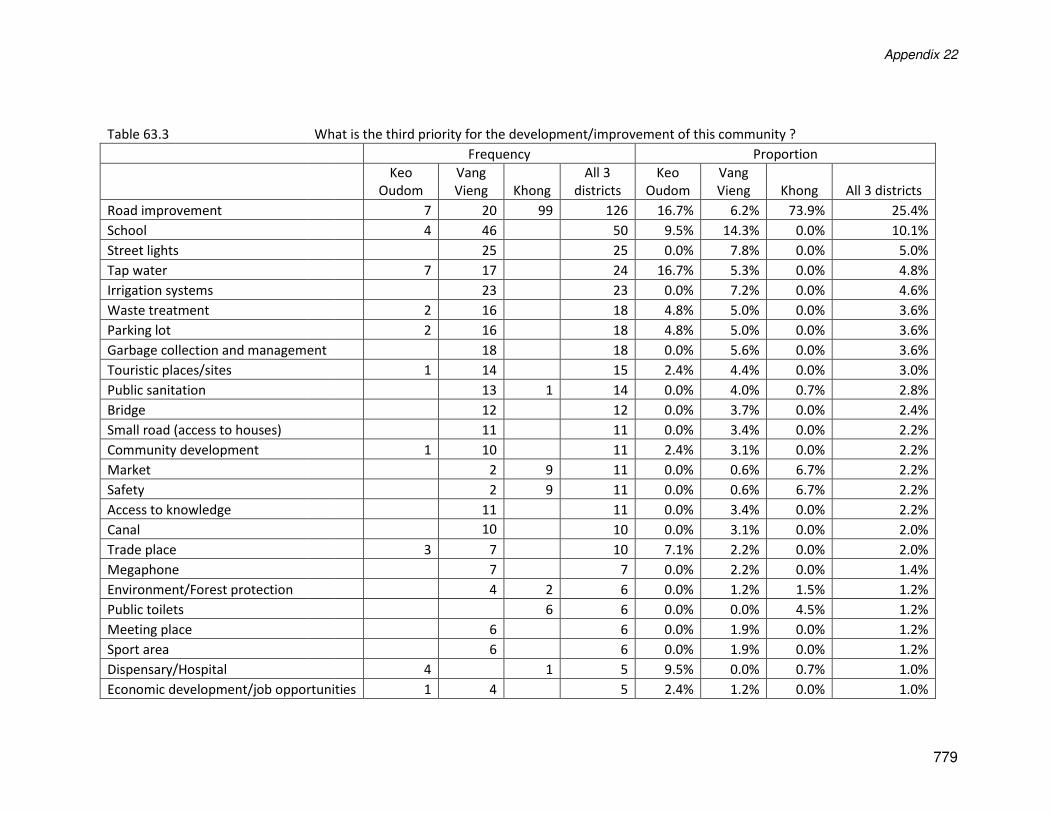
Appendix 22
779
Table 63.3 What is the third priority for the development/improvement of this community ?
Frequency Proportion
Keo
Oudom
Vang
Vieng Khong
All 3
districts
Keo
Oudom
Vang
Vieng Khong All 3 districts
Road improvement 7 20 99 126 16.7% 6.2% 73.9% 25.4%
School 4 46 50 9.5% 14.3% 0.0% 10.1%
Street lights 25 25 0.0% 7.8% 0.0% 5.0%
Tap water 7 17 24 16.7% 5.3% 0.0% 4.8%
Irrigation systems 23 23 0.0% 7.2% 0.0% 4.6%
Waste treatment 2 16 18 4.8% 5.0% 0.0% 3.6%
Parking lot 2 16 18 4.8% 5.0% 0.0% 3.6%
Garbage collection and management 18 18 0.0% 5.6% 0.0% 3.6%
Touristic places/sites 1 14 15 2.4% 4.4% 0.0% 3.0%
Public sanitation 13 1 14 0.0% 4.0% 0.7% 2.8%
Bridge 12 12 0.0% 3.7% 0.0% 2.4%
Small road (access to houses) 11 11 0.0% 3.4% 0.0% 2.2%
Community development 1 10 11 2.4% 3.1% 0.0% 2.2%
Market 2 9 11 0.0% 0.6% 6.7% 2.2%
Safety 2 9 11 0.0% 0.6% 6.7% 2.2%
Access to knowledge 11 11 0.0% 3.4% 0.0% 2.2%
Canal 10 10 0.0% 3.1% 0.0% 2.0%
Trade place 3 7 10 7.1% 2.2% 0.0% 2.0%
Megaphone 7 7 0.0% 2.2% 0.0% 1.4%
Environment/Forest protection 4 2 6 0.0% 1.2% 1.5% 1.2%
Public toilets 6 6 0.0% 0.0% 4.5% 1.2%
Meeting place 6 6 0.0% 1.9% 0.0% 1.2%
Sport area 6 6 0.0% 1.9% 0.0% 1.2%
Dispensary/Hospital 4 1 5 9.5% 0.0% 0.7% 1.0%
Economic development/job opportunities 1 4 5 2.4% 1.2% 0.0% 1.0%
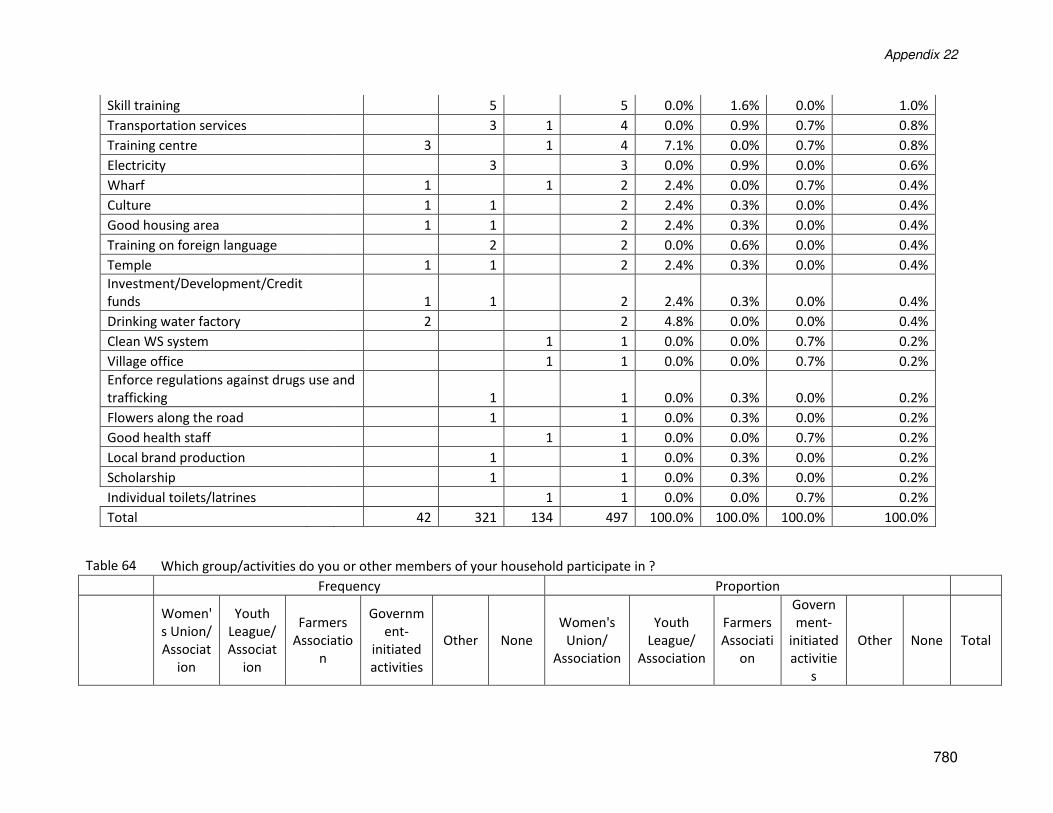
Appendix 22
780
Skill training 5 5 0.0% 1.6% 0.0% 1.0%
Transportation services 3 1 4 0.0% 0.9% 0.7% 0.8%
Training centre 3 1 4 7.1% 0.0% 0.7% 0.8%
Electricity 3 3 0.0% 0.9% 0.0% 0.6%
Wharf 1 1 2 2.4% 0.0% 0.7% 0.4%
Culture 1 1 2 2.4% 0.3% 0.0% 0.4%
Good housing area 1 1 2 2.4% 0.3% 0.0% 0.4%
Training on foreign language 2 2 0.0% 0.6% 0.0% 0.4%
Temple 1 1 2 2.4% 0.3% 0.0% 0.4%
Investment/Development/Credit
funds 1 1 2 2.4% 0.3% 0.0% 0.4%
Drinking water factory 2 2 4.8% 0.0% 0.0% 0.4%
Clean WS system 1 1 0.0% 0.0% 0.7% 0.2%
Village office 1 1 0.0% 0.0% 0.7% 0.2%
Enforce regulations against drugs use and
trafficking 1 1 0.0% 0.3% 0.0% 0.2%
Flowers along the road 1 1 0.0% 0.3% 0.0% 0.2%
Good health staff 1 1 0.0% 0.0% 0.7% 0.2%
Local brand production 1 1 0.0% 0.3% 0.0% 0.2%
Scholarship 1 1 0.0% 0.3% 0.0% 0.2%
Individual toilets/latrines 1 1 0.0% 0.0% 0.7% 0.2%
Total 42 321 134 497 100.0% 100.0% 100.0% 100.0%
Table 64 Which group/activities do you or other members of your household participate in ?
Frequency Proportion
Women'
s Union/
Associat
ion
Youth
League/
Associat
ion
Farmers
Associatio
n
Governm
ent-
initiated
activities
Other None
Women's
Union/
Association
Youth
League/
Association
Farmers
Associati
on
Govern
ment-
initiated
activitie
s
Other None Total
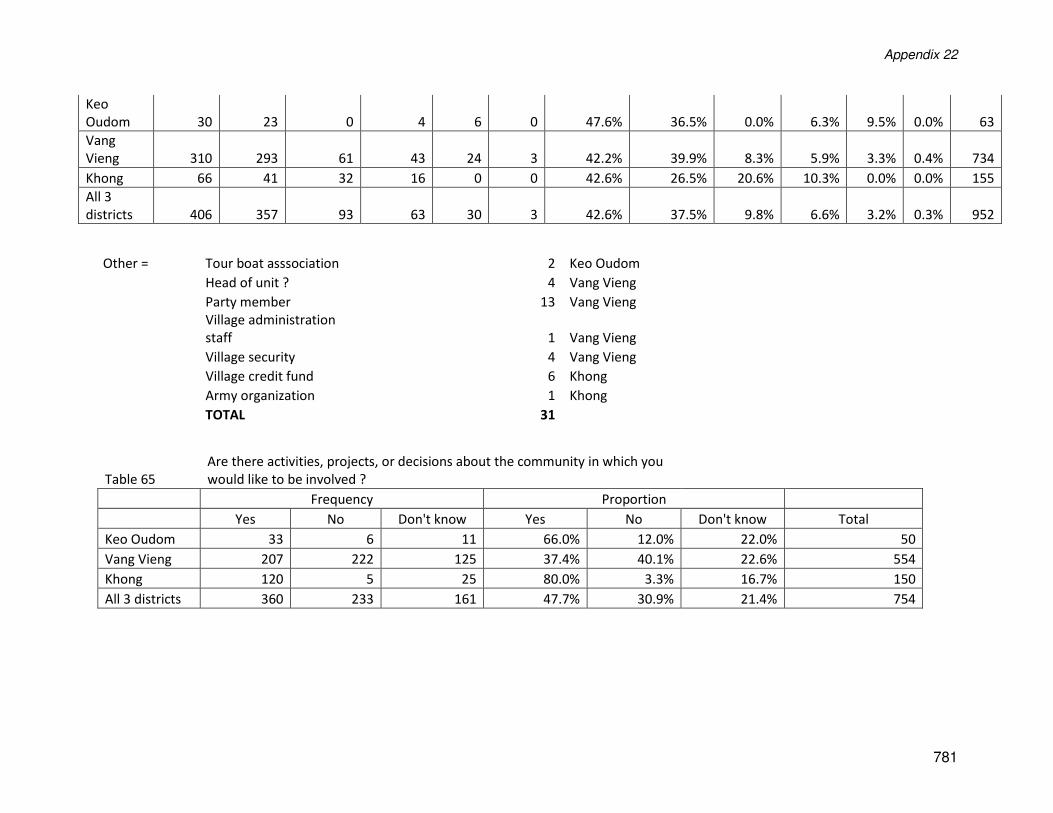
Appendix 22
781
Keo
Oudom 30 23 0 4 6 0 47.6% 36.5% 0.0% 6.3% 9.5% 0.0% 63
Vang
Vieng 310 293 61 43 24 3 42.2% 39.9% 8.3% 5.9% 3.3% 0.4% 734
Khong 66 41 32 16 0 0 42.6% 26.5% 20.6% 10.3% 0.0% 0.0% 155
All 3
districts 406 357 93 63 30 3 42.6% 37.5% 9.8% 6.6% 3.2% 0.3% 952
Other = Tour boat asssociation 2 Keo Oudom
Head of unit ? 4 Vang Vieng
Party member 13 Vang Vieng
Village administration
staff 1 Vang Vieng
Village security 4 Vang Vieng
Village credit fund 6 Khong
Army organization 1 Khong
TOTAL 31
Table 65
Are there activities, projects, or decisions about the community in which you
would like to be involved ?
Frequency Proportion
Yes No Don't know Yes No Don't know Total
Keo Oudom 33 6 11 66.0% 12.0% 22.0% 50
Vang Vieng 207 222 125 37.4% 40.1% 22.6% 554
Khong 120 5 25 80.0% 3.3% 16.7% 150
All 3 districts 360 233 161 47.7% 30.9% 21.4% 754
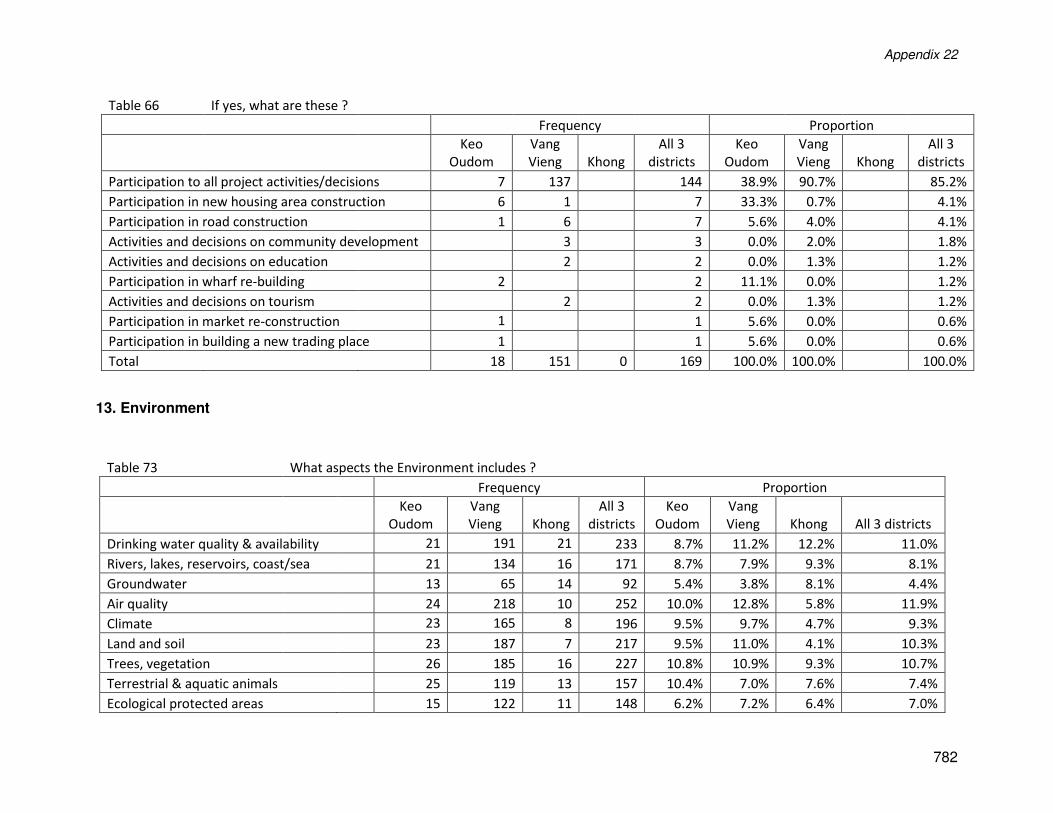
Appendix 22
782
Table 66 If yes, what are these ?
Frequency Proportion
Keo
Oudom
Vang
Vieng Khong
All 3
districts
Keo
Oudom
Vang
Vieng Khong
All 3
districts
Participation to all project activities/decisions 7 137 144 38.9% 90.7% 85.2%
Participation in new housing area construction 6 1 7 33.3% 0.7% 4.1%
Participation in road construction 1 6 7 5.6% 4.0% 4.1%
Activities and decisions on community development 3 3 0.0% 2.0% 1.8%
Activities and decisions on education 2 2 0.0% 1.3% 1.2%
Participation in wharf re-building 2 2 11.1% 0.0% 1.2%
Activities and decisions on tourism 2 2 0.0% 1.3% 1.2%
Participation in market re-construction 1 1 5.6% 0.0% 0.6%
Participation in building a new trading place 1 1 5.6% 0.0% 0.6%
Total 18 151 0 169 100.0% 100.0% 100.0%
13. Environment
Table 73 What aspects the Environment includes ?
Frequency Proportion
Keo
Oudom
Vang
Vieng Khong
All 3
districts
Keo
Oudom
Vang
Vieng Khong All 3 districts
Drinking water quality & availability 21 191 21 233 8.7% 11.2% 12.2% 11.0%
Rivers, lakes, reservoirs, coast/sea 21 134 16 171 8.7% 7.9% 9.3% 8.1%
Groundwater 13 65 14 92 5.4% 3.8% 8.1% 4.4%
Air quality 24 218 10 252 10.0% 12.8% 5.8% 11.9%
Climate 23 165 8 196 9.5% 9.7% 4.7% 9.3%
Land and soil 23 187 7 217 9.5% 11.0% 4.1% 10.3%
Trees, vegetation 26 185 16 227 10.8% 10.9% 9.3% 10.7%
Terrestrial & aquatic animals 25 119 13 157 10.4% 7.0% 7.6% 7.4%
Ecological protected areas 15 122 11 148 6.2% 7.2% 6.4% 7.0%
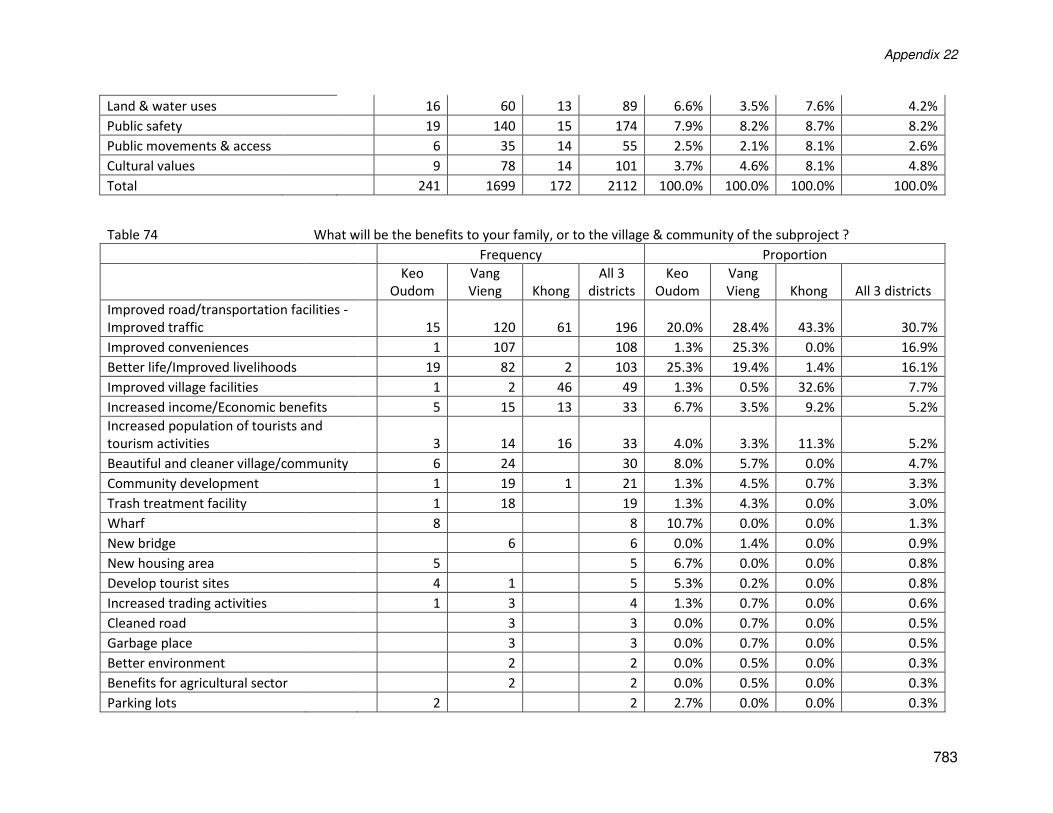
Appendix 22
783
Land & water uses 16 60 13 89 6.6% 3.5% 7.6% 4.2%
Public safety 19 140 15 174 7.9% 8.2% 8.7% 8.2%
Public movements & access 6 35 14 55 2.5% 2.1% 8.1% 2.6%
Cultural values 9 78 14 101 3.7% 4.6% 8.1% 4.8%
Total 241 1699 172 2112 100.0% 100.0% 100.0% 100.0%
Table 74 What will be the benefits to your family, or to the village & community of the subproject ?
Frequency Proportion
Keo
Oudom
Vang
Vieng Khong
All 3
districts
Keo
Oudom
Vang
Vieng Khong All 3 districts
Improved road/transportation facilities -
Improved traffic 15 120 61 196 20.0% 28.4% 43.3% 30.7%
Improved conveniences 1 107 108 1.3% 25.3% 0.0% 16.9%
Better life/Improved livelihoods 19 82 2 103 25.3% 19.4% 1.4% 16.1%
Improved village facilities 1 2 46 49 1.3% 0.5% 32.6% 7.7%
Increased income/Economic benefits 5 15 13 33 6.7% 3.5% 9.2% 5.2%
Increased population of tourists and
tourism activities 3 14 16 33 4.0% 3.3% 11.3% 5.2%
Beautiful and cleaner village/community 6 24 30 8.0% 5.7% 0.0% 4.7%
Community development 1 19 1 21 1.3% 4.5% 0.7% 3.3%
Trash treatment facility 1 18 19 1.3% 4.3% 0.0% 3.0%
Wharf 8 8 10.7% 0.0% 0.0% 1.3%
New bridge 6 6 0.0% 1.4% 0.0% 0.9%
New housing area 5 5 6.7% 0.0% 0.0% 0.8%
Develop tourist sites 4 1 5 5.3% 0.2% 0.0% 0.8%
Increased trading activities 1 3 4 1.3% 0.7% 0.0% 0.6%
Cleaned road 3 3 0.0% 0.7% 0.0% 0.5%
Garbage place 3 3 0.0% 0.7% 0.0% 0.5%
Better environment 2 2 0.0% 0.5% 0.0% 0.3%
Benefits for agricultural sector 2 2 0.0% 0.5% 0.0% 0.3%
Parking lots 2 2 2.7% 0.0% 0.0% 0.3%
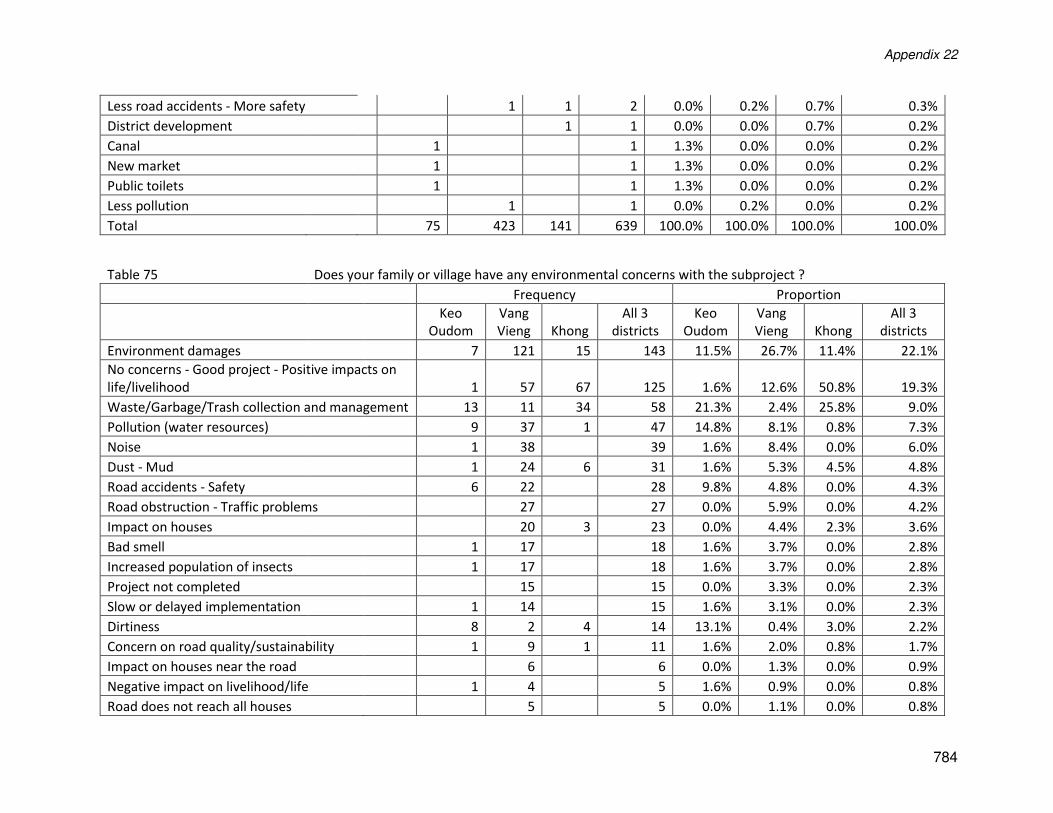
Appendix 22
784
Less road accidents - More safety 1 1 2 0.0% 0.2% 0.7% 0.3%
District development 1 1 0.0% 0.0% 0.7% 0.2%
Canal 1 1 1.3% 0.0% 0.0% 0.2%
New market 1 1 1.3% 0.0% 0.0% 0.2%
Public toilets 1 1 1.3% 0.0% 0.0% 0.2%
Less pollution 1 1 0.0% 0.2% 0.0% 0.2%
Total 75 423 141 639 100.0% 100.0% 100.0% 100.0%
Table 75 Does your family or village have any environmental concerns with the subproject ?
Frequency Proportion
Keo
Oudom
Vang
Vieng Khong
All 3
districts
Keo
Oudom
Vang
Vieng Khong
All 3
districts
Environment damages 7 121 15 143 11.5% 26.7% 11.4% 22.1%
No concerns - Good project - Positive impacts on
life/livelihood 1 57 67 125 1.6% 12.6% 50.8% 19.3%
Waste/Garbage/Trash collection and management 13 11 34 58 21.3% 2.4% 25.8% 9.0%
Pollution (water resources) 9 37 1 47 14.8% 8.1% 0.8% 7.3%
Noise 1 38 39 1.6% 8.4% 0.0% 6.0%
Dust - Mud 1 24 6 31 1.6% 5.3% 4.5% 4.8%
Road accidents - Safety 6 22 28 9.8% 4.8% 0.0% 4.3%
Road obstruction - Traffic problems 27 27 0.0% 5.9% 0.0% 4.2%
Impact on houses 20 3 23 0.0% 4.4% 2.3% 3.6%
Bad smell 1 17 18 1.6% 3.7% 0.0% 2.8%
Increased population of insects 1 17 18 1.6% 3.7% 0.0% 2.8%
Project not completed 15 15 0.0% 3.3% 0.0% 2.3%
Slow or delayed implementation 1 14 15 1.6% 3.1% 0.0% 2.3%
Dirtiness 8 2 4 14 13.1% 0.4% 3.0% 2.2%
Concern on road quality/sustainability 1 9 1 11 1.6% 2.0% 0.8% 1.7%
Impact on houses near the road 6 6 0.0% 1.3% 0.0% 0.9%
Negative impact on livelihood/life 1 4 5 1.6% 0.9% 0.0% 0.8%
Road does not reach all houses 5 5 0.0% 1.1% 0.0% 0.8%
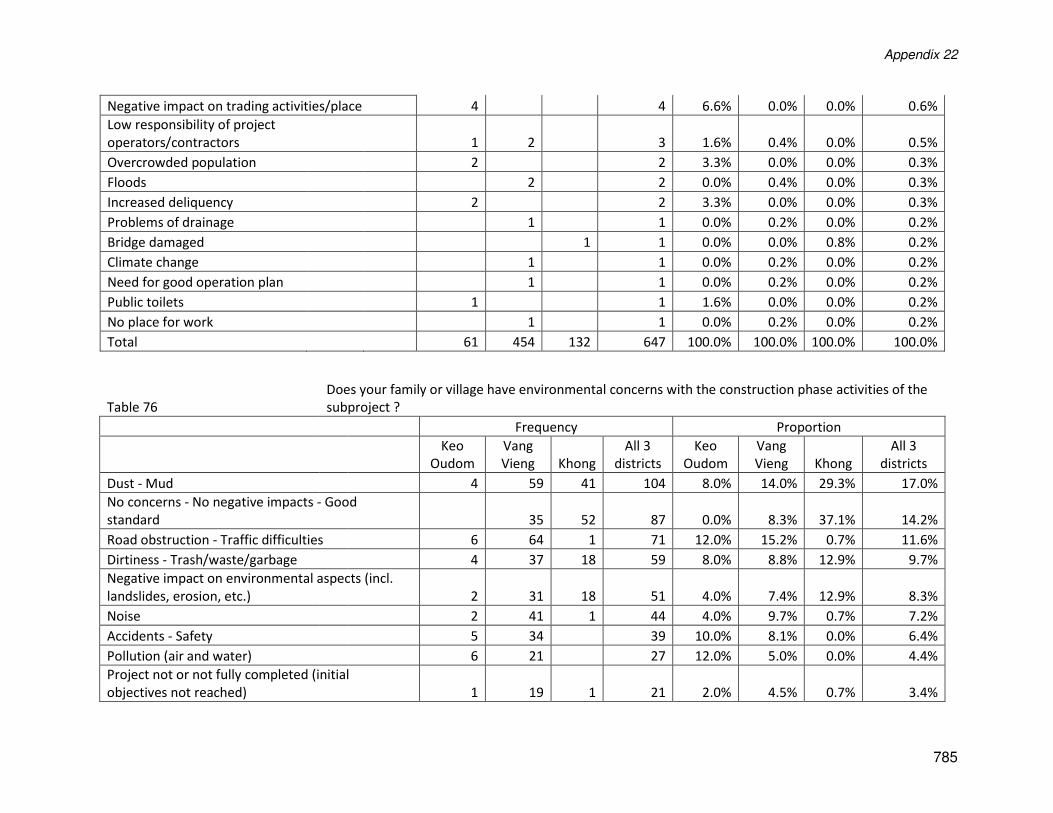
Appendix 22
785
Negative impact on trading activities/place 4 4 6.6% 0.0% 0.0% 0.6%
Low responsibility of project
operators/contractors 1 2 3 1.6% 0.4% 0.0% 0.5%
Overcrowded population 2 2 3.3% 0.0% 0.0% 0.3%
Floods 2 2 0.0% 0.4% 0.0% 0.3%
Increased deliquency 2 2 3.3% 0.0% 0.0% 0.3%
Problems of drainage 1 1 0.0% 0.2% 0.0% 0.2%
Bridge damaged 1 1 0.0% 0.0% 0.8% 0.2%
Climate change 1 1 0.0% 0.2% 0.0% 0.2%
Need for good operation plan 1 1 0.0% 0.2% 0.0% 0.2%
Public toilets 1 1 1.6% 0.0% 0.0% 0.2%
No place for work 1 1 0.0% 0.2% 0.0% 0.2%
Total 61 454 132 647 100.0% 100.0% 100.0% 100.0%
Table 76
Does your family or village have environmental concerns with the construction phase activities of the
subproject ?
Frequency Proportion
Keo
Oudom
Vang
Vieng Khong
All 3
districts
Keo
Oudom
Vang
Vieng Khong
All 3
districts
Dust - Mud 4 59 41 104 8.0% 14.0% 29.3% 17.0%
No concerns - No negative impacts - Good
standard 35 52 87 0.0% 8.3% 37.1% 14.2%
Road obstruction - Traffic difficulties 6 64 1 71 12.0% 15.2% 0.7% 11.6%
Dirtiness - Trash/waste/garbage 4 37 18 59 8.0% 8.8% 12.9% 9.7%
Negative impact on environmental aspects (incl.
landslides, erosion, etc.) 2 31 18 51 4.0% 7.4% 12.9% 8.3%
Noise 2 41 1 44 4.0% 9.7% 0.7% 7.2%
Accidents - Safety 5 34 39 10.0% 8.1% 0.0% 6.4%
Pollution (air and water) 6 21 27 12.0% 5.0% 0.0% 4.4%
Project not or not fully completed (initial
objectives not reached) 1 19 1 21 2.0% 4.5% 0.7% 3.4%
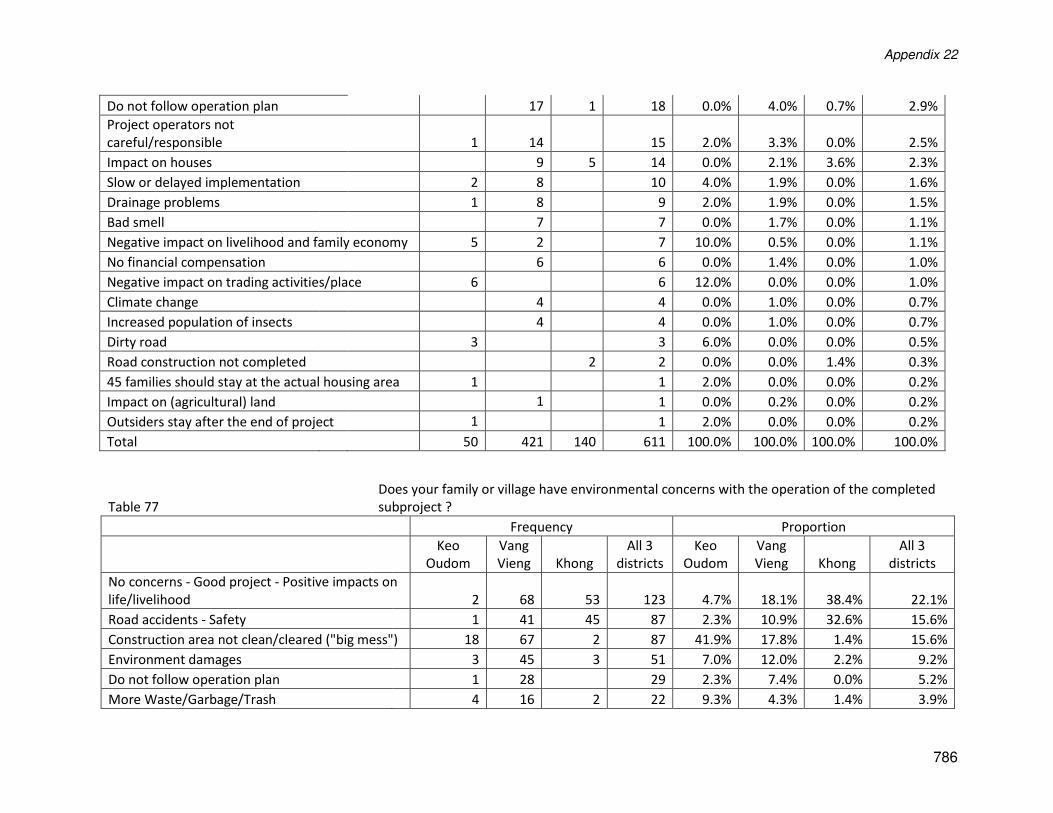
Appendix 22
786
Do not follow operation plan 17 1 18 0.0% 4.0% 0.7% 2.9%
Project operators not
careful/responsible 1 14 15 2.0% 3.3% 0.0% 2.5%
Impact on houses 9 5 14 0.0% 2.1% 3.6% 2.3%
Slow or delayed implementation 2 8 10 4.0% 1.9% 0.0% 1.6%
Drainage problems 1 8 9 2.0% 1.9% 0.0% 1.5%
Bad smell 7 7 0.0% 1.7% 0.0% 1.1%
Negative impact on livelihood and family economy 5 2 7 10.0% 0.5% 0.0% 1.1%
No financial compensation 6 6 0.0% 1.4% 0.0% 1.0%
Negative impact on trading activities/place 6 6 12.0% 0.0% 0.0% 1.0%
Climate change 4 4 0.0% 1.0% 0.0% 0.7%
Increased population of insects 4 4 0.0% 1.0% 0.0% 0.7%
Dirty road 3 3 6.0% 0.0% 0.0% 0.5%
Road construction not completed 2 2 0.0% 0.0% 1.4% 0.3%
45 families should stay at the actual housing area 1 1 2.0% 0.0% 0.0% 0.2%
Impact on (agricultural) land 1 1 0.0% 0.2% 0.0% 0.2%
Outsiders stay after the end of project 1 1 2.0% 0.0% 0.0% 0.2%
Total 50 421 140 611 100.0% 100.0% 100.0% 100.0%
Table 77
Does your family or village have environmental concerns with the operation of the completed
subproject ?
Frequency Proportion
Keo
Oudom
Vang
Vieng Khong
All 3
districts
Keo
Oudom
Vang
Vieng Khong
All 3
districts
No concerns - Good project - Positive impacts on
life/livelihood 2 68 53 123 4.7% 18.1% 38.4% 22.1%
Road accidents - Safety 1 41 45 87 2.3% 10.9% 32.6% 15.6%
Construction area not clean/cleared ("big mess") 18 67 2 87 41.9% 17.8% 1.4% 15.6%
Environment damages 3 45 3 51 7.0% 12.0% 2.2% 9.2%
Do not follow operation plan 1 28 29 2.3% 7.4% 0.0% 5.2%
More Waste/Garbage/Trash 4 16 2 22 9.3% 4.3% 1.4% 3.9%
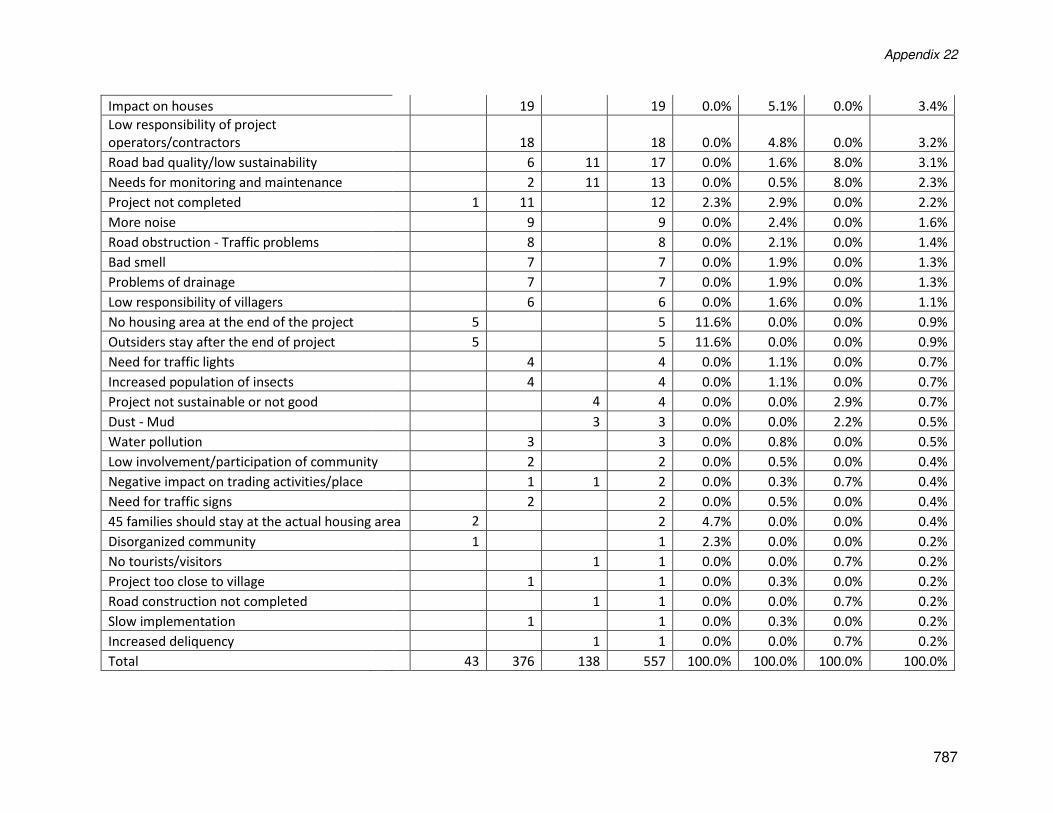
Appendix 22
787
Impact on houses 19 19 0.0% 5.1% 0.0% 3.4%
Low responsibility of project
operators/contractors 18 18 0.0% 4.8% 0.0% 3.2%
Road bad quality/low sustainability 6 11 17 0.0% 1.6% 8.0% 3.1%
Needs for monitoring and maintenance 2 11 13 0.0% 0.5% 8.0% 2.3%
Project not completed 1 11 12 2.3% 2.9% 0.0% 2.2%
More noise 9 9 0.0% 2.4% 0.0% 1.6%
Road obstruction - Traffic problems 8 8 0.0% 2.1% 0.0% 1.4%
Bad smell 7 7 0.0% 1.9% 0.0% 1.3%
Problems of drainage 7 7 0.0% 1.9% 0.0% 1.3%
Low responsibility of villagers 6 6 0.0% 1.6% 0.0% 1.1%
No housing area at the end of the project 5 5 11.6% 0.0% 0.0% 0.9%
Outsiders stay after the end of project 5 5 11.6% 0.0% 0.0% 0.9%
Need for traffic lights 4 4 0.0% 1.1% 0.0% 0.7%
Increased population of insects 4 4 0.0% 1.1% 0.0% 0.7%
Project not sustainable or not good 4 4 0.0% 0.0% 2.9% 0.7%
Dust - Mud 3 3 0.0% 0.0% 2.2% 0.5%
Water pollution 3 3 0.0% 0.8% 0.0% 0.5%
Low involvement/participation of community 2 2 0.0% 0.5% 0.0% 0.4%
Negative impact on trading activities/place 1 1 2 0.0% 0.3% 0.7% 0.4%
Need for traffic signs 2 2 0.0% 0.5% 0.0% 0.4%
45 families should stay at the actual housing area 2 2 4.7% 0.0% 0.0% 0.4%
Disorganized community 1 1 2.3% 0.0% 0.0% 0.2%
No tourists/visitors 1 1 0.0% 0.0% 0.7% 0.2%
Project too close to village 1 1 0.0% 0.3% 0.0% 0.2%
Road construction not completed 1 1 0.0% 0.0% 0.7% 0.2%
Slow implementation 1 1 0.0% 0.3% 0.0% 0.2%
Increased deliquency 1 1 0.0% 0.0% 0.7% 0.2%
Total 43 376 138 557 100.0% 100.0% 100.0% 100.0%
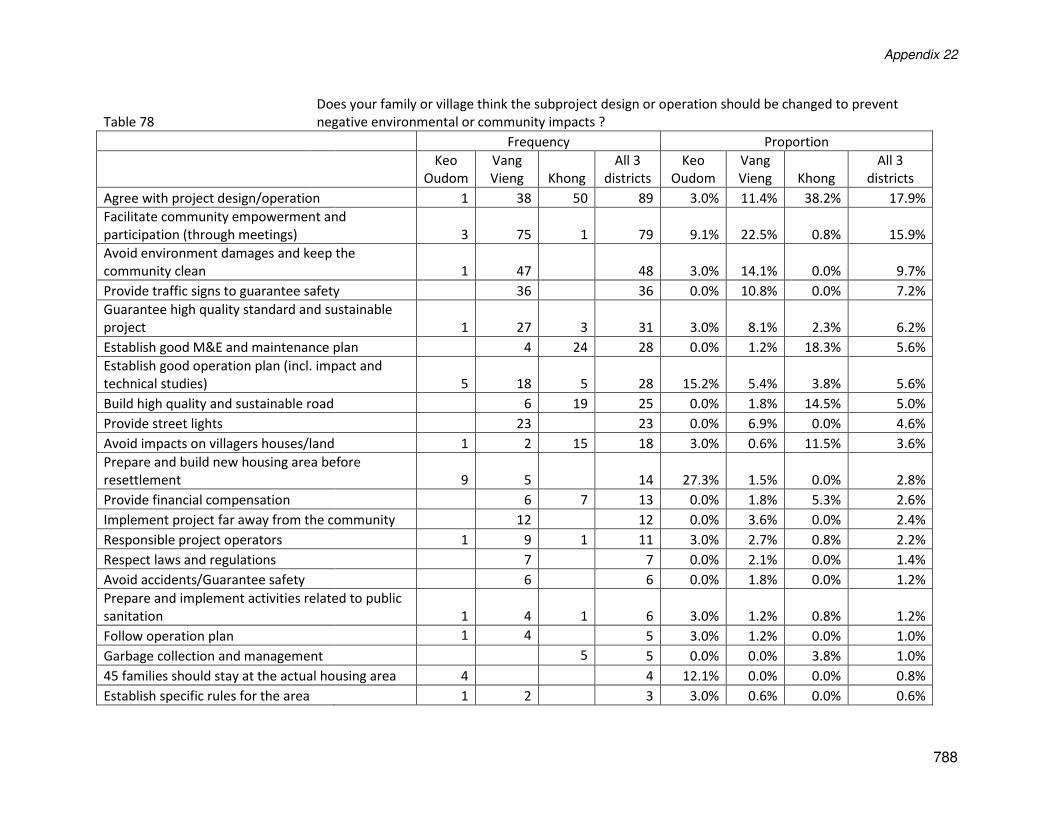
Appendix 22
788
Table 78
Does your family or village think the subproject design or operation should be changed to prevent
negative environmental or community impacts ?
Frequency Proportion
Keo
Oudom
Vang
Vieng Khong
All 3
districts
Keo
Oudom
Vang
Vieng Khong
All 3
districts
Agree with project design/operation 1 38 50 89 3.0% 11.4% 38.2% 17.9%
Facilitate community empowerment and
participation (through meetings) 3 75 1 79 9.1% 22.5% 0.8% 15.9%
Avoid environment damages and keep the
community clean 1 47 48 3.0% 14.1% 0.0% 9.7%
Provide traffic signs to guarantee safety 36 36 0.0% 10.8% 0.0% 7.2%
Guarantee high quality standard and sustainable
project 1 27 3 31 3.0% 8.1% 2.3% 6.2%
Establish good M&E and maintenance plan 4 24 28 0.0% 1.2% 18.3% 5.6%
Establish good operation plan (incl. impact and
technical studies) 5 18 5 28 15.2% 5.4% 3.8% 5.6%
Build high quality and sustainable road 6 19 25 0.0% 1.8% 14.5% 5.0%
Provide street lights 23 23 0.0% 6.9% 0.0% 4.6%
Avoid impacts on villagers houses/land 1 2 15 18 3.0% 0.6% 11.5% 3.6%
Prepare and build new housing area before
resettlement 9 5 14 27.3% 1.5% 0.0% 2.8%
Provide financial compensation 6 7 13 0.0% 1.8% 5.3% 2.6%
Implement project far away from the community 12 12 0.0% 3.6% 0.0% 2.4%
Responsible project operators 1 9 1 11 3.0% 2.7% 0.8% 2.2%
Respect laws and regulations 7 7 0.0% 2.1% 0.0% 1.4%
Avoid accidents/Guarantee safety 6 6 0.0% 1.8% 0.0% 1.2%
Prepare and implement activities related to public
sanitation 1 4 1 6 3.0% 1.2% 0.8% 1.2%
Follow operation plan 1 4 5 3.0% 1.2% 0.0% 1.0%
Garbage collection and management 5 5 0.0% 0.0% 3.8% 1.0%
45 families should stay at the actual housing area 4 4 12.1% 0.0% 0.0% 0.8%
Establish specific rules for the area 1 2 3 3.0% 0.6% 0.0% 0.6%
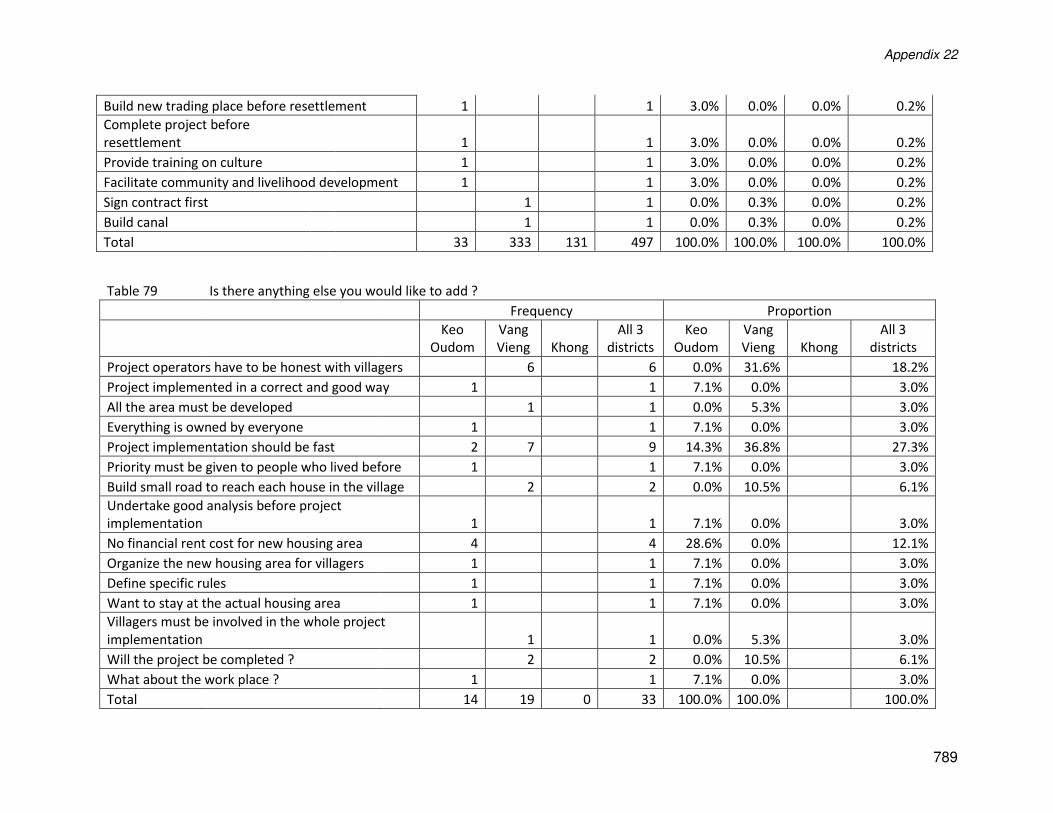
Appendix 22
789
Build new trading place before resettlement 1 1 3.0% 0.0% 0.0% 0.2%
Complete project before
resettlement 1 1 3.0% 0.0% 0.0% 0.2%
Provide training on culture 1 1 3.0% 0.0% 0.0% 0.2%
Facilitate community and livelihood development 1 1 3.0% 0.0% 0.0% 0.2%
Sign contract first 1 1 0.0% 0.3% 0.0% 0.2%
Build canal 1 1 0.0% 0.3% 0.0% 0.2%
Total 33 333 131 497 100.0% 100.0% 100.0% 100.0%
Table 79 Is there anything else you would like to add ?
Frequency Proportion
Keo
Oudom
Vang
Vieng Khong
All 3
districts
Keo
Oudom
Vang
Vieng Khong
All 3
districts
Project operators have to be honest with villagers 6 6 0.0% 31.6% 18.2%
Project implemented in a correct and good way 1 1 7.1% 0.0% 3.0%
All the area must be developed 1 1 0.0% 5.3% 3.0%
Everything is owned by everyone 1 1 7.1% 0.0% 3.0%
Project implementation should be fast 2 7 9 14.3% 36.8% 27.3%
Priority must be given to people who lived before 1 1 7.1% 0.0% 3.0%
Build small road to reach each house in the village 2 2 0.0% 10.5% 6.1%
Undertake good analysis before project
implementation 1 1 7.1% 0.0% 3.0%
No financial rent cost for new housing area 4 4 28.6% 0.0% 12.1%
Organize the new housing area for villagers 1 1 7.1% 0.0% 3.0%
Define specific rules 1 1 7.1% 0.0% 3.0%
Want to stay at the actual housing area 1 1 7.1% 0.0% 3.0%
Villagers must be involved in the whole project
implementation 1 1 0.0% 5.3% 3.0%
Will the project be completed ? 2 2 0.0% 10.5% 6.1%
What about the work place ? 1 1 7.1% 0.0% 3.0%
Total 14 19 0 33 100.0% 100.0% 100.0%
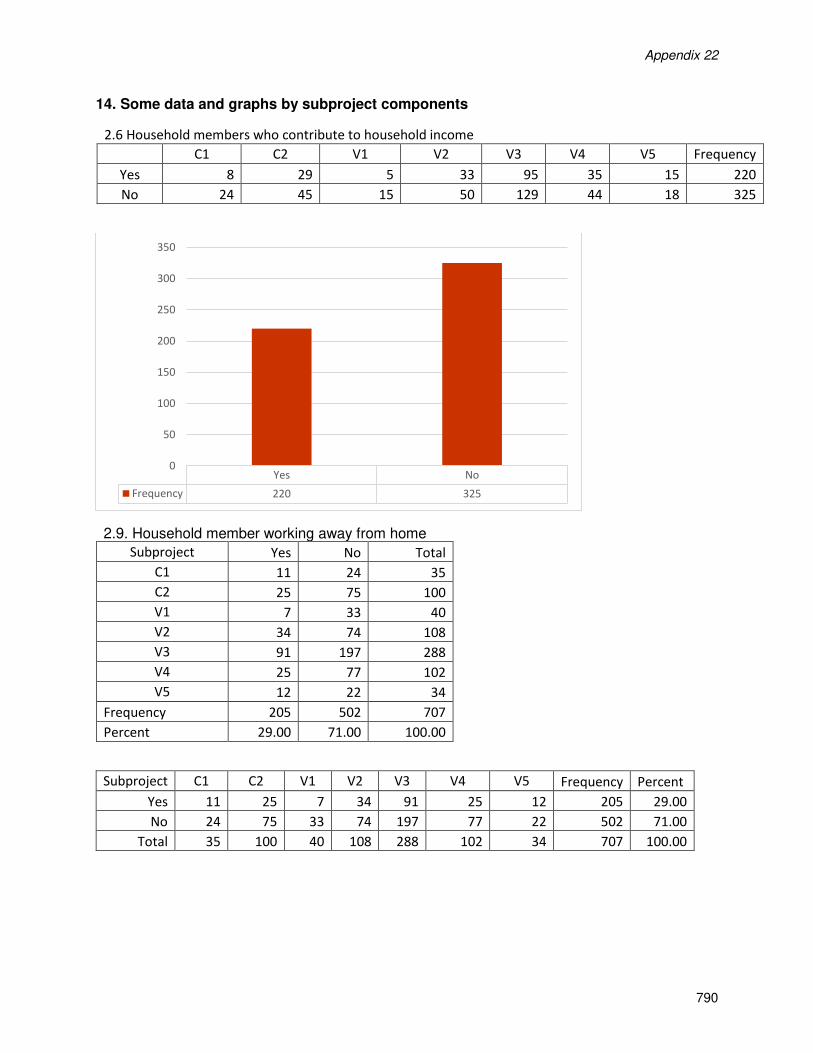
Appendix 22
790
14. Some data and graphs by subproject components
2.6 Household members who contribute to household income
C1 C2 V1 V2 V3 V4 V5 Frequency
Yes 8 29 5 33 95 35 15 220
No 24 45 15 50 129 44 18 325
2.9. Household member working away from home
Subproject Yes No Total
C1 11 24 35
C2 25 75 100
V1 7 33 40
V2 34 74 108
V3 91 197 288
V4 25 77 102
V5 12 22 34
Frequency 205 502 707
Percent 29.00 71.00 100.00
Subproject C1 C2 V1 V2 V3 V4 V5 Frequency Percent
Yes 11 25 7 34 91 25 12 205 29.00
No 24 75 33 74 197 77 22 502 71.00
Total 35 100 40 108 288 102 34 707 100.00
Yes No
Frequency 220 325
0
50
100
150
200
250
300
350
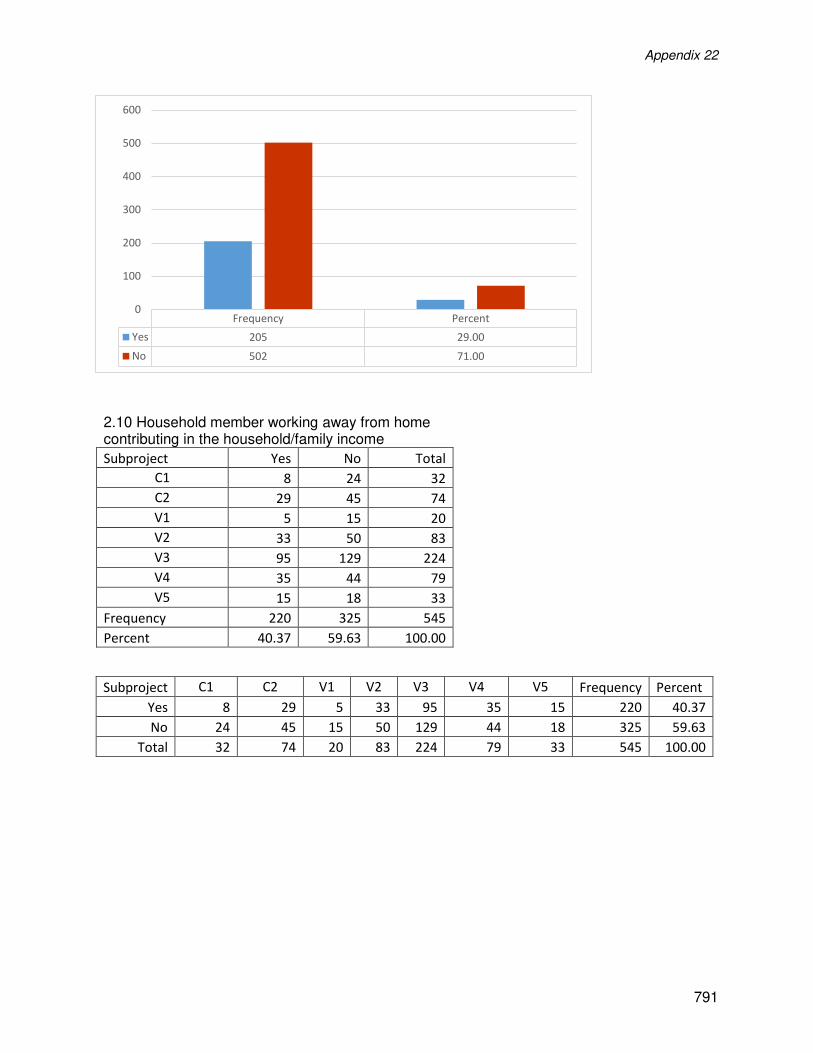
Appendix 22
791
2.10 Household member working away from home contributing in the household/family income
Subproject Yes No Total
C1 8 24 32
C2 29 45 74
V1 5 15 20
V2 33 50 83
V3 95 129 224
V4 35 44 79
V5 15 18 33
Frequency 220 325 545
Percent 40.37 59.63 100.00
Subproject C1 C2 V1 V2 V3 V4 V5 Frequency Percent
Yes 8 29 5 33 95 35 15 220 40.37
No 24 45 15 50 129 44 18 325 59.63
Total 32 74 20 83 224 79 33 545 100.00
Frequency Percent
Yes 205 29.00
No 502 71.00
0
100
200
300
400
500
600
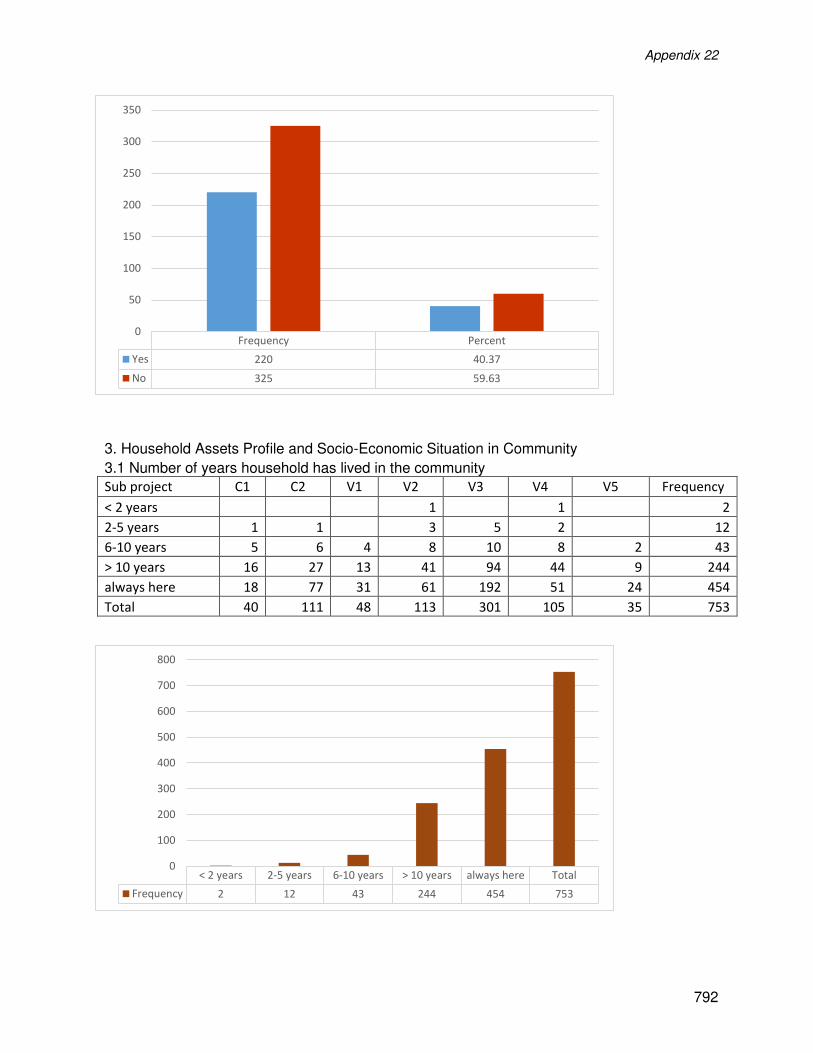
Appendix 22
792
3. Household Assets Profile and Socio-Economic Situation in Community
3.1 Number of years household has lived in the community
Sub project C1 C2 V1 V2 V3 V4 V5 Frequency
< 2 years 1 1 2
2-5 years 1 1 3 5 2 12
6-10 years 5 6 4 8 10 8 2 43
> 10 years 16 27 13 41 94 44 9 244
always here 18 77 31 61 192 51 24 454
Total 40 111 48 113 301 105 35 753
Frequency Percent
Yes 220 40.37
No 325 59.63
0
50
100
150
200
250
300
350
< 2 years 2-5 years 6-10 years > 10 years always here Total
Frequency 2 12 43 244 454 753
0
100
200
300
400
500
600
700
800
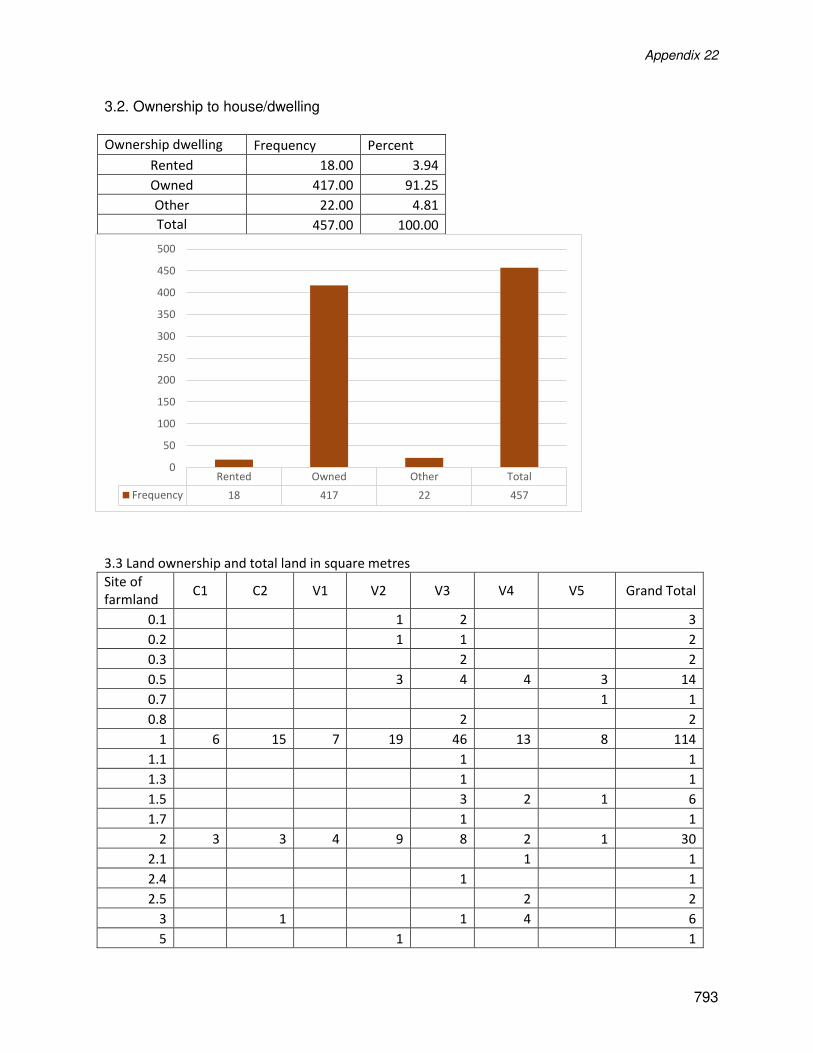
Appendix 22
793
3.2. Ownership to house/dwelling
Ownership dwelling Frequency Percent
Rented 18.00 3.94
Owned 417.00 91.25
Other 22.00 4.81
Total 457.00 100.00
3.3 Land ownership and total land in square metres
Site of
farmland C1 C2 V1 V2 V3 V4 V5 Grand Total
0.1 1 2 3
0.2 1 1 2
0.3 2 2
0.5 3 4 4 3 14
0.7 1 1
0.8 2 2
1 6 15 7 19 46 13 8 114
1.1 1 1
1.3 1 1
1.5 3 2 1 6
1.7 1 1
2 3 3 4 9 8 2 1 30
2.1 1 1
2.4 1 1
2.5 2 2
3 1 1 4 6
5 1 1
Rented Owned Other Total
Frequency 18 417 22 457
0
50
100
150
200
250
300
350
400
450
500
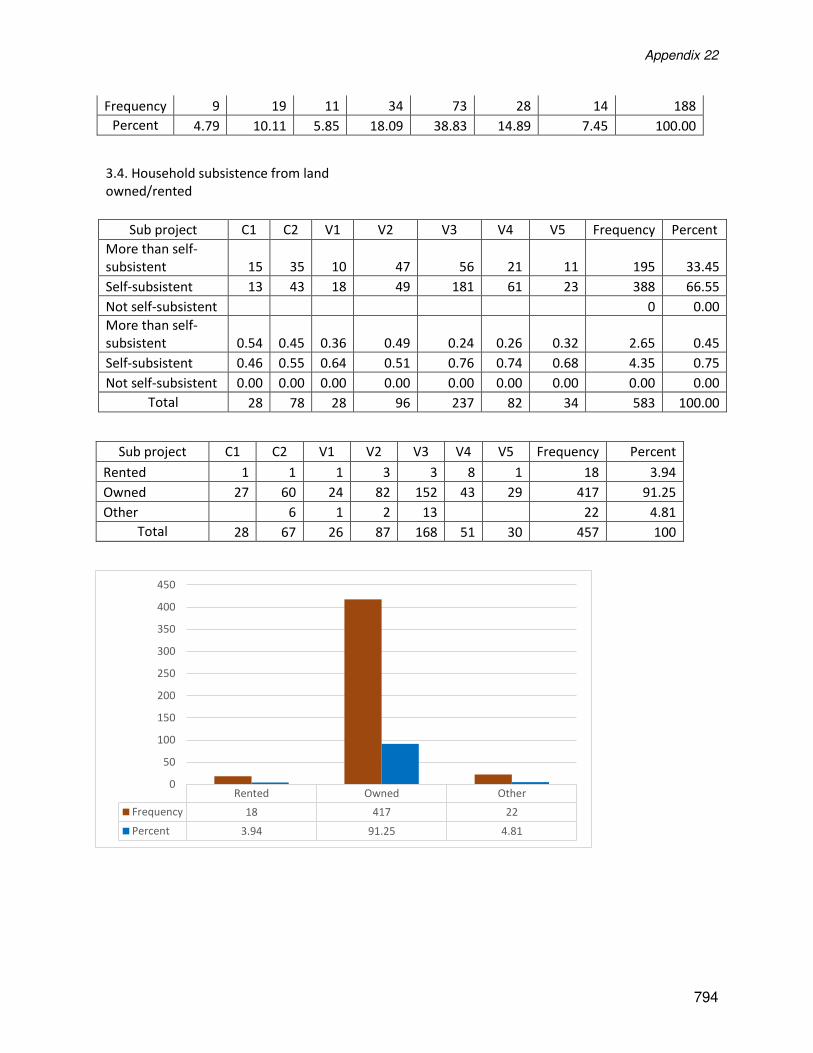
Appendix 22
794
Frequency 9 19 11 34 73 28 14 188
Percent 4.79 10.11 5.85 18.09 38.83 14.89 7.45 100.00
3.4. Household subsistence from land
owned/rented
Sub project C1 C2 V1 V2 V3 V4 V5 Frequency Percent
More than self-
subsistent 15 35 10 47 56 21 11 195 33.45
Self-subsistent 13 43 18 49 181 61 23 388 66.55
Not self-subsistent 0 0.00
More than self-
subsistent 0.54 0.45 0.36 0.49 0.24 0.26 0.32 2.65 0.45
Self-subsistent 0.46 0.55 0.64 0.51 0.76 0.74 0.68 4.35 0.75
Not self-subsistent 0.00 0.00 0.00 0.00 0.00 0.00 0.00 0.00 0.00
Total 28 78 28 96 237 82 34 583 100.00
Sub project C1 C2 V1 V2 V3 V4 V5 Frequency Percent
Rented 1 1 1 3 3 8 1 18 3.94
Owned 27 60 24 82 152 43 29 417 91.25
Other 6 1 2 13 22 4.81
Total 28 67 26 87 168 51 30 457 100
Rented Owned Other
Frequency 18 417 22
Percent 3.94 91.25 4.81
0
50
100
150
200
250
300
350
400
450
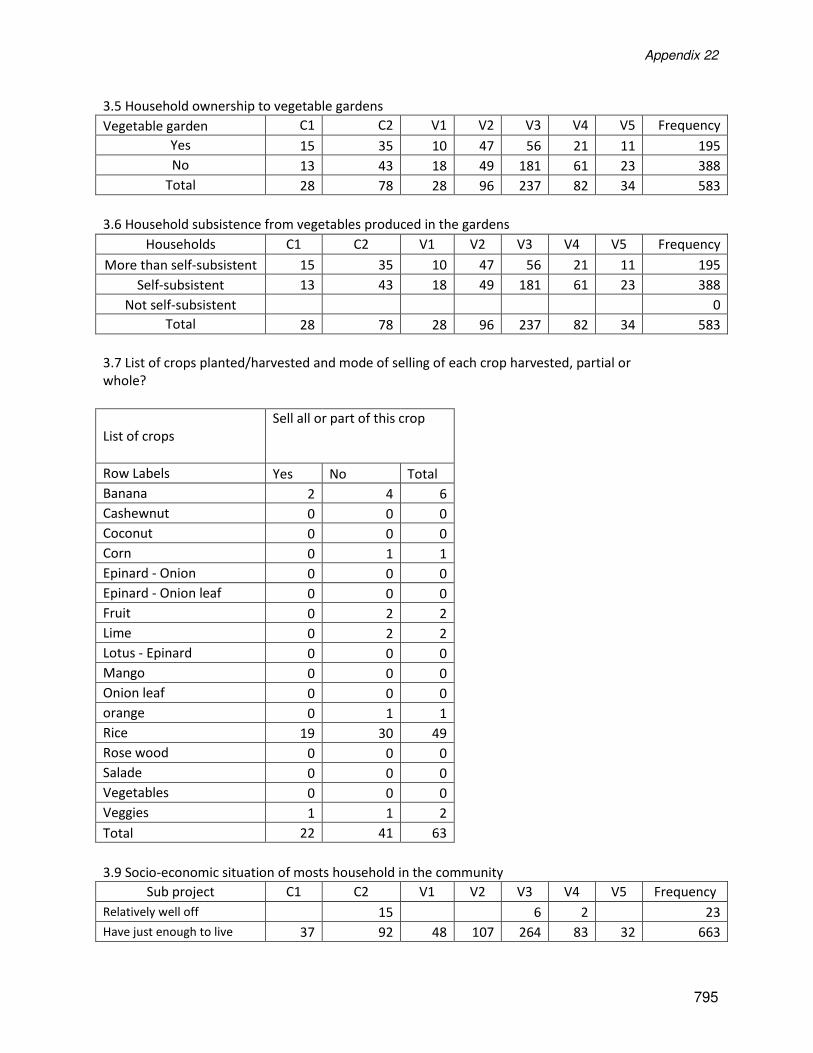
Appendix 22
795
3.5 Household ownership to vegetable gardens
Vegetable garden C1 C2 V1 V2 V3 V4 V5 Frequency
Yes 15 35 10 47 56 21 11 195
No 13 43 18 49 181 61 23 388
Total 28 78 28 96 237 82 34 583
3.6 Household subsistence from vegetables produced in the gardens
Households C1 C2 V1 V2 V3 V4 V5 Frequency
More than self-subsistent 15 35 10 47 56 21 11 195
Self-subsistent 13 43 18 49 181 61 23 388
Not self-subsistent 0
Total 28 78 28 96 237 82 34 583
3.7 List of crops planted/harvested and mode of selling of each crop harvested, partial or
whole?
List of crops
Sell all or part of this crop
Row Labels Yes No Total
Banana 2 4 6
Cashewnut 0 0 0
Coconut 0 0 0
Corn 0 1 1
Epinard - Onion 0 0 0
Epinard - Onion leaf 0 0 0
Fruit 0 2 2
Lime 0 2 2
Lotus - Epinard 0 0 0
Mango 0 0 0
Onion leaf 0 0 0
orange 0 1 1
Rice 19 30 49
Rose wood 0 0 0
Salade 0 0 0
Vegetables 0 0 0
Veggies 1 1 2
Total 22 41 63
3.9 Socio-economic situation of mosts household in the community
Sub project C1 C2 V1 V2 V3 V4 V5 Frequency
Relatively well off 15 6 2 23
Have just enough to live 37 92 48 107 264 83 32 663
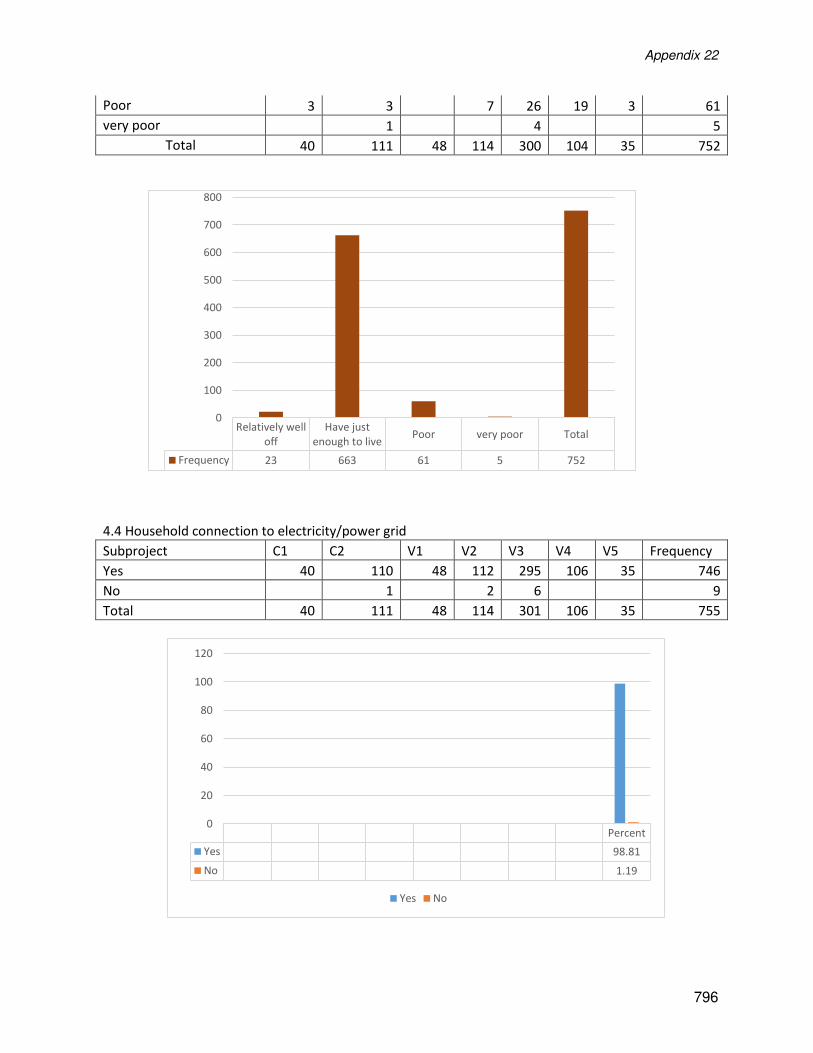
Appendix 22
796
Poor 3 3 7 26 19 3 61
very poor 1 4 5
Total 40 111 48 114 300 104 35 752
4.4 Household connection to electricity/power grid
Subproject C1 C2 V1 V2 V3 V4 V5 Frequency
Yes 40 110 48 112 295 106 35 746
No 1 2 6 9
Total 40 111 48 114 301 106 35 755
Relatively well
off
Have just
enough to livePoor very poor Total
Frequency 23 663 61 5 752
0
100
200
300
400
500
600
700
800
Percent
Yes 98.81
No 1.19
0
20
40
60
80
100
120
Yes No
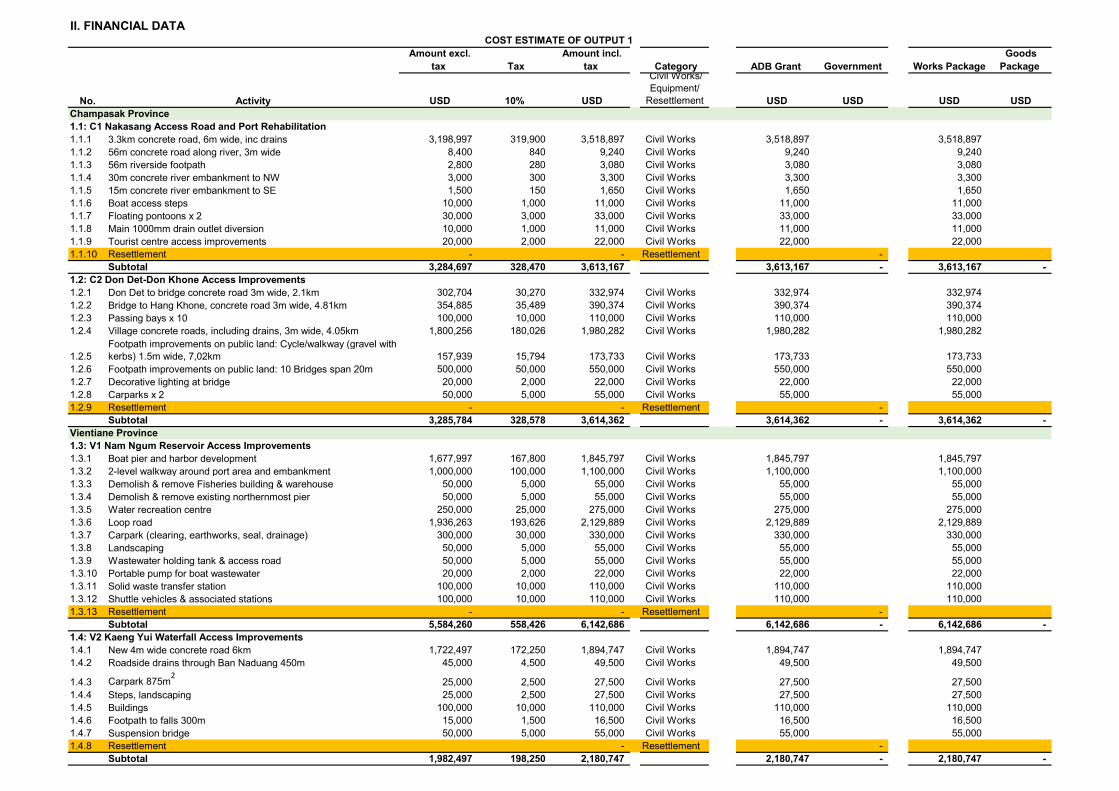
II. FINANCIAL DATA
Amount excl. tax Tax
Amount incl. tax Category ADB Grant Government Works Package
Goods Package
USD 10% USD
Civil Works/ Equipment/
Resettlement USD USD USD USD Champasak Province
1.1.1 3.3km concrete road, 6m wide, inc drains 3,198,997 319,900 3,518,897 Civil Works 3,518,897 3,518,897 1.1.2 56m concrete road along river, 3m wide 8,400 840 9,240 Civil Works 9,240 9,240 1.1.3 56m riverside footpath 2,800 280 3,080 Civil Works 3,080 3,080 1.1.4 30m concrete river embankment to NW 3,000 300 3,300 Civil Works 3,300 3,300 1.1.5 15m concrete river embankment to SE 1,500 150 1,650 Civil Works 1,650 1,650 1.1.6 Boat access steps 10,000 1,000 11,000 Civil Works 11,000 11,000 1.1.7 Floating pontoons x 2 30,000 3,000 33,000 Civil Works 33,000 33,000 1.1.8 Main 1000mm drain outlet diversion 10,000 1,000 11,000 Civil Works 11,000 11,000 1.1.9 Tourist centre access improvements 20,000 2,000 22,000 Civil Works 22,000 22,000 1.1.10 Resettlement - - Resettlement -
Subtotal 3,284,697 328,470 3,613,167 3,613,167 - 3,613,167 -
1.2.1 Don Det to bridge concrete road 3m wide, 2.1km 302,704 30,270 332,974 Civil Works 332,974 332,974 1.2.2 Bridge to Hang Khone, concrete road 3m wide, 4.81km 354,885 35,489 390,374 Civil Works 390,374 390,374 1.2.3 Passing bays x 10 100,000 10,000 110,000 Civil Works 110,000 110,000 1.2.4 Village concrete roads, including drains, 3m wide, 4.05km 1,800,256 180,026 1,980,282 Civil Works 1,980,282 1,980,282
1.2.5Footpath improvements on public land: Cycle/walkway (gravel with kerbs) 1.5m wide, 7,02km 157,939 15,794 173,733 Civil Works 173,733 173,733
1.2.6 Footpath improvements on public land: 10 Bridges span 20m 500,000 50,000 550,000 Civil Works 550,000 550,000 1.2.7 Decorative lighting at bridge 20,000 2,000 22,000 Civil Works 22,000 22,000 1.2.8 Carparks x 2 50,000 5,000 55,000 Civil Works 55,000 55,000 1.2.9 Resettlement - - Resettlement -
Subtotal 3,285,784 328,578 3,614,362 3,614,362 - 3,614,362 - Vientiane Province
1.3.1 Boat pier and harbor development 1,677,997 167,800 1,845,797 Civil Works 1,845,797 1,845,797 1.3.2 2-level walkway around port area and embankment 1,000,000 100,000 1,100,000 Civil Works 1,100,000 1,100,000 1.3.3 Demolish & remove Fisheries building & warehouse 50,000 5,000 55,000 Civil Works 55,000 55,000 1.3.4 Demolish & remove existing northernmost pier 50,000 5,000 55,000 Civil Works 55,000 55,000 1.3.5 Water recreation centre 250,000 25,000 275,000 Civil Works 275,000 275,000 1.3.6 Loop road 1,936,263 193,626 2,129,889 Civil Works 2,129,889 2,129,889 1.3.7 Carpark (clearing, earthworks, seal, drainage) 300,000 30,000 330,000 Civil Works 330,000 330,000 1.3.8 Landscaping 50,000 5,000 55,000 Civil Works 55,000 55,000 1.3.9 Wastewater holding tank & access road 50,000 5,000 55,000 Civil Works 55,000 55,000 1.3.10 Portable pump for boat wastewater 20,000 2,000 22,000 Civil Works 22,000 22,000 1.3.11 Solid waste transfer station 100,000 10,000 110,000 Civil Works 110,000 110,000 1.3.12 Shuttle vehicles & associated stations 100,000 10,000 110,000 Civil Works 110,000 110,000 1.3.13 Resettlement - - Resettlement -
Subtotal 5,584,260 558,426 6,142,686 6,142,686 - 6,142,686 -
1.4.1 New 4m wide concrete road 6km 1,722,497 172,250 1,894,747 Civil Works 1,894,747 1,894,747 1.4.2 Roadside drains through Ban Naduang 450m 45,000 4,500 49,500 Civil Works 49,500 49,500
1.4.3 Carpark 875m2 25,000 2,500 27,500 Civil Works 27,500 27,500
1.4.4 Steps, landscaping 25,000 2,500 27,500 Civil Works 27,500 27,500 1.4.5 Buildings 100,000 10,000 110,000 Civil Works 110,000 110,000 1.4.6 Footpath to falls 300m 15,000 1,500 16,500 Civil Works 16,500 16,500 1.4.7 Suspension bridge 50,000 5,000 55,000 Civil Works 55,000 55,000 1.4.8 Resettlement - Resettlement -
Subtotal 1,982,497 198,250 2,180,747 2,180,747 - 2,180,747 -
COST ESTIMATE OF OUTPUT 1
No. Activity
1.1: C1 Nakasang Access Road and Port Rehabilitation
1.2: C2 Don Det-Don Khone Access Improvements
1.3: V1 Nam Ngum Reservoir Access Improvements
1.4: V2 Kaeng Yui Waterfall Access Improvements

Amount excl. tax Tax
Amount incl. tax Category ADB Grant Government Works Package
Goods Package
USD 10% USD
Civil Works/ Equipment/
Resettlement USD USD USD USD No. Activity
1.5.16m road DBST loop road 26km, including 4km to Ban Phonxay and 1km for Ban Phathong & Phonxang 3,633,658 363,366 3,997,024 Civil Works 3,997,024 3,997,024
1.5.2 Steel plate for bridge resurfacing 100,000 10,000 110,000 Civil Works 110,000 110,000 1.5.3 New traffic bridge 1,000,000 100,000 1,100,000 Civil Works 1,100,000 1,100,000 1.5.4 New concrete road from NR13 to proposed bridge 300,000 30,000 330,000 Civil Works 330,000 330,000
1.5.5New concrete bypass road from proposed bridge to connection to western loop road 1,164,187 116,419 1,280,606 Civil Works 1,280,606 1,280,606
1.5.6 Riverbank path and park reserve 300,000 30,000 330,000 Civil Works 330,000 330,000 1.5.7 Riverbank protection 300,000 30,000 330,000 Civil Works 330,000 330,000 1.5.8 Resettlement 122,516 122,516 Resettlement 122,516
Subtotal 6,920,361 679,785 7,600,146 7,477,630 122,516 7,477,630 -
1.6.1Works on main road – central reservation, planting, street lighting, footpath clearing 0.98km 256,898 25,690 282,588 Civil Works 282,588 282,588
1.6.2Loop road past hospital – upgraded footpaths, street lights, parking bays, 1.43km 288,143 28,814 316,957 Civil Works 316,957 316,957
1.6.3Cross roads (6) - Paved footpaths 2m wide (or to fit existing width) parking, street lighting 1.42km 186,142 18,614 204,756 Civil Works 204,756 204,756
1.6.4 Road surfacing and drain rehabilitation 250m 50,000 5,000 55,000 Civil Works 55,000 55,000 1.6.5 Road surfacing with new road drains 640m 100,000 10,000 110,000 Civil Works 110,000 110,000 1.6.6 Upgraded footpaths and side drains only, 420m 42,000 4,200 46,200 Civil Works 46,200 46,200 1.6.7 Resettlement - - Resettlement -
Subtotal 923,183 92,318 1,015,501 1,015,501 - 1,015,501 -
1.7.1 Access 0.8km road to site, concrete, 4m wide 200,000 20,000 220,000 Civil Works 220,000 220,000 1.7.2 Clear site 50,000 5,000 55,000 Civil Works 55,000 55,000 1.7.3 Develop 6 clay lined cells (earthworks) and gas recovery 2,000,000 200,000 2,200,000 Civil Works 2,200,000 2,200,000 1.7.4 Site roads 100,000 10,000 110,000 Civil Works 110,000 110,000 1.7.5 Site drains 200,000 20,000 220,000 Civil Works 220,000 220,000 1.7.6 Retire & compact existing waste into 1 cell 100,000 10,000 110,000 Civil Works 110,000 110,000 1.7.7 Leachate pond (lined) 200,000 20,000 220,000 Civil Works 220,000 220,000 1.7.8 Leachate recirculation system 200,000 20,000 220,000 Civil Works 220,000 220,000 1.7.9 Site office & toilet 200,000 20,000 220,000 Civil Works 220,000 220,000 1.7.10 Sorting & recycling area (concrete pad, roofed) 200,000 20,000 220,000 Civil Works 220,000 220,000 1.7.11 Site fence 120,000 12,000 132,000 Civil Works 132,000 132,000 1.7.12 Power supply 200,000 20,000 220,000 Civil Works 220,000 220,000 1.7.13 Water supply, monitoring boreholes 100,000 10,000 110,000 Civil Works 110,000 110,000 1.7.14 Hazardous waste area & incinerator 250,000 25,000 275,000 Civil Works 275,000 275,000 1.7.15 Septage treatment facility 1,000,000 100,000 1,100,000 Civil Works 1,100,000 1,100,000 1.7.9 3 collection vehicles: 300,000 30,000 330,000 Equipment 330,000 330,000 1.7.10 1 bulldozer: 150,000 15,000 165,000 Equipment 165,000 165,000 1.7.11 Septage vehicles 200,000 20,000 220,000 Equipment 220,000 220,000 1.7.12 Resettlement - - Resettlement - -
Subtotal 5,770,000 577,000 6,347,000 6,347,000 - 5,632,000 715,000
Summary Output 1:Champasak Province 6,570,481 657,048 7,227,529 7,227,529 - 7,227,529 - Vientiane Province 21,180,301 2,105,779 23,286,080 23,163,564 122,516 22,448,564 715,000 Total for Output 1 27,750,782 2,762,827 30,513,609 30,391,093 122,516 29,676,093 715,000
1.5: V3 Western Loop Rural Access Road and Bridge Improvements
1.6: V4 Vang Vieng Urban Renewal
1.7: V5 Vang Vieng Solid Waste Management Improvements
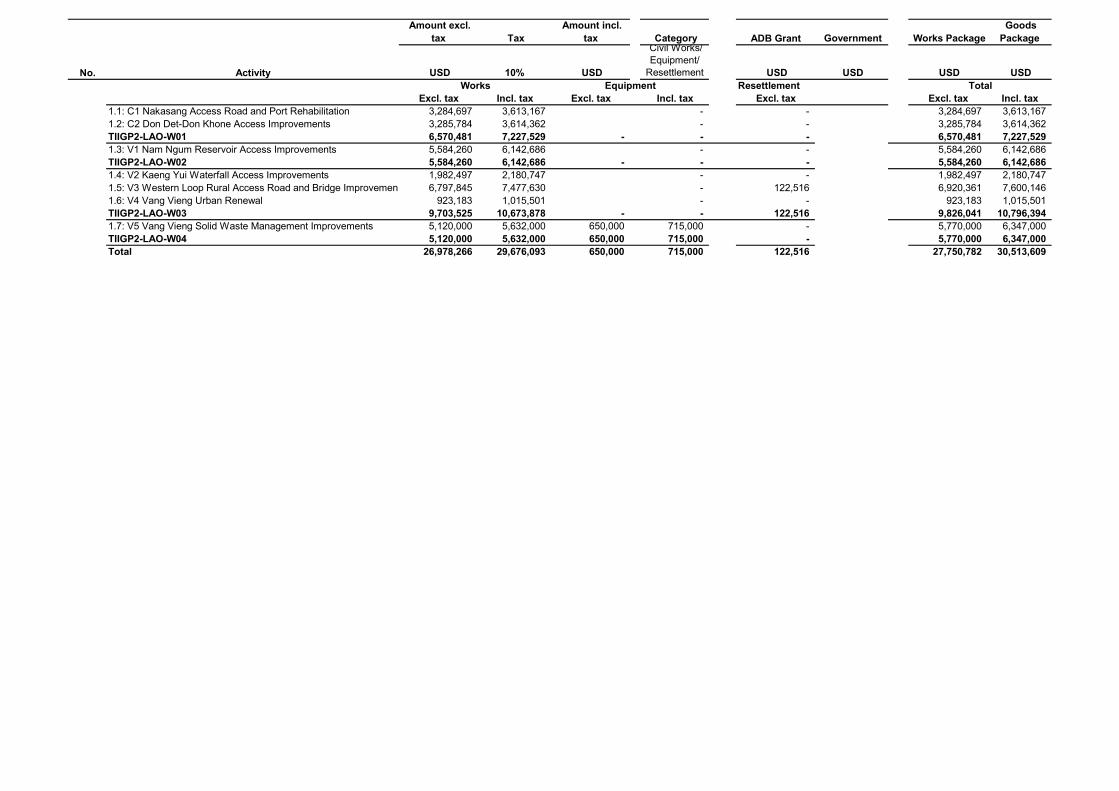
Amount excl. tax Tax
Amount incl. tax Category ADB Grant Government Works Package
Goods Package
USD 10% USD
Civil Works/ Equipment/
Resettlement USD USD USD USD No. ActivityResettlement
Excl. tax Incl. tax Excl. tax Incl. tax Excl. tax Excl. tax Incl. tax1.1: C1 Nakasang Access Road and Port Rehabilitation 3,284,697 3,613,167 - - 3,284,697 3,613,167 1.2: C2 Don Det-Don Khone Access Improvements 3,285,784 3,614,362 - - 3,285,784 3,614,362 TIIGP2-LAO-W01 6,570,481 7,227,529 - - - 6,570,481 7,227,529 1.3: V1 Nam Ngum Reservoir Access Improvements 5,584,260 6,142,686 - - 5,584,260 6,142,686 TIIGP2-LAO-W02 5,584,260 6,142,686 - - - 5,584,260 6,142,686 1.4: V2 Kaeng Yui Waterfall Access Improvements 1,982,497 2,180,747 - - 1,982,497 2,180,747 1.5: V3 Western Loop Rural Access Road and Bridge Improvements 6,797,845 7,477,630 - 122,516 6,920,361 7,600,146 1.6: V4 Vang Vieng Urban Renewal 923,183 1,015,501 - - 923,183 1,015,501 TIIGP2-LAO-W03 9,703,525 10,673,878 - - 122,516 9,826,041 10,796,394 1.7: V5 Vang Vieng Solid Waste Management Improvements 5,120,000 5,632,000 650,000 715,000 - 5,770,000 6,347,000 TIIGP2-LAO-W04 5,120,000 5,632,000 650,000 715,000 - 5,770,000 6,347,000 Total 26,978,266 29,676,093 650,000 715,000 122,516 27,750,782 30,513,609
TotalWorks Equipment
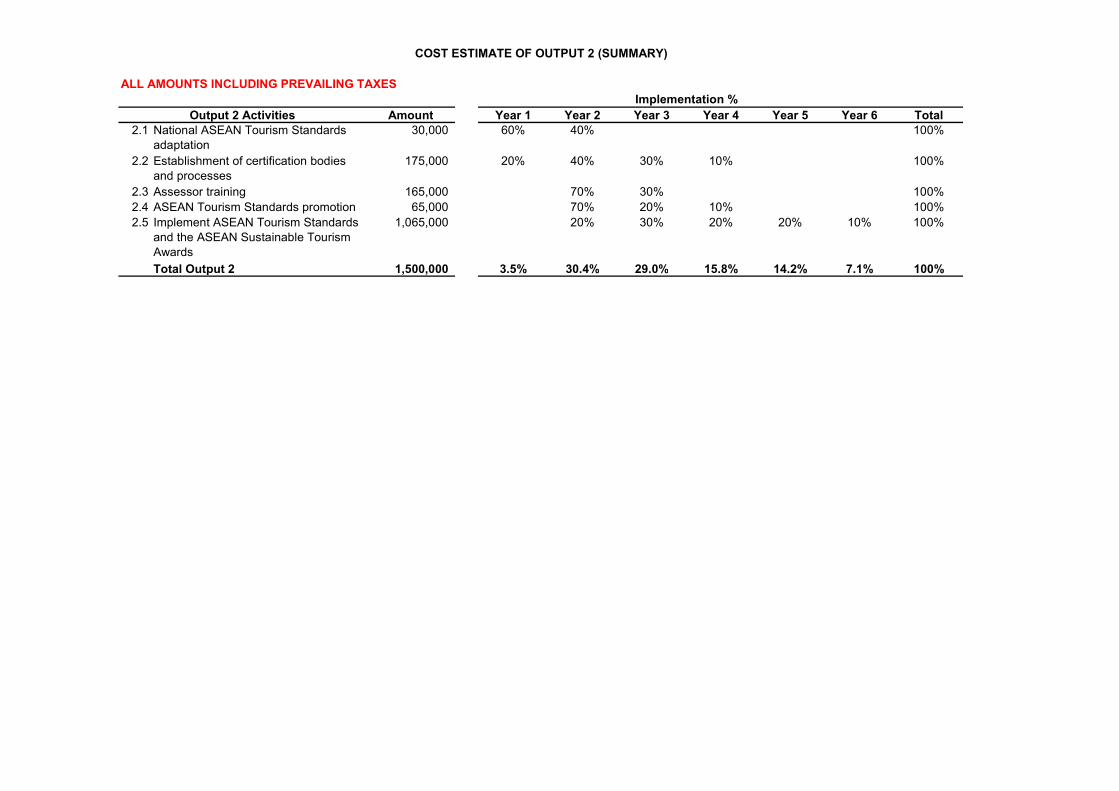
ALL AMOUNTS INCLUDING PREVAILING TAXES
Amount Year 1 Year 2 Year 3 Year 4 Year 5 Year 6 Total2.1 National ASEAN Tourism Standards
adaptation 30,000 60% 40% 100%
2.2 Establishment of certification bodies and processes
175,000 20% 40% 30% 10% 100%
2.3 Assessor training 165,000 70% 30% 100%2.4 ASEAN Tourism Standards promotion 65,000 70% 20% 10% 100%2.5 Implement ASEAN Tourism Standards
and the ASEAN Sustainable Tourism Awards
1,065,000 20% 30% 20% 20% 10% 100%
Total Output 2 1,500,000 3.5% 30.4% 29.0% 15.8% 14.2% 7.1% 100%
Output 2 ActivitiesImplementation %
COST ESTIMATE OF OUTPUT 2 (SUMMARY)
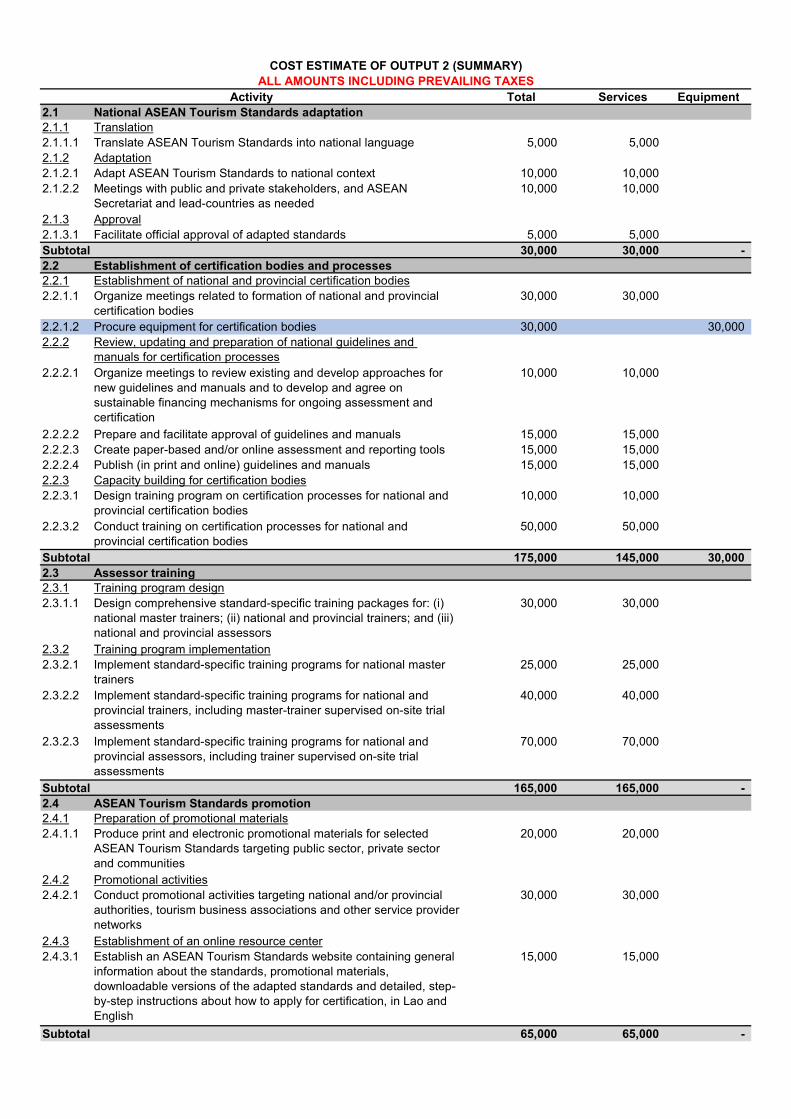
Total Services Equipment2.1 National ASEAN Tourism Standards adaptation 2.1.1 Translation2.1.1.1 Translate ASEAN Tourism Standards into national language 5,000 5,000 2.1.2 Adaptation2.1.2.1 Adapt ASEAN Tourism Standards to national context 10,000 10,000 2.1.2.2 Meetings with public and private stakeholders, and ASEAN
Secretariat and lead-countries as needed10,000 10,000
2.1.3 Approval2.1.3.1 Facilitate official approval of adapted standards 5,000 5,000 Subtotal 2.1 30,000 30,000 - 2.2 Establishment of certification bodies and processes2.2.1 Establishment of national and provincial certification bodies2.2.1.1 Organize meetings related to formation of national and provincial
certification bodies30,000 30,000
2.2.1.2 Procure equipment for certification bodies 30,000 30,000 2.2.2 Review, updating and preparation of national guidelines and
manuals for certification processes2.2.2.1 Organize meetings to review existing and develop approaches for
new guidelines and manuals and to develop and agree on sustainable financing mechanisms for ongoing assessment and certification
10,000 10,000
2.2.2.2 Prepare and facilitate approval of guidelines and manuals 15,000 15,000 2.2.2.3 Create paper-based and/or online assessment and reporting tools 15,000 15,000 2.2.2.4 Publish (in print and online) guidelines and manuals 15,000 15,000 2.2.3 Capacity building for certification bodies2.2.3.1 Design training program on certification processes for national and
provincial certification bodies10,000 10,000
2.2.3.2 Conduct training on certification processes for national and provincial certification bodies
50,000 50,000
Subtotal 2.2 175,000 145,000 30,000 2.3 Assessor training 2.3.1 Training program design2.3.1.1 Design comprehensive standard-specific training packages for: (i)
national master trainers; (ii) national and provincial trainers; and (iii) national and provincial assessors
30,000 30,000
2.3.2 Training program implementation2.3.2.1 Implement standard-specific training programs for national master
trainers25,000 25,000
2.3.2.2 Implement standard-specific training programs for national and provincial trainers, including master-trainer supervised on-site trial assessments
40,000 40,000
2.3.2.3 Implement standard-specific training programs for national and provincial assessors, including trainer supervised on-site trial assessments
70,000 70,000
Subtotal 2.3 165,000 165,000 - 2.4 ASEAN Tourism Standards promotion 2.4.1 Preparation of promotional materials2.4.1.1 Produce print and electronic promotional materials for selected
ASEAN Tourism Standards targeting public sector, private sector and communities
20,000 20,000
2.4.2 Promotional activities2.4.2.1 Conduct promotional activities targeting national and/or provincial
authorities, tourism business associations and other service provider networks
30,000 30,000
2.4.3 Establishment of an online resource center2.4.3.1 Establish an ASEAN Tourism Standards website containing general
information about the standards, promotional materials, downloadable versions of the adapted standards and detailed, step-by-step instructions about how to apply for certification, in Lao and English
15,000 15,000
Subtotal 2.4 65,000 65,000 -
Activity
COST ESTIMATE OF OUTPUT 2 (SUMMARY)ALL AMOUNTS INCLUDING PREVAILING TAXES
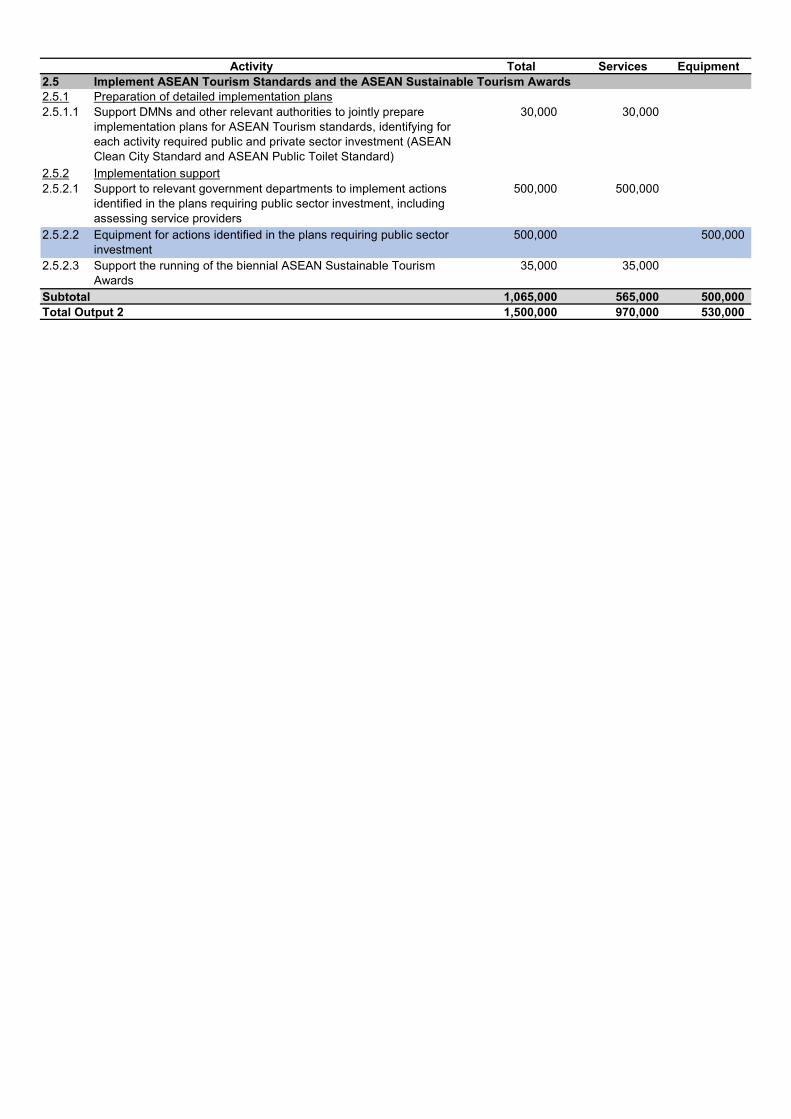
Total Services EquipmentActivity2.5 Implement ASEAN Tourism Standards and the ASEAN Sustainable Tourism Awards2.5.1 Preparation of detailed implementation plans2.5.1.1 Support DMNs and other relevant authorities to jointly prepare
implementation plans for ASEAN Tourism standards, identifying for each activity required public and private sector investment (ASEAN Clean City Standard and ASEAN Public Toilet Standard)
30,000 30,000
2.5.2 Implementation support2.5.2.1 Support to relevant government departments to implement actions
identified in the plans requiring public sector investment, including assessing service providers
500,000 500,000
2.5.2.2 Equipment for actions identified in the plans requiring public sector investment
500,000 500,000
2.5.2.3 Support the running of the biennial ASEAN Sustainable Tourism Awards
35,000 35,000
Subtotal 2.5 1,065,000 565,000 500,000 Total Output 2 1,500,000 970,000 530,000
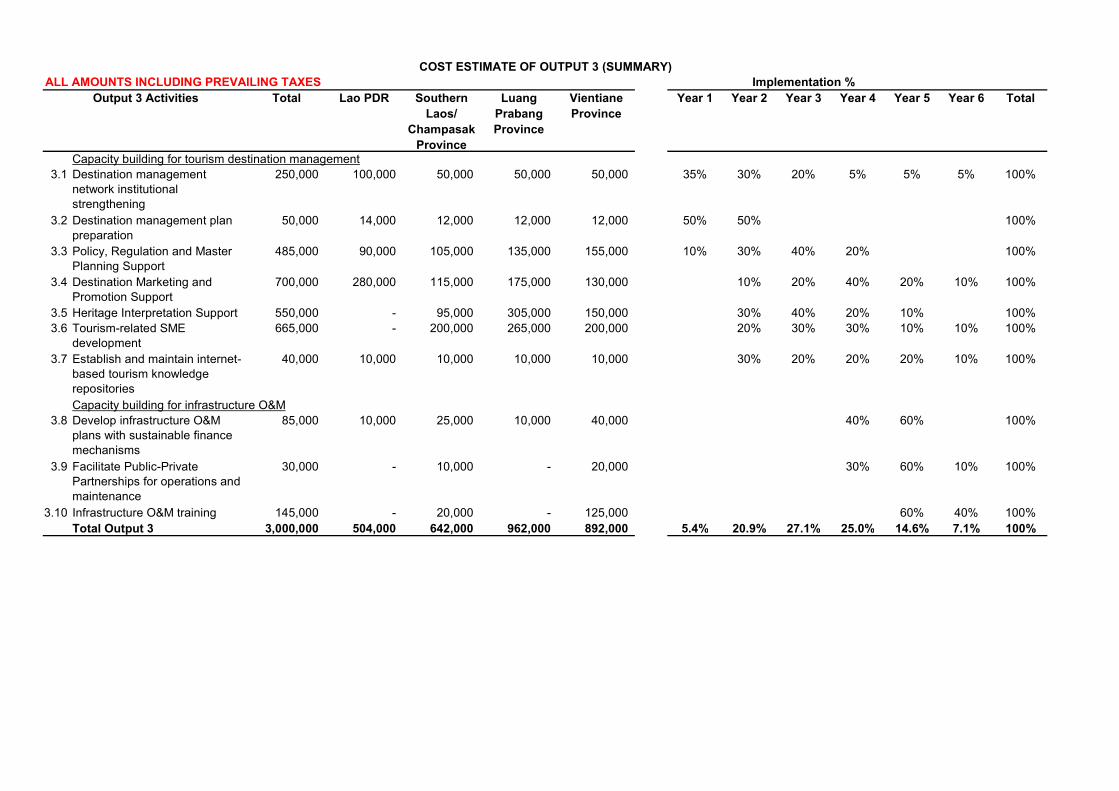
ALL AMOUNTS INCLUDING PREVAILING TAXESTotal Lao PDR Southern
Laos/ Champasak
Province
Luang Prabang Province
Vientiane Province
Year 1 Year 2 Year 3 Year 4 Year 5 Year 6 Total
Capacity building for tourism destination management3.1 Destination management
network institutional strengthening
250,000 100,000 50,000 50,000 50,000 35% 30% 20% 5% 5% 5% 100%
3.2 Destination management plan preparation
50,000 14,000 12,000 12,000 12,000 50% 50% 100%
3.3 Policy, Regulation and Master Planning Support
485,000 90,000 105,000 135,000 155,000 10% 30% 40% 20% 100%
3.4 Destination Marketing and Promotion Support
700,000 280,000 115,000 175,000 130,000 10% 20% 40% 20% 10% 100%
3.5 Heritage Interpretation Support 550,000 - 95,000 305,000 150,000 30% 40% 20% 10% 100%3.6 Tourism-related SME
development665,000 - 200,000 265,000 200,000 20% 30% 30% 10% 10% 100%
3.7 Establish and maintain internet-based tourism knowledge repositories
40,000 10,000 10,000 10,000 10,000 30% 20% 20% 20% 10% 100%
Capacity building for infrastructure O&M3.8 Develop infrastructure O&M
plans with sustainable finance mechanisms
85,000 10,000 25,000 10,000 40,000 40% 60% 100%
3.9 Facilitate Public-Private Partnerships for operations and maintenance
30,000 - 10,000 - 20,000 30% 60% 10% 100%
3.10 Infrastructure O&M training 145,000 - 20,000 - 125,000 60% 40% 100%Total Output 3 3,000,000 504,000 642,000 962,000 892,000 5.4% 20.9% 27.1% 25.0% 14.6% 7.1% 100%
Output 3 ActivitiesImplementation %
COST ESTIMATE OF OUTPUT 3 (SUMMARY)
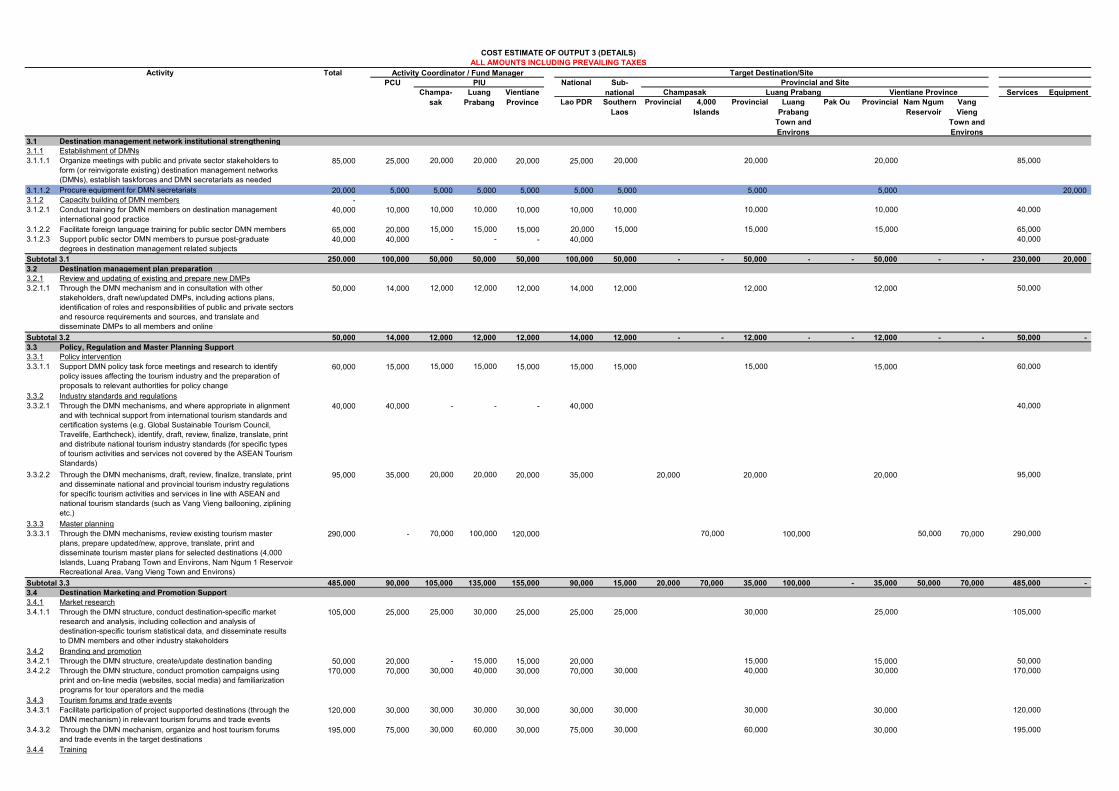
Services EquipmentLao PDR Southern
LaosProvincial 4,000
IslandsProvincial Luang
Prabang Town and Environs
Pak Ou Provincial Nam Ngum Reservoir
Vang Vieng
Town and Environs
3.1 Destination management network institutional strengthening3.1.1 Establishment of DMNs3.1.1.1 Organize meetings with public and private sector stakeholders to
form (or reinvigorate existing) destination management networks (DMNs), establish taskforces and DMN secretariats as needed
85,000 25,000 20,000 20,000 20,000 25,000 20,000 20,000 20,000 85,000
3.1.1.2 Procure equipment for DMN secretariats 20,000 5,000 5,000 5,000 5,000 5,000 5,000 5,000 5,000 20,000 3.1.2 Capacity building of DMN members - 3.1.2.1 Conduct training for DMN members on destination management
international good practice40,000 10,000 10,000 10,000 10,000 10,000 10,000 10,000 10,000 40,000
3.1.2.2 Facilitate foreign language training for public sector DMN members 65,000 20,000 15,000 15,000 15,000 20,000 15,000 15,000 15,000 65,000 3.1.2.3 Support public sector DMN members to pursue post-graduate
degrees in destination management related subjects40,000 40,000 - - - 40,000 40,000
Subtotal 3.1 250,000 100,000 50,000 50,000 50,000 100,000 50,000 - - 50,000 - - 50,000 - - 230,000 20,000 3.2 Destination management plan preparation3.2.1 Review and updating of existing and prepare new DMPs3.2.1.1 Through the DMN mechanism and in consultation with other
stakeholders, draft new/updated DMPs, including actions plans, identification of roles and responsibilities of public and private sectors and resource requirements and sources, and translate and disseminate DMPs to all members and online
50,000 14,000 12,000 12,000 12,000 14,000 12,000 12,000 12,000 50,000
Subtotal 3.2 50,000 14,000 12,000 12,000 12,000 14,000 12,000 - - 12,000 - - 12,000 - - 50,000 - 3.3 Policy, Regulation and Master Planning Support3.3.1 Policy intervention3.3.1.1 Support DMN policy task force meetings and research to identify
policy issues affecting the tourism industry and the preparation of proposals to relevant authorities for policy change
60,000 15,000 15,000 15,000 15,000 15,000 15,000 15,000 15,000 60,000
3.3.2 Industry standards and regulations3.3.2.1 Through the DMN mechanisms, and where appropriate in alignment
and with technical support from international tourism standards and certification systems (e.g. Global Sustainable Tourism Council, Travelife, Earthcheck), identify, draft, review, finalize, translate, print and distribute national tourism industry standards (for specific types of tourism activities and services not covered by the ASEAN Tourism Standards)
40,000 40,000 - - - 40,000 40,000
3.3.2.2 Through the DMN mechanisms, draft, review, finalize, translate, print and disseminate national and provincial tourism industry regulations for specific tourism activities and services in line with ASEAN and national tourism standards (such as Vang Vieng ballooning, ziplining etc.)
95,000 35,000 20,000 20,000 20,000 35,000 20,000 20,000 20,000 95,000
3.3.3 Master planning3.3.3.1 Through the DMN mechanisms, review existing tourism master
plans, prepare updated/new, approve, translate, print and disseminate tourism master plans for selected destinations (4,000 Islands, Luang Prabang Town and Environs, Nam Ngum 1 Reservoir Recreational Area, Vang Vieng Town and Environs)
290,000 - 70,000 100,000 120,000 70,000 100,000 50,000 70,000 290,000
Subtotal 3.3 485,000 90,000 105,000 135,000 155,000 90,000 15,000 20,000 70,000 35,000 100,000 - 35,000 50,000 70,000 485,000 - 3.4 Destination Marketing and Promotion Support3.4.1 Market research3.4.1.1 Through the DMN structure, conduct destination-specific market
research and analysis, including collection and analysis of destination-specific tourism statistical data, and disseminate results to DMN members and other industry stakeholders
105,000 25,000 25,000 30,000 25,000 25,000 25,000 30,000 25,000 105,000
3.4.2 Branding and promotion3.4.2.1 Through the DMN structure, create/update destination banding 50,000 20,000 - 15,000 15,000 20,000 15,000 15,000 50,000 3.4.2.2 Through the DMN structure, conduct promotion campaigns using
print and on-line media (websites, social media) and familiarization programs for tour operators and the media
170,000 70,000 30,000 40,000 30,000 70,000 30,000 40,000 30,000 170,000
3.4.3 Tourism forums and trade events3.4.3.1 Facilitate participation of project supported destinations (through the
DMN mechanism) in relevant tourism forums and trade events120,000 30,000 30,000 30,000 30,000 30,000 30,000 30,000 30,000 120,000
3.4.3.2 Through the DMN mechanism, organize and host tourism forums and trade events in the target destinations
195,000 75,000 30,000 60,000 30,000 75,000 30,000 60,000 30,000 195,000
3.4.4 Training
COST ESTIMATE OF OUTPUT 3 (DETAILS)ALL AMOUNTS INCLUDING PREVAILING TAXES
Activity Total Activity Coordinator / Fund Manager
Vientiane Province
PCU PIU National Sub-national
Provincial and SiteChampa-
sakLuang
PrabangChampasak Luang Prabang Vientiane Province
Target Destination/Site
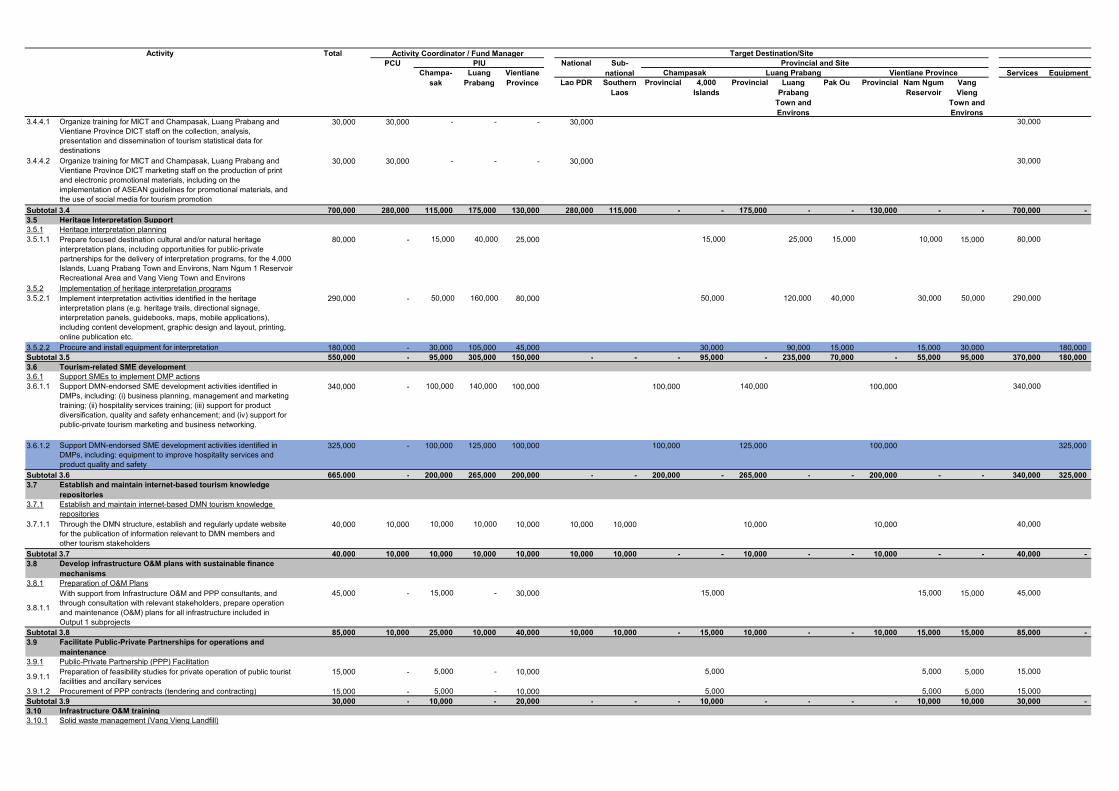
Services EquipmentLao PDR Southern
LaosProvincial 4,000
IslandsProvincial Luang
Prabang Town and Environs
Pak Ou Provincial Nam Ngum Reservoir
Vang Vieng
Town and Environs
Activity Total Activity Coordinator / Fund Manager
Vientiane Province
PCU PIU National Sub-national
Provincial and SiteChampa-
sakLuang
PrabangChampasak Luang Prabang Vientiane Province
Target Destination/Site
3.4.4.1 Organize training for MICT and Champasak, Luang Prabang and Vientiane Province DICT staff on the collection, analysis, presentation and dissemination of tourism statistical data for destinations
30,000 30,000 - - - 30,000 30,000
3.4.4.2 Organize training for MICT and Champasak, Luang Prabang and Vientiane Province DICT marketing staff on the production of print and electronic promotional materials, including on the implementation of ASEAN guidelines for promotional materials, and the use of social media for tourism promotion
30,000 30,000 - - - 30,000 30,000
Subtotal 3.4 700,000 280,000 115,000 175,000 130,000 280,000 115,000 - - 175,000 - - 130,000 - - 700,000 - 3.5 Heritage Interpretation Support3.5.1 Heritage interpretation planning3.5.1.1 Prepare focused destination cultural and/or natural heritage
interpretation plans, including opportunities for public-private partnerships for the delivery of interpretation programs, for the 4,000 Islands, Luang Prabang Town and Environs, Nam Ngum 1 Reservoir Recreational Area and Vang Vieng Town and Environs
80,000 - 15,000 40,000 25,000 15,000 25,000 15,000 10,000 15,000 80,000
3.5.2 Implementation of heritage interpretation programs3.5.2.1 Implement interpretation activities identified in the heritage
interpretation plans (e.g. heritage trails, directional signage, interpretation panels, guidebooks, maps, mobile applications), including content development, graphic design and layout, printing, online publication etc.
290,000 - 50,000 160,000 80,000 50,000 120,000 40,000 30,000 50,000 290,000
3.5.2.2 Procure and install equipment for interpretation 180,000 - 30,000 105,000 45,000 30,000 90,000 15,000 15,000 30,000 180,000 Subtotal 3.5 550,000 - 95,000 305,000 150,000 - - - 95,000 - 235,000 70,000 - 55,000 95,000 370,000 180,000 3.6 Tourism-related SME development3.6.1 Support SMEs to implement DMP actions3.6.1.1 Support DMN-endorsed SME development activities identified in
DMPs, including: (i) business planning, management and marketing training; (ii) hospitality services training; (iii) support for product diversification, quality and safety enhancement; and (iv) support for public-private tourism marketing and business networking.
340,000 - 100,000 140,000 100,000 100,000 140,000 100,000 340,000
3.6.1.2 Support DMN-endorsed SME development activities identified in DMPs, including: equipment to improve hospitality services and product quality and safety
325,000 - 100,000 125,000 100,000 100,000 125,000 100,000 325,000
Subtotal 3.6 665,000 - 200,000 265,000 200,000 - - 200,000 - 265,000 - - 200,000 - - 340,000 325,000 3.7 Establish and maintain internet-based tourism knowledge
repositories3.7.1 Establish and maintain internet-based DMN tourism knowledge
repositories3.7.1.1 Through the DMN structure, establish and regularly update website
for the publication of information relevant to DMN members and other tourism stakeholders
40,000 10,000 10,000 10,000 10,000 10,000 10,000 10,000 10,000 40,000
Subtotal 3.7 40,000 10,000 10,000 10,000 10,000 10,000 10,000 - - 10,000 - - 10,000 - - 40,000 - 3.8 Develop infrastructure O&M plans with sustainable finance
mechanisms3.8.1 Preparation of O&M Plans
3.8.1.1
With support from Infrastructure O&M and PPP consultants, and through consultation with relevant stakeholders, prepare operation and maintenance (O&M) plans for all infrastructure included in Output 1 subprojects
45,000 - 15,000 - 30,000 15,000 15,000 15,000 45,000
Subtotal 3.8 85,000 10,000 25,000 10,000 40,000 10,000 10,000 - 15,000 10,000 - - 10,000 15,000 15,000 85,000 - 3.9 Facilitate Public-Private Partnerships for operations and
maintenance 3.9.1 Public-Private Partnership (PPP) Facilitation
3.9.1.1 Preparation of feasibility studies for private operation of public tourist facilities and ancillary services
15,000 - 5,000 - 10,000 5,000 5,000 5,000 15,000
3.9.1.2 Procurement of PPP contracts (tendering and contracting) 15,000 - 5,000 - 10,000 5,000 5,000 5,000 15,000 Subtotal 3.9 30,000 - 10,000 - 20,000 - - - 10,000 - - - - 10,000 10,000 30,000 - 3.10 Infrastructure O&M training 3.10.1 Solid waste management (Vang Vieng Landfill)
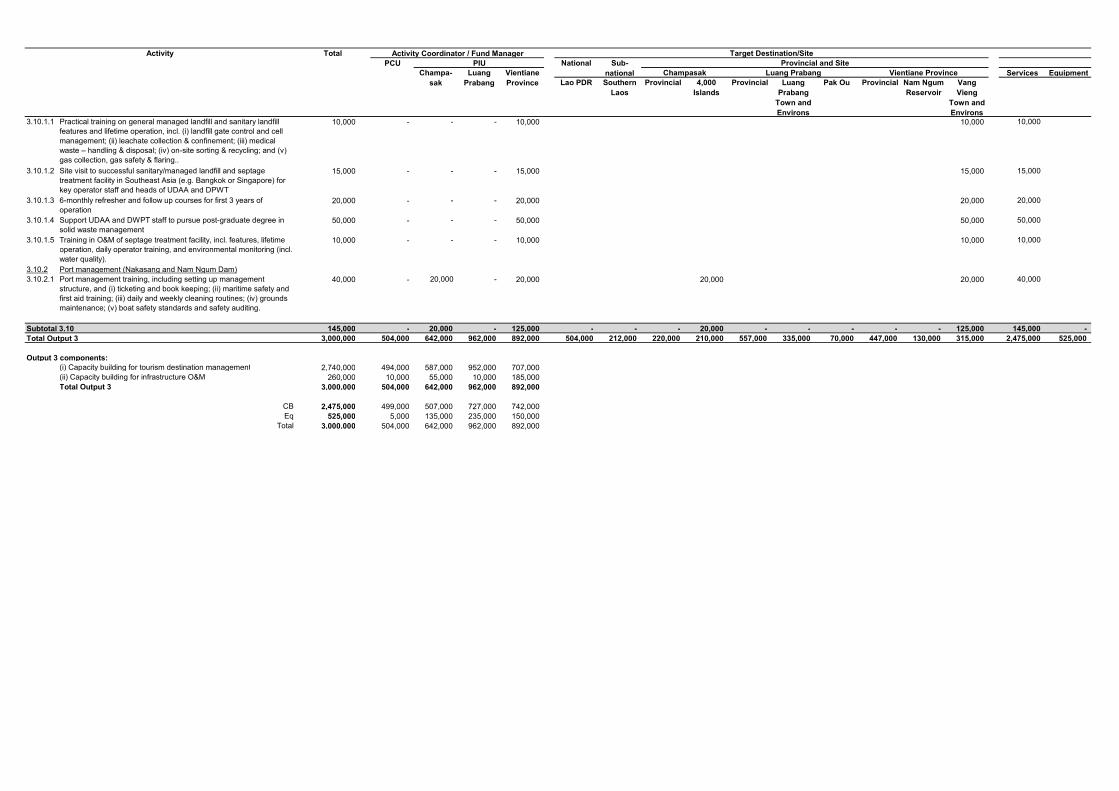
Services EquipmentLao PDR Southern
LaosProvincial 4,000
IslandsProvincial Luang
Prabang Town and Environs
Pak Ou Provincial Nam Ngum Reservoir
Vang Vieng
Town and Environs
Activity Total Activity Coordinator / Fund Manager
Vientiane Province
PCU PIU National Sub-national
Provincial and SiteChampa-
sakLuang
PrabangChampasak Luang Prabang Vientiane Province
Target Destination/Site
3.10.1.1 Practical training on general managed landfill and sanitary landfill features and lifetime operation, incl. (i) landfill gate control and cell management; (ii) leachate collection & confinement; (iii) medical waste – handling & disposal; (iv) on-site sorting & recycling; and (v) gas collection, gas safety & flaring..
10,000 - - - 10,000 10,000 10,000
3.10.1.2 Site visit to successful sanitary/managed landfill and septage treatment facility in Southeast Asia (e.g. Bangkok or Singapore) for key operator staff and heads of UDAA and DPWT
15,000 - - - 15,000 15,000 15,000
3.10.1.3 6-monthly refresher and follow up courses for first 3 years of operation
20,000 - - - 20,000 20,000 20,000
3.10.1.4 Support UDAA and DWPT staff to pursue post-graduate degree in solid waste management
50,000 - - - 50,000 50,000 50,000
3.10.1.5 Training in O&M of septage treatment facility, incl. features, lifetime operation, daily operator training, and environmental monitoring (incl. water quality).
10,000 - - - 10,000 10,000 10,000
3.10.2 Port management (Nakasang and Nam Ngum Dam)3.10.2.1 Port management training, including setting up management
structure, and (i) ticketing and book keeping; (ii) maritime safety and first aid training; (iii) daily and weekly cleaning routines; (iv) grounds maintenance; (v) boat safety standards and safety auditing.
40,000 - 20,000 - 20,000 20,000 20,000 40,000
Subtotal 3.10 145,000 - 20,000 - 125,000 - - - 20,000 - - - - - 125,000 145,000 - Total Output 3 3,000,000 504,000 642,000 962,000 892,000 504,000 212,000 220,000 210,000 557,000 335,000 70,000 447,000 130,000 315,000 2,475,000 525,000
Output 3 components:(i) Capacity building for tourism destination management 2,740,000 494,000 587,000 952,000 707,000 (ii) Capacity building for infrastructure O&M 260,000 10,000 55,000 10,000 185,000 Total Output 3 3,000,000 504,000 642,000 962,000 892,000
CB 2,475,000 499,000 507,000 727,000 742,000 Eq 525,000 5,000 135,000 235,000 150,000
Total 3,000,000 504,000 642,000 962,000 892,000
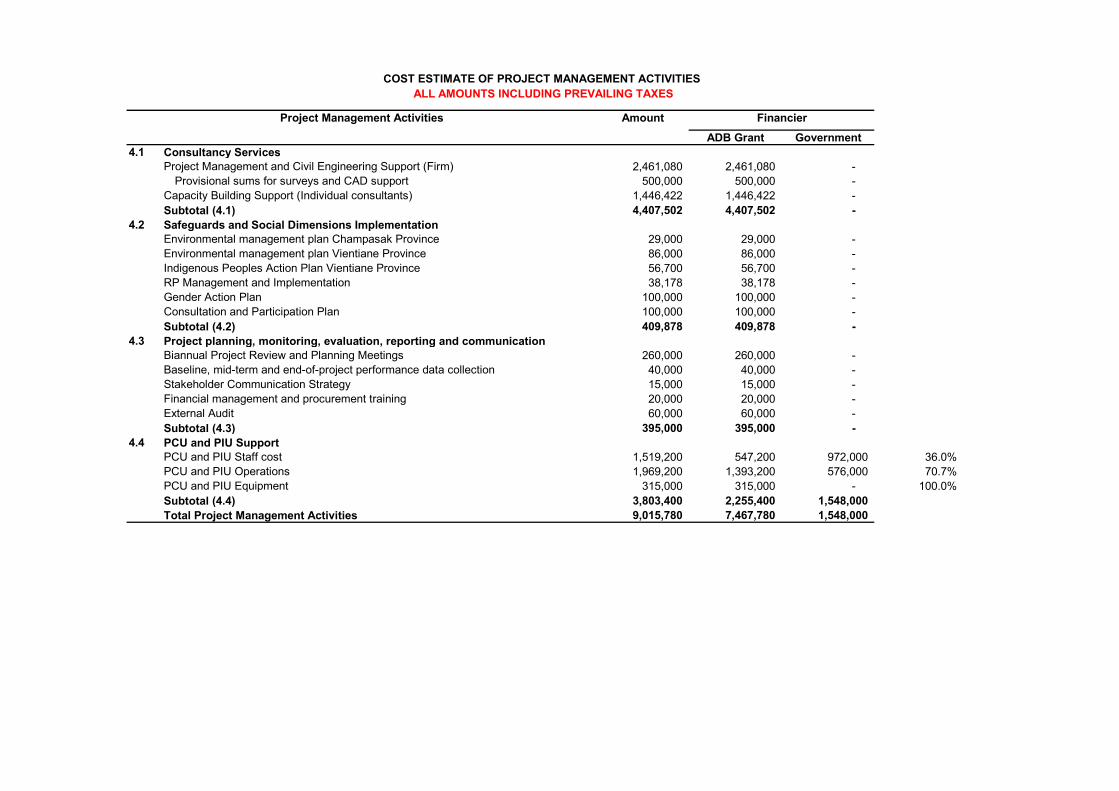
ADB Grant Government4.1 Consultancy Services
Project Management and Civil Engineering Support (Firm) 2,461,080 2,461,080 - Provisional sums for surveys and CAD support 500,000 500,000 -
Capacity Building Support (Individual consultants) 1,446,422 1,446,422 - Subtotal (4.1) 4,407,502 4,407,502 -
4.2 Safeguards and Social Dimensions ImplementationEnvironmental management plan Champasak Province 29,000 29,000 - Environmental management plan Vientiane Province 86,000 86,000 - Indigenous Peoples Action Plan Vientiane Province 56,700 56,700 - RP Management and Implementation 38,178 38,178 - Gender Action Plan 100,000 100,000 - Consultation and Participation Plan 100,000 100,000 - Subtotal (4.2) 409,878 409,878 -
4.3 Project planning, monitoring, evaluation, reporting and communicationBiannual Project Review and Planning Meetings 260,000 260,000 - Baseline, mid-term and end-of-project performance data collection 40,000 40,000 - Stakeholder Communication Strategy 15,000 15,000 - Financial management and procurement training 20,000 20,000 - External Audit 60,000 60,000 - Subtotal (4.3) 395,000 395,000 -
4.4 PCU and PIU SupportPCU and PIU Staff cost 1,519,200 547,200 972,000 36.0%PCU and PIU Operations 1,969,200 1,393,200 576,000 70.7%PCU and PIU Equipment 315,000 315,000 - 100.0%Subtotal (4.4) 3,803,400 2,255,400 1,548,000 Total Project Management Activities 9,015,780 7,467,780 1,548,000
FinancierProject Management Activities Amount
COST ESTIMATE OF PROJECT MANAGEMENT ACTIVITIES ALL AMOUNTS INCLUDING PREVAILING TAXES
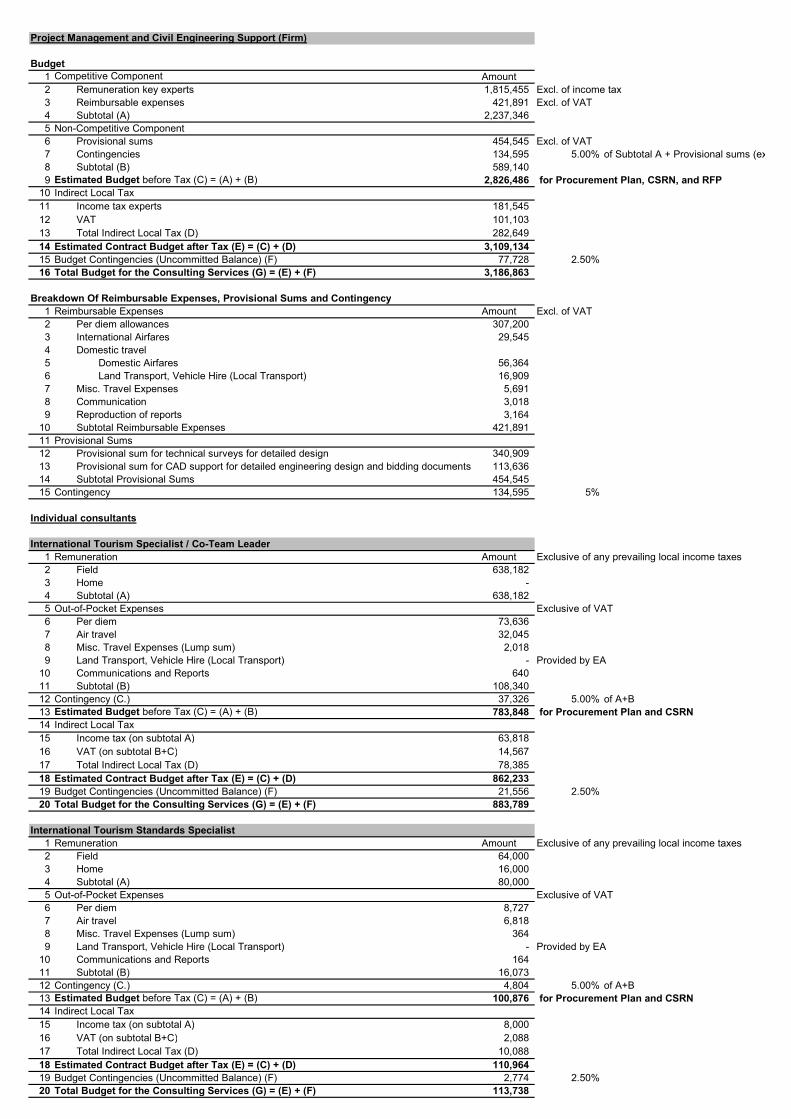
Project Management and Civil Engineering Support (Firm)
Budget1 Competitive Component Amount2 Remuneration key experts 1,815,455 Excl. of income tax3 Reimbursable expenses 421,891 Excl. of VAT4 Subtotal (A) 2,237,346 5 Non-Competitive Component6 Provisional sums 454,545 Excl. of VAT7 Contingencies 134,595 5.00% of Subtotal A + Provisional sums (excl. of VAT)8 Subtotal (B) 589,140 9 Estimated Budget before Tax (C) = (A) + (B) 2,826,486 for Procurement Plan, CSRN, and RFP
10 Indirect Local Tax11 Income tax experts 181,545 12 VAT 101,103 13 Total Indirect Local Tax (D) 282,649 14 Estimated Contract Budget after Tax (E) = (C) + (D) 3,109,134 15 Budget Contingencies (Uncommitted Balance) (F) 77,728 2.50%16 Total Budget for the Consulting Services (G) = (E) + (F) 3,186,863
Breakdown Of Reimbursable Expenses, Provisional Sums and Contingency1 Reimbursable Expenses Amount Excl. of VAT2 Per diem allowances 307,200 3 International Airfares 29,545 4 Domestic travel5 Domestic Airfares 56,364 6 Land Transport, Vehicle Hire (Local Transport) 16,909 7 Misc. Travel Expenses 5,691 8 Communication 3,018 9 Reproduction of reports 3,164
10 Subtotal Reimbursable Expenses 421,891 11 Provisional Sums12 Provisional sum for technical surveys for detailed design 340,909 13 Provisional sum for CAD support for detailed engineering design and bidding documents 113,636 14 Subtotal Provisional Sums 454,545 15 Contingency 134,595 5%
Individual consultants
International Tourism Specialist / Co-Team Leader1 Remuneration Amount Exclusive of any prevailing local income taxes2 Field 638,182 3 Home - 4 Subtotal (A) 638,182 5 Out-of-Pocket Expenses Exclusive of VAT6 Per diem 73,636 7 Air travel 32,045 8 Misc. Travel Expenses (Lump sum) 2,018 9 Land Transport, Vehicle Hire (Local Transport) - Provided by EA
10 Communications and Reports 640 11 Subtotal (B) 108,340 12 Contingency (C.) 37,326 5.00% of A+B13 Estimated Budget before Tax (C) = (A) + (B) 783,848 for Procurement Plan and CSRN14 Indirect Local Tax15 Income tax (on subtotal A) 63,818 16 VAT (on subtotal B+C) 14,567 17 Total Indirect Local Tax (D) 78,385 18 Estimated Contract Budget after Tax (E) = (C) + (D) 862,233 19 Budget Contingencies (Uncommitted Balance) (F) 21,556 2.50%20 Total Budget for the Consulting Services (G) = (E) + (F) 883,789
International Tourism Standards Specialist1 Remuneration Amount Exclusive of any prevailing local income taxes2 Field 64,000 3 Home 16,000 4 Subtotal (A) 80,000 5 Out-of-Pocket Expenses Exclusive of VAT6 Per diem 8,727 7 Air travel 6,818 8 Misc. Travel Expenses (Lump sum) 364 9 Land Transport, Vehicle Hire (Local Transport) - Provided by EA
10 Communications and Reports 164 11 Subtotal (B) 16,073 12 Contingency (C.) 4,804 5.00% of A+B13 Estimated Budget before Tax (C) = (A) + (B) 100,876 for Procurement Plan and CSRN14 Indirect Local Tax15 Income tax (on subtotal A) 8,000 16 VAT (on subtotal B+C) 2,088 17 Total Indirect Local Tax (D) 10,088 18 Estimated Contract Budget after Tax (E) = (C) + (D) 110,964 19 Budget Contingencies (Uncommitted Balance) (F) 2,774 2.50%20 Total Budget for the Consulting Services (G) = (E) + (F) 113,738
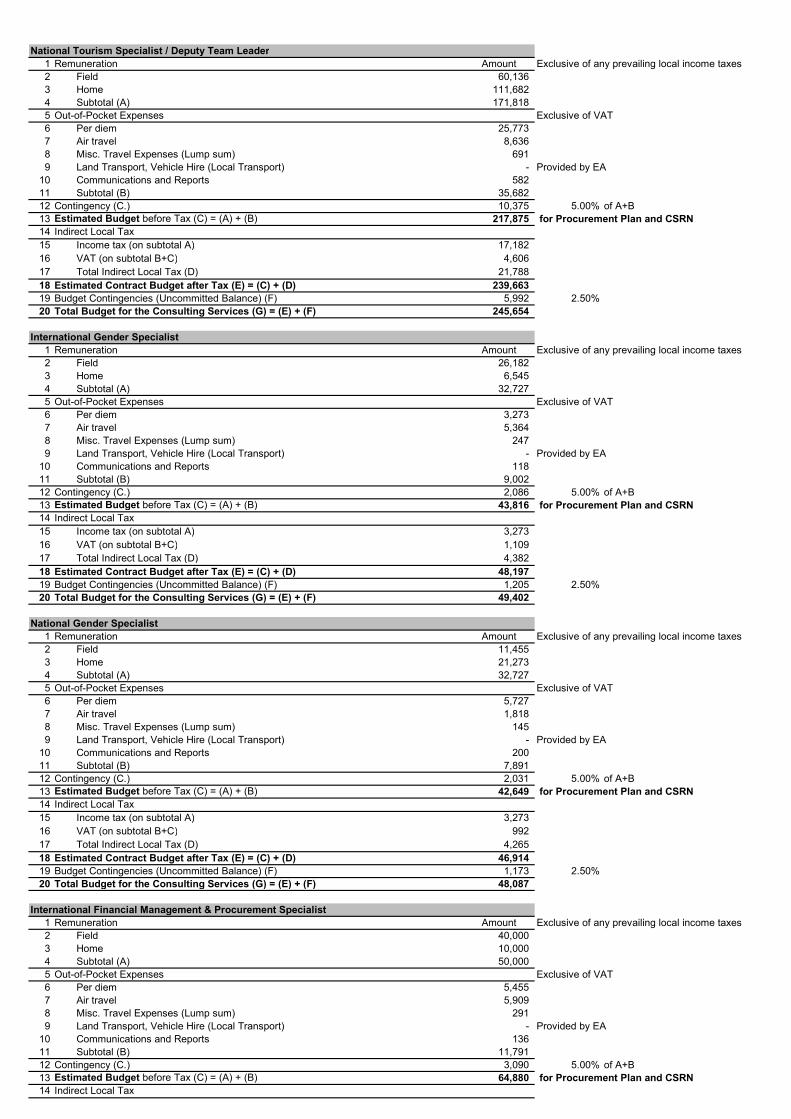
National Tourism Specialist / Deputy Team Leader1 Remuneration Amount Exclusive of any prevailing local income taxes2 Field 60,136 3 Home 111,682 4 Subtotal (A) 171,818 5 Out-of-Pocket Expenses Exclusive of VAT6 Per diem 25,773 7 Air travel 8,636 8 Misc. Travel Expenses (Lump sum) 691 9 Land Transport, Vehicle Hire (Local Transport) - Provided by EA
10 Communications and Reports 582 11 Subtotal (B) 35,682 12 Contingency (C.) 10,375 5.00% of A+B13 Estimated Budget before Tax (C) = (A) + (B) 217,875 for Procurement Plan and CSRN14 Indirect Local Tax15 Income tax (on subtotal A) 17,182 16 VAT (on subtotal B+C) 4,606 17 Total Indirect Local Tax (D) 21,788 18 Estimated Contract Budget after Tax (E) = (C) + (D) 239,663 19 Budget Contingencies (Uncommitted Balance) (F) 5,992 2.50%20 Total Budget for the Consulting Services (G) = (E) + (F) 245,654
International Gender Specialist1 Remuneration Amount Exclusive of any prevailing local income taxes2 Field 26,182 3 Home 6,545 4 Subtotal (A) 32,727 5 Out-of-Pocket Expenses Exclusive of VAT6 Per diem 3,273 7 Air travel 5,364 8 Misc. Travel Expenses (Lump sum) 247 9 Land Transport, Vehicle Hire (Local Transport) - Provided by EA
10 Communications and Reports 118 11 Subtotal (B) 9,002 12 Contingency (C.) 2,086 5.00% of A+B13 Estimated Budget before Tax (C) = (A) + (B) 43,816 for Procurement Plan and CSRN14 Indirect Local Tax15 Income tax (on subtotal A) 3,273 16 VAT (on subtotal B+C) 1,109 17 Total Indirect Local Tax (D) 4,382 18 Estimated Contract Budget after Tax (E) = (C) + (D) 48,197 19 Budget Contingencies (Uncommitted Balance) (F) 1,205 2.50%20 Total Budget for the Consulting Services (G) = (E) + (F) 49,402
National Gender Specialist1 Remuneration Amount Exclusive of any prevailing local income taxes2 Field 11,455 3 Home 21,273 4 Subtotal (A) 32,727 5 Out-of-Pocket Expenses Exclusive of VAT6 Per diem 5,727 7 Air travel 1,818 8 Misc. Travel Expenses (Lump sum) 145 9 Land Transport, Vehicle Hire (Local Transport) - Provided by EA
10 Communications and Reports 200 11 Subtotal (B) 7,891 12 Contingency (C.) 2,031 5.00% of A+B13 Estimated Budget before Tax (C) = (A) + (B) 42,649 for Procurement Plan and CSRN14 Indirect Local Tax15 Income tax (on subtotal A) 3,273 16 VAT (on subtotal B+C) 992 17 Total Indirect Local Tax (D) 4,265 18 Estimated Contract Budget after Tax (E) = (C) + (D) 46,914 19 Budget Contingencies (Uncommitted Balance) (F) 1,173 2.50%20 Total Budget for the Consulting Services (G) = (E) + (F) 48,087
International Financial Management & Procurement Specialist1 Remuneration Amount Exclusive of any prevailing local income taxes2 Field 40,000 3 Home 10,000 4 Subtotal (A) 50,000 5 Out-of-Pocket Expenses Exclusive of VAT6 Per diem 5,455 7 Air travel 5,909 8 Misc. Travel Expenses (Lump sum) 291 9 Land Transport, Vehicle Hire (Local Transport) - Provided by EA
10 Communications and Reports 136 11 Subtotal (B) 11,791 12 Contingency (C.) 3,090 5.00% of A+B13 Estimated Budget before Tax (C) = (A) + (B) 64,880 for Procurement Plan and CSRN14 Indirect Local Tax
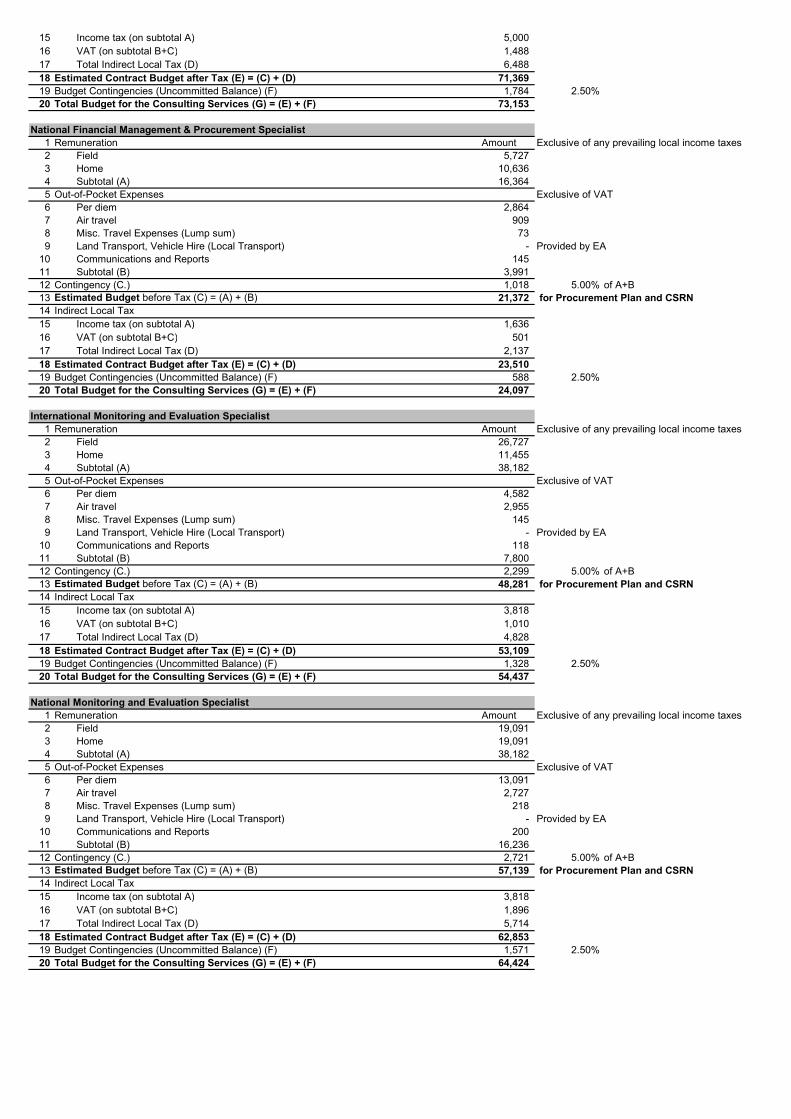
15 Income tax (on subtotal A) 5,000 16 VAT (on subtotal B+C) 1,488 17 Total Indirect Local Tax (D) 6,488 18 Estimated Contract Budget after Tax (E) = (C) + (D) 71,369 19 Budget Contingencies (Uncommitted Balance) (F) 1,784 2.50%20 Total Budget for the Consulting Services (G) = (E) + (F) 73,153
National Financial Management & Procurement Specialist1 Remuneration Amount Exclusive of any prevailing local income taxes2 Field 5,727 3 Home 10,636 4 Subtotal (A) 16,364 5 Out-of-Pocket Expenses Exclusive of VAT6 Per diem 2,864 7 Air travel 909 8 Misc. Travel Expenses (Lump sum) 73 9 Land Transport, Vehicle Hire (Local Transport) - Provided by EA
10 Communications and Reports 145 11 Subtotal (B) 3,991 12 Contingency (C.) 1,018 5.00% of A+B13 Estimated Budget before Tax (C) = (A) + (B) 21,372 for Procurement Plan and CSRN14 Indirect Local Tax15 Income tax (on subtotal A) 1,636 16 VAT (on subtotal B+C) 501 17 Total Indirect Local Tax (D) 2,137 18 Estimated Contract Budget after Tax (E) = (C) + (D) 23,510 19 Budget Contingencies (Uncommitted Balance) (F) 588 2.50%20 Total Budget for the Consulting Services (G) = (E) + (F) 24,097
International Monitoring and Evaluation Specialist1 Remuneration Amount Exclusive of any prevailing local income taxes2 Field 26,727 3 Home 11,455 4 Subtotal (A) 38,182 5 Out-of-Pocket Expenses Exclusive of VAT6 Per diem 4,582 7 Air travel 2,955 8 Misc. Travel Expenses (Lump sum) 145 9 Land Transport, Vehicle Hire (Local Transport) - Provided by EA
10 Communications and Reports 118 11 Subtotal (B) 7,800 12 Contingency (C.) 2,299 5.00% of A+B13 Estimated Budget before Tax (C) = (A) + (B) 48,281 for Procurement Plan and CSRN14 Indirect Local Tax15 Income tax (on subtotal A) 3,818 16 VAT (on subtotal B+C) 1,010 17 Total Indirect Local Tax (D) 4,828 18 Estimated Contract Budget after Tax (E) = (C) + (D) 53,109 19 Budget Contingencies (Uncommitted Balance) (F) 1,328 2.50%20 Total Budget for the Consulting Services (G) = (E) + (F) 54,437
National Monitoring and Evaluation Specialist1 Remuneration Amount Exclusive of any prevailing local income taxes2 Field 19,091 3 Home 19,091 4 Subtotal (A) 38,182 5 Out-of-Pocket Expenses Exclusive of VAT6 Per diem 13,091 7 Air travel 2,727 8 Misc. Travel Expenses (Lump sum) 218 9 Land Transport, Vehicle Hire (Local Transport) - Provided by EA
10 Communications and Reports 200 11 Subtotal (B) 16,236 12 Contingency (C.) 2,721 5.00% of A+B13 Estimated Budget before Tax (C) = (A) + (B) 57,139 for Procurement Plan and CSRN14 Indirect Local Tax15 Income tax (on subtotal A) 3,818 16 VAT (on subtotal B+C) 1,896 17 Total Indirect Local Tax (D) 5,714 18 Estimated Contract Budget after Tax (E) = (C) + (D) 62,853 19 Budget Contingencies (Uncommitted Balance) (F) 1,571 2.50%20 Total Budget for the Consulting Services (G) = (E) + (F) 64,424
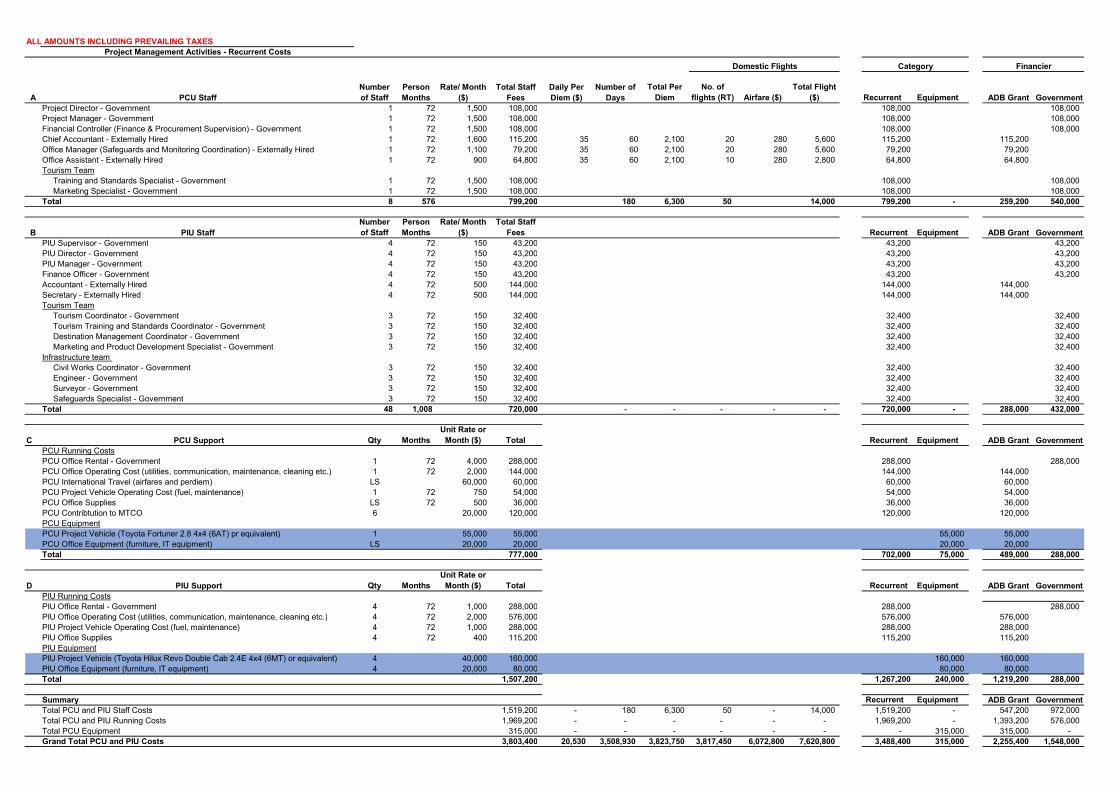
ALL AMOUNTS INCLUDING PREVAILING TAXESProject Management Activities - Recurrent Costs
Total Per Diem
No. of flights (RT) Airfare ($)
Total Flight ($) Recurrent Equipment ADB Grant Government
Project Director - Government 1 72 1,500 108,000 108,000 108,000 Project Manager - Government 1 72 1,500 108,000 108,000 108,000 Financial Controller (Finance & Procurement Supervision) - Government 1 72 1,500 108,000 108,000 108,000 Chief Accountant - Externally Hired 1 72 1,600 115,200 35 60 2,100 20 280 5,600 115,200 115,200 Office Manager (Safeguards and Monitoring Coordination) - Externally Hired 1 72 1,100 79,200 35 60 2,100 20 280 5,600 79,200 79,200 Office Assistant - Externally Hired 1 72 900 64,800 35 60 2,100 10 280 2,800 64,800 64,800 Tourism Team
Training and Standards Specialist - Government 1 72 1,500 108,000 108,000 108,000 Marketing Specialist - Government 1 72 1,500 108,000 108,000 108,000
Total 8 576 799,200 180 6,300 50 14,000 799,200 - 259,200 540,000
B PIU StaffNumber of Staff
Person Months
Rate/ Month ($)
Total Staff Fees Recurrent Equipment ADB Grant Government
PIU Supervisor - Government 4 72 150 43,200 43,200 43,200 PIU Director - Government 4 72 150 43,200 43,200 43,200 PIU Manager - Government 4 72 150 43,200 43,200 43,200 Finance Officer - Government 4 72 150 43,200 43,200 43,200 Accountant - Externally Hired 4 72 500 144,000 144,000 144,000 Secretary - Externally Hired 4 72 500 144,000 144,000 144,000 Tourism Team
Tourism Coordinator - Government 3 72 150 32,400 32,400 32,400 Tourism Training and Standards Coordinator - Government 3 72 150 32,400 32,400 32,400 Destination Management Coordinator - Government 3 72 150 32,400 32,400 32,400 Marketing and Product Development Specialist - Government 3 72 150 32,400 32,400 32,400
Infrastructure team Civil Works Coordinator - Government 3 72 150 32,400 32,400 32,400 Engineer - Government 3 72 150 32,400 32,400 32,400 Surveyor - Government 3 72 150 32,400 32,400 32,400 Safeguards Specialist - Government 3 72 150 32,400 32,400 32,400
Total 48 1,008 720,000 - - - - - 720,000 - 288,000 432,000
C PCU Support Qty MonthsUnit Rate or
Month ($) Total Recurrent Equipment ADB Grant GovernmentPCU Running CostsPCU Office Rental - Government 1 72 4,000 288,000 288,000 288,000 PCU Office Operating Cost (utilities, communication, maintenance, cleaning etc.) 1 72 2,000 144,000 144,000 144,000 PCU International Travel (airfares and perdiem) LS 60,000 60,000 60,000 60,000 PCU Project Vehicle Operating Cost (fuel, maintenance) 1 72 750 54,000 54,000 54,000 PCU Office Supplies LS 72 500 36,000 36,000 36,000 PCU Contribtution to MTCO 6 20,000 120,000 120,000 120,000 PCU EquipmentPCU Project Vehicle (Toyota Fortuner 2.8 4x4 (6AT) pr equivalent) 1 55,000 55,000 55,000 55,000 PCU Office Equipment (furniture, IT equipment) LS 20,000 20,000 20,000 20,000 Total 777,000 702,000 75,000 489,000 288,000
D PIU Support Qty MonthsUnit Rate or
Month ($) Total Recurrent Equipment ADB Grant GovernmentPIU Running CostsPIU Office Rental - Government 4 72 1,000 288,000 288,000 288,000 PIU Office Operating Cost (utilities, communication, maintenance, cleaning etc.) 4 72 2,000 576,000 576,000 576,000 PIU Project Vehicle Operating Cost (fuel, maintenance) 4 72 1,000 288,000 288,000 288,000 PIU Office Supplies 4 72 400 115,200 115,200 115,200 PIU EquipmentPIU Project Vehicle (Toyota Hilux Revo Double Cab 2.4E 4x4 (6MT) or equivalent) 4 40,000 160,000 160,000 160,000 PIU Office Equipment (furniture, IT equipment) 4 20,000 80,000 80,000 80,000 Total 1,507,200 1,267,200 240,000 1,219,200 288,000
Summary Recurrent Equipment ADB Grant GovernmentTotal PCU and PIU Staff Costs 1,519,200 - 180 6,300 50 - 14,000 1,519,200 - 547,200 972,000 Total PCU and PIU Running Costs 1,969,200 - - - - - - 1,969,200 - 1,393,200 576,000 Total PCU Equipment 315,000 - - - - - - - 315,000 315,000 - Grand Total PCU and PIU Costs 3,803,400 20,530 3,508,930 3,823,750 3,817,450 6,072,800 7,620,800 3,488,400 315,000 2,255,400 1,548,000
Total Staff Fees
Daily Per Diem ($)
Number of DaysA PCU Staff
Number of Staff
Person Months
Rate/ Month ($)
Domestic Flights Category Financier
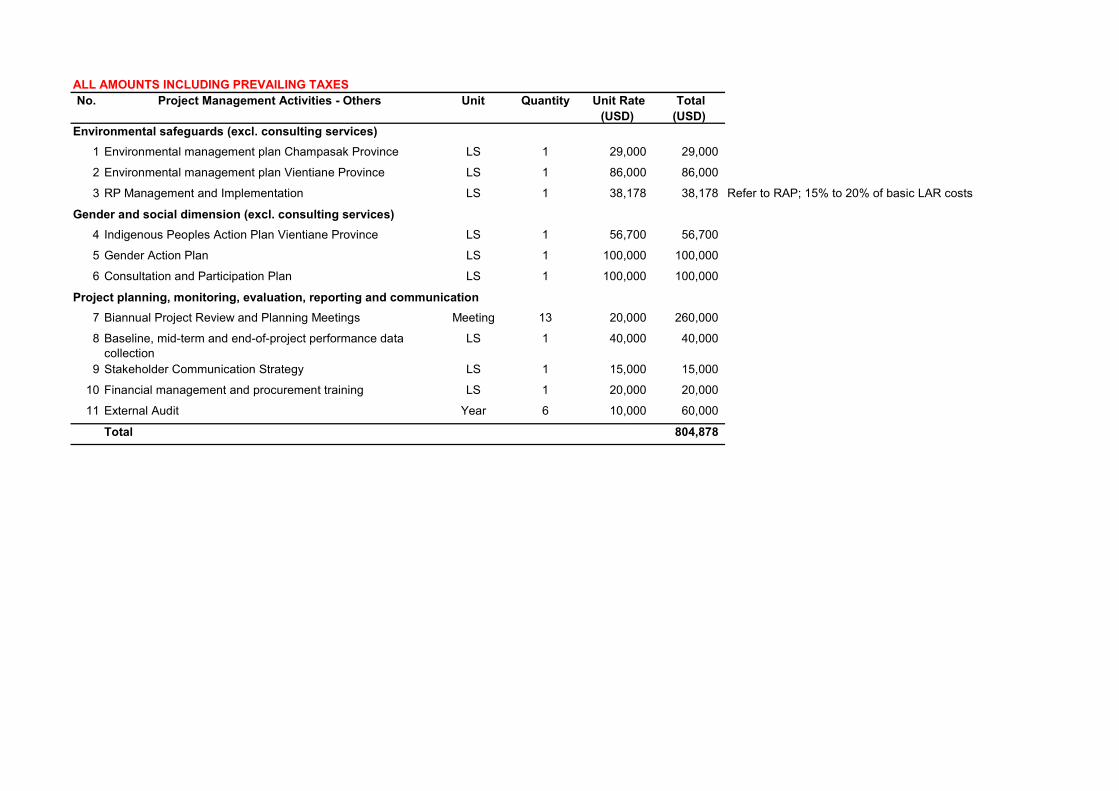
ALL AMOUNTS INCLUDING PREVAILING TAXESNo. Project Management Activities - Others Unit Quantity Unit Rate
(USD) Total (USD)
Environmental safeguards (excl. consulting services)1 Environmental management plan Champasak Province LS 1 29,000 29,000
2 Environmental management plan Vientiane Province LS 1 86,000 86,000
3 RP Management and Implementation LS 1 38,178 38,178 Refer to RAP; 15% to 20% of basic LAR costs
Gender and social dimension (excl. consulting services)4 Indigenous Peoples Action Plan Vientiane Province LS 1 56,700 56,700
5 Gender Action Plan LS 1 100,000 100,000
6 Consultation and Participation Plan LS 1 100,000 100,000
Project planning, monitoring, evaluation, reporting and communication7 Biannual Project Review and Planning Meetings Meeting 13 20,000 260,000
8 Baseline, mid-term and end-of-project performance data collection
LS 1 40,000 40,000
9 Stakeholder Communication Strategy LS 1 15,000 15,000
10 Financial management and procurement training LS 1 20,000 20,000
11 External Audit Year 6 10,000 60,000
Total 804,878
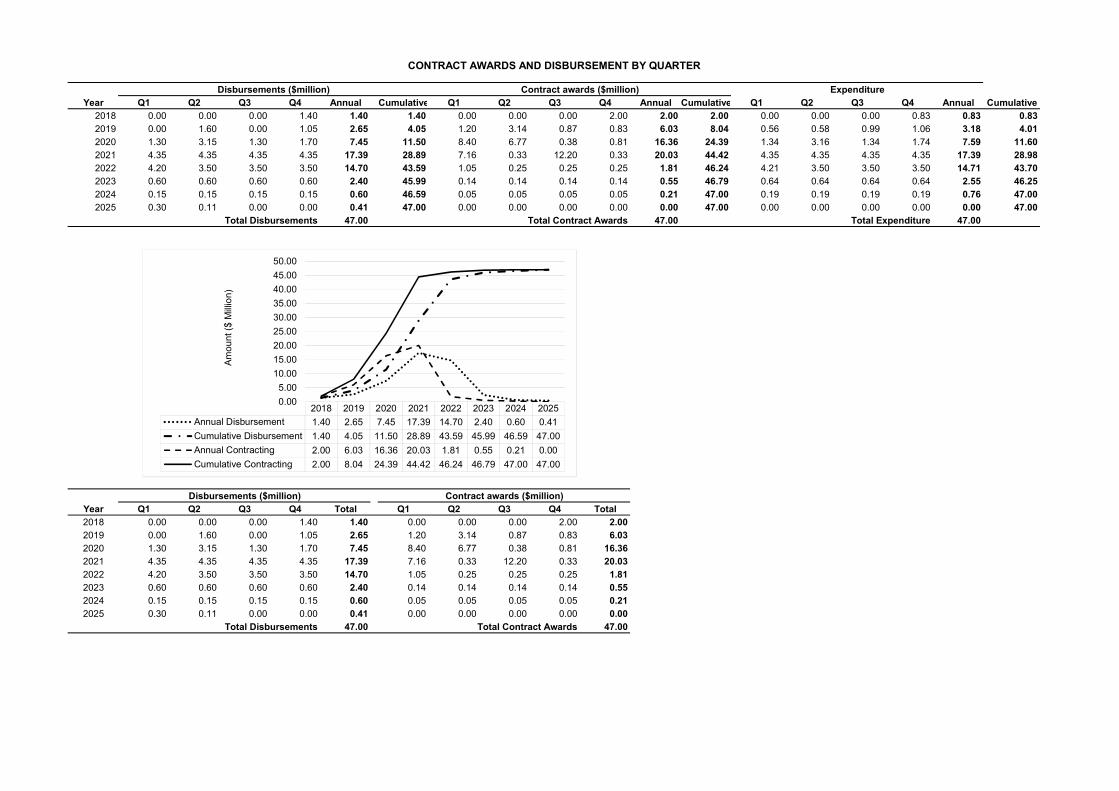
Year Q1 Q2 Q3 Q4 Annual Cumulative Q1 Q2 Q3 Q4 Annual Cumulative Q1 Q2 Q3 Q4 Annual Cumulative2018 0.00 0.00 0.00 1.40 1.40 1.40 0.00 0.00 0.00 2.00 2.00 2.00 0.00 0.00 0.00 0.83 0.83 0.832019 0.00 1.60 0.00 1.05 2.65 4.05 1.20 3.14 0.87 0.83 6.03 8.04 0.56 0.58 0.99 1.06 3.18 4.012020 1.30 3.15 1.30 1.70 7.45 11.50 8.40 6.77 0.38 0.81 16.36 24.39 1.34 3.16 1.34 1.74 7.59 11.602021 4.35 4.35 4.35 4.35 17.39 28.89 7.16 0.33 12.20 0.33 20.03 44.42 4.35 4.35 4.35 4.35 17.39 28.982022 4.20 3.50 3.50 3.50 14.70 43.59 1.05 0.25 0.25 0.25 1.81 46.24 4.21 3.50 3.50 3.50 14.71 43.702023 0.60 0.60 0.60 0.60 2.40 45.99 0.14 0.14 0.14 0.14 0.55 46.79 0.64 0.64 0.64 0.64 2.55 46.252024 0.15 0.15 0.15 0.15 0.60 46.59 0.05 0.05 0.05 0.05 0.21 47.00 0.19 0.19 0.19 0.19 0.76 47.002025 0.30 0.11 0.00 0.00 0.41 47.00 0.00 0.00 0.00 0.00 0.00 47.00 0.00 0.00 0.00 0.00 0.00 47.00
Total Disbursements 47.00 Total Contract Awards 47.00 Total Expenditure 47.00
Year Q1 Q2 Q3 Q4 Total Q1 Q2 Q3 Q4 Total2018 0.00 0.00 0.00 1.40 1.40 0.00 0.00 0.00 2.00 2.002019 0.00 1.60 0.00 1.05 2.65 1.20 3.14 0.87 0.83 6.032020 1.30 3.15 1.30 1.70 7.45 8.40 6.77 0.38 0.81 16.362021 4.35 4.35 4.35 4.35 17.39 7.16 0.33 12.20 0.33 20.032022 4.20 3.50 3.50 3.50 14.70 1.05 0.25 0.25 0.25 1.812023 0.60 0.60 0.60 0.60 2.40 0.14 0.14 0.14 0.14 0.552024 0.15 0.15 0.15 0.15 0.60 0.05 0.05 0.05 0.05 0.212025 0.30 0.11 0.00 0.00 0.41 0.00 0.00 0.00 0.00 0.00
47.00 47.00
CONTRACT AWARDS AND DISBURSEMENT BY QUARTER
Total Disbursements Total Contract Awards
Disbursements ($million) Contract awards ($million) Expenditure
Disbursements ($million) Contract awards ($million)
2018 2019 2020 2021 2022 2023 2024 2025Annual Disbursement 1.40 2.65 7.45 17.39 14.70 2.40 0.60 0.41Cumulative Disbursement 1.40 4.05 11.50 28.89 43.59 45.99 46.59 47.00Annual Contracting 2.00 6.03 16.36 20.03 1.81 0.55 0.21 0.00Cumulative Contracting 2.00 8.04 24.39 44.42 46.24 46.79 47.00 47.00
0.005.00
10.0015.0020.0025.0030.0035.0040.0045.0050.00
Amou
nt ($
Milli
on)
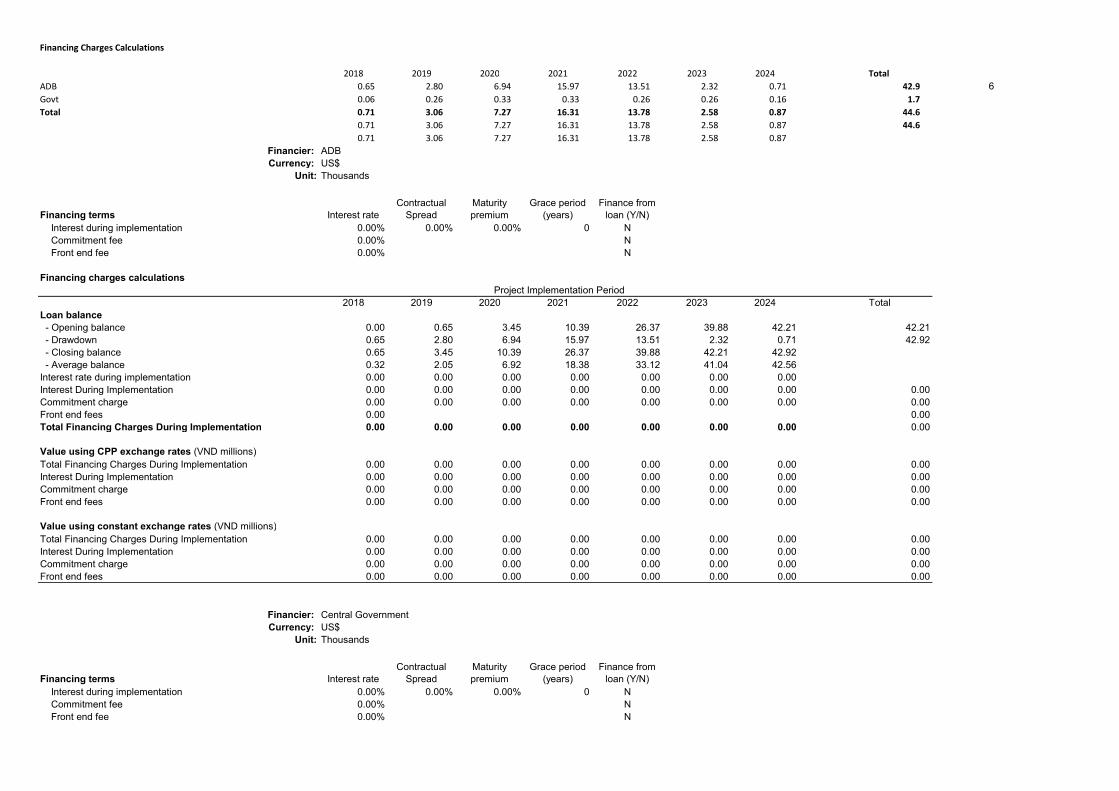
Financing Charges Calculations
2018 2019 2020 2021 2022 2023 2024 TotalADB 0.65 2.80 6.94 15.97 13.51 2.32 0.71 42.9 6 Govt 0.06 0.26 0.33 0.33 0.26 0.26 0.16 1.7 Total 0.71 3.06 7.27 16.31 13.78 2.58 0.87 44.6
0.71 3.06 7.27 16.31 13.78 2.58 0.87 44.6 0.71 3.06 7.27 16.31 13.78 2.58 0.87
Financier: ADBCurrency: US$
Unit: Thousands
Financing terms Interest rateContractual
SpreadMaturity premium
Grace period (years)
Finance from loan (Y/N)
Interest during implementation 0.00% 0.00% 0.00% 0 NCommitment fee 0.00% NFront end fee 0.00% N
Financing charges calculations
2018 2019 2020 2021 2022 2023 2024 TotalLoan balance - Opening balance 0.00 0.65 3.45 10.39 26.37 39.88 42.21 42.21 - Drawdown 0.65 2.80 6.94 15.97 13.51 2.32 0.71 42.92 - Closing balance 0.65 3.45 10.39 26.37 39.88 42.21 42.92 - Average balance 0.32 2.05 6.92 18.38 33.12 41.04 42.56Interest rate during implementation 0.00 0.00 0.00 0.00 0.00 0.00 0.00Interest During Implementation 0.00 0.00 0.00 0.00 0.00 0.00 0.00 0.00Commitment charge 0.00 0.00 0.00 0.00 0.00 0.00 0.00 0.00Front end fees 0.00 0.00Total Financing Charges During Implementation 0.00 0.00 0.00 0.00 0.00 0.00 0.00 0.00
Value using CPP exchange rates (VND millions)Total Financing Charges During Implementation 0.00 0.00 0.00 0.00 0.00 0.00 0.00 0.00Interest During Implementation 0.00 0.00 0.00 0.00 0.00 0.00 0.00 0.00Commitment charge 0.00 0.00 0.00 0.00 0.00 0.00 0.00 0.00Front end fees 0.00 0.00 0.00 0.00 0.00 0.00 0.00 0.00
Value using constant exchange rates (VND millions)Total Financing Charges During Implementation 0.00 0.00 0.00 0.00 0.00 0.00 0.00 0.00Interest During Implementation 0.00 0.00 0.00 0.00 0.00 0.00 0.00 0.00Commitment charge 0.00 0.00 0.00 0.00 0.00 0.00 0.00 0.00Front end fees 0.00 0.00 0.00 0.00 0.00 0.00 0.00 0.00
Financier: Central GovernmentCurrency: US$
Unit: Thousands
Financing terms Interest rateContractual
SpreadMaturity premium
Grace period (years)
Finance from loan (Y/N)
Interest during implementation 0.00% 0.00% 0.00% 0 NCommitment fee 0.00% NFront end fee 0.00% N
Project Implementation Period
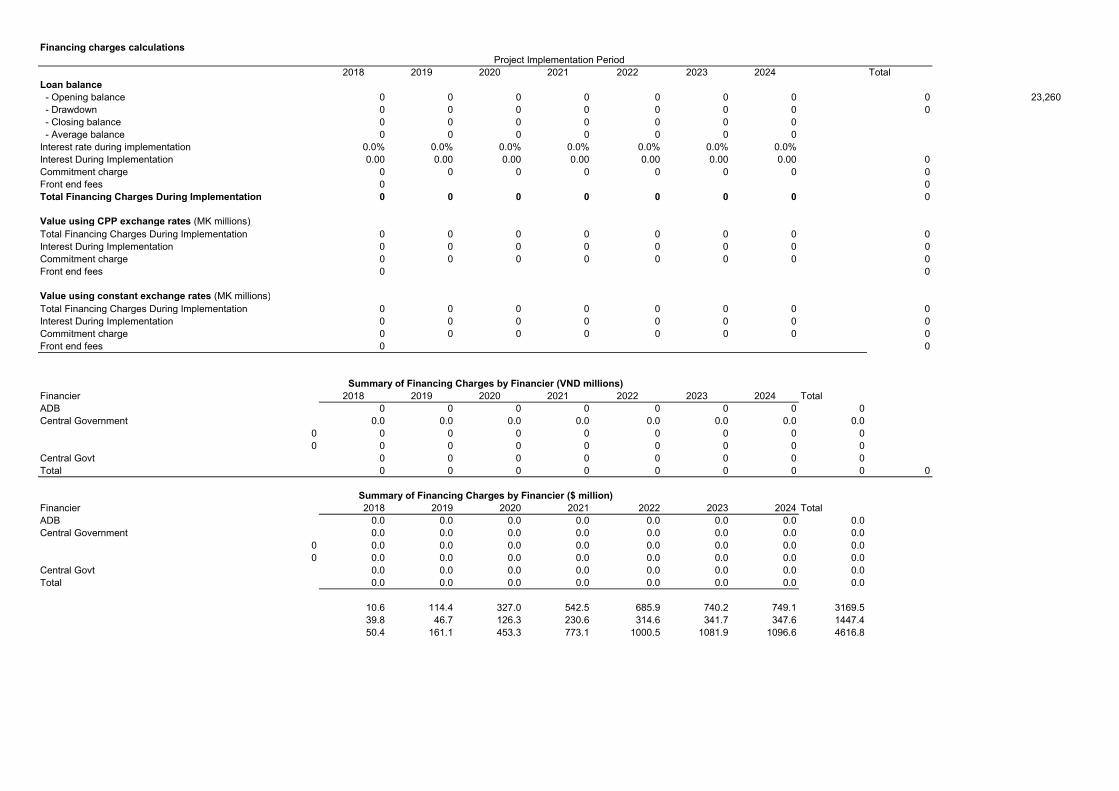
Financing charges calculations
2018 2019 2020 2021 2022 2023 2024 TotalLoan balance - Opening balance 0 0 0 0 0 0 0 0 23,260 - Drawdown 0 0 0 0 0 0 0 0 - Closing balance 0 0 0 0 0 0 0 - Average balance 0 0 0 0 0 0 0Interest rate during implementation 0.0% 0.0% 0.0% 0.0% 0.0% 0.0% 0.0%Interest During Implementation 0.00 0.00 0.00 0.00 0.00 0.00 0.00 0Commitment charge 0 0 0 0 0 0 0 0Front end fees 0 0Total Financing Charges During Implementation 0 0 0 0 0 0 0 0
Value using CPP exchange rates (MK millions)Total Financing Charges During Implementation 0 0 0 0 0 0 0 0Interest During Implementation 0 0 0 0 0 0 0 0Commitment charge 0 0 0 0 0 0 0 0Front end fees 0 0
Value using constant exchange rates (MK millions)Total Financing Charges During Implementation 0 0 0 0 0 0 0 0Interest During Implementation 0 0 0 0 0 0 0 0Commitment charge 0 0 0 0 0 0 0 0Front end fees 0 0
Financier 2018 2019 2020 2021 2022 2023 2024 TotalADB 0 0 0 0 0 0 0 0Central Government 0.0 0.0 0.0 0.0 0.0 0.0 0.0 0.0
0 0 0 0 0 0 0 0 00 0 0 0 0 0 0 0 0
Central Govt 0 0 0 0 0 0 0 0Total 0 0 0 0 0 0 0 0 0
Financier 2018 2019 2020 2021 2022 2023 2024 TotalADB 0.0 0.0 0.0 0.0 0.0 0.0 0.0 0.0Central Government 0.0 0.0 0.0 0.0 0.0 0.0 0.0 0.0
0 0.0 0.0 0.0 0.0 0.0 0.0 0.0 0.00 0.0 0.0 0.0 0.0 0.0 0.0 0.0 0.0
Central Govt 0.0 0.0 0.0 0.0 0.0 0.0 0.0 0.0Total 0.0 0.0 0.0 0.0 0.0 0.0 0.0 0.0
10.6 114.4 327.0 542.5 685.9 740.2 749.1 3169.539.8 46.7 126.3 230.6 314.6 341.7 347.6 1447.450.4 161.1 453.3 773.1 1000.5 1081.9 1096.6 4616.8
Summary of Financing Charges by Financier ($ million)
Project Implementation Period
Summary of Financing Charges by Financier (VND millions)
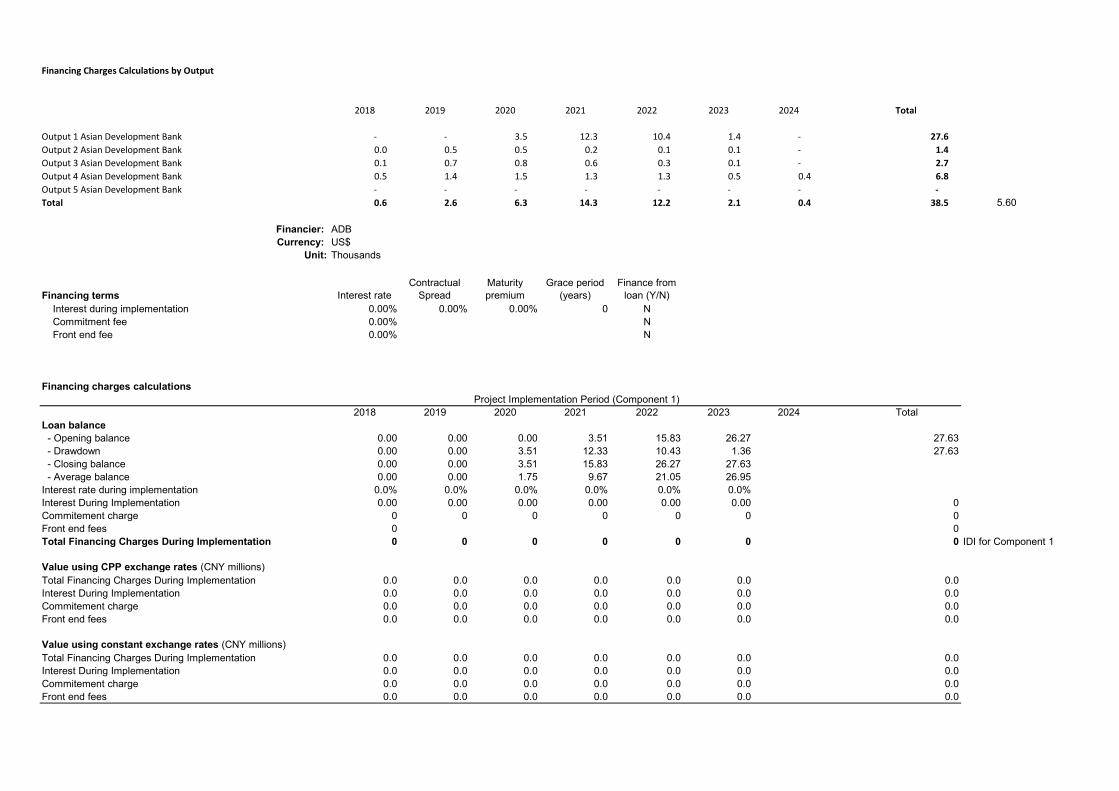
Financing Charges Calculations by Output
2018 2019 2020 2021 2022 2023 2024 Total
Output 1 Asian Development Bank - - 3.5 12.3 10.4 1.4 - 27.6 Output 2 Asian Development Bank 0.0 0.5 0.5 0.2 0.1 0.1 - 1.4 Output 3 Asian Development Bank 0.1 0.7 0.8 0.6 0.3 0.1 - 2.7 Output 4 Asian Development Bank 0.5 1.4 1.5 1.3 1.3 0.5 0.4 6.8 Output 5 Asian Development Bank - - - - - - - - Total 0.6 2.6 6.3 14.3 12.2 2.1 0.4 38.5 5.60
Financier: ADBCurrency: US$
Unit: Thousands
Financing terms Interest rateContractual
SpreadMaturity premium
Grace period (years)
Finance from loan (Y/N)
Interest during implementation 0.00% 0.00% 0.00% 0 NCommitment fee 0.00% NFront end fee 0.00% N
Financing charges calculations
2018 2019 2020 2021 2022 2023 2024 TotalLoan balance - Opening balance 0.00 0.00 0.00 3.51 15.83 26.27 27.63 - Drawdown 0.00 0.00 3.51 12.33 10.43 1.36 27.63 - Closing balance 0.00 0.00 3.51 15.83 26.27 27.63 - Average balance 0.00 0.00 1.75 9.67 21.05 26.95Interest rate during implementation 0.0% 0.0% 0.0% 0.0% 0.0% 0.0%Interest During Implementation 0.00 0.00 0.00 0.00 0.00 0.00 0Commitement charge 0 0 0 0 0 0 0Front end fees 0 0Total Financing Charges During Implementation 0 0 0 0 0 0 0 IDI for Component 1
Value using CPP exchange rates (CNY millions)Total Financing Charges During Implementation 0.0 0.0 0.0 0.0 0.0 0.0 0.0Interest During Implementation 0.0 0.0 0.0 0.0 0.0 0.0 0.0Commitement charge 0.0 0.0 0.0 0.0 0.0 0.0 0.0Front end fees 0.0 0.0 0.0 0.0 0.0 0.0 0.0
Value using constant exchange rates (CNY millions)Total Financing Charges During Implementation 0.0 0.0 0.0 0.0 0.0 0.0 0.0Interest During Implementation 0.0 0.0 0.0 0.0 0.0 0.0 0.0Commitement charge 0.0 0.0 0.0 0.0 0.0 0.0 0.0Front end fees 0.0 0.0 0.0 0.0 0.0 0.0 0.0
Project Implementation Period (Component 1)
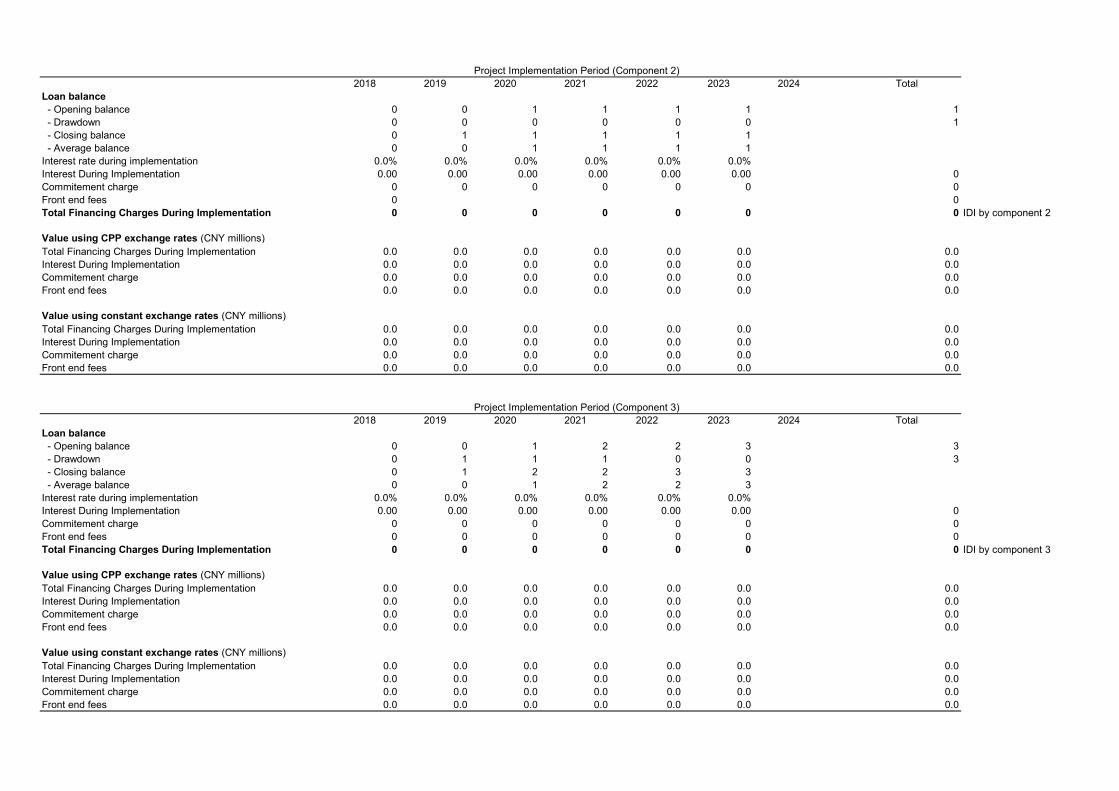
2018 2019 2020 2021 2022 2023 2024 TotalLoan balance - Opening balance 0 0 1 1 1 1 1 - Drawdown 0 0 0 0 0 0 1 - Closing balance 0 1 1 1 1 1 - Average balance 0 0 1 1 1 1Interest rate during implementation 0.0% 0.0% 0.0% 0.0% 0.0% 0.0%Interest During Implementation 0.00 0.00 0.00 0.00 0.00 0.00 0Commitement charge 0 0 0 0 0 0 0Front end fees 0 0Total Financing Charges During Implementation 0 0 0 0 0 0 0 IDI by component 2
Value using CPP exchange rates (CNY millions)Total Financing Charges During Implementation 0.0 0.0 0.0 0.0 0.0 0.0 0.0Interest During Implementation 0.0 0.0 0.0 0.0 0.0 0.0 0.0Commitement charge 0.0 0.0 0.0 0.0 0.0 0.0 0.0Front end fees 0.0 0.0 0.0 0.0 0.0 0.0 0.0
Value using constant exchange rates (CNY millions)Total Financing Charges During Implementation 0.0 0.0 0.0 0.0 0.0 0.0 0.0Interest During Implementation 0.0 0.0 0.0 0.0 0.0 0.0 0.0Commitement charge 0.0 0.0 0.0 0.0 0.0 0.0 0.0Front end fees 0.0 0.0 0.0 0.0 0.0 0.0 0.0
2018 2019 2020 2021 2022 2023 2024 TotalLoan balance - Opening balance 0 0 1 2 2 3 3 - Drawdown 0 1 1 1 0 0 3 - Closing balance 0 1 2 2 3 3 - Average balance 0 0 1 2 2 3Interest rate during implementation 0.0% 0.0% 0.0% 0.0% 0.0% 0.0%Interest During Implementation 0.00 0.00 0.00 0.00 0.00 0.00 0Commitement charge 0 0 0 0 0 0 0Front end fees 0 0 0 0 0 0 0Total Financing Charges During Implementation 0 0 0 0 0 0 0 IDI by component 3
Value using CPP exchange rates (CNY millions)Total Financing Charges During Implementation 0.0 0.0 0.0 0.0 0.0 0.0 0.0Interest During Implementation 0.0 0.0 0.0 0.0 0.0 0.0 0.0Commitement charge 0.0 0.0 0.0 0.0 0.0 0.0 0.0Front end fees 0.0 0.0 0.0 0.0 0.0 0.0 0.0
Value using constant exchange rates (CNY millions)Total Financing Charges During Implementation 0.0 0.0 0.0 0.0 0.0 0.0 0.0Interest During Implementation 0.0 0.0 0.0 0.0 0.0 0.0 0.0Commitement charge 0.0 0.0 0.0 0.0 0.0 0.0 0.0Front end fees 0.0 0.0 0.0 0.0 0.0 0.0 0.0
Project Implementation Period (Component 2)
Project Implementation Period (Component 3)
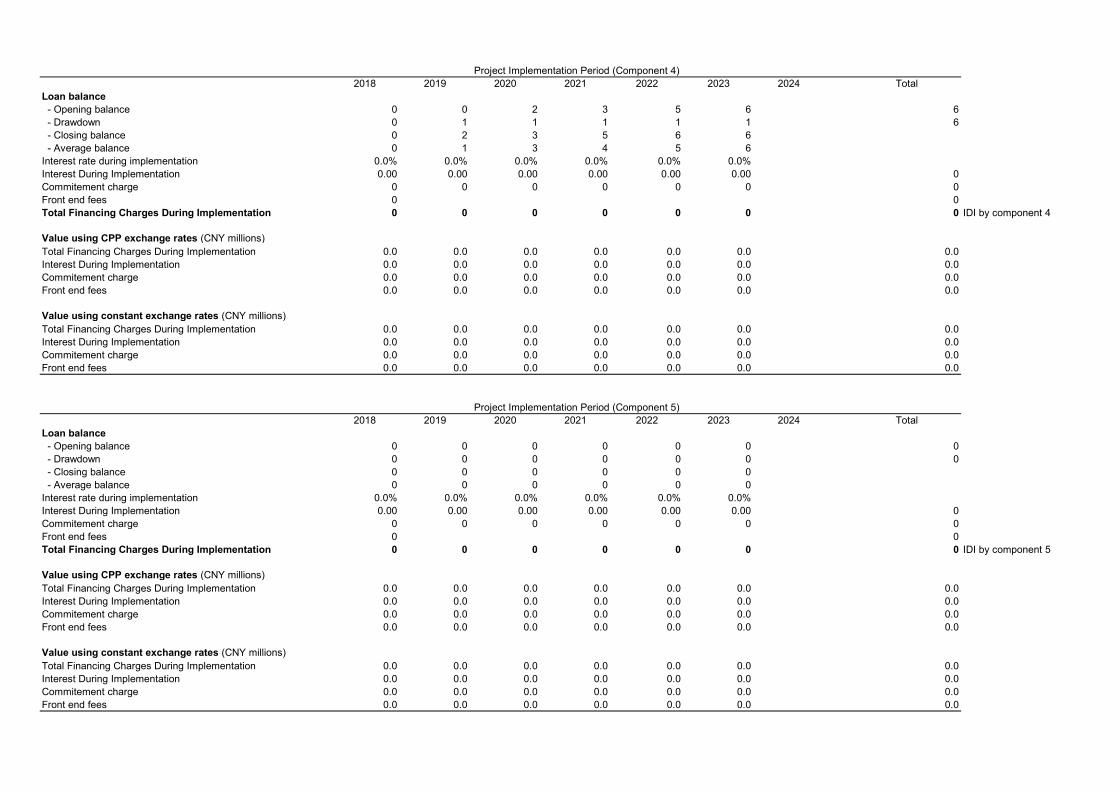
2018 2019 2020 2021 2022 2023 2024 TotalLoan balance - Opening balance 0 0 2 3 5 6 6 - Drawdown 0 1 1 1 1 1 6 - Closing balance 0 2 3 5 6 6 - Average balance 0 1 3 4 5 6Interest rate during implementation 0.0% 0.0% 0.0% 0.0% 0.0% 0.0%Interest During Implementation 0.00 0.00 0.00 0.00 0.00 0.00 0Commitement charge 0 0 0 0 0 0 0Front end fees 0 0Total Financing Charges During Implementation 0 0 0 0 0 0 0 IDI by component 4
Value using CPP exchange rates (CNY millions)Total Financing Charges During Implementation 0.0 0.0 0.0 0.0 0.0 0.0 0.0Interest During Implementation 0.0 0.0 0.0 0.0 0.0 0.0 0.0Commitement charge 0.0 0.0 0.0 0.0 0.0 0.0 0.0Front end fees 0.0 0.0 0.0 0.0 0.0 0.0 0.0
Value using constant exchange rates (CNY millions)Total Financing Charges During Implementation 0.0 0.0 0.0 0.0 0.0 0.0 0.0Interest During Implementation 0.0 0.0 0.0 0.0 0.0 0.0 0.0Commitement charge 0.0 0.0 0.0 0.0 0.0 0.0 0.0Front end fees 0.0 0.0 0.0 0.0 0.0 0.0 0.0
2018 2019 2020 2021 2022 2023 2024 TotalLoan balance - Opening balance 0 0 0 0 0 0 0 - Drawdown 0 0 0 0 0 0 0 - Closing balance 0 0 0 0 0 0 - Average balance 0 0 0 0 0 0Interest rate during implementation 0.0% 0.0% 0.0% 0.0% 0.0% 0.0%Interest During Implementation 0.00 0.00 0.00 0.00 0.00 0.00 0Commitement charge 0 0 0 0 0 0 0Front end fees 0 0Total Financing Charges During Implementation 0 0 0 0 0 0 0 IDI by component 5
Value using CPP exchange rates (CNY millions)Total Financing Charges During Implementation 0.0 0.0 0.0 0.0 0.0 0.0 0.0Interest During Implementation 0.0 0.0 0.0 0.0 0.0 0.0 0.0Commitement charge 0.0 0.0 0.0 0.0 0.0 0.0 0.0Front end fees 0.0 0.0 0.0 0.0 0.0 0.0 0.0
Value using constant exchange rates (CNY millions)Total Financing Charges During Implementation 0.0 0.0 0.0 0.0 0.0 0.0 0.0Interest During Implementation 0.0 0.0 0.0 0.0 0.0 0.0 0.0Commitement charge 0.0 0.0 0.0 0.0 0.0 0.0 0.0Front end fees 0.0 0.0 0.0 0.0 0.0 0.0 0.0
Project Implementation Period (Component 4)
Project Implementation Period (Component 5)
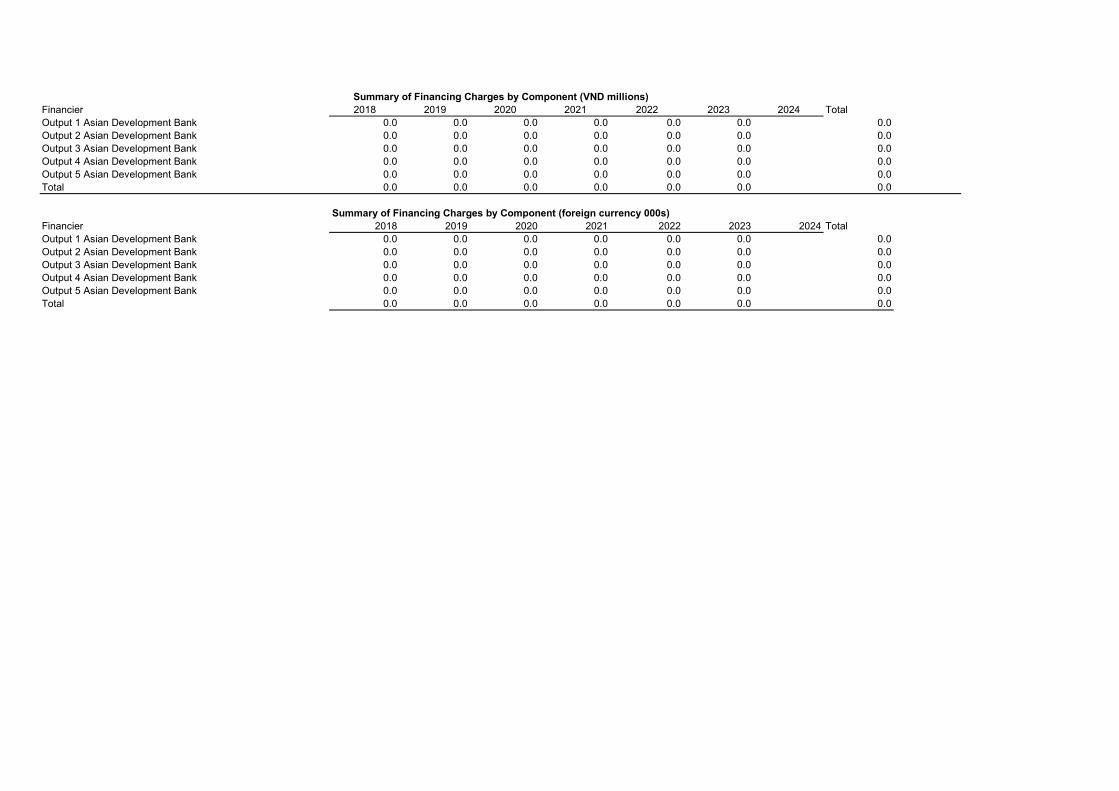
Financier 2018 2019 2020 2021 2022 2023 2024 TotalOutput 1 Asian Development Bank 0.0 0.0 0.0 0.0 0.0 0.0 0.0Output 2 Asian Development Bank 0.0 0.0 0.0 0.0 0.0 0.0 0.0Output 3 Asian Development Bank 0.0 0.0 0.0 0.0 0.0 0.0 0.0Output 4 Asian Development Bank 0.0 0.0 0.0 0.0 0.0 0.0 0.0Output 5 Asian Development Bank 0.0 0.0 0.0 0.0 0.0 0.0 0.0Total 0.0 0.0 0.0 0.0 0.0 0.0 0.0
Financier 2018 2019 2020 2021 2022 2023 2024 TotalOutput 1 Asian Development Bank 0.0 0.0 0.0 0.0 0.0 0.0 0.0Output 2 Asian Development Bank 0.0 0.0 0.0 0.0 0.0 0.0 0.0Output 3 Asian Development Bank 0.0 0.0 0.0 0.0 0.0 0.0 0.0Output 4 Asian Development Bank 0.0 0.0 0.0 0.0 0.0 0.0 0.0Output 5 Asian Development Bank 0.0 0.0 0.0 0.0 0.0 0.0 0.0Total 0.0 0.0 0.0 0.0 0.0 0.0 0.0
Summary of Financing Charges by Component (foreign currency 000s)
Summary of Financing Charges by Component (VND millions)
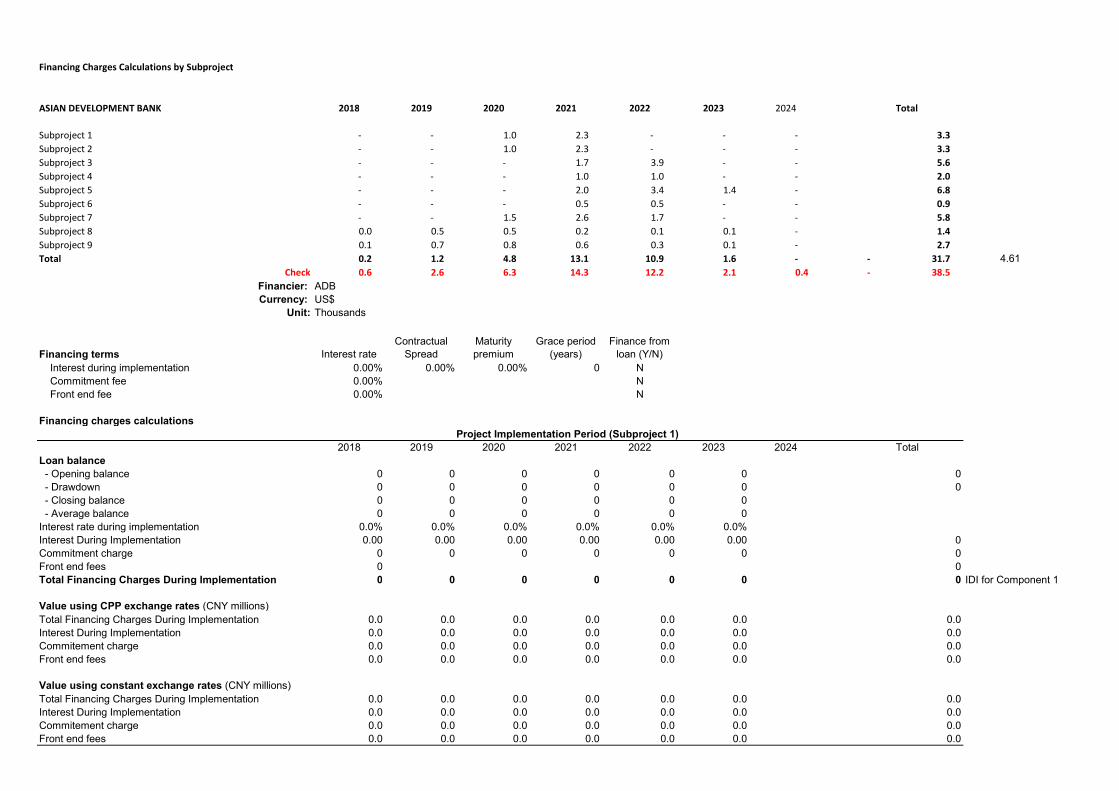
Financing Charges Calculations by Subproject
ASIAN DEVELOPMENT BANK 2018 2019 2020 2021 2022 2023 2024 Total
Subproject 1 - - 1.0 2.3 - - - 3.3 Subproject 2 - - 1.0 2.3 - - - 3.3 Subproject 3 - - - 1.7 3.9 - - 5.6 Subproject 4 - - - 1.0 1.0 - - 2.0 Subproject 5 - - - 2.0 3.4 1.4 - 6.8 Subproject 6 - - - 0.5 0.5 - - 0.9 Subproject 7 - - 1.5 2.6 1.7 - - 5.8 Subproject 8 0.0 0.5 0.5 0.2 0.1 0.1 - 1.4 Subproject 9 0.1 0.7 0.8 0.6 0.3 0.1 - 2.7 Total 0.2 1.2 4.8 13.1 10.9 1.6 - - 31.7 4.61
Check 0.6 2.6 6.3 14.3 12.2 2.1 0.4 - 38.5 Financier: ADBCurrency: US$
Unit: Thousands
Financing terms Interest rateContractual
SpreadMaturity premium
Grace period (years)
Finance from loan (Y/N)
Interest during implementation 0.00% 0.00% 0.00% 0 NCommitment fee 0.00% NFront end fee 0.00% N
Financing charges calculations
2018 2019 2020 2021 2022 2023 2024 TotalLoan balance - Opening balance 0 0 0 0 0 0 0 - Drawdown 0 0 0 0 0 0 0 - Closing balance 0 0 0 0 0 0 - Average balance 0 0 0 0 0 0Interest rate during implementation 0.0% 0.0% 0.0% 0.0% 0.0% 0.0%Interest During Implementation 0.00 0.00 0.00 0.00 0.00 0.00 0Commitment charge 0 0 0 0 0 0 0Front end fees 0 0Total Financing Charges During Implementation 0 0 0 0 0 0 0 IDI for Component 1
Value using CPP exchange rates (CNY millions)Total Financing Charges During Implementation 0.0 0.0 0.0 0.0 0.0 0.0 0.0Interest During Implementation 0.0 0.0 0.0 0.0 0.0 0.0 0.0Commitement charge 0.0 0.0 0.0 0.0 0.0 0.0 0.0Front end fees 0.0 0.0 0.0 0.0 0.0 0.0 0.0
Value using constant exchange rates (CNY millions)Total Financing Charges During Implementation 0.0 0.0 0.0 0.0 0.0 0.0 0.0Interest During Implementation 0.0 0.0 0.0 0.0 0.0 0.0 0.0Commitement charge 0.0 0.0 0.0 0.0 0.0 0.0 0.0Front end fees 0.0 0.0 0.0 0.0 0.0 0.0 0.0
Project Implementation Period (Subproject 1)
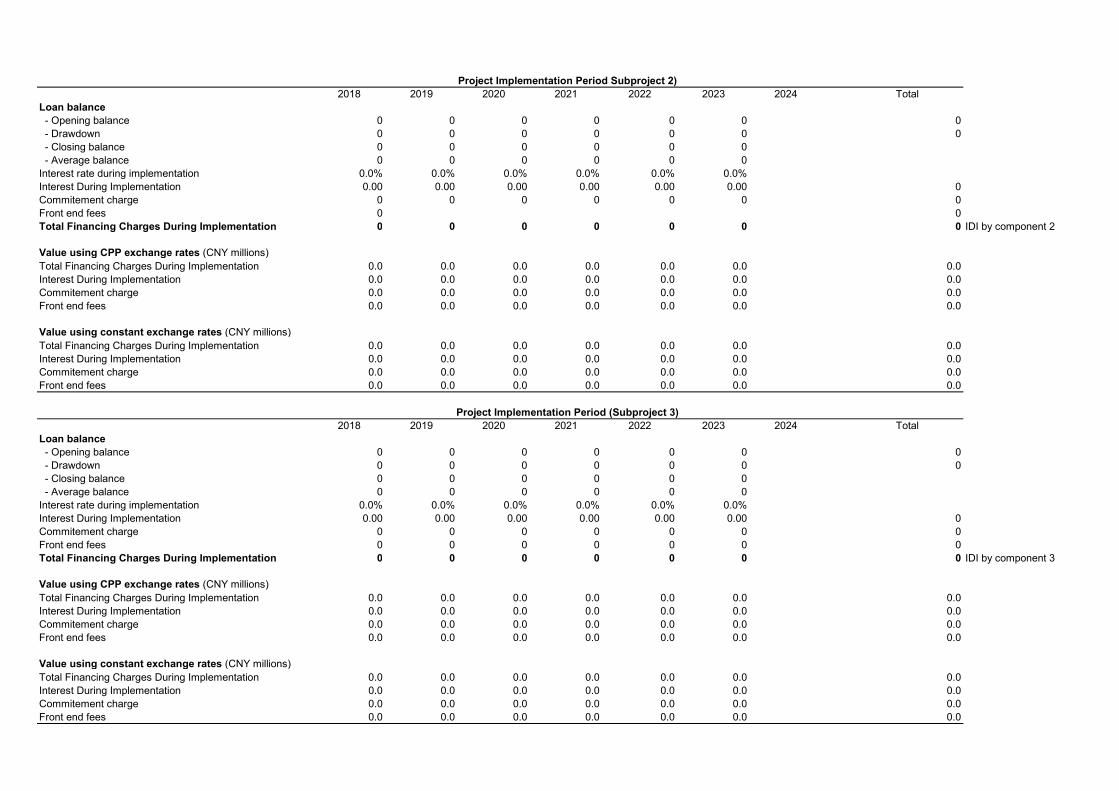
2018 2019 2020 2021 2022 2023 2024 TotalLoan balance - Opening balance 0 0 0 0 0 0 0 - Drawdown 0 0 0 0 0 0 0 - Closing balance 0 0 0 0 0 0 - Average balance 0 0 0 0 0 0Interest rate during implementation 0.0% 0.0% 0.0% 0.0% 0.0% 0.0%Interest During Implementation 0.00 0.00 0.00 0.00 0.00 0.00 0Commitement charge 0 0 0 0 0 0 0Front end fees 0 0Total Financing Charges During Implementation 0 0 0 0 0 0 0 IDI by component 2
Value using CPP exchange rates (CNY millions)Total Financing Charges During Implementation 0.0 0.0 0.0 0.0 0.0 0.0 0.0Interest During Implementation 0.0 0.0 0.0 0.0 0.0 0.0 0.0Commitement charge 0.0 0.0 0.0 0.0 0.0 0.0 0.0Front end fees 0.0 0.0 0.0 0.0 0.0 0.0 0.0
Value using constant exchange rates (CNY millions)Total Financing Charges During Implementation 0.0 0.0 0.0 0.0 0.0 0.0 0.0Interest During Implementation 0.0 0.0 0.0 0.0 0.0 0.0 0.0Commitement charge 0.0 0.0 0.0 0.0 0.0 0.0 0.0Front end fees 0.0 0.0 0.0 0.0 0.0 0.0 0.0
2018 2019 2020 2021 2022 2023 2024 TotalLoan balance - Opening balance 0 0 0 0 0 0 0 - Drawdown 0 0 0 0 0 0 0 - Closing balance 0 0 0 0 0 0 - Average balance 0 0 0 0 0 0Interest rate during implementation 0.0% 0.0% 0.0% 0.0% 0.0% 0.0%Interest During Implementation 0.00 0.00 0.00 0.00 0.00 0.00 0Commitement charge 0 0 0 0 0 0 0Front end fees 0 0 0 0 0 0 0Total Financing Charges During Implementation 0 0 0 0 0 0 0 IDI by component 3
Value using CPP exchange rates (CNY millions)Total Financing Charges During Implementation 0.0 0.0 0.0 0.0 0.0 0.0 0.0Interest During Implementation 0.0 0.0 0.0 0.0 0.0 0.0 0.0Commitement charge 0.0 0.0 0.0 0.0 0.0 0.0 0.0Front end fees 0.0 0.0 0.0 0.0 0.0 0.0 0.0
Value using constant exchange rates (CNY millions)Total Financing Charges During Implementation 0.0 0.0 0.0 0.0 0.0 0.0 0.0Interest During Implementation 0.0 0.0 0.0 0.0 0.0 0.0 0.0Commitement charge 0.0 0.0 0.0 0.0 0.0 0.0 0.0Front end fees 0.0 0.0 0.0 0.0 0.0 0.0 0.0
Project Implementation Period Subproject 2)
Project Implementation Period (Subproject 3)
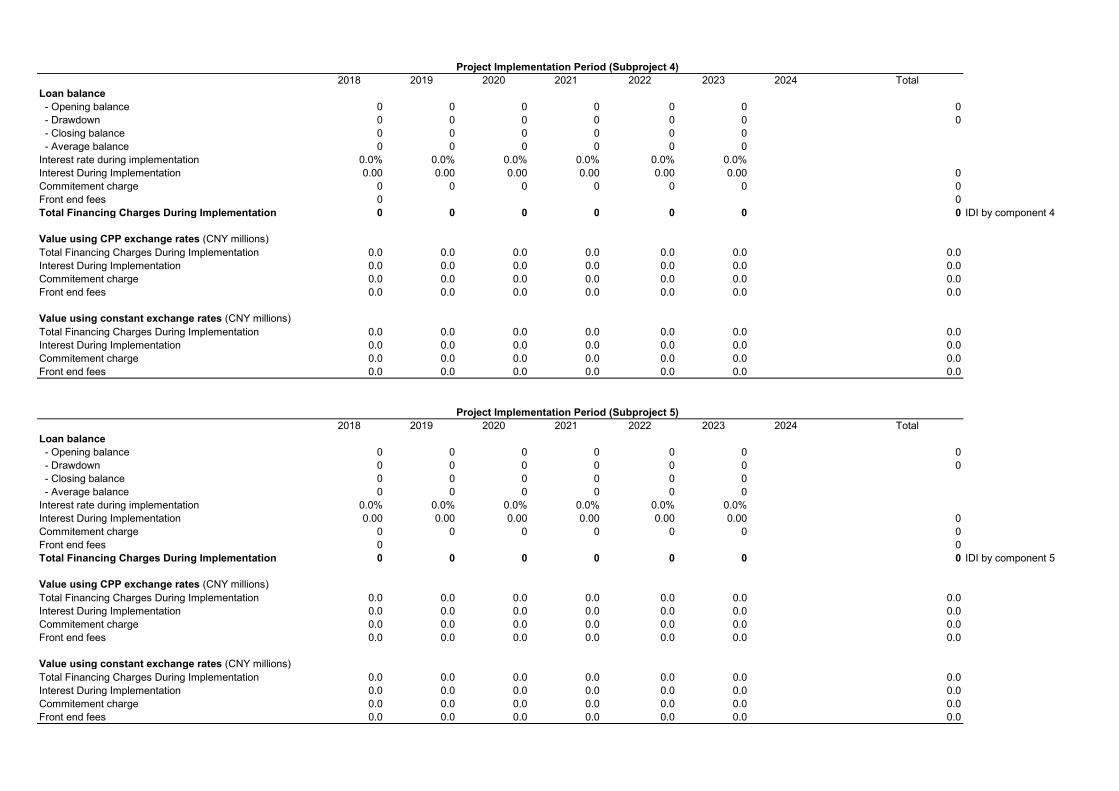
2018 2019 2020 2021 2022 2023 2024 TotalLoan balance - Opening balance 0 0 0 0 0 0 0 - Drawdown 0 0 0 0 0 0 0 - Closing balance 0 0 0 0 0 0 - Average balance 0 0 0 0 0 0Interest rate during implementation 0.0% 0.0% 0.0% 0.0% 0.0% 0.0%Interest During Implementation 0.00 0.00 0.00 0.00 0.00 0.00 0Commitement charge 0 0 0 0 0 0 0Front end fees 0 0Total Financing Charges During Implementation 0 0 0 0 0 0 0 IDI by component 4
Value using CPP exchange rates (CNY millions)Total Financing Charges During Implementation 0.0 0.0 0.0 0.0 0.0 0.0 0.0Interest During Implementation 0.0 0.0 0.0 0.0 0.0 0.0 0.0Commitement charge 0.0 0.0 0.0 0.0 0.0 0.0 0.0Front end fees 0.0 0.0 0.0 0.0 0.0 0.0 0.0
Value using constant exchange rates (CNY millions)Total Financing Charges During Implementation 0.0 0.0 0.0 0.0 0.0 0.0 0.0Interest During Implementation 0.0 0.0 0.0 0.0 0.0 0.0 0.0Commitement charge 0.0 0.0 0.0 0.0 0.0 0.0 0.0Front end fees 0.0 0.0 0.0 0.0 0.0 0.0 0.0
2018 2019 2020 2021 2022 2023 2024 TotalLoan balance - Opening balance 0 0 0 0 0 0 0 - Drawdown 0 0 0 0 0 0 0 - Closing balance 0 0 0 0 0 0 - Average balance 0 0 0 0 0 0Interest rate during implementation 0.0% 0.0% 0.0% 0.0% 0.0% 0.0%Interest During Implementation 0.00 0.00 0.00 0.00 0.00 0.00 0Commitement charge 0 0 0 0 0 0 0Front end fees 0 0Total Financing Charges During Implementation 0 0 0 0 0 0 0 IDI by component 5
Value using CPP exchange rates (CNY millions)Total Financing Charges During Implementation 0.0 0.0 0.0 0.0 0.0 0.0 0.0Interest During Implementation 0.0 0.0 0.0 0.0 0.0 0.0 0.0Commitement charge 0.0 0.0 0.0 0.0 0.0 0.0 0.0Front end fees 0.0 0.0 0.0 0.0 0.0 0.0 0.0
Value using constant exchange rates (CNY millions)Total Financing Charges During Implementation 0.0 0.0 0.0 0.0 0.0 0.0 0.0Interest During Implementation 0.0 0.0 0.0 0.0 0.0 0.0 0.0Commitement charge 0.0 0.0 0.0 0.0 0.0 0.0 0.0Front end fees 0.0 0.0 0.0 0.0 0.0 0.0 0.0
Project Implementation Period (Subproject 4)
Project Implementation Period (Subproject 5)
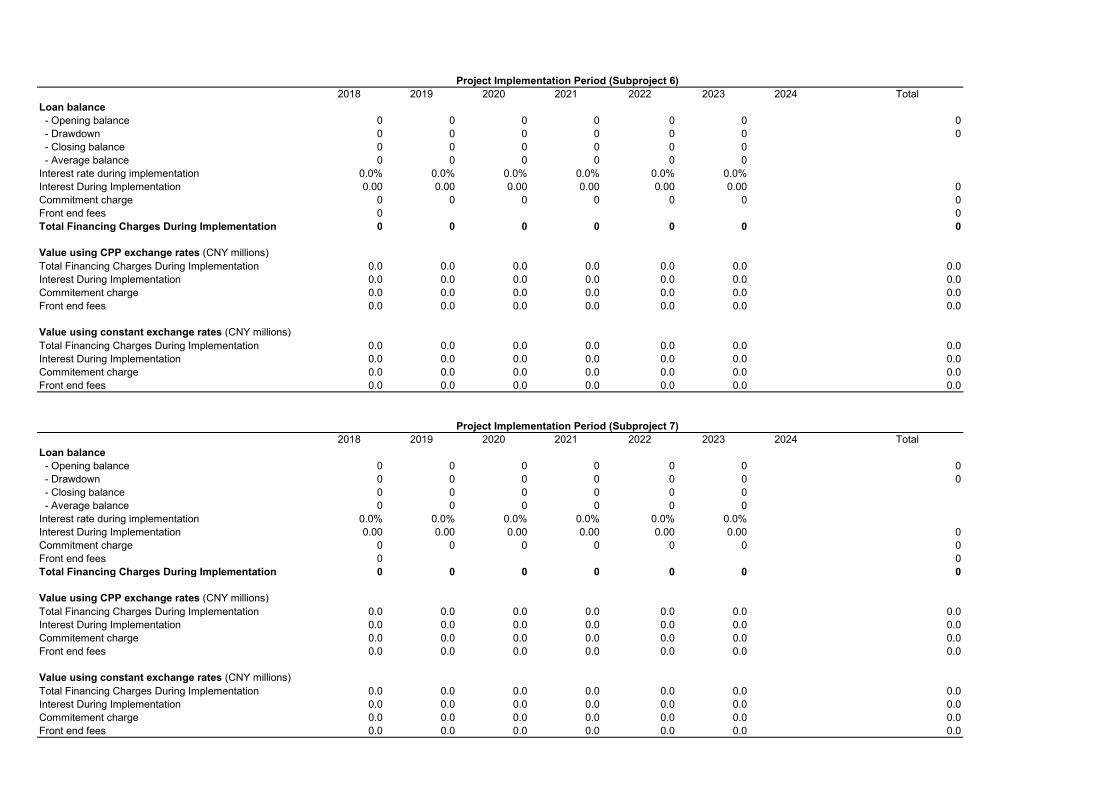
2018 2019 2020 2021 2022 2023 2024 TotalLoan balance - Opening balance 0 0 0 0 0 0 0 - Drawdown 0 0 0 0 0 0 0 - Closing balance 0 0 0 0 0 0 - Average balance 0 0 0 0 0 0Interest rate during implementation 0.0% 0.0% 0.0% 0.0% 0.0% 0.0%Interest During Implementation 0.00 0.00 0.00 0.00 0.00 0.00 0Commitment charge 0 0 0 0 0 0 0Front end fees 0 0Total Financing Charges During Implementation 0 0 0 0 0 0 0
Value using CPP exchange rates (CNY millions)Total Financing Charges During Implementation 0.0 0.0 0.0 0.0 0.0 0.0 0.0Interest During Implementation 0.0 0.0 0.0 0.0 0.0 0.0 0.0Commitement charge 0.0 0.0 0.0 0.0 0.0 0.0 0.0Front end fees 0.0 0.0 0.0 0.0 0.0 0.0 0.0
Value using constant exchange rates (CNY millions)Total Financing Charges During Implementation 0.0 0.0 0.0 0.0 0.0 0.0 0.0Interest During Implementation 0.0 0.0 0.0 0.0 0.0 0.0 0.0Commitement charge 0.0 0.0 0.0 0.0 0.0 0.0 0.0Front end fees 0.0 0.0 0.0 0.0 0.0 0.0 0.0
Project Implementation Period (Subproject 7)
Project Implementation Period (Subproject 6)
2018 2019 2020 2021 2022 2023 2024 TotalLoan balance - Opening balance 0 0 0 0 0 0 0 - Drawdown 0 0 0 0 0 0 0 - Closing balance 0 0 0 0 0 0 - Average balance 0 0 0 0 0 0Interest rate during implementation 0.0% 0.0% 0.0% 0.0% 0.0% 0.0%Interest During Implementation 0.00 0.00 0.00 0.00 0.00 0.00 0Commitment charge 0 0 0 0 0 0 0Front end fees 0 0Total Financing Charges During Implementation 0 0 0 0 0 0 0
Value using CPP exchange rates (CNY millions)Total Financing Charges During Implementation 0.0 0.0 0.0 0.0 0.0 0.0 0.0Interest During Implementation 0.0 0.0 0.0 0.0 0.0 0.0 0.0Commitement charge 0.0 0.0 0.0 0.0 0.0 0.0 0.0Front end fees 0.0 0.0 0.0 0.0 0.0 0.0 0.0
Value using constant exchange rates (CNY millions)Total Financing Charges During Implementation 0.0 0.0 0.0 0.0 0.0 0.0 0.0Interest During Implementation 0.0 0.0 0.0 0.0 0.0 0.0 0.0Commitement charge 0.0 0.0 0.0 0.0 0.0 0.0 0.0Front end fees 0.0 0.0 0.0 0.0 0.0 0.0 0.0
Project Implementation Period (Subproject 8)
Project Implementation Period (Subproject 9)
Financier - Asian Development Bank 2018 2019 2020 2021 2022 2023 2024 TotalSubproject 1 0.0 0.0 0.0 0.0 0.0 0.0 0.0Subproject 2 0.0 0.0 0.0 0.0 0.0 0.0 0.0Subproject 3 0.0 0.0 0.0 0.0 0.0 0.0 0.0Subproject 4 0.0 0.0 0.0 0.0 0.0 0.0 0.0Subproject 5 0.0 0.0 0.0 0.0 0.0 0.0 0.0Subproject 6 0.0 0.0 0.0 0.0 0.0 0.0 0.0Subproject 7 0.0 0.0 0.0 0.0 0.0 0.0 0.0Subproject 8 0.0 0.0 0.0 0.0 0.0 0.0 0.0Subproject 9 0.0 0.0 0.0 0.0 0.0 0.0 0.0Total 0.0 0.0 0.0 0.0 0.0 0.0 0.0 0.0
check 0.0 0.0 0.0 0.0 0.0 0.0 0.0 0.0
Summary of Financing Charges by Subproject (CNY millions)
Summary of Financing Charges by Component (foreign currency 000s)
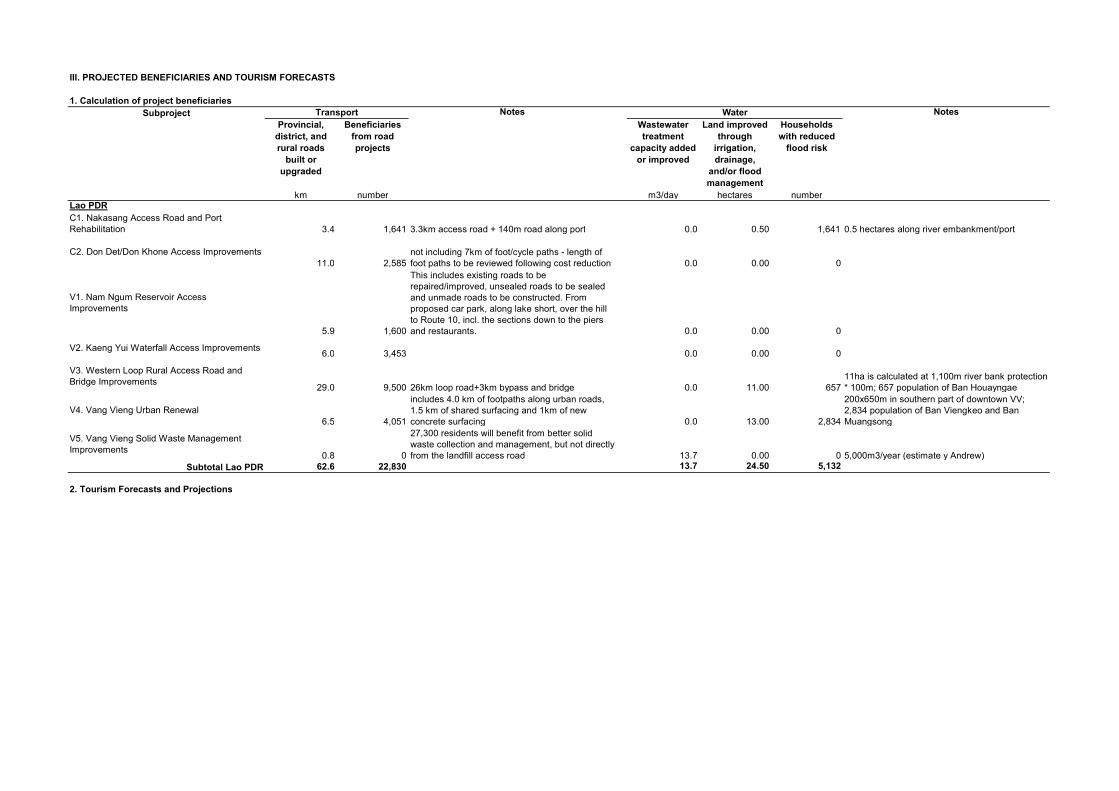
III. PROJECTED BENEFICIARIES AND TOURISM FORECASTS
1. Calculation of project beneficiaries Subproject Notes Notes
Provincial, district, and rural roads
built or upgraded
Beneficiaries from road projects
Wastewater treatment
capacity added or improved
Land improved through
irrigation, drainage,
and/or flood management
Households with reduced
flood risk
km number m3/day hectares numberLao PDRC1. Nakasang Access Road and Port Rehabilitation 3.4 1,641 3.3km access road + 140m road along port 0.0 0.50 1,641 0.5 hectares along river embankment/port
C2. Don Det/Don Khone Access Improvements11.0 2,585
not including 7km of foot/cycle paths - length of foot paths to be reviewed following cost reduction 0.0 0.00 0
V1. Nam Ngum Reservoir Access Improvements
5.9 1,600
This includes existing roads to be repaired/improved, unsealed roads to be sealed and unmade roads to be constructed. From proposed car park, along lake short, over the hill to Route 10, incl. the sections down to the piers and restaurants. 0.0 0.00 0
V2. Kaeng Yui Waterfall Access Improvements 6.0 3,453 0.0 0.00 0
V3. Western Loop Rural Access Road and Bridge Improvements 29.0 9,500 26km loop road+3km bypass and bridge 0.0 11.00 657
11ha is calculated at 1,100m river bank protection * 100m; 657 population of Ban Houayngae
V4. Vang Vieng Urban Renewal6.5 4,051
includes 4.0 km of footpaths along urban roads, 1.5 km of shared surfacing and 1km of new concrete surfacing 0.0 13.00 2,834
200x650m in southern part of downtown VV; 2,834 population of Ban Viengkeo and Ban Muangsong
V5. Vang Vieng Solid Waste Management Improvements 0.8 0
27,300 residents will benefit from better solid waste collection and management, but not directly from the landfill access road 13.7 0.00 0 5,000m3/year (estimate y Andrew)
Subtotal Lao PDR 62.6 22,830 13.7 24.50 5,132
2. Tourism Forecasts and Projections
Transport Water
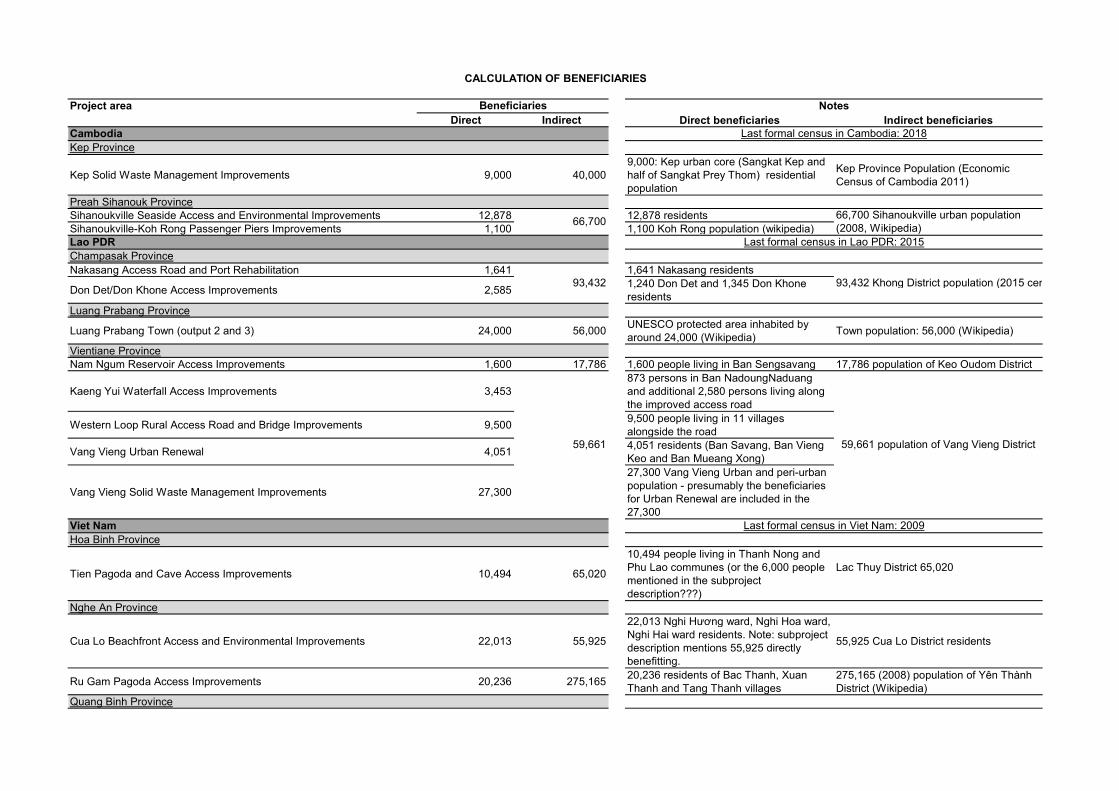
Project areaDirect Indirect Direct beneficiaries Indirect beneficiaries
CambodiaKep Province
Kep Solid Waste Management Improvements 9,000 40,0009,000: Kep urban core (Sangkat Kep and half of Sangkat Prey Thom) residential population
Kep Province Population (Economic Census of Cambodia 2011)
Preah Sihanouk ProvinceSihanoukville Seaside Access and Environmental Improvements 12,878 12,878 residentsSihanoukville-Koh Rong Passenger Piers Improvements 1,100 1,100 Koh Rong population (wikipedia)Lao PDRChampasak ProvinceNakasang Access Road and Port Rehabilitation 1,641 1,641 Nakasang residents
Don Det/Don Khone Access Improvements 2,585 1,240 Don Det and 1,345 Don Khone residents
Luang Prabang Province
Luang Prabang Town (output 2 and 3) 24,000 56,000 UNESCO protected area inhabited by around 24,000 (Wikipedia) Town population: 56,000 (Wikipedia)
Vientiane ProvinceNam Ngum Reservoir Access Improvements 1,600 17,786 1,600 people living in Ban Sengsavang 17,786 population of Keo Oudom District
Kaeng Yui Waterfall Access Improvements 3,453873 persons in Ban NadoungNaduang and additional 2,580 persons living along the improved access road
Western Loop Rural Access Road and Bridge Improvements 9,500 9,500 people living in 11 villages alongside the road
Vang Vieng Urban Renewal 4,051 4,051 residents (Ban Savang, Ban Vieng Keo and Ban Mueang Xong)
Vang Vieng Solid Waste Management Improvements 27,300
27,300 Vang Vieng Urban and peri-urban population - presumably the beneficiaries for Urban Renewal are included in the 27,300
Viet NamHoa Binh Province
Tien Pagoda and Cave Access Improvements 10,494 65,020
10,494 people living in Thanh Nong and Phu Lao communes (or the 6,000 people mentioned in the subproject description???)
Lac Thuy District 65,020
Nghe An Province
Cua Lo Beachfront Access and Environmental Improvements 22,013 55,925
22,013 Nghi Hương ward, Nghi Hoa ward, Nghi Hai ward residents. Note: subproject description mentions 55,925 directly benefitting.
55,925 Cua Lo District residents
Ru Gam Pagoda Access Improvements 20,236 275,165 20,236 residents of Bac Thanh, Xuan Thanh and Tang Thanh villages
275,165 (2008) population of Yên Thành District (Wikipedia)
Quang Binh Province
CALCULATION OF BENEFICIARIES
Last formal census in Viet Nam: 2009
66,700 Sihanoukville urban population (2008, Wikipedia)
Beneficiaries Notes
59,661 59,661 population of Vang Vieng District
93,432 93,432 Khong District population (2015 census)
66,700
Last formal census in Lao PDR: 2015
Last formal census in Cambodia: 2018
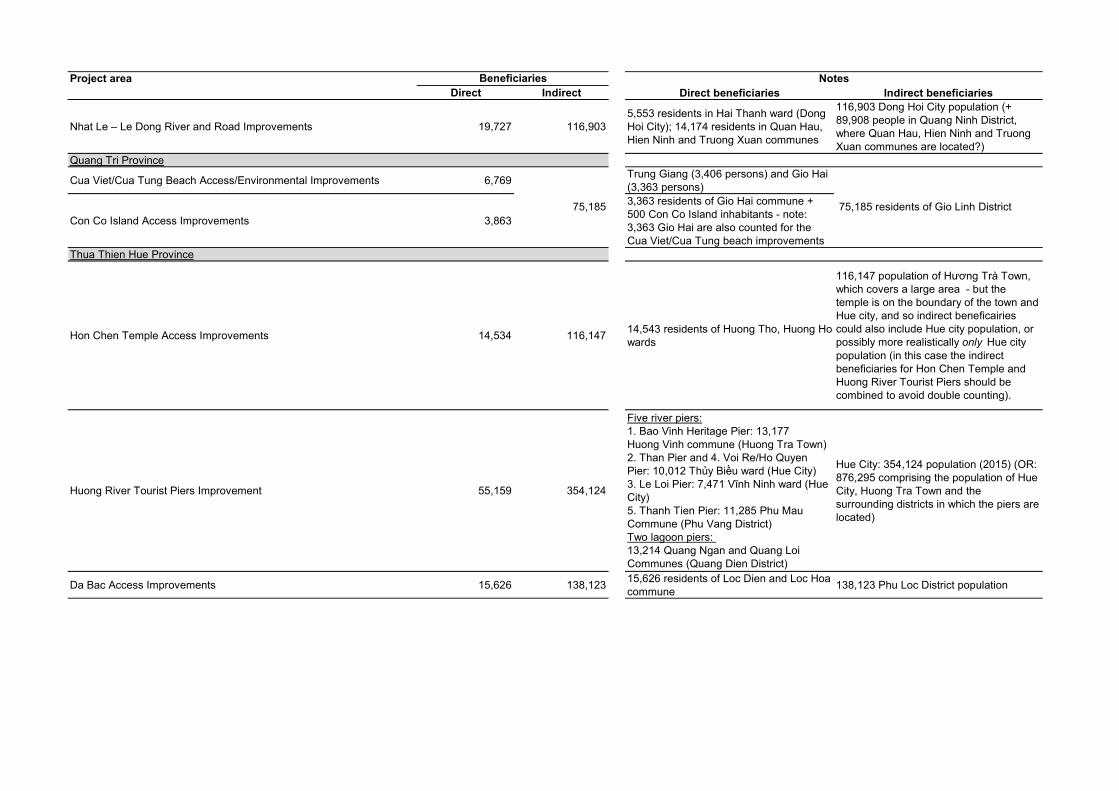
Project areaDirect Indirect Direct beneficiaries Indirect beneficiaries
Beneficiaries Notes
Nhat Le – Le Dong River and Road Improvements 19,727 116,9035,553 residents in Hai Thanh ward (Dong Hoi City); 14,174 residents in Quan Hau, Hien Ninh and Truong Xuan communes
116,903 Dong Hoi City population (+ 89,908 people in Quang Ninh District, where Quan Hau, Hien Ninh and Truong Xuan communes are located?)
Quang Tri Province
Cua Viet/Cua Tung Beach Access/Environmental Improvements 6,769 Trung Giang (3,406 persons) and Gio Hai (3,363 persons)
Con Co Island Access Improvements 3,863
3,363 residents of Gio Hai commune + 500 Con Co Island inhabitants - note: 3,363 Gio Hai are also counted for the Cua Viet/Cua Tung beach improvements
Thua Thien Hue Province
Hon Chen Temple Access Improvements 14,534 116,147 14,543 residents of Huong Tho, Huong Ho wards
116,147 population of Hương Trà Town, which covers a large area - but the temple is on the boundary of the town and Hue city, and so indirect beneficairies could also include Hue city population, or possibly more realistically only Hue city population (in this case the indirect beneficiaries for Hon Chen Temple and Huong River Tourist Piers should be combined to avoid double counting).
Huong River Tourist Piers Improvement 55,159 354,124
Five river piers:1. Bao Vinh Heritage Pier: 13,177 Huong Vinh commune (Huong Tra Town)2. Than Pier and 4. Voi Re/Ho Quyen Pier: 10,012 Thủy Biều ward (Hue City)3. Le Loi Pier: 7,471 Vĩnh Ninh ward (Hue City) 5. Thanh Tien Pier: 11,285 Phu Mau Commune (Phu Vang District)Two lagoon piers: 13,214 Quang Ngan and Quang Loi Communes (Quang Dien District)
Hue City: 354,124 population (2015) (OR: 876,295 comprising the population of Hue City, Huong Tra Town and the surrounding districts in which the piers are located)
Da Bac Access Improvements 15,626 138,123 15,626 residents of Loc Dien and Loc Hoa commune 138,123 Phu Loc District population
75,185 residents of Gio Linh District75,185
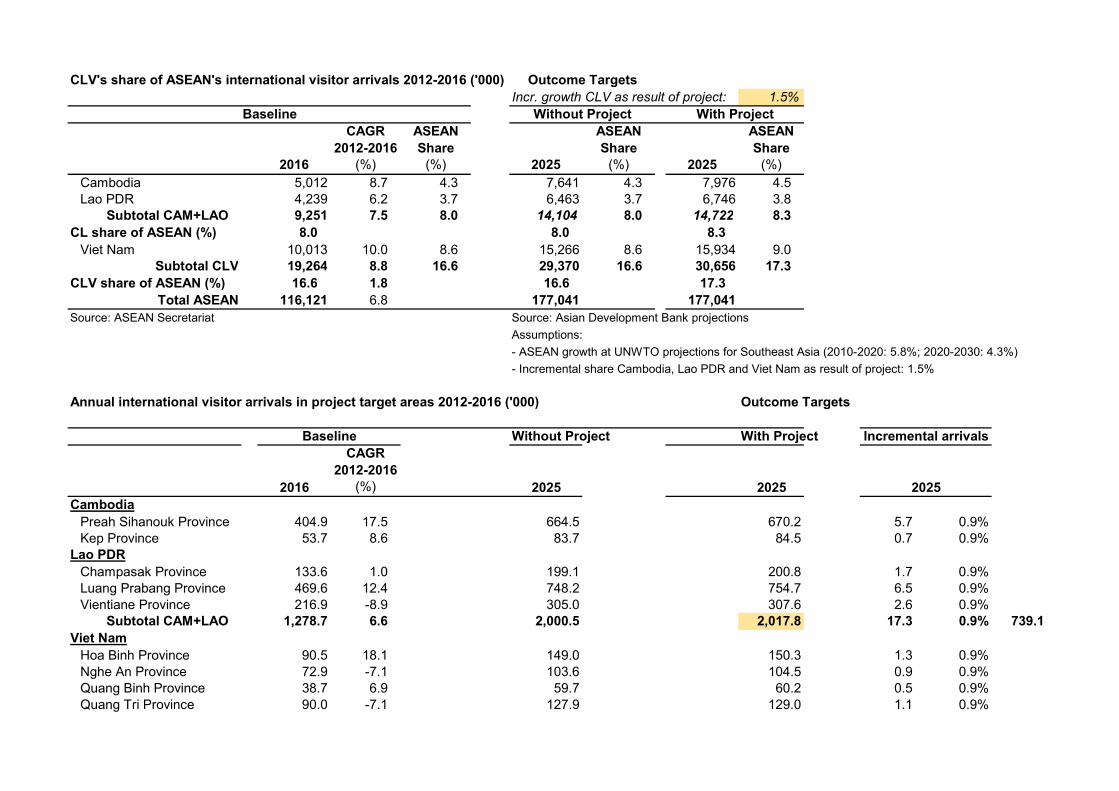
CLV's share of ASEAN's international visitor arrivals 2012-2016 ('000)Incr. growth CLV as result of project: 1.5%
2016
CAGR 2012-2016
(%)
ASEAN Share
(%) 2025
ASEAN Share
(%) 2025
ASEAN Share
(%)Cambodia 5,012 8.7 4.3 7,641 4.3 7,976 4.5Lao PDR 4,239 6.2 3.7 6,463 3.7 6,746 3.8
Subtotal CAM+LAO 9,251 7.5 8.0 14,104 8.0 14,722 8.3CL share of ASEAN (%) 8.0 8.0 8.3
Viet Nam 10,013 10.0 8.6 15,266 8.6 15,934 9.0Subtotal CLV 19,264 8.8 16.6 29,370 16.6 30,656 17.3
CLV share of ASEAN (%) 16.6 1.8 16.6 17.3Total ASEAN 116,121 6.8 177,041 177,041
Source: ASEAN Secretariat Source: Asian Development Bank projectionsAssumptions:- ASEAN growth at UNWTO projections for Southeast Asia (2010-2020: 5.8%; 2020-2030: 4.3%)- Incremental share Cambodia, Lao PDR and Viet Nam as result of project: 1.5%
Annual international visitor arrivals in project target areas 2012-2016 ('000) Outcome Targets
Without Project With Project
2016
CAGR 2012-2016
(%) 2025 2025Cambodia
Preah Sihanouk Province 404.9 17.5 664.5 670.2 5.7 0.9%Kep Province 53.7 8.6 83.7 84.5 0.7 0.9%
Lao PDRChampasak Province 133.6 1.0 199.1 200.8 1.7 0.9%Luang Prabang Province 469.6 12.4 748.2 754.7 6.5 0.9%Vientiane Province 216.9 -8.9 305.0 307.6 2.6 0.9%
Subtotal CAM+LAO 1,278.7 6.6 2,000.5 2,017.8 17.3 0.9% 739.1Viet Nam
Hoa Binh Province 90.5 18.1 149.0 150.3 1.3 0.9%Nghe An Province 72.9 -7.1 103.6 104.5 0.9 0.9%Quang Binh Province 38.7 6.9 59.7 60.2 0.5 0.9%Quang Tri Province 90.0 -7.1 127.9 129.0 1.1 0.9%
Baseline
2025
Baseline
Outcome Targets
With ProjectWithout Project
Incremental arrivals
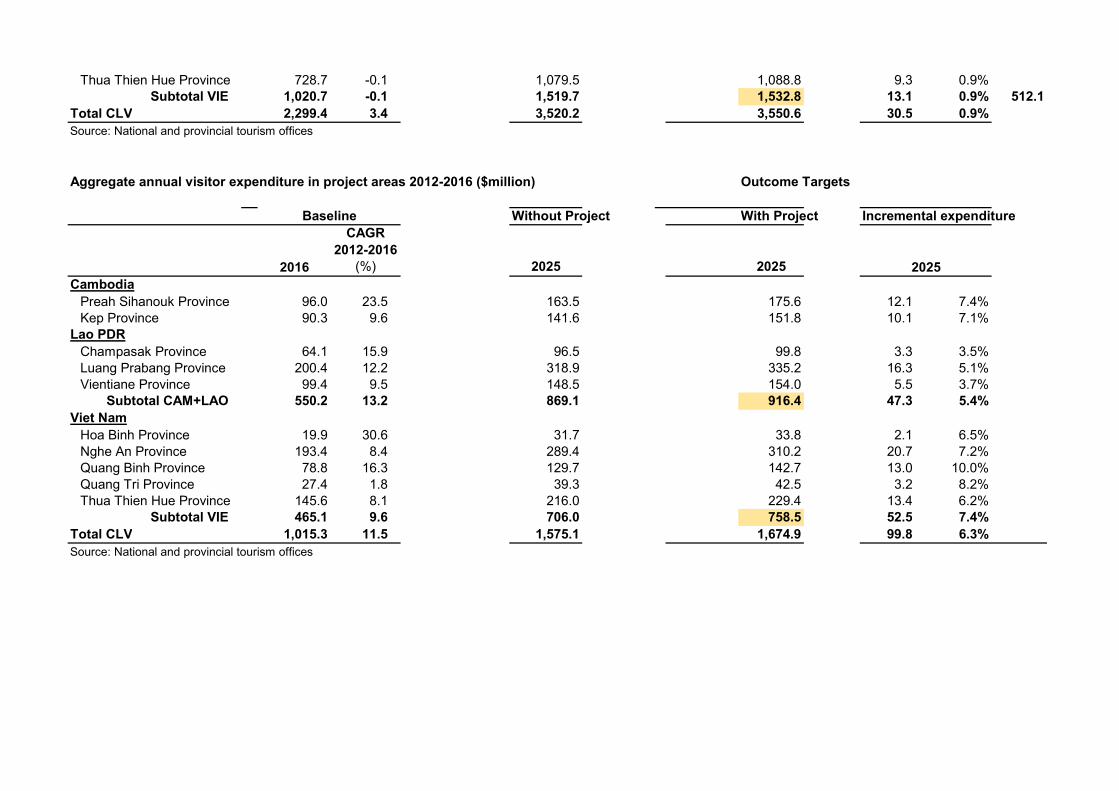
Thua Thien Hue Province 728.7 -0.1 1,079.5 1,088.8 9.3 0.9%Subtotal VIE 1,020.7 -0.1 1,519.7 1,532.8 13.1 0.9% 512.1
Total CLV 2,299.4 3.4 3,520.2 3,550.6 30.5 0.9%Source: National and provincial tourism offices
Aggregate annual visitor expenditure in project areas 2012-2016 ($million) Outcome Targets
Without Project With Project Incremental expenditure
2016
CAGR 2012-2016
(%) 2025 2025Cambodia
Preah Sihanouk Province 96.0 23.5 163.5 175.6 12.1 7.4%Kep Province 90.3 9.6 141.6 151.8 10.1 7.1%
Lao PDRChampasak Province 64.1 15.9 96.5 99.8 3.3 3.5%Luang Prabang Province 200.4 12.2 318.9 335.2 16.3 5.1%Vientiane Province 99.4 9.5 148.5 154.0 5.5 3.7%
Subtotal CAM+LAO 550.2 13.2 869.1 916.4 47.3 5.4%Viet Nam
Hoa Binh Province 19.9 30.6 31.7 33.8 2.1 6.5%Nghe An Province 193.4 8.4 289.4 310.2 20.7 7.2%Quang Binh Province 78.8 16.3 129.7 142.7 13.0 10.0%Quang Tri Province 27.4 1.8 39.3 42.5 3.2 8.2%Thua Thien Hue Province 145.6 8.1 216.0 229.4 13.4 6.2%
Subtotal VIE 465.1 9.6 706.0 758.5 52.5 7.4%Total CLV 1,015.3 11.5 1,575.1 1,674.9 99.8 6.3%Source: National and provincial tourism offices
2025
Baseline
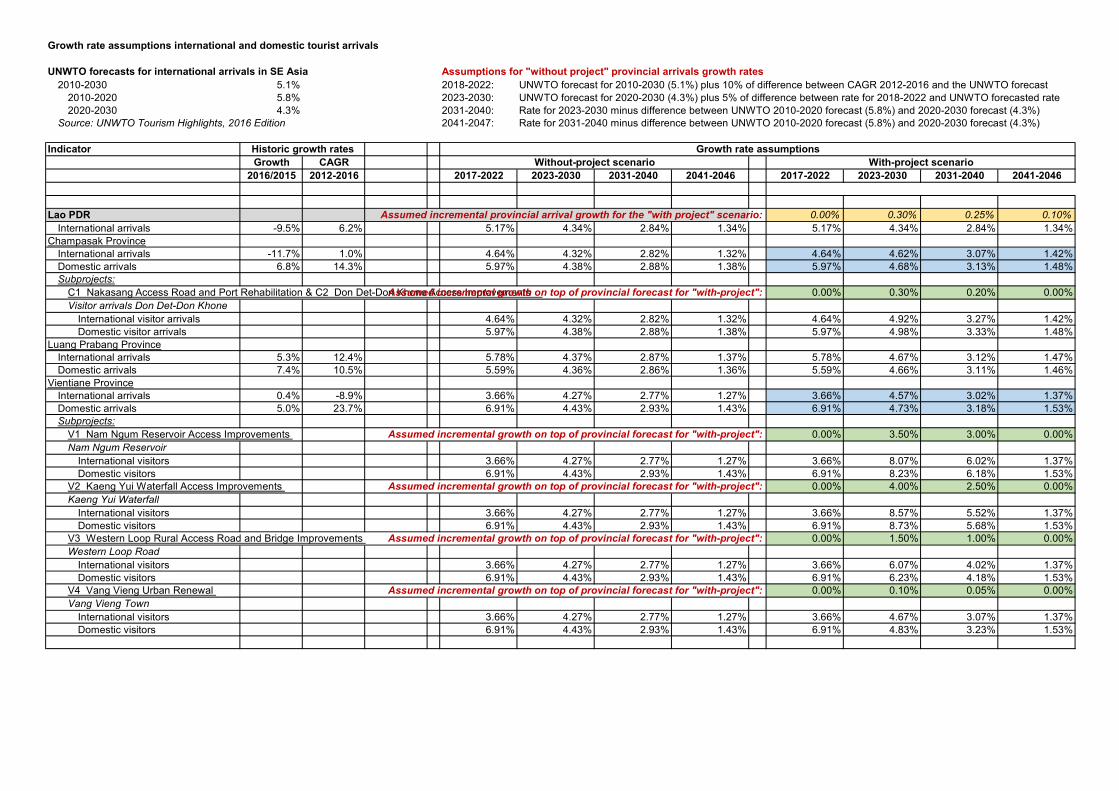
Growth rate assumptions international and domestic tourist arrivals
UNWTO forecasts for international arrivals in SE Asia Assumptions for "without project" provincial arrivals growth rates2010-2030 5.1% 2018-2022: UNWTO forecast for 2010-2030 (5.1%) plus 10% of difference between CAGR 2012-2016 and the UNWTO forecast
2010-2020 5.8% 2023-2030: UNWTO forecast for 2020-2030 (4.3%) plus 5% of difference between rate for 2018-2022 and UNWTO forecasted rate2020-2030 4.3% 2031-2040: Rate for 2023-2030 minus difference between UNWTO 2010-2020 forecast (5.8%) and 2020-2030 forecast (4.3%)
Source: UNWTO Tourism Highlights, 2016 Edition 2041-2047: Rate for 2031-2040 minus difference between UNWTO 2010-2020 forecast (5.8%) and 2020-2030 forecast (4.3%)
IndicatorGrowth CAGR
2016/2015 2012-2016 2017-2022 2023-2030 2031-2040 2041-2046 2017-2022 2023-2030 2031-2040 2041-2046
Lao PDR Assumed incremental provincial arrival growth for the "with project" scenario: 0.00% 0.30% 0.25% 0.10%International arrivals -9.5% 6.2% 5.17% 4.34% 2.84% 1.34% 5.17% 4.34% 2.84% 1.34%
Champasak ProvinceInternational arrivals -11.7% 1.0% 4.64% 4.32% 2.82% 1.32% 4.64% 4.62% 3.07% 1.42%Domestic arrivals 6.8% 14.3% 5.97% 4.38% 2.88% 1.38% 5.97% 4.68% 3.13% 1.48%Subprojects:
C1 Nakasang Access Road and Port Rehabilitation & C2 Don Det-Don Khone Access Improvements Assumed incremental growth on top of provincial forecast for "with-project": 0.00% 0.30% 0.20% 0.00%Visitor arrivals Don Det-Don Khone
International visitor arrivals 4.64% 4.32% 2.82% 1.32% 4.64% 4.92% 3.27% 1.42%Domestic visitor arrivals 5.97% 4.38% 2.88% 1.38% 5.97% 4.98% 3.33% 1.48%
Luang Prabang ProvinceInternational arrivals 5.3% 12.4% 5.78% 4.37% 2.87% 1.37% 5.78% 4.67% 3.12% 1.47%Domestic arrivals 7.4% 10.5% 5.59% 4.36% 2.86% 1.36% 5.59% 4.66% 3.11% 1.46%
Vientiane ProvinceInternational arrivals 0.4% -8.9% 3.66% 4.27% 2.77% 1.27% 3.66% 4.57% 3.02% 1.37%Domestic arrivals 5.0% 23.7% 6.91% 4.43% 2.93% 1.43% 6.91% 4.73% 3.18% 1.53%Subprojects:
V1 Nam Ngum Reservoir Access Improvements Assumed incremental growth on top of provincial forecast for "with-project": 0.00% 3.50% 3.00% 0.00%Nam Ngum Reservoir
International visitors 3.66% 4.27% 2.77% 1.27% 3.66% 8.07% 6.02% 1.37%Domestic visitors 6.91% 4.43% 2.93% 1.43% 6.91% 8.23% 6.18% 1.53%
V2 Kaeng Yui Waterfall Access Improvements Assumed incremental growth on top of provincial forecast for "with-project": 0.00% 4.00% 2.50% 0.00%Kaeng Yui Waterfall
International visitors 3.66% 4.27% 2.77% 1.27% 3.66% 8.57% 5.52% 1.37%Domestic visitors 6.91% 4.43% 2.93% 1.43% 6.91% 8.73% 5.68% 1.53%
V3 Western Loop Rural Access Road and Bridge Improvements Assumed incremental growth on top of provincial forecast for "with-project": 0.00% 1.50% 1.00% 0.00%Western Loop Road
International visitors 3.66% 4.27% 2.77% 1.27% 3.66% 6.07% 4.02% 1.37%Domestic visitors 6.91% 4.43% 2.93% 1.43% 6.91% 6.23% 4.18% 1.53%
V4 Vang Vieng Urban Renewal Assumed incremental growth on top of provincial forecast for "with-project": 0.00% 0.10% 0.05% 0.00%Vang Vieng Town
International visitors 3.66% 4.27% 2.77% 1.27% 3.66% 4.67% 3.07% 1.37%Domestic visitors 6.91% 4.43% 2.93% 1.43% 6.91% 4.83% 3.23% 1.53%
Without-project scenario With-project scenarioGrowth rate assumptionsHistoric growth rates
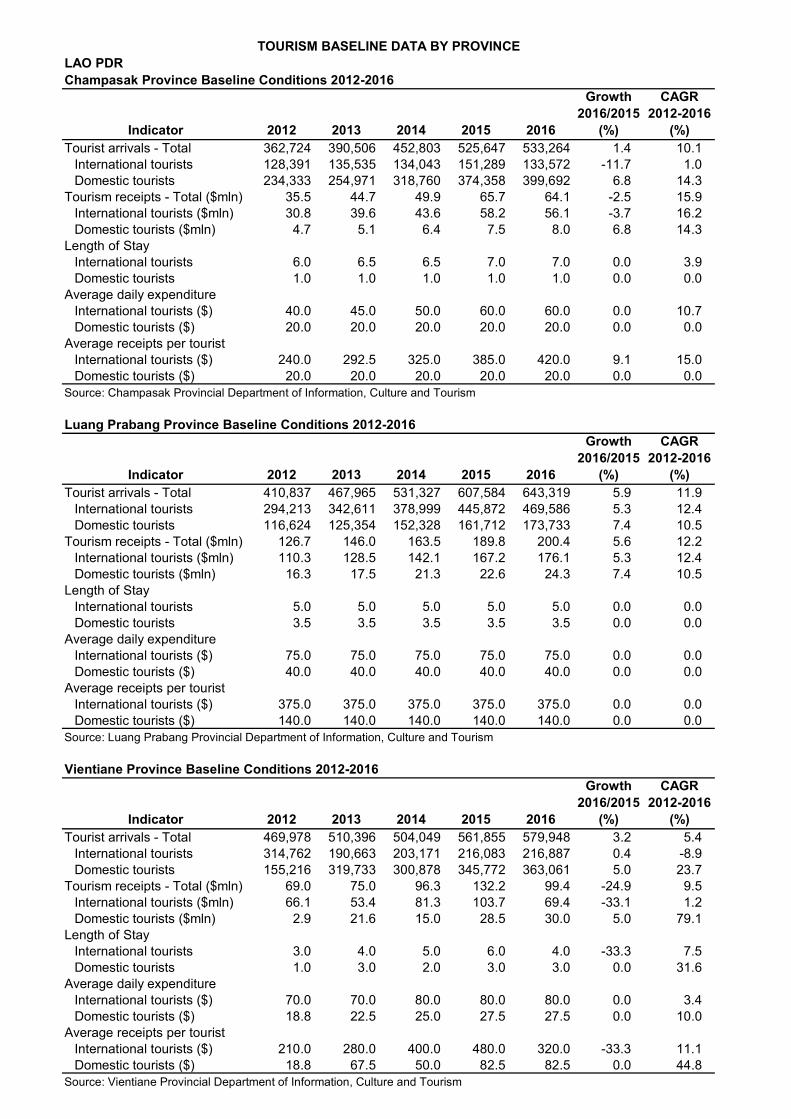
LAO PDRChampasak Province Baseline Conditions 2012-2016
Indicator 2012 2013 2014 2015 2016
Growth 2016/2015
(%)
CAGR 2012-2016
(%)Tourist arrivals - Total 362,724 390,506 452,803 525,647 533,264 1.4 10.1
International tourists 128,391 135,535 134,043 151,289 133,572 -11.7 1.0Domestic tourists 234,333 254,971 318,760 374,358 399,692 6.8 14.3
Tourism receipts - Total ($mln) 35.5 44.7 49.9 65.7 64.1 -2.5 15.9International tourists ($mln) 30.8 39.6 43.6 58.2 56.1 -3.7 16.2Domestic tourists ($mln) 4.7 5.1 6.4 7.5 8.0 6.8 14.3
Length of StayInternational tourists 6.0 6.5 6.5 7.0 7.0 0.0 3.9Domestic tourists 1.0 1.0 1.0 1.0 1.0 0.0 0.0
Average daily expenditureInternational tourists ($) 40.0 45.0 50.0 60.0 60.0 0.0 10.7Domestic tourists ($) 20.0 20.0 20.0 20.0 20.0 0.0 0.0
Average receipts per touristInternational tourists ($) 240.0 292.5 325.0 385.0 420.0 9.1 15.0Domestic tourists ($) 20.0 20.0 20.0 20.0 20.0 0.0 0.0
Source: Champasak Provincial Department of Information, Culture and Tourism
Luang Prabang Province Baseline Conditions 2012-2016
Indicator 2012 2013 2014 2015 2016
Growth 2016/2015
(%)
CAGR 2012-2016
(%)Tourist arrivals - Total 410,837 467,965 531,327 607,584 643,319 5.9 11.9
International tourists 294,213 342,611 378,999 445,872 469,586 5.3 12.4Domestic tourists 116,624 125,354 152,328 161,712 173,733 7.4 10.5
Tourism receipts - Total ($mln) 126.7 146.0 163.5 189.8 200.4 5.6 12.2International tourists ($mln) 110.3 128.5 142.1 167.2 176.1 5.3 12.4Domestic tourists ($mln) 16.3 17.5 21.3 22.6 24.3 7.4 10.5
Length of StayInternational tourists 5.0 5.0 5.0 5.0 5.0 0.0 0.0Domestic tourists 3.5 3.5 3.5 3.5 3.5 0.0 0.0
Average daily expenditureInternational tourists ($) 75.0 75.0 75.0 75.0 75.0 0.0 0.0Domestic tourists ($) 40.0 40.0 40.0 40.0 40.0 0.0 0.0
Average receipts per touristInternational tourists ($) 375.0 375.0 375.0 375.0 375.0 0.0 0.0Domestic tourists ($) 140.0 140.0 140.0 140.0 140.0 0.0 0.0
Source: Luang Prabang Provincial Department of Information, Culture and Tourism
Vientiane Province Baseline Conditions 2012-2016
Indicator 2012 2013 2014 2015 2016
Growth 2016/2015
(%)
CAGR 2012-2016
(%)Tourist arrivals - Total 469,978 510,396 504,049 561,855 579,948 3.2 5.4
International tourists 314,762 190,663 203,171 216,083 216,887 0.4 -8.9Domestic tourists 155,216 319,733 300,878 345,772 363,061 5.0 23.7
Tourism receipts - Total ($mln) 69.0 75.0 96.3 132.2 99.4 -24.9 9.5International tourists ($mln) 66.1 53.4 81.3 103.7 69.4 -33.1 1.2Domestic tourists ($mln) 2.9 21.6 15.0 28.5 30.0 5.0 79.1
Length of StayInternational tourists 3.0 4.0 5.0 6.0 4.0 -33.3 7.5Domestic tourists 1.0 3.0 2.0 3.0 3.0 0.0 31.6
Average daily expenditureInternational tourists ($) 70.0 70.0 80.0 80.0 80.0 0.0 3.4Domestic tourists ($) 18.8 22.5 25.0 27.5 27.5 0.0 10.0
Average receipts per touristInternational tourists ($) 210.0 280.0 400.0 480.0 320.0 -33.3 11.1Domestic tourists ($) 18.8 67.5 50.0 82.5 82.5 0.0 44.8
Source: Vientiane Provincial Department of Information, Culture and Tourism
TOURISM BASELINE DATA BY PROVINCE
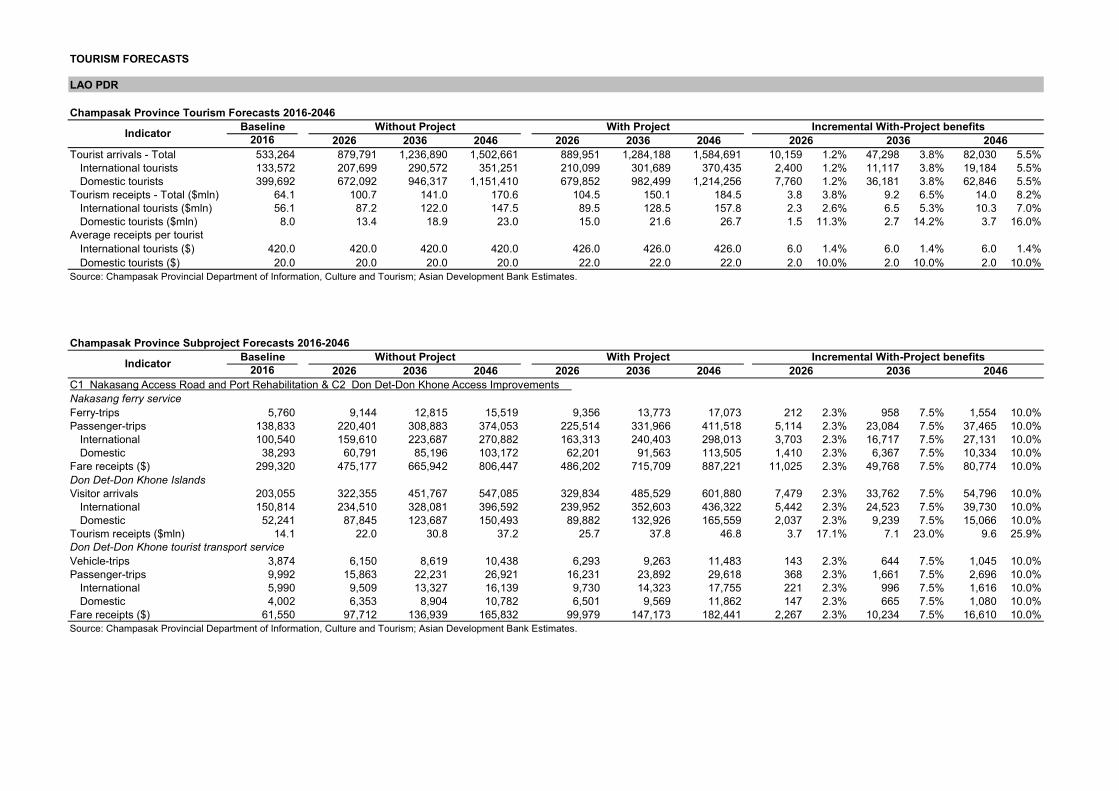
TOURISM FORECASTS
LAO PDR
Champasak Province Tourism Forecasts 2016-2046Baseline
2016 2026 2036 2046 2026 2036 2046Tourist arrivals - Total 533,264 879,791 1,236,890 1,502,661 889,951 1,284,188 1,584,691 10,159 1.2% 47,298 3.8% 82,030 5.5%
International tourists 133,572 207,699 290,572 351,251 210,099 301,689 370,435 2,400 1.2% 11,117 3.8% 19,184 5.5%Domestic tourists 399,692 672,092 946,317 1,151,410 679,852 982,499 1,214,256 7,760 1.2% 36,181 3.8% 62,846 5.5%
Tourism receipts - Total ($mln) 64.1 100.7 141.0 170.6 104.5 150.1 184.5 3.8 3.8% 9.2 6.5% 14.0 8.2%International tourists ($mln) 56.1 87.2 122.0 147.5 89.5 128.5 157.8 2.3 2.6% 6.5 5.3% 10.3 7.0%Domestic tourists ($mln) 8.0 13.4 18.9 23.0 15.0 21.6 26.7 1.5 11.3% 2.7 14.2% 3.7 16.0%
Average receipts per touristInternational tourists ($) 420.0 420.0 420.0 420.0 426.0 426.0 426.0 6.0 1.4% 6.0 1.4% 6.0 1.4%Domestic tourists ($) 20.0 20.0 20.0 20.0 22.0 22.0 22.0 2.0 10.0% 2.0 10.0% 2.0 10.0%
Source: Champasak Provincial Department of Information, Culture and Tourism; Asian Development Bank Estimates.
Champasak Province Subproject Forecasts 2016-2046Baseline
2016 2026 2036 2046 2026 2036 2046 C1 Nakasang Access Road and Port Rehabilitation & C2 Don Det-Don Khone Access Improvements
Nakasang ferry serviceFerry-trips 5,760 9,144 12,815 15,519 9,356 13,773 17,073 212 2.3% 958 7.5% 1,554 10.0%Passenger-trips 138,833 220,401 308,883 374,053 225,514 331,966 411,518 5,114 2.3% 23,084 7.5% 37,465 10.0%
International 100,540 159,610 223,687 270,882 163,313 240,403 298,013 3,703 2.3% 16,717 7.5% 27,131 10.0%Domestic 38,293 60,791 85,196 103,172 62,201 91,563 113,505 1,410 2.3% 6,367 7.5% 10,334 10.0%
Fare receipts ($) 299,320 475,177 665,942 806,447 486,202 715,709 887,221 11,025 2.3% 49,768 7.5% 80,774 10.0%Don Det-Don Khone IslandsVisitor arrivals 203,055 322,355 451,767 547,085 329,834 485,529 601,880 7,479 2.3% 33,762 7.5% 54,796 10.0%
International 150,814 234,510 328,081 396,592 239,952 352,603 436,322 5,442 2.3% 24,523 7.5% 39,730 10.0%Domestic 52,241 87,845 123,687 150,493 89,882 132,926 165,559 2,037 2.3% 9,239 7.5% 15,066 10.0%
Tourism receipts ($mln) 14.1 22.0 30.8 37.2 25.7 37.8 46.8 3.7 17.1% 7.1 23.0% 9.6 25.9%Don Det-Don Khone tourist transport serviceVehicle-trips 3,874 6,150 8,619 10,438 6,293 9,263 11,483 143 2.3% 644 7.5% 1,045 10.0%Passenger-trips 9,992 15,863 22,231 26,921 16,231 23,892 29,618 368 2.3% 1,661 7.5% 2,696 10.0%
International 5,990 9,509 13,327 16,139 9,730 14,323 17,755 221 2.3% 996 7.5% 1,616 10.0%Domestic 4,002 6,353 8,904 10,782 6,501 9,569 11,862 147 2.3% 665 7.5% 1,080 10.0%
Fare receipts ($) 61,550 97,712 136,939 165,832 99,979 147,173 182,441 2,267 2.3% 10,234 7.5% 16,610 10.0%Source: Champasak Provincial Department of Information, Culture and Tourism; Asian Development Bank Estimates.
2036 2046Indicator Without Project With Project Incremental With-Project benefits2026
Indicator Without Project With Project Incremental With-Project benefits2026 2036 2046
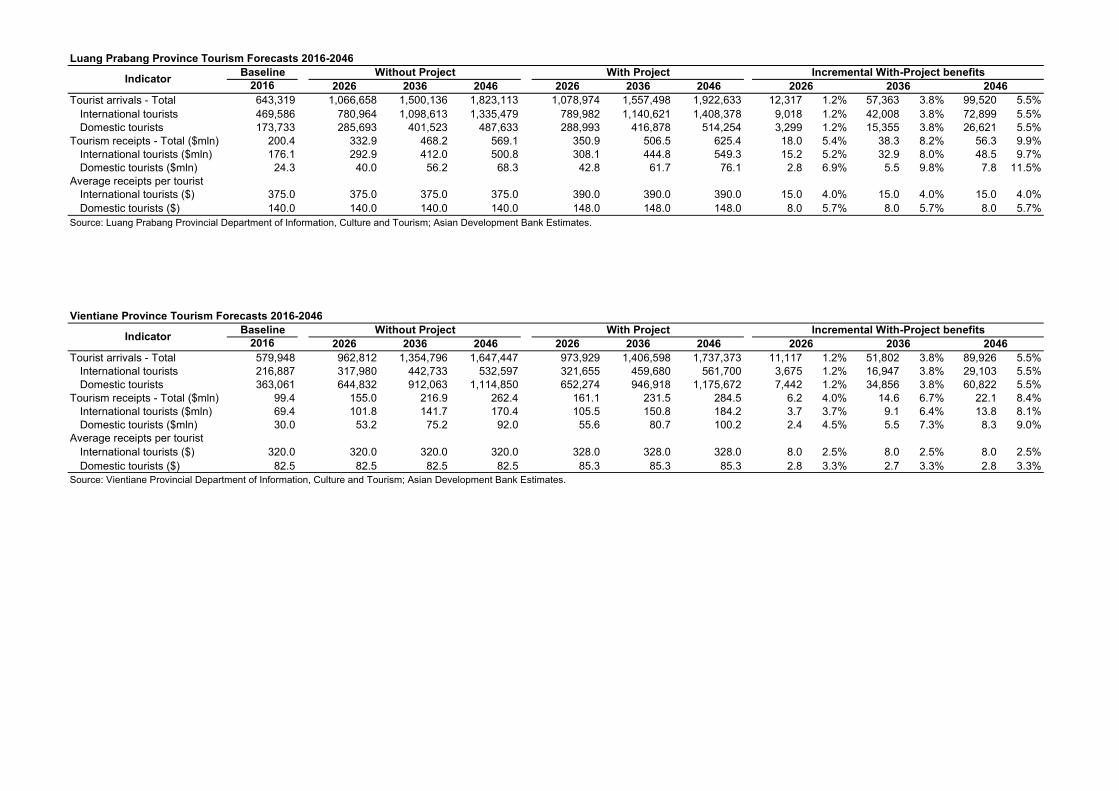
Luang Prabang Province Tourism Forecasts 2016-2046Baseline
2016 2026 2036 2046 2026 2036 2046Tourist arrivals - Total 643,319 1,066,658 1,500,136 1,823,113 1,078,974 1,557,498 1,922,633 12,317 1.2% 57,363 3.8% 99,520 5.5%
International tourists 469,586 780,964 1,098,613 1,335,479 789,982 1,140,621 1,408,378 9,018 1.2% 42,008 3.8% 72,899 5.5%Domestic tourists 173,733 285,693 401,523 487,633 288,993 416,878 514,254 3,299 1.2% 15,355 3.8% 26,621 5.5%
Tourism receipts - Total ($mln) 200.4 332.9 468.2 569.1 350.9 506.5 625.4 18.0 5.4% 38.3 8.2% 56.3 9.9%International tourists ($mln) 176.1 292.9 412.0 500.8 308.1 444.8 549.3 15.2 5.2% 32.9 8.0% 48.5 9.7%Domestic tourists ($mln) 24.3 40.0 56.2 68.3 42.8 61.7 76.1 2.8 6.9% 5.5 9.8% 7.8 11.5%
Average receipts per touristInternational tourists ($) 375.0 375.0 375.0 375.0 390.0 390.0 390.0 15.0 4.0% 15.0 4.0% 15.0 4.0%Domestic tourists ($) 140.0 140.0 140.0 140.0 148.0 148.0 148.0 8.0 5.7% 8.0 5.7% 8.0 5.7%
Source: Luang Prabang Provincial Department of Information, Culture and Tourism; Asian Development Bank Estimates.
Vientiane Province Tourism Forecasts 2016-2046Baseline
2016 2026 2036 2046 2026 2036 2046Tourist arrivals - Total 579,948 962,812 1,354,796 1,647,447 973,929 1,406,598 1,737,373 11,117 1.2% 51,802 3.8% 89,926 5.5%
International tourists 216,887 317,980 442,733 532,597 321,655 459,680 561,700 3,675 1.2% 16,947 3.8% 29,103 5.5%Domestic tourists 363,061 644,832 912,063 1,114,850 652,274 946,918 1,175,672 7,442 1.2% 34,856 3.8% 60,822 5.5%
Tourism receipts - Total ($mln) 99.4 155.0 216.9 262.4 161.1 231.5 284.5 6.2 4.0% 14.6 6.7% 22.1 8.4%International tourists ($mln) 69.4 101.8 141.7 170.4 105.5 150.8 184.2 3.7 3.7% 9.1 6.4% 13.8 8.1%Domestic tourists ($mln) 30.0 53.2 75.2 92.0 55.6 80.7 100.2 2.4 4.5% 5.5 7.3% 8.3 9.0%
Average receipts per touristInternational tourists ($) 320.0 320.0 320.0 320.0 328.0 328.0 328.0 8.0 2.5% 8.0 2.5% 8.0 2.5%Domestic tourists ($) 82.5 82.5 82.5 82.5 85.3 85.3 85.3 2.8 3.3% 2.7 3.3% 2.8 3.3%
Source: Vientiane Provincial Department of Information, Culture and Tourism; Asian Development Bank Estimates.
Incremental With-Project benefits2026
Indicator 2036 2046Without Project With Project Incremental With-Project benefits
2026
Indicator 2036 2046Without Project With Project
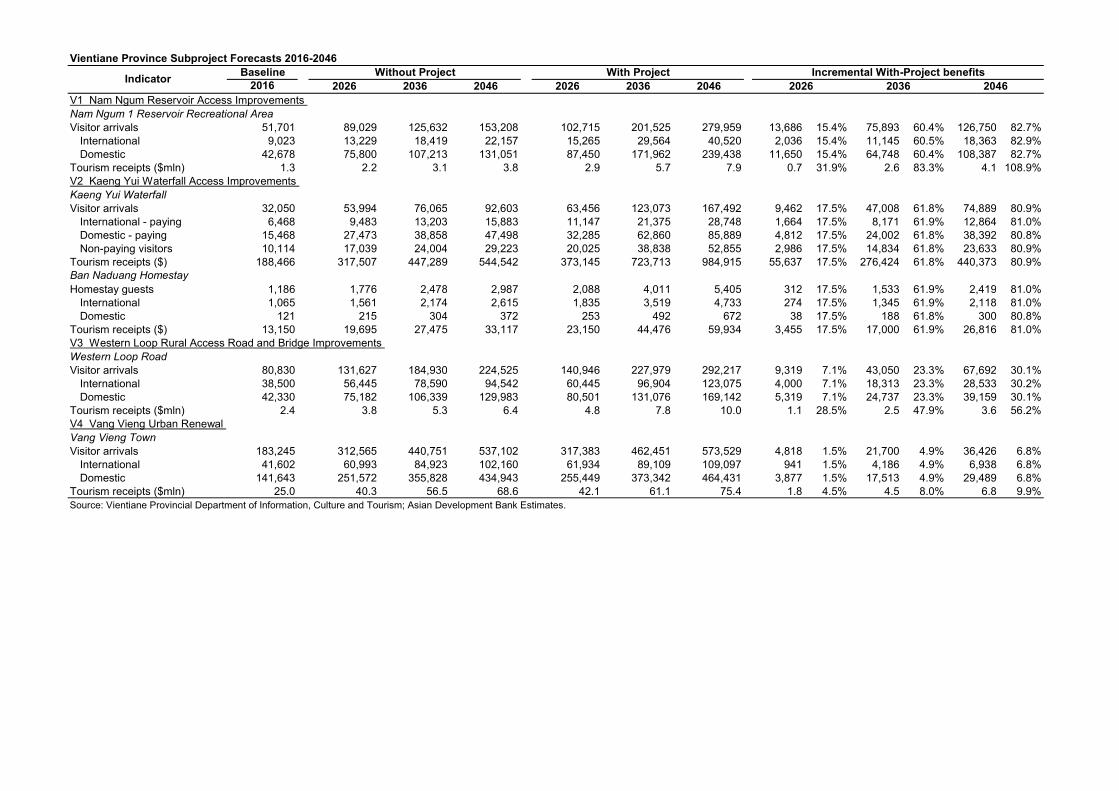
Vientiane Province Subproject Forecasts 2016-2046Baseline
2016 2026 2036 2046 2026 2036 2046V1 Nam Ngum Reservoir Access Improvements Nam Ngum 1 Reservoir Recreational AreaVisitor arrivals 51,701 89,029 125,632 153,208 102,715 201,525 279,959 13,686 15.4% 75,893 60.4% 126,750 82.7%
International 9,023 13,229 18,419 22,157 15,265 29,564 40,520 2,036 15.4% 11,145 60.5% 18,363 82.9%Domestic 42,678 75,800 107,213 131,051 87,450 171,962 239,438 11,650 15.4% 64,748 60.4% 108,387 82.7%
Tourism receipts ($mln) 1.3 2.2 3.1 3.8 2.9 5.7 7.9 0.7 31.9% 2.6 83.3% 4.1 108.9%V2 Kaeng Yui Waterfall Access Improvements Kaeng Yui WaterfallVisitor arrivals 32,050 53,994 76,065 92,603 63,456 123,073 167,492 9,462 17.5% 47,008 61.8% 74,889 80.9%
International - paying 6,468 9,483 13,203 15,883 11,147 21,375 28,748 1,664 17.5% 8,171 61.9% 12,864 81.0%Domestic - paying 15,468 27,473 38,858 47,498 32,285 62,860 85,889 4,812 17.5% 24,002 61.8% 38,392 80.8%Non-paying visitors 10,114 17,039 24,004 29,223 20,025 38,838 52,855 2,986 17.5% 14,834 61.8% 23,633 80.9%
Tourism receipts ($) 188,466 317,507 447,289 544,542 373,145 723,713 984,915 55,637 17.5% 276,424 61.8% 440,373 80.9%Ban Naduang HomestayHomestay guests 1,186 1,776 2,478 2,987 2,088 4,011 5,405 312 17.5% 1,533 61.9% 2,419 81.0%
International 1,065 1,561 2,174 2,615 1,835 3,519 4,733 274 17.5% 1,345 61.9% 2,118 81.0%Domestic 121 215 304 372 253 492 672 38 17.5% 188 61.8% 300 80.8%
Tourism receipts ($) 13,150 19,695 27,475 33,117 23,150 44,476 59,934 3,455 17.5% 17,000 61.9% 26,816 81.0%V3 Western Loop Rural Access Road and Bridge Improvements Western Loop RoadVisitor arrivals 80,830 131,627 184,930 224,525 140,946 227,979 292,217 9,319 7.1% 43,050 23.3% 67,692 30.1%
International 38,500 56,445 78,590 94,542 60,445 96,904 123,075 4,000 7.1% 18,313 23.3% 28,533 30.2%Domestic 42,330 75,182 106,339 129,983 80,501 131,076 169,142 5,319 7.1% 24,737 23.3% 39,159 30.1%
Tourism receipts ($mln) 2.4 3.8 5.3 6.4 4.8 7.8 10.0 1.1 28.5% 2.5 47.9% 3.6 56.2%V4 Vang Vieng Urban Renewal Vang Vieng TownVisitor arrivals 183,245 312,565 440,751 537,102 317,383 462,451 573,529 4,818 1.5% 21,700 4.9% 36,426 6.8%
International 41,602 60,993 84,923 102,160 61,934 89,109 109,097 941 1.5% 4,186 4.9% 6,938 6.8%Domestic 141,643 251,572 355,828 434,943 255,449 373,342 464,431 3,877 1.5% 17,513 4.9% 29,489 6.8%
Tourism receipts ($mln) 25.0 40.3 56.5 68.6 42.1 61.1 75.4 1.8 4.5% 4.5 8.0% 6.8 9.9%Source: Vientiane Provincial Department of Information, Culture and Tourism; Asian Development Bank Estimates.
Indicator Without Project With Project Incremental With-Project benefits2026 2036 2046
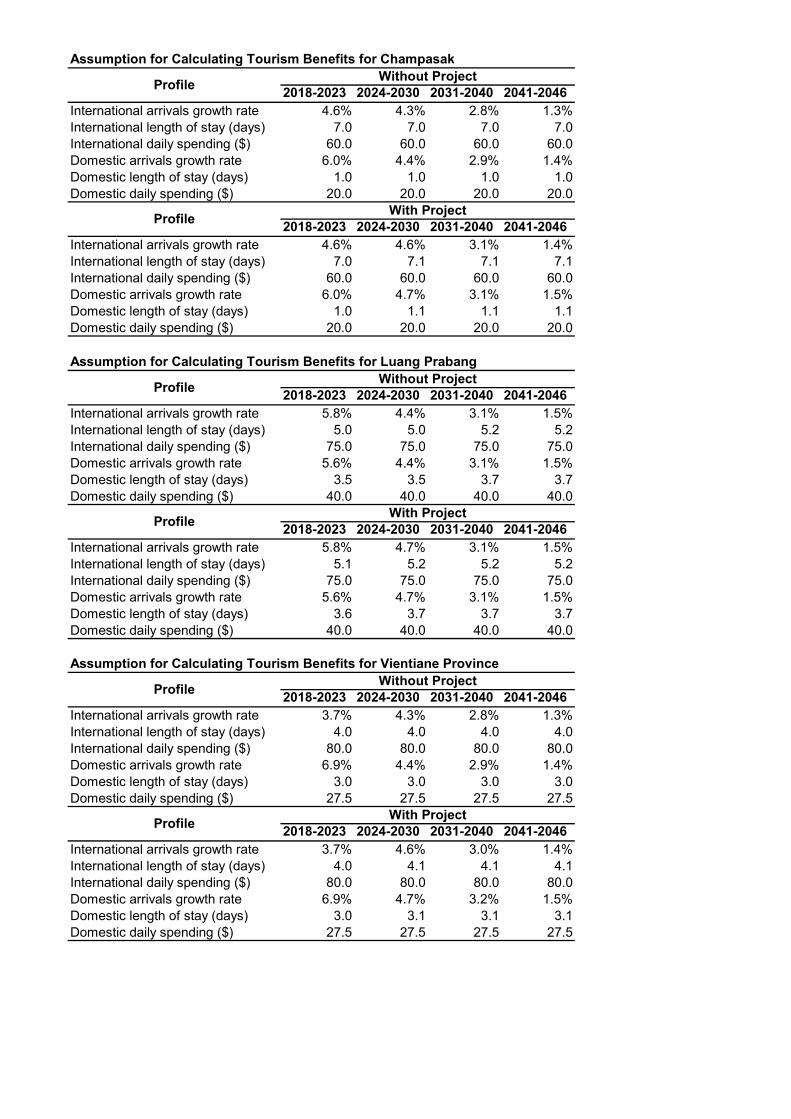
Assumption for Calculating Tourism Benefits for Champasak
2018-2023 2024-2030 2031-2040 2041-2046International arrivals growth rate 4.6% 4.3% 2.8% 1.3%International length of stay (days) 7.0 7.0 7.0 7.0International daily spending ($) 60.0 60.0 60.0 60.0Domestic arrivals growth rate 6.0% 4.4% 2.9% 1.4%Domestic length of stay (days) 1.0 1.0 1.0 1.0Domestic daily spending ($) 20.0 20.0 20.0 20.0
2018-2023 2024-2030 2031-2040 2041-2046International arrivals growth rate 4.6% 4.6% 3.1% 1.4%International length of stay (days) 7.0 7.1 7.1 7.1International daily spending ($) 60.0 60.0 60.0 60.0Domestic arrivals growth rate 6.0% 4.7% 3.1% 1.5%Domestic length of stay (days) 1.0 1.1 1.1 1.1Domestic daily spending ($) 20.0 20.0 20.0 20.0
Assumption for Calculating Tourism Benefits for Luang Prabang
2018-2023 2024-2030 2031-2040 2041-2046International arrivals growth rate 5.8% 4.4% 3.1% 1.5%International length of stay (days) 5.0 5.0 5.2 5.2International daily spending ($) 75.0 75.0 75.0 75.0Domestic arrivals growth rate 5.6% 4.4% 3.1% 1.5%Domestic length of stay (days) 3.5 3.5 3.7 3.7Domestic daily spending ($) 40.0 40.0 40.0 40.0
2018-2023 2024-2030 2031-2040 2041-2046International arrivals growth rate 5.8% 4.7% 3.1% 1.5%International length of stay (days) 5.1 5.2 5.2 5.2International daily spending ($) 75.0 75.0 75.0 75.0Domestic arrivals growth rate 5.6% 4.7% 3.1% 1.5%Domestic length of stay (days) 3.6 3.7 3.7 3.7Domestic daily spending ($) 40.0 40.0 40.0 40.0
Assumption for Calculating Tourism Benefits for Vientiane Province
2018-2023 2024-2030 2031-2040 2041-2046International arrivals growth rate 3.7% 4.3% 2.8% 1.3%International length of stay (days) 4.0 4.0 4.0 4.0International daily spending ($) 80.0 80.0 80.0 80.0Domestic arrivals growth rate 6.9% 4.4% 2.9% 1.4%Domestic length of stay (days) 3.0 3.0 3.0 3.0Domestic daily spending ($) 27.5 27.5 27.5 27.5
2018-2023 2024-2030 2031-2040 2041-2046International arrivals growth rate 3.7% 4.6% 3.0% 1.4%International length of stay (days) 4.0 4.1 4.1 4.1International daily spending ($) 80.0 80.0 80.0 80.0Domestic arrivals growth rate 6.9% 4.7% 3.2% 1.5%Domestic length of stay (days) 3.0 3.1 3.1 3.1Domestic daily spending ($) 27.5 27.5 27.5 27.5
Profile With Project
Without ProjectProfile
Profile With Project
Profile Without Project
Profile With Project
Profile Without Project
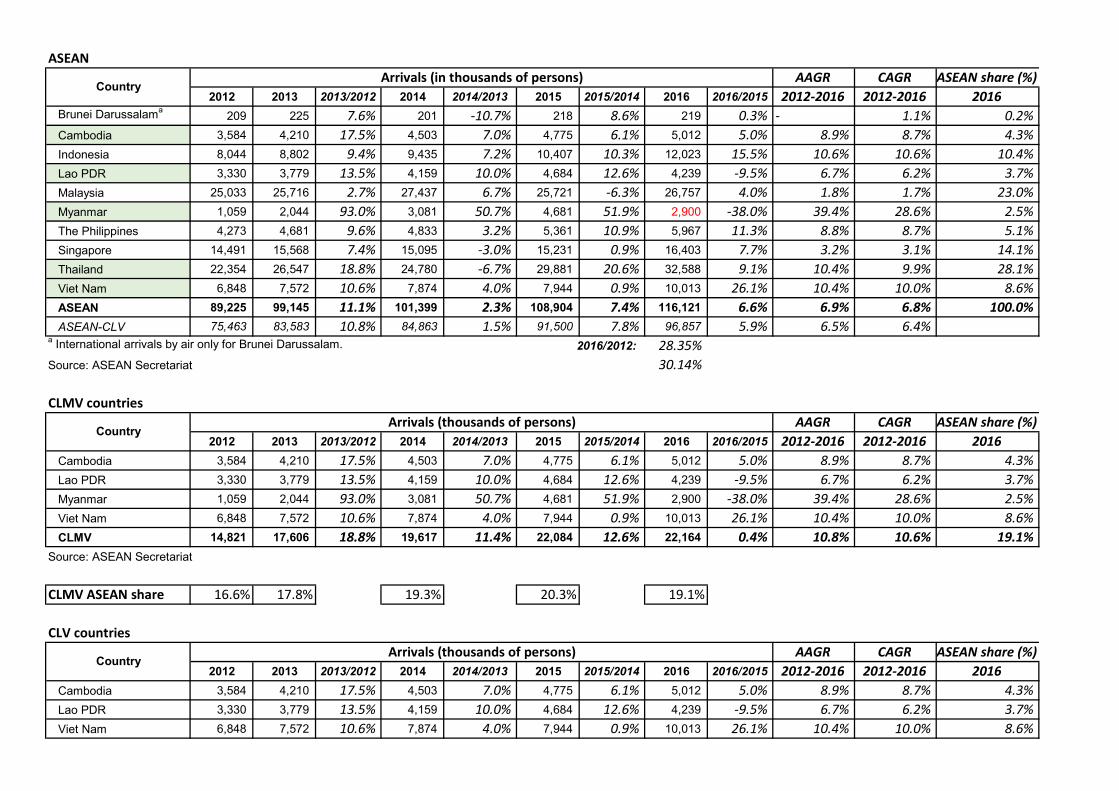
ASEANAAGR CAGR ASEAN share (%)
2012 2013 2013/2012 2014 2014/2013 2015 2015/2014 2016 2016/2015 2012-2016 2012-2016 2016Brunei Darussalama 209 225 7.6% 201 -10.7% 218 8.6% 219 0.3% - 1.1% 0.2%Cambodia 3,584 4,210 17.5% 4,503 7.0% 4,775 6.1% 5,012 5.0% 8.9% 8.7% 4.3%Indonesia 8,044 8,802 9.4% 9,435 7.2% 10,407 10.3% 12,023 15.5% 10.6% 10.6% 10.4%Lao PDR 3,330 3,779 13.5% 4,159 10.0% 4,684 12.6% 4,239 -9.5% 6.7% 6.2% 3.7%Malaysia 25,033 25,716 2.7% 27,437 6.7% 25,721 -6.3% 26,757 4.0% 1.8% 1.7% 23.0%Myanmar 1,059 2,044 93.0% 3,081 50.7% 4,681 51.9% 2,900 -38.0% 39.4% 28.6% 2.5%The Philippines 4,273 4,681 9.6% 4,833 3.2% 5,361 10.9% 5,967 11.3% 8.8% 8.7% 5.1%Singapore 14,491 15,568 7.4% 15,095 -3.0% 15,231 0.9% 16,403 7.7% 3.2% 3.1% 14.1%Thailand 22,354 26,547 18.8% 24,780 -6.7% 29,881 20.6% 32,588 9.1% 10.4% 9.9% 28.1%Viet Nam 6,848 7,572 10.6% 7,874 4.0% 7,944 0.9% 10,013 26.1% 10.4% 10.0% 8.6%ASEAN 89,225 99,145 11.1% 101,399 2.3% 108,904 7.4% 116,121 6.6% 6.9% 6.8% 100.0%ASEAN-CLV 75,463 83,583 10.8% 84,863 1.5% 91,500 7.8% 96,857 5.9% 6.5% 6.4%
a International arrivals by air only for Brunei Darussalam. 2016/2012: 28.35%Source: ASEAN Secretariat 30.14%
CLMV countriesAAGR CAGR ASEAN share (%)
2012 2013 2013/2012 2014 2014/2013 2015 2015/2014 2016 2016/2015 2012-2016 2012-2016 2016Cambodia 3,584 4,210 17.5% 4,503 7.0% 4,775 6.1% 5,012 5.0% 8.9% 8.7% 4.3%Lao PDR 3,330 3,779 13.5% 4,159 10.0% 4,684 12.6% 4,239 -9.5% 6.7% 6.2% 3.7%Myanmar 1,059 2,044 93.0% 3,081 50.7% 4,681 51.9% 2,900 -38.0% 39.4% 28.6% 2.5%Viet Nam 6,848 7,572 10.6% 7,874 4.0% 7,944 0.9% 10,013 26.1% 10.4% 10.0% 8.6%CLMV 14,821 17,606 18.8% 19,617 11.4% 22,084 12.6% 22,164 0.4% 10.8% 10.6% 19.1%
Source: ASEAN Secretariat
CLMV ASEAN share 16.6% 17.8% 19.3% 20.3% 19.1%
CLV countriesAAGR CAGR ASEAN share (%)
2012 2013 2013/2012 2014 2014/2013 2015 2015/2014 2016 2016/2015 2012-2016 2012-2016 2016Cambodia 3,584 4,210 17.5% 4,503 7.0% 4,775 6.1% 5,012 5.0% 8.9% 8.7% 4.3%Lao PDR 3,330 3,779 13.5% 4,159 10.0% 4,684 12.6% 4,239 -9.5% 6.7% 6.2% 3.7%Viet Nam 6,848 7,572 10.6% 7,874 4.0% 7,944 0.9% 10,013 26.1% 10.4% 10.0% 8.6%
Country
CountryArrivals (in thousands of persons)
Arrivals (thousands of persons)
CountryArrivals (thousands of persons)
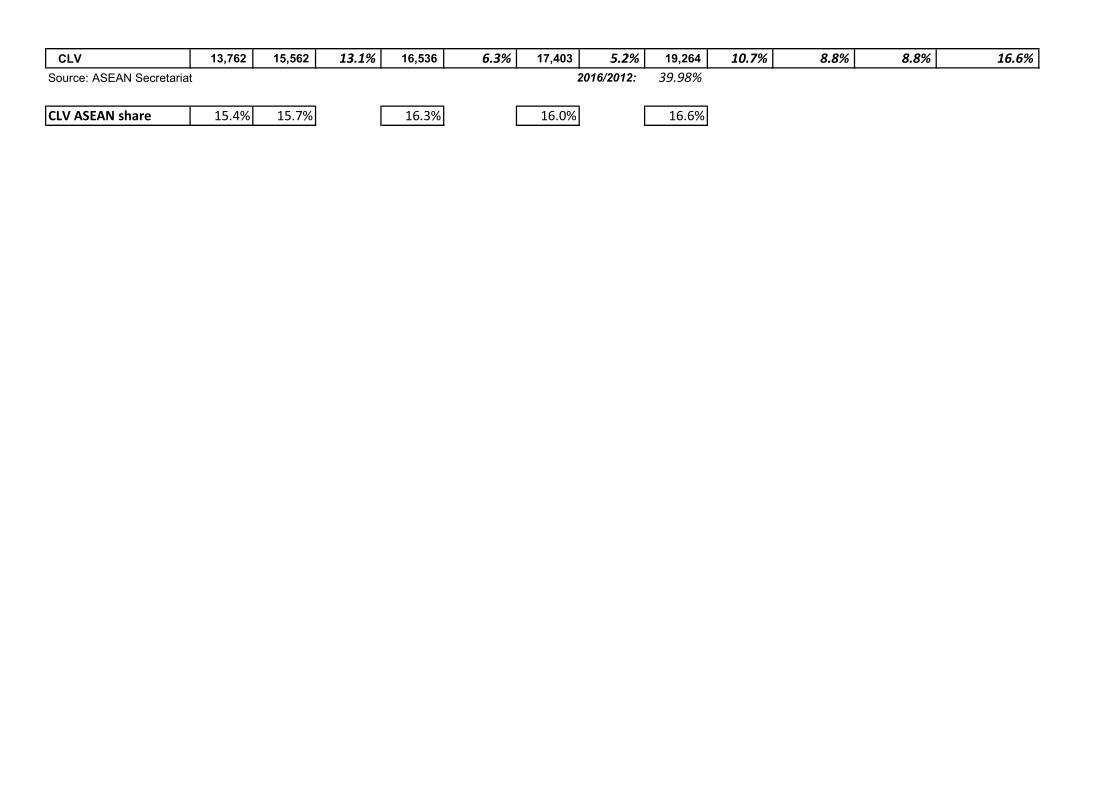
CLV 13,762 15,562 13.1% 16,536 6.3% 17,403 5.2% 19,264 10.7% 8.8% 8.8% 16.6%Source: ASEAN Secretariat 2016/2012: 39.98%
CLV ASEAN share 15.4% 15.7% 16.3% 16.0% 16.6%
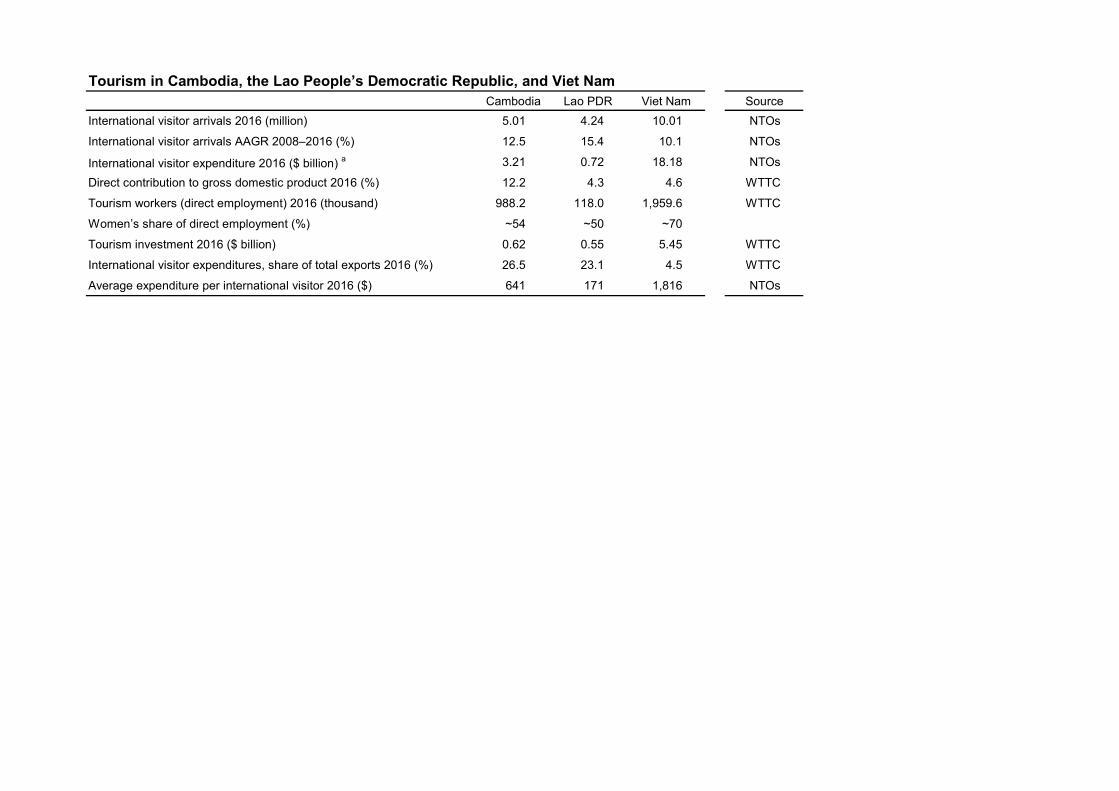
Tourism in Cambodia, the Lao People’s Democratic Republic, and Viet NamCambodia Lao PDR Viet Nam Source
International visitor arrivals 2016 (million) 5.01 4.24 10.01 NTOs
International visitor arrivals AAGR 2008–2016 (%) 12.5 15.4 10.1 NTOs
International visitor expenditure 2016 ($ billion) a 3.21 0.72 18.18 NTOs
Direct contribution to gross domestic product 2016 (%) 12.2 4.3 4.6 WTTC
Tourism workers (direct employment) 2016 (thousand) 988.2 118.0 1,959.6 WTTC
Women’s share of direct employment (%) ~54 ~50 ~70
Tourism investment 2016 ($ billion) 0.62 0.55 5.45 WTTC
International visitor expenditures, share of total exports 2016 (%) 26.5 23.1 4.5 WTTC
Average expenditure per international visitor 2016 ($) 641 171 1,816 NTOs
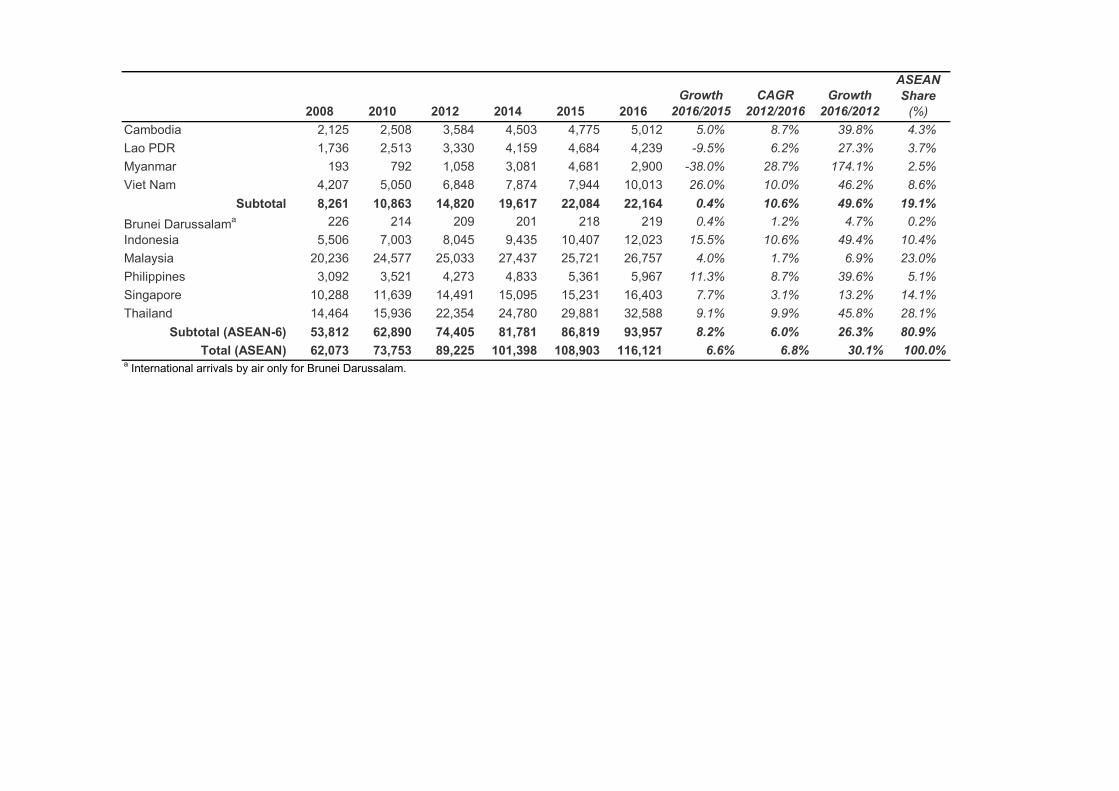
2008 2010 2012 2014 2015 2016Growth
2016/2015CAGR
2012/2016Growth
2016/2012
ASEAN Share
(%)Cambodia 2,125 2,508 3,584 4,503 4,775 5,012 5.0% 8.7% 39.8% 4.3%Lao PDR 1,736 2,513 3,330 4,159 4,684 4,239 -9.5% 6.2% 27.3% 3.7%Myanmar 193 792 1,058 3,081 4,681 2,900 -38.0% 28.7% 174.1% 2.5%Viet Nam 4,207 5,050 6,848 7,874 7,944 10,013 26.0% 10.0% 46.2% 8.6%
Subtotal 8,261 10,863 14,820 19,617 22,084 22,164 0.4% 10.6% 49.6% 19.1%Brunei Darussalama 226 214 209 201 218 219 0.4% 1.2% 4.7% 0.2%Indonesia 5,506 7,003 8,045 9,435 10,407 12,023 15.5% 10.6% 49.4% 10.4%Malaysia 20,236 24,577 25,033 27,437 25,721 26,757 4.0% 1.7% 6.9% 23.0%Philippines 3,092 3,521 4,273 4,833 5,361 5,967 11.3% 8.7% 39.6% 5.1%Singapore 10,288 11,639 14,491 15,095 15,231 16,403 7.7% 3.1% 13.2% 14.1%Thailand 14,464 15,936 22,354 24,780 29,881 32,588 9.1% 9.9% 45.8% 28.1%
Subtotal (ASEAN-6) 53,812 62,890 74,405 81,781 86,819 93,957 8.2% 6.0% 26.3% 80.9%Total (ASEAN) 62,073 73,753 89,225 101,398 108,903 116,121 6.6% 6.8% 30.1% 100.0%
a International arrivals by air only for Brunei Darussalam.
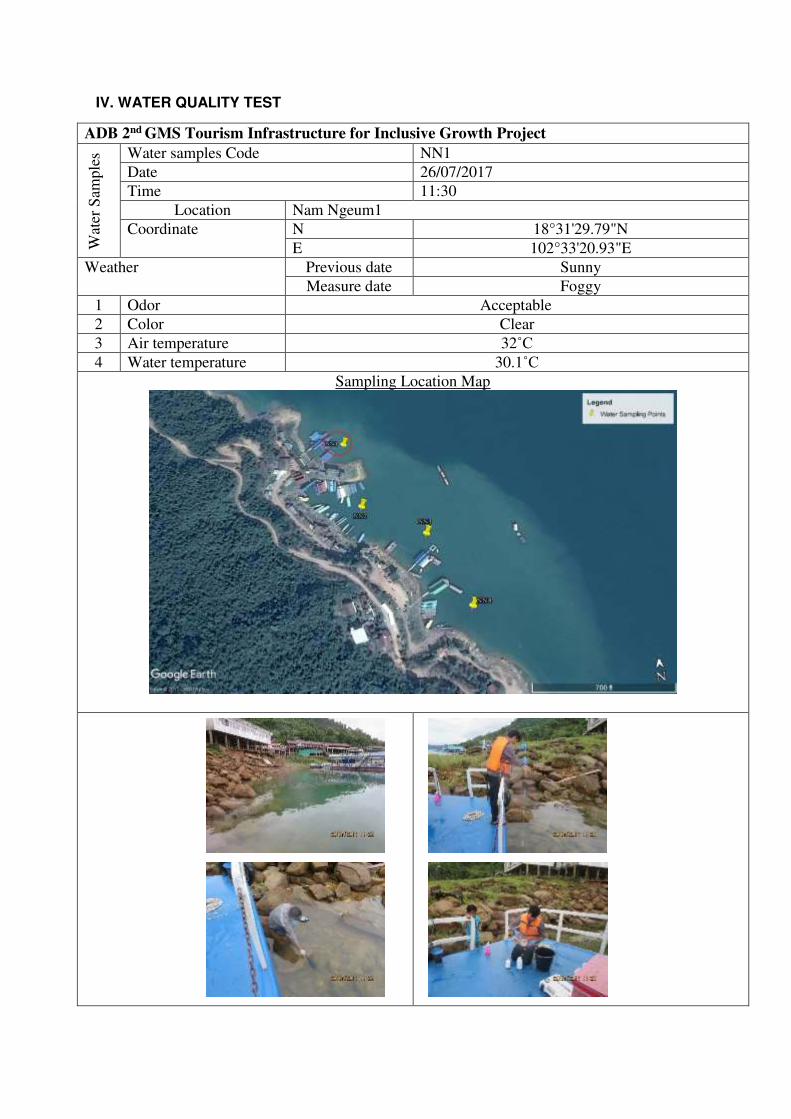
IV. WATER QUALITY TEST
ADB 2nd GMS Tourism Infrastructure for Inclusive Growth Project
Wat
er S
ample
s Water samples Code NN1
Date 26/07/2017
Time 11:30
Location Nam Ngeum1
Coordinate N 18°31'29.79"N
E 102°33'20.93"E
Weather Previous date Sunny
Measure date Foggy
1 Odor Acceptable
2 Color Clear
3 Air temperature 32˚C
4 Water temperature 30.1˚C
Sampling Location Map
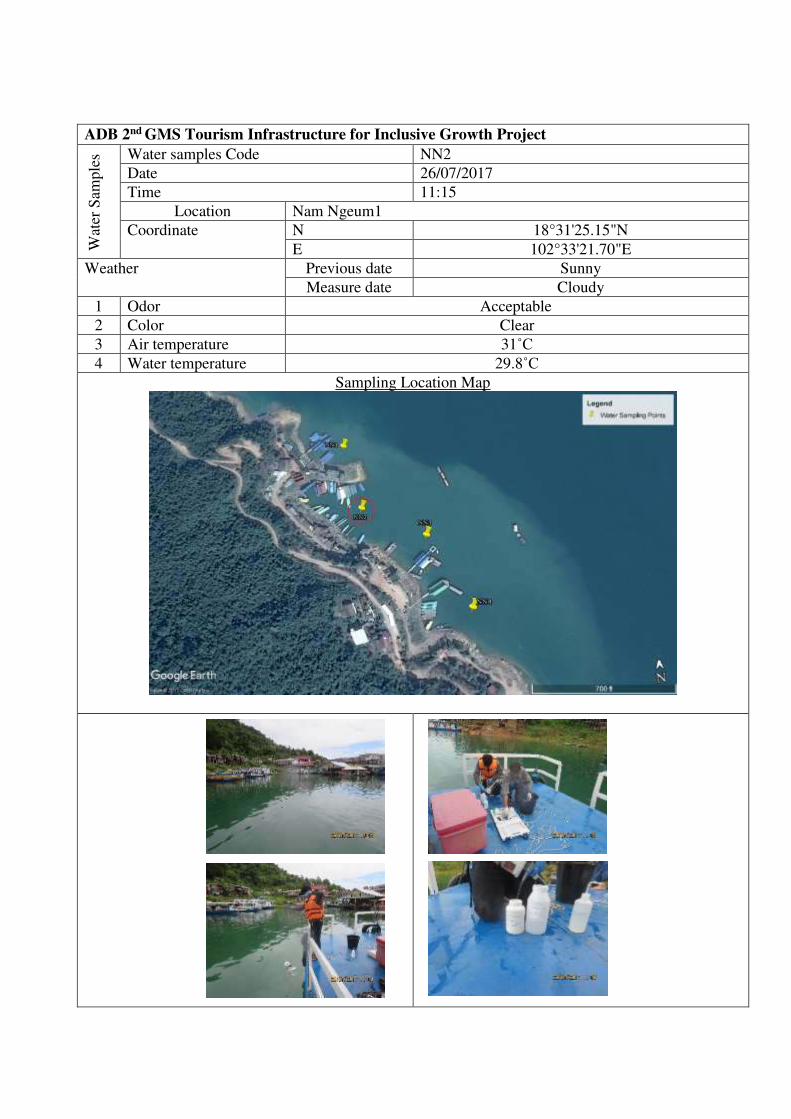
ADB 2nd GMS Tourism Infrastructure for Inclusive Growth Project
Wat
er S
ample
s Water samples Code NN2
Date 26/07/2017
Time 11:15
Location Nam Ngeum1
Coordinate N 18°31'25.15"N
E 102°33'21.70"E
Weather Previous date Sunny
Measure date Cloudy
1 Odor Acceptable
2 Color Clear
3 Air temperature 31˚C
4 Water temperature 29.8˚C
Sampling Location Map
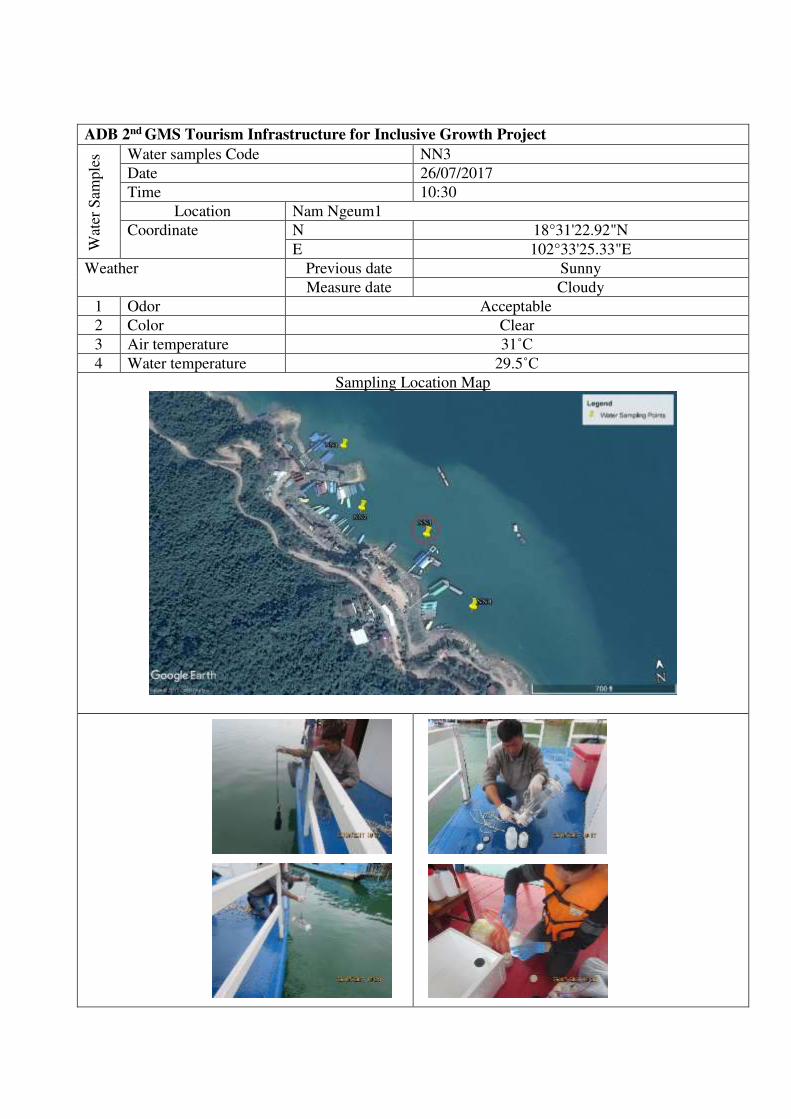
ADB 2nd GMS Tourism Infrastructure for Inclusive Growth Project
Wat
er S
ample
s Water samples Code NN3
Date 26/07/2017
Time 10:30
Location Nam Ngeum1
Coordinate N 18°31'22.92"N
E 102°33'25.33"E
Weather Previous date Sunny
Measure date Cloudy
1 Odor Acceptable
2 Color Clear
3 Air temperature 31˚C
4 Water temperature 29.5˚C
Sampling Location Map
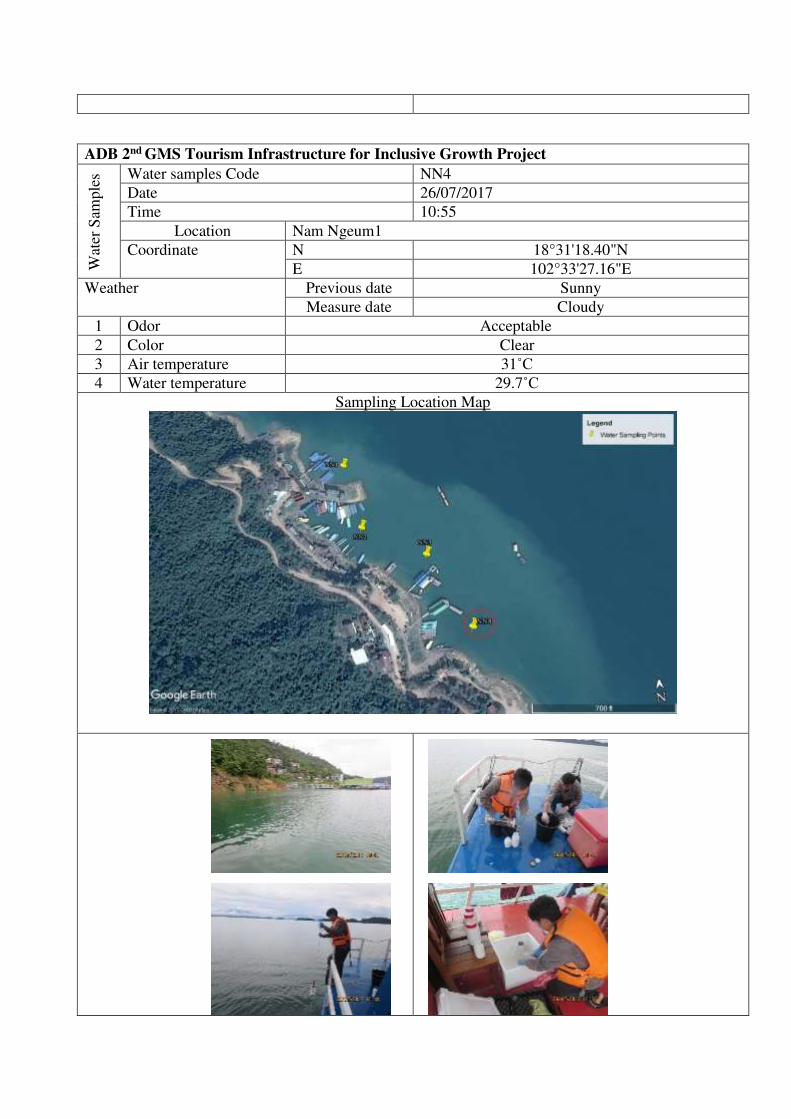
ADB 2nd GMS Tourism Infrastructure for Inclusive Growth Project
Wat
er S
ample
s Water samples Code NN4
Date 26/07/2017
Time 10:55
Location Nam Ngeum1
Coordinate N 18°31'18.40"N
E 102°33'27.16"E
Weather Previous date Sunny
Measure date Cloudy
1 Odor Acceptable
2 Color Clear
3 Air temperature 31˚C
4 Water temperature 29.7˚C
Sampling Location Map

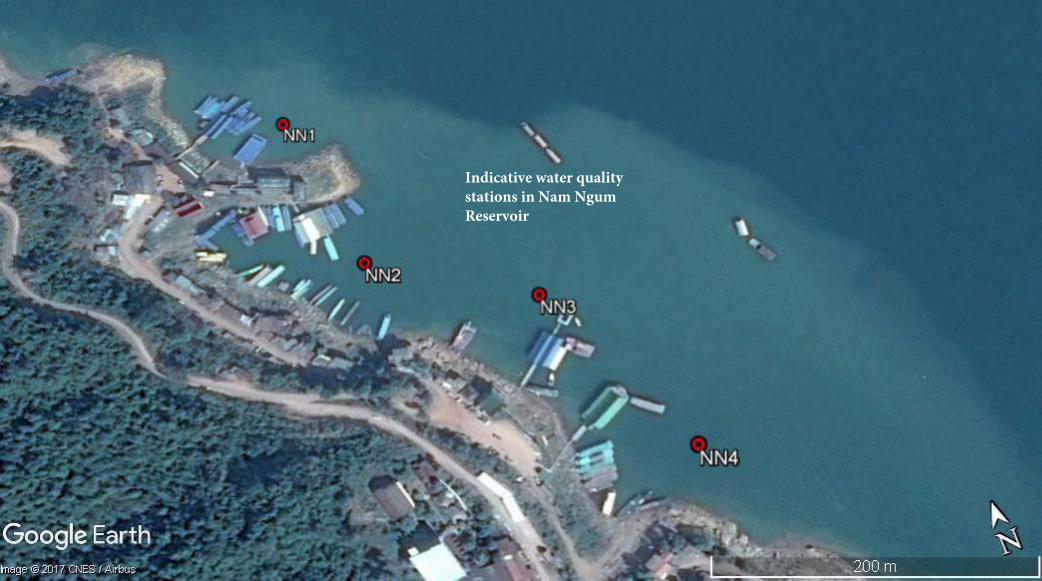
Indicative water quality
stations in Nam Ngum
Reservoir
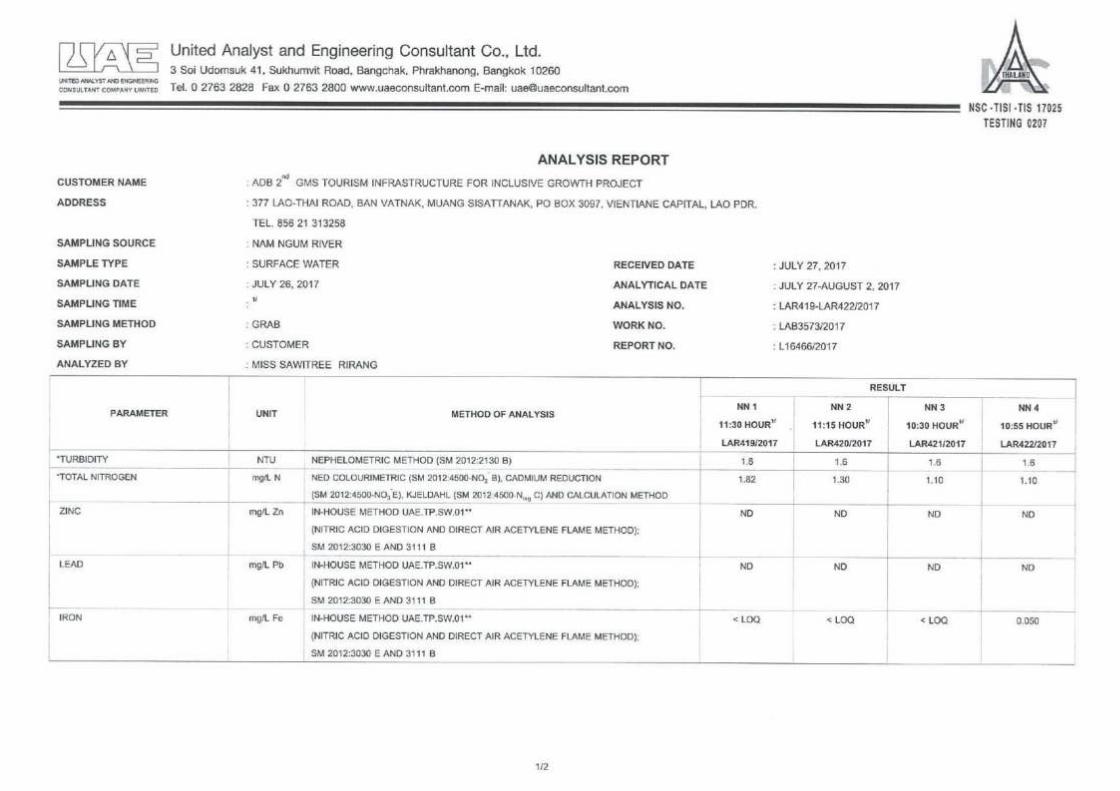
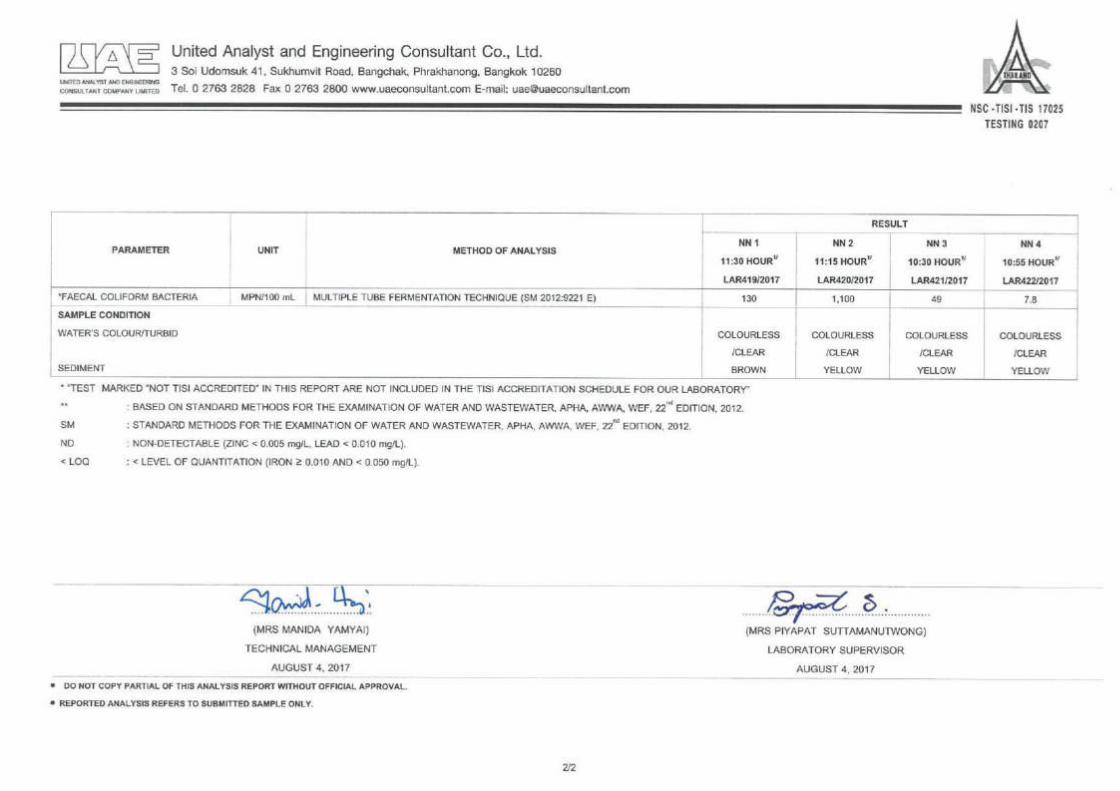
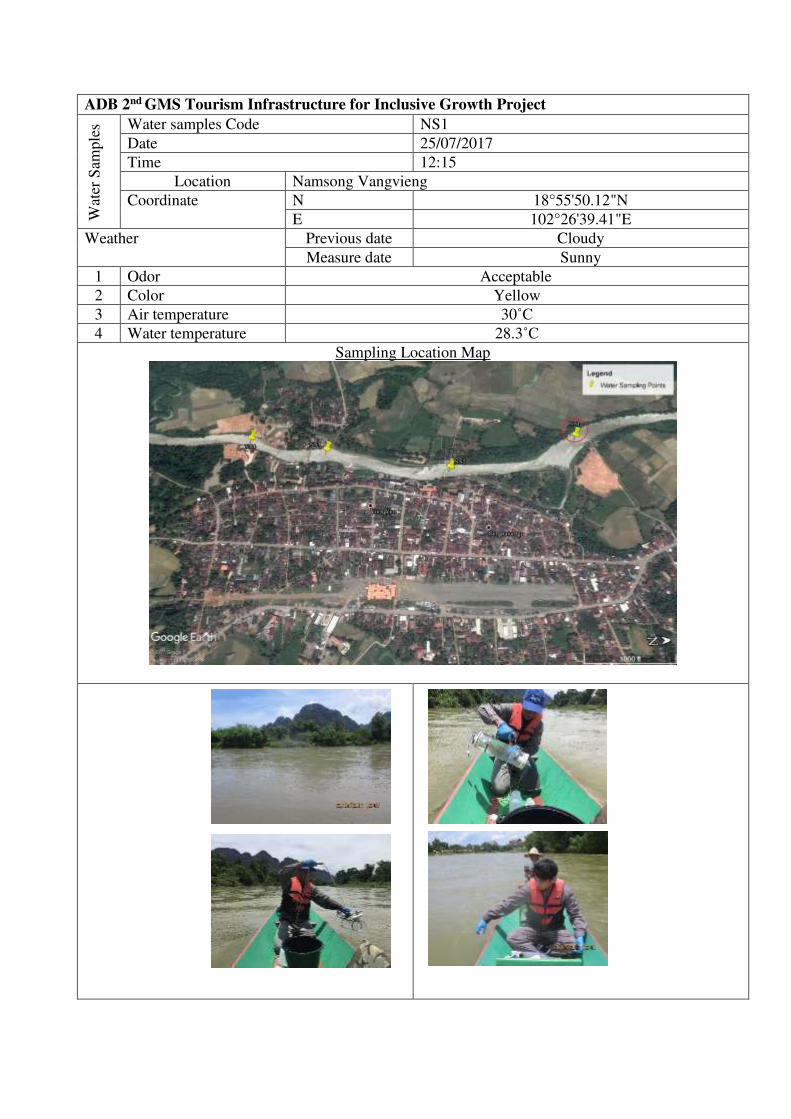
ADB 2nd GMS Tourism Infrastructure for Inclusive Growth Project W
ater
Sam
ple
s Water samples Code NS1
Date 25/07/2017
Time 12:15
Location Namsong Vangvieng
Coordinate N 18°55'50.12"N
E 102°26'39.41"E
Weather Previous date Cloudy
Measure date Sunny
1 Odor Acceptable
2 Color Yellow
3 Air temperature 30˚C
4 Water temperature 28.3˚C
Sampling Location Map
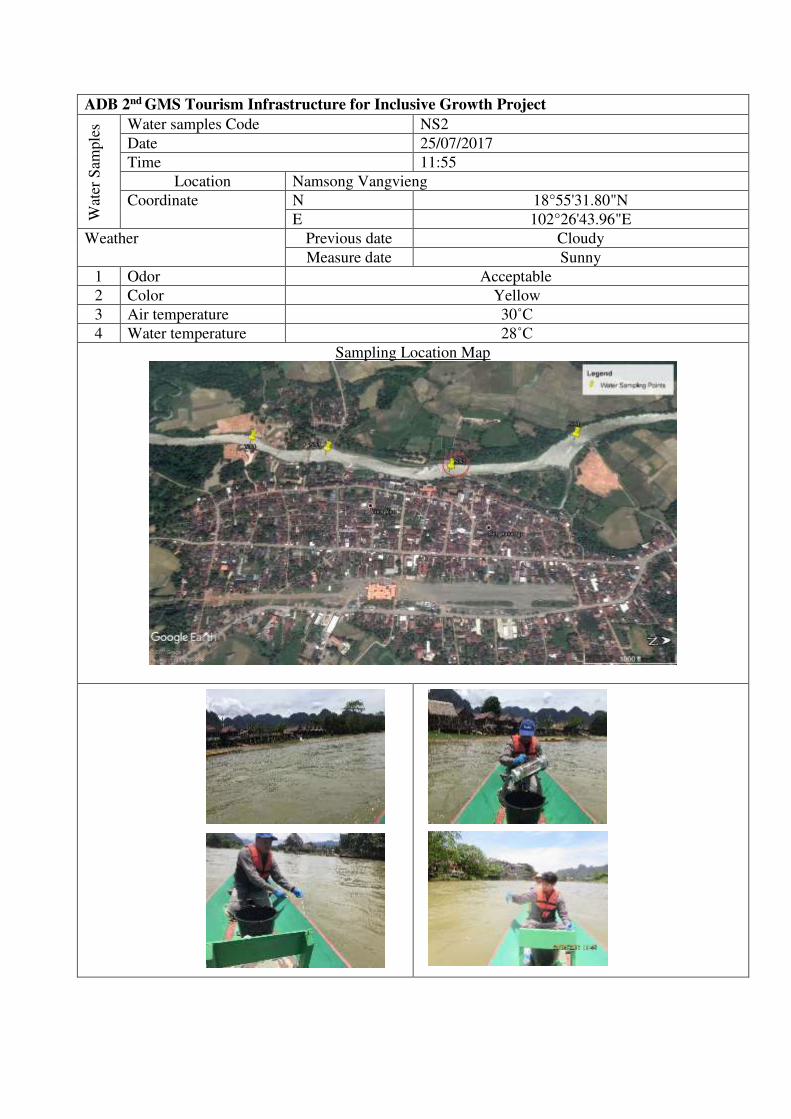
ADB 2nd GMS Tourism Infrastructure for Inclusive Growth Project W
ater
Sam
ple
s Water samples Code NS2
Date 25/07/2017
Time 11:55
Location Namsong Vangvieng
Coordinate N 18°55'31.80"N
E 102°26'43.96"E
Weather Previous date Cloudy
Measure date Sunny
1 Odor Acceptable
2 Color Yellow
3 Air temperature 30˚C
4 Water temperature 28˚C
Sampling Location Map
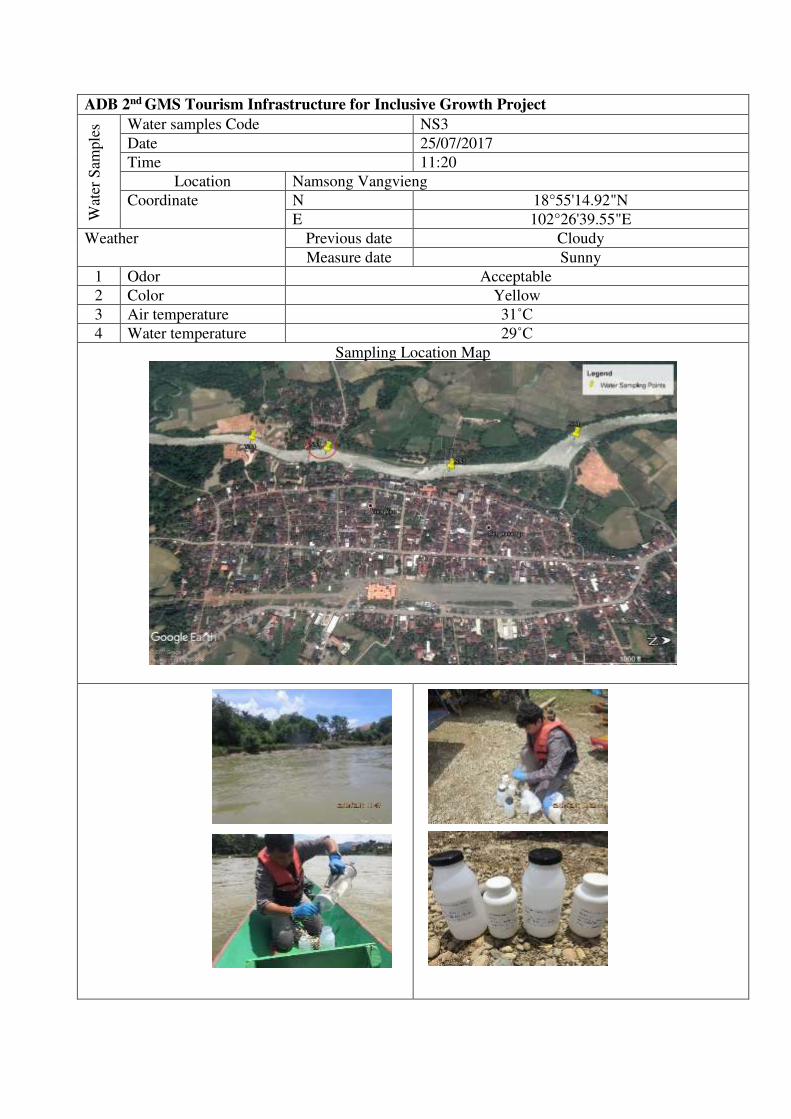
ADB 2nd GMS Tourism Infrastructure for Inclusive Growth Project W
ater
Sam
ple
s Water samples Code NS3
Date 25/07/2017
Time 11:20
Location Namsong Vangvieng
Coordinate N 18°55'14.92"N
E 102°26'39.55"E
Weather Previous date Cloudy
Measure date Sunny
1 Odor Acceptable
2 Color Yellow
3 Air temperature 31˚C
4 Water temperature 29˚C
Sampling Location Map
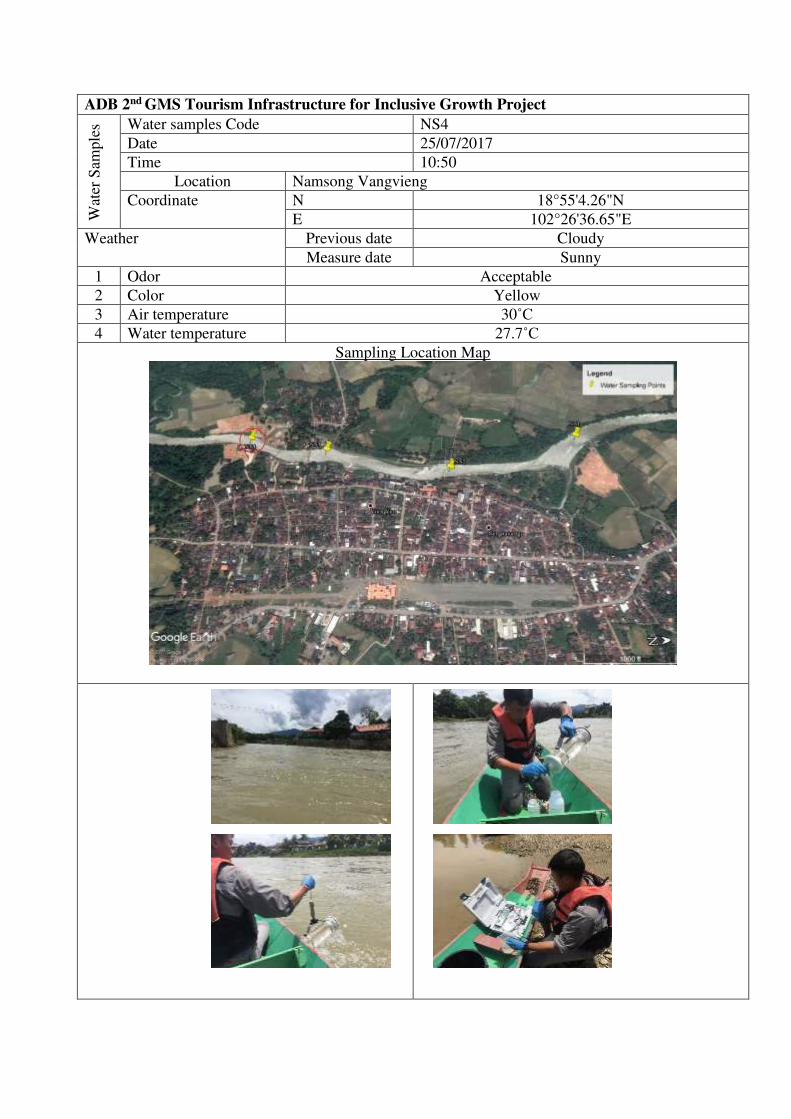
ADB 2nd GMS Tourism Infrastructure for Inclusive Growth Project W
ater
Sam
ple
s Water samples Code NS4
Date 25/07/2017
Time 10:50
Location Namsong Vangvieng
Coordinate N 18°55'4.26"N
E 102°26'36.65"E
Weather Previous date Cloudy
Measure date Sunny
1 Odor Acceptable
2 Color Yellow
3 Air temperature 30˚C
4 Water temperature 27.7˚C
Sampling Location Map
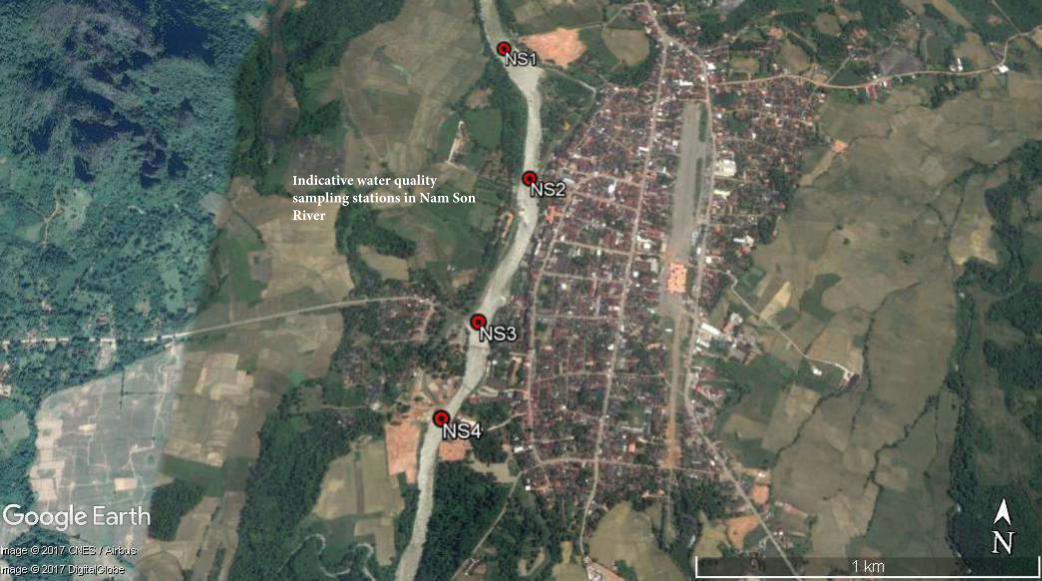
Indicative water quality
sampling stations in Nam Son
River