Embed Size (px)
Citation preview
Radical Statistics Issue 87
19
Teaching statistics – the missing ingredients Petra Boynton
Being stats-phobic, I was once reassured by a tutor that statistics were nothing to do with numbers, but akin to baking a cake (see also Edirisooriya, 2003). Their analogy was when we bake cakes we follow a recipe (a statistical test) so the cake (outcome) will be delicious (correct). I’m not certain whether this analogy was right, but it did reassure me. However, having taught statistics and research on a regular basis, I am reintroducing the analogy. Currently statistics are being taught and used in research in an incomplete format. Cakes are being made with only half the ingredients. Perhaps this seems a strange angle to take within a Radical Statistics forum. Hasn’t there been more than enough attention paid to teaching statistics? Can’t we find something else to talk about? Well, yes and no. Plenty has been written about teaching and learning statistics, and this paper will reference examples of ‘good practice’. But this information isn’t entering into practice, leaving many students and researchers ill-prepared to design studies, collect, and analyse data. In this essay I shall critically evaluate the way statistics is taught to non-statisticians at an undergraduate and postgraduate level, describe what is missing, and recommend resources to enable others to teach statistics more effectively. My focus is mainly aimed at the health and social sciences, although most of the arguments in this paper apply to all disciplines. I am a lecturer in international health services research. I teach students how to research, including analysing qualitative and quantitative data. Like many lecturers I taught statistics early in my career, having been lumbered with the research methods course that nobody wanted to teach (more on this later). Perhaps unusually I grew to love teaching and critically evaluating methods. But unlike other statistics tutors I was in the unenviable position of being dyscalculic, meaning have difficulty reading and understanding numbers. In this essay I position myself as someone who works with community groups, nascent researchers, and experienced analysts and academics. I am someone who struggles with statistics, and perhaps for that
Radical Statistics Issue 87
20
reason, and through talking to my students, can see the gaps in our current approach to teaching statistics, which leaves me convinced this is a very necessary and radical issue we need to address. Most statisticians I have talked to agree these issues are important, but often assume they are being taught somewhere on a statistics course. One of the main problems we face is that statistics are taught to non-statisticians by non-statisticians (Wakeford, 1980). And frequently both tutors and students are equally terrified of the subject. Research and training materials have been produced to make statistics more interesting, but less work has been completed on the process of teaching (Roback, 2003; Cobb and Moore, 1997), and matching the practical skills required by ‘real world’ researchers, to what is currently taught. I feel statisticians need to become more involved in teacher training and critically evaluating statistics courses.
Who teaches statistics, and what is learned? Statistics courses within social and health science degrees are usually combined with research, and are often the ‘punishment’ course given to new and/or young lecturers. Invariably students arrive with little or no statistical knowledge, or the barest of mathematics qualifications; and often they have no idea that statistics will form a large proportion of their degree (for example, statistics can make up to 10% of the final grade of a psychology BA). Statistics are usually presented in terms of tests or formulae to learn, and tutors move through them getting more complex as they go. Students therefore see statistics as a hierarchy, and often mistakenly believe that the more complicated tests are ‘better’, rather than realising different datum require specific tests. On one occasion I assisted a statistics lecturer who, in the first class of the first year introduced Analysis of Variance, and also a ‘quiz’ where students were asked to define terms such as ‘confidence intervals’, and ‘IQR’ (interquartile range – he left it as an acronym just for ‘fun’). I spent one of these classes in the bathroom with a student whilst she was sick, and cried that she wanted to go home. I felt much the same. Frequently statistics courses are not well planned, are passed down from one tutor to the next, and may be taught by someone who is excellent at data analysis, but cannot communicate this, particularly to a fearful or advanced student. We can improve the way statistics are taught to non-statisticians by starting at a basic level, identifying student needs, and training lecturers to
Radical Statistics Issue 87
21
communicate complicated issues to a diverse group (Roback, 2003). Streaming of students, or offering statistics clinics for those who are struggling may help.
Where do statistics classes go wrong? Statistics classes frequently don’t work effectively because they are pitched at a level too advanced for some students (Roback, 2003). Students’ skills are frequently not assessed prior to teaching, and often classes proceed at the rate set by the tutor. Those who find statistics easy can overshadow and intimidate slower students. Furthermore statistics are often taught in a vacuum. Students may not use worked examples (Moore, 1997), and focus more on memorising tests than being aware of the circumstances under which they should use them. I once talked to a mature student who had designed a highly complex questionnaire that required analysis with MANOVAs, regression, and factor analysis. This student struggled with basic level percentages. I asked why they had made the questionnaire so complex. Nobody had taught them to simplify their questionnaire (and therefore subsequent analysis). Another common error in the teaching of statistics is combining it with computer analysis packages (Monahan, 2004). Although learning analysis packages is vital, it may be more useful to learn about statistical tests, followed by different programmes to analyse data. On one course I observed, the tutor taught everything through Excel. The students were learning two tasks concurrently – a data management package, and statistics. By the end of the year, most were proficient in Excel. But if you asked them what test to use and when, they looked completely blank.
So what should we also be teaching? Statistics get a bad press, constructed as boring, difficult, or scary, often with introductory texts or even tutors playing on this fear. I don’t want to repeat this with a list of criticisms. The remainder of this essay will identify ways in which statistics can be taught more effectively, along with checklists and resources for tutors.
Radical Statistics Issue 87
22
It’s all Greek to me! (Statistics are like a foreign language) Students fare better if know when to use a test and how roughly to employ it. Evidence suggests that the metaphor of statistics as a language rather than ‘just being about maths’ (Martin, 2003) can reassure some students, as can approaching the teaching of statistics as one might a language course – with a focus on vocabulary and symbols instead of numbers (Rangecroft, 2002).
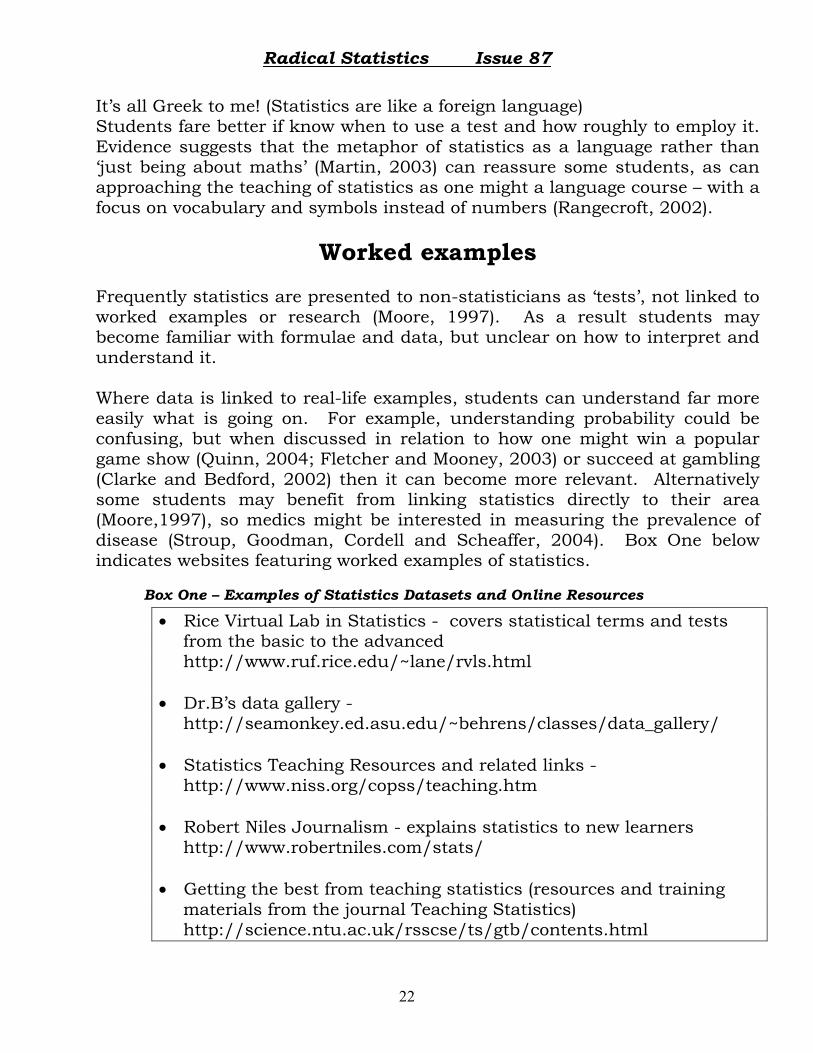
Worked examples Frequently statistics are presented to non-statisticians as ‘tests’, not linked to worked examples or research (Moore, 1997). As a result students may become familiar with formulae and data, but unclear on how to interpret and understand it. Where data is linked to real-life examples, students can understand far more easily what is going on. For example, understanding probability could be confusing, but when discussed in relation to how one might win a popular game show (Quinn, 2004; Fletcher and Mooney, 2003) or succeed at gambling (Clarke and Bedford, 2002) then it can become more relevant. Alternatively some students may benefit from linking statistics directly to their area (Moore,1997), so medics might be interested in measuring the prevalence of disease (Stroup, Goodman, Cordell and Scheaffer, 2004). Box One below indicates websites featuring worked examples of statistics.
Box One – Examples of Statistics Datasets and Online Resources
• Rice Virtual Lab in Statistics - covers statistical terms and tests from the basic to the advanced http://www.ruf.rice.edu/~lane/rvls.html
• Dr.B’s data gallery -
http://seamonkey.ed.asu.edu/~behrens/classes/data_gallery/ • Statistics Teaching Resources and related links -
http://www.niss.org/copss/teaching.htm • Robert Niles Journalism - explains statistics to new learners
http://www.robertniles.com/stats/ • Getting the best from teaching statistics (resources and training
materials from the journal Teaching Statistics) http://science.ntu.ac.uk/rsscse/ts/gtb/contents.html
Radical Statistics Issue 87
23
Matching methods to statistics To further encourage students to link statistics with methods (and to understand how their method choice and study design will influence later analysis), it is a useful idea to meld methods and statistics courses. I taught on one course where each week we taught a new method (e.g. observation, experimental designs) and the following statistics lecture taught a new form of analysis based on the data generated in the methods class. For example, in the observational study we asked students to note in a 20-minute period how many men checked out books from the university library compared to women. The students had generated the hypothesis that women would withdraw more books, based on their view women were ‘keener’. However, more men were found to check out books.
This permitted discussion of a wider range of issues – the ethics of research (was it okay to lurk in the library watching book withdrawals?), accuracy of measuring (were we really measuring gender?), and to consider confounding variables – for example students didn’t record when they’d completed their observations, which may have influenced outcomes, and many of them bumped into each other during the observation exercise meaning we had some repeated scores.
We found that completing exercises like this made statistics both more exciting and meaningful to the students, and they looked forward to see whether their hypotheses could be supported.
Data management The main reason why I felt compelled to write this essay, concerns data management, and how it is absent in many taught courses on statistics. The focus is on getting data and analysing it, but little attention is paid to managing it. Given that data management and entry is a core part of postgraduate research, and junior research positions in the health and social sciences, many are woefully ill prepared to cope. Statisticians may assume that how and when to enter data, how to code and what to record are routinely addressed, but these are mostly missed from courses. We need to ensure their importance in the curriculum is made clear. Again, this may be linked to non-statisticians teaching statistics, and that
Radical Statistics Issue 87
24
within the health and social sciences, many who teach statistics may not themselves have had great experience in handling large datasets, and may be unaware of the need to inform their students.
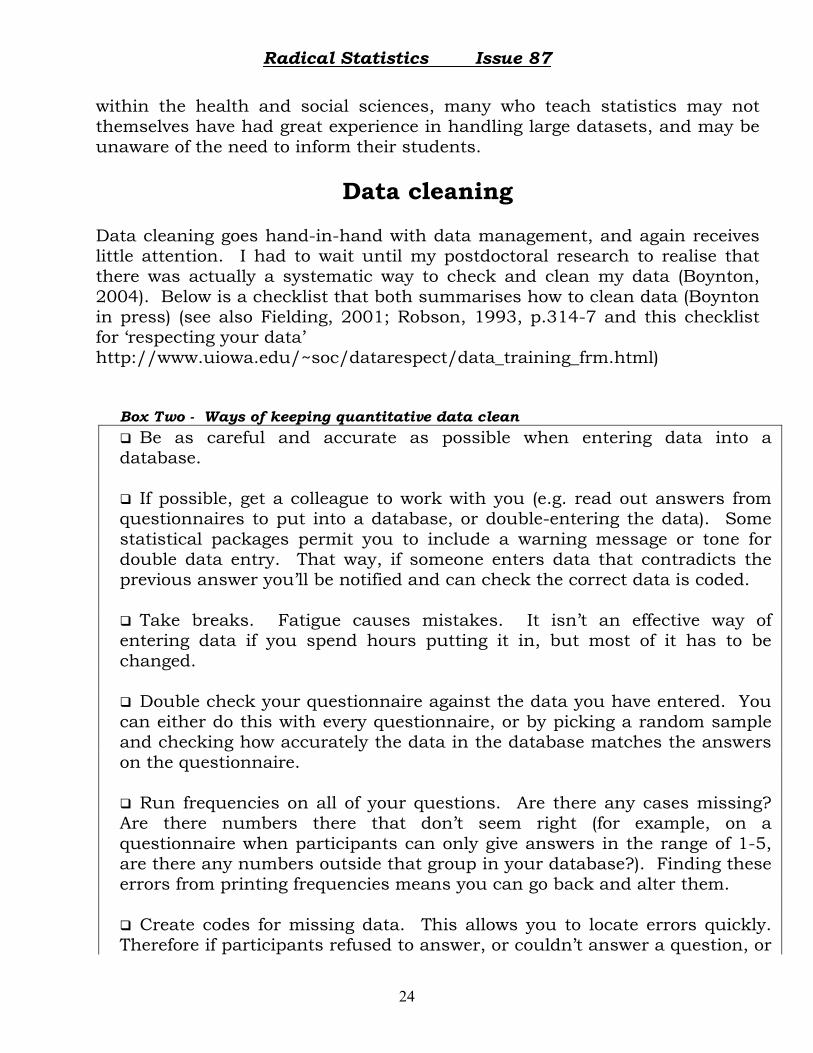
Data cleaning Data cleaning goes hand-in-hand with data management, and again receives little attention. I had to wait until my postdoctoral research to realise that there was actually a systematic way to check and clean my data (Boynton, 2004). Below is a checklist that both summarises how to clean data (Boynton in press) (see also Fielding, 2001; Robson, 1993, p.314-7 and this checklist for ‘respecting your data’ http://www.uiowa.edu/~soc/datarespect/data_training_frm.html)
Box Two - Ways of keeping quantitative data clean Be as careful and accurate as possible when entering data into a
database.
If possible, get a colleague to work with you (e.g. read out answers from questionnaires to put into a database, or double-entering the data). Some statistical packages permit you to include a warning message or tone for double data entry. That way, if someone enters data that contradicts the previous answer you’ll be notified and can check the correct data is coded.
Take breaks. Fatigue causes mistakes. It isn’t an effective way of entering data if you spend hours putting it in, but most of it has to be changed.
Double check your questionnaire against the data you have entered. You can either do this with every questionnaire, or by picking a random sample and checking how accurately the data in the database matches the answers on the questionnaire.
Run frequencies on all of your questions. Are there any cases missing? Are there numbers there that don’t seem right (for example, on a questionnaire when participants can only give answers in the range of 1-5, are there any numbers outside that group in your database?). Finding these errors from printing frequencies means you can go back and alter them.
Create codes for missing data. This allows you to locate errors quickly. Therefore if participants refused to answer, or couldn’t answer a question, or
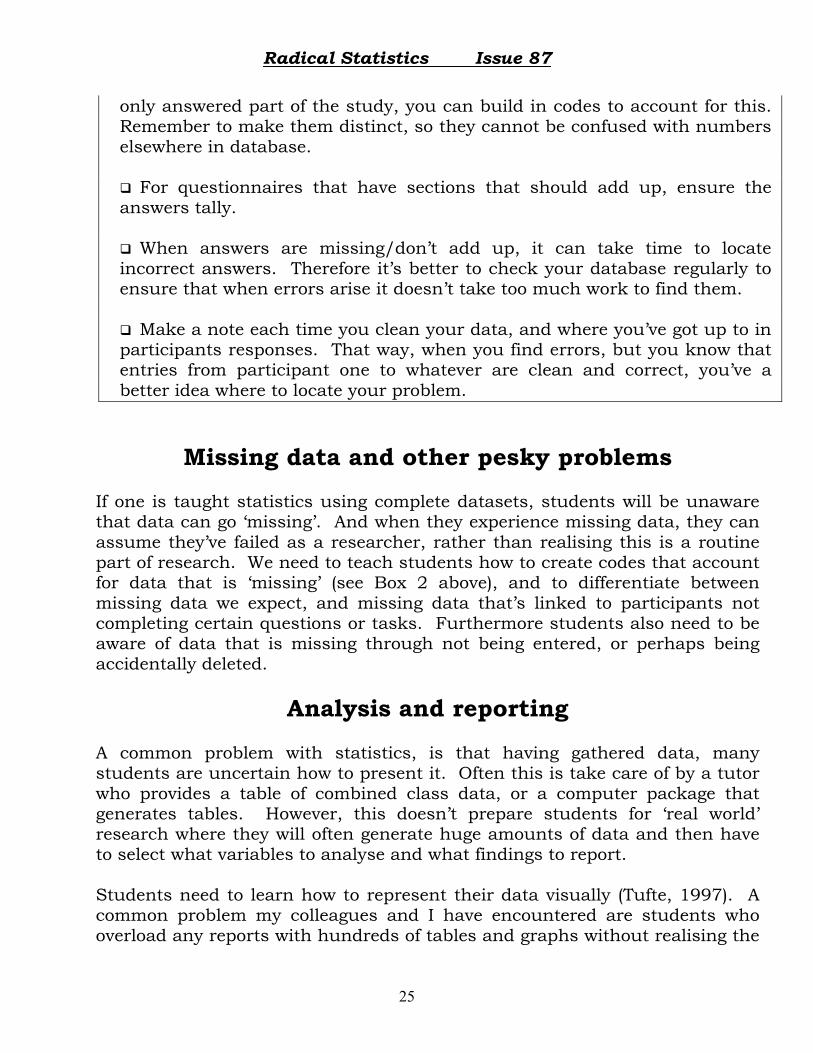
Radical Statistics Issue 87
25
only answered part of the study, you can build in codes to account for this. Remember to make them distinct, so they cannot be confused with numbers elsewhere in database.
For questionnaires that have sections that should add up, ensure the answers tally.
When answers are missing/don’t add up, it can take time to locate incorrect answers. Therefore it’s better to check your database regularly to ensure that when errors arise it doesn’t take too much work to find them.
Make a note each time you clean your data, and where you’ve got up to in participants responses. That way, when you find errors, but you know that entries from participant one to whatever are clean and correct, you’ve a better idea where to locate your problem.
Missing data and other pesky problems If one is taught statistics using complete datasets, students will be unaware that data can go ‘missing’. And when they experience missing data, they can assume they’ve failed as a researcher, rather than realising this is a routine part of research. We need to teach students how to create codes that account for data that is ‘missing’ (see Box 2 above), and to differentiate between missing data we expect, and missing data that’s linked to participants not completing certain questions or tasks. Furthermore students also need to be aware of data that is missing through not being entered, or perhaps being accidentally deleted.
Analysis and reporting
A common problem with statistics, is that having gathered data, many students are uncertain how to present it. Often this is take care of by a tutor who provides a table of combined class data, or a computer package that generates tables. However, this doesn’t prepare students for ‘real world’ research where they will often generate huge amounts of data and then have to select what variables to analyse and what findings to report. Students need to learn how to represent their data visually (Tufte, 1997). A common problem my colleagues and I have encountered are students who overload any reports with hundreds of tables and graphs without realising the
Radical Statistics Issue 87
26
importance of using the correct format to suit the data (Tufte, 1997). And mundane issues like labelling axis, or giving graphs or charts relevant titles may be overlooked. These problems can be addressed by asking students to critically evaluate papers (Greenhalgh, 2001). Reading results sections and finding they’re not correct, or that a graph or table is misleading can build student confidence as well as making statistics easier to follow. Directing students to consider participants, sample sizes, what was reported – and perhaps what is missing can all increase their awareness of what should be in their own research. Finally, asking students to read the results section of a paper first, and to then try and explain what they think the research was about, before checking it against the remainder of the paper can highlight where students struggle with understanding statistical concepts, and overcome the student habit of avoiding the results section completely!
Statistics can be fun Many of us learn statistics as a chore, or something to pass an exam. We may graduate to see it as a means of explaining our research data, but statistics is rarely presented as something enjoyable (Schafer and Ramsey, 2003). This essay has already referenced some techniques to make statistics more meaningful or entertaining (see also Lesser, 2001; Murrell, 2001; Nordmoe, 2004). Yet many of these papers or educational sites may not be known to non-statisticians, and tutors are often overworked, junior staff who may not have the time to read up on trendy new ways to talk about stats. We need to ensure those teaching statistics are given resources and ideas to help them. As well as thinking of fun ways to apply statistics, or making analysis directly relevant to the person, other possibilities include: Competitions – I taught a group of nervous adult learners who lacked statistical skills so we had a weekly contest – to find the most inaccessible explanation of a statistical concept. They unearthed incomprehensible, tautological explanations that made us all laugh, and reassured them they weren’t ignorant, but the definitions were flawed. Play – a colleague found that a simple reward of chocolate motivated students. She asked students to pick three chocolates from a tin of Quality Street and used this to rank which chocolates were the most popular choice. It also generated new hypothesis (e.g. do mature students prefer softer centres?)
Radical Statistics Issue 87
27
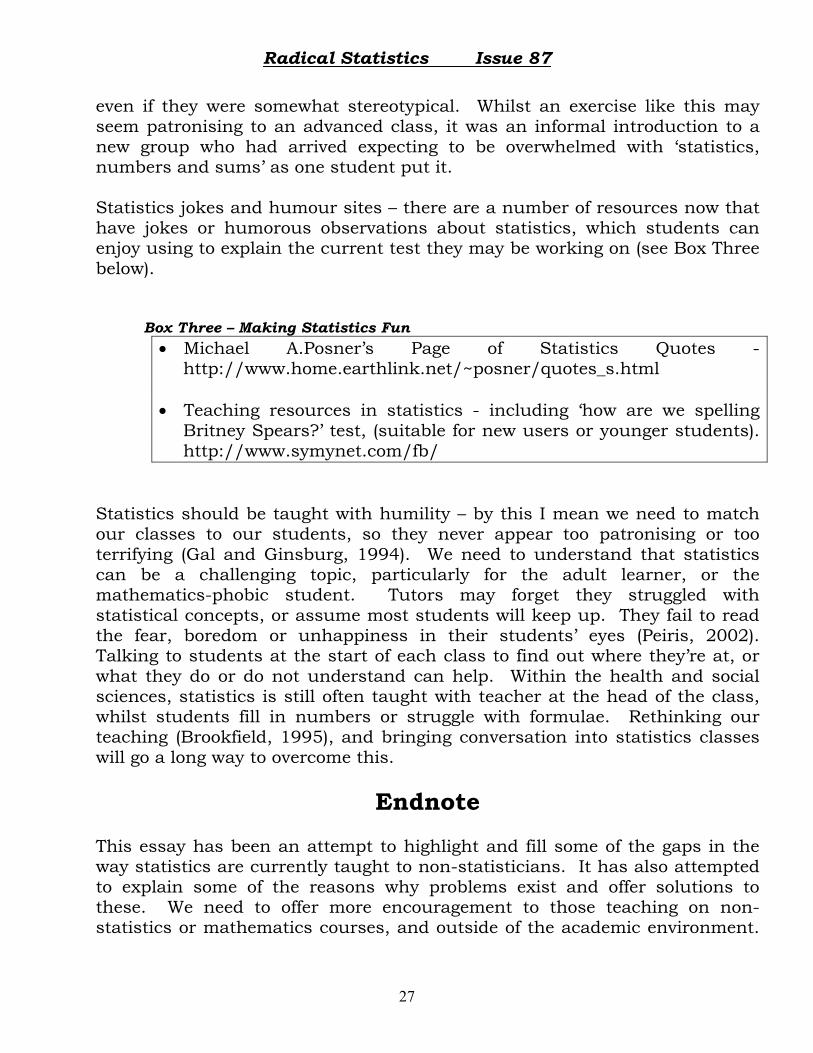
even if they were somewhat stereotypical. Whilst an exercise like this may seem patronising to an advanced class, it was an informal introduction to a new group who had arrived expecting to be overwhelmed with ‘statistics, numbers and sums’ as one student put it. Statistics jokes and humour sites – there are a number of resources now that have jokes or humorous observations about statistics, which students can enjoy using to explain the current test they may be working on (see Box Three below).
Box Three – Making Statistics Fun • Michael A.Posner’s Page of Statistics Quotes -
http://www.home.earthlink.net/~posner/quotes_s.html • Teaching resources in statistics - including ‘how are we spelling
Britney Spears?’ test, (suitable for new users or younger students). http://www.symynet.com/fb/
Statistics should be taught with humility – by this I mean we need to match our classes to our students, so they never appear too patronising or too terrifying (Gal and Ginsburg, 1994). We need to understand that statistics can be a challenging topic, particularly for the adult learner, or the mathematics-phobic student. Tutors may forget they struggled with statistical concepts, or assume most students will keep up. They fail to read the fear, boredom or unhappiness in their students’ eyes (Peiris, 2002). Talking to students at the start of each class to find out where they’re at, or what they do or do not understand can help. Within the health and social sciences, statistics is still often taught with teacher at the head of the class, whilst students fill in numbers or struggle with formulae. Rethinking our teaching (Brookfield, 1995), and bringing conversation into statistics classes will go a long way to overcome this.
Endnote This essay has been an attempt to highlight and fill some of the gaps in the way statistics are currently taught to non-statisticians. It has also attempted to explain some of the reasons why problems exist and offer solutions to these. We need to offer more encouragement to those teaching on non-statistics or mathematics courses, and outside of the academic environment.
Radical Statistics Issue 87
28
We also need to place more value on these topics and integrate them into research more thoroughly. In so doing we’ll be in a better place to train our students, many of whom may end up working in social or health projects where good statistical awareness isn’t just desirable, it’s vital.
References Boynton,P.M. (in press) The research companion: a guide to good practice in the social and health sciences. Psychology Press. Boynton,P.M. (2004) Your data – first things first. The Psychologist. 17 (3) p.151. Brookfield,S.D. (1995) Becoming a critically reflexive teacher. Jossey Bass, San Francisco. Clarke,R.S. and Bedford,A.B. (2002) Statistics Going to the Dogs. Teaching Statistics. 24 (1) ps: 6-9. Cobb,G. and Moore,D.S. (1997) Mathematics, statistics and teaching. The American Mathematical Monthly. 104 ps:801-23. Edirisooriya,G. (2003) The Gourmet Guide to Statistics: For an instructional strategy that makes teaching and learning statistics a piece of cake. Teaching Statistics. 25 (1) ps:2-5. Fielding,J. (2001) Coding and managing data in Researching Social Life (2nd Edition) Gilbert,N (ed) Sage. Thousand Oaks, London and New Delhi. Fletcher,M. and Mooney,C. (2003) The Weakest Link. Teaching Statistics. 25 (2) ps:54-5. Gal,I. and Ginsburg,L. (1994) The role of beliefs and attitudes in learning statistics: towards an assessment framework. Journal of Statistics Education 2 (2) www.amstat.org/publications/jse/v2n2/gal.html. Greenhalgh,T. (2001) How to read a paper, the basics of evidence based medicine. BMJ Books, London. Lesser,L.M. (2001) Musical Means: Using Songs in Teaching Statistics. Teaching Statistics. 23 (3) ps:81-5.
Radical Statistics Issue 87
29
Martin,M.A. (2003) “It’s like...you know”: The use of analogies and heuristics in teaching introductory statistical methods. Journal of Statistics Education. 11 (2) www.amstat.org/publications/jse/v11n2/martin.html. Monahan,J. (2004) Teaching statistical computation at a North Carolina State University. The American Statistician. 58 (10) ps:6-8. Moore,D.S. (1997) Statistics, concepts and controversies. (4th Edition) W.H. Freeman and Co, New York. Murrell,P. (2001) Beer Tasting and the Problem of Coincidences. Teaching Statistics. 23 (3) 94-6. Nordmoe,E.D. (2004) Of Poohsticks and p-Values: Hypothesis Testing in the Hundred Acre Wood. Teaching Statistics. 26 (2) ps:56-8. Peiris,M.S. (2002) A way of teaching statistics: an approach to flexible learning. CAL-laborate 9. http://science.uniserve.edu.au.pubs/callab/vol9/peiris.html Quinn,R.J. (2003) Exploring the probabilities for ‘Who wants to be a Millionaire?’ Teaching Statistics. 25 (3) ps:81-4. Rangecroft,M. (2002) The Language of Statistics. Teaching Statistics. 24 (2) ps:34-7. Roback,P.J. (2003) Teaching an advanced methods course to a mixed audience. Journal of Statistics Education. 11 (2) www.amstat.org/publications/jse/v11n2/roback.html. Robson,C. (1993) Real World Research: a resource for social scientists and practitioner-researchers. Blackwell Worldwide. Schafer,D.W. and Ramsey,F.L. (2003) Teaching the craft of data analysis. Journal of Statistics Education. 11 (1) www.amstat.org/publications/jse/v11n1/schafer.html. Stroup,D.F., Goodman,R.A., Cordell,R and Scheaffer.R. (2004) Teaching Statistical Principles Using Epidemiology: Measuring the Health of Populations. The American Statistician. 58 (1) ps:77-84.
Radical Statistics Issue 87
30
Tufte,E.R. (1997) Visual Explanations. Graphics Press. Cheshire. Wakeford,R.E. (1980) Report: Association for the Study of Medical Education – statistics in medicine. Medical Education. 14 ps:73-9. Petra M Boynton Lecturer in Health Services Research Department Primary Care and Population Sciences, UCL. Open Learning Unit, Archway Campus 4th Floor, Holborn Union Building, Highgate Hill London, N19 5LW. [email protected]


