Embed Size (px)
Citation preview
Taxes, Keiretsu Affiliation, and Income Shifting
Jeffrey D. Gramlich,* Piman Limpaphayom,+ and S. Ghon Rhee#
* University of Hawai�i and University of Michigan (visiting)+ Asian University of Science and Technology (Thailand)# University of Hawai�i
Key words: keiretsu, income shifting, marginal tax rateJEL Classification: G32
__________________________________________________________________* We are grateful to Kathy Dewenter, Amy Dunbar, James Hodder, Jun-Koo Kang, JasonLee, Thomas Matthews, Lil Mills, D.J. Nanda, Kaye Newberry, Frank Packer, Tom Scott,Terry Shevlin, Juro Teranishi, Jake Thomas, Masahiro Yoshikawa, and workshopparticipants at National Chung-Cheng University, Seoul National University, University ofAlberta, University of Michigan, and University of Rhode Island and the 2001 University ofIllinois Tax Research Symposium for their comments.

Abstract
This paper provides evidence that keiretsu group member firms are subject to lower
effective tax rates than independent firms in Japan. As one explanation for this phenomenon, we
develop a hypothesis that keiretsu firms engage in income-shifting activities to reduce overall
effective tax rates. Empirical evidence supports this income-shifting hypothesis since the positive
relationship between pretax return on firm value and marginal tax rate status is significantly
mitigated by keiretsu membership. Further, it appears that keiretsu income-shifting activities
intensify when Japanese firms face economic recession, contrasting conjecture of weakening
strength of keiretsu affiliation during this period.
1
Taxes, Keiretsu Affiliation, and Income Shifting
1. Introduction
This paper examines the effects of taxes and keiretsu affiliation on income-shifting among
Japanese firms. Prior tax research has focused primarily on shifting income between jurisdictions
rather than between differentially taxed entities within the same jurisdiction (for examples, refer to
Mills and Newberry 2001, Newberry and Dhaliwal 2001, and Collins et al. 1998).1 But advisory
materials are replete with planning suggestions for shifting income between entities that face
different tax rates (see, for example, Scholes et al. 2002). In this paper, we investigate the extent
that, relative to independent firms, keiretsu members capitalize on their affiliations by shifting
income among group members to lower their effective tax rates.
The keiretsu business form represents a significant portion of one of the world�s major
economies. Viewed as a formidable barrier to entry into the Japanese market, keiretsu members
benefit from distribution and production arrangements, dominant access to markets, and low-cost
flexible financing. In fiscal year 1997 (the final year of our 21-year study period), a total of 1,245
companies belong to six keiretsu groups under study, with the combined paid-in capital accounting
for approximately 20 percent of the total amount for Japan. Keiretsu annual sales account for over
17 percent of total sales in Japan, while their combined profits are 8.4 percent of the total profits of
Japanese corporations.2 A large number of empirical studies investigate the financial benefits of
keiretsu group affiliation, though we believe this paper is the first to investigate the tax savings of
1 A recent notable exception is Yetman�s (2001) study of nonprofit organizations� allocation of expenses betweentaxable and tax-exempt activities. Yetman finds evidence that medical and educational nonprofit groups are more likelythan charitable organizations to allocate nonprofit expenses to taxable activities.
2 These figures pertain to the six major horizontal keiretsu that are the subjects of this study. They consist of Mitsui,Mitsubishi, Sumitomo, Fuji, Sanwa, and Dai-ichi Kangyo, most of which have their origins in the 1950s (Nakatani 1984).The Tokyo Stock Exchange (TSE) lists approximately 250 core members and 280 other related firms (Dodwell MarketingConsultants 1985, 1989, 1995). Throughout the paper, the term �keiretsu� refers to these horizontal groups, leaving thestudy of income shifting within vertical keiretsu groups for future research.
2
keiretsu membership and, specifically, the possible shifting of income among affiliates to reduce
overall effective tax rates.3
The existence of important keiretsu groups, with firms organizing around a main bank and
related financial institutions, provides a unique setting for testing the effect of corporate group
affiliation on the propensity to shift income between taxpayers for tax-mitigating purposes. Given
that keiretsu firms are subject to lower effective tax rates than independent firms, we hypothesize
that income-shifting is one reason for this observation. To provide evidence in support of our
hypothesis, we examine the interactive effect of keiretsu membership and a marginal tax rate
proxy on pretax return on firm value.4 Compared with independent firms, keiretsu firms' pretax
return on firm value is inversely related to the marginal tax rate proxy. The evidence is robust to
alternative variable definitions, model specifications, and time periods.
Our empirical evidence has strong policy implications. Most important, the evidence
suggests that unbridled tax incentives for income shifting impair the relevance and reliability of
Japanese financial statements. Without fully understanding a firm�s tax situation and its income-
shifting capability and willingness, users of keiretsu financial reports face difficulty in assessing
corporate performance. Both cross-sectional and cross-temporal comparisons are problematic.
The challenge is particularly acute among the Presidents� Council members within each of keiretsu
groups; they exhibit more income-shifting behavior than other keiretsu members. Interestingly, the
evidence of income-shifting increases in intensity through Japan�s economic recession of the
1990s. This final observation may seem counter-intuitive because the Japanese government has
been tightening its regulatory grip over keiretsu firms through its Fair Trade Commission�s anti-
monopoly policies. Further, ad hoc evidence suggests that keiretsu affiliations have been
3 Recent examples of this research include Dewenter (2001), Jo et al. (2001), Guo et al. (2001), Anderson and Makhija(1999), Namiki (1999), Oliver (1999), Beason (1998), Dewenter and Warther (1998), and Kim and Limpaphayom (1998).More directly applicable research is described in the next section.
4 For this purpose, firm value is the sum of the book value of outstanding liabilities and the market value of outstandingequity. This deflator is used to avoid the bias that would potentially be caused by deflating with total assets that aremeasured under notoriously conservative accounting methods. In Section 4.4 we report that the results are not sensitiveto this choice of deflator.
3
weakening as the economic recession has deepened in the 1990s.5 However, keiretsu firms may
have capitalized on the recession�s effects (i.e., corporate losses) by engaging in income-shifting
activities to reduce overall keiretsu effective tax rates. We also conjecture that prior to the
recession the Japanese government generously distributed special tax breaks to keiretsu-affiliated
companies but these allowances began to disappear with the introduction of a broader-base,
lower-rate corporate tax system in 1990 (Ishi 1993). With special tax breaks having disappeared
and effective tax rates rising, keiretsu firms appear to have used their affiliations to capitalize on
the recession�s losses by shifting income among keiretsu members.
The remainder of the paper is organized as follows. We develop the income-shifting
hypothesis within keiretsu groups in Section 2. In Section 3 we illustrate relative tax burdens of
keiretsu group members and independent firms using an effective tax rate measure. We test the
income-shifting hypothesis in Section 4 with a multiple regression approach that explains pretax
return on firm value using keiretsu affiliation, a marginal tax rate proxy, and several control
variables. Summary and conclusions are offered in the final section.
2. Income-Shifting within Keiretsu Groups
Keiretsu or industrial groupings represent diversified groups of manufacturing and trading
firms that share the same financial institutions and adopt homogenous business strategies.
Keiretsu members usually come from a variety of industries, and they are linked through various
relationships, including cross-ownership, mutual appointment of officers and directors, intra-group
financing, and formation of presidential councils. Beyond extensive cross-shareholdings within the
keiretsu group, the most distinctive institutional feature is the main bank relationship (Miyashita
and Russell 1994). Serving as the central unit of each keiretsu group, the main bank acts as a
major lender as well as a major shareholder of its respective group members (Berglöf and Perotti
1994). At the end of fiscal year 1997, banks owned approximately 15 percent of listed non-
5 See Dvorak, Guth, Singer, and Zaun (2001) and Abrahams and Tett (1999) for articles discussing the possible recentdisintegration of the keiretsu system.
4
financial companies while listed companies held over 40 percent of banking shares, which
compares with 16.5 percent and 45 percent, respectively in 1990 (Brown & Company Ltd. 1999).
This ownership structure also enables main banks to assign personnel to top managerial positions
of member companies, which, in turn, allows the banks to exercise power as both lenders and
shareholders.6
Financial economists have documented a number of advantages of belonging to a keiretsu
group.7 For instance, keiretsu membership reduces the cost of financial distress (Suzuki and
Wright 1985; Hoshi et al. 1990). In addition, the keiretsu governance structure resolves agency
problems by reducing information asymmetry (Prowse 1990, 1992; Hoshi et al. 1991), and
provides effective monitoring over top management (Berglöf and Perotti 1994; Kaplan 1994;
Kaplan and Minton 1994). Consequently, keiretsu companies maintain higher financial leverage
than independent firms (Hodder and Tschoegl 1985) and firm diversification is more valuable to
keiretsu firms than to independent firms (Guo et al. 2001). At the same time, keiretsu firms�
investment decisions are less constrained by liquidity issues (Hoshi et. al. 1991), and keiretsu
membership has been observed to substantially reduce bankruptcy costs (Hoshi et al. 1990).8
Kester (1991) argues that business/trading relationships among keiretsu companies are as
important as financial relationships between banks and keiretsu members. In fact, cross-
6 A number of independent firms also maintain a primary bank relationship and borrow from one of six major city banks(Campbell and Hamao 1994; Horiuchi and Okazaki 1992). However, the corporate governance systems of independentfirms are completely different from, and much less complex than, those of keiretsu firms that have intense interactionsamong numerous constituents (Gilson and Roe 1993; Prowse 1992; Sheard 1989). Therefore, it is only in keiretsugroups where main banks share the benefits of affiliation with their members.
7 Some pessimistic views on this point, however, have been expressed in prior studies. For example, Beason (1998)concludes that the capital market behavior of keiretsu and independent firms� securities, as measured by equity pricevolatility, does not appear to systematically differ. The apparent lack of different capital market behavior implies that thedistinction between the two groups may be operationally meaningless in terms of the fundamental behavior of Japanesefirms.
8 Alternative interpretations of the literature cast a more critical view of the keiretsu financial system. It has beensuggested that Jensen�s (1986, 1989) value-destroying hypothesis, in which managers who control free cash flow arepredicted to manage it inefficiently, is consistent with this view. In addition, a number of studies suggest that close bankrelationships lead to lower growth and profitability (see, for example, Lincoln et al. 1993). Because of their fundamentalinterest in securing payment of principal and interest, banks may prevent firms from investing in risky but profitableprojects. Keiretsu affiliation also allows banks to charge relatively higher interest rates in exchange for readily accessiblebank loans (Weinstein and Yafeh 1998).
5
shareholding among member firms fosters mutual monitoring and information sharing among
corporate members (Gilson and Roe 1993).
With a focus on overall keiretsu wealth rather than on each firm�s bottom line, keiretsu
members have incentives to mitigate the organization�s overall tax liability. As in the United States,
except for the limited availability of loss carryovers, profitable firms pay tax while unprofitable firms
do not receive tax rebates.9 Thus, when two or more related companies act in concert they can
mitigate their overall tax liability by shifting income from a profitable firm to a loss firm. We borrow
a concept introduced by Harris et al. (1993) and Harris (1993) to suggest that keiretsu
membership affords firms flexibility (i.e. less �frictions�) in reducing their effective tax rates through
income shifting.10 These studies measure flexibility in terms of the level of expenses, relative to
total assets or sales, that represents operations that are apparently easy to shift across
jurisdictions (i.e., research and development, interest, advertising, and, in the Harris study, rent).
The cooperative nature of Japanese keiretsu firms provides a comparative measure of income-
shifting flexibility: whether the firm is a member of one of the six dominant keiretsu groups.
In the U.S. a tax-induced income-shifting scheme would be deemed improper by Internal
Revenue Code Section 482, which requires that transactions between related taxpayers be
recorded at arms� length prices. Japan has a similar law but it only applies to transactions between
Japanese companies and their overseas affiliates; transactions between domestic Japanese
9 See Shevlin (1990) for further discussion of the asymmetric treatment of income and loss and the estimation ofmarginal tax rates considering loss carryovers. Japanese corporate taxpayers that maintain certain accounting records(i.e., file �blue form� tax returns) are allowed to carry back losses to one preceding year [Article 81 of the CorporationTax Law] and carry forward income to five succeeding years [Article 57 of the Corporation Tax Law] (Kuboi 1991, p. 47).However, the one-year loss carryback rule was suspended between 1984 and 1988 and again between 1992 and 2000.Also, between 1986 and 1988 the loss carryforward rule required taxpayers to wait two years before offsetting currentincome with prior losses (Kuboi 1991, p. 34). Asymmetric taxation of gains and losses, combined with the limitedavailability of loss carryovers, explains some of the variation in effective tax rates across Japanese companies. Furthervariation in effective tax rates is due to the imposition of local income taxes that differ depending on prefecture andmunicipality (Kuboi 1991, pp. 44-45) and to the varying availability of tax-free reserves across firm size, industrymembership, and nature and amount of investment (Ishi 1993, pp. 201-203).
10 Refer to Scholes et al. (2002) for an explanation of the conceptual terms �frictions� and �restrictions.�
6
companies are specifically exempted from this legislation (Kuboi 1991, p. 86).11 Thus, the
Japanese government has apparently not exerted substantial effort to restrict income-shifting
schemes that reduce the overall tax burdens of cooperating firms.
In an early empirical study of tax-induced income shifting, Harris et al. (1993) find evidence
to support their hypothesis that firms transfer income to (from) the United States when their foreign
operations are located in countries with higher (lower) tax rates than in the United States. Harris
(1993) reports that US multinational companies shifted income into the United States following the
Tax Reform Act of 1986 when tax rates were cut substantially. Further, Harris finds that "flexible"
firms, those with substantial rent, interest, research and development, and advertising expenses,
react more quickly and completely than inflexible firms. Klassen et al. (1993) report evidence that
US multinational firms shift income around the world in response to both domestic and foreign tax
rate changes.
Jacob (1996) examines a sample of US firms to determine whether the magnitude of intra-
company cross-jurisdictional business is positively related to the propensity to shift income among
corporate affiliates. Jacob's evidence supports the view that these firms shifted income through
transfer pricing. Collins et al. (1998) determine that income-shifting by US multinational firms
critically depends on the firm�s position with respect to the foreign tax credit limit. Designed to
prevent double taxation but insure at least one level of taxation, the foreign tax credit allows US
firms to receive a tax credit for foreign taxes paid on foreign income; the limitation prevents the
credit from exceeding the US tax on the foreign income. Because of the foreign tax credit limit,
firms with foreign income subject to higher foreign tax rates have a strong incentive to shift income
from high-tax jurisdictions to the United States. Collins et al. reveal evidence that US
multinational companies shifted between $34 and $40 billion of income to the US between 1984
and 1992 in response to cross-jurisdictional tax rate differences. Mills and Newberry (2001) find
similar evidence of tax-rate-sensitive income shifting behavior among foreign-controlled U.S.
11 The Special Taxation Measures Law became effective on April 1, 1986.
7
corporations. In an effort to explain how firms shift income across jurisdictions, Newberry and
Dhaliwal (2001) show that firms� debt location decisions are one vehicle for reducing world-wide
tax burden.
In spite of the incentives and the perceived flexibility for keiretsu firms to reduce their
combined tax liabilities through income-shifting techniques, frictions might prevent this from
happening on a widespread basis. Income-shifting involves a transfer of wealth (or at least the
right to wealth) between two legal entities. To the extent that these firms are owned by different
sets of shareholders, some of the different shareholders will benefit from the income shift while
others will be harmed. Further, management performance evaluation is complicated by tax-
induced income-shifting and keiretsu affiliations may be forced to create costly logistical
mechanisms, including special accounting and dividend systems.12
In summary, keiretsu member firms have strong incentives to shift income for tax purposes
and they possess the flexibility to shift income through intra-keiretsu trade involving transfer prices.
Building on previous income-shifting research that pertains primarily to multinational American
firms operating in different tax jurisdictions, this study provides evidence supporting the view that
keiretsu member companies shift income among themselves to reduce the overall tax burden
facing the keiretsu. In the next section we present effective tax rates and other descriptive
statistics for the sample.
12 Later, in the sensitivity analysis portion of the empirical results, we examine evidence concerning the possibility thatshifted income is returned to the transferor via dividend payments. In Japan, an 80-percent (100-percent) dividendsreceived deduction is available to offset dividends received from domestic corporations for which the recipient owns 25percent or less (more than 25 percent). For further information, see Japanese Ministry of Finance (1999) and DeloitteTouche Tohmatsu International (1996).
8
3. Relative Tax Burdens of Keiretsu and Independent Firms
The sample employed in this study contains all non-financial and non-utility firms listed on
the Tokyo Stock Exchange for which data is available during the 21-year period from 1977-
1997.13 Financial statement data are retrieved from the PACAP database� compiled by the
Sandra Ann Morsilli Pacific-Basin Capital Markets (PACAP) Research Center at the University of
Rhode Island, in collaboration with the Daiwa Institute of Research and Toyo Keizai Inc.
3.1 Descriptive Statistics of Sample Firms
We classify sample firms into two categories, keiretsu member firms and independent
firms, based on the information in Industrial Groupings in Japan published by Dodwell Marketing
Consultants (1985, 1989, 1995) and Brown & Company Ltd (1999). Independent firms are those
not identified as members of one of the six largest horizontal keiretsu groups. We further organize
keiretsu firms into two subgroups, strong ties and weak ties, based on the degree of affiliation
intensity reported in Industrial Groupings in Japan. Dodwell Marketing Consultants and Brown &
Company, Ltd. use both qualitative and quantitative factors in measuring the degree of affiliation
intensity. Those factors include: historical background; share ownership; sources and amounts of
main bank loans; appointment of board directors; overall inter-company relations, etc. It appears,
however, the total number of shares held by the top ten shareholders is the most important
variable considered. Industrial Groupings in Japan assigns a four-star rating to nucleus
companies, a three-star rating to companies with group shareholding (by the ten largest
shareholders) greater than 50 percent; a two-star rating to companies with group shareholding
between 30 and 50 percent; and a one-star rating to companies with group shareholding of less
than 30 percent. Based on this information, we classify keiretsu firms with three- and four-star
ratings as having strong ties to the keiretsu group and companies with one- and two-star ratings
as indicating weak ties to the group.
13 Banks, insurance companies, and securities firms are excluded, but a small portion of the sample relates to certainfinancial companies that do not fall into one of these three categories.
9
Descriptive statistics are computed for the 21-year study period (1977-1997) as well as two
subperiods: 1977-1989 and 1990-1997. Beginning in 1990, Japan�s economy experienced a
decade-long economic recession. Relative to the recession period, the first subperiod is
characterized by robust economic growth and expansion in Japan. Two important developments
occurred toward the end of the first subperiod: the amendment to the Anti-Monopoly Act became
effective in 1987 and the Tax Reform Law of 1988 was enacted.14,15 The year 1990 marks the
beginning of a gradual weakening of keiretsu group affiliations as the Anti-Monopoly Act became a
driving force for changes in Japanese industrial organization and as other reform measures were
enforced in the Japanese banking and corporate sectors.
Table 1 summarizes cross-sectional mean and median statistics for gross profit measure,
pre-tax return, after-tax operating return, tax expense, financial leverage, firm value, and total
assets. Pre-tax return, after-tax operating return, and tax expense are shown relative to firm value,
which is defined as the sum of the market value of outstanding equity plus the book value of total
liabilities for all sample firms. Gross profit measure is the ratio of gross profits to sales. Financial
leverage is the ratio of total liabilities to firm value. The sample firms are grouped into keiretsu
firms, either strong-tie or weak-tie, and independent firms.16 Results of statistical tests of the
differences between each of the keiretsu groups and the independent firms are presented. Panel
A conveys this information for the whole 21-year period encompassing the years 1977 through
14 The first set of amendments to the Anti-Monopoly Act passed the Japanese Diet in 1977. The amendments wereintended to strengthen the original Act and to empower the FTC. Based on the amendments, for example, the FTC hasthe authority to impose a surcharge on a company involved in an illegal cartel and to order such corporations to divestthemselves of parts of their business. Most importantly, the amendments reduce the proportion of a company that canbe owned by a financial institution from 10 percent to 5 percent and impose new limits on cross-shareholding. Most ofthe provisions of the amendments became effective in 1987.
15 The Tax Reform Law of 1988 became fully effective in 1989, reducing the corporate tax rate and, more importantly,eliminating many special tax breaks previously available to corporations (Ishi 1993).
16 These descriptive statistics represent a somewhat smaller sample than the total of 30,234 firms-years used in theregression results because data requirements for the effective tax rate measure are not necessary for the regressionanalysis.
10
1997, Panel B shows the 1977 to 1989 pre-recession period, and Panel C reports the recession
period between 1990 and 1997.
[Insert Table 1]
Gross profit measure, pre-tax return on firm value and after-tax operating return on firm
value are all significantly lower among keiretsu firms than independent firms, and this difference
persists across both the pre-recession and recession periods (p<.0001). Strong-tie keiretsu firms
report lower profit measures than weak-tie keiretsu members, across the entire period as well as
each subperiod. Possible reasons for lower profitability among keiretsu firms include, among
others, market penetration objectives that dominate profit objectives, or a lack of financial
discipline on managers to provide the same return on investment required by managers of
independent firms. Consistent with lower profitability among keiretsu firms, tax expense relative to
firm value is lower for all keiretsu firms and the least for strong-tie keiretsu firms. From a macro-
economic point of view, both investors and the government reap smaller returns, per yen invested,
from keiretsu firms than from independent firms. One way to estimate the average keiretsu tax
advantage is to subtract the mean keiretsu tax rate on firm value, 0.012, from the independent firm
rate, 0.0157, and multiply the difference by the mean firm value of keiretsu firms, ¥300.3 billion.
This produces an estimated mean keiretsu annual tax savings of ¥1.11 billion or roughly $9.25
million.17 Financial leverage is consistently higher among keiretsu firms than independent firms
across the whole period as well as each of the two subperiods.
Keiretsu firms� mean firm value is nearly ¥21 billion larger (about 7 percent) than the mean
firm value of independent firms. Strong-tie keiretsu firms, with firm value averaging ¥395 billion
(approximately $3.3 billion) are more than twice as large as weak-tie keiretsu firms and nearly 42
percent larger than independent firms (see Panel A). Overall keiretsu mean pre- and after-tax
returns on firm value are 2.18 percent and 0.99 percent, respectively, compared with 2.75 percent
and 1.28 percent for independent firms across the whole period (Panel A). Keiretsu firms,
17 We use ¥120=$1 as a rough estimate of the exchange rate across the entire sample period.
11
particularly those with strong ties, are larger and less profitable than independent firms though
these differences dissipate sharply when the recession arrives.
Comparing the overall mean firm value, ¥285.9 billion, to the mean book value of total
assets, ¥196.2 billion, reveals that the ratio of the estimated market value of firm assets to the
balance sheet value of assets is 1.46. As expected, this ratio declined from 1.53 before the
Japanese stock market �bubble� burst in 1990 to 1.39 afterward (see Panels B and C).
3.2 Corporate Effective Tax Rates
Our initial objective is to understand the relative tax burdens facing keiretsu and
independent firms, and to see how these burdens differ across time, firm size, and industry. For
this purpose only, we examine effective tax rates on cash flows to avoid possible taint arising from
using income-shifted earnings in the denominator. The effective tax rate on cash flows is defined
as income tax divided by operating cash flow, where income tax is the sum of national tax (levied
by central government), enterprise tax (levied by the prefecture), and inhabitant tax (levied by both
prefectures and municipalities), and operating cash flow is the sum of net operating income, other
revenue/expense items, depreciation, prior-year current assets and current-year current liabilities,
minus the sum of current-year current assets and prior-year current liabilities. We retrieve tax data
from the PACAP-Japan Financial Statement file.18
Table 2 presents cross-sectional mean and median effective tax rates for keiretsu and
independent firms for the whole period as well as for the two subperiods.19 Effective tax rates for
keiretsu firms with strong and weak ties are also reported. Overall, there is strong evidence that
18 Unlike the United States where public companies report two different versions of profits, one for investors and one fortax authorities, in Japan during the study period, income for tax purposes is generally calculated based on theinformation included in published financial statements (Cooke and Kikuya 1992).
19 For the descriptive analysis relying upon the tax rate on cash flows (i.e., Tables 1 through 4), we exclude firmsreporting negative tax rates on cash flows. Negative tax rates indicate that either tax expense or cash flows is negative(but not both). When pre-tax cash flows are small, effective tax rates may become large. We decided to retain thoserates even if they become large: (i) to avoid imposing a subjective and arbitrary cut-off point; and (ii) to illustrate arealistic picture of tax burdens of sample firms. For this reason, comparisons of median effective tax rates are moreappropriate than means. Since we use a binomial marginal tax rate proxy in our empirical tests of the income-shiftinghypothesis, the use of effective tax rates for descriptive purposes does not bias our test results.
12
keiretsu firms have lower effective tax rates than independent firms. During the study period, the
median effective tax rate is 23.8 percent for keiretsu firms and 29.1 percent for independent firms
(p<.0001). During the pre-recession period, the difference between the two groups� median
effective tax rates is 5.7 percent (p<.0001) but this difference falls to 4.9 percent (p<.0001) in the
recession period. This implies erosion of the special tax breaks garnered by keiretsu firms in the
latter period following the complete introduction of tax reform measures in 1990.20
[Insert Table 2]
As expected, keiretsu firms with strong ties exhibit much lower median effective tax rates
than firms with weak ties [19.9 percent versus 28.1 percent] during the 21-year study period.
Across both subperiods, strong-tie keiretsu firms face lower effective tax rates than independent
firms. Not surprisingly, however, the differences between keiretsu firms with weak ties and
independent firms are not as pronounced as those between strong tie keiretsu firms and
independent firms.
3.3 Firm Size and Industry Effects
Zimmerman (1983) provides evidence that, relative to small firms, large U.S. firms incur
higher effective tax rates, and hypothesizes that this is due to higher political costs that large
companies may incur. Specifically, if keiretsu firms are, on average, smaller than independent
firms, it is possible that keiretsu firms� lower effective tax rates may be attributed to a difference in
firm size between keiretsu and independent firms. Panel A of Table 1 indicates that total assets
and firm value of keiretsu firms are greater than those reported by independent firms whereas the
market value of shareholders� equity is smaller for keiretsu firms than independent firms (not
reported).21 To examine the differences in effective tax rates between keiretsu and independent
20 As a precursor to later empirical evidence based on a marginal tax rate proxy, we note that the behavior of effectivetax rates may differ significantly from that of marginal tax rates. See Shevlin (1990) and Graham (1996a, 1996b) forfurther discussion of this issue.
21The average mean values of equity are ¥125.5 billion for keiretsu firms and ¥180.9 billion for independentfirms, respectively.
13
firms with the minimum possible confounding effect of firm size, all sample firms are ranked in
ascending order by firm value and then grouped into ten deciles (1st decile = smallest; 10th decile =
largest). We compute the mean and median effective tax rate, as well as the mean firm value, for
keiretsu and independent firms within each of the ten deciles.
Table 3 presents the results. Keiretsu firms exhibit lower mean and median effective tax
rates than independent firms throughout the whole period as well as during both subperiods, Firm
size differentials between keiretsu and independent firms are statistically insignificant in each of
the 10 decile columns with the exception of the 10th decile. Overall, median effective tax rates are
significantly lower for keiretsu firms across most size levels and, generally speaking, keiretsu and
independent firms are both fairly well dispersed across most of the size categories.
[Insert Table 3]
Industry effects may also explain differences in effective tax rates between keiretsu and
independent firms. Kern and Morris (1992) observe a strong association between effective tax
rates and industry classification using U.S. data. Thus, it may be plausible that keiretsu companies
are more clustered in certain industries where government tax subsidies and different forms of tax
breaks are readily available, which, in turn, could influence our results. Table 4 shows the average
effective tax rates of keiretsu and independent firms within major industries classified by Tokyo
Stock Exchange industry codes (similar to the four-digit standard industry classification). Effective
tax rates vary across industries, with food, wholesale and retail, construction, and service
industries exhibiting higher tax rates than others. Within each industry, however, keiretsu firms
exhibit lower effective tax rates than independent firms. Some exceptions are observed as
indicated by positive differences for some industries (e.g. real estate & financial and transportation,
communications, & utilities), but these differences are not statistically significant. In addition, the
notion that keiretsu companies may be concentrated more in low-tax industries than independent
firms is not supported by the results in Table 4. For example, keiretsu firms do not dominate the
low-tax industries such as real estate/financial, transportation, communications, utilities, and textile
14
industries. These findings indicate that industry effects alone cannot explain lower effective tax
rates observed for keiretsu firms. Overall, it does not appear that the keiretsu tax advantage is
explained by firm size or industry membership. The next section considers the possibility that
keiretsu firms use income-shifting as a vehicle for lowering effective tax rates.
[Insert Table 4]
4. Empirical Evidence on the Keiretsu Income-Shifting Hypothesis
4.1 Model
The effective tax rates portrayed in Tables 1-4 identify the overall tax burdens incurred by
different groups, but effective tax rates are not likely to be useful for estimating the tax cost of
earning additional income. For this, the marginal tax rate is appropriate as it is generally defined as
the change in the present value of cash paid to tax authorities as a result of earning one additional
currency unit (Scholes et al. 2002). In corporations, the primary issue in estimating marginal tax
rates is the valuation of the net operating loss (NOL) deduction (Shevlin 1999). Thus, the value of
the NOL depends on its magnitude, the amounts of current and future taxable income, the number
and timing of the years for which carryover is statutorily permitted, the tax rate in the year in which
the NOL deduction is used, and the cost of capital. Shevlin (1990) and Graham (1996a) simulate
future earnings streams in order to estimate corporate marginal tax rates. Although the evidence
indicates that these simulation procedures generally perform well, Graham (1996b) and Plesko
(2001) suggest that simple dummy variables reasonably capture much of the variation in corporate
marginal tax rate status.22
In place of the simulation procedure, Graham suggests employing a trichotomous variable
that differs depending on the value of the Compustat NOL variable that indicates whether the firm
possesses NOL carryforwards for tax purposes. Given the absence of the NOL carryforward data
22 Graham (1996b) finds that simulation results provide 87.6 percent correlation with tax rates based on perfectforesight. The correlation coefficient for the trichotomous variable is 69.1 percent and the correlation with a taxableincome dummy variable is 65.3 percent. Using tax return data, Plesko (2001) reports similar, though slightly lower,correlation coefficients for binary marginal tax rate indicator variables.
15
item on the PACAP database, we use a dummy variable approach in an attempt to model the
basic Japanese tax laws concerning loss carrybacks and carryforwards. Generally, Japanese
corporations can carry losses back one year and forward five to offset positive pretax income in
these other years (Ishi 1993 p. 179; Kuboi 1991 p. 34).23 Thus, firms are assumed to face positive
marginal tax rates in two cases: (1) if current pretax income is both greater than 0 and exceeds the
sum of net losses for the two preceding years (i.e., loss carryforward), and (2) if a pretax loss is
smaller than the prior year�s pretax income (i.e., loss carryback). However, between 1984 and
1988, and again between 1992 and 2000, loss carrybacks were not permitted in Japan (Ishi 1993
p. 179; Japanese Ministry of Finance 1999); during these years firms are assumed to face positive
marginal tax rates when pretax income exceeds zero. Regarding carryforwards, in 1986 and 1987
losses from the immediate preceding years could not be used to offset taxable income (i.e.,
corporate taxpayers were required to wait one year before utilizing an NOL carryforward) (Kuboi
1991, p. 34). Thus, we assume that firms face positive marginal tax rates in 1986 (1987) if positive
pretax income exceeds the sum of net losses for 1983 and 1984 (1984 and 1985).
An OLS multiple regression model is employed to examine the differential relation between
firm profitability and our marginal tax rate proxy given that firms are either independent or affiliated
with a keiretsu. This model is motivated by Collins et al. (1998) but adapted to capture the possible
differential behavior of keiretsu and independent firms. The underlying concept of the model is
straightforward: the relation between firm profitability and corporate marginal tax rate should be
positive. If keiretsu firms respond to taxes by shifting substantial income, we should be able to
capture this reaction with a dummy variable (signifying either keiretsu or independent firms)
interacting with the marginal tax rate proxy. We hypothesize that the coefficient estimated for the
interaction of tax rate and keiretsu membership in the regression will be negative, controlling for
the separate main effects of each of these variables. We employ the following model:
PTAXROVt,t = β0 + β1IPTAXROVi,t + β2Xi,t + β3Ki + β4(Ki*Xi,t) + β5SIZEi,t + + β6LEVERAGEi,t
23 We also perform the empirical tests modeling only the carryback rules and obtain results very similar to thosereported in Table 6.
16
+ β7INDi,1 +�..+ β34INDi,28 + β35YEAR1 +�..+ β54YEAR20 + εi,t (1)
for each firm i and year t. The dependent variable, PTAXROV, is the ratio of pretax income to firm
value (the sum of equity market value and debt book value); X is the binomial marginal tax rate
proxy (1 for firms facing positive marginal tax rates based on the assumptions described above; 0
otherwise); K is a dummy variable (1 for keiretsu firms; 0 for independent firms); SIZE is the
natural logarithm of the total market value of equity; LEVERAGE is the ratio of total liabilities to
firm value; IND is a vector of dummy variables for each of 28 industries (1 if the firm operates
primarily in the industry; 0 otherwise); YEAR is a vector of dummy variables signifying each of the
20 years between 1978 and 1997 (1 if the observation occurs within the year; 0 otherwise); and ε
is the residual term.
4.2 Descriptive Statistics of Key Variables
Table 5 presents descriptive statistics of key variables included in the regression model.
Panel A summarizes measures of central tendency and Panel B offers correlation coefficients
among the variables. In addition to PTAXROV, another profitability measure, the ratio of gross
profits to sales (GPPCT), is introduced in Table 5 because GPPCT is examined as an alternative
dependent variable in the sensitivity analysis. In general, Table 5 descriptive statistics confirm the
results reported in Table 1: independent firms are larger, more profitable, less financially levered,
and more likely to be subject to positive marginal tax than keiretsu firms. As reported in Panel B,
marginal tax status is positively related to both profitability measures, GPPCT and PTAXROV. Not
surprisingly, strong positive correlations are observed between two profitability measures,
PTAXROV and GPPCT as indicated by the Pearson and Spearman coefficients of 0.29 (p<.0001)
and 0.34 (p<.0001), respectively. Financial leverage is negatively correlated with marginal tax
status, firm size, and two profit measures. The relation between firm size and financial leverage
has not been clearly established. For example, Titman and Wessels (1988) report a positive
relation between size and debt-to-book value of equity but no significant relation between size and
17
debt-to-market value of equity. The negative correlation between financial leverage and profitability
measures is not surprising, but its magnitude is unexpectedly large.24
[Insert Table 5]
4.3 Regression Results
Panel A of Table 6 presents the regression results for the whole period (1977-1997), the
pre-recession period (1977-1989), and the recession period (1990-1997). The first column
presents the results for the whole period (1977-1997) and the last two columns summarize the
results for the two subperiods. In each column, regression results are reported for the entire
sample as well as separately for keiretsu firms with strong and weak ties.25 With adjusted R-
squares all exceeding .15 and highly significant F-statistics, the models provide strong
explanations of the variation in PTAXROV. The coefficient of LEVERAGE is highly significant and
negative in the whole period as well as in the two subperiods, indicating that high financial
leverage implies low profitability. Although conventional wisdom dictates that high profitability
should be associated with high risk (as well as high financial leverage as one of major
determinants of systematic risk), the large negative relation between firm profitability and financial
leverage is not surprising in view of the Japanese banking practices in the past.26 Traditionally,
Japanese banks continue to lend to their corporate customers even if borrowing firms suffer from
operating losses to avoid corporate bankruptcies.27 Only recently with severe economic recession,
Japanese banks attempt to minimize this type of relationship-based banking practices. The impact
24 We compute the correlations between financial leverage and PTAXROV for the population of U.S. Compustat activeindustrial companies for the years 1977 through 1997. Pearson and Spearman correlations are �0.063 and �0.064,respectively, which are much smaller in their magnitude than the counterpart figures estimated for our sample firms, -0.218 and �0.361 reported in Panel B. This preliminary evidence suggests that Japanese lenders are less concernedwith (or less successful in predicting) the future profitability of their debtors.
25 When regressions are run for strong-tie keiretsu firms, we made sure that weak-tie keiretsu firms are excluded.Thus, necessary contrast can be obtained between strong-tie firms and independent firms. Likewise, we excludedstrong-tie keiretsu firms from regressions for weak-tie keiretsu firms.
26 Refer to Mandelker and Rhee (1984) on the role of operating and financial leverage in determining a firm�ssystematic risk.
27 Horiuchi and Shimizu (1998) report that the issuance of a large amount of subordinated debt allowed the Japanesemajor banks to credit supply despite the severity of equity capital depletion in the 1980s and 1990s.
18
of firm size on firm profitability is significantly negative in the pre-recession period, while it
becomes insignificant in the recession period.
[Insert Table 6]
Controlling for industry median pre-tax return on firm value, industry, year, and size and
financial leverage effects, keiretsu firms exhibit tax-mitigating income-shifting behavior as indicated
by the whole-period negative coefficient of �0.0123 associated with the interaction term Ki*Xt
(p<.0001). This negative coefficient reveals evidence that keiretsu membership obscures the
positive relation between firm profitability and marginal tax status; it appears that keiretsu firms
facing positive marginal tax rates shift income to those facing non-positive marginal tax rates.
Keiretsu firms with strong ties and those with weak ties offer an interesting contrast. Apparent
income-shifting indicated by the estimated coefficient for the interaction term is more conspicuous
for keiretsu firms with strong ties.28
The results obtained for the two subperiod models are even more interesting. Overall, the
coefficient of the interaction term more than doubles in absolute magnitude in the recession period
(-0.0159, p<.0001), compared with the pre-recession period (-0.0078, p<.0001). Although the
significant negative coefficient estimated for strong-tie firms decreases from �0.0114 (p<.0001) to
�0.0186 (p<.0001) in the recession period (a 63% increase in absolute magnitude), the negative
coefficient of weak-tie keiretsu firms decreases from �0.0042 (insignificant) in the pre-recession
period to �0.0128 (p<.0001) during the recession, an increase of more than 204%. These results
indicate that income-shifting among keiretsu firms was formerly concentrated among those with
strong ties, and that income-shifting expands into weak-tie keiretsu firms during the recession.
Overall shifting becomes more intensive during the recession period than the pre-recession period.
The latter observation may appear counter-intuitive considering the overall trend of weakening
affiliation of keiretsu groups. However, when more keiretsu firms suffered from operating losses in
28 As a sensitivity test, we run equation (1) without including the industry dummy variables since the industry effect isalso captured by the industry median value of PTAXROV. The results are even stronger than with the industry dummyvariables as indicated by significant and negative coefficients estimated for the interaction variable (Ki*Xt).
19
the recession period, keiretsu groups apparently organized to take advantage of their group
affiliation to engage in aggressive income-shifting. The recession period also coincides with the
tightening of the fiscal purse by the Japanese government and the conclusion of government
subsidies that had previously been available to keiretsu firms. In contrast, during the pre-bubble
period, no strong incentive existed among keiretsu firms for income-shifting. As Jensen (1989)
points out, before the recession Japanese firms enjoyed readily available positive free cash flow
and bank financing, and senior management engaged in excessive expansion and growth of their
firms rather than cost-cutting and profit-maximization. From our evidence, it appears clear that
possible weakening of keiretsu affiliation does not imply moderation of income-shifting activities
among keiretsu firms.29 Rather, keiretsu firms engage in income-shifting more aggressively during
the economic recession.30
In Panel B we report the results in which we narrow strong keiretsu firms to include only
those companies that belong to the Presidents� Council of each keiretsu group. This Council is an
institutionalized forum for communication among selected chief executives of keiretsu members
(Gerlach 1992). Because only inner group members are invited to participate in the Council, we
expect more intensive income-shifting activities among these firms than across the broader group
of strong-tie keiretsu firms.31 The following model is used for the test:
PTAXROVt,t = β0 + β1IPTAXROVi,t + β2Xi,t + β3Gi + β4(Gi*Xi,t) + β5SIZEi,t + β6LEVERAGEi,t +
β7INDi,1 +�..+ β34INDi,28 + β35YEAR1 +�..+ β54YEAR20 + β55GROUP1
29 Except for a reduction in significance from P < .0001 to P < .001 for weak-tie firms during the recession period, noneof the significance levels reported in Table 6 for the test variable, Ki*Xt, changes when SIZE is alternatively defined asthe natural log of the sum of equity market value and debt book value.
30 Table 4 indicates that the largest difference in effective tax rate occurs in the fishing, mining and forestry industrygroup. To examine the robustness of our results, we ran the primary regression analysis without including firms in theseindustries. The results are very similar to those reported in Table 6, with strong significance across all years for strong-tie firms and highly significant results in the recession period for strong-tie firms and overall. Note that there is no logicalunderpinning for excluding these firms from the sample as they clearly represent keiretsu firms.
31 Dewenter (2001) reports that the total number of core group members in the Presidents� Councils for five keiretsugroups (with the data available in 1989 and 1998) changed from 145 to 144. At the individual keiretsu level, thechanges were more frequent, but these changes largely reflect mergers and consolidations within each group.
20
+�..+ β59GROUP5 + εi,t (2)
The primary difference between the above model and regression model (1) is the
introduction of a new dummy variable G (1 for Presidents� Council members and 0 for independent
firms). Heretofore, data limitations have prevented controlling for the likelihood that the
observations within each of the keiretsu groups are not independent from one another. However,
in this model we control for this possibility by including five keiretsu-specific dummy variables,
GROUP1-GROUP5, that equal 1 if the firm belongs to the keiretsu and 0 if not.32
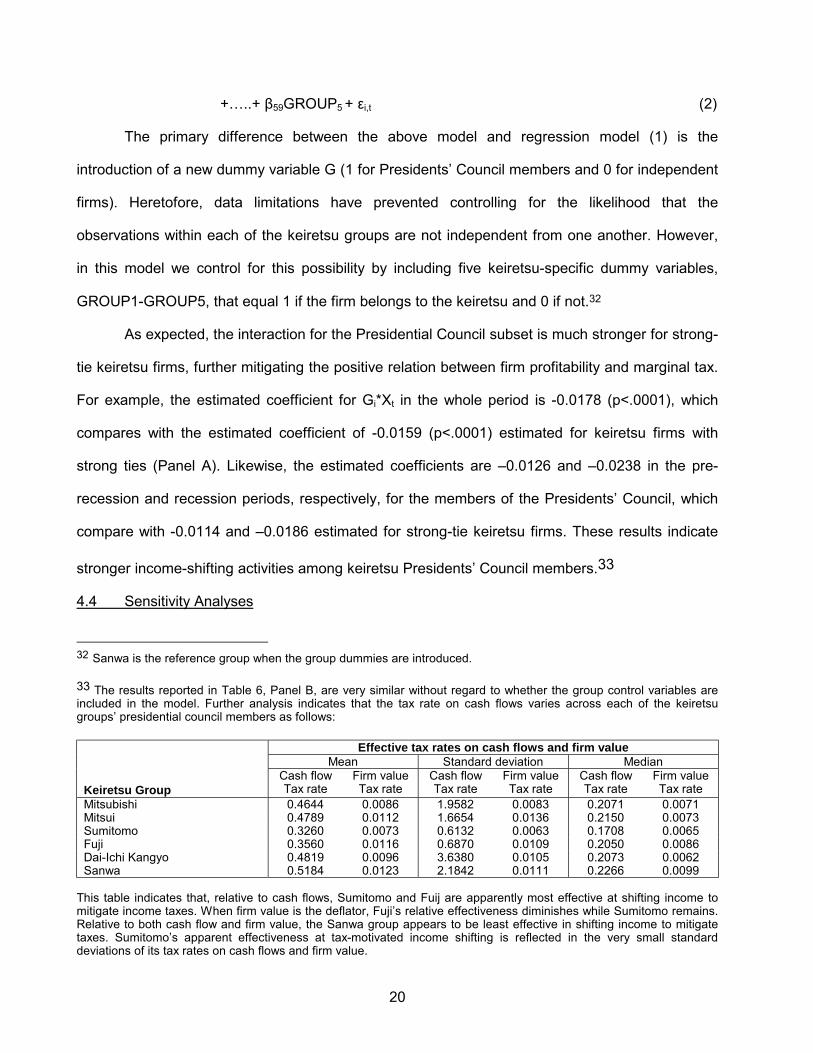
As expected, the interaction for the Presidential Council subset is much stronger for strong-
tie keiretsu firms, further mitigating the positive relation between firm profitability and marginal tax.
For example, the estimated coefficient for Gi*Xt in the whole period is -0.0178 (p<.0001), which
compares with the estimated coefficient of -0.0159 (p<.0001) estimated for keiretsu firms with
strong ties (Panel A). Likewise, the estimated coefficients are �0.0126 and �0.0238 in the pre-
recession and recession periods, respectively, for the members of the Presidents� Council, which
compare with -0.0114 and �0.0186 estimated for strong-tie keiretsu firms. These results indicate
stronger income-shifting activities among keiretsu Presidents� Council members.33
4.4 Sensitivity Analyses
32 Sanwa is the reference group when the group dummies are introduced.
33 The results reported in Table 6, Panel B, are very similar without regard to whether the group control variables areincluded in the model. Further analysis indicates that the tax rate on cash flows varies across each of the keiretsugroups� presidential council members as follows:
Effective tax rates on cash flows and firm valueMean Standard deviation Median
Keiretsu GroupCash flowTax rate
Firm valueTax rate
Cash flowTax rate
Firm valueTax rate
Cash flowTax rate
Firm valueTax rate
Mitsubishi 0.4644 0.0086 1.9582 0.0083 0.2071 0.0071Mitsui 0.4789 0.0112 1.6654 0.0136 0.2150 0.0073Sumitomo 0.3260 0.0073 0.6132 0.0063 0.1708 0.0065Fuji 0.3560 0.0116 0.6870 0.0109 0.2050 0.0086Dai-Ichi Kangyo 0.4819 0.0096 3.6380 0.0105 0.2073 0.0062Sanwa 0.5184 0.0123 2.1842 0.0111 0.2266 0.0099
This table indicates that, relative to cash flows, Sumitomo and Fuij are apparently most effective at shifting income tomitigate income taxes. When firm value is the deflator, Fuji�s relative effectiveness diminishes while Sumitomo remains.Relative to both cash flow and firm value, the Sanwa group appears to be least effective in shifting income to mitigatetaxes. Sumitomo�s apparent effectiveness at tax-motivated income shifting is reflected in the very small standarddeviations of its tax rates on cash flows and firm value.
21
In the absence of proprietary information regarding their operational decisions, it is almost
impossible to identify the vehicles that keiretsu member firms utilize for their income-shifting
activities. Therefore, we conduct a set of admittedly broad-based tests that are likely to be refined
by future corroborative studies.34 Initially, we examine alternative dependent variables and find
supporting results. First, we deflate earnings by book total assets rather than the market value of
the firm. With this specification, the coefficient of Ki*Xt is �0.0212 (p<.0001) across the whole
period. Second, we introduce an alternative definition of firm profitability, GPPCT: the ratio of
gross profits to sales. The GPPCT variable only considers transfer prices of primary products and
services within the manufacturing and distribution chain, whereas PTAXROV is a broader measure
that captures all possible transfer prices, including, for examples, interest, rent, and advertising.
The underlying motivation for using GPPCT as the alternative dependent variable is to determine
whether keiretsu group members rely on a wide variety of mechanisms beyond simple transfer
pricing of products. If qualitative results of the regression with GPPCT differ from those reported in
Table 6, we may conclude that keiretsu firms utilize a broader set of transactions to facilitate
income-shifting. The overall regression results with GPPCT as the dependent variable differ from
those summarized in Table 6. For example, only strong-tie keiretsu firms exhibit income-shifting
activities in the pre-recession period (p<.05) and recession period (p<.05), while weak-tie keiretsu
firms do not show any activities at all during the two subperiods. In the presence of much lower
significance level observed for strong-tie keiretsu firms only, we conjecture that keiretsu firms rely
on many other income-shifting methods over and beyond a narrowly defined transfer pricing
mechanism.
Second, we adopt a model to investigate the possibility that intra-keiretsu income-shifting
activities remain unsettled by cash transfers at year-end. If income-shifting among keiretsu firms is
not settled up in cash by year-end, tax-induced income-shifting will reduce the variation in tax
expense relative to pretax cash flows. In other words, keiretsu firms� income-shifting activities will
34 Detailed results of these tests are available upon request from the authors.
22
have a negative impact on the ratio of the time-series variation in income tax expense to the time-
series variation in pre-tax cash flows. The following model tests this possibility.
VTXCFi = β0 + β1SIZEi + β2Ki + β3INDi,1 +�..+ β30INDi,28 + β31YEAR1 +�..
+ β51YEAR21 + εi,t (3)
where VTXCF is the firm-specific ratio of the time-series variation in income tax expense to the
time-series variation of pre-tax cash flows; and K is a dummy variable that differs in definition
depending on whether the model examines all keiretsu firms, strong-tie keiretsu firms, or weak-tie
keiretsu firms. A negative and significant coefficient of dummy variable K is an indication of intra-
keiretsu income shifting activities. The regression coefficients on the keiretsu dummy variable
estimated for strong-tie keiretsu firms are significant and negative in the whole period and the
recession period, but not during the pre-recession period, indicating the existence of intra-keiretsu
income-shifting activities. The same coefficients are not significant for weak-tie keiretsu firms,
which implies that this type of income-shifting may be limited to only strong keiretsu members.
Although one cannot isolate specific income-shifting mechanisms, the results provide some
evidence of tax-lowering maneuvers among strong-tie keiretsu firms.35
The last test is designed to investigate the existence of a compensatory dividend payment.
The underlying assumption is as follows: If a keiretsu member firm shifts income to another
member firm, there must be some way the former should be compensated for the shifted income.
One variable we investigate is dividend payments in view of cross-shareholding practices
especially among keiretsu firms.36 In Japan, a firm owning more than (no more than) 25 percent of
the outstanding shares of another company is entitled to a 100 percent (80 percent) dividends-
received deduction for dividends received from the company (Japanese Ministry of Finance
35 Estimated coefficients for the test variable, K, are �0.0174 (P<.001) and �0.0145 (P<.05) in the whole period and therecession period, respectively, for strong-tie keiretsu firms, while the coefficient is insignificant in the pre-recessionperiod. In contrast, none of the coefficients (K) estimated for weak-tie keiretsu firms is significant in any of the periods.
36 Hojo (1995) reports that the average percentage of cross-shareholding among keiretsu group members amount to 20to 25 percent without counting the main banks� holding.
23
1999).37 The following model is used to test the hypothesis that keiretsu affiliation will directly
impact the dividend policies of its member firms:
NETDIVi = β0 + β1SIZEi + β2Ki+ β3Xi + β4(Ki*Xi) + β5INDi,1 +�..+ β32INDi,28
+ β33YEAR1 +�..+ β52YEAR20 + εi,t (4)
The estimated coefficient for the interaction, Ki*Xi, between the keiretsu dummy (K) and
marginal tax status (X) is our major focus in this model. NETDIV is the ratio of dividend income to
dividends paid and all other independent variables have been defined in previous regression
models. A positive and significant coefficient of Ki*Xi would indicate greater net compensatory
dividend income among keiretsu firms with positive marginal tax rates. In fact, the results confirm
this. Across the whole period for all keiretsu firms, we observe a positive and significant coefficient
on Ki*Xi of 0.1051 (p<.001). The results of this model are stronger for strong-tie keiretsu firms and
non-existent for weak-tie keiretsu firms, indicating that compensatory dividends is a mechanism
predominantly used by strong-tie keiretsu firms.
5. Conclusion
Many empirical papers have documented a variety of benefits to firms affiliated with
keiretsu groups in Japan. In the finance arena, membership in the keiretsu system has been
shown to reduce bankruptcy and agency costs, alleviate liquidity constraints, and control
monitoring costs. This paper examines a tax-savings benefit that has not been previously been
examined: the keiretsu system enables member companies to shift income within the affiliated
group to pay lower overall taxes than independent companies.
Given our evidence that keiretsu firms are subject to lower effective tax rates than
independent firms, we examine the relation between firm profitability and marginal tax status and
find that this relation is negatively affected by the keiretsu membership. This supports the view
that, relative to independent firms, keiretsu affiliates with relatively high tax rates shift income to
37 Ad hoc evidence from a conversation with a Japanese accounting professor suggests that special dividends tocertain shareholders are possible within keiretsu groups and that such dividends may result from the use of artificialtransfer prices designed to mitigate income tax.
24
affiliates with relatively low tax rates. The negative relation we find is strong especially during the
second subperiod (1990-1997) characterized by economic recession, and it withstands alternative
measures of both the key independent and dependent variables. Thus, the evidence strongly
suggests that one benefit of keiretsu membership is the ability to shift income among group
member companies. Contradicting conventional wisdom, we find that weakening of keiretsu
affiliation during the recent economic recession does not imply less income-shifting among
keiretsu firms. Rather, empirical evidence indicates that income-shifting emerges in full among
strong-tie keiretsu firms during the recession.
25
References
Abrahams, P. and G. Tett, 1999, The circle is broken, Financial Times (November 19).
Anderson, C. W. and A. K. Makhija, 1999, Deregulation, disintermediation, and agency costs ofdebt: Evidence from Japan, Journal of Financial Economics 51, 309-339.
Beason, D., 1998, Keiretsu affiliation and share price volatility in Japan, Pacific-Basin FinanceJournal 6, 27-43.
Berglöf, E. and E. Perotti, 1994, The governance structure of the Japanese financial keiretsu,Journal of Financial Economics 36, 259-284.
Brown & Company Ltd., 1999, Industrial groupings in Japan: The changing face of ‘keiretsu,’ 13th
edition.
Campbell, J. Y. and Y. Hamao, 1994, Changing patterns of corporate financing and the main banksystem in Japan, in: M. Aoki and H. Patrick, eds., The Japanese Main Bank System: ItsRelevance for Developing and Transforming Economies (Oxford University Press, New York)325-349.
Collins, J., D. Kemsley, and M. Lang, 1998, Cross-jurisdictional income shifting and earningsvaluation, Journal of Accounting Research 36, 209-229.
Cooke, T. E. and M. Kikuya, 1992, Financial reporting in Japan: Regulation, practice andenvironment (Blackwell Publishers Ltd., Oxford, United Kingdom).
Deloitte Touche Tohmatsu International, 1996, Taxation in the Asia-Pacific Region (New York,NY).
Dewenter, K. L., 2001, Japanese Keiretsu restructuring in the early 1990s: Was there a masterplan?, University of Washington working paper.
Dewenter, K. L. and V. A. Warther, 1998, Dividends, asymmetric information, and agencyconflicts: Evidence from a comparison of the dividend policies of Japanese and U.S. firms,Journal of Finance 53, 879-904.
Dodwell Marketing Consultants, 1985, 1989, 1995, Industrial Groupings in Japan (DodwellMarketing Consultants, Tokyo, Japan).
Dvorak, P., R. A. Guth, J. Singer, and T. Zaun, 2001, Loose ends: Frayed by recession, Japan�scorporate ties are coming unraveled�Sales of interlocking holdings fuel Nikkei�s tumble, boostforeign ownership�A chair and a crystal ashtray, Wall Street Journal (March 2, A1).
Gerlach, Michael, 1992, Alliance Capitalism: The Social Organization of Japanese Business(Berkeley, CA: University of California Press).
Gilson, R. J. and M. J. Roe, 1993, Understanding the Japanese keiretsu: Overlaps betweencorporate governance and industrial organization, Yale Law Journal 102, 870-906.
Graham, J. R., 1996a, Debt and the marginal tax rate, Journal of Financial Economics 41, 41-73.
26
Graham, J. R., 1996b, Proxies for the corporate marginal tax rate, Journal of Financial Economics42, 187-221.
Guo, E., A. J. Keown, and N. Sen, 2001, The impact of firm diversification and focus: TheJapanese experience, Pacific-Basin Finance Journal 9, 165-193.
Harris, D. G., 1993, The impact of US tax law revision on multinational corporations� capitallocation and income-shifting decisions, Journal of Accounting Research 31, 111-140.
Harris, D., R. Morck, J. Slemrod, and B. Yeung, 1993, Income shifting in US multinationalcorporations, in Studies in International Taxation, edited by A. Giovannini, R. G. Hubbard, andJ. Slemrod (University of Chicago Press, Chicago, IL).
Hodder, J. E. and A. E. Tschoegl, 1985, Some aspects of Japanese corporate finance, Journal ofFinancial and Quantitative Analysis 20, 261-272.
Hojo, Hiroo, 1995, The legacy of the bubble economy in Japan: Declining cross shareholding andcapital formation, Japan Securities Dealers Association Working Paper.
Horiuchi, A. and K. Shimizu, 1998, The deterioration of bank balance sheets in Japan: Risk-takingand recapitalization, Pacific-Basin Finance Journal 6, 1-26.
Horiuchi, A. and R. Okazaki, 1992, Capital markets and the banking sector: The efficiency ofJapanese banks in reducing agency costs, University of Tokyo working paper.
Hoshi, T., A. Kashyap, and D. Scharfstein, 1990, The role of banks in reducing the costs offinancial distress in Japan, Journal of Financial Economics 27, 67-88.
Hoshi, T., A. Kashyap, and D. Scharfstein, 1991, Corporate structure, liquidity, and investment:Evidence from Japanese industrial groups, Quarterly Journal of Economics 106, 33-60.
Ishi, H., 1993, The Japanese tax system, second edition (Oxford University Press, UK).
Jacob, J., 1996, Taxes and transfer pricing: Income shifting and the volume of intrafirm transfers,Journal of Accounting Research 34, 301-312.
Japanese Ministry of Finance, 1999, An Outline of Japanese Taxes.
Jensen, M. C., 1986, Agency costs of free cash flow, corporate finance, and takeovers, AmericanEconomic Review 76, 323-339.
Jensen, M. C., 1989, Eclipse of the public corporation, Harvard Business Review 5, 61-74.
Jo, H., S. G. Rhee, and M. H. Song, 2001, The role of security analysts in Japan, University ofHawaii working paper.
Kaplan, S. N., 1994, Top executive rewards and firm performance: A comparison of Japan and theUnited States, Journal of Political Economy 102, 510-546.
Kaplan, S. N., and B. A. Minton, 1994, Appointment of outsiders to Japanese boards:Determinants and implication for managers, Journal of Financial Economics 36, 225-258.
27
Kern, B. B. and M. H. Morris, 1992, Taxes and firm size: The effect of tax legislation during the1980s, Journal of the American Taxation Association 14, 80-96.
Kester, W. C., 1991, Japanese Takeovers: The Global Contest for Corporate Control (HarvardBusiness School Press, Boston, MA).
Kigyo Keiretsu Souran, 1992 and 1993 (Toyo Keizai, Tokyo, Japan).
Kim, K. A. and P. Limpaphayom, 1998, A test of the two-tier corporate governance structure: Thecase of Japanese keiretsu, Journal of Financial Research 21, 37-51.
Klassen, K., M. Lang, and M. Wolfson, 1993, Geographic income shifting by multinationalcorporations in response to tax rate changes, Journal of Accounting Research 31(Supplement), 140-173.
Kuboi, T., 1991, Business practices and taxation in Japan (The Japan Times, Tokyo, Japan).
Lincoln, J. R., M. Gerlach, and C. Ahmadjian, 1993, Keiretsu networks and corporate performancein Japan, University of California at Berkeley working paper.
Mandelker, G. N. and S. G. Rhee, 1984, The impact of the degrees of financial and operatingleverage on systematic risk of common stock, Journal of Financial and Quantitative Analysis19, 45-57.
Mills, L.F., and K.J. Newberry, 2001, Do worldwide tax incentives affect the income reporting anddebt policy of foreign-controlled U.S. corporations? University of Arizona working paper.
Miyashita, K. and D. W. Russell, 1994, Keiretsu: Inside the hidden Japanese conglomerates(McGraw-Hill, Inc., New York, NY).
Nakatani, I., 1984, The economic role of corporate financial grouping, in M. Aoki, ed., EconomicAnalysis of the Japanese Firm (Elsevier, New York, NY).
Namiki, N., 1999, Parent-subsidiary relationships in Japan: Some observations from financialstatement data, SAM Advanced Management Journal, Summer, 15-16.
Newberry, K., and D. Dhaliwal, 2001, Cross-Jurisdictional Income Shifting by U.S. Multinationals:Evidence from international bond offerings, forthcoming in Journal of Accounting Research,December 2001, 629-48.
Oliver, R. W., 1999, Killer keiretsu, Management Review, September, 10-11.
Plesko, G. A., 2001, An evaluation of alternative measures of corporate tax rates, MassachusettsInstitute of Technology working paper.
Prowse, S. D., 1990, Institutional investment patterns and corporate financial behavior in the U.S.and Japan, Journal of Financial Economics 27, 43-66.
Prowse, S. D., 1992, The structure of corporate ownership in Japan, Journal of Finance 47, 1121-1140.
28
Scholes, M. S., M. A. Wolfson, M. Erickson, E. L. Maydew, and T. Shevlin, 2002, Taxes andbusiness strategy: A planning approach, 2nd edition (Prentice Hall, Upper Saddle River, NJ).
Sheard, P., 1989, The main bank system and corporate monitoring and control in Japan, Journalof Economic Behavior and Organization 11, 399-422.
Shevlin, T., 1990, Estimating corporate marginal tax rates with asymmetric tax treatment of gainsand losses, Journal of the American Taxation Association 11, 51-67.
Shevlin, T., 1999, A critigue of Plesko�s �An evaluation of alternative measures of corporate taxrates,� University of Washington working paper.
Suzuki, S. and R. Wright, 1985, Financial structure and bankruptcy risk in Japanese companies,Journal of International Business Studies, 97-110.
Titman, S. and R. Wessels, 1988, The determinants of capital structure choice, Journal of Finance43, 1-19.
Weinstein, D. E. and Y. Yafeh, 1998, On the cost of a bank centered financial system: Evidencefrom the changing main bank relations in Japan, Journal of Finance 53, 635-672.
Yetman, R. J., 2001, Tax-Motivated Expense Allocations by Nonprofit Organizations, TheAccounting Review 76, 297-311.
Zimmerman, J. L., 1983, Taxes and firm size, Journal of Accounting and Economics 5, 119-149.
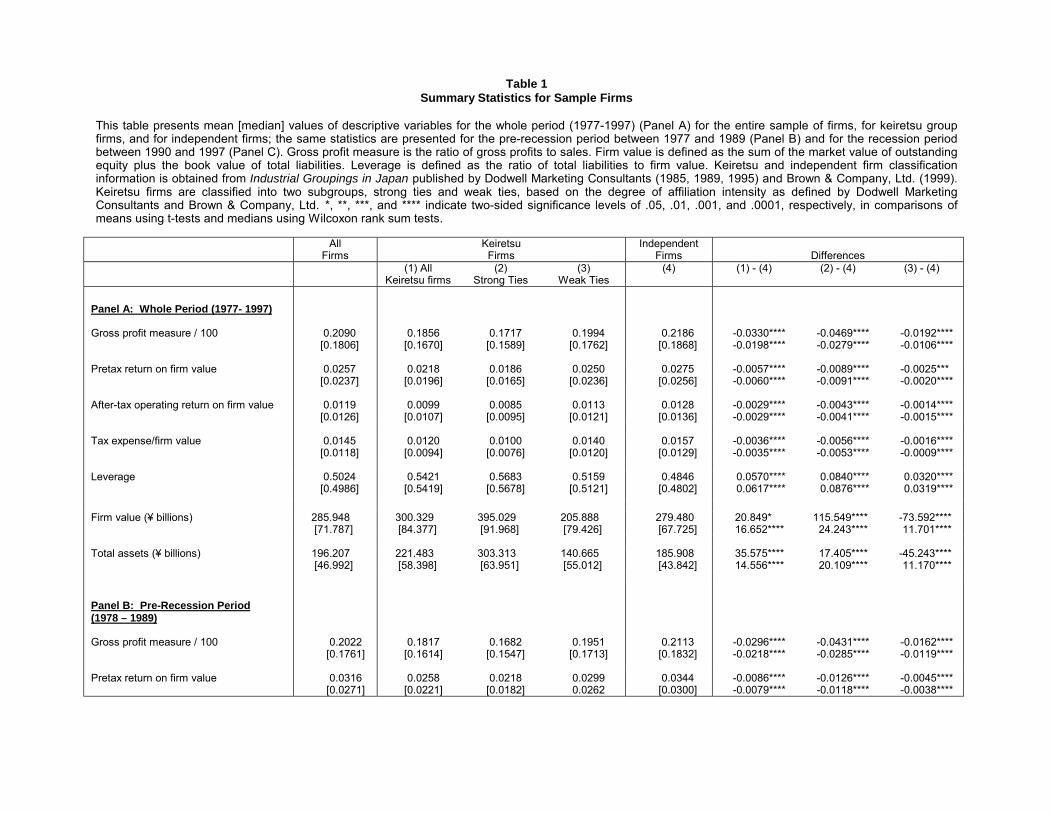
Table 1Summary Statistics for Sample Firms
This table presents mean [median] values of descriptive variables for the whole period (1977-1997) (Panel A) for the entire sample of firms, for keiretsu groupfirms, and for independent firms; the same statistics are presented for the pre-recession period between 1977 and 1989 (Panel B) and for the recession periodbetween 1990 and 1997 (Panel C). Gross profit measure is the ratio of gross profits to sales. Firm value is defined as the sum of the market value of outstandingequity plus the book value of total liabilities. Leverage is defined as the ratio of total liabilities to firm value. Keiretsu and independent firm classificationinformation is obtained from Industrial Groupings in Japan published by Dodwell Marketing Consultants (1985, 1989, 1995) and Brown & Company, Ltd. (1999).Keiretsu firms are classified into two subgroups, strong ties and weak ties, based on the degree of affiliation intensity as defined by Dodwell MarketingConsultants and Brown & Company, Ltd. *, **, ***, and **** indicate two-sided significance levels of .05, .01, .001, and .0001, respectively, in comparisons ofmeans using t-tests and medians using Wilcoxon rank sum tests.
AllFirms
KeiretsuFirms
IndependentFirms Differences
(1) AllKeiretsu firms
(2)Strong Ties
(3)Weak Ties
(4) (1) - (4) (2) - (4) (3) - (4)
Panel A: Whole Period (1977- 1997)
Gross profit measure / 100 0.2090[0.1806]
0.1856[0.1670]
0.1717[0.1589]
0.1994[0.1762]
0.2186[0.1868]
-0.0330****-0.0198****
-0.0469****-0.0279****
-0.0192****-0.0106****
Pretax return on firm value 0.0257[0.0237]
0.0218[0.0196]
0.0186[0.0165]
0.0250[0.0236]
0.0275[0.0256]
-0.0057****-0.0060****
-0.0089****-0.0091****
-0.0025***-0.0020****
After-tax operating return on firm value 0.0119[0.0126]
0.0099[0.0107]
0.0085[0.0095]
0.0113[0.0121]
0.0128[0.0136]
-0.0029****-0.0029****
-0.0043****-0.0041****
-0.0014****-0.0015****
Tax expense/firm value 0.0145[0.0118]
0.0120[0.0094]
0.0100[0.0076]
0.0140[0.0120]
0.0157[0.0129]
-0.0036****-0.0035****
-0.0056****-0.0053****
-0.0016****-0.0009****
Leverage 0.5024[0.4986]
0.5421[0.5419]
0.5683[0.5678]
0.5159[0.5121]
0.4846[0.4802]
0.0570****0.0617****
0.0840****0.0876****
0.0320****0.0319****
Firm value (¥ billions) 285.948[71.787]
300.329[84.377]
395.029[91.968]
205.888[79.426]
279.480[67.725]
20.849*16.652****
115.549****24.243****
-73.592****11.701****
Total assets (¥ billions) 196.207[46.992]
221.483[58.398]
303.313[63.951]
140.665[55.012]
185.908[43.842]
35.575****14.556****
17.405****20.109****
-45.243****11.170****
Panel B: Pre-Recession Period(1978 – 1989)
Gross profit measure / 100 0.2022[0.1761]
0.1817[0.1614]
0.1682[0.1547]
0.1951[0.1713]
0.2113[0.1832]
-0.0296****-0.0218****
-0.0431****-0.0285****
-0.0162****-0.0119****
Pretax return on firm value 0.0316[0.0271]
0.0258[0.0221]
0.0218[0.0182]
0.02990.0262
0.0344[0.0300]
-0.0086****-0.0079****
-0.0126****-0.0118****
-0.0045****-0.0038****
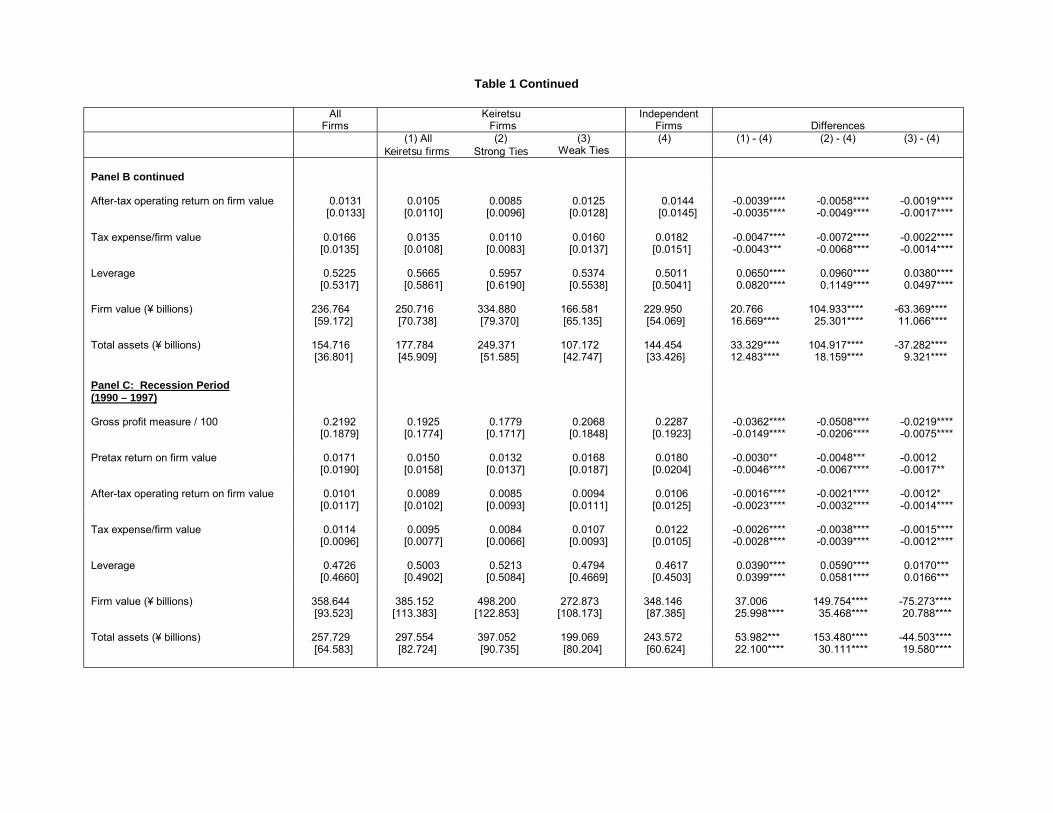
Table 1 Continued
AllFirms
KeiretsuFirms
IndependentFirms Differences
(1) AllKeiretsu firms
(2)Strong Ties
(3)Weak Ties
(4) (1) - (4) (2) - (4) (3) - (4)
Panel B continued
After-tax operating return on firm value 0.0131[0.0133]
0.0105[0.0110]
0.0085[0.0096]
0.0125[0.0128]
0.0144[0.0145]
-0.0039****-0.0035****
-0.0058****-0.0049****
-0.0019****-0.0017****
Tax expense/firm value 0.0166[0.0135]
0.0135[0.0108]
0.0110[0.0083]
0.0160[0.0137]
0.0182[0.0151]
-0.0047****-0.0043***
-0.0072****-0.0068****
-0.0022****-0.0014****
Leverage 0.5225[0.5317]
0.5665[0.5861]
0.5957[0.6190]
0.5374[0.5538]
0.5011[0.5041]
0.0650****0.0820****
0.0960****0.1149****
0.0380****0.0497****
Firm value (¥ billions) 236.764[59.172]
250.716[70.738]
334.880[79.370]
166.581[65.135]
229.950[54.069]
20.76616.669****
104.933****25.301****
-63.369****11.066****
Total assets (¥ billions) 154.716[36.801]
177.784[45.909]
249.371[51.585]
107.172[42.747]
144.454[33.426]
33.329****12.483****
104.917****18.159****
-37.282****9.321****
Panel C: Recession Period(1990 – 1997)
Gross profit measure / 100 0.2192[0.1879]
0.1925[0.1774]
0.1779[0.1717]
0.2068[0.1848]
0.2287[0.1923]
-0.0362****-0.0149****
-0.0508****-0.0206****
-0.0219****-0.0075****
Pretax return on firm value 0.0171[0.0190]
0.0150[0.0158]
0.0132[0.0137]
0.0168[0.0187]
0.0180[0.0204]
-0.0030**-0.0046****
-0.0048***-0.0067****
-0.0012-0.0017**
After-tax operating return on firm value 0.0101[0.0117]
0.0089[0.0102]
0.0085[0.0093]
0.0094[0.0111]
0.0106 [0.0125]
-0.0016****-0.0023****
-0.0021****-0.0032****
-0.0012*-0.0014****
Tax expense/firm value 0.0114[0.0096]
0.0095[0.0077]
0.0084[0.0066]
0.0107[0.0093]
0.0122[0.0105]
-0.0026****-0.0028****
-0.0038****-0.0039****
-0.0015****-0.0012****
Leverage 0.4726[0.4660]
0.5003[0.4902]
0.5213[0.5084]
0.4794[0.4669]
0.4617[0.4503]
0.0390****0.0399****
0.0590****0.0581****
0.0170***0.0166***
Firm value (¥ billions) 358.644[93.523]
385.152[113.383]
498.200[122.853]
272.873[108.173]
348.146[87.385]
37.00625.998****
149.754****35.468****
-75.273****20.788****
Total assets (¥ billions) 257.729[64.583]
297.554[82.724]
397.052[90.735]
199.069[80.204]
243.572[60.624]
53.982***22.100****
153.480****30.111****
-44.503****19.580****
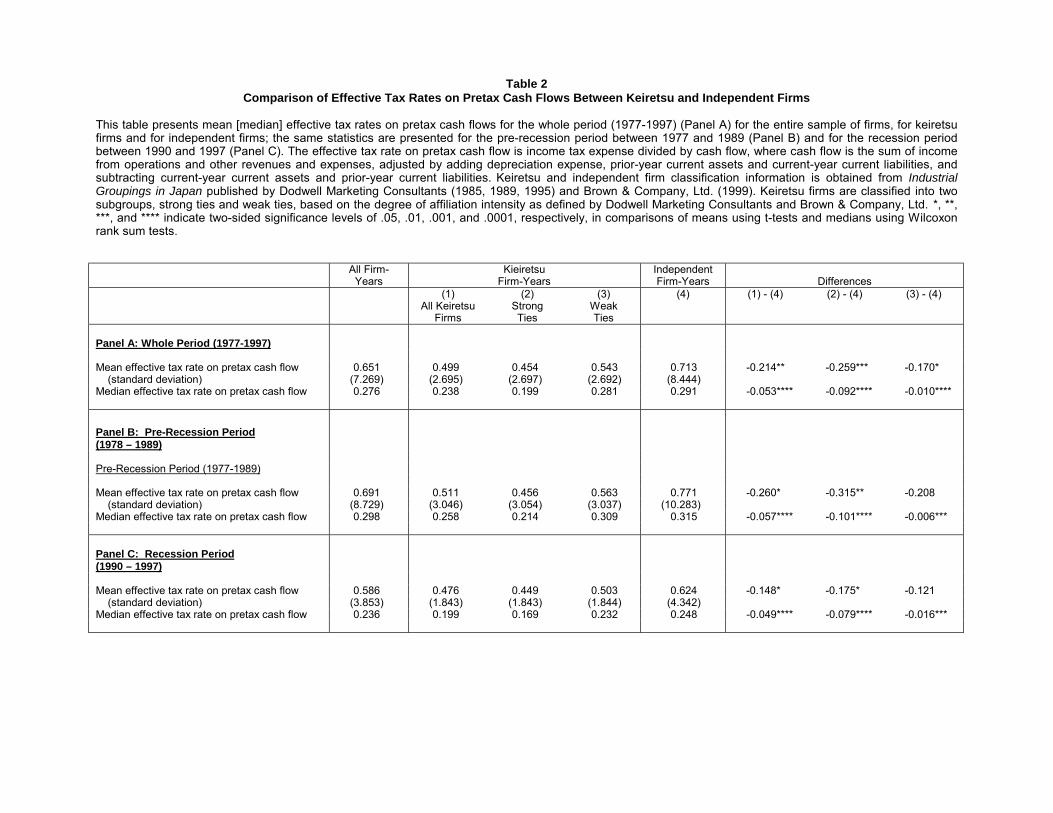
Table 2Comparison of Effective Tax Rates on Pretax Cash Flows Between Keiretsu and Independent Firms
This table presents mean [median] effective tax rates on pretax cash flows for the whole period (1977-1997) (Panel A) for the entire sample of firms, for keiretsufirms and for independent firms; the same statistics are presented for the pre-recession period between 1977 and 1989 (Panel B) and for the recession periodbetween 1990 and 1997 (Panel C). The effective tax rate on pretax cash flow is income tax expense divided by cash flow, where cash flow is the sum of incomefrom operations and other revenues and expenses, adjusted by adding depreciation expense, prior-year current assets and current-year current liabilities, andsubtracting current-year current assets and prior-year current liabilities. Keiretsu and independent firm classification information is obtained from IndustrialGroupings in Japan published by Dodwell Marketing Consultants (1985, 1989, 1995) and Brown & Company, Ltd. (1999). Keiretsu firms are classified into twosubgroups, strong ties and weak ties, based on the degree of affiliation intensity as defined by Dodwell Marketing Consultants and Brown & Company, Ltd. *, **,***, and **** indicate two-sided significance levels of .05, .01, .001, and .0001, respectively, in comparisons of means using t-tests and medians using Wilcoxonrank sum tests.
All Firm-Years
KieiretsuFirm-Years
IndependentFirm-Years Differences
(1)All Keiretsu
Firms
(2)StrongTies
(3)WeakTies
(4) (1) - (4) (2) - (4) (3) - (4)
Panel A: Whole Period (1977-1997)
Mean effective tax rate on pretax cash flow 0.651 0.499 0.454 0.543 0.713 -0.214** -0.259*** -0.170*(standard deviation) (7.269) (2.695) (2.697) (2.692) (8.444)
Median effective tax rate on pretax cash flow 0.276 0.238 0.199 0.281 0.291 -0.053**** -0.092**** -0.010****
Panel B: Pre-Recession Period(1978 – 1989)
Pre-Recession Period (1977-1989)
Mean effective tax rate on pretax cash flow 0.691 0.511 0.456 0.563 0.771 -0.260* -0.315** -0.208(standard deviation) (8.729) (3.046) (3.054) (3.037) (10.283)
Median effective tax rate on pretax cash flow 0.298 0.258 0.214 0.309 0.315 -0.057**** -0.101**** -0.006***
Panel C: Recession Period(1990 – 1997)
Mean effective tax rate on pretax cash flow 0.586 0.476 0.449 0.503 0.624 -0.148* -0.175* -0.121(standard deviation) (3.853) (1.843) (1.843) (1.844) (4.342)
Median effective tax rate on pretax cash flow 0.236 0.199 0.169 0.232 0.248 -0.049**** -0.079**** -0.016***
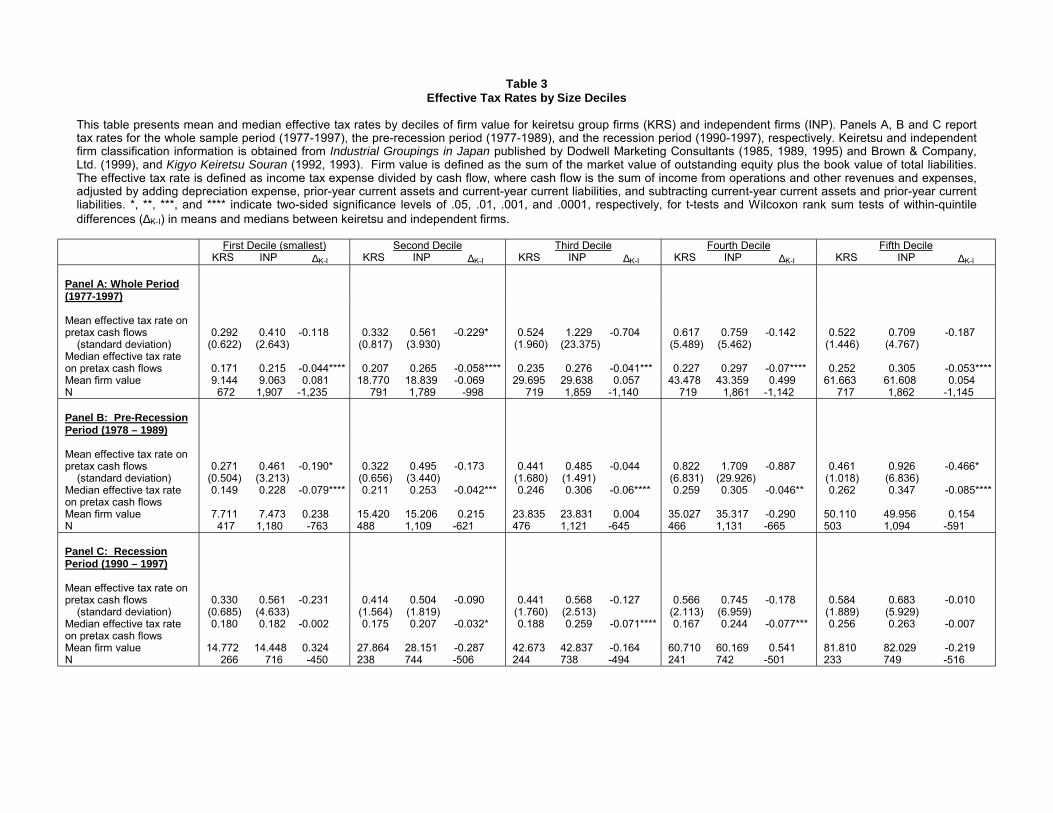
Table 3Effective Tax Rates by Size Deciles
This table presents mean and median effective tax rates by deciles of firm value for keiretsu group firms (KRS) and independent firms (INP). Panels A, B and C reporttax rates for the whole sample period (1977-1997), the pre-recession period (1977-1989), and the recession period (1990-1997), respectively. Keiretsu and independentfirm classification information is obtained from Industrial Groupings in Japan published by Dodwell Marketing Consultants (1985, 1989, 1995) and Brown & Company,Ltd. (1999), and Kigyo Keiretsu Souran (1992, 1993). Firm value is defined as the sum of the market value of outstanding equity plus the book value of total liabilities.The effective tax rate is defined as income tax expense divided by cash flow, where cash flow is the sum of income from operations and other revenues and expenses,adjusted by adding depreciation expense, prior-year current assets and current-year current liabilities, and subtracting current-year current assets and prior-year currentliabilities. *, **, ***, and **** indicate two-sided significance levels of .05, .01, .001, and .0001, respectively, for t-tests and Wilcoxon rank sum tests of within-quintiledifferences (∆K-I) in means and medians between keiretsu and independent firms.
First Decile (smallest) Second Decile Third Decile Fourth Decile Fifth DecileKRS INP ∆K-I KRS INP ∆K-I KRS INP ∆K-I KRS INP ∆K-I KRS INP ∆K-I
Panel A: Whole Period(1977-1997)
Mean effective tax rate onpretax cash flows 0.292 0.410 -0.118 0.332 0.561 -0.229* 0.524 1.229 -0.704 0.617 0.759 -0.142 0.522 0.709 -0.187
(standard deviation) (0.622) (2.643) (0.817) (3.930) (1.960) (23.375) (5.489) (5.462) (1.446) (4.767)Median effective tax rateon pretax cash flows 0.171 0.215 -0.044**** 0.207 0.265 -0.058**** 0.235 0.276 -0.041*** 0.227 0.297 -0.07**** 0.252 0.305 -0.053****Mean firm value 9.144 9.063 0.081 18.770 18.839 -0.069 29.695 29.638 0.057 43.478 43.359 0.499 61.663 61.608 0.054N 672 1,907 -1,235 791 1,789 -998 719 1,859 -1,140 719 1,861 -1,142 717 1,862 -1,145
Panel B: Pre-RecessionPeriod (1978 – 1989)
Mean effective tax rate onpretax cash flows 0.271 0.461 -0.190* 0.322 0.495 -0.173 0.441 0.485 -0.044 0.822 1.709 -0.887 0.461 0.926 -0.466*
(standard deviation) (0.504) (3.213) (0.656) (3.440) (1.680) (1.491) (6.831) (29.926) (1.018) (6.836)Median effective tax rateon pretax cash flows
0.149 0.228 -0.079**** 0.211 0.253 -0.042*** 0.246 0.306 -0.06**** 0.259 0.305 -0.046** 0.262 0.347 -0.085****
Mean firm value 7.711 7.473 0.238 15.420 15.206 0.215 23.835 23.831 0.004 35.027 35.317 -0.290 50.110 49.956 0.154N 417 1,180 -763 488 1,109 -621 476 1,121 -645 466 1,131 -665 503 1,094 -591
Panel C: RecessionPeriod (1990 – 1997)
Mean effective tax rate onpretax cash flows 0.330 0.561 -0.231 0.414 0.504 -0.090 0.441 0.568 -0.127 0.566 0.745 -0.178 0.584 0.683 -0.010
(standard deviation) (0.685) (4.633) (1.564) (1.819) (1.760) (2.513) (2.113) (6.959) (1.889) (5.929)Median effective tax rateon pretax cash flows
0.180 0.182 -0.002 0.175 0.207 -0.032* 0.188 0.259 -0.071**** 0.167 0.244 -0.077*** 0.256 0.263 -0.007
Mean firm value 14.772 14.448 0.324 27.864 28.151 -0.287 42.673 42.837 -0.164 60.710 60.169 0.541 81.810 82.029 -0.219N 266 716 -450 238 744 -506 244 738 -494 241 742 -501 233 749 -516
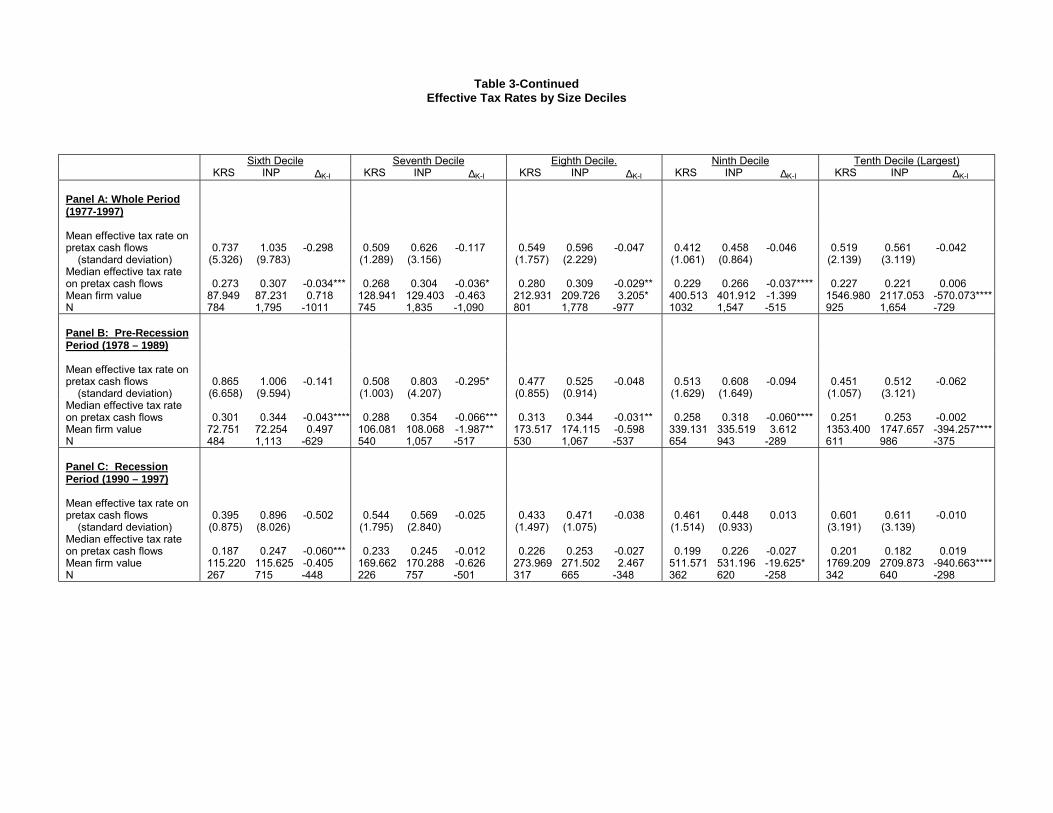
Table 3-ContinuedEffective Tax Rates by Size Deciles
Sixth Decile Seventh Decile Eighth Decile. Ninth Decile Tenth Decile (Largest)KRS INP ∆K-I KRS INP ∆K-I KRS INP ∆K-I KRS INP ∆K-I KRS INP ∆K-I
Panel A: Whole Period(1977-1997)
Mean effective tax rate onpretax cash flows 0.737 1.035 -0.298 0.509 0.626 -0.117 0.549 0.596 -0.047 0.412 0.458 -0.046 0.519 0.561 -0.042
(standard deviation) (5.326) (9.783) (1.289) (3.156) (1.757) (2.229) (1.061) (0.864) (2.139) (3.119)Median effective tax rateon pretax cash flows 0.273 0.307 -0.034*** 0.268 0.304 -0.036* 0.280 0.309 -0.029** 0.229 0.266 -0.037**** 0.227 0.221 0.006Mean firm value 87.949 87.231 0.718 128.941 129.403 -0.463 212.931 209.726 3.205* 400.513 401.912 -1.399 1546.980 2117.053 -570.073****N 784 1,795 -1011 745 1,835 -1,090 801 1,778 -977 1032 1,547 -515 925 1,654 -729
Panel B: Pre-RecessionPeriod (1978 – 1989)
Mean effective tax rate onpretax cash flows 0.865 1.006 -0.141 0.508 0.803 -0.295* 0.477 0.525 -0.048 0.513 0.608 -0.094 0.451 0.512 -0.062
(standard deviation) (6.658) (9.594) (1.003) (4.207) (0.855) (0.914) (1.629) (1.649) (1.057) (3.121)Median effective tax rateon pretax cash flows 0.301 0.344 -0.043**** 0.288 0.354 -0.066*** 0.313 0.344 -0.031** 0.258 0.318 -0.060**** 0.251 0.253 -0.002Mean firm value 72.751 72.254 0.497 106.081 108.068 -1.987** 173.517 174.115 -0.598 339.131 335.519 3.612 1353.400 1747.657 -394.257****N 484 1,113 -629 540 1,057 -517 530 1,067 -537 654 943 -289 611 986 -375
Panel C: RecessionPeriod (1990 – 1997)
Mean effective tax rate onpretax cash flows 0.395 0.896 -0.502 0.544 0.569 -0.025 0.433 0.471 -0.038 0.461 0.448 0.013 0.601 0.611 -0.010
(standard deviation) (0.875) (8.026) (1.795) (2.840) (1.497) (1.075) (1.514) (0.933) (3.191) (3.139)Median effective tax rateon pretax cash flows 0.187 0.247 -0.060*** 0.233 0.245 -0.012 0.226 0.253 -0.027 0.199 0.226 -0.027 0.201 0.182 0.019Mean firm value 115.220 115.625 -0.405 169.662 170.288 -0.626 273.969 271.502 2.467 511.571 531.196 -19.625* 1769.209 2709.873 -940.663****N 267 715 -448 226 757 -501 317 665 -348 362 620 -258 342 640 -298
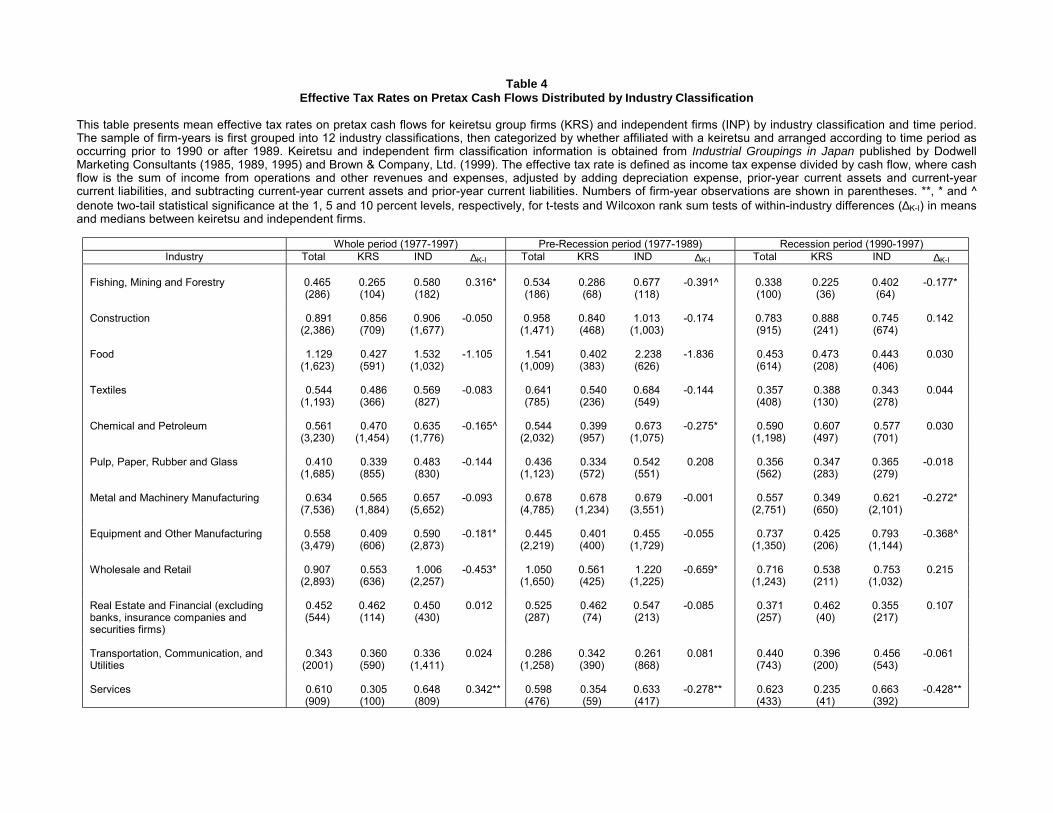
Table 4Effective Tax Rates on Pretax Cash Flows Distributed by Industry Classification
This table presents mean effective tax rates on pretax cash flows for keiretsu group firms (KRS) and independent firms (INP) by industry classification and time period.The sample of firm-years is first grouped into 12 industry classifications, then categorized by whether affiliated with a keiretsu and arranged according to time period asoccurring prior to 1990 or after 1989. Keiretsu and independent firm classification information is obtained from Industrial Groupings in Japan published by DodwellMarketing Consultants (1985, 1989, 1995) and Brown & Company, Ltd. (1999). The effective tax rate is defined as income tax expense divided by cash flow, where cashflow is the sum of income from operations and other revenues and expenses, adjusted by adding depreciation expense, prior-year current assets and current-yearcurrent liabilities, and subtracting current-year current assets and prior-year current liabilities. Numbers of firm-year observations are shown in parentheses. **, * and ^denote two-tail statistical significance at the 1, 5 and 10 percent levels, respectively, for t-tests and Wilcoxon rank sum tests of within-industry differences (∆K-I) in meansand medians between keiretsu and independent firms.
Whole period (1977-1997) Pre-Recession period (1977-1989) Recession period (1990-1997)Industry Total KRS IND ∆K-I Total KRS IND ∆K-I Total KRS IND ∆K-I
Fishing, Mining and Forestry 0.465(286)
0.265(104)
0.580(182)
0.316* 0.534(186)
0.286(68)
0.677(118)
-0.391^ 0.338(100)
0.225(36)
0.402(64)
-0.177*
Construction 0.891(2,386)
0.856(709)
0.906(1,677)
-0.050 0.958(1,471)
0.840(468)
1.013(1,003)
-0.174 0.783(915)
0.888(241)
0.745(674)
0.142
Food 1.129(1,623)
0.427(591)
1.532(1,032)
-1.105 1.541(1,009)
0.402(383)
2.238(626)
-1.836 0.453(614)
0.473(208)
0.443(406)
0.030
Textiles 0.544(1,193)
0.486(366)
0.569(827)
-0.083 0.641(785)
0.540(236)
0.684(549)
-0.144 0.357(408)
0.388(130)
0.343(278)
0.044
Chemical and Petroleum 0.561(3,230)
0.470(1,454)
0.635(1,776)
-0.165^ 0.544(2,032)
0.399(957)
0.673(1,075)
-0.275* 0.590(1,198)
0.607(497)
0.577(701)
0.030
Pulp, Paper, Rubber and Glass 0.410(1,685)
0.339(855)
0.483(830)
-0.144 0.436(1,123)
0.334(572)
0.542(551)
0.208 0.356(562)
0.347(283)
0.365(279)
-0.018
Metal and Machinery Manufacturing 0.634(7,536)
0.565(1,884)
0.657(5,652)
-0.093 0.678(4,785)
0.678(1,234)
0.679(3,551)
-0.001 0.557(2,751)
0.349(650)
0.621(2,101)
-0.272*
Equipment and Other Manufacturing 0.558(3,479)
0.409(606)
0.590(2,873)
-0.181* 0.445(2,219)
0.401(400)
0.455(1,729)
-0.055 0.737(1,350)
0.425(206)
0.793(1,144)
-0.368^
Wholesale and Retail 0.907(2,893)
0.553(636)
1.006(2,257)
-0.453* 1.050(1,650)
0.561(425)
1.220(1,225)
-0.659* 0.716(1,243)
0.538(211)
0.753(1,032)
0.215
Real Estate and Financial (excludingbanks, insurance companies andsecurities firms)
0.452(544)
0.462(114)
0.450(430)
0.012 0.525(287)
0.462(74)
0.547(213)
-0.085 0.371(257)
0.462(40)
0.355(217)
0.107
Transportation, Communication, andUtilities
0.343(2001)
0.360(590)
0.336(1,411)
0.024 0.286(1,258)
0.342(390)
0.261(868)
0.081 0.440(743)
0.396(200)
0.456(543)
-0.061
Services 0.610(909)
0.305(100)
0.648(809)
0.342** 0.598(476)
0.354(59)
0.633(417)
-0.278** 0.623(433)
0.235(41)
0.663(392)
-0.428**
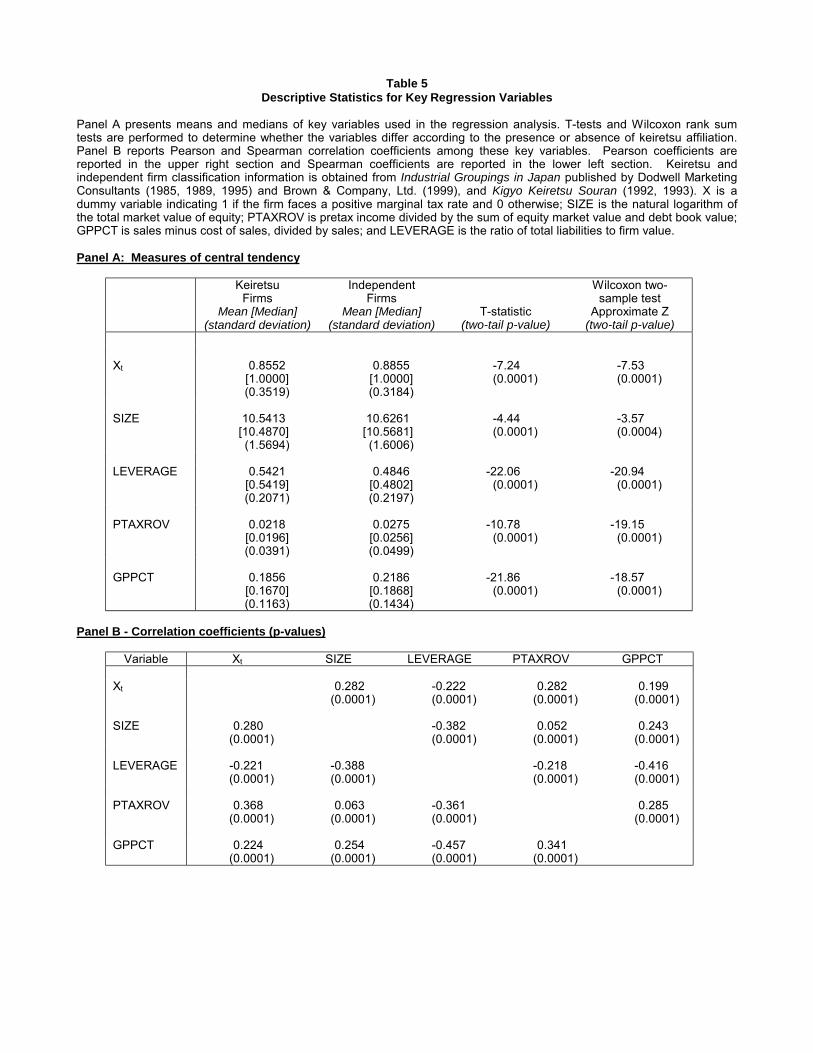
Table 5Descriptive Statistics for Key Regression Variables
Panel A presents means and medians of key variables used in the regression analysis. T-tests and Wilcoxon rank sumtests are performed to determine whether the variables differ according to the presence or absence of keiretsu affiliation.Panel B reports Pearson and Spearman correlation coefficients among these key variables. Pearson coefficients arereported in the upper right section and Spearman coefficients are reported in the lower left section. Keiretsu andindependent firm classification information is obtained from Industrial Groupings in Japan published by Dodwell MarketingConsultants (1985, 1989, 1995) and Brown & Company, Ltd. (1999), and Kigyo Keiretsu Souran (1992, 1993). X is adummy variable indicating 1 if the firm faces a positive marginal tax rate and 0 otherwise; SIZE is the natural logarithm ofthe total market value of equity; PTAXROV is pretax income divided by the sum of equity market value and debt book value;GPPCT is sales minus cost of sales, divided by sales; and LEVERAGE is the ratio of total liabilities to firm value.
Panel A: Measures of central tendency
KeiretsuFirms
Mean [Median](standard deviation)
IndependentFirms
Mean [Median](standard deviation)
T-statistic(two-tail p-value)
Wilcoxon two-sample test
Approximate Z(two-tail p-value)
Xt 0.8552[1.0000](0.3519)
0.8855[1.0000](0.3184)
-7.24(0.0001)
-7.53(0.0001)
SIZE 10.5413[10.4870](1.5694)
10.6261[10.5681](1.6006)
-4.44(0.0001)
-3.57(0.0004)
LEVERAGE 0.5421[0.5419](0.2071)
0.4846[0.4802](0.2197)
-22.06(0.0001)
-20.94(0.0001)
PTAXROV 0.0218[0.0196](0.0391)
0.0275 [0.0256](0.0499)
-10.78(0.0001)
-19.15(0.0001)
GPPCT 0.1856[0.1670](0.1163)
0.2186[0.1868](0.1434)
-21.86(0.0001)
-18.57(0.0001)
Panel B - Correlation coefficients (p-values)
Variable Xt SIZE LEVERAGE PTAXROV GPPCT
Xt 0.282(0.0001)
-0.222(0.0001)
0.282(0.0001)
0.199(0.0001)
SIZE 0.280(0.0001)
-0.382(0.0001)
0.052(0.0001)
0.243(0.0001)
LEVERAGE -0.221(0.0001)
-0.388(0.0001)
-0.218(0.0001)
-0.416(0.0001)
PTAXROV 0.368(0.0001)
0.063(0.0001)
-0.361(0.0001)
0.285(0.0001)
GPPCT 0.224(0.0001)
0.254(0.0001)
-0.457(0.0001)
0.341(0.0001)
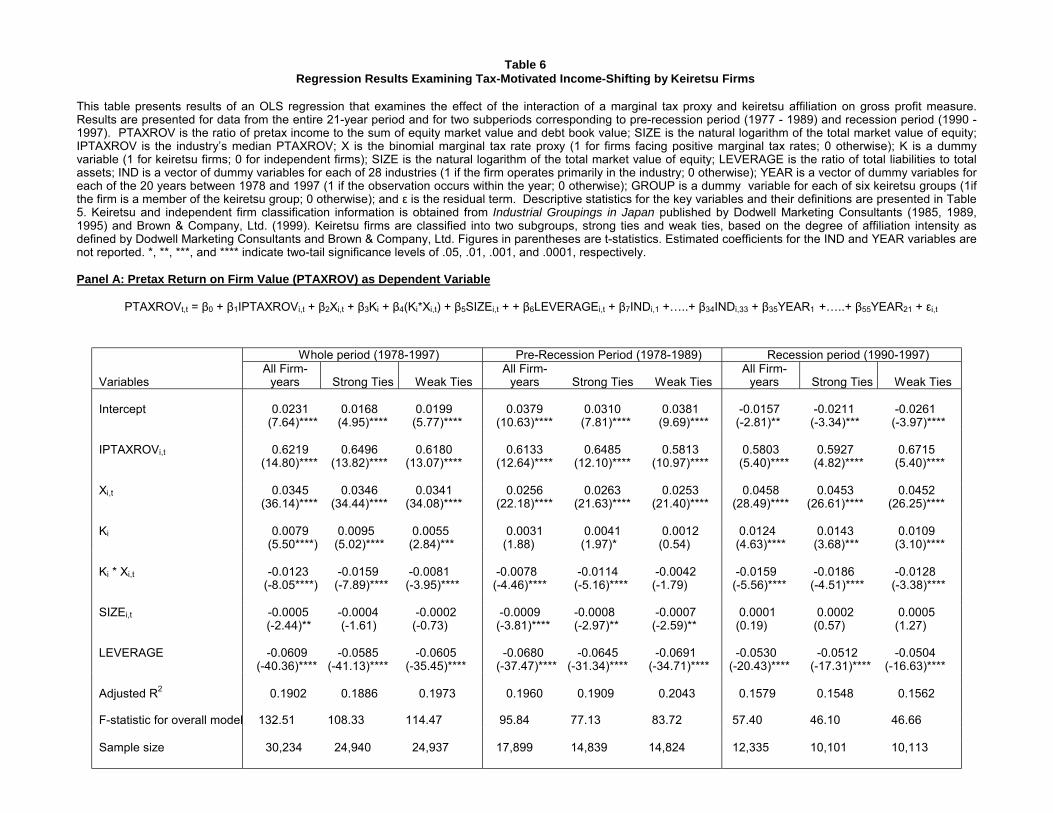
Table 6Regression Results Examining Tax-Motivated Income-Shifting by Keiretsu Firms
This table presents results of an OLS regression that examines the effect of the interaction of a marginal tax proxy and keiretsu affiliation on gross profit measure.Results are presented for data from the entire 21-year period and for two subperiods corresponding to pre-recession period (1977 - 1989) and recession period (1990 -1997). PTAXROV is the ratio of pretax income to the sum of equity market value and debt book value; SIZE is the natural logarithm of the total market value of equity;IPTAXROV is the industry�s median PTAXROV; X is the binomial marginal tax rate proxy (1 for firms facing positive marginal tax rates; 0 otherwise); K is a dummyvariable (1 for keiretsu firms; 0 for independent firms); SIZE is the natural logarithm of the total market value of equity; LEVERAGE is the ratio of total liabilities to totalassets; IND is a vector of dummy variables for each of 28 industries (1 if the firm operates primarily in the industry; 0 otherwise); YEAR is a vector of dummy variables foreach of the 20 years between 1978 and 1997 (1 if the observation occurs within the year; 0 otherwise); GROUP is a dummy variable for each of six keiretsu groups (1ifthe firm is a member of the keiretsu group; 0 otherwise); and ε is the residual term. Descriptive statistics for the key variables and their definitions are presented in Table5. Keiretsu and independent firm classification information is obtained from Industrial Groupings in Japan published by Dodwell Marketing Consultants (1985, 1989,1995) and Brown & Company, Ltd. (1999). Keiretsu firms are classified into two subgroups, strong ties and weak ties, based on the degree of affiliation intensity asdefined by Dodwell Marketing Consultants and Brown & Company, Ltd. Figures in parentheses are t-statistics. Estimated coefficients for the IND and YEAR variables arenot reported. *, **, ***, and **** indicate two-tail significance levels of .05, .01, .001, and .0001, respectively.
Panel A: Pretax Return on Firm Value (PTAXROV) as Dependent Variable
PTAXROVt,t = β0 + β1IPTAXROVi,t + β2Xi,t + β3Ki + β4(Ki*Xi,t) + β5SIZEi,t + + β6LEVERAGEi,t + β7INDi,1 +�..+ β34INDi,33 + β35YEAR1 +�..+ β55YEAR21 + εi,t
Whole period (1978-1997) Pre-Recession Period (1978-1989) Recession period (1990-1997)
VariablesAll Firm-
years Strong Ties Weak TiesAll Firm-
years Strong Ties Weak TiesAll Firm-
years Strong Ties Weak Ties
Intercept 0.0231(7.64)****
0.0168 (4.95)****
0.0199 (5.77)****
0.0379 (10.63)****
0.0310 (7.81)****
0.0381 (9.69)****
-0.0157 (-2.81)**
-0.0211 (-3.34)***
-0.0261 (-3.97)****
IPTAXROVi,t 0.6219(14.80)****
0.6496 (13.82)****
0.6180(13.07)****
0.6133 (12.64)****
0.6485 (12.10)****
0.5813 (10.97)****
0.5803 (5.40)****
0.5927 (4.82)****
0.6715 (5.40)****
Xi,t 0.0345(36.14)****
0.0346 (34.44)****
0.0341(34.08)****
0.0256 (22.18)****
0.0263 (21.63)****
0.0253 (21.40)****
0.0458 (28.49)****
0.0453(26.61)****
0.0452 (26.25)****
Ki 0.0079(5.50****)
0.0095 (5.02)****
0.0055 (2.84)***
0.0031 (1.88)
0.0041 (1.97)*
0.0012 (0.54)
0.0124 (4.63)****
0.0143 (3.68)***
0.0109 (3.10)****
Ki * Xi,t -0.0123(-8.05****)
-0.0159 (-7.89)****
-0.0081(-3.95)****
-0.0078 (-4.46)****
-0.0114 (-5.16)****
-0.0042 (-1.79)
-0.0159 (-5.56)****
-0.0186 (-4.51)****
-0.0128 (-3.38)****
SIZEi,t -0.0005 (-2.44)**
-0.0004 (-1.61)
-0.0002 (-0.73)
-0.0009 (-3.81)****
-0.0008 (-2.97)**
-0.0007 (-2.59)**
0.0001 (0.19)
0.0002 (0.57)
0.0005 (1.27)
LEVERAGE -0.0609 (-40.36)****
-0.0585(-41.13)****
-0.0605(-35.45)****
-0.0680 (-37.47)****
-0.0645(-31.34)****
-0.0691 (-34.71)****
-0.0530(-20.43)****
-0.0512 (-17.31)****
-0.0504(-16.63)****
Adjusted R2 0.1902 0.1886 0.1973 0.1960 0.1909 0.2043 0.1579 0.1548 0.1562
F-statistic for overall model 132.51 108.33 114.47 95.84 77.13 83.72 57.40 46.10 46.66
Sample size 30,234 24,940 24,937 17,899 14,839 14,824 12,335 10,101 10,113
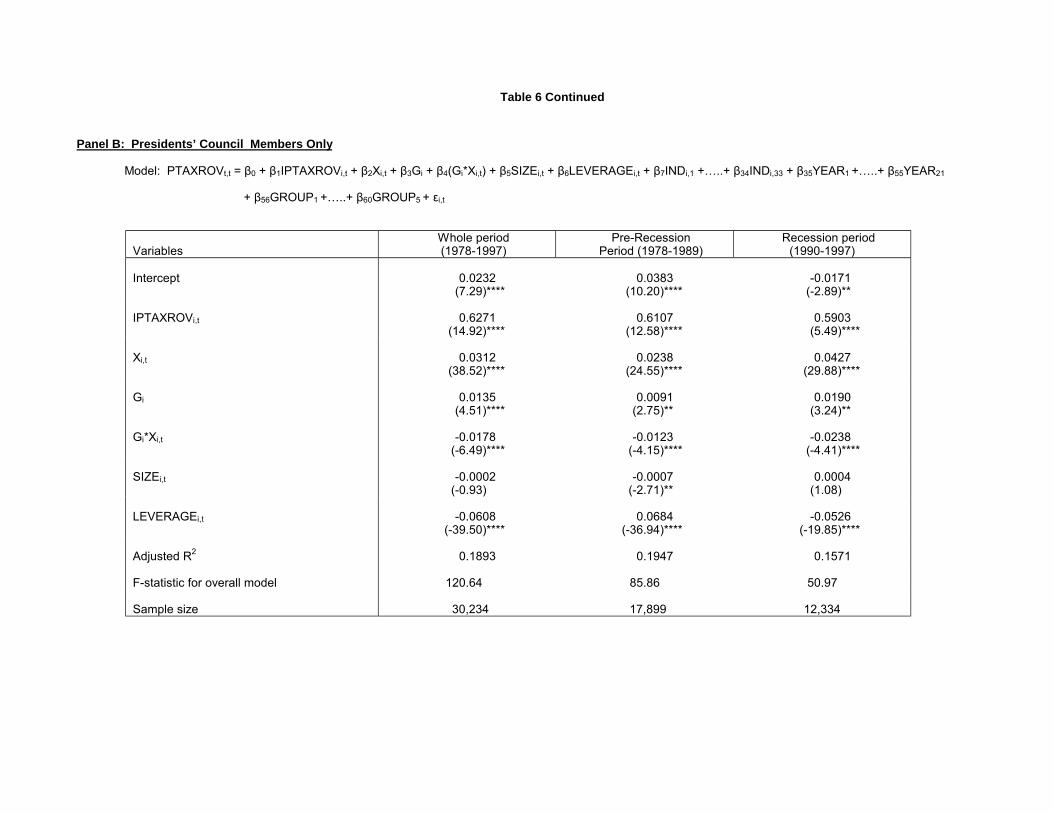
Table 6 Continued
Panel B: Presidents’ Council Members Only
Model: PTAXROVt,t = β0 + β1IPTAXROVi,t + β2Xi,t + β3Gi + β4(Gi*Xi,t) + β5SIZEi,t + β6LEVERAGEi,t + β7INDi,1 +�..+ β34INDi,33 + β35YEAR1 +�..+ β55YEAR21
+ β56GROUP1 +�..+ β60GROUP5 + εi,t
VariablesWhole period(1978-1997)
Pre-RecessionPeriod (1978-1989)
Recession period(1990-1997)
Intercept 0.0232(7.29)****
0.0383(10.20)****
-0.0171(-2.89)**
IPTAXROVi,t 0.6271(14.92)****
0.6107(12.58)****
0.5903(5.49)****
Xi,t 0.0312(38.52)****
0.0238(24.55)****
0.0427(29.88)****
Gi 0.0135(4.51)****
0.0091(2.75)**
0.0190(3.24)**
Gi*Xi,t -0.0178(-6.49)****
-0.0123(-4.15)****
-0.0238(-4.41)****
SIZEi,t -0.0002(-0.93)
-0.0007(-2.71)**
0.0004(1.08)
LEVERAGEi,t -0.0608(-39.50)****
0.0684(-36.94)****
-0.0526(-19.85)****
Adjusted R2 0.1893 0.1947 0.1571
F-statistic for overall model 120.64 85.86 50.97
Sample size 30,234 17,899 12,334


