Embed Size (px)
Citation preview

Tacrolimus treatment of plasmacytoid dendritic cells inhibitsdinucleotide (CpG-)-induced tumour necrosis factor-alpha secretion
Introduction
Immunosuppressive agents (IAs) are used currently to
reduce allograft rejection following organ transplanta-
tion1,2 and also in the treatment of several autoimmune
disorders and inflammatory diseases, such as rheumatoid
arthritis and atopic dermatitis.3,4 One of the most widely
used IAs is tacrolimus, a macrolide lactone antibiotic
obtained from a Japanese fungus (Streptomyces tsukuaben-
sis). Similar to cyclosporin A, the main effect of tacroli-
mus in T lymphocytes is the inhibition of the calcineurin
activity, although it binds to FKBP12, whereas cyclosporin
binds to cyclophilin A.5 These intracellular proteins form
a complex with calcium, calmodulin and calcineurin,
inhibiting the phosphatase activity of calcineurin. One of
the final consequences is the sequestration of phosphoryl-
ated-NF-AT in the cytoplasm and the inhibition of inter-
leukin (IL)-2 secretion by T cells. Several authors have
pointed out that IAs, including tacrolimus, may be also
affecting the immune response at the level of antigen
presentation,6,7 especially in dendritic cells (DCs).8–13 In
particular, CD34+-derived DCs cultured in the presence
of tacrolimus showed a poor capacity to stimulate allo-
geneic T cell responses and secreted low levels of IL-12.14
Also, monocyte-derived DCs (MDDCs) cultured in the
presence of tacrolimus display a reduced allostimulatory
capacity and impaired cytokine production, including
IL-12, IL-6 and tumour necrosis factor (TNF)-a,15,16
possibly affecting the nuclear factor (NF)-jB translocation
to the nucleus as shown in other cell types.17
The effect of different IAs has been studied mainly on
myeloid DCs. However, DCs form a heterogeneous family
Mar Naranjo-Gomez,1 Nuria
Climent,2 Joan Cos,3 Harold Oliva,2
Margarita Bofill,4 Jose M. Gatell,2
Teresa Gallart,2 Ricardo Pujol-
Borrell1 and Francesc E. Borras1
1Laboratory of Immunobiology for Research
and Diagnosis (LIRAD), Blood and Tissue
Bank (BST), Department of Cell Biology, Phys-
iology and Immunology, Universitat Autonoma
de Barcelona, Badalona, Barcelona, Spain,2Service of Immunology and Service of Infec-
tious Diseases and AIDS Unit, Hospital Clınic
de Barcelona. IDIBAPS-AIDS-Research Group,3Centre de Teixits i Terapia Cellular, BST,
Barcelona, and 4Institucio Catalana de Recerca
i Estudis Avancats (ICREA). IrsiCaixa Foun-
dation. Badalona, Barcelona, Spain
doi:10.1111/j.1365-2567.2006.02460.x
Received 8 April 2006; revised 24 July 2006;
accepted 24 July 2006.
Correspondence: Dr Francesc E. Borras,
LIRAD-Banc de Sang i Teixits, Institut
d’Investigacio Germans Trias i Pujol, Ctra.
del Canyet s/n, Edifici Escoles 08916,
Badalona, Barcelona, Spain.
Email: [email protected]
Summary
Tacrolimus is a widely used immunosuppressive agent. Although T cells
are the main targets of these pharmacological drugs, antigen presentation
may also be affected. Among antigen-presenting cells, plasmacytoid dend-
ritic cells (PDCs) are the main source of type I interferons upon microbial
challenge, and are involved in several diseases and autoimmune disorders.
The aim of this study was to evaluate whether tacrolimus can modulate
the function of PDCs in vitro. Maturation and function of PDCs was
determined using flow cytometry, enzyme-linked immunosorbent assay
and cytometry bead arrays. The effect of tacrolimus on PDCs was
observed mainly when the cells were pretreated with the immunosuppres-
sive agent before activation. Upon dinucleotide–oligodeoxynucleotide
(CpG–ODN) activation, tacrolimus pretreated PDCs showed a significant
reduction in the surface expression of co-stimulatory molecules and
human leucocyte antigen D-related (HLA-DR) and secreted reduced levels
of tumour necrosis factor (TNF)-a. These results show that tacrolimus
treatment of PDCs impairs CpG-induced activation, which could affect
the outcome of the immune response.
Keywords: autoimmunity; immunosupression; plasmacytoid dendritic cells;
tacrolimus; transplantation
488 � 2006 Blackwell Publishing Ltd, Immunology, 119, 488–498
I M M U N O L O G Y O R I G I N A L A R T I C L E

represented by two main populations, the myeloid and
the plasmacytoid subsets.18,19 Plasmacytoid DCs (PDCs)
are the main producers of type I interferons (IFN) upon
microbial infection, linking innate and adaptative
immune responses.20 In vitro, PDC may be activated by
CD40 ligation and/or dinucleotide (CpG) oligodeoxy-
nucleotide (CpG–ODN),21 inducing different types of
responses, including peripheral tolerance.22,23 CpG oligo-
deoxynucleotides are often used to induce PDC activation
via recognition of Toll-like receptor 9 (TLR9). It has
been shown that diverse CpG–ODNs may induce a differ-
ent type of maturation/activation on PDCs, especially
with regard to IFN-a secretion.21 PDCs may migrate con-
stitutively to lymph nodes in steady-state conditions.24
However, PDCs have been also found in different tissues
upon inflammation and in some autoimmune disorders,
such as rheumatoid and psoriatic arthritis.25 Importantly,
autoimmune disorders such as systemic lupus erythema-
tosus (SLE)26,27 and primary Sjogren’s syndrome28 are
also related to PDC function. This relation is based
mainly in the capacity of PDCs to secrete type I IFN,
the presence of factors inducing this function ) such as
anti-dsDNA antibodies29 in the serum of autoimmune
patients30 – and the consistent up-regulation of IFN-regu-
lated genes observed in SLE patients.31 Also, the induc-
tion of SLE-like syndromes in patients after type I IFN
treatment further confirmed the role of the cytokines and
PDCs in the etiology of the disorder. Often, patients
affected by lupus and other autoimmune diseases are
treated with corticosteroids, which have been shown to
reduce both the number of circulating cells and the ability
to produce IFN per PDC.32 In this regard, a recent study
exposed the role of dexamethasone in PDC-enhanced
apoptosis and suppression of differentiation from haema-
topoietic precursors.33
Due to the implication of PDCs in several autoimmune
disorders and their essential role in innate and adaptative
immunity, our aim was to investigate whether tacrolimus
could modulate PDC function. Our results show that
tacrolimus may affect the immune response induced by
PDCs through co-stimulatory blockade and impairment
in cytokine secretion.
Materials and methods
Cells
Human peripheral blood mononuclear cells (PBMC) were
isolated from apheresis products of healthy blood donors
from the Blood and Tissue Bank (BTB) by Ficoll-Paque
density gradient centrifugation (Lymphoprep, Axis Shield,
Oslo, Norway). Blood PDCs were enriched from PBMC
using the BDCA-4 cell isolation kit and the Automacs
device (Miltenyi Biotec, Bergisch Gladbach, Germany). In
some experiments PDCs were obtained by cell sorting, as
reported previously.34 In all samples, the purity and viab-
ility of the enriched PDCs was over 90%, as assessed by
expression of specific markers and trypan blue exclusion
or annexin V + 7-actinomycin D labelling (BD Bioscien-
ces, Oxford, UK), respectively. Naive cord blood T cells
(CbT) were obtained from umbilical cord blood units
(supplied by the Cord Bank of Barcelona) rejected for
banking owing to their low volume. Cord blood mono-
nuclear cells were obtained as in PBMCs and CD3+ T
lymphocytes were purified by negative selection (Miltenyi
Biotec). The purity of the CbT cells was 90–95% in all
experiments.
Oligodeoxynucleotides
Endotoxin-free phosphorothioate-modified stimulatory
CpG–ODNs (CpG-2216 and CpG-2006) (Invitrogen
Corporation, Paisley, UK) have been described previ-
ously.21 CpG–ODNs were resuspended in TE buffer, dilu-
ted in phosphate-buffered saline (PBS) and used as
indicated.
Monoclonal antibodies
The following murine monoclonal antibodies (mAbs) and
isotype controls were used: peridinin chlorophyll protein
(PerCP)-labelled CD3 and human leucocyte antigen
D-related (HLA-DR); fluorescein isothiocyanate (FITC)-
labelled CD4; phycoerythrin (PE)-labelled CD11c, CD80,
CD83, CD86 and CD123 (BD Biosciences); allophycocya-
nin (APC)-labelled IFN-c (Caltag Laboratories, Hamburg,
Germany); FITC-labelled anti-BDCA2 (Miltenyi Biotec);
and RPE-Cy5-labelled CD14, CD19 (Serotec Ltd, Kidling-
ton, UK).
Immunostaining and flow cytometry
Cells were washed, resuspended in 50 ll of buffer
[PBS + 0�1% bovine serum albumin (BSA)] and incuba-
ted with mAbs for 20 min at 4�. Cells were then washed,
resuspended in PBS and analysed in a FACSCalibur flow
cytometer using the standard CellQuestTM acquisition soft-
ware (BD Biosciences, Oxford, UK). Samples were gated
using forward (FSC) and side (SSC) scatter to exclude
dead cells and debris.
Cell culture media and reagents
A minimum of 50 000 PDCs were cultured in 200 ll in
flat-bottomed 96-well plates (Nunc, Roskilde, Denmark)
containing RPMI-1640 (Gibco, Invitrogen Corporation,
Paisley, UK) supplemented with 10% (v/v) heat-inacti-
vated fetal calf serum (FCS) (Gibco), 2 mM L-glutamine
(Sigma-Aldrich, St Louis, MO), 100 U/ml penicillin
(Cepa SL, Madrid, Spain), 100 lg/ml streptomycin
� 2006 Blackwell Publishing Ltd, Immunology, 119, 488–498 489
Tacrolimus effect on plasmacytoid DCs

(Laboratorios Normon SA, Madrid, Spain), 250 ng/ml
Fungizone� (Sigma-Aldrich) and recombinant human
IL-3 (Peprotech, London, UK) used at 25 ng/ml. Tacrolimus
(PROGRAF�; Fujisawa Ireland Limited, Killorglin, Ire-
land) was used mainly at 5 lM, based on published obser-
vations.11 Other doses are indicated in each experiment.
CpG–ODNs were used at 50 lg/ml to yield maximal
activity and were added at the indicated time-points.
After the incubation, supernatants were collected and
cells counted using perfect count beads (BD Bioscien-
ces). Dead cells were excluded by size and annexin V
detection.
Cytokine analyses
Cytokines were determined on supernatants using the
cytometric bead array (CBA) assay (BD Biosciences).
PDCs secreted IFN-a was determined on supernatants
using an enzyme-linked immunosorbent assay (ELISA) kit
(Bender Medisystems, Vienna, Austria) following the
manufacturer’s instructions. The presence of tacrolimus
in supernatants was analysed using a specific immuno-
assay (IMX system, tacrolimus II; Abbott Diagnostics,
Madrid, Spain).
Relative mRNA expression by real-time polymerasechain reaction (RT–PCR)
Total RNA was extracted from cells using TRIzol reagent
(Sigma-Aldrich) according the manufacturer’s protocol.
Aliquots of 1 lg total RNA, 0�5 lg of oligo-(dT) (Sigma-
Aldrich) as primers and 2 ll dNTPs (mix, 5 mM each;
Sigma-Aldrich) were dissolved with sterile RNAse-free
water until 12 ll, heated at 65� for 5 min and cooled at
4�. Then, 4 ll of first-strand buffer 5· (250 mM Tris-HCl,
375 mM KCl, 15 mM MgCl, pH 8�3; Invitrogen), 2 ll of
100 mM dithiothreitol (Invitrogen) and 1 ll of RNAse
inhibitor (RNasa OUT; Invitrogen) were added and incu-
bated at 42� for 2 min. The reaction was started adding
1 ll (200 units) of SuperScript II RT (Invitrogen), incu-
bated at 42� for 50 min and finished at 70� for 15 min.
The cDNAs were amplified using a commercially available
kit (LightCycler FastStart DNA MasterPLUS SYBR Green
I; Roche). Each reaction was carried out with 2 ll of
cDNA, 4 ll of 5· Master Mix (FastStart DNA Master-
PLUS SYBR Green I), 0�5 lM of each primer and sterile
RNAse-free water at final volume of 20 ll. RT–PCR was
carried out for 35 cycles using the LightCycler instrument
(Roche). Specific primers were selected according to the
GenBank database resource. Primers and PCR conditions
were as follows: TNF-a: amplimer 266 base pairs (bp),
forward: 50-CTT CTC CTT CCT GAT CGT GC-30,
reverse: 50-GCT GGT TAT CTC TCA GCT CCA-30 5 sec-
onds at 95�, 5 s annealing at 60�, 11 seconds at 72�, and
acquire for 4 seconds at 84�); b2-mycroglobulin: amplimer
107 bp, forward: 50-ACA CAA CTG TGT TCA CTA
GC-30, reverse: 50-CAA CTT CAT CCA CGT TCA CC-30
5 seconds at 95�, 10 s annealing at 58�, 4 seconds at 72�,
and acquire for 4 seconds at 85�). b2-mycroglobulin
mRNA levels were used as an endogenous control to nor-
malize mRNA quantities. The relative mRNA levels of
TNF-a were calculated as 2)(Ct TNF-a ) Ct b2-mycroglobulin).
Allostimulatory assays
Allostimulatory conditions were set up following previous
results.34 Briefly, allogeneic 5 · 104 CbT cells were stimu-
lated in vitro with the indicated PDCs at a 10:1 ratio dur-
ing 4 days. Previously, PDCs were washed three times
with an excess of PBS + 0�1% BSA to exclude dead cells
and debris and to minimize the direct effect of tacrolimus
on CbT cells. Cell proliferation was assessed using the
carboxyfluorescein diacetate succinimidyl ester (CFSE)-
based (Molecular Probes Europe, Leiden, the Nether-
lands) flow cytometry assay. Briefly, 5 · 106 isolated CbT
cells were resuspended in 1 ml PBS + 0�1% BSA and
incubated with an equal volume of 1�25 lM CFSE. After
10 min, unbound dye was quenched with an equal vol-
ume of RPMI-1640 + 10% FCS at 37�. Labelled cells were
washed twice in RPMI-1640 + 10% FCS before placing in
culture. Alloproliferative CbT cells were determined as the
CFSE-low/negative population by FACS analyses (BD Bio-
sciences). The number of cell divisions was estimated by
gating the cells in areas based on the non-proliferating T
cells area (as shown in Fig. 4b).
Intracellular cytokines
Day 4 alloproliferative CbT cells were washed and restim-
ulated for 5 hr with phorbol-12-myristate 13-acetate
(PMA) (50 ng/ml) and ionomycin (500 ng/ml) in the
presence of monensin (2�5 lg/ml). Then cells were
washed, fixed and permeabilized using the IntraStain kit
(Dako Cytomation, Glostrup, Denmark). Finally, cells
were labelled with anti-IFN-c allophycocyanin (APC)
mAbs (Caltag Laboratories) or the corresponding isotype
control.
Statistical analysis
Results are expressed as the mean ± standard deviation
(SD). Comparison between groups was conducted using
the Wilcoxon test for paired nonparametric data and the
paired t-test for parametric data after confirming normal
distribution by the Kolmogorov–Smirnov test, as indi-
cated. Unpaired observations were analysed by Mann–
Whitney test (nonparametric data) and unpaired t-test
(parametric data), respectively. Analyses were performed
using SigmaStat version 3�0 software (SPSS, Ekrath, Ger-
many). A value of P < 0�05 was considered significant.
490 � 2006 Blackwell Publishing Ltd, Immunology, 119, 488–498
M. Naranjo-Gomez et al.

Results
Tacrolimus does not modify the viability andphenotype of unactivated cultured PDCs and doesnot block CpG activation of PDCs
Freshly isolated PDCs were defined as CD4+ HLADR+
CD14–CD19–CD11c– and confirmed by the expression of
the PDC-specific marker BDCA-2. Immaturity of cells
was demonstrated by the low expression of co-stimulatory
molecules (CD80 and CD86) and the absence of CD83
(Fig. 1a). Cells were cultured in complete medium in the
presence or absence of tacrolimus. After 48 hr, non-acti-
vated PDCs showed a similar phenotype (data not shown)
and survival (46 ± 12% versus 41 ± 16%, n ¼ 6, ns) in
both conditions, indicating that tacrolimus did not affect
the viability of the cells. As expected, the addition of
CpG–ODN at the onset of the culture period increased
the survival of PDCs and induced the activation of PDCs,
as revealed by the up-regulation of HLA-DR and co-stim-
ulatory molecules (Fig. 1b). Activation was not blocked
by the presence of tacrolimus, although CD86 expression
did not reach the levels of the CpG-activated controls. An
unexpected observation was a reduced survival of PDCs
in the presence of tacrolimus only upon CpG2216 activa-
tion (49 ± 7% versus 26 ± 1%, n ¼ 3, P ¼ 0�006, paired
t-test). In contrast, this reduction was less evident when
CpG 2006 was used in the same conditions (62 ± 10%
versus 55 ± 13%, n ¼ 4, ns).
Tacrolimus-pretreated PDCs (Tp-PDCs) show loweractivation and secretion of inflammatory cytokines
As tacrolimus pretreatment could affect PDCs survival
upon activation, dose-viability experiments were per-
formed. Isolated PDCs were cultured in the absence or
presence of tacrolimus (tacrolimus-pretreatment, Tp).
After 48 hr, CpG–ODNs were added to the cultures to
induce activation of PDCs and the cells were incubated
further for 48 hr (Tp-CpG PDCs). In these experiments,
the recovered cells were counted using perfect count
beads (Fig. 2a). A significant reduction of cell numbers
was detected in CpG2216 activated Tp-PDCs at the higher
dose of tacrolimus used (5 lM) (23416 ± 6149 versus
13805 ± 3560, n ¼ 7, P < 0�002, paired t-test). Also, a
slightly reduced cell survival was detected in CpG2006
activated Tp-PDCs, although this was not found signifi-
cant. At lower doses, the survival of activated Tp-PDCs
was not different compared to activated controls, suggest-
ing a direct implication of the drug in the activation-
induced cell death. However, in the absence of CpG
activation, the higher dose of tacrolimus used did not
affect PDCs survival (Fig. 2a). Importantly, over 90% of
PDCs contained in the living gate in all situations were
annexin V negative, suggesting that they were not prone
to cell death (Fig. 2b). These cells were used later as sti-
mulators in alloresponse experiments.
In all experiments, the majority of cells were positive
for the analysed markers upon activation. However,
Tp-CpG PDCs showed reduced levels of HLA-DR, CD80
and CD86 compared to their fully activated controls
(Fig. 2c). This effect was independent of the CpG–ODN
used, and was marked specially on the expression of
CD80. Finally, supernatants of the cultured Tp-CpG
PDCs and controls were analysed to evaluate the presence
100 101 102 103 104
BDCA-2100 101 102 103 104
HLA-DR100 101 102 103 104
CD123
100 101 102 103 104
CD80100 101 102 103 104
CD83
P = 0·01
P = 0·01
P = 0·01
P = 0·007
1600
(b)
(a)
1200
800
400
0
500
400
300
200
100– –
– + +
+Tacrolimus
CpG 2006
HLA
-DR
(M
FI)
CD
86 (
MF
I)
100 101 102 103 104
CD86
Figure 1. Assessment of plasmacytoid dendritic cells (PDCs) pheno-
type upon isolation and after dinucleotide–oligodeoxynucleotide
(CpG–ODN) activation. (a) The phenotype of PDCs upon isolation.
Isotype controls are shown in grey. (b) PDCs were cultured for
48 hr in the presence of interleukin (IL)-3, tacrolimus and CpG–
ODN as indicated. After the incubation period, the expression of
human leucocyte antigen D-related (HLA-DR) and CD86 was ana-
lysed by flow cytometry. Each symbol represents an independent
sample. Significant differences are indicated in the figure (n � 5,
paired t-test).
� 2006 Blackwell Publishing Ltd, Immunology, 119, 488–498 491
Tacrolimus effect on plasmacytoid DCs

of proinflammatory cytokines. The results, summarized in
Table 1, showed a consistent (14 of 16 experiments) and
important reduction (up to 85%) in the secreted levels of
TNF-a by Tp-PDCs stimulated by CpG. In CpG2216-
stimulated cultures secretion of IL-6 was also reduced
(Fig. 3a). However, overall this reduction was quantita-
tively less important, and only four of 13 experiments
showed values below 50% compared to controls. Finally,
the presence of tacrolimus did not significantly affect the
levels of secreted IFN-a (Fig. 3a).
Pretreatment CpG
IL-3
IL-3
IL-3
IL-3 + Tacrol 5 µM
IL-3 + Tacrol 5 µM
IL-3 + Tacrol 0·5 µM
IL-3 + Tacrol 0·05 µM
IL-3 + Tacrol 5 µM
none
none
2216
2216
2216
2216
2006
2006
0 10 000 20 000
Cell number
CpG2006
30 000 40 000
PDC + CpG 2216
R1
0
**
200 400 600 800 1000 0 200 400 600 800 1000
0 200 400 600 800 1000 0 200 400 600 800 1000Forward scatter
CpG2216
2000
1500
1000
500
1250
750
250
0
0
– +
Tacrolimus pretreatment – +
Tacrolimus pretreatment
50
100
150
200
500
1000
P = 0·03
P = 0·035
P = 0·018P = 0·046
P = 0·039
R1
Sid
e sc
atte
r
0
104
103
102
101
100
200
400
600
800
1000
Ann
exin
V P
E
HLA
-DR
(M
FI)
2000
1500
1000
500
HLA
-DR
(M
FI)
CD
86 (
MF
I)750
250
0
500
1000
CD
86 (
MF
I)
CD
80 (
MF
I)
0
50
100
150
200
CD
80 (
MF
I)
TP-PDC + CpG 2216
(a)
(b)
(c)
Figure 2. Tacrolimus pretreatment impairs plasmacytoid dendritic cells (PDC) survival and maturation upon dinucleotide (CpG) activation.
PDCs were cultured during 48 hr in the presence of interleukin (IL)-3 and tacrolimus at the concentrations indicated. After this pretreatment,
dinucleotide–oligodeoxynucleotide (CpG–ODNs) were added and cells further incubated during 48 hr. (a) The number of viable cells in each
condition (mean ± SD of at least four independent experiments) recovered at the end of this period as determined by perfect count. The cells
contained in the R1 gate were mainly annexin V negative (a single representive experiment is shown in panel b). (c) The expression of the indi-
cated markers was analysed after the activation period. Each symbol represents an individual sample. Black symbols represent cells activated by
CpG–ODN 2006 and white symbols represent cells activated by CpG–ODN 2216. Significant differences are shown by the indicated P-value
(n � 4, paired t-test).
492 � 2006 Blackwell Publishing Ltd, Immunology, 119, 488–498
M. Naranjo-Gomez et al.

As the impaired survival observed in 5 lM Tp-PDCs
could account for the reduced secretion of some cytokines,
i.e. TNF-a, and to investigate further the involvement of
tacrolimus in the reduced cytokine secretion, PDCs were
pretreated with two different doses of the drug for 12 hr.
Then CpG2216 was added to cultures and both mRNA
and protein levels were analysed in short-term cultures
(up to 8 hr upon activation). Under these experimental
conditions, in which cell viability was not affected, 5 lM
Tp-PDCs showed an important reduction in the TNF-amRNA levels. When used at lower doses, this reduction
was no longer detected (Fig. 3b). Accordingly, protein lev-
els were also reduced in these conditions (about 60%, data
not shown), indicating that tacrolimus was indeed affect-
ing TNF secretion by PDCs at the transcriptional level.
Tp-PDCs are poor inducers of allostimulation
We next studied whether the defect on maturation
observed in Tp-PDCs was affecting their allogeneic stimu-
latory capacity. As before, Tp-PDCS were activated with
CpG2216 for 48 hr. Cells were then recovered and washed
extensively. PDCs included in the living gate were coun-
ted and added to fresh U-bottomed wells in which CFSE-
labelled naive CbT cells had been dispensed. As shown
before, cells included in the living gate were not prone to
3000(a)
(b)
** *
2000
1000
TN
F-a
lpha
(pg
/ml)
Inte
rleuk
in-6
(pg
/ml)
Inte
rfer
on-a
lpha
(pg
/ml)
00 5 0·5 0
Tacrolimus pretreatment (µM)
Tacrolimus pretreatment (µM)
% T
NF
-alp
ha m
RN
Aex
pres
sion
5 0·5 0 5 0·5
0 5 0·5
3000
2000
1000
0
100
75
50
25
0
3000
2000
1000
0
Figure 3. Tumour necrosis factor (TNF)-a secretion by activated plasmacytoid dendritic cells (PDCs) is impaired by tacrolimus pretreatment.
(a) PDCs were incubated during 48 hr in the presence of interleukin (IL)-3 and tacrolimus at the dose indicated. After this pretreatment,
dinucleotide–oligodeoxynucleotide (CpG–ODNs) were added. After the additional 48 hr of incubation, supernatants were recovered. Indicated
cytokines were determined either by enzyme-linked immunosorbent assay or cytometric bead array (CBA). Each symbol represents an individual
sample. Significant differences are indicated (*P < 0�05, paired t-test). (b) Cells were pretreated with the indicated dose of tacrolimus for 12 hr.
Then CpG–ODN were added and cells incubated further during 6–8 hr before mRNA was extracted. The expression of TNF-a mRNA is shown
as the relative proportion (TNF-a/b2 m) normalized to the maximum level of stimulation (CpG-activated non-pretreated PDCs). The
mean ± SD of two independent experiments is shown.
Table 1. Cytokine secretion by tacrolimus-
pretreated plasmacytoid dendritic cells (Tp-
PDCs). The indicated cytokines (pg/ml) were
determined in supernatants after culture. The
number of independent experiments is indica-
ted (n). Statistical differences are indicated by
the P-value (paired t-test)
Cytokine secretion (pg/ml)
CpG 2006 CpG2216
Control
Tacrolimus
(5 lm) P n Control
Tacrolimus
(5 lm) P n
TNF-a 126 ± 46 69 ± 47 0�02 4 871 ± 400 538 ± 496 0�002 12
IL-6 752 ± 504 716 ± 491 ns 3 1138 ± 562 947 ± 605 0�02 10
IFN-a 212 ± 186 198 ± 249 ns 3 1540 ± 571 1059 ± 457 ns 9
CpG: dinucleotide; IFN: interferon; IL: interleukin; TNF: tumour necrosis factor.
� 2006 Blackwell Publishing Ltd, Immunology, 119, 488–498 493
Tacrolimus effect on plasmacytoid DCs

cell death (Fig. 2b). After 96 hr, cells contained in the
living gate (R1) were analysed and the proportion of
proliferating T cells was significantly lower in allogeneic
cultures induced by activated Tp-PDCs than in activa-
ted control PDCs (39 ± 18% versus 20 ± 14%, n ¼ 8,
P ¼ 0�0003, paired t-test) (Fig. 4). Similar results were
obtained with CpG2006 (data not shown). PDCs pretreat-
ed with a lower dose of tacrolimus (0�5 lM) still showed
a reduced capacity to induce allogeneic T cell prolifer-
ation compared to untreatred controls (28 ± 5%, n ¼ 4,
P ¼ 0�02, paired t-test). In these experiments, the higher
proportion of proliferating T cells in control cultures had
suffered three divisions, whereas Tp-PDCs-stimulated T
cells reached only two divisions in the same period
(Fig. 4). Additionally, the presence of tacrolimus in 24-hr
and 48-hr mixed lymphocyte culture (MLC) supernatants
was determined. Although all measured values were below
the negative control (data not shown), technical limita-
tions (lower detection limit was 1�8 nM) do not permit to
completely rule out the possibility of a carryover effect.
T cells responding to Tp-PDCS show impairedcytokine production
To gain some knowledge of the cytokines secreted by
these responding cells, CFSE-low alloproliferative T
lymphocytes were re-stimulated with PMA + ionomycin
and the production of IFN-c was measured by intracellu-
lar staining. The capacity of responder T cells to produce
IFN-c was almost completely abrogated in cultures where
activated Tp-PDCs were used as stimulators compared
to controls (Fig. 5). As before, the effect was equally
observed when both CpG 2216 or 2006 were used to acti-
vate PDCs. Also, CBA analyses of allogeneic culture
supernatants stimulated with CpG2216 confirmed these
results (Fig. 5d). In general, pretreatment of PDC with
SS
C
% P
rolif
erat
ion
% T
cel
l Pro
lifer
atio
n
Eve
nts
52
0100 101 102
CFSE
***
*
d5 d4 d3 d2 d1 d0
d5d6 d4 d3 d2 d1 d0
FSC
80
R1
(a)
(c) (d)
(b)
60
40
20
0
75
90
60
45
30
15
0
103 104
0 5 0·5 0·05
Tacrolimus pretreatment (µM)Cell divisions
Figure 4. Allostimulatory capacity of dinucleotide (CpG)-activated tacrolimus-pretreated plasmacytoid dendritic cells (Tp-PDCs). PDCs were incu-
bated during 48 hr in the presence of interleukin (IL)-3 alone or IL-3 plus tacrolimus. After this pretreatment period, dinucleotide–oligodeoxynucleo-
tide (CpG–ODNs) were added to induce cell activation. After 48 hr, cells were recovered, washed and counted before allostimulatory experiments
were set up, using carboxyfluorescein diacetate succinimidyl ester (CFSE)-labelled cord blood T cell (CbT) lymphocytes as responders. After 4 days,
cells contained in the living gate (R1 in panel a) were analysed for CFSE labelling. (b) The loss of CFSE in proliferating T cells (gated in R1) in a
single representative experiment. The thick line represents the proliferation of T cells responding to activated PDCs (control), whereas the grey area
represents the proliferation of T cells responding to Tp-activated PDCs. (c) Number of cell divisions was estimated based on the area of CFSE-
labelled non-proliferating cells. The dotted line shows the non-stimulated control. Circles (black CpG2006 stimulated-PDCs, white CpG2006 stimu-
lated Tp-PDCS) show the number of cell divisions and the proportion of proliferating T cells. Each symbol represents the mean of at least three
independent determinations. A representative experiment of nine is shown. (d) Summary of results of the alloproliferation experiments induced by
CpG2216 activated PDCs pretreated or not with tacrolimus at the concentrations indicated. Proliferation is represented as the percentage of CFSE-
low T cells. Each symbol represents an individual experiment (mean of at least two replicates). Significant differences are indicated (*P < 0�05,
paired t-test).
494 � 2006 Blackwell Publishing Ltd, Immunology, 119, 488–498
M. Naranjo-Gomez et al.
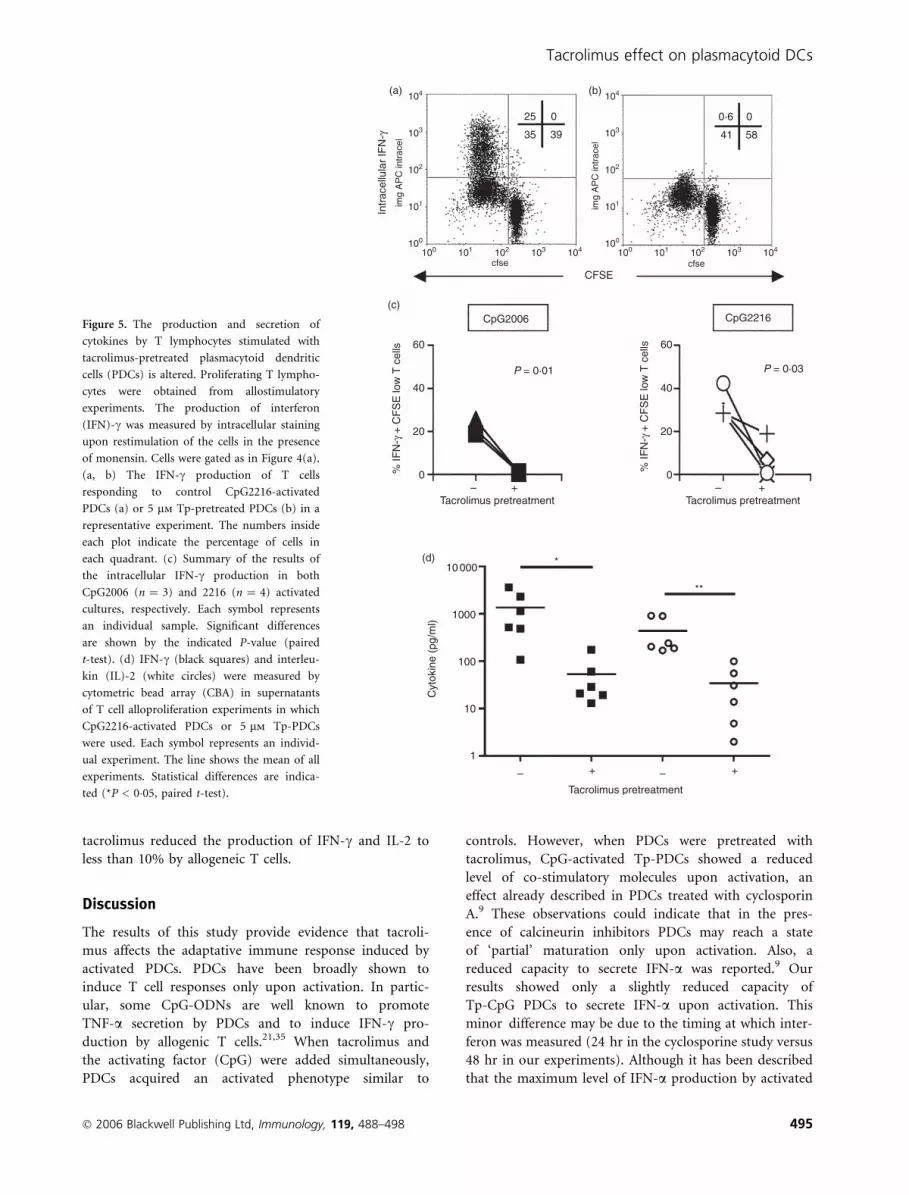
tacrolimus reduced the production of IFN-c and IL-2 to
less than 10% by allogeneic T cells.
Discussion
The results of this study provide evidence that tacroli-
mus affects the adaptative immune response induced by
activated PDCs. PDCs have been broadly shown to
induce T cell responses only upon activation. In partic-
ular, some CpG-ODNs are well known to promote
TNF-a secretion by PDCs and to induce IFN-c pro-
duction by allogenic T cells.21,35 When tacrolimus and
the activating factor (CpG) were added simultaneously,
PDCs acquired an activated phenotype similar to
controls. However, when PDCs were pretreated with
tacrolimus, CpG-activated Tp-PDCs showed a reduced
level of co-stimulatory molecules upon activation, an
effect already described in PDCs treated with cyclosporin
A.9 These observations could indicate that in the pres-
ence of calcineurin inhibitors PDCs may reach a state
of ‘partial’ maturation only upon activation. Also, a
reduced capacity to secrete IFN-a was reported.9 Our
results showed only a slightly reduced capacity of
Tp-CpG PDCs to secrete IFN-a upon activation. This
minor difference may be due to the timing at which inter-
feron was measured (24 hr in the cyclosporine study versus
48 hr in our experiments). Although it has been described
that the maximum level of IFN-a production by activated
Figure 5. The production and secretion of
cytokines by T lymphocytes stimulated with
tacrolimus-pretreated plasmacytoid dendritic
cells (PDCs) is altered. Proliferating T lympho-
cytes were obtained from allostimulatory
experiments. The production of interferon
(IFN)-c was measured by intracellular staining
upon restimulation of the cells in the presence
of monensin. Cells were gated as in Figure 4(a).
(a, b) The IFN-c production of T cells
responding to control CpG2216-activated
PDCs (a) or 5 lm Tp-pretreated PDCs (b) in a
representative experiment. The numbers inside
each plot indicate the percentage of cells in
each quadrant. (c) Summary of the results of
the intracellular IFN-c production in both
CpG2006 (n ¼ 3) and 2216 (n ¼ 4) activated
cultures, respectively. Each symbol represents
an individual sample. Significant differences
are shown by the indicated P-value (paired
t-test). (d) IFN-c (black squares) and interleu-
kin (IL)-2 (white circles) were measured by
cytometric bead array (CBA) in supernatants
of T cell alloproliferation experiments in which
CpG2216-activated PDCs or 5 lm Tp-PDCs
were used. Each symbol represents an individ-
ual experiment. The line shows the mean of all
experiments. Statistical differences are indica-
ted (*P < 0�05, paired t-test).
� 2006 Blackwell Publishing Ltd, Immunology, 119, 488–498 495
Tacrolimus effect on plasmacytoid DCs

PDCs may be around 24 hr,20,21 it is possible that incuba-
tion with the immunosuppressive agent may delay the pro-
duction and secretion of the cytokine, which may
accumulate and be detected at 48 hr. Also, tacrolimus pre-
treatment could modulate TLR9 levels on PDCs. In this
sense, no differences were found in intracellular staining
experiments using monoclonal antibodies to TLR-9
between tacrolimus-treated PDCs and controls (data not
shown). This observation is in tune with those reported for
other immunosuppressive agents, such as dexamethasone.33
Secretion of TNF-a and IL-6, both negatively regulated
by calcineurin inhibitors in myeloid DCs,15,16 was also
studied. TNF-a secretion showed a consistent and signifi-
cant reduction in Tp-CpG PDCs. The secretion of IL-6
was also reduced significantly, although to a much lesser
extent. Tacrolimus, as other calcineurin inhibitors, blocks
the binding of nuclear factor (NF)-jB to their regulatory
domains.8 The promoter regions of TNF-a and IL-636,37
contain NF-jB regulatory domains. Interestingly, the
NF-jB domain in the IL-6 promoter functions as a
potent IL-1/TNF-a-responsive element in myeloid cells.38
In addition, NF-jB activation is crucial for TNF produc-
tion.39 Recently, in NF-jB(–/–) mice, it has been shown
that murine pDCs produced type I interferon but not
IL-6.40 In our system, IL-6 secretion by PDCs was impaired
importantly only when TNF-a levels were reduced dras-
tically (> 80% reduction). These results further suggest
TNF-a as one of the potential regulators of IL-6 secretion
by PDCs. Also, a cross-regulation between TNF-a and
IFN-a has been suggested in autoimmune diseases.41 It is
considered that TNF-a may block IFN-a secretion, a
capacity owned by immature PDCs, by inducing PDC
maturation. Consequently, TNF blockade is thought to
impair PDC maturation, thus indirectly promoting IFN-asecretion. Our results show that tacrolimus treatment
impaired TNF-a secretion by PDCs and affected PDC
maturation, but did not increase IFN-a secretion upon
activation. This is due most probably to the multiple fac-
tors affected by tacrolimus on PDCs that can modulate
IFN-a secretion, rendering basal or even lower levels of
type I IFN upon stimulation.
Of note, tacrolimus-pretreated PDCs showed a dose-
dependent impaired survival exclusively upon activation.
Glucocorticoids33 but not cyclosporin A9 have been
shown to induce apoptosis in PDCs. As NF-jB transloca-
tion is related to PDC survival,40 it is possible that block-
ade of this factor may be involved in the induction of
apoptosis on PDCs upon activation.
With regard to allogeneic T cell responses, both pro-
liferation and cytokine secretion were clearly impaired
when Tp-CpG PDCs were used as stimulators. A putative
carryover effect of tacrolimus, suggested in MDDC
cultures,15 could also be affecting these MLCs. In our
titration experiments 1 nM tacrolimus affected only 1% of
PMA + ionomycin-induced T cell proliferation (data not
shown). However, it has been reported that murine T cell
proliferation and IFN-c secretion were reduced by
approximately 50% using 1 nM tacrolimus.12 Using a
commercial immunoassay we could not detect tacrolimus
in supernatants from 24-hr and 48-hr MLCs, although
due to technical limitations we cannot completely exclude
that minute amounts of tacrolimus would still be present
in those cultures and may affect, at least partially, the
outcome of the alloresponse. However, other factors, such
as the lower expression of HLA-DR and co-stimulatory
molecules on Tp-activated PDCs and the reduced secre-
tion of cytokines such as TNF-a, may also account for
the functional impairment exhibited by these cells. Also,
in the context of an immune response, the reduced secre-
tion of proinflammatory cytokines such as TNF-a may
have an autoparacrine activity to direct the PDCs final
differentiation and also affect the function of other cells,
such as monocytes, neutrophils or endothelial cells.
In conclusion, tacrolimus pretreatment importantly
affected the secretion of TNF-a by PDCs upon activa-
tion. TNF blockade using monoclonal antibodies is an
alternative approach to control autoimmune disorders,
but it may induce the secretion of IFN-a by PBMCs,
and particularly PDCs.41 In fact, 0�2% of rheumatoid
arthritis patients on TNF-blockade treatment have
developed symptoms of SLE, including increased anti-
dsDNA antibodies.42 Regulation of IFN-a secretion may
be crucial in some autoimmune disorders such as SLE,
where increased levels of IFN-a are found routinely.
Use of tacrolimus, providing reduced levels of TNF-aand a moderate decrease in IFN-a secretion, may be an
alternative choice in these situations. Studies on samples
from patients under continuous immunosuppressive
therapy would further clarify the role of IAs in PDCs
function.
Acknowledgements
The authors would like to thank Dr Carlos Margarit
(Unitat de Cirurgia Hepato-Bilio-Pancreatica i Trasplan-
tament Hepatic, Hospital Universitari Vall d’Hebron)
for kindly providing tacrolimus; also Dr Alejandro
Olive (Rheumatology Unit, Hospital U. Germans Trias i
Pujol) for critically revising the manuscript, and Ms
Laura Ocana (Centre de Teixits i Terapia Cellular, BST)
for helpful discussions. We also thank Drs Cruz Pastor
and Susana Montes (Hospital U. Germans Trias i
Pujol) for tacrolimus determinations. This work was
supported partially by grants from the ‘Fondo de Inves-
tigaciones Sanitarias’ FIS 01/3120 and FIS 03/0142 to
F.E.B. and ‘Red Tematica de Investigacion en SIDA
(Red de grupos 173)’ to M.B. M.N.G is supported by
grant FIS 03/0142. F.E.B. is supported by contract FIS
01/3120 from the BST in collaboration with the Spanish
Health Department.
496 � 2006 Blackwell Publishing Ltd, Immunology, 119, 488–498
M. Naranjo-Gomez et al.

References
1 Hariharan S, Johnson CP, Bresnahan BA, Taranto SE, McIntosh
MJ, Stablein D. Improved graft survival after renal transplantation
in the United States 1988–96. N Engl J Med 2000; 342:605–12.
2 Fung JJ. Tacrolimus and transplantation: a decade in review.
Transplantation 2004; 77 (9 Suppl.):S41–3.
3 Tugwell P, Bombardier C, Gent M et al. Low-dose cyclosporin
versus placebo in patients with rheumatoid arthritis. Lancet
1990; 335:1051–5.
4 Cheer SM, Plosker GL. Tacrolimus ointment. A review of its
therapeutic potential as a topical therapy in atopic dermatitis.
Am J Clin Dermatol 2001; 2:389–406.
5 Liu J, Farmer JD, Lane WS, Friedman J, Weissman I, Schreiber
SL. Calcineurin is a common target of cyclophilin–cyclosporin A
and FKBP-FK506 complexes. Cell 1991; 66:807–15.
6 Jirapongsananuruk O, Leung DY. The modulation of B7.2 and
B7.1 on B cells by immunosuppressive agents. Clin Exp Immunol
1999; 118:1–8.
7 Wasowska BA, Zheng XX, Strom TB, Kupieck-Weglinski JW.
Adjunctive rapamycin and CsA treatment inhibits monocyte/
macrophage associated cytokines/chemokines in sensitized car-
diac graft recipients. Transplantation 2001; 71:1179–83.
8 Lee JI, Ganster RW, Geller DA, Burckart GJ, Thomson AW,
Lu L. Cyclosporine A inhibits the expression of costimulatory
molecules on in vitro-generated dendritic cells: association
with reduced nuclear translocation of nuclear factor kappa B.
Transplantation 1999; 68:1255–63.
9 Tajima K, Amakawa R, Ito T, Miyaji M, Takebayashi M, Fuku-
hara S. Immunomodulatory effects of cyclosporin A on human
peripheral blood dendritic cell subsets. Immunology 2003;
108:321–8.
10 Vieira PL, Kalinski P, Wierenga EA, Kapsenberg ML, de Jong
EC. Glucocorticoids inhibit bioactive IL-12p70 production by
in vitro-generated human dendritic cells without affecting their T
cell stimulatory potential. J Immunol 1998; 161:5245–51.
11 Cos J, Villalba T, Parra R et al. FK506 in the maturation of
dendritic cells. Haematologica 2002; 87:679–87; discussion 687.
12 Matsue H, Yang C, Matsue K, Edelbaum D, Mummert M, Taka-
shima A. Contrasting impacts of immunosuppressive agents
(rapamycin, FK506, cyclosporin A, and dexamethasone) on
bidirectional dendritic cell–T cell interaction during antigen
presentation. J Immunol 2002; 169:3555–64.
13 Lee YR, Yang IH, Lee YH, Im SA, Song S et al. Cyclosporin A
and tacrolimus, but not rapamycin, inhibit MHC-restricted anti-
gen presentation pathways in dendritic cells. Blood 2005;
105:3951–5.
14 Shimizu K, Fujii S, Fujimoto K, Kawa K, Yamada A, Kawano F.
Tacrolimus (FK506) treatment of CD34+ hematopoietic progen-
itor cells promote the development of dendritic cells that drive
CD4+ T cells toward Th2 responses. J Leukoc Biol 2000; 68:633–
40.
15 Woltman AM, de Fijter JW, Kamerling SW, Paul LC, Daha MR,
van Kooten C. The effect of calcineurin inhibitors and cortico-
steroids on the differentiation of human dendritic cells. Eur J
Immunol 2000; 3:1807–12.
16 Szabo G, Gavala C, Mandrekar P. Tacrolimus and cyclosporine
A inhibit allostimulatory capacity and cytokine production of
human myeloid dendritic cells. J Invest Med 2001; 49:442–9.
17 Tunon MJ, Sanchez-Campos S, Gutierrez B, Culebras JM, Gon-
zalez-Gallego J. Effects of FK506 and rapamycin on generation
of reactive oxygen species, nitric oxide production and nuclear
factor kappa B activation in rat hepatocytes. Biochem Pharmacol
2003; 66:439–45.
18 Robinson SP, Patterson S, English N, Davies D, Knight SC, Reid
CD. Human peripheral blood contains two distinct lineages of
dendritic cells. Eur J Immunol 1999; 29:2769–78.
19 O’Doherty U, Peng M, Gezelter S et al. Human blood contains
two subsets of dendritic cells, one immunologically mature and
the other immature. Immunology 1994; 82:487–93.
20 Siegal FP, Kadowaki N, Shodell M et al. The nature of the prin-
cipal type 1 interferon-producing cells in human blood. Science
1999; 284:1835–7.
21 Krug A, Rothenfusser S, Hornung V et al. Identification of
CpG oligonucleotide sequences with high induction of IFN-
alpha/beta in plasmacytoid dendritic cells. Eur J Immunol
2001; 3:2154–63.
22 Grouard G, Rissoan MC, Filgueira L, Durand I, Banchereau J,
Liu YJ. The enigmatic plasmacytoid T cells develop into
dendritic cells with interleukin (IL)-3 and CD40-ligand. J Exp
Med 1997; 185:1101–11.
23 Colonna M, Trinchieri G, Liu YJ. Plasmacytoid dendritic cells in
immunity. Nat Immunol 2004; 5:1219–26.
24 Cella M, Jarrossay D, Facchetti F et al. Plasmacytoid monocytes
migrate to inflamed lymph nodes and produce large amounts of
type I interferon. Nat Med 1999; 5:919–23.
25 Jongbloed SL, Lebre MC, Fraser AR et al. Enumeration and
phenotypical analysis of distinct dendritic cell subsets in
psoriatic arthritis and rheumatoid arthritis Arthritis Res Ther
2006; 8:R15.
26 Farkas L, Beiske K, Lund-Johansen F, Brandtzaeg P, Jahnsen FL.
Plasmacytoid dendritic cells (natural interferon-alpha/beta-
producing cells) accumulate in cutaneous lupus erythematosus
lesions. Am J Pathol 2001; 159:237–43.
27 Lovgren T, Eloranta ML, Bave U, Alm GV, Ronnblom L. Induc-
tion of interferon-alpha production in plasmacytoid dendritic
cells by immune complexes containing nucleic acid released by
necrotic or late apoptotic cells and lupus IgG. Arthritis Rheum
2004; 50:1861–72.
28 Bave U, Nordmark G, Lovgren T et al. Activation of the
type I interferon system in primary Sjogren’s syndrome: a possi-
ble etiopathogenic mechanism. Arthritis Rheum 2005; 52:1185–
95.
29 Vallin H, Perers A, Alm GV, Ronnblom L. Anti-double-stranded
DNA antibodies and immunostimulatory plasmid DNA in com-
bination mimic the endogenous IFN-alpha inducer in systemic
lupus erythematosus. J Immunol 1999; 163:6306–13.
30 Vallin H, Blomberg S, Alm GV, Cederblad B, Ronnblom L.
Patients with systemic lupus erythematosus (SLE) have a circula-
ting inducer of interferon-alpha (IFN-alpha) production acting
on leucocytes resembling immature dendritic cells. Clin Exp
Immunol 1999; 115:196–202.
31 Qing X, Putterman C. Gene expression profiling in the study of
the pathogenesis of systemic lupus erythematosus. Autoimmun
Rev 2004; 3:505–9.
32 Shodell M, Shah K, Siegal FP. Circulating human plasmacytoid
dendritic cells are highly sensitive to corticosteroid administra-
tion. Lupus 2003; 12:222–30.
� 2006 Blackwell Publishing Ltd, Immunology, 119, 488–498 497
Tacrolimus effect on plasmacytoid DCs

33 Abe M, Thomson AW. Dexamethasone preferentially suppresses
plasmacytoid dendritic cell differentiation and enhances their
apoptotic death. Clin Immunol 2005; 118:300–6.
34 Naranjo-Gomez M, Fernandez MA, Bofill M et al. Primary allo-
proliferative TH1 response induced by immature plasmacytoid
dendritic cells in collaboration with myeloid DCs. Am J Trans-
plant 2005; 5:2838–48.
35 Krug A, Veeraswamy R, Pekosz A et al. Interferon-producing
cells fail to induce proliferation of naive T cells but can promote
expansion and T helper 1 differentiation of antigen-experienced
unpolarized T cells. J Exp Med 2003; 197:899–906.
36 Drouet C, Shakhov AN, Jongeneel CV. Enhancers and transcrip-
tion factors controlling the inducibility of the tumor necrosis
factor-alpha promoter in primary macrophages. J Immunol 1991;
147:1694–700.
37 Libermann TA, Baltimore D. Activation of interleukin-6 gene
expression through the NF-kappa B transcription factor.
Mol Cell Biol 1990; 10:2327–34.
38 Nakayama K, Shimizu H, Mitomo K, Watanabe T, Okamoto S,
Yamamoto K. A lymphoid cell-specific nuclear factor containing
c-Rel-like proteins preferentially interacts with interleukin-6
kappa B-related motifs whose activities are repressed in lym-
phoid cells. Mol Cell Biol 1992; 12:1736–46.
39 Foxwell B, Browne K, Bondeson J et al. Efficient adenoviral
infection with IkappaB alpha reveals that macrophage tumor
necrosis factor alpha production in rheumatoid arthritis is
NF-kappaB dependent. Proc Natl Acad Sci USA 1998; 95:
8211–15.
40 O’Keeffe M, Grumont RJ, Hochrein H et al. Distinct roles
for the NF-kappaB1 and c-Rel transcription factors in the dif-
ferentiation and survival of plasmacytoid and conventional
dendritic cells activated by TLR-9 signals. Blood 2005; 106:3457–
64.
41 Palucka AK, Blanck JP, Bennett L, Pascual V, Banchereau J.
Cross-regulation of TNF and IFN-alpha in autoimmune diseases.
Proc Natl Acad Sci USA 2005; 102:3372–7.
42 Aringer M, Graninger WB, Steiner G, Smolen JS. Safety and
efficacy of tumor necrosis factor alpha blockade in systemic
lupus erythematosus: an open-label study. Arthritis Rheum 2004;
50:3161–9.
498 � 2006 Blackwell Publishing Ltd, Immunology, 119, 488–498
M. Naranjo-Gomez et al.


