Embed Size (px)
Citation preview
Synthesis of Nanoparticles andNanostructured Materials
by Self-Assembly
Miriam Varón Izquierdo
Tesi doctoral
Estudis de Doctorat en Química
Director: Víctor F. Puntes
Departament de QuímicaFacultat de Ciències
Abril 2012

Synthesis of Nanoparticles andNanostructured Materials
by Self-Assembly
Memòria presentada per aspirar al Grau de Doctorper Miriam Varón Izquierdo
Bellaterra, Abril de 2012

El Dr. Victor F. Puntes, responsable del grup Inorganic Nanoparticles a l’Institut Català de
Nanotecnologia i professor associat del Departament de Química de la Facultat de Ciències de
la Universitat Autònoma de Barcelona,
Certifica:
Que el treball descrit en aquesta memòria titulada “Synthesis of Nanoparticles and
Nanostructured Materials by Self-Assembly” presentada per Miriam Varón Izquierdo
per optar al grau de Doctor, ha estat realtzada sota la meva direcció i recull, sota el meu punt
de vista, els requisits exigits per a la consecució del citat títol.
Perquè quedi constància, signo el present certificat
Dr. Víctor F. Puntes
Bellaterra, 11 d’Abril de 2012


La ciència serà sempre una cerca, mai un descobrimint real. És un viatge, mai una arribada.
Karl R. Popper

i
Contents
Acknowledgements ..................................................................................................................... vii
Structure of the Thesis ............................................................................................................... ix
Objectives .................................................................................................................................... xi
I. Introduction 1
1.1 Nanostructured Materials. A Bottom-up Approach .......................................... 1
1.2 Nanoparticles as Building Blocks .......................................................................... 2
1.3 Inorganic Nanoparticles ........................................................................................... 3
1.3.1 Colloidal Stability of Nanoparticles ........................................................................ 5
1.3.2 Synthetic Processes of Inorganic Nanoparticles ................................................... 6
1.4 Magnetic Characteristics of Nanoparticles ......................................................... 8
1.4.1 Magnetic Properties of Solids ................................................................................. 8
1.4.2 Magnetic Nanoparticles ......................................................................................... 11
1.4.3 Magnetic Anisotropy .............................................................................................. 11
1.4.4 Superparamagnetism ............................................................................................ 12
1.4.5 Exchange Bias: FM-AFM Coupled Systems .......................................................... 13
1.4.6 Inter-particle Interactions: Dipolar Interactions ................................................. 13
1.5 Self-Assembly Process .............................................................................................. 15
1.6 References ................................................................................................................... 17
II. Synthesis of Metallic and Bimetallic Nanoparticles 21
2.1 Synthesis of Co Nanoparticles ................................................................................ 22
2.1.1 Experimental .......................................................................................................... 23
Contents
ii
2.1.1.1 Chemicals .................................................................................................... 23
2.1.1.2 Synthesis of ɛ-Co Nanoparticles ................................................................ 23
2.1.2 Results and Discussion .......................................................................................... 24
2.1.2.1 Structural Characterization ........................................................................ 24
2.1.2.2 Size-Dependent Properties ........................................................................ 27
2.1.2.3 Magnetic Characterization ......................................................................... 28
2.1.3 Summary ............................................................................................................... 29
2.2 Formation of Core/Shell Co/CoO and Hollow CoO Nanoparticles ............. 30
2.2.1 Exposure to Open-Air Conditions:
Core/Shell Co/CoO Nanoparticles ..................................................................... 30
2.2.1.1 Experimental ............................................................................................. 30
Formation of Core/Shell Co/CoO Nanoparticles .................................. 30
2.2.1.2 Results and Discussion .............................................................................. 30
2.2.2 Exposure to Water/Air Interface Conditions:
Hollow CoO Nanoparticles ................................................................................ 32
2.2.2.1 Experimental .............................................................................................. 33
Formation of Hollow CoO Nanoparticles .............................................. 33
Recovery Process of Hollow CoO Nanoparticles ................................... 34
2.2.2.2 Results and Discussion .............................................................................. 34
Structural Characterization .................................................................... 33
Magnetic Characterization ..................................................................... 38
Formation Mechanism: Kirkendall Effect .............................................. 41
2.2.3 Summary ...................................................................................................... 42
2.3 Synthesis of Pt and PtCo Nanoparticles ............................................................. 42
2.3.1 Synthesis of Pt and PtCo Nanoparticles Assisted by Metal Traces ..................... 42
2.3.1.1 Experimental .............................................................................................. 43
2.3.1.2 Results and Discussion .............................................................................. 44
2.3.1.3 Summary .................................................................................................... 50
2.3.2 Synthesis of Pt and PtCo Nanoparticles by Using Competing Reducers ............ 50
2.3.2.1 Experimental .............................................................................................. 51
Chemicals .................................................................................................. 51
Synthesis ................................................................................................... 51
Increasing Co Content ............................................................................. 51
Contents
iii
Increasing Hydride Content ................................................................... 52
Increasing HDD Content ......................................................................... 52
2.3.2.2 Results and Discussion .............................................................................. 52
Increasing Co Content ................................................................... 52
Increasing Hydride Content ................................................................... 56
Increasing HDD Content ......................................................................... 57
2.3.2.3 Summary .................................................................................................... 60
2.4 Synthesis of Bimetallic Pt/Au Heterostructures .............................................. 60
2.4.1 Experimental ........................................................................................................ 61
2.4.1.1 Chemicals ................................................................................................... 61
2.4.1.2 Synthesis of Pt Nanocrystals ...................................................................... 61
2.4.1.3 Synthesis of Pt/Au Heterodimers at Room Temperature ......................... 61
2.4.2 Results and Discussion ......................................................................................... 62
2.4.2.1 The Reaction Time ..................................................................................... 62
2.4.2.2 Structural Characterization ....................................................................... 63
2.4.2.3 Role of Pt Nanocrystals ............................................................................. 65
2.4.3 Summary ............................................................................................................... 67
2.5 Synthesis of Extremely Long Rod Shaped Au Nanocrystals ......................... 67
2.5.1 Experimental ......................................................................................................... 68
2.5.1.1 Chemicals .................................................................................................... 68
2.5.1.2 Synthesis of CTAB Stabilized Pt Seed Nanoparticles ............................... 68
2.5.1.3 Synthesis of CTAB Stabilized Au Seed Nanoparticles ............................... 69
2.5.1.4 Synthesis of Au Rods Using Pt Seed Nanoparticles .................................. 69
2.5.1.5 Synthesis of Au Rods Using Au Seed Nanoparticles ................................. 69
2.5.2 Results and Discussion ......................................................................................... 69
2.5.2.1 Structural Characterization ....................................................................... 69
2.5.2.2 Effect of Pt2+ and Pt Seeds in the Synthesis .............................................. 72
2.5.2.3 Effectof Different Amount of Pt Seeds in the Synthesis ........................... 73
2.5.3 Summary ............................................................................................................... 74
2.6 Conclusions ................................................................................................................ 75
2.7 References ................................................................................................................... 76
Contents
iv
III. Study of the Self-Assembly Process of Magnetic and NobleMetal Nanoparticles 89
3.1 Self-Assembly of Metal Nanoparticles onto TEM Carbon Substrates ......... 90
3.1.1 Spherical Nanoparticles ......................................................................................... 90
3.1.1.1 Au Nanoparticles ........................................................................................ 90
3.1.1.2 Co Nanoparticles ........................................................................................ 91
3.1.2 Non-Spherical Nanoparticles ................................................................................ 92
3.1.2.1 Pt Nanoparticles ........................................................................................ 92
3.1.2.2 Rod Shaped Au Nanoparticles ................................................................... 93
3.1.3 Summary ................................................................................................................ 95
3.2 Self-assembly of Co Nanoparticles at Compatible Substrates:
Graphite ...................................................................................................................... 96
3.2.1 Experimental ......................................................................................................... 97
3.2.1.1 Co Nanoparticles ........................................................................................ 97
3.2.1.2 Deposition of Co Nanoparticles onto Graphite ......................................... 97
3.2.2 Results and Discussion ......................................................................................... 98
3.2.2.1 Structural Characterization ....................................................................... 99
3.2.2.2 Magnetic Characterization ....................................................................... 101
3.2.2.3 Effect of Increasing Particle Size .............................................................. 103
3.2.2.4 Effect of Applied Magnetic Fields.............................................................. 105
3.2.2.5 Formation Mechanism .............................................................................. 106
3.2.3 Summary ............................................................................................................... 108
3.3 Self-Assembly of Co Nanoparticles at Non-Compatible Substrates:
Silicon Wafers ........................................................................................................... 109
3.3.1 Experimental ......................................................................................................... 110
3.3.1.1 Substrates ...................................................................................... 110
3.3.1.2 Deposition of Co Nanoparticles onto Silicon Wafers .................. 110
3.3.2 Results and Discussion .......................................................................................... 111
3.3.3 Summary ............................................................................................................... 114
3.4 Conclusions ................................................................................................................ 114
3.5 References ................................................................................................................... 115
Contents
v
IV. Electron Holography and Lorentz Microscopy of Self-Assembled Cobalt Nanoparticles Structures 121
4.1 Basis of Lorentz Microscopy and Electron Holography ................................. 123
4.1.1 Off-Axis Electron Holography ............................................................................... 125
4.1.1.1 Imaging Theory ........................................................................................... 126
4.1.1.2 Hologram Reconstruction .......................................................................... 127
4.1.2 Magnetic and Mean Inner Potential Contributions to the Phase ...................... 129
4.1.3 Measurement of Magnetic Fields ........................................................................ 130
4.1.3.1 Separation of Phase Information ............................................................... 130
4.1.3.2 Visualization of the Magnetic Contribution to the Phase ......................... 131
4.2 Electron Holography of Chain-Like Self-Assembled Structures ................. 132
4.2.1 Experimental ......................................................................................................... 132
4.2.1.1 Sample Preparation ................................................................................ 132
4.2.1.2 Data Acquisition ...................................................................................... 132
4.2.2 Results and Discussion ......................................................................................... 132
4.2.3 Summary ............................................................................................................... 138
4.3 Electron Holography of Self-Assembled Co Structures with Increasing
Temperature .............................................................................................................. 138
4.3.1 Experimental ......................................................................................................... 138
4.3.1.1 Sample Preparation ................................................................................ 138
4.3.1.2 Data Acquisition ...................................................................................... 138
4.3.2 Results and Discussion ......................................................................................... 139
4.3.2.1 Region 1 .................................................................................................... 140
4.3.2.2 Region 2 ................................................................................................... 144
4.3.3 Summary ............................................................................................................... 146
4.4 Lorentz Microscopy and Electron Holography of Wire-Like Co Self-
Assembled Structures ............................................................................................. 146
4.4.1 Experimental ......................................................................................................... 146
4.4.1.1 Sample Preparation ................................................................................ 146
4.4.1.2 Data Acquisition Lorentz Microscopy .................................................... 146
4.4.1.3 Data Acquisition Electron Holography .................................................. 146
Contents
vi
4.4.2 Results and Discussion ......................................................................................... 147
4.4.2.1 Electron Holography .................................................................................. 147
4.4.2.2 Lorentz Microscopy ................................................................................... 149
4.3.3 Summary ............................................................................................................... 150
4.5 Conclusions ................................................................................................................. 150
4.6 References ................................................................................................................... 151
V. General Conclusions 157
VI. Appendix: Instrumentation 161
A.1 Synthesis of Co Nanoparticles ...................................................................................... 161
A.2 Formation of Core/Shell Co/CoO and Hollow CoO Nanoparticles ............................ 161
A.3 Synthesis of Pt and PtCo Nanoparticles ...................................................................... 162
A.3.1 Synthesis of Pt and PtCo Nanoparticles Assisted by Metal Traces .................... 162
A.3.2 Synthesis of Pt and PtCo Nanoparticles by Using Competing Reducers ........... 163
A.4 Synthesis of Bimetallic Au/Pt Heterostructures ......................................................... 163
A.5 Synthesis of Extremely Long Rod Shaped Au Nanocrystals ....................................... 164
A.6 Self-Assembly of Co Nanoparticles at Compatible Substrates: Graphite ................... 165
A.7 Self-Assembly of Co Nanoparticles at Non-Compatible Substrates: Silicon Wafers .. 165
A.8 References .................................................................................................................... 165
List of Abbreviations 167
List of Publications 169
vii
Acknowledgments
The work presented here is the result of collaboration with a number of people. First of all,
I want to thank my supervisor, Dr. Victor F. Puntes, for giving me the opportunity to work in
the Inorganic Nanoparrticles Group and introduce me to the Nanotechnology. I am very grateful
for his guidance and multiple advices during the last years which allowed me to be trained as a
researcher.
Thanks to all the members of the Inorganic Nanoparticles Group for make this experience
more enriching with their discussions and, not less important, for the funny moments. In
particular, I would like to thank both Stephanie Lim and Isaac Ojea for their help and
collaboration in the present work.
Thanks to Dr. Lluis Balcells and Dr.Benjamin Martínez, from the Institut de Ciència de
Materials de Barcelona, for their collaboration and for the magnetic measurements of my
particles. And thanks to Dr. Jordi Arbiol, from the Institut de Ciència de Materials de Barcelona,
for the numerous and valuable TEM measurements and analyses of the nanoparticles.
I want to express my gratitude to Dr. Cathrine Frandsen for her advice and guidance during
my two stays at DTU and for welcoming me so nicely. I also want to thank Prof. Rafal E. Dunin-
Borkowski and Dr. Takeshi Kasama form the Center of Electron Nanoscopy for introducing me
to the electron holography and for their productive discussions concerning to the results
presented in this thesis.
Tanks to the Spanish MICINN for the financial support though the scholarship BES-2007-
17164 associated to the research project MAT2006-13572-C02-02.
Gracias a mi familia y amigos, especialmente a mis padres, por darme siempre su apoyo.
Gracias Juanjo por haber estado y estar siempre ahí. Espero poder seguir compartiendo muchas
cosas contigo.

viii
ix
Structure of the Thesis
This thesis has been divided into the following chapters:
• Chapter zero exposes the objectives of the dissertation.
• Chapter one presents the basic concepts and the theoretical background for a better
understanding of the presented work. Some physical and chemical phenomena related to
the research presented in this thesis will be briefly introduced.
• Chapter two is focused in the description of the synthetic processes of different
metallic and bimetallic nanoparticles and their characterization.
• Chapter three shows the self-assembly process of different nanoparticles. In particular
two main works have been carried out studying of the self-assembly process of magnetic
Co nanoparticles at different substrates.
• Chapter five resumes the general conclusions of the thesis.
• Chapter six, formed by the appendix, compiles the description of the instrumentation
techniques used in each section of the previous chapters.
Finally, at the end of the thesis can be found the list of the abbreviations used along the text
and the list of publications generated from this work, as well the manuscripts that are in
preparation.
Every chapter in this dissertation includes conclusions and also the references cited along
the chapter.

x
xi
The aim of this work is to acquire basic knowledge and technology for the preparation
of nanoparticles (NPs) and nanostructured composite magnetic materials, including self-
assembly (SA) processes (controlled aggregation) of NPs. This goal includes activities going
from the optimization of basic properties and growing conditions up to the control of NPs SA
processes on top of technological substrates, useful for the fabrication composite magnetic
materials, with controlled properties, for the development of technological devices.
On one hand, we face topics related with metallic NP size and shape control. The goal is to
determine the most relevant parameters controlling the growth process of NPs by the proper
selection of synthetic conditions such as surfactants, reducing agents, time and temperature.
To achieve this goal, it is fundamental the development of experimental protocols and
theoretical knowledge for the preparation and the analysis of the NPs. In this context, different
kind of metallic and bimetallic NPs have been studied (Co, Co-Pt, Pt-Au, Au). First, Co magnetic
NPs of different size have been synthesized (Section 2.1) and their oxidation processes have
been also studied (Section 2.2), generating Co oxide hollow particles. We also used these Co
particles as reaction assistant in the synthesis of Pt and PtCo NPs (Section 2.3). We continued
with the synthesis of bimetallic Pt/Au heterostructures (Section 2.4). And, finally, Au long
rods are synthesized by using Pt NPs as reaction catalyst (Section 2.5).
On the other hand, we deal about problems related to NPs SA and the study of all the forces
that take place in the process, which depends on different parameters such as the composition
of the NPs and their size and shape among others. SA processes may yield the organization of
building blocks into a crystalline material with orientational and translational symmetry. The
macroscopic properties of such nanocrystalline superlattices are determined not only by the
individual properties of the building blocks but also by the interactions between them. Thus,
the studies of the interactions that intervene in these processes allow the study of the nature of
Objectives
Objectives
xii
the NPs beyond of their structural characterization, and allow feedback the synthetic processes
and improve the design of desired NP. This part of the work maily studies the interactions
between the NPs and also the interaction with the substrates (Section 3.1). Moreover, NPs SA
process into ordered structures on top of technological substrates (Section 3.2 and Section
3.3) is very interesting not only by the particular properties that such ordered nanostructures
may exhibit but also due to their potential applications as a procedure to prepare templates for
the fabrication of other nanostructures in combination with etching and/or growing techniques.
This fabrication procedure, based on the SA of nanoscopic units, called bottom-up
approximation, is radically different from the traditional top-down procedures, which usually
requires expensive etching and lithographic techniques. These studies have been mainly carried
out with magnetic NPs because present very interesting properties for forming part of
magnetoelectronic devices.
Additionally, the study of the influence of the magnetic properties in the SA process, and the
study of the inter-particle interactions inside the self-assembled structures, at the nanometric
level, is fundamental for the full understanding of the SA process. Thanks to two productive
stays realized in the Prof. Catherine Frandsen group at the physics department of the Technical
University of Denmark (DTU) and collaborating with the Center for Electron Nanoscopy (CEN),
it has been studied different self-assembled structures, formed by Co NPs, by Lorentz
microscopy and electron holography, which allow the study of electrical and magnetic fields of
the materials (Chapter 4). Thanks to electron holography we have been able to directly image
dipolar ferromagnetic-like patterns (superferromagnetism) in the structures with nanometer
resolution, demonstrating the formation of ordered regions and vortex states (Section 4.2).
Moreover, we have studied the magnetic changes in self-assembled structures with increasing
temperature (Section 4.3). Finally, self-assembled wire-like Co structures have been also
studied by both above mentioned techniques (Section 4.4). The observed structures indicate
collective effects among the whole NPs forming the structures.
1
1.1 Nanostructured Materials. A Bottom-up Approach
A nanostructured material is defined as a solid material formed by units (or building blocks)
that have dimensions at the nanometer scale. Fundamentally, two different approaches have
been followed to reach the nanometer-world. Engineers adopted a top-down strategy, i.e. by
starting from well-established structures and principles in the macro-world they ventured into
the nm-range via successive cycles of miniaturization. On the other hand, chemists naturally
adopted a bottom-up strategy as they progressed from synthesizing simple compounds
consisting of just a few atoms to long macromolecules.
The bottom-up approach makes use of chemical or physical forces operating at the nanoscale
to assemble basic units into larger structures. The inspiration of bottom-up approach comes
from biological systems, where nature has employed self-organization of essential building
blocks such as amino acids, monosaccharides or lipids, in order to create a wide range of
complex structures needed by life.1 In that way, researchers try to mimic this ability of nature.
The main advantages of the bottom-up technique is that a wide variety of preparation methods
are available, thus allowing a good control onto scale dimension, while they are not as expensive
as top-down approaches. Nevertheless, the preparation of self-assembled systems of
complexities comparable to those found in nature still remains a challenge.
Similarly to atoms or molecules, NPs can be used as the building blocks of condensed matter.
Assembling NPs into solids opens up the possibility of fabricating new solid-state materials and
devices with novel or enhanced physical and chemical properties. Moreover, interactions
between proximal NPs can give rise to new collective phenomena. Thus, by choosing an
Chapter 1Introduction
Chapter 1: Introduction
2
appropriate nanoparticulate building block it is possible to tailor the properties of the final
material.2
1.2 Nanoparticles as Building Blocks
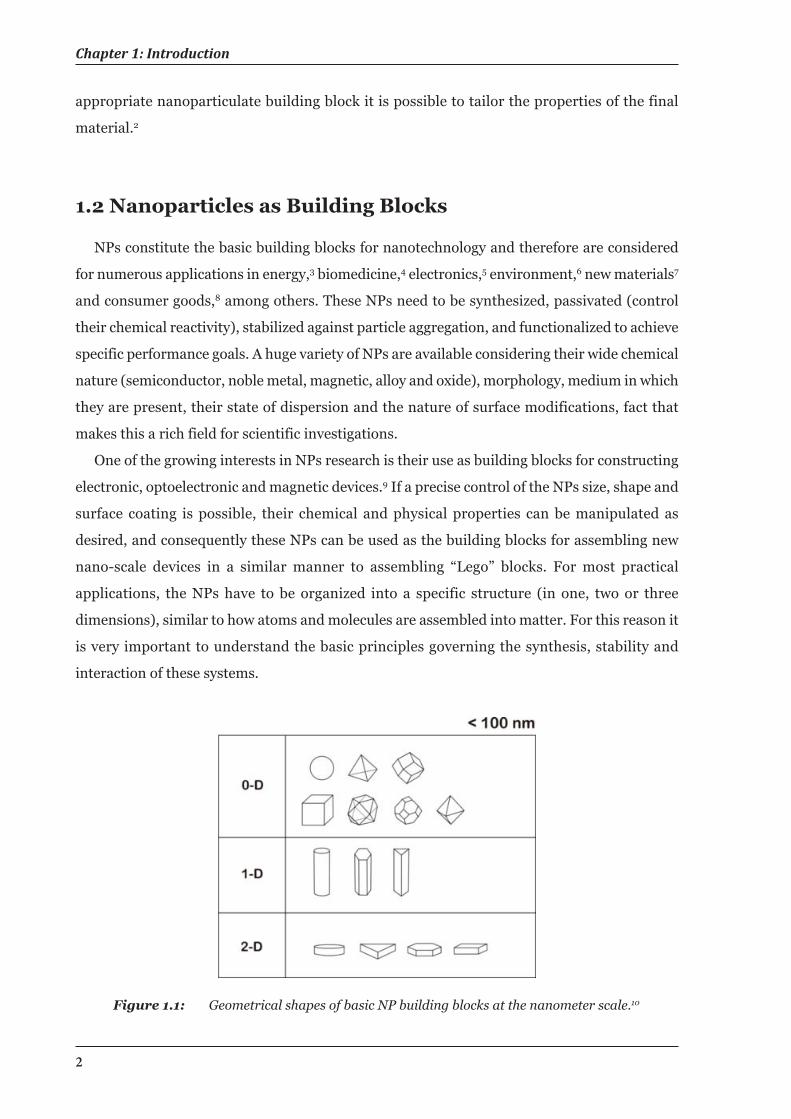
NPs constitute the basic building blocks for nanotechnology and therefore are considered
for numerous applications in energy,3 biomedicine,4 electronics,5 environment,6 new materials7
and consumer goods,8 among others. These NPs need to be synthesized, passivated (control
their chemical reactivity), stabilized against particle aggregation, and functionalized to achieve
specific performance goals. A huge variety of NPs are available considering their wide chemical
nature (semiconductor, noble metal, magnetic, alloy and oxide), morphology, medium in which
they are present, their state of dispersion and the nature of surface modifications, fact that
makes this a rich field for scientific investigations.
One of the growing interests in NPs research is their use as building blocks for constructing
electronic, optoelectronic and magnetic devices.9 If a precise control of the NPs size, shape and
surface coating is possible, their chemical and physical properties can be manipulated as
desired, and consequently these NPs can be used as the building blocks for assembling new
nano-scale devices in a similar manner to assembling “Lego” blocks. For most practical
applications, the NPs have to be organized into a specific structure (in one, two or three
dimensions), similar to how atoms and molecules are assembled into matter. For this reason it
is very important to understand the basic principles governing the synthesis, stability and
interaction of these systems.
Figure 1.1: Geometrical shapes of basic NP building blocks at the nanometer scale.10
1.3 Inorganic Nanoparticles
3
Basic building blocks can be classified by crystal symmetry and dimensionality (Figure 1.1).
The zero-dimensional (0-D) building blocks such as small (dot) spheres, icosahedrons, and
cubes are the most familiar shapes at the nanoscale. Rods, cylinders and wires are examples of
one-dimensional (1-D) building blocks, whereas disks, plates and polygon shape structures
belong to two-dimensional (2-D) building blocks group.
A wide number of approaches have been developed to accomplish SA such as template-
assisted assembly,11 surfactant-assisted assembly12 and charge-assisted assembly.13 Showing
how superstructures built-up with nano-building blocks can be achieved by specific interactions
of molecules conjugated on the particle surface, e.g. molecular recognition methods such as
antigen-antibody interactions. Alternatively, NPs are able to assemble into close-packed
ordered superlattices under certain conditions.14 When NPs with highly monodisperse size (<5
%) and shape are segregated from the solution through slow evaporation of the solvent (allowing
movement of the particles to suitable positions), closed-packed structures are formed via
interactions between NPs. This packing can be tuned by changing parameters including
particles size, shape and composition (which can add new interactions to the system). The
resulting macroscopic properties of these superlattices are determined not only by the
properties of each individual particle, but also by the interaction/coupling between the NPs,
which are interconnected and isolated by a thin monolayer (ML) of organic molecules.15 SA is
considered to be one of the most used strategies because of its simplicity, versatility, and ability
to obtain spontaneous NPs patterns.
1.3 Inorganic Nanoparticles
In nanotechnology, a NP can be defined as a small elemental ensemble that behaves as a
whole unit and present novel properties not exhibited in the characteristic bulk material. At
the nanometer scale the confinement of electrons, phonons and photons leads to the appearance
of new physical and chemical properties that make them “new” materials. Moreover, their size,
morphology and structure determine not only their properties but also its reactivity. NPs are
sized in the range of 1-100 nm and they are formed at least by hundreds or thousands of atoms
organized within a structure, which can be non-crystalline, polycrystalline or a single crystal.
Both the thermodynamics and kinetics of reactions are different depending on the NP size.
The reduction of the dimensionality affects to a variety of factors such as melting points (which
depends of the coordination number of the participating atoms), optical properties, magnetic
properties, reactivity and conductivity, among others. The smaller a particle becomes the more
Chapter 1: Introduction
4
the proportion of surface atoms, leading to an increased reactivity due to a rise of the active
sites.
Some inorganic NPs display interesting optical properties, and the absorption and/or
emission wavelengths can be controlled by particle size and surface functionalization.16 The
surface Plasmon resonance (SPR) is an optical phenomenon also present in some metal
particles, and consists in the parallel propagation of surface electromagnetic waves along the
metal-dielectric interfaces. Plasmon resonance in metal NPs arises from the collective
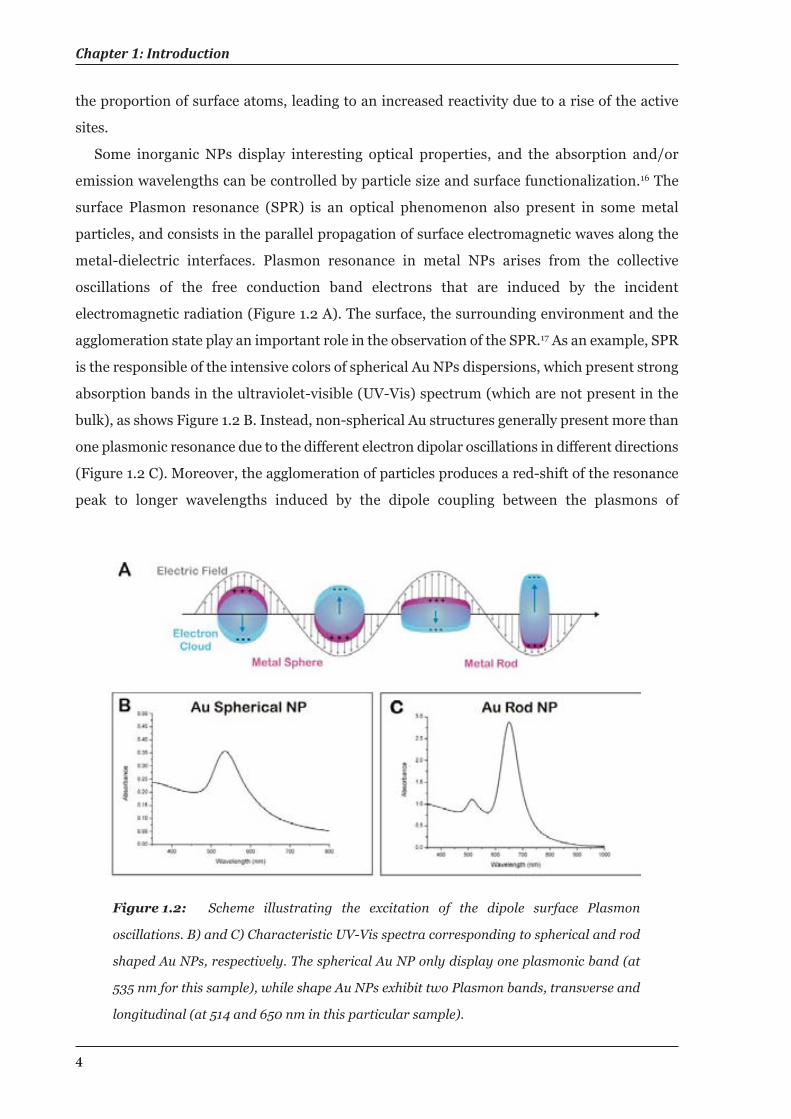
oscillations of the free conduction band electrons that are induced by the incident
electromagnetic radiation (Figure 1.2 A). The surface, the surrounding environment and the
agglomeration state play an important role in the observation of the SPR.17 As an example, SPR
is the responsible of the intensive colors of spherical Au NPs dispersions, which present strong
absorption bands in the ultraviolet-visible (UV-Vis) spectrum (which are not present in the
bulk), as shows Figure 1.2 B. Instead, non-spherical Au structures generally present more than
one plasmonic resonance due to the different electron dipolar oscillations in different directions
(Figure 1.2 C). Moreover, the agglomeration of particles produces a red-shift of the resonance
peak to longer wavelengths induced by the dipole coupling between the plasmons of
Figure 1.2: Scheme illustrating the excitation of the dipole surface Plasmon
oscillations. B) and C) Characteristic UV-Vis spectra corresponding to spherical and rod
shaped Au NPs, respectively. The spherical Au NP only display one plasmonic band (at
535 nm for this sample), while shape Au NPs exhibit two Plasmon bands, transverse and
longitudinal (at 514 and 650 nm in this particular sample).

1.3 Inorganic Nanoparticles
5
neighboring particles, fact that allow the Au NPs to be used as a sensor.
Another appearing optical property worthy to mention is the fluorescence emission in
semiconductor quantum dots (QDs) (e.g. CdSe or PbS).18 When these particles are photo-exited,
electron-hole pairs are generated and upon their recombination fluorescence light is emitted.
This emission fluorescence can be very precisely chosen through variation of the size (an effect
called quantum confinement). In this way, as the size of the nanocrystals (NCs) increase, the
energy gap also increases and the more red-shifted is their wavelength fluorescence, thus
yielding a tunability of colors from UV to infrared (IR).19,20
1.3.1 Colloidal Stability of Nanoparticles
NPs can be synthesized either in aqueous or in organic solvents, and there are two possible
mechanisms to provide them colloidal stability: electrostatic and steric stabilization. Colloid
stability requires repulsive forces between colliding particles, for this reason electrical charges
or ligand shells are used to screen the attraction.
In the case of electrostatically stabilized aqueous solutions, there is a competition between
the van der Waals (vdW) attractive forces between the metal cores and the electrostatic
repulsive forces from the charged surfaces. Derjaguin and Landau21 and Verwey and Overbeek22
worked deeply in the study of the factors affecting the dispersions stability, generating the
known DLVO theory. This theory suggests that the stability of a colloidal system is determined
by the sum of the vdW attractive forces and electrical double layer repulsive forces that exist
between particles as they approach each other due to the Brownian motion they are undergoing.
Figure 1.3: A) Schematic diagram showing the DLVO total interaction energy (solid
black line), which is the sum of two components: the attractive vdW (dashed line) and the
repulsive electric double layer (dotted line). B) Two main types of colloidal stabilization:
electrostatic (left) and steric (right) stabilization.
Chapter 1: Introduction
6
As depicted in Figure 1.3 A, vdW forces will predominate at both large and small distances,
while the double-layer repulsion may predominate at intermediate distances. Numerous
examples of the application of the DLVO theory, i.e. to Au NPs, can be found in the literature.23
In any colloidal-aqueous system, the surface charge on the particle with a counterion
concentration change in the surrounding environment results in an electric double layer. The
electrical double layer consist of two regions, the inner compact layer (Stern layer24) and the
diffusive layer (Figure 1.3 B, left). And the calculated total potential energy is known to have
two minima when the size of the double layer is smaller than the particle radius. In the case of
organic solutions, the total stability of the dispersion is again a competition of vdW attractive
forces of the metal cores and, in this case, the steric repulsive forces from the ligand shells. The
molecules adsorbed on the particle surface form a physical barrier that prevents the aggregation
of the particles (Figure 1.3 B, right).
1.3.2 Synthetic Processes of Inorganic Nanoparticles
Size and shape control are crucial parameters that have to be consider during the synthesis
of high quality NPs with specific properties. While the size of the NPs plays a significant role in
sensory, biological systems, and catalysis, the shape control is also important due to their unique
applications in sensors, photochemistry, optoelectronics and also fuel cell catalysis.9,25,26 Besides,
there are other factors that must also be considered such as the monodispersity, avoid
agglomeration and a well control of the surface functionalization (or state).
There are a wide variety of both physical and chemical synthetic methods for obtaining
NPs,27-29 which can be divided in three main groups: i) mechanical methods (e.g. grinding or
milling), ii) gas-phase methods (e.g. chemical vapor deposition or laser ablation deposition)
and iii) liquid- phase synthesis (e.g. hydrothermal synthesis or sol-gel process). Mechanical
breakdown methods present important technical advantages allowing the obtention of large
quantities of product with reduced costs. However, they often are limited by agglomeration and
contamination problems, and are not suitable for obtaining very small particles (<50 nm). Gas-
phase methods are normally used in continuous systems and are based on homogeneous
nucleation of a supersaturated vapor and subsequent particle grow by collision and
condensation. These processes form crystalline NPs with “naked” surface and also result into
agglomeration. Finally, in the liquid-phase methods, the size and the agglomeration are
effectively controlled due to the functionalization of the NPs surface with organic molecules,
also known as surfactants. In some cases, these molecules are used as shape control agents due
to their selected binding to some crystalline faces of the NPs, favoring the growth in specific
1.3 Inorganic Nanoparticles
7
directions. Thus, liquid-phase methods are the most frequently used for the synthesis of NPs
due to the wide variety of different sizes, shapes and surface functionalities that can be
obtained.9,30
In the liquid-phase methods can be found different synthetic approaches such as chemical
reduction of metal salts or thermal decomposition of organometallic complexes. Chapter 2 of
this thesis shows various syntheses of transition metal NPs via these two pathways. In the case
of metal ion reduction, many reductants such as sodium citrate, polyols, or H2, have been used.
In the organic phase, the reduction has to be performed by organic soluble reducing agents
such as litium superhydride. In particular, organic phase synthetic methods are one of the most
used because present many advantages such as the high crystallinity and monodispersity of the
obtained NPs.31 Many metallic particles, in particular those of Pt group metals, have been
synthesized by the method known as polyol process, in which the reduction is performed into
high-boiling point alcohols. Reactions by thermal decomposition of organometallic compounds
were performed in hot surfactant solutions.
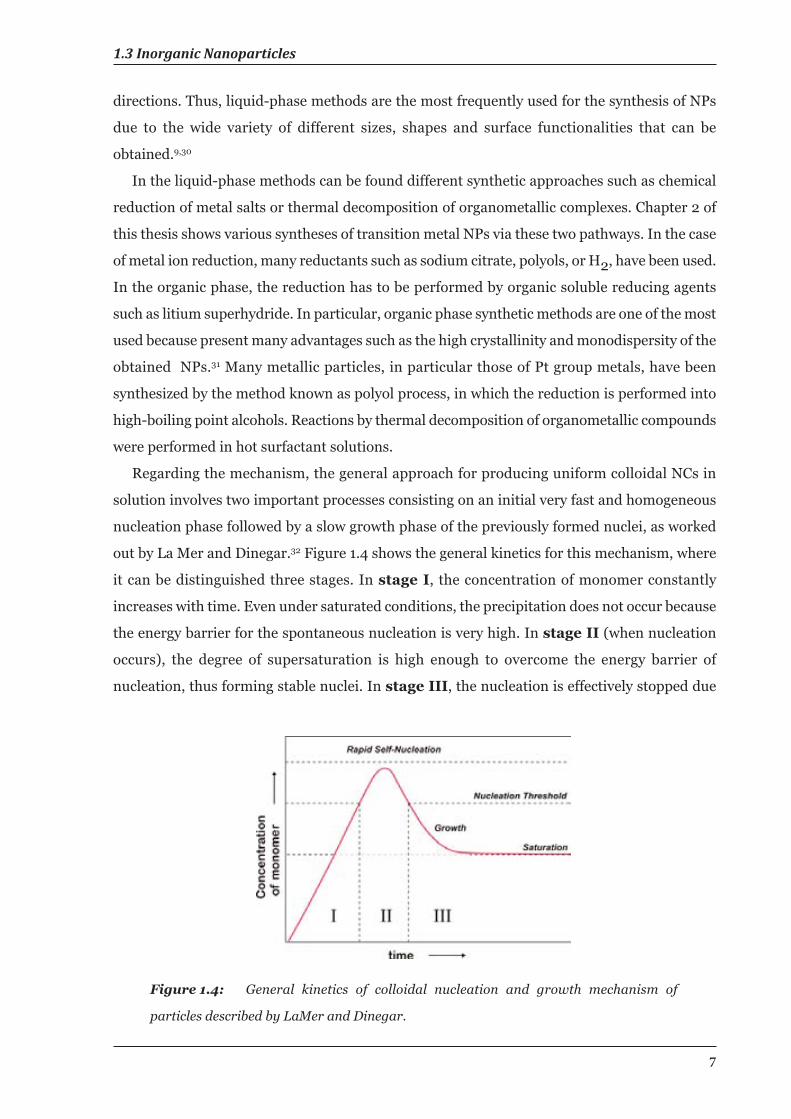
Regarding the mechanism, the general approach for producing uniform colloidal NCs in
solution involves two important processes consisting on an initial very fast and homogeneous
nucleation phase followed by a slow growth phase of the previously formed nuclei, as worked
out by La Mer and Dinegar.32 Figure 1.4 shows the general kinetics for this mechanism, where
it can be distinguished three stages. In stage I, the concentration of monomer constantly
increases with time. Even under saturated conditions, the precipitation does not occur because
the energy barrier for the spontaneous nucleation is very high. In stage II (when nucleation
occurs), the degree of supersaturation is high enough to overcome the energy barrier of
nucleation, thus forming stable nuclei. In stage III, the nucleation is effectively stopped due
Figure 1.4: General kinetics of colloidal nucleation and growth mechanism of
particles described by LaMer and Dinegar.
Chapter 1: Introduction
8
to the depletion of monomer concentration, and the particles keep growing as long as the
solution is supersaturated. To simplify, nucleation takes place because the supersaturated
solution is thermodynamically unstable and generates extremely small size nuclei particles.
And after the nuclei are formed from the solution, they grow via deposition of the soluble species
onto the solid surface (molecular addition).
1.4 Magnetic Characteristics of Nanoparticles
1.4.1 Magnetic Properties of Solids
If a magnetic material is placed in a magnetic field of strength H, the individual atomic
moments in the material contribute to its overall response, the magnetic induction:
Equation 1.1
where μ0 is the permeability of the free space, and the magnetization M=m⁄V is the magnetic
moment per unit volume, where m is the magnetic moment on a volume V, of the material. All
materials are magnetic to some extent, with their response depending on their atomic structure
and temperature.
Thus, materials can be classified depending on their response towards an external field. Most
materials display little magnetism even if it is only in the presence of an applied field; these are
classified either as paramagnents or diamagnets. However, some materials exhibit ordered
magnetic states and are magnetic even without an applied field; these are classified as
ferromagnets, ferrimagnets and antiferromagnets. In the latest, the prefix refers to the nature
of the coupling interaction between the electrons within the material.33
They may be conveniently classified in term of their volumetric magnetic susceptibility (χ)
Equation 1.2
where M describes the magnetization induced in a material by a magnetic field H, C is a material
- specific Curie constant and T is the temperature. In SI units χ is dimensionless and both M
and H are expressed in Am-1.
Diamagnetism is a property of all matter. A diamagnetic (DM) material do not have
1.4 Magnetic Characteristics of Nanoparticles
9
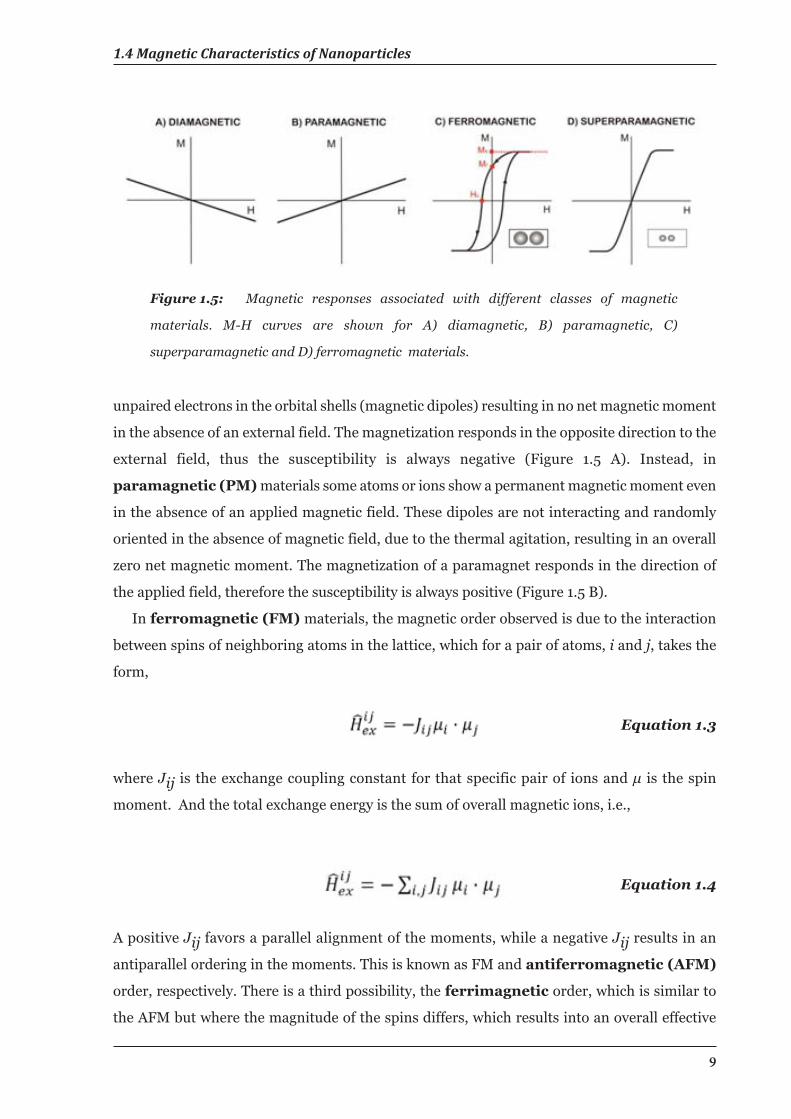
unpaired electrons in the orbital shells (magnetic dipoles) resulting in no net magnetic moment
in the absence of an external field. The magnetization responds in the opposite direction to the
external field, thus the susceptibility is always negative (Figure 1.5 A). Instead, in
paramagnetic (PM) materials some atoms or ions show a permanent magnetic moment even
in the absence of an applied magnetic field. These dipoles are not interacting and randomly
oriented in the absence of magnetic field, due to the thermal agitation, resulting in an overall
zero net magnetic moment. The magnetization of a paramagnet responds in the direction of
the applied field, therefore the susceptibility is always positive (Figure 1.5 B).
In ferromagnetic (FM) materials, the magnetic order observed is due to the interaction
between spins of neighboring atoms in the lattice, which for a pair of atoms, i and j, takes the
form,
Equation 1.3
where Jij is the exchange coupling constant for that specific pair of ions and μ is the spin
moment. And the total exchange energy is the sum of overall magnetic ions, i.e.,
Equation 1.4
A positive Jij favors a parallel alignment of the moments, while a negative Jij results in an
antiparallel ordering in the moments. This is known as FM and antiferromagnetic (AFM)
order, respectively. There is a third possibility, the ferrimagnetic order, which is similar to
the AFM but where the magnitude of the spins differs, which results into an overall effective
Figure 1.5: Magnetic responses associated with different classes of magnetic
materials. M-H curves are shown for A) diamagnetic, B) paramagnetic, C)
superparamagnetic and D) ferromagnetic materials.
Chapter 1: Introduction
10
The susceptibility in ordered materials depends not just on temperature, but also on H,
which gives rise to the characteristic sigmoidal shape of the M-H curve, with M approaching a
saturation value for large values of H (MS). Furthermore, in FM and ferrimagnetic materials
one often see hysteresis, which is an irreversibility in the magnetization process that is related
to the pinning of the magnetic domain walls at impurities or grain boundaries within the
material, as well as to intrinsic effects such as the magnetic anisotropy of the crystalline lattice.
This gives rise to the open M-H curve called hysteresis loop (Figure 1.5 C). The shapes of
these loops are determined, in part, by particles size: in large particles, there is a multi-domain
ground state which leads to a narrow hysteresis loop since it takes relatively little field energy
to make the domain walls move; while in smaller particles, there is a single domain ground
state which leads to a broad hysteresis loop. Furthermore, at even smaller sizes, (tens of
nanometers or less, depending on the material) one can see superparamagnetism, where
the magnetic moment of the particle as a whole is free to fluctuate in response to the thermal
energy, while the individual atomic moments maintain their ordered state relative to each other.
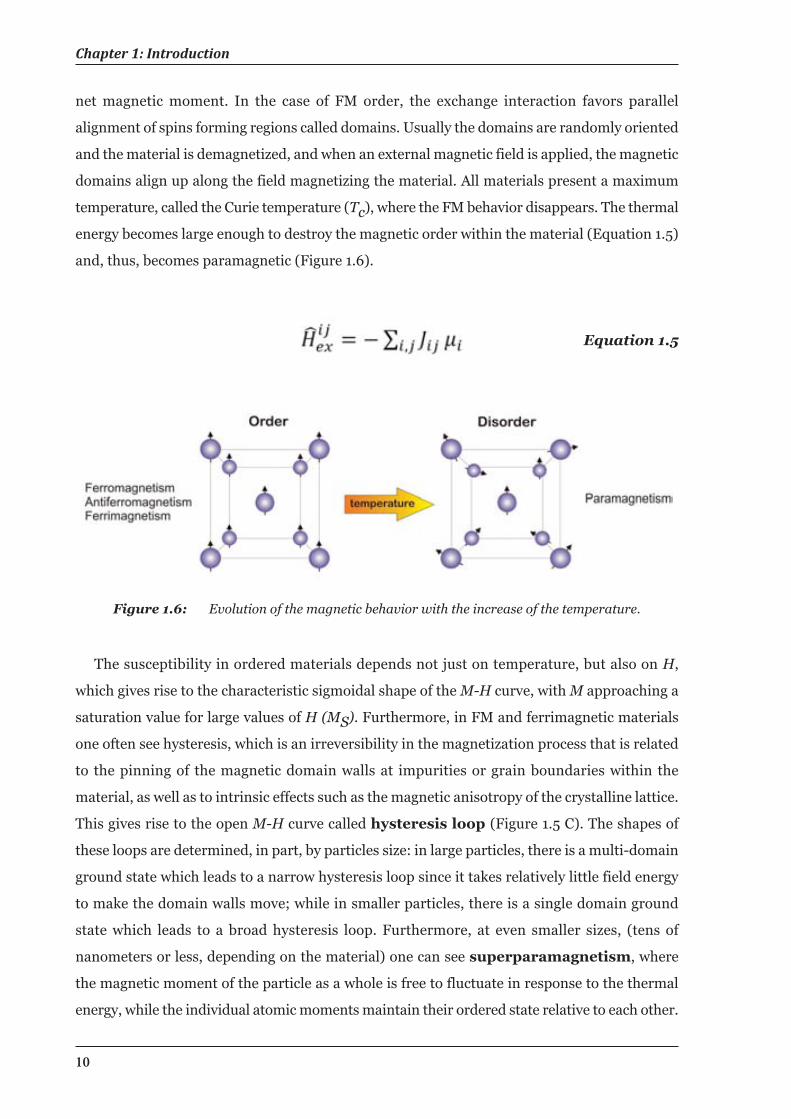
Figure 1.6: Evolution of the magnetic behavior with the increase of the temperature.
net magnetic moment. In the case of FM order, the exchange interaction favors parallel
alignment of spins forming regions called domains. Usually the domains are randomly oriented
and the material is demagnetized, and when an external magnetic field is applied, the magnetic
domains align up along the field magnetizing the material. All materials present a maximum
temperature, called the Curie temperature (Tc), where the FM behavior disappears. The thermal
energy becomes large enough to destroy the magnetic order within the material (Equation 1.5)
and, thus, becomes paramagnetic (Figure 1.6).
Equation 1.5
1.4 Magnetic Characteristics of Nanoparticles
11
This leads to the antihysteretic, but still sigmoidal, M-H curve shown in Figure 1.5 D.
1.4.2 Magnetic Nanoparticles
A magnetic NP has a net moment that is the sum of the spins of all its constituent atoms.
These atoms are organized within a crystalline structure that determines their magnetic
properties. Magnetic NPs show a wide variety of unusual magnetic properties compared to the
respective bulk materials, which arise from finite size and surface effects. They exhibit unique
phenomena such as superparamagnetism, high field irreversibility and high saturation field.
In addition, exchange anisotropy can be caused by a thin layer of AFM oxide formed around
the FM core of the NPs as a consequence of exposure to air.34 All these phenomena are attributed
to size and surface effects that dominate the behavior of magnetic particles in the nanosized
range.35 Co NPs are a typical example where it can be observed the previously described
phenomena.
Inside a material, the spins form domains where the individual moments of the atoms are
aligned which each other, and their formation is highly related with the size of the particle. In
one hand, in big particles the energy considerations suits the formation of domains. On the
other hand, when the size of the particle decreases the number of domains also decreases and
it becomes a single domain. If the particle size is reduced, there is a critical volume below which
it costs more energy to create a domain wall than to support the external magnetostatic energy
of the single-domain state. This critical diameter, which typically lies in the range of a few tens
of nanometers, depends on the type of material and it is influenced by the contribution from
various anisotropic energy terms.
1.4.3 Magnetic Anisotropy
The different directions along which magnetostatic energies have minimum/maximum
values are called directions (or axes) of easy/hard magnetization, respectively. Magnetic
anisotropy is the dependence of the internal energy of a system on the direction of the
spontaneous magnetization. The energy of an atomic moment in the crystalline structure
depends on the orientation of this magnetic moment with respect the crystallographic axis. The
exchange energy (Equation 1.3) is determined by the relative orientation of the moments with
respect each other, not by the absolute orientation with respect the crystal axes. Thus, the
magnetic anisotropy energy contains contributions from several other sources. The dominant
contribution comes from physical anisotropy (K) such as crystal lattice, shape, stress and
surface anisotropy, that favors certain M orientations.
Chapter 1: Introduction
12
Equation 1.6
Magnetocrystalline anisotropy is due to the anisotropy of the crystal lattice, and is the energy
necessary to deflect the magnetic moment from the easy to the hard direction in a single crystal,
Shape anisotropy is due to demagnetization (magnetostatic) effects in each direction of the NP
shape, strain anisotropy is due to magnetostriction, if the particle is subjected to stress, and
surface anisotropy is due to the reduced symmetry of the surface sites. The resulting associated
energy is, in the simplest case, written as,
Equation 1.7
where K is the effective anisotropy energy constant (containing contribution of all the sources
mentioned above) and is typically on the order of 103-105 J/m3 in magnetic NPs, where V is the
particle volume, and θ is the angle between the magnetization and easy axis. This direct
proportionality between ∆E and V is the reason why superparamagnetism (the thermally
activated flipping of the net moment direction) becomes important for small particles, since
for them ∆E is comparable to KBT at room temperature (RT) (see next section).
1.4.4 Superparamagnetism
In the most common cases, where the magnetic anisotropy is unidirectional (even in
spherical NPs defects favours a single easy magnetization axis), energy contains two minima
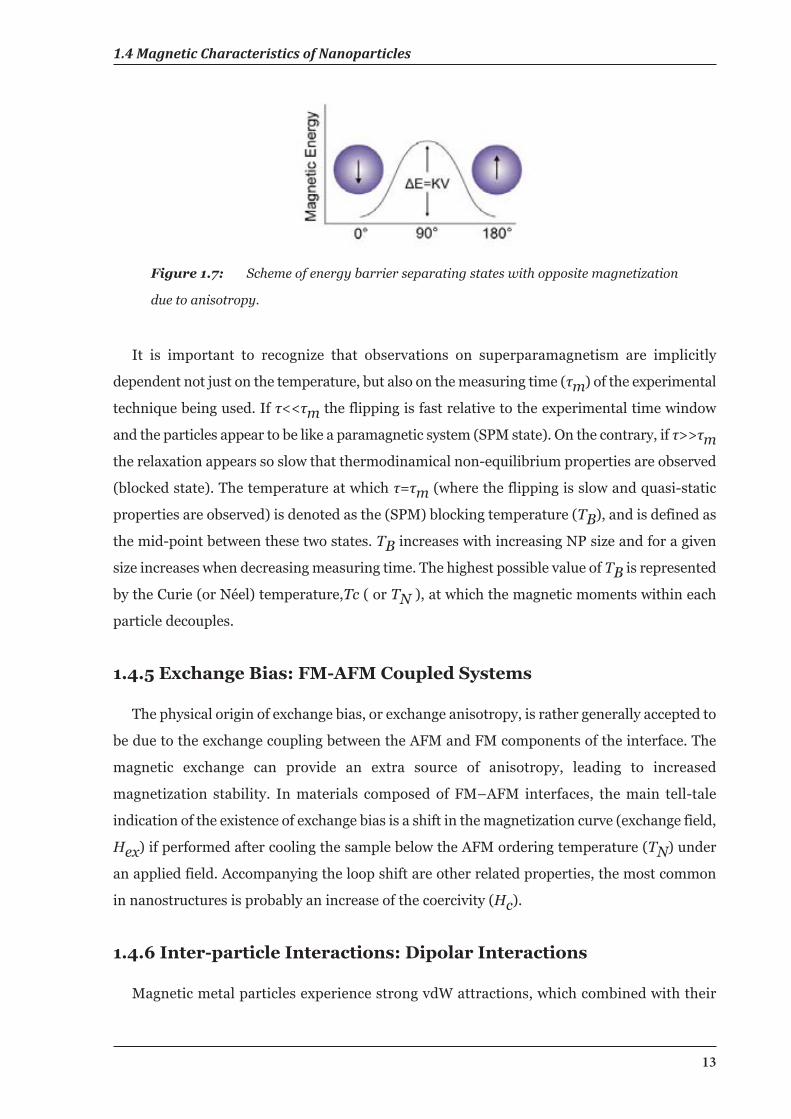
states (θ=0 and θ=180) with opposite magnetization (Figure 1.7), separated by an energy barrier
(∆E). The relaxation time,τ, between the two minima is given by the Arrhenius law:
Equation 1.8
where ∆E is the energy barrier to the moment reversal, KB is the Boltzmann’s constant, T is
the temperature, KBT is the thermal energy and τo is the moment relaxation time, that may be
considered as an “attempt time”, typically in the range of 10-11-10-9 s for non interacting
superparamagnetic (SPM) NPs.
1.4 Magnetic Characteristics of Nanoparticles
13
It is important to recognize that observations on superparamagnetism are implicitly
dependent not just on the temperature, but also on the measuring time (τm) of the experimental
technique being used. If τ<<τm the flipping is fast relative to the experimental time window
and the particles appear to be like a paramagnetic system (SPM state). On the contrary, if τ>>τmthe relaxation appears so slow that thermodinamical non-equilibrium properties are observed
(blocked state). The temperature at which τ=τm (where the flipping is slow and quasi-static
properties are observed) is denoted as the (SPM) blocking temperature (TB), and is defined as
the mid-point between these two states. TB increases with increasing NP size and for a given
size increases when decreasing measuring time. The highest possible value of TB is represented
by the Curie (or Néel) temperature,Tc ( or TN ), at which the magnetic moments within each
particle decouples.
1.4.5 Exchange Bias: FM-AFM Coupled Systems
The physical origin of exchange bias, or exchange anisotropy, is rather generally accepted to
be due to the exchange coupling between the AFM and FM components of the interface. The
magnetic exchange can provide an extra source of anisotropy, leading to increased
magnetization stability. In materials composed of FM–AFM interfaces, the main tell-tale
indication of the existence of exchange bias is a shift in the magnetization curve (exchange field,
Hex) if performed after cooling the sample below the AFM ordering temperature (TN) under
an applied field. Accompanying the loop shift are other related properties, the most common
in nanostructures is probably an increase of the coercivity (Hc).
1.4.6 Inter-particle Interactions: Dipolar Interactions
Magnetic metal particles experience strong vdW attractions, which combined with their
Figure 1.7: Scheme of energy barrier separating states with opposite magnetization
due to anisotropy.
Chapter 1: Introduction
14
magnetic dipole interactions, make the stabilization of these systems very challenging. Highly
ordered structures of NCs such as two or three dimensional assemblies are also interesting
because these NCs can act as building blocks in future devices for potential applications such
as data storage, permanent magnetic composites and biomedicine.36
The SPM behavior depends on inter-particle interactions. Additionally, at low temperatures,
the interactions between NPs become more important and can have strong influence in their
dynamics. The most important type of magnetic interactions in NPs is the dipole-dipole
interaction, which refers to the direct interaction between magnetic moments of neighboring
particles. Such interactions normally leads to increased disorder and spin-glass like behavior,
however ordering interactions are also possible. Dipolar ferromagnetism in the absence of
an external applied magnetic field was first predicted by Luttinger and Tisza,37 who found a FM
ground state for a face-centered-cubic (fcc) lattice of point dipoles. Its importance falls on the
presence of two main features: long-range character and rather large value of the typical
magnetic moment of an individual NP (103-104 Bohr’s magnetons, μB). Dipolar interactions are
present in all magnetic spin systems, but in large magnetic materials are usually negligible
compared to exchange interactions. However, decreasing the single particle size usually reduces
the anisotropy energy or modifies the easy magnetization axes increasing the influence of
dipolar interactions. Dipole interaction energy for a particle is the order of
Equation 1.9
where μ is the average magnetic moment, d the average distance between the particles, and μois the permeability of free space.
In fact, dipolar interactions play an important role in determining cooperative phenomena
at the molecular scale and in the final properties of the material.2 Dipoles display a fondness
for arranging themselves into highly inhomogeneous structures. This is a consequence of the
very strong anisotropy of the dipole-dipole interaction, which couples the orientations of the
dipole moments with that of the inter-particle vector, what is different from the isotropic vdW
interaction. Dipolar interactions are anisotropic and can favor AFM and FM alignments of the
magnetic moments, depending on geometry. Furthermore, the dipolar interaction tends to be
frustrated,38 and NP systems with dipolar interactions are anticipated to easily demonstrate
spin-glass properties due to the random distribution of particle easy axes and positions.39
1.5 Self-Assembly Process
15
1.5 Self-Assembly Process
The central role of the SA in life is one of the most important reasons that lead to its study.
SA can be defined by a spontaneous organization of components into patterns and structures
without human intervention, and is common throughout nature and technology.1 In addition,
SA is one of the few practical strategies for making ensembles of nanostructures, and it therefore
is an essential part of nanotechnology. The concept of SA is increasingly used in many
disciplines with different nuances in order to break nature’s code for SA.1
Dispersed colloidal NPs self-assemble into complex structures when segregated from the
solvent, either by evaporation or precipitation. Different micro and macroscopic structures like
opals, fractals, mixed structures and other forms based in NPs have been observed40
as a result
of the balance between electrostatic forces, surface tension, entropy, topography, substrate
affinity and, most importantly, the size, shape and concentration of the particles.41
The study
of these systems is a key issue for applications and for fundamental investigations.
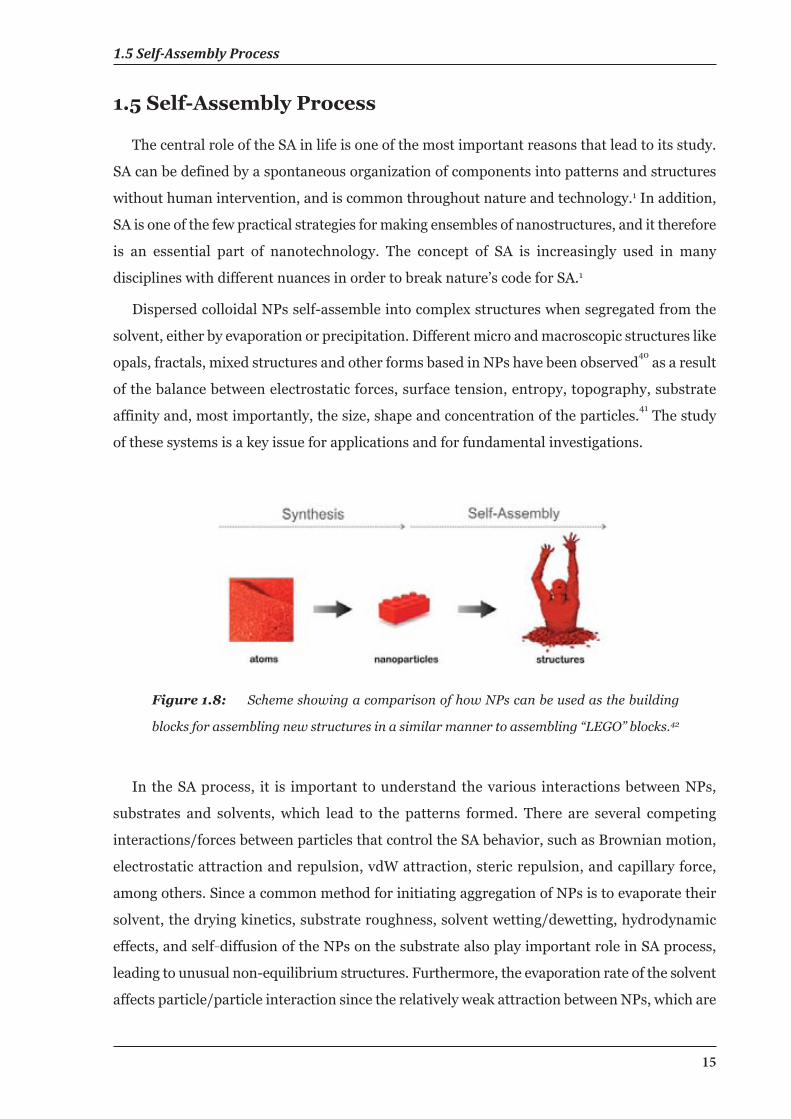
Figure 1.8: Scheme showing a comparison of how NPs can be used as the building
blocks for assembling new structures in a similar manner to assembling “LEGO” blocks.42
In the SA process, it is important to understand the various interactions between NPs,
substrates and solvents, which lead to the patterns formed. There are several competing
interactions/forces between particles that control the SA behavior, such as Brownian motion,
electrostatic attraction and repulsion, vdW attraction, steric repulsion, and capillary force,
among others. Since a common method for initiating aggregation of NPs is to evaporate their
solvent, the drying kinetics, substrate roughness, solvent wetting/dewetting, hydrodynamic
effects, and self–diffusion of the NPs on the substrate also play important role in SA process,
leading to unusual non-equilibrium structures. Furthermore, the evaporation rate of the solvent
affects particle/particle interaction since the relatively weak attraction between NPs, which are
Chapter 1: Introduction
16
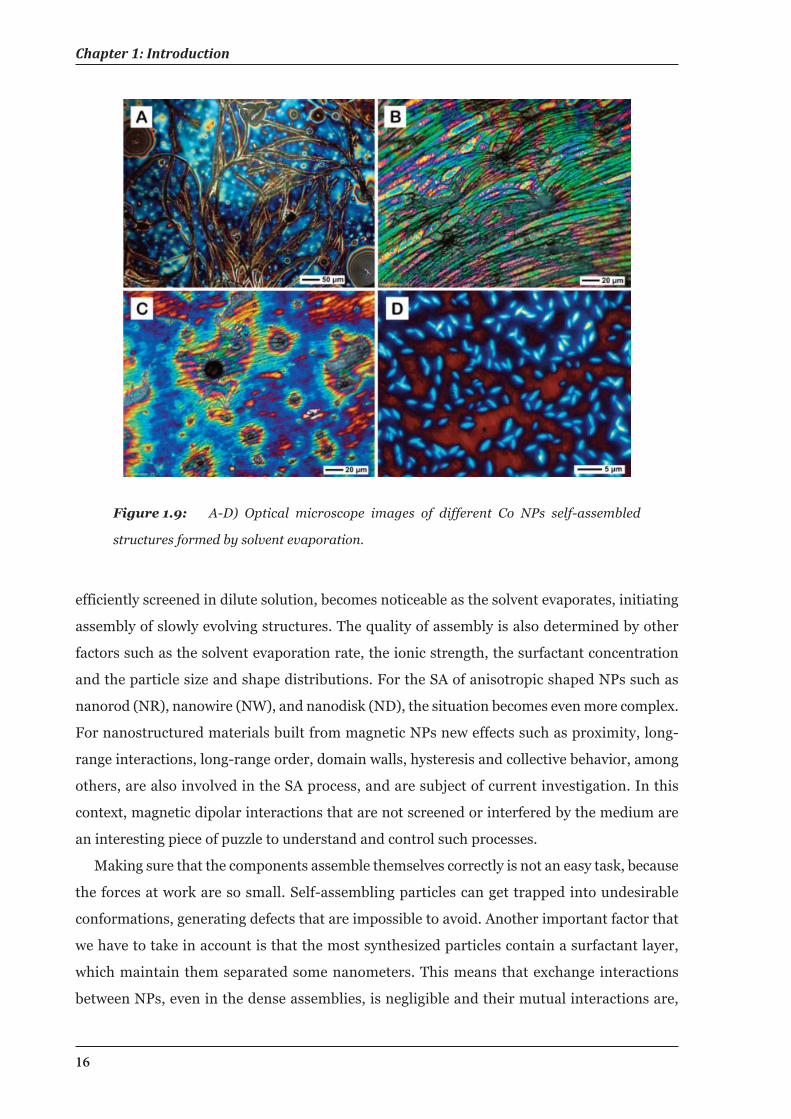
efficiently screened in dilute solution, becomes noticeable as the solvent evaporates, initiating
assembly of slowly evolving structures. The quality of assembly is also determined by other
factors such as the solvent evaporation rate, the ionic strength, the surfactant concentration
and the particle size and shape distributions. For the SA of anisotropic shaped NPs such as
nanorod (NR), nanowire (NW), and nanodisk (ND), the situation becomes even more complex.
For nanostructured materials built from magnetic NPs new effects such as proximity, long-
range interactions, long-range order, domain walls, hysteresis and collective behavior, among
others, are also involved in the SA process, and are subject of current investigation. In this
context, magnetic dipolar interactions that are not screened or interfered by the medium are
an interesting piece of puzzle to understand and control such processes.
Making sure that the components assemble themselves correctly is not an easy task, because
the forces at work are so small. Self-assembling particles can get trapped into undesirable
conformations, generating defects that are impossible to avoid. Another important factor that
we have to take in account is that the most synthesized particles contain a surfactant layer,
which maintain them separated some nanometers. This means that exchange interactions
between NPs, even in the dense assemblies, is negligible and their mutual interactions are,
Figure 1.9: A-D) Optical microscope images of different Co NPs self-assembled
structures formed by solvent evaporation.
1.6 References
17
therefore, dominated by long-range dipole-dipole interactions. Thus, dipolar interactions play
an important role in determining cooperative phenomena at the molecular scale and the final
properties of the material made of magnetic NPs. 43
There is a specific case of SA of NCs, also considered as a growth mechanism, known as
oriented attachment. Oriented attachment involves spontaneous self-organization of adjacent
particles, sharing a common crystallographic orientation, followed by joining of these particles
at a planar interface. Bonding between the particles reduces overall energy by removing surface
energy associated with unsatisfied bonds.44,45
1.6 References
1. Whitesides, G. M.; Grzybowski, B. "Self-Assembly at All Scales". Science 2002, 295,
2418-2421.
2. Zeng, H.; Li, J.; Liu, J. P.; Wang, Z. L.; Sun, S. "Exchange-Coupled Nanocomposite
Magnets by Nanoparticle Self-Assembly". Nature 2002, 420, 395-398.
3. Li, Y.; Somorjai, G. A. "Nanoscale Advances in Catalysis and Energy Applications". Nano
Letters 2010, 10, 2289-2295.
4. Pankhurst, Q. A.; Connolly, J.; Jones, S. K.; Dobson, J. "Applications of Magnetic
Nanoparticles in Biomedicine". Journal of Physics D-Applied Physics 2003, 36, R167-R181.
5. Arbiol, J.; Estrade, S.; Prades, J. D.; Cirera, A.; Furtmayr, F.; Stark, C.; Laufer, A.;
Stutzmann, M.; Eickhoff, M.; Gass, M. H.; Bleloch, A. L.; Peiro, F.; Morante, J. R. "Triple-
Twin Domains in Mg Doped Gan Wurtzite Nanowires: Structural and Electronic Properties
of This Zinc-Blende-Like Stacking". Nanotechnology 2009, 20.
6. Sanchez, A.; Recillas, S.; Font, X.; Casals, E.; Gonzalez, E.; Puntes, V. "Ecotoxicity of,
and Remediation with, Engineered Inorganic Nanoparticles in the Environment". Trac-
Trends in Analytical Chemistry 2011, 30, 507-516.
7. Gubin, S. P.; Koksharov, Y. A. "Preparation, Structure, and Properties of Magnetic
Materials Based on Co-Containing Nanoparticles". Inorganic Materials 2002, 38, 1085-
1099.
8. Kessler, R. "Engineered Nanoparticles in Consumer Products Understanding a New
Ingredient". Environmental Health Perspectives 2011, 119, 121-125.
Chapter 1: Introduction
18
9. Burda, C.; Chen, X.; Narayanan, R.; El-Sayed, M. A. "Chemistry and Properties of
Nanocrystals of Different Shapes". Chemical Reviews 2005, 105, 1025-1102.
10.Rotello, V. Nanoparticles: Building Blocks for Nanotechnology 1st ed.; Springer, 2003.
11. Yin, Y.; Lu, Y.; Gates, B.; Xia, Y. "Template-Assisted Self-Assembly: A Practical Route
to Complex Aggregates of Monodispersed Colloids with Well-Defined Sizes, Shapes, and
Structures". Journal of the American Chemical Society 2001, 123, 8718-8729.
12. Corma, A.; Atienzar, P.; Garcia, H.; Chane-Ching, J.-Y. "Hierarchically Mesostructured
Doped Ceo2 with Potential for Solar-Cell Use". Nat Mater 2004, 3, 394-397.
13. Murthy, V. S.; Cha, J. N.; Stucky, G. D.; Wong, M. S. "Charge-Driven Flocculation of
Poly(L-Lysine)Gold Nanoparticle Assemblies Leading to Hollow Microspheres". Journal of
the American Chemical Society 2004, 126, 5292-5299.
14. Wang, Z. L. "Structural Analysis of Self-Assembling Nanocrystal Superlattices".
Advanced Materials 1998, 10, 13-30.
15. Pileni, M. P. "Nanocrystal Self-Assemblies: Fabrication and Collective Properties".
Journal of Physical Chemistry B 2001, 105, 3358-3371.
16. Kelly, K. L.; Coronado, E.; Zhao, L. L.; Schatz, G. C. "The Optical Properties of Metal
Nanoparticles: The Influence of Size, Shape, and Dielectric Environment". Journal of
Physical Chemistry B 2003, 107, 668-677.
17. Mie, G. "Beiträge Zur Optik Trüber Medien, Speziell Kolloidaler Metallösungen".
Annalen der Physik 1908, 330, 377-445.
18. Nie, S. M.; Emery, S. R. "Probing Single Molecules and Single Nanoparticles by Surface-
Enhanced Raman Scattering". Science 1997, 275, 1102-1106.
19. Bruchez, M.; Moronne, M.; Gin, P.; Weiss, S.; Alivisatos, A. P. "Semiconductor
Nanocrystals as Fluorescent Biological Labels". Science 1998, 281, 2013-2016.
20. Chan, W. C. W.; Nie, S. "Quantum Dot Bioconjugates for Ultrasensitive Nonisotopic
Detection". Science 1998, 281, 2016-2018.
21. Derjaguin, B. V.; Landau, L. "Theory of the Stability of Strongly Charged Lyophobic Sols
and of the Adhesion of Strongly Charged Particles in Solutions of Electrolytes". Acta Phys.
Chim. URSS 1941, 14, 633-662.
1.6 References
19
22.Verwey, E. J. W.; Overbeek, J. T. G. Theory of the Stability of Lyophobic Colloids; Dover
Publications, 1999.
23.Laaksonen, T.; Ahonen, P.; Johans, C.; Kontturi, K. "Stability and Electrostatics of
Mercaptoundecanoic Acid-Capped Gold Nanoparticles with Varying Counterion Size".
Chemphyschem 2006, 7, 2143-2149.
24.Stern, O. "The Theory of the Electrolytic Double Shift". Zeitschrift Fur Elektrochemie
Und Angewandte Physikalische Chemie 1924, 30, 508-516.
25.Robinson, R. D.; Sadtler, B.; Demchenko, D. O.; Erdonmez, C. K.; Wang, L.-W.;
Alivisatos, A. P. "Spontaneous Superlattice Formation in Nanorods through Partial Cation
Exchange". Science 2007, 317, 355-358.
26.Senthil Kumar, P.; Pastoriza-Santos, I.; Rodriguez-Gonzalez, B.; Garcia de Abajo, F. J.;
Liz-Marzan, L. M. "High-Yield Synthesis and Optical Response of Gold Nanostars".
Nanotechnology 2008, 19.
27. Sun, S. H.; Murray, C. B. "Synthesis of Monodisperse Cobalt Nanocrystals and Their
Assembly into Magnetic Superlattices (Invited)". Journal of Applied Physics 1999, 85,
4325-4330.
28.Peng, X. G.; Manna, L.; Yang, W. D.; Wickham, J.; Scher, E.; Kadavanich, A.; Alivisatos,
A. P. "Shape Control of Cdse Nanocrystals". Nature 2000, 404, 59-61.
29.Jana, N. R.; Gearheart, L.; Murphy, C. J. "Seeding Growth for Size Control of 5-40 Nm
Diameter Gold Nanoparticles". Langmuir 2001, 17, 6782-6786.
30. Cushing, B. L.; Kolesnichenko, V. L.; O'Connor, C. J. "Recent Advances in the Liquid-
Phase Syntheses of Inorganic Nanoparticles". Chemical Reviews 2004, 104, 3893-3946.
31. Puntes, V. F.; Krishnan, K. M.; Alivisatos, A. P. "Colloidal Nanocrystal Shape and Size
Control: The Case of Cobalt". Science 2001, 291, 2115-2117.
32.LaMer, V. K.; Dinegar, R. H. "Theory, Production and Mechanism of Formation of
Monodispersed Hydrosols". Journal of the American Chemical Society 1950, 72, 4847.
33.Morrish, A. H. The Physical Principles of Magnetism; Wiley-IEEE Press: New York,
2001.
Chapter 1: Introduction
20
34.Tartaj, P.; Morales, M. D.; Veintemillas-Verdaguer, S.; Gonzalez-Carreno, T.; Serna, C.
J. "The Preparation of Magnetic Nanoparticles for Applications in Biomedicine". Journal
of Physics D-Applied Physics 2003, 36, R182-R197.
35.Batlle, X.; Labarta, A. "Finite-Size Effects in Fine Particles: Magnetic and Transport
Properties". Journal of Physics D-Applied Physics 2002, 35, R15-R42.
36.Sun, S. "Recent Advances in Chemical Synthesis, Self-Assembly, and Applications of
Fept Nanoparticles". Advanced Materials 2006, 18, 393-403.
37. Luttinger, J. M.; Tisza, L. "Theory of Dipole Interaction in Crystals". Physical Review
1946, 70, 954-964.
38.Chan, D. C. F.; Kirpotin, D. B.; Bunn, P. A. "Synthesis and Evaluation of Colloidal
Magnetic Iron-Oxides for the Site-Specific Radiofrequency-Induced Hyperthermia of
Cancer". Journal of Magnetism and Magnetic Materials 1993, 122, 374-378.
39.Poddar, P.; Telem-Shafir, T.; Fried, T.; Markovich, G. "Dipolar Interactions in Two- and
Three-Dimensional Magnetic Nanoparticle Arrays". Physical Review B 2002, 66, 060403.
40. Murray, C. B.; Kagan, C. R.; Bawendi, M. G. "Synthesis and Characterization of
Monodisperse Nanocrystals and Close-Packed Nanocrystal Assemblies". Annual Review of
Materials Science 2000, 30, 545-610.
41. Puntes, V. F.; Bastus, N. G.; Pagonabarraga, I.; Iglesias, O.; Labarta, A.; Batlle, X.
"Nucleation Phenomenon in Nanoparticle Self-Assemblies". International Journal of
Nanotechnology 2005, 2, 62-70.
42.http://brickartist.com/lego-art/red.html. © Copyright: See Author in the Original
Source of This Image
43.Zeng, H.; Li, J.; Liu, J. P.; Wang, Z. L.; Sun, S. H. "Exchange-Coupled Nanocomposite
Magnets by Nanoparticle Self-Assembly". Nature 2002, 420, 395-398.
44.Penn, R. L.; Banfield, J. F. "Imperfect Oriented Attachment: Dislocation Generation in
Defect-Free Nanocrystals". Science 1998, 281, 969-971.
45.Penn, R. L.; Banfield, J. F. "Morphology Development and Crystal Growth in
Nanocrystalline Aggregates under Hydrothermal Conditions: Insights from Titania".
Geochimica et Cosmochimica Acta 1999, 63, 1549-1557.
21
The combination of size- and shape-dependent physical properties, together whit their easy
fabrication and processing, makes NPs promising building blocks for materials with designed
functions.1,2 The properties of the individual particles as well as their mutual interactions
determine important features of the NPs systems. Since magnetic and optical properties are
highly dependent on the size, shape, crystalline and surface state of the NPs, their controlled
synthesis with a narrow size distribution and uniform shape remains an important issue.
Various methods have been developed for the synthesis of colloidal NPs.3-6 In particular, the
thermal decomposition of metal carbonyls is known to produce well-defined metallic NCs.7
In this chapter, we investigate different synthetic routes towards metallic NPs, presenting
different characteristic properties for their later use in SA processes. Firstly, we start with the
synthesis of different size Co NPs and the study of their size-dependent magnetic properties,
which are directly related with the oxidation state and crystal structure, among others. For this
reason, it is important to control the oxidation processes of Co NPs. We observe the formation
of different NPs such as Co/CoO core/shell and CoO hollow NPs. In addition, we study the
synthesis of Pt NPs, and the influence of Co in the formation of PtCo bimetallic particles. We
also explore the formation of Pt-Au heterodimers by using PtCo NPs both as a reaction catalyst
and starting material. Finally, we finish this chapter with the study of the formation of long
rod-shaped Au NCs, also using Pt NPs as catalytic starting of the reaction.
Chapter 2Synthesis of Metallic and BimetallicNanoparticles
Chapter 2: Synthesis of Metallic and Bimetallic Nanoparticles
22
2.1 Synthesis of Co Nanoparticles
Magnetic NPs have been the subject of extensive research because they have the potential
to be utilized in several applications such as ultra-high density recording media,8,9 contrast
agent in magnetic resonance imaging,10 drug delivery11 and as single electron transistors.8,9
Co is a well-known FM material which is commonly used as an alloying element in
permanent magnets.12 It can be found in two forms: hexagonal close-packed (hcp) and face-
centered cubic (fcc). The hcp phase is the bulk stable phase at RT, whereas fcc is stable at
temperatures above 450 °C.13 At the nanoscale regime, Co particles present a wide range of
interesting size-dependent structural, electrical, magnetic, and catalytic properties.14 Their net
moment that is sum of the spin of all atoms, displaying quantum size effects,
superparamagnetism, large magnetic anisotropies, and a maximum coercivity.15 In particular,
because of their large surface area, Co NPs show high chemical reactivity, which makes them
suitable for catalysis of intramolecular reactions.16 When the particle size is reduced, there is a
critical volume below which it costs more energy to create a domain wall than to support the
external magnetostatic energy of the single-domain state. This critical diameter typically, which
lies in the range of a few tens of nanometers, depends on the material and it is influenced by
the contribution from various anisotropic energy terms. Moreover, at this scale, a new
metastable phase of cobalt called epsilon (ε-Co) can also be formed.4,13 This new phase is a
primitive cubic phase (complex β-Mn phase) with 20 atoms in the elemental cell, and present
properties in between the hcp and fcc phases. Gubin et al. described in detail different methods
for the synthesis and magnetic properties of the different structures of Co particles.17
Liquid-phase synthetic routes are the most successful in the preparation of macroscopic
amount of monodisperse Co NPs. Examples of liquid-phase processes are metal salt
reduction,18,19 reverse micelles20 and thermal decomposition of organometallic precursor7 (see
also section 1.3.2). Among these routes, the organometallic route in the presence of tightly
binded ligands are the more extended in the preparation of monodispersed ε-Co NPs. The rapid
injection of organometallic reagents in a hot coordinating solvent produces temporally discrete
homogeneous nucleation. The life time of the monomers in solution is short, and rapidly many
small metal clusters form simultaneously. The surfactants (coordinating ligands) present in
solution allows controlling the size and the shape of the growing particles by coating them with
a close-packed ML. Also, this surfactant layer around the NPs prevents their agglomeration,
providing steric hindrance, and protects the NPs against oxidation.
In this section, a general synthesis methodology to prepare different sized ε-Co NPs in
organic solvent will be presented. This method was developed by Puntes et.al. and is based on
2.1 Synthesis of Co Nanoparticles
23
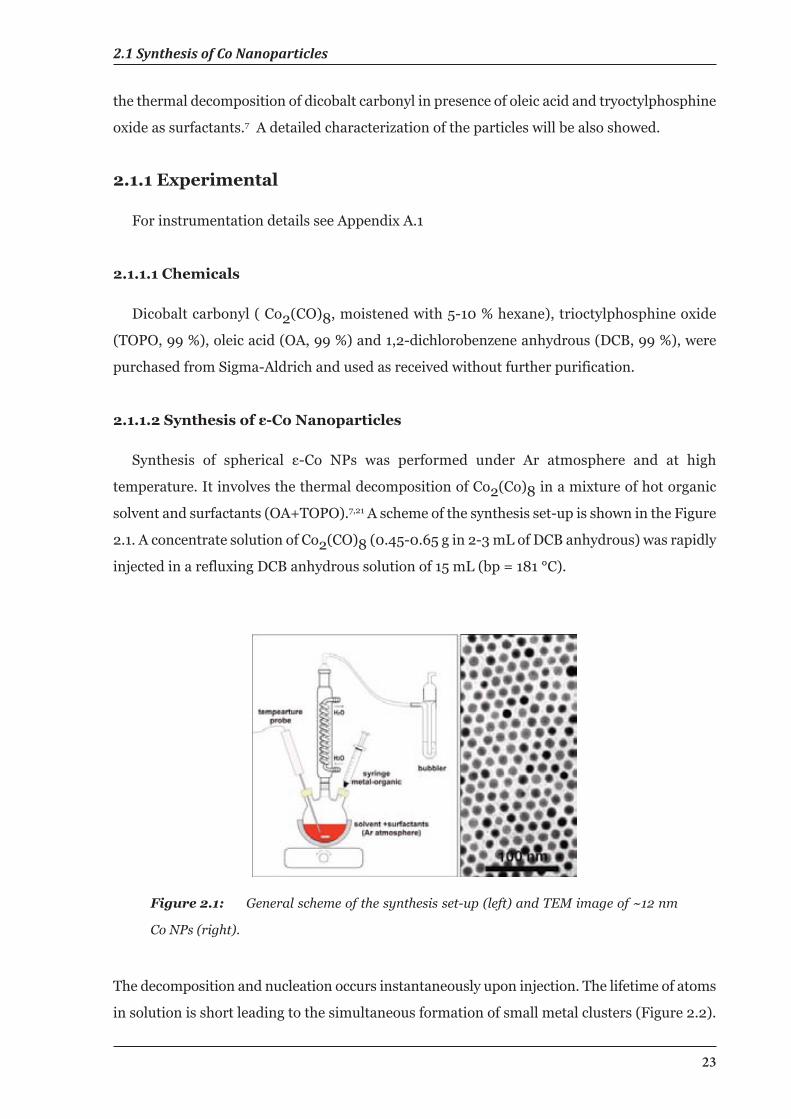
the thermal decomposition of dicobalt carbonyl in presence of oleic acid and tryoctylphosphine
oxide as surfactants.7 A detailed characterization of the particles will be also showed.
2.1.1 Experimental
For instrumentation details see Appendix A.1
2.1.1.1 Chemicals
Dicobalt carbonyl ( Co2(CO)8, moistened with 5-10 % hexane), trioctylphosphine oxide
(TOPO, 99 %), oleic acid (OA, 99 %) and 1,2-dichlorobenzene anhydrous (DCB, 99 %), were
purchased from Sigma-Aldrich and used as received without further purification.
2.1.1.2 Synthesis of ε-Co Nanoparticles
Synthesis of spherical ε-Co NPs was performed under Ar atmosphere and at high
temperature. It involves the thermal decomposition of Co2(Co)8 in a mixture of hot organic
solvent and surfactants (OA+TOPO).7,21 A scheme of the synthesis set-up is shown in the Figure
2.1. A concentrate solution of Co2(CO)8 (0.45-0.65 g in 2-3 mL of DCB anhydrous) was rapidly
injected in a refluxing DCB anhydrous solution of 15 mL (bp = 181 °C).
Figure 2.1: General scheme of the synthesis set-up (left) and TEM image of ~12 nm
Co NPs (right).
The decomposition and nucleation occurs instantaneously upon injection. The lifetime of atoms
in solution is short leading to the simultaneous formation of small metal clusters (Figure 2.2).
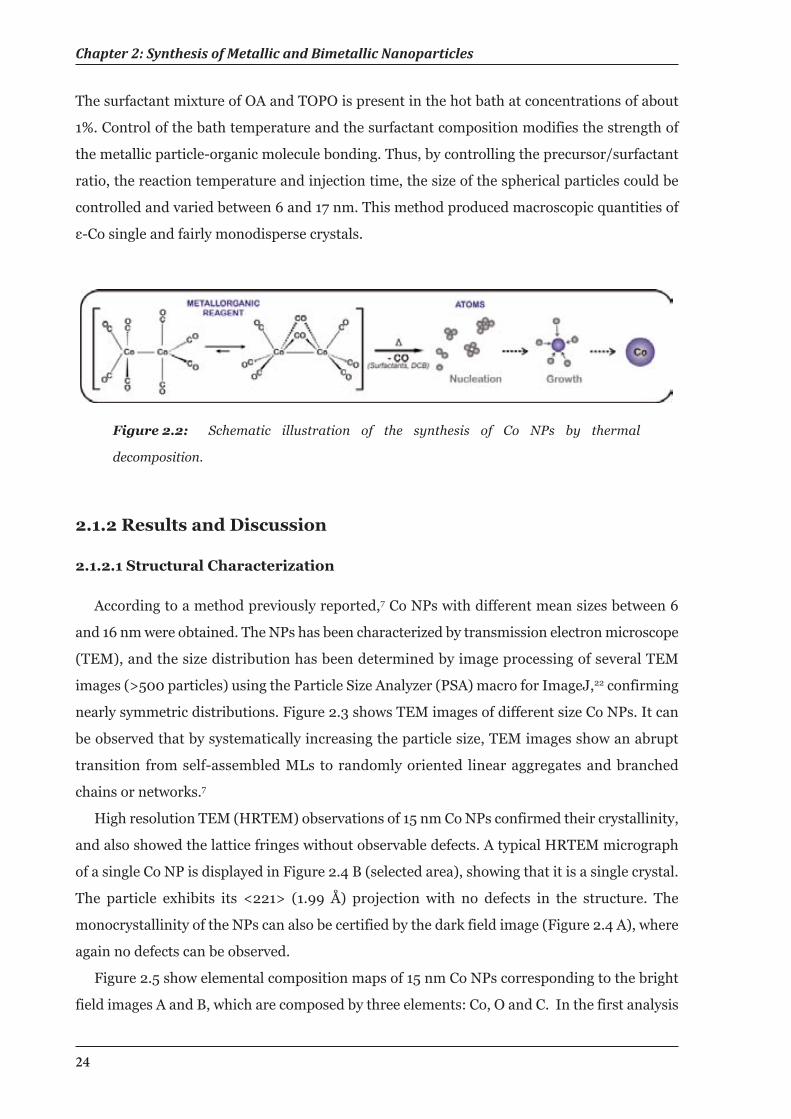
Chapter 2: Synthesis of Metallic and Bimetallic Nanoparticles
24
The surfactant mixture of OA and TOPO is present in the hot bath at concentrations of about
1%. Control of the bath temperature and the surfactant composition modifies the strength of
the metallic particle-organic molecule bonding. Thus, by controlling the precursor/surfactant
ratio, the reaction temperature and injection time, the size of the spherical particles could be
controlled and varied between 6 and 17 nm. This method produced macroscopic quantities of
ε-Co single and fairly monodisperse crystals.
Figure 2.2: Schematic illustration of the synthesis of Co NPs by thermal
decomposition.
2.1.2 Results and Discussion
2.1.2.1 Structural Characterization
According to a method previously reported,7 Co NPs with different mean sizes between 6
and 16 nm were obtained. The NPs has been characterized by transmission electron microscope
(TEM), and the size distribution has been determined by image processing of several TEM
images (>500 particles) using the Particle Size Analyzer (PSA) macro for ImageJ,22 confirming
nearly symmetric distributions. Figure 2.3 shows TEM images of different size Co NPs. It can
be observed that by systematically increasing the particle size, TEM images show an abrupt
transition from self-assembled MLs to randomly oriented linear aggregates and branched
chains or networks.7
High resolution TEM (HRTEM) observations of 15 nm Co NPs confirmed their crystallinity,
and also showed the lattice fringes without observable defects. A typical HRTEM micrograph
of a single Co NP is displayed in Figure 2.4 B (selected area), showing that it is a single crystal.
The particle exhibits its <221> (1.99 Å) projection with no defects in the structure. The
monocrystallinity of the NPs can also be certified by the dark field image (Figure 2.4 A), where
again no defects can be observed.
Figure 2.5 show elemental composition maps of 15 nm Co NPs corresponding to the bright
field images A and B, which are composed by three elements: Co, O and C. In the first analysis
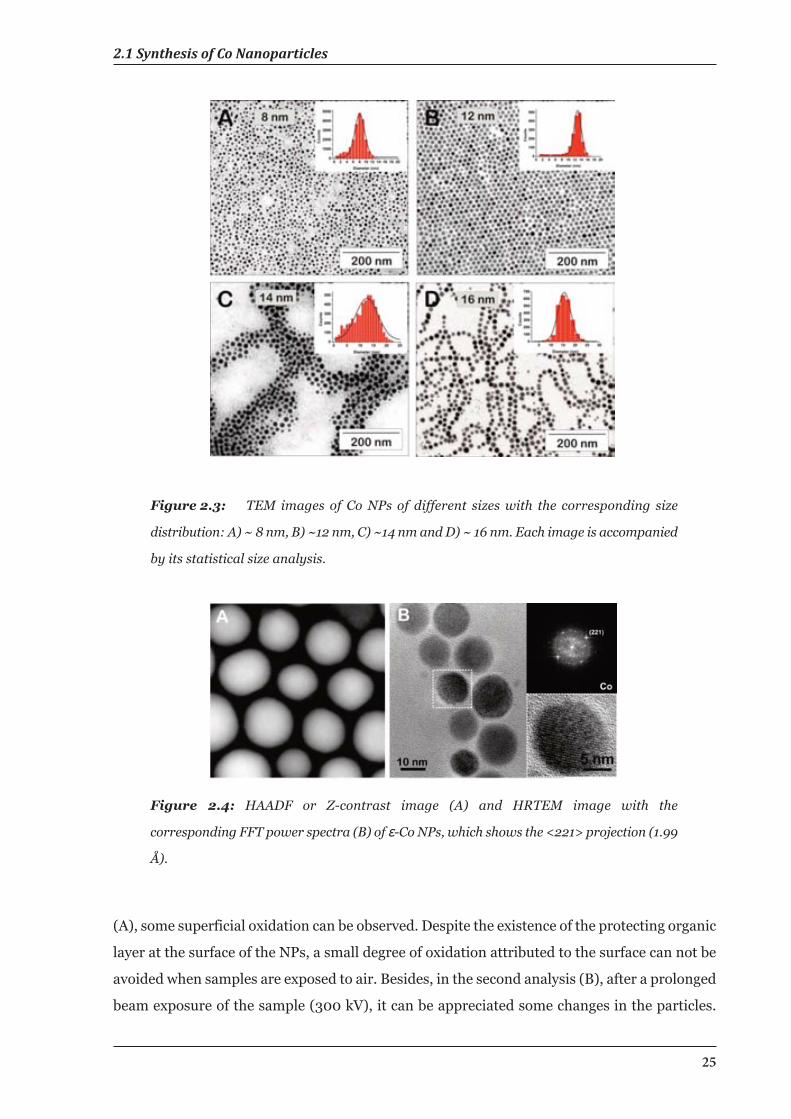
2.1 Synthesis of Co Nanoparticles
25
(A), some superficial oxidation can be observed. Despite the existence of the protecting organic
layer at the surface of the NPs, a small degree of oxidation attributed to the surface can not be
avoided when samples are exposed to air. Besides, in the second analysis (B), after a prolonged
beam exposure of the sample (300 kV), it can be appreciated some changes in the particles.
Figure 2.4: HAADF or Z-contrast image (A) and HRTEM image with the
corresponding FFT power spectra (B) of ɛ-Co NPs, which shows the <221> projection (1.99
Å).
Figure 2.3: TEM images of Co NPs of different sizes with the corresponding size
distribution: A) ~ 8 nm, B) ~12 nm, C) ~14 nm and D) ~ 16 nm. Each image is accompanied
by its statistical size analysis.
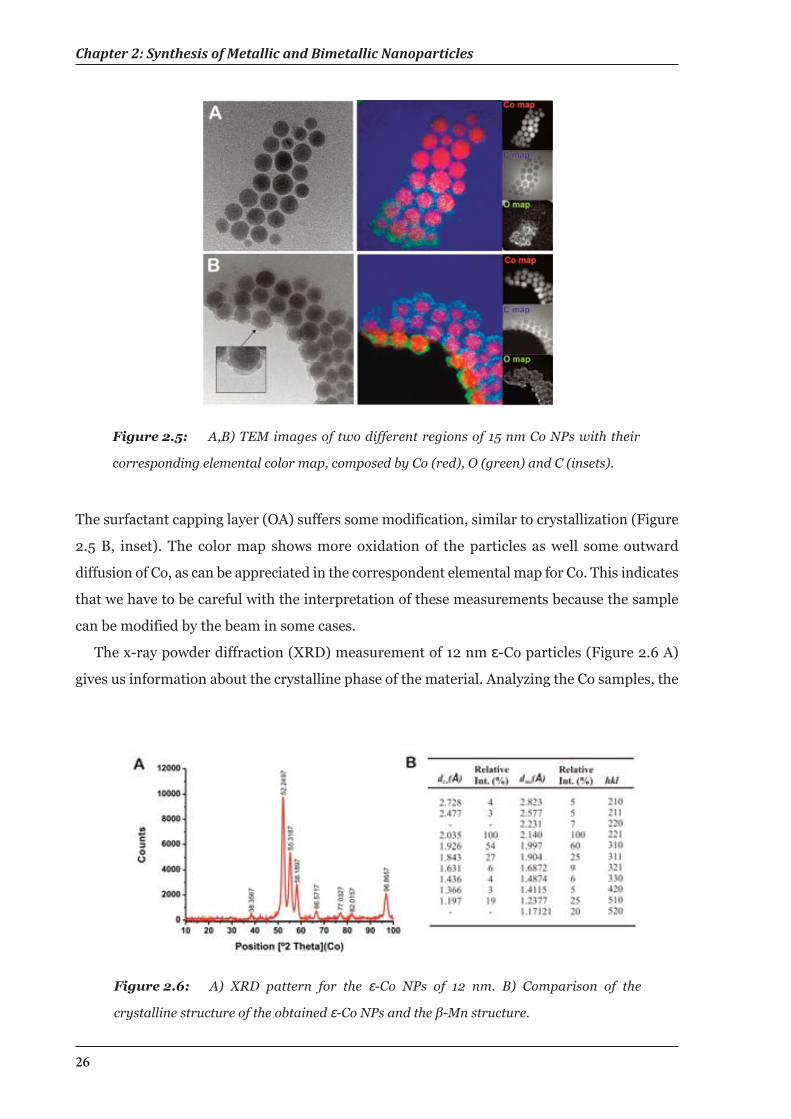
Chapter 2: Synthesis of Metallic and Bimetallic Nanoparticles
26
The surfactant capping layer (OA) suffers some modification, similar to crystallization (Figure
2.5 B, inset). The color map shows more oxidation of the particles as well some outward
diffusion of Co, as can be appreciated in the correspondent elemental map for Co. This indicates
that we have to be careful with the interpretation of these measurements because the sample
can be modified by the beam in some cases.
The x-ray powder diffraction (XRD) measurement of 12 nm ɛ-Co particles (Figure 2.6 A)
gives us information about the crystalline phase of the material. Analyzing the Co samples, the
Figure 2.5: A,B) TEM images of two different regions of 15 nm Co NPs with their
corresponding elemental color map, composed by Co (red), O (green) and C (insets).
Figure 2.6: A) XRD pattern for the ɛ-Co NPs of 12 nm. B) Comparison of the
crystalline structure of the obtained ɛ-Co NPs and the β-Mn structure.
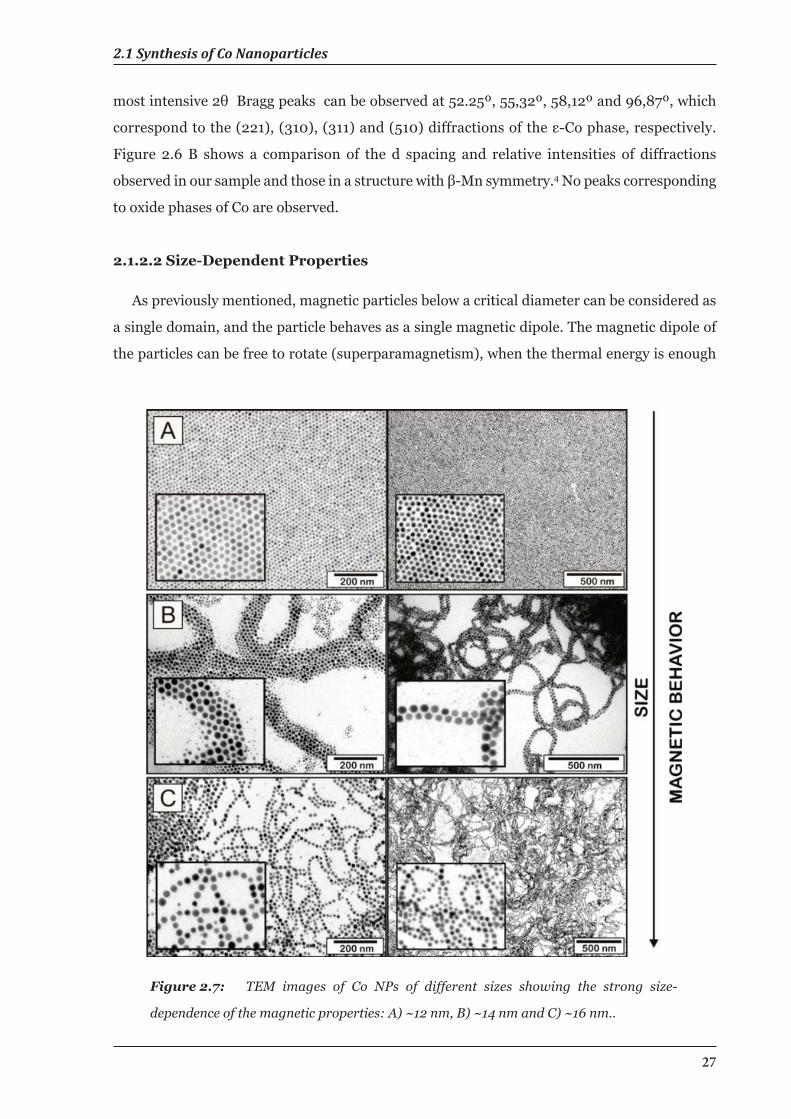
2.1 Synthesis of Co Nanoparticles
27
most intensive 2θ Bragg peaks can be observed at 52.25º, 55,32º, 58,12º and 96,87º, which
correspond to the (221), (310), (311) and (510) diffractions of the ε-Co phase, respectively.
Figure 2.6 B shows a comparison of the d spacing and relative intensities of diffractions
observed in our sample and those in a structure with β-Mn symmetry.4 No peaks corresponding
to oxide phases of Co are observed.
2.1.2.2 Size-Dependent Properties
As previously mentioned, magnetic particles below a critical diameter can be considered as
a single domain, and the particle behaves as a single magnetic dipole. The magnetic dipole of
the particles can be free to rotate (superparamagnetism), when the thermal energy is enough
Figure 2.7: TEM images of Co NPs of different sizes showing the strong size-
dependence of the magnetic properties: A) ~12 nm, B) ~14 nm and C) ~16 nm..
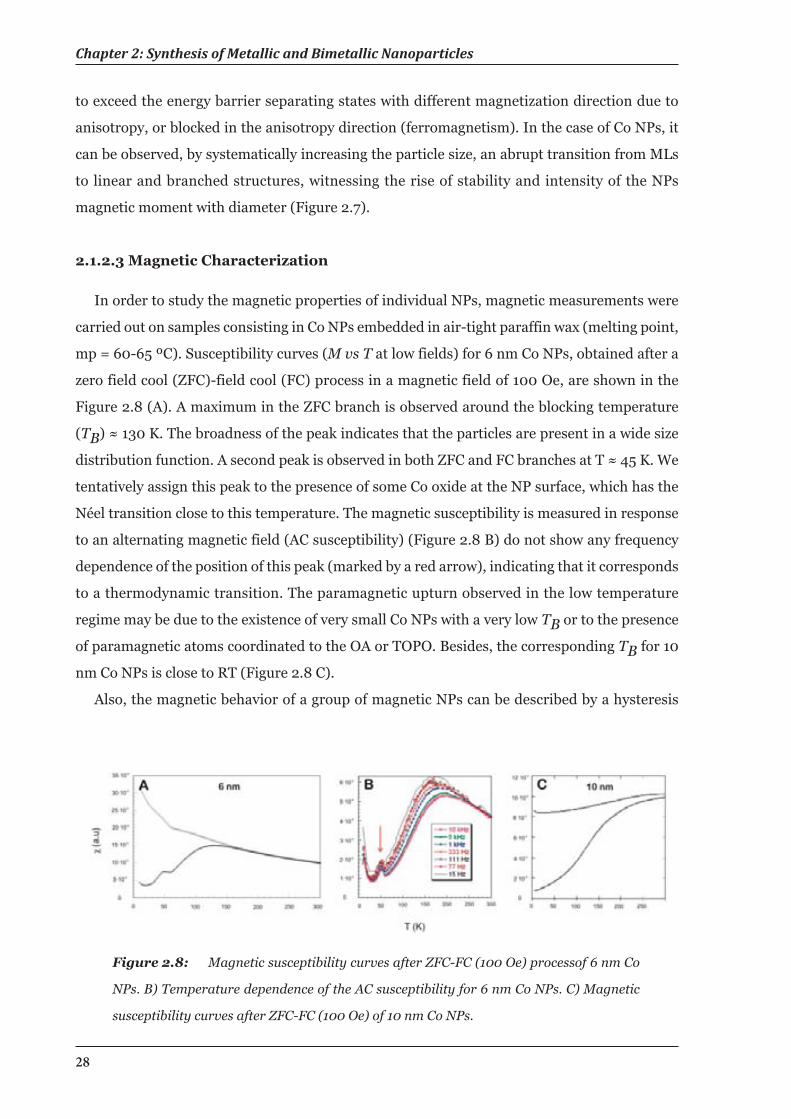
Chapter 2: Synthesis of Metallic and Bimetallic Nanoparticles
28
to exceed the energy barrier separating states with different magnetization direction due to
anisotropy, or blocked in the anisotropy direction (ferromagnetism). In the case of Co NPs, it
can be observed, by systematically increasing the particle size, an abrupt transition from MLs
to linear and branched structures, witnessing the rise of stability and intensity of the NPs
magnetic moment with diameter (Figure 2.7).
2.1.2.3 Magnetic Characterization
In order to study the magnetic properties of individual NPs, magnetic measurements were
carried out on samples consisting in Co NPs embedded in air-tight paraffin wax (melting point,
mp = 60-65 ºC). Susceptibility curves (M vs T at low fields) for 6 nm Co NPs, obtained after a
zero field cool (ZFC)-field cool (FC) process in a magnetic field of 100 Oe, are shown in the
Figure 2.8 (A). A maximum in the ZFC branch is observed around the blocking temperature
(TB) ≈ 130 K. The broadness of the peak indicates that the particles are present in a wide size
distribution function. A second peak is observed in both ZFC and FC branches at T ≈ 45 K. We
tentatively assign this peak to the presence of some Co oxide at the NP surface, which has the
Néel transition close to this temperature. The magnetic susceptibility is measured in response
to an alternating magnetic field (AC susceptibility) (Figure 2.8 B) do not show any frequency
dependence of the position of this peak (marked by a red arrow), indicating that it corresponds
to a thermodynamic transition. The paramagnetic upturn observed in the low temperature
regime may be due to the existence of very small Co NPs with a very low TB or to the presence
of paramagnetic atoms coordinated to the OA or TOPO. Besides, the corresponding TB for 10
nm Co NPs is close to RT (Figure 2.8 C).
Also, the magnetic behavior of a group of magnetic NPs can be described by a hysteresis
Figure 2.8: Magnetic susceptibility curves after ZFC-FC (100 Oe) processof 6 nm Co
NPs. B) Temperature dependence of the AC susceptibility for 6 nm Co NPs. C) Magnetic
susceptibility curves after ZFC-FC (100 Oe) of 10 nm Co NPs.
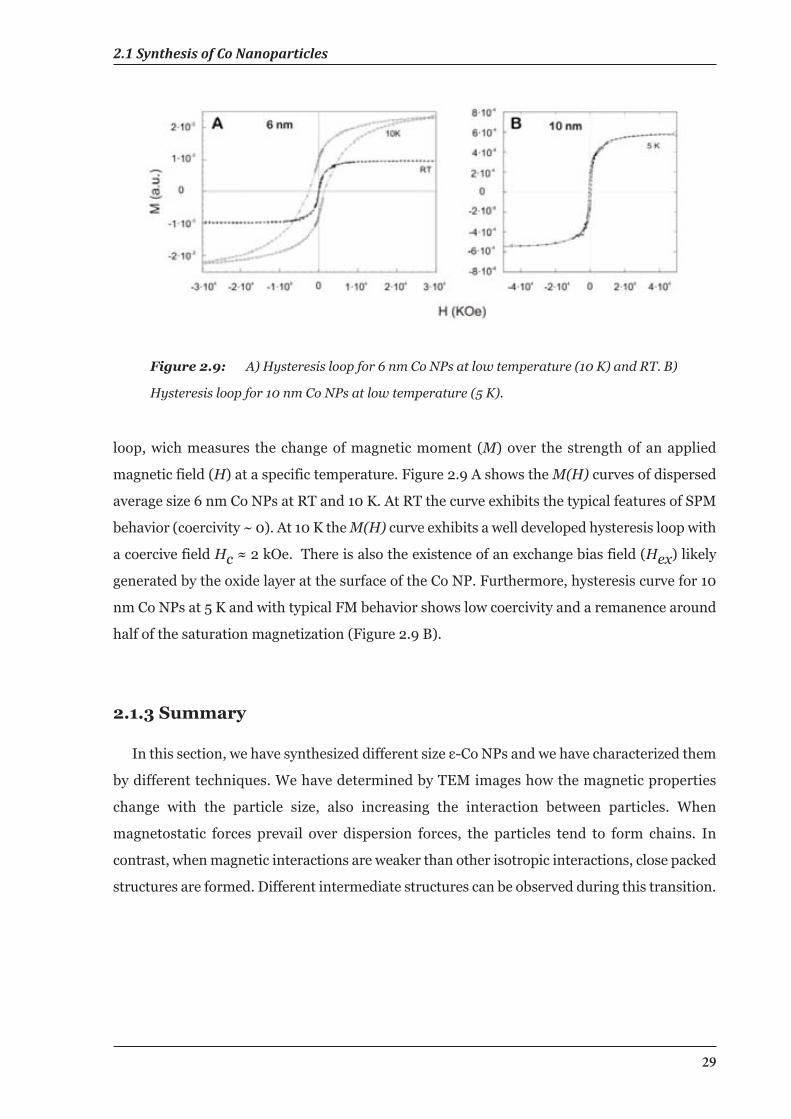
2.1 Synthesis of Co Nanoparticles
29
loop, wich measures the change of magnetic moment (M) over the strength of an applied
magnetic field (H) at a specific temperature. Figure 2.9 A shows the M(H) curves of dispersed
average size 6 nm Co NPs at RT and 10 K. At RT the curve exhibits the typical features of SPM
behavior (coercivity ~ 0). At 10 K the M(H) curve exhibits a well developed hysteresis loop with
a coercive field Hc ≈ 2 kOe. There is also the existence of an exchange bias field (Hex) likely
generated by the oxide layer at the surface of the Co NP. Furthermore, hysteresis curve for 10
nm Co NPs at 5 K and with typical FM behavior shows low coercivity and a remanence around
half of the saturation magnetization (Figure 2.9 B).
2.1.3 Summary
In this section, we have synthesized different size ε-Co NPs and we have characterized them
by different techniques. We have determined by TEM images how the magnetic properties
change with the particle size, also increasing the interaction between particles. When
magnetostatic forces prevail over dispersion forces, the particles tend to form chains. In
contrast, when magnetic interactions are weaker than other isotropic interactions, close packed
structures are formed. Different intermediate structures can be observed during this transition.
Figure 2.9: A) Hysteresis loop for 6 nm Co NPs at low temperature (10 K) and RT. B)
Hysteresis loop for 10 nm Co NPs at low temperature (5 K).
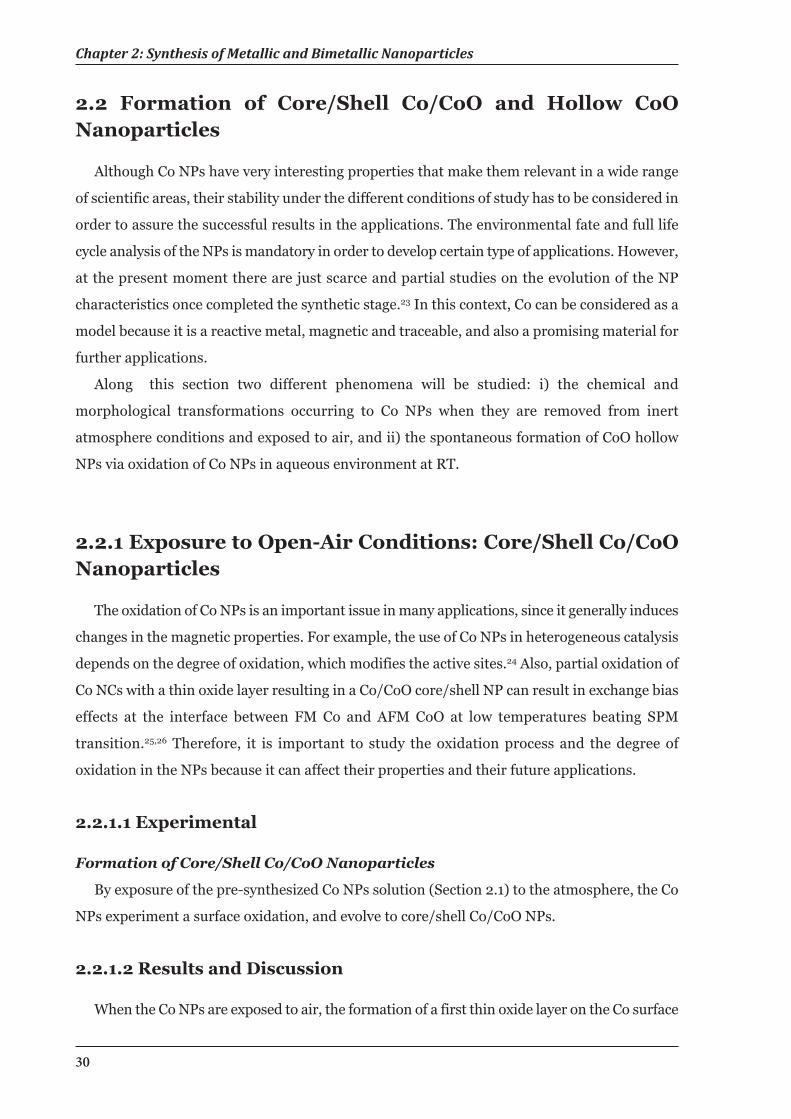
Chapter 2: Synthesis of Metallic and Bimetallic Nanoparticles
30
2.2 Formation of Core/Shell Co/CoO and Hollow CoONanoparticles
Although Co NPs have very interesting properties that make them relevant in a wide range
of scientific areas, their stability under the different conditions of study has to be considered in
order to assure the successful results in the applications. The environmental fate and full life
cycle analysis of the NPs is mandatory in order to develop certain type of applications. However,
at the present moment there are just scarce and partial studies on the evolution of the NP
characteristics once completed the synthetic stage.23 In this context, Co can be considered as a
model because it is a reactive metal, magnetic and traceable, and also a promising material for
further applications.
Along this section two different phenomena will be studied: i) the chemical and
morphological transformations occurring to Co NPs when they are removed from inert
atmosphere conditions and exposed to air, and ii) the spontaneous formation of CoO hollow
NPs via oxidation of Co NPs in aqueous environment at RT.
2.2.1 Exposure to Open-Air Conditions: Core/Shell Co/CoONanoparticles
The oxidation of Co NPs is an important issue in many applications, since it generally induces
changes in the magnetic properties. For example, the use of Co NPs in heterogeneous catalysis
depends on the degree of oxidation, which modifies the active sites.24 Also, partial oxidation of
Co NCs with a thin oxide layer resulting in a Co/CoO core/shell NP can result in exchange bias
effects at the interface between FM Co and AFM CoO at low temperatures beating SPM
transition.25,26 Therefore, it is important to study the oxidation process and the degree of
oxidation in the NPs because it can affect their properties and their future applications.
2.2.1.1 Experimental
Formation of Core/Shell Co/CoO Nanoparticles
By exposure of the pre-synthesized Co NPs solution (Section 2.1) to the atmosphere, the Co
NPs experiment a surface oxidation, and evolve to core/shell Co/CoO NPs.
2.2.1.2 Results and Discussion
When the Co NPs are exposed to air, the formation of a first thin oxide layer on the Co surface
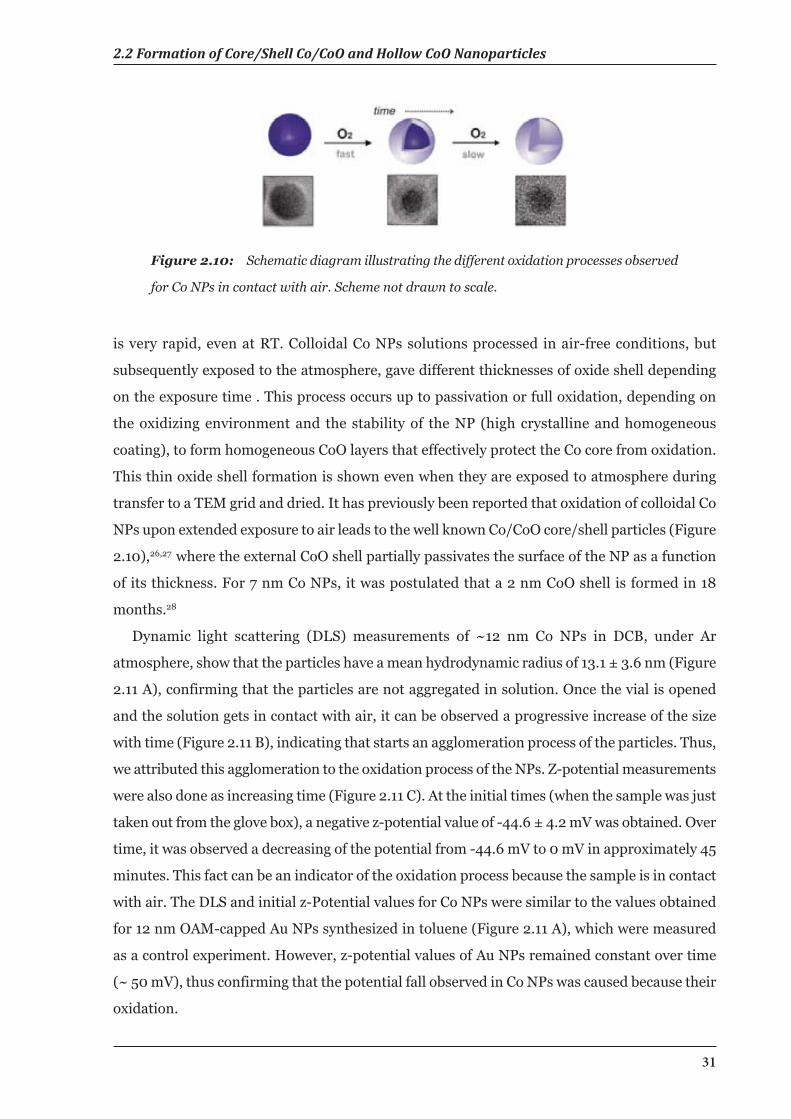
2.2 Formation of Core/Shell Co/CoO and Hollow CoO Nanoparticles
31
is very rapid, even at RT. Colloidal Co NPs solutions processed in air-free conditions, but
subsequently exposed to the atmosphere, gave different thicknesses of oxide shell depending
on the exposure time . This process occurs up to passivation or full oxidation, depending on
the oxidizing environment and the stability of the NP (high crystalline and homogeneous
coating), to form homogeneous CoO layers that effectively protect the Co core from oxidation.
This thin oxide shell formation is shown even when they are exposed to atmosphere during
transfer to a TEM grid and dried. It has previously been reported that oxidation of colloidal Co
NPs upon extended exposure to air leads to the well known Co/CoO core/shell particles (Figure
2.10),26,27 where the external CoO shell partially passivates the surface of the NP as a function
of its thickness. For 7 nm Co NPs, it was postulated that a 2 nm CoO shell is formed in 18
months.28
Dynamic light scattering (DLS) measurements of ~12 nm Co NPs in DCB, under Ar
atmosphere, show that the particles have a mean hydrodynamic radius of 13.1 ± 3.6 nm (Figure
2.11 A), confirming that the particles are not aggregated in solution. Once the vial is opened
and the solution gets in contact with air, it can be observed a progressive increase of the size
with time (Figure 2.11 B), indicating that starts an agglomeration process of the particles. Thus,
we attributed this agglomeration to the oxidation process of the NPs. Z-potential measurements
were also done as increasing time (Figure 2.11 C). At the initial times (when the sample was just
taken out from the glove box), a negative z-potential value of -44.6 ± 4.2 mV was obtained. Over
time, it was observed a decreasing of the potential from -44.6 mV to 0 mV in approximately 45
minutes. This fact can be an indicator of the oxidation process because the sample is in contact
with air. The DLS and initial z-Potential values for Co NPs were similar to the values obtained
for 12 nm OAM-capped Au NPs synthesized in toluene (Figure 2.11 A), which were measured
as a control experiment. However, z-potential values of Au NPs remained constant over time
(~ 50 mV), thus confirming that the potential fall observed in Co NPs was caused because their
oxidation.
Figure 2.10: Schematic diagram illustrating the different oxidation processes observed
for Co NPs in contact with air. Scheme not drawn to scale.
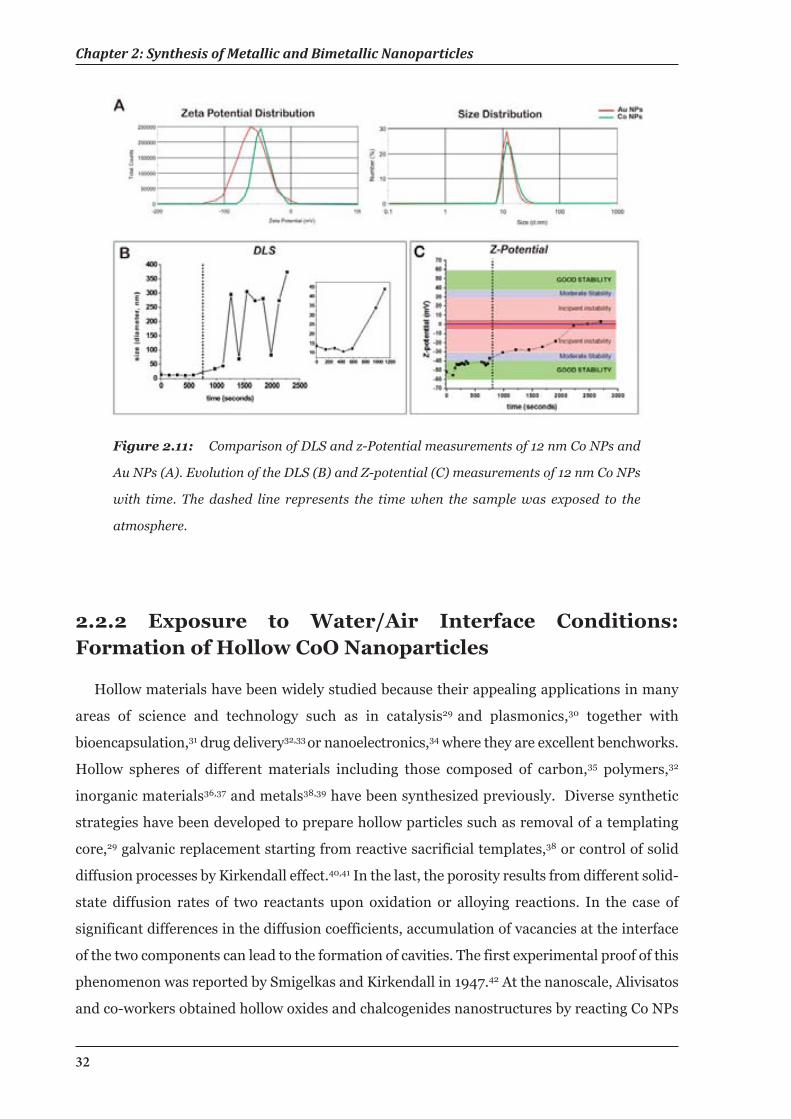
Chapter 2: Synthesis of Metallic and Bimetallic Nanoparticles
32
2.2.2 Exposure to Water/Air Interface Conditions:Formation of Hollow CoO Nanoparticles
Hollow materials have been widely studied because their appealing applications in many
areas of science and technology such as in catalysis29 and plasmonics,30 together with
bioencapsulation,31 drug delivery32,33 or nanoelectronics,34 where they are excellent benchworks.
Hollow spheres of different materials including those composed of carbon,35 polymers,32
inorganic materials36,37 and metals38,39 have been synthesized previously. Diverse synthetic
strategies have been developed to prepare hollow particles such as removal of a templating
core,29 galvanic replacement starting from reactive sacrificial templates,38 or control of solid
diffusion processes by Kirkendall effect.40,41 In the last, the porosity results from different solid-
state diffusion rates of two reactants upon oxidation or alloying reactions. In the case of
significant differences in the diffusion coefficients, accumulation of vacancies at the interface
of the two components can lead to the formation of cavities. The first experimental proof of this
phenomenon was reported by Smigelkas and Kirkendall in 1947.42 At the nanoscale, Alivisatos
and co-workers obtained hollow oxides and chalcogenides nanostructures by reacting Co NPs
Figure 2.11: Comparison of DLS and z-Potential measurements of 12 nm Co NPs and
Au NPs (A). Evolution of the DLS (B) and Z-potential (C) measurements of 12 nm Co NPs
with time. The dashed line represents the time when the sample was exposed to the
atmosphere.
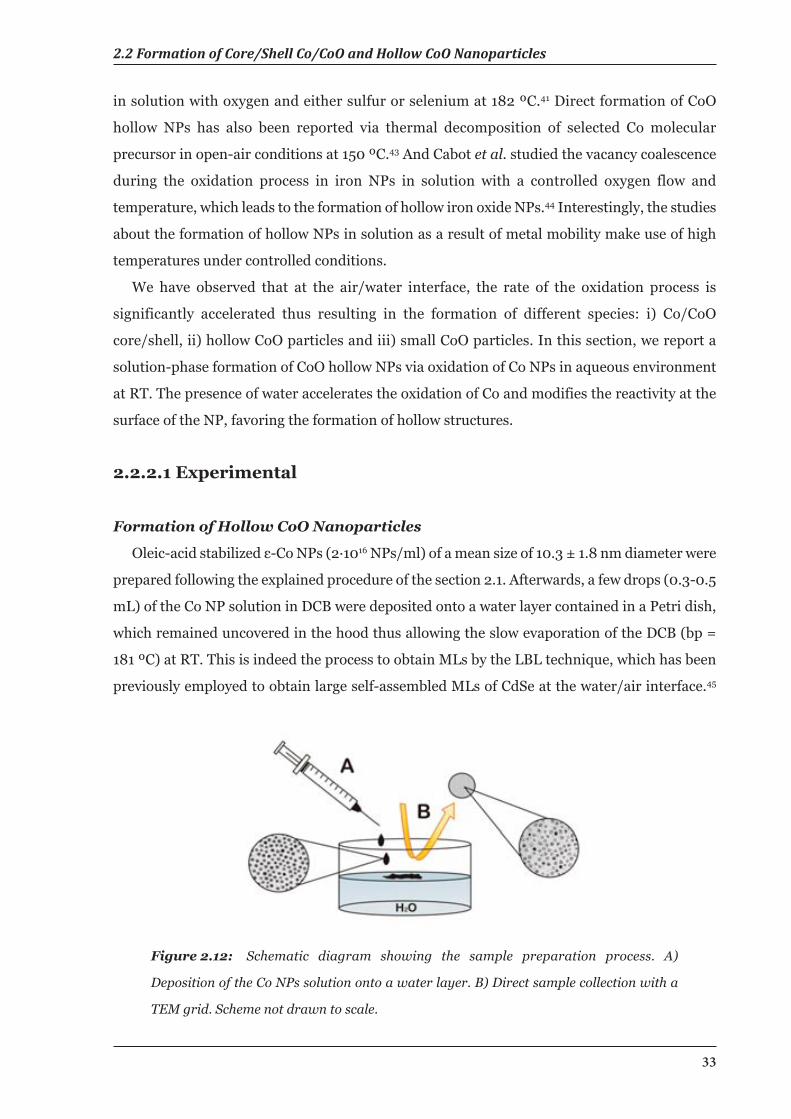
2.2 Formation of Core/Shell Co/CoO and Hollow CoO Nanoparticles
33
in solution with oxygen and either sulfur or selenium at 182 ºC.41 Direct formation of CoO
hollow NPs has also been reported via thermal decomposition of selected Co molecular
precursor in open-air conditions at 150 ºC.43 And Cabot et al. studied the vacancy coalescence
during the oxidation process in iron NPs in solution with a controlled oxygen flow and
temperature, which leads to the formation of hollow iron oxide NPs.44 Interestingly, the studies
about the formation of hollow NPs in solution as a result of metal mobility make use of high
temperatures under controlled conditions.
We have observed that at the air/water interface, the rate of the oxidation process is
significantly accelerated thus resulting in the formation of different species: i) Co/CoO
core/shell, ii) hollow CoO particles and iii) small CoO particles. In this section, we report a
solution-phase formation of CoO hollow NPs via oxidation of Co NPs in aqueous environment
at RT. The presence of water accelerates the oxidation of Co and modifies the reactivity at the
surface of the NP, favoring the formation of hollow structures.
2.2.2.1 Experimental
Formation of Hollow CoO Nanoparticles
Oleic-acid stabilized ε-Co NPs (2·1016 NPs/ml) of a mean size of 10.3 ± 1.8 nm diameter were
prepared following the explained procedure of the section 2.1. Afterwards, a few drops (0.3-0.5
mL) of the Co NP solution in DCB were deposited onto a water layer contained in a Petri dish,
which remained uncovered in the hood thus allowing the slow evaporation of the DCB (bp =
181 ºC) at RT. This is indeed the process to obtain MLs by the LBL technique, which has been
previously employed to obtain large self-assembled MLs of CdSe at the water/air interface.45
Figure 2.12: Schematic diagram showing the sample preparation process. A)
Deposition of the Co NPs solution onto a water layer. B) Direct sample collection with a
TEM grid. Scheme not drawn to scale.
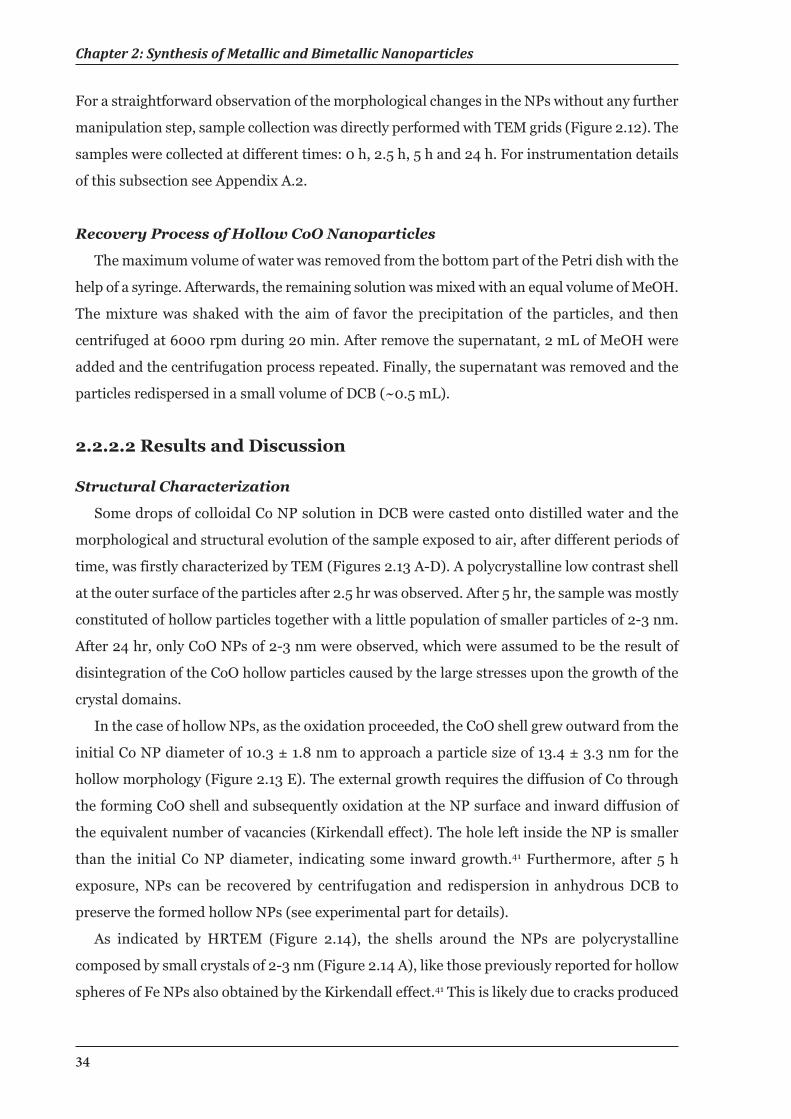
Chapter 2: Synthesis of Metallic and Bimetallic Nanoparticles
34
For a straightforward observation of the morphological changes in the NPs without any further
manipulation step, sample collection was directly performed with TEM grids (Figure 2.12). The
samples were collected at different times: 0 h, 2.5 h, 5 h and 24 h. For instrumentation details
of this subsection see Appendix A.2.
Recovery Process of Hollow CoO Nanoparticles
The maximum volume of water was removed from the bottom part of the Petri dish with the
help of a syringe. Afterwards, the remaining solution was mixed with an equal volume of MeOH.
The mixture was shaked with the aim of favor the precipitation of the particles, and then
centrifuged at 6000 rpm during 20 min. After remove the supernatant, 2 mL of MeOH were
added and the centrifugation process repeated. Finally, the supernatant was removed and the
particles redispersed in a small volume of DCB (~0.5 mL).
2.2.2.2 Results and Discussion
Structural Characterization
Some drops of colloidal Co NP solution in DCB were casted onto distilled water and the
morphological and structural evolution of the sample exposed to air, after different periods of
time, was firstly characterized by TEM (Figures 2.13 A-D). A polycrystalline low contrast shell
at the outer surface of the particles after 2.5 hr was observed. After 5 hr, the sample was mostly
constituted of hollow particles together with a little population of smaller particles of 2-3 nm.
After 24 hr, only CoO NPs of 2-3 nm were observed, which were assumed to be the result of
disintegration of the CoO hollow particles caused by the large stresses upon the growth of the
crystal domains.
In the case of hollow NPs, as the oxidation proceeded, the CoO shell grew outward from the
initial Co NP diameter of 10.3 ± 1.8 nm to approach a particle size of 13.4 ± 3.3 nm for the
hollow morphology (Figure 2.13 E). The external growth requires the diffusion of Co through
the forming CoO shell and subsequently oxidation at the NP surface and inward diffusion of
the equivalent number of vacancies (Kirkendall effect). The hole left inside the NP is smaller
than the initial Co NP diameter, indicating some inward growth.41 Furthermore, after 5 h
exposure, NPs can be recovered by centrifugation and redispersion in anhydrous DCB to
preserve the formed hollow NPs (see experimental part for details).
As indicated by HRTEM (Figure 2.14), the shells around the NPs are polycrystalline
composed by small crystals of 2-3 nm (Figure 2.14 A), like those previously reported for hollow
spheres of Fe NPs also obtained by the Kirkendall effect.41 This is likely due to cracks produced
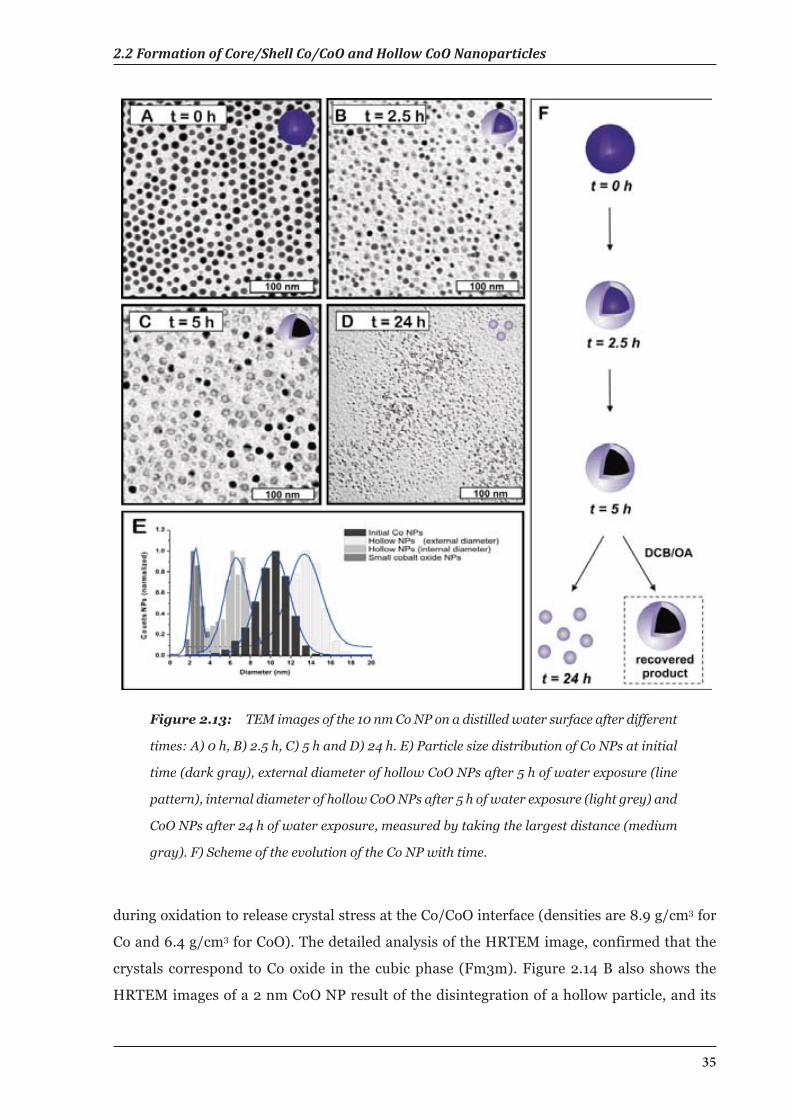
2.2 Formation of Core/Shell Co/CoO and Hollow CoO Nanoparticles
35
Figure 2.13: TEM images of the 10 nm Co NP on a distilled water surface after different
times: A) 0 h, B) 2.5 h, C) 5 h and D) 24 h. E) Particle size distribution of Co NPs at initial
time (dark gray), external diameter of hollow CoO NPs after 5 h of water exposure (line
pattern), internal diameter of hollow CoO NPs after 5 h of water exposure (light grey) and
CoO NPs after 24 h of water exposure, measured by taking the largest distance (medium
gray). F) Scheme of the evolution of the Co NP with time.
during oxidation to release crystal stress at the Co/CoO interface (densities are 8.9 g/cm3 for
Co and 6.4 g/cm3 for CoO). The detailed analysis of the HRTEM image, confirmed that the
crystals correspond to Co oxide in the cubic phase (Fm3m). Figure 2.14 B also shows the
HRTEM images of a 2 nm CoO NP result of the disintegration of a hollow particle, and its
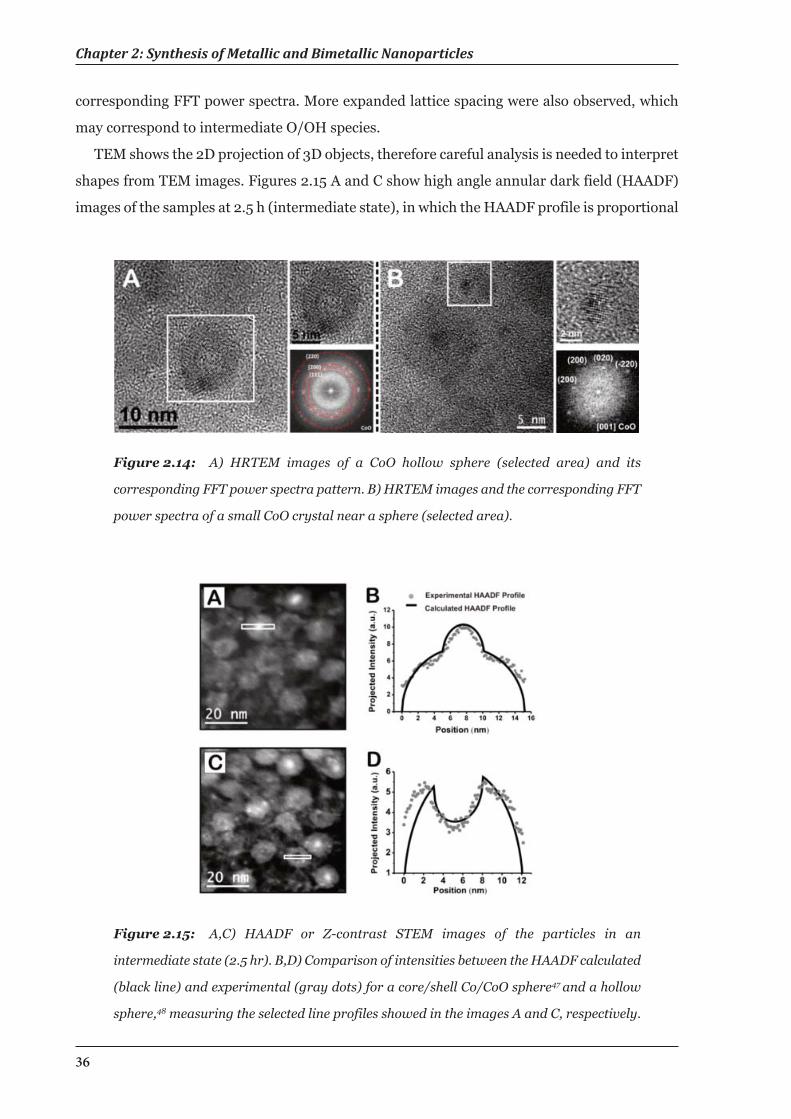
Chapter 2: Synthesis of Metallic and Bimetallic Nanoparticles
36
corresponding FFT power spectra. More expanded lattice spacing were also observed, which
may correspond to intermediate O/OH species.
TEM shows the 2D projection of 3D objects, therefore careful analysis is needed to interpret
shapes from TEM images. Figures 2.15 A and C show high angle annular dark field (HAADF)
images of the samples at 2.5 h (intermediate state), in which the HAADF profile is proportional
Figure 2.14: A) HRTEM images of a CoO hollow sphere (selected area) and its
corresponding FFT power spectra pattern. B) HRTEM images and the corresponding FFT
power spectra of a small CoO crystal near a sphere (selected area).
Figure 2.15: A,C) HAADF or Z-contrast STEM images of the particles in an
intermediate state (2.5 hr). B,D) Comparison of intensities between the HAADF calculated
(black line) and experimental (gray dots) for a core/shell Co/CoO sphere47 and a hollow
sphere,48 measuring the selected line profiles showed in the images A and C, respectively.
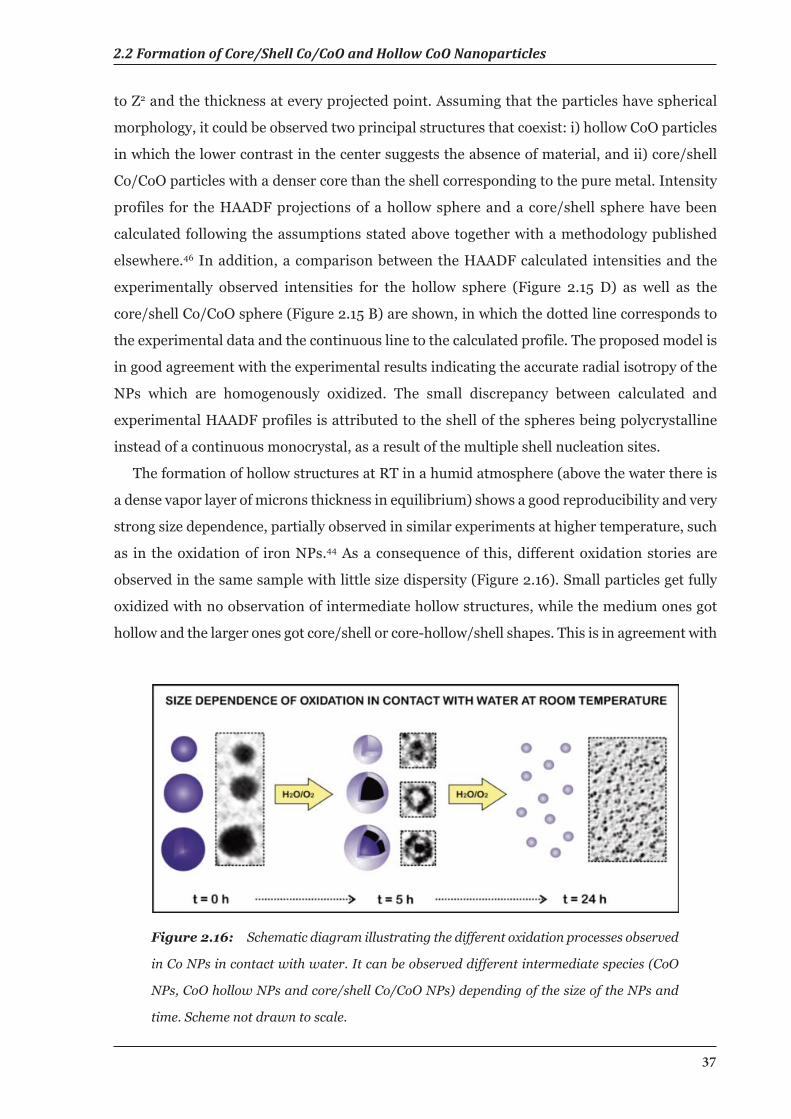
2.2 Formation of Core/Shell Co/CoO and Hollow CoO Nanoparticles
37
to Z2 and the thickness at every projected point. Assuming that the particles have spherical
morphology, it could be observed two principal structures that coexist: i) hollow CoO particles
in which the lower contrast in the center suggests the absence of material, and ii) core/shell
Co/CoO particles with a denser core than the shell corresponding to the pure metal. Intensity
profiles for the HAADF projections of a hollow sphere and a core/shell sphere have been
calculated following the assumptions stated above together with a methodology published
elsewhere.46 In addition, a comparison between the HAADF calculated intensities and the
experimentally observed intensities for the hollow sphere (Figure 2.15 D) as well as the
core/shell Co/CoO sphere (Figure 2.15 B) are shown, in which the dotted line corresponds to
the experimental data and the continuous line to the calculated profile. The proposed model is
in good agreement with the experimental results indicating the accurate radial isotropy of the
NPs which are homogenously oxidized. The small discrepancy between calculated and
experimental HAADF profiles is attributed to the shell of the spheres being polycrystalline
instead of a continuous monocrystal, as a result of the multiple shell nucleation sites.
The formation of hollow structures at RT in a humid atmosphere (above the water there is
a dense vapor layer of microns thickness in equilibrium) shows a good reproducibility and very
strong size dependence, partially observed in similar experiments at higher temperature, such
as in the oxidation of iron NPs.44 As a consequence of this, different oxidation stories are
observed in the same sample with little size dispersity (Figure 2.16). Small particles get fully
oxidized with no observation of intermediate hollow structures, while the medium ones got
hollow and the larger ones got core/shell or core-hollow/shell shapes. This is in agreement with
Figure 2.16: Schematic diagram illustrating the different oxidation processes observed
in Co NPs in contact with water. It can be observed different intermediate species (CoO
NPs, CoO hollow NPs and core/shell Co/CoO NPs) depending of the size of the NPs and
time. Scheme not drawn to scale.
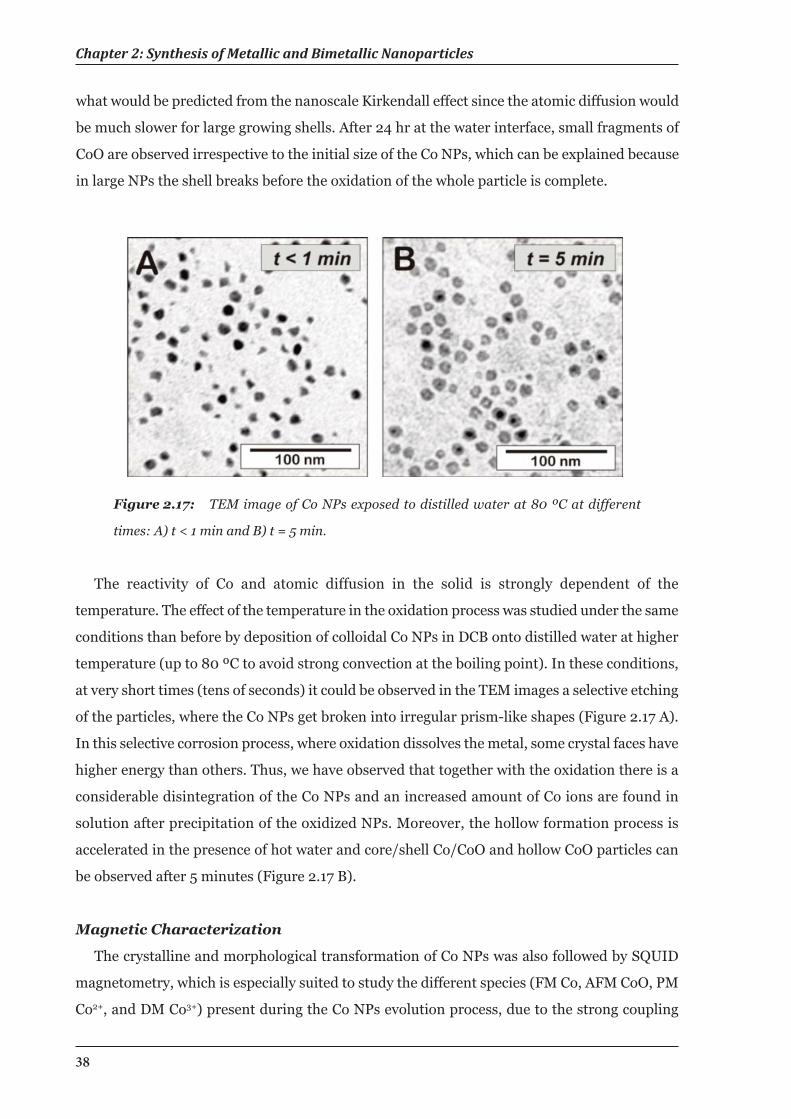
Chapter 2: Synthesis of Metallic and Bimetallic Nanoparticles
38
The reactivity of Co and atomic diffusion in the solid is strongly dependent of the
temperature. The effect of the temperature in the oxidation process was studied under the same
conditions than before by deposition of colloidal Co NPs in DCB onto distilled water at higher
temperature (up to 80 ºC to avoid strong convection at the boiling point). In these conditions,
at very short times (tens of seconds) it could be observed in the TEM images a selective etching
of the particles, where the Co NPs get broken into irregular prism-like shapes (Figure 2.17 A).
In this selective corrosion process, where oxidation dissolves the metal, some crystal faces have
higher energy than others. Thus, we have observed that together with the oxidation there is a
considerable disintegration of the Co NPs and an increased amount of Co ions are found in
solution after precipitation of the oxidized NPs. Moreover, the hollow formation process is
accelerated in the presence of hot water and core/shell Co/CoO and hollow CoO particles can
be observed after 5 minutes (Figure 2.17 B).
Magnetic Characterization
The crystalline and morphological transformation of Co NPs was also followed by SQUID
magnetometry, which is especially suited to study the different species (FM Co, AFM CoO, PM
Co2+, and DM Co3+) present during the Co NPs evolution process, due to the strong coupling
what would be predicted from the nanoscale Kirkendall effect since the atomic diffusion would
be much slower for large growing shells. After 24 hr at the water interface, small fragments of
CoO are observed irrespective to the initial size of the Co NPs, which can be explained because
in large NPs the shell breaks before the oxidation of the whole particle is complete.
Figure 2.17: TEM image of Co NPs exposed to distilled water at 80 ºC at different
times: A) t < 1 min and B) t = 5 min.
2.2 Formation of Core/Shell Co/CoO and Hollow CoO Nanoparticles
39
between fine atomic structure and magnetic response. In Figure 2.18 we show DC magnetic
susceptibility curves (under constant field), χ(T), of different samples after a ZFC and FC
processes. The colloidal Co NPs were mixed homogenously with air-tight paraffin wax (mp =
60-65 ºC) to avoid inter-particle interactions. For the initial Co NPs sample prior to oxidation
(Figure 2.18 A), the corresponding TB is close to RT as expected for Co NPs of about 10 nm in
diameter.14 After oxidation for 5 h in distilled water the χ(T) curve develops three peaks (Figure
2.18 B), together with a non-zero and almost constant magnetization measured between 100 K
and 300 K, which indicates the presence of FM or interacting NPs. The higher temperature
broad maximum around 150 K should correspond to residual Co NPs with a reduced diameter,
and with some degree of oxidation at the surface.26 From magnetic measurements at 70 K (well
below the TB of these residual Co NPs) this amount of metallic Co NPs can be estimated to be
only around 1%. The peak at intermediate temperature (53 K) has been identified as
corresponding to the CoO hollow particles,49 while the low temperature peak at 8 K has been
assigned to the tiny CoO particles formed when the hollow particles are broken down to pieces
due to over-oxidation. In order to confirm the origin of the low temperature peak at 8 K, we
have performed magnetic measurements of samples kept for 48 hr in distilled water, which
resulted into complete oxidation and disintegration of the original Co NPs as shown by TEM.
In this case, ZFC-FC susceptivility curves exhibit only a peak at about the expected temperature,
namely 6-7 K (Figure 2.18 C). In addition, AC susceptibility measurements (under AC field)
have also been performed to study the dynamic behavior of the magnetic system. AC
susceptibility curves as a function of the AC frequency in a temperature range close to the
observed TB of the hollow particles are shown in the inset of Figure 2.18 B. The observed
frequency dependence is indicative of a blocking process. However, attempts to fit the
experimental data using the Arrhenius law end up always in values of the microscopic relaxation
time τo~10-40 (it is expected to be around 10-11 for SPM NPs47). These results are indicative of
the existence of strong interaction between NPs or between different grains at the same NP.
Besides, a quite accurate fit of the experimental data taking reasonable values of τo (~10-9-10-
10) can be obtained by using the Vogel-Fulcher law
Equation 2.1
with a T0 value of about 40 K. This gives a TB’ slightly below 10 K, which is very close to that
obtained for residual disintegrated CoO NPs. Thus, the scenario is that hollow particles are
polycrystalline and consist of tiny AFM CoO grains. Besides, in Figures 2.18 D-F we depict the
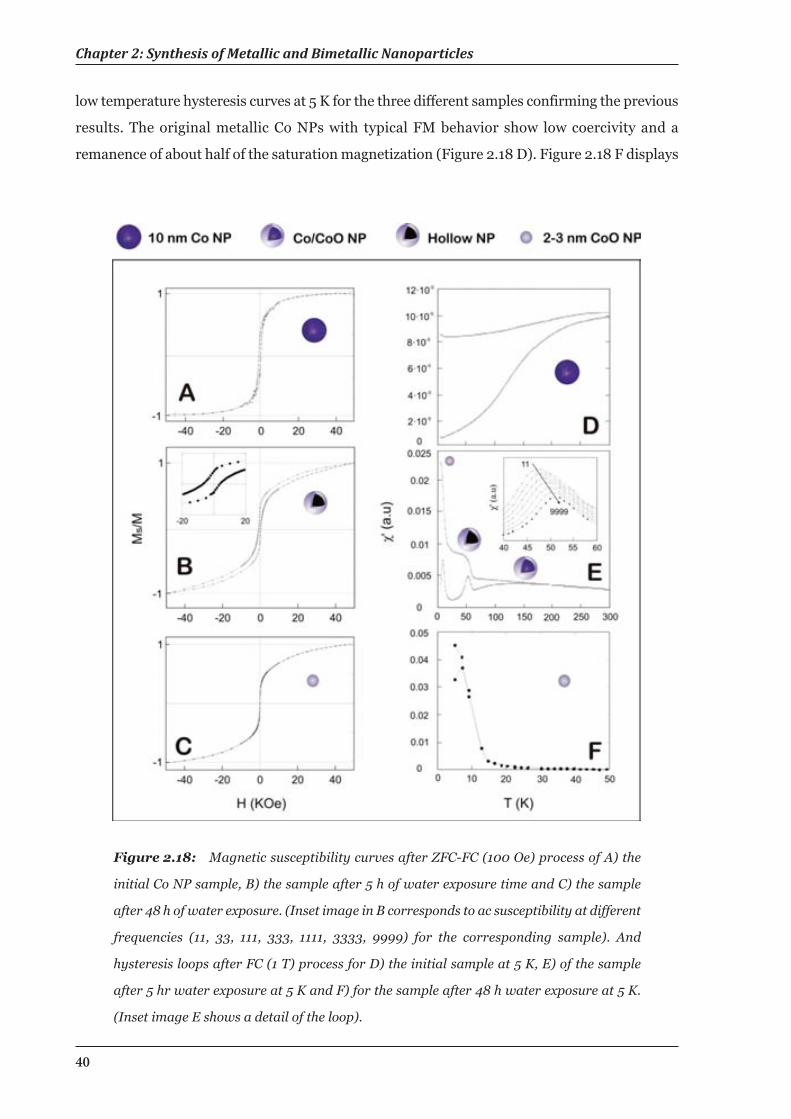
Chapter 2: Synthesis of Metallic and Bimetallic Nanoparticles
40
low temperature hysteresis curves at 5 K for the three different samples confirming the previous
results. The original metallic Co NPs with typical FM behavior show low coercivity and a
remanence of about half of the saturation magnetization (Figure 2.18 D). Figure 2.18 F displays
Figure 2.18: Magnetic susceptibility curves after ZFC-FC (100 Oe) process of A) the
initial Co NP sample, B) the sample after 5 h of water exposure time and C) the sample
after 48 h of water exposure. (Inset image in B corresponds to ac susceptibility at different
frequencies (11, 33, 111, 333, 1111, 3333, 9999) for the corresponding sample). And
hysteresis loops after FC (1 T) process for D) the initial sample at 5 K, E) of the sample
after 5 hr water exposure at 5 K and F) for the sample after 48 h water exposure at 5 K.
(Inset image E shows a detail of the loop).
2.2 Formation of Core/Shell Co/CoO and Hollow CoO Nanoparticles
41
the magnetization curve of the small CoO particles with a TB (9 K) very close to the
measurement temperature (10 K), showing low coercivity and remanence. On the other hand,
in Figure 2.18 E, which corresponds in more than 70% to hollow NPs, the magnetization curve
exhibits peculiar properties derived from its particular microstructure, which favors the
appearance of strong magnetic frustration.50 Thus, while the magnetization of the
polycrystalline hollow particles mainly corresponds to the uncompensated spins at the surface
and interfaces of these small AFM grains, the high TB is due to the intense exchange interaction
between neighboring grains in the same hollow NP. Consequently, while hysteresis loops are
dominated by the individual grains, susceptibility measurements are dominated by their dipolar
interactions. A similar behavior was also observed and described by Cabot et al.51
Formation Mechanism: Kirkendall Effect
Hollow polycrystalline NPs generally result when the outward diffusion of the core element
A (Co) through the growing AB (CoO) composite is faster than the inward diffusion of the
external element B (O2). This situation has previously been determined, and simulated for the
model case of 200 nm CdSe NPs, by the number of reactions at the A/AB and AB/solution
interfaces; which subsequently depend on: the diffusion time of both elements through the
shell, the A-B reaction probability at each interface, and the collision frequency of B with the
particle (determined by the concentration and the diffusivity of B in solution). For equal reaction
probabilities at each interface, the shell growth is controlled by the diffusivity of the metal
through the shell, and this condition can be expressed as a ratio of self-diffusivities.52 As the
self-diffusivity of Co2+ is estimated to be faster through the CoO shell (ρCoO = 6.4 g/cm3) than
in the denser Co core (ρCo = 8.9 g/cm3), this leads to kinetically controlled Co/CoO
nanostructures, with spherical cores in the case of larger particles supported by bridges and
with very high metal/void interface areas.41,44 As can be observed in the Figure 2.16 (case of the
bigger particles), by means of these bridges the mass transfer is facilitated, which leads to a
shrinking of the metal core suspended in a CoO shell. At some point the bridges may get
oxidized and mass transport slows down until dot-in-a-shell structures are observed.
Initially, one could expect that with the diffusion coefficients of Co in oxygen and oxygen in
Co, to grow a second shell of CoO by Kirkendall effect at RT would take months. However, here
we observe how it happens in a matter of hours. In fact, the diffusion coefficients at the
nanoscale are altered by several orders of magnitude, and previous works have confirmed that
diffusion processes are enhanced in NPs.53,54 In addition to the larger interfaces, number of
defects at the surface and stress folds, the reaction time at the surface can be limited by the
supply of the oxidizing agent in solution modulated by the presence of DCB.52 Finally, at low
Chapter 2: Synthesis of Metallic and Bimetallic Nanoparticles
42
enough oxygen concentration, the low collision frequencies but large reaction probability would
limit the global reaction rate, allowing Co2+ ions to diffuse and load the outer shell surface while
preventing the oxygen to diffuse inside leading to hollow NP formation at RT in short times.
2.2.3 Summary
In this section, it has been studied both the stability and reactivity of the Co NPs in different
environments, in air and water-air interface. We show that the formation of hollow structures
can be performed at RT and ambient conditions and not only under high temperatures and
specific controlled conditions as previously reported. It has also been demonstrated that water
has a critical role in the oxidation of Co NPs, which can be used to control and/or accelerate
the formation of hollow particles. The reactivity of the external surface increases initially while
O2 penetration is slow, and then the Co mobility dominates the oxidation process.
2.3 Synthesis of Pt and PtCo Nanoparticles
The main problem with the Co NPs is their fast oxidation and consequently the change of
the magnetic properties. Also Co is rather toxic, which makes them not biocompatible for
medical applications even that present better magnetic properties than other magnetic
materials like iron oxide. To solve this problem can be done two possibilities: cover the particles
with a protective layer, which will avoid oxidation process and also will make them
biocompatible; or form an alloy including a noble metal in the composition, which will reduce
the tendency towards oxidation. With this idea we started to deal with bimetallic synthesis of
different metals.
2.3.1 Synthesis of Pt and PtCo Nanoparticles Assisted byMetal Traces
The Pt system is of great interest because Pt NCs present unique optical and catalytic
properties, which make them to be the focus of an extensive research in the recent years. The
catalytic and electrocatalytic properties stongly depends on surface-to-volume ratio, shape and
number of active catalytic sites.55 The corner and edges of the particle are the most reactive sites
due to the low coordination number they exhibit. Thus, different Pt NCs morphologies have
been explored, finding that cubic Pt NCs seems to offer a greater potential as a catalyst.56-58
2.3 Synthesis of Pt and PtCo Nanoparticles
43
The rather extended methodology for a shape-controlled Pt NCs synthesis involves the use
of capping agents that binds to a preferred crystal face of the growing crystal.7 Rampino59 and
El-Sayed60 reported pioneering works reporting the synthesis of polydisperse cubic Pt NCs from
the reduction of a Pt salts in the presence of different capping agents. Later on, Zhu and
Alivisatos reported a similar synthesis using different temperatures and different capping
agents, and also performing a size selection by centrifugation.61 More recently, Xia reported a
more monodisperse and high yield synthesis of cubic Pt NCs (and other morphologies)
employing poly(vinylpyrrolidone) (PVP) as surfactant with ethylene glycol serving as both a
reducing agent and solvent.62,63 Subsequently, a wide variety of synthetic methods has been
reported in order to achieve the desired Pt NC size and shape.64-71
In this section, it will be explored how different small amounts of metal traces (we use the
term “trace” to refer a small quantity of a specie, below 5%) can interfere with the Pt NCs growth
and modify the final shape. Traces such a Co NCs,7 Co2+ ions and Au NCs72 has been used to
compare changes in the morphology and better understand the growth mechanism. The NCs
studied in this chapter are referred to as Pt NCs even when some contain a small amount of Co.
2.3.1.1 Experimental
For instrumentation details of this subsection see Appendix A.3.1
Chemicals. Platinum(II) acetylacetonate (Pt(acac)2, 98%) was purchased from Strem
Chemicals and used as received. Oleylamine (OAM, 70%), 1,2-dichlorobenzene anhydrous
(DCB, 99%), oleic acid (OA, 99%), 1,2-hexadecanediol (HDD, 90%), cobalt(II) acetylacetonate
(Co(acac)2, 97%), cobalt carbonyl moistened with 5-10% hexane (Co2(CO)8, 90-95%), cobalt
(II) chloride (CoCl2, 98%) and super-hydride lithium triethylborohydride (in 1M
tetrahydrofuran, THF) were purchased from Sigma-Aldrich and used as received. All chemicals
were stored and prepared for synthesis in a UNIlab MBraun glove box unless otherwise stated.
The synthesis of Co NCs7 and Au NCs72 follow the previously reported procedures and the NC
purification was performed in the presence of methanol or acetone followed by dispersion in
DCB or toluene, respectively.
General Synthesis. Unless otherwise stated, all syntheses were performed under an Ar
atmosphere using the standard Schlenk-line setup. In a typical synthesis, a solution containing
92 mg of HDD (0.36 mmol), 45 µL of OAM and 10 mL of DCB was added to a 3-neck round-
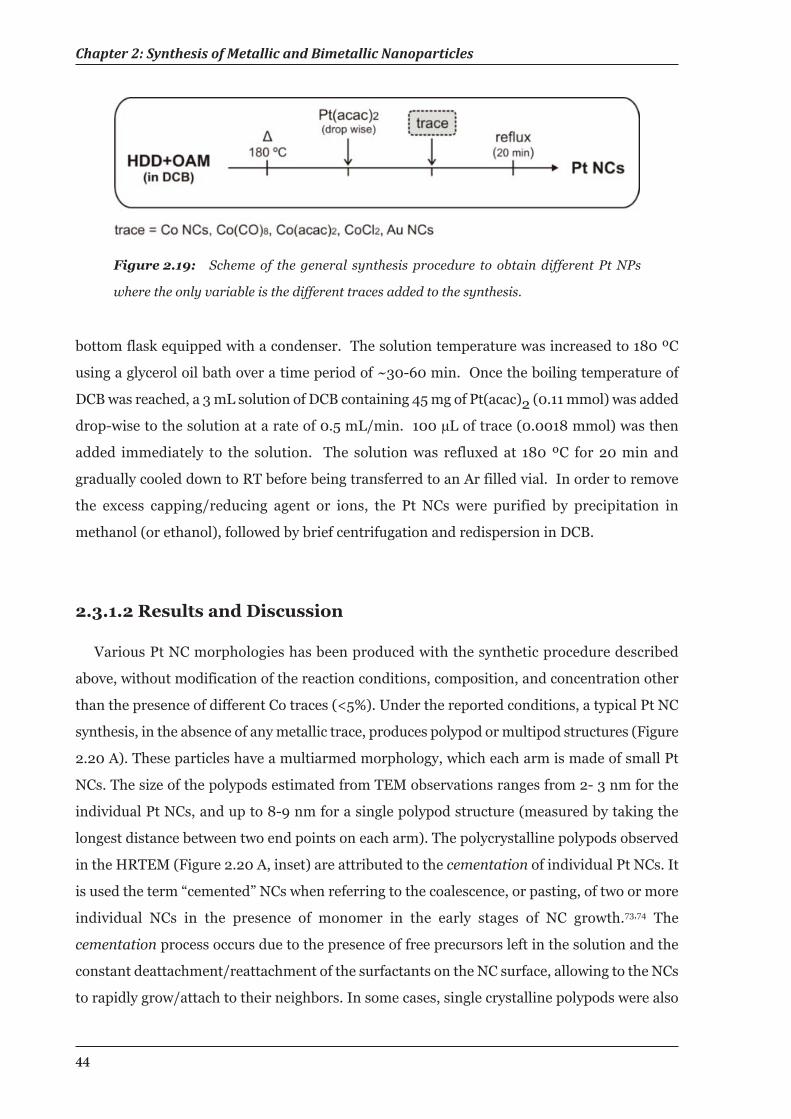
Chapter 2: Synthesis of Metallic and Bimetallic Nanoparticles
44
bottom flask equipped with a condenser. The solution temperature was increased to 180 ºC
using a glycerol oil bath over a time period of ~30-60 min. Once the boiling temperature of
DCB was reached, a 3 mL solution of DCB containing 45 mg of Pt(acac)2 (0.11 mmol) was added
drop-wise to the solution at a rate of 0.5 mL/min. 100 µL of trace (0.0018 mmol) was then
added immediately to the solution. The solution was refluxed at 180 ºC for 20 min and
gradually cooled down to RT before being transferred to an Ar filled vial. In order to remove
the excess capping/reducing agent or ions, the Pt NCs were purified by precipitation in
methanol (or ethanol), followed by brief centrifugation and redispersion in DCB.
2.3.1.2 Results and Discussion
Various Pt NC morphologies has been produced with the synthetic procedure described
above, without modification of the reaction conditions, composition, and concentration other
than the presence of different Co traces (<5%). Under the reported conditions, a typical Pt NC
synthesis, in the absence of any metallic trace, produces polypod or multipod structures (Figure
2.20 A). These particles have a multiarmed morphology, which each arm is made of small Pt
NCs. The size of the polypods estimated from TEM observations ranges from 2- 3 nm for the
individual Pt NCs, and up to 8-9 nm for a single polypod structure (measured by taking the
longest distance between two end points on each arm). The polycrystalline polypods observed
in the HRTEM (Figure 2.20 A, inset) are attributed to the cementation of individual Pt NCs. It
is used the term “cemented” NCs when referring to the coalescence, or pasting, of two or more
individual NCs in the presence of monomer in the early stages of NC growth.73,74 The
cementation process occurs due to the presence of free precursors left in the solution and the
constant deattachment/reattachment of the surfactants on the NC surface, allowing to the NCs
to rapidly grow/attach to their neighbors. In some cases, single crystalline polypods were also
Figure 2.19: Scheme of the general synthesis procedure to obtain different Pt NPs
where the only variable is the different traces added to the synthesis.
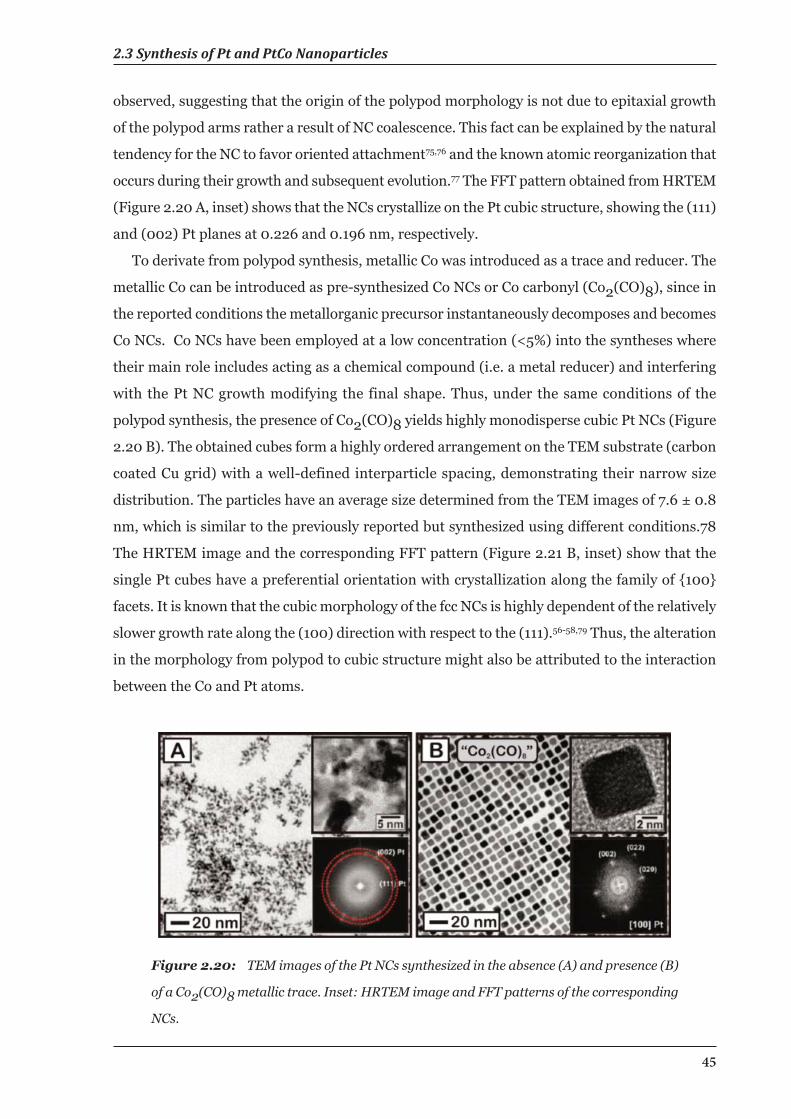
2.3 Synthesis of Pt and PtCo Nanoparticles
45
observed, suggesting that the origin of the polypod morphology is not due to epitaxial growth
of the polypod arms rather a result of NC coalescence. This fact can be explained by the natural
tendency for the NC to favor oriented attachment75,76 and the known atomic reorganization that
occurs during their growth and subsequent evolution.77 The FFT pattern obtained from HRTEM
(Figure 2.20 A, inset) shows that the NCs crystallize on the Pt cubic structure, showing the (111)
and (002) Pt planes at 0.226 and 0.196 nm, respectively.
To derivate from polypod synthesis, metallic Co was introduced as a trace and reducer. The
metallic Co can be introduced as pre-synthesized Co NCs or Co carbonyl (Co2(CO)8), since in
the reported conditions the metallorganic precursor instantaneously decomposes and becomes
Co NCs. Co NCs have been employed at a low concentration (<5%) into the syntheses where
their main role includes acting as a chemical compound (i.e. a metal reducer) and interfering
with the Pt NC growth modifying the final shape. Thus, under the same conditions of the
polypod synthesis, the presence of Co2(CO)8 yields highly monodisperse cubic Pt NCs (Figure
2.20 B). The obtained cubes form a highly ordered arrangement on the TEM substrate (carbon
coated Cu grid) with a well-defined interparticle spacing, demonstrating their narrow size
distribution. The particles have an average size determined from the TEM images of 7.6 ± 0.8
nm, which is similar to the previously reported but synthesized using different conditions.78
The HRTEM image and the corresponding FFT pattern (Figure 2.21 B, inset) show that the
single Pt cubes have a preferential orientation with crystallization along the family of {100}
facets. It is known that the cubic morphology of the fcc NCs is highly dependent of the relatively
slower growth rate along the (100) direction with respect to the (111).56-58,79 Thus, the alteration
in the morphology from polypod to cubic structure might also be attributed to the interaction
between the Co and Pt atoms.
Figure 2.20: TEM images of the Pt NCs synthesized in the absence (A) and presence (B)
of a Co2(CO)8 metallic trace. Inset: HRTEM image and FFT patterns of the corresponding
NCs.
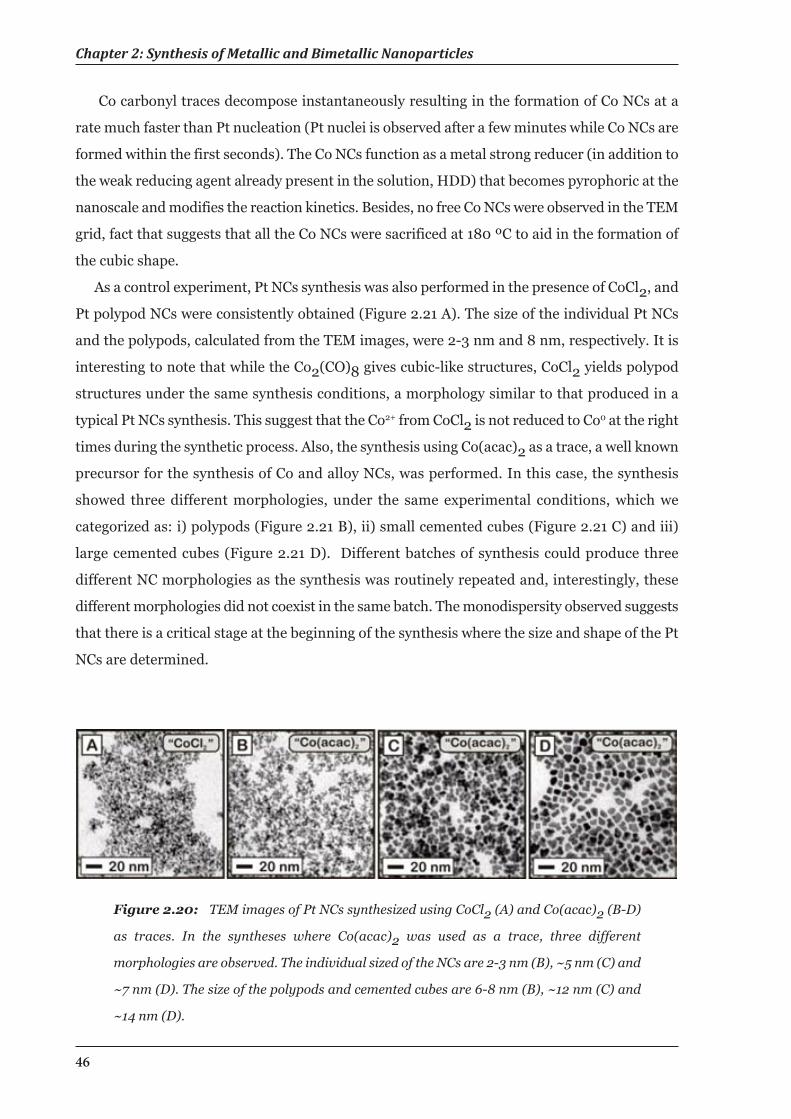
Chapter 2: Synthesis of Metallic and Bimetallic Nanoparticles
46
Co carbonyl traces decompose instantaneously resulting in the formation of Co NCs at a
rate much faster than Pt nucleation (Pt nuclei is observed after a few minutes while Co NCs are
formed within the first seconds). The Co NCs function as a metal strong reducer (in addition to
the weak reducing agent already present in the solution, HDD) that becomes pyrophoric at the
nanoscale and modifies the reaction kinetics. Besides, no free Co NCs were observed in the TEM
grid, fact that suggests that all the Co NCs were sacrificed at 180 ºC to aid in the formation of
the cubic shape.
As a control experiment, Pt NCs synthesis was also performed in the presence of CoCl2, and
Pt polypod NCs were consistently obtained (Figure 2.21 A). The size of the individual Pt NCs
and the polypods, calculated from the TEM images, were 2-3 nm and 8 nm, respectively. It is
interesting to note that while the Co2(CO)8 gives cubic-like structures, CoCl2 yields polypod
structures under the same synthesis conditions, a morphology similar to that produced in a
typical Pt NCs synthesis. This suggest that the Co2+ from CoCl2 is not reduced to Co0 at the right
times during the synthetic process. Also, the synthesis using Co(acac)2 as a trace, a well known
precursor for the synthesis of Co and alloy NCs, was performed. In this case, the synthesis
showed three different morphologies, under the same experimental conditions, which we
categorized as: i) polypods (Figure 2.21 B), ii) small cemented cubes (Figure 2.21 C) and iii)
large cemented cubes (Figure 2.21 D). Different batches of synthesis could produce three
different NC morphologies as the synthesis was routinely repeated and, interestingly, these
different morphologies did not coexist in the same batch. The monodispersity observed suggests
that there is a critical stage at the beginning of the synthesis where the size and shape of the Pt
NCs are determined.
Figure 2.20: TEM images of Pt NCs synthesized using CoCl2 (A) and Co(acac)2 (B-D)
as traces. In the syntheses where Co(acac)2 was used as a trace, three different
morphologies are observed. The individual sized of the NCs are 2-3 nm (B), ~5 nm (C) and
~7 nm (D). The size of the polypods and cemented cubes are 6-8 nm (B), ~12 nm (C) and
~14 nm (D).
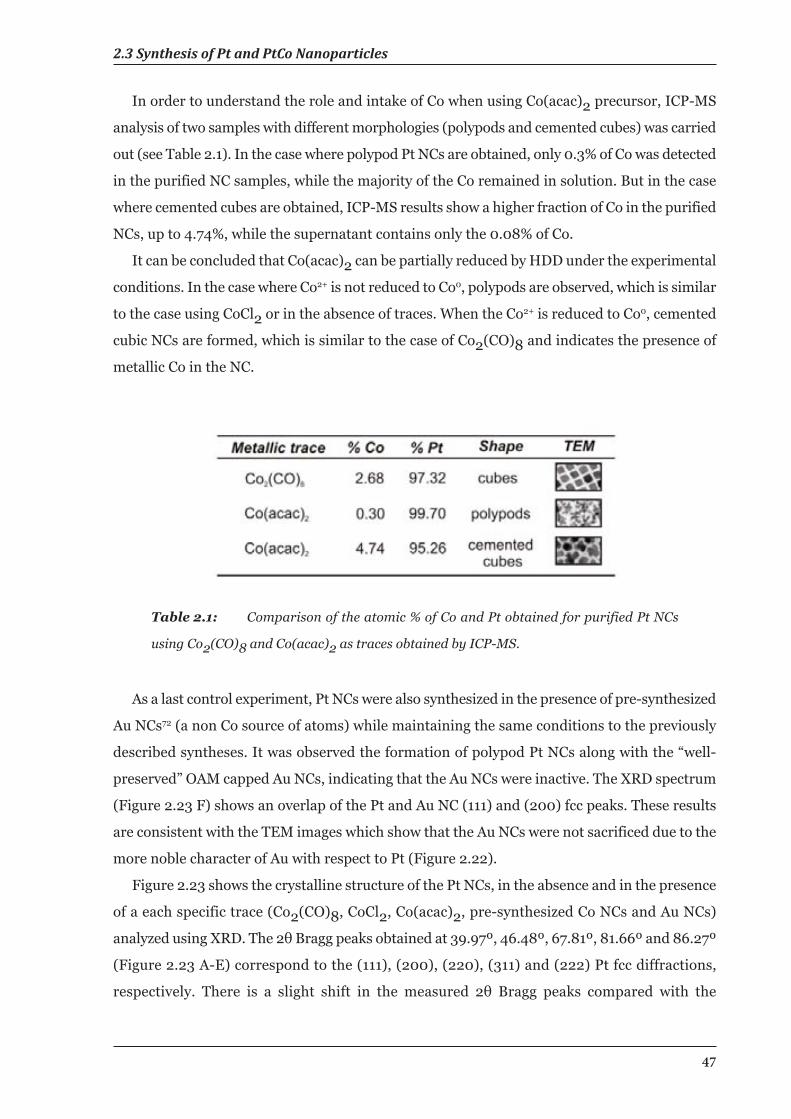
2.3 Synthesis of Pt and PtCo Nanoparticles
47
In order to understand the role and intake of Co when using Co(acac)2 precursor, ICP-MS
analysis of two samples with different morphologies (polypods and cemented cubes) was carried
out (see Table 2.1). In the case where polypod Pt NCs are obtained, only 0.3% of Co was detected
in the purified NC samples, while the majority of the Co remained in solution. But in the case
where cemented cubes are obtained, ICP-MS results show a higher fraction of Co in the purified
NCs, up to 4.74%, while the supernatant contains only the 0.08% of Co.
It can be concluded that Co(acac)2 can be partially reduced by HDD under the experimental
conditions. In the case where Co2+ is not reduced to Co0, polypods are observed, which is similar
to the case using CoCl2 or in the absence of traces. When the Co2+ is reduced to Co0, cemented
cubic NCs are formed, which is similar to the case of Co2(CO)8 and indicates the presence of
metallic Co in the NC.
Table 2.1: Comparison of the atomic % of Co and Pt obtained for purified Pt NCs
using Co2(CO)8 and Co(acac)2 as traces obtained by ICP-MS.
As a last control experiment, Pt NCs were also synthesized in the presence of pre-synthesized
Au NCs72 (a non Co source of atoms) while maintaining the same conditions to the previously
described syntheses. It was observed the formation of polypod Pt NCs along with the “well-
preserved” OAM capped Au NCs, indicating that the Au NCs were inactive. The XRD spectrum
(Figure 2.23 F) shows an overlap of the Pt and Au NC (111) and (200) fcc peaks. These results
are consistent with the TEM images which show that the Au NCs were not sacrificed due to the
more noble character of Au with respect to Pt (Figure 2.22).
Figure 2.23 shows the crystalline structure of the Pt NCs, in the absence and in the presence
of a each specific trace (Co2(CO)8, CoCl2, Co(acac)2, pre-synthesized Co NCs and Au NCs)
analyzed using XRD. The 2θ Bragg peaks obtained at 39.97º, 46.48º, 67.81º, 81.66º and 86.27º
(Figure 2.23 A-E) correspond to the (111), (200), (220), (311) and (222) Pt fcc diffractions,
respectively. There is a slight shift in the measured 2θ Bragg peaks compared with the
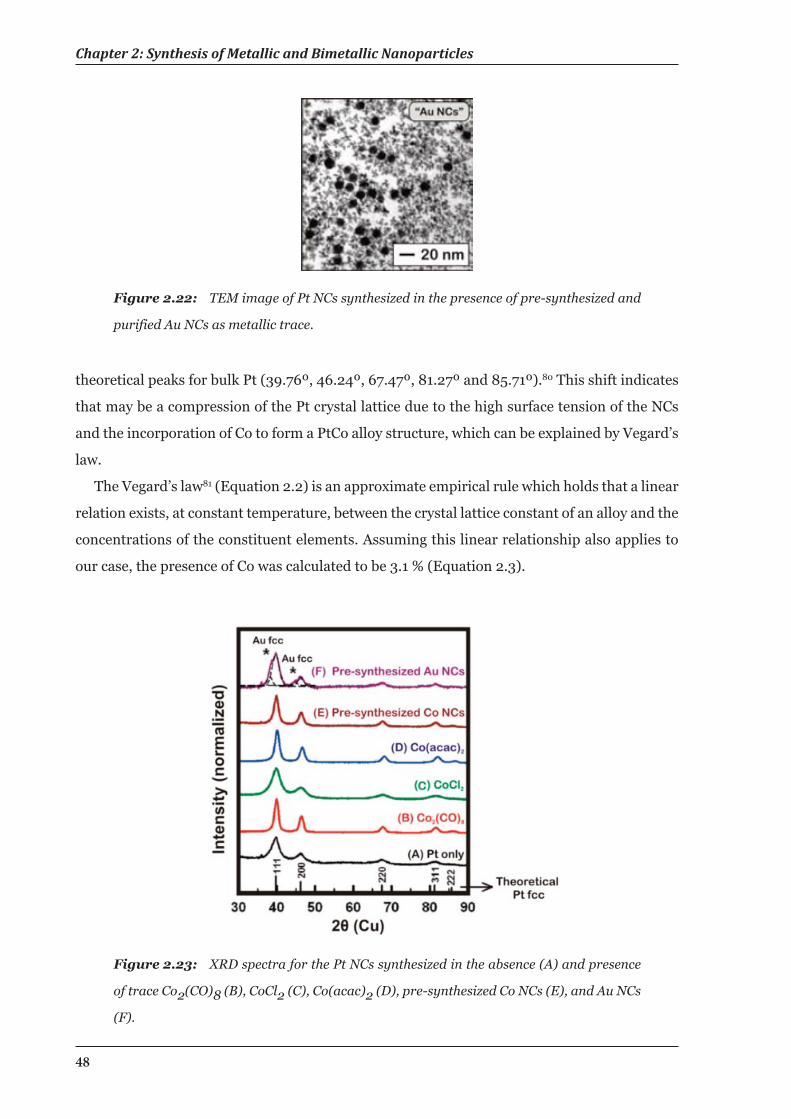
Chapter 2: Synthesis of Metallic and Bimetallic Nanoparticles
48
theoretical peaks for bulk Pt (39.76º, 46.24º, 67.47º, 81.27º and 85.71º).80 This shift indicates
that may be a compression of the Pt crystal lattice due to the high surface tension of the NCs
and the incorporation of Co to form a PtCo alloy structure, which can be explained by Vegard’s
law.
The Vegard’s law81 (Equation 2.2) is an approximate empirical rule which holds that a linear
relation exists, at constant temperature, between the crystal lattice constant of an alloy and the
concentrations of the constituent elements. Assuming this linear relationship also applies to
our case, the presence of Co was calculated to be 3.1 % (Equation 2.3).
Figure 2.23: XRD spectra for the Pt NCs synthesized in the absence (A) and presence
of trace Co2(CO)8 (B), CoCl2 (C), Co(acac)2 (D), pre-synthesized Co NCs (E), and Au NCs
(F).
Figure 2.22: TEM image of Pt NCs synthesized in the presence of pre-synthesized and
purified Au NCs as metallic trace.
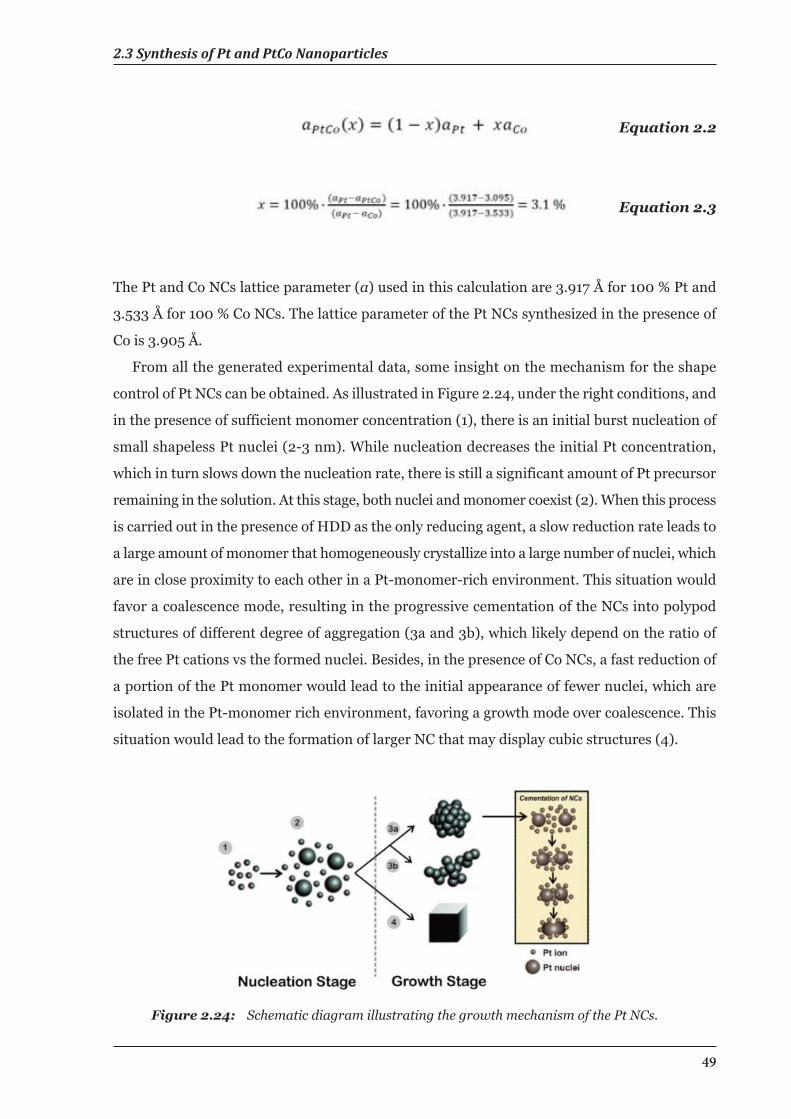
2.3 Synthesis of Pt and PtCo Nanoparticles
49
Equation 2.2
Equation 2.3
The Pt and Co NCs lattice parameter (a) used in this calculation are 3.917 Å for 100 % Pt and
3.533 Å for 100 % Co NCs. The lattice parameter of the Pt NCs synthesized in the presence of
Co is 3.905 Å.
From all the generated experimental data, some insight on the mechanism for the shape
control of Pt NCs can be obtained. As illustrated in Figure 2.24, under the right conditions, and
in the presence of sufficient monomer concentration (1), there is an initial burst nucleation of
small shapeless Pt nuclei (2-3 nm). While nucleation decreases the initial Pt concentration,
which in turn slows down the nucleation rate, there is still a significant amount of Pt precursor
remaining in the solution. At this stage, both nuclei and monomer coexist (2). When this process
is carried out in the presence of HDD as the only reducing agent, a slow reduction rate leads to
a large amount of monomer that homogeneously crystallize into a large number of nuclei, which
are in close proximity to each other in a Pt-monomer-rich environment. This situation would
favor a coalescence mode, resulting in the progressive cementation of the NCs into polypod
structures of different degree of aggregation (3a and 3b), which likely depend on the ratio of
the free Pt cations vs the formed nuclei. Besides, in the presence of Co NCs, a fast reduction of
a portion of the Pt monomer would lead to the initial appearance of fewer nuclei, which are
isolated in the Pt-monomer rich environment, favoring a growth mode over coalescence. This
situation would lead to the formation of larger NC that may display cubic structures (4).
Figure 2.24: Schematic diagram illustrating the growth mechanism of the Pt NCs.
Chapter 2: Synthesis of Metallic and Bimetallic Nanoparticles
50
2.2.1.3 Summary
Unlike previous works where different shapes where obtained with different experimental
procedures (modifying reducers, surfactants, concentration, temperatures, etc.), it has been
demonstrated that Pt NCs of different morphologies can be achieved by using a fixed set of
conditions and varying only the presence of different traces. In the presence of metallic Co at
low concentration (<5%), highly monodispersed cubic NCs are obtained, while in its absence
polypods are observed. The role of Co is to act as strong reducer to rapidly generate a small
amount of nuclei and promote cubic growth as shape directing agent. It is important to note
that these different morphologies do not coexist in the same preparation, indicating that the
size and shape are determined at an early stage and all the NCs are simultaneously affected. It
is worthy to mention one possible application of these Co doped Pt NCs as catalyst, as has been
recently reported for improving the oxygen reduction reaction in fuel cell technology.82
2.3.2 Synthesis of Pt and PtCo Nanoparticles by UsingCompeting Reducers
Generally, the kinetics of the NCs synthesis can be manipulated by changing different
parameters such the concentration, the temperature, reducing power, and additives or
surfactants, which have an impact on both the nucleation rate and the nuclei stability. Despite
the wide number of reports on the importance of the kinetic control in NC growth, the use of
mixtures of reducers has been not explored. In the previous subsection has been studied the
shape-control of Pt NCs in the presence of different Co traces and other metals (<5%),83 where
Co trace can function as both a metal reducer and shape directing agent. Recently, Zou et al.
reported the use of metal as reducers where tungsten was added as a foreign element to reduce
the Pt precursor. They found that tungsten has an influence of the kinetic control on NC
morphology, since without the presence of W(CO)6 their morphology appeared to be much
less controlled. 84
In this subsection is explored the synthesis of Pt NCs in the presence of Co0 with a broad
range of reducer compositions and concentrations with the aim of better understand this shape-
control process. Therefore, two competing reducers are used in a one-pot synthesis to kinetically
control the NC growth. It is showed that Pt and PtCo NCs with different morphologies can be
obtained by systematically varying the concentration of two competing reducing agents while
maintaining a fixed set of reaction conditions. Moreover, it is observed an important
competitive relationship between the two different reduces, and also how the NC growth toward
2.3 Synthesis of Pt and PtCo Nanoparticles
51
a particular shape can be influenced at very early stages. Unlike other NCs synthesis where the
size is controlled by varying the precursor/reducer ratio,85 chain lengths of capping agents86 or
changing reaction temperatures,87 herein it is observed a change in both the shape and the size
as we vary the Co and HDD concentrations. Finally, a control experiment substituting the Co
by lithium triethylborohydride as stronger reducing agent confirmed the proposed mechanism.
2.3.2.1 Experimental
For instrumentation details of this subsection see Appendix A.3.2
Chemicals. Platinum(II) acetylacetonate (Pt(acac)2, 98%) was purchased from Strem
Chemicals and used as received. Oleylamine (OAM, 70%), 1,2-dichlorobenzene anhydrous
(DCB, 99%), 1,2-hexadecanediol (HDD, 90%), superhydride lithium triethylborohydride (in 1
M THF) and Co carbonyl moistened with 5-10% hexane (Co2(CO)8, 90-95%) were purchased
from Sigma-Aldrich and used as received. All chemicals were stored and prepared for synthesis
in a UNIlab MBraun glovebox unless otherwise stated.
Synthesis. All the syntheses were performed under an Ar atmosphere using the standard
Schlenkline setup to avoid interactions between the NCs and O2, H+, or OH- species, and the
Pt(acac)2 concentration was constant in all syntheses. To remove the excess capping, reducing
agent and ions, the PtCo NCs were purified by precipitation in methanol followed by brief
centrifugation and redispersion in DCB prior to being subjected to further analysis (XRD, ICP-
MS, EDX).
Increasing Co Content. In the synthesis where the concentration of HDD remained
constant while the Co concentration was systematically increased, a solution containing 95 mg
of HDD (0.37 mmol), 45 μL of OAM, and 10 mL of DCB was added to a 3-neck round-bottom
flask equipped with a condenser and stirred under an Ar atmosphere. The solution temperature
was increased to 180 ºC using a glycerol oil bath over a time period of ~30-60 min. Once the
boiling temperature of DCB was reached, a 3 mL solution of DCB containing 45 mg of Pt(acac)2(0.11 mmol) was added dropwise at a rate of 0.5 mL/min. A 100 μL portion of Co trace prepared
from Co2(CO)8 (ranging from 0 to 54 μmol) was then added immediately to the solution. The
solution was refluxed at 180 ºC for 20 min and gradually cooled down to RT before being
transferred to an Ar filled vial.
Chapter 2: Synthesis of Metallic and Bimetallic Nanoparticles
52
Increasing Hydride Content. In a set of control syntheses, the Co was replaced with a
stronger reducing agent, lithium triethylborohydride. In this case, the HDD amount remained
constant at 0.37 mmol while the hydride concentration was varied from 0.2 to 40 μmol (taken
at 100 μL each time). The remaining synthesis was conducted following the method described
above.
Increasing HDD Content. In the synthesis where the concentration of HDD was varied
while maintaining a constant Co concentration, different amounts of HDD ranging from 0 to
1.5 mmol, and a constant concentration of Co trace prepared from Co2(CO)8 (100 μL containing
2.2 μmol of Co) were added to the synthesis following the method previously described.
2.3.2.2 Results and Discussion
As described in the previous subsection (2.3.1), synthesis of Pt NCs in the presence of HDD
and OAM produces Pt polypod NCs. However, if a small amount of Co2(CO)8 (<5%) is added,
the evolution of the reaction is much faster and cubic NCs are obtained. Herein, using the
experimental procedure described in the experimental section, the reduction of Pt ions has been
examined in the presence of two competing reducing agents (HDD and Co) with different
reducing strengths. The reduction potential of Pt2+ (Pt2+/Pt, Eºred = +1.20 V88) has been
achieved using HDD,83 but the exact reduction potential of HDD is not yet determined. Just a
reduction potential range can be delimited by comparing with other reported studies at similar
conditions, in which HDD was able to reduce Cu2+ (Cu2+/Cu, Eºred = +0.34 V89) and Fe2+
(Fe2+/Fe, Eºred = -0.44 V90). Besides, the redox potential of Co2+ is -0.28 V88, which can provide
a faster and effective reduction of the Pt ions. In the following experiments, the same synthetic
procedure is systematically performed by varying the concentration of only one reducer (HDD,
Co and hydride).
Increasing the Co content. Polypod structures with a multiarmed morphology, which
each arm is comprised small cemented Pt NCs,83 were observed when de HDD was presented
as sole reducing agent ([Co] = 0) (Figure 2.25A). The increase in Co concentration is determined
from the ratio [Co]/[Pt ] and represented by the value of x, which take values from 0 to 0.466.
When Co was added to the synthesis (x = 0.005), a morphological change from polypod to
cuboctahedron PtCo NCs could be observed (Figure 2.25, from B to D). It was produced an
increase in the NC size from 2.7 nm to 9.8 nm, being this dramatic change an effect of having
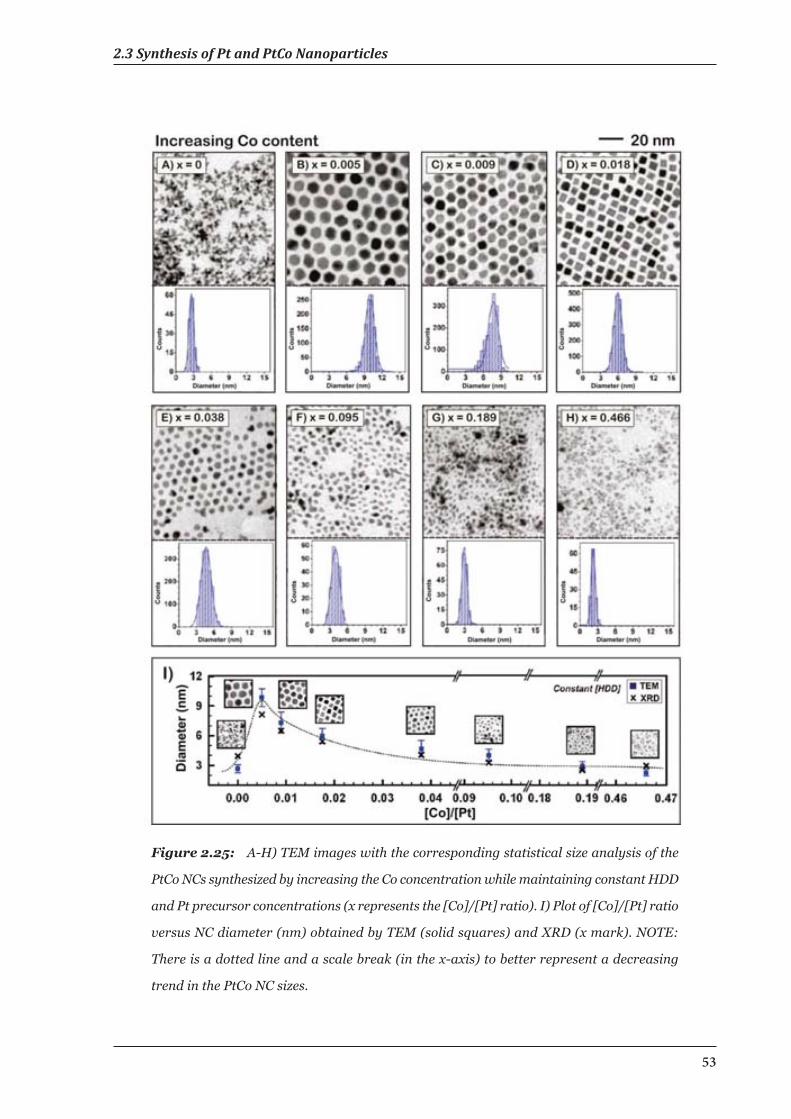
2.3 Synthesis of Pt and PtCo Nanoparticles
53
Figure 2.25: A-H) TEM images with the corresponding statistical size analysis of the
PtCo NCs synthesized by increasing the Co concentration while maintaining constant HDD
and Pt precursor concentrations (x represents the [Co]/[Pt] ratio). I) Plot of [Co]/[Pt] ratio
versus NC diameter (nm) obtained by TEM (solid squares) and XRD (x mark). NOTE:
There is a dotted line and a scale break (in the x-axis) to better represent a decreasing
trend in the PtCo NC sizes.
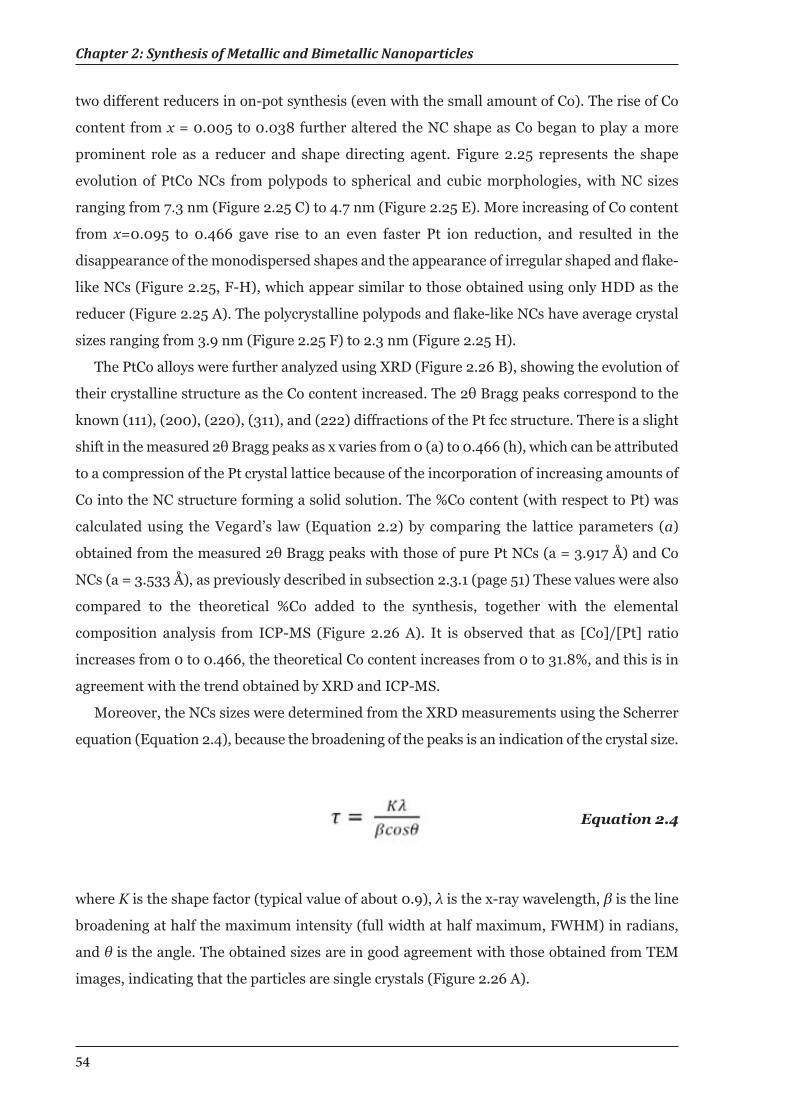
Chapter 2: Synthesis of Metallic and Bimetallic Nanoparticles
54
two different reducers in on-pot synthesis (even with the small amount of Co). The rise of Co
content from x = 0.005 to 0.038 further altered the NC shape as Co began to play a more
prominent role as a reducer and shape directing agent. Figure 2.25 represents the shape
evolution of PtCo NCs from polypods to spherical and cubic morphologies, with NC sizes
ranging from 7.3 nm (Figure 2.25 C) to 4.7 nm (Figure 2.25 E). More increasing of Co content
from x=0.095 to 0.466 gave rise to an even faster Pt ion reduction, and resulted in the
disappearance of the monodispersed shapes and the appearance of irregular shaped and flake-
like NCs (Figure 2.25, F-H), which appear similar to those obtained using only HDD as the
reducer (Figure 2.25 A). The polycrystalline polypods and flake-like NCs have average crystal
sizes ranging from 3.9 nm (Figure 2.25 F) to 2.3 nm (Figure 2.25 H).
The PtCo alloys were further analyzed using XRD (Figure 2.26 B), showing the evolution of
their crystalline structure as the Co content increased. The 2θ Bragg peaks correspond to the
known (111), (200), (220), (311), and (222) diffractions of the Pt fcc structure. There is a slight
shift in the measured 2θ Bragg peaks as x varies from 0 (a) to 0.466 (h), which can be attributed
to a compression of the Pt crystal lattice because of the incorporation of increasing amounts of
Co into the NC structure forming a solid solution. The %Co content (with respect to Pt) was
calculated using the Vegard’s law (Equation 2.2) by comparing the lattice parameters (a)
obtained from the measured 2θ Bragg peaks with those of pure Pt NCs (a = 3.917 Å) and Co
NCs (a = 3.533 Å), as previously described in subsection 2.3.1 (page 51) These values were also
compared to the theoretical %Co added to the synthesis, together with the elemental
composition analysis from ICP-MS (Figure 2.26 A). It is observed that as [Co]/[Pt] ratio
increases from 0 to 0.466, the theoretical Co content increases from 0 to 31.8%, and this is in
agreement with the trend obtained by XRD and ICP-MS.
Moreover, the NCs sizes were determined from the XRD measurements using the Scherrer
equation (Equation 2.4), because the broadening of the peaks is an indication of the crystal size.
Equation 2.4
where K is the shape factor (typical value of about 0.9), λ is the x-ray wavelength, β is the line
broadening at half the maximum intensity (full width at half maximum, FWHM) in radians,
and θ is the angle. The obtained sizes are in good agreement with those obtained from TEM
images, indicating that the particles are single crystals (Figure 2.26 A).
2.3 Synthesis of Pt and PtCo Nanoparticles
55
The different morphologies obtained with increasing [Co]/[Pt] ratio can be divided in three
regimes:
I. The polypods morphology is consistently observed in the absence of Co. Likely, the slow
reduction rate of HDD leads to a large amount of monomer that simultaneously crystallize
into a large amount of Pt nuclei, which grow into polypod structures due to a cementation
process.83
II. The spherical/cubic PtCo NCs are observed when small Co amounts are added to the
synthesis. The reduction competition between HDD and Co leads to a fast reduction of a
Figure 2.26: A) Tabulated comparison of the atomic % of Co obtained from the
theoretical synthesis, calculated from Vegard’s law (XRD) and ICP-MS (left); and a
comparison of the PtCo NCs size determined from TEM images and calculated using the
Scherrer equation (XRD) as the Co content varies (right). B) XDR patterns for the PtCo
NCs synthesized in the presence of increasing Co content (x=[Co]/[Pt]) with constant HDD
and Pt precursor concentrations.
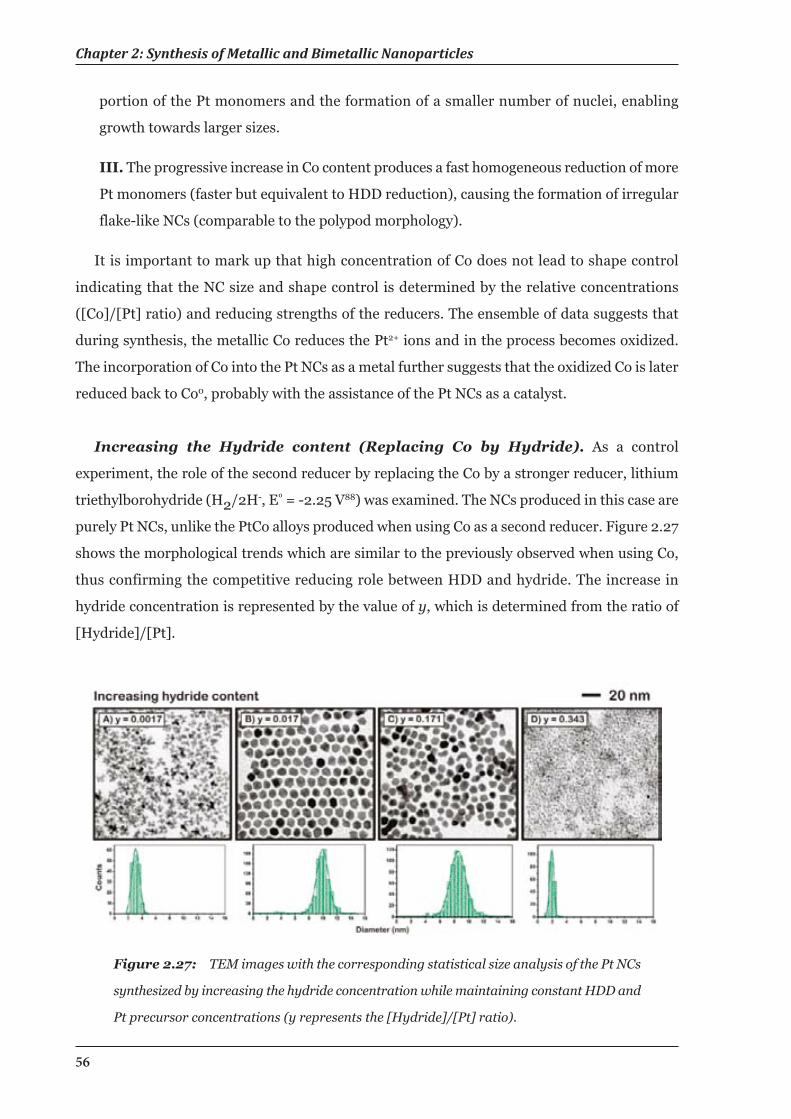
Chapter 2: Synthesis of Metallic and Bimetallic Nanoparticles
56
portion of the Pt monomers and the formation of a smaller number of nuclei, enabling
growth towards larger sizes.
III. The progressive increase in Co content produces a fast homogeneous reduction of more
Pt monomers (faster but equivalent to HDD reduction), causing the formation of irregular
flake-like NCs (comparable to the polypod morphology).
It is important to mark up that high concentration of Co does not lead to shape control
indicating that the NC size and shape control is determined by the relative concentrations
([Co]/[Pt] ratio) and reducing strengths of the reducers. The ensemble of data suggests that
during synthesis, the metallic Co reduces the Pt2+ ions and in the process becomes oxidized.
The incorporation of Co into the Pt NCs as a metal further suggests that the oxidized Co is later
reduced back to Co0, probably with the assistance of the Pt NCs as a catalyst.
Increasing the Hydride content (Replacing Co by Hydride). As a control
experiment, the role of the second reducer by replacing the Co by a stronger reducer, lithium
triethylborohydride (H2/2H-, Eº = -2.25 V88) was examined. The NCs produced in this case are
purely Pt NCs, unlike the PtCo alloys produced when using Co as a second reducer. Figure 2.27
shows the morphological trends which are similar to the previously observed when using Co,
thus confirming the competitive reducing role between HDD and hydride. The increase in
hydride concentration is represented by the value of y, which is determined from the ratio of
[Hydride]/[Pt].
Figure 2.27: TEM images with the corresponding statistical size analysis of the Pt NCs
synthesized by increasing the hydride concentration while maintaining constant HDD and
Pt precursor concentrations (y represents the [Hydride]/[Pt] ratio).
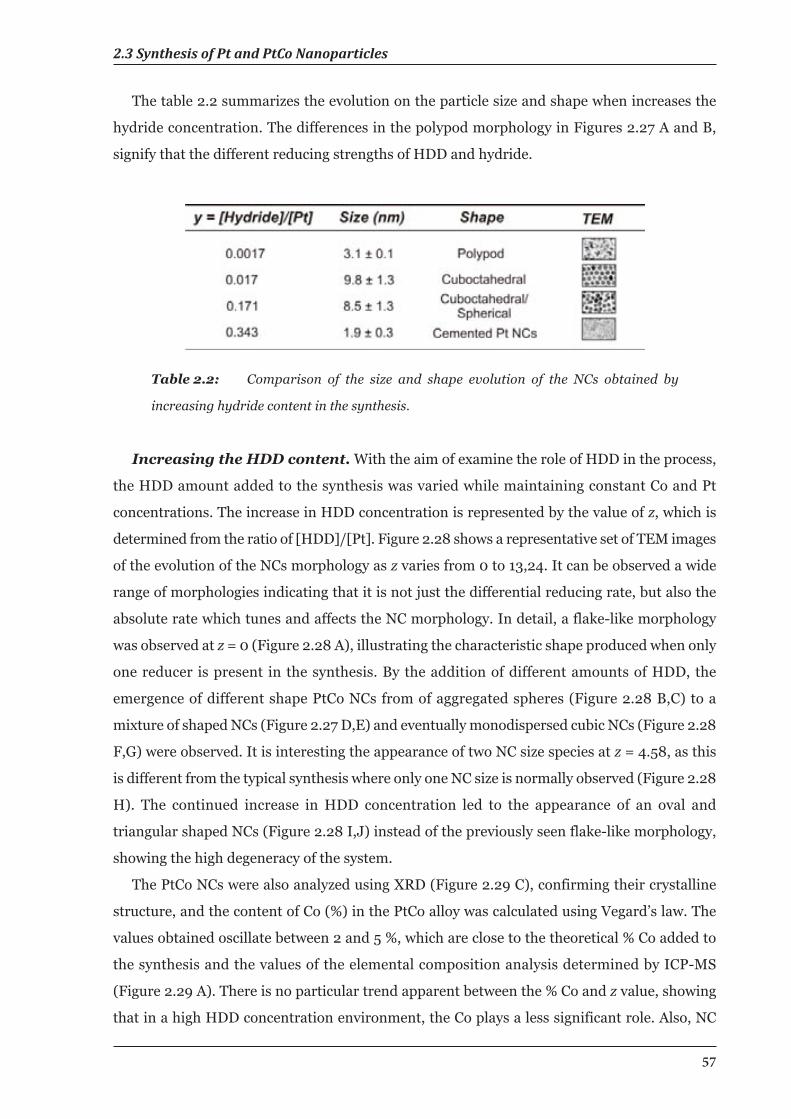
2.3 Synthesis of Pt and PtCo Nanoparticles
57
The table 2.2 summarizes the evolution on the particle size and shape when increases the
hydride concentration. The differences in the polypod morphology in Figures 2.27 A and B,
signify that the different reducing strengths of HDD and hydride.
Table 2.2: Comparison of the size and shape evolution of the NCs obtained by
increasing hydride content in the synthesis.
Increasing the HDD content. With the aim of examine the role of HDD in the process,
the HDD amount added to the synthesis was varied while maintaining constant Co and Pt
concentrations. The increase in HDD concentration is represented by the value of z, which is
determined from the ratio of [HDD]/[Pt]. Figure 2.28 shows a representative set of TEM images
of the evolution of the NCs morphology as z varies from 0 to 13,24. It can be observed a wide
range of morphologies indicating that it is not just the differential reducing rate, but also the
absolute rate which tunes and affects the NC morphology. In detail, a flake-like morphology
was observed at z = 0 (Figure 2.28 A), illustrating the characteristic shape produced when only
one reducer is present in the synthesis. By the addition of different amounts of HDD, the
emergence of different shape PtCo NCs from of aggregated spheres (Figure 2.28 B,C) to a
mixture of shaped NCs (Figure 2.27 D,E) and eventually monodispersed cubic NCs (Figure 2.28
F,G) were observed. It is interesting the appearance of two NC size species at z = 4.58, as this
is different from the typical synthesis where only one NC size is normally observed (Figure 2.28
H). The continued increase in HDD concentration led to the appearance of an oval and
triangular shaped NCs (Figure 2.28 I,J) instead of the previously seen flake-like morphology,
showing the high degeneracy of the system.
The PtCo NCs were also analyzed using XRD (Figure 2.29 C), confirming their crystalline
structure, and the content of Co (%) in the PtCo alloy was calculated using Vegard’s law. The
values obtained oscillate between 2 and 5 %, which are close to the theoretical % Co added to
the synthesis and the values of the elemental composition analysis determined by ICP-MS
(Figure 2.29 A). There is no particular trend apparent between the % Co and z value, showing
that in a high HDD concentration environment, the Co plays a less significant role. Also, NC
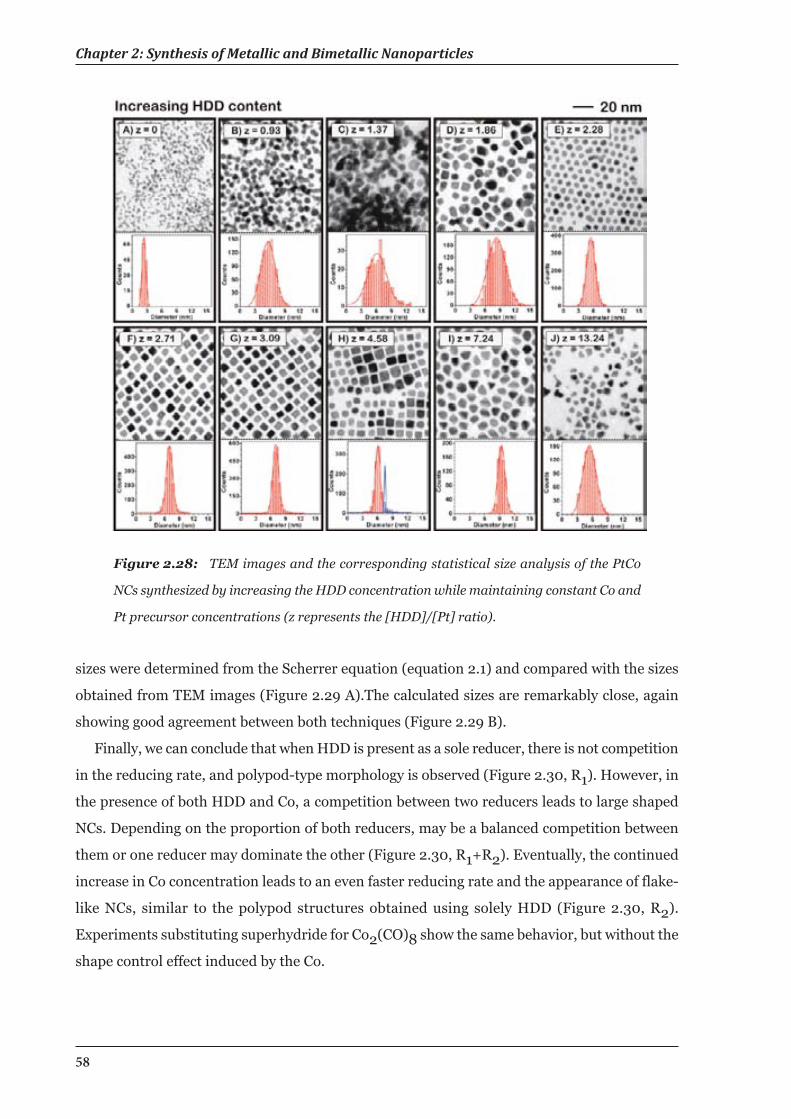
Chapter 2: Synthesis of Metallic and Bimetallic Nanoparticles
58
sizes were determined from the Scherrer equation (equation 2.1) and compared with the sizes
obtained from TEM images (Figure 2.29 A).The calculated sizes are remarkably close, again
showing good agreement between both techniques (Figure 2.29 B).
Finally, we can conclude that when HDD is present as a sole reducer, there is not competition
in the reducing rate, and polypod-type morphology is observed (Figure 2.30, R1). However, in
the presence of both HDD and Co, a competition between two reducers leads to large shaped
NCs. Depending on the proportion of both reducers, may be a balanced competition between
them or one reducer may dominate the other (Figure 2.30, R1+R2). Eventually, the continued
increase in Co concentration leads to an even faster reducing rate and the appearance of flake-
like NCs, similar to the polypod structures obtained using solely HDD (Figure 2.30, R2).
Experiments substituting superhydride for Co2(CO)8 show the same behavior, but without the
shape control effect induced by the Co.
Figure 2.28: TEM images and the corresponding statistical size analysis of the PtCo
NCs synthesized by increasing the HDD concentration while maintaining constant Co and
Pt precursor concentrations (z represents the [HDD]/[Pt] ratio).
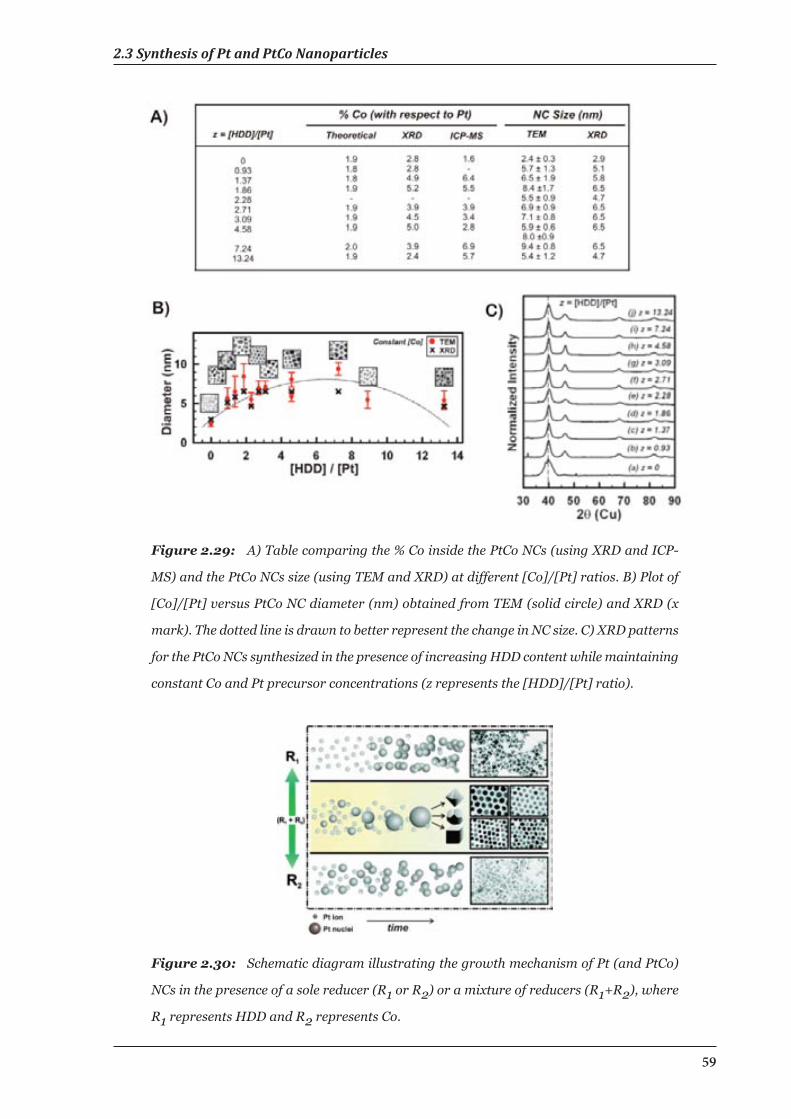
2.3 Synthesis of Pt and PtCo Nanoparticles
59
Figure 2.29: A) Table comparing the % Co inside the PtCo NCs (using XRD and ICP-
MS) and the PtCo NCs size (using TEM and XRD) at different [Co]/[Pt] ratios. B) Plot of
[Co]/[Pt] versus PtCo NC diameter (nm) obtained from TEM (solid circle) and XRD (x
mark). The dotted line is drawn to better represent the change in NC size. C) XRD patterns
for the PtCo NCs synthesized in the presence of increasing HDD content while maintaining
constant Co and Pt precursor concentrations (z represents the [HDD]/[Pt] ratio).
Figure 2.30: Schematic diagram illustrating the growth mechanism of Pt (and PtCo)
NCs in the presence of a sole reducer (R1 or R2) or a mixture of reducers (R1+R2), where
R1 represents HDD and R2 represents Co.
Chapter 2: Synthesis of Metallic and Bimetallic Nanoparticles
60
2.3.2.3 Summary
The synthesis of Pt and PtCo alloy NCs in the presence of one or two reducing agents has
been studied. Upon the addition of Pt precursor, an initial burst nucleation of small, amorphous
Pt nuclei results in a dramatic decrease on the concentration and availability of the Pt precursor,
and thus opens a getaway for the NC growth phase. The existence of both freshly formed nuclei
and precursor at the beginning of the reaction represents a highly susceptible and vulnerable
stage, where the size and shape of NCs can be easily manipulated.77 The relative concentrations
of available precursor and the growing nuclei can be altered to have an impact on the growth
kinetics by mixing reducers in such a way that they compete to reduce the Pt ions. The presence
of only one reducer produces polypod-type morphologies. On the other hand, when the
synthesis contains two competing reducers, shaped NCs are obtained. Different morphologies
can be produced by taking advantage of the susceptibility of the system to minor changes during
the early reaction stages.
2.4 Synthesis of Bimetallic Au/Pt Heterostructures
From the mixed Pt/Co systems, in this section we move to explore Pt/Au systems, where in
this case the Pt is the reactive specie and Au the noble one. Hybrid NCs represent a new class
of structures where different inorganic materials are joined together in the absence of a
mediator (i.e. molecular linker) and bring about materials with novel properties.91,92 The most
studied geometries are core/shell NCs, where the outer material is uniformly grown around the
metallic core.93 But recently, special interest is also being directed towards asymmetrical
structures, which are grown with two materials (such as metal/metal,94-96
semiconductor/metal,97,98 metal oxide/metal99,100 and metal oxide/semiconductor101) epitaxially
joined through an interfacial area. In the last years, a wide variety of morphologies such as
dumbbells,102,103 clover-like96 and rod with metal tip94,104 have been reported, where their shape
depends on how growth can occur (i.e. at specific facets or domains of the NCs).
While a common theme for most of the reported heterodimers is the use of high
temperatures during the synthetic process, herein we show a RT synthesis of AuPt heterodimers
using a simple protocol.
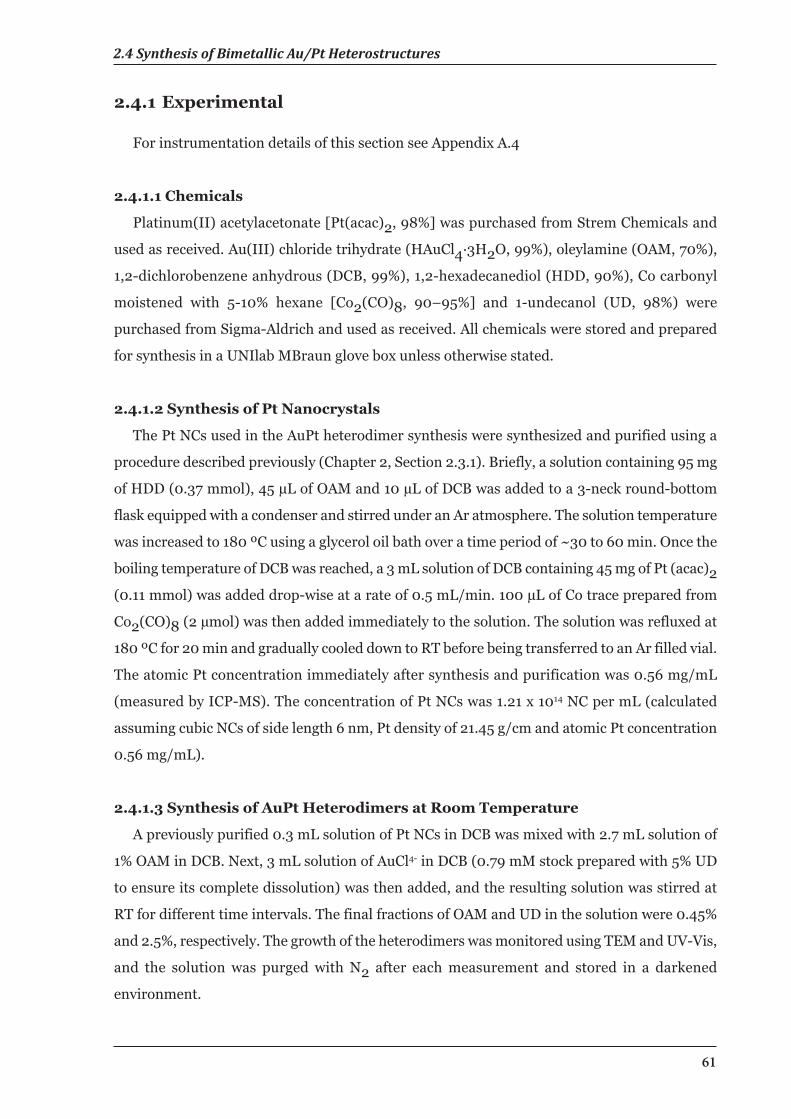
2.4 Synthesis of Bimetallic Au/Pt Heterostructures
61
2.4.1 Experimental
For instrumentation details of this section see Appendix A.4
2.4.1.1 Chemicals
Platinum(II) acetylacetonate [Pt(acac)2, 98%] was purchased from Strem Chemicals and
used as received. Au(III) chloride trihydrate (HAuCl4·3H2O, 99%), oleylamine (OAM, 70%),
1,2-dichlorobenzene anhydrous (DCB, 99%), 1,2-hexadecanediol (HDD, 90%), Co carbonyl
moistened with 5-10% hexane [Co2(CO)8, 90–95%] and 1-undecanol (UD, 98%) were
purchased from Sigma-Aldrich and used as received. All chemicals were stored and prepared
for synthesis in a UNIlab MBraun glove box unless otherwise stated.
2.4.1.2 Synthesis of Pt Nanocrystals
The Pt NCs used in the AuPt heterodimer synthesis were synthesized and purified using a
procedure described previously (Chapter 2, Section 2.3.1). Briefly, a solution containing 95 mg
of HDD (0.37 mmol), 45 µL of OAM and 10 µL of DCB was added to a 3-neck round-bottom
flask equipped with a condenser and stirred under an Ar atmosphere. The solution temperature
was increased to 180 ºC using a glycerol oil bath over a time period of ~30 to 60 min. Once the
boiling temperature of DCB was reached, a 3 mL solution of DCB containing 45 mg of Pt (acac)2(0.11 mmol) was added drop-wise at a rate of 0.5 mL/min. 100 µL of Co trace prepared from
Co2(CO)8 (2 µmol) was then added immediately to the solution. The solution was refluxed at
180 ºC for 20 min and gradually cooled down to RT before being transferred to an Ar filled vial.
The atomic Pt concentration immediately after synthesis and purification was 0.56 mg/mL
(measured by ICP-MS). The concentration of Pt NCs was 1.21 x 10¹⁴ NC per mL (calculated
assuming cubic NCs of side length 6 nm, Pt density of 21.45 g/cm and atomic Pt concentration
0.56 mg/mL).
2.4.1.3 Synthesis of AuPt Heterodimers at Room Temperature
A previously purified 0.3 mL solution of Pt NCs in DCB was mixed with 2.7 mL solution of
1% OAM in DCB. Next, 3 mL solution of AuCl4- in DCB (0.79 mM stock prepared with 5% UD
to ensure its complete dissolution) was then added, and the resulting solution was stirred at
RT for different time intervals. The final fractions of OAM and UD in the solution were 0.45%
and 2.5%, respectively. The growth of the heterodimers was monitored using TEM and UV-Vis,
and the solution was purged with N2 after each measurement and stored in a darkened
environment.
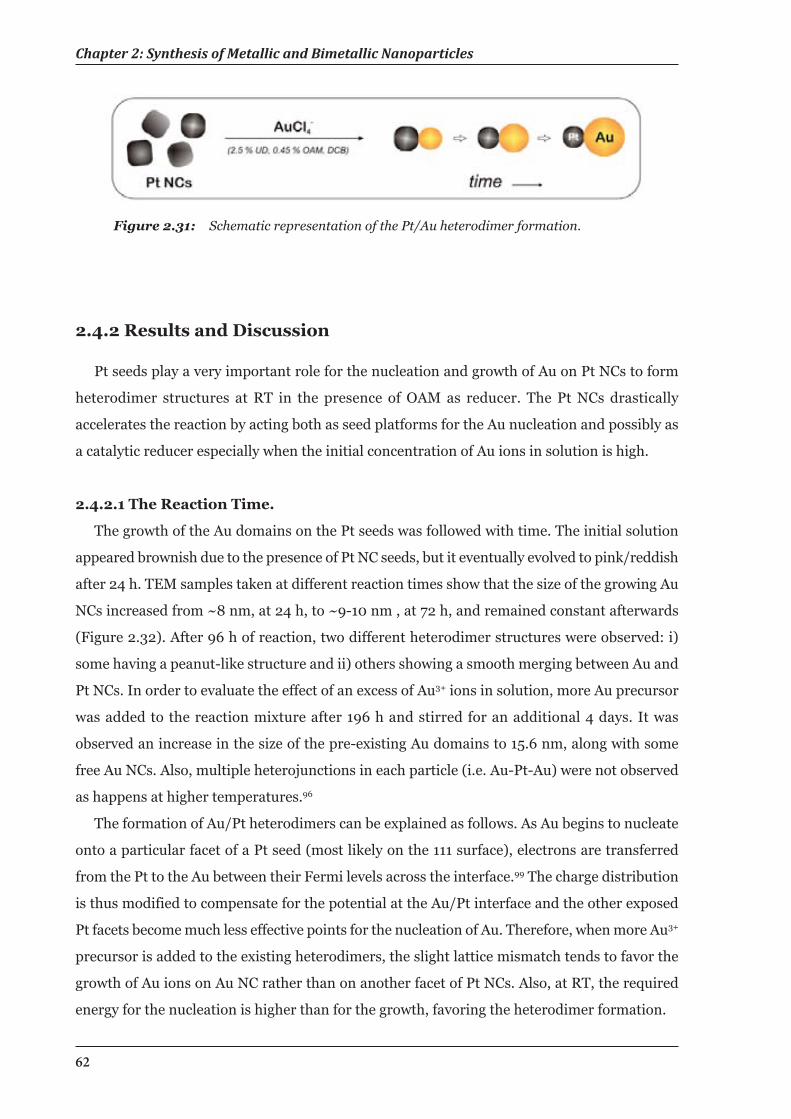
Chapter 2: Synthesis of Metallic and Bimetallic Nanoparticles
62
2.4.2 Results and Discussion
Pt seeds play a very important role for the nucleation and growth of Au on Pt NCs to form
heterodimer structures at RT in the presence of OAM as reducer. The Pt NCs drastically
accelerates the reaction by acting both as seed platforms for the Au nucleation and possibly as
a catalytic reducer especially when the initial concentration of Au ions in solution is high.
2.4.2.1 The Reaction Time.
The growth of the Au domains on the Pt seeds was followed with time. The initial solution
appeared brownish due to the presence of Pt NC seeds, but it eventually evolved to pink/reddish
after 24 h. TEM samples taken at different reaction times show that the size of the growing Au
NCs increased from ~8 nm, at 24 h, to ~9-10 nm , at 72 h, and remained constant afterwards
(Figure 2.32). After 96 h of reaction, two different heterodimer structures were observed: i)
some having a peanut-like structure and ii) others showing a smooth merging between Au and
Pt NCs. In order to evaluate the effect of an excess of Au3+ ions in solution, more Au precursor
was added to the reaction mixture after 196 h and stirred for an additional 4 days. It was
observed an increase in the size of the pre-existing Au domains to 15.6 nm, along with some
free Au NCs. Also, multiple heterojunctions in each particle (i.e. Au-Pt-Au) were not observed
as happens at higher temperatures.96
The formation of Au/Pt heterodimers can be explained as follows. As Au begins to nucleate
onto a particular facet of a Pt seed (most likely on the 111 surface), electrons are transferred
from the Pt to the Au between their Fermi levels across the interface.99 The charge distribution
is thus modified to compensate for the potential at the Au/Pt interface and the other exposed
Pt facets become much less effective points for the nucleation of Au. Therefore, when more Au3+
precursor is added to the existing heterodimers, the slight lattice mismatch tends to favor the
growth of Au ions on Au NC rather than on another facet of Pt NCs. Also, at RT, the required
energy for the nucleation is higher than for the growth, favoring the heterodimer formation.
Figure 2.31: Schematic representation of the Pt/Au heterodimer formation.
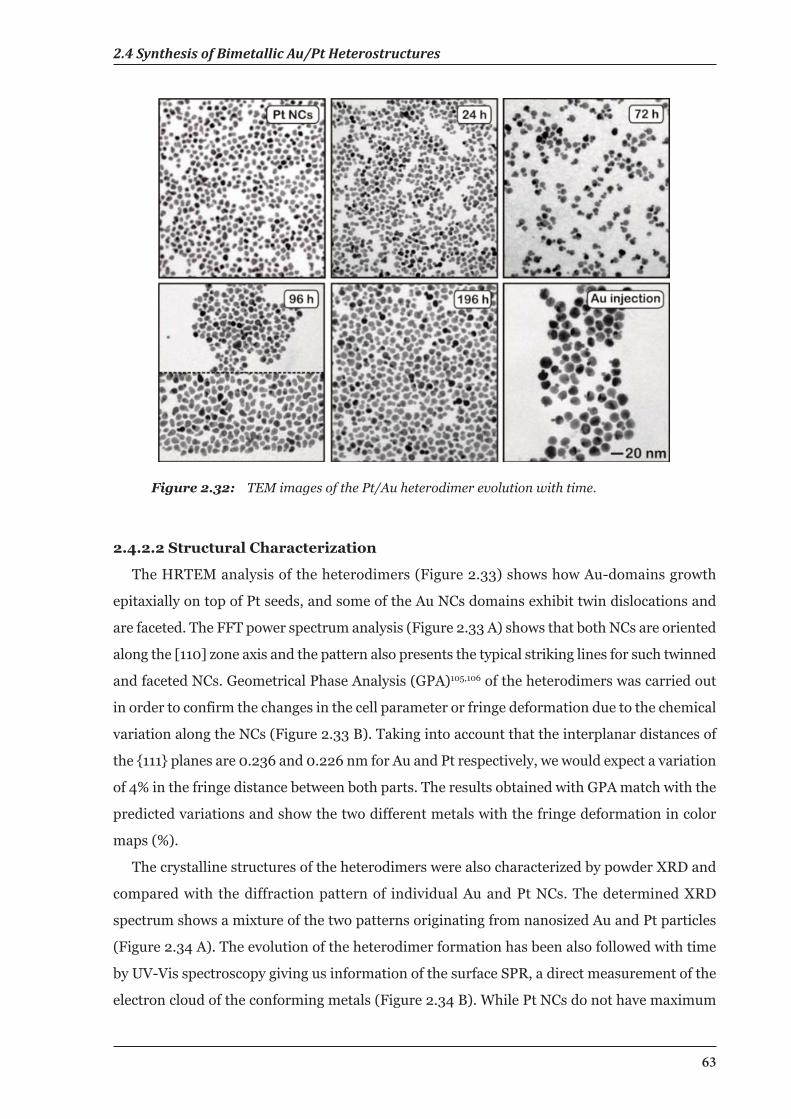
2.4 Synthesis of Bimetallic Au/Pt Heterostructures
63
2.4.2.2 Structural Characterization
The HRTEM analysis of the heterodimers (Figure 2.33) shows how Au-domains growth
epitaxially on top of Pt seeds, and some of the Au NCs domains exhibit twin dislocations and
are faceted. The FFT power spectrum analysis (Figure 2.33 A) shows that both NCs are oriented
along the [110] zone axis and the pattern also presents the typical striking lines for such twinned
and faceted NCs. Geometrical Phase Analysis (GPA)105,106 of the heterodimers was carried out
in order to confirm the changes in the cell parameter or fringe deformation due to the chemical
variation along the NCs (Figure 2.33 B). Taking into account that the interplanar distances of
the {111} planes are 0.236 and 0.226 nm for Au and Pt respectively, we would expect a variation
of 4% in the fringe distance between both parts. The results obtained with GPA match with the
predicted variations and show the two different metals with the fringe deformation in color
maps (%).
The crystalline structures of the heterodimers were also characterized by powder XRD and
compared with the diffraction pattern of individual Au and Pt NCs. The determined XRD
spectrum shows a mixture of the two patterns originating from nanosized Au and Pt particles
(Figure 2.34 A). The evolution of the heterodimer formation has been also followed with time
by UV-Vis spectroscopy giving us information of the surface SPR, a direct measurement of the
electron cloud of the conforming metals (Figure 2.34 B). While Pt NCs do not have maximum
Figure 2.32: TEM images of the Pt/Au heterodimer evolution with time.
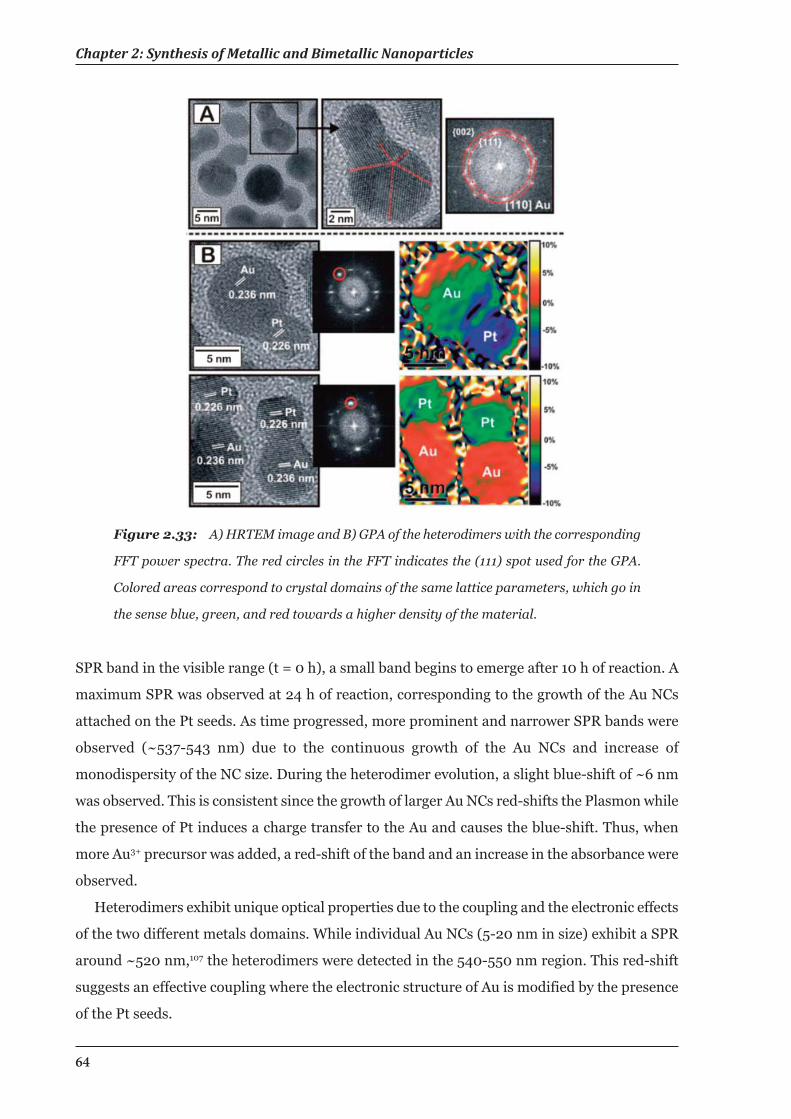
Chapter 2: Synthesis of Metallic and Bimetallic Nanoparticles
64
SPR band in the visible range (t = 0 h), a small band begins to emerge after 10 h of reaction. A
maximum SPR was observed at 24 h of reaction, corresponding to the growth of the Au NCs
attached on the Pt seeds. As time progressed, more prominent and narrower SPR bands were
observed (~537-543 nm) due to the continuous growth of the Au NCs and increase of
monodispersity of the NC size. During the heterodimer evolution, a slight blue-shift of ~6 nm
was observed. This is consistent since the growth of larger Au NCs red-shifts the Plasmon while
the presence of Pt induces a charge transfer to the Au and causes the blue-shift. Thus, when
more Au3+ precursor was added, a red-shift of the band and an increase in the absorbance were
observed.
Heterodimers exhibit unique optical properties due to the coupling and the electronic effects
of the two different metals domains. While individual Au NCs (5-20 nm in size) exhibit a SPR
around ~520 nm,107 the heterodimers were detected in the 540-550 nm region. This red-shift
suggests an effective coupling where the electronic structure of Au is modified by the presence
of the Pt seeds.
Figure 2.33: A) HRTEM image and B) GPA of the heterodimers with the corresponding
FFT power spectra. The red circles in the FFT indicates the (111) spot used for the GPA.
Colored areas correspond to crystal domains of the same lattice parameters, which go in
the sense blue, green, and red towards a higher density of the material.
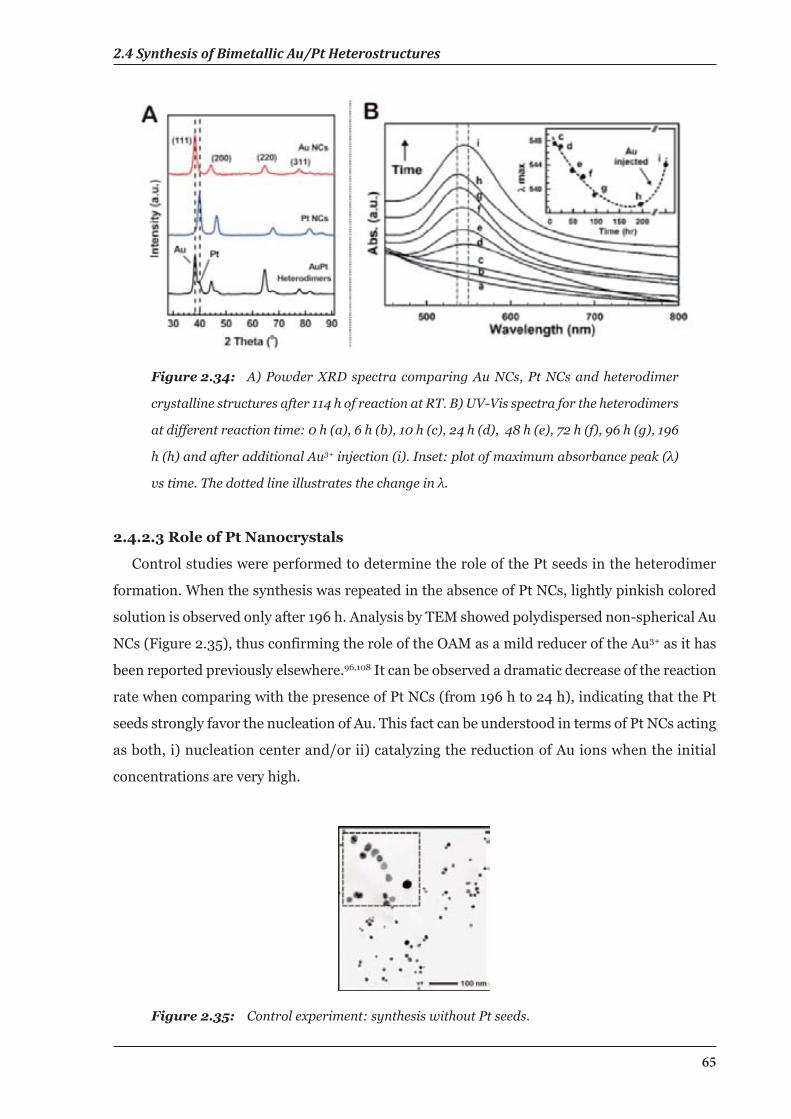
2.4 Synthesis of Bimetallic Au/Pt Heterostructures
65
Figure 2.34: A) Powder XRD spectra comparing Au NCs, Pt NCs and heterodimer
crystalline structures after 114 h of reaction at RT. B) UV-Vis spectra for the heterodimers
at different reaction time: 0 h (a), 6 h (b), 10 h (c), 24 h (d), 48 h (e), 72 h (f), 96 h (g), 196
h (h) and after additional Au3+ injection (i). Inset: plot of maximum absorbance peak (λ)
vs time. The dotted line illustrates the change in λ.
2.4.2.3 Role of Pt Nanocrystals
Control studies were performed to determine the role of the Pt seeds in the heterodimer
formation. When the synthesis was repeated in the absence of Pt NCs, lightly pinkish colored
solution is observed only after 196 h. Analysis by TEM showed polydispersed non-spherical Au
NCs (Figure 2.35), thus confirming the role of the OAM as a mild reducer of the Au3+ as it has
been reported previously elsewhere.96,108 It can be observed a dramatic decrease of the reaction
rate when comparing with the presence of Pt NCs (from 196 h to 24 h), indicating that the Pt
seeds strongly favor the nucleation of Au. This fact can be understood in terms of Pt NCs acting
as both, i) nucleation center and/or ii) catalyzing the reduction of Au ions when the initial
concentrations are very high.
Figure 2.35: Control experiment: synthesis without Pt seeds.
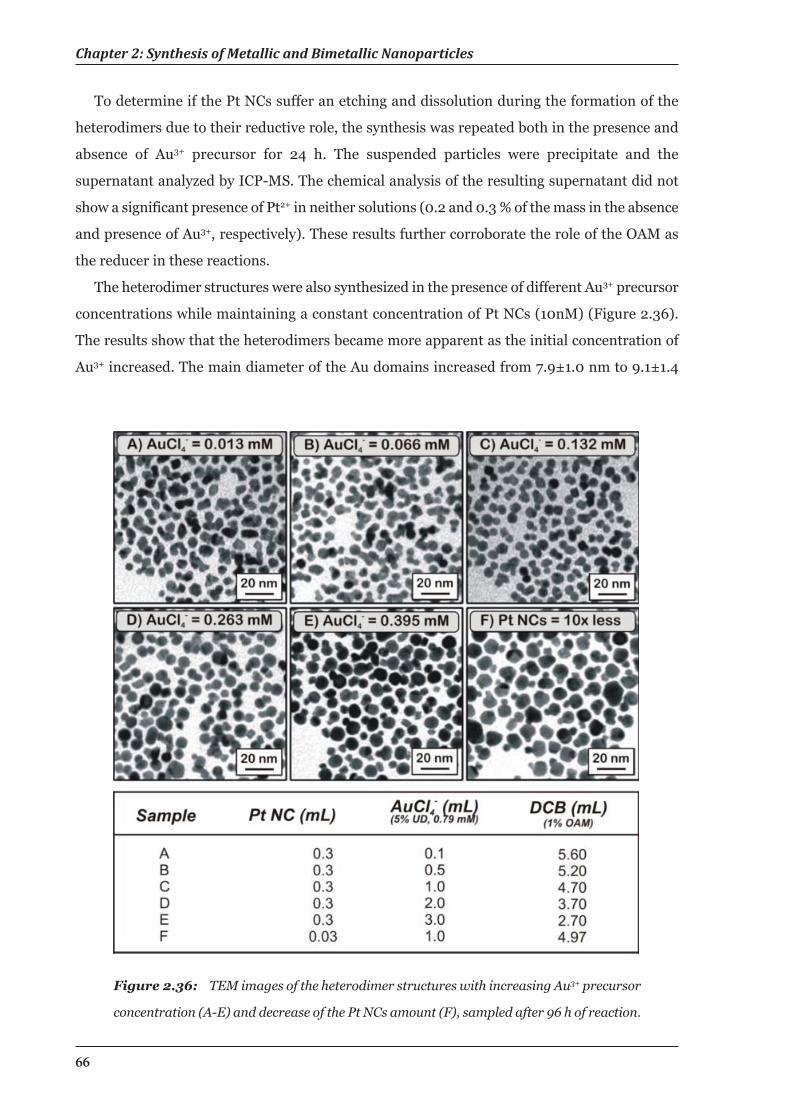
Chapter 2: Synthesis of Metallic and Bimetallic Nanoparticles
66
To determine if the Pt NCs suffer an etching and dissolution during the formation of the
heterodimers due to their reductive role, the synthesis was repeated both in the presence and
absence of Au3+ precursor for 24 h. The suspended particles were precipitate and the
supernatant analyzed by ICP-MS. The chemical analysis of the resulting supernatant did not
show a significant presence of Pt2+ in neither solutions (0.2 and 0.3 % of the mass in the absence
and presence of Au3+, respectively). These results further corroborate the role of the OAM as
the reducer in these reactions.
The heterodimer structures were also synthesized in the presence of different Au3+ precursor
concentrations while maintaining a constant concentration of Pt NCs (10nM) (Figure 2.36).
The results show that the heterodimers became more apparent as the initial concentration of
Au3+ increased. The main diameter of the Au domains increased from 7.9±1.0 nm to 9.1±1.4
Figure 2.36: TEM images of the heterodimer structures with increasing Au3+ precursor
concentration (A-E) and decrease of the Pt NCs amount (F), sampled after 96 h of reaction.
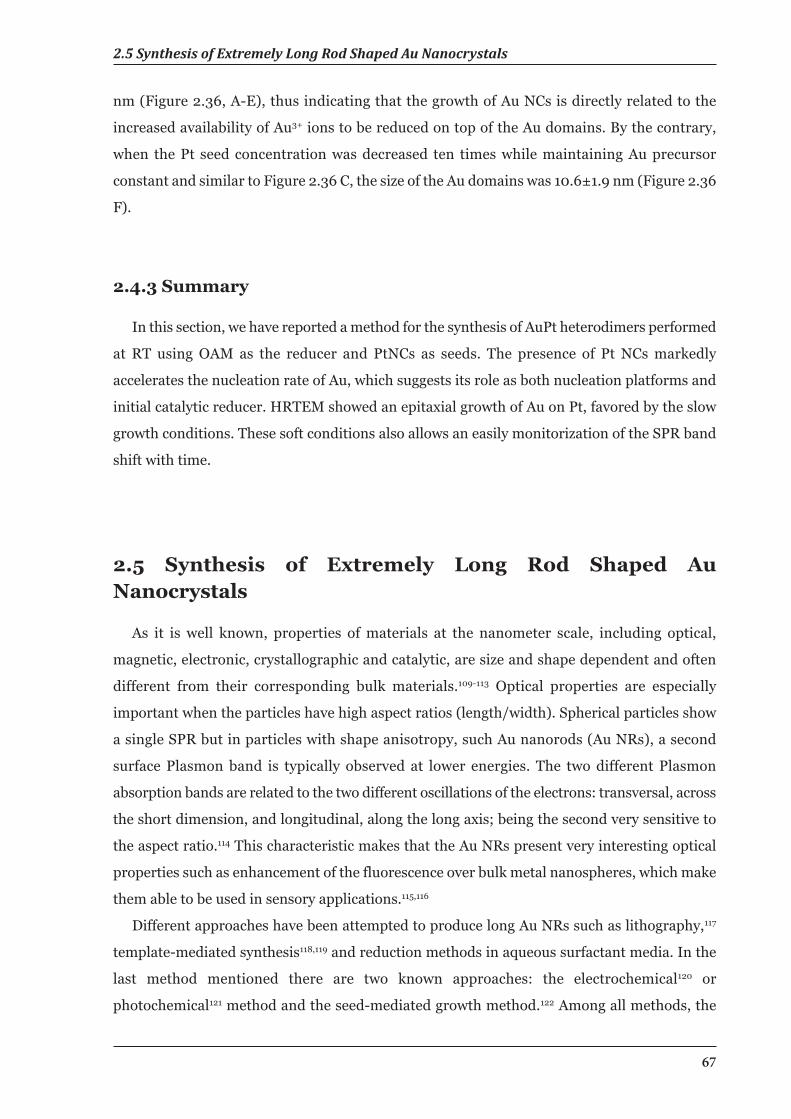
2.5 Synthesis of Extremely Long Rod Shaped Au Nanocrystals
67
nm (Figure 2.36, A-E), thus indicating that the growth of Au NCs is directly related to the
increased availability of Au3+ ions to be reduced on top of the Au domains. By the contrary,
when the Pt seed concentration was decreased ten times while maintaining Au precursor
constant and similar to Figure 2.36 C, the size of the Au domains was 10.6±1.9 nm (Figure 2.36
F).
2.4.3 Summary
In this section, we have reported a method for the synthesis of AuPt heterodimers performed
at RT using OAM as the reducer and PtNCs as seeds. The presence of Pt NCs markedly
accelerates the nucleation rate of Au, which suggests its role as both nucleation platforms and
initial catalytic reducer. HRTEM showed an epitaxial growth of Au on Pt, favored by the slow
growth conditions. These soft conditions also allows an easily monitorization of the SPR band
shift with time.
2.5 Synthesis of Extremely Long Rod Shaped AuNanocrystals
As it is well known, properties of materials at the nanometer scale, including optical,
magnetic, electronic, crystallographic and catalytic, are size and shape dependent and often
different from their corresponding bulk materials.109-113 Optical properties are especially
important when the particles have high aspect ratios (length/width). Spherical particles show
a single SPR but in particles with shape anisotropy, such Au nanorods (Au NRs), a second
surface Plasmon band is typically observed at lower energies. The two different Plasmon
absorption bands are related to the two different oscillations of the electrons: transversal, across
the short dimension, and longitudinal, along the long axis; being the second very sensitive to
the aspect ratio.114 This characteristic makes that the Au NRs present very interesting optical
properties such as enhancement of the fluorescence over bulk metal nanospheres, which make
them able to be used in sensory applications.115,116
Different approaches have been attempted to produce long Au NRs such as lithography,117
template-mediated synthesis118,119 and reduction methods in aqueous surfactant media. In the
last method mentioned there are two known approaches: the electrochemical120 or
photochemical121 method and the seed-mediated growth method.122 Among all methods, the
Chapter 2: Synthesis of Metallic and Bimetallic Nanoparticles
68
seed-mediated growth is one of the most commonly used, where previously synthesized small
particles (seeds) are used as nuclei for the anisotropic growth of the NRs. Moreover, the use of
cationic surfactant CTAB is a crucial parameter in the synthesis of Au NRs by a seed-mediated
growth method.
The growth mechanism of Au NRs remains a subject of debate, but all mechanisms are based
on the crystal growth inhibition, which is closely related to the crystalline structure and
thermodynamic stability of the different facets of the fcc structure of the metallic Au. CTAB is
used as a structural directing agent due to its preferential adsorption on the (100) surface.
Murphy and co-workers proposed the growth mechanism of Au NRs governed by preferential
adsorption of CTAB to different crystal faces during the growth in a bilayer conformation.123-125
Also they developed a rod synthesis where aspect ratio (AR) was controlled by varying the ratio
of seeds to the metal salt, and rods with AR between 2 and 18 can be synthesized by using this
three-step seed-mediated approach.122 Later on, it was discovered that with the addition of an
appropriate amount of nitric acid to the growth solution, and Au NRs with high AR (>20) can
be produced in a high yield.126,127 Huang et al. also discovered that rods growth was promoted
in acidic solutions, and they were able to increase the AR to over 200 with also decreasing the
amount of initial seeds.128 However, large amounts of Au precursor were needed to obtain long
rods, thus the reaction required to be multi-step to avoid new nucleation. In this section we
present a one-step synthesis, based in the seed-mediated growth method, which produces high
AR Au NRs at RT and using Pt seeds as nuclei.
2.5.1 Experimental
For instrumentation details of this section see Appendix A.5
2.5.1.1 Chemicals
Hydrogen tetrachloroaurate trihydrate (HAuCl4·3H2O), potassium tetrachloroplatinate(II)
(K2PtCl4), cetyl trimethylammonium bromide (CTAB) 95%, sodium citrate, sodium
borohydride (NaBH4) and ascorbic acid (AA) were purchased from Sigma-Aldrich and used as
received without further purification.
2.5.1.2 Synthesis of CTAB Stabilized Pt Seed Nanoparticles
The synthesis of Pt NPs stabilized in CTAB was carried out following the method described
by Grzelczak et al.129 A mixture of 9.63 mL of CTAB (0.1 M) with 50 µL of K2PtCl4 (0.05 M)
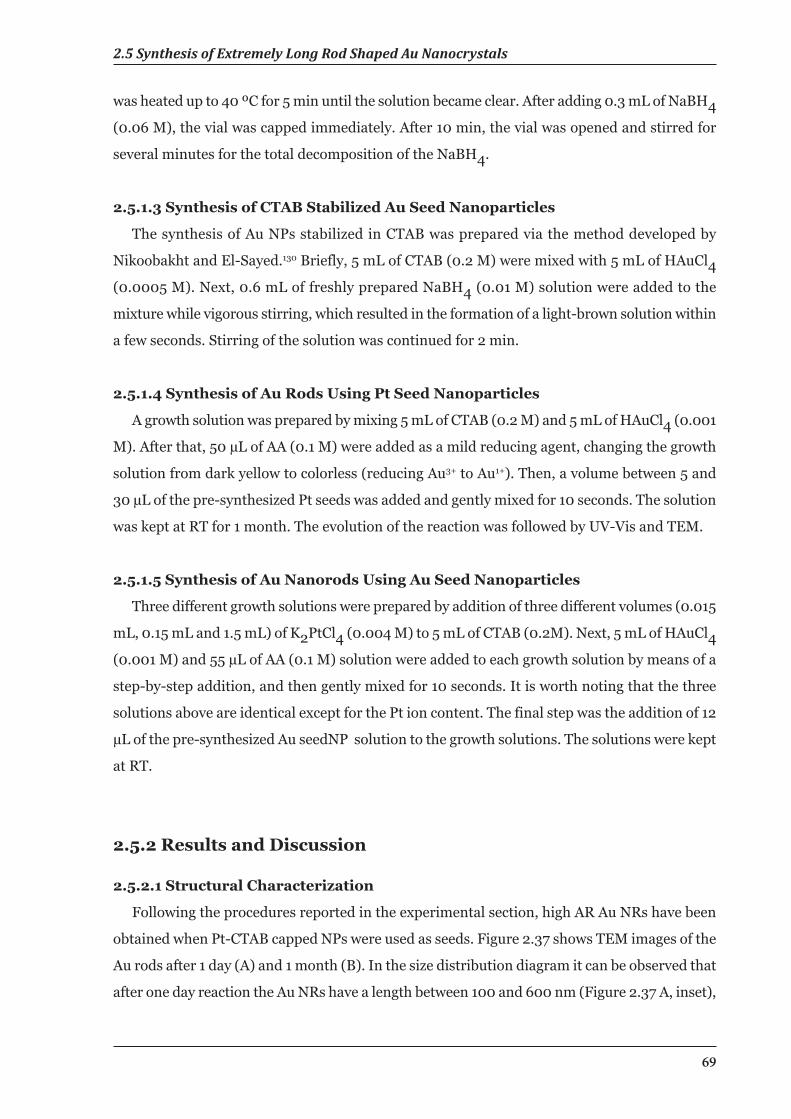
2.5 Synthesis of Extremely Long Rod Shaped Au Nanocrystals
69
was heated up to 40 ºC for 5 min until the solution became clear. After adding 0.3 mL of NaBH4(0.06 M), the vial was capped immediately. After 10 min, the vial was opened and stirred for
several minutes for the total decomposition of the NaBH4.
2.5.1.3 Synthesis of CTAB Stabilized Au Seed Nanoparticles
The synthesis of Au NPs stabilized in CTAB was prepared via the method developed by
Nikoobakht and El-Sayed.130 Briefly, 5 mL of CTAB (0.2 M) were mixed with 5 mL of HAuCl4(0.0005 M). Next, 0.6 mL of freshly prepared NaBH4 (0.01 M) solution were added to the
mixture while vigorous stirring, which resulted in the formation of a light-brown solution within
a few seconds. Stirring of the solution was continued for 2 min.
2.5.1.4 Synthesis of Au Rods Using Pt Seed Nanoparticles
A growth solution was prepared by mixing 5 mL of CTAB (0.2 M) and 5 mL of HAuCl4 (0.001
M). After that, 50 µL of AA (0.1 M) were added as a mild reducing agent, changing the growth
solution from dark yellow to colorless (reducing Au3+ to Au1+). Then, a volume between 5 and
30 µL of the pre-synthesized Pt seeds was added and gently mixed for 10 seconds. The solution
was kept at RT for 1 month. The evolution of the reaction was followed by UV-Vis and TEM.
2.5.1.5 Synthesis of Au Nanorods Using Au Seed Nanoparticles
Three different growth solutions were prepared by addition of three different volumes (0.015
mL, 0.15 mL and 1.5 mL) of K2PtCl4 (0.004 M) to 5 mL of CTAB (0.2M). Next, 5 mL of HAuCl4(0.001 M) and 55 µL of AA (0.1 M) solution were added to each growth solution by means of a
step-by-step addition, and then gently mixed for 10 seconds. It is worth noting that the three
solutions above are identical except for the Pt ion content. The final step was the addition of 12
µL of the pre-synthesized Au seedNP solution to the growth solutions. The solutions were kept
at RT.
2.5.2 Results and Discussion
2.5.2.1 Structural Characterization
Following the procedures reported in the experimental section, high AR Au NRs have been
obtained when Pt-CTAB capped NPs were used as seeds. Figure 2.37 shows TEM images of the
Au rods after 1 day (A) and 1 month (B). In the size distribution diagram it can be observed that
after one day reaction the Au NRs have a length between 100 and 600 nm (Figure 2.37 A, inset),
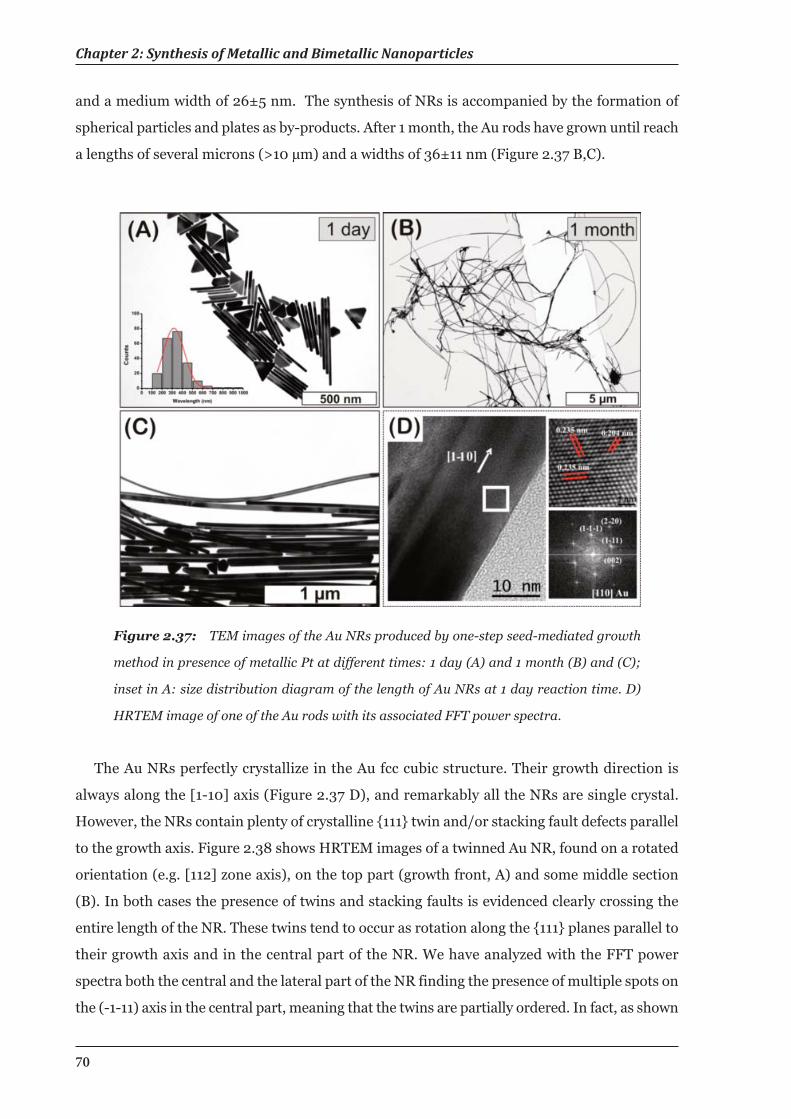
Chapter 2: Synthesis of Metallic and Bimetallic Nanoparticles
70
and a medium width of 26±5 nm. The synthesis of NRs is accompanied by the formation of
spherical particles and plates as by-products. After 1 month, the Au rods have grown until reach
a lengths of several microns (>10 µm) and a widths of 36±11 nm (Figure 2.37 B,C).
The Au NRs perfectly crystallize in the Au fcc cubic structure. Their growth direction is
always along the [1-10] axis (Figure 2.37 D), and remarkably all the NRs are single crystal.
However, the NRs contain plenty of crystalline {111} twin and/or stacking fault defects parallel
to the growth axis. Figure 2.38 shows HRTEM images of a twinned Au NR, found on a rotated
orientation (e.g. [112] zone axis), on the top part (growth front, A) and some middle section
(B). In both cases the presence of twins and stacking faults is evidenced clearly crossing the
entire length of the NR. These twins tend to occur as rotation along the {111} planes parallel to
their growth axis and in the central part of the NR. We have analyzed with the FFT power
spectra both the central and the lateral part of the NR finding the presence of multiple spots on
the (-1-11) axis in the central part, meaning that the twins are partially ordered. In fact, as shown
Figure 2.37: TEM images of the Au NRs produced by one-step seed-mediated growth
method in presence of metallic Pt at different times: 1 day (A) and 1 month (B) and (C);
inset in A: size distribution diagram of the length of Au NRs at 1 day reaction time. D)
HRTEM image of one of the Au rods with its associated FFT power spectra.
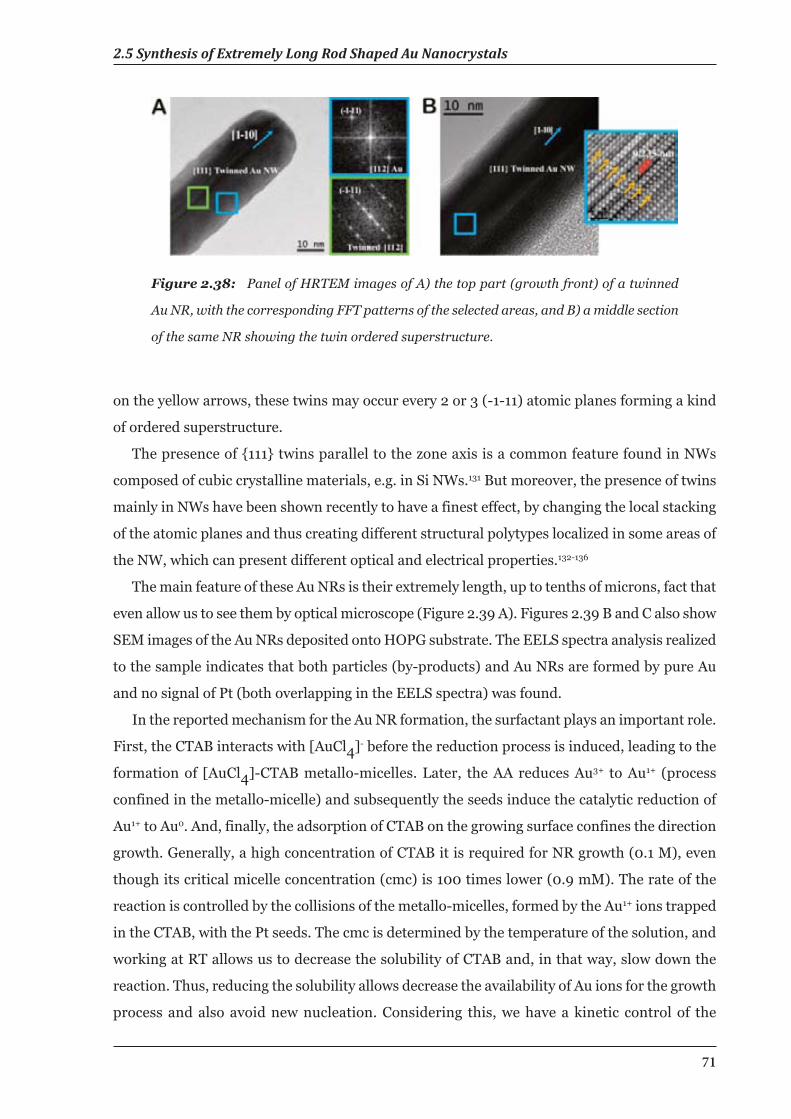
2.5 Synthesis of Extremely Long Rod Shaped Au Nanocrystals
71
on the yellow arrows, these twins may occur every 2 or 3 (-1-11) atomic planes forming a kind
of ordered superstructure.
The presence of {111} twins parallel to the zone axis is a common feature found in NWs
composed of cubic crystalline materials, e.g. in Si NWs.131 But moreover, the presence of twins
mainly in NWs have been shown recently to have a finest effect, by changing the local stacking
of the atomic planes and thus creating different structural polytypes localized in some areas of
the NW, which can present different optical and electrical properties.132-136
The main feature of these Au NRs is their extremely length, up to tenths of microns, fact that
even allow us to see them by optical microscope (Figure 2.39 A). Figures 2.39 B and C also show
SEM images of the Au NRs deposited onto HOPG substrate. The EELS spectra analysis realized
to the sample indicates that both particles (by-products) and Au NRs are formed by pure Au
and no signal of Pt (both overlapping in the EELS spectra) was found.
In the reported mechanism for the Au NR formation, the surfactant plays an important role.
First, the CTAB interacts with [AuCl4]- before the reduction process is induced, leading to the
formation of [AuCl4]-CTAB metallo-micelles. Later, the AA reduces Au3+ to Au1+ (process
confined in the metallo-micelle) and subsequently the seeds induce the catalytic reduction of
Au1+ to Au0. And, finally, the adsorption of CTAB on the growing surface confines the direction
growth. Generally, a high concentration of CTAB it is required for NR growth (0.1 M), even
though its critical micelle concentration (cmc) is 100 times lower (0.9 mM). The rate of the
reaction is controlled by the collisions of the metallo-micelles, formed by the Au1+ ions trapped
in the CTAB, with the Pt seeds. The cmc is determined by the temperature of the solution, and
working at RT allows us to decrease the solubility of CTAB and, in that way, slow down the
reaction. Thus, reducing the solubility allows decrease the availability of Au ions for the growth
process and also avoid new nucleation. Considering this, we have a kinetic control of the
Figure 2.38: Panel of HRTEM images of A) the top part (growth front) of a twinned
Au NR, with the corresponding FFT patterns of the selected areas, and B) a middle section
of the same NR showing the twin ordered superstructure.
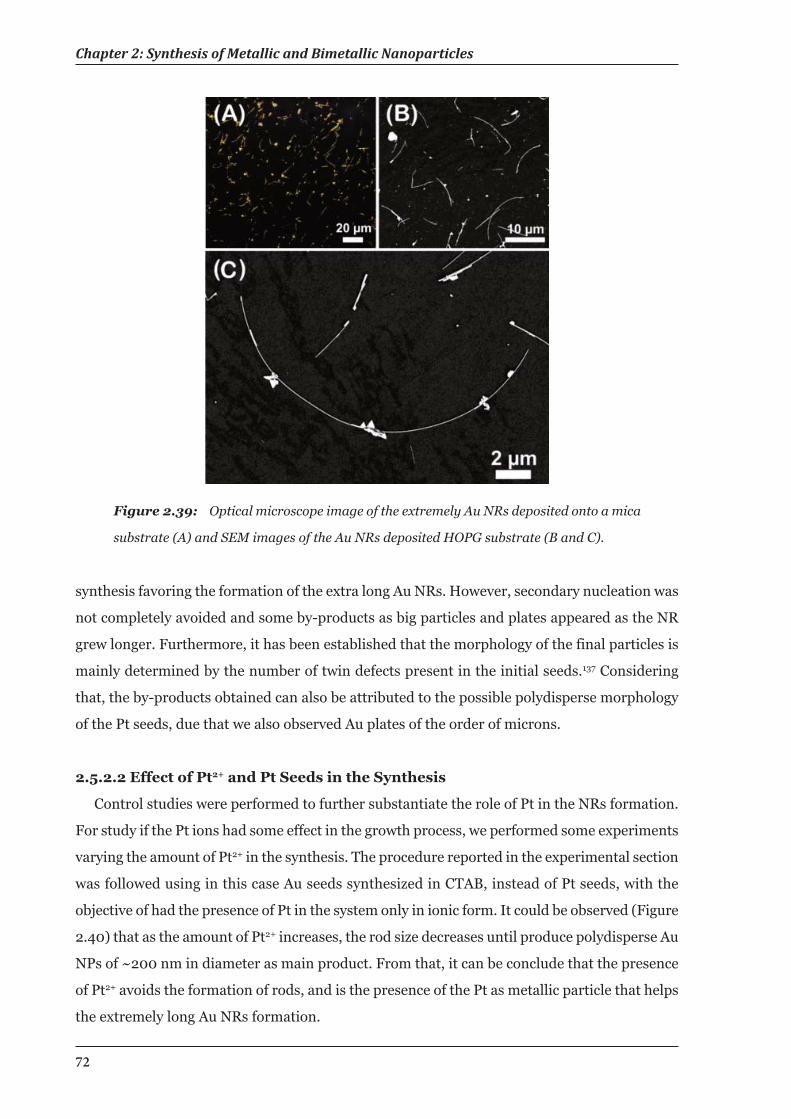
Chapter 2: Synthesis of Metallic and Bimetallic Nanoparticles
72
synthesis favoring the formation of the extra long Au NRs. However, secondary nucleation was
not completely avoided and some by-products as big particles and plates appeared as the NR
grew longer. Furthermore, it has been established that the morphology of the final particles is
mainly determined by the number of twin defects present in the initial seeds.137 Considering
that, the by-products obtained can also be attributed to the possible polydisperse morphology
of the Pt seeds, due that we also observed Au plates of the order of microns.
2.5.2.2 Effect of Pt2+ and Pt Seeds in the Synthesis
Control studies were performed to further substantiate the role of Pt in the NRs formation.
For study if the Pt ions had some effect in the growth process, we performed some experiments
varying the amount of Pt2+ in the synthesis. The procedure reported in the experimental section
was followed using in this case Au seeds synthesized in CTAB, instead of Pt seeds, with the
objective of had the presence of Pt in the system only in ionic form. It could be observed (Figure
2.40) that as the amount of Pt2+ increases, the rod size decreases until produce polydisperse Au
NPs of ~200 nm in diameter as main product. From that, it can be conclude that the presence
of Pt2+ avoids the formation of rods, and is the presence of the Pt as metallic particle that helps
the extremely long Au NRs formation.
Figure 2.39: Optical microscope image of the extremely Au NRs deposited onto a mica
substrate (A) and SEM images of the Au NRs deposited HOPG substrate (B and C).
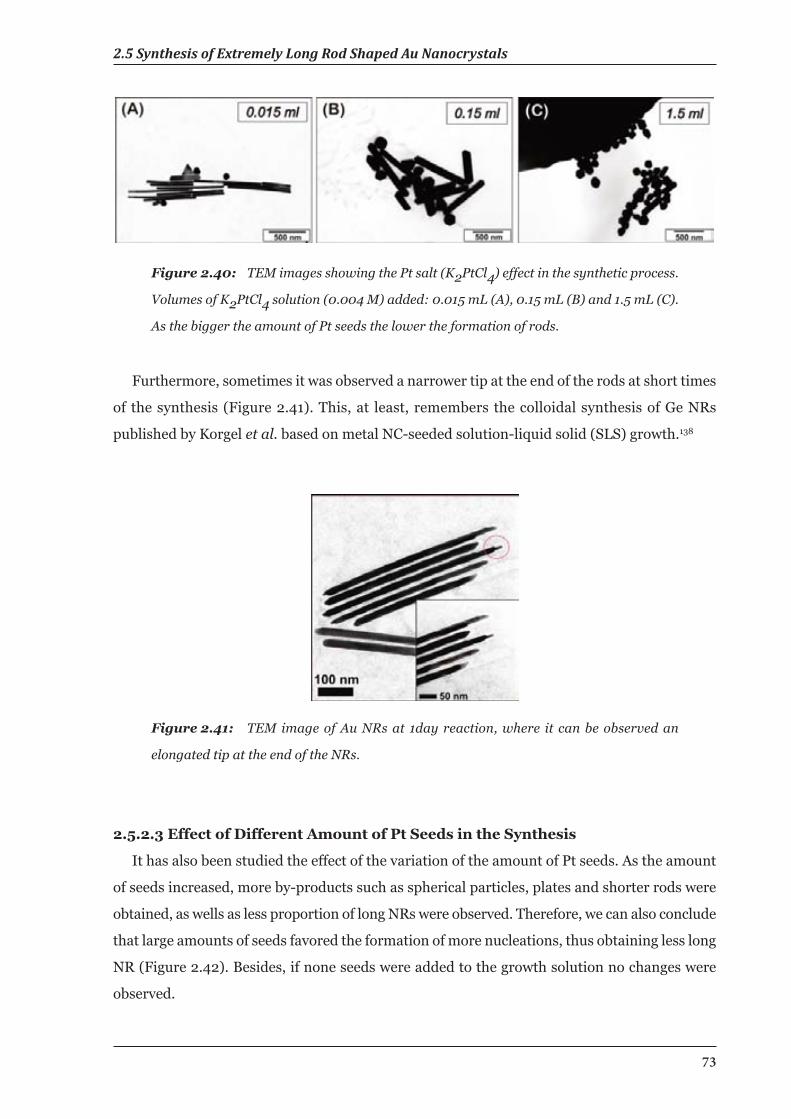
2.5 Synthesis of Extremely Long Rod Shaped Au Nanocrystals
73
Figure 2.40: TEM images showing the Pt salt (K2PtCl4) effect in the synthetic process.
Volumes of K2PtCl4 solution (0.004 M) added: 0.015 mL (A), 0.15 mL (B) and 1.5 mL (C).
As the bigger the amount of Pt seeds the lower the formation of rods.
Figure 2.41: TEM image of Au NRs at 1day reaction, where it can be observed an
elongated tip at the end of the NRs.
Furthermore, sometimes it was observed a narrower tip at the end of the rods at short times
of the synthesis (Figure 2.41). This, at least, remembers the colloidal synthesis of Ge NRs
published by Korgel et al. based on metal NC-seeded solution-liquid solid (SLS) growth.138
2.5.2.3 Effect of Different Amount of Pt Seeds in the Synthesis
It has also been studied the effect of the variation of the amount of Pt seeds. As the amount
of seeds increased, more by-products such as spherical particles, plates and shorter rods were
obtained, as wells as less proportion of long NRs were observed. Therefore, we can also conclude
that large amounts of seeds favored the formation of more nucleations, thus obtaining less long
NR (Figure 2.42). Besides, if none seeds were added to the growth solution no changes were
observed.
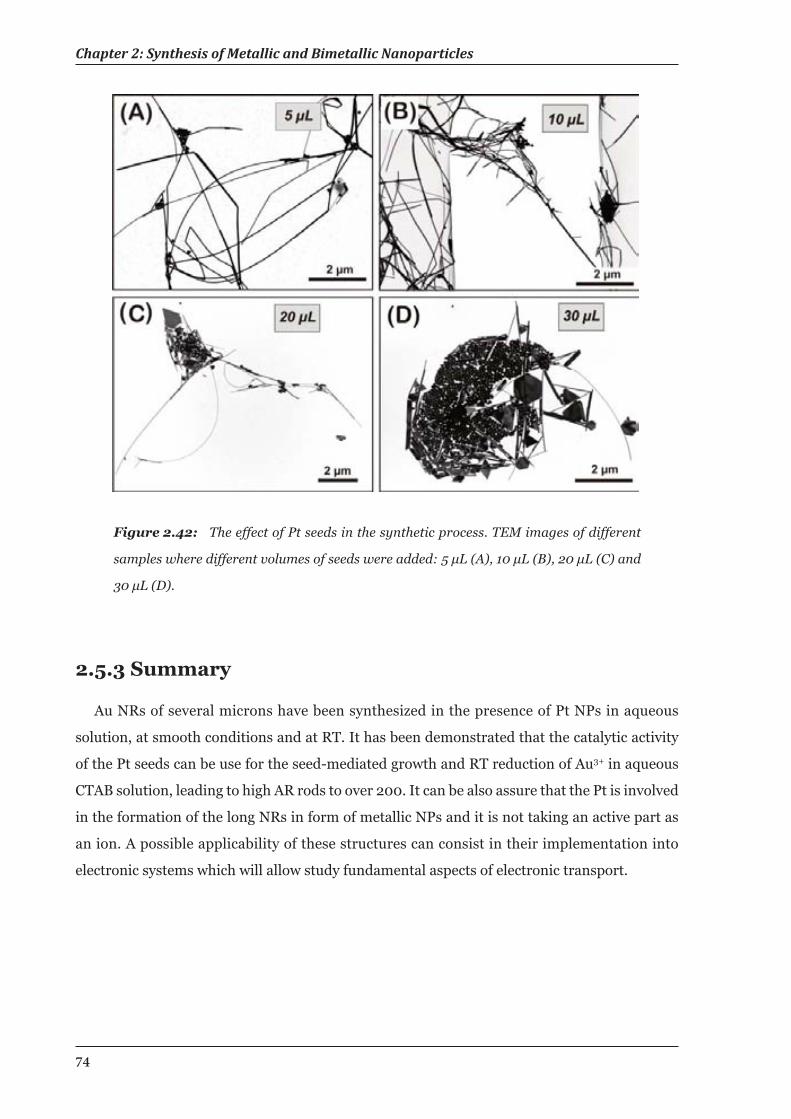
Chapter 2: Synthesis of Metallic and Bimetallic Nanoparticles
74
2.5.3 Summary
Au NRs of several microns have been synthesized in the presence of Pt NPs in aqueous
solution, at smooth conditions and at RT. It has been demonstrated that the catalytic activity
of the Pt seeds can be use for the seed-mediated growth and RT reduction of Au3+ in aqueous
CTAB solution, leading to high AR rods to over 200. It can be also assure that the Pt is involved
in the formation of the long NRs in form of metallic NPs and it is not taking an active part as
an ion. A possible applicability of these structures can consist in their implementation into
electronic systems which will allow study fundamental aspects of electronic transport.
Figure 2.42: The effect of Pt seeds in the synthetic process. TEM images of different
samples where different volumes of seeds were added: 5 μL (A), 10 μL (B), 20 μL (C) and
30 μL (D).
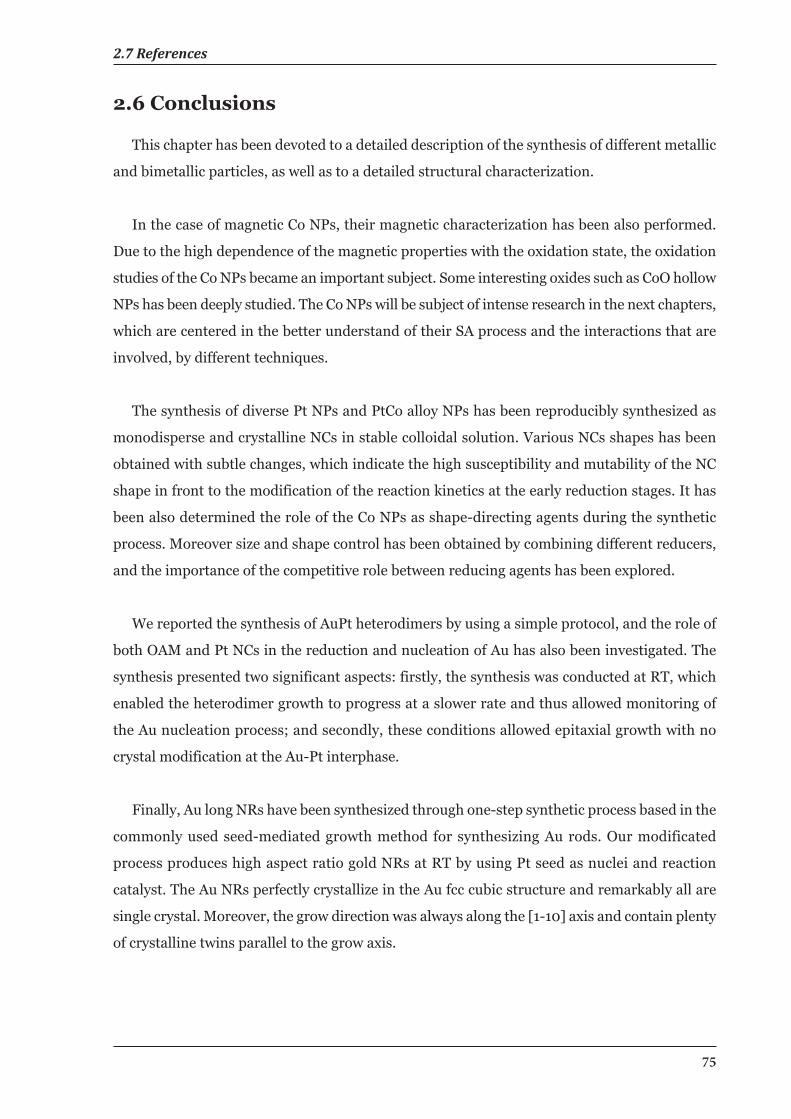
2.7 References
75
2.6 Conclusions
This chapter has been devoted to a detailed description of the synthesis of different metallic
and bimetallic particles, as well as to a detailed structural characterization.
In the case of magnetic Co NPs, their magnetic characterization has been also performed.
Due to the high dependence of the magnetic properties with the oxidation state, the oxidation
studies of the Co NPs became an important subject. Some interesting oxides such as CoO hollow
NPs has been deeply studied. The Co NPs will be subject of intense research in the next chapters,
which are centered in the better understand of their SA process and the interactions that are
involved, by different techniques.
The synthesis of diverse Pt NPs and PtCo alloy NPs has been reproducibly synthesized as
monodisperse and crystalline NCs in stable colloidal solution. Various NCs shapes has been
obtained with subtle changes, which indicate the high susceptibility and mutability of the NC
shape in front to the modification of the reaction kinetics at the early reduction stages. It has
been also determined the role of the Co NPs as shape-directing agents during the synthetic
process. Moreover size and shape control has been obtained by combining different reducers,
and the importance of the competitive role between reducing agents has been explored.
We reported the synthesis of AuPt heterodimers by using a simple protocol, and the role of
both OAM and Pt NCs in the reduction and nucleation of Au has also been investigated. The
synthesis presented two significant aspects: firstly, the synthesis was conducted at RT, which
enabled the heterodimer growth to progress at a slower rate and thus allowed monitoring of
the Au nucleation process; and secondly, these conditions allowed epitaxial growth with no
crystal modification at the Au-Pt interphase.
Finally, Au long NRs have been synthesized through one-step synthetic process based in the
commonly used seed-mediated growth method for synthesizing Au rods. Our modificated
process produces high aspect ratio gold NRs at RT by using Pt seed as nuclei and reaction
catalyst. The Au NRs perfectly crystallize in the Au fcc cubic structure and remarkably all are
single crystal. Moreover, the grow direction was always along the [1-10] axis and contain plenty
of crystalline twins parallel to the grow axis.
Chapter 2: Synthesis of Metallic and Bimetallic Nanoparticles
76
2.7 References
1. Alivisatos, A. P. "Nanocrystals: Building Blocks for Modern Materials Design".
Endeavour 1997, 21, 56-60.
2. El-Sayed, M. A. "Small Is Different: Shape-, Size-, and Composition-Dependent
Properties of Some Colloidal Semiconductor Nanocrystals". Accounts of Chemical Research
2004, 37, 326-333.
3. Yin, Y.; Alivisatos, A. P. "Colloidal Nanocrystal Synthesis and the Organic-Inorganic
Interface". Nature 2005, 437, 664-670.
4. Sun, S. H.; Murray, C. B. "Synthesis of Monodisperse Cobalt Nanocrystals and Their
Assembly into Magnetic Superlattices (Invited)". Journal of Applied Physics 1999, 85,
4325-4330.
5. Peng, X.; Manna, L.; Yang, W.; Wickham, J.; Scher, E.; Kadavanich, A.; Alivisatos, A. P.
"Shape Control of Cdse Nanocrystals". Nature 2000, 404, 59-61.
6. Jana, N. R.; Gearheart, L.; Murphy, C. J. "Seeding Growth for Size Control of 5−40 Nm
Diameter Gold Nanoparticles". Langmuir 2001, 17, 6782-6786.
7. Puntes, V. F.; Krishnan, K. M.; Alivisatos, A. P. "Colloidal Nanocrystal Shape and Size
Control: The Case of Cobalt". Science 2001, 291, 2115-2117.
8. Black, C. T.; Murray, C. B.; Sandstrom, R. L.; Sun, S. "Spin-Dependent Tunneling in
Self-Assembled Cobalt-Nanocrystal Superlattices". Science 2000, 290, 1131-1134.
9. Sun, S.; Murray, C. B.; Weller, D.; Folks, L.; Moser, A. "Monodisperse FePt
Nanoparticles and Ferromagnetic Fept Nanocrystal Superlattices". Science 2000, 287,
1989-1992.
10.Pankhurst, Q. A.; Connolly, J.; Jones, S. K.; Dobson, J. "Applications of Magnetic
Nanoparticles in Biomedicine". Journal of Physics D-Applied Physics 2003, 36, R167-R181.
11. Dobson, J. "Magnetic Nanoparticles for Drug Delivery". Drug Development Research
2006, 67, 55-60.
12. Goldman, A. Handbook of Modern Ferromagnetic Materials (the Springer International
Series in Engineering and Computer Science); Springer, 1999.
2.7 References
77
13. Dinega, D. P.; Bawendi, M. G. "A Solution-Phase Chemical Approach to a New Crystal
Structure of Cobalt". Angewandte Chemie International Edition 1999, 38, 1788-1791.
14. Puntes, V. F.; Krishnan, K. M.; Alivisatos, P. "Synthesis, Self-Assembly, and Magnetic
Behavior of a Two-Dimensional Superlattice of Single-Crystal Epsilon-Co Nanoparticles".
Applied Physics Letters 2001, 78, 2187-2189.
15. S, R. "Allotropic Phase Transformations in Hcp, Fcc and Bcc Metastable Structures in
Co-Nanoparticles". Materials Science and Engineering: A 2001, 304-306, 923-927.
16. Son, S. U.; Lee, S. I.; Chung, Y. K.; Kim, S.-W.; Hyeon, T. "The First Intramolecular
Pauson−Khand Reaction in Water Using Aqueous Colloidal Cobalt Nanoparticles as
Catalysts". Organic Letters 2001, 4, 277-279.
17. Gubin, S. P.; Koksharov, Y. A. "Preparation, Structure, and Properties of Magnetic
Materials Based on Co-Containing Nanoparticles". Inorganic Materials 2002, 38, 1085-
1099.
18. Petit, C.; Pileni, M. P. "Nanosize Cobalt Boride Particles: Control of the Size and
Properties". Journal of Magnetism and Magnetic Materials 1997, 166, 82-90.
19. Guo, F.; Zheng, H. G.; Yang, Z. P.; Qian, Y. T. "Synthesis of Cobalt Nanoparticles in
Ethanol Hydrazine Alkaline System (Ehas) at Room Temperature". Materials Letters 2002,
56, 906-909.
20. Lisiecki, I.; Pileni, M. P. "Synthesis of Well-Defined and Low Size Distribution Cobalt
Nanocrystals: The Limited Influence of Reverse Micelles". Langmuir 2003, 19, 9486-9489.
21. Puntes, V. F.; Zanchet, D.; Erdonmez, C. K.; Alivisatos, A. P. "Synthesis of Hcp-Co
Nanodisks". Journal of the American Chemical Society 2002, 124, 12874-12880.
22.https://docs.google.com/Doc?docid=0AYx6u-
E8P2NUZDJkOTg2c18xZm41a2YzZjk&hl=en&pli=1
23.Bastús, N. G.; Casals, E.; Vazquez-Campos, S.; Puntes, V. "Reactivity of Engineered
Inorganic Nanoparticles and Carbon Nanostructures in Biological Media." Nanotoxicology
2008, 2(3), 99-112.
24.Son, S. U.; Lee, S. I.; Chung, Y. K.; Kim, S. W.; Hyeon, T. "The First Intramolecular
Pauson-Khand Reaction in Water Using Aqueous Colloidal Cobalt Nanoparticles as
Chapter 2: Synthesis of Metallic and Bimetallic Nanoparticles
78
Catalysts". Organic Letters 2002, 4, 277-279.
25.Skumryev, V.; Stoyanov, S.; Zhang, Y.; Hadjipanayis, G.; Givord, D.; Nogues, J. "Beating
the Superparamagnetic Limit with Exchange Bias". Nature 2003, 423, 850-853.
26.Tracy, J. B.; Weiss, D. N.; Dinega, D. P.; Bawendi, M. G. "Exchange Biasing and
Magnetic Properties of Partially and Fully Oxidized Colloidal Cobalt Nanoparticles".
Physical Review B 2005, 72.
27. Braidy, N.; Behal, S.; Adronov, A.; Botton, G. A. "Investigation of the Oxide Shell
Forming on ε-Co Nanocrystals". Micron 2008, 39, 717-722.
28.Wiedwald, U.; Lindner, J.; Spasova, M.; Frait, Z.; Farle, M. "Effect of an Oxidic Overlayer
on the Magnetism of Co Nanoparticles". Phase Transitions 2005, 78, 85-104.
29.Kim, S. W.; Kim, M.; Lee, W. Y.; Hyeon, T. "Fabrication of Hollow Palladium Spheres
and Their Successful Application to the Recyclable Heterogeneous Catalyst for Suzuki
Coupling Reactions". Journal of the American Chemical Society 2002, 124, 7642-7643.
30. Oldenburg, S. J.; Averitt, R. D.; Westcott, S. L.; Halas, N. J. "Nanoengineering of Optical
Resonances". Chemical Physics Letters 1998, 288, 243-247.
31. Marinakos, S. M.; Novak, J. P.; Brousseau, L. C.; House, A. B.; Edeki, E. M.; Feldhaus,
J. C.; Feldheim, D. L. "Gold Particles as Templates for the Synthesis of Hollow Polymer
Capsules. Control of Capsule Dimensions and Guest Encapsulation". Journal of the
American Chemical Society 1999, 121, 8518-8522.
32.Caruso, F.; Caruso, R. A.; Mohwald, H. "Nanoengineering of Inorganic and Hybrid
Hollow Spheres by Colloidal Templating". Science 1998, 282, 1111-1114.
33.Im, S. H.; Jeong, U. Y.; Xia, Y. N. "Polymer Hollow Particles with Controllable Holes in
Their Surfaces". Nature Materials 2005, 4, 671-675.
34.Erlebacher, J.; Aziz, M. J.; Karma, A.; Dimitrov, N.; Sieradzki, K. "Evolution of
Nanoporosity in Dealloying". Nature 2001, 410, 450-453.
35.Yoon, S. B.; Sohn, K.; Kim, J. Y.; Shin, C. H.; Yu, J. S.; Hyeon, T. "Fabrication of Carbon
Capsules with Hollow Macroporous Core/Mesoporous Shell Structures". Advanced
Materials 2002, 14, 19-21.
36.Henkes, A. E.; Vasquez, Y.; Schaak, R. E. "Converting Metals into Phosphides: A General
2.7 References
79
Strategy for the Synthesis of Metal Phosphide Nanocrystals". Journal of the American
Chemical Society 2007, 129, 1896.
37. Peng, S.; Sun, S. H. "Synthesis and Characterization of Monodisperse Hollow Fe3o4
Nanoparticles". Angewandte Chemie-International Edition 2007, 46, 4155-4158.
38.Sun, Y. G.; Mayers, B.; Xia, Y. N. "Metal Nanostructures with Hollow Interiors".
Advanced Materials 2003, 15, 641-646.
39.Vasquez, Y.; Sra, A. K.; Schaak, R. E. "One-Pot Synthesis of Hollow Superparamagnetic
Copt Nanospheres". Journal of the American Chemical Society 2005, 127, 12504-12505.
40. Fan, H. J.; Gosele, U.; Zacharias, M. "Formation of Nanotubes and Hollow
Nanoparticles Based on Kirkendall and Diffusion Processes: A Review". Small 2007, 3,
1660-1671.
41. Yin, Y. D.; Rioux, R. M.; Erdonmez, C. K.; Hughes, S.; Somorjai, G. A.; Alivisatos, A. P.
"Formation of Hollow Nanocrystals through the Nanoscale Kirkendall Effect". Science
2004, 304, 711-714.
42.Smigelskas, A. D.; Kirkendall, E. O. "Zinc Diffusion in Alpha-Brass". Transactions of
the American Institute of Mining and Metallurgical Engineers 1947, 171, 130-142.
43.Mourdikoudis, S.; Simeonidis, K.; Tsiaoussis, I.; Dendrinou-Samara, C.; Angelakeris,
M.; Kalogirou, O. "Impact of Synthesis Parameters on Structural and Magnetic
Characteristics of Co-Based Nanoparticles". Journal of Nanoparticle Research 2009, 11,
1477-1484.
44.Cabot, A.; Puntes, V. F.; Shevchenko, E.; Yin, Y.; Balcells, L.; Marcus, M. A.; Hughes, S.
M.; Alivisatos, A. P. "Vacancy Coalescence During Oxidation of Iron Nanoparticles". Journal
of the American Chemical Society 2007, 129, 10358.
45.Rizzo, A.; Nobile, C.; Mazzeo, M.; De Giorgi, M.; Fiore, A.; Carbone, L.; Cingolani, R.;
Manna, L.; Gigli, G. "Polarized Light Emitting Diode by Long-Range Nanorod Self-
Assembling on a Water Surface". ACS Nano 2009, 3, 1506-1512.
46.Lima, E.; Vargas, J. M.; Zysler, R. D.; Rechenberg, H. R.; Cohen, R.; Arbiol, J.; Goya, G.
F.; Ibarra, A.; Ibarra, M. R. "Single-Step Chemical Synthesis of Ferrite Hollow
Nanospheres". Nanotechnology 2009, 20.
Chapter 2: Synthesis of Metallic and Bimetallic Nanoparticles
80
47.Dormann, J. L.; Fiorani, D.; Tronc, E. Magnetic Relaxation in Fine-Particle Systems. In
Advances in Chemical Physics, Vol 98; Prigogine, I., Rice, S. A., Eds., 1997; pp 283-494.
48. Bao, Y. P.; Beerman, M.; Pakhomov, A. B.; Krishnan, K. M. "Controlled Crystalline
Structure and Surface Stability of Cobalt Nanocrystals". Journal of Physical Chemistry B
2005, 109, 7220-7222.
49.Cabot, A.; Alivisatos, A. P.; Puntes, V. F.; Balcells, L.; Iglesias, O.; Labarta, A. "Magnetic
Domains and Surface Effects in Hollow Maghemite Nanoparticles". Physical Review B
2009, 79.
50.Yoshikawa, H.; Hayashida, K.; Kozuka, Y.; Horiguchi, A.; Awaga, K.; Bandow, S.; Iijima,
S. "Preparation and Magnetic Properties of Hollow Nano-Spheres of Cobalt and Cobalt
Oxide: Drastic Cooling-Field Effects on Remnant Magnetization of Antiferromagnet".
Applied Physics Letters 2004, 85, 5287-5289.
51. Cabot, A.; Alivisatos, A. P.; Puntes, V. F.; Balcells, L.; Iglesias, O.; Labarta, A. "Magnetic
Domains and Surface Effects in Hollow Maghemite Nanoparticles". Physical Review B
2009, 79, 7.
52.Cabot, A.; Smith, R. K.; Yin, Y.; Zheng, H.; Reinhard, B. r. M.; Liu, H.; Alivisatos, A. P.
"Sulfidation of Cadmium at the Nanoscale". ACS Nano 2008, 2, 1452-1458.
53.Das, D.; Chatterjee, P. P.; Manna, I.; Pabi, S. K. "A Measure of Enhanced Diffusion
Kinetics in Mechanical Alloying of Cu-18 At.% Al by Planetary Ball Milling". Scripta
Materialia 1999, 41, 861-866.
54.Guisbiers, G.; Buchaillot, L. "Size and Shape Effects on Creep and Diffusion at the
Nanoscale". Nanotechnology 2008, 19.
55.Li, Y.; Somorjai, G. A. "Nanoscale Advances in Catalysis and Energy Applications". Nano
Letters 2010, 10, 2289-2295.
56.Subhramannia, M.; Pillai, V. K. "Shape-Dependent Electrocatalytic Activity of Platinum
Nanostructures". Journal of Materials Chemistry 2008, 18, 5858-5870.
57. Tian, N.; Zhou, Z.-Y.; Sun, S.-G. "Platinum Metal Catalysts of High-Index Surfaces:
From Single-Crystal Planes to Electrochemically Shape-Controlled Nanoparticles". Journal
of Physical Chemistry C 2008, 112, 19801-19817.
2.7 References
81
58.Xia, Y.; Xiong, Y.; Lim, B.; Skrabalak, S. E. "Shape-Controlled Synthesis of Metal
Nanocrystals: Simple Chemistry Meets Complex Physics?". Angewandte Chemie-
International Edition 2009, 48, 60-103.
59.Rampino, L. D.; Nord, F. F. "Preparation of Palladium and Platinum Synthetic High
Polymer Catalysts and the Relationship between Particle Size and Rate of Hydrogenation".
Journal of the American Chemical Society 1941, 63, 2745-2749.
60. Ahmadi, T. S.; Wang, Z. L.; Green, T. C.; Henglein, A.; ElSayed, M. A. "Shape-Controlled
Synthesis of Colloidal Platinum Nanoparticles". Science 1996, 272, 1924-1926.
61. Zhu, J.; Konya, Z.; Puntes, V. F.; Kiricsi, I.; Miao, C. X.; Ager, J. W.; Alivisatos, A. P.;
Somorjai, G. A. "Encapsulation of Metal (Au, Ag, Pt) Nanoparticles into the Mesoporous
Sba-15 Structure". Langmuir 2003, 19, 4396-4401.
62.Chen, J. Y.; Herricks, T.; Xia, Y. N. "Polyol Synthesis of Platinum Nanostructures:
Control of Morphology through the Manipulation of Reduction Kinetics". Angewandte
Chemie-International Edition 2005, 44, 2589-2592.
63.Herricks, T.; Chen, J. Y.; Xia, Y. N. "Polyol Synthesis of Platinum Nanoparticles: Control
of Morphology with Sodium Nitrate". Nano Letters 2004, 4, 2367-2371.
64.Demortiere, A.; Launois, P.; Goubet, N.; Albouy, P. A.; Petit, C. "Shape-Controlled
Platinum Nanocubes and Their Assembly into Two-Dimensional and Three-Dimensional
Superlattices". Journal of Physical Chemistry B 2008, 112, 14583-14592.
65.Mahmoud, M. A.; Tabor, C. E.; El-Sayed, M. A.; Ding, Y.; Wang, Z. L. "A New
Catalytically Active Colloidal Platinum Nanocatalyst: The Multiarmed Nanostar Single
Crystal". Journal of the American Chemical Society 2008, 130, 4590-+.
66.Ren, J.; Tilley, R. D. "Shape-Controtled Growth of Platinum Nanoparticles". Small
2007, 3, 1508-1512.
67.Ren, J.; Tilley, R. D. "Preparation, Self-Assembly, and Mechanistic Study of Highly
Monodispersed Nanocubes". Journal of the American Chemical Society 2007, 129, 3287-
3291.
68. Song, H.; Kim, F.; Connor, S.; Somorjai, G. A.; Yang, P. D. "Pt Nanocrystals: Shape
Control and Langmuir-Blodgett Monolayer Formation". Journal of Physical Chemistry B
2005, 109, 188-193.
Chapter 2: Synthesis of Metallic and Bimetallic Nanoparticles
82
69.Teng, X. W.; Yang, H. "Synthesis of Platinum Multipods: An Induced Anisotropic
Growth". Nano Letters 2005, 5, 885-891.
70.Tian, N.; Zhou, Z.-Y.; Sun, S.-G.; Ding, Y.; Wang, Z. L. "Synthesis of Tetrahexahedral
Platinum Nanocrystals with High-Index Facets and High Electro-Oxidation Activity".
Science 2007, 316, 732-735.
71. Tsung, C.-K.; Kuhn, J. N.; Huang, W.; Aliaga, C.; Hung, L.-I.; Somorjai, G. A.; Yang, P.
"Sub-10 Nm Platinum Nanocrystals with Size and Shape Control: Catalytic Study for
Ethylene and Pyrrole Hydrogenation". Journal of the American Chemical Society 2009,
131, 5816-5822.
72. Hiramatsu, H.; Osterloh, F. E. "A Simple Large-Scale Synthesis of Nearly Monodisperse
Gold and Silver Nanoparticles with Adjustable Sizes and with Exchangeable Surfactants".
Chemistry of Materials 2004, 16, 2509-2511.
73. Maheshwari, V.; Kane, J.; Saraf, R. F. "Self-Assembly of a Micrometers-Long One-
Dimensional Network of Cemented Au Nanoparticles". Advanced Materials 2008, 20, 284.
74.Pong, B.-K.; Elim, H. I.; Chong, J.-X.; Ji, W.; Trout, B. L.; Lee, J.-Y. "New Insights on
the Nanoparticle Growth Mechanism in the Citrate Reduction of Gold(Iii) Salt: Formation
of the Au Nanowire Intermediate and Its Nonlinear Optical Properties". Journal of Physical
Chemistry C 2007, 111, 6281-6287.
75. Banfield, J. F.; Welch, S. A.; Zhang, H. Z.; Ebert, T. T.; Penn, R. L. "Aggregation-Based
Crystal Growth and Microstructure Development in Natural Iron Oxyhydroxide
Biomineralization Products". Science 2000, 289, 751-754.
76.Cho, K. S.; Talapin, D. V.; Gaschler, W.; Murray, C. B. "Designing Pbse Nanowires and
Nanorings through Oriented Attachment of Nanoparticles". Journal of the American
Chemical Society 2005, 127, 7140-7147.
77. Zheng, H.; Smith, R. K.; Jun, Y.-w.; Kisielowski, C.; Dahmen, U.; Alivisatos, A. P.
"Observation of Single Colloidal Platinum Nanocrystal Growth Trajectories". Science 2009,
324, 1309-1312.
78.Wang, C.; Daimon, H.; Lee, Y.; Kim, J.; Sun, S. "Synthesis of Monodisperse Pt
Nanocubes and Their Enhanced Catalysis for Oxygen Reduction". Journal of the American
Chemical Society 2007, 129, 6974.
2.7 References
83
79.Chen, J.; Lim, B.; Lee, E. P.; Xia, Y. "Shape-Controlled Synthesis of Platinum
Nanocrystals for Catalytic and Electrocatalytic Applications". Nano Today 2009, 4, 81-95.
80. http://database.iem.ac.ru/mincryst/.
81. Denton, A. R.; Ashcroft, N. W. "Vegard Law". Physical Review A 1991, 43, 3161-3164.
82.Paulus, U. A.; Wokaun, A.; Scherer, G. G.; Schmidt, T. J.; Stamenkovic, V.; Radmilovic,
V.; Markovic, N. M.; Ross, P. N. "Oxygen Reduction on Carbon-Supported Pt-Ni and Pt-Co
Alloy Catalysts". Journal of Physical Chemistry B 2002, 106, 4181-4191.
83. Lim, S. I.; Ojea-Jimenez, I.; Varon, M.; Casals, E.; Arbiol, J.; Puntes, V. "Synthesis of
Platinum Cubes, Polypods, Cuboctahedrons, and Raspberries Assisted by Cobalt
Nanocrystals". Nano Letters 2010, 10, 964-973.
84. Zhang, J.; Yang, H.; Fang, J.; Zou, S. "Synthesis and Oxygen Reduction Activity of
Shape-Controlled Pt3ni Nanopolyhedra". Nano Letters 2010, 10, 638-644.
85.Jana, N. R.; Peng, X. G. "Single-Phase and Gram-Scale Routes toward Nearly
Monodisperse Au and Other Noble Metal Nanocrystals". Journal of the American Chemical
Society 2003, 125, 14280-14281.
86. Schadt, M. J.; Cheung, W.; Luo, J.; Zhong, C.-J. "Molecularly Tuned Size Selectivity in
Thermal Processing of Gold Nanoparticles". Chemistry of Materials 2006, 18, 5147-5149.
87.Zheng, N.; Fan, J.; Stucky, G. D. "One-Step One-Phase Synthesis of Monodisperse
Noble-Metallic Nanoparticles and Their Colloidal Crystals". Journal of the American
Chemical Society 2006, 128, 6550-6551.
88. F.Cotton; Wilkinson, G. Advanced Inorganic Chemistry; 4th ed.: New York, 1980.
89. Mott, D.; Galkowski, J.; Wang, L.; Luo, J.; Zhong, C.-J. "Synthesis of Size-Controlled
and Shaped Copper Nanoparticles". Langmuir 2007, 23, 5740-5745.
90. Sun, S. H.; Zeng, H. "Size-Controlled Synthesis of Magnetite Nanoparticles". Journal
of the American Chemical Society 2002, 124, 8204-8205.
91. Carbone, L.; Cozzoli, P. D. "Colloidal Heterostructured Nanocrystals: Synthesis and
Growth Mechanisms". Nano Today 2010, 5, 449-493.
92.Hao, R.; Xing, R.; Xu, Z.; Hou, Y.; Gao, S.; Sun, S. "Synthesis, Functionalization, and
Chapter 2: Synthesis of Metallic and Bimetallic Nanoparticles
84
Biomedical Applications of Multifunctional Magnetic Nanoparticles". Advanced Materials
2010, 22, 2729-2742.
93.Cao, Y. W.; Banin, U. "Growth and Properties of Semiconductor Core/Shell Nanocrystals
with Inas Cores". Journal of the American Chemical Society 2000, 122, 9692-9702.
94.Camargo, P. H. C.; Xiong, Y.; Ji, L.; Zuo, J. M.; Xia, Y. "Facile Synthesis of Tadpole-Like
Nanostructures Consisting of Au Heads and Pd Tails". Journal of the American Chemical
Society 2007, 129, 15452.
95. Habas, S. E.; Lee, H.; Radmilovic, V.; Somorjai, G. A.; Yang, P. "Shaping Binary Metal
Nanocrystals through Epitaxial Seeded Growth". Nature Materials 2007, 6, 692-697.
96.Wang, C.; Tian, W.; Ding, Y.; Ma, Y.-q.; Wang, Z. L.; Markovic, N. M.; Stamenkovic, V.
R.; Daimon, H.; Sun, S. "Rational Synthesis of Heterostructured Nanoparticles with
Morphology Control". Journal of the American Chemical Society 2010, 132, 6524-6529.
97.Gu, H. W.; Zheng, R. K.; Zhang, X. X.; Xu, B. "Facile One-Pot Synthesis of Bifunctional
Heterodimers of Nanoparticles: A Conjugate of Quantum Dot and Magnetic Nanoparticles".
Journal of the American Chemical Society 2004, 126, 5664-5665.
98. Yang, J.; Elim, H. I.; Zhang, Q.; Lee, J. Y.; Ji, W. "Rational Synthesis, Self-Assembly,
and Optical Properties of Pbs-Au Heterogeneous Nanostructures Via Preferential
Deposition". Journal of the American Chemical Society 2006, 128, 11921-11926.
99.Yu, H.; Chen, M.; Rice, P. M.; Wang, S. X.; White, R. L.; Sun, S. H. "Dumbbell-Like
Bifunctional Au-Fe3o4 Nanoparticles". Nano Letters 2005, 5, 379-382.
100. Figuerola, A.; Fiore, A.; Di Corato, R.; Falqui, A.; Giannini, C.; Micotti, E.; Lascialfari,
A.; Corti, M.; Cingolani, R.; Pellegrino, T.; Cozzoli, P. D.; Manna, L. "One-Pot Synthesis and
Characterization of Size-Controlled Bimagnetic Fept−Iron Oxide Heterodimer
Nanocrystals". Journal of the American Chemical Society 2008, 130, 1477-1487.
101. Kwon, K. W.; Shim, M. "Gamma-Fe2o3/Ii-Vi Sulfide Nanocrystal Heterojunctions".
Journal of the American Chemical Society 2005, 127, 10269-10275.
102. Shi, W.; Zeng, H.; Sahoo, Y.; Ohulchanskyy, T. Y.; Ding, Y.; Wang, Z. L.; Swihart, M.;
Prasad, P. N. "A General Approach to Binary and Ternary Hybrid Nanocrystals". Nano
Letters 2006, 6, 875-881.
2.7 References
85
103. Wang, C.; Xu, C.; Zeng, H.; Sun, S. "Recent Progress in Syntheses and Applications of
Dumbbell-Like Nanoparticles". Advanced Materials 2009, 21, 3045-3052.
104. Mokari, T.; Rothenberg, E.; Popov, I.; Costi, R.; Banin, U. "Selective Growth of Metal
Tips onto Semiconductor Quantum Rods and Tetrapods". Science 2004, 304, 1787-1790.
105. Hytch, M. J.; Snoeck, E.; Kilaas, R. "Quantitative Measurement of Displacement and
Strain Fields from Hrem Micrographs". Ultramicroscopy 1998, 74, 131-146.
106. Johnson, C. L.; Snoeck, E.; Ezcurdia, M.; Rodriguez-Gonzalez, B.; Pastoriza-Santos,
I.; Liz-Marzan, L. M.; Hytch, M. J. "Effects of Elastic Anisotropy on Strain Distributions in
Decahedral Gold Nanoparticles". Nature Materials 2008, 7, 120-124.
107. Njoki, P. N.; Lim, I. I. S.; Mott, D.; Park, H. Y.; Khan, B.; Mishra, S.; Sujakumar, R.;
Luo, J.; Zhong, C. J. "Size Correlation of Optical and Spectroscopic Properties for Gold
Nanoparticles". Journal of Physical Chemistry C 2007, 111, 14664-14669.
108. Pellegrino, T.; Fiore, A.; Carlino, E.; Giannini, C.; Cozzoli, P. D.; Ciccarella, G.;
Respaud, M.; Palmirotta, L.; Cingolani, R.; Manna, L. "Heterodimers Based on Copt3-Au
Nanocrystals with Tunable Domain Size". Journal of the American Chemical Society 2006,
128, 6690-6698.
109. Creighton, J. A.; Eadon, D. G. "Ultraviolet Visible Absorption-Spectra of the Colloidal
Metallic Elements". Journal of the Chemical Society-Faraday Transactions 1991, 87, 3881-
3891.
110. El-Sayed, M. A. "Some Interesting Properties of Metals Confined in Time and
Nanometer Space of Different Shapes". Accounts of Chemical Research 2001, 34, 257-264.
111. Hu, J. T.; Odom, T. W.; Lieber, C. M. "Chemistry and Physics in One Dimension:
Synthesis and Properties of Nanowires and Nanotubes". Accounts of Chemical Research
1999, 32, 435-445.
112. Nie, S. M.; Emery, S. R. "Probing Single Molecules and Single Nanoparticles by
Surface-Enhanced Raman Scattering". Science 1997, 275, 1102-1106.
113. Wang, Z. L. "Transmission Electron Microscopy of Shape-Controlled Nanocrystals and
Their Assemblies". Journal of Physical Chemistry B 2000, 104, 1153-1175.
114. Kelly, K. L.; Coronado, E.; Zhao, L. L.; Schatz, G. C. "The Optical Properties of Metal
Chapter 2: Synthesis of Metallic and Bimetallic Nanoparticles
86
Nanoparticles: The Influence of Size, Shape, and Dielectric Environment". Journal of
Physical Chemistry B 2003, 107, 668-677.
115. Eustis, S.; El-Sayed, M. "Aspect Ratio Dependence of the Enhanced Fluorescence
Intensity of Gold Nanorods: Experimental and Simulation Study". Journal of Physical
Chemistry B 2005, 109, 16350-16356.
116. Mohamed, M. B.; Volkov, V.; Link, S.; El-Sayed, M. A. "The 'Lightning' Gold Nanorods:
Fluorescence Enhancement of over a Million Compared to the Gold Metal". Chemical
Physics Letters 2000, 317, 517-523.
117. Osberg, K. D.; Schmucker, A. L.; Senesi, A. J.; Mirkin, C. A. "One-Dimensional Nanorod
Arrays: Independent Control of Composition, Length, and Interparticle Spacing with
Nanometer Precision". Nano Letters 2011, 11, 820-824.
118. Martin, C. R. "Nanomaterials - a Membrane-Based Synthetic Approach". Science 1994,
266, 1961-1966.
119. Thurn-Albrecht, T.; Schotter, J.; Kastle, C. A.; Emley, N.; Shibauchi, T.; Krusin-
Elbaum, L.; Guarini, K.; Black, C. T.; Tuominen, M. T.; Russell, T. P. "Ultrahigh-Density
Nanowire Arrays Grown in Self-Assembled Diblock Copolymer Templates". Science 2000,
290, 2126-2129.
120. Yu, Y. Y.; Chang, S. S.; Lee, C. L.; Wang, C. R. C. "Gold Nanorods: Electrochemical
Synthesis and Optical Properties". Journal of Physical Chemistry B 1997, 101, 6661-6664.
121. Esumi, K.; Matsuhisa, K.; Torigoe, K. "Preparation of Rodlike Gold Particles by Uv
Irradiation Using Cationic Micelles as a Template". Langmuir 1995, 11, 3285-3287.
122. Jana, N. R.; Gearheart, L.; Murphy, C. J. "Wet Chemical Synthesis of High Aspect
Ratio Cylindrical Gold Nanorods". Journal of Physical Chemistry B 2001, 105, 4065-4067.
123. Gao, J. X.; Bender, C. M.; Murphy, C. J. "Dependence of the Gold Nanorod Aspect
Ratio on the Nature of the Directing Surfactant in Aqueous Solution". Langmuir 2003, 19,
9065-9070.
124. Johnson, C. J.; Dujardin, E.; Davis, S. A.; Murphy, C. J.; Mann, S. "Growth and Form
of Gold Nanorods Prepared by Seed-Mediated, Surfactant-Directed Synthesis". Journal of
Materials Chemistry 2002, 12, 1765-1770.
2.1 Synthesis of Cobalt Nanoparticles
87
125. Nikoobakht, B.; El-Sayed, M. A. "Evidence for Bilayer Assembly of Cationic Surfactants
on the Surface of Gold Nanorods". Langmuir 2001, 17, 6368-6374.
126. Wu, H. Y.; Chu, H. C.; Kuo, T. J.; Kuo, C. L.; Huang, M. H. "Seed-Mediated Synthesis
of High Aspect Ratio Gold Nanorods with Nitric Acid". Chemistry of Materials 2005, 17,
6447.
127. Wu, H. Y.; Huang, W. L.; Huang, M. H. "Direct High-Yield Synthesis of High Aspect
Ratio Gold Nanorods". Crystal Growth & Design 2007, 7, 831-835.
128. Kim, F.; Sohn, K.; Wu, J. S.; Huang, J. X. "Chemical Synthesis of Gold Nanowires in
Acidic Solutions". Journal of the American Chemical Society 2008, 130, 14442.
129. Grzelczak, M.; Perez-Juste, J.; Rodriguez-Gonzalez, B.; Spasova, M.; Barsukov, I.;
Farle, M.; Liz-Marzan, L. M. "Pt-Catalyzed Growth of Ni Nanoparticles in Aqueous Ctab
Solution". Chemistry of Materials 2008, 20, 5399-5405.
130. Nikoobakht, B.; El-Sayed, M. A. "Preparation and Growth Mechanism of Gold
Nanorods (Nrs) Using Seed-Mediated Growth Method". Chemistry of Materials 2003, 15,
1957-1962.
131. Carim, A. H.; Lew, K. K.; Redwing, J. M. "Bicrystalline Silicon Nanowires". Advanced
Materials 2001, 13, 1489-1491.
132. Arbiol, J.; Comini, E.; Faglia, G.; Sberveglieri, G.; Morante, J. R. "Orthorhombic Pbcn
Sno2 Nanowires for Gas Sensing Applications". Journal of Crystal Growth 2008, 310, 253-
260.
133. Arbiol, J.; Estrade, S.; Prades, J. D.; Cirera, A.; Furtmayr, F.; Stark, C.; Laufer, A.;
Stutzmann, M.; Eickhoff, M.; Gass, M. H.; Bleloch, A. L.; Peiro, F.; Morante, J. R. "Triple-
Twin Domains in Mg Doped Gan Wurtzite Nanowires: Structural and Electronic Properties
of This Zinc-Blende-Like Stacking". Nanotechnology 2009, 20.
134. Arbiol, J.; Kalache, B.; Cabarrocas, P. R. I.; Morante, J. R.; Morral, A. F. I. "Influence
of Cu as a Catalyst on the Properties of Silicon Nanowires Synthesized by the Vapour-Solid-
Solid Mechanism". Nanotechnology 2007, 18.
135. Arbiol, J.; Morral, A. F. I.; Estrade, S.; Peiro, F.; Kalache, B.; Cabarrocas, P. R. I.;
Morante, J. R. "Influence of the (111) Twinning on the Formation of Diamond
Cubic/Diamond Hexagonal Heterostructures in Cu-Catalyzed Si Nanowires". Journal of

Chapter 2: Synthesis of Metallic and Bimetallic Nanoparticles
88
Applied Physics 2008, 104.
136. Lopez, F. J.; Hemesath, E. R.; Lauhon, L. J. "Ordered Stacking Fault Arrays in Silicon
Nanowires". Nano Letters 2009, 9, 2774-2779.
137. Lu, X.; Rycenga, M.; Skrabalak, S. E.; Wiley, B.; Xia, Y. "Chemical Synthesis of Novel
Plasmonic Nanoparticles". Annual Review of Physical Chemistry 2009, 60, 167-192.
138. Chockla, A. M.; Harris, J. T.; Korgel, B. A. "Colloidal Synthesis of Germanium
Nanorods". Chemistry of Materials 2011, 23, 1964-1970.
89
It is known that under appropriate conditions, colloidal NPs self-assemble into crystalline
structures with long-range periodic order as a result of the balance between electrostatic forces,
surface tension, entropy, topography, substrate affinity, and evidently, the size, shape, and
concentration of the particles.1,2 SA process of NPs into ordered structures may be comparable
with crystallization, where elements rearrange themselves into a periodic crystal structure.
The spontaneous assembly of monodispersed ligand-capped NPs has been reported by many
authors.1,3-6 The formation of ordered structures can be promoted by using different techniques
such as Langmuir-Blodgett,7 magnetic fields8 (in the case of magnetic NPs) and electrophoretic
deposition.9 One well-known methodology used to obtain self-assembled NP structures is the
drying-mediated SA,10 which consists in the controlled evaporation of the solvent from a
colloidal particle dispersion on top of the desired substrate allowing the self-organization of
the constituent units. Three-dimensional superlattices of different metals such as Ag, Ag2S and
Co have been obtained by slow evaporation of the solvent onto TEM grids and carbon
substrates.11 NPs with size distribution less than 5% can then form closed-packed structures,
i.e. self-assembled NP superlattices, where the NP acts as individual entities. The NP
superlattices do not have strong chemical interactions between particles, but are linked by vdW,
hydrogen bonds, and electric/magnetic dipole interactions. This fact allows the NPs to have
certain mobility during the evaporation process, what results into a wide number of different
structures.
In the SA process, it is important to understand the various interactions between NPs,
substrates and solvents, which lead to the formed patterns (see section 1.5). For instance,
Chapter 3Study of the Self-Assembly Process ofMagnetic and Noble MetalNanoparticles
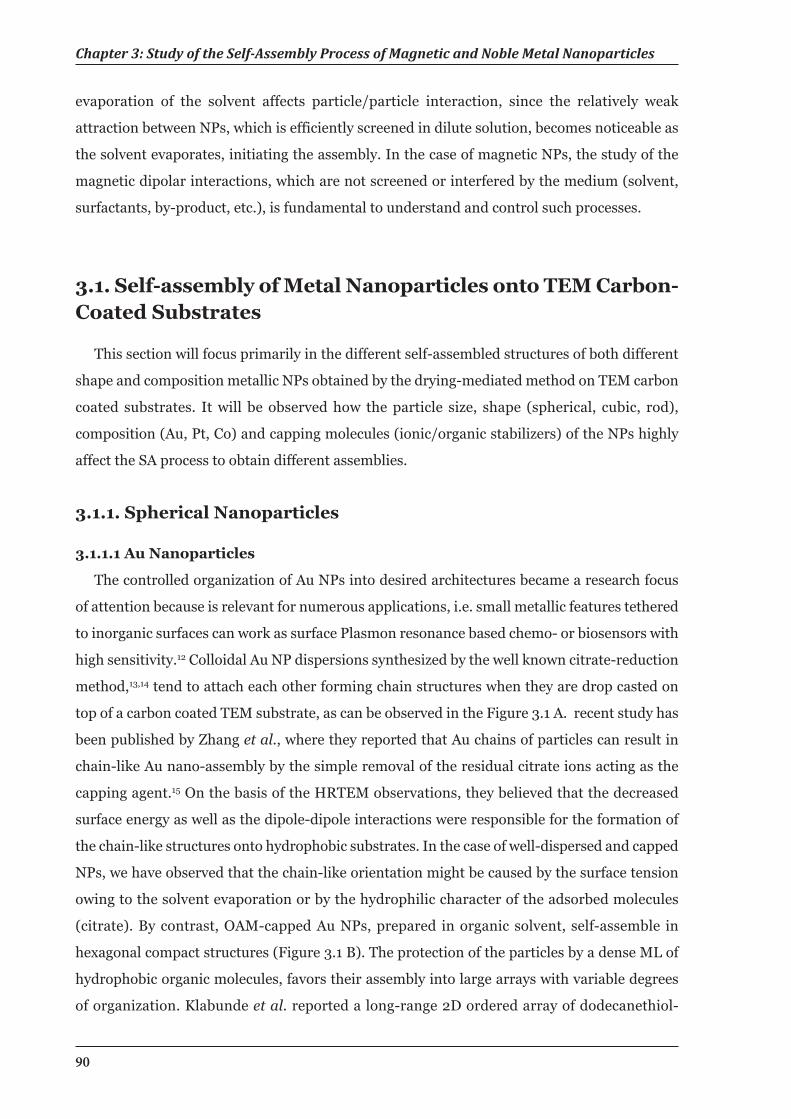
Chapter 3: Study of the Self-Assembly Process of Magnetic and Noble Metal Nanoparticles
90
evaporation of the solvent affects particle/particle interaction, since the relatively weak
attraction between NPs, which is efficiently screened in dilute solution, becomes noticeable as
the solvent evaporates, initiating the assembly. In the case of magnetic NPs, the study of the
magnetic dipolar interactions, which are not screened or interfered by the medium (solvent,
surfactants, by-product, etc.), is fundamental to understand and control such processes.
3.1. Self-assembly of Metal Nanoparticles onto TEM Carbon-Coated Substrates
This section will focus primarily in the different self-assembled structures of both different
shape and composition metallic NPs obtained by the drying-mediated method on TEM carbon
coated substrates. It will be observed how the particle size, shape (spherical, cubic, rod),
composition (Au, Pt, Co) and capping molecules (ionic/organic stabilizers) of the NPs highly
affect the SA process to obtain different assemblies.
3.1.1. Spherical Nanoparticles
3.1.1.1 Au Nanoparticles
The controlled organization of Au NPs into desired architectures became a research focus
of attention because is relevant for numerous applications, i.e. small metallic features tethered
to inorganic surfaces can work as surface Plasmon resonance based chemo- or biosensors with
high sensitivity.12 Colloidal Au NP dispersions synthesized by the well known citrate-reduction
method,13,14 tend to attach each other forming chain structures when they are drop casted on
top of a carbon coated TEM substrate, as can be observed in the Figure 3.1 A. recent study has
been published by Zhang et al., where they reported that Au chains of particles can result in
chain-like Au nano-assembly by the simple removal of the residual citrate ions acting as the
capping agent.15 On the basis of the HRTEM observations, they believed that the decreased
surface energy as well as the dipole-dipole interactions were responsible for the formation of
the chain-like structures onto hydrophobic substrates. In the case of well-dispersed and capped
NPs, we have observed that the chain-like orientation might be caused by the surface tension
owing to the solvent evaporation or by the hydrophilic character of the adsorbed molecules
(citrate). By contrast, OAM-capped Au NPs, prepared in organic solvent, self-assemble in
hexagonal compact structures (Figure 3.1 B). The protection of the particles by a dense ML of
hydrophobic organic molecules, favors their assembly into large arrays with variable degrees
of organization. Klabunde et al. reported a long-range 2D ordered array of dodecanethiol-
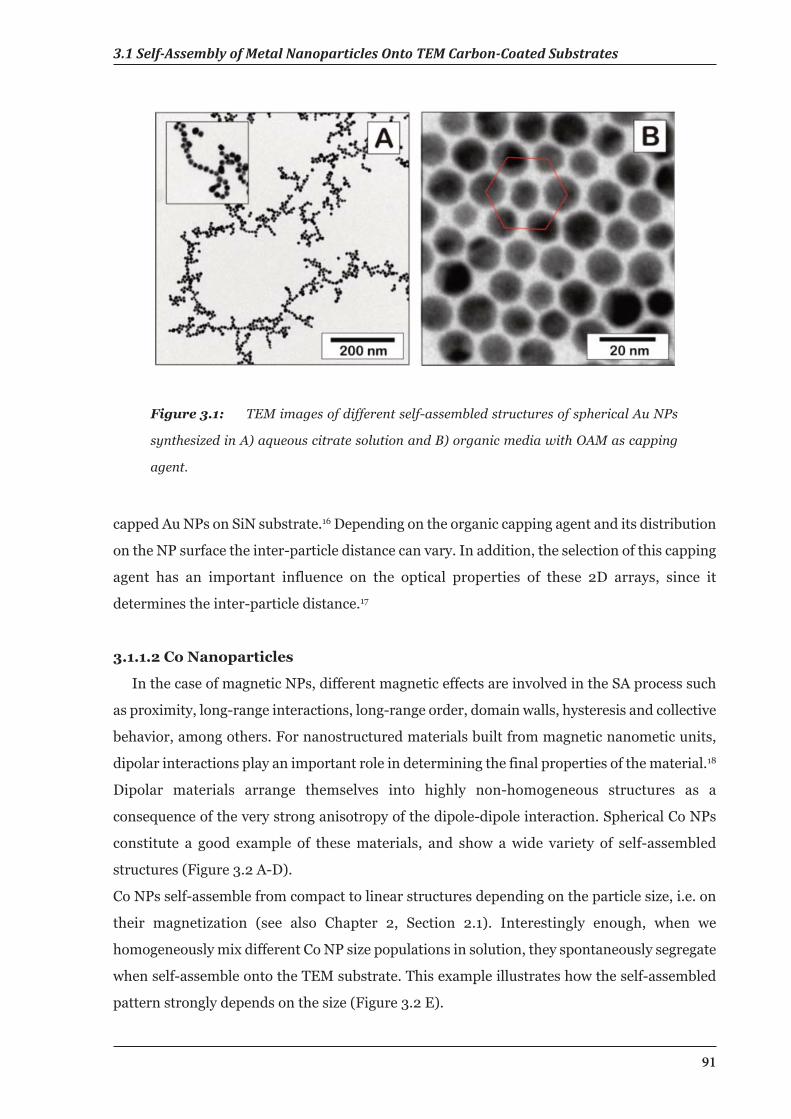
3.1 Self-Assembly of Metal Nanoparticles Onto TEM Carbon-Coated Substrates
91
capped Au NPs on SiN substrate.16 Depending on the organic capping agent and its distribution
on the NP surface the inter-particle distance can vary. In addition, the selection of this capping
agent has an important influence on the optical properties of these 2D arrays, since it
determines the inter-particle distance.17
3.1.1.2 Co Nanoparticles
In the case of magnetic NPs, different magnetic effects are involved in the SA process such
as proximity, long-range interactions, long-range order, domain walls, hysteresis and collective
behavior, among others. For nanostructured materials built from magnetic nanometic units,
dipolar interactions play an important role in determining the final properties of the material.18
Dipolar materials arrange themselves into highly non-homogeneous structures as a
consequence of the very strong anisotropy of the dipole-dipole interaction. Spherical Co NPs
constitute a good example of these materials, and show a wide variety of self-assembled
structures (Figure 3.2 A-D).
Co NPs self-assemble from compact to linear structures depending on the particle size, i.e. on
their magnetization (see also Chapter 2, Section 2.1). Interestingly enough, when we
homogeneously mix different Co NP size populations in solution, they spontaneously segregate
when self-assemble onto the TEM substrate. This example illustrates how the self-assembled
pattern strongly depends on the size (Figure 3.2 E).
Figure 3.1: TEM images of different self-assembled structures of spherical Au NPs
synthesized in A) aqueous citrate solution and B) organic media with OAM as capping
agent.
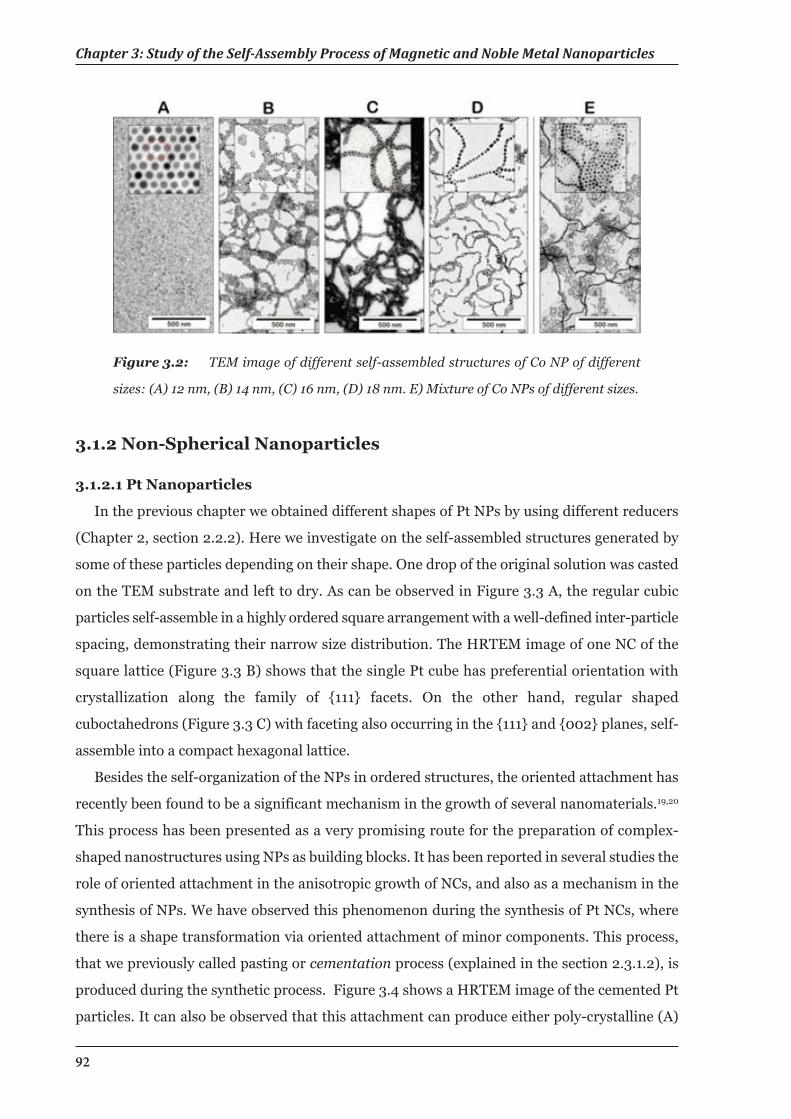
Chapter 3: Study of the Self-Assembly Process of Magnetic and Noble Metal Nanoparticles
92
3.1.2 Non-Spherical Nanoparticles
3.1.2.1 Pt Nanoparticles
In the previous chapter we obtained different shapes of Pt NPs by using different reducers
(Chapter 2, section 2.2.2). Here we investigate on the self-assembled structures generated by
some of these particles depending on their shape. One drop of the original solution was casted
on the TEM substrate and left to dry. As can be observed in Figure 3.3 A, the regular cubic
particles self-assemble in a highly ordered square arrangement with a well-defined inter-particle
spacing, demonstrating their narrow size distribution. The HRTEM image of one NC of the
square lattice (Figure 3.3 B) shows that the single Pt cube has preferential orientation with
crystallization along the family of {111} facets. On the other hand, regular shaped
cuboctahedrons (Figure 3.3 C) with faceting also occurring in the {111} and {002} planes, self-
assemble into a compact hexagonal lattice.
Besides the self-organization of the NPs in ordered structures, the oriented attachment has
recently been found to be a significant mechanism in the growth of several nanomaterials.19,20
This process has been presented as a very promising route for the preparation of complex-
shaped nanostructures using NPs as building blocks. It has been reported in several studies the
role of oriented attachment in the anisotropic growth of NCs, and also as a mechanism in the
synthesis of NPs. We have observed this phenomenon during the synthesis of Pt NCs, where
there is a shape transformation via oriented attachment of minor components. This process,
that we previously called pasting or cementation process (explained in the section 2.3.1.2), is
produced during the synthetic process. Figure 3.4 shows a HRTEM image of the cemented Pt
particles. It can also be observed that this attachment can produce either poly-crystalline (A)
Figure 3.2: TEM image of different self-assembled structures of Co NP of different
sizes: (A) 12 nm, (B) 14 nm, (C) 16 nm, (D) 18 nm. E) Mixture of Co NPs of different sizes.
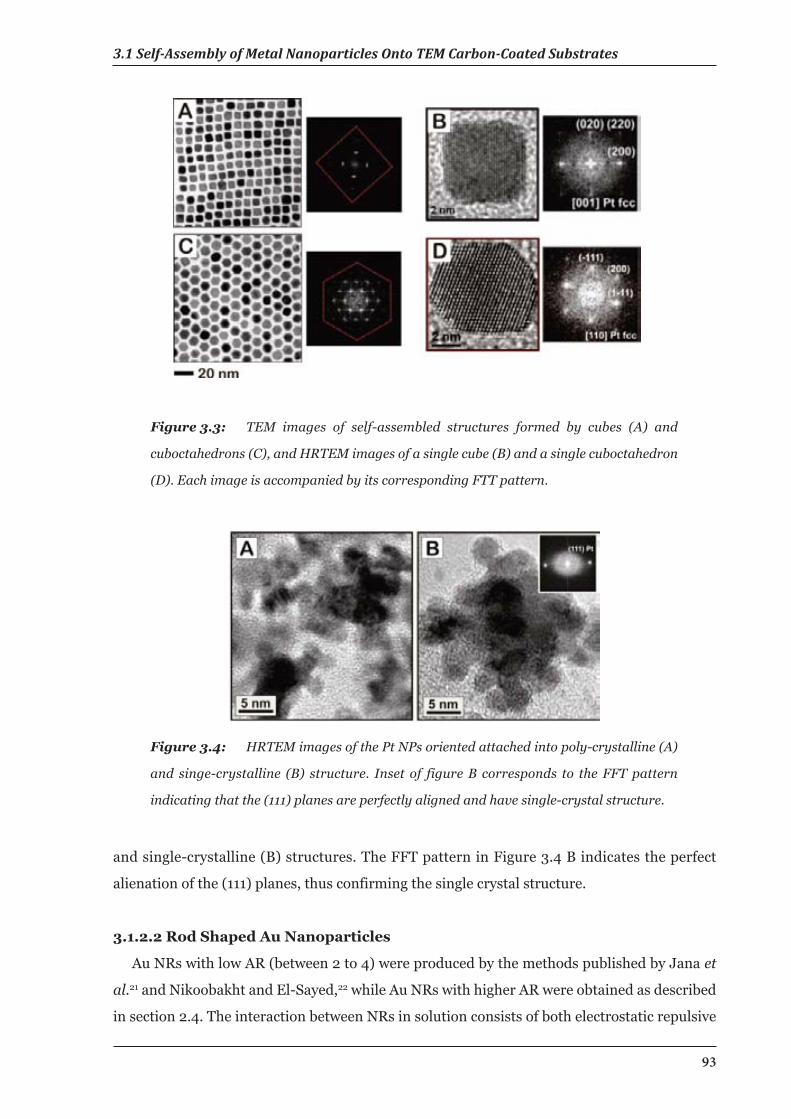
93
and single-crystalline (B) structures. The FFT pattern in Figure 3.4 B indicates the perfect
alienation of the (111) planes, thus confirming the single crystal structure.
3.1.2.2 Rod Shaped Au Nanoparticles
Au NRs with low AR (between 2 to 4) were produced by the methods published by Jana et
al.21 and Nikoobakht and El-Sayed,22 while Au NRs with higher AR were obtained as described
in section 2.4. The interaction between NRs in solution consists of both electrostatic repulsive
Figure 3.4: HRTEM images of the Pt NPs oriented attached into poly-crystalline (A)
and singe-crystalline (B) structure. Inset of figure B corresponds to the FFT pattern
indicating that the (111) planes are perfectly aligned and have single-crystal structure.
Figure 3.3: TEM images of self-assembled structures formed by cubes (A) and
cuboctahedrons (C), and HRTEM images of a single cube (B) and a single cuboctahedron
(D). Each image is accompanied by its corresponding FTT pattern.
3.1 Self-Assembly of Metal Nanoparticles Onto TEM Carbon-Coated Substrates
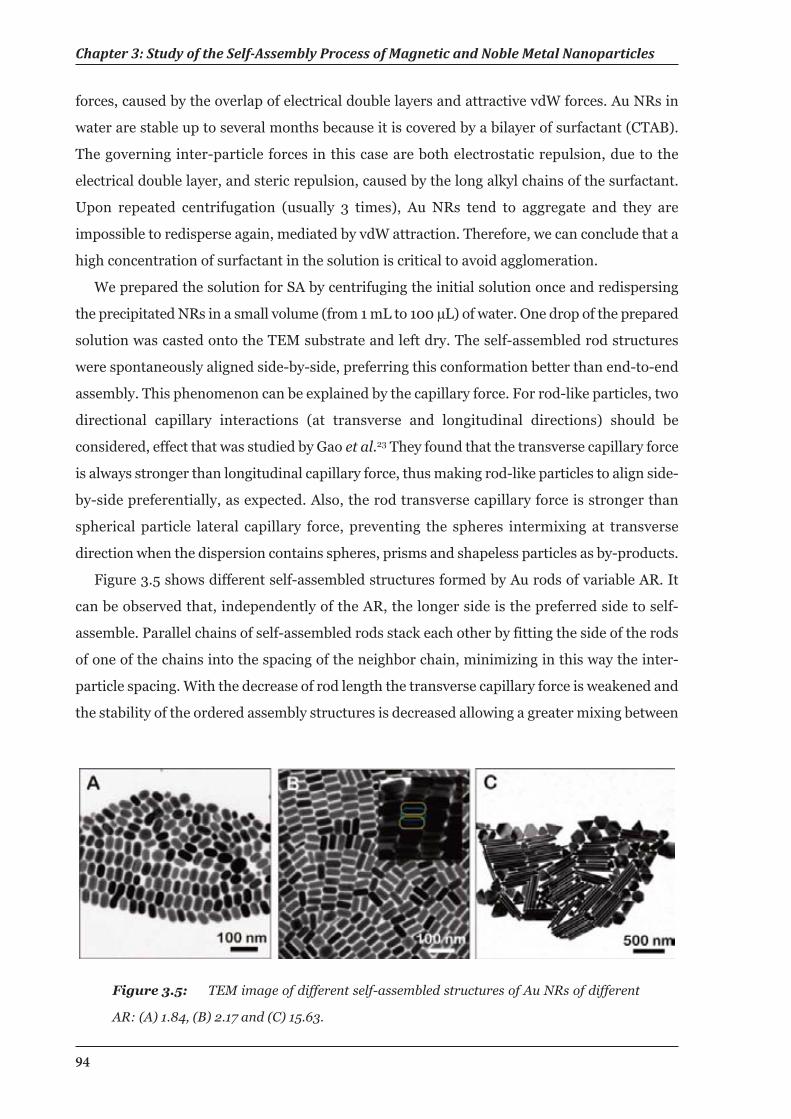
Chapter 3: Study of the Self-Assembly Process of Magnetic and Noble Metal Nanoparticles
94
forces, caused by the overlap of electrical double layers and attractive vdW forces. Au NRs in
water are stable up to several months because it is covered by a bilayer of surfactant (CTAB).
The governing inter-particle forces in this case are both electrostatic repulsion, due to the
electrical double layer, and steric repulsion, caused by the long alkyl chains of the surfactant.
Upon repeated centrifugation (usually 3 times), Au NRs tend to aggregate and they are
impossible to redisperse again, mediated by vdW attraction. Therefore, we can conclude that a
high concentration of surfactant in the solution is critical to avoid agglomeration.
We prepared the solution for SA by centrifuging the initial solution once and redispersing
the precipitated NRs in a small volume (from 1 mL to 100 µL) of water. One drop of the prepared
solution was casted onto the TEM substrate and left dry. The self-assembled rod structures
were spontaneously aligned side-by-side, preferring this conformation better than end-to-end
assembly. This phenomenon can be explained by the capillary force. For rod-like particles, two
directional capillary interactions (at transverse and longitudinal directions) should be
considered, effect that was studied by Gao et al.23 They found that the transverse capillary force
is always stronger than longitudinal capillary force, thus making rod-like particles to align side-
by-side preferentially, as expected. Also, the rod transverse capillary force is stronger than
spherical particle lateral capillary force, preventing the spheres intermixing at transverse
direction when the dispersion contains spheres, prisms and shapeless particles as by-products.
Figure 3.5 shows different self-assembled structures formed by Au rods of variable AR. It
can be observed that, independently of the AR, the longer side is the preferred side to self-
assemble. Parallel chains of self-assembled rods stack each other by fitting the side of the rods
of one of the chains into the spacing of the neighbor chain, minimizing in this way the inter-
particle spacing. With the decrease of rod length the transverse capillary force is weakened and
the stability of the ordered assembly structures is decreased allowing a greater mixing between
Figure 3.5: TEM image of different self-assembled structures of Au NRs of different
AR: (A) 1.84, (B) 2.17 and (C) 15.63.
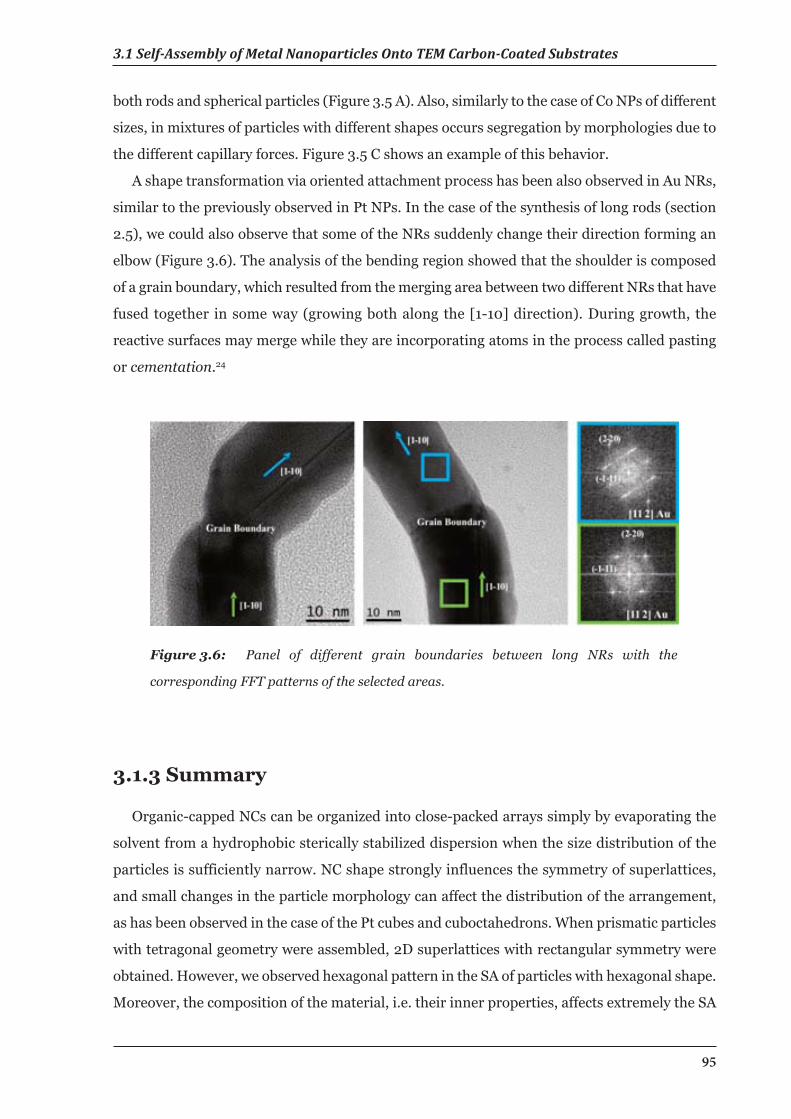
95
3.1.3 Summary
Organic-capped NCs can be organized into close-packed arrays simply by evaporating the
solvent from a hydrophobic sterically stabilized dispersion when the size distribution of the
particles is sufficiently narrow. NC shape strongly influences the symmetry of superlattices,
and small changes in the particle morphology can affect the distribution of the arrangement,
as has been observed in the case of the Pt cubes and cuboctahedrons. When prismatic particles
with tetragonal geometry were assembled, 2D superlattices with rectangular symmetry were
obtained. However, we observed hexagonal pattern in the SA of particles with hexagonal shape.
Moreover, the composition of the material, i.e. their inner properties, affects extremely the SA
Figure 3.6: Panel of different grain boundaries between long NRs with the
corresponding FFT patterns of the selected areas.
both rods and spherical particles (Figure 3.5 A). Also, similarly to the case of Co NPs of different
sizes, in mixtures of particles with different shapes occurs segregation by morphologies due to
the different capillary forces. Figure 3.5 C shows an example of this behavior.
A shape transformation via oriented attachment process has been also observed in Au NRs,
similar to the previously observed in Pt NPs. In the case of the synthesis of long rods (section
2.5), we could also observe that some of the NRs suddenly change their direction forming an
elbow (Figure 3.6). The analysis of the bending region showed that the shoulder is composed
of a grain boundary, which resulted from the merging area between two different NRs that have
fused together in some way (growing both along the [1-10] direction). During growth, the
reactive surfaces may merge while they are incorporating atoms in the process called pasting
or cementation.24
3.1 Self-Assembly of Metal Nanoparticles Onto TEM Carbon-Coated Substrates
Chapter 3: Study of the Self-Assembly Process of Magnetic and Noble Metal Nanoparticles
96
process. A good example is the case of Co NPs, where the SA depends directly of the
magnetization. Finally, oriented attachment-based SA has been also observed in the case of Pt
NPs and Au NRs. In this oriented attachment, which is an irreversible process, particles appear
fused to form bigger structures.
3.2 Self-Assembly of Co Nanoparticles at CompatibleSubstrates: Graphite
In particular, magnetic NPs are promising building blocks for high-performance nanodevices
for applications such as magnetic data storage and recording media.4,25 In magnetic materials,
the magnetic behavior is determined by the intrinsic exchange coupling energy and anisotropy
energy. Decreasing the single particle size usually reduces the anisotropy energy or modifies
the easy magnetization axes increasing the influence of dipolar interactions. If considering a
magnetic NP assembly, the particle-particle interaction becomes then an important issue,
dominating the collective magnetic behavior.26 Through changing the particle density, inter-
distance, or space arrangement, the magnetic properties might be controlled by design.27
Dipolar interactions play an important role in determining cooperative phenomena at the
molecular scale and the final properties of the material.28 Dipoles display a fondness for
arranging themselves into highly inhomogeneous structures. This is a consequence of the very
strong anisotropy of the dipole-dipole interaction, which couples the orientations of the dipole
moments with that of the inter-particle vector, what is different from the isotropic vdW
interaction.
There have been numerous experimental studies of magnetic NP arrays. FM-like (collective)
behavior in magnetization measurements of a 2D self-assembled ML of 9 and 12 nm diameter
Co particles has been previously observed.29 Similarly, Georgescu et al.30 studied islands of
spherical 21 nm size Co-ferrite (CoFe2O4) NPs by MFM. They observed that the magnetization
pattern of the NPs was determined by the competition between the collective dipole-dipole
interactions and the alignment of the dipole moments along the easy axes of magnetization.
Russier et al.31 studied both experimentally and theoretically the dipolar interactions between
Co NPs, which they characterized by a random distribution of the easy axes and deposited on
graphite.
In this section, we report on the predominant role of the dipolar magnetic interactions on
the formation of self-assembled super structures of magnetic NPs in the absence of applied
magnetic field. Other factors influencing the formation of those structures, such as the
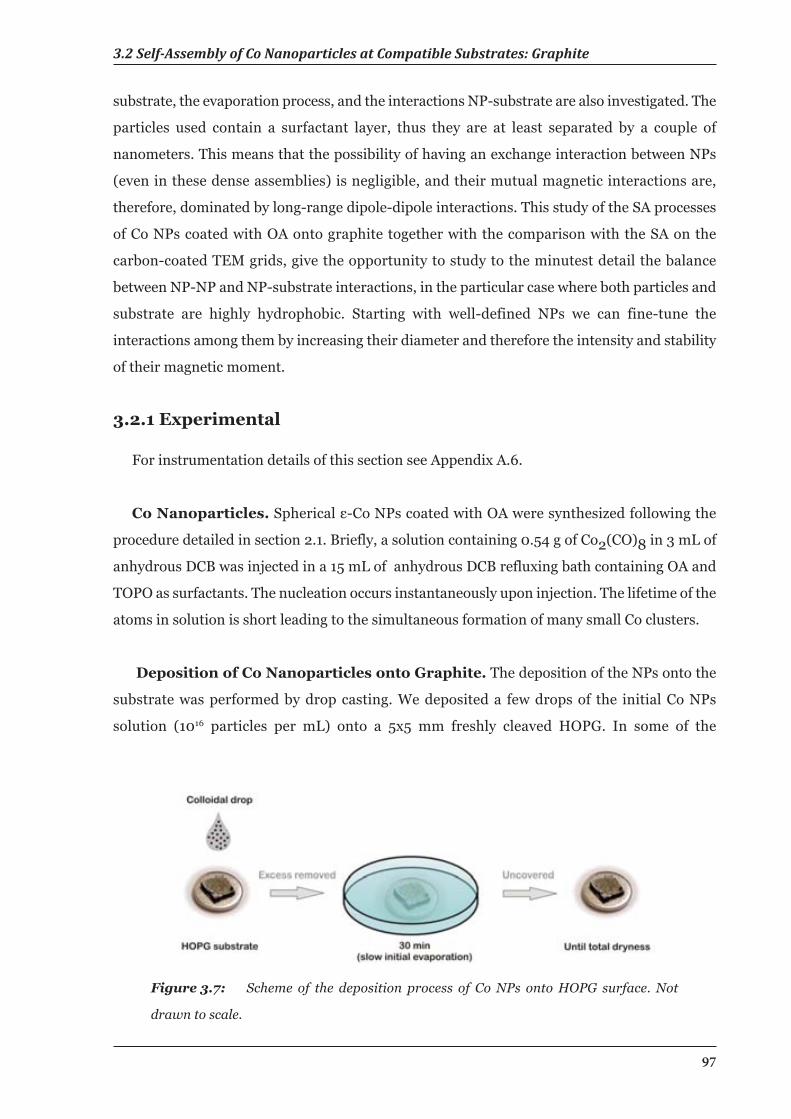
3.2 Self-Assembly of Co Nanoparticles at Compatible Substrates: Graphite
97
substrate, the evaporation process, and the interactions NP-substrate are also investigated. The
particles used contain a surfactant layer, thus they are at least separated by a couple of
nanometers. This means that the possibility of having an exchange interaction between NPs
(even in these dense assemblies) is negligible, and their mutual magnetic interactions are,
therefore, dominated by long-range dipole-dipole interactions. This study of the SA processes
of Co NPs coated with OA onto graphite together with the comparison with the SA on the
carbon-coated TEM grids, give the opportunity to study to the minutest detail the balance
between NP-NP and NP-substrate interactions, in the particular case where both particles and
substrate are highly hydrophobic. Starting with well-defined NPs we can fine-tune the
interactions among them by increasing their diameter and therefore the intensity and stability
of their magnetic moment.
3.2.1 Experimental
For instrumentation details of this section see Appendix A.6.
Co Nanoparticles. Spherical ε-Co NPs coated with OA were synthesized following the
procedure detailed in section 2.1. Briefly, a solution containing 0.54 g of Co2(CO)8 in 3 mL of
anhydrous DCB was injected in a 15 mL of anhydrous DCB refluxing bath containing OA and
TOPO as surfactants. The nucleation occurs instantaneously upon injection. The lifetime of the
atoms in solution is short leading to the simultaneous formation of many small Co clusters.
Deposition of Co Nanoparticles onto Graphite. The deposition of the NPs onto the
substrate was performed by drop casting. We deposited a few drops of the initial Co NPs
solution (1016 particles per mL) onto a 5x5 mm freshly cleaved HOPG. In some of the
Figure 3.7: Scheme of the deposition process of Co NPs onto HOPG surface. Not
drawn to scale.
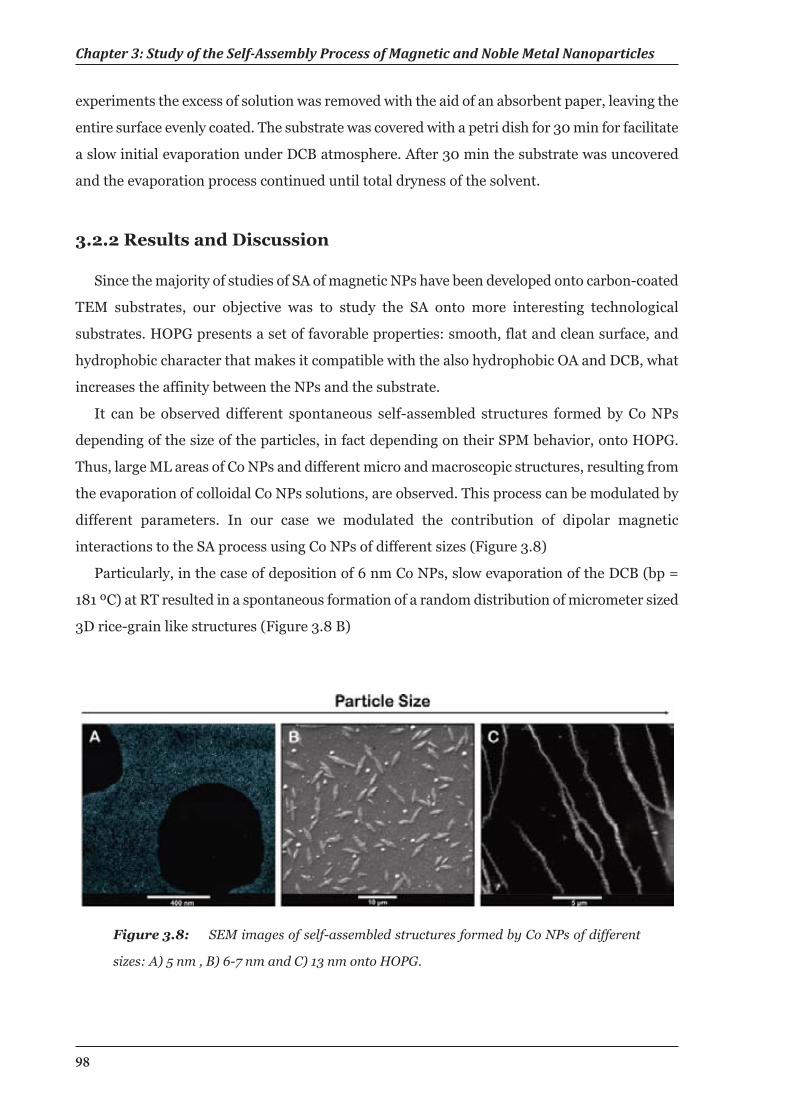
Figure 3.8: SEM images of self-assembled structures formed by Co NPs of different
sizes: A) 5 nm , B) 6-7 nm and C) 13 nm onto HOPG.
Chapter 3: Study of the Self-Assembly Process of Magnetic and Noble Metal Nanoparticles
98
experiments the excess of solution was removed with the aid of an absorbent paper, leaving the
entire surface evenly coated. The substrate was covered with a petri dish for 30 min for facilitate
a slow initial evaporation under DCB atmosphere. After 30 min the substrate was uncovered
and the evaporation process continued until total dryness of the solvent.
3.2.2 Results and Discussion
Since the majority of studies of SA of magnetic NPs have been developed onto carbon-coated
TEM substrates, our objective was to study the SA onto more interesting technological
substrates. HOPG presents a set of favorable properties: smooth, flat and clean surface, and
hydrophobic character that makes it compatible with the also hydrophobic OA and DCB, what
increases the affinity between the NPs and the substrate.
It can be observed different spontaneous self-assembled structures formed by Co NPs
depending of the size of the particles, in fact depending on their SPM behavior, onto HOPG.
Thus, large ML areas of Co NPs and different micro and macroscopic structures, resulting from
the evaporation of colloidal Co NPs solutions, are observed. This process can be modulated by
different parameters. In our case we modulated the contribution of dipolar magnetic
interactions to the SA process using Co NPs of different sizes (Figure 3.8)
Particularly, in the case of deposition of 6 nm Co NPs, slow evaporation of the DCB (bp =
181 ºC) at RT resulted in a spontaneous formation of a random distribution of micrometer sized
3D rice-grain like structures (Figure 3.8 B)
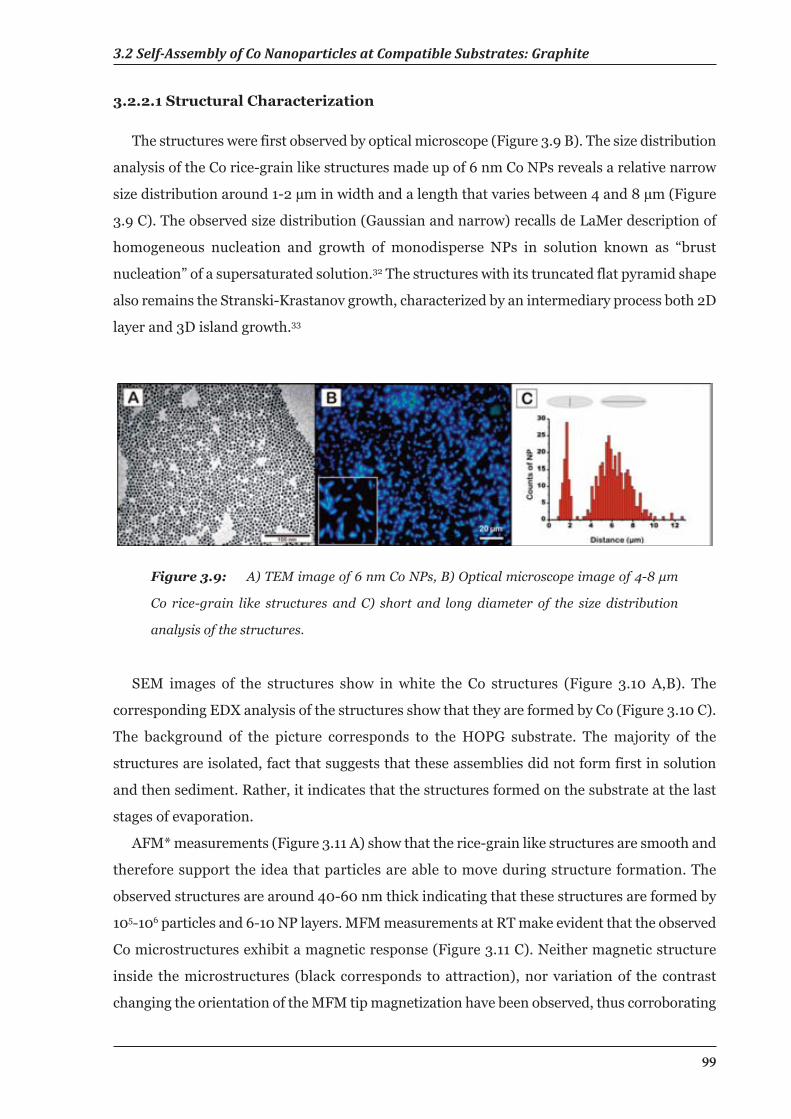
99
3.2 Self-Assembly of Co Nanoparticles at Compatible Substrates: Graphite
3.2.2.1 Structural Characterization
The structures were first observed by optical microscope (Figure 3.9 B). The size distribution
analysis of the Co rice-grain like structures made up of 6 nm Co NPs reveals a relative narrow
size distribution around 1-2 µm in width and a length that varies between 4 and 8 µm (Figure
3.9 C). The observed size distribution (Gaussian and narrow) recalls de LaMer description of
homogeneous nucleation and growth of monodisperse NPs in solution known as “brust
nucleation” of a supersaturated solution.32 The structures with its truncated flat pyramid shape
also remains the Stranski-Krastanov growth, characterized by an intermediary process both 2D
layer and 3D island growth.33
Figure 3.9: A) TEM image of 6 nm Co NPs, B) Optical microscope image of 4-8 μm
Co rice-grain like structures and C) short and long diameter of the size distribution
analysis of the structures.
SEM images of the structures show in white the Co structures (Figure 3.10 A,B). The
corresponding EDX analysis of the structures show that they are formed by Co (Figure 3.10 C).
The background of the picture corresponds to the HOPG substrate. The majority of the
structures are isolated, fact that suggests that these assemblies did not form first in solution
and then sediment. Rather, it indicates that the structures formed on the substrate at the last
stages of evaporation.
AFM* measurements (Figure 3.11 A) show that the rice-grain like structures are smooth and
therefore support the idea that particles are able to move during structure formation. The
observed structures are around 40-60 nm thick indicating that these structures are formed by
105-106 particles and 6-10 NP layers. MFM measurements at RT make evident that the observed
Co microstructures exhibit a magnetic response (Figure 3.11 C). Neither magnetic structure
inside the microstructures (black corresponds to attraction), nor variation of the contrast
changing the orientation of the MFM tip magnetization have been observed, thus corroborating
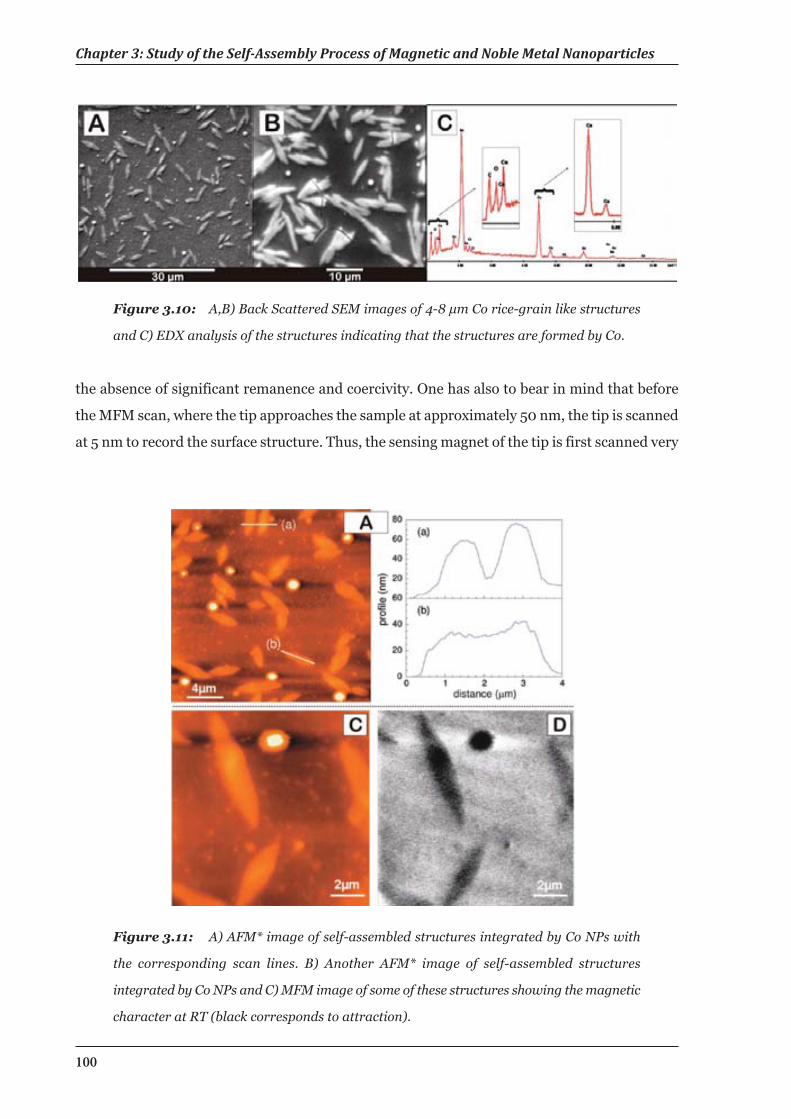
Chapter 3: Study of the Self-Assembly Process of Magnetic and Noble Metal Nanoparticles
100
Figure 3.11: A) AFM* image of self-assembled structures integrated by Co NPs with
the corresponding scan lines. B) Another AFM* image of self-assembled structures
integrated by Co NPs and C) MFM image of some of these structures showing the magnetic
character at RT (black corresponds to attraction).
the absence of significant remanence and coercivity. One has also to bear in mind that before
the MFM scan, where the tip approaches the sample at approximately 50 nm, the tip is scanned
at 5 nm to record the surface structure. Thus, the sensing magnet of the tip is first scanned very
Figure 3.10: A,B) Back Scattered SEM images of 4-8 μm Co rice-grain like structures
and C) EDX analysis of the structures indicating that the structures are formed by Co.
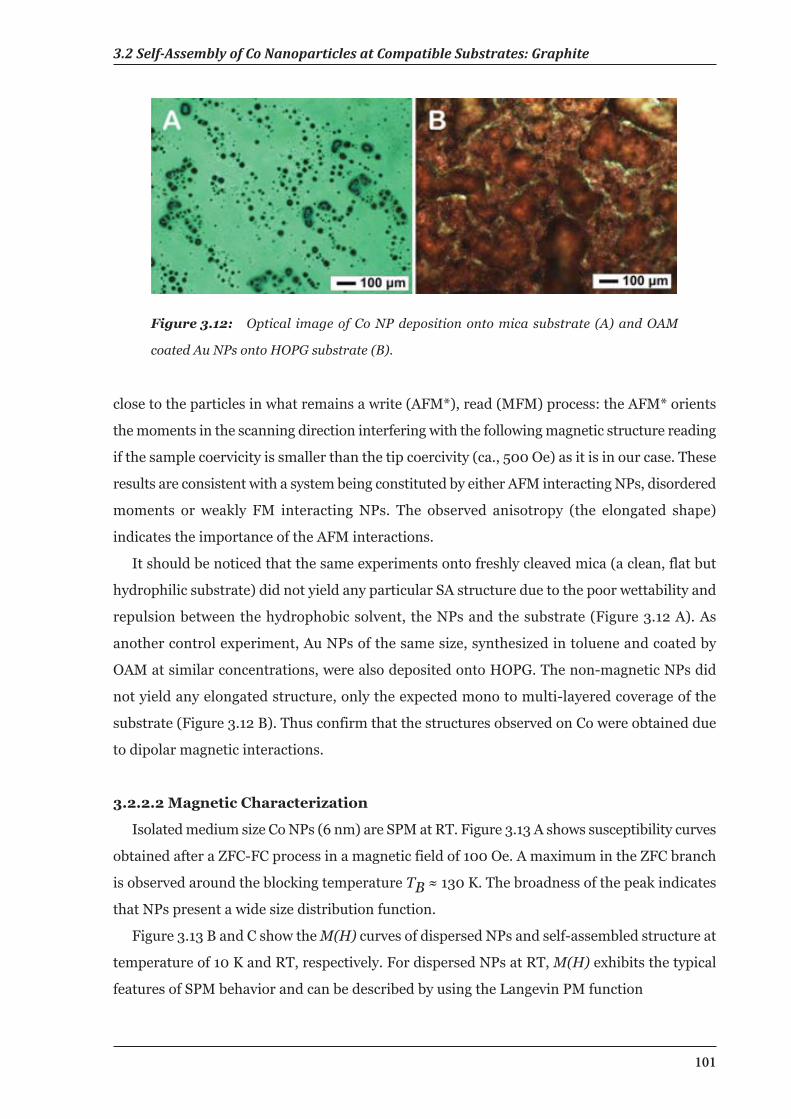
101
3.2 Self-Assembly of Co Nanoparticles at Compatible Substrates: Graphite
close to the particles in what remains a write (AFM*), read (MFM) process: the AFM* orients
the moments in the scanning direction interfering with the following magnetic structure reading
if the sample coervicity is smaller than the tip coercivity (ca., 500 Oe) as it is in our case. These
results are consistent with a system being constituted by either AFM interacting NPs, disordered
moments or weakly FM interacting NPs. The observed anisotropy (the elongated shape)
indicates the importance of the AFM interactions.
It should be noticed that the same experiments onto freshly cleaved mica (a clean, flat but
hydrophilic substrate) did not yield any particular SA structure due to the poor wettability and
repulsion between the hydrophobic solvent, the NPs and the substrate (Figure 3.12 A). As
another control experiment, Au NPs of the same size, synthesized in toluene and coated by
OAM at similar concentrations, were also deposited onto HOPG. The non-magnetic NPs did
not yield any elongated structure, only the expected mono to multi-layered coverage of the
substrate (Figure 3.12 B). Thus confirm that the structures observed on Co were obtained due
to dipolar magnetic interactions.
3.2.2.2 Magnetic Characterization
Isolated medium size Co NPs (6 nm) are SPM at RT. Figure 3.13 A shows susceptibility curves
obtained after a ZFC-FC process in a magnetic field of 100 Oe. A maximum in the ZFC branch
is observed around the blocking temperature TB ≈ 130 K. The broadness of the peak indicates
that NPs present a wide size distribution function.
Figure 3.13 B and C show the M(H) curves of dispersed NPs and self-assembled structure at
temperature of 10 K and RT, respectively. For dispersed NPs at RT, M(H) exhibits the typical
features of SPM behavior and can be described by using the Langevin PM function
Figure 3.12: Optical image of Co NP deposition onto mica substrate (A) and OAM
coated Au NPs onto HOPG substrate (B).
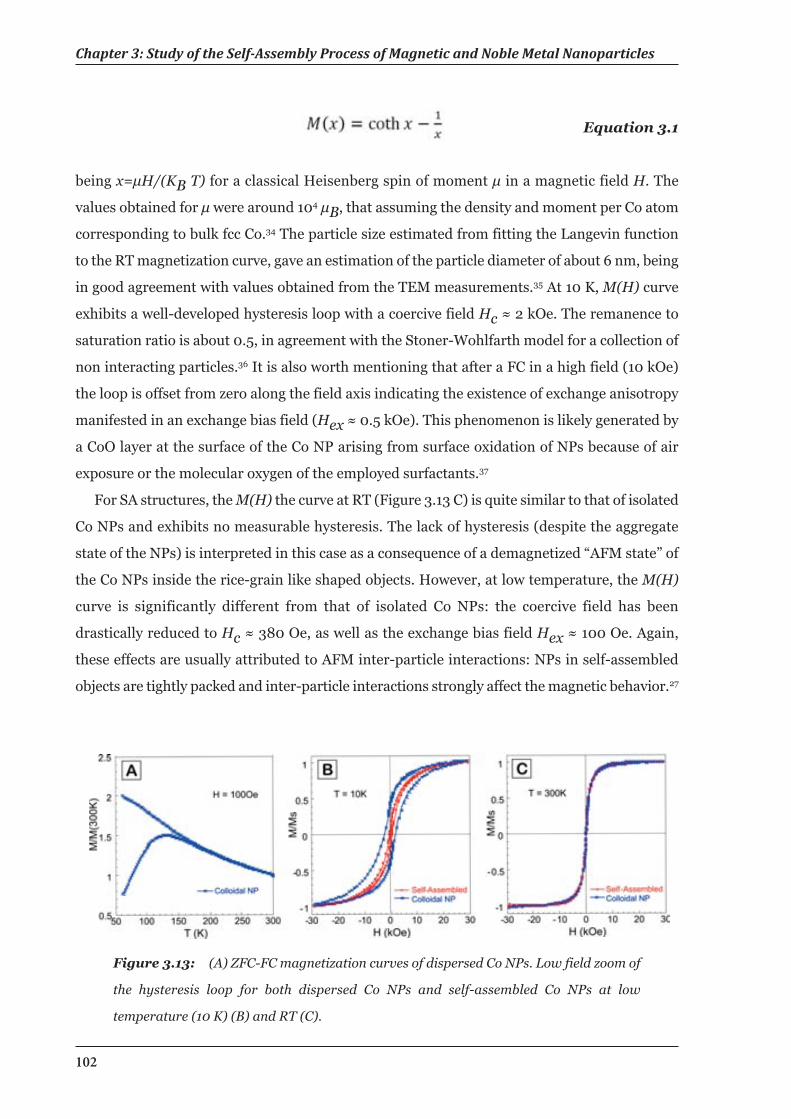
Chapter 3: Study of the Self-Assembly Process of Magnetic and Noble Metal Nanoparticles
102
Figure 3.13: (A) ZFC-FC magnetization curves of dispersed Co NPs. Low field zoom of
the hysteresis loop for both dispersed Co NPs and self-assembled Co NPs at low
temperature (10 K) (B) and RT (C).
Equation 3.1
being x=μH/(KB T) for a classical Heisenberg spin of moment μ in a magnetic field H. The
values obtained for μ were around 104 μB, that assuming the density and moment per Co atom
corresponding to bulk fcc Co.34 The particle size estimated from fitting the Langevin function
to the RT magnetization curve, gave an estimation of the particle diameter of about 6 nm, being
in good agreement with values obtained from the TEM measurements.35 At 10 K, M(H) curve
exhibits a well-developed hysteresis loop with a coercive field Hc ≈ 2 kOe. The remanence to
saturation ratio is about 0.5, in agreement with the Stoner-Wohlfarth model for a collection of
non interacting particles.36 It is also worth mentioning that after a FC in a high field (10 kOe)
the loop is offset from zero along the field axis indicating the existence of exchange anisotropy
manifested in an exchange bias field (Hex ≈ 0.5 kOe). This phenomenon is likely generated by
a CoO layer at the surface of the Co NP arising from surface oxidation of NPs because of air
exposure or the molecular oxygen of the employed surfactants.37
For SA structures, the M(H) the curve at RT (Figure 3.13 C) is quite similar to that of isolated
Co NPs and exhibits no measurable hysteresis. The lack of hysteresis (despite the aggregate
state of the NPs) is interpreted in this case as a consequence of a demagnetized “AFM state” of
the Co NPs inside the rice-grain like shaped objects. However, at low temperature, the M(H)
curve is significantly different from that of isolated Co NPs: the coercive field has been
drastically reduced to Hc ≈ 380 Oe, as well as the exchange bias field Hex ≈ 100 Oe. Again,
these effects are usually attributed to AFM inter-particle interactions: NPs in self-assembled
objects are tightly packed and inter-particle interactions strongly affect the magnetic behavior.27
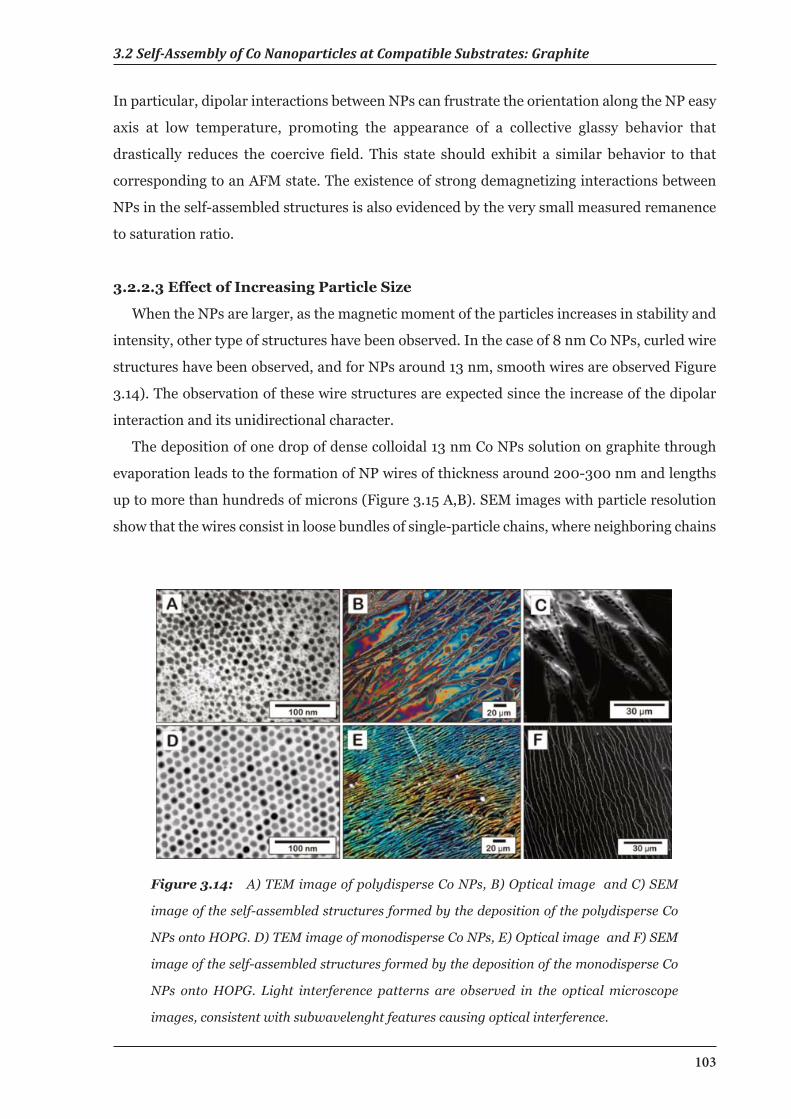
103
3.2 Self-Assembly of Co Nanoparticles at Compatible Substrates: Graphite
In particular, dipolar interactions between NPs can frustrate the orientation along the NP easy
axis at low temperature, promoting the appearance of a collective glassy behavior that
drastically reduces the coercive field. This state should exhibit a similar behavior to that
corresponding to an AFM state. The existence of strong demagnetizing interactions between
NPs in the self-assembled structures is also evidenced by the very small measured remanence
to saturation ratio.
3.2.2.3 Effect of Increasing Particle Size
When the NPs are larger, as the magnetic moment of the particles increases in stability and
intensity, other type of structures have been observed. In the case of 8 nm Co NPs, curled wire
structures have been observed, and for NPs around 13 nm, smooth wires are observed Figure
3.14). The observation of these wire structures are expected since the increase of the dipolar
interaction and its unidirectional character.
The deposition of one drop of dense colloidal 13 nm Co NPs solution on graphite through
evaporation leads to the formation of NP wires of thickness around 200-300 nm and lengths
up to more than hundreds of microns (Figure 3.15 A,B). SEM images with particle resolution
show that the wires consist in loose bundles of single-particle chains, where neighboring chains
Figure 3.14: A) TEM image of polydisperse Co NPs, B) Optical image and C) SEM
image of the self-assembled structures formed by the deposition of the polydisperse Co
NPs onto HOPG. D) TEM image of monodisperse Co NPs, E) Optical image and F) SEM
image of the self-assembled structures formed by the deposition of the monodisperse Co
NPs onto HOPG. Light interference patterns are observed in the optical microscope
images, consistent with subwavelenght features causing optical interference.
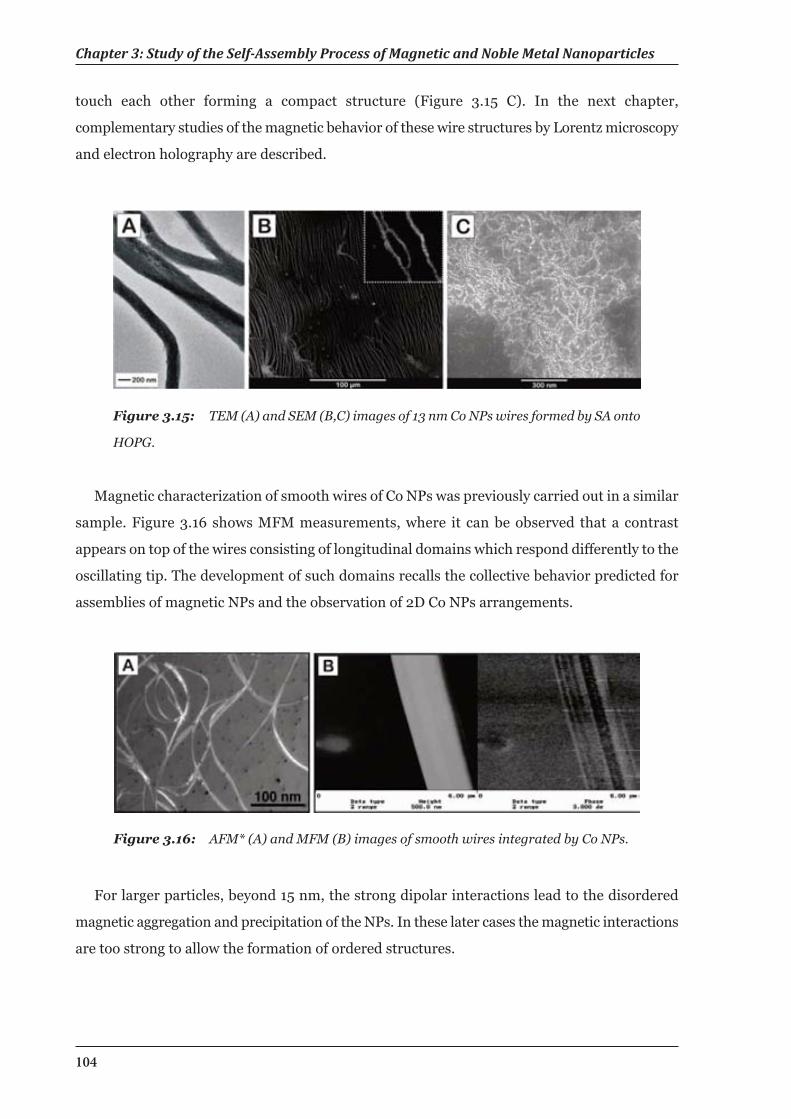
Chapter 3: Study of the Self-Assembly Process of Magnetic and Noble Metal Nanoparticles
104
Figure 3.16: AFM* (A) and MFM (B) images of smooth wires integrated by Co NPs.
Figure 3.15: TEM (A) and SEM (B,C) images of 13 nm Co NPs wires formed by SA onto
HOPG.
touch each other forming a compact structure (Figure 3.15 C). In the next chapter,
complementary studies of the magnetic behavior of these wire structures by Lorentz microscopy
and electron holography are described.
Magnetic characterization of smooth wires of Co NPs was previously carried out in a similar
sample. Figure 3.16 shows MFM measurements, where it can be observed that a contrast
appears on top of the wires consisting of longitudinal domains which respond differently to the
oscillating tip. The development of such domains recalls the collective behavior predicted for
assemblies of magnetic NPs and the observation of 2D Co NPs arrangements.
For larger particles, beyond 15 nm, the strong dipolar interactions lead to the disordered
magnetic aggregation and precipitation of the NPs. In these later cases the magnetic interactions
are too strong to allow the formation of ordered structures.
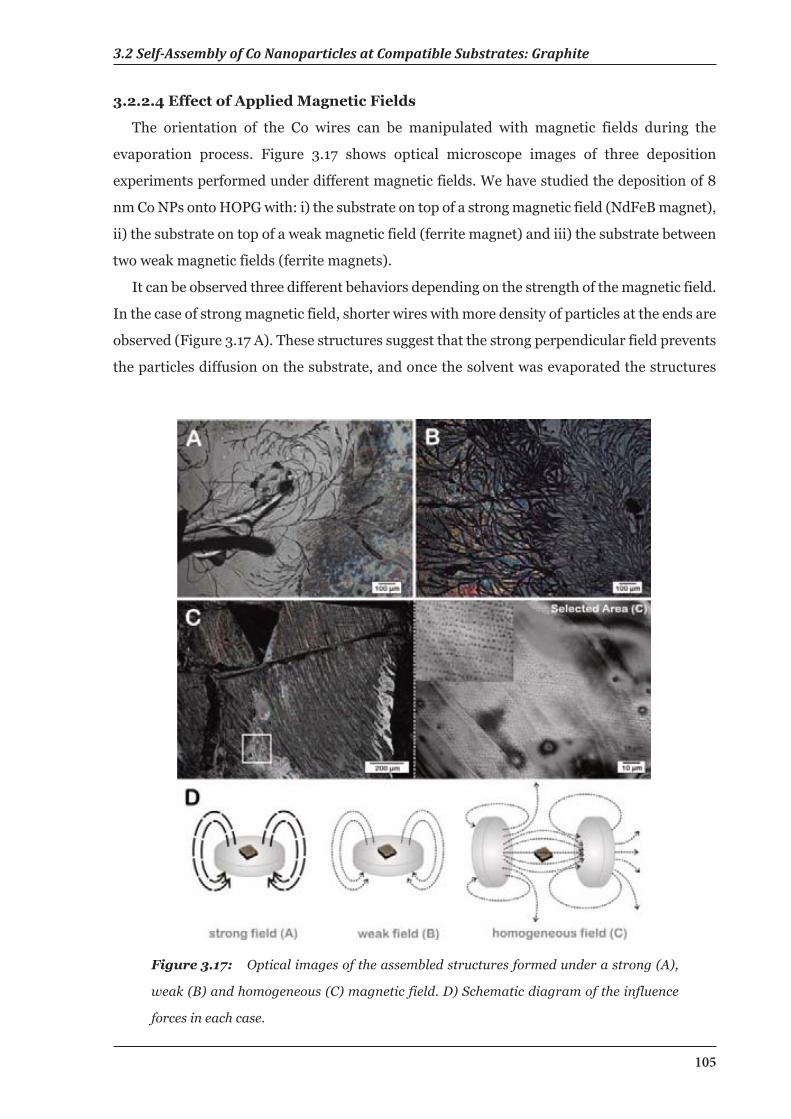
105
3.2 Self-Assembly of Co Nanoparticles at Compatible Substrates: Graphite
3.2.2.4 Effect of Applied Magnetic Fields
The orientation of the Co wires can be manipulated with magnetic fields during the
evaporation process. Figure 3.17 shows optical microscope images of three deposition
experiments performed under different magnetic fields. We have studied the deposition of 8
nm Co NPs onto HOPG with: i) the substrate on top of a strong magnetic field (NdFeB magnet),
ii) the substrate on top of a weak magnetic field (ferrite magnet) and iii) the substrate between
two weak magnetic fields (ferrite magnets).
It can be observed three different behaviors depending on the strength of the magnetic field.
In the case of strong magnetic field, shorter wires with more density of particles at the ends are
observed (Figure 3.17 A). These structures suggest that the strong perpendicular field prevents
the particles diffusion on the substrate, and once the solvent was evaporated the structures
Figure 3.17: Optical images of the assembled structures formed under a strong (A),
weak (B) and homogeneous (C) magnetic field. D) Schematic diagram of the influence
forces in each case.
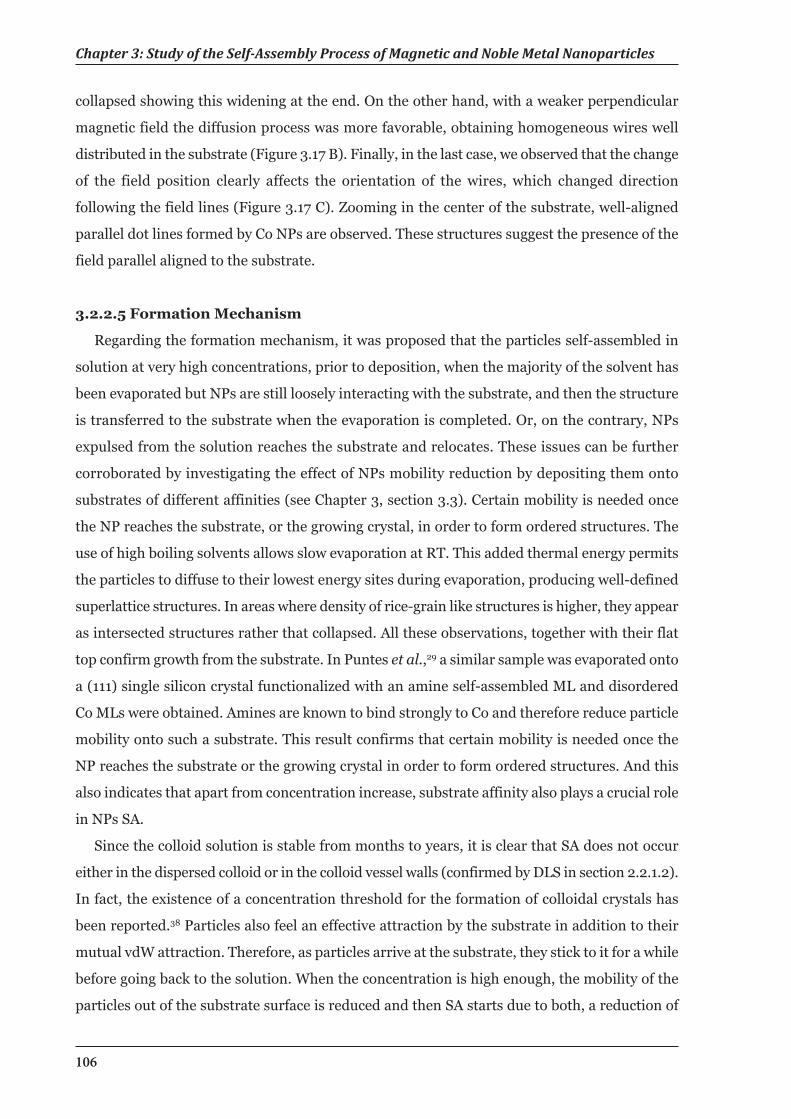
106
Chapter 3: Study of the Self-Assembly Process of Magnetic and Noble Metal Nanoparticles
collapsed showing this widening at the end. On the other hand, with a weaker perpendicular
magnetic field the diffusion process was more favorable, obtaining homogeneous wires well
distributed in the substrate (Figure 3.17 B). Finally, in the last case, we observed that the change
of the field position clearly affects the orientation of the wires, which changed direction
following the field lines (Figure 3.17 C). Zooming in the center of the substrate, well-aligned
parallel dot lines formed by Co NPs are observed. These structures suggest the presence of the
field parallel aligned to the substrate.
3.2.2.5 Formation Mechanism
Regarding the formation mechanism, it was proposed that the particles self-assembled in
solution at very high concentrations, prior to deposition, when the majority of the solvent has
been evaporated but NPs are still loosely interacting with the substrate, and then the structure
is transferred to the substrate when the evaporation is completed. Or, on the contrary, NPs
expulsed from the solution reaches the substrate and relocates. These issues can be further
corroborated by investigating the effect of NPs mobility reduction by depositing them onto
substrates of different affinities (see Chapter 3, section 3.3). Certain mobility is needed once
the NP reaches the substrate, or the growing crystal, in order to form ordered structures. The
use of high boiling solvents allows slow evaporation at RT. This added thermal energy permits
the particles to diffuse to their lowest energy sites during evaporation, producing well-defined
superlattice structures. In areas where density of rice-grain like structures is higher, they appear
as intersected structures rather that collapsed. All these observations, together with their flat
top confirm growth from the substrate. In Puntes et al.,29 a similar sample was evaporated onto
a (111) single silicon crystal functionalized with an amine self-assembled ML and disordered
Co MLs were obtained. Amines are known to bind strongly to Co and therefore reduce particle
mobility onto such a substrate. This result confirms that certain mobility is needed once the
NP reaches the substrate or the growing crystal in order to form ordered structures. And this
also indicates that apart from concentration increase, substrate affinity also plays a crucial role
in NPs SA.
Since the colloid solution is stable from months to years, it is clear that SA does not occur
either in the dispersed colloid or in the colloid vessel walls (confirmed by DLS in section 2.2.1.2).
In fact, the existence of a concentration threshold for the formation of colloidal crystals has
been reported.38 Particles also feel an effective attraction by the substrate in addition to their
mutual vdW attraction. Therefore, as particles arrive at the substrate, they stick to it for a while
before going back to the solution. When the concentration is high enough, the mobility of the
particles out of the substrate surface is reduced and then SA starts due to both, a reduction of
3.2 Self-Assembly of Co Nanoparticles at Compatible Substrates: HOPG
107
available positions for the NPs in solution and an increase in the self-assembled structure
stability. In other words, as the particles are packed together, if one of them wants to move, its
neighbors will have to cooperate. Therefore, as they are packed even tighter, more particles
have to cooperate for anyone to move, what stabilizes the growing structure.
For an isolated Co NP with diameter of ∼6 nm and TB = 130 K, the anisotropy constant
should be KCoNP = 2.5·106 erg/cm3. Considering the extremely short-range character of
exchange interactions and the fact that particles are isolated by at least twice the surfactant
layer thickness, the possible coupling of Co through such interactions can be ruled out.
However, when such particles are close to each other, inter-particles dipolar interactions
develop. The maximum dipolar field created along the axis between two particles in contact
being
Equation 3.2
where μo is the permeability of vacuum, N is the number of atoms per particle, μat is the atomic
magnetic moment, R is the particle radius, a is the apparent atomic radius and l/2 is the
surfactant layer thickness. The energy of ∼6 nm Co NP (particle moment Nμat ≈ 104 μB) in a
field of 0.7 T is much higher than RT. Thus, the above oversimplified considerations suggest
the possibility of thermally stable magnetic moment interaction during the solvent evaporation,
and hence for NP self-assembling coming from the dipolar interactions between SPM NPs.
The intuitive picture of self-organization scenario is as follows (Figure 3.18). Since the dipolar
interactions favor formation of chains of particles, “nucleus” of such chains will spontaneously
appear during the initial stage of solvent evaporation and they will further grow by attracting
particles which are in the vicinity of the chains ends. At the same time, other particles which
are positioned far from the end of the chain will not be able to join the chain. Instead they will
try to move toward the nearest particle of the chain, orienting their magnetic moments in
opposite direction. Thus, chains with progressively shorter lengths will be eventually attached
to the original “nucleus” resulting in 3D rice-grain-like objects (Figure 3.18 A). Naturally, the
coercivity and the remanence of such rice-grain like objects formed by dipolar forces, being
macroscopic “antiferromagnets”, will be close to zero. Of course, the interplay of several
parameters (like particle concentration, particle magnetic moment, solvent viscosity, and
evaporation conditions) will all play a role in determining whether the particles will self-
assemble into rice-grains or chains, confined into layers, or they will not assemble at all. When
the NPs are larger, as the magnetic moment of the particles increases in stability and intensity,
Chapter 3: Study of the Self-Assembly Process of Magnetic and Noble Metal Nanoparticles
108
Figure 3.18: Scheme of the self-organization process for <10 nm Co NPs (A) and 10-15
nm Co NPs (B). The field arrows do not mean application of an external field, but indicates
the direction of the collective magnetic behavior.
two other types of structures have been observed. Curled wires (for NPs around 8 nm) and
smooth wires (for NPs around 12 nm) are observed as expected from the increase of the dipolar
interaction and its unidirectional character (Figure 3.18 B). The phenomena here observed
recalls the description of the magnetic NP chain collapse under the application of an external
field as in Martin et al.39 Finally, drop evaporation seems to not interfere with the formation of
the SA structures.
3.2.3 Summary
NPs coated with organic surfactants are able to self-organize into ordered arrays due to the
interplay between vdW attractive forces and steric repulsion. When NPs are magnetic, the
magnetostatic forces due to dipolar interactions (which are anisotropic) play a relevant role
109
3.3 Self-Assembly of Co Nanoparticles at Non Compatible Substrates: Silicon Wafers
influencing and even prevailing over isotropic interactions. When magnetic NPs have a stable
enough magnetic moment, depending on the relation between magnetostatic forces and
dispersive forces, different self-assembled arrays may be generated. It is important to note that
the thermally fluctuating SPM moment of an isolated particle could be stabilized when the
particle is in the vicinity of other particle and dipole-dipole interactions appear.
For instance, when magnetostatic forces prevail over dispersion forces, the particles form
chains. In contrast, when magnetic interactions are weaker than the other isotropic interactions,
close-packed structures are formed.40,41 Steric forces and vdW interactions can be modulated
by using different type of surfactants, whereas dipolar magnetic interactions can be modified
by changing the size of the magnetic NPs.
We show that those dipolar interactions may promote SA into elongated superstructures
with a narrow size distribution, from micrometric rice-grain like structures to micrometric wire
like structures. The properties of the individual particles as well as their mutual interactions
determine important features of the NPs systems. A full understanding of the NPs SA will allow
the design and construction of complex modular materials with customized properties.
3.3 Self-Assembly of Co Nanoparticles at Non-CompatibleSubstrates: Silicon Wafers
MLs of magnetic NPs present a great interest because they can be used to functionalize other
materials for sensing or spintronics.42,43 Self-assembled MLs and multilayers of magnetic NPs
can be prepared by using different techniques, apart from deposition and solvent evaporation,11
such as Langmuir-Blodgett44 or layer-by-layer deposition,45 which are strategies based on
transferring dense pre-formed MLs to the desired substrate. It is known that the more
developed technique to prepare particle MLs is based on the Langmuir–Blodgett films, where
an insoluble particle ML is prepared at the liquid–air interface and later on picked up with a
substrate, sometimes vertically or horizontally. However, since such manipulations can be both
cost and time consuming, it is interesting to explore the ability of spontaneous SA of NPs,
avoiding the introduction and use of additional instrumentation. Thereby, techniques as spin-
coating or drop-casting would be preferable.
Periodicity with long-range ordering is hard to achieve experimentally using drying-
mediated SA, because of the dewetting of the solvent during the SA process. Dewetting is the
process that describes the rupture of a liquid film on the substrate and the formation of rims
and drops, and can occur at a solid–liquid or liquid–liquid interface. Moreover, other
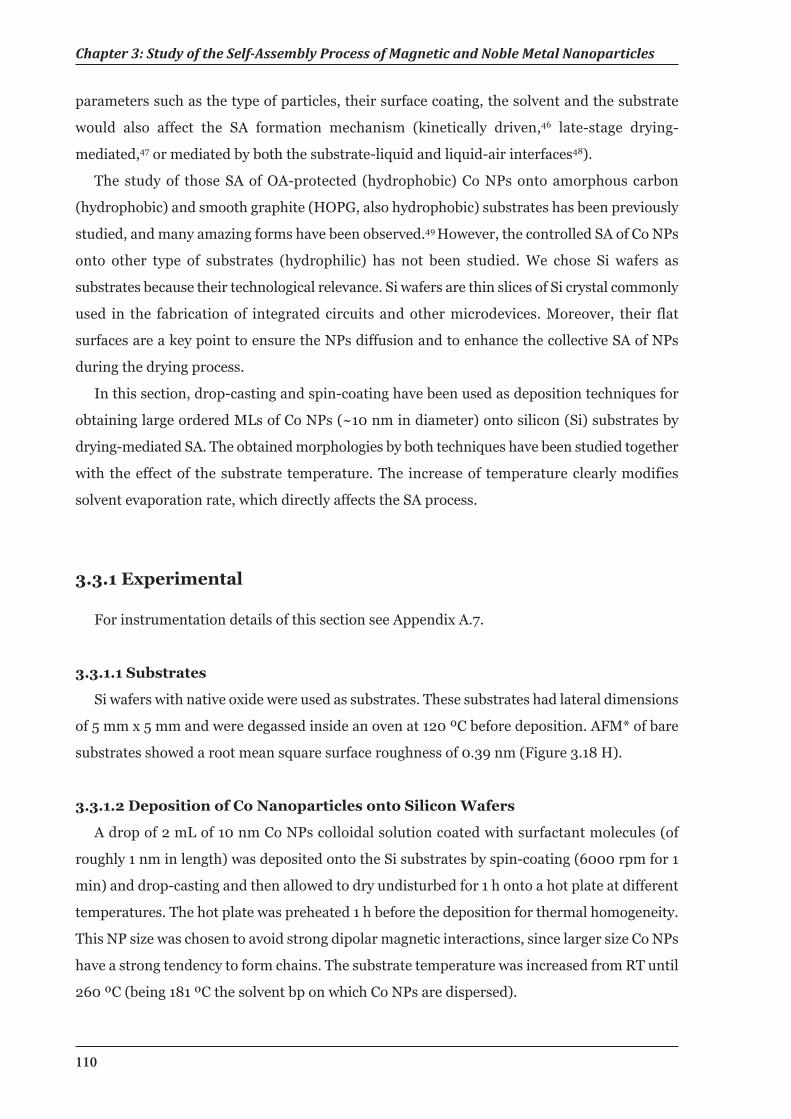
Chapter 3: Study of the Self-Assembly Process of Magnetic and Noble Metal Nanoparticles
110
parameters such as the type of particles, their surface coating, the solvent and the substrate
would also affect the SA formation mechanism (kinetically driven,46 late-stage drying-
mediated,47 or mediated by both the substrate-liquid and liquid-air interfaces48).
The study of those SA of OA-protected (hydrophobic) Co NPs onto amorphous carbon
(hydrophobic) and smooth graphite (HOPG, also hydrophobic) substrates has been previously
studied, and many amazing forms have been observed.49 However, the controlled SA of Co NPs
onto other type of substrates (hydrophilic) has not been studied. We chose Si wafers as
substrates because their technological relevance. Si wafers are thin slices of Si crystal commonly
used in the fabrication of integrated circuits and other microdevices. Moreover, their flat
surfaces are a key point to ensure the NPs diffusion and to enhance the collective SA of NPs
during the drying process.
In this section, drop-casting and spin-coating have been used as deposition techniques for
obtaining large ordered MLs of Co NPs (~10 nm in diameter) onto silicon (Si) substrates by
drying-mediated SA. The obtained morphologies by both techniques have been studied together
with the effect of the substrate temperature. The increase of temperature clearly modifies
solvent evaporation rate, which directly affects the SA process.
3.3.1 Experimental
For instrumentation details of this section see Appendix A.7.
3.3.1.1 Substrates
Si wafers with native oxide were used as substrates. These substrates had lateral dimensions
of 5 mm x 5 mm and were degassed inside an oven at 120 ºC before deposition. AFM* of bare
substrates showed a root mean square surface roughness of 0.39 nm (Figure 3.18 H).
3.3.1.2 Deposition of Co Nanoparticles onto Silicon Wafers
A drop of 2 mL of 10 nm Co NPs colloidal solution coated with surfactant molecules (of
roughly 1 nm in length) was deposited onto the Si substrates by spin-coating (6000 rpm for 1
min) and drop-casting and then allowed to dry undisturbed for 1 h onto a hot plate at different
temperatures. The hot plate was preheated 1 h before the deposition for thermal homogeneity.
This NP size was chosen to avoid strong dipolar magnetic interactions, since larger size Co NPs
have a strong tendency to form chains. The substrate temperature was increased from RT until
260 ºC (being 181 ºC the solvent bp on which Co NPs are dispersed).
3.3 Self-Assembly of Co Nanoparticles at Non Compatible Substrates: Silicon Wafers
111
3.3.2 Results and DiscussionDrop-casting and spin-coating are two deposition techniques commonly used in drying-
mediated SA. In the absence of intervention either by spin-coating or drop-casting, at RT,
islands and disordered MLs with holes and multilayered areas are observed. During
evaporation, the liquid film may become thin enough before the nucleation limit to form the
ML is reached, so that dewetting from the substrate occurs before superlattice formation.
Dewetting causes holes to open up in the liquid layer, and particles to move outward, away from
the holes, as the liquid evaporates, thus forming 3D islands. In addition to the effect of
dewetting, which prevents long-range periodicity, a recent AFM* study has suggested that the
inter-particle interaction might become strong enough to cause spinodal phase separation
during the liquid drying process.50 This effect would also cause particles to form percolating
domains. In order to obtain the SA of a single ML over extended regions, the substrate
temperature was increased from 25 up to 260 ºC.
At low magnification, the self-assembled morphologies obtained by both techniques at
different temperatures are similar. It has been found that at low substrate temperatures (25
ºC), instabilities that destroy the SA homogeneity appear frequently. Anisotropic islands, in the
case of spin-coating (Figure 3.19 A), and ribbon-like morphologies, in the case of drop-casting
(Figure 3.19 E), have been observed. These patterns suggest that the 2D growth kinetics
correspond to the spinodal nucleation and a subsequent coarsening process characteristic of
drying-mediated SA. Exist the general idea that extended times would lead to more organized
systems; however, it seems that other competitive forces develop when the evaporation time is
increased. It can be observed that the presence of instabilities falls when the temperature rises,
and in consequence the homogeneity of the ML increases (Figure 3.19). In spin-coating, no
irregularities disturb the ML (Figure 3.19 B), and in drop-casting, the instabilities associated
with drop shrinking are not present (Figure 3.19 F). It can be also observed, by means of spin-
coating, that if we continue increasing the substrate temperature near the solvent bp (181 ºC),
the evaporation mode changes from liquid-film vaporization to nucleate-boiling and the
nucleation phenomena (appearance and arising of gaseous bubbles from the substrate) and
strong turbulences destroy the long-range homogeneity of self-assembled MLs (Figure 3.19 C).
In addition, at temperatures over the bp the reduction of the time of packing causes cracks to
take place at the latest stages of the drying process (Figure 3.19 D). The cracking pattern
observed suggests that NPs are somehow bonded to the surface, because freely contracting films
do not crack this way.
It can be conclude that a way to suppress growth instabilities appears to be to increase the
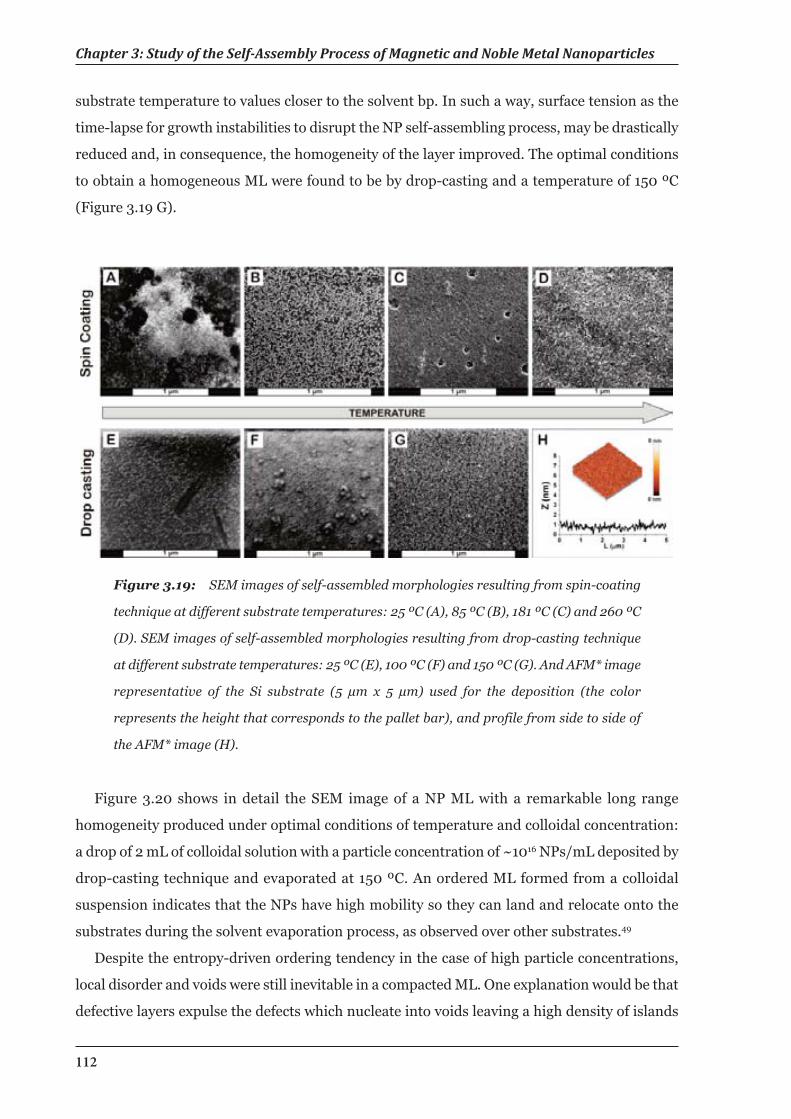
Chapter 3: Study of the Self-Assembly Process of Magnetic and Noble Metal Nanoparticles
112
substrate temperature to values closer to the solvent bp. In such a way, surface tension as the
time-lapse for growth instabilities to disrupt the NP self-assembling process, may be drastically
reduced and, in consequence, the homogeneity of the layer improved. The optimal conditions
to obtain a homogeneous ML were found to be by drop-casting and a temperature of 150 ºC
(Figure 3.19 G).
Figure 3.19: SEM images of self-assembled morphologies resulting from spin-coating
technique at different substrate temperatures: 25 ºC (A), 85 ºC (B), 181 ºC (C) and 260 ºC
(D). SEM images of self-assembled morphologies resulting from drop-casting technique
at different substrate temperatures: 25 ºC (E), 100 ºC (F) and 150 ºC (G). And AFM* image
representative of the Si substrate (5 µm x 5 µm) used for the deposition (the color
represents the height that corresponds to the pallet bar), and profile from side to side of
the AFM* image (H).
Figure 3.20 shows in detail the SEM image of a NP ML with a remarkable long range
homogeneity produced under optimal conditions of temperature and colloidal concentration:
a drop of 2 mL of colloidal solution with a particle concentration of ~1016 NPs/mL deposited by
drop-casting technique and evaporated at 150 ºC. An ordered ML formed from a colloidal
suspension indicates that the NPs have high mobility so they can land and relocate onto the
substrates during the solvent evaporation process, as observed over other substrates.49
Despite the entropy-driven ordering tendency in the case of high particle concentrations,
local disorder and voids were still inevitable in a compacted ML. One explanation would be that
defective layers expulse the defects which nucleate into voids leaving a high density of islands
113
3.3 Self-Assembly of Co Nanoparticles at Non Compatible Substrates: Silicon Wafers
Figure 3.20: SEM images of long-range self-assembled ML of 10 nm Co NPs formed
under optimal conditions (drop-casting at 150 ºC).
behind. The expulsion of defects to the border of the ordered area, or the occurrence of multiple
nucleation events on the substrate, induces the appearance of domain boundaries as a result of
a defective percolation process. Both mechanisms support the idea that particles are able to
move during the structure formation, i.e., there is still solvent left in contact with the substrate,
which is consistent with other observations.50 Moreover, depending on the size polydispersity
of the employed NPs different degrees of orders are obtained. Zones with narrow size
distribution produced long-range ordering. Besides, a sample with broader size distribution
shows that the assembly of the same size NPs is broken by the presence of other sized NPs. We
have used the 2D height–height correlation function (HHCF) (obtained with the software
Mountains) to analyze the degree of ordering in self-assembled MLs. Two zones of the same
sample and with different size dispersions (prepared by drop-casting at 150 ºC) were analyzed
(Figure 3.21). 1D HHCF graph analysis of zone 1 gives a distribution of the center-to-center
distance between nearest neighbors (dh), with a mean value of 7.0 nm and a full width at
medium height (FWMH) of 2.5 nm. The same analysis of zone 2 gives a mean value of 7.9 nm
with a much narrower FWMH of 1.2 nm. The correlation function for zone 1 shows a low
probability even for nearest neighbors. However, zones with narrower size distributions, like
zone 2, show hexagonal packing SA MLs with order beyond the eighth nearest neighbor.
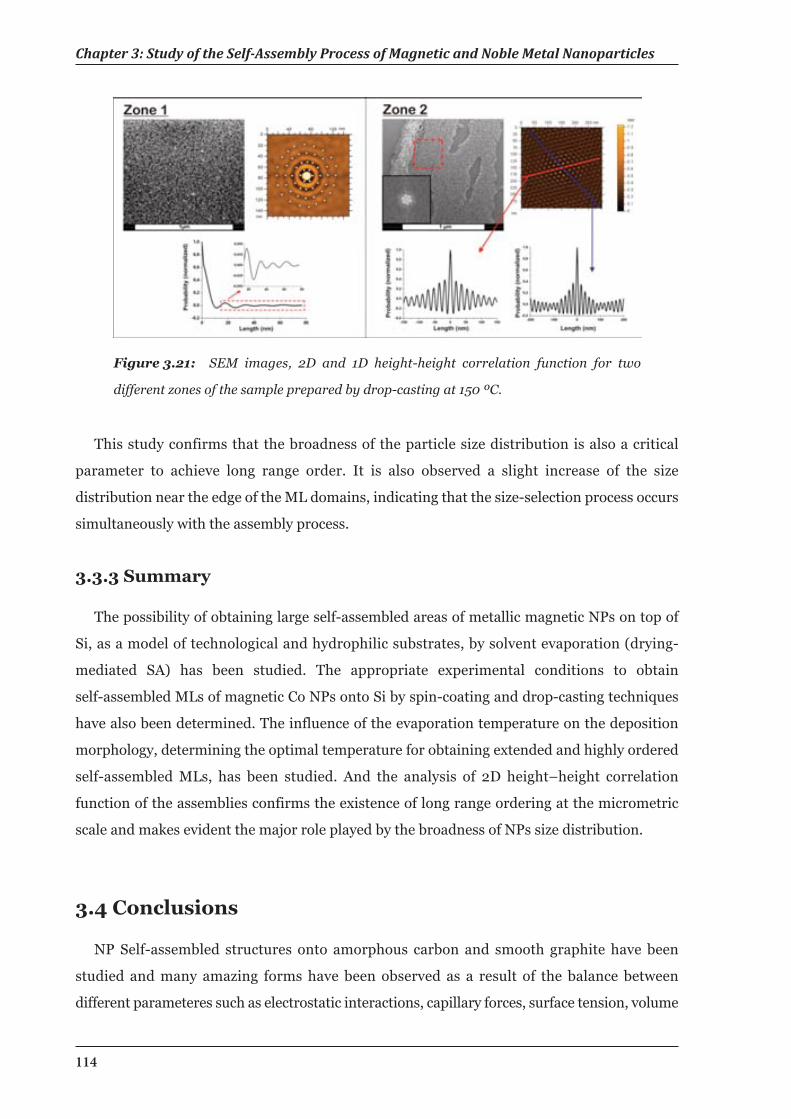
Chapter 3: Study of the Self-Assembly Process of Magnetic and Noble Metal Nanoparticles
114
Figure 3.21: SEM images, 2D and 1D height-height correlation function for two
different zones of the sample prepared by drop-casting at 150 ºC.
This study confirms that the broadness of the particle size distribution is also a critical
parameter to achieve long range order. It is also observed a slight increase of the size
distribution near the edge of the ML domains, indicating that the size-selection process occurs
simultaneously with the assembly process.
3.3.3 Summary
The possibility of obtaining large self-assembled areas of metallic magnetic NPs on top of
Si, as a model of technological and hydrophilic substrates, by solvent evaporation (drying-
mediated SA) has been studied. The appropriate experimental conditions to obtain
self-assembled MLs of magnetic Co NPs onto Si by spin-coating and drop-casting techniques
have also been determined. The influence of the evaporation temperature on the deposition
morphology, determining the optimal temperature for obtaining extended and highly ordered
self-assembled MLs, has been studied. And the analysis of 2D height–height correlation
function of the assemblies confirms the existence of long range ordering at the micrometric
scale and makes evident the major role played by the broadness of NPs size distribution.
3.4 Conclusions
NP Self-assembled structures onto amorphous carbon and smooth graphite have been
studied and many amazing forms have been observed as a result of the balance between
different parameteres such as electrostatic interactions, capillary forces, surface tension, volume
115
3.5 Conclusions
exclusion, substrate topography and affinity, as well as other parameters such as particle size,
shape and concentration. It is especially at the nanoscale that forces such as the vdW and the
directional dipolar interactions compete with comparable strength.
In a colloidal suspension, individual NCs may be viewed as analogous to dissolved molecules.
As the solvent evaporates from a droplet of such a colloid on a substrate, the solubility limit
will be exceeded and a superlattice of NCs can nucleate on the surface because of both particle-
particle and particle-substrate interactions. Due to the increasing of particle concentration, the
pinning effect becomes stronger because of the increased frequency of particle-particle
interactions. There is a reduction of the available positions for the NPs and an increase of the
self-assembled structure stability (once self-assembled, to move a NP require moveing its
neighbors). When the structure is formed, it may be strong enough to avoid perturbation when
dewetting finally occurs. Beyond the substrate affinity and monodispersity of the particles, it is
also important to maintain a wetting layer on the surface to allow mobility of the NCs and form
large structures. Thus, the use of solvents with bp greater than RT allows the control of the
evaporation rate by the choice of substrate temperature. This added thermal energy, permits
the particles to diffuse to their lowest energy sites during evaporation, producing well-defined
large periodical structures of Co NPs.It could be argued that the particles self-assemble in
solution at very high concentrations (prior to deposition), when the majority of the solvent has
been evaporated but they are still independent from the substrate, and then that the structure
is transferred to the substrate when the evaporation is completed. However, we would like to
note that DLS measurements showed no aggregation of the NPs before deposition (section
2.2.1.2). In addition, for the same particles, different structural patterns and dynamics were
obtained with different substrates, indicating that substrate affinity plays a crucial role in the
SA process.11
3.5 References
1. Murray, C. B.; Kagan, C. R.; Bawendi, M. G. "Synthesis and Characterization of
Monodisperse Nanocrystals and Close-Packed Nanocrystal Assemblies". Annual Review of
Materials Science 2000, 30, 545-610.
2. Puntes, V. F.; Bastus, N. G.; Pagonabarraga, I.; Iglesias, O.; Labarta, A.; Batlle, X.
"Nucleation Phenomenon in Nanoparticle Self-Assemblies". International Journal of
Nanotechnology 2005, 2, 62-70.
Chapter 3: Study of the Self-Assembly Process of Magnetic and Noble Metal Nanoparticles
116
3. Sun, S. H.; Murray, C. B. "Synthesis of Monodisperse Cobalt Nanocrystals and Their
Assembly into Magnetic Superlattices (Invited)". Journal of Applied Physics 1999, 85,
4325-4330.
4. Sun, S.; Murray, C. B.; Weller, D.; Folks, L.; Moser, A. "Monodisperse Fept
Nanoparticles and Ferromagnetic Fept Nanocrystal Superlattices". Science 2000, 287,
1989-1992.
5. Puntes, V. F.; Krishnan, K. M.; Alivisatos, A. P. "Colloidal Nanocrystal Shape and Size
Control: The Case of Cobalt". Science 2001, 291, 2115-2117.
6. Korgel, B. A.; Fitzmaurice, D. "Self-Assembly of Silver Nanocrystals into Two-
Dimensional Nanowire Arrays". Advanced Materials 1998, 10, 661-665.
7. Dabbousi, B. O.; Murray, C. B.; Rubner, M. F.; Bawendi, M. G. "Langmuir-Blodgett
Manipulation of Size-Selected Cdse Nanocrystallites". Chemistry of Materials 1994, 6, 216-
219.
8. Legrand, J.; Petit, C.; Pileni, M. P. "Domain Shapes and Superlattices Made of 8 Nm
Cobalt Nanocrystals: Fabrication and Magnetic Properties". Journal of Physical Chemistry
B 2001, 105, 5643-5646.
9. Giersig, M.; Mulvaney, P. "Preparation of Ordered Colloid Monolayers by
Electrophoretic Deposition". Langmuir 1993, 9, 3408-3413.
10.Rabani, E.; Reichman, D. R.; Geissler, P. L.; Brus, L. E. "Drying-Mediated Self-Assembly
of Nanoparticles". Nature 2003, 426, 271-274.
11. Pileni, M. P. "Nanocrystal Self-Assemblies: Fabrication and Collective Properties".
Journal of Physical Chemistry B 2001, 105, 3358-3371.
12. Nath, N.; Chilkoti, A. "Label-Free Biosensing by Surface Plasmon Resonance of
Nanoparticles on Glass: Optimization of Nanoparticle Size". Analytical Chemistry 2004,
76, 5370-5378.
13. Turkevich, J.; Stevenson, P. C.; Hillier, J. "A Study of the Nucleation and Growth
Processes in the Synthesis of Colloidal Gold". Discussions of the Faraday Society 1951, 55.
14. Frens, G. "Controlled Nucleation for Regulation of Particle-Size in Monodisperse Gold
Suspensions". Nature-Physical Science 1973, 241, 20-22.
117
3.5 References
15. Zhang, D.-F.; Zhang, Q.; Niu, L.-Y.; Jiang, L.; Yin, P.-G.; Guo, L. "Self-Assembly of Gold
Nanoparticles into Chain-Like Structures and Their Optical Properties". Journal of
Nanoparticle Research 2011, 13, 3923-3928.
16. Lin, X. M.; Jaeger, H. M.; Sorensen, C. M.; Klabunde, K. J. "Formation of Long-Range-
Ordered Nanocrystal Superlattices on Silicon Nitride Substrates". Journal of Physical
Chemistry B 2001, 105, 3353-3357.
17. Kim, B.; Tripp, S. L.; Wei, A. "Self-Organization of Large Gold Nanoparticle Arrays".
Journal of the American Chemical Society 2001, 123, 7955-7956.
18. Poddar, P.; Telem-Shafir, T.; Fried, T.; Markovich, G. "Dipolar Interactions in Two- and
Three-Dimensional Magnetic Nanoparticle Arrays". Physical Review B 2002, 66, 060403.
19. Penn, R. L.; Oskam, G.; Strathmann, T. J.; Searson, P. C.; Stone, A. T.; Veblen, D. R.
"Epitaxial Assembly in Aged Colloids". The Journal of Physical Chemistry B 2001, 105,
2177-2182.
20. Lee, E. J. H.; Ribeiro, C.; Longo, E.; Leite, E. R. "Oriented Attachment: An Effective
Mechanism in the Formation of Anisotropic Nanocrystals". The Journal of Physical
Chemistry B 2005, 109, 20842-20846.
21. Jana, N. R.; Gearheart, L.; Murphy, C. J. "Wet Chemical Synthesis of Silver Nanorods
and Nanowires of Controllable Aspect Ratio". Chemical Communications 2001, 617-618.
22.Nikoobakht, B.; El-Sayed, M. A. "Preparation and Growth Mechanism of Gold Nanorods
(Nrs) Using Seed-Mediated Growth Method". Chemistry of Materials 2003, 15, 1957-1962.
23.Xu, Z.-C.; Shen, C.-M.; Xiao, C.-W.; Yang, T.-Z.; Chen, S.-T.; Li, H.-L.; Gao, H.-J.
"Fabrication of Gold Nanorod Self-Assemblies from Rod and Sphere Mixtures Via Shape
Self-Selective Behavior". Chemical Physics Letters 2006, 432, 222-225.
24.Lim, S. I.; Ojea-Jimenez, I.; Varon, M.; Casals, E.; Arbiol, J.; Puntes, V. "Synthesis of
Platinum Cubes, Polypods, Cuboctahedrons, and Raspberries Assisted by Cobalt
Nanocrystals". Nano Letters 2010, 10, 964-973.
25.Moser, A.; Takano, K.; Margulies, D. T.; Albrecht, M.; Sonobe, Y.; Ikeda, Y.; Sun, S. H.;
Fullerton, E. E. "Magnetic Recording: Advancing into the Future". Journal of Physics D-
Applied Physics 2002, 35, R157-R167.
Chapter 3: Study of the Self-Assembly Process of Magnetic and Noble Metal Nanoparticles
118
26.Yamamoto, K.; Majetich, S. A.; McCartney, M. R.; Sachan, M.; Yamamuro, S.; Hirayama,
T. "Direct Visualization of Dipolar Ferromagnetic Domain Structures in Co Nanoparticle
Monolayers by Electron Holography". Applied Physics Letters 2008, 93.
27. Zeng, H.; Li, J.; Liu, J. P.; Wang, Z. L.; Sun, S. H. "Exchange-Coupled Nanocomposite
Magnets by Nanoparticle Self-Assembly". Nature 2002, 420, 395-398.
28.Zeng, H.; Li, J.; Liu, J. P.; Wang, Z. L.; Sun, S. "Exchange-Coupled Nanocomposite
Magnets by Nanoparticle Self-Assembly". Nature 2002, 420, 395-398.
29.Puntes, V. F.; Gorostiza, P.; Aruguete, D. M.; Bastus, N. G.; Alivisatos, A. P. "Collective
Behaviour in Two-Dimensional Cobalt Nanoparticle Assemblies Observed by Magnetic
Force Microscopy". Nature Materials 2004, 3, 263-268.
30. Georgescu, M.; Viota, J. L.; Klokkenburg, M.; Erne, B. H.; Vanmaekelbergh, D.; van
Emmichoven, P. A. Z. "Short-Range Magnetic Order in Two-Dimensional Cobalt-Ferrite
Nanoparticle Assemblies". Physical Review B 2008, 77.
31. Russier, V.; Petit, C.; Legrand, J.; Pileni, M. P. "Collective Magnetic Properties of Cobalt
Nanocrystals Self-Assembled in a Hexagonal Network: Theoretical Model Supported by
Experiments". Physical Review B 2000, 62, 3910-3916.
32.LaMer, V. K.; Dinegar, R. H. "Theory, Production and Mechanism of Formation of
Monodispersed Hydrosols". Journal of the American Chemical Society 1950, 72, 4847-
4854.
33.Stranski, I. N.; Krastanow, L. "Abhandlungen der Mathematisch-
Naturwissenschaftlichen Klasse IIb". Akademie der Wissenschaften Wien 1938, 146,
797-810.
34.Suzuki, T.; Weller, D.; Chang, C. A.; Savoy, R.; Huang, T.; Gurney, B. A.; Speriosu, V.
"Magnetic and Magnetooptic Properties of Thick Face-Centered-Cubic Co Single-Crystal
Films". Applied Physics Letters 1994, 64, 2736-2738.
35.Chantrell, R. W.; Popplewell, J.; Charles, S. W. "Measurements of Particle-Size
Distribution Parameters in Ferrofluids". IEEE Transactions on Magnetics 1978, 14, 975-
977.
36.Stoner, E. C.; Wohlfarth, E. P. "A Mechanism of Magnetic Hysteresis in Heterogeneous
Alloys". Philosophical Transactions of the Royal Society of London. Series A, Mathematical
119
3.5 References
and Physical Sciences 1948, 240, 44.
37. Skumryev, V.; Stoyanov, S.; Zhang, Y.; Hadjipanayis, G.; Givord, D.; Nogues, J. "Beating
the Superparamagnetic Limit with Exchange Bias". Nature 2003, 423, 850-853.
38.Alder, B. J.; Wainwright, T. E. "Phase Transition for a Hard Sphere System". Journal
of Chemical Physics 1957, 27, 1208-1209.
39.Martin, J. E.; Anderson, R. A.; Tigges, C. P. "Thermal Coarsening of Uniaxial and Biaxial
Field-Structured Composites". Journal of Chemical Physics 1999, 110, 4854-4866.
40. Korgel, B. A.; Fitzmaurice, D. "Small-Angle X-Ray-Scattering Study of Silver-
Nanocrystal Disorder-Order Phase Transitions". Physical Review B 1999, 59, 14191-14201.
41. Yamamuro, S.; Farrell, D. F.; Majetich, S. A. "Direct Imaging of Self-Assembled
Magnetic Nanoparticle Arrays: Phase Stability and Magnetic Effects on Morphology".
Physical Review B 2002, 65.
42.Sun, S. "Recent Advances in Chemical Synthesis, Self-Assembly, and Applications of
Fept Nanoparticles". Advanced Materials 2006, 18, 393-403.
43.Yakushiji, K.; Ernult, F.; Imamura, H.; Yamane, K.; Mitani, S.; Takanashi, K.; Takahashi,
S.; Maekawa, S.; Fujimori, H. "Enhanced Spin Accumulation and Novel Magnetotransport
in Nanoparticles". Nat Mater 2005, 4, 57-61.
44.Kotov, N. A.; Meldrum, F. C.; Wu, C.; Fendler, J. H. "Monoparticulate Layer and
Langmuir-Blodgett-Type Multiparticulate Layers of Size-Quantized Cadmium-Sulfide
Clusters - a Colloid-Chemical Approach to Superlattice Construction". Journal of Physical
Chemistry 1994, 98, 2735-2738.
45.Kotov, N. A., Multilayer Thin Films,eds. G. Decher and J. B. Schlenoff, Wiley-VCH
Verlag GmbH & Co., Weinheim, 2002, Chapter 8. .
46.Bigioni, T. P.; Lin, X. M.; Nguyen, T. T.; Corwin, E. I.; Witten, T. A.; Jaeger, H. M.
"Kinetically Driven Self Assembly of Highly Ordered Nanoparticle Monolayers". Nature
Materials 2006, 5, 265-270.
47.Tang, J.; Ge, G. L.; Brus, L. E. "Gas-Liquid-Solid Phase Transition Model for Two-
Dimensional Nanocrystal Self-Assembly on Graphite". Journal of Physical Chemistry B
2002, 106, 5653-5658.
Chapter 3: Study of the Self-Assembly Process of Magnetic and Noble Metal Nanoparticles
120
48. Korgel, B. A.; Fitzmaurice, D. "Condensation of Ordered Nanocrystal Thin Films".
Physical Review Letters 1998, 80, 3531-3534.
49.Varon, M.; Pena, L.; Balcells, L.; Skumryev, V.; Martinez, B.; Puntes, V. "Dipolar Driven
Spontaneous Self Assembly of Superparamagnetic Co Nanoparticles into Micrometric Rice-
Grain Like Structures". Langmuir 2010, 26, 109-116.
50.Ge, G. L.; Brus, L. "Evidence for Spinodal Phase Separation in Two-Dimensional
Nanocrystal Self-Assembly". Journal of Physical Chemistry B 2000, 104, 9573-9575.
121
In recent years, the dynamics of the assemblies of interacting magnetic NPs has been subject
of extensive research as much as tailoring the properties of solids made up of magnetic NPs
assemblies. This approach is being explored for a variety of applications such as logic gates,1
thermally stable magnetic memories2 or strong magnets for high-end electronics,3 among
others. Ordering on the NP scale produces changes in the energy band gaps of the crystalline
materials, which determine their chemical and physical properties.4 On the other hand, the lack
of symmetry can lead to distinctly different properties that are unique to non-crystalline
materials.5 This is especially true for magnetic NPs, where materials may achieve new magnetic
properties by mixing NPs of different hardness and saturation intensity.2 Thus, when
considering the magnetic NP assembly, the particle-particle interactions becomes a a
determining issue, dominating the macroscopic magnetic behavior.6 Therefore, through
changing the particle density, inter-distance, or space arrangement, the magnetic properties
might be controlled by design.7,8
An assembly of NPs can be considered as a meta-material where the atoms are replaced by
NPs, and where dipolar interactions between single-domain ferro- or ferrimagnetic NPs may
be strong and lead to magnetic ordering.7,9-11 Dipolar ferromagnetism (or superferromagnetism)
is a collective FM state of single domain FM particles.12 As a consequence, superferromagnetic
domains are expected to be similar to FM domains with the difference that atomic spins are
replaced by the super-spins of the single-domain NPs. Since the particles contain a surfactant
layer (they are generally separated a few nanometers) the exchange interactions between NP,
even in the dense assemblies, is negligible, and their mutual interactions are therefore
Chapter 4Electron Holography and LorentzMicroscopy of Self-Assembled CobaltNanoparticles Structures
Chapter 4: Electron Holography and Lorentz Microscopy of Self-Assembled Co NPs Structures
122
dominated by long-range dipole-dipole interactions. In addition, the magneto-crystalline
anisotropy energy of the magnetic NPs is known to be low, meaning that the magnetization
pattern of an assembly of spherical magnetic NPs is mainly determined by collective dipole-
dipole interactions. Georgescu et al. showed recently a MFM study, supported by numerical
simulations, which showed a strong tendency of the moments to arrange themselves in flux-
closure structures within 2D islands formed by spherical NPs.13 Furthermore, spin-glass like
behavior has been also demonstrated for these 2D systems of NPs.6,9
Studies based on microscopic imaging are usually difficult to carry out. Scanning probe
techniques such as spin-polarized scanning tunnelling microscopy (SP-STM)14,15 and
MFM,11,13,16,17 while being powerful for magnetic domain imaging, are generally difficult to be
used for imaging NP assemblies due to the significant interference of the morphological
corrugations. In contrast, electron probes are little affected by morphology and give vector
signals that are directly proportional to magnetization. Electron microscopy has revolutionized
the understanding of materials by completing the processing-structure-properties links down
to atomistic levels. In particular, TEM is a powerful and widely used tool for characterizing the
microstructure and chemistry of materials.18 But, an important limitation of most of the TEM
imaging modes is that only spatial distribution of image intensity is recorded. All information
about phase shift of the high-energy electron wave that passes through the specimen is lost.
However, in electron microscopy the objects are especially phase shifted according to the
Aharonov-Bohm effect.19 In TEM, there are two primary techniques for achieving useful
micromagnetic image contrast: Lorentz microscopy and electron holography. Both
techniques take advantage of the so-called Lorentz force, which occurs whenever an electron
beam passes through a region with transverse magnetic fields. Electron holography has the
ability to yield quantitative and local information about the nanoscale magnetic properties.
Studies of the magnetic fields in different materials such as NCs,20,21 nanostructures,22 thin
films23 or devices24 have been carried out. Recently, dipolar ferromagnetism has been observed
in array of different magnetic NPs. Majetich and co workers observed long-range dipolar
ferromagnetism in MLs of Co particles25 and, later on, the dipolar FM phase transition in a ML
of F3O4 NPs.26
In this chapter we report on different studies of magnetic self-assembled structures formed
by Co NPs by using Lorentz microscopy and electron holography. We mapped the in-plane
induced magnetic field in 2D self-assembled structures formed by ε-Co NPs and demonstrated
the formation of magnetically ordered regions and vortex states. A number of previous
simulations have predicted vortex structures due to magnetostatic interactions,27-29 perhaps
due to the finite sample size or the treatment of boundary conditions. Here we performed the
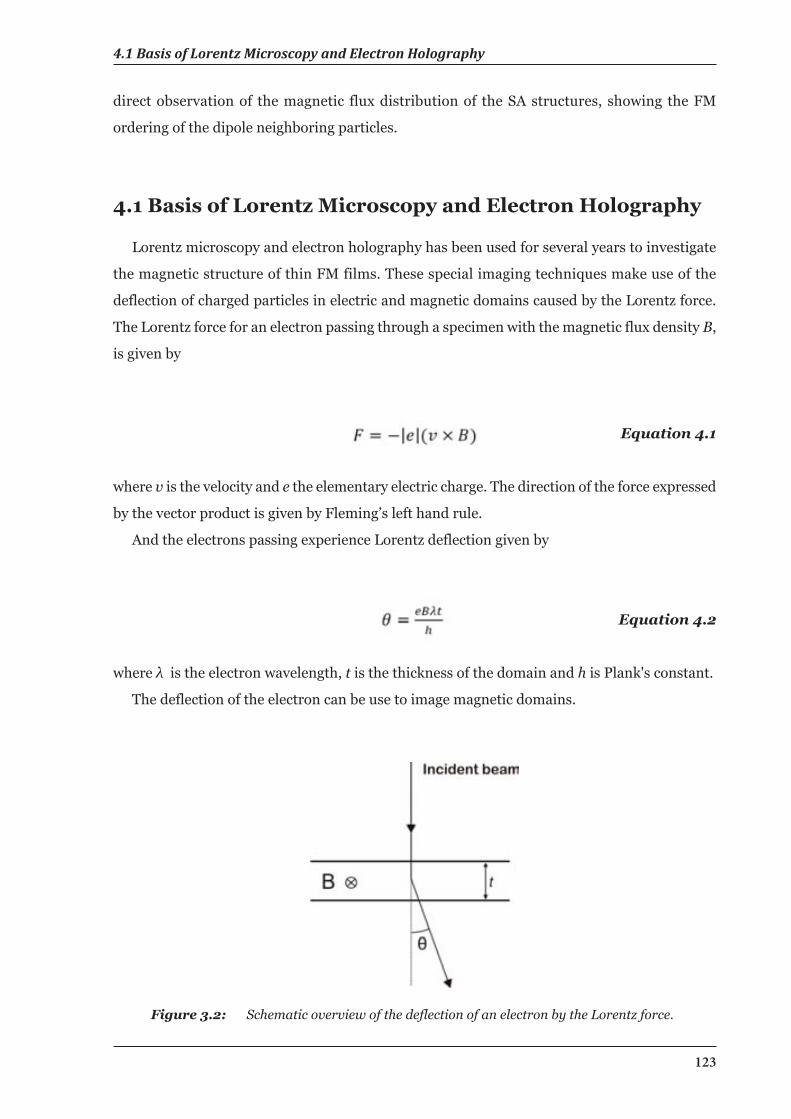
4.1 Basis of Lorentz Microscopy and Electron Holography
123
direct observation of the magnetic flux distribution of the SA structures, showing the FM
ordering of the dipole neighboring particles.
4.1 Basis of Lorentz Microscopy and Electron Holography
Lorentz microscopy and electron holography has been used for several years to investigate
the magnetic structure of thin FM films. These special imaging techniques make use of the
deflection of charged particles in electric and magnetic domains caused by the Lorentz force.
The Lorentz force for an electron passing through a specimen with the magnetic flux density B,
is given by
Equation 4.1
where v is the velocity and e the elementary electric charge. The direction of the force expressed
by the vector product is given by Fleming’s left hand rule.
And the electrons passing experience Lorentz deflection given by
Equation 4.2
where λ is the electron wavelength, t is the thickness of the domain and h is Plank's constant.
The deflection of the electron can be use to image magnetic domains.
Figure 3.2: Schematic overview of the deflection of an electron by the Lorentz force.
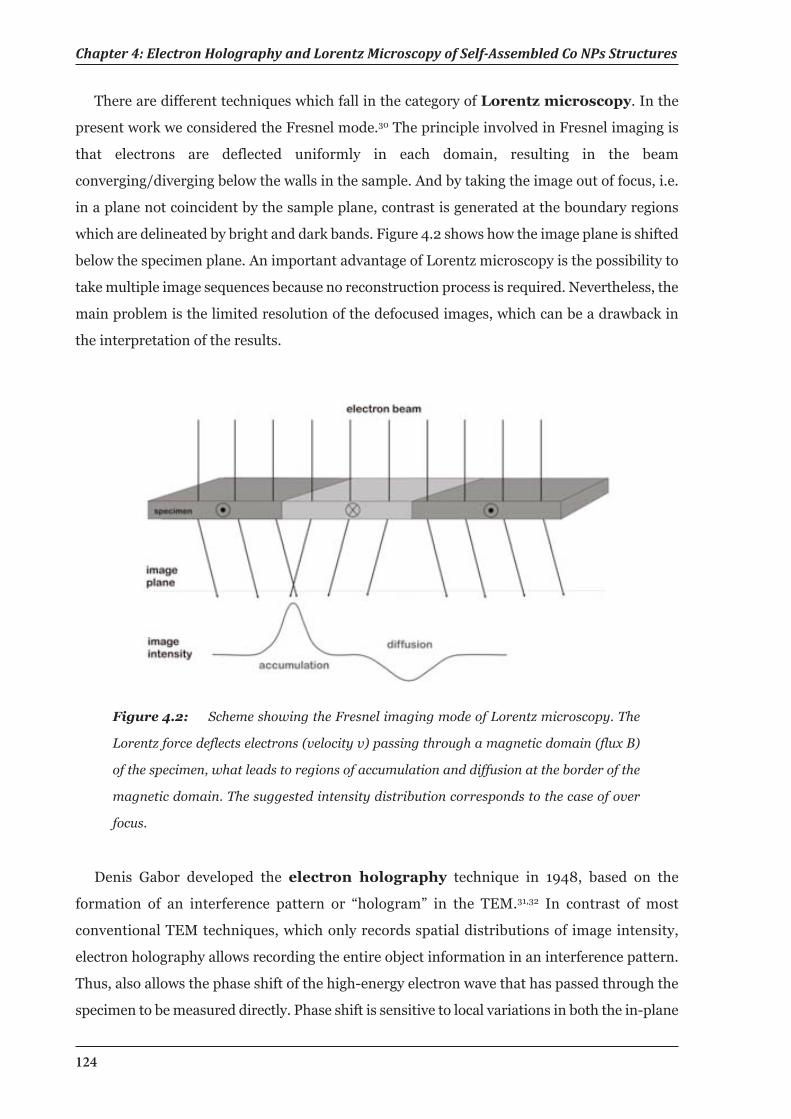
Chapter 4: Electron Holography and Lorentz Microscopy of Self-Assembled Co NPs Structures
124
There are different techniques which fall in the category of Lorentz microscopy. In the
present work we considered the Fresnel mode.30 The principle involved in Fresnel imaging is
that electrons are deflected uniformly in each domain, resulting in the beam
converging/diverging below the walls in the sample. And by taking the image out of focus, i.e.
in a plane not coincident by the sample plane, contrast is generated at the boundary regions
which are delineated by bright and dark bands. Figure 4.2 shows how the image plane is shifted
below the specimen plane. An important advantage of Lorentz microscopy is the possibility to
take multiple image sequences because no reconstruction process is required. Nevertheless, the
main problem is the limited resolution of the defocused images, which can be a drawback in
the interpretation of the results.
Figure 4.2: Scheme showing the Fresnel imaging mode of Lorentz microscopy. The
Lorentz force deflects electrons (velocity v) passing through a magnetic domain (flux B)
of the specimen, what leads to regions of accumulation and diffusion at the border of the
magnetic domain. The suggested intensity distribution corresponds to the case of over
focus.
Denis Gabor developed the electron holography technique in 1948, based on the
formation of an interference pattern or “hologram” in the TEM.31,32 In contrast of most
conventional TEM techniques, which only records spatial distributions of image intensity,
electron holography allows recording the entire object information in an interference pattern.
Thus, also allows the phase shift of the high-energy electron wave that has passed through the
specimen to be measured directly. Phase shift is sensitive to local variations in both the in-plane
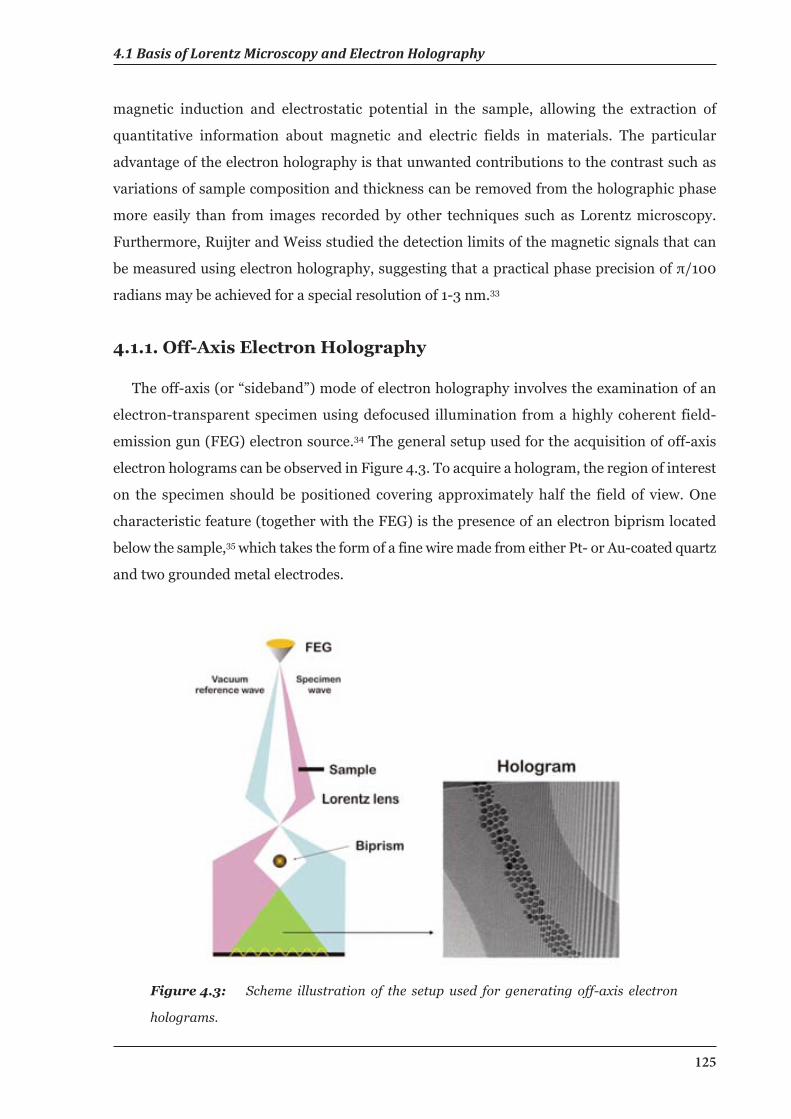
4.1 Basis of Lorentz Microscopy and Electron Holography
125
magnetic induction and electrostatic potential in the sample, allowing the extraction of
quantitative information about magnetic and electric fields in materials. The particular
advantage of the electron holography is that unwanted contributions to the contrast such as
variations of sample composition and thickness can be removed from the holographic phase
more easily than from images recorded by other techniques such as Lorentz microscopy.
Furthermore, Ruijter and Weiss studied the detection limits of the magnetic signals that can
be measured using electron holography, suggesting that a practical phase precision of π/100
radians may be achieved for a special resolution of 1-3 nm.33
4.1.1. Off-Axis Electron Holography
The off-axis (or “sideband”) mode of electron holography involves the examination of an
electron-transparent specimen using defocused illumination from a highly coherent field-
emission gun (FEG) electron source.34 The general setup used for the acquisition of off-axis
electron holograms can be observed in Figure 4.3. To acquire a hologram, the region of interest
on the specimen should be positioned covering approximately half the field of view. One
characteristic feature (together with the FEG) is the presence of an electron biprism located
below the sample,35 which takes the form of a fine wire made from either Pt- or Au-coated quartz
and two grounded metal electrodes.
Figure 4.3: Scheme illustration of the setup used for generating off-axis electron
holograms.
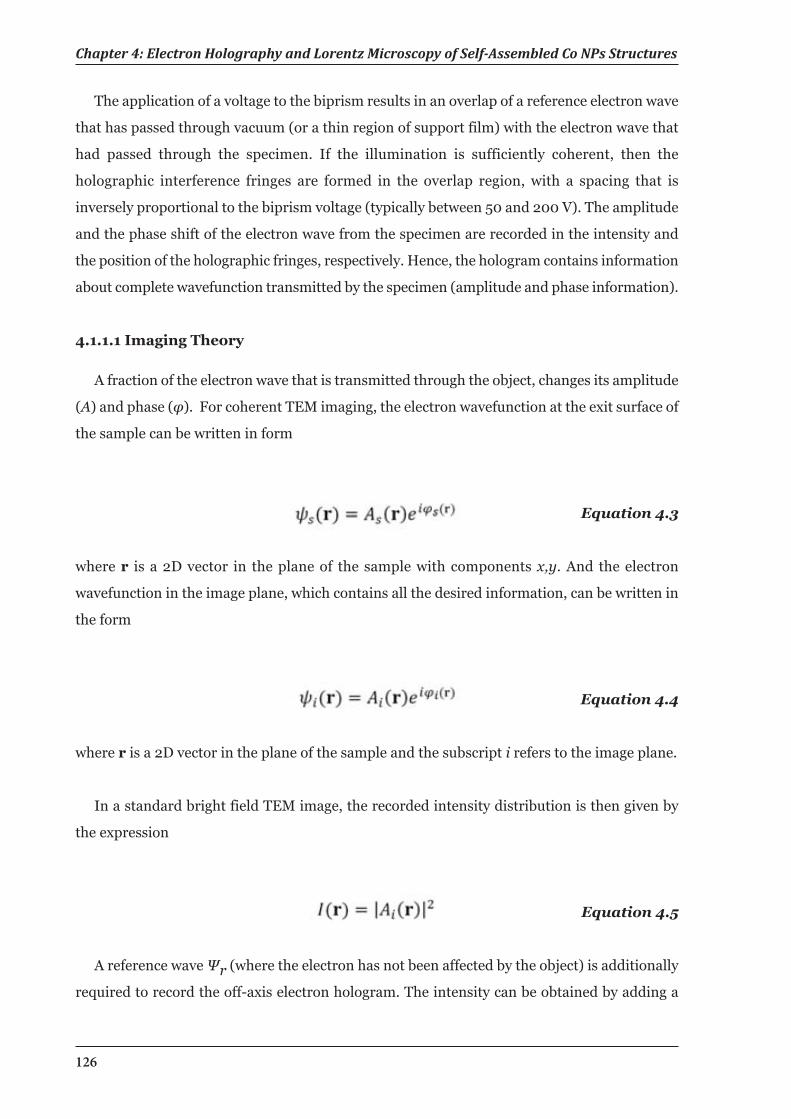
Chapter 4: Electron Holography and Lorentz Microscopy of Self-Assembled Co NPs Structures
126
The application of a voltage to the biprism results in an overlap of a reference electron wave
that has passed through vacuum (or a thin region of support film) with the electron wave that
had passed through the specimen. If the illumination is sufficiently coherent, then the
holographic interference fringes are formed in the overlap region, with a spacing that is
inversely proportional to the biprism voltage (typically between 50 and 200 V). The amplitude
and the phase shift of the electron wave from the specimen are recorded in the intensity and
the position of the holographic fringes, respectively. Hence, the hologram contains information
about complete wavefunction transmitted by the specimen (amplitude and phase information).
4.1.1.1 Imaging Theory
A fraction of the electron wave that is transmitted through the object, changes its amplitude
(A) and phase (φ). For coherent TEM imaging, the electron wavefunction at the exit surface of
the sample can be written in form
Equation 4.3
where r is a 2D vector in the plane of the sample with components x,y. And the electron
wavefunction in the image plane, which contains all the desired information, can be written in
the form
Equation 4.4
where r is a 2D vector in the plane of the sample and the subscript i refers to the image plane.
In a standard bright field TEM image, the recorded intensity distribution is then given by
the expression
Equation 4.5
A reference wave Ψr (where the electron has not been affected by the object) is additionally
required to record the off-axis electron hologram. The intensity can be obtained by adding a
4.1 Basis of Lorentz Microscopy and Electron Holography
127
plane wave with a tilt corresponding to q=qc to the electron wave, where qc is a 2D vector in
the reciprocal space.
Equation 4.6
Thus the image intensity can be described as the modulus squared of an electron
wavefunction that has been modified by the specimen and the objective lens. After passing the
biprism, the two beams interfere at the image plane giving the electron hologram with the
following intensity distribution
Equation 4.7
Equation 4.8
where the tilt of the reference wave is specified by the 2D reciprocal space vector q=qc. There
are three separated contributions to the intensity distribution in a hologram: the reference
wave, the image wave, and an additional set of cosinusoidal fringes with local phase shifts and
amplitudes that are exactly equivalent to the phase and amplitude of the electron wavefunction
in the image plane, φi and Ai, respectively.
4.1.1.2 Hologram Reconstruction
To obtain amplitude and phase information, the off-axis electron hologram is first Fourier
transformed. From Equation 4.8, the complex Fourier transform of the hologram is given by
(autocorrelation)
(sideband +1)
(sideband -1)
Equation 4.9
Chapter 4: Electron Holography and Lorentz Microscopy of Self-Assembled Co NPs Structures
128
The four terms of Equation 4.9 can be described as follows: A first peak at the reciprocal
space origin corresponding to the Fourier transform of the reference image (contribution of
electrons that propagate through the system without being affected by the sample), a second
peak centered on the origin corresponding to the Fourier transform of a bright-field TEM image
of the sample (yields the intensity), a third peak centered at q=-qc corresponding to the Fourier
transform of the desired image wavefunction, and a last peak centered at q=+qc corresponding
to Fourier transform of the complex conjugate of the wavefunction. These contributions are
visible as a central “autocorrelation” peak and two “sidebands” (containing identical
information) as can be observed in the Figure 4.4 b).
Both the amplitude and the phase can be numerically reconstructed following the procedure
described in Figure 4.4. After the Fourier transform of the holographic phase is made, two
sidebands can be detected. If one of the two sidebands are selected digitally with a circular
aperture and inverse Fourier transformed, the amplitude and phase of this complex
wavefunction can be then easily calculated (Figure 4.4 c,d).
An inverse Fourier transform will provide the complex image wave ψi=Aeiφ(r) or its complex
conjugated ψi*=Ae(-iφ(r)) depending on the choice of the sideband. We can now determine the
amplitude and phase φ of the image wave, whereby a negative sign of the phase can be reversed
by a contrast inversion. When the phase image is calculated digitally, some 2π pahse
discontinuities that are not related with the specimen feature can appear. This is because the
reconstruction process is unable to determine between a phase change of π and π+2π. In this
case a phase unwrapping is able to handle this problem by applying suitable algorithms before
the interpretation of the results.
Figure 4.4: Step-by-step procedure to reconstruct the phase from an electron
hologram of a self-assembled structure of Co NPs. a) Representative off-axis electron
hologram of a self-assembled Co NPs structure (inset: enlargement of the image showing
interference fringes within the sample). b) Fourier transform of the electron hologram.
c+d) Phase image obtained after inverse Fourier transformation of one of the side bands,
formed by the electrostatic (c) and the magnetic (d) component.
4.1 Basis of Lorentz Microscopy and Electron Holography
129
4.1.2. Magnetic and Mean Inner Potential Contributions to the Phase
The total phase image contains both the electric and the magnetic contribution to the phase
shift. Neglecting dynamical diffraction (i.e., assuming that the specimen is thin and weakly
diffracting), the phase shift can be expressed in the form
Equation 4.10
Equation 4.11
where φE is the electrostatic component of the phase shift, φM is the magnetic component of
the phase shift, and CE is the energy dependent constant
Equation 4.12
z is the incident electron beam direction, x is a direction in the plane of the specimen, AZ is the
component of the magnetic vector potential A in the beam direction, B┴ is the component of
the magnetic induction within and outside the specimen perpendicular to both x and z, V is the
electrostatic potential, λ is the (relativistic) electron wavelength, and E and Eo are, respectively,
the kinetic and rest mass energies of the incident electron.36 And CE has values of 7.29 x 10⁶,
6.53 x 10⁶, and 5.39 x 10⁶ rad V-1 m-1 at 200 kV, 300 kV and 1 MV, respectively.
The dominant contribution to the electrostatic potential is from the mean inner potential,
which depends on the local composition and density of the sample. If neither V nor B┴ varies
along the electron beam direction within a sample of thickness t, then
Equation 4.12
Determination of the phase gradient is particularly useful for a magnetic material because
of the following relationship (differentiating Equation 4.13):
Equation 4.14
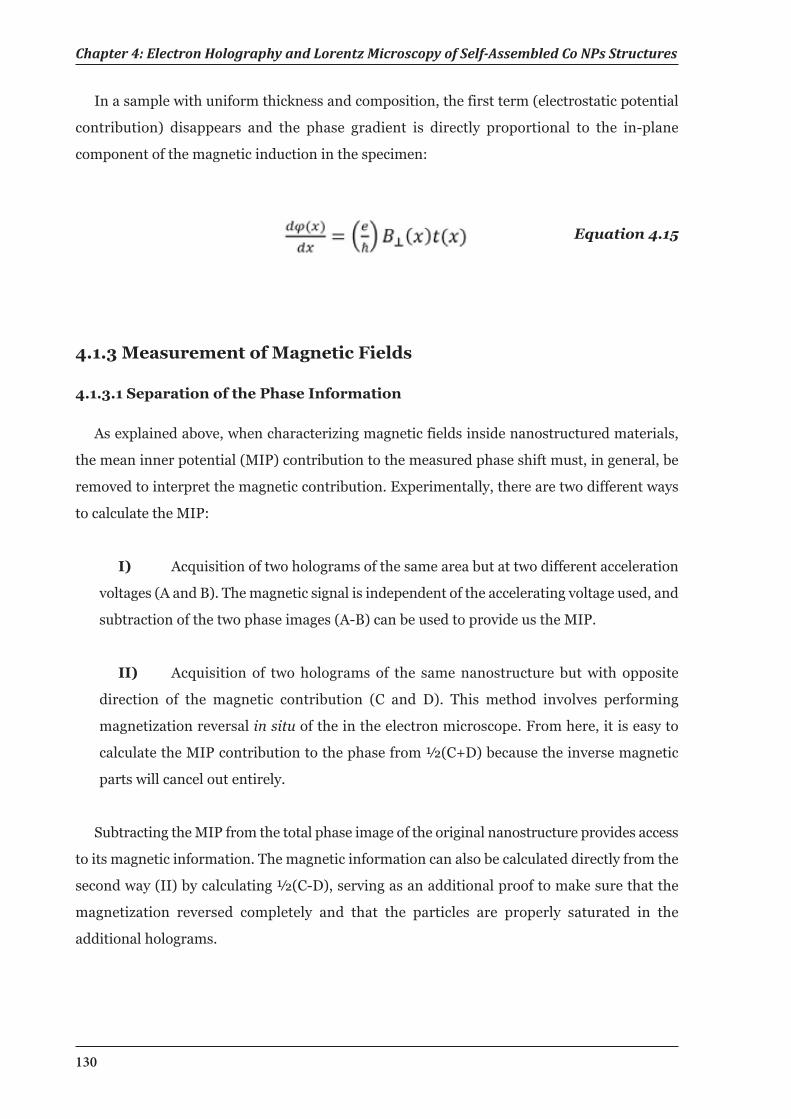
Chapter 4: Electron Holography and Lorentz Microscopy of Self-Assembled Co NPs Structures
130
In a sample with uniform thickness and composition, the first term (electrostatic potential
contribution) disappears and the phase gradient is directly proportional to the in-plane
component of the magnetic induction in the specimen:
Equation 4.15
4.1.3 Measurement of Magnetic Fields
4.1.3.1 Separation of the Phase Information
As explained above, when characterizing magnetic fields inside nanostructured materials,
the mean inner potential (MIP) contribution to the measured phase shift must, in general, be
removed to interpret the magnetic contribution. Experimentally, there are two different ways
to calculate the MIP:
I) Acquisition of two holograms of the same area but at two different acceleration
voltages (A and B). The magnetic signal is independent of the accelerating voltage used, and
subtraction of the two phase images (A-B) can be used to provide us the MIP.
II) Acquisition of two holograms of the same nanostructure but with opposite
direction of the magnetic contribution (C and D). This method involves performing
magnetization reversal in situ of the in the electron microscope. From here, it is easy to
calculate the MIP contribution to the phase from ½(C+D) because the inverse magnetic
parts will cancel out entirely.
Subtracting the MIP from the total phase image of the original nanostructure provides access
to its magnetic information. The magnetic information can also be calculated directly from the
second way (II) by calculating ½(C-D), serving as an additional proof to make sure that the
magnetization reversed completely and that the particles are properly saturated in the
additional holograms.
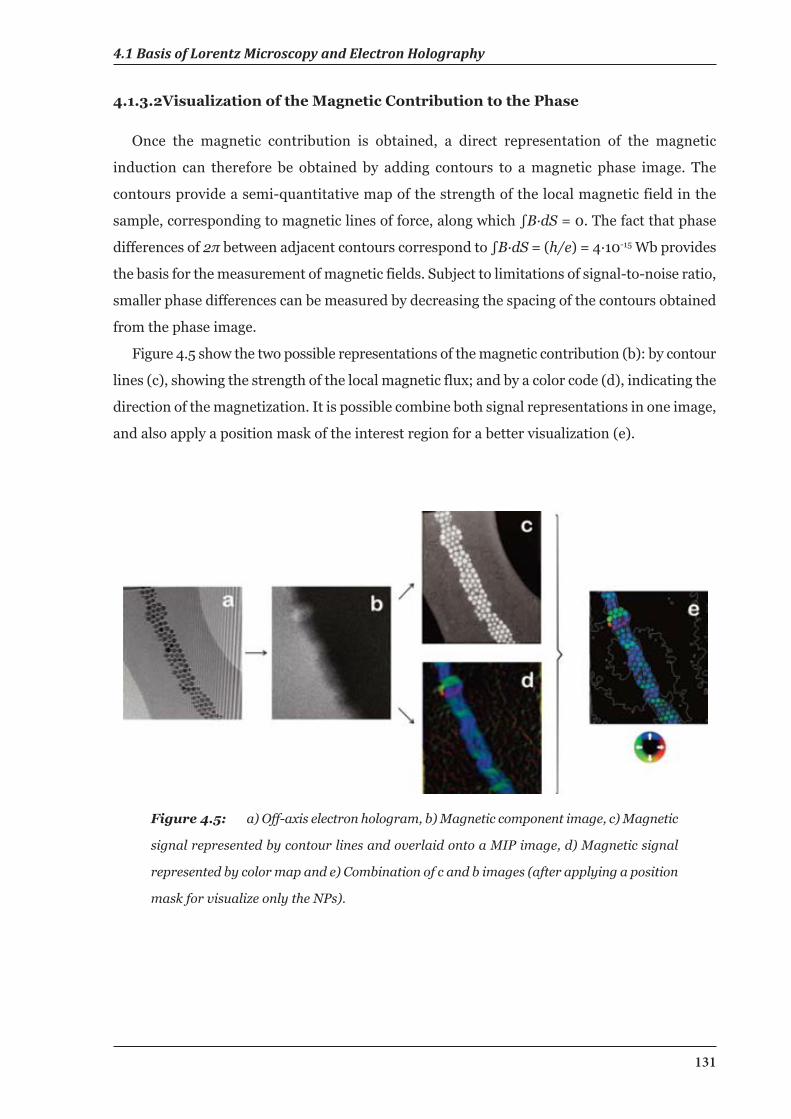
4.1 Basis of Lorentz Microscopy and Electron Holography
131
4.1.3.2Visualization of the Magnetic Contribution to the Phase
Once the magnetic contribution is obtained, a direct representation of the magnetic
induction can therefore be obtained by adding contours to a magnetic phase image. The
contours provide a semi-quantitative map of the strength of the local magnetic field in the
sample, corresponding to magnetic lines of force, along which ∫B·dS = 0. The fact that phase
differences of 2π between adjacent contours correspond to ∫B·dS = (h/e) = 4·10-15 Wb provides
the basis for the measurement of magnetic fields. Subject to limitations of signal-to-noise ratio,
smaller phase differences can be measured by decreasing the spacing of the contours obtained
from the phase image.
Figure 4.5 show the two possible representations of the magnetic contribution (b): by contour
lines (c), showing the strength of the local magnetic flux; and by a color code (d), indicating the
direction of the magnetization. It is possible combine both signal representations in one image,
and also apply a position mask of the interest region for a better visualization (e).
Figure 4.5: a) Off-axis electron hologram, b) Magnetic component image, c) Magnetic
signal represented by contour lines and overlaid onto a MIP image, d) Magnetic signal
represented by color map and e) Combination of c and b images (after applying a position
mask for visualize only the NPs).
Chapter 4: Electron Holography and Lorentz Microscopy of Self-Assembled Co NPs Structures
132
4.2. Electron Holography of Chain-like Self-AssembledStructures
4.2.1. Experimental
4.2.1.1 Sample Preparation
On drop of ~15 nm Co NPs solution was deposited onto a holey carbon-coated copper TEM
grid and left to dry inside a globe box. These dispersion conditions produced a variety of self-
assembled chain nanostructures as imaged by TEM (Figure 4.6). The magnetic induction of
different Co self-assembled structures forming chains while increasing the chain width has been
studied. Also, the grid was mounted in the TEM holder inside the globe box for avoid oxidation
of the Co particles.
4.2.1.2 Data Acquisition
Two sets of experiments were performed. Off-axis electron holograms were acquired in
Lorentz mode in a Titan Analytical 80-300ST TEM with a charge-coupled device (CCD) camera
and biprism voltages of 180 and 200 V for each set of experiments, respectively. The
experiments were performed at RT, and the acquisition time was of 6 s and 12 s. The direction
of magnetization in each chain was in situ reversed by tilting the sample by ± 60 degrees and
turning on the conventional microscope objective lens to apply a magnetic field (2 T) to the
sample parallel to the direction of the electron beam. Then, the objective lens was turned off
and the sample tilted back to 0 degrees for hologram acquisition in field-free conditions with
the particles at remanence. Following this procedure, the different holograms were recorded
with the chains magnetized in opposite directions and analyzed using Semper.41
4.2.2 Results and Discussion
Off-axis electron holography has been used to reveal the magnetic induction associated to
different distributions of self-assembled Co NPs. The first observations of the magnetic
induction in 2D self-assembled NPs structures with unprecedented resolution of ~5 nm, a
resolution smaller than the particle size, are shown. Long spontaneously formed chains are
commonly observed for individual magnetic NPs provided by the fact that the interacting forces
between the particles are suitably balanced. If the NP magnetic moments are too weak, or the
surfactants too long and bulky, the particles would not magnetically attract each other, which
would result in a hexagonal lattice. And if the magnetic moments of the particles are too strong,
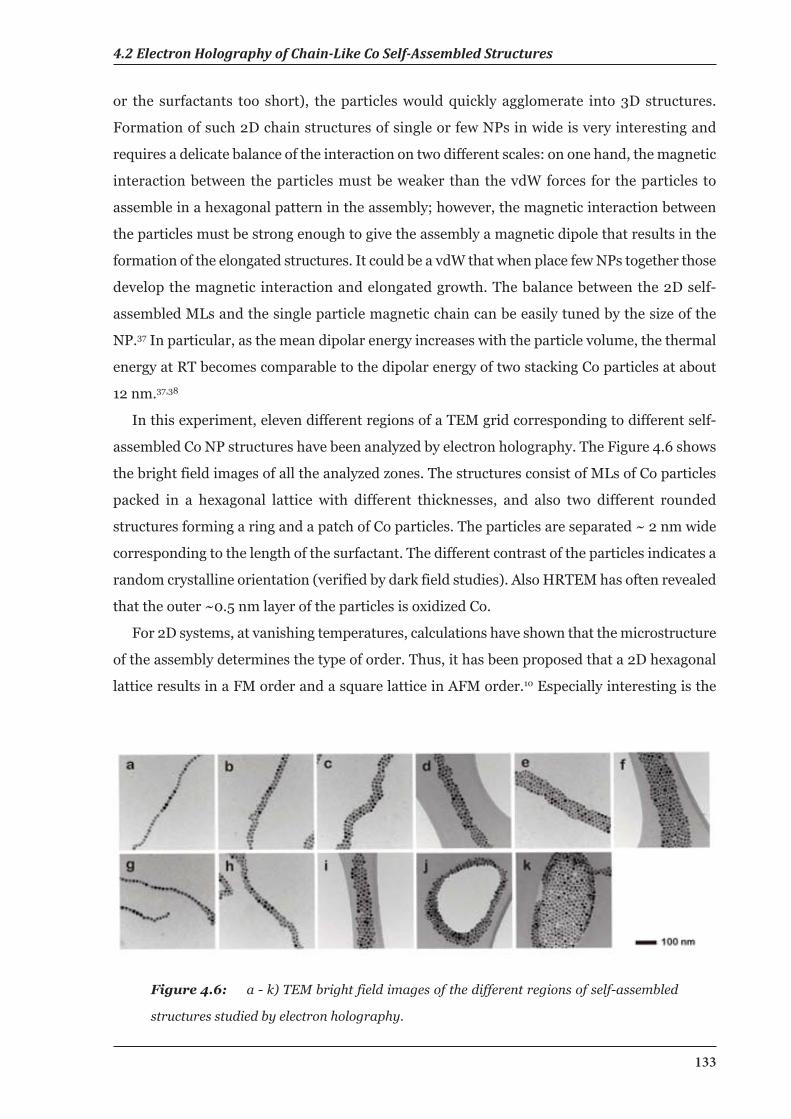
4.2 Electron Holography of Chain-Like Co Self-Assembled Structures
133
or the surfactants too short), the particles would quickly agglomerate into 3D structures.
Formation of such 2D chain structures of single or few NPs in wide is very interesting and
requires a delicate balance of the interaction on two different scales: on one hand, the magnetic
interaction between the particles must be weaker than the vdW forces for the particles to
assemble in a hexagonal pattern in the assembly; however, the magnetic interaction between
the particles must be strong enough to give the assembly a magnetic dipole that results in the
formation of the elongated structures. It could be a vdW that when place few NPs together those
develop the magnetic interaction and elongated growth. The balance between the 2D self-
assembled MLs and the single particle magnetic chain can be easily tuned by the size of the
NP.37 In particular, as the mean dipolar energy increases with the particle volume, the thermal
energy at RT becomes comparable to the dipolar energy of two stacking Co particles at about
12 nm.37,38
In this experiment, eleven different regions of a TEM grid corresponding to different self-
assembled Co NP structures have been analyzed by electron holography. The Figure 4.6 shows
the bright field images of all the analyzed zones. The structures consist of MLs of Co particles
packed in a hexagonal lattice with different thicknesses, and also two different rounded
structures forming a ring and a patch of Co particles. The particles are separated ~ 2 nm wide
corresponding to the length of the surfactant. The different contrast of the particles indicates a
random crystalline orientation (verified by dark field studies). Also HRTEM has often revealed
that the outer ~0.5 nm layer of the particles is oxidized Co.
For 2D systems, at vanishing temperatures, calculations have shown that the microstructure
of the assembly determines the type of order. Thus, it has been proposed that a 2D hexagonal
lattice results in a FM order and a square lattice in AFM order.10 Especially interesting is the
Figure 4.6: a - k) TEM bright field images of the different regions of self-assembled
structures studied by electron holography.
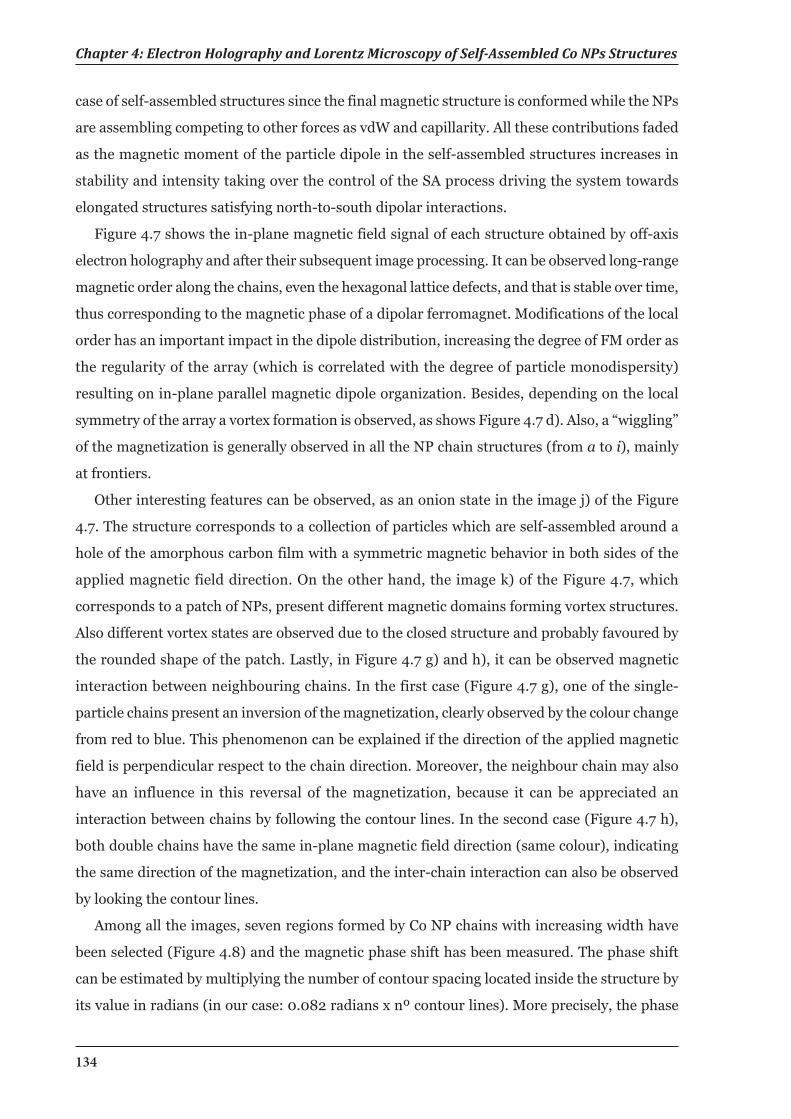
Chapter 4: Electron Holography and Lorentz Microscopy of Self-Assembled Co NPs Structures
134
case of self-assembled structures since the final magnetic structure is conformed while the NPs
are assembling competing to other forces as vdW and capillarity. All these contributions faded
as the magnetic moment of the particle dipole in the self-assembled structures increases in
stability and intensity taking over the control of the SA process driving the system towards
elongated structures satisfying north-to-south dipolar interactions.
Figure 4.7 shows the in-plane magnetic field signal of each structure obtained by off-axis
electron holography and after their subsequent image processing. It can be observed long-range
magnetic order along the chains, even the hexagonal lattice defects, and that is stable over time,
thus corresponding to the magnetic phase of a dipolar ferromagnet. Modifications of the local
order has an important impact in the dipole distribution, increasing the degree of FM order as
the regularity of the array (which is correlated with the degree of particle monodispersity)
resulting on in-plane parallel magnetic dipole organization. Besides, depending on the local
symmetry of the array a vortex formation is observed, as shows Figure 4.7 d). Also, a “wiggling”
of the magnetization is generally observed in all the NP chain structures (from a to i), mainly
at frontiers.
Other interesting features can be observed, as an onion state in the image j) of the Figure
4.7. The structure corresponds to a collection of particles which are self-assembled around a
hole of the amorphous carbon film with a symmetric magnetic behavior in both sides of the
applied magnetic field direction. On the other hand, the image k) of the Figure 4.7, which
corresponds to a patch of NPs, present different magnetic domains forming vortex structures.
Also different vortex states are observed due to the closed structure and probably favoured by
the rounded shape of the patch. Lastly, in Figure 4.7 g) and h), it can be observed magnetic
interaction between neighbouring chains. In the first case (Figure 4.7 g), one of the single-
particle chains present an inversion of the magnetization, clearly observed by the colour change
from red to blue. This phenomenon can be explained if the direction of the applied magnetic
field is perpendicular respect to the chain direction. Moreover, the neighbour chain may also
have an influence in this reversal of the magnetization, because it can be appreciated an
interaction between chains by following the contour lines. In the second case (Figure 4.7 h),
both double chains have the same in-plane magnetic field direction (same colour), indicating
the same direction of the magnetization, and the inter-chain interaction can also be observed
by looking the contour lines.
Among all the images, seven regions formed by Co NP chains with increasing width have
been selected (Figure 4.8) and the magnetic phase shift has been measured. The phase shift
can be estimated by multiplying the number of contour spacing located inside the structure by
its value in radians (in our case: 0.082 radians x nº contour lines). More precisely, the phase
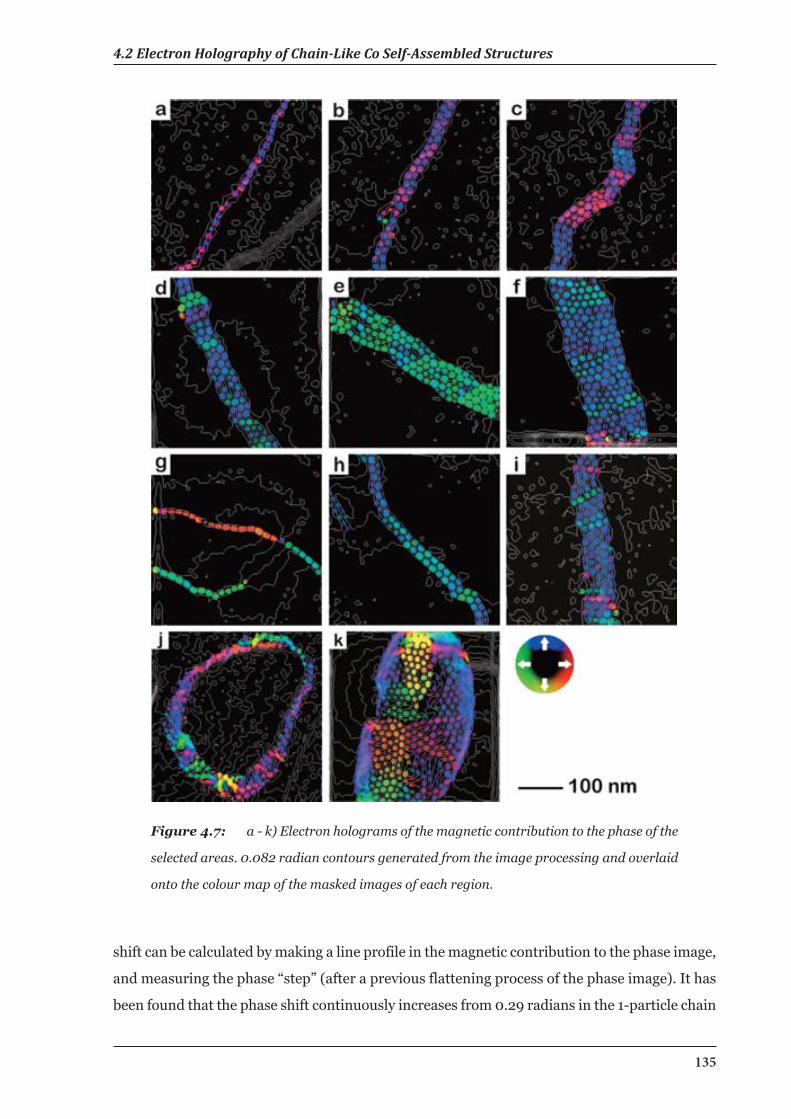
4.2 Electron Holography of Chain-Like Co Self-Assembled Structures
135
Figure 4.7: a - k) Electron holograms of the magnetic contribution to the phase of the
selected areas. 0.082 radian contours generated from the image processing and overlaid
onto the colour map of the masked images of each region.
shift can be calculated by making a line profile in the magnetic contribution to the phase image,
and measuring the phase “step” (after a previous flattening process of the phase image). It has
been found that the phase shift continuously increases from 0.29 radians in the 1-particle chain
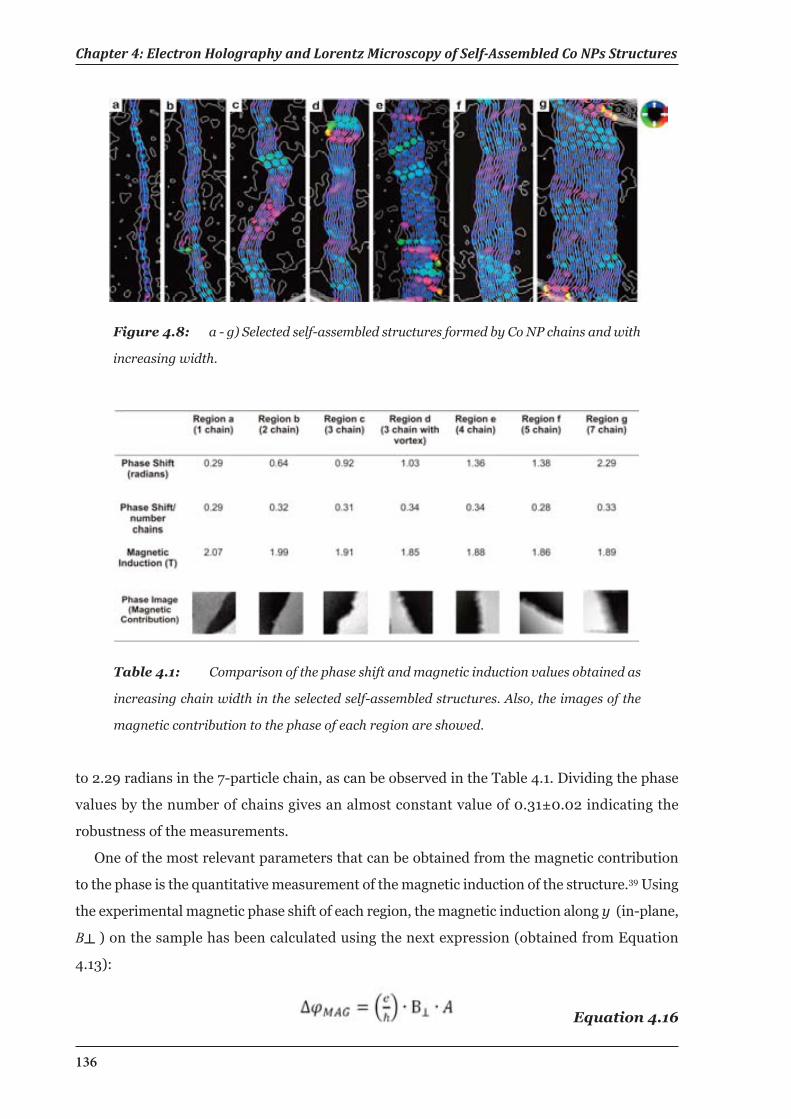
Chapter 4: Electron Holography and Lorentz Microscopy of Self-Assembled Co NPs Structures
136
Table 4.1: Comparison of the phase shift and magnetic induction values obtained as
increasing chain width in the selected self-assembled structures. Also, the images of the
magnetic contribution to the phase of each region are showed.
Figure 4.8: a - g) Selected self-assembled structures formed by Co NP chains and with
increasing width.
to 2.29 radians in the 7-particle chain, as can be observed in the Table 4.1. Dividing the phase
values by the number of chains gives an almost constant value of 0.31±0.02 indicating the
robustness of the measurements.
One of the most relevant parameters that can be obtained from the magnetic contribution
to the phase is the quantitative measurement of the magnetic induction of the structure.39 Using
the experimental magnetic phase shift of each region, the magnetic induction along y (in-plane,
B┴ ) on the sample has been calculated using the next expression (obtained from Equation
4.13):
Equation 4.16
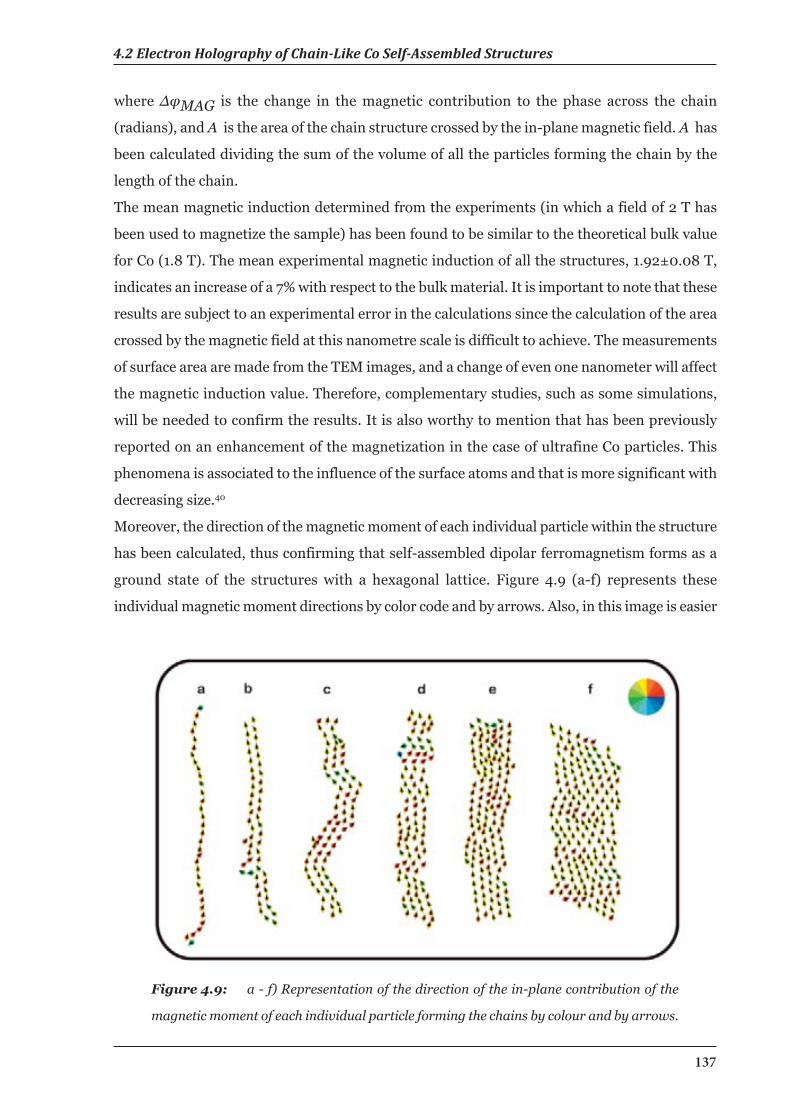
4.2 Electron Holography of Chain-Like Co Self-Assembled Structures
137
where ∆φMAG is the change in the magnetic contribution to the phase across the chain
(radians), and A is the area of the chain structure crossed by the in-plane magnetic field. A has
been calculated dividing the sum of the volume of all the particles forming the chain by the
length of the chain.
The mean magnetic induction determined from the experiments (in which a field of 2 T has
been used to magnetize the sample) has been found to be similar to the theoretical bulk value
for Co (1.8 T). The mean experimental magnetic induction of all the structures, 1.92±0.08 T,
indicates an increase of a 7% with respect to the bulk material. It is important to note that these
results are subject to an experimental error in the calculations since the calculation of the area
crossed by the magnetic field at this nanometre scale is difficult to achieve. The measurements
of surface area are made from the TEM images, and a change of even one nanometer will affect
the magnetic induction value. Therefore, complementary studies, such as some simulations,
will be needed to confirm the results. It is also worthy to mention that has been previously
reported on an enhancement of the magnetization in the case of ultrafine Co particles. This
phenomena is associated to the influence of the surface atoms and that is more significant with
decreasing size.40
Moreover, the direction of the magnetic moment of each individual particle within the structure
has been calculated, thus confirming that self-assembled dipolar ferromagnetism forms as a
ground state of the structures with a hexagonal lattice. Figure 4.9 (a-f) represents these
individual magnetic moment directions by color code and by arrows. Also, in this image is easier
Figure 4.9: a - f) Representation of the direction of the in-plane contribution of the
magnetic moment of each individual particle forming the chains by colour and by arrows.
Chapter 4: Electron Holography and Lorentz Microscopy of Self-Assembled Co NPs Structures
138
to observe the previously mentioned “wiggling” of the magnetization along the chains. And can
be clearly appreciated a relationship between the magnetic order and the geometric order.
Measurements of the central position of the particles (x,y), and the distances between
particle centres (r), together with changes in the magnetic moment direction (∆θm) between
all particles, are still in progress in order to correlate the geometric order with the magnetic
order with the help of simulations.
4.2.3 Summary
Off-axis electron holography has been used to map with a few nanometers resolution the in-
plane magnetic field in self-assembled structures formed by Co NPs of ~15 nm. It has been
demonstrated that self-assembled dipolar ferromagnetism forms as a ground state of the
structures with hexagonal particle lattices, even when they have some geometric disorder.
4.3. Electron Holography of Self-Assembled Co Structureswith Increasing Temperature
4.3.1 Experimental
4.3.1.1 Sample Preparation
One drop of diluted solution of ~11 nm Co NPs was deposited onto a holey carbon-coated
copper TEM grid and left to dry inside a globe box. Also, the grid was mounted in the TEM
holder fast to prevent the oxidation of the particles, being in contact with the air atmosphere
only for a few seconds. These dispersion conditions produced patches of 2D self-assembled
nanostructures as imaged by TEM (Figure 4.10). The magnetic induction of two different self-
assembled structures has been studied while increasing temperature.
4.3.1.2 Data Acquisition
Off-axis electron holograms were acquired in Lorentz mode in a Titan Analytical 80-300ST
TEM with a Gif CCD camera using biprism voltages of 180 V for the experiment. A heating
holder was used for increase the temperature of the sample from RT until 455 ºC. The direction
of magnetization was reversed in situ by tilting the sample ± 25 degrees, and turning on the
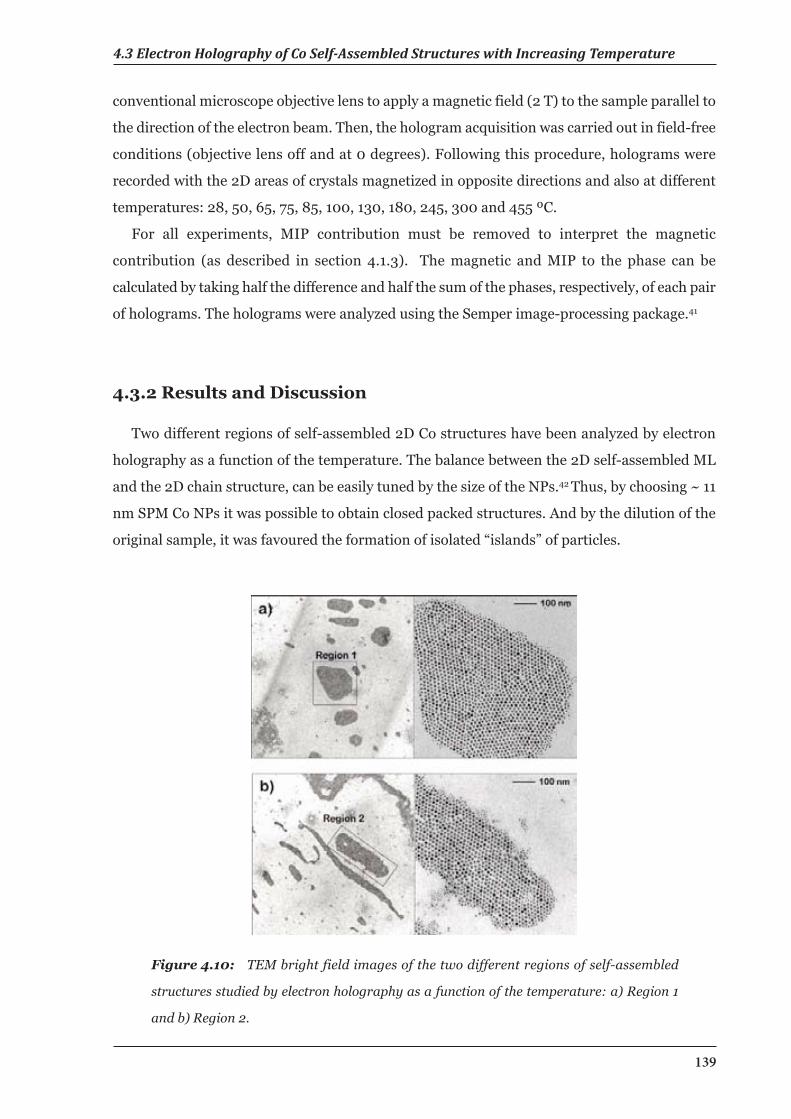
4.3 Electron Holography of Co Self-Assembled Structures with Increasing Temperature
139
conventional microscope objective lens to apply a magnetic field (2 T) to the sample parallel to
the direction of the electron beam. Then, the hologram acquisition was carried out in field-free
conditions (objective lens off and at 0 degrees). Following this procedure, holograms were
recorded with the 2D areas of crystals magnetized in opposite directions and also at different
temperatures: 28, 50, 65, 75, 85, 100, 130, 180, 245, 300 and 455 ºC.
For all experiments, MIP contribution must be removed to interpret the magnetic
contribution (as described in section 4.1.3). The magnetic and MIP to the phase can be
calculated by taking half the difference and half the sum of the phases, respectively, of each pair
of holograms. The holograms were analyzed using the Semper image-processing package.41
4.3.2 Results and Discussion
Two different regions of self-assembled 2D Co structures have been analyzed by electron
holography as a function of the temperature. The balance between the 2D self-assembled ML
and the 2D chain structure, can be easily tuned by the size of the NPs.42 Thus, by choosing ~ 11
nm SPM Co NPs it was possible to obtain closed packed structures. And by the dilution of the
original sample, it was favoured the formation of isolated “islands” of particles.
Figure 4.10: TEM bright field images of the two different regions of self-assembled
structures studied by electron holography as a function of the temperature: a) Region 1
and b) Region 2.
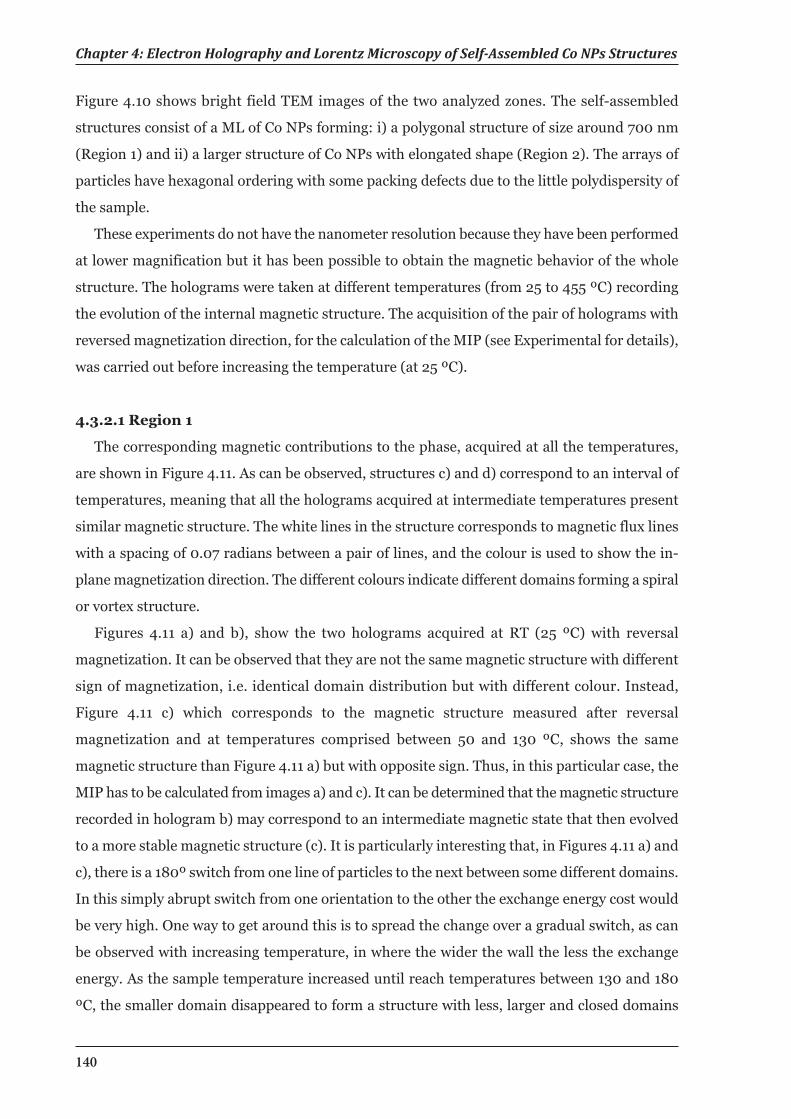
Chapter 4: Electron Holography and Lorentz Microscopy of Self-Assembled Co NPs Structures
140
Figure 4.10 shows bright field TEM images of the two analyzed zones. The self-assembled
structures consist of a ML of Co NPs forming: i) a polygonal structure of size around 700 nm
(Region 1) and ii) a larger structure of Co NPs with elongated shape (Region 2). The arrays of
particles have hexagonal ordering with some packing defects due to the little polydispersity of
the sample.
These experiments do not have the nanometer resolution because they have been performed
at lower magnification but it has been possible to obtain the magnetic behavior of the whole
structure. The holograms were taken at different temperatures (from 25 to 455 ºC) recording
the evolution of the internal magnetic structure. The acquisition of the pair of holograms with
reversed magnetization direction, for the calculation of the MIP (see Experimental for details),
was carried out before increasing the temperature (at 25 ºC).
4.3.2.1 Region 1
The corresponding magnetic contributions to the phase, acquired at all the temperatures,
are shown in Figure 4.11. As can be observed, structures c) and d) correspond to an interval of
temperatures, meaning that all the holograms acquired at intermediate temperatures present
similar magnetic structure. The white lines in the structure corresponds to magnetic flux lines
with a spacing of 0.07 radians between a pair of lines, and the colour is used to show the in-
plane magnetization direction. The different colours indicate different domains forming a spiral
or vortex structure.
Figures 4.11 a) and b), show the two holograms acquired at RT (25 ºC) with reversal
magnetization. It can be observed that they are not the same magnetic structure with different
sign of magnetization, i.e. identical domain distribution but with different colour. Instead,
Figure 4.11 c) which corresponds to the magnetic structure measured after reversal
magnetization and at temperatures comprised between 50 and 130 ºC, shows the same
magnetic structure than Figure 4.11 a) but with opposite sign. Thus, in this particular case, the
MIP has to be calculated from images a) and c). It can be determined that the magnetic structure
recorded in hologram b) may correspond to an intermediate magnetic state that then evolved
to a more stable magnetic structure (c). It is particularly interesting that, in Figures 4.11 a) and
c), there is a 180º switch from one line of particles to the next between some different domains.
In this simply abrupt switch from one orientation to the other the exchange energy cost would
be very high. One way to get around this is to spread the change over a gradual switch, as can
be observed with increasing temperature, in where the wider the wall the less the exchange
energy. As the sample temperature increased until reach temperatures between 130 and 180
ºC, the smaller domain disappeared to form a structure with less, larger and closed domains
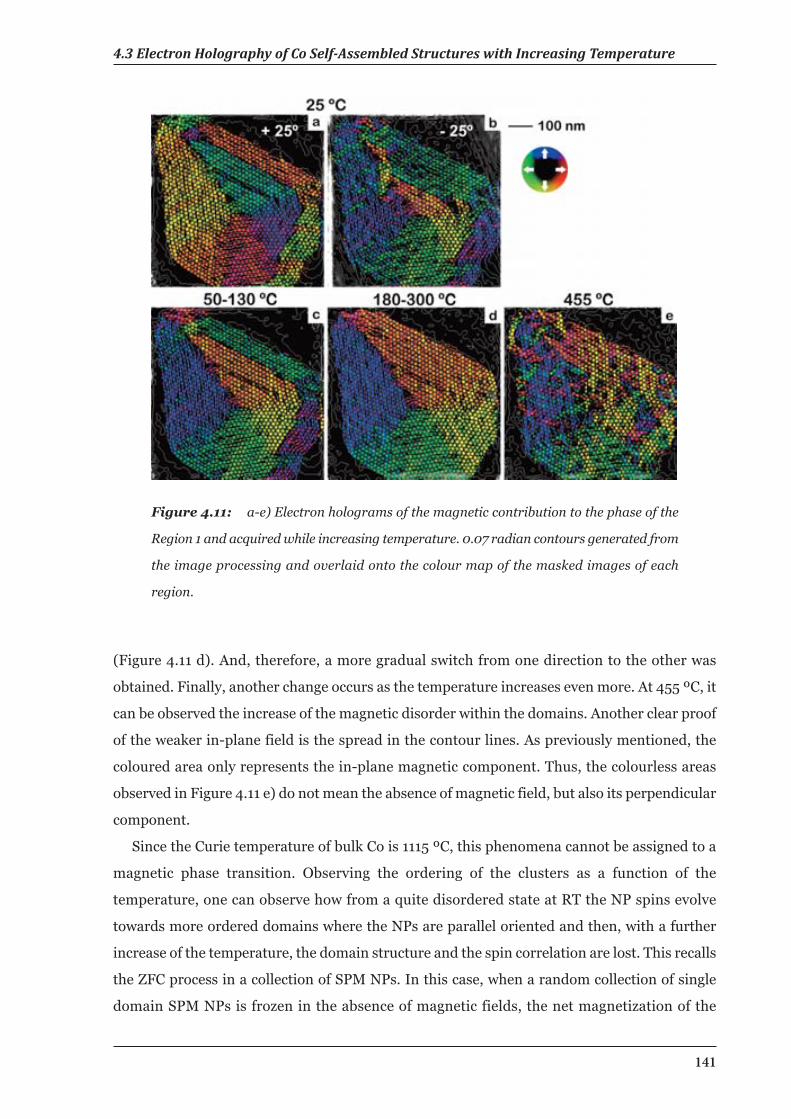
4.3 Electron Holography of Co Self-Assembled Structures with Increasing Temperature
141
(Figure 4.11 d). And, therefore, a more gradual switch from one direction to the other was
obtained. Finally, another change occurs as the temperature increases even more. At 455 ºC, it
can be observed the increase of the magnetic disorder within the domains. Another clear proof
of the weaker in-plane field is the spread in the contour lines. As previously mentioned, the
coloured area only represents the in-plane magnetic component. Thus, the colourless areas
observed in Figure 4.11 e) do not mean the absence of magnetic field, but also its perpendicular
component.
Since the Curie temperature of bulk Co is 1115 ºC, this phenomena cannot be assigned to a
magnetic phase transition. Observing the ordering of the clusters as a function of the
temperature, one can observe how from a quite disordered state at RT the NP spins evolve
towards more ordered domains where the NPs are parallel oriented and then, with a further
increase of the temperature, the domain structure and the spin correlation are lost. This recalls
the ZFC process in a collection of SPM NPs. In this case, when a random collection of single
domain SPM NPs is frozen in the absence of magnetic fields, the net magnetization of the
Figure 4.11: a-e) Electron holograms of the magnetic contribution to the phase of the
Region 1 and acquired while increasing temperature. 0.07 radian contours generated from
the image processing and overlaid onto the colour map of the masked images of each
region.
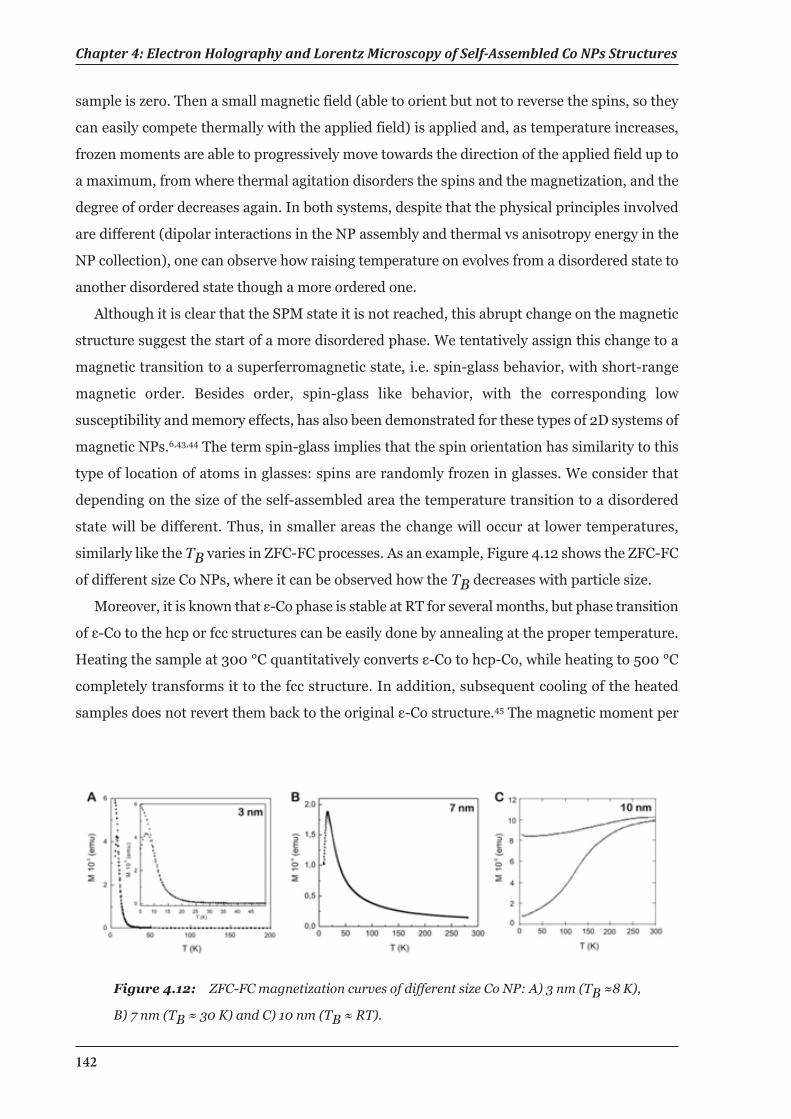
Chapter 4: Electron Holography and Lorentz Microscopy of Self-Assembled Co NPs Structures
142
sample is zero. Then a small magnetic field (able to orient but not to reverse the spins, so they
can easily compete thermally with the applied field) is applied and, as temperature increases,
frozen moments are able to progressively move towards the direction of the applied field up to
a maximum, from where thermal agitation disorders the spins and the magnetization, and the
degree of order decreases again. In both systems, despite that the physical principles involved
are different (dipolar interactions in the NP assembly and thermal vs anisotropy energy in the
NP collection), one can observe how raising temperature on evolves from a disordered state to
another disordered state though a more ordered one.
Although it is clear that the SPM state it is not reached, this abrupt change on the magnetic
structure suggest the start of a more disordered phase. We tentatively assign this change to a
magnetic transition to a superferromagnetic state, i.e. spin-glass behavior, with short-range
magnetic order. Besides order, spin-glass like behavior, with the corresponding low
susceptibility and memory effects, has also been demonstrated for these types of 2D systems of
magnetic NPs.6,43,44 The term spin-glass implies that the spin orientation has similarity to this
type of location of atoms in glasses: spins are randomly frozen in glasses. We consider that
depending on the size of the self-assembled area the temperature transition to a disordered
state will be different. Thus, in smaller areas the change will occur at lower temperatures,
similarly like the TB varies in ZFC-FC processes. As an example, Figure 4.12 shows the ZFC-FC
of different size Co NPs, where it can be observed how the TB decreases with particle size.
Moreover, it is known that ε-Co phase is stable at RT for several months, but phase transition
of ε-Co to the hcp or fcc structures can be easily done by annealing at the proper temperature.
Heating the sample at 300 °C quantitatively converts ε-Co to hcp-Co, while heating to 500 °C
completely transforms it to the fcc structure. In addition, subsequent cooling of the heated
samples does not revert them back to the original ε-Co structure.45 The magnetic moment per
Figure 4.12: ZFC-FC magnetization curves of different size Co NP: A) 3 nm (TB ≈8 K),
B) 7 nm (TB ≈ 30 K) and C) 10 nm (TB ≈ RT).
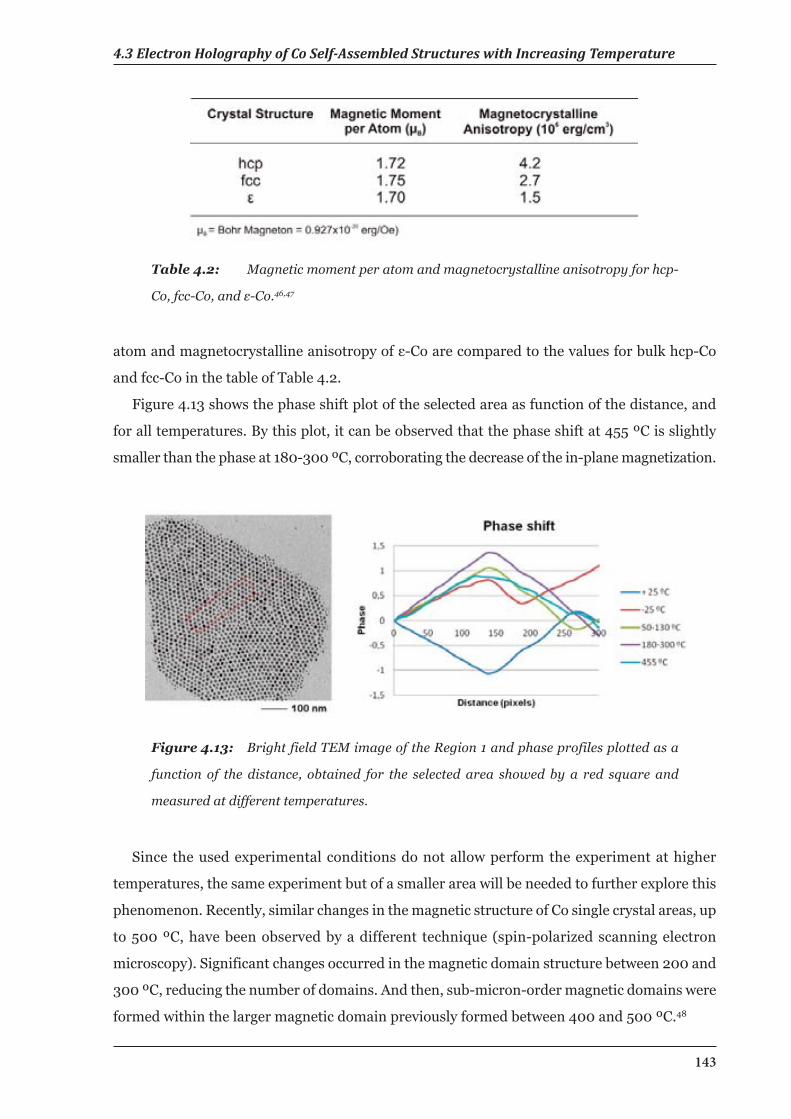
4.3 Electron Holography of Co Self-Assembled Structures with Increasing Temperature
143
atom and magnetocrystalline anisotropy of ε-Co are compared to the values for bulk hcp-Co
and fcc-Co in the table of Table 4.2.
Figure 4.13 shows the phase shift plot of the selected area as function of the distance, and
for all temperatures. By this plot, it can be observed that the phase shift at 455 ºC is slightly
smaller than the phase at 180-300 ºC, corroborating the decrease of the in-plane magnetization.
Table 4.2: Magnetic moment per atom and magnetocrystalline anisotropy for hcp-
Co, fcc-Co, and ε-Co.46,47
Figure 4.13: Bright field TEM image of the Region 1 and phase profiles plotted as a
function of the distance, obtained for the selected area showed by a red square and
measured at different temperatures.
Since the used experimental conditions do not allow perform the experiment at higher
temperatures, the same experiment but of a smaller area will be needed to further explore this
phenomenon. Recently, similar changes in the magnetic structure of Co single crystal areas, up
to 500 ºC, have been observed by a different technique (spin-polarized scanning electron
microscopy). Significant changes occurred in the magnetic domain structure between 200 and
300 ºC, reducing the number of domains. And then, sub-micron-order magnetic domains were
formed within the larger magnetic domain previously formed between 400 and 500 ºC.48
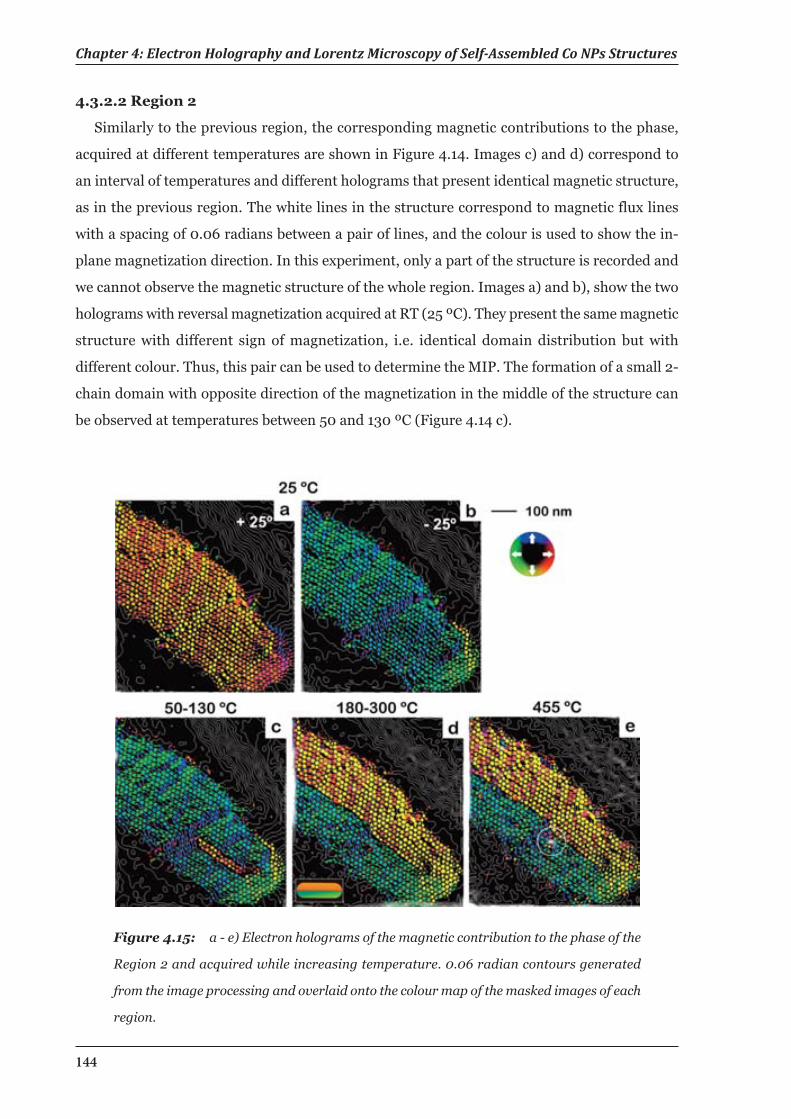
Chapter 4: Electron Holography and Lorentz Microscopy of Self-Assembled Co NPs Structures
144
4.3.2.2 Region 2
Similarly to the previous region, the corresponding magnetic contributions to the phase,
acquired at different temperatures are shown in Figure 4.14. Images c) and d) correspond to
an interval of temperatures and different holograms that present identical magnetic structure,
as in the previous region. The white lines in the structure correspond to magnetic flux lines
with a spacing of 0.06 radians between a pair of lines, and the colour is used to show the in-
plane magnetization direction. In this experiment, only a part of the structure is recorded and
we cannot observe the magnetic structure of the whole region. Images a) and b), show the two
holograms with reversal magnetization acquired at RT (25 ºC). They present the same magnetic
structure with different sign of magnetization, i.e. identical domain distribution but with
different colour. Thus, this pair can be used to determine the MIP. The formation of a small 2-
chain domain with opposite direction of the magnetization in the middle of the structure can
be observed at temperatures between 50 and 130 ºC (Figure 4.14 c).
Figure 4.15: a - e) Electron holograms of the magnetic contribution to the phase of the
Region 2 and acquired while increasing temperature. 0.06 radian contours generated
from the image processing and overlaid onto the colour map of the masked images of each
region.
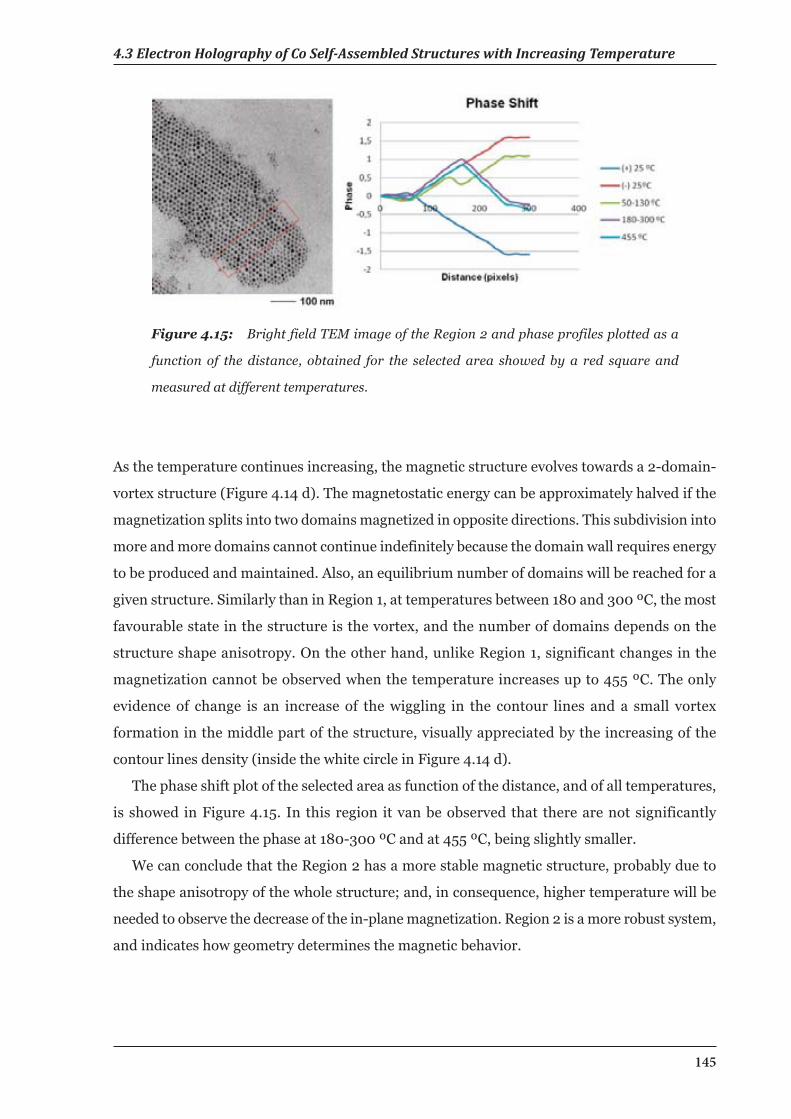
4.3 Electron Holography of Co Self-Assembled Structures with Increasing Temperature
145
As the temperature continues increasing, the magnetic structure evolves towards a 2-domain-
vortex structure (Figure 4.14 d). The magnetostatic energy can be approximately halved if the
magnetization splits into two domains magnetized in opposite directions. This subdivision into
more and more domains cannot continue indefinitely because the domain wall requires energy
to be produced and maintained. Also, an equilibrium number of domains will be reached for a
given structure. Similarly than in Region 1, at temperatures between 180 and 300 ºC, the most
favourable state in the structure is the vortex, and the number of domains depends on the
structure shape anisotropy. On the other hand, unlike Region 1, significant changes in the
magnetization cannot be observed when the temperature increases up to 455 ºC. The only
evidence of change is an increase of the wiggling in the contour lines and a small vortex
formation in the middle part of the structure, visually appreciated by the increasing of the
contour lines density (inside the white circle in Figure 4.14 d).
The phase shift plot of the selected area as function of the distance, and of all temperatures,
is showed in Figure 4.15. In this region it van be observed that there are not significantly
difference between the phase at 180-300 ºC and at 455 ºC, being slightly smaller.
We can conclude that the Region 2 has a more stable magnetic structure, probably due to
the shape anisotropy of the whole structure; and, in consequence, higher temperature will be
needed to observe the decrease of the in-plane magnetization. Region 2 is a more robust system,
and indicates how geometry determines the magnetic behavior.
Figure 4.15: Bright field TEM image of the Region 2 and phase profiles plotted as a
function of the distance, obtained for the selected area showed by a red square and
measured at different temperatures.
Chapter 4: Electron Holography and Lorentz Microscopy of Self-Assembled Co NPs Structures
146
4.3.3 Summary
In this section, the magnetic domain changes under high temperature conditions have been
observed by off-axis electron holography. During the heating process of Co NPs self-assembled
structures, previously magnetic induced, drastic changes were observed in the magnetic
domains between RT and 300 ºC,. And at 455 ºC some decreasing of the magnetism is also
observed. These changes in the magnetic structure occur with temperature-related changes in
Co phase, which may have an effect in the process.
4.4 Lorentz Microscopy and Electron Holography of Wire-Like Co Self-Assembled Structures
4.4.1 Experimental
4.4.1.1 Sample Preparation
One drop of the initial solution of 13 nm Co NPs was drop casted onto a TEM carbon-coated
substrate. The preparation was carried out inside the globe box for avoiding oxidation. This
dispersion produced wire-like Co NP self-assembled structures, which have been characterized
by TEM and SEM in section 3.2.2.3 (Figure 3.15). Both Lorentz microscopy and electron
holography images were acquired in Lorentz mode in a Titan Analytical 80-300ST TEM
working at 120 kV. The acquisition process is detailed as follows.
4.4.1.2 Data Acquisition Lorentz Microscopy
The selected region was magnetized in one direction by applying a magnetic field higher
than 5000 Oe using the objective lens. Then, the objective lens was also used for change the
magnetization to the opposite direction. Starting from zero field conditions, the value of the
objective lens was varied until reach a field value of 400 Oe, where the complete reversal of the
magnetization could be observed. Different images were acquired out of focus at field intervals
of ~ 20 Oe.
4.4.1.3 Data Acquisition Electron Holograph
The direction of magnetization of the sample was reversed in situ by tilting the sample by ±
30 degrees, and then turning on the conventional microscope objective lens to apply a magnetic
field (>2 T) to the sample parallel to the direction of the electron beam. Then, the hologram
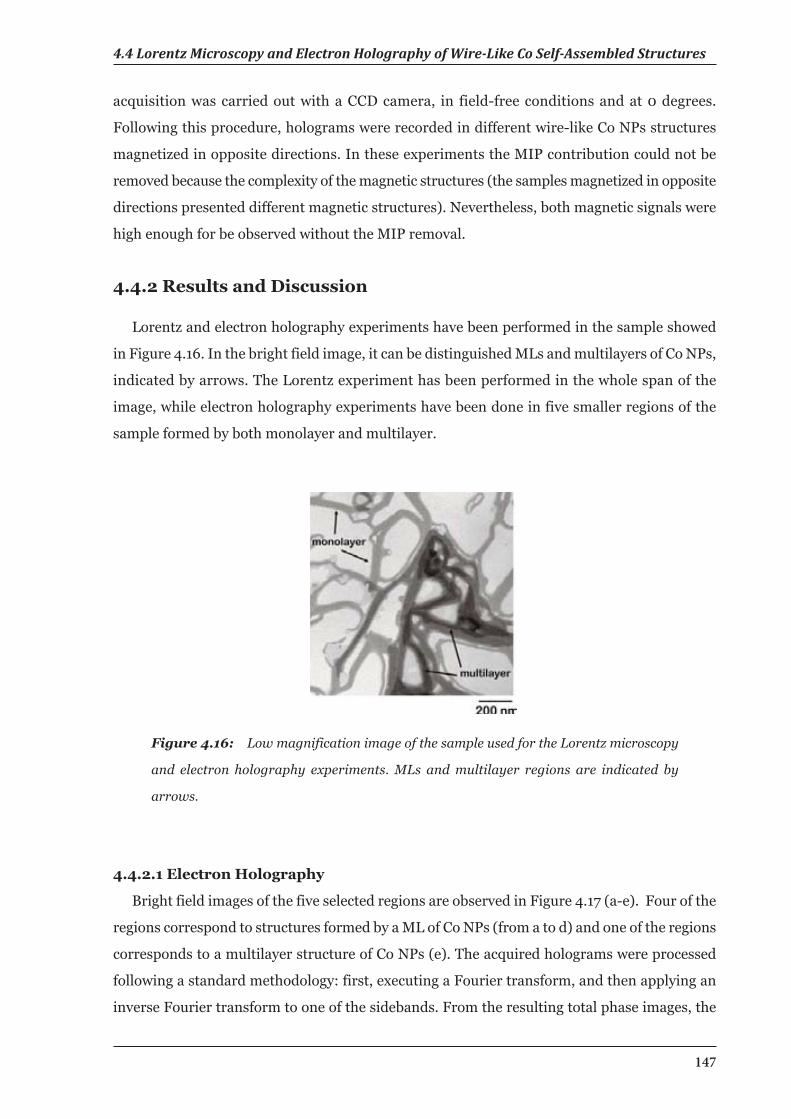
4.4 Lorentz Microscopy and Electron Holography of Wire-Like Co Self-Assembled Structures
147
acquisition was carried out with a CCD camera, in field-free conditions and at 0 degrees.
Following this procedure, holograms were recorded in different wire-like Co NPs structures
magnetized in opposite directions. In these experiments the MIP contribution could not be
removed because the complexity of the magnetic structures (the samples magnetized in opposite
directions presented different magnetic structures). Nevertheless, both magnetic signals were
high enough for be observed without the MIP removal.
4.4.2 Results and Discussion
Lorentz and electron holography experiments have been performed in the sample showed
in Figure 4.16. In the bright field image, it can be distinguished MLs and multilayers of Co NPs,
indicated by arrows. The Lorentz experiment has been performed in the whole span of the
image, while electron holography experiments have been done in five smaller regions of the
sample formed by both monolayer and multilayer.
Figure 4.16: Low magnification image of the sample used for the Lorentz microscopy
and electron holography experiments. MLs and multilayer regions are indicated by
arrows.
4.4.2.1 Electron Holography
Bright field images of the five selected regions are observed in Figure 4.17 (a-e). Four of the
regions correspond to structures formed by a ML of Co NPs (from a to d) and one of the regions
corresponds to a multilayer structure of Co NPs (e). The acquired holograms were processed
following a standard methodology: first, executing a Fourier transform, and then applying an
inverse Fourier transform to one of the sidebands. From the resulting total phase images, the
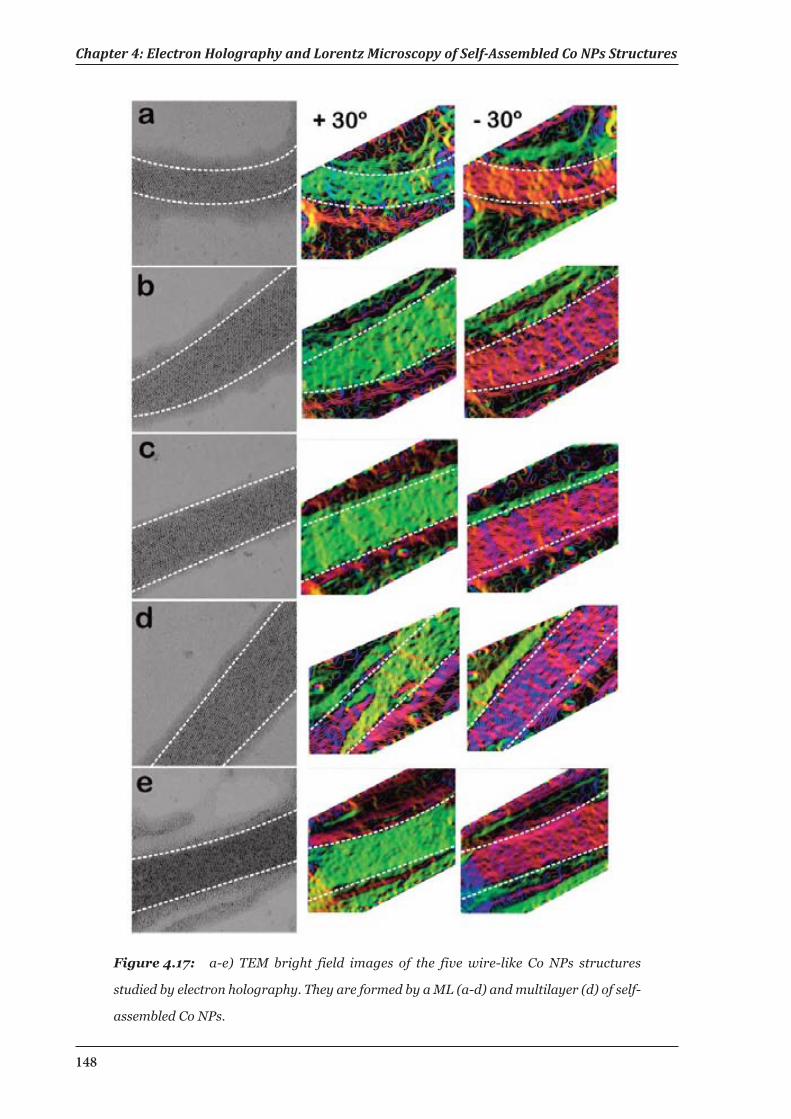
Chapter 4: Electron Holography and Lorentz Microscopy of Self-Assembled Co NPs Structures
148
Figure 4.17: a-e) TEM bright field images of the five wire-like Co NPs structures
studied by electron holography. They are formed by a ML (a-d) and multilayer (d) of self-
assembled Co NPs.
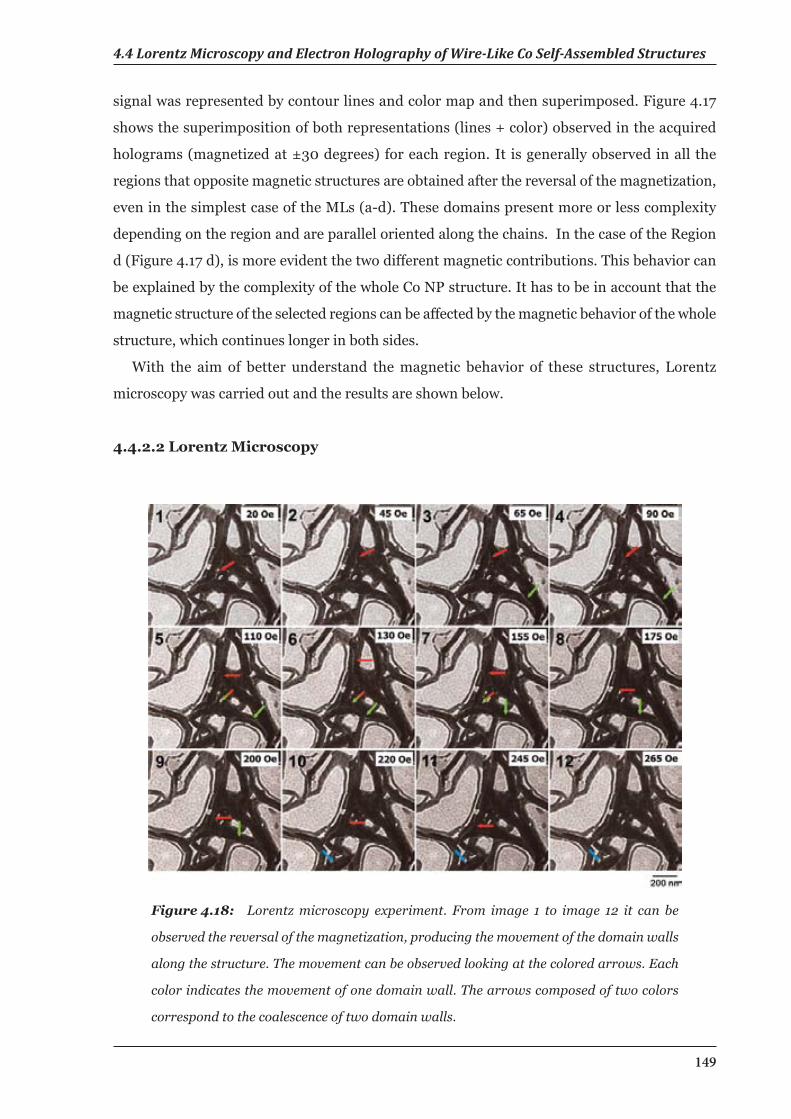
4.4 Lorentz Microscopy and Electron Holography of Wire-Like Co Self-Assembled Structures
149
signal was represented by contour lines and color map and then superimposed. Figure 4.17
shows the superimposition of both representations (lines + color) observed in the acquired
holograms (magnetized at ±30 degrees) for each region. It is generally observed in all the
regions that opposite magnetic structures are obtained after the reversal of the magnetization,
even in the simplest case of the MLs (a-d). These domains present more or less complexity
depending on the region and are parallel oriented along the chains. In the case of the Region
d (Figure 4.17 d), is more evident the two different magnetic contributions. This behavior can
be explained by the complexity of the whole Co NP structure. It has to be in account that the
magnetic structure of the selected regions can be affected by the magnetic behavior of the whole
structure, which continues longer in both sides.
With the aim of better understand the magnetic behavior of these structures, Lorentz
microscopy was carried out and the results are shown below.
4.4.2.2 Lorentz Microscopy
Figure 4.18: Lorentz microscopy experiment. From image 1 to image 12 it can be
observed the reversal of the magnetization, producing the movement of the domain walls
along the structure. The movement can be observed looking at the colored arrows. Each
color indicates the movement of one domain wall. The arrows composed of two colors
correspond to the coalescence of two domain walls.
Chapter 4: Electron Holography and Lorentz Microscopy of Self-Assembled Co NPs Structures
150
Defocused Fresnel images acquired during the reversal of the magnetization are shown in
Figure 4.18. The bright lines (marked with arrows) correspond to domain wall boundaries of
the magnetic structure. It can be followed the movement of the domain walls along the wires
when the direction of the applied magnetic field is reversed in situ, by changing the value of
the objective lens (each image correspond to a change of the magnetic field around 20 Oe).
Following one colored arrow it can be observed the movement of one particular magnetic wall,
while the arrows composed of two colors correspond to the coalescence of two different domain
walls. It is also confirmed by Lorentz microscopy that the dipole magnetization and domain
walls are preferentially oriented along the length of the wires as observed in Figure 3.16. These
observations, together with the electron holography measurements, indicate that the magnetic
behavior of the NPs on the wire-like structures is FM (dipolar ferromagnetism).
4.4.3 Summary
The magnetic behavior of wire-like self-assembled Co NPs structures has been analyzed
either by electron holography and Lorentz microscopy. The complexity of the magnetic structure
made impossible to obtain exclusively the magnetic signal of the sample, but the signal was
high enough for be observed without the removal of the MIP. It has been possible to obtain an
idea of the magnetic behavior, confirmed afterwards by Lorentz microscopy, demonstrating
the existence of dipolar FM domains in the Co NPs structures. The existence of domain walls is
a signature of superferromagnetism.
4.5 Conclusions
The off-axis mode of electron holography is ideally suited to characterize the magnetic
behavior of Co NPs assemblies because unwanted contributions to the contrast from local
variations in composition and specimen thickness can usually be removed from a phase image
more easily than from images recorded using other TEM phase contrast techniques. For
example, the Fresnel and Foucault modes of Lorenz microscopy and differential phase contrast
(DPC) imaging provide signals that are approximately proportional to either the first or the
second differential of the phase shift. These techniques inherently enhance contributions to the
contrast from rapid variations in specimen thickness and composition, as compared with the
weak and slowly varying magnetic signal. Nevertheless, the main disadvantage of the electron
4.6 References
151
holography is that dynamic events cannot be followed in real time because the holograms are
usually processed off-line. Moreover the field of view is limited to about 5 µm.
Summarizing, our results demonstrate the existence of dipolar ferromagnetism in different
2D self-assembled Co NPs structures. Dipolar interactions have been studied in a set of chain-
like Co NP structures with different widths, founding that the magnetization is distributed along
the chain. It has been also observed a direct relationship between the structure order and the
magnetic order. Complementary studies based in computer simulations are in progress for
determine the mentioned relationship. Moreover, changes in the magnetic structure in 2D self-
assembled “closed” structures have been studied as a function of the temperature. It is observed
that, in the dipole-interacting structures, the domain size and shapes varies over time from RT
until 300 ºC. Furthermore, at 455 ºC it can be observed a decreasing of the magnetic order,
more evident in Region 1 than in Region 2. This phenomenon is tentatively assigned to a first
observation of a magnetic phase transition to a short-order magnetic structure (spin-glass
structure) due to the thermal agitation of the NP dipoles within the structure. Further
experiments will be needed to confirm this hypothesis. Finally, dipolar ferromagnetism has
been demonstrated by Lorentz microscopy, observing domain wall movement as reversal of the
magnetization in wire-like structures formed by Co NPs.
Electron holography and Lorentz microscopy can play a valuable and complementary role
in characterizing the magnetic structure of nanostructurated magnetic materials. And the
combination of both techniques allows conducting in situ studies as a function of temperature
and/or the strength of any external applied magnetic field.
4.6 References
1. Cowburn, R. P.; Welland, M. E. "Room Temperature Magnetic Quantum Cellular
Automata". Science 2000, 287, 1466-1468.
2. Zeng, H.; Li, J.; Liu, J. P.; Wang, Z. L.; Sun, S. "Exchange-Coupled Nanocomposite
Magnets by Nanoparticle Self-Assembly". Nature 2002, 420, 395-398.
3. Jones, N. "The Pull of Stronger Magnets". Nature 2011, 472, 22-23.
4. Altmann, S. L. Band Theory of Solids: An Introduction from the Point of View of
Symmetry; Oxford University Press, 1994.
Chapter 4: Electron Holography and Lorentz Microscopy of Self-Assembled Co NPs Structures
152
5. L. Pye, D.; La Course, W. C.; Stevens, H. J. The Physics of Non-Crystalline Solids; Taylor
& Francis Ltd 1992.
6. Majetich, S. A.; Sachan, M. "Magnetostatic Interactions in Magnetic Nanoparticle
Assemblies: Energy, Time and Length Scales". Journal of Physics D-Applied Physics 2006,
39, R407-R422.
7. Scheinfein, M. R.; Schmidt, K. E.; Heim, K. R.; Hembree, G. G. "Magnetic Order in Two-
Dimensional Arrays of Nanometer-Sized Superparamagnets". Physical Review Letters
1996, 76, 1541-1544.
8. Tomita, S.; Akamatsu, K.; Shinkai, H.; Ikeda, S.; Nawafune, H.; Mitsumata, C.;
Kashiwagi, T.; Hagiwara, M. "Tuning Magnetic Interactions in Ferromagnetic-Metal
Nanoparticle Systems". Physical Review B 2005, 71.
9. Mørup, S.; Christiansen, G. "Influence of Magnetic Anisotropy on the
Superferromagnetic Ordering in Nanocomposites". Journal of Applied Physics 1993, 73,
6955-6957.
10.Russier, V. "Calculated Magnetic Properties of Two-Dimensional Arrays of
Nanoparticles at Vanishing Temperature". Journal of Applied Physics 2001, 89, 1287-1294.
11. Puntes, V. F.; Gorostiza, P.; Aruguete, D. M.; Bastus, N. G.; Alivisatos, A. P. "Collective
Behaviour in Two-Dimensional Cobalt Nanoparticle Assemblies Observed by Magnetic
Force Microscopy". Nature Materials 2004, 3, 263-268.
12. Mørup, S.; Bo Madsen, M.; Franck, J.; Villadsen, J.; Koch, C. J. W. "A New
Interpretation of Mössbauer Spectra of Microcrystalline Goethite: “Super-Ferromagnetism”
or “Super-Spin-Glass” Behaviour". Journal of Magnetism and Magnetic Materials 1983,
40, 163-174.
13. Georgescu, M.; Klokkenburg, M.; Erne, B. H.; Liljeroth, P.; Vanmaekelbergh, D.; van
Emmichoven, P. A. Z. "Flux Closure in Two-Dimensional Magnetite Nanoparticle
Assemblies". Physical Review B 2006, 73.
14. Kubetzka, A.; Pietzsch, O.; Bode, M.; Wiesendanger, R. "Magnetism of Nanoscale Fe
Islands Studied by Spin-Polarized Scanning Tunneling Spectroscopy". Physical Review B
2001, 63.
15. Schlickum, U.; Wulfhekel, W.; Kirschner, J. "Spin-Polarized Scanning Tunneling
4.6 References
153
Microscope for Imaging the in-Plane Magnetization". Applied Physics Letters 2003, 83,
2016-2018.
16. Georgescu, M.; Viota, J. L.; Klokkenburg, M.; Erne, B. H.; Vanmaekelbergh, D.; van
Emmichoven, P. A. Z. "Short-Range Magnetic Order in Two-Dimensional Cobalt-Ferrite
Nanoparticle Assemblies". Physical Review B 2008, 77.
17. Koch, S. A.; Velde, R. H. T.; Palasantzas, G.; De Hosson, J. T. M. "Magnetic Versus
Structural Properties of Co Nanocluster Thin Films: A Magnetic Force Microscopy Study".
Applied Physics Letters 2004, 84, 556-558.
18. Dunin-Borkowski, R. E.; McCartney, M. R.; Smith, D. J. Electron Holography of
Nanostructured Materials. In Encyclopaedia of Nanoscience and Nanotechnology; Nalwa,
H. S., Ed., 2004; Vol. 3; pp 41-100.
19. Aharonov, Y.; Bohm, D. "Significance of Electromagnetic Potentials in the Quantum
Theory". Physical Review 1959, 115, 485-491.
20. Thomas, J. M.; Simpson, E. T.; Kasama, T.; Dunin-Borkowski, R. E. "Electron
Holography for the Study of Magnetic Nanomaterials". Accounts of Chemical Research
2008, 41, 665-674.
21. Gao, Y.; Shindo, D.; Bao, Y.; Krishnan, K. "Electron Holography of Core-Shell Co/CoO
Spherical Nanocrystals". Applied Physics Letters 2007, 90.
22.Snoeck, E.; Dunin-Borkowski, R. E.; Dumestre, F.; Renaud, P.; Amiens, C.; Chaudret,
B.; Zurcher, P. "Quantitative Magnetization Measurements on Nanometer Ferromagnetic
Cobalt Wires Using Electron Holography". Applied Physics Letters 2003, 82, 88-90.
23.Dunin-Borkowski, R. E.; McCartney, M. R.; Smith, D. J.; Parkin, S. S. P. "Towards
Quantitative Electron Holography of Magnetic Thin Films Using in Situ Magnetization
Reversal". Ultramicroscopy 1998, 74, 61-73.
24.Twitchett, A. C.; Dunin-Borkowski, R. E.; Midgley, P. A. "Quantitative Electron
Holography of Biased Semiconductor Devices". Physical Review Letters 2002, 88, 238302.
25.Yamamoto, K.; Majetich, S. A.; McCartney, M. R.; Sachan, M.; Yamamuro, S.; Hirayama,
T. "Direct Visualization of Dipolar Ferromagnetic Domain Structures in Co Nanoparticle
Monolayers by Electron Holography". Applied Physics Letters 2008, 93.
Chapter 4: Electron Holography and Lorentz Microscopy of Self-Assembled Co NPs Structures
154
26.Yamamoto, K.; Hogg, C. R.; Yamamuro, S.; Hirayama, T.; Majetich, S. A. "Dipolar
Ferromagnetic Phase Transition in Fe(3)O(4) Nanoparticle Arrays Observed by Lorentz
Microscopy and Electron Holography". Applied Physics Letters 2011, 98.
27. Ghazali, A.; Levy, J. C. "Two-Dimensional Arrangements of Magnetic Nanoparticles".
Physical Review B 2003, 67.
28.Bennett, A. J.; Xu, J. M. "Simulating Collective Magnetic Dynamics in Nanodisk Arrays".
Applied Physics Letters 2003, 82, 2503-2505.
29.Kotzler, J.; Gorlitz, D.; Kurfiss, M.; von Sawilski, L.; Vedmedenko, E. Y. "Vortex
Fluctuations and Freezing of Dipolar-Coupled Granular Moments in Thin Ferromagnetic
Films". Physical Review B 2006, 73.
30. Chapman, J. N. "The Investigation of Magnetic Domain-Structures in Thin Foils by
Electron-Microscopy". Journal of Physics D-Applied Physics 1984, 17, 623.
31. Gabor, D. "Microscopy by Reconstructed Wave-Fronts". Proceedings of the Royal
Society of London. Series A. Mathematical and Physical Sciences 1949, 197, 454-487.
32.Gabor, D. "Microscopy by Reconstructed Wave Fronts: II". Proceedings of the Physical
Society. Section B 1951, 64, 449.
33.de Ruijter, W. J.; Weiss, J. K. "Detection Limits in Quantitative Off-Axis Electron
Holography". Ultramicroscopy 1993, 50, 269-283.
34.Tonomura Akira, M. T., Endo Junji. "High Resolution Electron Holography with Field
Emission Electron Microscope". Japanese Journal of Applied Physics 1979, 18, 9-14.
35.Hannes, L. "Electron Holography: Optimum Position of the Biprism in the Electron
Microscope". Ultramicroscopy 1996, 64, 79-86.
36.Reimer, L. Transmission Electron Microscopy; Springer-Verlag: Berlin, 1989.
37. Varon, M.; Pena, L.; Balcells, L.; Skumryev, V.; Martinez, B.; Puntes, V. "Dipolar Driven
Spontaneous Self Assembly of Superparamagnetic Co Nanoparticles into Micrometric Rice-
Grain Like Structures". Langmuir 2010, 26, 109-116.
38.Puntes, V. F.; Krishnan, K. M.; Alivisatos, P. "Synthesis, Self-Assembly, and Magnetic
Behavior of a Two-Dimensional Superlattice of Single-Crystal Epsilon-Co Nanoparticles".
Applied Physics Letters 2001, 78, 2187-2189.
4.6 References
155
39.Beleggia, M.; Kasama, T.; Dunin-Borkowski, R. E. "The Quantitative Measurement of
Magnetic Moments from Phase Images of Nanoparticles and Nanostructures I.
Fundamentals". Ultramicroscopy 2010, 110, 425-432.
40. Respaud, M.; Broto, J. M.; Rakoto, H.; Fert, A. R.; Thomas, L.; Barbara, B.; Verelst,
M.; Snoeck, E.; Lecante, P.; Mosset, A.; Osuna, J.; Ely, T. O.; Amiens, C.; Chaudret, B.
"Surface Effects on the Magnetic Properties of Ultrafine Cobalt Particles". Physical Review
B 1998, 57, 2925-2935.
41. http://www.microscopy.cen.dtu.dk/computing/semper/index.html.
42.Poddar, P.; Telem-Shafir, T.; Fried, T.; Markovich, G. "Dipolar Interactions in Two- and
Three-Dimensional Magnetic Nanoparticle Arrays". Physical Review B 2002, 66, 060403.
43.Farrell, D.; Cheng, Y.; McCallum, R. W.; Sachan, M.; Majetich, S. A. "Magnetic
Interactions of Iron Nanoparticles in Arrays and Dilute Dispersions". The Journal of
Physical Chemistry B 2005, 109, 13409-13419.
44.Petit, C.; Wang, Z. L.; Pileni, M. P. "Ferromagnetic Cobalt Nanocrystals Achieved by
Soft Annealing Approach—from Individual Behavior to Mesoscopic Organized Properties".
Journal of Magnetism and Magnetic Materials 2007, 312, 390-399.
45.Shukla, N.; Svedberg, E. B.; Ell, J.; Roy, A. J. "Surfactant Effects on the Shapes of Cobalt
Nanoparticles". Materials Letters 2006, 60, 1950-1955.
46.Cullity, B. D.; Graham, C. D. Introduction to Magnetic Materials Wiley-IEEE Press,
1972.
47.http://www.hitachi.com/New/cnews/100921c.pdf.

156
157
Chapter 5General Conclusions
The two main objectives of this thesis have been the development of synthetic processes of
metallic and bimetallic NPs and the study of their SA processes.
Concerning the first objective, syntheses of different types of metal NPs , with controlled
size and shape, have been developed. The synthesis of different metallic and bimetallic NPs
composed by Co and some of its oxides, Au, Pt and some alloys has been achieved .
• Co NPs of different sizes have been synthesized, and different parameters affecting the
variation of their magnetic properties such as the particle size and the oxidation state have
been studied. It has been observed how Co NPs self-assemble into hexagonal lattice or
linear structures depending on their magnetization.
• The syntheses of Pt NPs with different size and shape have also been successfully
achieved by controlling different parameters during the synthetic process such as the
temperature, the used surfactants, the addition of metal “traces” and the reaction time. In
particular, it has been determined how the incorporation of a small amount of Co NPs in
the synthesis has an effect as shape directing agent.
• The synthesis of single crystal Au rods (bars) has been developed by using a one-step
seed-mediated method, under smooth conditions, and by using Pt seed NPs as a reaction
catalyst. The effect of different parameters such as the role of Pt in the process and its
Chapter 5
158
influence in the rods’ length has been also explored, concluding that Pt is involved in the
rod formation in the form of metallic NP and not as an ion. Moreover, working at RT favors
a slow growth that at the same time favors the extremely length of the rods.
• Finally, the formation process of Au/Pt heterodimers has been developed at RT, and
the different factors that affect the final heterostructure (concentrations, reaction time and
amount of Pt NCs) have been studied. It has been concluded that the presence of Pt particles
accelerates again the synthetic process, acting both as nucleation platforms and initial
catalytic reducer.
Concerning the second objective, it has been studied the different interactions that drive the
SA of NPs into different structures. In particular, the SA process of magnetic Co NPs onto
different substrates has been studied.
• A close correlation between the shape and composition of the NPs and type of SA has
been determined, which cannot be changed but manipulated by changing external
parameters.
• Self-assembled NP structures have been prepared on different types of surfaces (carbon,
graphite, silicon wafers) by controlled evaporation. Different parameters such as the solvent
nature, the temperature, the atmosphere conditions and the substrate have been varied for
the formation of different self-assembled structures as a result of the balance between
different forces.
• In the particular case of magnetic Co NPs, dipolar interactions play an important role
in the SA process. Different self-assembled structures are obtained by modulating the
strength of magnetic interactions by controlling the Co NP size. It has been also observed
how different parameters such the particle size distribution and the nature of the substrates,
which will change the interactions substrate-NP, can be used to modulate the SA process,
and different patterns like MLs of NPs or wire-like structures can be obtained.
Understand the nature and intensity of the forces present in this type of nanostructured
magnetic materials is crucial for their future applications. Thanks to the electron holography
and Lorentz microscopy, it has been possible to the record the magnetic signal of different Co
self-assembled structures at NP resolution and also follow the changes in the magnetic structure
General Conclusions
159
with increasing temperature.
• Lorentz microscopy and the electron holography have confirmed the existence of
dipolar ferromagnetism in the observed self-assembled structures. The spontaneous
appearance of dipolar ferromagnetism suggests that dipolar coupling is as strong and
influential for the present arrangement of NPs as exchange coupling in conventional
magnetic materials. Interestingly, these results show that dipolar FM order is extremely
persistent even at a high degree of lattice disorder.

160
161
Chapter 6Appendix: Instrumentation
A.1 Synthesis of Co Nanoparticles
TEM analysis was performed on a JEOL 1010 with an accelerating voltage of 80 kV and a
digitalization image system Bioscan (Gatan). HRTEM, z-contrast and color maps analysis, were
performed on a Titan Analytical 80-300ST TEM with an accelerating voltage of 300 kV. The
magnetic characterization has been done using a SQUID magnetometer (MPMS, Quantum
Design) was used to record the magnetic signal of a Co NPs between 5 and 50 K and fields up
to 5 T. Diluted NPs where dispersed in paraffin to have a solid dispersion of noninteracting
NPs. X-ray diffraction (XRD) data were collected on a PANalytical X´Pert diffractometer using
a Co Kα radiation source (λ=1.179 Å). In a typical experiment, the 2θ diffraction (Bragg) angles
were measured by scanning the goniometer from 10° to 100°. The samples were prepared by
precipitating the Co NPs in the presence of methanol or ethanol followed by brief
centrifugation. The supernatant was discarded and the samples were dried under nitrogen
before smearing onto (510) silicon wafers (3º off axis) for XRD analysis.
A.2 Formation of Core/Shell Co/CoO and Hollow CoONanoparticles
TEM analysis was performed on a JEOL 1010 with an accelerating voltage of 80 kV and a
digitalization image system Bioscan (Gatan). HRTEM, BFSTEM, and HAADF or Z-contrast
STEM images analyses were performed on a JEOL 2100 with an accelerating voltage of 200
Chapter 6
162
kV equipped with an energy-dispersive X-ray spectroscopy (EDX) detector. HRTEM was
performed on a JEOL JEM 2010F field emission gun microscope with an accelerating voltage
of 200 kV. For the Z-contrast imaging we used a HAADF detector coupled to the same
microscope, which allows working in STEM mode. In order to model the Z-contrast profiles
obtained for the nanostructures, we followed the methodology published elsewhere.1 The DLS
and z-potential measurements has been done using a Zetasizer Nano from Malvern and the Dip
cell kid for non aqueous measurements, and diluting the sample 100 times. A superconducting
quantum interference device (SQUID) magnetometer (MPMS Quantum Design) was used to
record the magnetic signal of the samples. The temperature was varied between 5 and 300 K
according to a classical ZFC/FC procedure in the presence of an applied magnetic field (50
kOe), and the hysteresis cycles were obtained at different temperatures in a magnetic field
varying from +50 to -50 kOe. The samples were prepared in gelatine capsules under air.
A.3 Synthesis of Pt and PtCo Nanoparticles
A.3.1 Synthesis of Pt and PtCo Nanoparticles Assisted by Metal Traces
TEM analysis was performed on a JEOL 1010 with an accelerating voltage of 80 kV. HRTEM
analysis was performed on a JEOL 2100 with an accelerating voltage of 200 kV equipped with
an EDX detector. The Pt NCs were drop-cast onto a carbon coated grid and allowed to air dry
under ambient conditions. XRD data were collected on a PANalytical X´Pert diffractometer
using a Cu Kα radiation source (λ=1.541 Å). In a typical experiment, the 2θ diffraction (Bragg)
angles were measured by scanning the goniometer from 25° to 100° at a speed of 0.021° s-1.
The samples were prepared by precipitating the Pt NCs in the presence of methanol or ethanol
followed by brief centrifugation to ensure that all the NCs precipitated. The supernatant was
discarded and the samples were dried under nitrogen before smearing onto (510) silicon wafers
(3º off axis) for XRD analysis. Estimates of nanocrystal size were obtained using the Scherrer
equation (d = Kλ/ βcosθ) where d is the mean crystallite dimension, K is the shape factor (0.9),
λ is the X-ray wavelength, β is the line broadening at full width half maximum (FWHM)
(radians) and θ is the Bragg angle. The peak positions were determined using the X´Pert
HighScore program and compared before and after baseline correction. Vegard´s law of alloy
nanocrystals was considered for a slight shift in the 2θ Bragg peaks when compared to those
for bulk Pt. ICP-MS was performed using an ICP-MS Agilent instrument (Model: 7500cx) with
a detection limit of 0.02386 ppb. For each sample, the as-synthesized NCs, the purified NCs
and the supernatant from the purification were all subjected to ICP-MS analysis. Aliquots of
Appendix: Instrumentation
163
the Pt NC samples were dissolved in concentrated aqua regia, which was then heated to ensure
complete dissolution of all the metals, and diluted to an optimal concentration for ICP-MS
analysis. Ga was used as the internal standard and the integration time/point and time/mass
were 0.1 sec and 0.3 sec, respectively with a 3x repetition.
A.3.2 Synthesis of Pt and PtCo Nanoparticles by Using CompetingReducers
TEM analysis was performed on a JEOL 1010 with an accelerating voltage of 80 kV. HRTEM
analysis was performed on a JEOL 2010F field emission gun microscope. The 3D supercell
atomic models were designed by using the Rhodius software package available online at the
University of Cadiz.2,3 In general, the supercell atomic models created are composed of 6000
to 25000 Pt atoms, and correspond to the same diameters as the experimental crystals found.
EDX analysis was performed on a JEOL 2100 with an accelerating voltage of 200 kV equipped
with an EDX detector. The NCs were drop-cast onto a carbon-coated grid and allowed to air-
dry under ambient conditions. XRD data were collected on a PANalytical X’Pert diffractometer
using a Cu Kα radiation source (λ=1.541 Å). In a typical experiment, the 2θ diffraction (Bragg)
angles were measured by scanning the goniometer from 25º to 100º at a speed of 0.021º s-1.
The samples were prepared by precipitating the NCs in the presence of methanol followed by
brief centrifugation to ensure that all the NCs precipitated. The supernatant was discarded, and
the samples were dried under nitrogen before smearing onto (510) silicon wafers (3º off axis)
for XRD analysis. Estimates of NC size were obtained using the Scherrer equation and the peak
positions were determined using the X’Pert HighScore program and compared before and after
baseline correction. Calculations using Vegard’s law support the observed shifts in the 2θ Bragg
peaks when compared to those for pure Pt and Co NCs. ICP-MS was performed using an ICP-
MS Agilent instrument (Model: 7500cx) with a detection limit of 0.02386 ppb. Aliquots of the
purified NC samples were dissolved in concentrated aqua regia, which was heated to ensure
complete dissolution of all metals, and diluted to an optimal concentration for ICP-MS analysis.
Ga was used as the internal standard, and the integration time/point and time/mass were 0.1
and 0.3 s, respectively, with a 3x repetition.
A.4 Synthesis of Bimetallic Au/Pt Heterostructures
TEM analysis was performed on a JEOL 1010 with an accelerating voltage of 80 kV. HRTEM
analysis was performed on a JEOL 2100 with an accelerating voltage of 200 kV. XRD data were
Chapter 6
164
collected on a PANalytical X’Pert diffractometer using a Cu Kα radiation source (λ = 1.541 Å).
In a typical experiment, the 2θ diffraction (Bragg) angles were measured by scanning the
goniometer from 25º to 100º at a speed of 0.021º per s. The samples were prepared by
precipitating the NCs in the presence of methanol, and dried under nitrogen before smearing
onto (510) silicon wafers (3º off axis) for XRD analysis. The peak positions were determined
using the X’Pert High Score program and compared before and after baseline correction. UV-
Vis spectra were obtained with a Shimadzu UV-2401PC spectrophotometer, over the range of
200–800 nm with a 1 cm path length quartz cuvette. Baseline correction was performed and
the spectra were stacked in order to compare the changes in the absorption peak. Pt analyses
were performed using an ICP-MS Agilent instrument (Model: 7500cx) with a detection limit of
0.02386 ppb. Aliquots of the samples were diluted to an optimal concentration for ICP-MS
analysis. Gallium was used as the internal standard and the integration time/point and
time/mass were 0.1 s and 0.3 s, respectively, with a 3x repetition.
A.5 Synthesis of Extremely Long Rod Shaped AuNanocrystals
TEM analysis was performed on a JEOL 1010 with an accelerating voltage of 80 kV and a
digitalization image system Bioscan (Gatan). HRTEM was performed on a JEOL JEM 2010F
field emission gun microscope with an accelerating voltage of 200 kV. For the Z-contrast
imaging we used a HAADF detector coupled to the same microscope, which allows working in
STEM mode. In both cases, the NRs solution was concentrated and separated from the small
nanospheres and surfactant by centrifugation. A volume of 1 mL of solution was centrifuged at
1500 rpm for 20 min. The supernatant was drawn off with a syringe and the precipitate was
redispersed in 20 µL of distilled water. Finally, the concentrated solution was dropped onto a
carbon-coated copper grid. SEM analysis was performed on a MERLIN Field Emission SEM
(Fe-SEM) from Zeiss with an operating voltage of 1.2 kV. The Au NR solution was dropped on
a HOPG substrate, and after 5 min the excess was removed tilting the substrate onto an
absorbent paper. Then was rinsed with methanol and distilled water to remove CTAB. For
optical images, Axio Observer z1m from Zeiss was used. The sample deposition onto a MICA
substrate was prepared by means the same procedure explained above. UV-Vis spectra were
obtained with a Shimadzu UV-2401PC spectrophotometer, over the range of 200–1000 nm
with a 1 cm path length quartz cuvette.
Appendix: Instrumentation
165
A.6 Self-Assembly of Co Nanoparticles at CompatibleSubstrates: Graphite
TEM analysis was performed on a JEOL 1010 with an accelerating voltage of 80 kV. HRTEM
analysis was performed on a JEOL 2010F field emission gun microscope. An ESEM Quanta
200FEI XTE325/D8395 was used to obtain resolution images of the NP layers. The instrument
can be used in high vacuum (HV) mode, low vacuum (LV) mode and the so-called ESEM mode.
The images were taken at low vacuum conditions (up to 1 Torr) with a large field detector (LFD)
and at high vacuum with a conventional Everhart-Thornley secondary electron detector (ETD).
The chemical analysis of the structures was performed with an EDX system with an energy-
dispersive spectrometer (EDS) detector for the spectra acquisition. And a SEM Helios EBS3
was used to obtain NP resolution. For the acquisition of optical images, Axio Observer z1m
optical microscope from Zeiss was used. The magnetic characterization has been done using a
SQUID magnetometer (MPMS, Quantum Design) was used to record the magnetic signal of a
Co NPs between 5 and 50 K and fields up to 5 T. NPs assemblies were introduced together with
the substrate (which was previously measured to ensure non magnetic signal) into the sample
holder.
A.7 Self-Assembly of Co Nanoparticles at Non-CompatibleSubstrates: Silicon Wafers
TEM analysis was performed on a JEOL 1010 with an accelerating voltage of 80 kV. An
ESEM Quanta 200FEI XTE325/D8395 was used to obtain resolution images of the NP layers.
Image processing. The most direct method to quantitatively obtain insight into the structural
arrangement of NPs is to analyze the height–height correlation of the surface using real-space
imaging techniques (here SEM). Image processing was done using the software Mountains
(Digital Surface 5.1.1.5541).
A.8 References
1. Lima, E., Jr.; Vargas, J. M.; Zysler, R. D.; Rechenberg, H. R.; Cohen, R.; Arbiol, J.; Goya,
G. F.; Ibarra, A.; Ibarra, M. R. "Single-Step Chemical Synthesis of Ferrite Hollow
Nanospheres". Nanotechnology 2009, 20.

Chapter 6
166
2. Bernal, S.; Botana, F. J.; Calvino, J. J.; Lopez-Cartes, C.; Perez-Omil, J. A.; Rodriguez-
Izquierdo, J. M. "The Interpretation of Hrem Images of Supported Metal Catalysts Using
Image Simulation: Profile View Images". Ultramicroscopy 1998, 72, 135-164.
3. Pérez-Omil, J. A. D. T., University of Cádiz, Spain, 1994.

167
List of Abbreviations
a: Lattice parameter
A: Amplitude
AA: Ascorbic Acid
AFM: Antiferromagnetic
AFM*: Atomic Force Microscopy
AR: Aspect ratio
B: Magnetic flux
BF-STEM: Bright Field Scanning
Transmission Electron Microscopy
bp: Boiling point
CCD: Charge-coupled device
cmc: Critical micelle concentration
CTAB: Cetyl trimethylammonium
bromide
DCB: Dichlorobenzene
DLS: Dynamic Light Scattering
DM: Diamagnetic
e: Elementary electric charge
E°: Standard electrode potential
EDX: Energy-Dispersive X-ray
Spectroscopy
EELS: Electron-Energy-Loss Spectroscopy
FC: Field cool
fcc: Face-centered cubic
FEG: Field-emission gun
FFT: Fast Fourier transform
FM: Ferromagnetic
FWHM: Full Width at Half Maximum
GPA: Geometrical phase analysis
h: Planck constant
ћ: Reduced Planck constant
H: Magnetic field
Hc: Coercivity field
He: Exchange field
HAADF: High Angle Annular Dark Field
hcp: Hexagonal close-packed
HDD: Hexadecanediol
HHCF: Height-height correlation function
HOPG: Highly oriented pyrolytic graphite
HRTEM: High Resolution Transmission
Electron Microscopy
ICP-MS: Inductively coupled plasma mass
spectrometry
IR: Infrared
K: Anisotropy:
KBT: Thermal energy
LBL: Layer-by-layer
m: Magnetic moment
List of Abbreviations
168
M: Magnetization
MFM: Magnetic Force Microscopy
MIP: Mean inner potential
ML: Monolayer
mp: Melting point
NC: Nanocrystal
ND: Nanodisk
NP: Nanoparticle
NR: Nanorod
NW: Nanowire
OA: Oleic acid
OAM: Oleylamine
PM: Paramagnetic
PSA: Particle size analyzer
PVP: Poly vinyl pyrrolidone
QD: Quantum dot
RT: Room temperature
SA: Self-assembly
SEM: Scanning Electron Microscopy
SLS: Solution-liquid solid
SP-STM: Spin-Polarized Scanning
Tunnelling Microscopy
SPM: Superparamegnetic
T: Temperature
TB: Blocking temperature
TC: Curie temperature
TN: Néel temperature
TEM: Transmission electron microscopy
THF: Tetrahydrofuran
TOPO: Trioctylphosphine oxide
UD: Undecanol
UV-vis: Ultraviolet-visible
V: Volume
v: Velocity
vdW: Van der Waals
XRD: X-ray powder diffraction
ZFC: Zero field cool
SPR: Surface Plasmon resonance
β: Beta
ε : Epsilon
ρ : Density
φ: Phase
ψ: Electron wavefunction
μ: Spin moment
μo: Permeability of the free space
μat: Atomic magnetic moment
μB : Bohr magneton
τo: Moment relaxation time
τm: Measuring time
χ: Susceptibility
1D: One-dimensional
2D: Two-dimensional
3D: Three-dimensional
169
List of Publications
Peer-reviewed papers
1. Peña L., Varón M., Konstantinovic Z., Balcells Ll., Martínez B. and Puntes V. “Large 2D
self-assembled domains of cobalt nanoparticles onto silicon wafers” J. Mater. Chem. 2011,
21, 16973-16977.
2. Lim S.I., Varon M., Ojea-Jiménez I., Arbiol J. and Puntes V. “Pt nanocrystal evolution
in the presence of Au(III)-salts at room temperature: spontaneous formation of AuPt
heterodimers” J. Mater. Chem. 2011, 21, 11518-11523.
3. Amigo J.M., Bastús N.G., Hoen R., Vázquez-Campos S., Varón M., Royo M. and Puntes
V. “Analysis of time-dependent conjugation of gold nanoparticles with an antiparkinsonian
molecule by using curve resolution methods” Analytica Chimica Acta 2011, Volume 683,
Issue 2, 170-177.
4. Lim S.I. , Varon M., Ojea-Jimenez I., Arbiol J., Puntes V. “Exploring the Limitations of
the Use of Competing Reducers to Control the Morphology and Composition of Pt and PtCo
Nanocrystals” Chemistry of Materials 2010, 22, 4495-4504.
5. Lim S.I., Ojea-Jimenez I., Varon M., Casals E., Arbiol J., Puntes V. “Synthesis of
Platinum Cubes, Polypods, Cuboctahedrons, and Raspberries Assisted by Cobalt
Nanocrystals” Nano Letters 2010, 10, 964-973.
6. Varon M., Peña L., Balcells Ll., Skumryev V., Martínez B., and Puntes V. F. “Dipolar
Driven Spontaneous Self Assembly of Superparamagnetic Co Nanoparticles into
Micrometric Rice-Grain like Structures” Langmuir 2010, 26, 109-116.
List of Publications
170
7. Casals E., Bastús N.G., Vazquez-Campos S., Varon M., Comenge J. and Puntes V..
“Inorganic Nanoparticles and Biology”, Contributions to Science 2007, 3(3).
In preparation
8. Varón M., Beleggia M., Kasama T., Harrison R.J., Dunin-Borkowski R.E., Puntes V.F.,
and Frandsen C. “Dipolar Ferromagnetism in Low-dimensional Nanoparticle Structures”.
9. Varón M., Ojea-Jiménez I., Arbiol J., Puntes V.F. “Spontaneous Formation of Hollow
Cobalt Oxide Nanoparticles at Room Temperature at the Water/Air Interface Shows
Enhanced Solid-Solid Diffusion at the Nanoscale”.
10.Varón M., Ojea-Jiménez I., Arbiol J., Puntes V.F. “Sustained Growth Synthesis of
Extremely Long Gold Nanorods at Room Temperature”.
11. Varón M., Kasama T., Beleggia M., Mateiu R.V., Fuller A., Puntes V.F., and Frandsen
C. “Dipolar ferromagnetism and domain structure in wire-like structures of self-assembled
cobalt nanoparticles”.
Book Chapters
1. Bastús N. G., Casals E., I. Ojea, Varon M. and Puntes V. “The Reactivity of Colloidal
Inorganic Nanoparticles”. Published by In Tech, Accepted. Edited by Abbass Hashim.


