Embed Size (px)
Citation preview
marine drugs
Article
Synergistic Cytotoxicity of Renieramycin M andDoxorubicin in MCF-7 Breast Cancer Cells
Jortan O. Tun 1,*, Lilibeth A. Salvador-Reyes 1,2 , Michael C. Velarde 3 , Naoki Saito 4 ,Khanit Suwanborirux 5 and Gisela P. Concepcion 1,2,*
1 The Marine Science Institute, University of the Philippines Diliman, Quezon City 1101, Philippines;[email protected]
2 Philippine Genome Center, University of the Philippines Diliman, Quezon City 1101, Philippines3 Institute of Biology, University of the Philippines Diliman, Quezon City 1101, Philippines;
[email protected] Graduate School of Pharmaceutical Sciences, Meiji Pharmaceutical University, Tokyo 204-8588, Japan;
[email protected] Department of Pharmacognosy and Pharmaceutical Botany, Faculty of Pharmaceutical Sciences,
Center for Bioactive Natural Products from Marine Organisms and Endophytic Fungi (BNPME),Chulalongkorn University, Pathumwan, Bangkok 10330, Thailand; [email protected]
* Correspondence: [email protected] (J.O.T.); [email protected] (G.P.C.);Tel.: +632-922-3959 (J.O.T. & G.P.C.)
Received: 23 July 2019; Accepted: 7 August 2019; Published: 16 September 2019�����������������
Abstract: Renieramycin M (RM) is a KCN-stabilized tetrahydroisoquinoline purified from the bluesponge Xestospongia sp., with nanomolar IC50s against several cancer cell lines. Our goal is to evaluateits combination effects with doxorubicin (DOX) in estrogen receptor positive MCF-7 breast cancercells. MCF-7 cells were treated simultaneously or sequentially with various combination ratios of RMand DOX for 72 h. Cell viability was determined using the MTT assay. Synergism or antagonismwas determined using curve-shift analysis, combination index method and isobologram analysis.Synergism was observed with pharmacologically achievable concentrations of DOX when administeredsimultaneously, but not sequentially. The IC95 values of RM and DOX after combination were reducedby up to four-fold and eight-fold, respectively. To gain insights on the mechanism of synergy, real-timeprofiling, cell cycle analysis, apoptosis assays, and transcriptome analysis were conducted. Thecombination treatment displayed a similar profile with DNA-damaging agents and induced a greaterand faster cell killing. The combination treatment also showed an increase in apoptosis. DOX inducedS and G2/M arrest while RM did not induce significant changes in the cell cycle. DNA replication andrepair genes were downregulated commonly by RM and DOX. p53 signaling and cell cycle checkpointswere regulated by DOX while ErbB/PI3K-Akt, integrin and focal adhesion signaling were regulated byRM upon combination. Genes involved in cytochrome C release and interferon gamma signaling wereregulated specifically in the combination treatment. This study serves as a basis for in vivo studiesand provides a rationale for using RM in combination with other anticancer drugs.
Keywords: renieramycin M; doxorubicin; synergistic combination chemotherapy; real-time profiling;cell cycle; gene expression profiling; apoptosis; breast cancer; blue sponge; DNA damage response
1. Introduction
The standard treatment for advanced breast cancer includes doxorubicin (DOX), administeredeither as monotherapy or in combination with other cytotoxic or targeted drugs [1]. However, its usehas been limited because of dose-limiting toxicities such as cardiotoxicity. Moreover, the generation ofdrug-resistant tumors after continued therapy is still inevitable, and this eventually narrows down
Mar. Drugs 2019, 17, 536; doi:10.3390/md17090536 www.mdpi.com/journal/marinedrugs
Mar. Drugs 2019, 17, 536 2 of 26
the treatment armamentarium. It is imperative therefore, to keep looking for new drug combinationsthat can enhance or maintain efficacy, while minimizing toxicity and delaying the development ofdrug resistance.
Renieramycin M (RM) is a KCN-stabilized tetrahydroisoquinoline purified from the blue spongeXestospongia sp. (Figure 1), with nanomolar IC50s against the colon, lung, melanoma, and pancreaticcancer cells [2–7]. RM induces apoptosis and inhibits invasion and migration in non-small cell lungcancer cells (NSCLC) in vitro, making it a potential antimetastatic agent [8].
Mar. Drugs 2019, 17, x 2 of 28
that can enhance or maintain efficacy, while minimizing toxicity and delaying the development of
drug resistance.
Renieramycin M (RM) is a KCN-stabilized tetrahydroisoquinoline purified from the blue sponge
Xestospongia sp. (Figure 1), with nanomolar IC50s against the colon, lung, melanoma, and pancreatic
cancer cells [2–7]. RM induces apoptosis and inhibits invasion and migration in non-small cell lung
cancer cells (NSCLC) in vitro, making it a potential antimetastatic agent [8].
RM is structurally related to ecteinascidin-743 (Et-743; Trabectedin, Yondelis® ), an anticancer
drug for advanced soft tissue sarcoma and recurrent platinum-sensitive ovarian cancer. The
renieramycins and ecteinascidins are the two major categories of the 1,2,3,4-tetrahydroisoquinoline
alkaloids that have an anticancer effect. This warrants further investigation on the potential clinical
utility of RM. A transcriptional structure–activity relationship (SAR) study and molecular network
profiling revealed that RM and the ecteinascidin class of compounds induce apoptosis via a common
pathway in the colon, breast [2], and glioblastoma cells [9]. Et-743 was reported to have a sequence-
dependent synergistic effect with paclitaxel in breast carcinoma [10], and with doxorubicin in soft
tissue sarcoma in vitro [11]. In view of the similarities between RM and Et-743, we hypothesize that
RM can act also synergistically with standard cytotoxic drugs and thus, may be potentially useful to
improve the therapeutic outcome.
In this study, we investigated the effects of the combination of RM and DOX in estrogen receptor
positive (ER+) MCF-7, an in vitro model for the most common type of breast cancer and determined
the drug ratio and regimen that will yield a synergistic effect. We also determined the effects of the
combination on the cell cycle, apoptosis, and transcriptome in order to gain insights on the
mechanism of combinatorial synergy, which could suggest therapeutic strategies for the treatment of
breast cancer.
Figure 1. Renieramycin M from the blue sponge Xestospongia sp.
2. Results
2.1. RM Is More Potent Than DOX in MCF-7 Cells
The prerequisite for determination of synergistic activity is to know the potency and slope of the
concentration-response curves of the individual drugs. Using MTT cytotoxicity assay, we determined
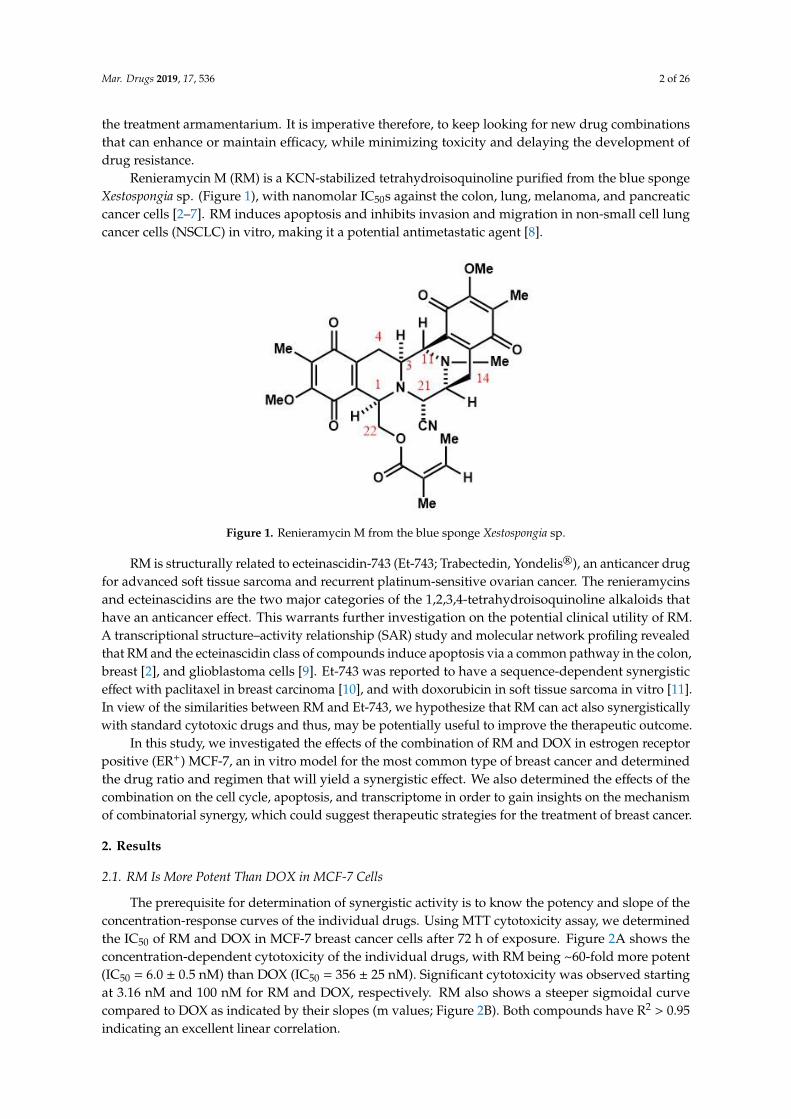
the IC50 of RM and DOX in MCF-7 breast cancer cells after 72 h of exposure. Figure 2A shows the
concentration-dependent cytotoxicity of the individual drugs, with RM being ~60-fold more potent
(IC50 = 6.0 ± 0.5 nM) than DOX (IC50 = 356 ± 25 nM). Significant cytotoxicity was observed starting at
3.16 nM and 100 nM for RM and DOX, respectively. RM also shows a steeper sigmoidal curve
Figure 1. Renieramycin M from the blue sponge Xestospongia sp.
RM is structurally related to ecteinascidin-743 (Et-743; Trabectedin, Yondelis®), an anticancer drugfor advanced soft tissue sarcoma and recurrent platinum-sensitive ovarian cancer. The renieramycinsand ecteinascidins are the two major categories of the 1,2,3,4-tetrahydroisoquinoline alkaloids thathave an anticancer effect. This warrants further investigation on the potential clinical utility of RM.A transcriptional structure–activity relationship (SAR) study and molecular network profiling revealedthat RM and the ecteinascidin class of compounds induce apoptosis via a common pathway in the colon,breast [2], and glioblastoma cells [9]. Et-743 was reported to have a sequence-dependent synergisticeffect with paclitaxel in breast carcinoma [10], and with doxorubicin in soft tissue sarcoma in vitro [11].In view of the similarities between RM and Et-743, we hypothesize that RM can act also synergisticallywith standard cytotoxic drugs and thus, may be potentially useful to improve the therapeutic outcome.
In this study, we investigated the effects of the combination of RM and DOX in estrogen receptorpositive (ER+) MCF-7, an in vitro model for the most common type of breast cancer and determinedthe drug ratio and regimen that will yield a synergistic effect. We also determined the effects of thecombination on the cell cycle, apoptosis, and transcriptome in order to gain insights on the mechanismof combinatorial synergy, which could suggest therapeutic strategies for the treatment of breast cancer.
2. Results
2.1. RM Is More Potent Than DOX in MCF-7 Cells
The prerequisite for determination of synergistic activity is to know the potency and slope of theconcentration-response curves of the individual drugs. Using MTT cytotoxicity assay, we determinedthe IC50 of RM and DOX in MCF-7 breast cancer cells after 72 h of exposure. Figure 2A shows theconcentration-dependent cytotoxicity of the individual drugs, with RM being ~60-fold more potent(IC50 = 6.0 ± 0.5 nM) than DOX (IC50 = 356 ± 25 nM). Significant cytotoxicity was observed startingat 3.16 nM and 100 nM for RM and DOX, respectively. RM also shows a steeper sigmoidal curvecompared to DOX as indicated by their slopes (m values; Figure 2B). Both compounds have R2 > 0.95indicating an excellent linear correlation.
Mar. Drugs 2019, 17, 536 3 of 26
Mar. Drugs 2019, 17, x 3 of 28
compared to DOX as indicated by their slopes (m values; Figure 2B). Both compounds have R2 > 0.95
indicating an excellent linear correlation.
We also monitored the effects of RM and DOX singly in real-time for a period of seven days and
calculated the IC50 at different time points. The IC50 values of RM and DOX decreased over time
indicating time-dependent cytotoxicity (Figure 2C, Figure S3). The IC50 of RM at all time points were
lower than DOX, reflecting the more potent cytotoxicity of RM over DOX. RM also induces faster
cytotoxicity (~24 h) than DOX (~48 h; Figure 2C). Interestingly, the cytostatic effect of DOX was
observed after 24 h of exposure as shown by the brief lag in IC50. After 72 h, the IC50 of RM is almost
constant, while that of DOX continued to gradually decrease.
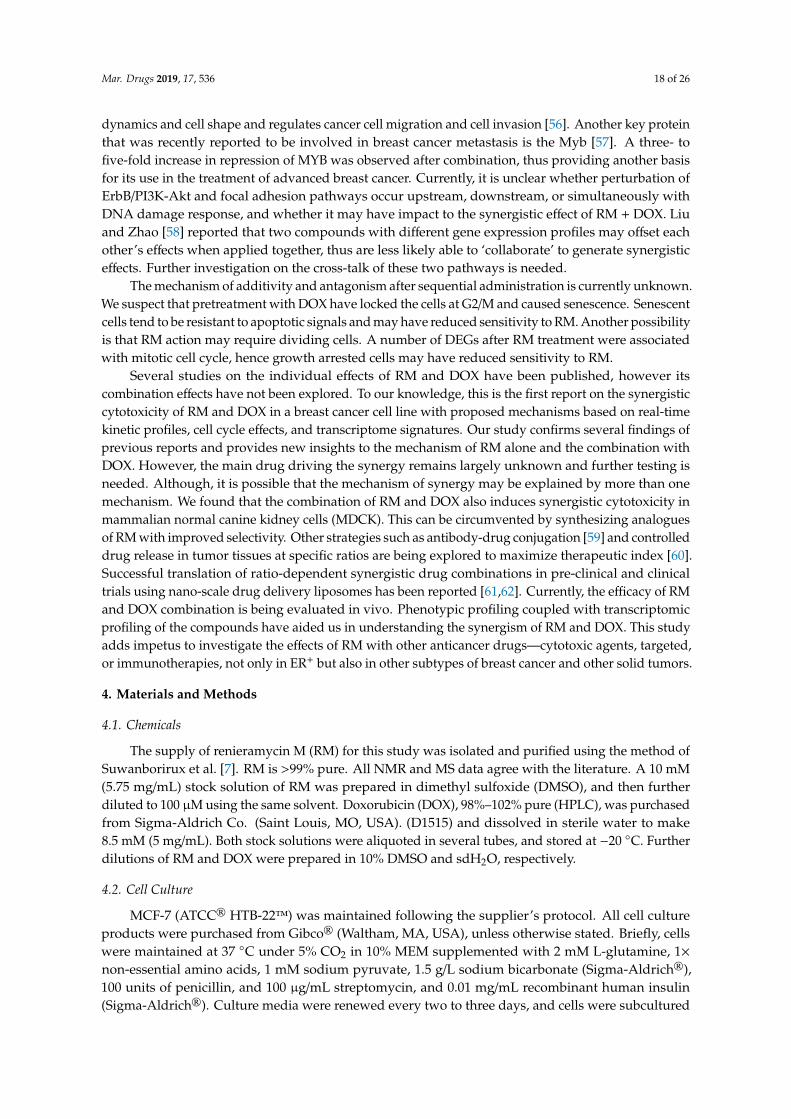
Figure 2. Individual cytotoxicity of renieramycin M (RM) and doxorubicin (DOX) on MCF-7 breastcancer cells. (A) Concentration-dependent cytotoxicity of RM and DOX from MTT cytotoxicity assay at72 h post-treatment. Data points are mean± SEM of three independent trials performed in quadruplicates.*** p < 0.0001 (one-way analysis of variance—ANOVA/Dunnett’s multiple comparison test). (B) Slopesof the concentration-response curves. m = “shape” or the slope of the curve; r = conformity of the datato the mass-action law. These were automatically generated using the CompuSyn software (Paramus,NJ, USA) [12]. (C) Time-dependent cytotoxicity of RM and DOX using xCELLigence® software (RTCA;ACEA, Biosciences Inc., San Diego, CA, USA) during a seven-day exposure. Each data point representsmean IC50 ± SEM (n = 3) calculated during the indicated time-points of a representative experiment.Solid black line indicates the time of treatment; ∆t24 and ∆t48 indicate time points after 24 and 48 h ofexposure, respectively.
Mar. Drugs 2019, 17, 536 4 of 26
We also monitored the effects of RM and DOX singly in real-time for a period of seven daysand calculated the IC50 at different time points. The IC50 values of RM and DOX decreased overtime indicating time-dependent cytotoxicity (Figure 2C, Figure S3). The IC50 of RM at all time pointswere lower than DOX, reflecting the more potent cytotoxicity of RM over DOX. RM also inducesfaster cytotoxicity (~24 h) than DOX (~48 h; Figure 2C). Interestingly, the cytostatic effect of DOX wasobserved after 24 h of exposure as shown by the brief lag in IC50. After 72 h, the IC50 of RM is almostconstant, while that of DOX continued to gradually decrease.
2.2. RM Synergizes with DOX at Different Combination Ratios When Administered Simultaneously, But NotSequentially in MCF-7 Cells
The next question that we addressed was whether RM could work synergistically with DOX.The combined effect of RM and DOX (RM + DOX) on MCF-7 breast cancer cells was investigatedusing an MTT cytotoxicity assay. First, cells were treated with RM and DOX at equipotent molar ratio(RM IC50/DOX IC50). Since RM was ~60-fold more potent than DOX (Figure 2A), a 1:60 constant ratioof RM:DOX was administered concurrently to the cells for 72 h. To demonstrate synergistic activity,multiple analytical approaches like the curve-shift analysis, combination index (CI), and isobologramanalysis were performed. RM + DOX at the equipotent ratio (1:60) showed synergistic activity when≥90% of MCF-7 cells were inhibited (Figure S4).
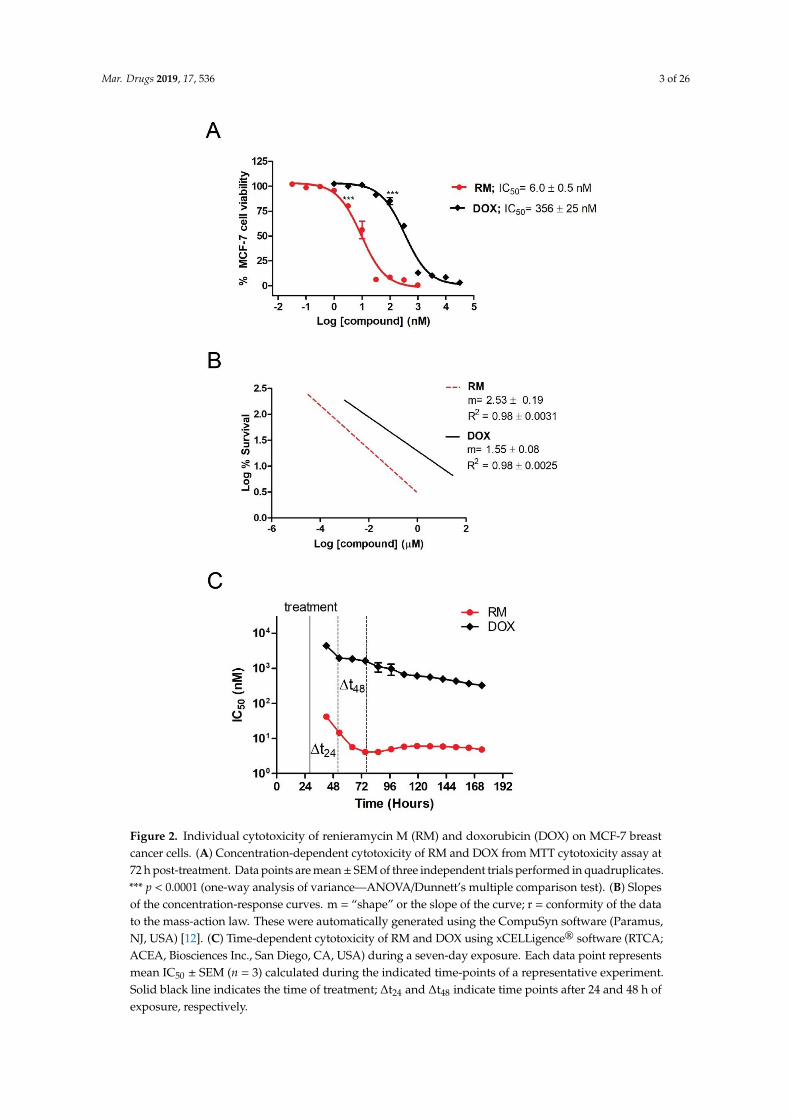
The dosage and schedule of administration are important in combination chemotherapy sincethis can affect the therapeutic outcome. Depending on the ratio and schedule of administration(simultaneous or sequential), combination of cytotoxic compounds can yield a synergistic, additive, orantagonistic effect. This prompted us to determine the drug ratio and regimen that will yield maximumsynergy. MCF-7 cells were treated simultaneously (RM + DOX) or sequentially with various constantmolar ratios. For the sequential administration of compounds, cells were exposed either to RM first for24 h, followed by DOX for 48 h (RM→ DOX), or its reverse sequence, DOX for 48 h, followed by RMfor 24 h (DOX→ RM), without a washing step in between administrations (Figure S2). The exposuretime was based on the real-time profile of the individual drugs, wherein RM required a shorter time toinduce cytotoxicity than DOX (Figure 2C). To quantify synergistic effects, the CI values were calculatedusing the method of Chou and Talalay [13], where CI values < 1, =1, or >1 would mean synergistic,additive, or antagonistic activity, respectively. Table 1 shows the CI values at different inhibition levels(IC50–IC95) for each combination ratio and regimen tested.
Table 1. Heat map of the effects of RM and DOX at different combination ratios and regimen.
DrugCombination
CombinationRatio (nM)
n CI values at
IC50 IC75 IC90 IC95
RM + DOX 1:100 5 0.956 ± 0.064 0.886 ± 0.047 0.884 ± 0.111 0.917 ± 0.156RM + DOX 1:80 3 1.111 ± 0.093 0.913 ± 0.047 0.777 ± 0.056 0.712 ± 0.085RM + DOX 1:60 3 1.202 ± 0.115 1.011 ± 0.075 0.877 ± 0.054 0.810 ± 0.065RM + DOX 1:50 5 0.806 ± 0.069 0.685 ± 0.044 0.609 ± 0.036 0.575 ± 0.041RM + DOX 1:40 3 0.856 ± 0.041 0.691 ± 0.048 0.580 ± 0.061 0.524 ± 0.071RM + DOX 1:20 3 1.160 ± 0.075 0.942 ± 0.047 0.780 ± 0.033 0.692 ± 0.032RM→ DOX 1:100 6 2.372 ± 0.220 1.601 ± 0.156 1.105 ± 0.121 0.870 ± 0.105RM→ DOX 1:20 4 1.414 ± 0.094 1.173 ± 0.087 1.004 ± 0.132 0.918 ± 0.162DOX→ RM 100:1 5 1.622 ± 0.221 1.545 ± 0.209 1.557 ± 0.311 1.620 ± 0.427DOX→ RM 20:1 3 2.543 ± 0.429 2.273 ± 0.288 2.074 ± 0.263 1.974 ± 0.319
The effects on cell viability were determined using an MTT cytotoxicity assay after 72 h, and the combinationindex (CI) values were calculated using CompuSyn software. To determine the combination ratio and schedule ofadministration that yield the greatest synergistic effect, a heat map was generated, with the red color highlighting thelowest CI values signifying synergism, white highlighting values near 1 signifying additivity, and blue highlightingvalues greater than 1 signifying antagonism. RM + DOX indicates simultaneous administration, RM → DOXindicates pre-exposure to RM for 24 h followed by DOX for 48 h and DOX→ RM indicates the reverse order. n is thenumber of independent trials. Each trial consisted of single drug controls and their combination. The CI values aremean ± SEM of n trials.
Mar. Drugs 2019, 17, 536 5 of 26
In general, synergism was observed at high inhibition levels (≥90% inhibition), while additivityto antagonism was observed at lower inhibition levels (≤75% inhibition; Table 1). Synergism at highinhibition levels is more clinically relevant [14,15]. Among the three regimens, the highest synergisticeffect was observed with the simultaneous treatment (Table 1). Sequential treatment of RM, followedby DOX (RM→ DOX) yielded additive effect at high inhibition levels, while its reverse sequence (DOX→ RM) showed an antagonistic effect (Table 1).
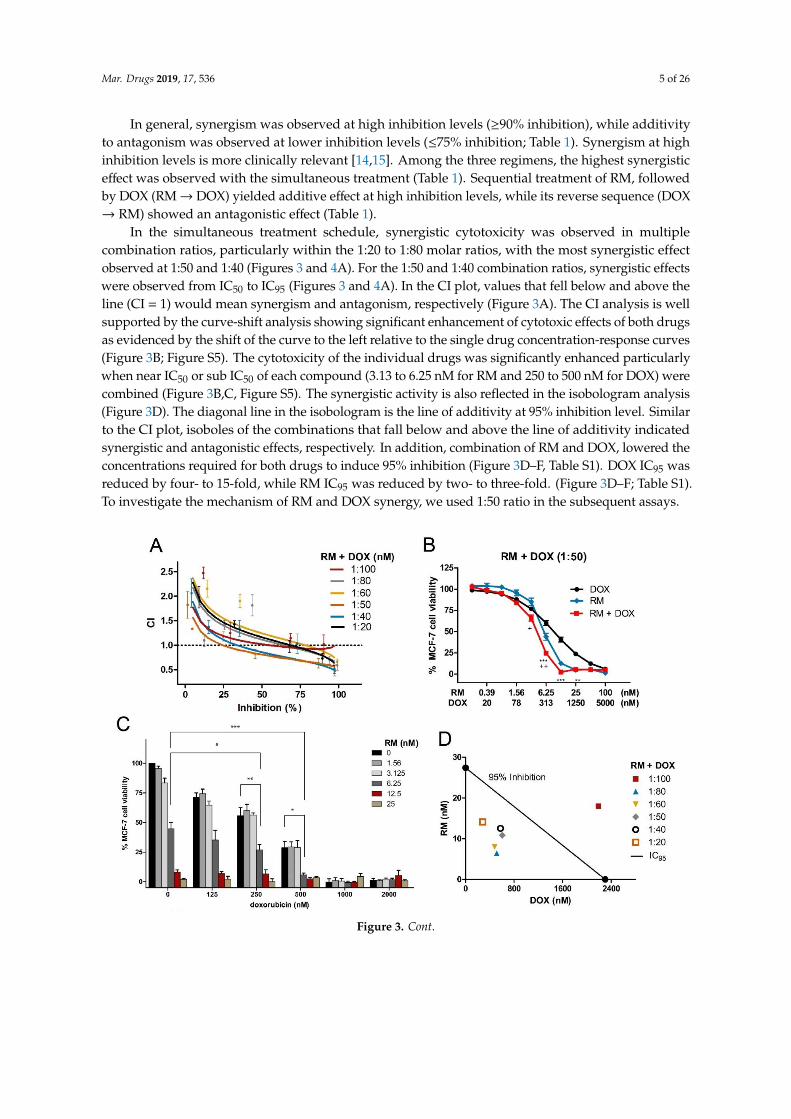
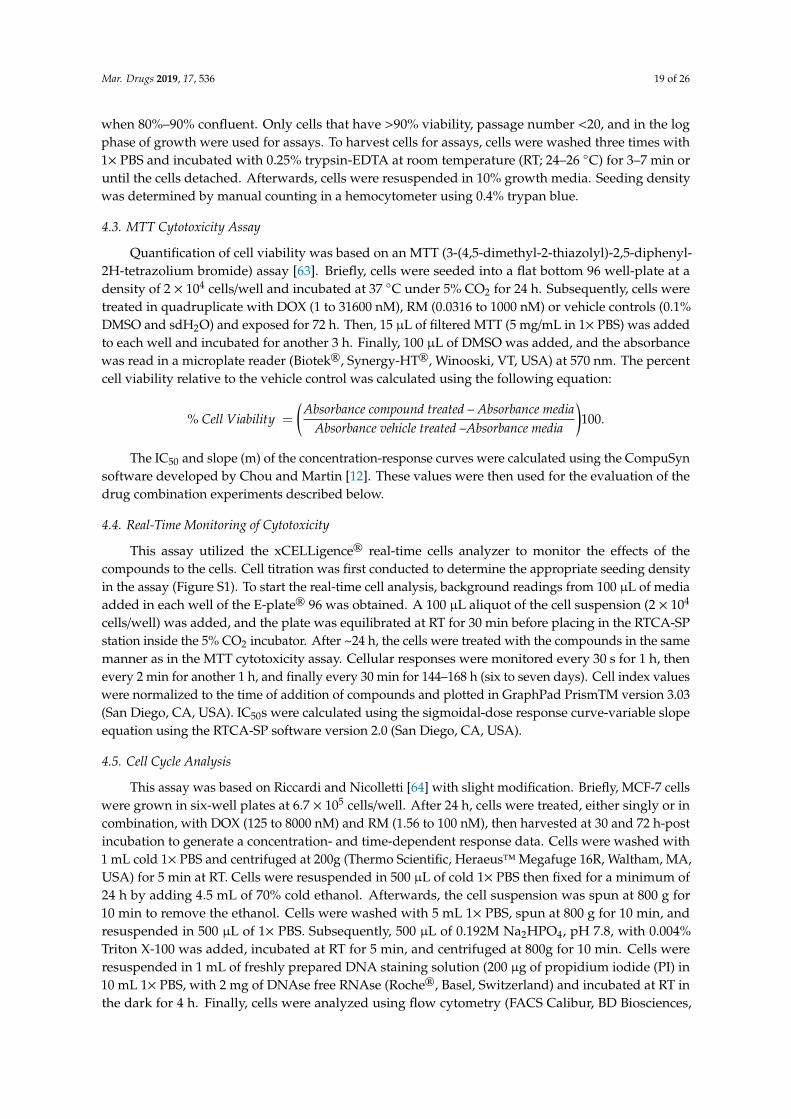
In the simultaneous treatment schedule, synergistic cytotoxicity was observed in multiplecombination ratios, particularly within the 1:20 to 1:80 molar ratios, with the most synergistic effectobserved at 1:50 and 1:40 (Figures 3 and 4A). For the 1:50 and 1:40 combination ratios, synergistic effectswere observed from IC50 to IC95 (Figures 3 and 4A). In the CI plot, values that fell below and above theline (CI = 1) would mean synergism and antagonism, respectively (Figure 3A). The CI analysis is wellsupported by the curve-shift analysis showing significant enhancement of cytotoxic effects of both drugsas evidenced by the shift of the curve to the left relative to the single drug concentration-response curves(Figure 3B; Figure S5). The cytotoxicity of the individual drugs was significantly enhanced particularlywhen near IC50 or sub IC50 of each compound (3.13 to 6.25 nM for RM and 250 to 500 nM for DOX) werecombined (Figure 3B,C, Figure S5). The synergistic activity is also reflected in the isobologram analysis(Figure 3D). The diagonal line in the isobologram is the line of additivity at 95% inhibition level. Similarto the CI plot, isoboles of the combinations that fall below and above the line of additivity indicatedsynergistic and antagonistic effects, respectively. In addition, combination of RM and DOX, lowered theconcentrations required for both drugs to induce 95% inhibition (Figure 3D–F, Table S1). DOX IC95 wasreduced by four- to 15-fold, while RM IC95 was reduced by two- to three-fold. (Figure 3D–F; Table S1).To investigate the mechanism of RM and DOX synergy, we used 1:50 ratio in the subsequent assays.Mar. Drugs 2019, 17, x 6 of 28
Figure 3. Synergistic cytotoxicity of RM + DOX at multiple combination ratios. MCF-7 cells were
treated singly or concurrently with RM plus DOX at different constant molar ratios for 72 h, and the
cell viability was assessed using an MTT cytotoxicity assay. (A) The combination index (CI) plot of
different combination ratios. Values that fall below and above the line (CI = 1) would mean synergism
and antagonism, respectively. Points are experimental data reported in mean ± SEM of three
independent trials. (B) Example of curve-shift analysis conducted for the most synergistic
combination ratio (1:50). Data points are mean ± SEM of three independent trials performed in
quadruplicates * p < 0.05, ** p < 0.001, *** p < 0.0001, and + p < 0.05, ++ p < 0.001 vs. DOX alone and RM
alone, respectively (one-way ANOVA/Bonferroni). (C) Comparison of cell viabilities in the
checkerboard assay. Bars are mean + SEM of three independent trials. Significant enhancements in
cytotoxicity were observed particularly when near IC50 of both drugs (RM 6.25 nM + 250 nM DOX
(1:40) and 6.25 nM RM + 500 nM DOX (1:80)) were combined. * p < 0.05, ** p < 0.001, and *** p < 0.0001
(one-way ANOVA/Dunnett’s multiple comparison test). (D) Isobologram analysis of different
combination ratios at IC95. The diagonal line denotes additivity at 95% inhibition. The isoboles are
the mean of at least three independent trials. (E-F) Comparison of IC95 of single and combination drug
treatments. The IC95 were computed using the CompuSyn software. The IC95 of the individual drugs
from all sets of combination experiments were averaged and compared to the resulting IC95 after
combination treatments. Each set of combination experiments was done at least three times. Data
Figure 3. Cont.
Mar. Drugs 2019, 17, 536 6 of 26
Mar. Drugs 2019, 17, x 6 of 28
Figure 3. Synergistic cytotoxicity of RM + DOX at multiple combination ratios. MCF-7 cells were
treated singly or concurrently with RM plus DOX at different constant molar ratios for 72 h, and the
cell viability was assessed using an MTT cytotoxicity assay. (A) The combination index (CI) plot of
different combination ratios. Values that fall below and above the line (CI = 1) would mean synergism
and antagonism, respectively. Points are experimental data reported in mean ± SEM of three
independent trials. (B) Example of curve-shift analysis conducted for the most synergistic
combination ratio (1:50). Data points are mean ± SEM of three independent trials performed in
quadruplicates * p < 0.05, ** p < 0.001, *** p < 0.0001, and + p < 0.05, ++ p < 0.001 vs. DOX alone and RM
alone, respectively (one-way ANOVA/Bonferroni). (C) Comparison of cell viabilities in the
checkerboard assay. Bars are mean + SEM of three independent trials. Significant enhancements in
cytotoxicity were observed particularly when near IC50 of both drugs (RM 6.25 nM + 250 nM DOX
(1:40) and 6.25 nM RM + 500 nM DOX (1:80)) were combined. * p < 0.05, ** p < 0.001, and *** p < 0.0001
(one-way ANOVA/Dunnett’s multiple comparison test). (D) Isobologram analysis of different
combination ratios at IC95. The diagonal line denotes additivity at 95% inhibition. The isoboles are
the mean of at least three independent trials. (E-F) Comparison of IC95 of single and combination drug
treatments. The IC95 were computed using the CompuSyn software. The IC95 of the individual drugs
from all sets of combination experiments were averaged and compared to the resulting IC95 after
combination treatments. Each set of combination experiments was done at least three times. Data
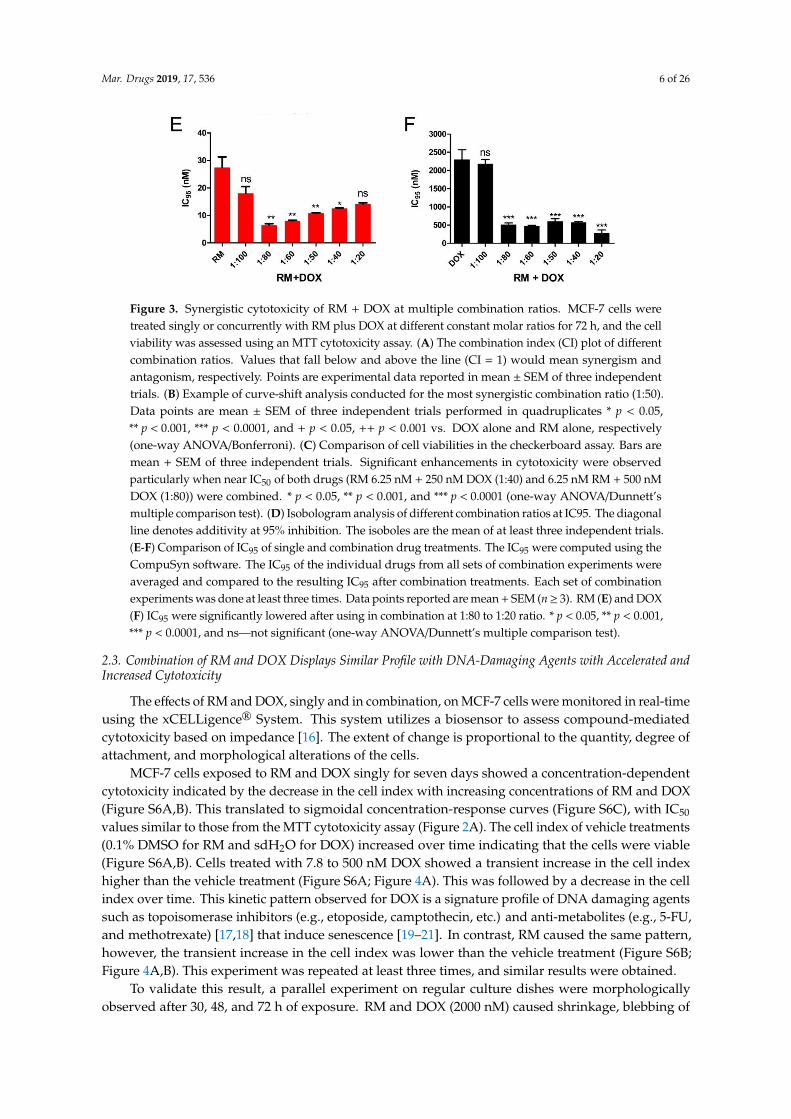
Figure 3. Synergistic cytotoxicity of RM + DOX at multiple combination ratios. MCF-7 cells weretreated singly or concurrently with RM plus DOX at different constant molar ratios for 72 h, and the cellviability was assessed using an MTT cytotoxicity assay. (A) The combination index (CI) plot of differentcombination ratios. Values that fall below and above the line (CI = 1) would mean synergism andantagonism, respectively. Points are experimental data reported in mean ± SEM of three independenttrials. (B) Example of curve-shift analysis conducted for the most synergistic combination ratio (1:50).Data points are mean ± SEM of three independent trials performed in quadruplicates * p < 0.05,** p < 0.001, *** p < 0.0001, and + p < 0.05, ++ p < 0.001 vs. DOX alone and RM alone, respectively(one-way ANOVA/Bonferroni). (C) Comparison of cell viabilities in the checkerboard assay. Bars aremean + SEM of three independent trials. Significant enhancements in cytotoxicity were observedparticularly when near IC50 of both drugs (RM 6.25 nM + 250 nM DOX (1:40) and 6.25 nM RM + 500 nMDOX (1:80)) were combined. * p < 0.05, ** p < 0.001, and *** p < 0.0001 (one-way ANOVA/Dunnett’smultiple comparison test). (D) Isobologram analysis of different combination ratios at IC95. The diagonalline denotes additivity at 95% inhibition. The isoboles are the mean of at least three independent trials.(E-F) Comparison of IC95 of single and combination drug treatments. The IC95 were computed using theCompuSyn software. The IC95 of the individual drugs from all sets of combination experiments wereaveraged and compared to the resulting IC95 after combination treatments. Each set of combinationexperiments was done at least three times. Data points reported are mean + SEM (n≥ 3). RM (E) and DOX(F) IC95 were significantly lowered after using in combination at 1:80 to 1:20 ratio. * p < 0.05, ** p < 0.001,*** p < 0.0001, and ns—not significant (one-way ANOVA/Dunnett’s multiple comparison test).
2.3. Combination of RM and DOX Displays Similar Profile with DNA-Damaging Agents with Accelerated andIncreased Cytotoxicity
The effects of RM and DOX, singly and in combination, on MCF-7 cells were monitored in real-timeusing the xCELLigence® System. This system utilizes a biosensor to assess compound-mediatedcytotoxicity based on impedance [16]. The extent of change is proportional to the quantity, degree ofattachment, and morphological alterations of the cells.
MCF-7 cells exposed to RM and DOX singly for seven days showed a concentration-dependentcytotoxicity indicated by the decrease in the cell index with increasing concentrations of RM and DOX(Figure S6A,B). This translated to sigmoidal concentration-response curves (Figure S6C), with IC50
values similar to those from the MTT cytotoxicity assay (Figure 2A). The cell index of vehicle treatments(0.1% DMSO for RM and sdH2O for DOX) increased over time indicating that the cells were viable(Figure S6A,B). Cells treated with 7.8 to 500 nM DOX showed a transient increase in the cell indexhigher than the vehicle treatment (Figure S6A; Figure 4A). This was followed by a decrease in the cellindex over time. This kinetic pattern observed for DOX is a signature profile of DNA damaging agentssuch as topoisomerase inhibitors (e.g., etoposide, camptothecin, etc.) and anti-metabolites (e.g., 5-FU,and methotrexate) [17,18] that induce senescence [19–21]. In contrast, RM caused the same pattern,however, the transient increase in the cell index was lower than the vehicle treatment (Figure S6B;Figure 4A,B). This experiment was repeated at least three times, and similar results were obtained.
To validate this result, a parallel experiment on regular culture dishes were morphologicallyobserved after 30, 48, and 72 h of exposure. RM and DOX (2000 nM) caused shrinkage, blebbing of
Mar. Drugs 2019, 17, 536 7 of 26
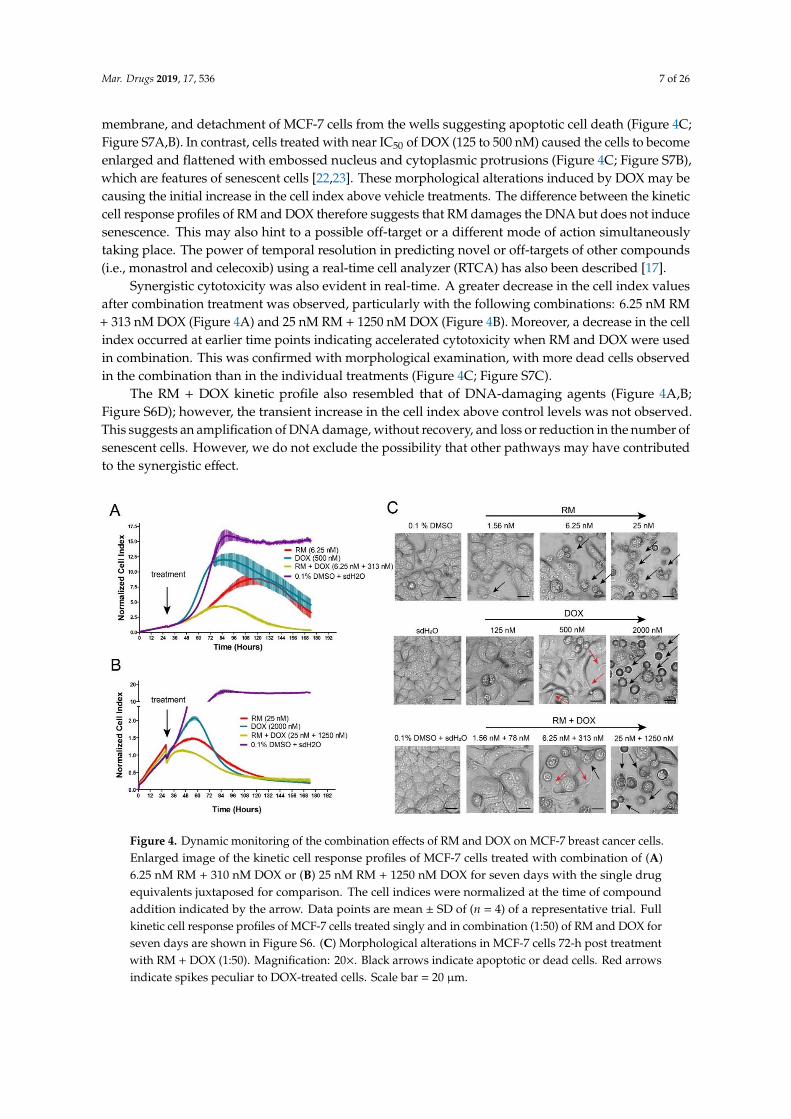
membrane, and detachment of MCF-7 cells from the wells suggesting apoptotic cell death (Figure 4C;Figure S7A,B). In contrast, cells treated with near IC50 of DOX (125 to 500 nM) caused the cells to becomeenlarged and flattened with embossed nucleus and cytoplasmic protrusions (Figure 4C; Figure S7B),which are features of senescent cells [22,23]. These morphological alterations induced by DOX may becausing the initial increase in the cell index above vehicle treatments. The difference between the kineticcell response profiles of RM and DOX therefore suggests that RM damages the DNA but does not inducesenescence. This may also hint to a possible off-target or a different mode of action simultaneouslytaking place. The power of temporal resolution in predicting novel or off-targets of other compounds(i.e., monastrol and celecoxib) using a real-time cell analyzer (RTCA) has also been described [17].
Synergistic cytotoxicity was also evident in real-time. A greater decrease in the cell index valuesafter combination treatment was observed, particularly with the following combinations: 6.25 nM RM+ 313 nM DOX (Figure 4A) and 25 nM RM + 1250 nM DOX (Figure 4B). Moreover, a decrease in the cellindex occurred at earlier time points indicating accelerated cytotoxicity when RM and DOX were usedin combination. This was confirmed with morphological examination, with more dead cells observedin the combination than in the individual treatments (Figure 4C; Figure S7C).
The RM + DOX kinetic profile also resembled that of DNA-damaging agents (Figure 4A,B;Figure S6D); however, the transient increase in the cell index above control levels was not observed.This suggests an amplification of DNA damage, without recovery, and loss or reduction in the number ofsenescent cells. However, we do not exclude the possibility that other pathways may have contributedto the synergistic effect.
Mar. Drugs 2019, 17, x 8 of 28
The RM + DOX kinetic profile also resembled that of DNA-damaging agents (Figure 4A-B;
Figure S6D); however, the transient increase in the cell index above control levels was not observed.
This suggests an amplification of DNA damage, without recovery, and loss or reduction in the
number of senescent cells. However, we do not exclude the possibility that other pathways may have
contributed to the synergistic effect.
Figure 4. Dynamic monitoring of the combination effects of RM and DOX on MCF-7 breast cancer
cells. Enlarged image of the kinetic cell response profiles of MCF-7 cells treated with combination of
(A) 6.25 nM RM + 310 nM DOX or (B) 25 nM RM + 1250 nM DOX for seven days with the single drug
equivalents juxtaposed for comparison. The cell indices were normalized at the time of compound
addition indicated by the arrow. Data points are mean ± SD of (n = 4) of a representative trial. Full
kinetic cell response profiles of MCF-7 cells treated singly and in combination (1:50) of RM and DOX
for seven days are shown in Figure S6. (C) Morphological alterations in MCF-7 cells 72-h post
treatment with RM + DOX (1:50). Magnification: 20×. Black arrows indicate apoptotic or dead cells.
Red arrows indicate spikes peculiar to DOX-treated cells. Scale bar = 20 μm.
2.4. Combination of RM and DOX Increases Apoptosis
Subsequently, we determined the effect of RM and DOX, singly and in combination, on the cell
cycle. RM alone does not significantly affect the cell cycle. Only cells treated with high concentrations
of RM (25 and 100 nM) induced late accumulation of cells in S and G2/M, which was only observed
at 72 h (Figure 5A; Figure S8). In contrast, low concentrations of DOX alone (125 to 500 nM) showed
a more pronounced G2/M arrest after 72 h without a significant increase in sub-G1 (Figure 5A, Figure
S8). Meanwhile, high concentrations of DOX (2000 to 8000 nM) induced an arrest in S phase after 72
h, with a marked increase in sub-G1, suggesting that cells have undergone apoptosis. For the
combination, higher concentration (25 nM RM + 1250 nM DOX) arrested the cells in S phase and
slightly in G2/M, while lower concentrations (i.e., 6.25 nM RM + 313 nM DOX) arrested the cells in
G2/M only (Figure 5A). These effects on the cell cycle may be attributed to DOX. Significant increase
in sub-G1 was also observed (Figure 5A) and may have been induced both in a cell cycle-dependent
and -independent manner.
Sub-G1 population is usually difficult to demonstrate in MCF-7, since this cell line is deficient in
caspase 3, an enzyme responsible for DNA fragmentation [24,25]. For instance, the cell viability of
MCF-7 at 72 h-post treatment with 25 nM and 100 nM RM was almost 5%–10% (Figure 2A), while
Figure 4. Dynamic monitoring of the combination effects of RM and DOX on MCF-7 breast cancer cells.Enlarged image of the kinetic cell response profiles of MCF-7 cells treated with combination of (A)6.25 nM RM + 310 nM DOX or (B) 25 nM RM + 1250 nM DOX for seven days with the single drugequivalents juxtaposed for comparison. The cell indices were normalized at the time of compoundaddition indicated by the arrow. Data points are mean ± SD of (n = 4) of a representative trial. Fullkinetic cell response profiles of MCF-7 cells treated singly and in combination (1:50) of RM and DOX forseven days are shown in Figure S6. (C) Morphological alterations in MCF-7 cells 72-h post treatmentwith RM + DOX (1:50). Magnification: 20×. Black arrows indicate apoptotic or dead cells. Red arrowsindicate spikes peculiar to DOX-treated cells. Scale bar = 20 µm.
Mar. Drugs 2019, 17, 536 8 of 26
2.4. Combination of RM and DOX Increases Apoptosis
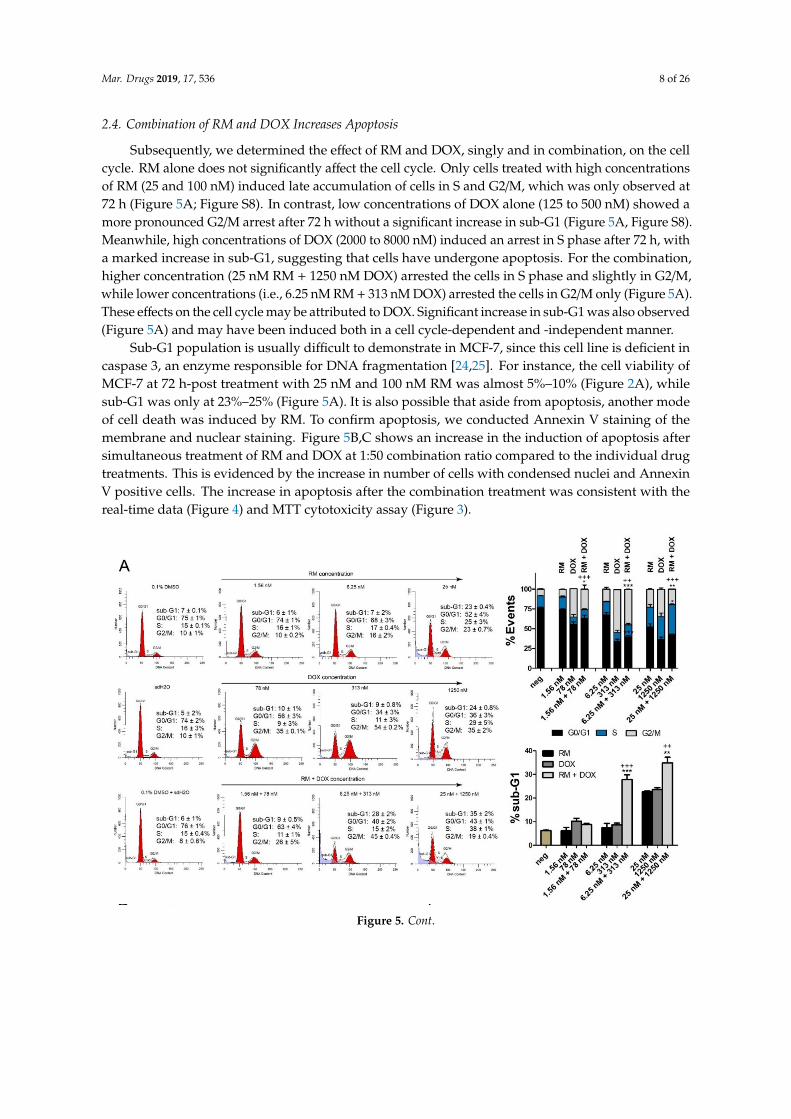
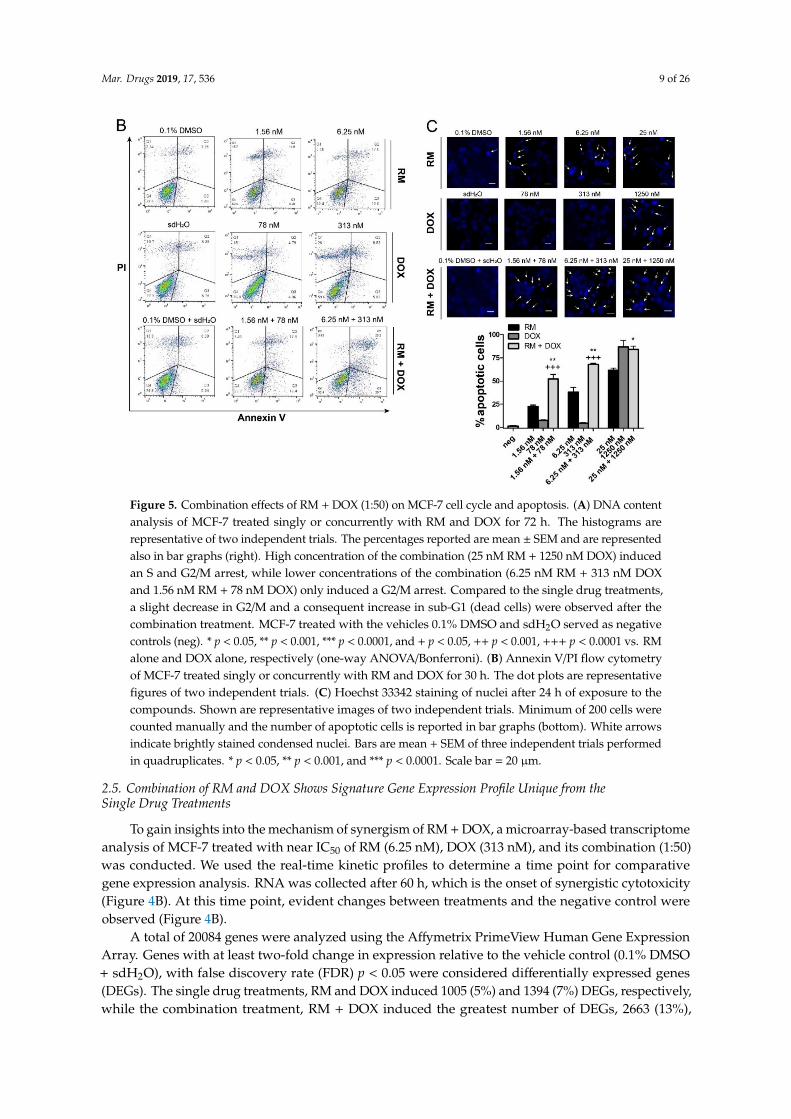
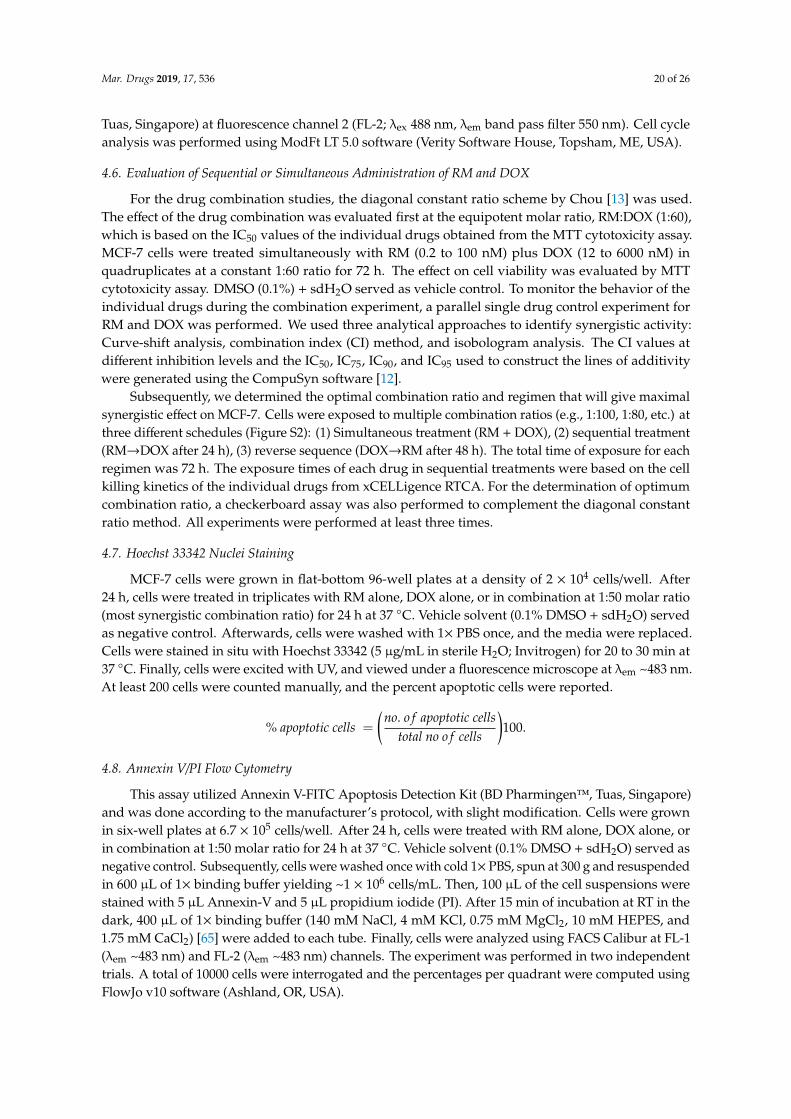
Subsequently, we determined the effect of RM and DOX, singly and in combination, on the cellcycle. RM alone does not significantly affect the cell cycle. Only cells treated with high concentrationsof RM (25 and 100 nM) induced late accumulation of cells in S and G2/M, which was only observed at72 h (Figure 5A; Figure S8). In contrast, low concentrations of DOX alone (125 to 500 nM) showed amore pronounced G2/M arrest after 72 h without a significant increase in sub-G1 (Figure 5A, Figure S8).Meanwhile, high concentrations of DOX (2000 to 8000 nM) induced an arrest in S phase after 72 h, witha marked increase in sub-G1, suggesting that cells have undergone apoptosis. For the combination,higher concentration (25 nM RM + 1250 nM DOX) arrested the cells in S phase and slightly in G2/M,while lower concentrations (i.e., 6.25 nM RM + 313 nM DOX) arrested the cells in G2/M only (Figure 5A).These effects on the cell cycle may be attributed to DOX. Significant increase in sub-G1 was also observed(Figure 5A) and may have been induced both in a cell cycle-dependent and -independent manner.
Sub-G1 population is usually difficult to demonstrate in MCF-7, since this cell line is deficient incaspase 3, an enzyme responsible for DNA fragmentation [24,25]. For instance, the cell viability ofMCF-7 at 72 h-post treatment with 25 nM and 100 nM RM was almost 5%–10% (Figure 2A), whilesub-G1 was only at 23%–25% (Figure 5A). It is also possible that aside from apoptosis, another modeof cell death was induced by RM. To confirm apoptosis, we conducted Annexin V staining of themembrane and nuclear staining. Figure 5B,C shows an increase in the induction of apoptosis aftersimultaneous treatment of RM and DOX at 1:50 combination ratio compared to the individual drugtreatments. This is evidenced by the increase in number of cells with condensed nuclei and AnnexinV positive cells. The increase in apoptosis after the combination treatment was consistent with thereal-time data (Figure 4) and MTT cytotoxicity assay (Figure 3).
Mar. Drugs 2019, 17, x 9 of 28
sub-G1 was only at 23%–25% (Figure 5A). It is also possible that aside from apoptosis, another mode of cell death was induced by RM. To confirm apoptosis, we conducted Annexin V staining of the membrane and nuclear staining. Figure 5B–C shows an increase in the induction of apoptosis after simultaneous treatment of RM and DOX at 1:50 combination ratio compared to the individual drug treatments. This is evidenced by the increase in number of cells with condensed nuclei and Annexin V positive cells. The increase in apoptosis after the combination treatment was consistent with the real-time data (Figure 4) and MTT cytotoxicity assay (Figure 3).
Figure 5. Cont.
Mar. Drugs 2019, 17, 536 9 of 26
Mar. Drugs 2019, 17, x 9 of 28
sub-G1 was only at 23%–25% (Figure 5A). It is also possible that aside from apoptosis, another mode of cell death was induced by RM. To confirm apoptosis, we conducted Annexin V staining of the membrane and nuclear staining. Figure 5B–C shows an increase in the induction of apoptosis after simultaneous treatment of RM and DOX at 1:50 combination ratio compared to the individual drug treatments. This is evidenced by the increase in number of cells with condensed nuclei and Annexin V positive cells. The increase in apoptosis after the combination treatment was consistent with the real-time data (Figure 4) and MTT cytotoxicity assay (Figure 3).
Figure 5. Combination effects of RM + DOX (1:50) on MCF-7 cell cycle and apoptosis. (A) DNA contentanalysis of MCF-7 treated singly or concurrently with RM and DOX for 72 h. The histograms arerepresentative of two independent trials. The percentages reported are mean ± SEM and are representedalso in bar graphs (right). High concentration of the combination (25 nM RM + 1250 nM DOX) inducedan S and G2/M arrest, while lower concentrations of the combination (6.25 nM RM + 313 nM DOXand 1.56 nM RM + 78 nM DOX) only induced a G2/M arrest. Compared to the single drug treatments,a slight decrease in G2/M and a consequent increase in sub-G1 (dead cells) were observed after thecombination treatment. MCF-7 treated with the vehicles 0.1% DMSO and sdH2O served as negativecontrols (neg). * p < 0.05, ** p < 0.001, *** p < 0.0001, and + p < 0.05, ++ p < 0.001, +++ p < 0.0001 vs. RMalone and DOX alone, respectively (one-way ANOVA/Bonferroni). (B) Annexin V/PI flow cytometryof MCF-7 treated singly or concurrently with RM and DOX for 30 h. The dot plots are representativefigures of two independent trials. (C) Hoechst 33342 staining of nuclei after 24 h of exposure to thecompounds. Shown are representative images of two independent trials. Minimum of 200 cells werecounted manually and the number of apoptotic cells is reported in bar graphs (bottom). White arrowsindicate brightly stained condensed nuclei. Bars are mean + SEM of three independent trials performedin quadruplicates. * p < 0.05, ** p < 0.001, and *** p < 0.0001. Scale bar = 20 µm.
2.5. Combination of RM and DOX Shows Signature Gene Expression Profile Unique from theSingle Drug Treatments
To gain insights into the mechanism of synergism of RM + DOX, a microarray-based transcriptomeanalysis of MCF-7 treated with near IC50 of RM (6.25 nM), DOX (313 nM), and its combination (1:50)was conducted. We used the real-time kinetic profiles to determine a time point for comparativegene expression analysis. RNA was collected after 60 h, which is the onset of synergistic cytotoxicity(Figure 4B). At this time point, evident changes between treatments and the negative control wereobserved (Figure 4B).
A total of 20084 genes were analyzed using the Affymetrix PrimeView Human Gene ExpressionArray. Genes with at least two-fold change in expression relative to the vehicle control (0.1% DMSO+ sdH2O), with false discovery rate (FDR) p < 0.05 were considered differentially expressed genes(DEGs). The single drug treatments, RM and DOX induced 1005 (5%) and 1394 (7%) DEGs, respectively,while the combination treatment, RM + DOX induced the greatest number of DEGs, 2663 (13%),
Mar. Drugs 2019, 17, 536 10 of 26
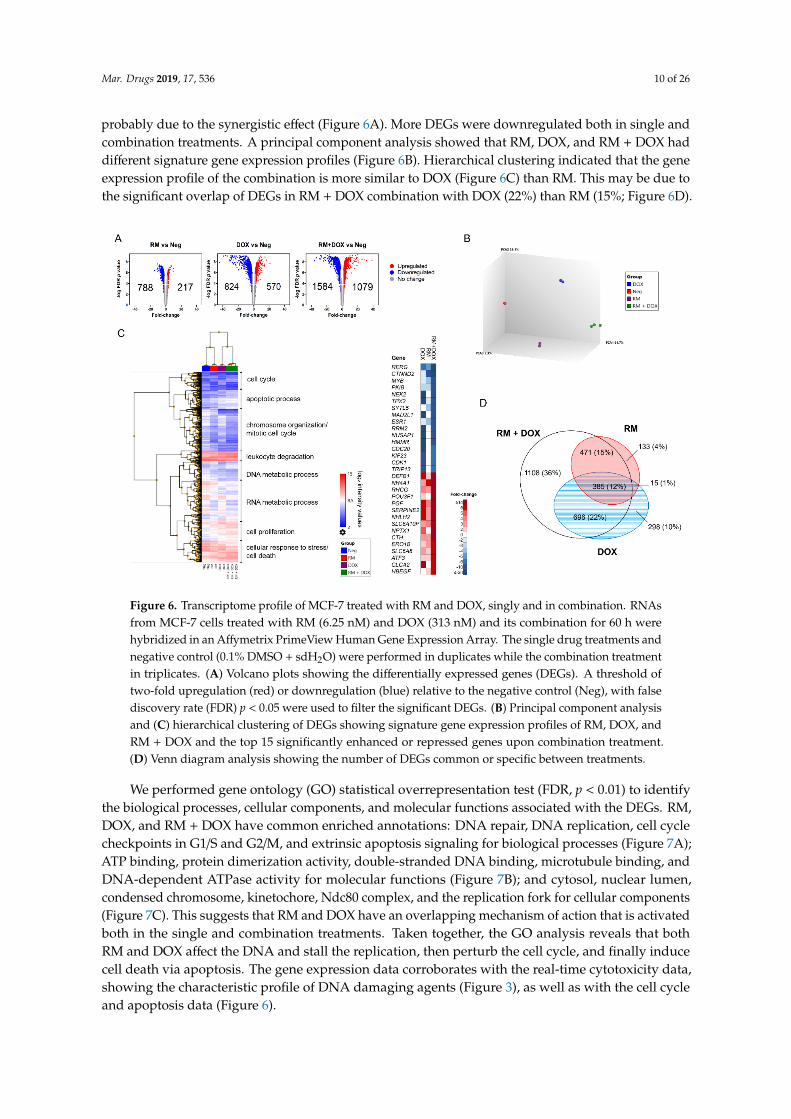
probably due to the synergistic effect (Figure 6A). More DEGs were downregulated both in single andcombination treatments. A principal component analysis showed that RM, DOX, and RM + DOX haddifferent signature gene expression profiles (Figure 6B). Hierarchical clustering indicated that the geneexpression profile of the combination is more similar to DOX (Figure 6C) than RM. This may be due tothe significant overlap of DEGs in RM + DOX combination with DOX (22%) than RM (15%; Figure 6D).
Mar. Drugs 2019, 17, x 11 of 28
Figure 6. Transcriptome profile of MCF-7 treated with RM and DOX, singly and in combination.
RNAs from MCF-7 cells treated with RM (6.25 nM) and DOX (313 nM) and its combination for 60 h
were hybridized in an Affymetrix PrimeView Human Gene Expression Array. The single drug
treatments and negative control (0.1% DMSO + sdH2O) were performed in duplicates while the
combination treatment in triplicates. (A) Volcano plots showing the differentially expressed genes
(DEGs). A threshold of two-fold upregulation (red) or downregulation (blue) relative to the negative
control (Neg), with false discovery rate (FDR) p < 0.05 were used to filter the significant DEGs. (B)
Principal component analysis and (C) hierarchical clustering of DEGs showing signature gene
expression profiles of RM, DOX, and RM + DOX and the top 15 significantly enhanced or repressed
genes upon combination treatment. (D) Venn diagram analysis showing the number of DEGs
common or specific between treatments.
We performed gene ontology (GO) statistical overrepresentation test (FDR, p < 0.01) to identify
the biological processes, cellular components, and molecular functions associated with the DEGs.
RM, DOX, and RM + DOX have common enriched annotations: DNA repair, DNA replication, cell
cycle checkpoints in G1/S and G2/M, and extrinsic apoptosis signaling for biological processes (Figure
7A); ATP binding, protein dimerization activity, double-stranded DNA binding, microtubule
binding, and DNA-dependent ATPase activity for molecular functions (Figure 7B); and cytosol,
nuclear lumen, condensed chromosome, kinetochore, Ndc80 complex, and the replication fork for
cellular components (Figure 7C). This suggests that RM and DOX have an overlapping mechanism
of action that is activated both in the single and combination treatments. Taken together, the GO
analysis reveals that both RM and DOX affect the DNA and stall the replication, then perturb the cell
cycle, and finally induce cell death via apoptosis. The gene expression data corroborates with the
real-time cytotoxicity data, showing the characteristic profile of DNA damaging agents (Figure 3), as
well as with the cell cycle and apoptosis data (Figure 6).
Interestingly, there are gene ontologies that are common only between RM alone and RM + DOX
(RM ∩ RM + DOX) and DOX alone and RM + DOX (DOX ∩ RM + DOX; Figure 7). For RM and RM +
DOX, this includes neurogenesis, regulation of cell migration, angiogenesis, response to reactive
oxygen species (ROS), and ErbB signaling pathway for biological processes; lipid binding, Ras
Figure 6. Transcriptome profile of MCF-7 treated with RM and DOX, singly and in combination. RNAsfrom MCF-7 cells treated with RM (6.25 nM) and DOX (313 nM) and its combination for 60 h werehybridized in an Affymetrix PrimeView Human Gene Expression Array. The single drug treatments andnegative control (0.1% DMSO + sdH2O) were performed in duplicates while the combination treatmentin triplicates. (A) Volcano plots showing the differentially expressed genes (DEGs). A threshold oftwo-fold upregulation (red) or downregulation (blue) relative to the negative control (Neg), with falsediscovery rate (FDR) p < 0.05 were used to filter the significant DEGs. (B) Principal component analysisand (C) hierarchical clustering of DEGs showing signature gene expression profiles of RM, DOX, andRM + DOX and the top 15 significantly enhanced or repressed genes upon combination treatment.(D) Venn diagram analysis showing the number of DEGs common or specific between treatments.
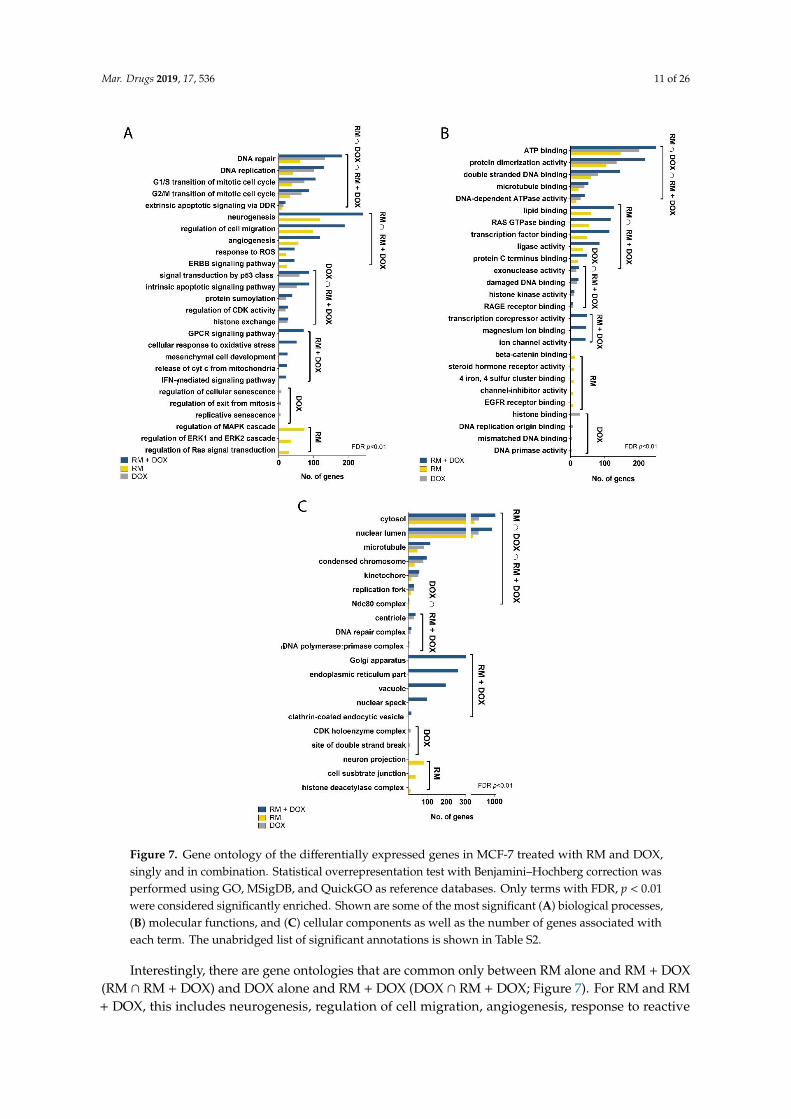
We performed gene ontology (GO) statistical overrepresentation test (FDR, p < 0.01) to identifythe biological processes, cellular components, and molecular functions associated with the DEGs. RM,DOX, and RM + DOX have common enriched annotations: DNA repair, DNA replication, cell cyclecheckpoints in G1/S and G2/M, and extrinsic apoptosis signaling for biological processes (Figure 7A);ATP binding, protein dimerization activity, double-stranded DNA binding, microtubule binding, andDNA-dependent ATPase activity for molecular functions (Figure 7B); and cytosol, nuclear lumen,condensed chromosome, kinetochore, Ndc80 complex, and the replication fork for cellular components(Figure 7C). This suggests that RM and DOX have an overlapping mechanism of action that is activatedboth in the single and combination treatments. Taken together, the GO analysis reveals that bothRM and DOX affect the DNA and stall the replication, then perturb the cell cycle, and finally inducecell death via apoptosis. The gene expression data corroborates with the real-time cytotoxicity data,showing the characteristic profile of DNA damaging agents (Figure 3), as well as with the cell cycleand apoptosis data (Figure 6).
Mar. Drugs 2019, 17, 536 11 of 26
Mar. Drugs 2019, 17, x 13 of 28
Figure 7. Gene ontology of the differentially expressed genes in MCF-7 treated with RM and DOX,
singly and in combination. Statistical overrepresentation test with Benjamini–Hochberg correction
was performed using GO, MSigDB, and QuickGO as reference databases. Only terms with FDR, p <
0.01 were considered significantly enriched. Shown are some of the most significant (A) biological
processes, (B) molecular functions, and (C) cellular components as well as the number of genes
associated with each term. The unabridged list of significant annotations is shown in Table S2.
Figure 7. Gene ontology of the differentially expressed genes in MCF-7 treated with RM and DOX,singly and in combination. Statistical overrepresentation test with Benjamini–Hochberg correction wasperformed using GO, MSigDB, and QuickGO as reference databases. Only terms with FDR, p < 0.01were considered significantly enriched. Shown are some of the most significant (A) biological processes,(B) molecular functions, and (C) cellular components as well as the number of genes associated witheach term. The unabridged list of significant annotations is shown in Table S2.
Interestingly, there are gene ontologies that are common only between RM alone and RM + DOX(RM ∩ RM + DOX) and DOX alone and RM + DOX (DOX ∩ RM + DOX; Figure 7). For RM and RM+ DOX, this includes neurogenesis, regulation of cell migration, angiogenesis, response to reactive
Mar. Drugs 2019, 17, 536 12 of 26
oxygen species (ROS), and ErbB signaling pathway for biological processes; lipid binding, Ras GTPasebinding, transcription factor binding, ligase activity, and protein C terminus binding for molecularfunctions. No unique cellular component was found for RM and RM + DOX. For DOX and RM +
DOX, the common ontologies include signal transduction by p53 class mediator, intrinsic apoptoticsignaling pathway, protein sumoylation, regulation of cyclin-dependent kinase (CDK) activity, andhistone exchange for biological processes; exonuclease activity, damaged DNA binding, histone kinaseactivity, and RAGE receptor binding for molecular function; and centriole, DNA repair complexand α-DNA polymerase:primase complex for cellular components. The biological processes andmolecular functions activated both in the single and combination treatments point toward the possiblemechanism of synergistic cytotoxicity. Therefore, aside from activation of DNA damage response, theregulation of cell migration, angiogenesis, response to ROS, and ErbB signaling pathway activatedby RM, and p53 signaling pathway and intrinsic apoptotic signaling activated by DOX, may becontributing to the observed synergistic effect. Other biological processes were uniquely enrichedwith the combination treatment and included G-protein coupled receptor (GPCR) signaling pathway,cellular response to oxidative stress, release of cytochrome c from mitochondria, and interferon gamma(IFN-γ) signaling pathway.
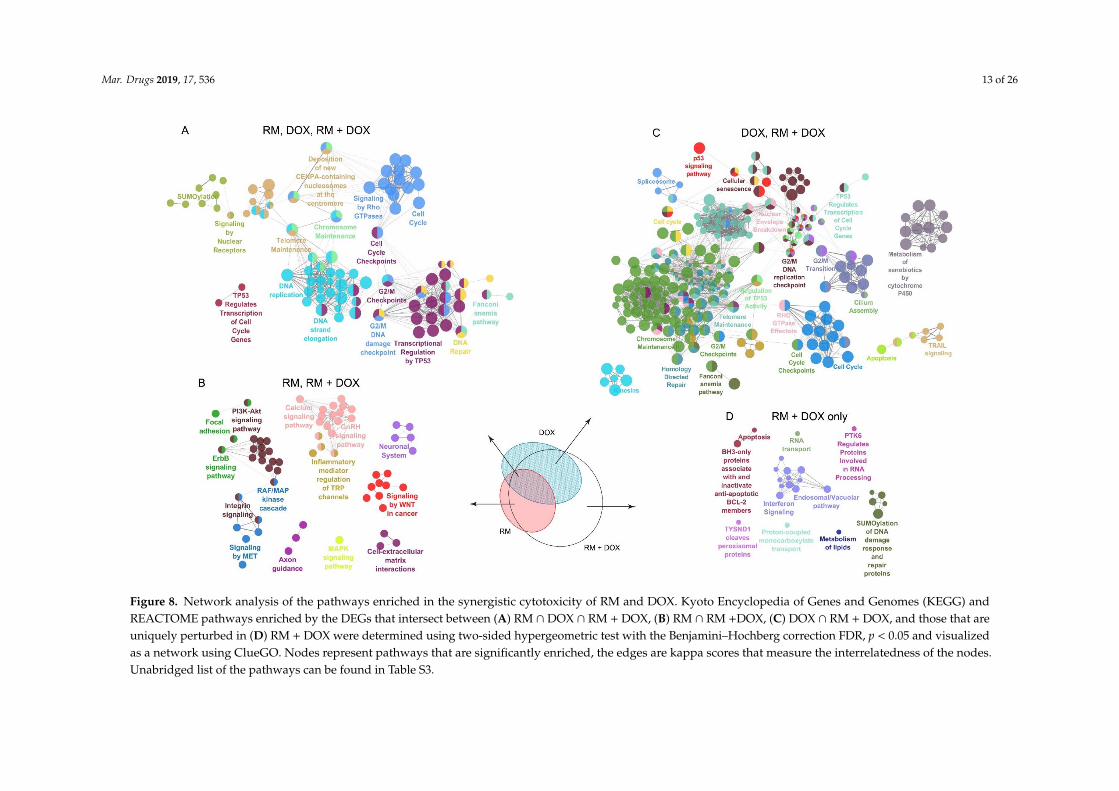
To examine the mechanism of action further, we conducted a molecular networking analysis ofthe REACTOME and Kyoto Encyclopedia of Genes and Genomes (KEGG) pathways enriched by theDEGs common in single and combination drug treatment. We also looked at the pathways associatedwith the genes uniquely regulated in RM + DOX. The molecular networking analysis was consistentwith the GO analysis (Figure 7). As expected, a large network involving mainly the DNA damageresponse and related cell cycle events were enriched in RM ∩ DOX ∩ RM + DOX. This suggests thatRM and DOX collectively modulate the expression and activity of target proteins involved in DNAreplication, DNA repair, G2/M cell cycle checkpoints, p53 regulation of transcription, telomere andchromosome maintenance, and sumoylation of proteins (Figure 8A).
In RM ∩ RM + DOX, several pathways that are diverse from each other were enriched. One clusterincludes the focal adhesion, PI3K-Akt pathway, ErbB pathway, RAF/MAPK cascade, integrin signaling,and signaling by MET, which are interrelated pathways that control cell survival. Another clusterinvolves secondary messenger signaling such as Ca2+ signaling pathway, gonadotropin-releasinghormone (GnRH) pathway, and inflammatory mediator regulation of transient receptor potential (TRP)channels. Signaling by Wnt and cell–extracellular matrix interactions were also activated (Figure 8B).In contrast, the genes uniquely induced or repressed in DOX ∩ RM + DOX were associated with a hugenetwork that overlaps with the networks enriched in RM ∩ DOX ∩ RM + DOX, suggesting that DOXmaybe reinforcing or amplifying the pathways affected by RM, and vice versa (Figure 8C). It is alsoimportant to note that cellular senescence is reflected in the gene expression profile of DOX, confirmingthe phenotypic response observed in real-time cell analyzer (Figure 4). Meanwhile, neurogenesis andaxon guidance consistently appeared as a significant hit (FDR, p < 0.05) in the gene expression profile ofRM (Figure 8A,C and Figure 9B), suggesting a possible neuroactivity. Interestingly, there are networksthat are exclusively activated in RM + DOX only: Endosomal/vacuolar pathway, interferon signaling,apoptosis, and BH-3 only proteins that inactivate anti-apoptotic Bcl-2 proteins, RNA transport, andsumoylation of DNA damage response and repair proteins (Figure 8D).
The combination treatment was able to perturb simultaneously diverse pathways controlling cellsurvival: (1) DNA repair/replication, cell cycle, apoptosis by both RM and DOX, and (2) signalingby receptor tyrosine kinases (i.e., ErbB, PI3K-Akt), focal adhesion and integrin signaling by RM. Wefurther investigated the genes involved in these pathways (Figure 9).
Mar. Drugs 2019, 17, 536 13 of 26Mar. Drugs 2019, 17, x 16 of 28
Mar. Drugs 2019, 17, x; doi: www.mdpi.com/journal/marinedrugs
Figure 8. Network analysis of the pathways enriched in the synergistic cytotoxicity of RM and DOX. Kyoto Encyclopedia of Genes and Genomes (KEGG) and REACTOME
pathways enriched by the DEGs that intersect between (A) RM ∩ DOX ∩ RM + DOX, (B) RM ∩ RM +DOX, (C) DOX ∩ RM + DOX, and those that are uniquely perturbed in
(D) RM + DOX were determined using two-sided hypergeometric test with the Benjamini–Hochberg correction FDR, p < 0.05 and visualized as a network using ClueGO.
Nodes represent pathways that are significantly enriched, the edges are kappa scores that measure the interrelatedness of the nodes. Unabridged list of the pathways can
be found in Table S3.
Figure 8. Network analysis of the pathways enriched in the synergistic cytotoxicity of RM and DOX. Kyoto Encyclopedia of Genes and Genomes (KEGG) andREACTOME pathways enriched by the DEGs that intersect between (A) RM ∩ DOX ∩ RM + DOX, (B) RM ∩ RM +DOX, (C) DOX ∩ RM + DOX, and those that areuniquely perturbed in (D) RM + DOX were determined using two-sided hypergeometric test with the Benjamini–Hochberg correction FDR, p < 0.05 and visualizedas a network using ClueGO. Nodes represent pathways that are significantly enriched, the edges are kappa scores that measure the interrelatedness of the nodes.Unabridged list of the pathways can be found in Table S3.
Mar. Drugs 2019, 17, 536 14 of 26
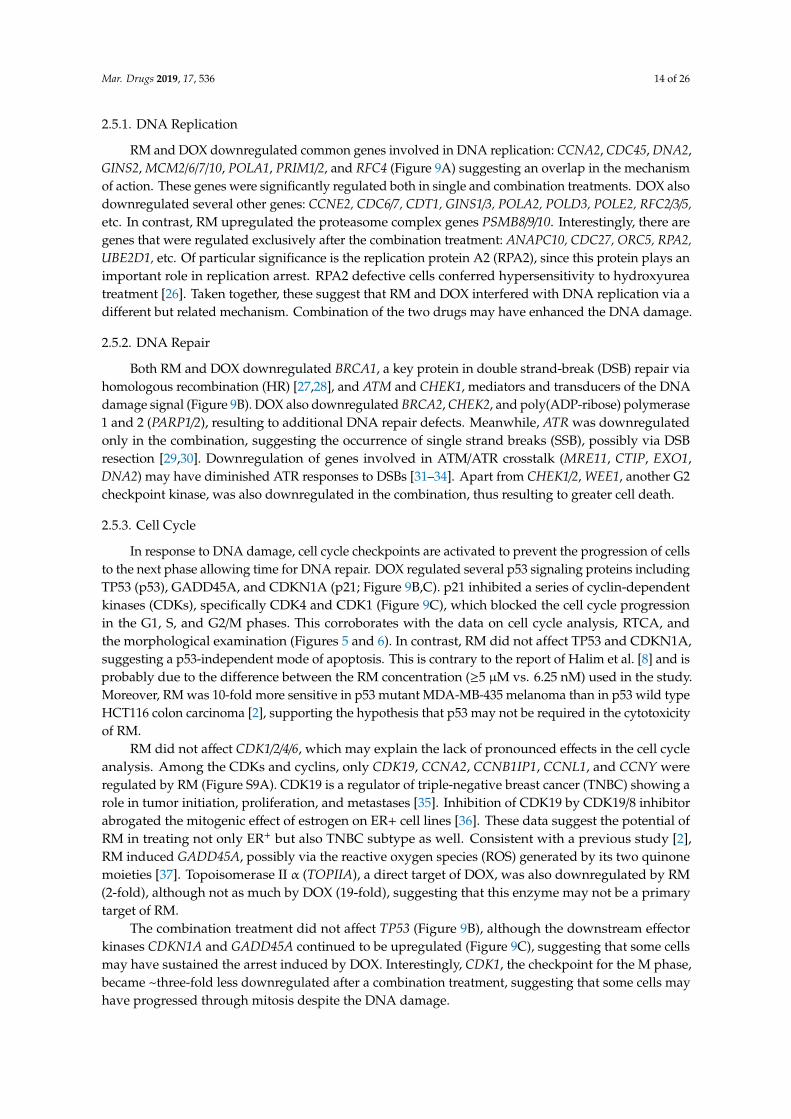
2.5.1. DNA Replication
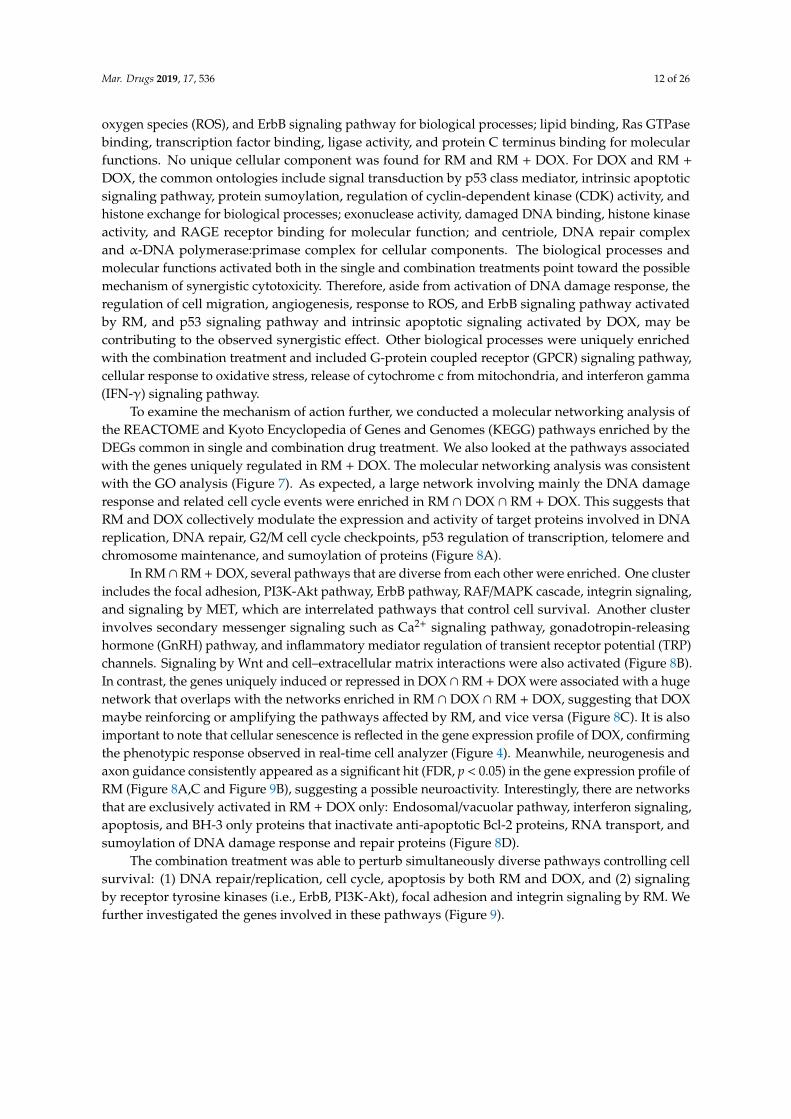
RM and DOX downregulated common genes involved in DNA replication: CCNA2, CDC45, DNA2,GINS2, MCM2/6/7/10, POLA1, PRIM1/2, and RFC4 (Figure 9A) suggesting an overlap in the mechanismof action. These genes were significantly regulated both in single and combination treatments. DOX alsodownregulated several other genes: CCNE2, CDC6/7, CDT1, GINS1/3, POLA2, POLD3, POLE2, RFC2/3/5,etc. In contrast, RM upregulated the proteasome complex genes PSMB8/9/10. Interestingly, there aregenes that were regulated exclusively after the combination treatment: ANAPC10, CDC27, ORC5, RPA2,UBE2D1, etc. Of particular significance is the replication protein A2 (RPA2), since this protein plays animportant role in replication arrest. RPA2 defective cells conferred hypersensitivity to hydroxyureatreatment [26]. Taken together, these suggest that RM and DOX interfered with DNA replication via adifferent but related mechanism. Combination of the two drugs may have enhanced the DNA damage.
2.5.2. DNA Repair
Both RM and DOX downregulated BRCA1, a key protein in double strand-break (DSB) repair viahomologous recombination (HR) [27,28], and ATM and CHEK1, mediators and transducers of the DNAdamage signal (Figure 9B). DOX also downregulated BRCA2, CHEK2, and poly(ADP-ribose) polymerase1 and 2 (PARP1/2), resulting to additional DNA repair defects. Meanwhile, ATR was downregulatedonly in the combination, suggesting the occurrence of single strand breaks (SSB), possibly via DSBresection [29,30]. Downregulation of genes involved in ATM/ATR crosstalk (MRE11, CTIP, EXO1,DNA2) may have diminished ATR responses to DSBs [31–34]. Apart from CHEK1/2, WEE1, another G2checkpoint kinase, was also downregulated in the combination, thus resulting to greater cell death.
2.5.3. Cell Cycle
In response to DNA damage, cell cycle checkpoints are activated to prevent the progression of cellsto the next phase allowing time for DNA repair. DOX regulated several p53 signaling proteins includingTP53 (p53), GADD45A, and CDKN1A (p21; Figure 9B,C). p21 inhibited a series of cyclin-dependentkinases (CDKs), specifically CDK4 and CDK1 (Figure 9C), which blocked the cell cycle progressionin the G1, S, and G2/M phases. This corroborates with the data on cell cycle analysis, RTCA, andthe morphological examination (Figures 5 and 6). In contrast, RM did not affect TP53 and CDKN1A,suggesting a p53-independent mode of apoptosis. This is contrary to the report of Halim et al. [8] and isprobably due to the difference between the RM concentration (≥5 µM vs. 6.25 nM) used in the study.Moreover, RM was 10-fold more sensitive in p53 mutant MDA-MB-435 melanoma than in p53 wild typeHCT116 colon carcinoma [2], supporting the hypothesis that p53 may not be required in the cytotoxicityof RM.
RM did not affect CDK1/2/4/6, which may explain the lack of pronounced effects in the cell cycleanalysis. Among the CDKs and cyclins, only CDK19, CCNA2, CCNB1IP1, CCNL1, and CCNY wereregulated by RM (Figure S9A). CDK19 is a regulator of triple-negative breast cancer (TNBC) showing arole in tumor initiation, proliferation, and metastases [35]. Inhibition of CDK19 by CDK19/8 inhibitorabrogated the mitogenic effect of estrogen on ER+ cell lines [36]. These data suggest the potential ofRM in treating not only ER+ but also TNBC subtype as well. Consistent with a previous study [2],RM induced GADD45A, possibly via the reactive oxygen species (ROS) generated by its two quinonemoieties [37]. Topoisomerase II α (TOPIIA), a direct target of DOX, was also downregulated by RM(2-fold), although not as much by DOX (19-fold), suggesting that this enzyme may not be a primarytarget of RM.
The combination treatment did not affect TP53 (Figure 9B), although the downstream effectorkinases CDKN1A and GADD45A continued to be upregulated (Figure 9C), suggesting that some cellsmay have sustained the arrest induced by DOX. Interestingly, CDK1, the checkpoint for the M phase,became ~three-fold less downregulated after a combination treatment, suggesting that some cells mayhave progressed through mitosis despite the DNA damage.
Mar. Drugs 2019, 17, 536 15 of 26
Mar. Drugs 2019, 17, x 19 of 28
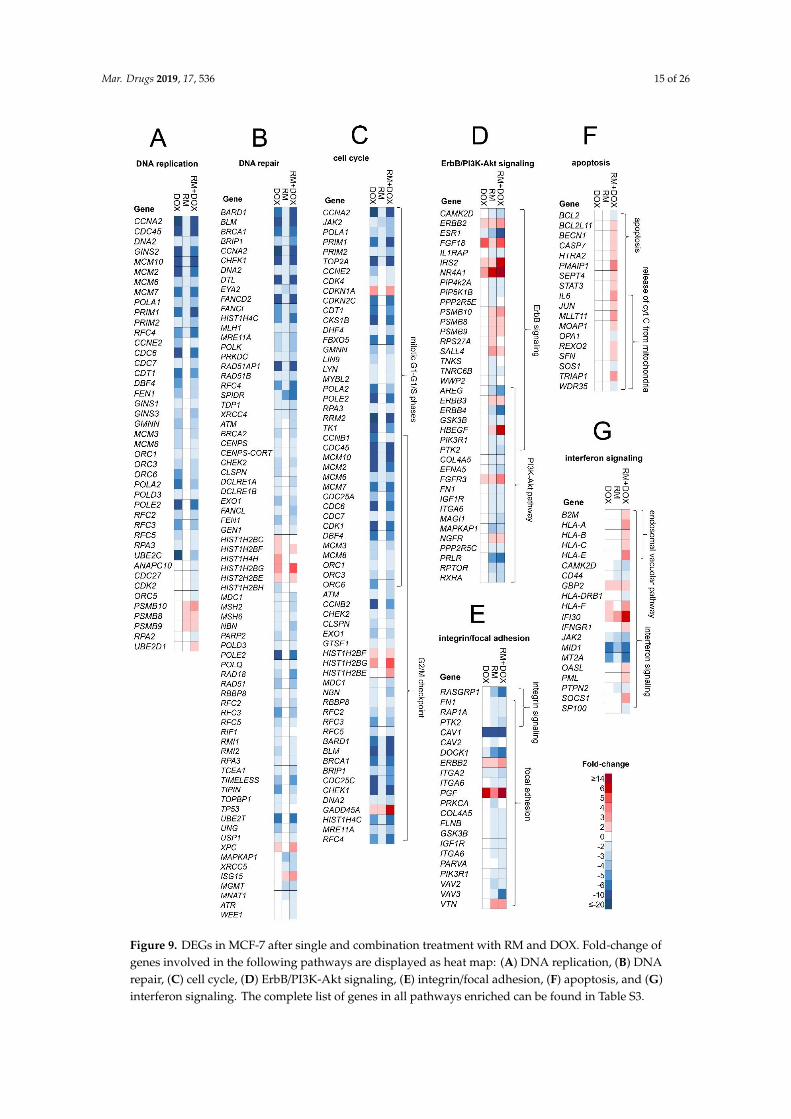
Figure 9. DEGs in MCF-7 after single and combination treatment with RM and DOX. Fold-change of
genes involved in the following pathways are displayed as heat map: (A) DNA replication, (B) DNA
repair, (C) cell cycle, (D) ErbB/PI3K-Akt signaling, (E) integrin/focal adhesion, (F) apoptosis, and (G)
interferon signaling. The complete list of genes in all pathways enriched can be found in Table S3.
Figure 9. DEGs in MCF-7 after single and combination treatment with RM and DOX. Fold-change ofgenes involved in the following pathways are displayed as heat map: (A) DNA replication, (B) DNArepair, (C) cell cycle, (D) ErbB/PI3K-Akt signaling, (E) integrin/focal adhesion, (F) apoptosis, and (G)interferon signaling. The complete list of genes in all pathways enriched can be found in Table S3.
Mar. Drugs 2019, 17, 536 16 of 26
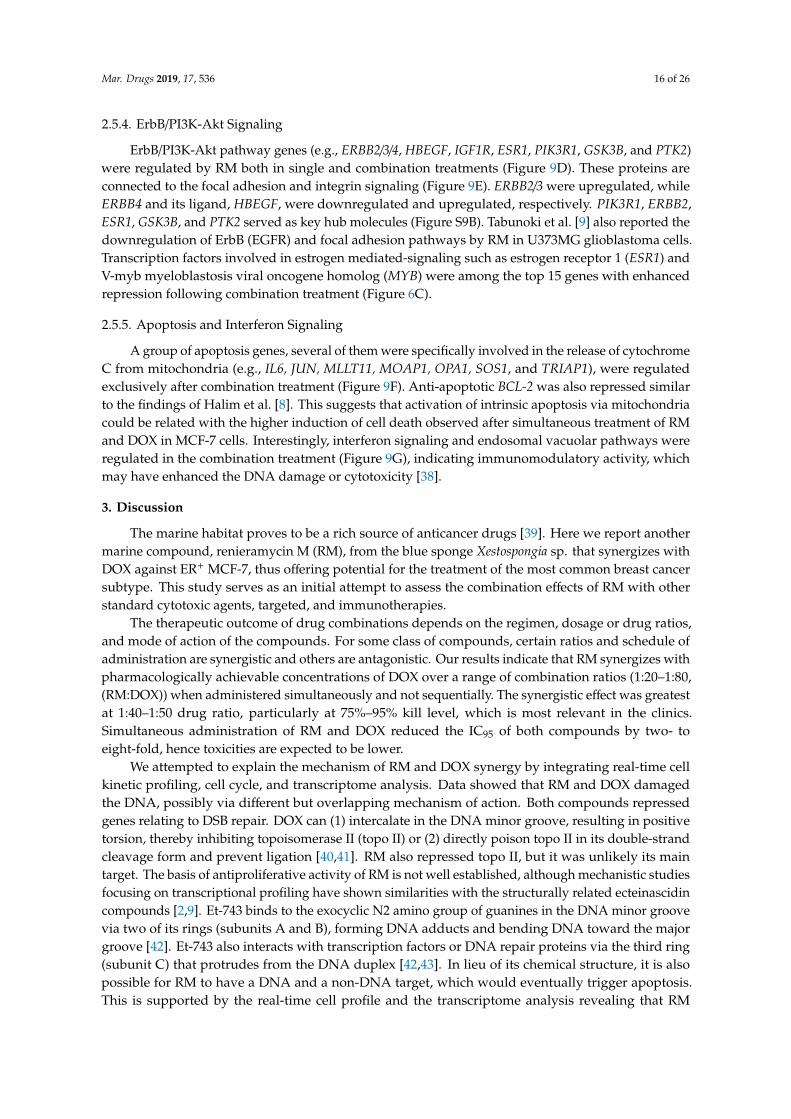
2.5.4. ErbB/PI3K-Akt Signaling
ErbB/PI3K-Akt pathway genes (e.g., ERBB2/3/4, HBEGF, IGF1R, ESR1, PIK3R1, GSK3B, and PTK2)were regulated by RM both in single and combination treatments (Figure 9D). These proteins areconnected to the focal adhesion and integrin signaling (Figure 9E). ERBB2/3 were upregulated, whileERBB4 and its ligand, HBEGF, were downregulated and upregulated, respectively. PIK3R1, ERBB2,ESR1, GSK3B, and PTK2 served as key hub molecules (Figure S9B). Tabunoki et al. [9] also reported thedownregulation of ErbB (EGFR) and focal adhesion pathways by RM in U373MG glioblastoma cells.Transcription factors involved in estrogen mediated-signaling such as estrogen receptor 1 (ESR1) andV-myb myeloblastosis viral oncogene homolog (MYB) were among the top 15 genes with enhancedrepression following combination treatment (Figure 6C).
2.5.5. Apoptosis and Interferon Signaling
A group of apoptosis genes, several of them were specifically involved in the release of cytochromeC from mitochondria (e.g., IL6, JUN, MLLT11, MOAP1, OPA1, SOS1, and TRIAP1), were regulatedexclusively after combination treatment (Figure 9F). Anti-apoptotic BCL-2 was also repressed similarto the findings of Halim et al. [8]. This suggests that activation of intrinsic apoptosis via mitochondriacould be related with the higher induction of cell death observed after simultaneous treatment of RMand DOX in MCF-7 cells. Interestingly, interferon signaling and endosomal vacuolar pathways wereregulated in the combination treatment (Figure 9G), indicating immunomodulatory activity, whichmay have enhanced the DNA damage or cytotoxicity [38].
3. Discussion
The marine habitat proves to be a rich source of anticancer drugs [39]. Here we report anothermarine compound, renieramycin M (RM), from the blue sponge Xestospongia sp. that synergizes withDOX against ER+ MCF-7, thus offering potential for the treatment of the most common breast cancersubtype. This study serves as an initial attempt to assess the combination effects of RM with otherstandard cytotoxic agents, targeted, and immunotherapies.
The therapeutic outcome of drug combinations depends on the regimen, dosage or drug ratios,and mode of action of the compounds. For some class of compounds, certain ratios and schedule ofadministration are synergistic and others are antagonistic. Our results indicate that RM synergizes withpharmacologically achievable concentrations of DOX over a range of combination ratios (1:20–1:80,(RM:DOX)) when administered simultaneously and not sequentially. The synergistic effect was greatestat 1:40–1:50 drug ratio, particularly at 75%–95% kill level, which is most relevant in the clinics.Simultaneous administration of RM and DOX reduced the IC95 of both compounds by two- toeight-fold, hence toxicities are expected to be lower.
We attempted to explain the mechanism of RM and DOX synergy by integrating real-time cellkinetic profiling, cell cycle, and transcriptome analysis. Data showed that RM and DOX damagedthe DNA, possibly via different but overlapping mechanism of action. Both compounds repressedgenes relating to DSB repair. DOX can (1) intercalate in the DNA minor groove, resulting in positivetorsion, thereby inhibiting topoisomerase II (topo II) or (2) directly poison topo II in its double-strandcleavage form and prevent ligation [40,41]. RM also repressed topo II, but it was unlikely its maintarget. The basis of antiproliferative activity of RM is not well established, although mechanistic studiesfocusing on transcriptional profiling have shown similarities with the structurally related ecteinascidincompounds [2,9]. Et-743 binds to the exocyclic N2 amino group of guanines in the DNA minor groovevia two of its rings (subunits A and B), forming DNA adducts and bending DNA toward the majorgroove [42]. Et-743 also interacts with transcription factors or DNA repair proteins via the third ring(subunit C) that protrudes from the DNA duplex [42,43]. In lieu of its chemical structure, it is alsopossible for RM to have a DNA and a non-DNA target, which would eventually trigger apoptosis.This is supported by the real-time cell profile and the transcriptome analysis revealing that RM
Mar. Drugs 2019, 17, 536 17 of 26
downregulated DNA repair proteins and tyrosine kinase signaling proteins involved in ErbB/PI3K-Aktand focal adhesion pathways. The differential regulation of these pathways could be integral to thecytotoxicity of RM. Growth arrest and DNA damage-inducible gene 45 (GADD45A), a p53-induciblegene involved in the mitotic phase of the cell cycle, was induced by RM, corroborating the results ofan earlier report [2]. However, our results revealed no significant cell cycle arrest, suggesting thatother events have led to apoptosis. Possible routes could be through a putative protein target or thenon-specific oxidative stress, which can cause DNA-strand breaks, membrane damage, and eventually,cell death [37]. Saframycin A (Saf A), another closely related tetrahydroisoquinoline with pyruvamideside chain at C-22 instead of an angelate ester [44], was also shown to alkylate guanine residues inDNA duplexes [45,46]. Both compounds offered compelling evidence supporting the involvementof iminium ion intermediate in the process, either by the expulsion of cyanide by Saf A or water byEt-743 [47]. However, based on gene expression analysis, Saf A did not affect DNA repair genes, asmight have been expected if the primary action is through covalent modification of DNA [48]. LikeEt-743, this suggests that Saf A also targets a non-DNA target, which was later on identified to beGAPDH via formation of DNA ternary complexes [49]. Based on the SAR study, the C-22 angelate esteris important in the cytotoxicity of RM [3] and may be key to the activation of DNA damage response.SAR studies designed to determine the effects on DNA, coupled with computational modeling will beimportant in unraveling the moieties that bind to the DNA and putative non-DNA targets.
There are two possible mechanisms therefore to explain the synergy between RM and DOX inMCF-7 breast cancer cells. First, RM and DOX may have acted on the same or related pathway andamplified DNA injury while simultaneously repressing DNA repair pathways. One possible scenariowould be accumulation of lesions due to DSBs and SSBs, requiring DNA repair. We hypothesizedthat these lesions were not repaired due to downregulation of BRCA1 by both compounds. With thesimultaneous inhibition of PARP1/2 by DOX, the number of SSBs increased, resulting in a greaterreplication-associated DSBs, which in turn produced chromatid breaks and exchange aberrations, leadingto cell death. Moreover, DOX also downregulated BRCA2, resulting to additional BRCA2-mediated HRrepair defects. The mechanism of RM and DOX synergy may be reminiscent of the synthetic lethality inHR-defective breast and ovarian cancer (with BRCA1/2 mutations) treated with PARP inhibitors [27,28].Another possible scenario would be the blocking of the mediators (ATM and ATR), and transducers(CHEK1 and CHEK2) of SSB and DSB repair. CHEK1/2 is responsible for controlling G1/S, S, and G2/Mcheckpoints. Simultaneous inhibition of CHEK1/2 and other DNA repair proteins may have propagatedthe DNA damage by permitting the replication of unrepaired DNA, causing genomic instability. Cellsthat accumulated DNA injury may have progressed through mitosis without arrest for repair andeventually underwent mitotic catastrophe or apoptosis [38]. Inactivation of anti-apoptotic BCL2 andcytochrome C release upon combination treatment may also have enhanced cell death. Finally, theactivation of interferon gamma signaling may indicate immune regulation that may have altered theexpression of DNA damage repair proteins and cell cycle regulators [38].
Second, RM and DOX may have acted on different targets or pathways that may either complementor reinforce drug action or neutralize compensatory mechanisms [50–52]. An example is vinblastine,a tubulin inhibitor that works synergistically with DOX for non-Hodgkin lymphoma [53] andtriple-negative breast cancer [50]. Here we show that RM is able to downregulate ErbB (possiblythrough ERBB4), PI3K-Akt, and focal adhesion pathways. Miller et al. [54] reported that combinedinhibition of CDK4 and IGF1R cooperatively suppresses the activation of proteins within the Aktpathway resulting in synergistic cytotoxicity. This might be implicated in the synergism of RM andDOX, as shown by the downregulation of IGF1R by RM, and CDK4 by DOX. Inhibition of PI3K-Akt byRM may also have utility in repressing DOX resistance in melanoma and colon cancer cells [55]. RMwas reported to inhibit the migration and invasion of H460 lung cancer cells, thus may be a potentialanti-metastatic agent [8]. We speculate that downregulation of focal adhesion and integrin signalingvia protein tyrosine kinase 2 (PTK2) may be involved. PTK2 or focal adhesion kinase (FAK) is enrichedin focal adhesions and together with Src kinase coordinates adhesion turnover, actin cytoskeleton
Mar. Drugs 2019, 17, 536 18 of 26
dynamics and cell shape and regulates cancer cell migration and cell invasion [56]. Another key proteinthat was recently reported to be involved in breast cancer metastasis is the Myb [57]. A three- tofive-fold increase in repression of MYB was observed after combination, thus providing another basisfor its use in the treatment of advanced breast cancer. Currently, it is unclear whether perturbation ofErbB/PI3K-Akt and focal adhesion pathways occur upstream, downstream, or simultaneously withDNA damage response, and whether it may have impact to the synergistic effect of RM + DOX. Liuand Zhao [58] reported that two compounds with different gene expression profiles may offset eachother’s effects when applied together, thus are less likely able to ‘collaborate’ to generate synergisticeffects. Further investigation on the cross-talk of these two pathways is needed.
The mechanism of additivity and antagonism after sequential administration is currently unknown.We suspect that pretreatment with DOX have locked the cells at G2/M and caused senescence. Senescentcells tend to be resistant to apoptotic signals and may have reduced sensitivity to RM. Another possibilityis that RM action may require dividing cells. A number of DEGs after RM treatment were associatedwith mitotic cell cycle, hence growth arrested cells may have reduced sensitivity to RM.
Several studies on the individual effects of RM and DOX have been published, however itscombination effects have not been explored. To our knowledge, this is the first report on the synergisticcytotoxicity of RM and DOX in a breast cancer cell line with proposed mechanisms based on real-timekinetic profiles, cell cycle effects, and transcriptome signatures. Our study confirms several findings ofprevious reports and provides new insights to the mechanism of RM alone and the combination withDOX. However, the main drug driving the synergy remains largely unknown and further testing isneeded. Although, it is possible that the mechanism of synergy may be explained by more than onemechanism. We found that the combination of RM and DOX also induces synergistic cytotoxicity inmammalian normal canine kidney cells (MDCK). This can be circumvented by synthesizing analoguesof RM with improved selectivity. Other strategies such as antibody-drug conjugation [59] and controlleddrug release in tumor tissues at specific ratios are being explored to maximize therapeutic index [60].Successful translation of ratio-dependent synergistic drug combinations in pre-clinical and clinicaltrials using nano-scale drug delivery liposomes has been reported [61,62]. Currently, the efficacy of RMand DOX combination is being evaluated in vivo. Phenotypic profiling coupled with transcriptomicprofiling of the compounds have aided us in understanding the synergism of RM and DOX. This studyadds impetus to investigate the effects of RM with other anticancer drugs—cytotoxic agents, targeted,or immunotherapies, not only in ER+ but also in other subtypes of breast cancer and other solid tumors.
4. Materials and Methods
4.1. Chemicals
The supply of renieramycin M (RM) for this study was isolated and purified using the method ofSuwanborirux et al. [7]. RM is >99% pure. All NMR and MS data agree with the literature. A 10 mM(5.75 mg/mL) stock solution of RM was prepared in dimethyl sulfoxide (DMSO), and then furtherdiluted to 100 µM using the same solvent. Doxorubicin (DOX), 98%–102% pure (HPLC), was purchasedfrom Sigma-Aldrich Co. (Saint Louis, MO, USA). (D1515) and dissolved in sterile water to make8.5 mM (5 mg/mL). Both stock solutions were aliquoted in several tubes, and stored at −20 ◦C. Furtherdilutions of RM and DOX were prepared in 10% DMSO and sdH2O, respectively.
4.2. Cell Culture
MCF-7 (ATCC® HTB-22™) was maintained following the supplier’s protocol. All cell cultureproducts were purchased from Gibco® (Waltham, MA, USA), unless otherwise stated. Briefly, cellswere maintained at 37 ◦C under 5% CO2 in 10% MEM supplemented with 2 mM L-glutamine, 1×non-essential amino acids, 1 mM sodium pyruvate, 1.5 g/L sodium bicarbonate (Sigma-Aldrich®),100 units of penicillin, and 100 µg/mL streptomycin, and 0.01 mg/mL recombinant human insulin(Sigma-Aldrich®). Culture media were renewed every two to three days, and cells were subcultured
Mar. Drugs 2019, 17, 536 19 of 26
when 80%–90% confluent. Only cells that have >90% viability, passage number <20, and in the logphase of growth were used for assays. To harvest cells for assays, cells were washed three times with1× PBS and incubated with 0.25% trypsin-EDTA at room temperature (RT; 24–26 ◦C) for 3–7 min oruntil the cells detached. Afterwards, cells were resuspended in 10% growth media. Seeding densitywas determined by manual counting in a hemocytometer using 0.4% trypan blue.
4.3. MTT Cytotoxicity Assay
Quantification of cell viability was based on an MTT (3-(4,5-dimethyl-2-thiazolyl)-2,5-diphenyl-2H-tetrazolium bromide) assay [63]. Briefly, cells were seeded into a flat bottom 96 well-plate at adensity of 2 × 10⁴ cells/well and incubated at 37 ◦C under 5% CO2 for 24 h. Subsequently, cells weretreated in quadruplicate with DOX (1 to 31600 nM), RM (0.0316 to 1000 nM) or vehicle controls (0.1%DMSO and sdH2O) and exposed for 72 h. Then, 15 µL of filtered MTT (5 mg/mL in 1× PBS) was addedto each well and incubated for another 3 h. Finally, 100 µL of DMSO was added, and the absorbancewas read in a microplate reader (Biotek®, Synergy-HT®, Winooski, VT, USA) at 570 nm. The percentcell viability relative to the vehicle control was calculated using the following equation:
% Cell Viability =
(Absorbance compound treated – Absorbance media
Absorbance vehicle treated –Absorbance media
)100.
The IC50 and slope (m) of the concentration-response curves were calculated using the CompuSynsoftware developed by Chou and Martin [12]. These values were then used for the evaluation of thedrug combination experiments described below.
4.4. Real-Time Monitoring of Cytotoxicity
This assay utilized the xCELLigence® real-time cells analyzer to monitor the effects of thecompounds to the cells. Cell titration was first conducted to determine the appropriate seeding densityin the assay (Figure S1). To start the real-time cell analysis, background readings from 100 µL of mediaadded in each well of the E-plate® 96 was obtained. A 100 µL aliquot of the cell suspension (2 × 10⁴
cells/well) was added, and the plate was equilibrated at RT for 30 min before placing in the RTCA-SPstation inside the 5% CO2 incubator. After ~24 h, the cells were treated with the compounds in the samemanner as in the MTT cytotoxicity assay. Cellular responses were monitored every 30 s for 1 h, thenevery 2 min for another 1 h, and finally every 30 min for 144–168 h (six to seven days). Cell index valueswere normalized to the time of addition of compounds and plotted in GraphPad PrismTM version 3.03(San Diego, CA, USA). IC50s were calculated using the sigmoidal-dose response curve-variable slopeequation using the RTCA-SP software version 2.0 (San Diego, CA, USA).
4.5. Cell Cycle Analysis
This assay was based on Riccardi and Nicolletti [64] with slight modification. Briefly, MCF-7 cellswere grown in six-well plates at 6.7 × 10⁵ cells/well. After 24 h, cells were treated, either singly or incombination, with DOX (125 to 8000 nM) and RM (1.56 to 100 nM), then harvested at 30 and 72 h-postincubation to generate a concentration- and time-dependent response data. Cells were washed with1 mL cold 1× PBS and centrifuged at 200g (Thermo Scientific, Heraeus™Megafuge 16R, Waltham, MA,USA) for 5 min at RT. Cells were resuspended in 500 µL of cold 1× PBS then fixed for a minimum of24 h by adding 4.5 mL of 70% cold ethanol. Afterwards, the cell suspension was spun at 800 g for10 min to remove the ethanol. Cells were washed with 5 mL 1× PBS, spun at 800 g for 10 min, andresuspended in 500 µL of 1× PBS. Subsequently, 500 µL of 0.192M Na2HPO4, pH 7.8, with 0.004%Triton X-100 was added, incubated at RT for 5 min, and centrifuged at 800g for 10 min. Cells wereresuspended in 1 mL of freshly prepared DNA staining solution (200 µg of propidium iodide (PI) in10 mL 1× PBS, with 2 mg of DNAse free RNAse (Roche®, Basel, Switzerland) and incubated at RT inthe dark for 4 h. Finally, cells were analyzed using flow cytometry (FACS Calibur, BD Biosciences,
Mar. Drugs 2019, 17, 536 20 of 26
Tuas, Singapore) at fluorescence channel 2 (FL-2; λex 488 nm, λem band pass filter 550 nm). Cell cycleanalysis was performed using ModFt LT 5.0 software (Verity Software House, Topsham, ME, USA).
4.6. Evaluation of Sequential or Simultaneous Administration of RM and DOX
For the drug combination studies, the diagonal constant ratio scheme by Chou [13] was used.The effect of the drug combination was evaluated first at the equipotent molar ratio, RM:DOX (1:60),which is based on the IC50 values of the individual drugs obtained from the MTT cytotoxicity assay.MCF-7 cells were treated simultaneously with RM (0.2 to 100 nM) plus DOX (12 to 6000 nM) inquadruplicates at a constant 1:60 ratio for 72 h. The effect on cell viability was evaluated by MTTcytotoxicity assay. DMSO (0.1%) + sdH2O served as vehicle control. To monitor the behavior of theindividual drugs during the combination experiment, a parallel single drug control experiment forRM and DOX was performed. We used three analytical approaches to identify synergistic activity:Curve-shift analysis, combination index (CI) method, and isobologram analysis. The CI values atdifferent inhibition levels and the IC50, IC75, IC90, and IC95 used to construct the lines of additivitywere generated using the CompuSyn software [12].
Subsequently, we determined the optimal combination ratio and regimen that will give maximalsynergistic effect on MCF-7. Cells were exposed to multiple combination ratios (e.g., 1:100, 1:80, etc.) atthree different schedules (Figure S2): (1) Simultaneous treatment (RM + DOX), (2) sequential treatment(RM→DOX after 24 h), (3) reverse sequence (DOX→RM after 48 h). The total time of exposure for eachregimen was 72 h. The exposure times of each drug in sequential treatments were based on the cellkilling kinetics of the individual drugs from xCELLigence RTCA. For the determination of optimumcombination ratio, a checkerboard assay was also performed to complement the diagonal constantratio method. All experiments were performed at least three times.
4.7. Hoechst 33342 Nuclei Staining
MCF-7 cells were grown in flat-bottom 96-well plates at a density of 2 × 10⁴ cells/well. After24 h, cells were treated in triplicates with RM alone, DOX alone, or in combination at 1:50 molar ratio(most synergistic combination ratio) for 24 h at 37 ◦C. Vehicle solvent (0.1% DMSO + sdH2O) servedas negative control. Afterwards, cells were washed with 1× PBS once, and the media were replaced.Cells were stained in situ with Hoechst 33342 (5 µg/mL in sterile H2O; Invitrogen) for 20 to 30 min at37 ◦C. Finally, cells were excited with UV, and viewed under a fluorescence microscope at λem ~483 nm.At least 200 cells were counted manually, and the percent apoptotic cells were reported.
% apoptotic cells =
(no. o f apoptotic cells
total no o f cells
)100.
4.8. Annexin V/PI Flow Cytometry
This assay utilized Annexin V-FITC Apoptosis Detection Kit (BD Pharmingen™, Tuas, Singapore)and was done according to the manufacturer’s protocol, with slight modification. Cells were grownin six-well plates at 6.7 × 10⁵ cells/well. After 24 h, cells were treated with RM alone, DOX alone, orin combination at 1:50 molar ratio for 24 h at 37 ◦C. Vehicle solvent (0.1% DMSO + sdH2O) served asnegative control. Subsequently, cells were washed once with cold 1× PBS, spun at 300 g and resuspendedin 600 µL of 1× binding buffer yielding ~1 × 10⁶ cells/mL. Then, 100 µL of the cell suspensions werestained with 5 µL Annexin-V and 5 µL propidium iodide (PI). After 15 min of incubation at RT in thedark, 400 µL of 1× binding buffer (140 mM NaCl, 4 mM KCl, 0.75 mM MgCl2, 10 mM HEPES, and1.75 mM CaCl2) [65] were added to each tube. Finally, cells were analyzed using FACS Calibur at FL-1(λem ~483 nm) and FL-2 (λem ~483 nm) channels. The experiment was performed in two independenttrials. A total of 10000 cells were interrogated and the percentages per quadrant were computed usingFlowJo v10 software (Ashland, OR, USA).
Mar. Drugs 2019, 17, 536 21 of 26
4.9. Microarray-Based Transcriptome Analysis
MCF-7 cells were treated with near IC50 concentrations of RM (6.25 nM), DOX (313 nM), and itscombination for 60 h. Individual drug treatments and vehicle control were prepared in duplicates,while the combination treatment was prepared in triplicates. Cells were lysed using QIAshredder(Qiagen, Hilder, Germany), followed by RNA extraction using QIAgen RNeasy mini kit (Qiagen,Hilder, Germany) and sent to Origen Labs Inc. (Ayer Rajah Crescent, Singapore) within 24 h formicroarray hybridization using Affymetrix PrimeView Human Expression Arrays. CEL files weregenerated using Affymetrix GCC (GeneChip Command Console) 5.0 software (Waltham, MA, USA)and imported to the Transcriptome Analysis Console (TAC 4.0) software (Waltham, MA, USA) fordata quality control (QC). RMA normalization were performed on the samples to generate the QCmetrics. Samples showed OD260/OD280 ratios of ~1.793 to 1.915, with concentrations of 132.81 ng/µL to541.99 ng/µL, indicating good purity and acceptable concentrations.
Mean absolute relative log expression (RLE), principal component analysis (PCA) plot andhierarchical clustering of differentially expressed genes (DEG) were conducted in TAC 4.0. CHPfiles were used to obtain DEGs using a one-way analysis of variance—ANOVA (eBayes) and filtercriteria of fold change ≤−2 or ≥2 with an ANOVA, p < 0.05. Gene ontology (GO) of the DEGs wasconducted using ClueGO v. 2.5.1 (Paris, France) [66]. The Molecular Signature Database (MSigDB) C5Collection v. 6.2 of the Broad Institute (updated July 2018) (Cambridge, MA, USA) [67] and QuickGOof EMBL-EBI (updated August 2018) (Hinxton, Cambridgeshire, UK) [68] were used as reference genelists. Enrichment/depletion (two-sided hypergeometric test) with Benjamini–Hochberg correctionwas performed. Only hits with false discovery rate (FDR) p < 0.01 were considered statisticallysignificant. Annotation data sets used were GO complete biological process, cellular component,and molecular function. ClueGO was also used for pathway enrichment and network analysis withREACTOME pathways (updated August 2018) [69] and Kyoto Encyclopedia of Genes and Genomes(KEGG) pathways (updated August 2018) [70] as reference lists. Other databases that use differentalgorithm from ClueGO, such as Gene Ontology Consortium v. 13.1 (released 2018-02-03) [71,72] andProtein Annotation Through Evolutionary Relationship (PANTHER; updated August 2018) [73] werealso utilized to validate the results. An overrepresentation test using Fisher’s exact test with FDRcorrection was performed. Terms with FDR, p < 0.05 were considered significant. Venn Diagrams wereconstructed using EulerAPE (University of Kent, Canterbury, UK) [74]. Microarray gene expressiondata (GSE124597) were submitted to Gene Expression Omnibus (GEO).
4.10. Statistical Analysis
All experiments were performed with at least two to three independent trials. Results wereexpressed as mean ± SD or mean ± SEM. Statistical comparisons were performed using GraphPadPrismTM version 3.03 using one-way ANOVA (analysis of variance) followed by Bonferroni or Dunnett’smultiple comparison test or unpaired two-tailed Student’s t-test. p < 0.05 were considered significant.
5. Patents
This study has been the subject of patent application by J.O.T. and G.P.C. of the Marine ScienceInstitute, University of the Philippines Diliman with patent application number 1-2018-050034,patent pending.
Supplementary Materials: The following are available online at http://www.mdpi.com/1660-3397/17/9/536/s1,Figure S1: Real-time monitoring of the density-dependent proliferation of MCF-7 cells for 6 days, Figure S2:Treatment protocol for the evaluation of synergistic activity, Figure S3: Time-dependent cytotoxicity of RM andDOX using xCELLigence real-time cell analyzer (RTCA), Figure S4: Synergistic cytotoxicity of RM + DOX atequipotent molar ratio (1:60), Figure S5: Curve shift-analyses of the different combination ratios of RM + DOX,Figure S6: Dynamic monitoring of the effects of RM and DOX, singly on MCF-7 breast cancer cells, Figure S7:Morphological changes in MCF-7 breast cancer cells treated singly, and in combination of RM and DOX for 30and 48 hrs, Figure S8: Effects of RM alone and DOX alone on MCF-7 cell cycle, Figure S9: CDKs and cyclins andmolecular networking, Table S1: Comparison of IC50 and IC95 of single and combination drug treatments.
Mar. Drugs 2019, 17, 536 22 of 26
Author Contributions: Conceptualization, J.O.T., L.A.S.-R. and G.P.C.; methodology, J.O.T., L.A.S.-R. and G.P.C.;software, J.O.T.; validation, L.A.S.-R., M.C.V. and G.P.C.; formal analysis, J.O.T., L.A.S.-R., M.C.V. and G.P.C.;investigation, J.O.T., L.A.S.-R., M.C.V. and G.P.C.; resources, N.S. and K.S.; data curation, J.O.T.; writing—originaldraft preparation, J.O.T.; writing—review and editing, J.O.T., L.A.S.-R., M.C.V., N.S. and G.P.C.; visualization,J.O.T., L.A.S.-R., M.C.V. and G.P.C.; supervision, L.A.S.-R., M.C.V. and G.P.C.; project administration, L.A.S.-R. andG.P.C.; funding acquisition, L.A.S.-R. and G.P.C.
Funding: This work was funded by the in-house project of Gisela P. Concepcion at the Marine Science Institutein the University of the Philippines Diliman (UPD) and is part of J.O.T’s thesis in MS Molecular Medicine inSt. Luke’s College of Medicine. The microarray experiment was funded by the Discovery and Development ofHealth Products—Marine Component funded by the Department of Science and Technology-Philippine Councilfor Health Research and Development (DOST-PCHRD).
Acknowledgments: We would like to thank Sonia Jacinto of the Institute of Biology (IB) in UPD for allowingus to use her fluorescence microscope, and to Joyce A. Ibana of IB for sharing her expertise in flow cytometryexperiments. We would also like to thank Shalice Susana for the assistance in RNA extraction and to JoeriggoReyes for the assistance in the microarray analysis. We would also like to thank the Department of Science andTechnology-Philippine Council for Health Research and Development (DOST-PCHRD) for the MSc scholarship ofJ.O.T. Special thanks to Maria Nilda Muñoz of St. Luke’s College of Medicine for the proofreading and assistancein writing the thesis manuscript.
Conflicts of Interest: The authors declare no conflict of interest.
References
1. NCCN Clinical Practice Guidelines in Oncology (NCCN Guidelines®) Breast Cancer. 2014. Available online:https://www.nccn.org/professionals/physician_gls/pdf/breast.pdf (accessed on 7 August 2019).
2. Charupant, K.; Suwanborirux, K.; Daikuhara, N.; Yokoya, M.; Ushijima-Sugano, R.; Kawai, T.; Owa, T.;Saito, N. Microarray-based transcriptional profiling of renieramycin M and jorunnamycin C, isolated fromThai marine organisms. Mar. Drugs 2009, 7, 483–494. [CrossRef] [PubMed]
3. Charupant, K.; Daikuhara, N.; Saito, E.; Amnuoypol, S.; Suwanborirux, K.; Owa, T.; Saito, N. Chemistry ofrenieramycins. Part 8: Synthesis and cytotoxicity evaluation of renieramycin M-jorunnamycin A analogues.Bioorg. Med. Chem. 2009, 17, 4548–4558. [CrossRef] [PubMed]
4. Charupant, K.; Suwanborirux, K.; Amnuoypol, S.; Saito, E.; Kubo, A.; Saito, N. Jorunnamycins A-C, newstabilized renieramycin-type bistetrahydroisoquinolines isolated from the Thai nudibranch Jorunna funebris.Chem. Pharm. Bull. (Tokyo) 2007, 55, 81–86. [CrossRef] [PubMed]
5. Amnuoypol, S.; Suwanborirux, K.; Pummangura, S.; Kubo, A.; Tanaka, C.; Saito, N. Chemistry ofrenieramycins. Part 5. Structure elucidation of renieramycin-type derivatives O, Q, R, and S from thaimarine sponge Xestospongia species pretreated with potassium cyanide. J. Nat. Prod. 2004, 67, 1023–1028.[CrossRef] [PubMed]
6. Saito, N.; Tanaka, C.; Koizumi, Y.; Suwanborirux, K.; Amnuoypol, S.; Pummangura, S.; Kubo, A. Chemistryof renieramycins. Part 6: Transformation of renieramycin M into jorumycin and renieramycin J includingoxidative degradation products, mimosamycin, renierone, and renierol acetate. Tetrahedron 2004, 60,3873–3881. [CrossRef]
7. Suwanborirux, K.; Amnuoypol, S.; Plubrukarn, A.; Pummangura, S.; Kubo, A.; Tanaka, C.; Saito, N. Chemistryof renieramycins. Part 3.(1) isolation and structure of stabilized renieramycin type derivatives possessingantitumor activity from Thai sponge Xestospongia species, pretreated with potassium cyanide. J. Nat. Prod.2003, 66, 1441–1446. [CrossRef] [PubMed]
8. Halim, H.; Chunhacha, P.; Suwanborirux, K.; Chanvorachote, P. Anticancer and antimetastatic activitiesof Renieramycin M, a marine tetrahydroisoquinoline alkaloid, in human non-small cell lung cancer cells.Anticancer Res. 2011, 31, 193–201. [PubMed]
9. Tabunoki, H.; Saito, N.; Suwanborirux, K.; Charupant, K.; Satoh, J.-I. Molecular network profiling ofU373MG human glioblastoma cells following induction of apoptosis by novel marine-derived anti-cancer1,2,3,4-tetrahydroisoquinoline alkaloids. Cancer Cell Int. 2012, 12, 14. [CrossRef] [PubMed]
10. Takahashi, N.; Li, W.; Banerjee, D.; Guan, Y.; Wada-Takahashi, Y.; Brennan, M.F.; Chou, T.; Scotto, K.W.;Bertino, J.R. Sequence-dependent synergistic cytotoxicity of ecteinascidin-743 and paclitaxel in human breastcancer cell lines in vitro and in vivo. Cancer Res. 2002, 62, 6909–6915. [PubMed]
Mar. Drugs 2019, 17, 536 23 of 26
11. Takahashi, N.; Li, W.W.; Banerjee, D.; Scotto, K.W.; Bertino, J.R. Sequence-dependent enhancement ofcytotoxicity produced by ecteinascidin 743 (ET-743) with doxorubicin or paclitaxel in soft tissue sarcomacells. Clin. Cancer Res. 2001, 7, 3251–3257. [PubMed]
12. Chou, T.-C.; Martin, N. CompuSyn For Drug Combinations and For General Dose-Effect Analysis, And User’sGuide A Computer Program for Quantitation of Synergism and Antagonism in Drug Combinations, and theDetermination of IC50, ED50, and LD50 Values; ComboSyn, Inc.: Paramus, NJ, USA, 2005; Available online:http://www.combosyn.com/feature.html (accessed on 7 August 2019).
13. Chou, T.-C. Theoretical Basis, Experimental Design, and Computerized Simulation of Synergism andAntagonism in Drug Combination Studies. Pharmacol. Rev. 2006, 58, 621–681. [CrossRef] [PubMed]
14. Porrata, L.F.; Adjei, A.A. The pharmacologic basis of high dose chemotherapy with haematopoietic stem cellsupport for solid tumours. Br. J. Cancer 2001, 85, 484–489. [CrossRef] [PubMed]
15. Chou, T.C.; Otter, G.M.; Sirotnak, F.M. Schedule-dependent synergism of taxol or taxotere with edatrexateagainst human breast cancer cells in vitro. Cancer Chemother. Pharmacol. 1996, 37, 222–228. [CrossRef][PubMed]
16. Xing, J.Z.; Zhu, L.; Jackson, J.A.; Gabos, S.; Sun, X.-J.; Wang, X.-B.; Xu, X. Dynamic monitoring of cytotoxicityon microelectronic sensors. Chem. Res. Toxicol. 2005, 18, 154–161. [CrossRef] [PubMed]
17. Abassi, Y.A.; Xi, B.; Zhang, W.; Ye, P.; Kirstein, S.L.; Gaylord, M.R.; Feinstein, S.C.; Wang, X.; Xu, X. Kineticcell-based morphological screening: prediction of mechanism of compound action and off-target effects.Chem. Biol. 2009, 16, 712–723. [CrossRef] [PubMed]
18. Atienzar, F.; Gerets, H.; Tilmant, K.; Toussaint, G.; Dhalluin, S. Evaluation of Impedance-Based Label-FreeTechnology as a Tool for Pharmacology and Toxicology Investigations. Biosensors 2013, 3, 132–156. [CrossRef][PubMed]
19. Petrova, N.V.; Velichko, A.K.; Razin, S.V.; Kantidze, O.L. Small molecule compounds that induce cellularsenescence. Aging Cell 2016, 15, 999–1017. [CrossRef] [PubMed]
20. Focaccetti, C.; Bruno, A.; Magnani, E.; Bartolini, D.; Principi, E.; Dallaglio, K.; Bucci, E.O.; Finzi, G.; Sessa, F.;Noonan, D.M.; et al. Effects of 5-fluorouracil on morphology, cell cycle, proliferation, apoptosis, autophagyand ROS production in endothelial cells and cardiomyocytes. PLoS ONE 2015, 10, e0115686. [CrossRef][PubMed]
21. Dabrowska, M.; Skoneczny, M.; Rode, W. Functional gene expression profile underlying methotrexate-inducedsenescence in human colon cancer cells. Tumor Biol. 2011, 32, 965–976. [CrossRef]
22. Eom, Y.-W.; Kim, M.A.; Park, S.S.; Goo, M.J.; Kwon, H.J.; Sohn, S.; Kim, W.-H.; Yoon, G.; Choi, K.S. Twodistinct modes of cell death induced by doxorubicin: Apoptosis and cell death through mitotic catastropheaccompanied by senescence-like phenotype. Oncogene 2005, 24, 4765–4777. [CrossRef]
23. Dimri, G.P.; Lee, X.; Basile, G.; Acosta, M.; Scott, G.; Roskelley, C.; Medrano, E.E.; Linskens, M.; Rubelj, I.;Pereira-Smith, O. A biomarker that identifies senescent human cells in culture and in aging skin in vivo.Proc. Natl. Acad. Sci. USA 1995, 92, 9363–9367. [CrossRef] [PubMed]
24. Hernández-Vargas, H.; Ballestar, E.; Carmona-Saez, P.; von Kobbe, C.; Bañón-Rodríguez, I.; Esteller, M.;Moreno-Bueno, G.; Palacios, J. Transcriptional profiling of MCF7 breast cancer cells in response to5-Fluorouracil: relationship with cell cycle changes and apoptosis, and identification of novel targetsof p53. Int. J. Cancer 2006, 119, 1164–1175. [CrossRef]
25. Jänicke, R.U.; Sprengart, M.L.; Wati, M.R.; Porter, A.G. Caspase-3 Is Required for DNA Fragmentationand Morphological Changes Associated with Apoptosis. J. Biol. Chem. 1998, 273, 9357–9360. [CrossRef][PubMed]
26. Shi, W.; Feng, Z.; Zhang, J.; Gonzalez-Suarez, I.; Vanderwaal, R.P.; Wu, X.; Powell, S.N.; Roti Roti, J.L.;Gonzalo, S.; Zhang, J. The role of RPA2 phosphorylation in homologous recombination in response toreplication arrest. Carcinogenesis 2010, 31, 994–1002. [CrossRef] [PubMed]
27. Farmer, H.; McCabe, H.; Lord, C.J.; Tutt, A.H.J.; Johnson, D.A.; Richardson, T.B.; Santarosa, M.; Dillon, K.J.;Hickson, I.; Knights, C.; et al. Targeting the DNA repair defect in BRCA mutant cells as a therapeutic strategy.Nature 2005, 434, 917–921. [CrossRef] [PubMed]
28. Bryant, H.E.; Schultz, N.; Thomas, H.D.; Parker, K.M.; Flower, D.; Lopez, E.; Kyle, S.; Meuth, M.; Curtin, N.J.;Helleday, T. Specific killing of BRCA2-deficient tumours with inhibitors of poly(ADP-ribose) polymerase.Nature 2005, 434, 913–917. [CrossRef] [PubMed]
Mar. Drugs 2019, 17, 536 24 of 26
29. Marechal, A.; Zou, L. DNA Damage Sensing by the ATM and ATR Kinases. Cold Spring Harb. Perspect. Biol.2013, 5, 12716. [CrossRef] [PubMed]
30. Symington, L.S.; Gautier, J. Double-strand break end resection and repair pathway choice. Annu. Rev. Genet.2011, 45, 247–271. [CrossRef] [PubMed]
31. Jazayeri, A.; Falck, J.; Lukas, C.; Bartek, J.; Smith, G.C.M.; Lukas, J.; Jackson, S.P. ATM- and cell cycle-dependentregulation of ATR in response to DNA double-strand breaks. Nat. Cell Biol. 2006, 8, 37–45. [CrossRef]
32. Sartori, A.A.; Lukas, C.; Coates, J.; Mistrik, M.; Fu, S.; Bartek, J.; Baer, R.; Lukas, J.; Jackson, S.P. Human CtIPpromotes DNA end resection. Nature 2007, 450, 509–514. [CrossRef]
33. Tomimatsu, N.; Mukherjee, B.; Deland, K.; Kurimasa, A.; Bolderson, E.; Khanna, K.K.; Burma, S. Exo1 plays amajor role in DNA end resection in humans and influences double-strand break repair and damage signalingdecisions. DNA Repair (Amst). 2012, 11, 441–448. [CrossRef] [PubMed]
34. Karanja, K.K.; Cox, S.W.; Duxin, J.P.; Stewart, S.A.; Campbell, J.L. DNA2 and EXO1 in replication-coupled,homology-directed repair and in the interplay between HDR and the FA/BRCA network. Cell Cycle 2012, 11,3983–3996. [CrossRef] [PubMed]
35. Hsieh, R.W.; Kuo, A.H.; Scheeren, F.A.; Zarnegar, M.A.; Sikandar, S.S.; Antony, J.; Heitink, L.S.; Periyakoil, D.;Dirbas, M.; Jadhav, A.; et al. CDK19 is a Regulator of Triple-Negative Breast Cancer Growth. bioRxiv 2018.[CrossRef]
36. McDermott, M.S.J.; Chumanevich, A.A.; Lim, C.; Liang, J.; Chen, M.; Altilia, S.; Oliver, D.; Rae, J.M.;Shtutman, M.; Kiaris, H.; et al. Inhibition of CDK8 mediator kinase suppresses estrogen dependenttranscription and the growth of estrogen receptor positive breast cancer. Oncotarget 2017, 8, 12558–12575.[CrossRef] [PubMed]
37. Cheun-Arom, T.; Chanvorachote, P.; Sirimangkalakitti, N.; Chuanasa, T.; Saito, N.; Abe, I.; Suwanborirux, K.Replacement of a quinone by a 5-O-acetylhydroquinone abolishes the accidental necrosis inducing effectwhile preserving the apoptosis-inducing effect of renieramycin M on lung cancer cells. J. Nat. Prod. 2013, 76,1468–1474. [CrossRef] [PubMed]
38. Ivy, S.P.; de Bono, J.; Kohn, E.C. The ‘Pushmi-Pullyu’ of DNA REPAIR: Clinical Synthetic Lethality.Trends Cancer 2016, 2, 646–656. [CrossRef]
39. Newman, D.J.; Cragg, G.M. Marine-sourced anti-cancer and cancer pain control agents in clinical and latepreclinical development. Mar. Drugs 2014, 12, 255–278. [CrossRef]
40. Frederick, C.A.; Williams, L.D.; Ughetto, G.; van der Marel, G.A.; van Boom, H.J.; Rich, A.; Wang, A.H.J.Structural Comparison of Anticancer Drug-DNA Complexes: Adriamycin and Daunomycin. Biochemistry1990, 29, 2538–2549. [CrossRef]
41. Pommier, Y.; Leo, E.; Zhang, H.; Marchand, C. Review DNA Topoisomerases and Their Poisoning byAnticancer and Antibacterial Drugs. Chem. Biol. 2010, 17, 421–433. [CrossRef]
42. D’Incalci, M.; Galmarini, C.M. A review of trabectedin (ET-743): A unique mechanism of action. Mol. Cancer Ther.2010, 9, 2157–2163. [CrossRef]
43. David-Cordonnier, M.-H.; Gajate, C.; Olmea, O.; Laine, W.; de la Iglesia-Vicente, J.; Perez, C.; Cuevas, C.;Otero, G.; Manzanares, I.; Bailly, C.; et al. DNA and non-DNA targets in the mechanism of action of theantitumor drug trabectedin. Chem. Biol. 2005, 12, 1201–1210. [CrossRef] [PubMed]
44. Scott, J.D.; Williams, R.M. Chemistry and biology of the tetrahydroisoquinoline antitumor antibiotics.Chem. Rev. 2002, 102, 1669–1730. [CrossRef] [PubMed]
45. Lown, J.W.; Joshua, A.V.; Lee, J.S. Molecular mechanisms of binding and single-strand scission ofdeoxyribonucleic acid by the antitumor antibiotics saframycins A and C. Biochemistry 1982, 21, 419–428.[CrossRef] [PubMed]
46. Hill, G.C.; Remers, W.A. Computer simulation of the binding of saframycin A to d (GATGCATC)2. J. Med. Chem.1991, 34, 1990–1998. [CrossRef] [PubMed]
47. Moore, B.M.; Seaman, F.C.; Wheelhouse, R.T.; Hurley, L.H. Mechanism for the catalytic activation of ecteinascidin743 and its subsequent alkylation of guanine N2. J. Am. Chem. Soc. 1998, 120, 2490–2491. [CrossRef]
48. Plowright, A.T.; Schaus, S.E.; Myers, A.G. Transcriptional response pathways in a yeast strain sensitiveto saframycin A and a more potent analog: Evidence for a common basis of activity. Chem. Biol. 2002, 9,607–618. [CrossRef]
49. Xing, C.; LaPorte, J.R.; Barbay, J.K.; Myers, A.G. Identification of GAPDH as a protein target of the saframycinantiproliferative agents. Proc. Natl. Acad. Sci. USA 2004, 101, 5862–5866. [CrossRef] [PubMed]
Mar. Drugs 2019, 17, 536 25 of 26
50. Brandl, M.B.; Pasquier, E.; Li, F.; Beck, D.; Zhang, S.; Zhao, H.; Kavallaris, M.; Wong, S.T.C. Computationalanalysis of image-based drug profiling predicts synergistic drug combinations: Applications in triple-negativebreast cancer. Mol. Oncol. 2014, 8, 1548–1560. [CrossRef]
51. Pritchard, J.R.; Bruno, P.M.; Gilbert, L.A.; Capron, K.L.; Lauffenburger, D.A.; Hemann, M.T. Defining principlesof combination drug mechanisms of action. Proc. Natl. Acad. Sci. USA 2013, 110, E170–E179. [CrossRef]
52. Jia, J.; Zhu, F.; Ma, X.; Cao, Z.; Cao, Z.W.; Li, Y.; Li, Y.X.; Chen, Y.Z. Mechanisms of drug combinations:interaction and network perspectives. Nat. Rev. Drug Discov. 2009, 8, 111–128. [CrossRef]
53. Bonadonna, G.; Zucali, R.; Monfardini, S.; De Lena, M.; Uslenghi, C. Combination chemotherapy of Hodgkin’sdisease with adriamycin, bleomycin, vinblastine, and imidazole carboxamide versus MOPP. Cancer 1975, 36,252–259. [CrossRef]
54. Miller, M.L.; Molinelli, E.J.; Nair, J.S.; Sheikh, T.; Samy, R.; Jing, X.; He, Q.; Korkut, A.; Crago, A.M.; Singer, S.;et al. Drug synergy screen and network modeling in dedifferentiated liposarcoma identifies CDK4 andIGF1R as synergistic drug targets. Sci. Signal. 2013, 6, 85. [CrossRef] [PubMed]
55. Jung, K.-A.; Choi, B.-H.; Kwak, M.-K. The c-MET/PI3K signaling is associated with cancer resistance todoxorubicin and photodynamic therapy by elevating BCRP/ABCG2 expression. Mol. Pharmacol. 2015, 87,465–476. [CrossRef] [PubMed]
56. Mitra, S.K.; Hanson, D.A.; Schlaepfer, D.D. Focal adhesion kinase: In command and control of cell motility.Nat. Rev. Mol. Cell Biol. 2005, 6, 56–68. [CrossRef] [PubMed]
57. Knopfová, L.; Biglieri, E.; Volodko, N.; Masarík, M.; Hermanová, M.; Garzón, J.F.G.; Dúcka, M.; Kucírková, T.;Soucek, K.; Šmarda, J.; et al. Transcription factor c-Myb inhibits breast cancer lung metastasis by suppressionof tumor cell seeding. Oncogene 2018, 37, 1020–1030. [CrossRef] [PubMed]
58. Liu, Y.; Zhao, H. Predicting synergistic effects between compounds through their structural similarity andeffects on transcriptomes. Bioinformatics 2016, 32, 3782–3789. [CrossRef] [PubMed]
59. Beck, A.; Goetsch, L.; Dumontet, C.; Corvaïa, N. Strategies and challenges for the next generation ofantibody-drug conjugates. Nat. Rev. Drug Discov. 2017, 16, 315–337. [CrossRef] [PubMed]
60. Mayer, L.D.; Janoff, A.S. Optimizing combination chemotherapy by controlling drug ratios. Mol. Interv. 2007,7, 216–223. [CrossRef]
61. Mayer, L.D.; Harasym, T.O.; Tardi, P.G.; Harasym, N.L.; Shew, C.R.; Johnstone, S.A.; Ramsay, E.C.; Bally, M.B.;Janoff, A.S. Ratiometric dosing of anticancer drug combinations: controlling drug ratios after systemicadministration regulates therapeutic activity in tumor-bearing mice. Mol. Cancer Ther. 2006, 5, 1854–1863.[CrossRef] [PubMed]
62. Batist, G.; Gelmon, K.A.; Chi, K.N.; Miller, W.H.; Chia, S.K.L.; Mayer, L.D.; Swenson, C.E.; Janoff, A.S.;Louie, A.C. Safety, pharmacokinetics, and efficacy of CPX-1 liposome injection in patients with advancedsolid tumors. Clin. Cancer Res. 2009, 15, 692–700. [CrossRef]
63. Mosmann, T. Rapid colorimetric assay for cellular growth and survival: application to proliferation andcytotoxicity assays. J. Immunol. Methods 1983, 65, 55–63. [CrossRef]
64. Riccardi, C.; Nicoletti, I. Analysis of apoptosis by propidium iodide staining and flow cytometry. Nat. Protoc.2006, 1, 1458–1461. [CrossRef] [PubMed]
65. Trahtemberg, U.; Atallah, M.; Krispin, A.; Verbovetski, I.; Mevorach, D. Calcium, leukocyte cell death andthe use of annexin V: Fatal encounters. Apoptosis 2007, 12, 1769–1780. [CrossRef] [PubMed]
66. Bindea, G.; Mlecnik, B.; Hackl, H.; Charoentong, P.; Tosolini, M.; Kirilovsky, A.; Fridman, W.-H.; Pagès, F.;Trajanoski, Z.; Galon, J. ClueGO: A Cytoscape plug-in to decipher functionally grouped gene ontology andpathway annotation networks. Bioinformatics 2009, 25, 1091–1093. [CrossRef]
67. Subramanian, A.; Tamayo, P.; Mootha, V.K.; Mukherjee, S.; Ebert, B.L.; Gillette, M.A.; Paulovich, A.;Pomeroy, S.L.; Golub, T.R.; Lander, E.S.; et al. Gene set enrichment analysis: a knowledge-based approach forinterpreting genome-wide expression profiles. Proc. Natl. Acad. Sci. USA. 2005, 102, 15545–15550. [CrossRef][PubMed]
68. Binns, D.; Dimmer, E.; Huntley, R.; Barrell, D.; O’Donovan, C.; Apweiler, R. QuickGO: A web-based tool forGene Ontology searching. Bioinformatics 2009, 25, 3045–3046. [CrossRef] [PubMed]
69. Fabregat, A.; Jupe, S.; Matthews, L.; Sidiropoulos, K.; Gillespie, M.; Garapati, P.; Haw, R.; Jassal, B.; Korninger, F.;May, B.; et al. The Reactome Pathway Knowledgebase. Nucleic Acids Res. 2018, 46, D649–D655. [CrossRef][PubMed]
Mar. Drugs 2019, 17, 536 26 of 26
70. Kanehisa, M.; Goto, S. KEGG: kyoto encyclopedia of genes and genomes. Nucleic Acids Res. 2000, 28, 27–30.[CrossRef]
71. Carbon, S.; Dietze, H.; Lewis, S.E.; Mungall, C.J.; Munoz-Torres, M.C.; Basu, S.; Chisholm, R.L.; Dodson, R.J.;Fey, P.; Thomas, P.D.; et al. Expansion of the gene ontology knowledgebase and resources: The gene ontologyconsortium. Nucleic Acids Res. 2017, 45, D331–D338.
72. Ashburner, M.; Ball, C.A.; Blake, J.A.; Botstein, D.; Butler, H.; Cherry, J.M.; Davis, A.P.; Dolinski, K.;Dwight, S.S.; Eppig, J.T.; et al. Gene ontology: Tool for the unification of biology. The Gene OntologyConsortium. Nat. Genet. 2000, 25, 25–29. [CrossRef]
73. Mi, H.; Huang, X.; Muruganujan, A.; Tang, H.; Mills, C.; Kang, D.; Thomas, P.D. PANTHER version 11:Expanded annotation data from Gene Ontology and Reactome pathways, and data analysis tool enhancements.Nucleic Acids Res. 2017, 45, D183–D189. [CrossRef] [PubMed]
74. Micallef, L.; Rodgers, P. euler APE: Drawing area-proportional 3-Venn diagrams using ellipses. PLoS ONE2014, 9. [CrossRef] [PubMed]
© 2019 by the authors. Licensee MDPI, Basel, Switzerland. This article is an open accessarticle distributed under the terms and conditions of the Creative Commons Attribution(CC BY) license (http://creativecommons.org/licenses/by/4.0/).


