Embed Size (px)
Citation preview

, 20140633, published 25 June 2014281 2014 Proc. R. Soc. B SteinerWilliam A. Nelson, Michael Paterson, James A. Rusak, Jonathan B. Shurin and Christopher F.Helmus, Catherine Johnson, Pavel Kratina, Colin Kremer, Claire de Mazancourt, Elizabeth Miller, David A. Vasseur, Jeremy W. Fox, Andrew Gonzalez, Rita Adrian, Beatrix E. Beisner, Matthew R. temperate lake ecosystemsSynchronous dynamics of zooplankton competitors prevail in
Supplementary datatml http://rspb.royalsocietypublishing.org/content/suppl/2014/06/24/rspb.2014.0633.DC1.h
"Data Supplement"
References http://rspb.royalsocietypublishing.org/content/281/1788/20140633.full.html#ref-list-1 This article cites 43 articles, 3 of which can be accessed free
Subject collections (1686 articles)ecology
Articles on similar topics can be found in the following collections
Email alerting service hereright-hand corner of the article or click Receive free email alerts when new articles cite this article - sign up in the box at the top
http://rspb.royalsocietypublishing.org/subscriptions go to: Proc. R. Soc. BTo subscribe to
on June 25, 2014rspb.royalsocietypublishing.orgDownloaded from on June 25, 2014rspb.royalsocietypublishing.orgDownloaded from

rspb.royalsocietypublishing.org
ResearchCite this article: Vasseur DA et al. 2014Synchronous dynamics of zooplanktoncompetitors prevail in temperate lakeecosystems. Proc. R. Soc. B 281: 20140633.http://dx.doi.org/10.1098/rspb.2014.0633
Received: 14 March 2014Accepted: 4 June 2014
Subject Areas:ecology
Keywords:synchrony, compensatory dynamics,zooplankton, wavelet
Author for correspondence:David A. Vasseure-mail: [email protected]
Electronic supplementary material is availableat http://dx.doi.org/10.1098/rspb.2014.0633 orvia http://rspb.royalsocietypublishing.org.
Synchronous dynamics of zooplanktoncompetitors prevail in temperate lakeecosystemsDavid A. Vasseur1, Jeremy W. Fox2, Andrew Gonzalez3, Rita Adrian4,Beatrix E. Beisner5, Matthew R. Helmus6, Catherine Johnson7,Pavel Kratina8, Colin Kremer9,10, Claire de Mazancourt11,Elizabeth Miller9,10, William A. Nelson12, Michael Paterson13,James A. Rusak14, Jonathan B. Shurin15 and Christopher F. Steiner16
1Department of Ecology and Evolutionary Biology, Yale University, New Haven, CT 06520, USA2Department of Biological Sciences, University of Calgary, Calgary, Alberta, Canada T2N 1N43Department of Biology, McGill University, Montreal, Quebec, Canada4Leibniz-Institute of Freshwater Ecology and Inland Fisheries, Berlin, Germany5Department of Biological Sciences, University of Quebec at Montreal, Montreal, Quebec, Canada H3C 3P86Department of Animal Ecology, Amsterdam Global Change Institute, Vrije Universiteit, Amsterdam 1081 HV,Netherlands7Fisheries and Oceans Canada, Bedford Institute of Oceanography, Dartmouth, Nova Scotia, Canada B2Y 4A28School of Biological and Chemical Sciences, Queen Mary University of London, London E1 4NS, UK9W. K. Kellogg Biological Station and Department of Plant Biology, Michigan State University, Hickory Corners,MI 49060, USA10Department of Plant Biology, Michigan State University, East Lansing, MI 48824, USA11Centre for Biodiversity Theory and Modelling, Station d’Ecologie Experimentale du Centre National de laRecherche Scientifique a Moulis, Moulis 09200, France12Department of Biology, Queen’s University, Kingston, Ontario, Canada K7L 3N613IISD-Experimental Lakes Area, 161 Portage Ave East 6th Floor, Winnipeg, MB, Canada R3B 0Y414Ontario Ministry of the Environment, Dorset Environmental Science Centre, Dorset, Ontario, Canada P0A 1E015Section of Ecology, Behavior and Evolution, University of California-San Diego, 9500 Gilman Drive #0116,La Jolla, CA 92093, USA16Department of Biological Sciences, Wayne State University, Detroit, MI 48202, USA
Although competing species are expected to exhibit compensatory dynamics(negative temporal covariation), empirical work has demonstrated that com-petitive communities often exhibit synchronous dynamics (positivetemporal covariation). This has led to the suggestion that environmental for-cing dominates species dynamics; however, synchronous and compensatorydynamics may appear at different length scales and/or at different times,making it challenging to identify their relative importance. We compiled 58long-term datasets of zooplankton abundance in north-temperate and sub-tropical lakes and used wavelet analysis to quantify general patterns in thetimes and scales at which synchronous/compensatory dynamics dominatedzooplankton communities in different regions and across the entire dataset.Synchronous dynamics were far more prevalent at all scales and times andwere ubiquitous at the annual scale. Although we found compensatorydynamics in approximately 14% of all combinations of time period/scale/lake, there were no consistent scales or time periods during which compensa-tory dynamics were apparent across different regions. Our results suggest thatthe processes driving compensatory dynamics may be local in their extent,while those generating synchronous dynamics operate at much larger scales.This highlights an important gap in our understanding of the interactionbetween environmental and biotic forces that structure communities.
1. IntroductionThe extent to which communities of interspecific competitors exhibit synchronizedfluctuations over time is intrinsically linked to community stability and moreover
& 2014 The Author(s) Published by the Royal Society. All rights reserved.
on June 25, 2014rspb.royalsocietypublishing.orgDownloaded from

may reflect important attributes of the functional diversity ofcommunities [1,2] and of the processes structuring communitycomposition [3–5]. Synchrony and its alternative pattern, com-pensation (or compensatory dynamics), are mutually exclusivephenomenological features of community dynamics that canarise from many underlying mechanisms [6,7]. Compensationmay reflect a reciprocal negative interaction among competitors[4]; however, it also can arise when species respond opposi-tely to changes in an environmental factor [8], or when theyrespond to different environmental factors which are them-selves negatively correlated through time. By contrast, speciesthat exist in a temporally variable environment must also bequalitatively similar in their ability to tolerate the environment’sextremes (e.g. phosphorus is essential for plankton but somespecies better tolerate phosphorus depletion), suggestingthat the environment may select species with similar traits,which in turn predisposes species to exhibit synchronizeddynamics [1]. The extent of synchronous and compensa-tory dynamics in competitive communities may thereforereflect differences in the relative strength of environmentalforcing and competition [1,3].
Synchronous and compensatory dynamics are also of fun-damental interest in community ecology because theyregulate the relationship between population and temporalcommunity variability. At the scale of populations, temporalvariability is an indicator of stability which is often linked toextinction probability [9,10]. Similarly, temporal variability atthe aggregate or community level, ‘community variability’[7,11], is of fundamental interest as an index of community stab-ility [12,13] and is of applied interest as a potential leadingindicator of nonlinear changes in ecosystem state [14,15].When species contribute additively to a particular communityattribute (e.g. total biomass), the temporal variability of theattribute is given by the sum of all terms in the communityvariance–covariance matrix. All else being equal, communitieswith species dynamics that negatively covary over time (com-pensatory dynamics) will exhibit lower community variabilitythan communities whose covariance terms are positive onaverage (synchronous dynamics) [7]; however, the same pro-cesses that generate negative covariation can also destabilizecommunities by increasing species fluctuations [16].
Many studies have measured the synchrony of competi-tors in experiments and nature [3,7,17–20] and some haveattempted to infer the relative contributions of competitionand environmental factors in these communities [1,3,20].For example, using annual census of terrestrial plants andanimals, Houlahan et al. [3] found that species are on averagesynchronized and suggested that environmental drivers wererelatively more important than competition for shaping com-munity dynamics. Although appealing, the argument thatsynchronous dynamics result when environmental driversare relatively more important than density-dependent bioticfeedbacks is challenging to verify, because the drivers lead-ing to synchronous and compensatory dynamics need notnecessarily be in conflict. Synchronous and compensatorydynamics may operate on different timescales [20,21] orduring different periods [21] in which case the frequencyand temporal extent of sampling largely dictates which dri-vers are perceived to be the most critical. For example, ifcompeting species are commonly and uniformly affected byenvironmental variation, it simply generates a temporallychanging arena in which the outcomes of competition areenacted. If species are sampled once annually as in [3], the
signature of competition may be entirely obscured by the syn-chronizing effect of ‘good’ versus ‘bad’ years (e.g. droughtversus wet), even if it is an important driver of species’ rela-tive fitness and persistence [22]. Furthermore, it has beenshown that embedding competitors in a food web contextcan cause them to respond synchronously to environmentaldisturbance even when the underlying dynamics are com-pensatory [23], highlighting the challenge of identifying themechanisms underlying dynamics. Measuring and inter-preting synchrony and compensation thus requires, at aminimum, refined estimators of synchrony and compensationacross different timescales [17–21].
Freshwater plankton communities have been a focus ofrecent work on the scale-dependence of compensatory andsynchronous dynamics. In phytoplankton and zooplanktoncommunities in Lake Constance (Bodensee), compensatorydynamics have been shown to occur regularly at scalesranging from six months to 1 year while synchronousdynamics dominate at most other scales [17,21]. Synchronyof zooplankton communities in Little Rock Lake intensifiedat the annual scale during experimental acidification, withno apparent alteration of covariation patterns at other scales[18,19]. Freshwater plankton are ideal for analyses of commu-nity variability due to their short generation times andimportance in long-term monitoring programmes world-wide. In temperate regions, lakes experience environmentalfluctuations on timescales ranging from short-term weatherfluctuations (e.g. solar irradiance and wind-driven mixing)to long-term trends in nutrient loading, pH, temperatureand other factors.
In addition to timescale, communities may transitionbetween synchrony to compensation over time at fixed scales.In Little Rock Lake, experimental acidification altered theexpression of synchronization at the annual scale in a zooplank-ton community [18] and elsewhere, natural and anthropogenicchanges in long-term nutrient loads have been shown toimpact community composition [24,25]. Within the growingseason, the intensity of competition among zooplankton canvary greatly as nutrients become depleted and well-ediblealgae are replaced by colonial forms [26]. Transitions betweensynchrony and compensatory dynamics may be common at avariety of scales and yield important insight into the mechan-isms structuring the distribution of temporal dynamics ofspecies in competitive communities; however, detecting suchtransitions requires advanced statistical machinery capable ofresolving patterns in both time and scale.
Here, we quantify patterns of dynamics within commu-nities in long-term time series (mean 17 years) of crustaceanzooplankton species from 58 study sites originating from52 North American and European temperate lakes and twosub-tropical lakes (figure 1). We employ a wavelet analysis,which estimates the amount of variation in a time seriesattributable to a particular frequency (scale) at a particularpoint in time [27], to generate a scale and time-resolvedbinary metric of synchronous/compensatory dynamicsamong zooplankton assemblages within each of our studysites. Our extensive dataset allows us to then overlay thisinformation from various lakes to determine the relativeprevalence of synchronous and compensatory dynamicsover a wide range of temporal scales (monthly to decadally)and across a large span of time (1971–2008) in a large sampleof 58 study sites (54 lakes). The objective of this work is to(i) provide a critical assessment and frame of reference for
rspb.royalsocietypublishing.orgProc.R.Soc.B
281:20140633
2
on June 25, 2014rspb.royalsocietypublishing.orgDownloaded from

the prevalence of synchronous and compensatory dynamicsin competitive communities and (ii) to highlight poten-tially important scales and times at which transitions incommunity dynamics occur and may help to identify themechanisms structuring competitor dynamics.
2. Material and methods(a) DataTemporal data were compiled from a number of long-term moni-toring programmes of temperate zone lakes in North Americaand Europe. Crustacean zooplankton data from the follow-ing regions were included: eight lakes from WI, USA NorthTemperate Lakes Region LTER and Mendota region (Universityof Wisconsin Center for Limnology); eight lakes from theDorset region of Muskoka, Ontario, Canada (Ontario Ministryof Environment Dorset Environmental Science Centre); 10 lakesfrom the Sudbury region, Ontario, Canada (Laurentian Univer-sity Cooperative Freshwater Ecology Unit); 12 lakes from theExperimental Lakes Area (Department of Fisheries and OceansFreshwater Institute) near Kenora, Ontario, Canada and sixlakes from the Coldwater Lakes Project in northwestern Ontario,Canada (Ontario Ministry of Natural Resources); six lakes fromthe Northwest Ontario Lake Size Series project [28]; LakeApopka, FL, USA (Mike Coveney, St. Johns River Water Manage-ment District); Lake Okeechobee, FL, USA (five basin sites onthis, the largest of our lakes; Karl Havens, Florida Sea GrantCollege Program; Muggelsee in Berlin, Germany [29]; andLake Zurich in the southwestern part of the canton of Zurich,Switzerland [30]). This resulted in a total of 58 sample sites in54 different lakes distributed across North America and Europe(figure 1).
Surveys varied in their frequency of sampling and period oftemporal coverage (electronic supplementary material, figure S3);however, our methods (see below) select the scales and timeperiods during which a particular sampling site can reliably con-tribute information. Zooplankton were sampled, depending onthe survey, using nets, Schindler-Patalas traps or tube samplers,with identification to species. A total of 250 to more than 1000
individuals were counted in each sample. In this analysis, weonly consider crustaceans (cladocerans and copepods) andexclude unidentifiable juvenile stages. Species belonging to thegenera Bosmina, Chydorus and Alona/Alonella were aggregatedwithin each of those genera due to variable taxonomic resolutionamong the surveys. A more detailed description of the samplingmethods is given in [31]. The average number of species presentper sampling site was 27 (range 11–40).
(b) Wavelet analysisTo provide a scale- and time-resolved metric of synchronization,we began by calculating the continuous wavelet transformationWk,l of the time series xk,l for each zooplankton species (k) ineach lake (l ) as the convolution of xk,l with the conjugate of thescaled and translated Morlet wavelet c(.) [27,32]
Wk,l(n, s) ¼ s"0:5XN
i¼1
xk,l(ti) # c$n" ti
s
! ": (2:1)
In expression (2.1), ti represents the set of Julian dates on which xk,l
was sampled and N is the total number of samples of xk,l. The par-ameters n and s represent the time and scale localization,respectively, of the Morlet wavelet, which is the product of a Gaus-sian distribution and a complex waveform, c(t) ¼ p"1=4eiv0te"t2=2.We set the wavenumber of the Morlet wavelet, v0, which controlsthe number of oscillations within the effective width of theGaussian distribution, equal to 6 as in previous studies [18,27].
In order to facilitate comparison across our study sites, wechose standardized arrays of times (n) and scales (s) at whichto sample the wavelet transformation and we subset thesedepending on the limitations of each time series. In the temporaldimension, we sampled the wavelet on every 10th Julian dayprovided that it fell within the ‘cone of influence’, which isdefined as the range of points further than
ffiffiffi2p
s from the startand end of the time series [27]. In the scale dimension, wegenerated an array of scales according to
s ¼ 365:25% 2 jds , (2:2)
where d ¼ 0.1 and j is a sequence of integers. We set the mini-mum value of j such that the smallest scale was not less than
60
50
40
52
50
48
46
44
42–95 –90 –85 –80
30
20–140 –120 –100
longitude
latit
ude
–80
Coldwater (6)Dorset (8)ELA (12)Florida (6)
Mendota (3)NOLSS (6)
NTL LTER (5)Sudbury (10)
–60
Figure 1. Geographical locations of study sites grouped by region. The inset map shows an enlargement of the region in the black box. Numbers in parenthesesindicate the number of study sites in each region. Study sites represent individual lakes in all regions except Florida, where Lake Okechobee was sampled in fivebasins within the lake. In addition to North American lakes, our study included two European sites: Muggelsee, Germany, (52.438 N, 13.658 E) and Lake Zurich,Switzerland (47.378 N, 8.558 E).
rspb.royalsocietypublishing.orgProc.R.Soc.B
281:20140633
3
on June 25, 2014rspb.royalsocietypublishing.orgDownloaded from

three times the average time between successive samples in thetime series. We set the maximum value of j such that the largestscale did not exceed half the total period of sampling in the timeseries; however, only scales smaller than this threshold includedsamples that were admissible based upon the ‘cone of influence’.
Most of our time series were unevenly sampled through time,potentially producing combinations time and scale which wereunreliable within the boundaries defined above. For example, ifsampling was discontinued during winter (which is commonin temperate lakes), there may be few or no data points in theneighbourhood of the wavelet at shorter scales during winter.To deal with this, we further discarded any wavelet samplesfor which fewer than 10 observations occurred within +
ffiffiffi2p
s ofthe centre of the Morlet wavelet.
(c) Measuring synchronyWe first quantified the relative amplitude of zooplankton crus-tacean species dynamics within each of l sites using the localizedwavelet modulus ratio [18]
rl(n, s) ¼Ln,s
Pk Wk,l(n, s)
$$ $$% &
Ln,sP
k jWk,l(n, s)j% & , (2:3)
where j # j denotes the complex modulus and Ln,s(#) ¼Ðe"(1=2)((n"ti)=s)2
(#) dn is a Gaussian localization function in time n.The localized wavelet modulus ratio computes the ratio of theactual amplitude of community fluctuations against the cumulat-ive amplitude of population fluctuations at each time and scale.The numerator in equation (2.3) uses the modulus of the sum ofthe wavelet transform; by summing wavelet coefficients prior tocomputing the modulus, the realized amplitude is discounted byspecies whose dynamics have opposite phases. The denominator,the sum of species’ moduli, is the maximum possible amplitudegiven a perfect alignment of phases. Thus, the wavelet modulusratio is bounded between values of zero and one. A value of zeroindicates that compensatory dynamics result in a communityvariance equal to zero, whereas a value of one indicates perfectsynchronization of population dynamics and a maximum valueof the community variance. The modulus ratio is akin to afamily of multivariate indices of synchronization [7] that measurethe sum or mean of pairwise species covariances (or here co-amplitudes) by comparing realized variances or amplitudes ofcommunities to the values that would be achieved under perfectsynchronization, thus superseding the need to compute pairwiserelationships directly using correlative or co-spectral techniques.Although uneven sampling can generate bias in the estimates ofwavelet power (W2), this bias is consistent within each samplingsite because sampling occurred for all zooplankton species atthe same points in time, making our measure of synchroniza-tion (based on relative amplitude) unbiased in the presence ofuneven sampling.
To measure synchronization, we generated 1000 null-modeloutcomes in each site (l ), at each scale (s) and time (n) by attribut-ing a random phase-shift on the interval (0, 2p) to each of the kspecies and recalculating the modulus ratio (2.3) [18]. Becausethis procedure retains the distribution of amplitudes of variationexpressed by different species, it generates an accurate distri-bution for the value of the local wavelet modulus ratio underthe assumption that species’ dynamics are unrelated. Althoughit is possible to use this distribution of outcomes to statisticallydifferentiate synchronous and compensatory dynamics fromindependent fluctuations [18], the p-value adjustment requiredby the combined number of scales, times and lakes to whichwe would apply this test would require on the order of 106 ran-domizations at each of the ca 1.1 million combinations of time,scale and sample site, an operation that is computationallyinfeasible. Instead, we generate a binary response metric ateach combination of scale, time and lake by assigning a value
of one to cases where pl(n,s) exceeded the median value of the1000 bootstrapped realizations and a zero otherwise. We thensummarized this metric across our study regions and acrossthe entire dataset to determine the fraction of all lakes demon-strating synchronized dynamics at any particular time and scale.
For the entire dataset, we determined whether the set of lakescontributing information to a particular time and scale were moreor less synchronized than expected by chance using a binomialtest. Given the large number of tests performed (all combinationsof time and scale), we applied a Benjamini–Hochberg–Yekutielicorrection to control the false discovery rate [33]. Similar analyseswere not possible at the regional scale due to small sample sizes(number of lakes). The wavelet analysis was performed usingcustom code in R v. 2.6.0 (R development core team), and sum-mary statistics and plots were generated using MATHEMATICA
v. 9.0. A summary schematic of our analysis is available (electronicsupplementary material, figure S1).
3. ResultsSynchronous dynamics are common in freshwater zooplanktoncommunities. Considering all temporal scales (approximatelymonthly to decadal scales of variation), times (sampling datesranging from 1971 to 2008) and study sites (58 sites in 54lakes), we found that zooplankton communities were moresynchronized than the median of our null model in 85.8% ofthese combinations (14.2% showed compensatory dynamics)(figure 2). The vast majority of incidences (79%) were associatedwith a q-value equal to 1, meaning that the observed dynamicswere more synchronized than all 1000 of our null-model realiz-ations (result not shown). Values of the wavelet modulus ratioless than approximately 0.4 were predominantly compensatory,whereas those greater than approximately 0.4 were predomi-nantly synchronous. This implies that communities that weremore synchronized than the median of null-model realizationsstill expressed substantial variation in their extent of synchroni-zation. Strong synchrony (wavelet modulus ratios close to 1)mainly occurred at scales near 1 year; shorter and longerscales tended to exhibit weaker synchronization (cf. figure 2b–d).
We searched for the consistency of dynamics (synchronyor compensation) across study sites by region (using sixdifferent study regions) and across the entire 58-site dataset(figure 3). With the entire dataset, we applied a binomialtest to determine whether lakes exhibited similar dynamicsat each combination of time and scale. At the regional scale,smaller sample sizes precluded the use of statistical tests.Synchronous dynamics are pervasive at the annual scale inall regions and across the entire dataset ( p , 0.0066); how-ever, there are no combinations of time and scale at whicha significant fraction of sites exhibit compensatory dynamicsacross the entire dataset ( p . 0.05). Rather, times and scalesat which compensatory dynamics are predominant tend todiffer across regions; while both the Experimental LakesArea (ELA) and Sudbury area lakes (figure 3a,e) showperiods of compensatory zooplankton dynamics at scalesgreater than 1 year, these are expressed at different times inthe two areas and thus are not visible in the aggregate plot(figure 3m). Similar mismatches among regions are alsoevident at scales smaller than 1 year.
At longer timescales (2–10 years), the entire dataset exhi-bits a larger fraction of lakes with synchronized dynamicsafter ca 1984, but not prior ( p , 0.0066; figure 3m). This tem-poral transition is echoed at the regional scale in the Sudbury
rspb.royalsocietypublishing.orgProc.R.Soc.B
281:20140633
4
on June 25, 2014rspb.royalsocietypublishing.orgDownloaded from

and Dorset areas (figure 3e,g) suggesting that important andwidespread changes that yielded greater long-term synchro-nization of zooplankton dynamics within lakes occurred atthis time.
4. DiscussionCharacterizing patterns across all combinations of timescale,sampling date and study site, we found that synchronousdynamics were far more prevalent in lake zooplankton com-munities than compensatory dynamics. Although we founda range of scales over which a significant fraction of ourstudy lakes demonstrated synchronized dynamics, we foundno scales at which a significant fraction demonstrated compen-satory dynamics. Furthermore, we detected a significantchange over time in the fraction of study sites demonstratingsynchronized dynamics at long timescales, an effect that maybe caused by recovery from anthropogenic disturbance in asubset of our study lakes.
It is no surprise that we find a predominance of strong syn-chronization of zooplankton species at and around the scale of1 year in our analysis (figures 2 and 3) and that this predomi-nance is unchanged through time. Seasonal variation drivesstrong patterns in both the abiotic (e.g. temperature and nutri-ents) and biotic (e.g. resources and predators) factors thatdetermine zooplankton abundance [26,34] and the extent towhich the prevailing factors seasonally vary in temperate sys-tems leads to synchronous variation among a large fraction ofzooplankton species [26]. More interesting, is the rarity of com-pensatory dynamics at scales below and above 1 year. Belowthe 1-year scale, we expect resource competition to be ongoingand species may exhibit compensatory dynamics via their tem-poral partitioning of the growing season [26]; above 1 yearand competitive exclusion and species replacement may beimportant processes driving compensatory dynamics [7].
Given the wealth of theory suggesting that compensatorydynamics should be a common facet of coexisting competi-tors [4,6–8,35,36], the rarity of compensatory dynamics inour analysis is surprising. A possible explanation is thatfreshwater zooplankton species are highly differentiatedand therefore only weak interspecific competitors. However,this is unlikely given that co-occurring species of zooplanktonare known to demonstrate little variation in life-history traitssuggesting use of common resources [37] and negative reci-procal interactions among zooplankton taxa common to ourstudy lakes have been previously demonstrated [38,39]. Amore likely hypothesis explaining the rarity of compensatorydynamics is that the period during which intense competitionoccurs may be confined to a rather short portion of the seaso-nal cycle [21,26]; detecting compensatory dynamics wouldtherefore then require sampling frequencies greater thanthose employed in most of our study lakes. In addition, ouranalysis of the complete assemblage of zooplankton speciesincludes interactions other than competition. Larger bodiedcrustacean zooplankton are known to prey on smaller clado-cerans and copepods and although these species make up arelatively small fraction of the zooplankton biomass in mostlakes they may have important impacts on the expressionof patterns in the dynamics.
Although our analysis revealed compensatory dynamics in14.2% of all scales and times in our 58 zooplankton commu-nities, we detected no times or scales at which compensatorydynamics co-occurred in the majority of these lakes and veryfew instances where compensatory dynamics dominated anyparticular region. This suggests that the mechanisms drivingcompensatory dynamics may be local in their extent and/orvary substantially in their strength across lakes. Because com-pensatory dynamics are more likely to occur during periodswhere resources are limiting for a subset of species [4,7,21],and such periods occur only during certain parts of the seaso-nal succession [26], differences in the physical and biological
0.10
00.010.020.030.040.050.06
0.02
0.04
0.06
0.08 synchronous dynamics
(a) (b)all scales scales < 1/2 years
00.2 0.4 0.6 0.8 1.0
0.2 0.4 0.6 0.8 1.0
0.2 0.4 0.6 0.8 1.0
0.010.020.030.040.050.06
(d )scales >2 years
00.010.020.030.040.050.06
(c)scales between1/2 and 2 years
compensatory dynamics
0.10
0.2 0.3 0.4 0.5
wavelet modulus ratio rl(s)
freq
uenc
y
0.6 0.7 0.8 0.9 1.0
Figure 2. (a) The frequency of values of the wavelet modulus ratios observed across all combinations of time, scale and site in the analysis; a value of 0.3 indicatesthat the amplitude of biomass variability in the community is 30% the amount it would express if species’ dynamics were perfectly synchronized. Colours demarcatehow common synchronous and compensatory dynamics are at each value of the wavelet modulus ratio—as determined by comparison against the null model thatassumed no correlation among species dynamics. In total, the relative incidence of synchronous dynamics was 85.8% (compensatory dynamics 14.2%). Panels (b – d )further partition this result by different scales of variation (axes are the same as panel (a)); relatively more contributions come from intermediate scales (between1/2 and 2 years) because many sites were sampled at frequencies commensurate with this range.
rspb.royalsocietypublishing.orgProc.R.Soc.B
281:20140633
5
on June 25, 2014rspb.royalsocietypublishing.orgDownloaded from

0
10
5
2
1/2
1/4
1/6
1/12
1
0.25 0.50fraction of lakes with synchronized zooplankton(a) (b)
10
5
2
1/2
1/4
1/6
1/12
1
(c) (d)
10
5
2
1/2
1/4
1/6
1/12
1
(e) ( f )
10
5
2
1/2
1/4
1/6
1/12
1
(g) (h)
10
5
2
1/2
1/4
1/6
1/12
72 76 80 84 88 92 96 00 04
time (year) time (year)
wav
elet
sca
le (y
ears
)w
avel
et s
cale
(yea
rs)
wav
elet
sca
le (y
ears
)w
avel
et s
cale
(yea
rs)
wav
elet
sca
le (y
ears
)
08 72 76 80 84 88 92 96 00 04 08
72 76 80 84 88 92 96 00 04 08 72 76 80 84 88 92 96 00 04 08
72 76 80 84 88 92 96 00 04 08 72 76 80 84 88 92 96 00 04 08
72 76 80 84 88 92 96 00 04 08 72 76 80 84 88 92 96 00 04 08
72 76 80 84 88 92 96 00 04 08 72 76 80 84 88 92 96 00 04 08
1
(i) (j)
no. lakes contributing0.75 1.00 1 5 10 15 20 25
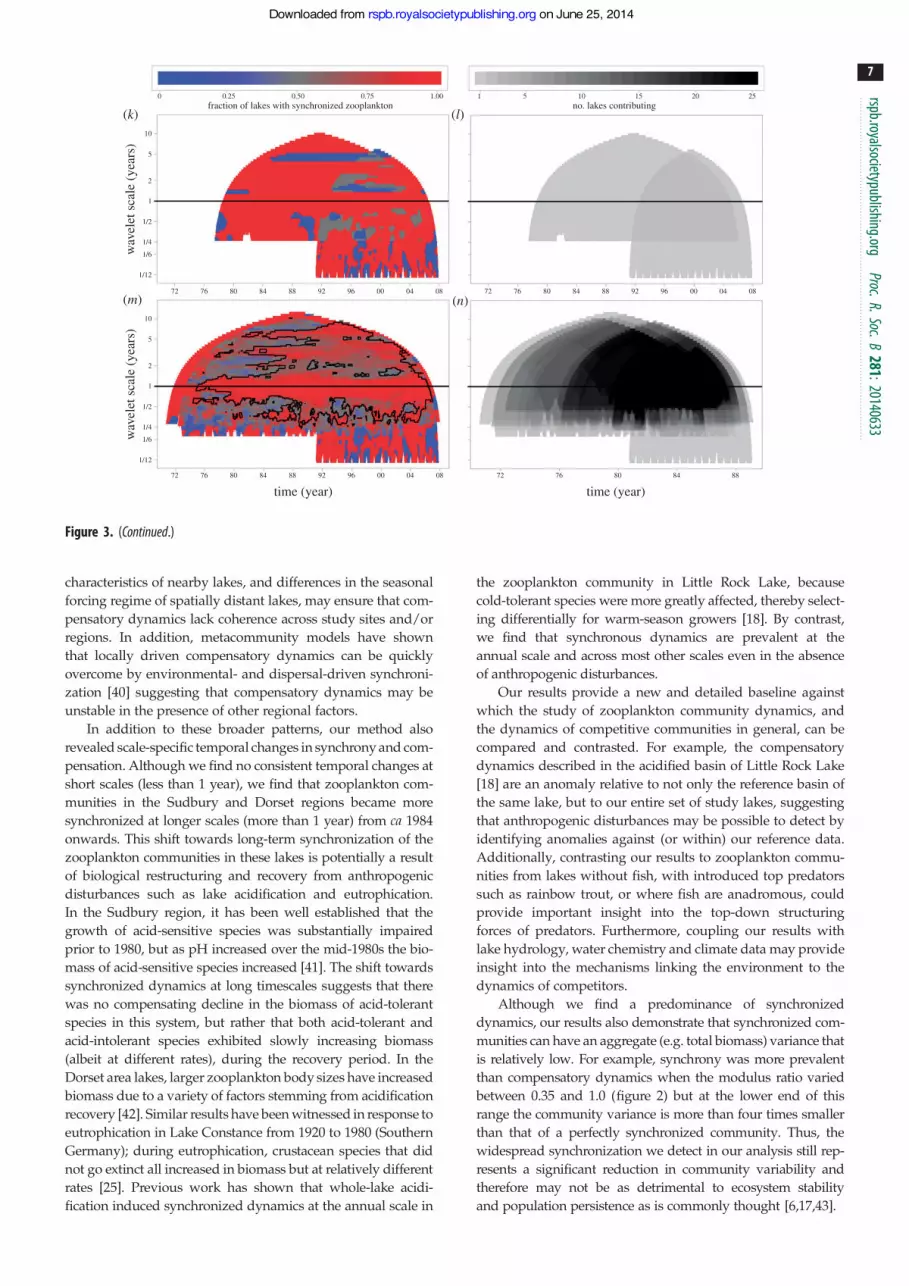
Figure 3. The fraction of study sites demonstrating synchronized zooplankton dynamics (left-side panels) and the number of lakes contributing information (right-side panels) ateach time and scale, broken down by region. Panels (a,b) show aggregated information for the ELA, NOLSS and Coldwater lakes; panels (c,d ) show NTL and Mendota lakes; panels(e,f ) show Sudbury lakes; panels (g,h) show Dorset lakes; panels (i,j ) show Florida lakes; panels (k,l ) show Lake Zurich and Muggelsee and panels (m,n) show aggregatedinformation from all study lakes. In panel (m), the black etching encloses a domain in which synchronized dynamics are more common across sites than expected by chance(a¼ 0.025; p , 0.0066). There are no domains on this plot in which compensatory dynamics are more common across sites than expected by chance. Typically, between10 and 25 study sites contributed information at each combination of time and scale; however, as many as 44 sites contributed at certain combinations. The conical shapeof these figures arises because longer scales require longer time series to generate reliable Wavelet transformations.
rspb.royalsocietypublishing.orgProc.R.Soc.B
281:20140633
6
on June 25, 2014rspb.royalsocietypublishing.orgDownloaded from
characteristics of nearby lakes, and differences in the seasonalforcing regime of spatially distant lakes, may ensure that com-pensatory dynamics lack coherence across study sites and/orregions. In addition, metacommunity models have shownthat locally driven compensatory dynamics can be quicklyovercome by environmental- and dispersal-driven synchroni-zation [40] suggesting that compensatory dynamics may beunstable in the presence of other regional factors.
In addition to these broader patterns, our method alsorevealed scale-specific temporal changes in synchrony and com-pensation. Although we find no consistent temporal changes atshort scales (less than 1 year), we find that zooplankton com-munities in the Sudbury and Dorset regions became moresynchronized at longer scales (more than 1 year) from ca 1984onwards. This shift towards long-term synchronization of thezooplankton communities in these lakes is potentially a resultof biological restructuring and recovery from anthropogenicdisturbances such as lake acidification and eutrophication.In the Sudbury region, it has been well established that thegrowth of acid-sensitive species was substantially impairedprior to 1980, but as pH increased over the mid-1980s the bio-mass of acid-sensitive species increased [41]. The shift towardssynchronized dynamics at long timescales suggests that therewas no compensating decline in the biomass of acid-tolerantspecies in this system, but rather that both acid-tolerant andacid-intolerant species exhibited slowly increasing biomass(albeit at different rates), during the recovery period. In theDorset area lakes, larger zooplankton body sizes have increasedbiomass due to a variety of factors stemming from acidificationrecovery [42]. Similar results have been witnessed in response toeutrophication in Lake Constance from 1920 to 1980 (SouthernGermany); during eutrophication, crustacean species that didnot go extinct all increased in biomass but at relatively differentrates [25]. Previous work has shown that whole-lake acidi-fication induced synchronized dynamics at the annual scale in
the zooplankton community in Little Rock Lake, becausecold-tolerant species were more greatly affected, thereby select-ing differentially for warm-season growers [18]. By contrast,we find that synchronous dynamics are prevalent at theannual scale and across most other scales even in the absenceof anthropogenic disturbances.
Our results provide a new and detailed baseline againstwhich the study of zooplankton community dynamics, andthe dynamics of competitive communities in general, can becompared and contrasted. For example, the compensatorydynamics described in the acidified basin of Little Rock Lake[18] are an anomaly relative to not only the reference basin ofthe same lake, but to our entire set of study lakes, suggestingthat anthropogenic disturbances may be possible to detect byidentifying anomalies against (or within) our reference data.Additionally, contrasting our results to zooplankton commu-nities from lakes without fish, with introduced top predatorssuch as rainbow trout, or where fish are anadromous, couldprovide important insight into the top-down structuringforces of predators. Furthermore, coupling our results withlake hydrology, water chemistry and climate data may provideinsight into the mechanisms linking the environment to thedynamics of competitors.
Although we find a predominance of synchronizeddynamics, our results also demonstrate that synchronized com-munities can have an aggregate (e.g. total biomass) variance thatis relatively low. For example, synchrony was more prevalentthan compensatory dynamics when the modulus ratio variedbetween 0.35 and 1.0 (figure 2) but at the lower end of thisrange the community variance is more than four times smallerthan that of a perfectly synchronized community. Thus, thewidespread synchronization we detect in our analysis still rep-resents a significant reduction in community variability andtherefore may not be as detrimental to ecosystem stabilityand population persistence as is commonly thought [6,17,43].
0
10
5
2
1/2
1/4
1/6
1/12
1
0.25 0.50fraction of lakes with synchronized zooplankton
(k) (l)
10
5
2
1/2
1/4
1/6
1/12
1
(m) (n)
no. lakes contributing0.75 1.00 1 5 10 15 20 25
wav
elet
sca
le (y
ears
)w
avel
et s
cale
(yea
rs)
72 76 80 84 88 92 96 00 04
time (year) time (year)08 72 76 80 84 88
72 76 80 84 88 92 96 00 04 08 72 76 80 84 88 92 96 00 04 08
Figure 3. (Continued.)
rspb.royalsocietypublishing.orgProc.R.Soc.B
281:20140633
7
on June 25, 2014rspb.royalsocietypublishing.orgDownloaded from

Unlike previous work that used methods sensitive to onlythe dominant mode of variation and produced a measure ofvariability averaged across time, our analysis parses out theeffect of variation occurring at different timescales and duringdifferent time periods. Although scale- and time-resolvingmethods have become commonplace in understanding patternsof species covariation [17,18,20,44], ours is the first analysis toseek patterns across broad spatial and temporal scales. Wefound evidence for widespread synchronous dynamics at abroad range of times and scales, while compensatory dynamicswere relatively rare and incoherently distributed among differ-ent times and scales in our study lakes. Although, we found onlyfew regionally consistent changes in zooplankton synchroniza-tion over time, this result is itself important—indicating thatlocal drivers of zooplankton dynamics and heterogeneityamong lakes are strong enough to obscure larger scale patterns.The rarity of compensatory dynamics, which are assumed to bean essential feature of competitive coexistence, brings into
question our understanding of the mechanisms maintainingcoexistence of competitors. Future theoretical and experimentalwork should aim to address how diverse species assemblagespersist despite their tendency to display synchronous dynamicsacross long reaches of time and scale.
Acknowledgements. Toni Klausiches assisted in the development andexecution of programs in R.Data accessibility. Data can be made available upon request.Funding statement. This paper emerged as part of the PredictingEcological Change: Multi-Scale Analysis of Plankton Diversity andDynamics working group funded by the Canadian Institute for Ecol-ogy and Evolution (CIEE/ICEE). This is Kellogg Biological Stationcontribution no. 1718. R.A. was funded by Limnotip (O1LC1207A;Biodiversa) founded under the FP7 ERA-Net Scheme and the DFG-LakeRisk Project; W.A.N. and B.E.B. acknowledge support ofNSERC discovery grants; A.G. is supported by the Canada ResearchChair programme; D.A.V. acknowledges support of NSF DEB grantno. 1050803.
References
1. Rocha MR, Gaedke U, Vasseur DA. 2011 Functionallysimilar species have similar dynamics. J. Ecol. 99,1453 – 1459. (doi:10.1111/j.1365-2745.2011.01893.x)
2. Olden JD, LeRoy Poff N, Douglas MR, Douglas ME,Fausch KD. 2004 Ecological and evolutionaryconsequences of biotic homogenization. Trends Ecol.Evol. 19, 18 – 24. (doi:10.1016/j.tree.2003.09.010)
3. Houlahan JE et al. 2007 Compensatory dynamics arerare in natural ecological communities. Proc. NatlAcad. Sci. USA 104, 3273 – 3277. (doi:10.1073/pnas.0603798104)
4. Loreau M, de Mazancourt C. 2008 Species synchronyand its drivers: neutral and nonneutral communitydynamics in fluctuating environments. Am. Nat.172, E48 – E66. (doi:10.1086/589746)
5. Haegeman B, Loreau M. 2011 A mathematicalsynthesis of niche and neutral theories incommunity ecology. J. Theor. Biol. 269, 150 – 165.(doi:10.1016/j.jtbi.2010.10.006)
6. Micheli F et al. 1999 The dual nature of communityvariability. Oikos 85, 161 – 169. (doi:10.2307/3546802)
7. Gonzalez A, Loreau M. 2009 The causes andconsequences of compensatory dynamics inecological communities. Annu. Rev. Ecol. Evol. Syst.40, 393 – 414. (doi:10.1146/annurev.ecolsys.39.110707.173349)
8. Ives AR, Gross K, Klug JL. 1999 Stability andvariability in competitive communities. Science 286,542 – 544. (doi:10.1126/science.286.5439.542)
9. Pimm SL, Jones HL, Diamond J. 1988 On the risk ofextinction. Am. Nat. 132, 757 – 785. (doi:10.1086/284889)
10. Inchausti P, Halley J. 2003 On the relation betweentemporal variability and persistence time in animalpopulations. J. Anim. Ecol. 72, 899 – 908. (doi:10.1046/j.1365-2656.2003.00767.x)
11. Cottingham KL, Brown BL, Lennon JT. 2001Biodiversity may regulate the temporal variability ofecological systems. Ecol. Lett. 4, 72 – 85. (doi:10.1046/j.1461-0248.2001.00189.x)
12. Petchey OL, Gaston KJ. 2002 Functional diversity(FD), species richness and community composition.Ecol. Lett. 5, 402 – 411. (doi:10.1046/j.1461-0248.2002.00339.x)
13. Steiner CF, Long ZT, Krumins JA, Morin PJ. 2005Temporal stability of aquatic food webs: partitioningthe effects of species diversity, species compositionand enrichment. Ecol. Lett. 8, 819 – 828. (doi:10.1111/j.1461-0248.2005.00785.x)
14. Carpenter SR, Brock WA. 2006 Rising variance: aleading indicator of ecological transition. Ecol.Lett. 9, 311 – 318. (doi:10.1111/j.1461-0248.2005.00877.x)
15. Scheffer M et al. 2012 Anticipating criticaltransitions. Science 338, 344 – 348. (doi:10.1126/science.1225244)
16. Loreau M, de Mazancourt C. 2013 Biodiversity andecosystem stability: a synthesis of underlyingmechanisms. Ecol. Lett. 16, 106 – 115. (doi:10.1111/ele.12073)
17. Vasseur DA, Gaedke U. 2007 Spectral analysisunmasks synchronous and compensatory dynamicsin plankton communities. Ecology 88, 2058 – 2071.(doi:10.1890/06-1899.1)
18. Keitt TH. 2008 Coherent ecological dynamicsinduced by large-scale disturbance. Nature 454,331 – 334. (doi:10.1038/nature06935)
19. Keitt TH, Fischer J. 2006 Detection of scale-specificcommunity dynamics using wavelets. Ecology 87,2895 – 2904. (doi:10.1890/0012-9658(2006)87[2895:DOSCDU]2.0.CO;2)
20. Downing AL, Brown BL, Perrin EM, Keitt TH, LeiboldMA. 2008 Environmental fluctuations induce scale-dependent compensation and increase stability inplankton ecosystems. Ecology 89, 3204 – 3214.(doi:10.1890/07-1652.1)
21. Vasseur DA, Gaedke U, McCann KS. 2005 A seasonalalternation of coherent and compensatory dynamicsoccurs in phytoplankton. Oikos 110, 507 – 514.(doi:10.1111/j.0030-1299.2005.14006.x)
22. Haegeman B, Etienne RS. 2008 Relaxing the zero-sum assumption in neutral biodiversity theory.J. Theor. Biol. 252, 288 – 294. (doi:10.1016/j.jtbi.2008.01.023)
23. Vasseur DA, Fox JW. 2007 Environmentalfluctuations can stabilize food web dynamics byincreasing synchrony. Ecol. Lett. 10, 1066 – 1074.(doi:10.1111/j.1461-0248.2007.01099.x)
24. Jeppesen E, Peder Jensen J, SØndergaard M,Lauridsen T, Landkildehus F. 2000 Trophic structure,species richness and biodiversity in Danish lakes:changes along a phosphorus gradient. Freshw. Biol.45, 201 – 218. (doi:10.1046/j.1365-2427.2000.00675.x)
25. Straile D, Geller W. 1998 Crustacean zooplankton inLake Constance from 1920 to 1995: Response toeutrophication and re-oligotrophication. Adv.Limnol. 53, 255 – 274.
26. Sommer U, Gliwicz ZM, Lampert W, Duncan A. 1986The PEG-model of seasonal succession of planktonicevent in fresh waters. Arch. Hydrobiol. 106, 433 – 471.
27. Torrence C, Compo GP. 1998 A practical guide towavelet analysis. Bull. Am. Meteorol. Soc. 79,61 – 78. (doi:10.1175/1520-0477(1998)079,0061:APGTWA.2.0.CO;2)
28. Fee EJ, Hecky RE. 1992 Introduction to thenorthwest Ontario lake size series (NOLSS).Can. J. Fish. Aquat. Sci. 49, 2434 – 2444. (doi:10.1139/f92-269)
29. Straile D, Adrian R. 2000 The North AtlanticOscillation and plankton dynamics in two Europeanlakes—two variations on a general theme. Glob.Change Biol. 6, 663 – 670. (doi:10.1046/j.1365-2486.2000.00350.x)
30. Pomati F, Matthews B, Jokela J, Schildknecht A,Ibelings BW. 2012 Effects of re-oligotrophicationand climate warming on plankton richness andcommunity stability in a deep mesotrophic lake.Oikos 121, 1317 – 1327. (doi:10.1111/j.1600-0706.2011.20055.x)
rspb.royalsocietypublishing.orgProc.R.Soc.B
281:20140633
8
on June 25, 2014rspb.royalsocietypublishing.orgDownloaded from

31. Shurin JB et al. 2010 Environmental stabilityand lake zooplankton diversity: contrastingeffects of chemical and thermal variability. Ecol.Lett. 13, 453 – 463. (doi:10.1111/j.1461-0248.2009.01438.x)
32. Foufoula-Georgiou E, Kumar P. 1994 Wavelets ingeophysics. San Diego, CA: Academic Press.
33. Benjamini Y, Yekutieli D. 2001 The control of thefalse discovery rate in multiple testing underdependency. Ann. Stat. 29, 1165 – 1188. (doi:10.1214/aos/1013699998)
34. Vanni MJ, Temte J. 1990 Seasonal patterns ofgrazing and nutrient limitation of phytoplankton ina eutrophic lake. Limnol. Oceanogr. 35, 697 – 709.(doi:10.4319/lo.1990.35.3.0697)
35. Chesson P. 2000 Mechanisms of maintenance ofspecies diversity. Annu. Rev. Ecol. Syst. 31,343 – 366. (doi:10.1146/annurev.ecolsys.31.1.343)
36. Hubbell SP. 2001 The unified neutral theory ofspecies abundance and diversity, vol. 79, pp. 96 – 97.Princeton, NJ: Princeton University Press.
37. Hebert PDN. 1982 Competition in zooplanktoncommunities. Annales Zoologici Fennici 19,349 – 356.
38. Vanni MJ. 1986 Competition in zooplanktoncommunities: suppression of small species byDaphnia pulex. Limnol. Oceanogr. 31, 1039 – 1056.(doi:10.4319/lo.1986.31.5.1039)
39. Gilbert JJ. 1988 Suppression of rotifer populationsby Daphnia: a review of the evidence, themechanisms, and the effects on zooplanktoncommunity structure. Limnol. Oceanogr. 33,1286 – 1303. (doi:10.4319/lo.1988.33.6.1286)
40. Gouhier TC, Guichard F, Gonzalez A. 2010 Synchronyand stability of food webs in metacommunities. Am.Nat. 175, E16 – E34. (doi:10.1086/649579)
41. Keller W, Yan ND, Somers KM, Heneberry JH. 2002Crustacean zooplankton communities in lakesrecovering from acidification. Can. J. Fish. Aquat. Sci.59, 726 – 735. (doi:10.1139/f02-042)
42. Yan ND et al. 2008 Long-term trends inzooplankton of Dorset, Ontario, lakes: the probableinteractive effects of changes in pH, totalphosphorus, dissolved organic carbon, andpredators. Can. J. Fish. Aquat. Sci. 65, 862 – 877.(doi:10.1139/f07-197)
43. Peterson CH. 1975 Stability of species and ofcommunity for the benthos of two lagoons. Ecology56, 958 – 965. (doi:10.2307/1936306)
44. Fischer JM, Frost TM, Ives AR. 2001 Compensatorydynanmics in zooplankton community responses toacidification: measurement and mechanisms. Ecol.Appl. 11, 1060 – 1072. (doi:10.1890/1051-0761(2001)011[1060:CDIZCR]2.0.CO;2)
rspb.royalsocietypublishing.orgProc.R.Soc.B
281:20140633
9
on June 25, 2014rspb.royalsocietypublishing.orgDownloaded from


