Embed Size (px)
Citation preview
Journal of Engineering Volume 24 February 2018 Number 2
16
Synchronous Buck Converter with Perturb and Observe Maximum Power
Point Tracking Implemented on a Low-Cost Arduino-microcontroller
Emad Talib Hashim Sarah Adil Mohammed Hussien
Assistant Professor M.Sc. Student
Department of Energy Engineering Department of Energy Engineering
College of Engineering/ University of Baghdad College of Engineering/ University of Baghdad
[email protected] [email protected]
ABSTRACT
Maximum power point tracking (MPPT) is used in photovoltaic (PV) systems to enhance
efficiency and maximize the output power of PV module, regardless the variation of temperature,
irradiation, and the electrical characteristics of the load. A new MPPT system has been presented
in this research, consisting of a synchronous DC-DC step-down Buck converter controlled by an
Arduino microcontroller based unit. The MPPT process with Perturb and Observe method is
performed with a DC-DC converter circuit to overcome the problem of voltage mismatch
between the PV modules and the loads. The proposing system has high efficiency, lower cost
and can be easily modified to handle more energy sources. The test results indicate that the use
of the proposed MPPT control with the designed synchronous Buck converter increases the PV
output power; hence increases the overall solar system efficiency. The synchronous Buck
converter test results used in this design showed high converter efficiency up to 95% of the
power produced from the solar module, leading to reduce power loss caused by the power
transfer process from PV module to the loads.
Keywords: photovoltaic MPP system, P&O algorithm, DC-DC converter, Arduino
microcontroller.
االردوينو تالعظمى تنفذ على متحكم تالطبق تالتتبع واالضطزاة لنقط تالمحول التزامني الخبفض مع تقني
تالكلف تواطئ
عبدل محمذ حسين ةسبر عمبد طبلت هبشم
يبجسزش خاسزبر يسبػذ طبنج
ثغذاد خ/جبيؼخانهذس خ/كهخانطبق خ/جبيؼه ثغذاد قسى هذسخانهذس خقسى هذسه انطبقه/كه
الخالصهثغض انفىرىفىنزبئ ي انهىح انسزخشجخ حنك رزذ ي انقذس انفىرىفىنزبئ رسزخذو ف انظبوانؼظى قطخ انطبقخرقخ رزجغ
زقخ رزجغ قطخ انطبقخ. طىس ظبو جذذ ثع انشس وخصبئص انحم انكهشثبئخاالشؼب خوحبن انظش ػ رأثش دسجخ انحشاسح
زحكى ثه وحذاد انحىل انززاي انخبفض نهزبس انكهشثبئ انسزش وانزيزكى ي انفىرىفىنزبئ ف انهىح انؼظى
انحىل حاالضطشاة وانززجغ قذ طجقذ يغ دائش خيغ طشق انؼظى رقخ رزجغ قطخ انطبقخ االسدوى.ا انصغشح خانزحك
وانحم. انظبو انبرج نذه ح انفىرىفىنزبئ ث انهى خػذو رىافق انفىنز خػهى يشكهانززاي انخبفض نهزبس انسزش نهزغهت
ذ ا اسزخذاو ث دس فىنزخ او طبقخ اػهى. انزبئج انؼههنك زحم يصب هرحىه خكفبءح ػبنخ, كهفخ واطئخ ويك ثسهىن
نزبئ وثبنزبن زذ رىفىي انهىح انفى ح انطبقخ انسزخشجخزذ ي كفبء انؼظى زقخ رزجغ قطخ انطبقخانظبو انقزشح زحكى ث
سزخذو ف هزا انزصى اظهشد . ا زبئج اخزجبس انحىل انززاي انخبفض نهزبس انسزش اني كفبءح انظبو انشس انكهخ
هم ي خسبئش انطبقه انبرجخ ي % وثبنزبن ق59اػهى ي كفبءح رحىم ػبنخ نهطبقخ انبخىرح ي انهىح انفىرىفىنزبئ ثسجخ
ي انهىح انفىرىفىنزبئ انى انحم. انقذسحرحىم
Journal of Engineering Volume 24 February 2018 Number 2
17
1. INTRODUCTION
Nowadays the photovoltaic power systems are one of the fastest-growing renewable energy
technologies, providing more secure power sources and pollution free electric supplies.
Unfortunately, PV systems have its own problems, besides the high fabrication cost, the energy
conversion efficiency not exceeds 30%.Because the output power of PV modules severely
affected by irradiance levels. Another limitation is the electricity produced from PV system is
expensive competed to the electricity from the utility grid. Therefore, the use of PV system and
make it operate at maximum output power in any environmental conditions is desired, Dinçer,
and Meral, 2009.
A typical PV solar system has a current-voltage (I-V) characteristic curves under constant
uniform irradiance similar to that presented in Fig.1. The operation point of the system is at the
intersection of the I-V curve and load line, there is one unique point at the knee of the curve
known as maximum power point (MPP). At the MPP the PV system operates at the maximum
power. When a PV system is directly connected to a load, the photovoltaic system operations
point is not at MPP most of the time. The problem is overcome by using an MPPT technique that
use algorithm maintains the PV system operating point at the MPP. Many MPPT methods have
been proposed in the literature each has it is pros and cons and differed in complexity, cost,
tracking speed, and another aspect. These methods use different solar panels characteristics and
the location of the MPP, including perturb-and-observe method, open- and short-circuit method,
incremental conductance algorithm, fuzzy logic and artificial neural network, Hohm, and Ropp,
2003.
An MPPT system is used to extract the maximum power from the PV module. A prototype
design has been developed, using one of the famous switch mode power converters named
synchronous buck converter. Step-down DC-DC converter acts as an interface between the PV
module and load to transfer the maximum power of the photovoltaic system to the load.
Maximum power is transferred by changing the load impedance as seen by the source and
matching it at the peak power of it when the duty cycle is varied. In order to maintain PV
module’s operating at its MPP, different MPPT methods are studied. In the literature, many
MPPT methods are proposed such as the perturb and observe (P&O) method, incremental
Conductance(IC) method, Fuzzy Logic Method etc., Morales, 2010. However, one algorithm,
the perturb and observe (P&O) claimed by many methods and continue to be by far the most
common MPPT method used in practice because it is simple structure and ease of
implementation. This paper presents a practical implementation of P&O algorithms based on
Arduino microcontroller for tracking of the maximum power generation from PV system under a
rapid change in the radiation level. The proposed control system algorithm obtains the Data from
the PV system through microcontroller’s Analog and Digital ports to perform the pulse width
modulation to the DC-DC converter. These techniques vary in many aspects like simplicity,
speed of convergence, digital or analogical implementation, number of sensors required, cost,
effectiveness range, and in other aspects
2. MATHEMATICAL MODELING OF PV MODULE
The main building block of the photovoltaic module is the PV cell, the PV cells connected in
a series-parallel manner to form the PV module. The PV cell basically is a P-N junction
semiconductor which represents the main electrical unit of solar power generation system. The
PV receives energy from the sun and generate DC power when exposed to light.
Journal of Engineering Volume 24 February 2018 Number 2
18
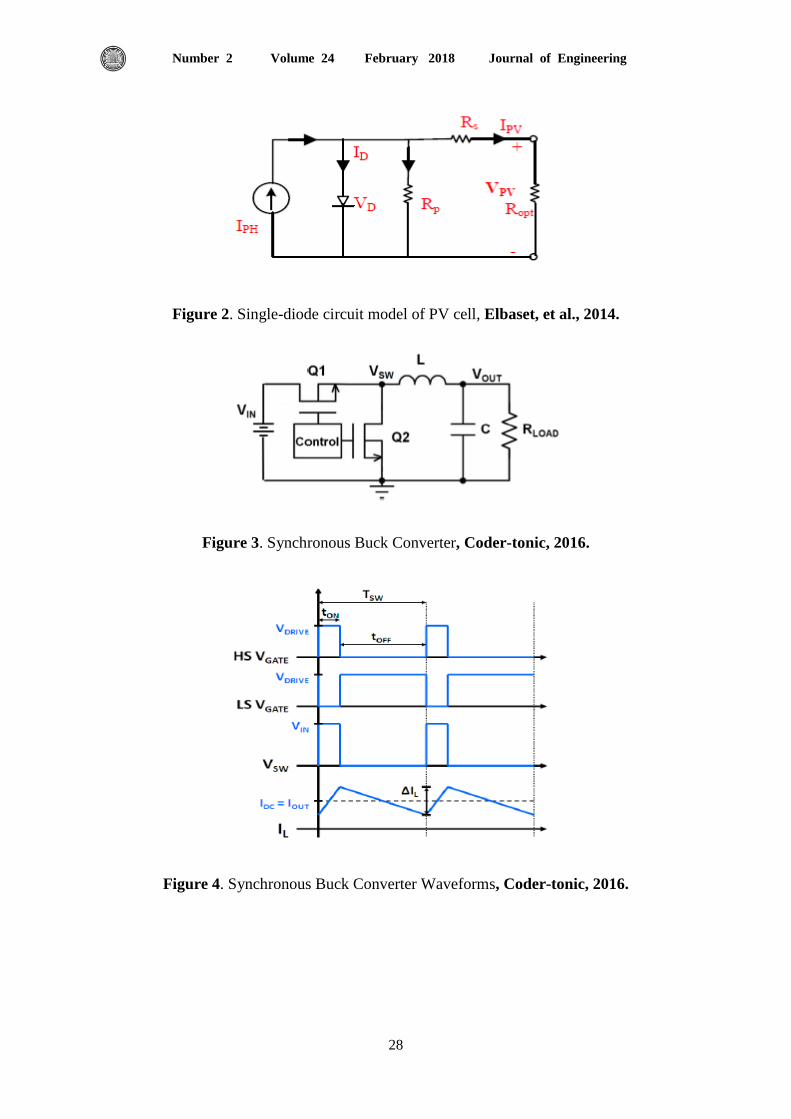
The generated voltage and current for such PV modules depend generally on solar radiation
and cell temperature. The equivalent circuit model of a simplified single-diode is as shown in
Fig. 2.
The mathematical equation describing the I-V characteristics of a PV solar cells module is
given by Elbaset, et al., 2014.
(
) (1)
(2)
Iph: The generated current of solar cells module. This current varies with temperature
according to the next equation:
( ( )) (3)
and the diode characteristic is:
( ) (4)
(5)
* *( )
+ +
(6)
Io: The reverse saturation current, Amp. This current changes with temperature variation as
follows:
*
+
[
(
)] (7)
The solar cells output can be calculated by the following equation:
* * * ( )
+ +
+ (8)
From the previous equations, it can be concluded that the power and output current of a PV
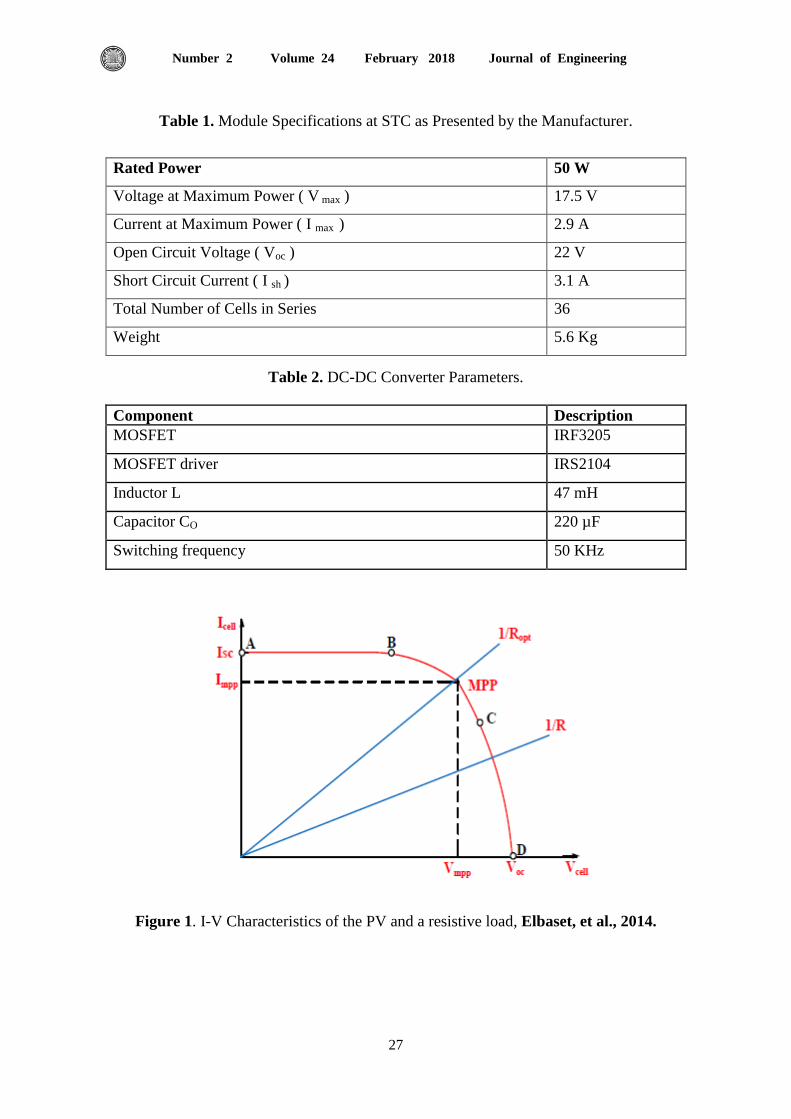
module is mainly affected by solar radiation and the cell temperature. Fig. 1 clarifies the I-V
characteristics curve of a PV module and a resistive load Ropt. The resistance characteristic is a
line of slope 1/Ropt. At the intersection of the two curves, the operating point is located. In the
curve AB region the module acts as a current source and in the CD region, it acts as a voltage
source. Notice in the BC intermediate zone, the PV characteristic is nonlinear; this is the area
where can find the MPP for which the PV module could provide its highest power for certain
atmospheric conditions. Ropt represents the resistance at that point, Elbaset, et al., 2014.
Journal of Engineering Volume 24 February 2018 Number 2
19
3. DC-DC REGULATORS
In any solar system the maximum power point varies with the variation of atmospheric
condition this means at each irradiance and temperature there is one optimum output voltage for
the PV module to operate with. In order to make the PV panel operates at it is MPP and maintain
optimal battery charging process, the DC-DC regulator is required to increase or decrease the
output voltage of solar module to the desired battery level. These regulators are also known as
switching regulators. Switch mode DC-DC converters are utilized to convert the unregulated DC
input into controlled DC output at the desired voltage level. The heart of MPPT system hardware
is DC-DC converter and without it, the maximum power could not be achieved, Daib, 2012.
A power switch, an inductor, a capacitor and a diode are the basic component of any DC
converter that can be arranged to form a different type of DC-DC converters. MPPT system uses
DC converter for regulating the PV terminal voltage at MPP and matching the load by providing
maximum power transfer. The most efficient and fast way to permit a pulse width modulation to
control the frequency and the switch duty cycle is MOSFET. The amount of transferred power
from the input to output depends on duty cycle high. There is no need for any analog to digital
signal conversion from the microcontroller to the MOSFETs because the signal remains digital
from the source and this is one of PWM advantages, Hiwale, et al., 2014.
There are different types of the DC-DC converter such as Buck, Boost, Buck/Boost, Cuk and
Single Ended Primary Inductor Converter (SEPIC).In Buck converter, the output voltage is
lower than the input voltage, while Boost converter works on higher the output voltage since it
has less the input voltage. The Buck/Boost and Cuk converters have the same characteristics that
the output voltage is higher or lower the input voltage, and the polarity of the voltage between
input and output are reversed. However, SEPIC converter cans low or high the input voltage by
maintaining the polarity between input and output. The main type of DC-DC converter in this
project is synchronous Buck converter, Mwinyiwiwa, 2013.
3.1 Synchronous Buck Converter Basics
The synchronous buck converter is used to reduce a voltage level from a higher voltage to a
lower voltage. Today in industry Synchronous buck converters are very popular, since it
provides high-efficiency solutions for a wide range of applications especially in portable
electronics. A synchronous buck converter supplies a regulated voltage that is lower or the same
as input voltage and can minimize power loss by delivering high currents. As shown in Fig. 3,
the synchronous buck converter is consisting of two power MOSFETs, an output inductor, and
an output capacitor. This specific buck topology derives its name from the control method of the
two power MOSFETs; the on / off control is synchronized in order to provide a regulated output
voltage and to prevent the MOSFETs from turning on at the same time. Klein, 2006.
The high side MOSFET (Q1) is connected directly to the circuit input voltage. When Q1i
turns on, current is provided to the load through the high side MOSFET. During this time, the
low side MOSFET (Q2) is turned off and the inductor current increases, charging the LC filter.
When Q1i turns off, Q2i turns on and current is delivered to the load through the low side
MOSFET. At this time, the inductor current decreases, discharging the LC filter. Q2 the low side
MOSFET presents an additional function when both MOSFETs are off. It locks the voltage of
switch node through the body diode to prevent VSW from going too far negative when the high
side MOSFET first turns off, Geetha, and Pramila, 2016.
Journal of Engineering Volume 24 February 2018 Number 2
20
Fig.4 demonstrates the synchronous buck converter basic waveforms in continuous
conduction mode. The peak to peak inductor current is the total change in inductor current. The
switch mode output voltage is smoothed out by the LC output stage so as to supply a regulated
DC voltage at the output. To prevent shoot−through the MOSFETs are synchronously controlled.
Shoot−through occurs when both MOSFET the high side and low side are on at the same time,
providing a direct short to ground. Meekhun, et al., 2011.
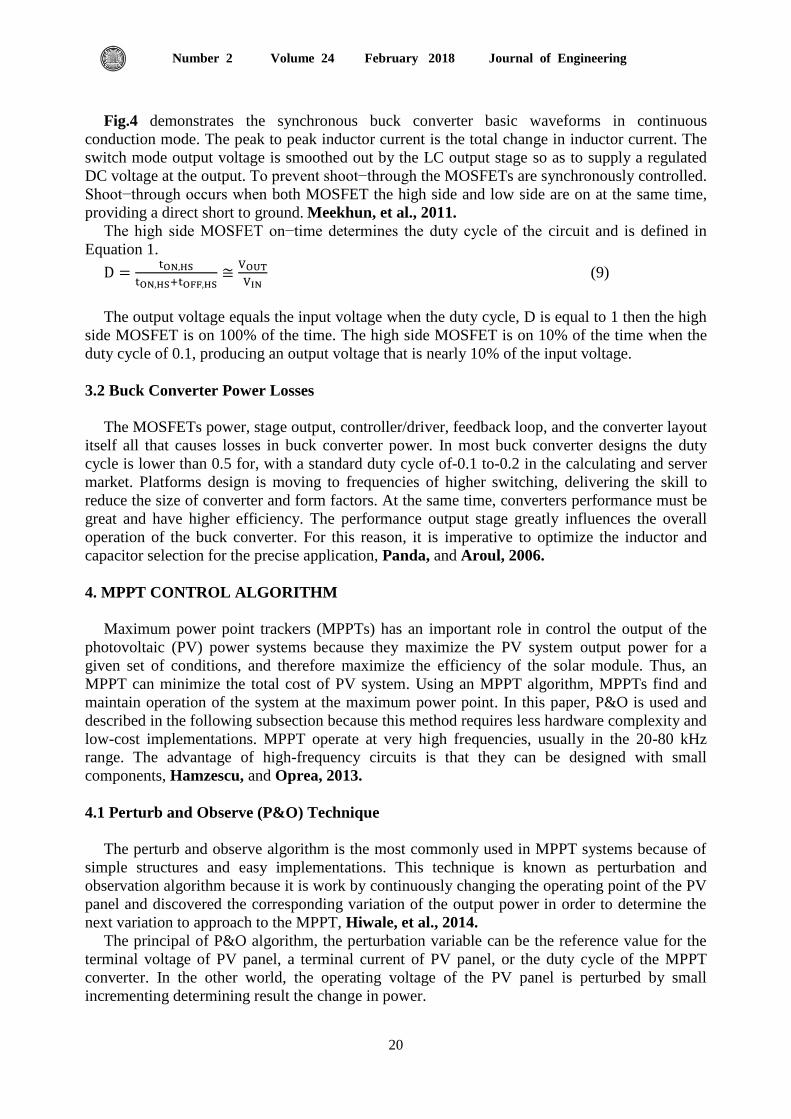
The high side MOSFET on−time determines the duty cycle of the circuit and is defined in
Equation 1.
(9)
The output voltage equals the input voltage when the duty cycle, D is equal to 1 then the high
side MOSFET is on 100% of the time. The high side MOSFET is on 10% of the time when the
duty cycle of 0.1, producing an output voltage that is nearly 10% of the input voltage.
3.2 Buck Converter Power Losses
The MOSFETs power, stage output, controller/driver, feedback loop, and the converter layout
itself all that causes losses in buck converter power. In most buck converter designs the duty
cycle is lower than 0.5 for, with a standard duty cycle of-0.1 to-0.2 in the calculating and server
market. Platforms design is moving to frequencies of higher switching, delivering the skill to
reduce the size of converter and form factors. At the same time, converters performance must be
great and have higher efficiency. The performance output stage greatly influences the overall
operation of the buck converter. For this reason, it is imperative to optimize the inductor and
capacitor selection for the precise application, Panda, and Aroul, 2006.
4. MPPT CONTROL ALGORITHM
Maximum power point trackers (MPPTs) has an important role in control the output of the
photovoltaic (PV) power systems because they maximize the PV system output power for a
given set of conditions, and therefore maximize the efficiency of the solar module. Thus, an
MPPT can minimize the total cost of PV system. Using an MPPT algorithm, MPPTs find and
maintain operation of the system at the maximum power point. In this paper, P&O is used and
described in the following subsection because this method requires less hardware complexity and
low-cost implementations. MPPT operate at very high frequencies, usually in the 20-80 kHz
range. The advantage of high-frequency circuits is that they can be designed with small
components, Hamzescu, and Oprea, 2013.
4.1 Perturb and Observe (P&O) Technique
The perturb and observe algorithm is the most commonly used in MPPT systems because of
simple structures and easy implementations. This technique is known as perturbation and
observation algorithm because it is work by continuously changing the operating point of the PV
panel and discovered the corresponding variation of the output power in order to determine the
next variation to approach to the MPPT, Hiwale, et al., 2014.
The principal of P&O algorithm, the perturbation variable can be the reference value for the
terminal voltage of PV panel, a terminal current of PV panel, or the duty cycle of the MPPT
converter. In the other world, the operating voltage of the PV panel is perturbed by small
incrementing determining result the change in power.
Journal of Engineering Volume 24 February 2018 Number 2
21
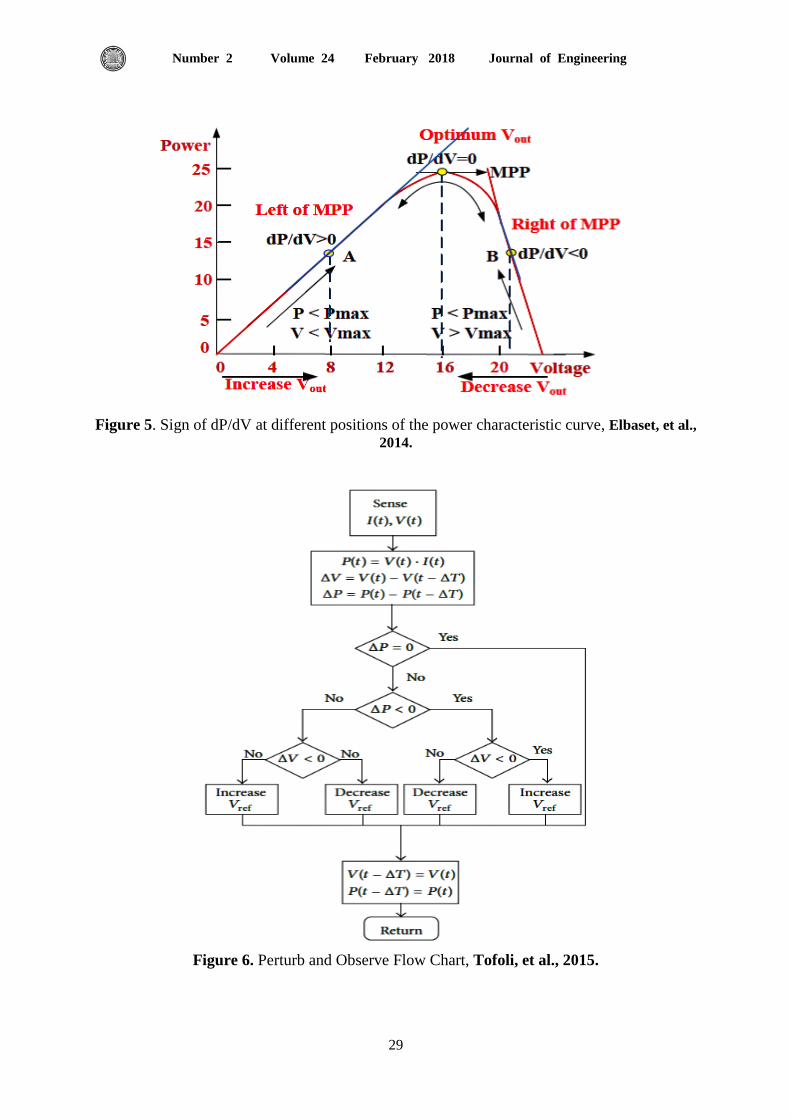
Fig. 5 shows a clarification of the PV panel output power against panel voltage at a specific
irradiance and constant temperature, the spot indicated represents the MPP.
Let's say having two operating positions as point A (dP/dV ˃ 0) and point B (dP/dV ˂ 0) as
pointed in Fig.5. If the voltage at point A is perturbed and (dP/dV ˃ 0), it is clear that the
operation point is on the left side of MPP. The P&O algorithm would then increase the PV
module voltage to move the operation point towards the MPP. At point B if (dP/dV ˂ 0) it is
clear that the operating point is on the right side of the MPP. The P&O algorithm would then
decrease the PV module voltage, Hohm, and Ropp, 2003. Hence, the key function in the perturbation and observation algorithm is a determination of
the perturbation direction. Here the PV terminal voltage used as a control variable, first of all,
using the sensor to measuring the terminal voltage, Vpv and current, Ipv, then obtain the output
power from Vpv and Ipv product. The algorithm detects if the module power increase with
increasing the terminal voltage, then the reference voltage is increased by one step size
otherwise, the algorithm will decrease reference voltage by one step size. If the PV output power
decreases while the PV terminal voltage increase, the reference voltage is dropped by one step
size perturbation, otherwise, the reference voltage is increased by one step size perturbation.
From the flowchart shown in Fig. 6, the next direction of perturbation can be determined by an
increase or decrease the reference voltage, Xuejun, 2010.
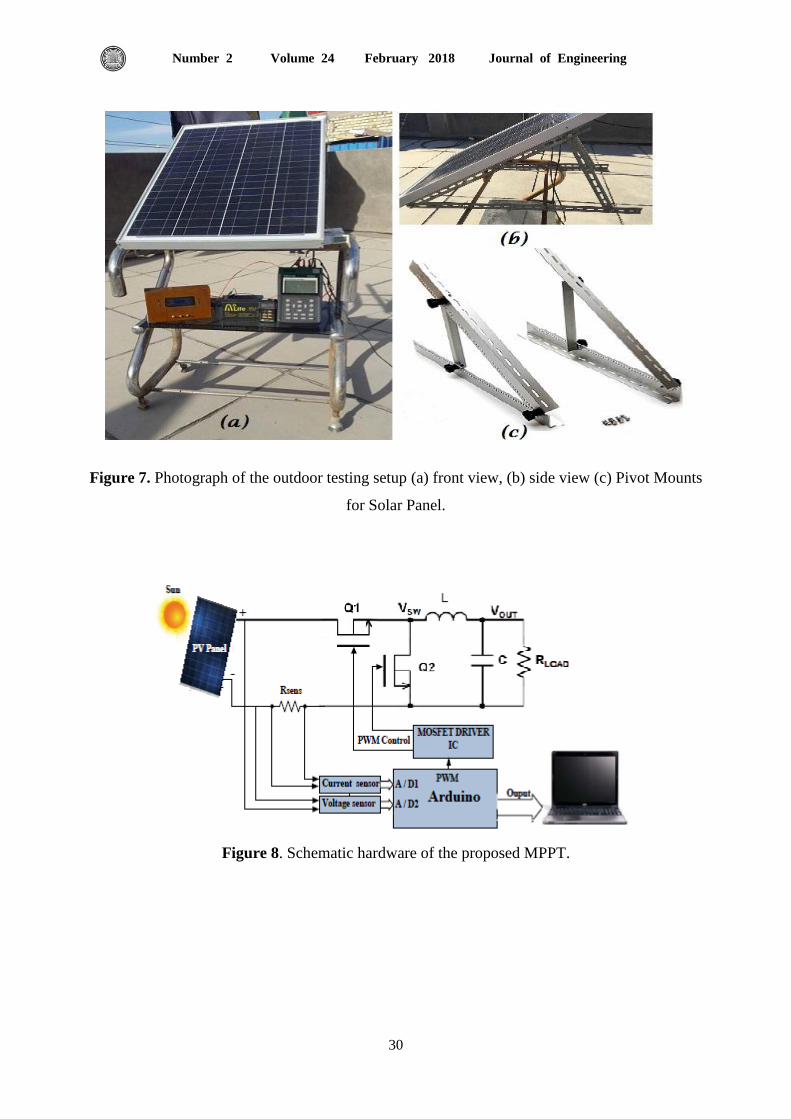
5. IMPLEMENTATION OF HARDWARE
To test the performance of the proposed system a prototype hardware is implemented as
shown in Fig. 7.The system was created and tested with a polycrystalline PV module of 50 W
maximum output power to corroborate the proposed design. The system consists of the PV
module; the charge controller contains a DC-DC converter and an Arduino microcontroller in
which the MPPT algorithm was implemented. The tests were carried out to measure
characteristics of the synchronous buck converter. The microcontroller provides the pulse-width-
modulation (PWM) signal to control the synchronous buck DC-DC converter. The schematic
hardware of the proposed MPPT with the converter is shown in Fig.8.
5.1 Photovoltaic PV Module
Single poly-crystalline solar module specifications given by the manufacturer are presented in
Table 1.The electrical characteristics of a PV module, given by manufacture’s data sheet at the
nominal temperature of 25 °C and irradiation of 1000W/m2.The panel equipped with TPM-10
Temperature Sensor to monitor its temperature during experiments. The solar module is
calibrated according to standard procedure available in the energy laboratory.
5.2 Synchronous Buck Converter
In this work The DC-DC converter is a 50W Synchronous Buck converter working at a
switching frequency of 50 kHz, it is used to interface the PV panel output to the load and to track
the maximum power point of the PV panel. The parameters of the converter are given in Table
2. The system output parameters and it is loaded determined the designing first step in the buck
converter circuit. The operation frequency, the size of inductor and output capacitor size are very
Journal of Engineering Volume 24 February 2018 Number 2
22
important since they determine the ripple size of current and voltage. It is desired to have an as
smaller ripple of current and voltage as possible.
A general rule is when the frequency higher the inductor and the output capacitor size are
smaller, and a smaller inductor size and capacitor size generally reduces the system
cost. However, the PWM of higher frequencies reduces the efficiency of the system because of
losses in MOSFETs switching, so a tradeoff has to be reached. Calculating the value of the
inductor is most critical in a step-down switching converter designing which meets the design
constraints of the end system.
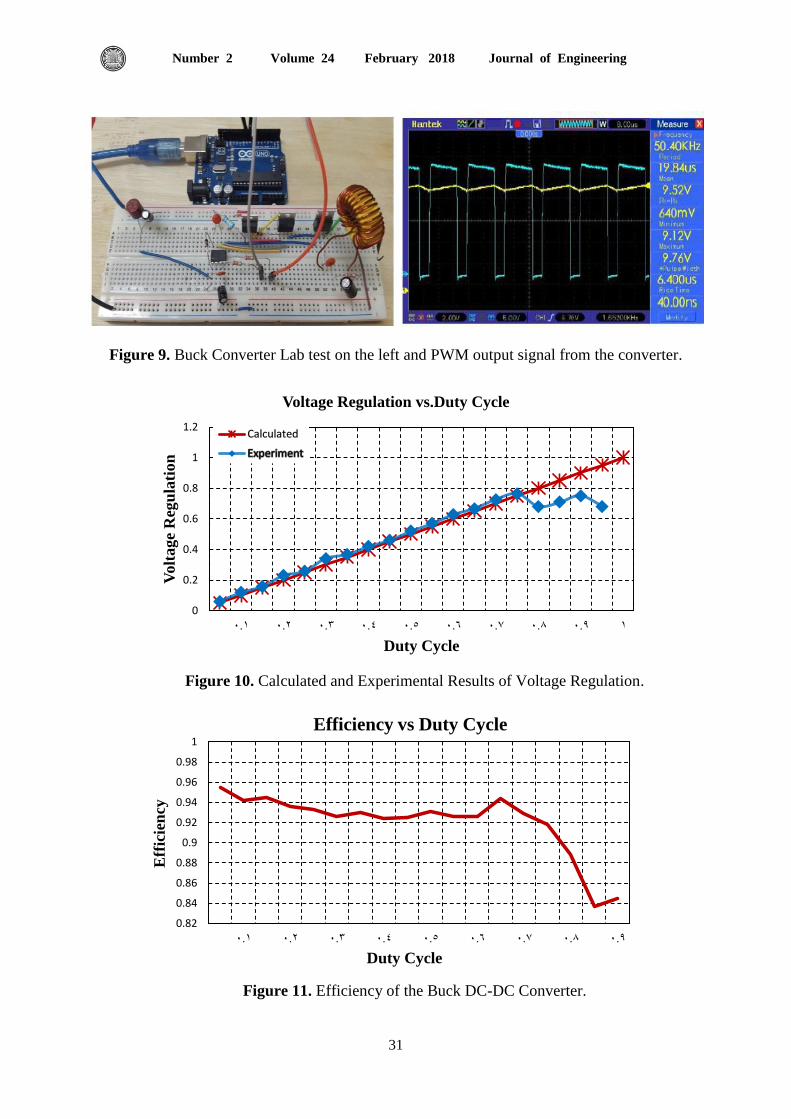
For this research, the inductor was toroidal core and it is hand-wounded from old computer
power supply as shown in Fig.9. To reduce the voltage overshoot and the step-down converter
output ripple the output capacitance is required. The look for the suitable MOSFET for a
particular design includes reducing the switching losses and Find out how to rely on switching
frequency, current, duty cycle, and shift times up and downs of these losses. The Half-Bridge
driver is an IC designed specifically for driving MOSFETs. The driver takes the PWM signal
coming from the microcontroller then drives High and Low-Side outputs MOSFET. The driver
used is IRS2104 half bridge driver manufactured by International Rectifier, this driver allows 2-
PWM signals to be connected to High and Low-Side outputs MOSFET, this gives the chance to
the MOSFETs dead band switching fine tune. The converter was tested on a breadboard in the
lab and the PWM output signal from the buck converter shown in Fig.9.
5.3 Microcontroller
The ATmega328P microcontroller with Arduino bootloader offers all hardware
functionality required in charge controller design. This microcontroller provides all the digital
and analog pins needed by the sensors and other peripherals. This microcontroller features an 8-
bit, 6-PWM channel, 8 analog inputs, and 14 digital input/output pins. Arduino microcontroller
mainly used to control the DC-DC converter, the program controlled duty cycle via PWM
outputs that provide from microcontroller channel. Arduino microcontroller has many features
such as great memory size, analog to digital converter on-chip, PWM outputs, consumption low
power and low cost all that was needed for the suggested system. The Arduino bootloader allows
programming directly from PC through the USB cable, eliminating the need for a programmer in
separate hardware to implement new code. The Arduino programming language was selected
because it is easy, learning curve relatively shorter, and facilitates faster learning due to the large
and active community. The language and IDE are completely free and open source, and Arduino
website enables many resources about all kind of sensors, motors, LEDs, communication
tutorials, etc. The language is both easy to use and robust, providing all the functionality needed
for interfacing with analog sensors, I2C components, and TTL serial peripherals among others.
Moreover, numerous libraries have been written for popular sensors and other peripherals which
helped in the learning and implementation of components in MPPTs. Gibb, 201, and Durfee,
2011.
Journal of Engineering Volume 24 February 2018 Number 2
23
6. EXPERIMENTAL RESULTS
6.1 The Synchronous Buck Converter
The system was constructed and tested with a 50 W maximum output power PV panel as
shown in Fig. 7 to validate the proposed design. The system consists of the PV panel; the charge
controller contains a DC/DC converter and an Arduino microcontroller in which the MPPT
algorithm was implemented. The tests were carried out to measure characteristics of the buck
converter and the MPPT charge controller.
The first aspect of the converter to be verified was the voltage regulation. The voltage
regulation was found by measuring the input and output voltages at different duty cycle levels.
The output voltage was divided by the input voltage to obtain the voltage regulation. Fig.10
shows the measured voltage regulation of the converter compared to the expected voltage
regulation results value that had been calculated from Equation 9. The experimental results were
measured with the converter connected to the PV panel as an input source, at fixed input voltage.
As can be seen in Fig.10, the voltage regulation results from the actual converter are nearly
identical to the calculated values until an 80% duty cycle. This result shows two things. First,
from the correlation of the regulation ratios 0.05 up to 0.75, it is observed that the converter is
acting as expected. The results are the same as the calculated expectation for the circuit.
Second, something can also be learned from the results of a duty cycle of 75%. The
calculations do not take into account real-world parameters and physical limits on components.
The results from the equation were taken with the assumption that the converter connected to an
ideal voltage supply at 17 volts. This voltage supply was said to be able to supply unlimited
current while staying at the 17-volt level. The PV panel, however, is not an ideal source. This
fact is what contributes to the limiting factor on the voltage regulation of the circuit at the higher
duty cycles. As previously presented a PV panel has a finite limit on the amount of voltage,
current, and power it can output.
When the converter is running at higher duty cycle values the PV panel is outputting very
high currents, close to the short-circuit value. Since the panel does have a finite amount of power
it can produce this high current causes the panel’s output voltage to become much lower. This
high current, low voltage output characteristic effectively limits the voltage regulation of the
converter by not allowing the circuit the power it needs to properly step down the output voltage
to the expected level.
The second attribute of the converter that needed to be tested was the circuit’s efficiency.
Testing of the efficiency was performed with the converter being connected to the output of the
PV panel. The input current and voltage was measured using solar module analyzer PROVA
200.the output current and voltage was measured using a multimeter. The test was performed on
the converter alone without any of the current and voltage sensing technologies in place. The
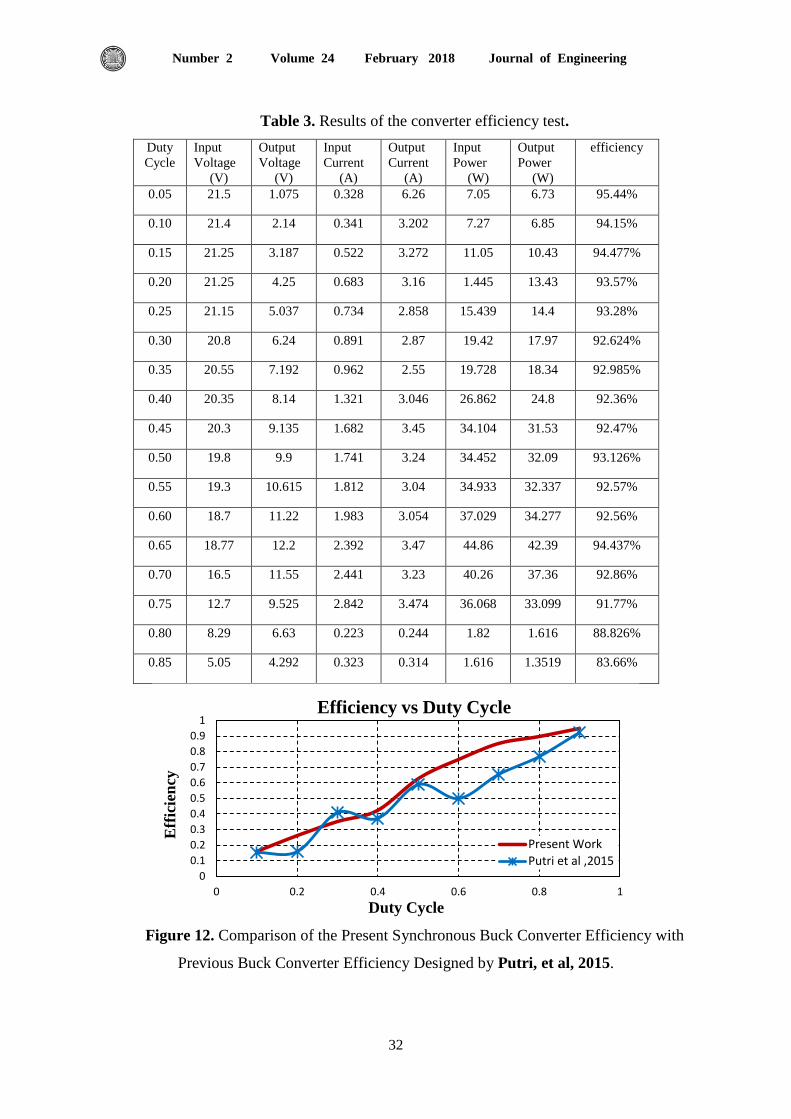
results of the efficiency test can be seen in Fig.11and Table 3.
There are a few things to note about Fig.11. First of all is that the effective result for a
duty cycle of 95% is not included in the graph. This is simply because the result is so much
lower than the others that it makes the graph harder to see, the result can still be seen in Table 3.
The second thing to notice about the graph is that the efficiencies are highest when the duty cycle
is lowest. This was expected due to the large inductance values. The final and most compelling
aspect of the graph is the almost uniform efficiency over the band of duty cycles that the MPPT
system will use on most normal days. This band covers the duty cycles from 5% to 75%. Over
this area, there is a minimum efficiency of 92.4% and a maximum of 95.4%.
Journal of Engineering Volume 24 February 2018 Number 2
24
Fig.12 indicates the comparison of the Present Synchronous Buck Converter Efficiency
with Previous Buck Converter Efficiency Designed by Putri, et al, 2015. The present converter
efficiency is clearly higher than the previous design, this is related to the losses caused by the
diode in buck converter design while in present synchronous buck converter design using Mosfet
instead of diode reduced losses and thus improved efficiency.
6.2 The MPPT Control
The MPPT system was tested over a variety of situations. The algorithm is implemented by
connecting the 50w solar panel to buck converter. The duty cycle of this converter is controlled
by the Arduino microcontroller. The same panel was then connected to a solar analyzer
PROVA 200A, which has a fixed internal resistance. The value of this resistance was set so that
the panel will be able to output the maximum power as described in the PV panel manual. The
resistance was calculated by taking the rated voltage at maximum power (VMP) of the panel
(17.5V) and dividing it by the rated current at maximum power (Imp) of the panel (2.9A). The
voltage and current sensor send the information to the microcontroller to run the MPPT system.
These values for panel were then multiplied together to obtain the power output of panel, and
then compare it with the values that PROVA200 calculated
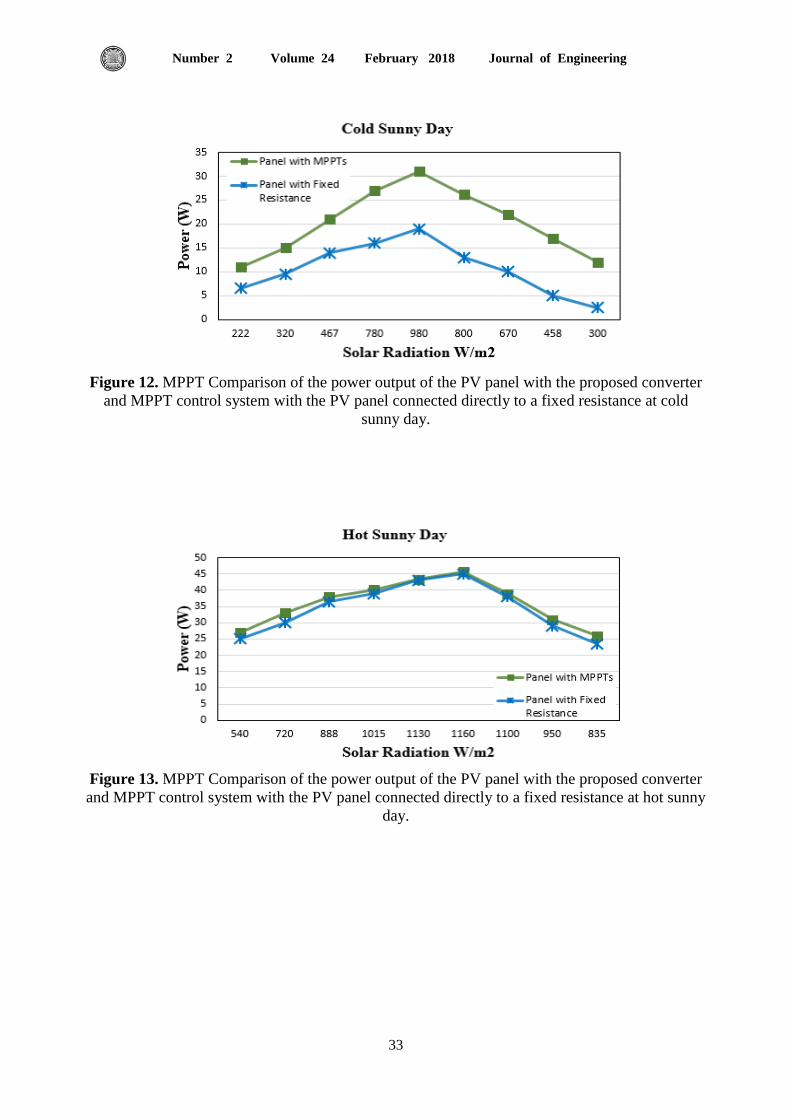
The first test was performed on a cold sunny day. The results of this test can be seen in
Fig13. In this Figure, the system ran for almost a full day when there were almost no clouds in
the sky and the temperature was 16˚C. A system reset as described before can again be seen at
the very beginning of this graph. The Figure also shows a great improvement when using the
system compared to using a fixed resistance. A notable aspect of this Figure was how much of
an improvement there was when the system was at maximum power output when the sun is at
its highest point in the sky. This large improvement was due to the test being performed during
a winter month (2016/11/21).
In the winter month, the sun is at a lower angle in the sky so it is not hitting the PV panel
dead on. This causes less light to be absorbed by the panel that would be during a summer
month. The lower light absorption due to the angle can also be seen in that the maximum power
output barely exceeds 30 watts when the panel is rated at 50watts
The second test was performed on a hot sunny day. The results of this test can be seen in
Fig.14. In this Figure, the system was run for almost a full day when the sky was clear and the
temperature was41˚C. This Figure shows the same results seen in Fig.13 when there was a
great improvement when using the MPPT system compared to using a fixed resistance. A
notable aspect of this figure was the two curves almost are identical at the peak of these curves.
This was related to the test being performed during a summer month (2016/9/15) when the sun
is hitting the panel directly and the PV panel was output putting the maximum rated power.
The MPPT system curve was identical with fixed resistance curve at peak points because the
fixed resistance was implemented according to the values of voltage and current at maximum
power. While the MPPT circuit performed better during all other times of the day. It had been
the same performance as the fixed resistance over the time when the panel was operating at its
rated power output. This can be noticed during the interval when the sun was at the highest
point in the sky and the amount of radiation was at its biggest values. The values of voltage and
current at maximum power are finite and cannot be exceeded by the tracking circuit.
A second notable thing about Fig.14 was that the peak point or the highest power that the
solar panel was produced at 1160W/m2. This was because the incident angle of the sun in the
summer months or this day of the year is higher than the winter month.
Journal of Engineering Volume 24 February 2018 Number 2
25
7. CONCLUSION
The PV solar module output power carried to a load can be maximized using MPPT control
systems, which consist of a power converter to interface the photovoltaic output to the load, and
a control unit, which drives the power converter such that it extracts the maximum power from a
PV solar module. In this research, a low cost, low power consumption MPPT system for battery
charging has been developed and tested. The system consists of a high efficiency, Buck
converter and a microcontroller-based unit which controls the DC/DC. The experimental results
show that the use of the proposed MPPT control increases the PV output power; hence increases
the overall solar system efficiency. The synchronous Buck converter test results used in this
design showed high converter efficiency up to 95% of the power produced from the solar
module, which intern reduced the power loss because of the power transfer process from PV
module to the loads.
REFERENCES
Dinçer, F., and Meral, M.E., 2010. Critical factors that affect the efficiency of solar cell.
Smart Grid and Renewable Energy SGRE, 1 pp.47-50.
Diab, H.,2012. Intelligent maximum power tracking and inverter hysteresis current
control of Grid-connected PV system. M.Sc. Thesis. International Conference on
Advances in Power Conversion and Energy Technologies APCET.
Durfee, W., 2011. Arduino microcontroller guide. The university of Minnesota. [online]
Available at WWW.me.umn.edu/courses/me2011/arduino/.
Elbaset, A. A., Hussein, A. E. E., Brishu, A., and Mostafa, R M., 2014. Implementation
of a PIC-based, photovoltaic maximum power point tracking control system.
International Journal of Emerging Technology and Advanced Engineering IJETAE, 4(5)
pp. 392-401.
Geetha, D. K., and Pramila, P., 2016. A Survey on Efficiency in PV Systems with DC-
DC Converter. Communications on Applied Electronics CAE.6(1)
Gibb, A. M.,2010. New media art, Design and the Arduino microcontroller: a malleable
tool. M.Sc Thesis, School of Art and Design, PrattbInstitute.
Hamzescu, M. R., and Oprea, S.,2013. Practical Guide to Implementing Solar Panel
MPPT Algorithms. Microchip Technology Inc.
Hiwale, A. S., Patil, M. V., and Vinchurkar, H.,2014. An efficient MPPT solar charging
controller. International Journal of Advanced Research in Electrical, Electronics and
Instrumentation Engineering IDAREEJE, 3(7).
Hohm, D. P., and Ropp, M. E., 2003. Comparative study of maximum power point
tracking algorithms. John Wiley & Sons, pp. 47-62.
Klein, J., 2006. Synchronous buck MOSFET loss calculations with Excel model.
Fairchild Semiconductors.
Meekhun, D., Boitier, V., Dilhac, J.M., 2011. Buck converter design for Photovoltaic
generators with super capacitor energy storage. International Conference on Renewable
Energies and Power Quality ICREPQ’11.1(9)
Mwinyiwiwa, B. M. M., 2013. Dc bus voltage regulator for Renewable Energy based
microgrid application. International Journal of Electrical, Computer, Energetic,
Electronic and Communication Engineering, 7(12).
Journal of Engineering Volume 24 February 2018 Number 2
26
Panda, A.K., and Aroul, K., 2006. A Novel Technique to Reduce the Switching Losses in
a Synchronous Buck Converter. International Conference of Power Electronics, Drives
and Energy Systems PEDES. Pp.1-5.
Putri, R.I., Rifa’i, M., Adhisuwiginjo, S., 2015. Design of Buck Converter For
Photovoltaic System Applications. Proceeding Conference on Applied Electromagnetic
Technology AEMT.
Xuejun, L., 2004. An improved perturbation and observation maximum power point
tracking algorithm for PV panels .M.Sc. Thesis. Concordia University Canada.
NOMENCLATURE
: The average radiation on the tilted surface, W/m2
A: The idealist factor for the p-n junction.
DC = direct current, dimensionless
Ego: The band-gap energy of the semiconductor used in solar cells module.
ID: The diode saturation current, A
IMPP = Current at maximum power point, A
Io: The reverse saturation current, A.
Ior: The saturation current at Tr, A.
Iph: The generated current of solar cells module, A
IPV: The output photovoltaic cell current, A
IPV = terminal current, A
Ish = short circuit current, A
KB: The Boltzmann's constant in Joules per Kelvin, 1.38*10-23 J/k.
KI: The short circuit current temperature coefficient.
MPP = maximum power point, dimensionless
MPPT = maximum power point tracking, dimensionless
P = output power of the solar module, W
PCB = printed circuit board, dimensionless
PWM = pulse width modulation, dimensionless
q: The charge of the electron in Coulombs, 1.6*10-19C.
RP: Parallel resistance, Ω
RS: Series resistance, Ω
T: The temperature, Tr: The reference temperature, Ko.
V = output voltage of the solar module, V
VD: The diode voltage, V
VMPP = voltage at maximum power point, V
Voc = open circuit voltage, V
VPV: The output photovoltaic cell voltage, V
VPV = terminal voltage, V
Journal of Engineering Volume 24 February 2018 Number 2
27
Table 1. Module Specifications at STC as Presented by the Manufacturer.
Rated Power 50 W
Voltage at Maximum Power ( V max ) 17.5 V
Current at Maximum Power ( I max ) 2.9 A
Open Circuit Voltage ( Voc ) 22 V
Short Circuit Current ( I sh ) 3.1 A
Total Number of Cells in Series 36
Weight 5.6 Kg
Table 2. DC-DC Converter Parameters.
Component Description
MOSFET IRF3205
MOSFET driver IRS2104
Inductor L 47 mH
Capacitor CO 220 µF
Switching frequency 50 KHz
Figure 1. I-V Characteristics of the PV and a resistive load, Elbaset, et al., 2014.
Journal of Engineering Volume 24 February 2018 Number 2
28
Figure 2. Single-diode circuit model of PV cell, Elbaset, et al., 2014.
Figure 3. Synchronous Buck Converter, Coder-tonic, 2016.
Figure 4. Synchronous Buck Converter Waveforms, Coder-tonic, 2016.
Journal of Engineering Volume 24 February 2018 Number 2
29
Figure 5. Sign of dP/dV at different positions of the power characteristic curve, Elbaset, et al.,
2014.
Figure 6. Perturb and Observe Flow Chart, Tofoli, et al., 2015.
Journal of Engineering Volume 24 February 2018 Number 2
30
Figure 7. Photograph of the outdoor testing setup (a) front view, (b) side view (c) Pivot Mounts
for Solar Panel.
Figure 8. Schematic hardware of the proposed MPPT.
Journal of Engineering Volume 24 February 2018 Number 2
31
Figure 9. Buck Converter Lab test on the left and PWM output signal from the converter.
Figure 10. Calculated and Experimental Results of Voltage Regulation.
Figure 11. Efficiency of the Buck DC-DC Converter.
0
0.2
0.4
0.6
0.8
1
1.2
0.1 0.2 0.3 0.4 0.5 0.6 0.7 0.8 0.9 1
Volt
age
Reg
ula
tion
Duty Cycle
Voltage Regulation vs.Duty Cycle
0.82
0.84
0.86
0.88
0.9
0.92
0.94
0.96
0.98
1
0.1 0.2 0.3 0.4 0.5 0.6 0.7 0.8 0.9
Eff
icie
ncy
Duty Cycle
Efficiency vs Duty Cycle
Journal of Engineering Volume 24 February 2018 Number 2
32
Table 3. Results of the converter efficiency test.
Duty
Cycle
Input
Voltage
(V)
Output
Voltage
(V)
Input
Current
(A)
Output
Current
(A)
Input
Power
(W)
Output
Power
(W)
efficiency
0.05 21.5 1.075 0.328 6.26 7.05 6.73 95.44%
0.10 21.4 2.14 0.341 3.202 7.27 6.85 94.15%
0.15 21.25 3.187 0.522 3.272 11.05 10.43 94.477%
0.20 21.25 4.25 0.683 3.16 1.445 13.43 93.57%
0.25 21.15 5.037 0.734 2.858 15.439 14.4 93.28%
0.30 20.8 6.24 0.891 2.87 19.42 17.97 92.624%
0.35 20.55 7.192 0.962 2.55 19.728 18.34 92.985%
0.40 20.35 8.14 1.321 3.046 26.862 24.8 92.36%
0.45 20.3 9.135 1.682 3.45 34.104 31.53 92.47%
0.50 19.8 9.9 1.741 3.24 34.452 32.09 93.126%
0.55 19.3 10.615 1.812 3.04 34.933 32.337 92.57%
0.60 18.7 11.22 1.983 3.054 37.029 34.277 92.56%
0.65 18.77 12.2 2.392 3.47 44.86 42.39 94.437%
0.70 16.5 11.55 2.441 3.23 40.26 37.36 92.86%
0.75 12.7 9.525 2.842 3.474 36.068 33.099 91.77%
0.80 8.29 6.63 0.223 0.244 1.82 1.616 88.826%
0.85 5.05 4.292 0.323 0.314 1.616 1.3519 83.66%
Figure 12. Comparison of the Present Synchronous Buck Converter Efficiency with
Previous Buck Converter Efficiency Designed by Putri, et al, 2015.
0
0.1
0.2
0.3
0.4
0.5
0.6
0.7
0.8
0.9
1
0 0.2 0.4 0.6 0.8 1
Eff
icie
ncy
Duty Cycle
Efficiency vs Duty Cycle
Present Work
Putri et al ,2015
Journal of Engineering Volume 24 February 2018 Number 2
33
Figure 12. MPPT Comparison of the power output of the PV panel with the proposed converter
and MPPT control system with the PV panel connected directly to a fixed resistance at cold
sunny day.
Figure 13. MPPT Comparison of the power output of the PV panel with the proposed converter
and MPPT control system with the PV panel connected directly to a fixed resistance at hot sunny
day.


