Embed Size (px)
Citation preview
407
Swimming Behaviour andEnergetics of Free-rangingSharks: New Directions in
Movement Analysis
David W. Sims
INTRODUCTIONINTRODUCTIONINTRODUCTIONINTRODUCTIONINTRODUCTION
There is now a general agreement that sharks, and pelagic sharks in particular,are facing widespread declines in population level due to fishing activity(Pauly et al., 2003). Recent studies suggest dramatic reductions in relativeabundance of up to 80% have occurred in as little as 15 years for some species(Baum et al., 2003; Myers et al., 2006), trends most likely linked to greatertarget catch and bycatch rates fuelled by increased demand for shark fins andmeat for human consumption. Although some fisheries assessments indicateless pronounced declines for large pelagic (Sibert et al., 2006) and coastalsharks (Burgess et al., 2006), undoubtedly they are particularly susceptible toover-harvesting on account of slow growth rates, late age at maturity andrelatively low fecundity. Many pelagic sharks are now red-listed by the World
13
Authors’ address: Marine Biological Association of the United Kingdom, The Laboratory,Citadel Hill, Plymouth PL1 2PB, UK, and School of Biological Sciences, University ofPlymouth, Drake Circus, Plymouth PL4 8AA, UK. E-mail: [email protected]
Swimming Behaviour and Energetics of Free-ranging Sharks
408 Fish Locomotion: An Eco-Ethological Perspective
Conservation Union, with some now at a fraction of their historical biomass(Jackson et al., 2001).
Ideally the sustainable management of shark populations requiresdetailed knowledge of how individuals within a species distribute themselvesin relation to their environment, that is with respect to physical andbiological resources. The spatial distribution of a shark species will beinfluenced by how swimming behaviour (linked to motivational and energyrequirements) affects rates of key movements, such as search strategies andencounter rates with prey, the location of mates and timing of courtship,and occupation times in preferred habitats. Therefore, day-to-day changesin swimming movement and behaviour will influence broader scale patternsin distribution and population structure, but also signal a shark’s responseto environmental fluctuations. An ability firstly to understand and then topredict shark space-use patterns and responses to important variables shouldhelp identify the extent and dynamics of population distributions andessential habitats, ultimately providing spatial and temporal foci formanagement in relation to fishing activity and distribution.
A key problem in determining the appropriateness of management orconservation measures for highly mobile and wide-ranging species such assharks however, is that their horizontal and vertical swimming movements,behaviour and distribution patterns remain largely unknown for the majorityof species. Even the behavioural ecology of shark species’ that areencountered relatively frequently (e.g., grey reef sharks) are still onlypartially described. Thus, without knowing where and what habitats sharksoccupy, over what time scales, and what behaviour patterns drive theresulting observable changes, it is extremely difficult to determine apopulation’s spatial dynamics and ‘stock’ boundaries, or to predict howthey will respond to future environmental changes. For example, how sharks(and their prey) will respond to climate change that is predicted to increasesea surface temperatures by about 4 C over the next century is not clear,principally because swimming movements and behaviour leading to thermalhabitat selection is insufficiently well documented over the appropriatespatio-temporal scales. Equally, how sharks are distributed in relation tofishing locations and effort is important to determine, not least because ifremaining aggregations occur in areas where fishing activity is most intense,this will further exacerbate declines. Understanding these processes,therefore, relies on accurate studies of how swimming movements andbehaviour in relation to environment influence population structuring andabundance changes of sharks.
Central to this problem of not knowing where sharks are is that theyspend most, if not all, their time below the sea surface where they cannotbe observed directly or followed to elucidate movements. Until recently
409
only very coarse and simplistic data on fish movements and activities wereavailable for identifying putative fish ‘stocks’ and possible migrations(Harden Jones, 1968; Guenette et al., 2000). What we are learning from theapplication of new technologies is that fish such as sharks have complicatedspatial and temporal behavioural dynamics, characterised by daily andseasonal migrations, regional differences in behaviour, distinct habitatpreferences, and age and sexual segregation. The picture is much morebehaviourally complex than previously thought (Harden Jones, 1968).Linked to the deficiency in knowing little about shark movements andbehaviour in relation to environment is the difficulty in identifying whysuch behaviours occur when and where they do.
In behavioural ecology much has been learnt from optimality modelsseeking to reveal the decision-making processes of animals (Krebs andDavies, 1997), that is, why animals behave a certain way when faced with aset of (necessarily) changing conditions. In formulating these models it isusual to define the likely decision being made by the animal (e.g., timespent in a prey patch), then to define particular currencies (e.g., maximisenet rate of gain) and constraints (e.g., travel or handling time,environmental factors) for testing hypotheses about how these differentconstraints influence the costs and benefits of decision-making. The problemwith applying this framework to the behavioural study of sharks is that suchdecisions, currencies, and constraints may be relatively straightforward toformalise theoretically, but in practice they are very difficult to measureaccurately (if at all) for long enough time periods over which natural changesin behaviour and energetics can be recorded. Therefore, empirical tests ofoptimality models for shark behaviour are not in widespread use (Sims,2003). So how can we begin to understand what behavioural mechanismsunderlie shark movements given these logistical difficulties?
The purpose of this chapter is to introduce a new approach for analysing,interpreting and thinking about the movement and behaviour patterns offree-ranging sharks. In so doing, this paper will (i) briefly describe whattypical generalised movement patterns of free-ranging sharks have beenrecorded using electronic tags, and how this new technology hasrevolutionised shark behavioural ecology. The chapter will (ii) progress toidentify how movement types may be closely linked to habitat types andwhy, and how foraging and behavioural trade-off models have been usedrecently to test habitat selection processes in sharks. (iii) A new approachof analysing shark movement data will be described that uses methods fromstatistical physics to evaluate behavioural response in relation toenvironment. The chapter closes by providing some future perspectivesfor better understanding the behaviour patterns of wild sharks.
Swimming Behaviour and Energetics of Free-ranging Sharks
410 Fish Locomotion: An Eco-Ethological Perspective
Shark Swimming BehaviourShark Swimming BehaviourShark Swimming BehaviourShark Swimming BehaviourShark Swimming Behaviour
Recording MovementsRecording MovementsRecording MovementsRecording MovementsRecording Movements
Before the advent of acoustic, datalogging and satellite-linked transmittertags the study of wild shark behaviour was limited to brief descriptions fromdivers or from observers aboard vessels. It was in the 1960s when electronicdevices capable of emitting or transponding sound energy first came to beused to track individual sharks (Carey, 1992). Sound is the only practicalmeans of transmitting a signal through seawater over distances greater thana few metres as radio waves do not propagate sufficiently in such a conductingmedium, at least at the frequencies used in biotelemetry (Nelson, 1990;Priede, 1992). Radio transmitters can be used to track fish in shallow freshwater but through-the-water telemetry of marine fish must be made byacoustic transmission (Nelson, 1990). Ultrasonic frequencies are used (40–78 kHz) because since frequency is proportional to transducer diameter,this is an important factor in reducing the size of the transmitter (thus the‘package’ to be carried by a fish). Lower frequency transmitters of greatersize due to a larger transducer have been used to track large fish (e.g.,Carey and Scharold, 1990), whereas higher frequency tags are reserved forthe tracking of smaller species (Sims et al., 2001). A wide array of sensorswere made available for acoustic tags to transmit data on water temperature,muscle temperature, depth, cranial temperature, speed, tail beat, heartrate, and multiplexed tags were capable of transmitting sensor data for upto three channels (Carey and Scharold, 1990).
In practical terms, sound pulses emitted from a transmitter attached toa fish are received using a directional hydrophone and portable receiversuch that a vessel can follow the moves made by the transmitter, and hencethe fish, and receive any encoded signals from sensors. The main problemwith this technique for tracking large, highly migratory species that traverse10s of km per day is that tracking individual sharks continuously in theopen sea far from land becomes prohibitively expensive, especially sinceonly one at a time can be tracked by a ship. Because of this, even by the1990s there were relatively few horizontal and vertical tracks of sharksavailable for analysis, and these were understandably of short duration(hours to a few days) (e.g., Carey et al., 1982; Klimley, 1993).
The widespread availability of miniaturised data-logging computers inthe 1980s revolutionised the study of wild fish behaviour. During the early1990s dataloggers were developed that were small enough not to impedethe natural swimming behaviour of the fish but with powerful batteries andmemory sizes capable of recording and storing large amounts of high-qualitydata (termed archival data). They were also relatively cheap so large numberscould be deployed, and for commercially important species at least, tags
411
could be returned to scientists through the fishery. Early tags wereprogrammed to record pressure (depth) and later models also incorporatedtemperature and ambient light level sensors (Arnold and Dewar, 2001).Large-scale deployments on North Sea plaice (Pleuronectes platessa) (Metcalfeand Arnold, 1997) and on Atlantic bluefin tuna (Thunnus thynnus) (Blocket al., 2001) were among the first studies to successfully use this technologyfor tracking movements and behaviour of hundreds of individual fish.Studies followed that fitted depth/temperature/light-logging tags, alsoknown as data storage tags (DSTs), to sharks and other large pelagic fish(e.g., Schaefer and Fuller, 2002) revealing new patterns of behaviour.However, one drawback was that data retrieval was unpredictable since itrelied on tags being returned through developed fisheries where returnrates can vary widely depending on fishing activity in a given region, andmay even be quite low (~5–10%) (Metcalfe and Arnold, 1997).
New tracking methods using satellites were developed to provide ameans of collecting data at precise times and independent of fisheriesreturns. A study in the early 1980s showed that direct satellite tracking of ashark was feasible (Priede, 1984). In a pioneering study in the Clyde Sea offScotland, a Platform Transmitter Terminal (PTT) moulded into a largebuoyant float was attached to a large, 7-m long basking shark (Cetorhinusmaximus) via a 10-m long tether. Whenever the shark swam near the surfacethe tag was able to break the surface and transmit to Argos receivers borneon polar-orbiting satellites that estimated the tag’s geographical locationfrom these transmissions with reasonable accuracy (Taillade, 1992). Theshark was tracked moving in an approximately circular course for 17 daysnear a biologically productive thermal front (Priede, 1984). Despite thisearly success, there were no further studies to satellite track sharks for aboutanother 10 years. Tags were large therefore only the largest species such aswhale shark, Rhincodon typus (Eckert and Stewart, 2001) and basking sharkwere capable of towing these tags through water. Despite a successful attemptto satellite track smaller-bodied predatory sharks (a blue shark, Prionaceglauca) using a satellite transmitter mounted on a dorsal fin ‘saddle’(Kingman 1996), by the late 1990s the problem still largely remained: howcould open ocean fish species’ movements and behaviour be tracked atreasonable spatial resolution over longer time periods?
A solution to this problem was developed in the form of a ‘hydrid’electronic tag that combined sensor datalogging with satellite transmission(Block et al., 1998; for review see Arnold and Dewar, 2001). This tag, termeda pop-off satellite archival transmitter (PSAT) was attached to a fish ‘host’like an external parasite, during which time it recorded 61 hourly or dailywater temperature measurements (Arnold and Dewar, 2001). After a pre-programmed time the tag would release from the fish, that is ‘pop-off’,float to the surface and begin transmitting to Argos receivers that geolocated
Swimming Behaviour and Energetics of Free-ranging Sharks
412 Fish Locomotion: An Eco-Ethological Perspective
the tag’s position and received temperature data. Later generations of thesetags were increasingly capable of recording and storing larger amounts ofdata and from more sensors; pressure (depth) and light level sensorswere added in subsequent models. The narrow Argos receiver bandwidthhowever means transmitted message lengths from PSAT tags are necessarilyshort (360 ms) with relatively small amounts of data capable of beingtransmitted (32 bytes) per message. The transmission times of these tagsafter pop-off is limited due to rapid battery exhaustion, usually rangingfrom 0.5–1 month, so different methods have been employed by themanufacturers to increase rates of data recovery. Hence, for one tag type(see www.wildlifecomputers.com) comprehensive summary data in the formof histogram messages (swimming depth, water temperature, profiles ofwater temperature with depth, times of sunrise/sunset for use ingeolocation, see below) derived from archival sensor records are transmittedremotely via satellites, whereas if a tag is physically recovered the entirearchived dataset can be downloaded. For another tag type (seewww.microwavetelemetry.com), times of sunrise and sunset together withhourly temperature and pressure readings can be recorded for over a yearthen transmitted after pop-off. In this tag, a special duty cycle timer extendstransmission to one month for uploading of this archival dataset by activatingthe PTT only when Argos satellites are mostly likely to be in view of the tag.The development of PSAT tags, with the ability to geolocate a single positionof a fish remotely and track its behaviour and habitat changes (depth andtemperature) between tagging and ‘pop-off, was nothing short of arevolution in large fish ecology (see below).
Although the early findings from PSATs were impressive, in terms ofthe details they gave about horizontal movement trajectories betweentagging and pop-off, they were still quite rudimentary. PSATs at this stagewere capable of providing essentially the same locational information asthat obtained from conventional number tagging studies: that is, wherethe fish was located when tagged, and where it was after a known timeperiod (although conventional tag return rates were low by comparison).Around the end of the 90s, PSATs and DSTs became available that couldrecord not only pressure and temperature, but also ambient light level.This was important because longitude can be estimated by comparing thetime of local midnight or midday with that at Greenwich, and latitude fromestimates of day length (Wilson et al., 1992). Therefore, electronic tagscapable of recording light level could provide data amenable to calculationsof geolocation anywhere on the Earth’s surface, thereby allowingreconstruction of a fish’s movement track from data retrieved from remotelocations by Argos satellite (Block et al., 2001).
Much recent research effort has been aimed at improving accuracy ofthe estimates of light-level-derived locations of sharks and other large fish
413
during their free-ranging movements (e.g., Teo et al., 2004; Nielsen et al.,2006). However, it appears that there are distinct limits to the spatial accuracyof these estimates (60 to 180 km), such that a spatial error of only 10% of ashark’s daily movement distance renders detection of specific behaviourswithin the track prone to error (Bradshaw et al., 2007). Hence, light-levelgeolocation appears appropriate for tracking large scale movements, but isless able to resolve the specific pattern of smaller scale movements typicalof most sharks during much of their annual cycle. In view of this, researchershave re-discovered Priede’s idea of direct satellite tracking of sharks, andlike F.G. Carey pioneered in the 1990s, have begun attaching satellitetransmitting tags directly to the first dorsal fin of large sharks (Weng et al.,2005). Because many large species of shark often come to the surface (seebelow), as do many large bony fishes such as swordfish (Xiphias gladius)and ocean sunfish (Mola mola), this presents a new opportunity for resolvingmore accurately the horizontal movements of sharks across a broader rangeof space-time scales.
Horizontal MovementsHorizontal MovementsHorizontal MovementsHorizontal MovementsHorizontal Movements
Acoustic tracking provided the first data on the movements and behaviour offree-ranging sharks in relation to environment. For example, the movementsof transmitter-tagged scalloped hammerhead sharks (Sphyrna lewini) weremonitored using datalogging acoustic receivers moored along the plateau ofa seamount (Klimley et al., 1988). The departures, arrivals and occupancytimes of individual sharks were recorded and showed that individuals groupedat the seamount during the day, but departed before dusk moving separatelyinto the pelagic environment at night and returning near dawn the next day.Acoustic tracking of individual S. lewini using a vessel resolved those nocturnaltrajectories (Klimley, 1993). Individuals generally moved away from theseamount on a straight line or meandering course into deep water beforeheading back in the general direction of the seamount. Trackings however,were limited to 1–2 days so the persistence of this central place behaviourwithin an individual and among individuals across the annual cycle was notknown. Studies using the same type of technology but on smaller shark specieshave shown interesting parallels with these general behaviours of largerspecies. Small spotted catsharks (Scyliorhinus canicula) fitted with acoustictransmitters and tracked continuously for up to 2 weeks show similar patternsof central place refuging (Sims et al., 2001, 2006). Here, males and femalesremain generally inactive during the day, leaving to forage before dusk andreturning to the preferred daytime locations near dawn. The pattern ofdaytime inactivity in a small activity space centred on rock refuges andnocturnal foraging behaviour in the wider environment was a patternsustained over many months (Sims, 2003; Sims et al., 2006).
Swimming Behaviour and Energetics of Free-ranging Sharks
414 Fish Locomotion: An Eco-Ethological Perspective
The short duration of acoustic tracking of large pelagic sharks is perhapseven more of a problem when tracking individuals that were captured onlines prior to tagging. Klimley (1993) attached tags underwater to free-swimming sharks without the need for capture, but other studies requiringfish to be hooked on lines are naturally dealing with more distressed fish.Horizontal acoustic trackings of blue shark off the U.S. northwest coastshowed that in late summer and autumn they generally moved south andsoutheast offshore following tagging and release (Carey and Scharold, 1990).It was suggested this consistent pattern of movement may have been relatedto seasonal migration, but it was also recognised that in part thesemovements may be a general reaction of pelagic fish to move into deepwater offshore after being captured for tagging (Carey and Scharold, 1990).For longer trackings where the shark was tagged without the need forcapture, horizontal movements are more likely to provide insights intonatural foraging or ranging movements. For example, a white shark(Carcharodon carcharias) that was tagged feeding in the vicinity of a whalecarcass off Long Island, U.S.A., continued feeding and swimming within a3 km radius of the whale for 1.5 days (Carey et al., 1982). The shark thenmoved southwest following quite closely the 25 m isobath for a further2 days.
Before light level sensors were available on electronic tags, tagging and‘pop-off’ locations provided information on dispersal distances overtimescales much greater than was possible with acoustic telemetry. Forexample, bluefin tuna (Thunnus thynnus) fitted with PSATs off the easternU.S. coast were found to travel over 3,000 km east across the North AtlanticOcean in 2–3 months (Block et al., 1998; Lutcavage et al., 1999). In addition,the longer range movements of the white shark (Carcharodon carcharias)were generally unknown, but those aggregating around small islands in thecoastal waters of California were generally thought to remain in shelf waters,moving up and down the coast according to season. However, PSAT taggingrevealed some incredible movements of these apex predators; tagged whitesharks moved into the open ocean away from the coast and one shark madethe journey from California to Hawaii (some 3,800 km across the NorthPacific Ocean) in less than 6 months, making dives down to 700 m andexperiencing temperatures as low as 5 C (Boustany et al., 2002).
Among the first studies to use light-level intensity changes to calculatelarge-scale horizontal movements of pelagic fish were those with bluefintuna (Block et al., 2001) and basking shark (Cetorhinus maximus) (Sims et al.,2003). Reconstructed tracks of bluefin tuna tagged off North Carolina,U.S.A., showed movements between foraging grounds in the western Atlanticprior to transatlantic migrations into the Mediterranean Sea for spawning.Bluefins were also shown to dive to over 1,000 m depth during theseexcursions (Block et al., 2001). The question of diving activity and what
415
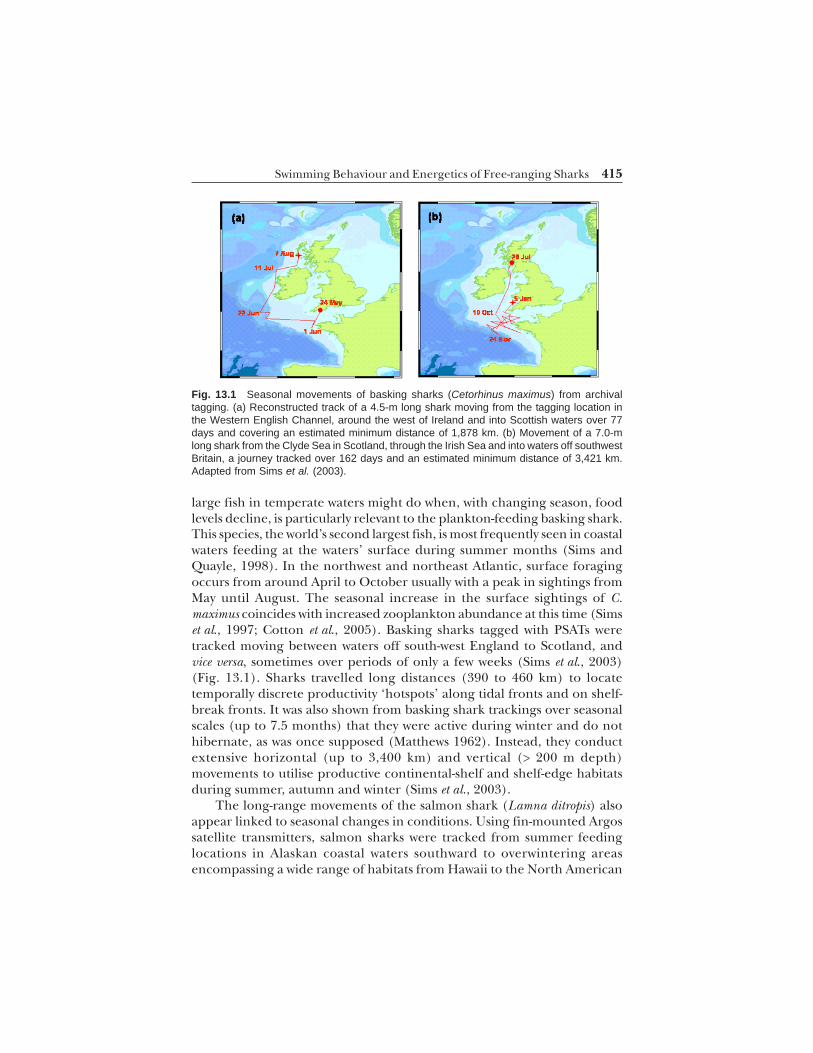
large fish in temperate waters might do when, with changing season, foodlevels decline, is particularly relevant to the plankton-feeding basking shark.This species, the world’s second largest fish, is most frequently seen in coastalwaters feeding at the waters’ surface during summer months (Sims andQuayle, 1998). In the northwest and northeast Atlantic, surface foragingoccurs from around April to October usually with a peak in sightings fromMay until August. The seasonal increase in the surface sightings of C.maximus coincides with increased zooplankton abundance at this time (Simset al., 1997; Cotton et al., 2005). Basking sharks tagged with PSATs weretracked moving between waters off south-west England to Scotland, andvice versa, sometimes over periods of only a few weeks (Sims et al., 2003)(Fig. 13.1). Sharks travelled long distances (390 to 460 km) to locatetemporally discrete productivity ‘hotspots’ along tidal fronts and on shelf-break fronts. It was also shown from basking shark trackings over seasonalscales (up to 7.5 months) that they were active during winter and do nothibernate, as was once supposed (Matthews 1962). Instead, they conductextensive horizontal (up to 3,400 km) and vertical (> 200 m depth)movements to utilise productive continental-shelf and shelf-edge habitatsduring summer, autumn and winter (Sims et al., 2003).
The long-range movements of the salmon shark (Lamna ditropis) alsoappear linked to seasonal changes in conditions. Using fin-mounted Argossatellite transmitters, salmon sharks were tracked from summer feedinglocations in Alaskan coastal waters southward to overwintering areasencompassing a wide range of habitats from Hawaii to the North American
Fig. 13.1 Seasonal movements of basking sharks (Cetorhinus maximus) from archivaltagging. (a) Reconstructed track of a 4.5-m long shark moving from the tagging location inthe Western English Channel, around the west of Ireland and into Scottish waters over 77days and covering an estimated minimum distance of 1,878 km. (b) Movement of a 7.0-mlong shark from the Clyde Sea in Scotland, through the Irish Sea and into waters off southwestBritain, a journey tracked over 162 days and an estimated minimum distance of 3,421 km.Adapted from Sims et al. (2003).
Swimming Behaviour and Energetics of Free-ranging Sharks
416 Fish Locomotion: An Eco-Ethological Perspective
Pacific coast (Weng et al., 2005). Some individuals, however, overwintered inAlaskan waters and in so doing experienced water temperatures between 2and 8 C and dived no deeper than 400 m. Those sharks migrating south bycontrast, occupied depths where sea water temperatures were up to 24 C andregularly dived into cooler waters to depths over 500 m (Weng et al., 2005).This illustrates that in our attempts to understand the movements andbehaviour of free-ranging sharks it is as important to consider swimmingmovements in the vertical as well as horizontal plane.
Vertical MovementsVertical MovementsVertical MovementsVertical MovementsVertical Movements
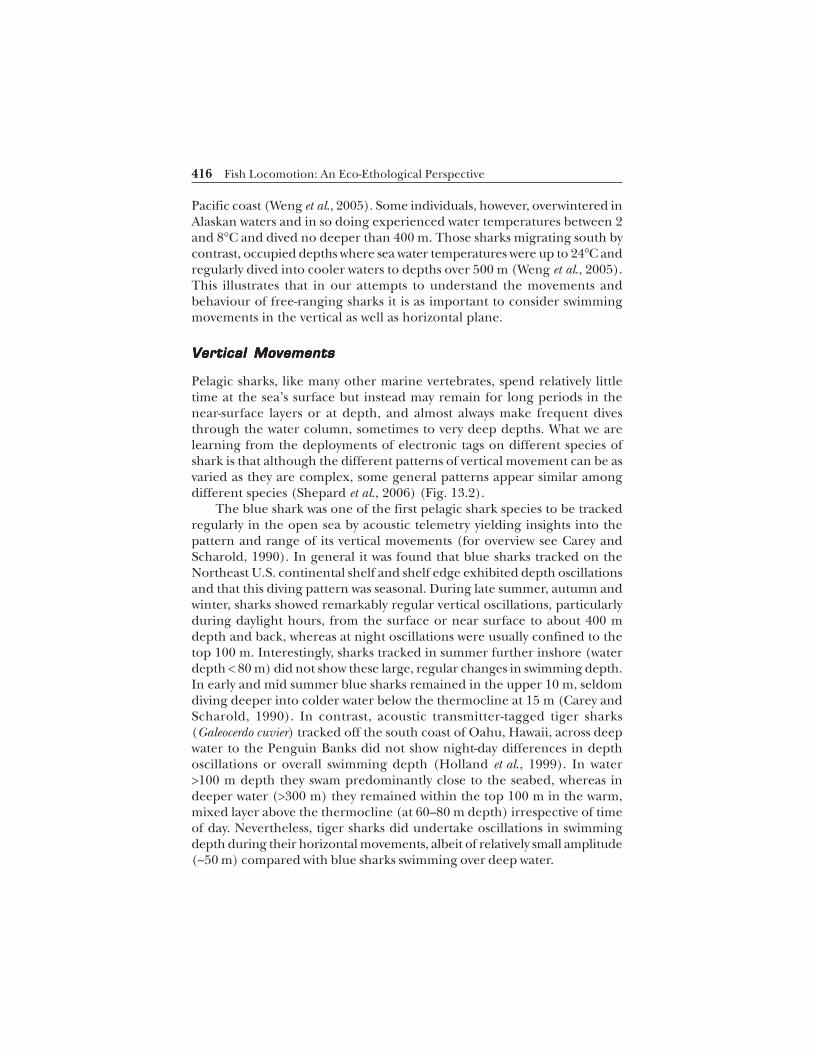
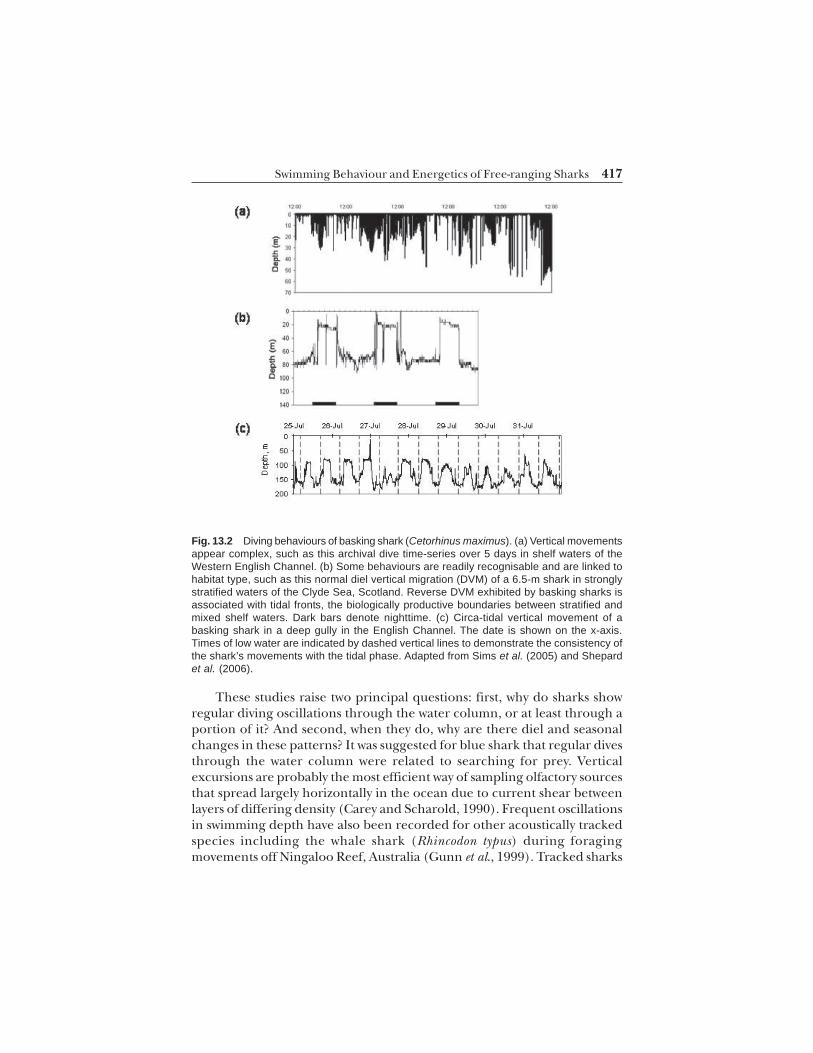
Pelagic sharks, like many other marine vertebrates, spend relatively littletime at the sea’s surface but instead may remain for long periods in thenear-surface layers or at depth, and almost always make frequent divesthrough the water column, sometimes to very deep depths. What we arelearning from the deployments of electronic tags on different species ofshark is that although the different patterns of vertical movement can be asvaried as they are complex, some general patterns appear similar amongdifferent species (Shepard et al., 2006) (Fig. 13.2).
The blue shark was one of the first pelagic shark species to be trackedregularly in the open sea by acoustic telemetry yielding insights into thepattern and range of its vertical movements (for overview see Carey andScharold, 1990). In general it was found that blue sharks tracked on theNortheast U.S. continental shelf and shelf edge exhibited depth oscillationsand that this diving pattern was seasonal. During late summer, autumn andwinter, sharks showed remarkably regular vertical oscillations, particularlyduring daylight hours, from the surface or near surface to about 400 mdepth and back, whereas at night oscillations were usually confined to thetop 100 m. Interestingly, sharks tracked in summer further inshore (waterdepth < 80 m) did not show these large, regular changes in swimming depth.In early and mid summer blue sharks remained in the upper 10 m, seldomdiving deeper into colder water below the thermocline at 15 m (Carey andScharold, 1990). In contrast, acoustic transmitter-tagged tiger sharks(Galeocerdo cuvier) tracked off the south coast of Oahu, Hawaii, across deepwater to the Penguin Banks did not show night-day differences in depthoscillations or overall swimming depth (Holland et al., 1999). In water>100 m depth they swam predominantly close to the seabed, whereas indeeper water (>300 m) they remained within the top 100 m in the warm,mixed layer above the thermocline (at 60–80 m depth) irrespective of timeof day. Nevertheless, tiger sharks did undertake oscillations in swimmingdepth during their horizontal movements, albeit of relatively small amplitude(~50 m) compared with blue sharks swimming over deep water.
417Swimming Behaviour and Energetics of Free-ranging Sharks
These studies raise two principal questions: first, why do sharks showregular diving oscillations through the water column, or at least through aportion of it? And second, when they do, why are there diel and seasonalchanges in these patterns? It was suggested for blue shark that regular divesthrough the water column were related to searching for prey. Verticalexcursions are probably the most efficient way of sampling olfactory sourcesthat spread largely horizontally in the ocean due to current shear betweenlayers of differing density (Carey and Scharold, 1990). Frequent oscillationsin swimming depth have also been recorded for other acoustically trackedspecies including the whale shark (Rhincodon typus) during foragingmovements off Ningaloo Reef, Australia (Gunn et al., 1999). Tracked sharks
Fig. 13.2 Diving behaviours of basking shark (Cetorhinus maximus). (a) Vertical movementsappear complex, such as this archival dive time-series over 5 days in shelf waters of theWestern English Channel. (b) Some behaviours are readily recognisable and are linked tohabitat type, such as this normal diel vertical migration (DVM) of a 6.5-m shark in stronglystratified waters of the Clyde Sea, Scotland. Reverse DVM exhibited by basking sharks isassociated with tidal fronts, the biologically productive boundaries between stratified andmixed shelf waters. Dark bars denote nighttime. (c) Circa-tidal vertical movement of abasking shark in a deep gully in the English Channel. The date is shown on the x-axis.Times of low water are indicated by dashed vertical lines to demonstrate the consistency ofthe shark’s movements with the tidal phase. Adapted from Sims et al. (2005) and Shepardet al. (2006).
418 Fish Locomotion: An Eco-Ethological Perspective
made regular dives through the water column from the surface to near thebottom at 60–80 m. It was suggested the sharks were searching the watercolumn for food since the dives were not related closely to changes inhydrographic features.
The use of data storage tags (DSTs) and satellite-linked archivaltransmitters on sharks has provided more detailed temporal informationon their depth utilisations over longer time periods. Viewed at this highresolution over days to months, longer term and sometimes quite differentpatterns in shark swimming behaviour are evident. For example, DSTtracking of school shark (Galeorhinus galeus) showed vertical rhythms inswimming depth over the diel cycle. In continental shelf waters off southernAustralia G. galeus spent the day at depth before ascending at night intoshallower water often for several hours (West and Stevens, 2001). When G.galeus was in deeper water off the continental shelf this pattern wasmaintained, with descent at dawn to depths of up to 600 m before ascent toshallower waters at dusk. In maintaining this pattern it appears the schoolshark exhibits what is termed a ‘normal’ diel vertical migration (DVM)(dusk ascent, dawn descent) for much of the time when ranging andforaging off southern Australia. This pattern may represent prey trackingof vertically migrating populations of squid for example, that also undertakesimilar daily vertical movements as those observed in school sharks (Westand Stevens, 2001).
By contrast, white sharks tagged and tracked off southern Australiaappear to exhibit at least three different vertical movement patterns. Apattern of regular vertical oscillations from about 50 m depth to the surfaceirrespective of day or night was apparent during directed westerly movementsof white sharks (Bruce et al., 2006). These swimming movements werereminiscent of blue shark oscillations during straight-line movements.However, this pattern was not maintained when ranging within the SpencerGulf inlet where bottom-oriented behaviour with few ascents to the surfacewas the dominant pattern. Furthermore, a third pattern comprised dielvertical movements with shallow depths between the surface and 25 m depthoccupied principally during the day, and depths around 50 m selected atnight (Bruce et al., 2006). This diel vertical movement pattern occurredwhen the white shark was present at offshore islands. Therefore, it appearsthat large sharks display different vertical movements as a function of habitatand also in response to differing prey distribution, abundance andavailability.
419
Habitat SelectionHabitat SelectionHabitat SelectionHabitat SelectionHabitat Selection
Central to an understanding of shark movements is identification of the roleof environment and habitat characteristics in shaping movement andbehaviour patterns. For such an understanding, it becomes necessary toinvestigate closely the links between different behaviour types andconcomitant changes in the environment, and to try to separate habitat selectionor preferences from habitat correlations. Detecting selection of sharks andother animals for particular habitats is difficult since movements generallyconvey little about why those habitats have been selected (Kramer et al., 1997).Simple mapping of shark movements on to environmental fields, for examplea horizontal trajectory overlaid on a satellite remote-sensing map of sea surfacetemperature, provides a view of where and in what type of habitat the individualwas located, but actually tells us nothing in itself about the habitat selectionprocesses underlying the movement; that is, why the habitat was selectedfrom those habitats available. To understand why sharks go where they do, itbecomes important to be able to move beyond simple shark-habitatcorrelations, and to monitor where the sharks are in comparison with wherethey are not. By comparing the habitat types where sharks are located to thetypes of other (presumably) equally available habitats where they are notlocated at a given time, it allows us to delve into the dynamics of habitatselection. As mentioned previously (see Introduction), an understanding ofhabitat choices moves us closer to being able to predict the movements andbehaviour of sharks when faced with a particular set of environmentalconditions.
There is a growing literature documenting the locations of sharks throughtime in relation to different habitat types encountered. Generally, the aimhas been to describe the habitat correlations of the various species studied totry to gain a mechanistic insight into what may control movement patterns.Less attention however has been paid to comparing occupied habitat typeswith other habitats available to detect potential differences regarding bioticand abiotic factors, such as prey presence or water temperature. In addressingthe former, horizontal trajectories have been plotted on maps of sea surfacetemperature (e.g., Priede, 1984; Skomal et al., 2004; Weng et al., 2005; Bonfilet al., 2005), bathymetry (e.g., Holland et al., 1999; Sims et al., 2003),geomagnetic anomalies (Carey and Scharold, 1990) and primary (Sims et al.,2003) and secondary productivity (Sims and Quayle, 1998; Sims et al., 2006).Vertical movements of sharks have been mapped on to variations in verticalthermal structure (e.g., Carey and Scharold, 1990), in relation to seabeddepth (e.g., Gunn et al., 1999) and with respect to concentrations of preyspecies (Sims et al., 2005) (Fig. 13.2b). Assessing movements in relation toprey is perhaps one of the most useful environmental fields to use, at leastover the short-term, because the distribution of prey is a key factor influencing
Swimming Behaviour and Energetics of Free-ranging Sharks
420 Fish Locomotion: An Eco-Ethological Perspective
predator movements. It is expected that clear and persistent changes inswimming movements should be related to specific changes in preyabundance and availability.
Acoustic tracking studies of large pelagic fish have shown verticalmovements linked closely to changes in prey distribution over the diel cycle.Depth movements of a large swordfish (Xiphias gladius) were related to anechogram made with a 50-kHz echosounder (Carey, 1992). A denseassemblage of prey organisms, probably squid and fish, produced a heavyband of echos (termed a sound-scattering layer, SSL) near the surface atnight, where the swordfish also occurred. About an hour before sunrise ataround 04: 30h, the SSL gradually descended from surface waters to about300 m. The swordfish appeared to track this change in SSL depth closelyduring the short tracking, probably preying on squid and fish both nearthe surface at night and at depth during the day (Carey, 1992). Similarly, abigeye tuna (Thunnus obsesus) was tracked gradually moving with thedownward migrating SSL from 100 to 350 m, and remaining within it untilearly morning after which the tuna moved upward into warm, shallow waters,perhaps for reasons related to behavioural thermoregulation rather thanfeeding opportunities (Holland et al., 1990; see Bernal et al., chapter XX).
Movements of sharks have been linked with long-term diel verticalmigration of prey. The vertical movements of basking sharks recorded witharchival tags in the Northeast Atlantic were found to be consistent withthose associated with foraging on diel vertically migrating zooplankton prey(Sims et al., 2005). In deep, thermally stratified waters sharks exhibitednormal diel vertical migration (nDVM), comprising a dusk ascent intosurface waters followed by a dawn descent to deeper depths. Thiscorresponded closely with migrating sound-scattering layers made up ofCalanus and euphausiids that moved into surface waters at dusk, returningto depths of 50–80 m at dawn where they remained during the day untildusk. Basking sharks occupying thermally stratified waters were recordedundertaking a nDVM pattern tracking zooplankton movements for up to amonth before moving to new areas or changing their vertical movementpattern. Interestingly, the vertical pattern of movement was found to varybetween different oceanographic habitat types. In contrast to basking sharksin stratified waters, individuals occupying shallow, inner-shelf areas nearthermal fronts conducted reverse DVM, comprising a dusk descent to depthsbetween 20–80 m before ascending at dawn into surface waters where theyremained during the day (Sims et al., 2005). This difference in sharkswimming movements in fronts compared with thermally stratified waterswas due to induction of reverse DVM in Calanus by the presence of highconcentrations of chaetognaths (important predators of calanoid copepods)at the surface during the night, followed by downward migrations ofchaetgnaths during the day (i.e., the normal DVM of the predators produced
421
a behavioural switch to reverse DVM in the copepod prey). Other changes invertical movements of basking sharks are known from the Northeast Atlantic.Dive patterns of one cycle per day (e.g., DVM) give way to depth oscillationsof two cycles per day, in response to tidally-mediated migrations of zooplankton,when basking sharks moved into strongly tidal waters of the English Channel(Shepard et al., 2006) (Fig. 13.2c).
Relating shark movements to environmental fields such as those in theaforementioned studies has revealed much about the diversity of behaviourspresent in the wild. It has provided insights into what environmental factorsmay influence observed patterns. However, the findings of such studiesoften represent simple habitat correlations that may or may not be theproduct of habitat selection. In such studies, random correlation may bean equally likely explanation of the observed patterns because other areasnot occupied by the shark are not included in the analysis, only where theshark occurs. The question is, what is it about the location where the sharkoccurs that renders it different from the surrounding habitats that are notapparently selected? Explicit tests of habitat preferences of sharks are muchless common in the literature, although some useful recent examples suggestwhat is possible to gain from such an approach.
The general approach used in preference-testing studies is to comparethe amount of time spent or prey encountered in each habitat as a functionof the movement track observed, compared with predicted values for thatindividual based on random walks through the same environment. Thehabitat preferences of tiger sharks in a shallow, seagrass ecosystem inAustralia were examined by acoustic tracking and animal-borne cameras(Crittercams) as they moved through different habitats (Heithaus et al.,2002). Tracks of actual sharks were used to estimate the proportion of timespent in two different habitats, shallow and deep. These were then comparedwith habitats visited during random walks. To produce a random walk, thedistances moved between 5-minute position fixes in an actual tiger sharktrack, termed the move step lengths, were randomised to form a new trackof the same length, but with a new direction of travel angle assigned toeach move step taken from the distribution of commonly observed travelangles of tiger shark tracks. A particular strength of this approach is thatactual shark tracks were each compared with 500 random tracks sosignificance levels of actual versus random could be calculated. The analysisshowed that although there was individual variation in habitat use, tigersharks preferred shallow habitat where prey was more abundant (Heithauset al., 2002).
Assessing the habitat selection of sharks in relation to dynamic prey‘landscapes’ has been a more difficult goal to achieve. The principal reasonfor this is that temporally changing prey-density fields are not available forthe vast majority of marine predators. One of the few cases where this is
Swimming Behaviour and Energetics of Free-ranging Sharks
422 Fish Locomotion: An Eco-Ethological Perspective
possible however, is for filter-feeding sharks. As mentioned previously, baskingsharks feed selectively on large calanoid copepods in specific assemblages ofzooplankton (Sims and Quayle, 1998). In the north Atlantic the ContinuousPlankton Recorder (CPR) survey has for over 50 years undertaken broad-scale measurements of zooplankton abundance to species level (Richardsonet al., 2005). The large-scale spatial coverage of individual plankton samples(minimum spatial and temporal resolutions of 56 x 36 km and 14 days,respectively) means it was possible to relate the broad-scale foragingmovements of satellite-tracked basking sharks to the spatio-temporalabundance of their copepod prey. Basking shark tracks were mapped ontotime-referenced copepod abundance fields in a recent study, with the amountof zooplankton ‘encountered’ estimated for each movement track (Sims et al.,2006). The total prey encountered along each track was compared with thatencountered by 1000 random walks of model sharks, where the move stepstaken by each random walker were drawn from the distribution of move stepsobserved for real sharks. The study showed that movements of adult and sub-adult basking sharks yielded consistently higher prey encounter rates than90% of random-walk simulations. This suggests that the structure ofmovements undertaken by basking sharks were aimed at exploiting preferredhabitats with the richest zooplankton densities available across their range.
Behavioural Trade-offs and EnergeticsBehavioural Trade-offs and EnergeticsBehavioural Trade-offs and EnergeticsBehavioural Trade-offs and EnergeticsBehavioural Trade-offs and Energetics
So far in this discussion we have generally considered only single factors at atime, such as prey or water temperature, to be influencing the behaviourpattern of sharks. Necessarily when these simple relationships break down,we suggest other factors to test. Assessing changes in shark swimmingmovements due to a single factor in piecemeal fashion is likely to be asimplification in our approach, one that makes it easier for us to identifyapparent relationships more readily than if many factors are appraised.However, as we can all appreciate, sharks move through complexenvironments and their behaviours are in response to a myriad of changinginfluences. So, how can we investigate the effects of co-varying factors onshark behaviour? And if we can reliably, what do such studies show?
Although studies of the effects of multiple factors on habitat selectionbehaviour of birds and teleost fish under captive or semi-natural conditionshave been investigated in carefully designed experiments, similar work onsharks is generally lacking. In part this is due to the logistical problemsassociated with keeping large sharks in sufficiently large aquaria such thatexperiments can be reliably undertaken. But in addition, it is due to thecomprehensive knowledge needed of the natural habitats where sharksoccur to begin such studies, how different factors may co-vary to influenceshark movement patterns, and also the energetic costs of movement and
423
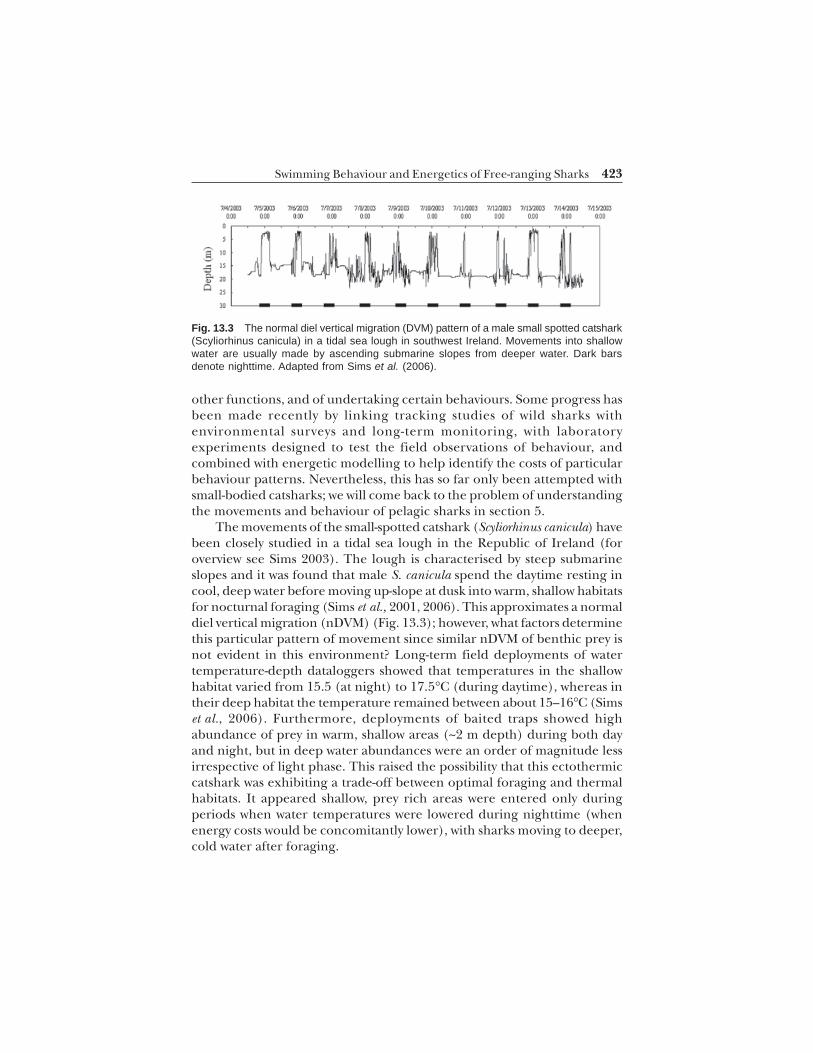
Fig. 13.3 The normal diel vertical migration (DVM) pattern of a male small spotted catshark(Scyliorhinus canicula) in a tidal sea lough in southwest Ireland. Movements into shallowwater are usually made by ascending submarine slopes from deeper water. Dark barsdenote nighttime. Adapted from Sims et al. (2006).
Swimming Behaviour and Energetics of Free-ranging Sharks
other functions, and of undertaking certain behaviours. Some progress hasbeen made recently by linking tracking studies of wild sharks withenvironmental surveys and long-term monitoring, with laboratoryexperiments designed to test the field observations of behaviour, andcombined with energetic modelling to help identify the costs of particularbehaviour patterns. Nevertheless, this has so far only been attempted withsmall-bodied catsharks; we will come back to the problem of understandingthe movements and behaviour of pelagic sharks in section 5.
The movements of the small-spotted catshark (Scyliorhinus canicula) havebeen closely studied in a tidal sea lough in the Republic of Ireland (foroverview see Sims 2003). The lough is characterised by steep submarineslopes and it was found that male S. canicula spend the daytime resting incool, deep water before moving up-slope at dusk into warm, shallow habitatsfor nocturnal foraging (Sims et al., 2001, 2006). This approximates a normaldiel vertical migration (nDVM) (Fig. 13.3); however, what factors determinethis particular pattern of movement since similar nDVM of benthic prey isnot evident in this environment? Long-term field deployments of watertemperature-depth dataloggers showed that temperatures in the shallowhabitat varied from 15.5 (at night) to 17.5 C (during daytime), whereas intheir deep habitat the temperature remained between about 15–16 C (Simset al., 2006). Furthermore, deployments of baited traps showed highabundance of prey in warm, shallow areas (~2 m depth) during both dayand night, but in deep water abundances were an order of magnitude lessirrespective of light phase. This raised the possibility that this ectothermiccatshark was exhibiting a trade-off between optimal foraging and thermalhabitats. It appeared shallow, prey rich areas were entered only duringperiods when water temperatures were lowered during nighttime (whenenergy costs would be concomitantly lower), with sharks moving to deeper,cold water after foraging.
424 Fish Locomotion: An Eco-Ethological Perspective
A laboratory manipulation of behaviour was designed to investigate theeffects of water temperature and food availability on catshark habitat selection.Four male catsharks were trained to receive food in one compartment of atwo-compartment choice chamber (water temperature, 14.4 C), thecompartments being linked by a small tunnel through which the fish werefree to move. After the training period, and for the next two weeks, thefrequency of habitat (compartment) use strongly favoured that where foodwas made available (3 or more individuals were present there ~90% of thetime). Throughout the following two weeks, the water temperature of thefood-delivery compartment was maintained 0.9 C above the othercompartment (i.e., elevated to 15.3 C), and habitat choice was recorded. Bythe end of the second week, the four catsharks were spending 90% of theirtime in the cooler side, only moving into the warmer habitat to obtain food,and which was consistent with wild behaviour of males. When the temperaturegradient was removed for the next two weeks, habitat occupation switchedback to the food-delivery compartment (Sims et al., 2006). Thus, the thermalchoice experiment using environmentally realistic temperatures supportedthe field observation that catsharks positively avoided warmer water evenwhen it was associated with greater food availability.
To estimate the energetic costs of this behaviour extensive measure-ments of catshark metabolic rate (indirectly from oxygen consumption)were undertaken to determine the three principal components of a fish’senergy budget: standard metabolism (metabolic rate at zero swimmingspeed), and feeding and active metabolic rates (Sims and Davies, 1994;Sims, 1996). From this data, potential energetic mechanisms underlyingobserved behaviour were approached by calculating the energy costsassociated with occupying different-temperature habitat at varying levels ofactivity and feeding metabolism (termed specific dynamic action, SDA).Depth and temperature records from data-storage tagged catsharkscomprised the empirical data used to build a model of energy expenditurewhich was then subjected to manipulations of thermal regime, that is,replacement of actual water temperature values with fixed (isothermal coldor warm temperatures) or biased-random values (within a range generatedfrom warm or cold average ‘seed’ values) (Sims et al., 2006). Modelling ofenergy budgets under these different realistic thermal choice scenariosdetermined by temperature and activity records from electronic tagsattached to catsharks revealed that adopting a “hunt warm, rest cool” strategycould lower daily energy costs by just over 4%. Although in the short-term thissaving appears small, this species is known to live for at least 15 years, duringwhich time time these daily energy savings may contribute significantly toincreasing lifetime reproductive success. Overall the findings were consistentwith male S. canicula undertaking nDVM movements to increase energeticbenefits through trade-offs between foraging opportunity and the effect of
425
thermal resources on energy expenditure (Sims et al., 2006). The resultsprovide the first clear evidence that benthic sharks, at least, are capable ofutilizing DVM as an energy conservation strategy that increases bioenergeticefficiency.
Macroscopic Patterns of BehaviourMacroscopic Patterns of BehaviourMacroscopic Patterns of BehaviourMacroscopic Patterns of BehaviourMacroscopic Patterns of Behaviour
It is relatively straightfoward to see how measurements of energy expenditure,manipulative laboratory experiments and field tracking of smaller-bodiedsharks can be combined to test explicit hypotheses in behavioural ecology.Doing the same for large pelagic sharks however is logistically prohibitive. Aswe have seen (Horizontal Movements 2.2 and Vertical Movements 2.3), largesharks often undertake complicated horizontal and vertical movements butas has been mentioned already what is less well known is what they are doingduring such movements and why. Generally speaking it has proved verydifficult to identify what behaviours sharks are exhibiting, whether they aresearching, feeding, commuting, resting, or migrating, and so on. Untilelectronic devices capable of providing a “daily diary” of shark activities andenergy expenditure becomes a practical reality (for concept see Wilson et al.,2008), we are reliant upon using inferential approaches to help tease outparticular behaviours and, in some cases, the strategies potentially used bysharks to find resources (food, mates, refuge, etc). Here, I will describe someanalysis techniques taken from the field of statistical physics and indicatewhere these have recently proved useful in helping to understand sharkswimming movements and behaviour in the wild, in particular those associatedwith searching.
Searching Natural EnvironmentsSearching Natural EnvironmentsSearching Natural EnvironmentsSearching Natural EnvironmentsSearching Natural Environments
A central issue in behavioural ecology is understanding how organisms searchfor resources within heterogeneous natural environments (MacArthur andPianka 1966; Stephens and Krebs 1986). Organisms are often assumed tomove through an environment in a manner that optimises their chances ofencountering resource targets, such as food, potential mates, or preferredrefuging locations. For a forager searching for prey in a stable, unchangingenvironment, prior expectation of when and where to find items will informa deterministic search pattern (Stephens and Krebs, 1986; Houston andMcNamara, 1999). However, foragers in environments that couple complexprey distributions with stochastic dynamics will not be able to attain a universalknowledge of prey availability. This raises the question of how should a foragerbest search across complex landscapes to optimise the probability ofencountering suitable prey densities? Because nearly all motile animals facethis same problem it suggests the possibility that a general foraging rule for
Swimming Behaviour and Energetics of Free-ranging Sharks
426 Fish Locomotion: An Eco-Ethological Perspective
optimising search patterns has emerged in animals by natural selection.Pelagic sharks such as the blue shark (Prionace glauca) appear well designedfor sustained cruising at low swimming speeds, presumably in part as aconsequence of their need to search large areas and depths to locate sparseresources in sufficient quantities. Hence, pelagic sharks may be idealcandidates for testing ideas about optimal searching by applying Lévy statisticsto movement patterns, and in so doing this may reveal insights about whatgoverns aspects of their behaviour.
Optimal LOptimal LOptimal LOptimal LOptimal Lèvy flightsvy flightsvy flightsvy flightsvy flights
Recent progress in optimal foraging theory has focused on probabilisticsearches described by a category of random-walk models known as Lévy flights(Viswanathan et al., 2000; Bartumeus et al., 2005). Lévy flights are specialisedrandom walks that comprise “walk clusters” of relatively short step lengths, orflight intervals (distances between turns), connected by longer movement‘jumps’ between them, with this pattern repeated across all scales (Bartumeuset al., 2005). In a Lévy flight the move step lengths are chosen from a probabilitydistribution with a power-law tail, resulting in step lengths with nocharacteristic scale: P(lj) ~ lj
–μ, with 1 < μ ≤ 3 where lj is the flight length and μis the exponent (or Lévy exponent) of the power law. Theoretical studiesindicate Lévy flights represent an optimal solution to the biological searchproblem in complex landscapes where prey are sparsely and randomlydistributed outside an organism’s sensory detection range (Viswanathan et al.,1999, 2000; Bartumeus et al., 2005). Simulation studies indicate an optimalsearch has a Lévy exponent of μ ≅ 2 (Viswanathan et al., 1996). The advantageto predators of selecting step lengths with a Lévy distribution compared withsimple Brownian motion for example, is that Lévy flight increases theprobability of encountering new patches compared with other types ofsearches (Viswanathan et al., 2000; Bartumeus et al., 2002). Recent studies(Benhamou, 2007; Edwards et al., 2007; Sims et al., 2007) contend Lévy flightshave been wrongly ascribed to some species through use of incorrect methods,while others indicate Lévy-like behaviour with optimal power-law exponents(Bartumeus et al., 2005), supporting the hypothesis that μ ≅ 2 may representan evolutionary optimal value of the Lévy exponent (Bartumeus, 2007).
Here then, is a theoretical prediction about searching movements thatcan be tested with empirical data. The approach is to ask whether individualanimals exhibit movement patterns that are consistent with Lévy behaviour,that is, whether the move step length frequency distribution is well describedby a power law form with a heavy tail. If there is sufficient support forobserved movements to be approximated by a Lévy distribution of movestep lengths, where 1 < μ d” 3 , then we can infer that the animal might beadopting a probabilistic, Lévy-like searching pattern. Furthermore, if the
427
calculated exponent lies close to μ ≅ 2, it is possible the structure of movementsundertaken by an animal may be optimal. Similarly, fluctuations or changesin the Lévy exponent of movements could signal ecologically important shiftsin behaviour.
Testing Empirical DataTesting Empirical DataTesting Empirical DataTesting Empirical DataTesting Empirical Data
Marine vertebrates such as large sharks that feed on ephemeral resourceslike zooplankton and smaller pelagic fish typify the type of predator thatmight undertake such probabilistic searches described with Lévydistributions. This is principally because they have sensory detection rangeslimited by the seawater medium and experience extreme variability in foodsupply over a broad range of spatio-temporal scales (Mackus and Boyd,1979; Makris et al., 2006). Although at near-distance scales sharks use sensoryinformation of resource abundance and distribution, and at very broadscales some may have awareness of seasonal and geographical preydistributions, across the broad range of mesoscale boundaries (1 to 100s ofkm) pelagic sharks, in many instances such as during searching, are morelike probabilistic or ‘blind’ hunters than deterministic foragers. Across suchscales, the necessary spatial knowledge required for successful foraging willdepend largely on the search strategy employed.
Lévy-like movement behaviour has apparently been detected amongdiverse organisms, including amoeba (Schuster and Levandowsky, 1996),zooplankton (Bartumeus et al., 2003), insects (honeybees) (Reynolds et al.,2007), social canids (jackals) (Atkinson et al., 2002), arboreal primates(spider monkeys) (Ramos-Fernandez et al., 2004) and even in humanmovements (Brockmann et al., 2006; Gonzalez et al., 2008). Recent studiesindicated some methodological errors associated with early studies oforganism movements (Edwards et al., 2007; Sims et al., 2007), perhapsresulting in false detections of Lévy behaviour; however, robust statisticalmethods have now been developed (Clauset et al., 2007). It was during thisrecent period of methodological progress that marine vertebrate predatormovements were tested rigorously for the first time (Sims et al., 2008).
Most studies to date have analysed the horizontal trajectories of organismsto test for Lévy flights. However, when considering fully aquatic marinevertebrates such as sharks, this presents a problem since the horizontal tracksare subject to significant spatial errors. Inaccurate location determinations,either from direct Argos satellite tracking or from reconstructed tracks usinglight-level geolocation, are not necessarily important when considering large-scale movements such as migration. This is because the gross movementdisplacement is greater than the quantified error field. However, in testingfor the presence of Lévy flights the move step lengths whether they be smallor large are important to measure accurately as they form the frequency
Swimming Behaviour and Energetics of Free-ranging Sharks
428 Fish Locomotion: An Eco-Ethological Perspective
distribution, and it is from this that the Lévy exponent is determined.Simulation studies show that a Lévy exponent of a move step frequencydistribution cannot be recovered from the original Lévy flight movementwhen locations are subjected to spatial errors of about 10% of the maximumdaily movement distance (Bradshaw et al., 2007). This means that for a sharkmoving say 50 km per day, the spatial location error during tracking can be nogreater, and ideally much less, than 5 km, otherwise a Lévy flight that ispresent is unlikely to be reliably detected. This is clearly a problem if light-level geolocations of shark trajectories are used because error fields are largefor this method (e.g. ~ 50–250 km). Although Argos satellite geolocations(class 1–3) of fin-mounted transmitters are much more accurate (Weng et al.,2005), the gaps in transmissions caused by a shark not necessarily surfacingregularly enough are a problem since move step lengths cannot bedetermined accurately if locations in the trajectory are missing.
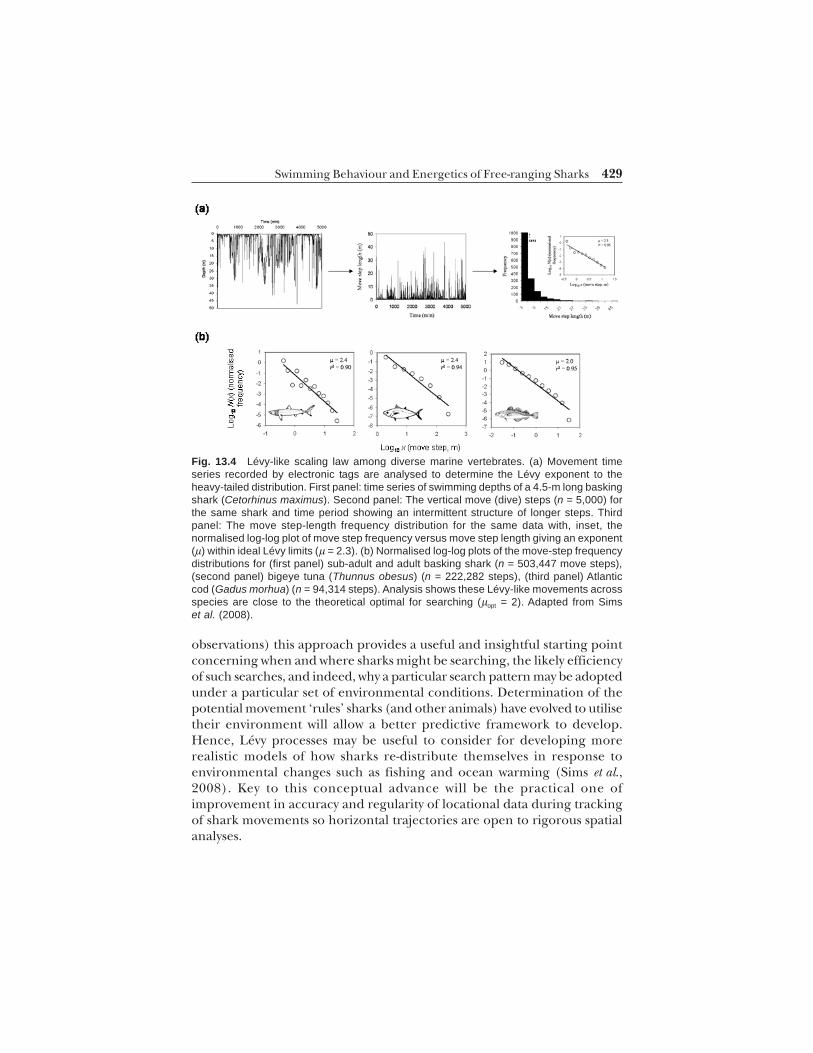
The limitations location errors or gaps put on using horizontal movementdata from pelagic sharks has precluded, so far, their use in testing for Lévyflights. Recent progress however has been made in analysing verticalmovements for Lévy behaviour (Sims et al., 2008). Here, the change inconsecutive depth measurements recorded by shark-attached electronic tagsform a time-series of move steps suitable for analysis of macroscopic patternsacross the long temporal scale (Fig. 13.4). A time series of consecutivevertical steps is reminiscent of a Lévy walk rather than a Lévy flight, sincevertical move steps are determined across equal time intervals rather thanbetween turns (turning points in a Lévy walk form a Lévy flight; seeShlesinger et al., 1993). Using this approach it was demonstrated that movestep frequency distributions of basking shark, bigeye tuna and Atlantic cod(Gadus morhua) tracked on their foraging grounds were consistent withLévy-like behaviour (Sims et al., 2008) (Fig. 13.4). A modification in thetime-series was needed for air breathers such as leatherback turtles(Dermochelys coriacea) and Magellanic penguins (Spheniscus magellanicus), butthey too showed move step patterns consistent with Lévy motion.Interestingly, the Lévy exponents for these five species were close to thetheoretically optimal μ ≅ 2 exponent. Analysis of prey abundance time seriesand a predator-prey computer simulation was also undertaken and suggestedthat marine vertebrates in stochastic environments necessitatingprobabilistic searching may derive benefits from adapting movementsdescribed by Lévy processes (Sims et al., 2008).
These results indicate that archival tag-derived data from pelagic species,including sharks, may be particularly amenable to movement analysis usingthe techniques described in various recent studies (Bartumeus et al., 2003;Shepard et al., 2006; Clauset et al., 2007; Sims et al., 2007; Sims et al., 2008).Perhaps more importantly though, the recent investigation (Sims et al., 2008)showed that in the absence of more direct information (experiments,
429
observations) this approach provides a useful and insightful starting pointconcerning when and where sharks might be searching, the likely efficiencyof such searches, and indeed, why a particular search pattern may be adoptedunder a particular set of environmental conditions. Determination of thepotential movement ‘rules’ sharks (and other animals) have evolved to utilisetheir environment will allow a better predictive framework to develop.Hence, Lévy processes may be useful to consider for developing morerealistic models of how sharks re-distribute themselves in response toenvironmental changes such as fishing and ocean warming (Sims et al.,2008). Key to this conceptual advance will be the practical one ofimprovement in accuracy and regularity of locational data during trackingof shark movements so horizontal trajectories are open to rigorous spatialanalyses.
Fig. 13.4 Lévy-like scaling law among diverse marine vertebrates. (a) Movement timeseries recorded by electronic tags are analysed to determine the Lévy exponent to theheavy-tailed distribution. First panel: time series of swimming depths of a 4.5-m long baskingshark (Cetorhinus maximus). Second panel: The vertical move (dive) steps (n = 5,000) forthe same shark and time period showing an intermittent structure of longer steps. Thirdpanel: The move step-length frequency distribution for the same data with, inset, thenormalised log-log plot of move step frequency versus move step length giving an exponent(μ) within ideal Lévy limits (μ = 2.3). (b) Normalised log-log plots of the move-step frequencydistributions for (first panel) sub-adult and adult basking shark (n = 503,447 move steps),(second panel) bigeye tuna (Thunnus obesus) (n = 222,282 steps), (third panel) Atlanticcod (Gadus morhua) (n = 94,314 steps). Analysis shows these Lévy-like movements acrossspecies are close to the theoretical optimal for searching (μopt = 2). Adapted from Simset al. (2008).
Swimming Behaviour and Energetics of Free-ranging Sharks
430 Fish Locomotion: An Eco-Ethological Perspective
Future PerspectivesFuture PerspectivesFuture PerspectivesFuture PerspectivesFuture Perspectives
The application of cutting edge tracking and datalogging technology,together with movement analysis and simulation modelling has recentlypointed to potential mechanisms underlying the complex patterns of sharkbehaviour. There are several other examples that could have been discussedin this chapter that are equally important and interesting, and this illustratesthat the field of shark movement ecology is entering a rapid phase of formalprogress. So what lies ahead for us in the study of shark swimmingmovements in the wild? How can new technologies be applied to furtherenhance our understanding of free-ranging shark behaviour? Of centralimportance will be clear identification and testing of behavioural ecologyhypotheses combining advanced movement analysis with simulations andmodelling to better understand habitat preferences and hence re-distribution patterns. Patterns and dynamics of sexual segregation in sharkswill be particularly important to elucidate, not least because of the potentialfor biased fishing effects on one sex over another and its likely deleteriouspopulation implications (Sims, 2005). Linked to this is the need for thenext generation of instruments that will provide data of such good qualitythat much deeper insights into sharks behaving in their naturalenvironments will be possible—we will then be capable of tackling those‘why’ questions routinely. Some innovative advances will be globalpositioning system (GPS) tags for sharks for providing more accuratelocations, the availability of datalogging sensors for signalling prey size andtype ingested, and which will be needed to undertake natural experimentsin shark foraging ecology. The advent of electronic “daily diaries” for sharksthat reveal fine-scale data on movement, feeding events, energy expenditureand so on, over long time scales, is predicted to have a large impact in thefield.
In this regard, over the last few years tests have been made of pop-updatalogging tags that instead of transmitting to satellites are capable ofdownloading data to mobile telephone networks. This has the advantageover satellite transmission, where message lengths are small, in that archivalrather than summary data can be transmitted so long as the ‘line’ remainsopen. This year also sees the test of a new hybrid tag, this time a combinationof an Argos satellite transmitter and a Fastloc GPS transmitter. This willimprove the accuracy of locations of the fish by several orders of magnitudethan can presently be obtained using Argos transmitters. However, fishcarrying the tag must come to the surface to facilitate acquisition of theGPS satellite constellation for location fixing, which is very fast, about 50ms (hence the ‘Fastloc’ name). Several recent studies show the potential ofattaching a satellite transmitter to a shark’s fin for example, to track it more
431
accurately than is possible from light-level geolocation, so it seems likely thatGPS tracking of large pelagic fish is just around the corner.
Tracking sharks in the wild is a new frontier in ecological science butone that has already resulted in significant advances in understandingbehaviour. Development of ever smaller and more sophisticated tags toaddress clear science questions will ensure that this knowledge widens yetfurther to include more species, and will provide key data to improve thepossibility for better shark management and conservation.
ACKNOWLEDGEMENTSACKNOWLEDGEMENTSACKNOWLEDGEMENTSACKNOWLEDGEMENTSACKNOWLEDGEMENTS
DWS was supported by a UK Natural Environment Research Council (NERC)MBA Research Fellowship and the NERC Oceans 2025 Strategic ResearchProgramme Theme 6 (Science for Sustainable Marine Resources). The authorthanks P. Domenici and three referees for helping to improve the chapter.
REFERENCESREFERENCESREFERENCESREFERENCESREFERENCES
Arnold, G. and H. Dewar. 2001. Electronic Tags in Marine Fisheries Research: A 30-YearPerspective. In: Electronic Tagging and Tracking in Marine Fisheries, J.R. Sibert and J.L.Nielsen (Eds.). Kluwer, Academic Publishers, Dordrecht, Netherlands, pp. 7–64.
Atkinson, R.P.D., C.J. Rhodes, D.W. Macdonald and R.M. Anderson. 2002. Scale-free dynamicsin the movement pattern of jackals. Oikos 98: 134–140.
Baum, J.K., R.A. Myers, D.G. Kehler, B. Worm, S.J. Harley and P.A. Doherty. 2003. Collapseand conservation of shark populations in the northwest Atlantic. Science 299: 389–392.
Bartumeus, F. 2007. Lévy processes in animal movement: An evolutionary hypothesis. Fractals15: 151–162.
Bartumeus, F., M.G.E. da Luz, G.M. Viswanathan and J. Catalan. 2005. Animal search strategies:a quantitative random-walk analysis. Ecology 86: 3078–3087.
Bartumeus, F., F. Peters, S. Pueyo, C. Marrasé and J. Catalan. 2003. Helical Lévy walks: adjustingsearch statistics to resource availability in microzooplankton. Proceedings of the NationalAcademy of Sciences of the United States of America. 100: 12771–12775.
Benhamou, S. 2007. How many animals really do the Lévy walk? Ecology 88: 1962–1969Bertrand, A., E. Josse and J. Massé. 1999. In situ acoustic target-strength measurement of
bigeye (Thunnus obesus) and yellowfin tuna (Thunnus albacares) by coupling split-beamechosounder observations and sonic tracking. Journal of Marine Science 56: 51–60.
Block, B.A., H. Dewar, C. Farwell and E.D. Prince. 1998. A new satellite technology for trackingthe movements of Atlantic bluefin tuna. Proceedings of the National Academy of Sciences ofthe United States of America. 95: 9384–9389.
Block, B.A. et al. 2001. Migratory movements, depth preferences, and thermal biology ofAtlantic bluefin tuna. Science 293: 1310–1314.
Block, B.A. et al. 2005. Electronic tagging and population structure of Atlantic bluefin tuna.Nature (London) 434: 1121–1127.
Bonfil, R., M. Meÿer, M.C. Scholl, R. Johnson, S. O’Brien, H. Oosthuizen, S. Swanson, D.Kotze and M. Paterson. 2005. Transoceanic migration, spatial dynamics, and populationlinkages of white sharks. Science 310: 100–103.
Boustany, A., S. Davis, P. Pyle, S.D. Anderson, B. Le Boeuf and B.A. Block. 2002. Satellitetagging: Expanded niche for white sharks. Nature (London) 35–36.
Swimming Behaviour and Energetics of Free-ranging Sharks
432 Fish Locomotion: An Eco-Ethological Perspective
Bradshaw, C.J.A., D.W. Sims and G.C. Hays. 2007. Measurement error causes scale-dependent threshold erosion of biological signals extracted from animal movementdata. Ecological Applications 17: 628–38.
Brockmann, D, L. Hufnagel and T. Geisel. 2006. The scaling laws of human travel. Nature(London) 439: 462–465.
Bruce, B.D., J.D. Stevens and H. Malcolm. 2006. Movements and swimming behaviour ofwhite sharks (Carcharodon carcharias) in Australian waters. Marine Biology 150: 161–172.
Burgess, G.H., L.R. Beerkircher, G.M. Cailliet, J.K. Carlson, E. Cortes, K.J. Goldman, R.D.Grubbs, J.A. Musick, M.K. Musyl and C.A. Simpfendorfer. 2005. Is the collapse of sharkpopulations in the Northwest Atlantic Ocean and Gulf of Mexico real? Fisheries 30:19–26.
Carey, F.G. 1992. Through the thermocline and back again: Heat regulation in big fish. Oceanus35: 79–85.
Carey, F.G. and J.V. Scharold. 1990. Movements of blue sharks (Prionace glauca) in depth andcourse. Marine Biology 106: 329–342.
Carey, F.G., J.W. Kanwisher, O. Brazier, G. Gabrielson, J.G. Casey and Jr, H.L. Pratt. 1982.Temperature and activities of a white shark Carcharodon carcharias. Copeia 1982:254–260.
Clauset, A., C.R. Shalizi and M.E.J. Newman. 2007. Power-law distributions in empirical data.E-Print, arXiv: 0706.1062v1.
Cotton, P.A., D.W. Sims, S. Fanshawe and M. Chadwick. 2005. The effects of climate variabilityon zooplankton and basking shark relative abundance off southwest Britain. FisheriesOceanography 14: 151–155.
Eckert, S.A. and B.S. Stewart. 2001. Telemetry and satellite tracking of whale sharks, Rhincodontypus, in the Sea of Cortez, Mexico, and the north Pacific Ocean. Environmental Biology ofFishes 60: 299–308.
Eckert, S.A., L.L. Dolar, G.L. Kooyman, W. Perrin and R.A. Rahman. 2002. Movements ofwhale sharks (Rhincodon typus) in South-east Asian waters as determined by satellitetelemetry. Journal of the Zoological Society of London 257: 111–115.
Edwards, A.M. et al. 2007. Revisiting Lévy flight search patterns of wandering albatrosses,bumblebees or deer. Nature (London) 449: 1044–1048.
Gonzalez, M.C., C.A. Hidalgo and A.-L. Barabasi. 2008. Understanding individual humanmobility patterns. Nature (London) 453: 779–782.
Graham, R.T., C.M. Roberts and J.C.R. Smart. 2006. Diving behaviour of whale sharks inrelation to a predictable food pulse. Journal of the Royal Society Interface 3: 109–116.
Guénette, S., T.J. Pitcher and C.J. Walters. 2000. The potential of marine reserves for themanagement of northern cod in Newfoundland. Bulletin of Marine Science 66: 831–52
Gunn, J.S., J.D. Stevens, T.L.O. Davis and B.M. Norman. 1999. Observations on the short-term movements and behaviour of whale sharks (Rhincodon typus) at Ningaloo Reef,Western Australia. Marine Biology 135: 553–559.
Harden Jones, F.R. 1968. Fish Migration. Edward Arnold, London.Heithaus, M.R., L.M. Dill, G.L. Marshall and B. Buhleier. 2002. Habitat use and foraging
behavior of tiger sharks (Galeocerdo cuvier) in seagrass ecosystem. Marine Biology 140:237–248.
Holland, K.N., R.W. Brill, R.K.C. Chang, J.R. Sibert and D.A. Fournier. 1992. Physiologicaland behavioural thermoregulation in bigeye tuna (Thunnus obesus). Nature (London)358: 410–412.
Holland, K.N., B.M. Wetherbee, C.G. Lowe and C.G. Meyer. 1999. Movements of tiger sharks(Galeocerdo cuvier) in coastal Hawaiian waters. Marine Biology 134: 665–673.
Jackson, J.B.C. et al. 2001. Historical overfishing and the recent collapse of coastal ecosystems.Science 293: 629–638.
Josse, E., P. Bach and L. Dagorn. 1998. Simultaneous observations of tuna movements andtheir prey by sonic tracking and acoustic surveys. Hydrobiologia 371/372: 61–69.
Kingman, A. 1996. Satellite tracking blue sharks. Shark News 7: 6.
433
Klimley, A.P. 1993. Highly directional swimming by scalloped hammerhead sharks, Sphyrnalewini, and subsurface irradiance, temperature, bathymetry, and geomagnetic field.Marine Biology 117: 1–22.
Klimley, A.P., S.B. Butler, D.R. Nelson and A.T. Stull. 1988. Diel movements of scallopedhammerhead sharks, Sphyrna lewini Griffith and Smith, to and from a seamount in theGulf of California. Journal of Fish Biology 33: 751–761.
Klimley, A.P. and D.R. Nelson. 1984. Diel movement patterns of the scalloped hammerheadshark (Sphyrna lewini) in relation to El Bajo Espiritu Santo: a refuging central-positionsocial system. Behavioural Ecology and Sociobiology 15: 45–54.
Kramer, D.L., R.W. Rangeley and L.J. Chapman. 1997. Habitat selection: patterns of spatialdistribution from behavioural decisions. In: Behavioural Ecology of Teleost Fishes J.-G.J. Godin(Ed.). Oxford University Press, Oxford, pp. 37–80.
Krebs, J.R. and N.B. Davies (Eds.). 1997. Behavioural Ecology: An Evolutionary Approach. BlackwellScience, Oxford.
Lutcavage, M.E., R.W. Brill, G.B. Skomal, B.C. Chase and P.W. Howey. 1999. Results of pop-up satellite tagging of spawning class fish in the Gulf of Maine: do North Atlantic bluefintuna spawn in the mid-Atlantic? Candian Journal of Fisheries and Aquatic Science 56:173–177.
MacArthur, R.H. and E.R. Pianka. 1966. On optimal use of a patchy environment. AmericanNaturalist 100: 603–609.
Mackus, D.L. and C.M. Boyd. 1979. Spectral analysis of zooplankton spatial heterogeneity.Science 204: 62–64.
Makris, N.C. et al. 2006. Fish population and behaviour revealed by instantaneous continentalshelf-scale imaging. Science 311: 660–663.
Matthews, L.H. 1962. The shark that hibernates. New Scientist 280: 756–759.Metcalfe, J.D. and G.P. Arnold. 1997. Tracking fish with electronic tags. Nature (London)
387: 665–666.Myers, R., J.K. Baum, T.D. Shepherd, S.P. Powers and C.H. Peterson. 2007. Cascading effects
of the loss of apex predatory sharks from a coastal ocean. Science 315: 1846–1850.Nelson, D.R. 1990. Telemetry studies of sharks: A review, with applications in resource
management. In: Elasmobranchs as Living Resources: Advances in the Biology, Ecology,Systematics, and Status of the Fisheries, H.L. Pratt, S.H. Gruber and T. Taniuchi. (Eds.).NOAA Technical Report 90: 239–256.
Nelson, D.R., J.N. McKibben, Jr, W.R. Strong, C.G. Lowe, J.A. Sisneros, D.M. Schroeder andR.J. Lavenberg. 1997. An acoustic tracking of a megamouth shark, Megachasma pelagios:a crepuscular vertical migrator. Environmental Biology of Fishes 49: 389–399.
Nielsen, A., K.A. Bigelow, M.K. Musyl and J.R. Sibert. 2006. Improving light-based geolocationby including sea surface temperature Fisheries Oceanography 15: 314–325.
Pauly, D. et al. 2002. Towards sustainability in world fisheries. Nature 418: 689–695.Priede, I.G. 1984. A basking shark (Cetorhinus maximus) tracked by satellite together with
simultaneous remote-sensing. Fisheries Research 2: 201–216.Priede, I.G. 1992. Wildlife telemetry: An introduction. In: Wildlife Telemetry: Remote Monitoring
and Tracking of Animals, I.G. Priede and S.M. Swift (Eds.). Ellis Horwood, Chichester,pp. 3–25.
Ramos-Fernández, G., J.L. Mateos, O. Miramontes, G. Cocho, H. Larralde and B. Ayala-Orozco.2004. Lévy walk patterns in foraging movements of spider monkeys (Ateles geoffroyi).Behavioural Ecology and Sociobiology 55: 223–230.
Reynolds, A.M., A.D. Smith, R. Menzel, U. Greggers, D.R. Reynolds and J.R. Riley. 2007.Displaced honey bees perform optimal scale-free search flights. Ecology 88: 1955–1961.
Richardson, A.J., A.W. Walne, A.W.G. John, T.D. Jonas, J.A. Lindley, D.W. Sims, D. Stevensand M.J. Witt. 2006. Using continuous plankton recorder data. Progress in Oceanography68: 27–74.
Swimming Behaviour and Energetics of Free-ranging Sharks
434 Fish Locomotion: An Eco-Ethological Perspective
Schaefer, K.M. and D.W. Fuller. 2002. Movements, behavior, and habitat selection ofbigeye tuna (Thunnus obesus) in the eastern equatorial Pacific, ascertained througharchival tags. Fisheries Bulletin 100: 765–788.
Schuster, F.L. and M. Levandowsky. 1996. Chemosensory responses of Acanthamoebacastellani: Visual analysis of random movement and responses to chemical signals.Journal of Eukaryotic Microbiology 43: 150–158.
Shepard, E.L.C., M.Z. Ahmed, E.J. Southall, M.J. Witt, J.D. Metcalfe and D.W. Sims. 2006.Diel and tidal rhythms in diving behaviour of pelagic sharks identified by signalprocessing of archival tagging data. Marine Ecology Progress Series 328: 205–213.
Shlesinger, M.F., G.M. Zaslavsky and J. Klafter. Strange kinetics. Nature (London) 363: 31–37(1993).
Sibert, J., J. Hampton, P. Kleiber and M. Maunder. 2006. Biomass, size, and trophic status oftop predators in the Pacific Ocean. Science 314: 1773–1776.
Sims, D.W. 1996. The effect of body size on the standard metabolic rate of lesser spotteddogfish, Scyliorhinus canicula. Journal of Fish Biology 48: 542–544.
Sims, D.W. 1999. Threshold foraging behaviour of basking sharks on zooplankton: life on anenergetic knife edge? Proceedings of the Royal Society B266: 1437–1443.
Sims, D.W. 2003. Tractable models for testing theories about natural strategies: Foragingbehaviour and habitat selection of free-ranging sharks. Journal of Fish Biology 63(Supplement A): 53–73.
Sims, D.W. 2005. Differences in habitat selection and reproductive strategies of male andfemale sharks. In: Sexual Segregation in Vertebrates: Ecology of the Two Sexes K. E. Ruckstuhland P. Neuhaus (Eds.). Cambridge University Press, Cambridge, pp. 127–147.
Sims, D.W. and S.J. Davies. 1994. Does specific dynamic action (SDA) regulate return ofappetite in the lesser spotted dogfish, Scyliorhinus canicula? Journal of Fish Biology 45:341–348.
Sims, D.W. and V.A. Quayle. 1998. Selective foraging behaviour of basking sharks onzooplankton in a small-scale front. Nature 393: 460–464.
Sims, D.W., A.M. Fox and D.A. Merrett. 1997. Basking shark occurrence off south-west Englandin relation to zooplankton abundance. Journal of Fish Biology 51: 436–440.
Sims, D.W., J.P. Nash and D. Morritt. 2001. Movements and activity of male and femaledogfish in a tidal sea lough: alternative behavioural strategies and apparent sexualsegregation. Marine Biology 139: 1165–1175.
Sims, D.W., E.J. Southall, A.J. Richardson, P.C. Reid and J.D. Metcalfe. 2003. Seasonalmovements and behaviour of basking sharks from archival tagging: no evidence of winterhibernation. Marine Ecology Progress Series 248: 187–196.
Sims, D.W., E.J. Southall, G.A. Tarling and J.D. Metcalfe. 2005. Habitat-specific normal andreverse diel vertical migration in the plankton-feeding basking shark. Journal of AnimalEcology 74: 755–761.
Sims, D.W., M.J. Witt, A.J. Richardson, E.J. Southall and J.D. Metcalfe. 2006. Encounter successof free-ranging marine predator movements across a dynamic prey landscape. Proceedingsof the Royal Society B273: 1195–1201.
Sims, D.W. et al. 2006. Hunt warm, rest cool: bioenergetic strategy underlying diel verticalmigration in a benthic shark. Journal of Animal Ecology 75: 176–190.
Sims, D.W., D. Righton and J.W. Pitchford. 2007. Minimizing errors in identifying Lévy flightbehaviour of organisms. Journal of Animal Ecology 76: 222–229
Sims, D.W. et al. 2008. Scaling laws of marine predator search behaviour. Nature (London)451: 1098–1102.
Skomal, G.B., G. Wood and N. Caloyianis. 2004. Archival tagging of a basking shark, Cetorhinusmaximus, in the western North Atlantic. Journal of the Marine Biological Association of theUnited Kingdom 84: 795–799.
Stephens, D.W. and J.R. Krebs. 1986. Foraging Theory. Princeton University Press, Princeton.
435
Taillade, M. 1992. Animal tracking by satellite. In: Wildlife Telemetry: Remote Monitoring andTracking of Animals, I.G. Priede and S.M. Swift (Eds.). Ellis Horwood, Chichester,pp. 149–160.
Teo, S.L.H., A. Boustany, S. Blackwell, A. Walli, K.C. Weng and B.A. Block. 2004. Validationof geolocation estimates based on light level and sea surface temperature fromelectronic tags. Marine Ecology Progress Series 283: 81–98.
Weng, K.C. et al. 2005. Satellite tagging and cardiac physiology reveal niche expansion insalmon sharks. Science 310: 104–106.
West, G.J. and J.D. Stevens. 2001. Archival tagging of school shark, Galeorhinus galeus, inAustralia: initial results. Environmental Biology of Fishes 60: 283–298.
Wilson, R.P., E.L.C. Shepard and N. Liebsch. 2008. Prying into the intimate details of animallives: use of a daily diary on animals. Endangered Species Research 4: 123–137.
Wilson, R.P., J.J. Ducamp, W.G. Rees, B.M. Culik and K. Niekamp. 1992. Estimation of location:Global coverage using light intensity. In: Wildlife Telemetry: Remote Monitoring and Trackingof Animals I.G. Priede and S.M. Swift (Eds.). Ellis Horwood, Chichester, pp. 131–134.
Wilson, S.G., B.S. Stewart, J.J. Polovina, M.G. Meekan, J.D. Stevens and B. Galuardi. 2007.Accuracy and precision of archival tag data: a multiple-tagging study conducted on awhale shark (Rhincodon typus) in the Indian Ocean. Fisheries Oceanography 16: 547–554.
Viswanathan, G.M. et al. 1996. Lévy flight search patterns of wandering albatrosses. Nature(London) 381: 413–415
Viswanathan, G.M. et al. 1999. Optimizing the success of random searches. Nature (London)401: 911–914.
Viswanathan, G.M. et al. 2000. Lévy flights in random searches. Physica A282: 1–12.
Swimming Behaviour and Energetics of Free-ranging Sharks


