Embed Size (px)
Citation preview

EN EN
EUROPEAN COMMISSION
Strasbourg, 25.10.2016
SWD(2016) 341 final
COMMISSION STAFF WORKING DOCUMENT
IMPACT ASSESSMENT
Accompanying the document
Proposals for a Council Directive
on a Common Corporate Tax Base and
a Common Consolidated Corporate Tax Base (CCCTB)
{COM(2016) 683 final}
{SWD(2016) 342 final}

2
TABLE OF CONTENTS
1. INTRODUCTION ....................................................................................................... 4
2. THE PROBLEM AND WHY THE EUROPEAN UNION SHOULD ACT .............. 8
2.1. Problems with corporate taxation in an international context ........................... 8
2.2. Corporate taxation and its impact on financing and investment
decisions .......................................................................................................... 12
2.3. How the problems affect stakeholders ............................................................ 19
2.4. Baseline scenario based on recent developments ............................................ 19
2.5. Subsidiarity and proportionality, EU added value .......................................... 21
3. OBJECTIVES ........................................................................................................... 22
3.1. General objective: Enhancing the fairness of the tax system .......................... 23
3.2. General objective: Stimulating growth and investment .................................. 23
4. POLICY OPTIONS ................................................................................................... 24
4.1. Option 1: No further EU action ....................................................................... 25
4.2. Option 2: CCCTB with a scope definition ...................................................... 26
4.3. Option 3: Solutions to address the debt bias ................................................... 27
4.4. Option 4: Options to incentivise R&D ............................................................ 28
4.5. Option 5: Staged approach .............................................................................. 30
5. ANALYSIS OF IMPACTS OF THE OPTIONS ...................................................... 31
5.1. Baseline vs CCCTB ......................................................................................... 33
5.2. Scope of the common consolidated base ......................................................... 40
5.3. Addressing the debt bias .................................................................................. 48
5.4. Treatment of R&D expenses ........................................................................... 56
5.5. The staged approach ........................................................................................ 63
5.6. Impact on SMEs .............................................................................................. 66
5.7. Social and environmental impacts ................................................................... 66
5.8. Conclusion on the preferred option ................................................................. 67
5.9. Choice of the corresponding policy instrument ............................................... 69
6. MONITORING AND EVALUATION ..................................................................... 69
6.1. Monitoring arrangements ................................................................................ 69
6.2. Evaluation ........................................................................................................ 71
7. GLOSSARY .............................................................................................................. 72
8. REFERENCES .......................................................................................................... 76

3
9. ANNEXES ................................................................................................................ 86
Annex I: Procedural Information .............................................................................. 87
Annex II: Stakeholder Consultation – Synopsis Report ............................................ 89
Annex III: Who is affected by the initiative and how ............................................. 107
Annex IV: Analytical Models used in preparing the Impact Assessment ............... 109
Annex V: Formula apportionment .......................................................................... 119
Annex VI: The Anti-Tax Avoidance Package ........................................................ 127
Annex VII: Compliance Costs ................................................................................ 130
Annex VIII: The 2011 Proposal for a CCCTB ........................................................ 139
Annex IX: Impact of the CCCTB on intra-group profit shifting ............................ 144
Annex X: Measuring the cost of capital and effective average tax rates ................ 145
Annex XI: Existence and design of R&D tax incentives in the EU ........................ 147
Annex XII: The impact on tax revenues ................................................................. 149
Annex XIII: Sensitivity analysis on the AGI and the ACE ..................................... 155

4
1. INTRODUCTION
The taxation of multinational companies has come under scrutiny by tax administrations,
tax experts and the general public in recent years. More and more evidence suggests that
considerable amounts of corporate income generated in cross-border activities find ways
to avoid taxation. The business models of multinational companies have become more
complex, intra-group transactions have multiplied and multinationals' integrated value
chains make it difficult to determine where profits are created. Governments struggle to
determine within the current set of international tax rules which country should tax a
multinational's income. Smaller businesses are put at a competitive disadvantage and
citizens perceive tax systems as unfair since some corporate taxpayers might be able to
avoid taxation by exploiting tax planning strategies. This perceived lack of fairness
threatens the social contract between governments and their citizens and may impact
overall tax compliance. More generally, the international tax rules suffer from
inefficiencies and are non-transparent. On the other hand, companies still face a very
complex patchwork of 28 national systems with high compliance costs and risks of
double taxation.
The Commission announced in June 2015 to re-launch the proposal for a common
consolidated corporate tax base (CCCTB) to address these issues.1 This report presents
the main findings from the impact assessment for this re-launch. The CCCTB was
previously proposed by the European Commission in 2011, based on an impact
assessment concluding that it would greatly improve the business environment in the
single market, making it simpler and cheaper for companies to operate cross-border.
Since 2011, new issues have come into light that reinforce the need for a common
approach to corporate taxation in Europe.
First, aggressive tax planning strategies of multinational corporate groups have become
more prevalent. As outlined above, these tax avoidance activities undermine the very
principle of a deeper and fair single market and generate frustration among honest
taxpayers who in recent years had to make additional efforts to consolidate public
finances after the economic and financial crisis.
Second, the financial crisis has shed light on tax-induced corporate financing structures
that weaken the resilience of businesses and put at risk the financial system and more
generally the economy. Ideally, an efficient corporate tax system should be neutral with
regard to the financing and investment decisions of companies.
Third, European growth and investment remain subdued and businesses in the EU are not
investing enough in R&D activities in comparison to other major economies. European
businesses need to remain competitive and innovative in a globalised world. The
corporate tax system can play an important role in ensuring effective taxation while
minimizing negative impacts on investment and growth.
The introduction of a CCCTB is central to those issues, as it aims to fundamentally
reform corporate taxation and provide a European solution to the current challenges in
the international tax policy arena. It has been recognised that the CCCTB can serve as a
powerful tool in the fight against corporate tax avoidance by removing exploitable
1 The Commission laid the groundwork for action on aggressive tax planning with its June 2015 action
plan for a fair and efficient corporate tax system in the EU (COM/2015/302).

5
differences and mismatches between national systems. To safeguard the CCCTB against
profit shifting to third countries, it also needs to be equipped with common anti-
avoidance provisions, as spelled out in the June 2015 action plan. A single set of
corporate tax rules will not only remove tax obstacles in the single market, but will make
Europe more attractive to domestic and foreign investment. By making EU tax law
simpler and reducing regulatory costs, it is expected to contribute to a clear, stable and
predictable regulatory framework and improve tax certainty. At the same time, it
provides for the opportunity to address existing financing and investment distortions and
ensure sufficient R&D incentives. The CCCTB would hence contribute to the
Commission's top priority of creating jobs, growth and investment.
Accordingly, the June 2015 action plan identified the CCCTB as a potentially effective
tool to make corporate taxation fairer and more efficient. The action plan announced the
re-launch of the CCCTB, while clarifying that it needed to be strengthened to address the
current challenges in taxation. In that respect, the action plan referred to the fact that the
CCCTB should be made compulsory, at least for multinational corporations, and that
R&D incentives and measures to address current distortions would be considered.
Developing a staged approach to implementing the CCCTB was recommended, focusing
first on the common corporate tax base (common base henceforth) and in a second stage
on the consolidation. The action plan also recalled the detrimental impact on European
competitiveness of the current heavy compliance costs and administrative burdens
created by the patchwork of 28 different national tax bases.
The re-launch of the CCCTB has been included in the 2016 Commission Work
Programme under the priority of creating a deeper and fairer single market.2 The work
programme has also announced the withdrawal of the 2011 proposal. The 2016 re-launch
builds on the 2011 proposal and adds the new elements as described above.
The analysis conducted in 2011 showed that the CCCTB has the potential to bring
simplification and reduce costs for companies. It therefore contributes to the
Commission's regulatory fitness and performance programme (REFIT). The CCCTB
initiative has also been identified as one of the important milestones for building a capital
markets union (CMU).3 In this context, the Commission committed to address the issue
of the debt-equity bias as part of the re-launch of the CCCTB. The preferential tax
treatment of debt represents an obstacle for creating a stronger equity base in European
companies.
The CCCTB is a major reform proposal to address the current challenges in corporate
income taxation, but experience so far has shown that its negotiation in Council will need
time. To address the most pressing issues in fighting aggressive tax planning the
Commission committed in the June 2015 action plan to other actions aimed at ensuring in
the shorter term effective taxation where profits are generated, a better tax environment
for business, greater tax transparency and strong EU tools for coordination. As a result,
the Anti-Tax Avoidance Package followed in January 2016. It includes legally-binding
anti-avoidance measures necessary to reduce aggressive tax planning. Tax transparency
has been boosted by the Commission's proposals on tax rulings and on country-by-
2 COM(2015) 215 final. 3 As described in the action plan on building a capital markets union, COM(2015)468final,
30 September 2015.

6
country reporting.4 The Anti-Tax Avoidance Package complements existing initiatives
and forums to ensure effective taxation and transparency, such as the Code of Conduct or
the Joint Transfer Pricing Forum. Compared to the more short-term measures, the re-
launched CCCTB offers a holistic solution, which allows tackling important root causes
of the tax avoidance problems.
The CCCTB defines the rules for calculating the taxable profits of a company. The tax
base definition would be the same in all Member States under a CCCTB. However, the
CCCTB does not seek to harmonize the national corporate tax rates. The level of taxation
as determined by the statutory tax corporate rate remains a national decision. The
CCCTB does not change either the domestic corporate tax systems for companies that are
not captured by the scope of the directive or have not opted in. Also, the CCCTB does
not replace bilateral tax treaties and transfer pricing rules which are still needed vis-à-vis
third countries.
This impact assessment and the new CCCTB proposal build on the extensive work done
by the CCCTB working group, the 2011 impact assessment and the technical work done
in collaboration with Member States following the 2011 proposal.5 The impact
assessment presented in this document should thus be seen as part of a wider package of
technical studies on the subject6, complementing the existing material with further
evidence, with a focus specifically on the new elements and objectives. Due to the
CCCTB's potential to considerably simplify the corporate income tax system in the EU,
this document was prepared as a regulatory fitness project of the European Commission.7
The impact assessment is based on the following logic: The analysis starts with the
withdrawal of the 2011 proposal. The absence of a CCCTB proposal coupled with the
introduction of recent anti-tax avoidance initiatives is the baseline scenario. The impact
of introducing a CCCTB as envisaged in 2011 is assessed and the analysis is further
developed by studying the impact of possible new proposed elements to the CCCTB: a
compulsory requirement for some companies, a solution for the debt bias, a tax incentive
for R&D and a staged approach for its introduction to facilitate the political process.
The analysis concludes that the preferred option would be a CCCTB that is mandatory
for very large multinational companies and optional for others, that includes an
allowance for growth and investment (AGI) with well-designed anti-avoidance measures
and that contains an additional allowance for R&D expenses.
4 COM(2016) 198 final. 5 The analysis the 2011 proposal and impact assessment was based on many years of work and input
from within the Commission, external contractors and Member States (CCCTB Working Group) as
well as other stakeholders. The CCCTB Working Group produced 68 papers and summary records of
their meetings between 2004 and 2010. All material is published on a dedicated DG TAXUD website:
http://ec.europa.eu/taxation_customs/taxation/company_tax/common_tax_base/index_en.htm. 6 Annex VIII gives an overview of the 2011 proposal, the underlying impact assessment and the
subsequent technical work. 7 COM(2015) 215 final and SWD(2015) 110 final.

7
Box 1: The 2011 proposal for a CCCTB
The Commission has highlighted the issues and challenges of corporate tax systems in an Economic
Union as well as their role for competitiveness vis-à-vis third countries for many decades. In 2001, the
Commission presented a communication identifying concrete steps to eliminate tax obstacles to cross-
border trade in the EU. This was followed by 10 years of technical preparation, culminating in the
Commission's 2011 proposal for a CCCTB.
The Commission tabled in March 2011 a proposal for a directive on a CCCTB which lays down
common rules for the calculation of the tax base applicable to companies operating in the EU. This EU
tax framework comprises a full set of corporate tax rules to calculate the individual fiscal results of
companies and permanent establishments which are tax resident, or situated, in the EU. The system
includes rules for consolidating those results (profits and losses) when there are other group members
and to apportion the consolidated tax base to all relevant Member States if it is positive. In other words,
a qualifying company or group of companies would have to comply with only one set of rules for
computing its taxable income, rather than different rules in each Member State where it operates. The
consolidated tax base would be apportioned on the basis of a fixed formula comprising three equally
weighted factors: sales (by destination), labour and assets. Each Member State would apply its own tax
rate to the share of the tax base apportioned through the formula. Only the calculation and
apportionment of the tax base would be harmonised. Member States would retain the power to set their
own tax rates.
The CCCTB was proposed as an optional system. All companies, irrespective of size or whether they
had cross-border operations, would be entitled, but not obliged, to apply the system, provided that they
fulfilled the eligibility requirements of the Directive. The proposal also includes anti-abuse rules and
stipulates how Member States should administer the CCCTB under a 'one-stop-shop' approach.
In 2011, the CCCTB was primarily envisaged as a tool for removing tax obstacles which companies
occasionally suffer when they operate cross-border within the internal market. Companies would thus
benefit from cross-border loss relief, which is an automatic outcome of consolidation (i.e. no more
paying tax on profits in one Member State to the extent that unrelieved losses are being made at the
same time in another Member State). The apportionment of the tax base through a formula would
remove the requirement for lengthy and costly recording and negotiating of intra-group transactions at
notional arm's length prices (i.e. no more transfer pricing within a CCCTB group). Accordingly,
compliance costs would be reduced by providing for a single set of tax rules for calculating the tax
base. Having a common set of rules would also reduce the possibility of double taxation or double non-
taxation and mismatches in general.
Intensive technical discussions followed in Council. After a first reading was completed, the High
Level Working Party (HLWP) agreed in March 2013 that work on the proposal should be structured as
a step-by-step approach and Member States should prioritise the matters related to the tax base.
Accordingly, consolidation would have to be addressed in a second step once the work on the base
would have been sufficiently advanced. At the time, Member States also stated that the proposal was
not yet ready for a political discussion.
After technical work on the elements of the tax base was accomplished, attention shifted towards
highlighting the link between the CCCTB and the OECD initiative against Base Erosion and Profit
Shifting (BEPS). In this framework, discussions focussed on the international aspects of the tax base as
well as certain elements of the CCCTB system, such as controlled foreign company (CFC) legislation
and the interest limitation rule. Both are closely linked to the OECD BEPS work.
At the informal ECOFIN of October 2014, the Council discussed how to make concrete progress on the
CCCTB in the short to medium term. It was concluded that future work should primarily be centred on
the international aspects of the system.
On 28th January 2016 and while work on the re-launched CCCTB proposal was progressing, the
Commission tabled a proposal for a directive against tax avoidance practices. As a matter of fact, the
proposed instrument included most of the elements of the international and BEPS related aspects of the
CCCTB in an effort to lay down a coordinated approach to implementing certain common minimum
standards against tax avoidance in the EU.

8
2. THE PROBLEM AND WHY THE EUROPEAN UNION SHOULD ACT
2.1. Problems with corporate taxation in an international context
Drivers
The taxation of multinational companies has increasingly come under scrutiny in recent
years. The business models of multinational companies have become more complex and
increasing evidence suggests that considerable amounts of corporate income can avoid
taxation.
The root of the problem stems from current international practices for the distribution of
taxable profits in combination with the increase in capital mobility over the last decades.
Capital mobility within the EU has been fostered by the increased economic integration
following key achievements towards a single market and the implementation of a
common currency in the euro area. While this has helped businesses in their cross-border
activities and increased welfare of citizens, the increased capital mobility conflicts with
the lack of coordination of tax policies at the international level. Not only do tax
obstacles still exist in the single market, but tax authorities also struggle to determine
which country should own the rights to tax which share of a multinational's income.
Figure 1: Problem tree
Source: European Commission
The interplay between these factors creates incentives for governments to compete for
highly mobile tax bases, notably accounting profits as well as income related to
intangible assets. In fact, the economic literature shows that governments have reacted to
increased mobility by reducing the statutory corporate tax rates while broadening the tax
bases to lower the risk of profits being shifted outside the country. Governments have
also implemented specific regimes to attract highly mobile tax bases such as royalty and

9
license payments. This form of tax competition increasingly replaces tax competition
based on headline statutory tax rates and opens up new non-transparent tax planning
opportunities.8 Recent evidence points to tax competition being particularly strong within
the EU due to the high economic integration and low trade costs within the EU (Streif,
2015).9 The continued strengthening of the single market with respect to goods, capital
and labour in the absence of tax harmonisation has intensified this effect (Redoano,
2014).
While incentives for tax competition have increased, there is at the same time a tendency
to protect domestic tax bases through anti-avoidance rules. Introducing anti-abuse
measures by Member States is a valuable short-term solution to fix the most pressing
issues. However, the uncoordinated implementation of such measures can create new
barriers to cross-border investments and thereby hamper the overarching goals of the
single market, the creation of a capital markets union and the overall attractiveness of the
EU at the global level. Moreover, they render the international corporate income tax
(CIT) system ever more complex, which in itself may exacerbate the tax avoidance
problem. More generally, uncoordinated national actions contribute to creating new tax
mismatches and loopholes that can be exploited by multinational firms.
Problems
Improvements in the tax area to the functioning of the single market have brought some
key advantages to multinational companies active in several EU countries. Notably, they
benefit from withholding tax exemptions on intra-group interest, royalty and dividend
payments and from tax-neutral cross-border reorganisations10
, as well as a fairly narrow
application of controlled foreign company (CFC) rules between most EU Member
States.11
In short, they are treated as if they were operating only domestically. At the
same time, their multinational group structure allows them to exploit mismatches in the
interaction of national tax systems, locate intellectual property where they achieve the
most attractive tax savings and treaty-shop in the EU for the most attractive withholding
tax regimes vis-à-vis a specific third country.
The existence of tax avoidance in the form of profit shifting and base eroding practices is
demonstrated in many academic studies. Although the extent of these practices and their
impact on total tax revenues is hard to measure, the existing evidence suggests it is
considerable. The OECD/G20 BEPS report on Action 11 for example estimates the
revenue loss at the global level at 4-10% of CIT revenue, i.e. USD 100-240 billion
8 Evidence for tax competition and the evolution of tax rates and bases in the EU have been summarised
in the Staff Working Document accompanying the June 2015 action plan (European Commission,
2015b). 9 Low trade costs have two effects: (1) they tend to concentrate foreign direct investment from third
countries in one Member State, from where other Member States are reached via exports instead of
investing more evenly in the EU; (2) with decreasing trade costs, foreign direct investment within the
EU might become relatively less attractive compared to intra-EU exports. 10 According to the rules laid down in the Merger Directive, the Parent-Subsidiary Directive and the
Interest and Royalty Directive. 11 Following the European Court of Justice Decision, the fundamental freedoms imply that CFC rules in
the EU only apply to wholly artificial arrangements. The situation is slightly different in Denmark
(where CFC rules also apply to domestic cases), Lithuania (which applies a white list for EU countries,
but subject to conditions) and the UK (which has not implemented a specific clause for the EU) (see
page 58 of ZEW (2016c) for a discussion).

10
annually at 2014 levels. In a study covering 51 countries, the IMF concludes that "the
(unweighted) average revenue loss is about 5 per cent of current CIT revenue – but
almost 13 per cent in non-OECD countries". Additionally, a recent study commissioned
by the European Parliamentary Research Service finds that the revenue loss from profit
shifting amounts to about EUR 50-70 billion in the EU, equivalent to 17-23% of CIT
revenue in 2013.
Other studies have not attempted to measure the total revenue loss, but are nonetheless
indicative of the potential size of the problem. Lee et al. (2015) find that 22% of
companies in their sample have a 'large tax gap', meaning that their tax payments
correspond to at most 90% of the taxes they would theoretically owe according to where
they generate their revenues. Furthermore, there is evidence of the sensitivity of affiliates'
profits to CIT rates: reported profits are higher in low-tax jurisdictions than in high-tax
jurisdictions.12
Synthesizing 25 studies, Heckemeyer and Overesch (2013) find that an
increase in the CIT rate by 1 percentage point leads to a lowering of affiliates' pre-tax
profits by 0.8% on average.
An important cross-border tax obstacle for companies active in several Member States is
having to deal with up to 28 different rulebooks and up to 28 different tax
administrations. They also have to deal with international rules set by bilateral tax
treaties between Member States. In addition, they are faced with an extremely complex
system for determining how intra-group transactions should be taxed (transfer pricing),
and often cannot offset their losses in one Member State against profits in another.13
The
result is that most businesses are faced with high costs and complexities, while smaller
businesses are often completely deterred from expanding within the EU. This could be
particularly detrimental for young companies that foster innovation dynamics and are an
engine of job creation. Cross-border obstacles hindering the functioning of the single
market motivated the 2011 proposal for a CCCTB14
and most of the 2011 findings on
these obstacles are still valid today. A majority of companies find the current regimes
difficult to operate, particularly transfer pricing requirements and dealing with audits in
various Member States.15
The latest available statistics under the EU arbitration
convention show that the number of pending disputes has further increased since 2008
and the number of requests to resolve disputes has also gone up in recent years.16
Moreover, the growing number of anti-avoidance regulations adds to the complexity of
the international corporate tax system, potentially creating additional double taxation
cases and leading to higher administrative costs for both businesses and administrations.
Consequences
The negative consequences resulting from corporate tax avoidance, the complex
international tax system and other tax obstacles are manifold, but they particularly raise
12 See Sullivan (2004) and Clausing (2011). 13 Denmark is one exemption, where corporations can opt for international joint taxation for the group. 14 Corporate taxation has been recognised much earlier as a fundamental component of the single market.
See e.g. the 2000 report by the CEPS Tax Task Force, Radaelli (2000) and the discussion in annex X. 15 These findings are based on a 2013 review of methods to compute compliance costs (Ramboll
Management Consulting, The Evaluation Partnership and Europe Economic Research, 2013). 16 The EU arbitration convention establishes a procedure to resolve disputes where double taxation
occurs between enterprises of different Member States as a result of an upward adjustment of taxable
profits by one Member State.

11
issues of fairness among taxpayers and may constitute barriers to cross-border
investment. Tax avoidance leads to a poor congruence between the jurisdiction where the
value is created and the one where corporate profits are taxed. This contributes to an
unfair distribution of the tax burden, alongside a tendency of national governments to
respond by tapping less mobile tax bases, an additional benefit for multinational
businesses. In the light of fiscal adjustment needs following the economic and financial
crisis (public debt levels have increased in the EU from around 58% of GDP in 2007 to
an estimated 86% of GDP in 2017), many governments have cut expenditures and
increased taxes, notably on consumption, to consolidate public budgets. This has raised a
question about multinationals and their fair contribution to government budgets.
There is clear evidence for an uneven playing field between multinational entities and
domestic firms. A recent study by the ZEW (2016c) has shown that the use of cross-
border tax planning in the EU can considerably reduce effective taxation levels (Table
1).17
Tax planning reduces both the mean effective average tax rate (EATR) in the EU as
well as the minimum and maximum EATRs18
. The average reduction is substantial.
Lower effective taxation levels for multinational entities have also been evidenced
empirically. For instance, Egger et al. (2010) compare the tax liabilities of multinationals
with those of domestic firms and find that foreign-owned affiliates in high-tax European
countries pay 32% less tax than domestically owned companies. A similar study by Finke
(2013) for Germany finds a gap of 27%.
Table 1: Impact of tax planning on effective average tax rates
% Mean Min Max Average EU-28
percentage reduction
Effective average tax rate domestic case 21.1 9.0 38.3 n/a
Effective average tax rate after cross-
border tax planning via
Hybrid financing 13.7 4.3 26.6 -36.3%
Intellectual property box (patent box) -1.6 -3.7 1.8 -108.3%
Financing via offshore treaty 15.9 6.4 28.6 -25.0%
Source: ZEW (2015, 2016c) and own computations
Notes: Hybrid financing: A parent located in the EU or the US finances an intermediate company located in an 'EU
average' country which grants a 'hybrid loan' to a subsidiary located in the EU. The hybrid loan is treated as
equity in the EU average country and as a loan in the subsidiary country.
Intellectual property box: A parent located in the EU finances both, an intermediate company in an EU
country that has an attractive intellectual property box regime and another subsidiary in the EU or the US.
The intermediate company licenses the intellectual property to the subsidiary and receives royalties from the
subsidiary. The figures show the extreme case where the intellectual property is the only productive asset of
the multinational. .
Financing via offshore treaty: A parent located in the EU or the US finances an intermediate company located
in a zero-tax country which has concluded tax treaties with EU countries. The intermediate company grants a
loan to a subsidiary located in the EU and receives interest payments from the subsidiary.
Mean: In the domestic case the mean is the simple EU-28 average, while in cross-border cases, the mean is
the average over all possible combinations of parent-subsidiary locations in the EU-28 and the US.
17 The possibilities for hybrid loan financing by corporate groups and the ensuing double-non taxation
have been reduced due to the 2014 amendment of the Parent-Subsidiary Directive, effective as of
2016. 18 Effective average tax rates are driven by the respective statutory CIT rate in each country, which partly
explains the wide spread.

12
Aside from the harmful perception of the tax system being unfair, including its negative
impact on taxpayer morale (see discussion in Section 5.1), the resulting competitive
distortions weigh negatively on the economy. Tax avoidance and aggressive tax planning
by multinational companies distort price signals in the single market and thereby the
allocation of resources. A recent study by the OECD estimates that mark-ups of
multinational entities are on average 10% higher than those of domestic groups with
similar characteristics while the mark-up of a tax-planning MNE is up to 23% higher. For
multinational groups with links to zero-tax countries or operating in a large number of
countries the mark-ups are estimated to be even higher. Multinational enterprises are also
found to operate in more concentrated industries.19
Companies which use tax avoidance
are more profitable and face lower capital costs compared to domestic companies. Higher
mark-ups weigh on growth and are detrimental to equality.20
In addition, important
economic resources are wasted on unproductive tax planning activities.
On the other hand, the negative consequences highlighted in the 2011 impact assessment
remain: high tax compliance costs and double taxation risks coupled with few
possibilities for cross-border loss offset constitute an important barrier to cross-border
investment and impede the EU's attractiveness as an investment destination.
The main findings on tax compliance costs for firms from the 2011 impact assessment
were that they are high and significant, mostly due to frequent changes and complexity of
tax laws, and that they are regressive: The estimate for large companies is about 2% of
taxes paid, while for small and medium sized enterprises (SMEs) the figure is about 30%
of taxes paid. These findings are confirmed in a survey of empirical estimates by
Eichfelder and Vaillancourt (2014) for the period between 1984 and 2014. Research also
shows that those compliance costs do not appear to be diminishing over time.21
Evidence on cross-border tax compliance costs remains scarce, even though they are
arguably higher than in the domestic case since the rules of two countries have two be
applied in addition to international tax rules which have to be considered (double tax
treaties). In line with this, the 2011 impact assessment finds that compliance costs
increase with cross-border activity and with increasing number of subsidiaries. Early
contributions such as the 1992 Ruding report provide a first survey of cross-border
compliance costs for EU companies, which were found to be at around 3% of total
income of the surveyed companies.22
A more detailed overview of the main findings on
tax compliance costs is provided in annex VII.
2.2. Corporate taxation and its impact on financing and investment
decisions
Implementing a European corporate tax base offers the opportunity to create a more
neutral and investment friendly tax system. This would contribute to a successful capital
markets union, attract inward investment to the EU, and result in a more resilient
19 See OECD (2015d), p. 169. 20 See Ilzkovitz and Dierx (2016) for a discussion. 21 See Lignier and Evans (2012) and Lignier, Evans and Tran-Nam (2014). 22 The summary of compliance cost issues in annex 2 of the 2001 Communication on tax obstacles in the
internal market provides a summary of the results of the Ruding survey as well as a discussion of the
literature available at the time.

13
corporate sector by removing financing distortions.23
Taxation is indeed a key component
of the business environment. It influences companies' investment and innovation
decisions through its impact on the cost of capital. Two issues stand out in particular: the
debt bias and the tax treatment of R&D expenditures.
2.2.1. Debt bias
Drivers and problems
Most corporate tax systems favour debt over equity because interest expenses for debt are
largely tax deductible in contrast to equity costs. The result is a difference in effective
taxation between investments financed by debt and those financed by equity. The debt
bias has been recognized by the European Commission and other relevant international
organisations as a major problem.24
Figure 2: Cost of capital - difference between new equity and debt financing
Source: ZEW (2015, 2016a)
Note: The graph shows the cost of capital at the level of the company for new equity and debt as well as the
difference between them for each Member State in 2015. The indicator takes into account the ACE provisions
in Belgium and Italy. The assumption is that the notional interest rate granted is equal to the market interest
rate in the model. This results in full financing neutrality.
Because of this different tax treatment, an equity financed investment needs to earn a pre-
tax return that is higher than the one required by a debt financed investment. In a
concrete example this means that if the investing company has an alternative safe
investment that earns 5%, the investment financed by debt would need a pre-tax return of
23 This is in line with the tax recommendations in the European Semester. 24 See for example the various Annual Growth Surveys published by the European Commission in the
context of the European Semester, the action plan on building a capital markets union, the publications
of the International Monetary Fund (IMF, 2009, 2010; de Mooij, 2011a) or the Organisation for
Economic Cooperation and Development (OECD, 2015a), and the Financial Stability Board (2015).

14
only 4%, while equity needs to earn 6.1%.25
Figure 2 presents this 'required return' - also
called cost of capital - for Member States in 2015. It shows that the bias is present in
nearly all countries, as the cost of capital for investment financed by new equity is larger
than the cost of capital for investment financed by debt.
Consequences
There is ample empirical evidence that the corporate debt bias significantly affects
financing decisions of companies, both in the financial and the non-financial corporate
sector. In the non-financial sector, de Mooij (2011b) finds that a 10 percentage point
higher corporate tax rate increases the debt-asset ratio by between 1.7 and 2.8 percentage
points.26
The result is an increased indebtedness of non-financial companies due to the
debt bias.27
The debt bias encourages non-financial corporations to use more debt than equity. The
higher leverage makes companies more fragile and less resilient and may result in an
increased volatility of the business cycle and disproportionate levels of bankruptcy costs.
Indeed, Sørensen (2015) estimates that the debt bias leads to a debt-asset ratio which is
about 2-3 percentage points above the socially optimal level28
. This is partly attributed to
the fact that firms do not account for the welfare costs of financial distress when
choosing their debt levels.
The debt bias also has a negative impact on growth. According to research conducted at
the Bank for International Settlements, debt levels exceeding 90% of GDP for the non-
financial corporate sector become deleterious for growth.29
This negative effect of debt
on growth is also identified by the European Central Bank (2014, p. 112). In 2014 the
non-consolidated non-financial corporate debt level in percent of GDP was above that
level in 18 of the 28 Member States and was above 150% in six of them.30
The debt bias misallocates capital and may hamper the growth of stock market
capitalization, the latter being associated with higher GDP per capita. In addition, the
debt bias is particularly detrimental for young and innovative firms, whose access to
external funding is more difficult. Thus it puts at a disadvantage exactly those firms that
are important for economic growth (including by slowing down the exit of highly-
indebted low-productivity firms). As a consequence the welfare costs associated with the
25 Annex X explains the underlying model. 26 This result could be a lower bound: recent studies that rely on tax return data rather than commercial
balance sheets find that the estimated tax effect on capital structure using financial statements is likely
to be biased downward. Devereux et al. (2015) show that the external leverage of domestic stand-alone
companies and of multinational companies responds strongly to corporate tax incentives. 27 Taxation is not the only driver of indebtedness but econometric techniques allow disentangling the
respective effects of the various drivers and point to a large role for taxation. 28 The socially optimal level is defined as the one that maximises total rent to society generated by an
investment. See also equation 3.1 in Sørensen (2015). 29 See Cecchetti et al. (2011). 30 Source: Eurostat. Latest available data. The instruments that are taken into account to compile debt of
non-financial corporations are Debt securities (F.3) and Loans (F.4). Data are presented in non-
consolidated terms, i.e. including transactions within the same sector.

15
lack of deductibility of the cost of equity for young and innovative firms may be
particularly relevant. Overall, the welfare impact is not negligible.31
Recent research has also shown that despite stricter capital requirements for banks, the
debt bias also plays a significant role in the financing structure of financial institutions, in
clear opposition with the aims of regulations strengthening the equity base. For banks
with an amount of equity larger than the minimum regulatory requirement, the
responsiveness of the debt-asset ratio to corporate tax rate increases is similar to the one
for the non-financial sector.32
Moreover, the adverse impacts in the non-financial and
financial sectors reinforce each other to the extent that the sectors provide funds to each
other. By discouraging firms from building a strong equity base and tapping capital
markets, the debt bias has contributed to excessive leverage also in the financial sector
and potentially magnified the negative effects of the financial crisis: Langedijk et al.
(2014) and de Mooij et al. (2014) find that eliminating the debt bias could decrease both
the likelihood of financial crises and their costs for public finances. The potential gains
from the reduced probability and cost of crises are estimated by both studies to be
between 0.5 and 11-12% of GDP (reflecting the low and high range of tax elasticities).
Finally, the preferential tax treatment of debt generates opportunities for aggressive tax
planning. At a cross-border level, the deductibility of interest expenses creates
opportunities to decrease reported profit via debt-shifting – for example by using hybrid
instruments (considered as equity in one country, but as debt in another).33
Figure 3
summarises the different drivers and consequences of the debt bias.
31 See Fatica et al. (2013, p. 11) for a discussion. 32 Empirical evidence for the debt bias in the financial sector is among others provided by Gropp and
Heider (2010), Hemmelgarn and Teichmann (2014) and Keen and de Mooij (2012). 33 Huizinga et al. (2008) provide empirical evidence for this type of profit shifting.

16
Figure 3: Problem tree – Debt Bias
Source: European Commission
2.2.2. The tax treatment of R&D expenditures
Drivers
R&D investment is a key driver of productivity and economic growth. However, private
companies do not sufficiently invest in R&D from a welfare perspective. The reason is
that companies do not take into account the positive externality from knowledge
spillovers which benefit the whole economy. Indeed, the social returns from R&D
investment are estimated to be two to three times higher than the private returns of firms
on the investment.34
In addition, the risk and the uncertainty of returns are much higher
for R&D investments and their returns are highly skewed, which again leads to lower
investment.35
The IMF (2016) shows that fully internalizing the externalities of R&D
would lead to 40% higher investments compared to the status quo. Such an increase
could lift GDP in individual economies by 5% in the long term - and globally by as much
as 8% due to international spillovers.
34 See Parsons and Phillips (2007), Sveikauskas (2007), Bloom, Schankerman, and van Reenen (2013). 35 See Scherer and Harhoff (2000).

17
Figure 4: Evolution of business R&D intensity, 2000-2014
Source: DG Research and Innovation, based on Eurostat and OECD data. Business R&D spending in % of GDP
Notes: Business R&D intensity measured as business R&D expenditure in % of GDP.
(1) South Korea: break in the series between 2007 and the previous years.
(2) USA: business enterprise expenditure on R&D (BERD) does not include most or all capital expenditure.
(3) China: break in the series between 2009 and previous years.
Problems and Consequences
The underinvestment in business R&D is particularly pronounced in the EU. While the
world is becoming more R&D-intensive, the relative weight of the EU is decreasing,
mainly due to the rapid rise of China. The EU is moreover not on track to reach its target
of investing 3% of GDP in (total private and public) R&D by 2020. The underinvestment
in business R&D is one of the reasons behind the widening of the EU's productivity gap
compared to the US. The shortfall mainly reflects a deficit in business R&D expenditure.
Business in the EU spend far less on R&D than businesses, e.g. in the US and Japan, and
the latest figures show a further increase of the gap (Figure 4). To reach the 3% R&D
target, large additional R&D investments are needed. Assuming that two thirds of the
investment should come from the private sector, the business R&D investment gap was
EUR 98 billion in 2014.
0.5 %
1.0 %
1.5 %
2.0 %
2.5 %
3.0 %
3.5 %
2000 2005 2010 2015
South Korea(1)
Japan
United States(2)
China(3)
EU

18
Figure 5: R&D intensity and business R&D intensity projections for the EU
Source: DG Research and Innovation, DG Eurostat
Notes: R&D intensity is measured as R&D expenditure in % of GDP.
(1) The projections based on trends are derived from compound annual growth in R&D intensity and business
R&D intensity between 2007 and 2014.
(2) R&D intensity: the projection is based on R&D intensity target of 3% for 2020.
(3) Business R&D intensity: the projection is based on a business R&D intensity target of 2% for 2020.
R&D tax incentives are an important policy tool, which is now used by the majority of
EU countries (and beyond). In response to the challenging economic environment, almost
all Member States widened their R&D tax incentives and five other countries have
introduced new measures.36
The OECD (2016) estimates that R&D tax support
accounted for at least 43% of fiscal support for business R&D in 2013. However, not all
measures are effective.37
The diversity of schemes could result in an increasingly
complex landscape for R&D tax treatment in Europe hindering trans-European
collaboration. In its 2006 Communication on the more effective use of tax incentives in
favour of R&D, the Commission already encouraged Member States to improve the use
and coordination of R&D tax incentives. Figure 6 summarises the different elements
discussed above in a problem tree which relates drivers, problems and consequences.
36 See Garnier et al. (2014) for an overview of tax reforms in the EU. 37 Governments can draw on several experiences with the design of R&D tax incentives given that such
schemes have been deployed in most advanced economies over the last decade or longer. These
experiences are evaluated in a study by CPB (2014) carried out for the European Commission in 2014
which also benefited from exchanges with Member States representatives and concluded with a list of
good practices in terms of the design of R&D tax incentives.
Trend (1)
Target (2)
R&D intensity
Trend (1)
Target (3)
Business R&D intensity
0.5
1.0
1.5
2.0
2.5
3.0
3.5
2005 2010 2015 2020

19
Figure 6: Problem tree – R&D
Source: European Commission
2.3. How the problems affect stakeholders
Multinational enterprises are negatively affected by the problems outlined above to the
extent that they have to deal with numerous national tax systems which creates high
compliance costs and uncertainty. On the other hand, some companies do benefit from
the tax planning opportunities generated by the current international tax architecture.
SMEs face high costs of investing and growing abroad due to differences across national
tax systems. There is no level-playing-field since SMEs cannot reduce their tax burdens
by tax planning measures which leads to distortions in the internal market and raises
fairness issues.
The current tax systems provide incentives for Member States to possibly engage in
harmful tax competition to attract highly mobile tax bases. As a consequence of such tax
competition, some Member States will lose tax bases, while others gain from adopting
tax provisions that are advantageous for attracting mobile tax bases.
Citizens perceive the fairness of tax systems being hampered by the fact that some
taxpayers have means to reduce their tax burden significantly by playing with the rules.
This perception can reduce overall tax morale and more broadly damage the social
contract between citizens and governments.
2.4. Baseline scenario based on recent developments
The baseline scenario assumes that the CCCTB as tabled in 2011 is withdrawn. It reflects
the latest initiatives to clamp down on corporate tax avoidance and ensure fair and
efficient taxation in the EU. The June 2015 action plan acknowledged that the CCCTB is
a very ambitious proposal that would require time to be completed. It identified several

20
actions aimed in the shorter term at enhancing effective taxation where profits are
generated, creating a better tax environment for business, enhancing tax transparency and
strengthening EU tools for coordination.
Following the crisis and the increased revenue needs, the OECD proposed an action plan
on base erosion and profit shifting (BEPS) to reinforce the current international tax rules
and stabilise national tax bases. The BEPS project focuses on the interaction of different
(national) tax rules and tries to detect and close loopholes in the current tax architecture.
The action plan laid the basis for developing an EU approach38
to implementing some
international aspects of the common base that are linked to the OECD/G20 BEPS project.
As a result, the Commission proposed in January 2016 the Anti-Tax Avoidance Package,
made up of four proposals to ensure that tax is paid where the value is generated and that
tax information is effectively accessed. The elements of the package are detailed in annex
VIII. Its central element is the Anti-Tax Avoidance Directive39
, which was politically
agreed by the Council on 21st June 2016 and legally adopted on 12th July 2016. It puts
forward tax rules aimed at preventing that income goes untaxed (or taxed at very low
level), inter alia an interest limitation rule, controlled foreign company rules, and rules
on hybrid mismatches.
The other elements of the package consist of: (i) an Amendment to the existing Directive
on administrative cooperation to implement automatic exchange of information on
country-by-country reports of multinational companies with consolidated revenues of at
least EUR 750 million; (ii) a Recommendation on Tax Treaty issues; (iii) a
Communication on External Strategy for Effective Taxation setting out a coordinated EU
approach against external risks of tax avoidance and to promote international tax good
governance.
The Anti-Tax Avoidance Package complements existing initiatives and forums to ensure
an effective taxation, enhance tax transparency and address the risk of double taxation.
The proposal for an automatic exchange of information on tax rulings was adopted by the
Council in December 2015. A proposal to introduce public reporting requirements for
multinational entities with turnover above EUR 750 million was adopted by the
Commission in April 2016. In line with the action plan of June 2015, the Commission is
currently exploring various options for a coordinated EU approach to improve dispute
resolution mechanisms, following a public consultation. The Commission is also willing
to respond to the invitation for tabling a proposal on hybrid mismatches involving third
countries, as this arises from the statement which accompanied the political agreement on
the Anti-Tax Avoidance Directive.
Thus the baseline scenario, against which all policy options will be evaluated, is one in
which there is no CCCTB, but the Anti-Tax Avoidance Package and public country-by-
country reporting are implemented.
38 This would allow for a coordinated implementation of the new international standards agreed in the
package. The Treaties require that the fundamental rights – including the freedom of establishment –
be respected. Reforms must therefore be tailored for the EU content and fix inconsistencies on an EU-
wide basis. 39 10426/16 FISC 104 ECOFIN 628

21
2.5. Subsidiarity and proportionality, EU added value
Subsidiarity
Although the problems and market distortions explained in the previous subsections have
distinct origins, it seems that their harmful effects can be tackled effectively only through
a common solution: that is, the approximation of corporate tax regimes in the EU would
mitigate distortions in the market by creating a fairer and more coherent tax environment
for businesses. For this objective to come into fruition, action is necessary to be taken not
separately by Member States in an uncoordinated fashion, but at the level of the Union
instead. Initiatives, planned and implemented by each Member State individually, would
only perpetuate, or even exacerbate, the current situation, as taxpayers would still need to
deal with 28 diverse and sometimes, conflicting tax systems.
The envisaged re-launch of the CCCTB aims to respond to the need for increased growth
and job creation in the post-crisis EU, as well as countering aggressive tax planning
practices. All these objectives essentially seek to tackle problems beyond a single
Member State which by nature require a common approach. In this light, any measures
could only bring results if the rules were applied in a uniform fashion across the single
market. If not, the landscape in the field of corporate taxation would remain fragmented
and the current situation would persist, allowing fiscal obstacles and unfair tax
competition practices to continue to flourish.
What is more, tax avoidance practices are nowadays primarily set up in a cross-border
context. It is indeed the interaction between different tax systems that generates
opportunities for abuse or facilitates taking advantage of mismatches in the interaction of
national corporate tax rules. In addition, the fact that the EU is an internal market with a
high degree of integration presumes enhanced cross-border activity, which underscores
the significance of agreeing to coordinated solutions.
More specifically, most key features of the CCCTB system, such as relief for cross-
border losses, tax-free internal group restructurings, the elimination of complex intra-
group transfer pricing as well as the apportionment of revenues by a formula at the level
of a group have a cross-border underpinning and could only be addressed within a
context of common regulation.40
Thus, the EU added value follows from the fact that a
certain degree of uniformity is necessary for the purpose of effectively tackling identified
distortions in the market caused by mismatches, double taxation or non-taxation.
Common rules are also a prerequisite for creating a 'one-stop-shop' for companies or
groups of companies operating across the EU.
Considering the scale and effects of the envisaged CCCTB, its objectives would be better
achieved at Union level, to attenuate the distortions resulting from the current interaction
of 28 national tax regimes and create more favourable conditions for cross-border
investment in the single market.
Proportionality
The envisaged measures are both suitable and necessary for achieving the desired end.
They do not go further than harmonising the corporate tax base, which is a prerequisite
40 For an overview of the elements of the CCCTB mentioned here see also annex X.

22
for curbing identified obstacles that distort the single market. Furthermore, the explored
initiatives do not restrict Member States' capability to determine the composition and
desired amount of tax revenues that they collect in order to meet their budgetary policy
targets. In this regard, they do not affect Member States' sovereignty over setting their
own corporate tax rates.
Although the Commission has consistently promoted the coordination of national tax
practices, coordination alone is not sufficient for eradicating tax-related distortions in the
single market. Experience has shown that coordination is a slow process and the results
of such exercises have hitherto been modest. Moreover, tax coordination typically
addresses only specific, targeted issues and cannot cater for the wide variety of problems
faced by companies in the single market.
The rules would contribute to improving the functioning of the single market through a
more efficient way for collectively managing problems that emerge from the interaction
of disparate national corporate tax systems.
EU added value
The taxation of multinational companies in a framework of national corporate tax
systems and bilateral tax treaties faces considerable challenges. While the integration of
markets has made progress and generates benefits for companies as well as for citizens,
the taxation of income from corporate activities across the EU remains a national task.
This can lead to frictions in the single market due to tax obstacles.
In this context, the value-added of EU action is to maintain and further improve capital
mobility within the Union by decreasing compliance costs and tax obstacles. At the same
time, EU action ensures that the activities of multinational companies within the EU do
not avoid a fair level of taxation. An integrated EU approach to the taxation of corporate
income allows Member States to tax the income generated within their boundaries with
the corporate tax rate they consider appropriate. A common approach to an EU tax base
therefore helps to re-establish the link between taxation and value creation. Acting at EU
level would not only replace the current mechanism of taxing corporate profits with a
system based on attributing income where the real economic activity takes place, it
would also eliminate the costly transfer pricing procedures since the tax base would be
consolidated at EU level.
3. OBJECTIVES
The June action plan announced the CCCTB as a proposal to strengthen the single
market by ensuring a fair, efficient and growth-friendly corporate tax system which is
immune to aggressive tax planning practices and based on the principle that companies
should pay taxes in the country where profits are generated. Work on this impact
assessment has led to the identification of the following general and specific objectives,
which are consistent with those of the action plan.

23
3.1. General objective: Enhancing the fairness of the tax system
A first important aim is to enhance the fairness of the tax system by addressing some of
the root causes of corporate tax avoidance by multinational companies. The specific
objectives supporting this general goal are to
(i) significantly reduce cross-border tax planning possibilities;
(ii) create a more level playing field between domestic and multinational companies;
(iii) ensure that companies pay a fair share of the tax burden; and
(iv) enhance general tax payer morale, which is currently seriously undermined by a
strong perception that international players are largely escaping taxation.
3.2. General objective: Stimulating growth and investment
The improvement of the business environment by removing single market tax obstacles
was the central objective of the 2011 CCCTB proposal. This objective remains important
in order to maintain or even enhance the competitiveness of companies in the EU and is
reflected in the 10 Commission priorities which put an emphasis on strengthening jobs,
growth and investment as well as the single market.41
The specific objectives to support
this goal are to
(i) significantly simplify within the EU the currently highly complex international
system of corporate taxation to reduce compliance costs and administrative burden;
and
(ii) eliminate double taxation risks within the EU and remove still existing
discriminations and restrictions.
Supported by lessons learned following the financial crisis and given the still modest and
uneven economic recovery, two more objectives have been identified that a reform of the
corporate tax system for the EU should deliver:
(iii) provide an approach to profit taxation that does not distort investment and
financing decisions; and
(iv) create more incentives to invest in the EU, inter alia by supporting R&D and
innovation to safeguard and enhance current welfare levels.42
In light of the current
underinvestment in business R&D (compared to its importance for innovation,
productivity and economic growth), a minimum requirement should be that the
preferred option maintains the current tax incentives for R&D expenses. Incentives
going beyond the current levels in the EU need to be balanced against the revenue
costs for providing such incentives.
41 The 10 priorities are summarized here: https://ec.europa.eu/priorities/index_en. 42 This is in coherence with the Commission's objective to stimulate more investment and jobs in Europe
under the Investment Plan.

24
One should note that there is a trade-off between the general objectives. Notably,
reducing costs for companies and fostering investment by more attractive allowances and
deductions could in some cases be difficult to reconcile with ensuring effective taxation
by reducing tax planning opportunities. In addition, it can also impact tax collection.
Therefore the two general objectives need to be balanced. The objective to stimulate
growth and investment needs to be put in coherence with the objective of enhancing the
fairness of the tax system and should not result in more tax planning opportunities.
Notably, experiences with some of the measures taken at national level to tackle the debt
bias and to promote R&D point to the need for a specific anti-abuse design. Provided that
due attention is given to the design and anti-abuse framework, reforms in these areas
would actually provide for an opportunity to tackle specific tax avoidance channels. For
example, addressing the debt bias could remove opportunities for groups operating cross-
border to shift profit via the debt instrument.
4. POLICY OPTIONS
In line with the action plan of June 2015 and the existing CCCTB proposal, the main
option for a policy proposal will centre on the CCCTB as proposed and discussed in the
Council since 2011 (see Box 1). This is in the following referred to as the 'central
scenario'. The impact of having an interim stage without consolidation and
apportionment, but with the possibility of some form of cross-border loss relief has also
been examined (Sections 4.5 and 5.5). A key element within the options for a CCCTB is
its scope (Sections 4.2 and 5.2), determining which taxpayers should be subject to
mandatory application of the CCCTB and which taxpayers could be allowed to opt into
the system. Further, there are naturally many different options to choose from for the
design of the CCCTB. Most of the relevant design elements have been evaluated
thoroughly in the preparations for the 2011 proposal. Discussions have subsequently
progressed in Council. The present impact assessment therefore focusses on assessing
options for new elements that were not yet discussed in the earlier proposal: measures to
tackle the debt bias (Sections 4.3 and 5.3) and R&D tax incentives (Sections 4.4 and 5.4).
Table 2 gives an overview of the intervention logic by linking problems, objectives and
policy options as well as providing the context for the initiative.

25
Table 2: Intervention logic
Source: European Commission
The analysis focuses on the new elements that are added to the original proposal, but all
comparisons are always made against the 'no CCCTB' baseline scenario. Note also that
the additional options (debt bias solution, R&D incentives, etc.) are analysed here as
separate policy interventions, whereas they are in reality provisions of the corporate tax
base included in the CCCTB proposal and not separate proposals on their own.
4.1. Option 1: No further EU action
In case of no further EU action, the expected evolution of the current situation is as
described in the baseline scenario. Notably, the CCCTB would not be implemented, but
the Anti-Tax Avoidance Package is implemented and eventually public country-by-
country reporting by large multinational entities will be in place. The root problems
linked to current international practices for the distribution of taxable profits will largely
remain. Differences in the treatment of debt- and equity-financing are likely to continue
to push up indebtedness and bear on growth. Differences in the treatment of debt and
equity across Member States will continue to offer tax planning opportunities.
Differences in R&D tax incentives will continue to prevent the emergence of a single
market for research, and promote tax competition strategies for the location of
intellectual property, without increasing R&D activities. As a consequence, socially-
inefficient levels of R&D may remain. Overall, as the internationalisation of the global
economy is expected to continue, it is likely that tax avoidance strategies will continue to
be sought after. In the long term, a shift to those avoidance strategies that are not at the
centre of the more recent policy proposals can be expected. Even new strategies might be
created, circumventing the new anti-avoidance rules and other measures that most likely
will be in place in the near future.
CCCTBScope
(mandatory
CCCTB)
Debt bias
solution
R&D
incentives
General Objective 1: Enhancing the fairness of the tax system x
Reduce cross-border tax planning x
Level playing field between domestic
and multinational companiesx
Ensure that companies pay a fair share
of the tax burdenx
Enhance general tax payer morale x
General Objective 2: Stimulating growth and investment x x x x
Reduce compliance costs and administrative burden x
Eliminate double taxation risks and remove still existing
discriminations and restrictionsx
Debt bias in taxation Taxation neutrality for investment and financing decisions x
Underinvestment in R&D Creating more incentives to invest in the EU x x
Policy options
Cross-border
corporate tax avoidance
Context: Globalization, changing business models with increasingly mobile profits and tax bases, current international tax rules struggle with
determining the place of taxation, little tax coordination at the international level creates incentives for governments to engage in tax competition, impact on
distribution on tax burden and fairness
Single market: tax obstacles,
compliance costs
Problems Objectives
26
4.2. Option 2: CCCTB with a scope definition
To keep the exposition reasonably simple, only the main options for the scope are
outlined below. Where relevant, sub-options on various design questions will be
discussed in Section 5.
4.2.1. Option 2a: Optional for all firms
Under this option, the CCCTB would be fully optional. Given the magnitude of tax
savings that are currently achievable for those companies that use tax avoidance
strategies most aggressively (see evidence in Table 1), it is unlikely that potential
CCCTB benefits such as reduced compliance costs, enhanced R&D benefits or cross-
border loss offset suffice to make these firms opt into the CCCTB. Consequently, a fully
optional approach would not effectively fight tax avoidance and is thus not suited to
enhancing the fairness of the tax system. This option is therefore not considered further
in the analysis of impacts in Section 4.
4.2.2. Option 2b: Compulsory application for a defined set of firms and
possibility to opt in for all others
This option would make the application of the CCCTB compulsory for a defined set of
companies, while giving all others the option to apply the CCCTB. The criteria for
defining the compulsory element should ideally capture companies which are most
relevant in the corporate tax avoidance context to comprehensively address corporate tax
avoidance in the EU and not introduce any undue selectivity. Several criteria can
theoretically be envisaged, alone or combined: (i) a sectorial approach, (ii) an approach
targeting multinational entities via a definition of cross-border groups and (iii) a size
approach.
4.2.3. Option 2c: Compulsory application for a defined set of firms without
possibility to opt in for other firms
This option would make the application of the CCCTB compulsory for certain
companies, but would not allow other companies to opt into the CCCTB system. While
such an approach would be in line with the objective of fighting tax avoidance in the EU,
this option is clearly problematic vis-à-vis the equally important objectives of stimulating
growth and investment and creating a level playing field. If the CCCTB delivers on its
promise to provide for a simple corporate tax system which would reduce compliance
costs and double taxation risks in the cross-border context, preventing some companies
from applying the system is not appropriate. Indeed, to the extent that the CCCTB could
provide more attractive design and compliance features than national tax systems, such
an approach may imply granting an advantage on a selective basis which would be
contrary to State aid principles. It may also raise concerns in terms of discrimination
under the fundamental freedoms. Finally, stakeholders who expressed their views widely
support a possibility to opt in. About 60% of respondents are in favour and only 9%
reject the idea. Some of the opponents explain their rejection with concerns about tax
planning possibilities. Not granting the possibility to opt-in is therefore not retained as an
option in the analysis of impacts in Section 5.
4.2.4. Option 2d: Compulsory application for all firms
This option would replace all existing national CIT systems with the single set of rules
provided by the CCCTB. Member States would continue to determine tax rates at

27
national level. Thus all corporations in the EU, irrespective of their size, group structure
or cross-border activity would have to apply the CCCTB.
4.3. Option 3: Solutions to address the debt bias
4.3.1. Option 3a: No debt bias action
The no-action case assumes that the CCCTB does not provide any specific measure to
comprehensively address the debt bias. This implies that, as in the 2011 proposal, equity
costs are not deductible while interest expenses remain deductible, though with
limitations (notably those included in the Anti-Tax Avoidance Directive).
4.3.2. Option 3b: Non-deductibility of interest expenses
Disallowing the deductibility of interest expenses would align the treatment of debt and
equity costs.43
With full non-deductibility of interest expenses, interest limitation rules
would become obsolete.
4.3.3. Option 3c: Allowance for corporate equity (ACE)
An allowance for corporate equity grants a defined return for equity which is deductible
from the tax base. The defined interest rate is usually close to or linked to a risk-free
reference rate such as the interest rates of government bonds.44
Since the allowance is
computed by multiplying a defined rate on a definition of equity, an ACE does not
necessarily achieve full financing neutrality between debt and equity, but moves in any
case the system closer to neutrality.
The allowance can be designed in several ways. First, the allowance can apply to the total
stock of equity (stock-based) or to the difference between current equity and equity at a
specific date in the past (incremental-based). Second, the level of the defined rate can
vary with the reference interest rate. Third, the design can include anti-abuse measures to
avoid cascading of the benefits along the ownership structure of the corporate group.
4.3.4. Option 3d: Allowance for growth and investment (AGI)
The allowance for growth and investment is one specific version of an ACE. The AGI is
incremental with a moving reference date in the past. This means it is granted only for
the sum of equity increases over a specific period (e.g. 10 years in the past). Also, the
AGI foresees rules so that new capital can only benefit once from the deductibility.
4.3.5. Option 3e: Allowance for corporate capital (ACC)
Under this option, companies may deduct a defined return on total capital, i.e. the sum of
debt and equity. At the same time, it is no longer permitted to deduct actual interest
43 This option resembles a 1992 proposal from the U.S. Department of Treasury, called a Comprehensive
Business Income Tax (CBIT). However, the CBIT is more far-reaching as it complements the non-
deductibility of interest expenses with the non-taxation of interest income, an element which goes
beyond the EU's legal power to act. 44 The proposal goes back to a contribution by Devereux and Freeman (1991). It has been tested in
practice and with different designs. Currently, Belgium, Italy and more recently, Cyprus apply an
ACE. Austria, Latvia and Croatia also experienced an ACE. Portugal has an ACE for its SMEs (under
eligibility conditions) and is considering extending its scope. Other countries such as Turkey also
currently have an ACE.

28
expenses. Since there is only one rate applied to debt and equity, this option achieves full
financing choice neutrality.45
The need for a limitation rule for the allowance would have
to be examined. So far, it has not been implemented in practice. The same considerations
in terms of stock versus incremental, the reference rate and the possible anti-abuse
measures apply as for the ACE and the AGI.
4.3.6. Option 3f: Cost of capital allowance (CoCA)
The cost of capital allowance combines a defined interest on capital at the corporate level
with the inclusion in the profit of the shareholder of an amount equivalent to the ACE
deduction obtained by the corporation and instead of actual dividends and interest.46
The
CoCA is a far-reaching proposal that includes changes in the taxation of capital income
at the level of individuals. The option for a CoCA is not retained in the analysis of
impacts in Section 5 as it is too far-reaching. At corporate level, the effects of the CoCA
are identical to those of the ACC. The same considerations in terms of stock versus
incremental, the reference rate and the possible anti-abuse measures apply as for the ACE
and the AGI.
4.4. Option 4: Options to incentivise R&D
R&D tax incentives reduce the tax burden on R&D activities. They can target R&D
inputs by supporting R&D related expenditure. Such measures either reduce the tax base
by granting a deductible allowance or they directly reduce the amount of tax to be paid in
form of a tax credit. Support measures can also be based on output, i.e. income generated
by R&D outcomes such as patents. The latter offer reduced rates on R&D income.
4.4.1. Option 4a: No further action on R&D
The no-action option assumes that, as in the 2011 proposal, all R&D expenses would be
expensed immediately for tax purposes. However, to reflect concerns expressed by
Member States in Council, it is also assumed that capital expenses on R&D buildings
would not be expensed immediately, but depreciated in the same way as other
buildings.47
No national R&D tax incentives would apply any more for companies
applying the CCCTB.
4.4.2. Option 4b: Granting tax incentives for R&D expenses
Under this option, the CCCTB would offer additional allowances or tax credits on R&D
expenses, replicating tax incentives applicable under the national systems.
4.4.2.1. Additional allowance for R&D expenses
An additional allowance decreases the tax base by deducting more than 100% of R&D
expenditure.48
For example, a company could deduct an additional allowance of 50% of
45 An ACC was first analysed by Boadway and Bruce (1984). 46 This system was proposed by Kleinbard (2015). 47 R&D expenses on buildings and land account for only a small share of total business R&D (around 5%
according to OECD estimates) and are therefore not expected to materially affect incentives to invest
in R&D. The largest part of R&D spending is for skilled labour which also generates the highest
spillovers. 48 Note that the term "additional allowance" in the context of R&D refers to the amount of tax incentives
granted on top of immediate expensing of R&D expenditures, i.e. an immediate deduction of 100%. In

29
their R&D expenditure on top of the full deductibility of R&D costs, i.e. 150% in total.
The effective level of generosity of the additional allowance varies with the applicable
corporate tax rate.
4.4.2.2. Tax credit for R&D expenses
Tax credits and additional allowances are economically very similar. The operational
difference is that tax credits reduce directly the tax bill and therefore do not vary with the
tax rate. However, tax credits go beyond the scope of the common base. Member States
would give a tax credit after the computation of the tax liability which would be in
opposition to the spirit of the CCCTB. By granting a tax reduction after the application of
formula apportionment they would not ensure a level playing field for R&D in the EU
and could induce harmful competition between Member States.49
Therefore this option is
not retained.
4.4.3. Option 4c: Granting tax incentives for income from intellectual
property
Output-related incentives apply reduced rates to income generated by R&D, i.e. earned
from exploiting intellectual property (patent boxes). The empirical evidence suggests that
input-related incentives are more effective than patent boxes in stimulating R&D
investments.50
Moreover, patent boxes have in recent years given rise to concerns of harmful tax
competition. First, intangible assets play an important role in profit shifting as their
location can be tax sensitive and can lead to large revenue losses.51
Evidence from ZEW
(2016c) as summarised in Table 1 shows the considerable decrease in effective tax rates
that multinational groups can achieve by exploiting patent box regimes. Second, patent
boxes do not stimulate increases in R&D activity.52
Third, there is no clear rationale for
using patent boxes as a means of stimulating innovation, as they do not appear to address
any specific market failure. Instead, they award additional tax benefits to a successful
innovation that already enjoys intellectual property protection. Research efforts that are
not patentable with potentially higher social spillovers are less attractive and thus become
indirectly discriminated. Finally, the compliance costs required to directly link R&D
expenses to individual patentable efforts are significant and extremely complex for
businesses and tax administrations.
All in all, this option does not only go contrary to the objective of reducing tax avoidance
and improving the fairness of the tax system, but also against the objective of stimulating
additional research and innovation and simplifying the tax system. It is therefore not
retained for further analysis.53
the literature different terms are used to describe this additional allowance, e.g. enhanced allowance,
bonus allowance, super allowance or super deduction. In the following, the term additional allowance
will be used. 49 A detailed description of the formula apportionment is provided in annex VII. 50 See CPB (2014). 51 See Griffith et al. (2014). 52 See Alstadsæter et al. (2015). 53 To prevent the harmfulness of these schemes, an agreement was reached in the OECD and in the EU
on the approach to be taken to ensure that there is a clear link between the tax advantage being granted

30
4.5. Option 5: Staged approach
Recognising the likely difficulties to adopt the CCCTB in one step, the June 2015 action
plan announced that consolidation and formula apportionment would be postponed until
the common base has been agreed and implemented. This impact assessment therefore
assesses the implications of such a staged approach. The key question concerns the
granting of some form of cross-border loss relief in the absence of consolidation.
It is useful to note here that there will be no differentiation between stage 1 (CCTB) and
stage 2 (CCCTB) regarding the scope and the definition of the tax base (including the
debt bias solution and the R&D incentives). The directive on a common base would be
implemented as a first step and then be amended in stage 2 via a CCCTB directive to
incorporate consolidation and formula apportionment. The base definitions as such do
not change in stage 2.
4.5.1. Option 5a: Common base without cross-border loss relief
This option focusses on securing the common tax base at a first stage. This would
involve agreeing to a common set of corporate tax rules for computing the tax base of
companies without possibility for multinational entities to offset losses in one Member
State with profits in another Member State.
4.5.2. Option 5b: Common base with cross-border loss relief
With the aim to strengthen EU competitiveness, the common base could include a
mechanism of (partial) cross-border loss relief with subsequent recapture. Taxpayers
would be entitled to temporarily take into account the losses incurred by their immediate
subsidiaries and permanent establishments situated in other Member States.
under the patent box and a firm’s R&D activities ('nexus approach'). However, this does not mean that
these schemes are effective in raising R&D efforts.
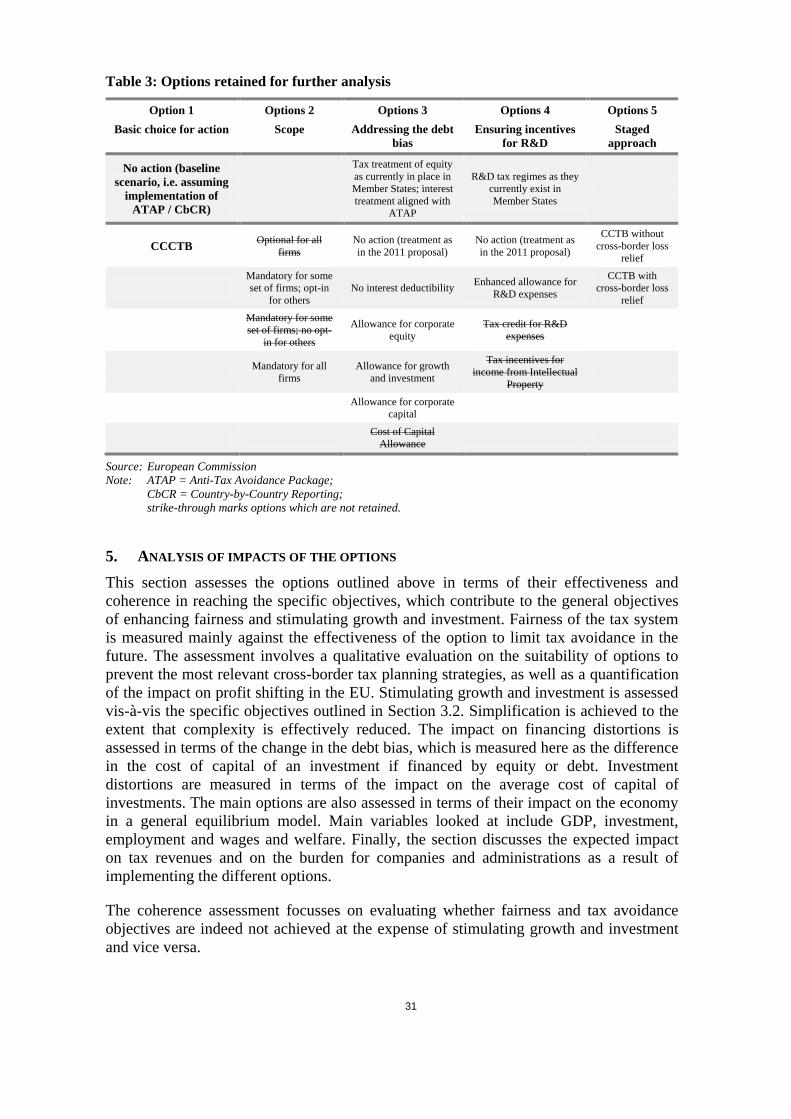
31
Table 3: Options retained for further analysis
Option 1
Basic choice for action
Options 2
Scope
Options 3
Addressing the debt
bias
Options 4
Ensuring incentives
for R&D
Options 5
Staged
approach
No action (baseline
scenario, i.e. assuming
implementation of
ATAP / CbCR)
Tax treatment of equity
as currently in place in
Member States; interest
treatment aligned with
ATAP
R&D tax regimes as they
currently exist in
Member States
CCCTB Optional for all
firms
No action (treatment as
in the 2011 proposal)
No action (treatment as
in the 2011 proposal)
CCTB without
cross-border loss
relief
Mandatory for some
set of firms; opt-in
for others
No interest deductibility Enhanced allowance for
R&D expenses
CCTB with
cross-border loss
relief
Mandatory for some
set of firms; no opt-
in for others
Allowance for corporate
equity
Tax credit for R&D
expenses
Mandatory for all
firms
Allowance for growth
and investment
Tax incentives for
income from Intellectual
Property
Allowance for corporate
capital
Cost of Capital
Allowance
Source: European Commission
Note: ATAP = Anti-Tax Avoidance Package;
CbCR = Country-by-Country Reporting;
strike-through marks options which are not retained.
5. ANALYSIS OF IMPACTS OF THE OPTIONS
This section assesses the options outlined above in terms of their effectiveness and
coherence in reaching the specific objectives, which contribute to the general objectives
of enhancing fairness and stimulating growth and investment. Fairness of the tax system
is measured mainly against the effectiveness of the option to limit tax avoidance in the
future. The assessment involves a qualitative evaluation on the suitability of options to
prevent the most relevant cross-border tax planning strategies, as well as a quantification
of the impact on profit shifting in the EU. Stimulating growth and investment is assessed
vis-à-vis the specific objectives outlined in Section 3.2. Simplification is achieved to the
extent that complexity is effectively reduced. The impact on financing distortions is
assessed in terms of the change in the debt bias, which is measured here as the difference
in the cost of capital of an investment if financed by equity or debt. Investment
distortions are measured in terms of the impact on the average cost of capital of
investments. The main options are also assessed in terms of their impact on the economy
in a general equilibrium model. Main variables looked at include GDP, investment,
employment and wages and welfare. Finally, the section discusses the expected impact
on tax revenues and on the burden for companies and administrations as a result of
implementing the different options.
The coherence assessment focusses on evaluating whether fairness and tax avoidance
objectives are indeed not achieved at the expense of stimulating growth and investment
and vice versa.

32
To reduce complexity, the assessment is presented in sequential steps. This separation of
option dimensions is justified as there are no relevant interdependencies between them.
Other possible interdependencies are discussed whenever appropriate; otherwise the
independence between different option dimensions is explained in the following
subsections. Sections 5.1 and 5.2 focus on the basic choice of 'no action' versus
implementation of a CCCTB and the options on the scope of the application. Assuming
implementation of the CCCTB with the preferred scope option, Sections 5.3 and 5.4
assess the open design issues related to debt bias and R&D incentives. Finally, Section
5.5 assesses the impact of introducing the CCCTB in two steps, with an initial period
without consolidation, but possibly with some form of cross-border loss relief.
Figure 7 shows the sequence of the analysis. To justify this sequential approach it is
required that the preferred options for the scope, for the debt bias solution and for R&D
incentives do not change if the choice of options changes for the other dimensions. Based
on the available analytical evidence and qualitative arguments this can be assumed with
relative confidence. For example, the choice of a solution for addressing the debt bias
seems independent of the choice for the scope or of the choice for the R&D incentives.
In contrast, this does not mean that the choice of each dimension does not affect the final
outcome. In other words, the economic impact of a preferred option (for example to
address the debt bias) might very well change if options in another dimension change (for
example the mandatory scope). For example, implementing an AGI for all companies or
only a selection of them will have different economic impacts. However, the important
point is that the ranking of the preferred options seems to be independent from the
choices made elsewhere.54
54 However, it should be made clear that it is not possible to quantify in all cases the exact impacts due to
the limitations of the analytical model, even if this latter is considered state-of-the-art in corporate
taxation analysis in an international context. Based on the partial analysis that is available on the
combination of certain options and based on additional quantitative arguments outlined in the analysis
Share A = 1
3
𝑆𝑎𝑙𝑒𝑠𝐴
𝑆𝑎𝑙𝑒𝑠𝐺𝑟𝑜𝑢𝑝+
1
3 1
2+
𝑃𝑎𝑦𝑟𝑜𝑙𝑙𝐴
𝑃𝑎𝑦𝑟𝑜𝑙𝑙𝐺𝑟𝑜𝑢𝑝+1
2
𝑁𝑜 𝑜𝑓 𝑒𝑚𝑝𝑙𝑜𝑦𝑒𝑒𝑠𝐴
𝑁𝑜 𝑜𝑓 𝑒𝑚𝑝𝑙𝑜𝑦𝑒𝑒𝑠𝐺𝑟𝑜𝑢𝑝 +
1
3
𝐴𝑠𝑠𝑒𝑡𝑠𝐴
𝐴𝑠𝑠𝑒𝑡𝑠𝐺𝑟𝑜𝑢𝑝 .
∗ 𝐶𝑜𝑛′𝑑 𝑇𝑎𝑥 𝐵𝑎𝑠𝑒
Box 2: Formula apportionment
The distribution of revenues based on a formula is an important element of the CCCTB proposal and its
impact was analysed in the 2011 impact assessment (see also annexes V and VIII). It concluded to
allocate the consolidated tax base to a 'group member A' according to the following formula:
Aside from the extensive work by the CCCTB Working Group and consultations with stakeholders,
three specific pieces of analysis were included in the impact assessment in order to compare the impact
of different formulas: (i) a survey of multinational entities on compliance costs: (ii) impact of
variations in the formula on the distribution of tax bases across countries, using the Amadeus and
ORBIS databases; and (iii) the CORTAX study, which examined formula apportionment within the
context of a wider analysis aiming to quantify the impacts of alternative policy options. The formula
was evaluated against four criteria: 1. Simplicity for taxpayers and administrations; 2. Difficult to
manipulate, i.e. no easy relocation of factors to exploit tax-rate differentials across the EU; 3. Fair and
equitable distribution of the tax base; 4. No negative impact on tax competition. More details on the
rationale for the formula that was chosen can be found in Annex V: Formula apportionment.

33
Figure 7: Analytical approach – sequence of analysis
Source: European Commission
5.1. Baseline vs CCCTB
This section compares the CCCTB (option 1b) with the baseline scenario (option 1a),
assuming that the CCCTB will be either (i) mandatory for some set of firms with the
possibility to opt in for others or (ii) mandatory for all firms. To keep the exposition
reasonably simple, this section discusses the case of a CCCTB without any specific
measures to address the debt bias or to ensure sufficient incentives for R&D. Since there
is a certain degree of overlap of the present assessment with the impact assessment of the
2011 proposal, the main conclusions of the 2011 assessment have been summarised in
annex VIII.
5.1.1. Fairness impacts
Despite the progress at EU level in coordinating a stronger anti-abuse framework, it is
clear that these new rules alone do not address comprehensively the roots of the problem,
particularly in the long term. The inherent conflict remains between corporate taxation
rules determined at national levels on one hand and an increasingly integrated economy
and mobile profits on the other hand. As such, there is a risk that the new anti-abuse
below, one can be confident that the principal choices (i.e. limiting the mandatory scope to large firms,
opting for an allowance for growth and investment to address the debt bias, providing additional
allowance for R&D expenses) would not change even if a complete model that could capture all the
interactions were available.

34
framework addresses only a selection of avoidance strategies, so that companies over
time would adjust their behaviour towards other planning strategies. Not only would this
entail the need for new anti-abuse rules and an ever more complex system, it would also
mean that tax planning multinational entities will keep their undue advantages vis-à-vis
purely domestic firms.
Due to the common rules for determining the tax base combined with full consolidation,
the CCCTB would by and large eliminate profit-shifting possibilities within the EU for
those companies subject to mandatory application. Notably, aggressive tax planning by
exploiting mismatches and making use of patent boxes would no longer be possible,
provided that due attention is given to definitions of central concepts such as debt,
interest expenses, profits and dividends. Whereas exploiting tax differentials via intra-
group loans or transfer pricing would no longer be beneficial. Effectively, the most
relevant aggressive tax planning strategies would be addressed within the EU.55
Incentives for tax planning remain however relevant vis-à-vis third countries. Therefore,
the CCCTB is equipped with a broad set of anti-avoidance measures. As discussed
above, many of these measures are already adopted with the Anti-Tax Avoidance
Directive. Hence, anti-abuse rules addressing tax avoidance involving third countries
would be harmonised with a CCCTB which leaves companies with less room to shop for
the most attractive regime(s) in the EU.56
Limited opportunities would remain in relation
to differences in withholding tax regimes between EU Member States and third countries,
with respect to factor allocation under the formula apportionment regime and, if the
mandatory application is not extended to all firms, with respect to those companies or
parts of a company group that are not subject to the CCCTB.57
Also, transfer pricing
remains an issue between the EU and third countries.
In the general equilibrium model used to analyse the economic impacts of a CCCTB
reform,58
multinational entities have the possibility to shift profits within their group via
transfer pricing.59
Table 4 below compares the impact of profit shifting on tax bases in
the baseline case and in the CCCTB case (compulsory for multinational entities). The
table shows the percent changes in the tax base due to intra-group profit shifting from
and into EU Member States. The starting point is the hypothetical tax base that would
occur if transfer pricing was not available to multinational entities. In the model, which
covers the EU-28, the US and Japan, the CCCTB results in the complete elimination of
any outward shifting of profits from EU Member States. Inward shifting is also largely
eliminated although some inward shifting from the high-tax countries US and Japan
remains. CORTAX currently cannot simulate other aggressive tax planning techniques.
To the extent that these are no longer possible or beneficial within the EU under the
55 See Ramboll et al. (2015) for a description of those tax planning strategies. 56 The relevance of this point is underlined by the findings in ZEW (2016c). 57 See annex V for a discussion. 58 See annex IV (part 1) for a detailed description of model. 59 CORTAX does not model other tax planning strategies, which are often based on specific regimes
offered in national tax systems or certain mismatches between national systems. Therefore the analysis
of the profit shifting impact is stylised and summarised via the transfer pricing channel. In addition,
the analysis only covers profit shifting within the EU, the US and Japan. Consequently, the figures
presented here are not comparable with the estimates presented in Section 2 on the possible tax
revenue costs of tax avoidance.
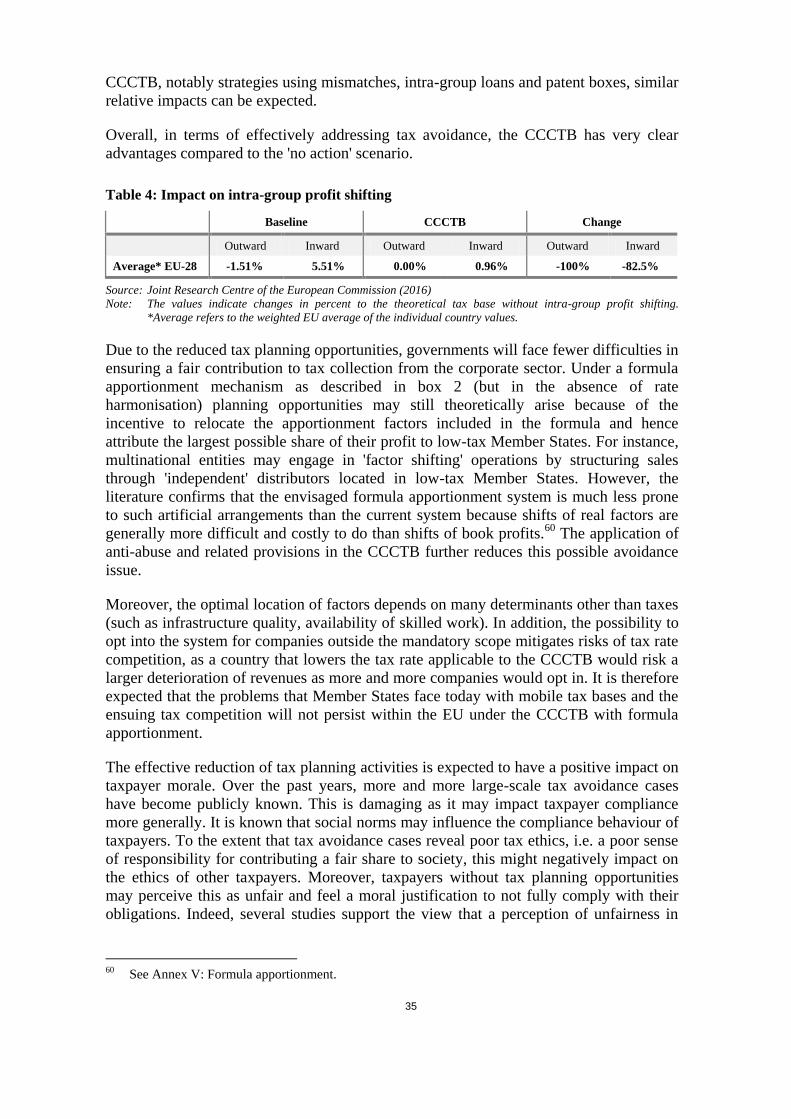
35
CCCTB, notably strategies using mismatches, intra-group loans and patent boxes, similar
relative impacts can be expected.
Overall, in terms of effectively addressing tax avoidance, the CCCTB has very clear
advantages compared to the 'no action' scenario.
Table 4: Impact on intra-group profit shifting
Baseline CCCTB Change
Outward Inward Outward Inward Outward Inward
Average* EU-28 -1.51% 5.51% 0.00% 0.96% -100% -82.5%
Source: Joint Research Centre of the European Commission (2016)
Note: The values indicate changes in percent to the theoretical tax base without intra-group profit shifting.
*Average refers to the weighted EU average of the individual country values.
Due to the reduced tax planning opportunities, governments will face fewer difficulties in
ensuring a fair contribution to tax collection from the corporate sector. Under a formula
apportionment mechanism as described in box 2 (but in the absence of rate
harmonisation) planning opportunities may still theoretically arise because of the
incentive to relocate the apportionment factors included in the formula and hence
attribute the largest possible share of their profit to low-tax Member States. For instance,
multinational entities may engage in 'factor shifting' operations by structuring sales
through 'independent' distributors located in low-tax Member States. However, the
literature confirms that the envisaged formula apportionment system is much less prone
to such artificial arrangements than the current system because shifts of real factors are
generally more difficult and costly to do than shifts of book profits.60
The application of
anti-abuse and related provisions in the CCCTB further reduces this possible avoidance
issue.
Moreover, the optimal location of factors depends on many determinants other than taxes
(such as infrastructure quality, availability of skilled work). In addition, the possibility to
opt into the system for companies outside the mandatory scope mitigates risks of tax rate
competition, as a country that lowers the tax rate applicable to the CCCTB would risk a
larger deterioration of revenues as more and more companies would opt in. It is therefore
expected that the problems that Member States face today with mobile tax bases and the
ensuing tax competition will not persist within the EU under the CCCTB with formula
apportionment.
The effective reduction of tax planning activities is expected to have a positive impact on
taxpayer morale. Over the past years, more and more large-scale tax avoidance cases
have become publicly known. This is damaging as it may impact taxpayer compliance
more generally. It is known that social norms may influence the compliance behaviour of
taxpayers. To the extent that tax avoidance cases reveal poor tax ethics, i.e. a poor sense
of responsibility for contributing a fair share to society, this might negatively impact on
the ethics of other taxpayers. Moreover, taxpayers without tax planning opportunities
may perceive this as unfair and feel a moral justification to not fully comply with their
obligations. Indeed, several studies support the view that a perception of unfairness in
60 See Annex V: Formula apportionment.

36
taxation negatively impacts tax compliance behaviour or at least the willingness to
cooperate with tax authorities.61
5.1.2. Economic impacts
To assess the economic impact of various options, the CORTAX model was used.
CORTAX is a computable general equilibrium model, allowing state-of-the-art analysis
of corporate tax reforms by incorporating key features such as multinational profit
shifting, investment decisions, loss compensation and the debt-equity choice of firms.
The model includes the direct and indirect effects of all domestic labour and capital
markets. It covers the 28 countries of the European Union, the U.S., Japan and a tax
haven. The CORTAX simulations assess the impact of the CCCTB on a set of main
economic variables such as investment, employment and wages, GDP and welfare. It is
assumed that the CCCTB is implemented in a budget-neutral manner, notably by
compensating changes in the corporate tax base by changes in the CIT rate.62
Results can
be made available for two basic assumptions on the set of firms applying the CCCTB:
either all firms or only multinational entities. The assumption that all multinational
entities apply the CCCTB fits, within the logic of the model, to a wide range of possible
definitions for the mandatory scope as long as domestic firms are not included.63
Table 5 shows the results of implementing the CCCTB for multinationals only and for all
firms (both compared to the baseline scenario). Whether applied to multinational entities
only or to all firms, the CCCTB has positive effects on key economic variables. The cost
of capital decrease and as a result investment increases. Employment and wages are also
positively affected, as is GDP and welfare. The results for CCCTB for all firms are
generally more positive, albeit the differences are marginal.
Table 5: Economic impact of the CCCTB (GDP-weighted EU average)
CCCTB –
only multinational entities
CCCTB –
all firms
Cost of capital (change in percentage points) -0.04 -0.07
Investment 0.57 0.74
Wages 0.40 0.44
Employment 0.19 0.19
GDP 0.16 0.26
Welfare (change in % of GDP) 0.07 0.10
Source: Joint Research Centre of the European Commission (2016)
Notes: Changes are in % unless noted otherwise. All simulations are changes compared to the baseline scenario of
no CCCTB
As a caveat, CORTAX does not permit a proper assessment on the level playing field
between domestic firms and multinational entities. On the one hand, the closing of the
61 See the contributions by Fortin, Lacroix and Villeval (2007), Weber et al. (2014), Kirchler,
Niemirowski and Wearing (2006) and Torgler et al. (2008). 62 In more detail, the model adjusts ex-ante the corporate statutory tax rates to ensure ex-ante revenue-
neutrality when the corporate tax base changes. The adjusted CIT rate is subject to an upper bound for
of 37.5% and a lower bound of 10%. In addition, budget neutrality is ensured ex-post by a change in
lump-sum transfers to the citizens (see JRC (2016) for the details). 63 More details on the model and the study that was performed by the Joint Research Centre of the
European Commission (2016) are available in annex IV.

37
most important cross-border tax planning channels is not properly reflected in the model.
CORTAX captures profit shifting in a stylised way through transfer pricing via intra-
group sales, but does not feature multinational entities exploiting mismatches, making
use of patent boxes or saving taxes via intra-group loans. On the other hand,
multinational groups in the model benefit considerably from consolidation. This is
mostly because they are all active in all 28 Member States, which makes it very likely
that a loss occurred in one Member State can be offset against profits in other Member
States. Thus, the model tends to capture more the positive features for multinational
entities while the loss of tax planning opportunities is reflected only partially. In contrast,
the possible positive impact on domestic firms is not captured in the model. This is
because CORTAX does not feature the opt-in choice of firms. In the 'only multinational
entities' case, domestic firms are assumed to stay in their respective national system,
which is broadly consistent within the logic of the model. In the 'all firms' case, domestic
firms are all forced into the CCCTB. In both cases, there may be reasons that domestic
firms would rather opt into/stay out of the CCCTB. For example, if for a domestic firm
the CCCTB tax base is smaller compared to the national tax base and this advantage is
not fully eliminated by a larger CCCTB tax rate, a domestic firm might choose the
CCCTB. The CCCTB may also be attractive as it may be simpler to administer than the
national system, notably due to the depreciation regime, which allows depreciating short-
life assets in a pool rather than individually.
Hence, the model may over-emphasise the positive impacts of the reform for
multinational entities, whereas it may underestimate them for domestic firms. Moreover,
this relative difference in the impacts is reinforced to the extent that domestic firms and
multinational entities compete against each other. As a result, the CORTAX simulations
show a large increase in production of multinational entities and a large decrease in
production of domestic firms, as reported in Table 6. Due to the caveats explained above,
and notably since the model does not feature the possibility to opt in for domestic firms,
the magnitude of the estimated impacts on production cannot be considered realistic. It
therefore does not seem justified to reject the proposal based on this result alone.
Table 6: Impact on production by category of firm
Category of firm CCCTB –
only multinational entities
CCCTB –
all firms
Domestic* -9.89 -12.22
Multinational headquarter 9.59 11.03
Multinational subsidiary 19.39 25.95
Source: Joint Research Centre of the European Commission (2016)
Note: Impact is given as EU-28 weighted average of the change in %. All simulations are changes compared to the
baseline scenario of no CCCTB. *Domestic firms in the 'only multinational entities case' are assumed to not
opt in, even if in reality they may prefer to do so.
A sensitivity analysis based on a number of variations in the assumptions has been
conducted. The variations that have been considered include different depreciation
regimes, variation in the capital-labour substitutability, reduced compliance cost savings
under the CCCTB and compensating changes in tax bases by modifying labour taxes
instead of corporate income tax. All variations yield similar results as in the central case,
pointing to the robustness of the findings, namely positive economic impacts.

38
Impacts on tax revenue
The CORTAX simulations also allow for some first considerations on the impact on tax
revenues although the model cannot simulate all transmission channels. The available
simulations point to a small decrease in total tax revenues for the EU-28 of 0.08% of
GDP, corresponding to about EUR 11 billion. This results from a decrease in EU-28
corporate tax revenues by about EUR 36 billion partly compensated by increases in the
collection of other taxes by about EUR 25 billion. These tax increases are due to
increased economic activity and better employment that respectively boost consumption
and labour tax bases.
These figures should be put in perspective with the potential gain in corporate tax
revenues due to the reduction in several forms of corporate tax avoidance. As discussed
in the previous subsection, the CORTAX model captures the impact from reduced
transfer pricing activities (which are eliminated in the model), but it does not capture the
removal of patent boxes, the removal of hybrid mismatches and the elimination of profit
shifting via intra-group debt shifts. A recent study commissioned by the European
Parliamentary Research Service finds that the corporate tax revenue losses due to tax
avoidance would amount to about EUR 50-70 billion in the EU. It is however difficult to
assess the share of this amount due to transfer pricing and the share due to other
channels.64
Moreover, interpreting these values is difficult as a number of factors impact on
revenues. Most importantly, the model assumes that governments set the CIT rate for the
CCCTB in order to compensate for changes in the rules to compute the corporate tax
base. This is a technical assumption as national governments would be free to adjust tax
rates in other ways. More details and a discussion of other factors that drive the impact
on tax revenues are provided in annex XII.
Impact on administrative burden
The effectiveness of the CCCTB in simplifying the currently highly complex
international system of corporate taxation, reducing compliance costs and double taxation
and removing discriminations and restrictions in cross-border situations, has been
demonstrated in the 2011 impact assessment.65
To which extent the CCCTB would be
made mandatory is of little relevance for these impacts as companies or company groups
which would gain the most from reduced compliance costs are expected to opt into the
system. The differences in national R&D incentives schemes (as illustrated in annex XI)
are a good example to illustrate the potential for simplification. These differences can
lead to high compliance cost for businesses that conduct their R&D cross-border or
engage in transnational cooperations on R&D projects for example through joint
ventures.
As explained in annex VII, tax compliance costs remain an important burden for
businesses and their reduction is a major advantage of the CCCTB compared to the
64 Available studies on the tax revenue impact from transfer pricing do not give a clear indication. The
staff working document accompanying the June action plan includes a summary discussion of the
available studies (SWD/2015/121). 65 See annex VIII for an overview.

39
baseline. The 2011 impact assessment estimated compliance costs for large companies to
amount to about 2% of taxes paid, while for SMEs the estimate was about 30% of taxes
paid. In absolute terms, compliance costs were estimated to increase with cross-border
activity and with increasing number of subsidiaries. The compliance cost levels and their
structure do not seem to have changed considerably in recent years. A recent review of
compliance tax studies (Eichfelder and Vaillancourt, 2014) shows for the period from
1984 to 2014 that compliance costs remain largely stable over time. Existing differences
between different estimates are rather due to different methodologies applied to measure
the costs.66
One could expect that compliance requirements have rather slightly increased since the
2011 assessment. In fact, tax reform data show that numerous CIT reforms took place
after the crisis and many measures were directed at reinforcing the international anti-
abuse framework.67
In the light of this, the reduction of compliance costs when setting up
an additional subsidiary under the CCCTB remains a major advantage: Time costs for
setting up a new subsidiary in a Member State were estimated to decrease 62-67% for the
CCCTB. Focussing on recurring costs, i.e. ignoring one-off switching costs, the 2011
impact assessment estimated a decrease in time spent on compliance activities by 8% for
the CCCTB.68
Based on these time reductions one could endeavour a rough calculation
of the order of total cost savings that would result under the CCCTB. If 5% of medium-
sized companies expand abroad, a one-off cost saving of around EUR 1 billion could be
expected. If all multinational entities apply the CCCTB recurring compliance costs could
go down by about EUR 0.8 billion.
Tax administrations will benefit from reduced dealings with transfer pricing issues and a
reduced 'case number' to the extent that the tax affairs of a company group is mainly dealt
with by the administration of the Member State where the parent resides. However, if the
CCCTB is not made mandatory for all firms, the burden for national administrations may
go up slightly due to the required maintenance of two parallel systems. Also, there might
be requirements to set-up new IT and communication systems between Member States to
ensure a consistent enforcement and application of the CCCTB.
5.1.3. Stakeholder views
Most of the stakeholders (38%) believe that the CCCTB can be an effective tool against
aggressive tax planning and at the same time retain attractiveness to businesses. This
includes a majority of enterprises, driven by the views of SMEs, 54% of which agree
with this view. Another 22% of stakeholders have a more nuanced opinion. A number of
them give a qualified approval, i.e. attaching certain conditions; others point to the
original motivation of removing single market barriers, which in their view should
remain the main focus. Some 17% of respondents do not believe in the effectiveness of
66 The Commission services commissioned a study (Ramboll Management Consulting et al., 2013) on
methodologies to measure compliance cost in 2013 which explains in detail the existing methods as
well as the related caveats. 67 The Tax Reform Report 2015 describes the very recent anti-avoidance measures taken by Member
States in the 2014 and 2015 (Section 1.5.2 of the report). For example, several Member States
introduced or strengthened general or specific anti-avoidance provisions. Four Member States
reinforced their transfer pricing rules, in particular by extending reporting requirements. Controlled-
Foreign-Company rules were introduced or tightened as were interest limitation rules. 68 See annex VII for a more detailed analysis of compliance costs.

40
the CCCTB against aggressive tax planning. Often they point to other initiatives against
tax avoidance and/or do not find the CCCTB to be a proportionate measure.
5.1.4. Preferred option
Overall, the CCCTB (option 1b) is preferable over the alternative of taking no action
(option 1a). The anticipated effects of enhancing fairness via reduced corporate tax
avoidance, ensuring a fair tax contribution from the corporate sector, a more level
playing field among companies and the expected positive impacts on taxpayer morale are
critical, even if not all of them are quantifiable. This is also in line with the views of a
majority of stakeholders. In addition, small positive economic impacts are expected
through the removal of single market tax obstacles. Both the business environment and
the labour market are positively affected. Overall, welfare is expected to increase
slightly. The removal of tax obstacles is also expected to remove existing distortions
between domestic and cross-border investments and enhance incentives for cross-border
investments within the EU and form outside the EU.
Moreover, the administrative burden for companies operating cross-border is expected to
reduce significantly. The burden for national administrations is expected to go down if
the CCCTB is made mandatory for all firms. If not, the required maintenance of two
parallel systems in case the CCCTB is not made mandatory for all companies could raise
the costs for administrations.
Table 7 assesses the performance of the CCCTB vis-à-vis the no action scenario. The
CCCTB performs better on most of the objectives.
Table 7: Assessment of impacts of the CCCTB (Option 1b)
Options
CCCTB
central scenario
Enhancing the fairness of the yax system
Reduce cross-border tax planning opportunities ++
More level playing field for domestic and multinational companies ++
Companies pay a fair share of the tax burden ++
Enhance general taxpayer morale ++
Stimulating growth and investment
Simplify within the EU the currently highly complex international system of
corporate taxation ++
Eliminate double taxation risks within the EU and remove still existing
discriminations and restrictions ++
Approach to profit taxation that does not distort investment and financing decisions +/-
More incentives to invest in the EU +
Reduction in administrative burden for companies and administrations +
Source: European Commission
Note: The evaluation is based on a scale of five steps from very negative (- -) to very positive (++).
"0" indicates no change (i.e. neutrality).
5.2. Scope of the common consolidated base
This section will examine the options for the scope of the mandatory application, keeping
in mind that it is motivated by the new objective of enhancing the fairness of the tax

41
system by comprehensively addressing corporate tax avoidance. The available options
are to make the application compulsory for all firms (option 2d) or to make it compulsory
for some firms (the scope of which will be discussed) and to grant the possibility to opt
in for other firms (option 2b). Full optionality (option 2a) as well as making the CCCTB
mandatory for some set of firms without granting the possibility to opt in for other firms
(option 2c) have been discarded in Section 4.2.69
5.2.1. Fairness impacts
To determine the mandatory set that is effective in capturing tax avoiders but
proportionate at the same time, i.e. not imposing unjustified obligations, it is helpful to
think of three mutually exclusive sets of firms. First, there are those firms that prefer the
CCCTB over the current national systems. It is irrelevant whether the mandatory
application applies to these firms as they will in any case benefit and therefore opt into
the CCCTB. Second, there are firms that prefer the current national systems, not because
they are currently employing tax avoidance strategies but because the net impact from the
CCCTB is not positive for them, in the sense that it would increase their tax burden and
they would not benefit sufficiently from reduced compliance costs. Third, there are firms
that prefer to continue applying the current national systems because they benefit from
tax avoidance strategies and this benefit is larger than any potential benefits from reduced
tax compliance costs and the net impact of other changes.
It is not relevant whether the definition of the mandatory set covers firms in the first set,
which in any case would opt-in. However, the aim should be that the definition captures
the third set of firms and should only capture firms in the second set if there is a valid
justification for requiring them to apply the CCCTB. Many firms in the second set are
likely to be micro and small corporations. These smaller firms are unlikely to engage in
tax avoidance practices. Since a large share of them are active only domestically70
, they
would also not be able to reap any of the potential benefits of the common base. In
addition, 14 Member States currently apply specific regimes for the smallest
corporations, not only in the form of reduced statutory rates, but in 11 of them also via
modified tax bases and/or relief from other taxes.71
The mandatory for all option would
harmonise the tax treatment across all firms. It is not clear whether this would necessarily
create a level playing field to the extent that special regimes are justified to compensate
undue competitive disadvantages. The results from the CORTAX study for the
'mandatory for all' option presented in Table 7 indicate that in the aggregate domestic
firms (which may be small or not) do not benefit uniformly from the application of the
CCCTB.
Overall, option 2d to make the CCCTB mandatory for all firms appears disproportionate
to the extent that it would unnecessarily oblige these small and micro corporations to
69 To keep the structure of the assessment of various option dimensions consistent throughout the report
the impact analysis in this section is divided into fairness impacts and economic impacts, even though
the separation is not always clear-cut. 70 According to a survey conducted in 2015, only 4% of European SMEs had invested abroad at that time
(European Commission (2015c)). Similarly, Navaretti et al. (2011) find a clear positive correlation
between firm size and propensity to invest abroad in seven EU Member States (AT, FR, DE, HU, IT,
ES, UK). Notably, the share of firms with foreign affiliates is several times larger for large firms than
for SMEs. 71 See VVW (2015) and ZEW (2015).

42
apply the CCCTB. Proportionality is also an important aspect of the EU Better regulation
agenda and in particular its programme for regulatory fitness (REFIT), according to
which legislation should avoid any unnecessary burden. In line with this approach, the
intention is thus not to place, in the absence of any real benefits, a burden on smaller-
sized companies of limited finances, which may not have the intention of expanding
abroad. While this would come at the administrative cost of maintaining two corporate
tax systems in parallel, it would also allow national corporate tax systems to stay more
flexible and respond to domestic circumstances.
There are in principle three main criteria that could be used to select firms into the
mandatory set: (i) a sectorial approach, (ii) an approach targeting multinational entities
via a definition of cross-border groups and (iii) a size approach.
Sectorial approach
One could argue that some sectors, such as the financial sector, would be more suitable
candidates than other sectors to the application of a CCCTB, notably because the far-
reaching harmonisation in regulation and supervision makes taxation one of the few
discriminating elements between companies of different Member States.72
However, the
sectorial approach is not retained here as the problems identified in Section 2 are
common to all sectors, albeit to possibly varying degrees, and as it is difficult to
apprehend how an adequate and efficient solution to those problems can be achieved by
applying a sectorial approach.
Cross-border criterion
Firms that currently benefit from cross-border tax planning have by definition a cross-
border structure. This is therefore a natural requirement for the inclusion into the
mandatory set. It may be considered as the 'minimum criterion', leading to the widest
mandatory scope that is justifiable. However, mandating firms with cross-border
operations into the CCCTB while domestic firms (even of a comparable size) are given
the possibility, but are not obliged, to opt in, could be challenged on discrimination
grounds. In addition, if not complemented by further criteria a cross-border criterion
would capture about 4-5% of SMEs that are active cross-border (Table 8 below). On this
basis, it is not suggested to focus on a cross-border criterion alone.
Size criterion
There is a clear correlation between size and propensity to operate in a cross-border
structure (Table 8 below). Therefore, applying a size criterion might be a good alternative
way for capturing those – essentially cross-border – businesses which have higher
possibilities of engaging in tax avoidance practices. Furthermore, relying on a size
criterion would better fit the necessity to avoid discrimination since it would not make
any difference between a member of a multinational group and a member of a domestic
group that, even just potentially, want to grow internationally or do business through
permanent establishments. Finally, a size criterion would be consistent with the approach
followed in the recently agreed amendment to the Directive on administrative
72 See e.g. Bénassy-Quéré, Trannoy and Wolff (2014).

43
cooperation to implement the country-by-country reporting. The reporting requirement
will apply to groups with total consolidated revenue of at least EUR 750 million.
Different size thresholds could be envisaged above which the CCCTB would be
mandatory. In that respect, the following elements serve as guiding principles.
First, as explained above, the threshold should aim at the right balance between the risk
of tax avoiders falling below the CCCTB threshold and the risk of imposing the CCCTB
to companies that do not engage in tax avoidance and would get little or no benefit from
lessened compliance costs as they do not operate cross-border (i.e. threshold set too
low).73
The available evidence on the link between a firm's size and its likelihood to engage in
tax planning would point, if anything, to a rather high threshold. It is difficult to establish
a clear direction for this link. The empirical literature finds evidence for both positive and
negative relationships, pointing to a possible non-linear relationship. A recent meta-study
by Belz et al. (2016) finds the overall effect to be rather positive. However, they also
point to a changing picture based on studies that use more recent samples. Moreover,
studies focussing on samples with larger firms show a significantly lower consensus
estimate, indicating that these firms might indeed achieve lower effective tax rates. Data
for the US show that average implicit tax rates (i.e. the tax payment divided by the
taxable profit) increase with increasing firm size, except for the 5% largest firms.
Examining this upper 5 percentile more closely shows that there is no significant trend in
one or the other direction for the 95-99 percentile but that effective tax rates are
significantly lower and decreasing in size for the 99-100 percentile (Bao and Romeo,
2013).
Analyses of the structure of tax compliance costs of companies suggest that spending on
tax planning increases with firm size which could be interpreted as economies of scale in
tax avoidance techniques. Eichfelder and Vaillancourt (2014) summarise the tax
compliance cost literature of the last three decades and conclude that tax planning costs
seem to be relatively unimportant for micro and small enterprises. The results could be
interpreted in the sense that the fraction of planning costs increases with business size.
This evidence has to be used cautiously due to the many weaknesses of the methods to
estimate compliance costs and the exact definition of tax planning costs. Data provided
by Slemrod and Venkatesh (2002) show that the share of tax planning costs in total
compliance costs increases with firm size measured by the value of assets from 4% for
companies with assets smaller than USD 5 million to 15% for companies with an asset
size of more USD 1 billion.
Second, by setting a threshold, a trade-off might emerge for some companies that may
want to scale down or refrain from growing in order to remain outside the scope of the
CCCTB. Such an effect is likely to be more acute if the threshold is low. The direction of
73 In the OECD/G20 BEPS Report on Action 13, the following elements were put forward: the general
filing requirement for MNE groups with annual consolidated group turnover of more than EUR 750
million is believed to "exclude approximately 85 to 90 percent of MNE groups from the requirement to
file the country-by-country report, but that the country-by-country report will nevertheless be filed by
MNE groups controlling approximately 90 percent of corporate revenues. The prescribed exemption
threshold therefore represents an appropriate balancing of reporting burden and benefit to tax
administrations." (OECD, 2015b)

44
the distortion would be that some firms above, but close to the frontier would stay
smaller than they would choose to be otherwise.74
Unless at the outset firms are already
larger than optimal, this would imply an efficiency loss. The lower the threshold, the
larger is the number of firms facing such a trade-off. A similar issue concerns the level
playing field between companies below and above the threshold. Due to the possibility to
opt in, firms below the threshold may be able to benefit from an advantage compared to
competitors above the threshold. This concern is less pronounced for higher thresholds
simply because there will be fewer instances of direct competitors being below and above
the threshold.
Third, a very high threshold may give rise to concerns of creating a beneficial tax regime
for the most mobile segment of the tax base, which would in turn harm taxpayer morale.
In principle, Member States would have incentives to make the CCCTB regime attractive
to attract mobile base. There are two reasons why this concern is of limited relevance.
The notion of mobility will change under the CCCTB as shifting tax base requires the re-
allocation of factors. Furthermore, the possibility for companies to opt in implies that a
country that lowers the CCCTB tax rate would risk a larger deterioration of revenues as
more and more companies would opt in.
Table 8 gives an overview of the estimated scope of the CCCTB (in terms of number of
companies and share of corporate revenues) for various thresholds.
Table 8: Estimated shares of groups, turnover and domestic groups
for different size thresholds
Consolidated
turnover
Share of groups, compared
to total number of groups
Corresponding share of
unconsolidated turnover
Share of groups active
only domestically
compared to total number
of groups in this bracket75
<= EUR 50 million 96.1% 19.9% 95.2%
> EUR 50 million 3.9% 81.1% 51.0%
> EUR 500 million 1.9% 68.6% 24.5%
> EUR 750 million 1.6% 64.2% 19.2%
Source: ORBIS and ORBIS Historical Ownership (December 2014)
It is clear that corporate groups with consolidated turnover up to EUR 50 million, which
corresponds roughly to SMEs, are overwhelmingly present in a single Member State
only. Therefore, capturing the small share of SME groups active in more than one
Member State would come at the expense of imposing a change to the CCCTB on a very
large number of domestic firms. This would clearly not be a targeted measure. Moreover,
even within the large groups with consolidated turnover of more than EUR 50 million,
slightly more than half of the large groups have a purely domestic structure. The share of
domestic firms becomes significantly smaller only for considerably larger thresholds.
Overall, the thresholds of EUR 500 million and EUR 750 million seem to produce fairly
74 Hasegawa et al (2013) find evidence for such effects based on experience with corporate transparency
requirements in Japan. 75 This ratio has been computed for groups that have their global ultimate owner (GUO) in the EU. In
other words, groups active in the EU but with GUO outside the EU are not reflected in this ratio. This
ratio therefore gives an upper estimate of the share of purely domestic groups.

45
comparable results, capturing respectively 68.6% and 64.2% of turnover of all groups.
They imply that a fraction of 19.2% and 24.5% of groups under mandatory application
would be active only domestically.
5.2.2. Economic impacts
Results for the economic impacts using the CORTAX study have been obtained for two
different assumptions on the set of firms that apply the CCCTB, namely either only
multinational entities or all firms. As the results summarised in Table 4 and Table 5
show, the overall impact on key economic variables is very similar for the two options.
However, the CORTAX model is not built to capture in a meaningful way the opt-in
decision of a firm. The assumption that all multinationals opt into the CCCTB, whereas
domestic firms prefer to stay out is consistent with the other assumptions in the model,76
but in reality a number of elements influence the opt-in decision.
In principle, one would expect economic impacts to be maximised if firms have the
largest possible flexibility to choose the CCCTB. They would then self-select depending
on whether the CCCTB or the respective national system better fits their needs, even
though this would also entail a certain burden due to the required cost-benefit analysis
preceding such a decision.
Impact on administrative burden
The main impacts on the compliance burden for companies have been discussed in
Section 5.1. In principle it is expected that the CCCTB reduces the compliance burden
for companies, at least for those that are active cross-border or wish to expand cross-
border. There may be cases in which a company finds the respective national system
easier to deal with. If companies have the possibility to opt into the CCCTB, they would
factor in the compliance burden in their opt-in decision. In this respect a wider optional
application would be better to reduce compliance costs. On the other hand firms would
have to conduct a cost-benefit analysis before they decide. Since such cost-benefit
analysis is a one-off cost, it is overall more beneficial from a compliance cost perspective
to leave companies a choice.
Tax administrations, however, would benefit the most if the CCCTB is made mandatory
for all firms, even though they would also incur one-off costs for switching to the new
system. In terms of recurring costs, the burden for national administrations may go up
slightly if the CCCTB is not mandatory for all firms due to the required maintenance of
two parallel systems. In this case, they could still benefit from reduced case numbers due
to the one-stop shop approach by which multinational companies deal with the tax
administration of only one Member State.
5.2.3. Stakeholder views
Stakeholders were asked whether they support making the CCCTB obligatory for all EU
groups. Roughly one-third of the respondents are in favour and the same fraction is
against. Another 13% express a neutral stance while 15% opted for 'other'. Among
companies, slightly more than half of SMEs support a mandatory application for all EU
76 This is why in the 2011 impact assessment the 'optional for all' option was translated into the
assumption that all multinational entities would opt into the CCCTB.

46
groups, whereas only 20% of the large companies are in favour. The absolute number of
respondents representing respectively large companies and SMEs is relatively small
though and the results should be interpreted cautiously. Comments given along with the
replies suggest a wide range of nuances within each of the reply categories. Some
consider it more appropriate to apply cross-border or turnover criteria and/or to exclude
SMEs, and/or believe that a mandatory application should only be considered after an
initial optional phase. The range of views is particularly wide for the opponents. Some
prefer the CCCTB to be mandatory for all firms to ensure a level playing field. Some
suggest size thresholds or an opt-out possibility. Others are in principle against the
CCCTB.
5.2.4. Scope preferred option
Table 9 shows a summary of the performance of the two main scope definitions for the
CCCTB against the baseline. Column (1) summarises the impacts of a mandatory
application for all firms. Column (2) shows the impacts for the case of a limited
mandatory application. Evaluated on their merits in reaching the objectives, both scope
options improve the situation when compared to the baseline scenario. The option
'compulsory for all firms' is expected to perform slightly better in reducing tax planning
opportunities and has the advantage to eliminate all national corporate tax systems which
reduces costs for tax administrations in comparison to a limited mandatory application.
Otherwise, the two options are expected to be similarly effective in stimulating growth
and investment. However, the advantage of a full compulsory application in reducing tax
planning opportunities is small if compared to a mandatory scope definition that captures
the most relevant companies engaged in cross-border tax planning. At the same time, a
fully compulsory approach would also force companies into the CCCTB system that
have no tax planning opportunities and generally fewer benefits to reap from the
CCCTB. This is not a proportionate approach to achieve the objectives. Instead, granting
the possibility to apply the CCCTB to such companies, which are often active only
domestically and tend to be smaller, creates a more level playing field between them and
multinationals. Thus 'compulsory for all' is rejected.
It is proposed to make the CCCTB compulsory only for a subset of firms (option 2b),
based on their size. A size criterion proves to be a good proxy for capturing, in a non-
discriminatory manner, companies that are likely to engage in tax avoidance practices.
Defining the actual threshold implies a trade-off between the risk of not capturing tax
avoiders and the risk of targeting companies that do not ordinarily engage in cross-border
activities and would therefore not present a substantial tax avoidance risk. In addition,
this second category of companies should be expected to operate business structures that
would derive only little or no benefit from lessened compliance costs, given that they do
not operate cross-border. It seems at the very least appropriate to exclude SMEs from the
mandatory application as they are by and large not active internationally, hence unlikely
to engage in tax avoidance. The link between size and likelihood to engage in tax
planning being more robust for the very large firms, and taking into account the risk of
adverse threshold effects (disincentives to grow), would point to a rather high threshold.
Moreover, domestic firms do not seem as a whole to benefit from the CCCTB or from
staying out. To account for their different needs and to ensure a more level playing field,
it may be important to not oblige them to apply the system. This, too, points to a rather
high threshold, considering the shares of purely domestic groups captured by the various
thresholds displayed in Table 8.

47
Limiting the compulsory application to groups with a consolidated turnover above
EUR 750 million would serve the purpose of capturing the vast majority (ca. 64%) of
turnover generated by groups while limiting the risk of including purely domestic groups.
Furthermore, such a threshold would be coherent with the approach taken in other EU
initiatives to counter tax avoidance.
Table 9: Assessment of impacts of scope options
Options
(1)
Compulsory
for all firms
(2)
Compulsory
application for a
defined set of firms
Enhancing the Fairness of the Tax System
Reduce cross-border tax planning opportunities ++ +
More level playing field for domestic and multinational
companies + ++
Companies pay a fair share of the tax burden + +
Enhance general tax payer morale + +
Stimulating growth and investment
Simplify within the EU the currently highly complex
international system of corporate taxation ++ ++
Eliminate double taxation risks within the EU and remove still
existing discriminations and restrictions + +
Approach to profit taxation that does not distort investment
and financing decisions 0 0
More incentives to invest in the EU + +
Reduction in administrative burden for companies and
administrations + +
Source: European Commission
Note: The evaluation is based on a scale of five steps from very negative (- -) to very positive (++).
"0" indicates no change (i.e. neutrality).
Importantly, the assessment should be contrasted with the proportionality of each option.
A 'compulsory for all' approach would put an unnecessary burden on some firms, in
particular small and micro corporations. Those companies would not necessarily be able
to benefit from reduced recurrent compliance costs and may no longer have access to
specific tax regimes. This is disproportionate to the extent that including those companies
would not much advance any of the two general objectives.
5.2.5. Independence of the preferred scope option with other option
dimensions.
The choice for the mandatory scope does not change with respect to the preferred debt
bias and R&D options. In relation to the debt bias, this relies on the AGI being the
preferred option, as developed below.77
The level of generosity of the R&D options has
no critical implications for the scope question either. The more generous and the larger
77 If instead the preferred choice had been disallowing interest deductibility, which is a disadvantage
compared to national systems, this could have changed the considerations for the set of firms under
mandatory application.

48
the set of firms that would opt in, the more limited the risk of not capturing all tax
avoiders. However, it is not obvious how to translate this effect into an exact amount for
the threshold.
5.3. Addressing the debt bias
This section examines how to address the debt bias in the CCCTB with the most
effective and efficient option vis-à-vis the objectives. The available options are:
'No further action', which is equivalent to maintaining the situation as foreseen in
the 2011 CCCTB proposal but aligned with the requirements by the Anti-Tax
Avoidance Directive (option 3a),
the non-deductibility of interest payments (option 3b),
the allowance for corporate equity (option 3c),
the allowance for growth and investment (option 3d), and
the allowance for corporate capital (option 3e).
The cost of capital allowance (option 3f) has been discarded in Section 4.3. In line with
the intervention logic, this section starts out with presenting the economic impacts, which
are more relevant for the options for the debt bias. The same sequence is applied in the
following section on R&D tax incentives.
5.3.1. Economic impacts
Impact on the financing decisions of firms
Current tax systems in the Member States usually provide a significant tax advantage to
debt (see also Section 2.2.1). They indeed favour debt-financed investments by allowing
a deduction of interest paid from the tax base, whereas there is no equivalent deduction
for the cost of equity.
For the analysis of the economic impacts of this differential treatment, it is necessary to
adopt an indicator that expresses the financing costs of a company for different sources
of financing. The indicator used here is the cost of capital (this concept is explained in
annex X). In most tax systems, the cost of capital is lower for debt-financed investment
due to the favourable tax treatment of debt. A profit-maximizing company will exploit
this difference and use more of the (cheaper) debt financing. Ideally, the cost of capital
for debt and equity should be equal. In this case the tax system would be neutral with
regard to financing decision (i.e. debt and equity face the same tax wedge).
ZEW (2016a) analyses the impact of various tax reforms to address the debt bias on the
cost of capital.78
The reforms simulate revenue neutrality to avoid that the results are
driven by changes in revenue levels. Table 10 presents the results of the study.79
Column
(1) shows the required cost of capital in the current tax systems assuming a real return on
a safe alternative investment of 5%.
78 Details on the concept and the underlying model are available in annexes IV and XII. 79 It should be noted that our model does not distinguish between the ACE and the AGI, which have here
the same macroeconomic effects.

49
Table 10: Effect of revenue-neutral debt-bias reforms on the cost of capital (EU average)
Source of financing /
Reform
(Cost of capital in %)
(1)
Current tax
systems
(2)
No interest
deductibility
(3)
ACE
(4)
AGI
(5)
ACC
Retained Earnings 6.7 6.5 4.5 4.5 4.5
New Equity 6.8 6.6 4.6 4.6 4.6
Debt 4.7 6.5 4.5 4.5 4.5
Mean 6.0 6.5 4.5 4.5 4.5
Debt Bias* 2.1 0.1 0.1 0.1 0.1
Source: ZEW (2016a).
Note: *Debt Bias: This is computed as the cost of capital for new equity minus the cost of capital for debt. Revenue
neutrality is achieved by adjusting the statutory CIT rate to achieve the same effective average tax rate. For
ACE, AGI and ACC, the defined interest rate assumed is 7.1%, corresponding to the long-term nominal
interest rate on a risk-free bond. The analysis is not qualitatively affected by the assumed rate (ZEW, 2016b).
The analysis shows that reform options to address the debt bias largely eliminate tax-
induced financing distortions by equalizing the cost of capital of debt-financed
investments and equity-financed investments.
Implementing the non-deductibility of interest increases the cost of capital for debt up to
the level for equity. Non-deductibility of interest leads to a broader tax base, which
allows reducing the CIT rate to achieve revenue neutrality. Due to this lower tax rate, the
cost of capital decreases slightly also for equity. Overall, the reform leads to an increase
in the mean cost of capital from 6.0 to 6.5%, despite the decrease in the CIT rate.
The allowance for corporate equity (ACE, option 3c), allowance for growth and
investment (AGI, option 3d) and the allowance for corporate capital (ACC, option 3e)
show identical results. They differ only with respect to their tax treatment of debt, with
the ACC providing a defined deduction whereas ACE and AGI generally allow for the
deductibility of actual interest paid.80
This design difference does not matter here since
the assumed defined rate is identical to the nominal market interest rate.81
All reforms
reduce the tax base and thus require an increase in the CIT rate to keep revenue
neutrality.82
Despite the increase in the tax rate to guarantee revenue neutrality, the cost
of capital for equity decreases considerably.83
Overall, the cost of capital decreases by
25%, from 6.0% to 4.5%. The reason for this result is that the cost of capital measures the
cost of an investment at the margin, i.e. the tax burden on the last euro invested. The
three reforms reduce this marginal burden thereby fostering investment. In contrast, the
tax burden on the economic rent, i.e. the profit above the normal market return is taxed
higher. From an economic point of view this type of taxation is efficiency enhancing
since it leads to fewer distortions in the investment decision of companies.
80 The model can simulate neither the effects of specific corrections done under the AGI nor its
incremental features. Hence it cannot differentiate between the ACE and the AGI. 81 Irrespective of the defined rate, the ACC always achieves financing neutrality. In contrast, full
financing neutrality for the ACE and the AGI is achieved only if the rate equals the market interest
rate. 82 Note, however, that for the ACC the impact on the base depends on the level of the defined rate
chosen. For sufficiently low rates, the tax base may be broader than in the status quo. 83 Due to the deductibility of interest the tax base for a 'marginal investment' (see annex XII) is small.
Therefore changes in tax rates have little impact and changes in the tax base dominate.

50
In the central scenario, the CCCTB (option 1b) is implemented without specific
provisions to address the debt bias but there would still be certain limitations on interest
deductibility (as following the implementation of the Anti-Tax Avoidance Directive,
interest deductibility limitations will be part of the CCCTB). Such limitation rules have
already been discussed in Council after the 2011 proposal. They would deny interest
deductibility partially either with respect to debt that leads to 'thin capitalisation'
(meaning an insufficient equity base relative to debt) or with respect to interest expenses
that exceed a certain percentage of gross earnings. These rules would overall imply a
strengthening of deductibility limitations currently applied in Member States.84
They are,
however, not designed to achieve financing neutrality of the corporate tax system and
they tackle tax-induced indebtedness only partially.
Based on the results on the impact on cost of capital, all reform options are expected to
increase the share of equity in corporations. The introduction of an ACE in Belgium in
2006 and in Italy in 2011 offer the possibility to assess empirically their effect on
leverage.85
For Belgium, a number of studies find a reduction in leverage of non-financial
Belgian firms after the introduction of the ACE.86
Schepens (2015) finds similar effects
for the financial sector. For Italy, Panteghini et al. (2012) find evidence of a significant
decrease in the leverage of firms following the introduction of the ACE.
As no country has applied full non-deductibility of interest or an ACC, there is no
empirical evidence on their effects. Some research found that partial limitations of
interest via anti-abuse rules have somewhat decreased the leverage of companies.87
Finally, simulations with CORTAX indicate that all options would indeed reduce the
leverage of firms, ranging from a decrease by 1.8% in the case of the ACE and AGI to
4.4% with the no interest deductibility (see Table 11).
Impacts on investment and growth
The macroeconomic impacts of the three potential reforms and the central scenario (in
which the CCCTB is implemented without a debt-bias reform) are summarized in Table
11. As before, the results have been obtained using CORTAX, which simulates all
reforms in an ex-ante revenue-neutral way by adjusting the CIT rate. The macroeconomic
effects of the ACE and the AGI are positive and superior to those of the no-action
scenario, the ACC and the non-deductibility of interest. The table shows the case of a
CCCTB applied to multinational entities only, but similar results are obtained under all
possible variations (CCTB or CCCTB, all firms or multinational entities only).88
In all
these variations, the non-deductibility of interest leads to a negative effect on GDP,
driven by depressed investment.
84 As discussed in ZEW (2016b, chapter 6.1), 16 Member States apply interest deductibility limits to
intra-group debt only (of which 9 simply apply the arm's length principle without any specific rule),
whereas the other 12 Member States apply specific limitations to both intra-group and third-party debt. 85 The ACE in Belgium has some resemblance with the traditional ACE as it is based on stock of equity
and the anti-avoidance framework, although the way certain tax planning opportunities are addressed
is considered as incomplete by some (e.g. Zangari, 2014). In contrast, the Italian system is closer to the
AGI as it is based on incremental equity and has a relatively complete anti-avoidance framework. 86 See Princen (2012), aus dem Moore (2013), Panier et al. (2015) and Hebous and Ruf (2015). 87 See for example Büttner et al. (2012) and Blouin et al. (2014). 88 The results are confirmed even if one allows companies in the model to relocate their activities in
response to taxation (JRC, 2016).

51
The CORTAX model does not incorporate the incremental feature of the AGI, i.e. the
fact that it is only granted on equity increases. Sensitivity analyses presented in annex
XIII suggest that the extent of the economic impacts depends on the exact calibration of
the AGI (and the ACE), notably the choice of the rate.
The impact on investment has been assessed empirically for the Belgian ACE.89
Aus dem
Moore (2014b) finds "highly significant and robust estimates that correspond to an
increase in investment activity by small and medium-sized firms of about 3 percent in
response to the ACE reform". Hebous and Ruf (2015) find no effect on production
investment from multinational affiliates, which are the focus of their study. Zangari
(2014) concludes that while the Belgian ACE has possibly benefitted investment by
SMEs, multinationals seem to have used the ACE mostly as a tax planning device. He
stresses the weaknesses of the anti-avoidance framework of the Belgian ACE as opposed
to Italy's system, where the same effect has not been reported. In addition, the fact that
the Belgian ACE at its introduction was granted on the already existing stock of a
company's equity implied a windfall gain for companies, without any impact on
investment decisions or their financing source.
Table 11: Economy-wide impacts of budget-neutral debt bias reforms under the CCCTB
Multinational entities only – GDP-weighted EU-28 average
%-change unless stated
otherwise
(compared to no CCCTB –
baseline scenario)
(1)
CCCTB
central
scenario
(2)
CCCTB
with no interest
deductibility
(3)
CCCTB
with ACE
(4)
CCCTB
with AGI
(5)
CCCTB
with ACC
Cost of capital (change in
percentage points) -0.04 0.14 -0.32 -0.32 -0.14
Investment 0.57 -0.90 3.36 3.36 1.41
Share of debt-financed
investment 1.53% -4.37 -1.79 -1.79 -4.31
Wages 0.40 -0.02 1.26 1.26 0.71
Employment 0.19 -0.15 0.65 0.65 0.30
Welfare (%GDP) 0.07 0.13 0.18 0.18 0.16
GDP 0.16 -0.37 1.17 1.17 0.48
Source: Joint Research Centre of the European Commission (2016).
Note: All simulations are changes compared to the baseline scenario of no CCCTB
The CORTAX simulations do now allow capturing the incremental feature of the AGI. However, sensitivity analysis on
the level of the allowance base suggest that the economic impacts of the AGI depend on its exact calibration.
Impacts on tax revenue
Revenue impacts are difficult to assess for non-deductibility of interest and the ACC
since none of the systems have so far been implemented. For the non-deductibility of
interest a back-of-the-envelope calculation, which does not take into account behavioural
responses, suggests an increase in CIT collected of between 0.4% and 1% of GDP (see
annex XII).
89 As neither a full non-deductibility of interest nor an ACC have been applied in practice, no empirical
study exists. In addition, the Italian and the Cypriot ACE are too recent to offer long enough time-
series data to investigate their impact on investment.

52
Regarding the revenue impact of the ACE, De Mooij (2012) finds a potential decrease in
the tax base by 14.1% and in tax collection by 0.49% of GDP. Zangari (2014) finds that
for the period 2009-2011, the revenue losses of the ACE represented about a third of CIT
collected. He estimates that the revenue cost would be lower by 15% taking into account
reductions in deductible interest as companies substitute debt for equity. The National
Bank of Belgium (2008) puts this correction at about a third of the gross revenue loss in
2006. More details on these analyses are available in annex XII.
The CORTAX simulations allow evaluating the additional revenue impact of debt bias
reforms compared to the CCCTB central scenario, i.e. the CCCTB without addressing
the debt bias. The figures are subject to a number of caveats. Notably it should be kept in
mind that CORTAX ensures budget-neutrality by adjusting the CIT rate and lump sum
transfers. In terms of total tax revenues the additional impact from 'non-deductibility of
interest payments' is positive in the order of EUR 13 billion (0.1% of GDP), due to a
larger increase in CIT revenues partly compensated by a decrease in other tax revenues.
The ACE/AGI reform is expected to decrease total tax revenue by EUR 19 billion (0.1%
of GDP), due to a larger decrease in CIT revenues partly compensated by an increase in
other tax revenues. With its design, the AGI is supposed to lead to lower revenue losses
than the ACE and could be made fully revenue-neutral by introducing offsetting tax rate
increases, without affecting the positive impact on financing neutrality. The ACC is
almost neutral with a negative impact of EUR 1 billion, due to a decrease in CIT
revenues largely offset by an increase in other taxes.
Impact on administrative burden
None of the options seem to imply important changes in administrative burden. They
concern only one aspect of the computation of the tax base and are not per se more
burdensome than e.g. the application of depreciation rules. The non-deductibility of
interest is straightforward as is the application of a defined interest rate to equity.
The application of anti-avoidance rules may generate additional compliance and
administrative costs for companies and tax administrations respectively. This is
specifically the case for the AGI but, depending on their depth, also for the ACE and the
ACC. These costs of course need to be balanced with the objectives of fairness.
Compared to the no-action scenario and the non-deductibility of interest, the application
of AGI, ACE and ACC could then lead to increased administrative burden.
5.3.2. Fairness impacts
The design of individual debt-bias reforms is crucial for the impacts on fairness. Not
addressing the debt bias would leave opportunities for groups operating cross-border to
shift profit via the debt instrument, at least under a common base.
Fully disallowing interest deductibility would suppress such opportunities and would
therefore address the fairness aspects. The ACC would reduce tax planning opportunities
via transfer price manipulations on interest rates as the deductible interest would not be
based on the actual rate but on a defined one.

53
The ACE has been criticised because of the tax planning opportunities90
it can
theoretically open in the form of cascading of the deductions on the same initial capital.
Under the current system, interest paid is taxed at the level of the receiver, which is
justified by the fact that the payment is tax deductible at the level of the payer. At the
level of company groups, the reverse is true for dividends. Dividends paid are not taxed
at the level of the receiver (via participation exemption in the EU), which finds its
justification by the fact that they are not deductible at the level of the payer. The ACE
changes this system by allowing a notional deduction for equity at the level of the payer
(but does not change the exemption for dividends at the level of the receiver). This opens
the following possibility to cascade the benefits of deductions: a parent borrows debt (D)
from a bank and/or receives equity injections (Ep) from shareholders and re-injects the
full amount of capital into a subsidiary as equity (Es = D+Ep). Under an ACE system
without proper anti-avoidance rules, the parent company receives tax deductions in the
form of ACE and deductible interest on its equity Ep and its debt D, respectively. The
subsidiary receives a tax deduction in the form of an ACE on the same (transferred)
capital.
Figure 8: Cascading of benefits under ACE
Source: European Commission
To avoid such cascading, there is a need to make sure that the same euro of capital
invested in the group receives tax deductibility only once.91
This is achieved with an
allowance for growth and investment (AGI). The embedded anti-avoidance measures
ensure that the funds injected in a group benefit only once from a deductibility (via
deductible actual interest or the allowance on equity). The system would remove the
loopholes used for aggressive tax planning.
These specific rules to make the system robust to tax planning can include inter alia a
stricter definition of the ACE/AGI base to exclude items that do not represent business
needs or genuine investment, as well as participations and own shares, the limitation of
the benefits of the ACE/AGI both in time (via an incremental system with a moving
reference date) and amount (with a fixed limit), general anti-abuse rules (GAAR) and
specific anti-abuse rules in terms of interest limitation rule; last but not least the AGI
90 For the Belgian ACE, Hebous and Ruf (2015) find indications for the use of such tax planning
strategies. 91 Zangari (2014) discusses the Belgian and Italian ACE systems and the role of anti-avoidance
provisions targeting intra-group transactions.
Banks
Ep
Shareholders
Parent
Subsidiary
Es
D
Divp Int
Divs
Profits = Xs – ACE/AGIs
Profitp = Xp – ACE/AGIp-int

54
offers a correction mechanism at the level of either the parent or the subsidiary to avoid
the cascading of the benefits.
5.3.3. Stakeholder views
In the stakeholders' consultation (see annex II), an overwhelming majority of respondents
have voiced that the debt bias shall be addressed in the proposal. Among companies who
responded more than 60% are in favour of addressing the debt bias, large companies and
SMEs alike.
Most of the NGOs opt for the non-deductibility of interest method whereas from the
companies' perspective there is resounding support for the ACE/AGI92
. Like the
companies, a strong majority of business/professional associations and consultancy/law
firms expressed their preference for the ACE/AGI. A few respondents were in favour of
the ACC/CoCA. Some respondents indicated that anti-avoidance measures are an
important component of a possible ACE/AGI.
Several respondents mention the interest limitation rules foreseen in BEPS action 4 to
indicate that interest limitation shall probably not go beyond those. Finally, many
respondents emphasise the need for a solution to promote investment.
5.3.4. Debt bias preferred option.
In light of the above, deductibility for equity costs in the form of an allowance for growth
and investment (AGI, option 3d) is the option that scores best in terms of economic
outcomes while at the same time addressing the fairness aspects of the tax system.
Indeed, looking back at the objectives, both the non-deductibility of interest and the AGI
would reduce tax planning opportunities, something the ACE would not do. When it
comes to levelling the playing field for domestic and multinational companies, we have
seen that the debt bias is particularly detrimental for SMEs, which constitute a large share
of domestic companies. By entirely removing the debt bias, all options have the potential
to help SMEs. However, the ACE and the ACC offer planning opportunities that would
favour multinational entities over domestic companies.
The ACE, AGI and ACC may bring some complexity notably when it comes to their
details. This is certainly true when compared to the non-deductibility of interest which is
a simple, albeit radical, solution. However, a specific issue arises with the application of
the full non-deductibility of interest in the financial sector. Applying the full non-
deductibility of interest paid to the financial sector would represent a disproportionate
financial cost for the sector, unless by symmetry the interest received would be
exempted. This however would in turn mean that the larger part of traditional banking
would be exempted from corporate taxation. Another practical question concerns the
compatibility of non-deductibility of interest within the international landscape. In most
countries interest is taxed based on residence whereas disallowing interest deductibility
would imply moving to taxation at source.
92 The AGI was not formally part of the public consultation as it is a special case of the ACE.

55
In the panel of options, only the AGI – by ensuring that deductibility is granted only once
– offers a remedy without leading to double taxation. The non-deductibility of interest
creates double taxation unless interest received is exempted at the level of the recipient.
In theory, all options should offer a satisfactory remedy to the distortions in the financing
decisions. However, the same is not true when it comes to investment decisions and the
attractiveness of the EU as the non-deductibility of interest would have adverse effects
and the ACE would distort choices because of potential tax planning opportunities.
Taking no action, i.e. introducing the CCCTB without a debt bias solution, would imply
that problems due to distorted financing incentives remain unaddressed, whereas profit
shifting via debt would be mitigated to a certain degree through limitation rules in the
CCCTB on interest deductibility.
In conclusion, the AGI addresses the debt bias and is expected to have a positive impact
on the investment, even if implemented in a revenue-neutral way. The robust anti-
avoidance framework inherent to the AGI makes it the preferred debt bias option.
Table 12 summarises the impacts of the different debt bias options and assesses them
against the central scenario for a CCCTB. This means that options are compared to a
situation with a CCCTB which does not address the debt bias. The table therefore
answers the questions whether a debt bias solution will improve the CCCTB vis-à-vis the
central scenario. The analysis shows that granting no interest deductibility at all is
attractive to reduce tax planning opportunities. At the same time this option clearly
hampers investment due to its impact on capital costs. An allowance for equity features
high on improving the economic environment, but scores lower when tax planning
considerations are taken into account. The allowance for growth and investment (AGI)
comes with stricter anti-avoidance rules and is only granted on incremental changes in
the capital stock. It provides economic benefits while reducing the risks of tax planning.
The allowance for the cost of capital (ACC) is similar to an ACE, but less favourable in
economic terms.

56
Table 12: Assessment of impacts of debt-bias options
Options
(1)
No Interest
deductibility
(2)
ACE
(3)
AGI
(4)
ACC
Enhancing the fairness of the tax system
Reduce cross-border tax planning opportunities + - + 0
More level playing field for domestic and
multinational companies + 0 + 0
Companies pay a fair share of the tax burden n.a. n.a. n.a. n.a.
Enhance general tax payer morale n.a. n.a. n.a. n.a.
Stimulating growth and investment
Simplify within the EU the currently highly
complex international system of corporate
taxation
+ 0 0 0
Eliminate double taxation risks within the EU and
remove still existing discriminations and
restrictions
- 0 + 0
Approach to profit taxation that does not distort
investment and financing decisions - 0 + +
More incentives to invest in the EU -- ++ ++ +
Reduction in administrative burden for companies
and administrations 0 0 0 0
Source: European Commission
Note: The evaluation is based on a scale of five steps from very negative (- -) to very positive (++).
"0" indicates no change (i.e. neutrality).
5.3.5. Independence of the debt bias preferred option with other option
dimensions
The conclusion on the preferred debt bias option does not depend on the preferred option
for the scope or the R&D incentive. The results from the CORTAX and ZEW studies
confirm that the ranking of debt bias options is stable, irrespective of the scope (and
indeed independent also from consolidation). The specific design of the R&D incentive
should not have implications for the choice on scope or debt bias either. The debt bias is
a wider issue, changing the cost of capital for all investments, not only R&D
investments.
5.4. Treatment of R&D expenses
This section reviews the two retained options for ensuring that the CCCTB provides
sufficient incentives to invest in R&D. The available options are 'No further action' on
R&D (option 4a), which is equivalent to immediate expensing of R&D in the 2011
CCCTB proposal, and granting a super allowance for R&D expenses (option 4b). The
options of granting tax credits or granting tax incentives for income from intellectual
property (option 4c) have been discarded in Section 4.4.

57
5.4.1. Economic impacts
Option 4a provides full and immediate deductibility for R&D expenses.93
The majority
of national tax incentives provide currently larger than full immediate expensing
(additional allowances amount to up to 200% in Latvia and Lithuania) or a tax credit for
qualifying R&D costs.94
Annex XI provides an overview table of the systems currently
applied in Member States and selected third countries.
A systematic comparison of the generosity levels requires a measure which condenses
different features of the tax system (rate, design of the incentive, etc.) into one indicator.
Such an indicator of tax support to R&D is the '1-B-index' (see box 3). This index takes
the value zero if the tax system does not provide any tax incentive on business R&D
expenses beyond immediate expensing of all R&D expenses. It takes a positive value if
the incentive is larger. It takes a negative value if the incentive is smaller.
Box. 3 The B-index and the 1-B-index
The B-index measures the minimum level of profit before tax that a representative company needs to
earn to break even on one euro spent on R&D. The B-index summarises a large array of qualitative and
quantitative information about R&D tax incentives and depreciation regimes for R&D assets as
collected by the OECD. An alternative and more intuitive way is to look at the one minus B-index.
1-B-index = Tax subsidy (if positive) or tax burden (if negative).
The 1-B-index shows the influence of R&D tax incentives on the price of business R&D (user cost). For
example, a value of 0.1 suggests that the price for a business to invest in R&D is 10% lower than it
would have been in the absence of taxation, whereas a value of -.05 suggests that the user cost is 5%
higher than it would have been in the absence of taxation. A value of 0 corresponds to the case of no
taxation.
Source: OECD and Warda (2001).
Table 13 shows the computations of the 1-B index for all EU countries. The values are
positive in 21 Member States, i.e. these Member States provide more tax support beyond full
immediate expensing. They are negative in four Member States and the value is zero for
three Member States. The weighted average of the tax subsidy rate for the EU stands at 0.12.
This means that for every euro invested in business R&D in the EU, Member States give on
average a subsidy of 12 cents.
Option 4a offers immediate expensing for all R&D costs except for the estimated 5% related
to buildings and land. This would translate into a tax burden on R&D of -0.01 and not
maintain the current generosity level of the tax treatment of R&D expenses.
93 As explained in Section 3.6.1., the exception is expenses for R&D buildings which cannot be
immediately expensed, but these account for only 5% of total R&D expenditure. 94 These considerations may be affected in case a country requires capitalisation of some current R&D
costs. The effect of expensing or capitalisation of current R&D costs was considered in preparation for
the 2011 proposal and the results of the simulation reveal no considerable impact (ZEW, 2008).

58
Table 13: Tax subsidy rates as measured by the '1-B-index' in EU Member States.
Country B-index 1-B-index Country B-index 1-B-index
Germany 1.02 -0.02 Slovak Republic 0.89 0.11
Finland 1.01 -0.01 Austria 0.88 0.12
Denmark 1.01 -0.01 Netherlands 0.84 0.16
Luxembourg 1.01 -0.01 Slovenia 0.81 0.19
Cyprus 1.00 0.00 Czech Republic 0.77 0.23
Bulgaria 1.00 0.00 Croatia 0.74 0.26
Estonia 1.00 0.00 France 0.74 0.26
Poland 0.98 0.02 Hungary 0.72 0.28
Italy 0.96 0.04 Ireland 0.71 0.29
Sweden 0.95 0.05 Latvia 0.69 0.31
Romania 0.92 0.08 Lithuania 0.68 0.32
Greece 0.91 0.09 Portugal 0.64 0.36
United Kingdom 0.90 0.10 Spain 0.63 0.37
Belgium 0.89 0.11 Malta 0.51 0.49
EU-28 –
simple average 0.85 0.15
EU-28 –
GDP-weighted average 0.88 0.12
Source: OECD calculations, where available. Joint Research Centre and DG Taxation and Customs Union
Note: Calculations for missing EU countries and for Poland following the regime change in 2016.
Impact on R&D investment
The vast majority of empirical research concludes that expense-based R&D tax
incentives lead to additional R&D investment.95
The estimates of the size of this effect
are widely diverging, partly due to differences in methodologies and countries covered
by the studies. Recent studies conclude that the tax elasticity (the proportional change in
R&D spending due to a 1% decrease in the tax burden) is positive and close to, but less
than one.96
To reflect these results in a plausible but conservative manner, an elasticity of 0.8 is
assumed in the calculations presented in table 14.97
An elasticity of 0.8 means that a 10%
reduction in the price of business R&D results in an 8% increase in business R&D. In
line with the result above that Option 4a would lead to a deterioration in incentives, the
analysis finds an 18% reduction in R&D spending compared to the baseline (existing
national schemes). An additional allowance (option 4b) of 33% is required to achieve the
same level of tax subsidy as in current national tax schemes.
95 See the study by CPB (2014) for a recent survey of the literature. 96 See for example CPB (2014), Becker (2015) and Koehler et al. (2012). The effects, may, however be
underestimated, as some research suggests that R&D tax incentives may assessed to be less effective
than they really are if studies do not take into account the endogenous determination of tax policies,
i.e. the fact that tax reforms are often introduced to offset economic downturns (Chang, 2014). 97 Alternative calculations were also performed using a plausible range of literature-backed elasticities
(from 0.5 to 1.2). Minimum and maximum bounds suggested by these alternative elasticities are also
presented.

59
Table 14: Reform scenarios and their possible impact on R&D investment
Pre-reform: B-index:
EU-28 GDP-weighted average 0.88 Expected % change in R&D expenditures:
Post-reform: Elasticity 1.2 Elasticity 1.0 Elasticity 0.8 Elasticity
0.5
Option 4a, full expensing 1.01 -0.27 -0.22 -0.18 -0.11
Option 4b, full expensing, 33% bonus
allowance 0.88 0.00 0.00 0.00 0.00
Option 4b, full expensing, 100% bonus
allowance 0.69 0.25 0.21 0.17 0.10
Option 4b, full expensing, 200% bonus
allowance 0.38 0.78 0.65 0.52 0.32
Source: Joint Research Centre and DG Taxation and Customs Union. European Commission.
Note: R&D buildings are depreciated under all options. Inclusion of own-calculated B-indices leads to a lower
average tax subsidy in the EU than the one calculated based on the available OECD indices as the GDP-
weighted average B-index drops from 0.88 to 0.86. Under the B-index of 0.86, the full expensing has worse
consequences on R&D, as the drop in R&D is -23% (from -18% with the full set of 28 B-indexes). An
allowance of 37% is needed to achieve pre-reform levels (up from 33%).
An additional allowance of 100% (on top of full expensing) would significantly improve
existing incentives to engage in R&D, with an expected increase of about 17% in
business R&D investment compared to the status quo. Meeting the Europe 2020 target of
3% of GDP devoted to R&D would require an even bolder allowance. If 2% of GDP
were to come from the private sector, business R&D investment would need to increase
by 54% from current levels.98
An additional allowance of 200% could result in an
increase in business R&D by 52%, approximately meeting the Europe 2020 target.
However, the effectiveness of an additional allowance of a given level will vary with the
applicable CIT rate. The higher the tax rate the larger the benefit for the company
investing in R&D and thus the stronger the incentive to invest. Under the CCCTB the
relevant rate would depend on a weighted average of tax rates after formula
apportionment. To the extent that Member States change CIT rates after introduction of
the CCCTB this could change the generosity level of the allowance.
Impact on tax revenue
In terms of foregone tax revenues, granting an additional allowance of 33% should have
an overall neutral impact on CIT revenues as it corresponds to the R&D tax incentives
already offered in EU Member States.99
Estimates of the likely changes in CIT revenues
under the two options for different rates of the allowance, as presented in annex XII, vary
from 5% for an additional allowance of 100% to 15% for an allowance of 200%. These
estimates are broadly in line with OECD (2015c).
Neither of these estimates takes into account revenue gains from the reversal of all patent
boxes currently applied in the EU. Griffith et al. (2014) simulate the revenue impacts of
introducing patent boxes in four countries. They find that tax revenues from new patents
are less than half of their pre-reform levels in the four countries concerned. The impact
from the removal of patent box regimes would be the same for both options.
98 R&D business expenses stood at 1.3% of GDP in 2014 and thus the shortfall in the EU amounts to
0.7% of GDP (Eurostat data). 99 The effect will depend on the tax rates Member States choose after the introduction of a CCCTB.

60
Impact on different types of companies and possible targeting of R&D incentives
A conclusion from the economic literature is that tax incentives should not be linked to
the size of a company but rather to the desirable outcome such as more research and
innovation investment.100
The effects of R&D tax incentives vary across firm types, notably size. In general, there
is no undisputed conclusion whether SMEs respond more strongly to R&D tax incentives
than large companies. Recent evidence however suggests that knowledge spillovers from
large firms exceed those from small firms (Bloom et al, 2013). Targeting R&D tax
incentives to firm size needs to consider both, the degree of responsiveness and the level
of spillovers. There is nevertheless evidence that size may not be the best selection
criterion as the impact of tax incentives on R&D spending for start-up firms can exceed
the average impact. Therefore, targeting young companies can be considered a better
practice than targeting SMEs.101
If the CCCTB is more generous than national tax incentives schemes, it could be seen as
favouring incumbent firms. This is because more generous R&D tax incentives can be
associated with a more concentrated growth distribution in R&D intensive sectors, which
may favour incumbent firms (Bravo-Biosca et al., 2013). Young companies can
challenge incumbent businesses and generate proportionally more jobs (Criscuolo et al.,
2014). The EU has currently fewer young leading innovative companies than the US in
fast moving sectors (Cincera and Veugelers, 2013). Tax incentives can hence be designed
to support young companies directly with relatively more generous provisions (as
currently applied in France, Belgium, the Netherlands and Portugal), by including
options to carry forward the R&D expenditure (as in most national schemes) and/or to
get a cash refund (as in seven EU countries). Such features offer young firms more
flexibility and reduce the uncertainty associated with investment decisions.
Impact on EU competitiveness
Based on the conclusion that option 4a weakens current incentives for businesses to
invest in R&D and given that the EU underinvests in private R&D compared to other
innovation leaders such as US, Japan and South Korea (which all apply R&D tax
incentives), option 4a could further deteriorate the competitive position of EU businesses
and could also lead to delocalisation of R&D efforts of EU businesses from the EU to
other countries.
The likely impact of the tax treatment of R&D expenses on GDP growth is difficult to
estimate. The IMF (2016) expects a long-term increase in GDP of about 5% following an
increase in business R&D by 38% based on the literature estimates of the elasticity of
100 This seems to be the focus as well in national tax systems. A 2015 study on SME taxation concludes
that SME tax incentives are not as frequently implemented as R&D tax incentives. Mostly, reduced tax
rates are employed to support SMEs on which available evidence suggests that such SME reduced
rates may prevent companies from growing (IMF, 2016). Most SME tax incentives seem to benefit
only micro and small enterprises, while medium-sized corporations basically benefit only from R&D
tax incentives (see also table 37 in annex XI). Reductions in the effective tax burden due to R&D tax
incentives for large corporations comes mostly from reductions applicable to the tax base, i.e.
enhanced allowances (VVA and ZEW, 2015). 101 See the discussion and evidence provided in CPB (2014), OECD (2016) and IMF (2016).

61
output with respect to changes in business R&D. Extrapolating from this, an allowance
of 100% and 200% may increase GDP by roughly 2% and 7%, respectively. However,
linear extrapolations should be treated with caution.102
Impact on administrative burden
As explained above, introducing the CCCTB is expected to reduce administrative burden
in relation to R&D tax incentives, which currently vary considerably across the EU
(annex XI). This reduction in administrative burden is expected to be the same for
options 4a and 4b.
5.4.2. Fairness impacts
Stimulating R&D activities should also contribute to the objective of enhancing fairness.
13 EU countries currently offer tax reductions on the income earned from exploiting
intellectual property. Such patent boxes have been introduced in recent years with the
declared objective of boosting R&D, high-tech jobs and competitiveness. However,
patent boxes have been criticized from the outset. Research shows that they do not
stimulate R&D and may rather be used as a profit-shifting instrument, leading to high
revenue losses. Section 4.4 discusses this more and Table 1 in Section 2.1 illustrates the
large tax saving potential by exploiting patent boxes. Patent boxes reward successful
innovations which already profit from an intellectual property protection. They could
thus make research efforts that are not patentable, with potentially higher social
spillovers, less attractive. Furthermore, the use of intellectual rights is sector specific.103
Overall, both options 4a and 4b would increase fairness by reducing IP-related profit
shifting and improving the level playing field between those research efforts which
benefit from IP-protection and those which do not.
5.4.3. Stakeholder views
A majority of respondents (55%) are in favour of making the CCCTB more favourable
for R&D than in the 2011 CCCTB proposal, while 18% are against. Those in favour are
companies – in fact all large companies and 80% of SMEs who responded - while most
of the NGOs and private individuals are against a more favourable regime.
Around half of the respondents who are against making the framework more favourable
refer to concerns about harmful tax competition induced by tax schemes based on income
from intellectual property. Many respondents highlight that any scheme under the
CCCTB should be based on actual R&D costs. Other responses in this group suggest a
preference for other means to stimulate R&D.
102 The variance observed in quantitative literature on the returns to R&D (e.g. Hall et al., 1999) argues
against crude linear extrapolations. In fact literature on the statistical distribution of highly valuable
inventions (e.g. Scherer and Harhoff, 2000; Silverberg and Verspagen, 2007) suggests that they have
no mean and no variance and therefore attempts to forecast the aggregate outcome of R&D with
precision need to be treated with caution. 103 Hall et al. (2013) find that in the UK even among firms that conduct R&D, only 4% patent. Findings
are similar for the US as 5.5% of US manufacturing firms own a patent (Balasubramanian and
Sivadasan, 2011). Sectors such as computers, electronics, machinery, chemical and pharmaceuticals
seem to have the highest patenting activities (Squicciarini and Dernis 2013). The empirical evidence
suggests that for many sectors patents seem an ineffective way to appropriate returns and secrecy and
lead times are used extensively (Arundel, 2001; Hanel, 2008; Hall et al., 2014).

62
The suggestions of respondents who are in favour of making the framework more
favourable mostly concentrate on super deductions.
Across the various groups of respondents, some believe that Member States should be
allowed to retain their flexibility in granting R&D tax credits or super deductions in
parallel to the CCCTB.
5.4.4. Preferred R&D option
Given its impact on R&D investment and positive spillovers for the whole society, option
4b, i.e. granting an additional allowance, is preferable to maintaining the 2011 CCCTB
proposal on R&D (option 4a). An additional allowance between 33% and 100% would
be preferable to maintain or further encourage R&D investment in the EU at a reasonable
cost. To stimulate growth of innovative firms and ensure fairness, a more generous
provision could be proposed to young innovative companies that would opt into the
CCCTB. An alignment of definitions and eligible costs with EU state aid rules would
ensure coherence with other EU policies.
Table 15 summarizes the impacts of the two options. Column (1) shows the central
scenario for the CCCTB which by definition is neutral (option 4a). Column (2) shows the
impacts in comparison to this central scenario of an additional allowance (4b).
Table 15: Assessment of impacts of R&D options
Options (Option 4a)
2011 R&D
treatment in
CCCTB
(Option 4b)
Additional
R&D
allowance
Enhancing the fairness of the tax system
Reduce cross-border tax planning opportunities 0 0
More level playing field for domestic and multinational companies 0 0
Companies pay a fair share of the tax burden n/a n/a
Enhance general taxpayer morale n/a n/a
Stimulating growth and investment
Simplify within the EU the currently highly complex international
system of corporate taxation
0 0
Eliminate double taxation risks within the EU and remove still existing
discriminations and restrictions
0 0
Approach to profit taxation that does not distort investment and
financing decisions
n/a n/a
More incentives to invest in the EU (impact on R&D) 0 ++
Reduction in administrative burden for companies and administrations 0 0
Source: European Commission
Note: The evaluation is based on a scale of five steps from very negative (- -) to very positive (++).
"0" indicates no change (i.e. neutrality).
5.4.5. Independence of the R&D preferred option with other option
dimensions
The preferred choice for the treatment of R&D expenses does not have important
dependencies with the preferred option for the scope or the debt bias. This is due to the
possibility to opt in and the objective to include R&D tax incentives that are at least as

63
generous as what Member States currently apply. However, it is possible that in some
cases a company will have more incentives to invest in R&D under the national system,
but falls under the mandatory scope. This would be an argument for keeping the
threshold for the mandatory application rather high to reduce the possibility for such
cases. The considerations between the principal choices for the R&D incentive
(additional allowance, tax credit etc.) do not depend on the preferred debt bias option
either. As shown above, in order to design the preferred R&D option in a way to
maintain at least current generosity levels, at least immediate expensing of all R&D costs
needs to be ensured. As this means that R&D costs are not capitalised, there is no
interaction between the generosity of the R&D incentive and the choice for the preferred
debt bias option, which is the AGI.
5.5. The staged approach
This section presents (i) the impacts expected, relative to the CCCTB, from an initial
stage without consolidation and formula apportionment (option 5a); and (ii) it assesses
whether it would be opportune to foresee some form of cross-border loss offset during
this initial stage (option 5b).
It is clear from this impact assessment and the one underpinning the 2011 proposal that
the preferred option is the CCCTB. However, discussions in the Council have shown that
the CCCTB is unlikely to be adopted in one piece, consolidation being the most difficult
and controversial element. It no longer appears promising to move forward with the
CCCTB in one single go and the Commission therefore decided to pursue a pragmatic
approach, postponing the work on consolidation until after the common base has been
agreed and implemented. Therefore this section presents the economic and fairness
impacts of the initial stage, in which the common base is implemented. This means that
provisions on profit and loss consolidation within groups and formula apportionment
across Member States would be postponed. All other features of the base definition,
notably an allowance for growth and investment (AGI) and R&D incentives would be the
same in the common base and the CCCTB.
The comparison of options in this subsection concerns merely the possible inclusion of
some form of cross-border loss offset, if the political environment required the staged
approach for the introduction of the CCCTB. The main difference between cross-border
loss offset and consolidation is that the latter would fully offset losses and profits within
a CCCTB group whereas cross-border loss offset would only allow a vertical offset
between parents and subsidiaries. In addition, the cross-border loss offset envisaged
would foresee a reincorporation of the loss offset after some time.
5.5.1. Economic impacts
Table 16 presents the results from the CORTAX simulations for the common base with
and without cross-border loss offset as well as, for comparison, the results for the
CCCTB. All the simulations presented assume that all multinational enterprises apply the
common base and that the common base includes the ACE/AGI to address the debt
bias.104
It is clear that the CCCTB is expected to achieve better economic results than the
common base. GDP, investment, wages and employment all perform better. In the model,
104 R&D incentives should also apply but these do currently not feature in the CORTAX model.

64
three main effects drive these differences in the impacts. First, under the CCCTB
compliance costs are assumed to fall to zero for subsidiaries of multinational enterprises,
whereas they stay the same as before under the common base.105
Second, consolidation
allows for the immediate offset of losses against profits made somewhere else in a
multinational group. This lowers the tax burden and the cost of labour and the cost of
capital. Third, the move to formula apportionment removes an important distortion to the
location of real factors and replaces it by another, yet less significant, distortion induced
by formula apportionment (see discussion Section 5.1). Overall, since in the CORTAX
model the key economic benefits of the reform are driven by the ACE/AGI reform, the
relative differences between the common base and the CCCTB are relatively minor.
Turning to the cross-border loss offset, CORTAX results indicate a fairly modest positive
economic impact of allowing cross-border loss relief, where parents can claim losses of
their subsidiaries. The most important benefit from offering some cross-border loss relief
is the enhancement of cash-flow capacity of businesses (for instance, by compensating
start-up losses in a Member State with profits in another Member State) and the resulting
support for cross-border investment within the EU.
Currently only a few Member States offer limited forms of cross-border loss
compensation. Some cross-border loss offset would alleviate in most Member States
differences in the treatment of groups operating cross-border and domestic groups.
Moreover, limited or non-existing cross-border loss offset implies differences in tax
treatment of foreign permanent establishments and foreign subsidiaries. As the 2011
impact assessment notes, other potential benefits include the reduced risk of investment,
as losses are better insured, and increased efficiency in the international allocation of
productive capital.
Table 16: Economic impacts of an initial stage without consolidation, with and without
cross-border loss relief –
multinational entities only + ACE/AGI, EU-28, GDP-weighted average
Common base Common base with
cross-border loss relief CCCTB
Cost of capital
(change in percentage points) -0.29 -0.35 -0.32
Investment 3.06 3.62 3.36
Wages 0.88 1.11 1.26
Employment 0.40 0.52 0.65
GDP 1.06 1.31 1.17
Welfare (% of GDP) 0.19 0.22 0.18
Source: Joint Research Centre of the European Commission (2016)
Note: Changes are in % unless noted otherwise
Impact on administrative burden
The administrative burden would be reduced by much more under the CCCTB compared
to the common base. Consolidation brings major benefits in terms of reduced compliance
105 A sensitivity analysis, in which the compliance costs instead are reduced by 50% is also performed in
the CORTAX study.

65
costs, eliminating the necessity to comply with the arm's length principle. For groups, the
absence of consolidation implies that cross-border transactions between group members
and associated enterprises would continue to be subject to transfer pricing rules and filing
formalities. It would therefore be necessary to work out arm's length adjustments. In
addition, groups of companies would have to continue dealing with as many tax
administrations as the number of Member States where they have a taxable presence (i.e.
subsidiary or permanent establishment). On the other hand, formula apportionment
requires documenting additional information on the factors used in each company entity
in order to apply the formula.106
Thus the CCCTB is expected to be particularly effective in reducing recurrent tax
compliance cost. In terms of one-off costs for setting up a subsidiary in a new location,
the common base would already constitute a major improvement as a company
expanding cross-border would not have to deal with a new tax system. Tax
administrations would be able to benefit from a reduced number of cases and fewer
dealings with transfer pricing issues only once the CCCTB is implemented.
5.5.2. Fairness impacts
Consolidation and apportionment is clearly an important element to reap all the benefits
from reducing tax avoidance. Whereas the common base would address profit shifting by
exploiting patent boxes and mismatches in the tax systems, the CCCTB would in
addition render profit shifting via transfer pricing and debt shifting unattractive
(assuming that both the common base and the CCCTB would be mandatory for the most
relevant companies).
A mechanism for a cross-border loss relief outside formula apportionment may give rise
to new opportunities of tax planning and profit shifting in favour of multinational
companies. Anti-tax avoidance provisions that may be implemented in order to prevent
an abusive use of cross-border loss relief could have only limited dissuasive effect. It
should also be underlined that tax administrations would have a crucial role in order to
prevent abuses. Hence, anti-avoidance provisions could remain ineffective to the extent
that tax administrations are not capable to apply them.
The loss relief should therefore have a narrow scope to minimise possibilities for tax
avoidance. Notably, to safeguard national tax revenues, the deducted losses should be
reincorporated ('recaptured') automatically if this has not occurred after a certain number
of years or if the requisites to qualify as an immediate subsidiary or permanent
establishment are no longer met. In addition, it should be ensured that companies cannot
artificially reduce their tax bill by buying loss-making companies. This is an issue that
has already been recognised in national systems that provide a loss relief for groups and
can be addressed via specific anti-avoidance rules.
5.5.3. Stakeholder views
More than 50% of companies who responded are in favour of a temporary cross-border
loss relief. The positive view is shared by large companies and SMEs alike. The majority
of the companies argue that the current lack of mechanisms available to offset cross-
106 The required information concerns sales by destination, tangible fixed assets, employees and the wage
bill.

66
border losses is one of the major obstacles to the completion of the single market and
reduces the competitiveness of the EU. A few respondents suggest that the cross-border
loss offset should be extended to non-EU companies and permanent establishments,
given that competitiveness of EU companies needs to be regarded on a global scale.
A strong majority of respondents from business/professional associations and
consultancy/law firms believe that consolidation is essential. However, they would
accept a transitory and temporary cross-border loss relief as a second-best approach.
Some envisage resistance from Member States in offering wide-ranging cross-border
relief as taxes should be paid where value is created. Others advocate the introduction of
an EU wide regime, not linked to the CCCTB, to be implemented into domestic
legislation.
Conversely, most NGOs and civil society organizations do not support a temporary
mechanism for cross-border loss relief. They fear it would only shrink the taxable base of
multinational companies and open up the system to new types of aggressive tax planning
while postponing consolidation would remove the main benefit of the proposal.
5.5.4. Conclusion on staged approach
Should an initial stage without consolidation be required politically, a limited form of
cross-border loss offset (option 5b) could have small positive impacts on key economic
variables such as GDP, the labour market and investment.
5.6. Impact on SMEs
SMEs would be effectively excluded from the mandatory application of the CCCTB
through the recommended high turnover threshold. Given the low degree of
internationalisation of SMEs, the risk of imposing an additional administrative burden
(through a change in the tax rules to which they would be subjected) would not
necessarily be offset by the benefits of having a common base throughout the EU.
However, the CCCTB is expected to support growth and investment and to reduce
compliance costs when expanding across border. SMEs might therefore want to opt into
the system, which would allow them to benefit from the CCCTB, including the AGI and
the allowance for R&D expenses.
Indeed 63% of SMEs that responded to the public consultation are in favour of providing
the possibility to opt into the CCCTB. Views by SMEs on other issues have been
summarised above in the respective sections on the public consultation.
The impact of debt bias measures is likely to be higher for SMEs that would opt for the
CCCTB. The debt bias is particularly detrimental for young and innovative firms, whose
access to external funding is more difficult. Among the options, the AGI could
potentially be particularly favourable to growing companies, which are likely to be small
on average. Caiumi (2015) investigates the impact of the Italian ACE on the debt bias
and finds that the corrective effect is particularly strong for SMEs.
5.7. Social and environmental impacts
There are no relevant environmental impacts expected from any of the options. Social
impacts will also be limited, but two aspects are worth mentioning. To the extent that

67
positive indirect impacts on the labour market materialise (employment and wages),
positive social impacts are also expected. This aspect lends further support for a CCCTB
with an AGI, which has the most positive impacts on the labour market.
In addition, the significant reduction of corporate tax avoidance under the CCCTB is
expected to influence positively general taxpayer morale. The positive impact on
taxpayer morale is maximized with a CCCTB and a mandatory scope that ensures that
the major share of corporate tax avoidance is no longer feasible.
In the longer term, the provision of R&D tax incentives in the CCCTB which would lead
to more investment in R&D could improve the living standard by generating positive
social spillovers. Cost-benefit analyses of the social effects of R&D tax incentives carried
out in the Netherlands, Canada and Japan find positive effect on welfare.107
5.8. Conclusion on the preferred option
5.8.1. Design components of the preferred option
The analysis of impacts in the previous sections focusses on three design elements of the
CCCTB proposal. These elements were added to the 2011 proposal to address the new
general and specific objectives outlined in Section 3. The general objectives are to (1)
enhance the fairness of the tax system and to (2) stimulate growth and investment.
Section 5.1 shows that the CCCTB offers clear advantages in comparison with the
baseline scenario. The anticipated effects of enhancing fairness via reduced corporate tax
avoidance, ensuring a fair tax contribution from the corporate sector, a more level
playing field among companies and the expected positive impacts on taxpayer morale are
critical, even if not all of them are quantifiable. Small positive economic and investment
effects arise, notably by removing obstacles in the single market. Overall, welfare is
expected to increase slightly. The impact on public finances will largely depend on how
Member States will adjust tax rates, but also on some calibration issues such as the rate
for the AGI. Under the assumption of partly offsetting changes in CIT rates, the
simulations show a small decrease in total tax revenues by 0.2% of GDP, due to a
reduction in CIT revenues partly offset by an increase in other taxes as a result of the
increased economic activity. However, these figures do not capture expected positive
impacts from closing important tax planning channels.
Effectively reducing tax avoidance by multinational entities and increasing fairness
through a more level playing field in the EU can only be reached if the relevant
companies have to operate under a CCCTB. Section 5.2 concludes that a scope which is
mandatory for a defined set of multinational entities and optional for other companies is
the preferred option. The limit of compulsory application is set to groups with a high
consolidated turnover. A threshold of EUR 750 million would serve the purpose of
capturing the vast majority (ca. 64%) of turnover generated by groups while limiting the
risk of including purely domestic groups. Furthermore, such a threshold would be
coherent with the approach taken in current EU initiatives to enhance tax transparency.
107 Parsons and Phillips (2007) conclude that the tax incentive in Canada had a positive welfare effect of
eleven cents for every dollar spent in terms of lost tax revenue. Lokshin and Mohnen (2009) conclude
that the Dutch program resulted in a 16% net welfare gain. Such analyses are sensitive to the
assumptions made, for example on spillover rate and administrative and compliance costs.

68
Solutions for the CCCTB to address the debt bias in corporate taxation are analysed in
Section 5.3. The options to address the debt bias are assessed not only based on their
economic merits of removing the distortion, but also with a view to minimising the risks
of tax planning. The allowance for growth and investment (AGI) is identified as the
option that best matches both criteria. Compared to the CCCTB without AGI, the results
also show much larger positive impacts in terms of overall investment which increases
by up to 3.4% depending on the level of allowance.
Section 5.4 analyses the question of the appropriate level for an allowance for R&D
investments. When setting the level of the allowance, policy makers have to weigh the
increase in R&D expenses from granting the allowance with the loss of tax revenue. The
simulations show that an additional allowance between 33% and 100% (i.e. beyond full
immediate expensing) would be preferable to maintain or further encourage R&D
investment in the EU at a reasonable cost. Allowances will reduce the tax bases and
therefore revenues. However, costly and inefficient existing patent box regimes in
Member States would be removed with the CCCTB. This could partly offset some of the
revenue losses.
In conclusion, a mandatory CCCTB for very large companies, an AGI with well-
designed anti-avoidance measures and an R&D tax incentive designed as a super
allowance for R&D expenses define the preferred option for the re-launch of the
CCCTB.
5.8.2. Regulatory fitness and simplification of the preferred option
Tax compliance costs are an important burden for businesses and their reduction will be a
major advantage of the implementation of the CCCTB. Estimated compliance costs for
large companies amount to about 2% of taxes paid, while for SMEs the estimate was
about 30% of taxes paid. Compliance costs are estimated to increase with cross-border
activity and with increasing number of subsidiaries. Tax reform data show that numerous
CIT reforms took place after the crisis and many measures were directed at reinforcing
the international anti-abuse framework. In the light of this, the reduction of compliance
costs when setting up an additional subsidiary when the CCCTB is introduced remains a
major advantage: The compliance costs for companies will decline for those cases where
cross-border investments are involved – partly because of the abolition of transfer pricing
documentation, more generally because there is only one set of rules to comply with.
Given the fact that the CCCTB is more streamlined than national systems, one could
expect that also domestic compliance costs are reduced. In any case, the choice to enter
the CCCTB will reflect compliance cost considerations, both for domestic firms and for
multinational entities not subject to mandatory application. Generally, data on these
questions are scarce or in some cases missing. The available survey data point however
to cost savings as explained in Section 5.1.1 and therefore serves the objective to increase
regulatory fitness. Time costs for setting up a new subsidiary in a Member State are
estimated to decrease 62-67% for the CCCTB. Focussing on recurring costs, i.e. ignoring
one-off switching costs, the Impact Assessment estimates a decrease in time spent on
compliance activities by 8% after implementation of the CCCTB. Based on these time
reductions one could endeavour a rough calculation of the order of total cost savings that
would result under the CCCTB. If 5% of medium-sized companies expand abroad, a one-
off cost saving of around EUR 1 billion could be expected. If all multinational entities
apply the CCCTB recurring compliance costs could go down by about EUR 0.8 billion.

69
With regard to the costs of tax administrations, the parallel application of national CIT
systems and the CCCTB will increase administrative burden in tax administrations since
two, albeit similar taxes need to be managed. However, since multinational entities under
the scope of the CCCTB will file only one tax declaration in the EU the total amount of
tax declarations should decline and ease the burden for tax administrations. Also, the fact
that no more transfer pricing documentation is necessary in the EU will reduce the
burden on administrations – in line with increasing regulatory fitness.
5.9. Choice of the corresponding policy instrument
It is beyond doubt that binding legal rules are necessary for providing solutions, through
a common legislative framework, to the problems identified earlier as distortions to the
single market. Soft law would risk not being implemented by Member States at all or
could lead to a piece-meal approach. Such an outcome would be highly undesirable. In
addition to creating legal uncertainty for taxpayers, non-binding rules could jeopardise
the objectives for a coordinated and coherent corporate tax system in the single market.
In addition, as the architecture of the common tax base should be expected to impact on
national budgets, especially through the formula apportionment, it is critical that the rules
which define its composition be applied consistently and efficiently. This is far more
likely to be achieved through binding law.
Based on Article 115 of the Treaty on the Functioning of the European Union (TFEU),
which is the legal base used for legislating in direct taxation, "the Council shall, acting
unanimously … issue directives for the approximation of laws, regulations and
administrative provisions of the Member States as directly affect the establishment or
functioning of the internal market." The Treaty is therefore prescriptive that in direct
taxation, legislation shall exclusively be in the form of directives. According to Article
288 TFEU, a directive shall be binding, as to the result to be achieved, upon each
Member State to which it is addressed, but shall leave to the national authorities the
choice of form and methods for achieving this result. In this vein, the directive should
remain general in nature since technicalities and the minute detail should be left to
Member States to decide.
6. MONITORING AND EVALUATION
6.1. Monitoring arrangements
The Commission will monitor the implementation of the legal proposal and its
application in close cooperation with the Member States. Monitoring in a continuous and
systematic way will allow identifying whether the policy proposal is applied as expected
and addressing implementation problems in a timely manner. Collection of factual data
of the suggested monitoring indicators will also provide the basis for the future
evaluation of the CCCTB. Given the specificities of the proposal, the monitoring will
cover both phases of the staged approach set out in the preferred option.
In terms of operational objectives, the number of intra-EU profit shifting arrangements
should be significantly reduced compared to the status quo since the CCCTB makes the

70
current practices obsolete.108
The corresponding indicators presented in Table 17 are a
selection of those suggested by the OECD/G20 BEPS project (Action 11), slightly
modified to fit the context of the CCCTB initiative. For other companies the CCCTB is
optional, but it is generally designed to be attractive for all businesses. The operational
goal is to have a large number of firms opting into the system, ideally from all sectors of
the economy. The operational objective to ensure that profit taxation that does not distort
financing decisions is (i) to reduce the difference in the cost of capital for debt and equity
and (ii) to reduce the debt-equity ratio in companies. High take-up rates of the R&D tax
incentives are the relevant operational objective to measure progress towards the goal to
enhance investment in business R&D.
To measure the operational objectives, in-depth analyses is necessary. The data needed is
micro-panel data for companies, as well as national accounts data and information from
tax administrations, for instance on the take-up of the R&D allowance under the CCCTB.
To measure the effects econometrically a period of five years after the introduction is
necessary to produce statistically relevant results.
In compliance with the principle of subsidiarity, the relevant information should be
gathered primarily by the Member States' tax administrations when data on tax
compliance and the use of the system is concerned. Micro-data on companies is available
from external data providers.
Table 17: Potential monitoring indicators
Operational Objective Indicators
1. Significantly reduce the
number of intra-EU profit
shifting arrangements
Concentration of foreign direct investment relative to GDP
Effective tax rates of MNEs subject to mandatory application of the
common base/CCCTB relative to companies not applying the common
base/CCCTB with similar characteristics
Concentration of royalty receipts relative to R&D spending
Interest-to-income ratios of MNE affiliates in locations with above
average statutory tax rates
2. Large number of companies
opting in from all sectors
Number of companies who have opted for the common base/CCCTB
Number of companies who have opted-in or opted-out in a given year
Number of companies who fall under the mandatory application of the
common base/CCCTB
Contextual information: resident Member State, sector and size of the
company; statutory and effective tax rates under the common
base/CCCTB
3. Reduce difference in cost of
capital for debt and equity
Cost of capital for investments financed by debt and by equity for
companies applying the common base/CCCTB (by Member State)
Levels of debt and equity for companies applying the common
base/CCCTB and for companies not applying the common base/CCCTB
4. High take-up rates of
R&D incentives
Number of companies receiving an R&D allowance under the common
base CCCTB
R&D allowance granted under the common base/CCCTB by company
Contextual information: sector and size of the company
Source: European Commission
Note: The data sources for indicator 1 are described in the final report on BEPS Action 11.
108 For the status quo see the study by Ramboll et al. (2015) on aggressive tax planning structures as well
as ZEW (2016c).

71
6.2. Evaluation
The evaluation of the CCCTB should assess the extent to which the outlined objectives
have been met. It will also analyse the extent to which the expected simplifications for
the targeted stakeholders have materialized and assess the related administrative and
regulatory burden. Considering the phased approach of the CCCTB and allowing for
impacts to materialize and to be observed after the implementation of the policy, an
evaluation should be carried out three to five years after the implementation of the
second phase of the proposal. The Commission will report on the evaluation results in the
form of an evaluation report.

72
7. GLOSSARY
Aggressive tax planning (see also: Tax planning): In the Commission
Recommendation on aggressive tax planning (C(2012) 8806 final), aggressive tax
planning is defined as “taking advantage of the technicalities of a tax system or of
mismatches between two or more tax systems for the purpose of reducing tax liability.
Aggressive tax planning can take a multitude of forms. Its consequences include double
deductions (e.g. the same loss is deducted both in the state of source and residence) and
double non-taxation (e.g. income which is not taxed in the source state is exempt in the
state of residence)”.
Allowance for corporate capital (ACC) is a corporate tax system where corporations
may deduct a defined return on total capital (both equity and debt) from the corporate
income tax base. It achieves full financing neutrality between debt and equity at the
corporate level.
Allowance for corporate equity (ACE) is a corporate tax system where interest
payments and a defined return on equity can both be deducted from the corporate income
tax base. It moves the system closer to financing neutrality between debt and equity at
the corporate level.
Allowance for growth and investment (AGI) is a corporate tax system where interest
payments and a return on equity can both be deducted from the corporate income tax
base. It moves the system closer to financing neutrality between debt and equity at the
corporate level. It goes some steps further than ACE because it removes tax avoidance by
cascading the benefits (the funds injected in a group benefit from deductibility only once)
and uses an incremental system based on a moving reference year.
Anti-Tax Avoidance Directive (ATAD) is an EU Tax Directive which lays down rules
against tax avoidance practices which directly affect the functioning of the single market.
Anti-Tax Avoidance Package (ATAP) is a package of actions which includes legally-
binding anti-avoidance measures necessary to reduce aggressive tax planning. It is part of
the action plan on corporate taxation for fairer, simpler and more effective corporate
taxation in the EU.
Base erosion and profit shifting (BEPS project): Tax planning strategies that exploit
gaps and mismatches in tax rules to artificially shift profits to low or no-tax locations
where there is little or no economic activity, resulting in little or no overall corporate tax
being paid. The OECD and the EU have developed specific actions to give countries the
tools they need to ensure that profits are taxed where economic activities generating the
profits are performed and where value is created, while at the same time giving
enterprises greater certainty by reducing disputes over the application of international tax
rules, and standardising requirements.
Common consolidated corporate tax base (CCCTB) is a policy proposal of the
European Commission consisting of the harmonisation of the tax base of corporations at
EU level. It also includes consolidation and apportionment of the tax base of corporation
groups.

73
Common corporate tax base (CCTB) consists of the harmonisation of the tax base of
corporations at the EU level, but does not include the element of tax consolidation which
is part of the CCCTB.
Comprehensive business income tax (CBIT) refers to a corporate tax system where
neither interest payments nor the return on equity can be deducted from corporate profits,
and are thus both fully subject to corporate income tax. It equalises the tax treatment of
debt and equity finance at the corporate level.
Controlled foreign corporation (CFC) is a foreign corporation whose income (or some
part of it) is deemed to be generated (and hence to be taxed) in the residence country of
the multinational group if certain conditions are met (usually this condition is that the tax
rate in the foreign country is lower than a set percentage of the tax rate in the country
implementing the CFC rule). The particular definition of the foreign corporations subject
to these rules varies across jurisdictions, but it is generally based on a control percentage.
Corporate income tax (CIT) is a direct tax levied on the profits of corporations. The tax
rate payable varies across jurisdictions.
Cost of capital (CoC) is a measure of the cost of either debt and/or equity. It is used to
assess the cost of new investments.
Cost of capital allowance (CoCA): The term refers to a corporate tax system where the
cost for both debt and equity finance is captured by a defined allowance which is
deductible from the corporate tax base; similarly, at the investor's level, the income tax
base increases by a defined return on the investments, which corresponds to the defined
allowance and can be taxable. The amount of the allowance/return is computed as the
product of the relevant assets/investments multiplied by a CoCA rate. This system
equalises the tax treatment of debt and equity finance at the corporate and investor level.
Country-by-country reporting (CBCR) refers to the requirement that large
multinational entities (those with consolidated revenues of at least EUR 750 million)
have to submit a report on tax-related information to the jurisdictions in which they do
business on an annual basis.
Debt-equity tax bias/debt bias can be the result of operating a corporate tax system
which favours financing by debt, rather than by equity. This is achieved by treating
interest payments as a tax deductible expense whilst no equivalent deduction is granted
for the return on equity (mainly, dividends).
Double taxation is an international taxation scenario in which the same taxable object is
subject to taxation in two or more jurisdictions.
Earnings before interest, tax depreciation and amortisation (EBITDA) is an
accounting measure of the net earnings of a company. It excludes interest, taxes,
depreciation and amortisation expenses.
Effective average tax rate is a tax rate calculated from the nominal tax rate and the
definition of the tax base. Particularly, this effective tax rate is based on total investment
income.

74
Effective marginal tax rate is a tax rate calculated from the combination of the nominal
(i.e. statutory) tax rate and the definition of the tax base (i.e. the taxable profit).
Particularly, this effective tax rate is based on additional investment income.
Formula apportionment is an equation used to allocate the tax base of multinational
corporations between the entities of the group.
Hybrid mismatches: This refers to the situation where, as a result of disparities amongst
national laws, the same entity or financial instrument is characterized differently, as far
as its tax treatment is concerned, in two or more States (e.g. an entity is treated as a
partnership in one jurisdiction and as a corporation in another; a financial instrument
qualifies as deductible interest in one jurisdiction and as tax exempt dividend in the
other). Taxpayers often set up arrangements to exploit such mismatches for the purpose
of lowering their overall tax burden.
Intellectual property is a set of intangible assets owned by a company, which are legally
protected by patents, trademarks, copyrights or other type of intellectual property rights.
Joint Transfer Pricing Forum is an EU forum of experts that assists and advises the
European Commission on transfer pricing tax issues. It was created by a Commission's
Decision of 25th
January 2011.109
The JTPF has one representative from each Member
State's tax administrations and 18 non-government organisation members. It is chaired by
an independent chairperson. The JTPF works within the framework of the OECD
Transfer Pricing Guidelines and operates on the basis of consensus to propose to the
Commission pragmatic, non-legislative solutions to practical problems posed by transfer
pricing practices in the EU.
Multinational entities/companies/enterprises are corporations that operate across
different jurisdictions.
Non-financial corporations are corporations not belonging to the financial sector.
Profit shifting is an intra-group tax planning strategy of multinational entities consisting
of shifting profits from the entities of the group operating in high tax paying countries to
other entities operating in low tax paying countries.
Research & Development (R&D):
Research: all original and planned investigation undertaken with the prospect of gaining
new scientific or technical knowledge and understanding.
Development: the application of research findings or other knowledge to a plan or design
for the production of new or substantially improved materials, products, devices,
processes, systems or services before the start of commercial production or use.
Small and medium-sized enterprises (SMEs) are defined by the European Commission
as having less than 250 persons employed. They should also have an annual turnover of
up to EUR 50 million, or a balance sheet total of no more than EUR 43 million
(Commission Recommendation of 6 May 2003).
109
http://ec.europa.eu/taxation_customs/resources/documents/taxation/company_tax/transfer_pricing/forum/c_2011_16_en.pdf

75
Special-purpose entities are legal entities established to perform specific functions
limited in scope or time, which has little or no production, is often a subsidiary and has
as a core business function financing its group activities or holding assets and liabilities
of its group.
Treaty on the Functioning of the European Union (TFEU) is one of the Treaties on
which the EU is founded. It organises the functioning of the Union and determines the
areas of, delimitation of, and arrangements for exercising its competences.
Tax avoidance: According to the OECD glossary of tax terms, tax avoidance is defined
as the arrangement of a taxpayer’s affairs in a way that is intended to reduce his or her
tax liability and that - although the arrangement may be strictly legal - is usually in
contradiction with the intent of the law it purports to follow.
Tax evasion: According to the OECD glossary of tax terms, tax evasion is defined as
illegal arrangements where the liability to tax is hidden or ignored. This implies that the
taxpayer pays less tax than he or she is legally obligated to pay by hiding income or
information from the tax authorities.
Tax planning (see also: Aggressive tax planning): According to the OECD glossary of
tax terms, tax planning is an arrangement of a person’s business and/or private affairs in
order to minimize tax liability.

76
8. REFERENCES
Agúndez-García, A. (2006), 'The Delineation and Apportionment of an EU Consolidated
Tax Base for Multi-jurisdictional Corporate Income Taxation: A Review of Issues and
Options', Taxation Papers No 9, DG Taxation and Customs Union, European
Commission.
Alstadsæter, A., Barrios, S., Nicodeme, G., Skonieczna, A. and Vezzani, A. (2015),
'Patent Boxes Design, Patents Location and Local R&D', Taxation Papers No 57, DG
Taxation and Customs Union, European Commission.
Arundel, A. (2001), 'The relative effectiveness of patents and secrecy for appropriation',
Research Policy, 30(4), pp. 611-624.
Aus dem Moore, N. (2014a), 'Taxes and Corporate Financing Decisions: Evidence from
the Belgian ACE Reform', Ruhr Economic Papers, No 533, Rheinisch-Westfälisches
Institut für Wirtschaftsforschung (RWI).
Aus dem Moore, N. (2014b), 'Corporate Taxation and Investment: Evidence from the
Belgian ACE Reform', Ruhr Economic Papers, No 534, Rheinisch-Westfälisches Institut
für Wirtschaftsforschung (RWI).
Balasubramanian, N. and J. Sivadasan (2011), 'What Happens When Firms Patent? New
Evidence from U.S. Economic Census Data', The Review of Economics and Statistics, No
93(1), pp. 126-146.
Bao, D.-H. and Romeo, G. C. (2013), 'Tax Avoidance and Corporations in the United
States – The Effective Tax Rate Abnormality for the Top Five Percent by Corporate
Size', Journal of Applied Business and Economics 14(4), pp. 88-100.
Belz, T., von Hagen, D. and Steffens, C. (2016), 'Taxes and Firm Size: Political Cost or
Political Power? A Meta-Regression Analysis', SSRN Working paper.
Becker, B. (2015), 'Public R&D policies and private R&D investment: a survey of the
empirical evidence', Journal of Economic Surveys 29(5), pp. 917-942.
Bénassy-Quéré, A., Trannoy, A. and Wolff, G. (2014), 'Tax Harmonization in Europe:
Moving Forward', Les notes du CAE, 14, July, Conseil d'analyse économique (CAE),
Paris.
Bettendorf, L. and van der Horst, A. (2006), 'Documentation of CORTAX', CPB
Memorandum No 161, CPB Netherlands Bureau for Economic Policy Analysis.
Bettendorf, L., van der Horst, A. and de Mooij, R. (2009a), 'Corporate Tax Policy and
Unemployment in Europe: An Applied General Equilibrium Analysis', The World
Economy, pp. 1319-1347.
Bettendorf, L., van der Horst, A., de Mooij, R., Devereux, M and Loretz, S. (2009b), 'The
economic effects of EU-reforms in corporate income systems', Study for the European
Commission Directorate General for Taxation and Customs Union.

77
Bettendorf, L., Devereux, M., van der Horst, A., Loretz, S. and de Mooij, R. (2010a),
'Corporate tax harmonization in the EU', Economic Policy, pp. 537–590.
Bettendorf, L., van der Horst, A., de Mooij, R. and Vrijburg, H. (2010b), 'Corporate Tax
Consolidation and Enhanced Cooperation in the European Union', Fiscal Studies, Vol.
31, No 4, pp. 453–479.
Bloom, N., Schankerman, M. and van Reenen, J. (2013), 'Identifying Technology
Spillovers and Product Market Rivalry.' Econometrica, Vol 81, No 4, pp. 1347–1393.
Blouin, J., Huizinga, H., Laeven, L. and Nicodeme, G. (2014), 'Thin Capitalization Rules
and Multinational Firm Capital Structure', Taxation papers No 42, DG Taxation and
Customs Union, European Commission.
Boadway R. and Bruce, N. (1984), 'A General Proposition On The Design of a Neutral
Business Tax', Journal of Public Economics, Vol. 24, No 2, pp. 231-239.
Büttner, T., Riedel, N., and Runkel, M. (2011), 'Strategic Consolidation under Formula
Apportionment', National Tax Journal, Vol. 64, 2011, pp. 225-254.
Büttner, T., Overesch, M., Schreiber, U. and Wamser, G. (2012), 'The Impact of Thin-
Capitalization Rules on the Capital Structure of Multinational Firms', Journal of Public
Economics, Vol. 96 No 11, pp. 930-938.
Bravo-Biosca, A., Criscuolo, C. and Menon, C. (2013), 'What Drives the Dynamics of
Business Growth?', OECD Science, Technology and Industry Policy Papers, No. 1,
OECD Publishing.
Cecchetti, S. G., Mohanty, M. and Zampolli, F. (2011), 'The real effects of debt',
Economic Symposium Conference Proceedings, Jackson Hole, pp- 145-196.
Chang, A. (2014), 'Tax Policy Endogeneity: Evidence from R&D Tax Credits'. Finance
and Economics Discussion Series, No 2014-101, Federal Reserve Board.
Cincera, M. and Veugelers, R. (2013), 'Young leading innovators and the EU's R&D
intensity gap', Economics of Innovation and New Technology Vol. 22 No 2, pp. 177-198.
Clausing, K. A. (2011), 'The revenue effects of multinational form income shifting', Tax
Notes.
Clausing, K.A., and Lahav, Y. (2011), 'Corporate tax payments under formulary
apportionment: Evidence from the financial reports of 50 major U.S. multinational firms',
Journal of International Accounting, Auditing and Taxation, Vol. 20, 2011, pp. 97-105.
CPB (2014), 'A study on R&D tax incentives. Final Report.' Taxation Papers, No 52, DG
Taxation and Customs Union, European Commission.
Criscuolo C, Bajgar M, Appelt S, Galindo-Rueda F (2016), R&D tax incentives: design
and evidence. Organisation for Economic Co-operation and Development, Paris, No
DSTI/IND/STP (2016)

78
De Mooij, R. (2011a), 'Tax Biases to Debt Finance: Assessing the Problem, Finding
Solutions', May 2011, IMF Staff Discussion Note, No 11/11, International Monetary
Fund (IMF), Washington D.C.
De Mooij, R. (2011b), 'The Tax Elasticity of Corporate Debt; A Synthesis of Size and
Variations', IMF Working Paper, No 11/95, International Monetary Fund (IMF),
Washington D.C.
De Mooij R. A. and Devereux, M. P. (2011c), 'An applied analysis of ACE and CBIT
reforms in the EU', International Tax and Publix Finance, Vol. 18 No 1, pp. 93-120.
De Mooij R. A., (2012), 'Tax Biases to Debt Finance: Assessing the Problem, Finding
Solutions', Fiscal Studies Vol. 33 No 4, pp. 489–512.
De Moiij, R., Keen, M. and Orihara, M. (2014), 'Taxation, Bank Leverage, and Financial
Crises', Taxation and Regulation of the Financial Sector, de Mooij and Nicodeme (eds.),
MIT Press, Cambridge, chapter 11.
Devereux, M.P. and Freeman, H. (1991), 'A General Neutral Profits Tax', Fiscal Studies,
Vol. 12 No 3, pp. 1-15.
Devereux, M. P. and Griffith, R. (1998a), 'Taxes and the location of production: evidence
from a penal of US multinationals', Journal of Public Economics Vol. 68 No 3, pp. 335-
367.
Devereux, M. P. and Griffith, R. (1998b), 'The Taxation of Discrete Investment Choices',
IFS Working Paper, No W98/16, Institute for Fiscal Studies, London.
Devereux, M.P. and Griffith, R. (2003), 'Evaluating tax policy for location decisions',
International Tax and Public Finance, No 10, pp. 107-126.
Devereux, M.P., Maffini, G. and Xing, J. (2015), 'Corporate tax incentives and capital
structure: empirical evidence from UK tax returns', Working Papers, No 1507, Oxford
University Centre for Business Taxation.
Dharmapala, D. (2014), 'What do we know about base erosion and profit shifting? A
review of the empirical literature', Fiscal Studies, Vol. 35, 2014, pp. 421-448.
Egger, P., Eggert, W. and Winner, H. (2010), 'Saving Taxes through Foreign Plant
Ownership', Journal of International Economics 81(1), pp. 99-108.
Eichfelder, S., Hechtner, F., Hundsdoerfer, J. (2015), 'Formula Apportionment: Factor
Allocation and Tax Avoidance', Arbeitskreis Quantitative Steuerlehre (arqus), Discussion
paper No. 199.
Eichfelder, S. and Vaillancourt, F. (2014), 'Tax Compliance Costs: A Review of Cost
Burdens and Cost Structures', arqus Working Paper 178, Arbeitskreis Quantitative
Steuerlehre, Berlin 2014.
European Central Bank (2014), 'Deleveraging patterns in the euro area corporate sector',
ECB Monthly Bulletin, February 2014, European Central Bank, Frankfurt.

79
European Commission (2001), 'Company taxation in the Internal market', SEC (2001)
1681, Brussels.European Commission (2006), 'Towards a more effective use of tax
incentives in favour of R&D', Communication from the Commission to the Council, the
European Parliament and the European Economic and Social Committee, No
COM/2006/0728 final.
European Commission (2011a), 'Impact Assessment - Accompanying document to the
Proposal for a Council Directive on a Common Consolidated Corporate Tax Base
(CCCTB)', Commission Staff Working Document, SEC(2011) 315 final, European
Commission, Brussels.
European Commission (2011b), 'Opportunities for the Internationalisation of European
SMEs – Final Report', Directorate-General for Internal Market, Industry, Entrepreneur-
ship and SMEs.
European Commission (2015a), 'A Fair and Efficient Corporate Tax System in the
European Union: 5 Key Areas for Action', Communication from the Commission to the
European Parliament and The Council, COM(2015) 302 final, European Commission,
Brussels.
European Commission (2015b), 'Corporate Income Taxation in the European Union',
Commission Staff Working Document, SWD(2015) 121 final, European Commission,
Brussels.
European Commission (2015c), 'Internationalisation of Small and Medium-sized
Enterprises', Flash Eurobarometer 421, Directorate-General for Internal Market,
Industry, Entrepreneurship and SMEs.
European Commission (2016), 'Science, Research and Innovation performance of the
EU. A contribution to the Open Innovation, Open Science, Open to the World agenda'.
Luxembourg: Publications Office of the European Union, 2016.
Evans, C. Hansford, A., Hasseldine, J., Lignier, P., Smulders, S. and Vaillancourt, F.
(2014), 'Small business and tax compliance costs: A cross-country study of managerial
benefits and tax concessions', eJournal of Tax Research. Vol 12, no. 2, pp. 453-482.
Evers, L., Miller, H. and Spengel, C. (2015), 'Intellectual property box regimes: effective
tax rates and tax policy considerations', International Tax and Public Finance, Vol. 22,
pp. 502-530.
Fama, E.F. and French, K.R. (1999), "The Corporate Cost of Capital and the Return on
Corporate Investment," The Journal of Finance, No. 6.
Fatica, S., Hemmelgarn, T. and Nicodeme, G. (2013), 'The Debt-Equity Bias:
Consequences and Solutions', Reflets et Perspectives de la Vie Economique, Vol. 52 No
1, pp. 5-18.
Financial Stability Board (2015), Corporate Funding Structures and Incentives – Final
Report, Basel, August 2015
Finke, K. (2013), Tax Avoidance of German Multinationals and Implications for Tax
Revenue Evidence from a Propensity Score Matching Approach, mimeo.

80
Fortin B., Lacroix G. and Villeval, M-C. (2007), 'Tax evasion and social interactions',
Journal of Public Economics Vol. 91 No 11-12, pp. 2089–2112.
Garnier, G., György, E., Heineken, K., Mathé, M., Puglisi, L., Rua, S., et al. (2014), 'A
wind of change? Reforms of Tax Systems since the launch of Europe 2020'. Taxation
Papers No 49, DG Taxation and Customs Union, European Commission.
Giannini, S. and Maggiulli, C. (2002), 'The Effective Tax Rates in the EU Commission
Study on Corporate Taxation: Methodological Aspects, Main Results and Policy
Implications', CESifo Working Papers, No 666, CESifo Group, München.
Gordon, R. and Wilson, J.D. (1986), 'An Examination of Multijurisdictional Corporate
Income Taxation under Formula Apportionment', Econometrica, Vol. 54, No. 6, 1986,
pp. 1357-1373.
Griffith, R., Miller, H., and O'Connell, M. (2014). 'Ownership of intellectual property
and corporate taxation'. Journal of Public Economics Vol. 112, pp. 12–23.
Gropp, R. and Heider, F. (2010), 'The determinants of bank capital structure', Review of
Finance Vol. 14, No 4, pp. 587-622.
Hasegawa, M., Hopes, J. L., Ishida, R., and Slemrod, J. B. (2013), 'The effect of public
disclosure on reported taxable income: Evidence from individuals and corporations in
Japan', National Tax Journal Vol. 66 No 3, pp. 571-608.
Hall, B.H., Mairesse, J. and Mohnen, P. (1999), 'Measuring the Returns to R&D', in:
Handbook of the Economics of Innovation (edited by B.H. Hall and N. Rosenberg). Vol.
1, Elsevier, 2010.
Hall, B., Helmers, C., Rogers, M., Sena, V. (2013), 'The importance (or not) of patents to
UK firms', NBER Working Paper Series, No 19089.
Hall, B., Helmers, C., Rogers, M., Sena, V. (2014), 'The choice between formal and
informal intellectual property: A review', Journal of Economic Literature Vol. 52 No 2,
pp. 375–423.
Hanel, P. (2008), 'The use of intellectual property rights an innovation by manufacturing
firms in Canada', Economics of Innovation and New Technologies Vol 17, pp. 285-309.
Hebous, S. and Ruf, M. (2015), 'Evaluating the Effects of ACE Systems on Multinational
Debt Financing and Investment', CESifo Working Paper, No 5360, CESifo Group,
München.
Heckemeyer, J.H. and Overesch, M. (2013), 'Multinationals' profit response to tax
differentials: Effect size and shifting channels', ZEW Discussion Paper, No 13-045, ZEW
Centre for European Economic Research, Mannheim.
Hellerstein, W., (2005), 'Income Allocation in the 21st century: The End of Transfer
Pricing? The Case for Formulary Apportionment', International Transfer Pricing
Journal, Vol. 3.

81
Hellerstein, W., (2012), 'Tax Planning under the CCCTB's Formulary Apportionment
Provisions: The Good, the bad, and the Ugly', Dennis Weber (ed.), CCCTB: Selected
Issues, Kluwer Law International, 2012, pp. 221-252.
Hemmelgarn; T. and Teichmann, D. (2014), 'Tax reforms and the capital structure of
banks', International Tax and Public Finance, Vol. 21, No 4, pp. 645-693.
Huizinga, H., Laeven, L., and Nicodeme, G. (2008), 'Capital Structure and International
Debt Shifting', Journal of Financial Economics Vol. 88 No 1, pp. 80-118.
Ilzkovitz, F. and Dierx, A. (2016), 'Competition Policy and Inclusive Growth', Voxeu.org
of 19 June 2016.
International Monetary Fund (2009), 'Debt Bias and Other Distortions: Crisis-Related
Issues in Tax Policy', Public Information Notice (PIN), No 09/76, June 2009,
International Monetary Fund (IMF), Washington D.C.
International Monetary Fund (2010), Financial Sector Taxation, the IMF Report to the
G-20 and Background Material, Claessens, Keen and Pazarbasioglu (eds.), International
Monetary Fund (IMF), Washington D.C.
International Monetary Fund (2016), 'IMF Fiscal Monitor. Acting Now, Acting
Together'. World economic and financial surveys, International Monetary Fund (IMF),
Washington, DC.
Joint Research Center of the European Commission (2016), Modelling corporate tax
reform in the EU: New calibration and simulations with the CORTAX model, Report by
the Joint Research Center.
Keen, M. and de Mooij, R. (2012), 'Debt, Taxes, and Banks', IMF Working Paper 12/48,
International Monetary Fund (IMF), Washington D.C.
Keser, C., Kimpel, G., Oestreicher, A., (2014), 'The CCCTB option an experimental
study' CIRANO Working Papers, 2014s-24.
Kind, H.J., Midelfart, K.H. and Schjelderup, G. (2005), 'Corporate Tax Systems,
Multinational Enterprises and Economic Integration', Journal of International
Economics, Vol. 65, 2005, pp. 507-521.
King, M., and Fullerton, D. (1984), 'The taxation of income from capital: a comparative
study of the United States, the United Kingdom, Sweden and West Germany', The
Chicago University Press.
Kirchler E., Niemirowski A. and Wearing, A. (2006), 'Shared subjective views, intent to
cooperate and tax compliance: Similarities between Australian taxpayers and tax
officers', Journal of Economic Psychology, Vol. 27, No 4, pp. 502–517.
Langedijk, S., Nicodeme, G., Pagano, A., and Rossi, A. (2014), 'Debt Bias in Corporate
Income Taxation and the Costs of Banking Crises', CEPR Discussion Paper, No 10616.
Lee L-E, M. Moscardi, G. Trivedi and Shakdwipee, M. (2015), 'Re‐Examining the Tax
Gap – The Tax Gap in the MSCI World', Issue Brief, MSCI ESG Research, New York.

82
Kleinbard D. E. (2015), 'Reimagining capital income taxation', Oxford University Centre
for Business Taxation Working paper Vol. 15, No 24.
Klemm, A. and Radaelli C. (2001), The reform of the EU tax system, Report of the Ceps
tax task force, Centre for European Policy Studies, Brussels.
Koehler, C., Laredo, P., Rammer, C. (2012), "The Impact and Effectiveness of Fiscal
Incentives for R&D", Nesta Working Paper No 12/01.
Lignier, P and Evans, C (2012), ‘The rise and rise of tax compliance costs for the small
business sector in Australia’, Australian Tax Forum, No 27, pp. 615-672.
Lignier, P, Evans, C and Tran-Nam, B (2014), ‘Tangled up in tape: The continuing tax
compliance plight of the small and medium enterprise business sector’, Australian Tax
Forum, No 29, pp. 217-247.
Lokshin, B. and Mohnen, P., (2009). 'What does it take for an R&D tax incentive policy
to be effective?' MERIT Working Papers.
c ure, Ch.E., r. (1 0), 'The tate Corporate ncome Tax: ambs in olves
Clothing', in H. J. Aaron and M. J. Boskin (eds.) The Economics of Taxation.
Washington: Brookings Institution.
McLure, Ch.E., Jr. (2002), 'Replacing Separate Entity Accounting and the Arm's Length
Principle with Formulary Apportionment', Bulletin for International Fiscal
Documentation, Vol. 56, 2002, pp. 586-599.
Mintz, J. M. and Smart, M. (2004), 'Income Shifting, Investment and Tax Competition:
Theory and Evidence from Provincial Taxation in Canada', Journal of Public Economics,
Vol. 88, 2004, pp. 1149-1178.
Musgrave, P.B. (1973), 'International Tax Base Division and the Multinational
Corporation', Public Finance, Vol. 27, 1973, pp. 394-411.
National Bank of Belgium (2008), Impact Macroéconomique et Budgétaire de la
déduction Fiscale pour Capital à Risque, July 22.
Navaretti, G. B., Bugamelli, F., Chivardi, F., Altomonte, C., Horgos, D. and Maggioni,
D. (2011), 'The Global Operations of European Firms – The Second EFIGE policy
report', Bruegel Blueprints Series, Vol. XII, Bruegel, Brussels.
OECD (1991), 'Taxing Profits in the Global Economy: Domestic and International
Issues', Organisation for Economic Co-operation and Development (OECD), Paris.
OECD (2007), 'Tax Effects on Foreign Direct Investment: Recent Evidence and Policy
Analysis', OECD Tax Policy Studies, No. 17.
OECD (2015a), 'How to Restore a Healthy Financial Sector that Supports Long-Lasting,
Inclusive Growth?', Economics Department Policy Note, No 27, Organisation for
Economic Co-operation and Development (OECD), Paris.

83
OECD (2015b), 'Transfer Pricing Documentation and Country-by-Country Reporting,
Action 13 - 2015 Final Report', OECD/G20 Base Erosion and Profit Shifting Project,
Organisation for Economic Co-operation and Development (OECD), Paris.
OECD (2015c), R&D Tax Incentive Indicators, www.oecd.org/sti/rd-tax-stats.htm and
Main Science and Technology Indicators, www.oecd.org/sti/msti.htm, June 2015,
Organisation for Economic Co-operation and Development (OECD), Paris.
OECD (2015d), Measuring and Monitoring BEPS: Action 11 – 2015 Final Report,
Organisation for Economic Co-operation and Development (OECD), Paris.
OECD (2016), 'Fiscal incentives for R&D innovation and dissemination in a
heterogeneous world', Centre for Tax Policy and Administration, Note by the Secretariat.
Forthcoming as chapter in OECD's Business and Financial Outlook, Organisation for
Economic Co-operation and Development (OECD), Paris.
Ortmann, R. and Erich, P. (2015), 'Formula Apportionment or Separate Accounting?
Tax- nduced Distortions of ultinationals’ ocational nvestment Decisions', TAF
Working Paper, University of Paderborn.
Panteghini, P., Parisi, M.L. and Pighetti F. (2012), 'Italy's ACE Tax and its Effect on a
Firm's Leverage', CESifo Working Paper, No 3869, CESifo Group, München.
Panier, F., Perez-Gonzalez, F. and Villanueva, P. (2015), 'Capital Structure and Taxes:
What happens when you (also) subsidize equity?', Stanford University, Mimeo.
Parsons, M., and Phillips, N. (2007). 'An Evaluation of the Federal Tax Credit for
Scientific Research and Experimental Development'. Working Paper, Department of
Finance, Canada.
Poterba, J.M. (1998), 'The rate of return to corporate capital and factor shares: new
estimates using revised national income accounts and capital stock data', Carnegie-
Rochester Conference Series on Public Policy Vol. 48, No 21, pp. 211-246
Princen; S. (2012), 'Taxes do Affect Corporate Financing Decisions: The Case of Belgian
ACE', CESifo Working Paper, No 3713, CESifo Group, München.
PwC. (2008), Impact of corporate income tax reforms at the EU level on European
business taxpayers. Report on the impact on taxable profits.
Schäfer, A. and Spengel, C. (2003), 'The impact of ICT on Profit Allocation within
Multinational Groups: Arm's Length Pricing or Formula Apportionment?', ZEW
Discussion Paper No. 03-53, ZEW Centre for European Economic Research, Mannheim.
Scherer, F. M, Harhoff, D. (2000), 'Technology policy for a world of skew-distributed
outcomes', Research Policy, Vol. 29, pp. 559-566.
Schepens, G. (2015), 'Taxes and Bank Capital Structure', available at SSRN:
http://ssrn.com/abstract=2519533 or http://dx.doi.org/10.2139/ssrn.2519533.
Ramboll Management Consulting, The Evaluation Partnership and Europe Economic
Research (2013), 'A review and Evaluation of Methodologies to calculate tax compliance

84
costs', Taxation Papers, No 40, DG Taxation and Customs Union, European
Commission.
Ramboll Management Consulting and Corit Advisory (2015), 'Study on Structures of
Aggressive Tax Planning and Indicators', Taxation Papers, No 61, DG Taxation and
Customs Union, European Commission.
Redoano, M. (2014), 'Tax competition among European countries. Does the EU matter?',
European Journal of Policital Economy, No 34, pp. 353-371.
Sandford C., Godwin, M. and Hardwick, P. (1989), 'Administrative and compliance costs
of taxation', Fiscal Publications, Bath.
Schreiber, U., Spengel. C. and Lammersen, L. (2002), 'Measuring the Impact of Taxation
on Investment and Financing Decisions', Schmalenbach Business Review, Vol. 54, pp. 2-
23.
Silverberg, G. and Verspagen, B. (2007), 'The size distribution of innovations revisited:
An application of extreme value statistics to citation and value measures of patent
significance', Journal of Econometrics, Vol. 139 No. 2, pp. 318-339.
Sørensen P. B. (2015), Taxation and the Optimal Constraint on Corporate Debt Finance:
Why a Comprehensive Business Income Tax is Suboptimal, University of Copenhagen.
Spengel, C. and Zöllkau, Y. (2012), Common Corporate Tax Base (CC(C)TB) and
Determination of Taxable Income: An International Comparison, Springer, Berlin.
Squicciarini, M. and Dernis, H. (2013), 'A Cross-Country Characterisation of the
Patenting Behaviour of Firms based on Matched Firm and Patent Data', OECD Science,
Technology and Industry Working Papers, 2013/05, OECD Publishing.
Streif, F. (2015), 'Tax Competition in Europe – Europe in Competition with Other World
Regions?', ZEW Discussion Paper, No 15-082, ZEW Centre for European Economic
Research, Mannheim.
Sullivan, M. (2004), 'Data Show Dramatic Shift Of Profits to Tax Havens', Tax Notes,
September 2004, Tax Analysts, pp. 1190-1200.
Sveikauskas, L. (2007), 'R&D and Productivity Growth: A Review of the Literature.'
Bureau of Labor Statistics Working Paper 408, U.S. Department of Labor, Washington.
Thomsen, M., Ullmann, R., and Watrin, C. (2014), 'The impact of taxes on location
decisions', Working Paper, niversity of nster.
Torgler B., Demir I. C., Macintyre A. and Schaffner, M. (2008), 'Causes and
Consequences of Tax Morale: An Empirical Investigation', Economic Analysis and
Policy, Vol. 38 No 2, pp. 313-339.
VVA and ZEW (2015), SME taxation in Europe. An empirical study of applied
corporate income taxation for SMEs compared to large enterprises, commissioned by
the European Commission, May 2015.

85
Warda, J. (2001), 'Measuring the Value of R&D Tax Treatment in OECD Countries', STI
Review No. 27: Special Issue on New Science and Technology Indicators, OECD
Publishing.
Weber, T. O., Fooken, J. and Herrmann, B. (2014), 'Behavioural Economics and
Taxation', Taxation paper, No 41, DG Taxation and Customs Union, European
Commission.
Weiner, J. M. (2005), 'Formulary Apportionment and Group Taxation in the EU: Insights
from the United States and Canada', Taxation Papers, Working Paper, No 8, DG
Taxation and Customs Union, European Commission.
Weiner, J. M. (2006), 'Company Tax reform in the European Union: Guidance from the
United States and Canada on Implementing Formulary Apportionment in the EU'.
Springer Science, New York.
Zangari, E. (2014), 'Addressing the Debt Bias: A Comparison between the Belgian and
the Italian ACE Systems', Taxation Papers, No 44, DG Taxation and Customs Union,
European Commission.
ZEW (2008), 'Study on the impact of reforms of corporate income taxation systems at the
E level on the size of the tax bases of the E companies, using the model “European
Tax Analyzer”, Final Report, Project for the E Commission TAX D/2007/DE/325.
ZEW (2015), 'Effective tax rates in an enlarged European Union' – Intermediate Report
2015, Project for the European Commission, TAXUD/2013/CC/120.
ZEW (2016a), 'The Effects of Tax Reforms to Address the Debt-equity Bias on the Cost
of Capital and on Effective Tax Rates', forthcoming in Taxation Papers, DG Taxation
and Customs Union, European Commission.
ZEW (2016b), 'The Effect of Inflation and Interest Rates on Forward-looking Effective
Tax Rates, forthcoming in Taxation Papers, DG Taxation and Customs Union, European
Commission.
ZEW (2016c), The Impact of Tax-planning on Forward-looking Effective Tax Rates,
forthcoming in Taxation Papers, DG Taxation and Customs Union, European
Commission.

86
9. ANNEXES

87
Annex I: Procedural Information
1. LEAD DG, AGENDA PLANNING AND WORK PROGRAMME
The re-launch of a proposal for a Common Consolidated Corporate Tax Base (CCCTB)
was prepared under the lead of Directorate General for Taxation and Customs Union.
Within the Agenda Planning of the European Commission, the project is referred to
under item 2016/TAXUD/006. In the Commission Work Programme for 2016, the
Commission committed under the header "Deeper and Fairer Internal Market with a
Strengthened Industrial Base" to propose a staged approach starting with agreeing a
mandatory tax base.
2. ORGANISATION AND TIMING
Work on the re-launch of the CCCTB started in July 2015.
An Inter-services Steering Group assisted DG Taxation and Customs Union in the
preparation of this Impact Assessment report. The Steering Group was set up on
24/08/2015 and included colleagues from DG Communication Networks, Content and
Technology; DG Competition; DG Economic and Financial Affairs; DG Environment;
DG Financial Stability, Financial Services and Capital Markets Union; DG Internal
Market, Industry, Entrepreneurship and SMEs; DG Justice and Consumers; DG Research
and Innovation; DG Taxation and Customs Union; DG Trade; the Joint Research Centre;
the Legal Service; and the Secretariat-General.
The Steering Group met on four occasions between September 2015 and June 2016. The
last meeting of the Steering Group took place on 13 June 2016. At each occasion, the
members of the Steering Group were given the opportunity to provide comments in
writing on the draft versions of the documents presented.
3. CONSULTATION OF THE REGULATORY SCRUTINY BOARD
The impact assessment report was reviewed by the Regulatory Scrutiny Board on 20th
July 2016. Based on the Board's recommendations, the impact assessment has been
revised in accordance with the following points.
(1) The introduction (Section 1) has been amended to clarify and better explain the policy
context. The other sections have been revisited to ensure consistency with the new
introduction. A box on the 2011 proposal has been introduced in Section 1.
(2) The intervention logic was refined and is explained in Section 3 which now also
includes a table which provides an overview of the links between problems, objectives
and policy options as well as the general context. The choice of the preferred option for
the scope has been elaborated more vis-à-vis the summary table 8.
(3) Throughout the text the references to baseline scenario have been clarified and
streamlined to better explain the assessment of options. A new section on EU value
added has been introduced in Section 2.5.

88
(4) Options have been numbered and further clarified with regard to the 2011 proposal.
More information on the fiscal impact of the options has been added in the subsections of
Section 5 and in annexes XII and XIII. . Section 5.5 has been expanded to explain better
the implications of a staged approach.
(5) The REFIT elements have been added in Section 5.8 in the discussion of the preferred
policy option.
4. EXTERNAL EXPERTISE
DG Taxation and Customs Union used external expertise to substantiate the discussion of
the design of the CCCTB with extensive quantitative analysis. These projects were not
triggered specifically by the decision to propose a re-launch of the CCCTB itself, but part
of continuous analysis of policy issues in the area of corporate income taxation by DG
TAXUD.
On the basis of administrative agreement between DG Taxation and Customs Union and
the Joint Research Centre (JRC)110
, the JRC Institute for Prospective Technological
Studies (IPTS) has provided modelling support in the area of corporate tax policy. By
means of econometric analysis and computable general equilibrium model, IPTS has
analysed corporate income tax policy development and reforms.
Within the Framework Service Agreement with the Centre for European Economic
Research (ZEW) on the "Provision of effective tax rates in the context of an enlarged
European Union and related supporting services"111
, DG TAXUD signed specific
contracts for the analysis of effective tax rates. One of these studies explored potential
effects of aggressive tax planning on the effective marginal and effective average
corporate tax rate of multinational corporations112
. In another study, the ZEW analysed
the "The Effects of Tax Reforms to Address the Debt Bias on the Cost of Capital and on
Effective Tax Rates".
For the studies prepared by the JRC and the ZEW, Annex 4 provides more detailed
information on the model structure used, underlying assumptions and sensitivity of
results.
In addition to these specific studies commissioned by DG TAXUD, there exist a number
of other recent external studies of particular relevance for the design of a CCCTB. A list
of the scientific papers referred to in the Impact Assessment is provided in Section 8 of
the Impact Assessment report.
110 "Competitiveness and welfare effects of corporate tax reforms (TAXMOD-Corporate)",
Administrative Agreement JRC N°33829 - TAXUD/2014/DE/324 111 Framework Service Contract TAXUD/2013/CC/120 112 "The Impact of Tax Planning on Forward-Looking Effective Tax Rates".

89
Annex II: Stakeholder Consultation – Synopsis Report
1. INTRODUCTION
On 17th June 2015 the Commission published an action plan for a Fairer and Efficient
Corporate Tax System which proposed 5 key areas for action in the coming months
(COM (2015) 302). The re-launch of the Common Consolidated Corporate Tax Base
(CCCTB) proposal lies at the heart of the action plan. It is presented as an overarching
objective which has the potential to be an extremely effective tool for meeting the twin
objectives of fairer and more efficient taxation.
The Inception Impact Assessment has been published on the EUROPA webpage early in
the process to inform the public of the setup and scope of the re-launch of the CCCTB.
The Commission has not received any direct feedback on this Inception Impact
Assessment.
The Commission has furthermore run an open public consultation to consult all
stakeholders and offer interested parties the possibility to provide their input to the re-
launch of the CCCTB. 175 participants participated in this consultation.
The percentages given in this factual summary correspond to the responses submitted by
stakeholders to the open public consultation. Beyond a statistical analysis of the data, the
summary also provides a qualitative assessment of the valued opinions and input
received.
2. BREAKDOWN OF PARTICIPANTS
The majority of respondents were trade or business associations and companies (42% and
32% of responses, respectively). A comparably high share of responses came from
Bulgarian companies (about 20%). The second largest group of responses came from
trade/business associations in Belgium (some being representations to the EU).
Respondents indicating "Other country" were located in Norway, Russia, South Africa,
USA – or did not want to single out a specific country when their association or company
group is located in many different countries.

90
Table 18: Distribution of respondents
Source: European Commission (2016), own calculations based on 175 responses
With respect to the 55 responses provided by individual companies, the data shows that a
majority (30 out of 55) of the responses were provided by micro, small and medium-
sized companies. This indicates the relative high interest also of smaller companies in the
re-launch of the CCCTB.
Table 19: Distribution of responses submitted by companies
Source: European Commission (2016), own calculations based on 55 responses by companies
CountriesPrivate
individuals
Non registered
associations
Registered
AssociationsCompanies NGOs Academics
Public
AuthoritiesOthers Grand Total
Austria 0% 0% 1% 3% 0% 0% 1% 0% 4%
Belgium 1% 0% 10% 1% 3% 0% 0% 2% 16%
Bulgaria 0% 1% 0% 19% 1% 0% 0% 0% 21%
Czech Republic 0% 0% 1% 0% 0% 0% 0% 0% 1%
Denmark 1% 0% 1% 0% 1% 0% 0% 0% 2%
Estonia 0% 1% 0% 0% 0% 0% 1% 0% 1%
Finland 0% 0% 0% 1% 1% 0% 0% 0% 2%
France 1% 1% 2% 2% 0% 0% 0% 1% 6%
Germany 3% 0% 5% 2% 1% 1% 1% 1% 14%
Hungary 0% 0% 0% 1% 0% 0% 0% 0% 1%
Ireland 0% 1% 2% 1% 0% 0% 0% 1% 4%
Italy 1% 1% 4% 1% 0% 1% 0% 0% 7%
Lithuania 0% 0% 0% 0% 0% 1% 0% 0% 1%
Luxembourg 0% 0% 1% 0% 0% 0% 0% 0% 1%
Malta 0% 0% 1% 0% 0% 0% 0% 0% 1%
Other country 1% 0% 3% 1% 1% 0% 0% 0% 6%
Portugal 0% 0% 0% 1% 0% 0% 0% 0% 1%
Romania 1% 0% 0% 0% 0% 0% 0% 0% 1%
Spain 0% 0% 0% 1% 0% 0% 0% 0% 1%
Sweden 0% 0% 2% 0% 1% 0% 0% 0% 2%
The Netherlands 1% 0% 1% 0% 1% 1% 0% 0% 3%
United Kingdom 0% 1% 5% 0% 1% 0% 0% 0% 7%
Grand Total 7% 5% 37% 32% 10% 3% 2% 5% 100%
Economic
Sectors1 - 9 10 - 49 50 - 249 250 or more Grand Total
Construction 2% 0% 0% 2% 4%
Electricty, Gas,
Water Supply, ...0% 0% 0% 7% 7%
Financial and Insurance Activities
(incl. fund management activities)0% 0% 2% 0% 2%
Manufacturing 2% 4% 4% 15% 24%
Professional, scientific and technical activities
(incl. accounting, bookkeeping, auditing activities)11% 2% 0% 2% 15%
Wholesale and Retail Trade 18% 0% 0% 0% 18%
Other 7% 0% 2% 5% 15%
Multiple sectors 2% 7% 2% 5% 16%
Grand Total 42% 13% 9% 36% 100%

91
Figure 9: Participation in the public consultation - by type of respondent
Source: European Commission (2016), own calculations based on 175 responses
Figure 10: Responses by extent of national/international activities of respondents
Source: European Commission (2016), own calculations based on 162 responses, i.e. responses not by private
individuals
3. ANALYSIS OF RESPONSES
3.1 Policy directions
The Commission believes that the CCCTB system can be an effective tool against aggressive tax planning
and at the same time retain its attractiveness to the business. What are your views?

92
Figure 11: Views on CCCTB as effective tool against aggressive tax planning
Source: European Commission
Table 20: Views on CCCTB as effective tool against aggressive tax planning –
by type of respondent
Source: European Commission
A majority of participating private individuals and civil society organisations share the
view that CCCTB can be an effective tool against aggressive tax planning while retaining
its attractiveness to business. A number of respondents mentioned that a common set of
rules for calculating the corporate tax base, accompanied by consolidation, would prevent
profit shifting, provide greater transparency and align economic activity with taxation.
This will also make the EU a more attractive place for foreign firms to invest in and
make doing business easier.
Many companies also broadly agree with this objective. Respondents who don't agree
argue that the CCCTB should be focussed on removing cross-border obstacles in order to
reduce tax compliance costs.
Furthermore a large majority of respondents from NGOs, public authorities and other
respondents shared the view that the CCCTB could be an effective anti-avoidance tool
within the CCCTB zone. For arrangements involving third countries, or tax avoidance by
multinationals headquartered outside the CCCTB, the prevailing opinion is that the
OECD BEPS project outcomes will provide more targeted and global responses and that
diverging from OECD/BEPS could leave EU business at a competitive disadvantage.
Therefore the CCCTB ''should not go faster and further than the rest of the world in
implementing BEPS recommendations''.
Type of Respondent Agree Neutral Don't agree Other
(1) Private individuals and
non registered associations59% 9% 18% 14%
(2) Registered Associations 14% 27% 19% 41%
(3) Company 43% 30% 18% 9%
of which: SMEs 54% 34% 11% 0%
Large enterprises 20% 25% 30% 25%
(4) NGOs, Public authorities, Others 68% 14% 4% 14%
(5) Academics 40% 0% 60% 0%
Grand Total 38% 23% 17% 22%

93
Some respondents had some concerns about the overall administrative burden that many
new rules could place on business and the risk that shifting the focus towards aggressive
tax planning may undermine the original purpose of the CCCTB, i.e. to support EU
business and make the internal market more business friendly. Concerns have also been
expressed about the risk that the interaction between the formulary approach followed by
the CCCTB and the arm's length principle strengthened by the OECD BEPS project
could potentially lead to double taxation.
The Commission envisages re-launching the CCCTB in a staged approach which will consist of 2 steps:
Firstly, agreement on the tax base, secondly, moving on to consolidation. What are your views on the
staged approach?
Figure 12: Views on Staged Approach
Source: European Commission
Table 21: Views on Staged Approach – by type of respondent
Source: European Commission
Among the respondents to the public consultation, in general more respondents were in
favour of the staged approach than against. For those in favour of a staged approach,
consolidation is essential and its introduction should follow as quickly as possible
without delay. Therefore the first stage should incorporate a procedural path towards the
second stage and a clear timeframe/ commitment to move to consolidation should be
introduced at the outset.
Only the group of NGOs, public authorities and other respondents was – with a big
majority – in favour of introducing the CCCTB in one move. These respondents argued
that delaying consolidation would create uncertainty and a risk of more tax competition.
Type of RespondentIn favour of
the staged approachNeutral
Against the
staged approachOther
(1) Private individuals and
non registered associations50% 5% 36% 9%
(2) Registered Associations 20% 27% 17% 36%
(3) Company 46% 21% 21% 11%
of which: SMEs 60% 26% 14% 0%
Large enterprises 20% 15% 35% 30%
(4) NGOs, Public authorities, Others 25% 7% 64% 4%
(5) Academics 40% 20% 20% 20%
Grand Total 34% 19% 29% 19%

94
Among the remaining respondents, some are concerned that there is little point in
achieving a CCTB when there may be difficulty making further progress; a few are in
principle against the concept of CCCTB; and a couple support implementing the CCTB
as a stand-alone and not depending on consolidation.
It is a priority of the Commission to promote discussion in Council of certain BEPS-related international
aspects of the common base before the re-launched CCCTB is proposed. The aim will be to arrive at
consensus on how to implement certain OECD anti-BEPS best practice recommendations in a uniform
fashion across the EU. The intention would be to create a common playing field in defending the single
market against base erosion and profit shifting.
What are your views on agreeing on such a common approach?
Figure 13: Views on Common approach
Source: European Commission
Table 22: Views on Common approach – by type of respondent
Source: European Commission
In the responses to the consultation, NGOs stated their views that OECD has fallen short
of expectations and that it is now up to the EU to go beyond the BEPS recommendations
in order to close the remaining tax loopholes and develop a solution to the widespread
phenomenon of tax avoidance. Only one reply from civil society organisations showed
opposition to a common approach to implementing OECD anti-BEPS best practice
recommendations. Companies believe that it is crucial for multinational entities to have
stability and legal certainty. Accordingly, if the proposals of the OECD BEPS action plan
were to be implemented by EU Member States unilaterally without any harmonisation or
coordination, the basic principles of the OECD BEPS action plan would be violated and
the chances to achieve its aims would be severely harmed. Only a small percentage of
this category's respondents are opposed to the Commission's approach.
Type of RespondentIn favour of
common approachNeutral
Against
common approachDon't know Other
(1) Private individuals and
non registered associations77% 14% 5% 0% 5%
(2) Registered Associations 42% 20% 9% 0% 28%
(3) Company 66% 13% 11% 2% 9%
of which: SMEs 74% 14% 9% 3% 0%
Large enterprises 50% 10% 15% 0% 25%
(4) NGOs, Public authorities, Others 39% 7% 4% 0% 50%
(5) Academics 80% 20% 0% 0% 0%
Grand Total 55% 15% 8% 1% 22%

95
There is a strong support from registered business/professional associations and
consultancy/law firms for the common implementation of the OECD BEPS principles
through the EU. However the majority believes that EU anti-BEPS measures should not
go beyond the OECD recommendations in order to avoid competitive disadvantages for
EU companies.
As to the timing and modalities, some proposed an anti-BEPS directive to be
supplemented with a strong dispute resolution system, while others questioned whether
the CCCTB would be an appropriate mechanism to implement anti-BEPS measures
before the common tax base has been agreed. A few objected that applying a one size fits
all approach to tax legislation within the EU does not take into account the needs of
different Member States.
3.2 Scope of the CCCTB proposal
The Commission considers making the new proposal for a CCCTB obligatory for all EU companies which
are part of a group. A group can be formed:
- Between parent and subsidiary companies where there is a holding of more than 50% of the voting rights;
and direct or indirect holding amounting to more than 75% of capital or more than 75% of the profit
rights); or
- Between a Head Office and its permanent establishment where a company has one or more permanent
establishment in other Member States.
What are your views on making the proposal for a CCCTB obligatory for all EU companies which are part
of a group?
Would you suggest a different approach to defining who should be required to use the CCCTB? If yes,
please explain your suggestion briefly.
Figure 14: Views on making CCCTB mandatory
Source: European Commission

96
Table 23: Views on making CCCTB mandatory – by type of respondent
Source: European Commission
Respondents from NGOs, public authorities and other respondents advocate a mandatory
CCCTB given that an optional one would allow companies to choose the more profitable
system, hence creating new arbitrage opportunities. A substantial number of respondents
consider that the co-existence of two systems, the domestic one and the CCCTB, could
cause the Internal Market to deteriorate and therefore propose a broader scope for the
CCCTB to include all companies with a taxable presence in the EU.
Companies' opinions appear to be more divided. 40% of them support the Commission
proposal. On the other hand 30% of them are opposed to a mandatory CCCTB. Even
among the supporters, the definition of "group" gives rise to different views. Some
respondents propose to include only cross-border entities while others prefer a threshold
based on the turnover of the company.
The majority of business/professional associations and consultancy/law firms do not
support this approach. The divergent opinions expressed on this question include the
following: "Making the system optional could create an incentive for EU governments to
create a system that is superior to existing individual systems and to give businesses a
practical alternative." "For governments an optional system entails the benefit of a
gradual adoption by businesses, thereby ensuring a limited short term impact on
corporate tax".
Business and professional associations expressed concern about the definition of group
for which the system should be mandatory. Considering the difficulty of introducing the
concept of group for jurisdictions that have very different legal accounting models, some
proposed that the criteria for defining a group should be based on the accounting
directive.
The Commission envisages providing the following option:
Companies which would not be subject to the mandatory CCCTB - because they do not fulfil the
requirements of being part of a group - could still have the possibility to apply the rules of the system.
What are your views on offering non-qualifying companies the option to apply the rules?
Type of RespondentIn favour of
mandatory CCCTBNeutral
Against
mandatory CCCTBDon't know Other
(1) Private individuals and
non registered associations45% 0% 41% 0% 14%
(2) Registered Associations 11% 11% 52% 0% 27%
(3) Company 41% 23% 29% 5% 2%
of which: SMEs 51% 29% 14% 6% 0%
Large enterprises 20% 15% 55% 5% 5%
(4) NGOs, Public authorities, Others 64% 7% 14% 4% 11%
(5) Academics 20% 20% 0% 20% 40%
Grand Total 34% 13% 35% 3% 15%

97
Figure 15: Views on possibility of opt-in
Source: European Commission
Table 24: Views on possibility of opt-in – by type of respondent
Source: European Commission
Overall, a clear majority of the respondents to the consultation supports the possibility
that non-qualifying companies could opt for applying the common tax base.
Most enterprises and business/professional associations support optionality for all
companies. There is some agreement that a system mandatory for qualifying companies
should allow non-qualifying companies to opt in. Others believe that allowing some
companies to opt in would undermine the level playing field the CCCTB wants to create
and will distort the system, opening it up to possible abuses and tax planning.
3.3 Anti-avoidance elements
In view of recent developments, the CCCTB system should include more robust rules to defend itself
against aggressive tax planning.
Which of the elements of the CCCTB system would you reinforce so that the system can better respond to
tax avoidance?
(Multiple answers possible)
Type of Respondent In favour of opt-in Neutral Against opt-in Don't know Other
(1) Private individuals and
non registered associations55% 14% 5% 9% 18%
(2) Registered Associations 63% 19% 3% 2% 14%
(3) Company 75% 18% 5% 0% 2%
of which: SMEs 63% 29% 6% 0% 3%
Large enterprises 95% 0% 5% 0% 0%
(4) NGOs, Public authorities, Others 36% 14% 32% 7% 11%
(5) Academics 60% 20% 20% 0% 0%
Grand Total 61% 17% 9% 3% 10%

98
Figure 16: Views on options to fight aggressive tax planning
Source: European Commission
Table 25: Views on options to fight aggressive tax planning – by type of respondent
Source: European Commission
All measures have received a certain support but, overall, there is a general demand for
more robust CFC rules. In particular, many NGOs call for "full-inclusion" CFC rules
which means: " treating all foreign affiliates of EU resident parent companies as CFCs so
that the group consolidated profits are subject to tax in the resident country, with a full
credit for all equivalent foreign taxes paid, which under the CCCTB should be
apportioned among the group’s E affiliates by an appropriate formula. This would
protect the tax base of both source and residence countries. They should certainly not be
Type of RespondentLimiting Interest
Deductibility
Disallowance of tax
exemption for portfolio
participants
Exit taxation rules More robust rules on CFC
(1) Private individuals and
non registered associations27% 27% 41% 36%
(2) Registered Associations 2% 8% 6% 20%
(3) Company 4% 4% 20% 30%
of which: SMEs 0% 6% 26% 34%
Large enterprises 10% 0% 10% 20%
(4) NGOs, Public authorities, Others 75% 68% 75% 75%
(5) Academics 40% 20% 60% 40%
Grand Total 18% 19% 27% 35%
Type of Respondent
Anti-abuse rules based
on effective rather than
statutory rates
Addressing distortions
casued by debt/equity
bias
Other suggestions None of the above
(1) Private individuals and
non registered associations36% 41% 23% 18%
(2) Registered Associations 6% 11% 72% 27%
(3) Company 41% 18% 16% 21%
of which: SMEs 57% 26% 3% 9%
Large enterprises 10% 5% 40% 45%
(4) NGOs, Public authorities, Others 64% 68% 61% 0%
(5) Academics 20% 40% 60% 20%
Grand Total 31% 27% 46% 19%

99
limited to income from transactions with the parent company, and there should be no
exemptions based on criteria such as effective exchange of information, as profits may
also be shifted into cooperative jurisdictions. Full-inclusion CFC rules would be easier to
apply than attempting to distinguish between active and passive income, or using a
threshold such as 40% of the taxpayer’s effective tax rate."
Most of civil society respondents who chose 'other suggestion', argue that consolidation
and harmonisation would make the listed elements unnecessary.
From the companies' perspective, improving arbitration seems to be essential.
The most recurrent 'other suggestion' from business/professional associations and
consultancy/law firms include:
a double tax avoidance mechanism (arbitration) between EU and non-EU country
with a mandatory system for the EU through a directive;
consistency between the anti-avoidance measures incorporated in the CCCTB and
those advocated by the OECD;
coordination with non-EU countries to avoid relocation of business activities
outside the EU.
One respondent's comments summarise the prevailing opinion of this category:
"Effective anti-avoidance rules are necessary under a CCCTB but they should not trigger
any unintended consequences such as having a negative effect on investments into the
EU or the international competitiveness of EU based groups".
3.4 Hybrid Mismatches
Hybrid mismatches are the result of disparities in the tax treatment of an entity or financial instrument
under the laws of two or more States. Currently, arrangements can be set up to exploit such mismatches for
the purpose of lowering their overall tax burden. The risk of such arrangements would be removed in
transactions between enterprises applying the common tax base rules within a consolidated group. It would
however persist in relations with enterprises outside the common rules as well as during step 1 of the
staged approach to a CCCTB, in the absence of tax consolidation amongst the companies applying the
common rules.
One option to address hybrid mismatches would be to require enterprises to follow in a Member State the
classification of entities and/or of financial instruments adopted in the other Member State or the third
country which is party to the transaction.
In your view, can hybrid mismatches be effectively addressed through any other measures than the one
suggested above?

100
Figure 17: Views on whether hybrid mismatches can effectively be addressed through
other measures
Source: European Commission
Table 26: Views on whether hybrid mismatches can effectively be addressed through
other measures – by type of respondent
Source: European Commission
The majority of NGOs and public authorities propose full-inclusion CFC rules as a key
element to catch hybrids, accompanied by a credit for taxes paid abroad. One third
doesn't know. A few suggest a public country by country report as an effective measure
to cover more hybrid mismatches, others stress that consolidation would solve the
discrepancies.
A vast majority of companies answered that they don't know, mainly driven by the
responses of small and medium size enterprises. Only a few respondents, including
multinationals, mentioned that hybrids could be avoided through OECD anti-BEPS
actions.
Among registered business associations, some believe that the EU should not diverge
from the OECD recommendations on this topic. Some make a distinction between intra-
EU situations, where a consolidated CCCTB from the beginning could solve the issue,
and extra-EU situations where OECD/BEPS covers the issue. A couple of respondents
say that hybrid instruments are not necessarily a result of tax planning.
Type of Respondent Yes No Don't know Other
(1) Private individuals and
non registered associations32% 14% 32% 23%
(2) Registered Associations 20% 6% 25% 48%
(3) Company 13% 7% 61% 20%
of which: SMEs 11% 6% 83% 0%
Large enterprises 15% 5% 25% 55%
(4) NGOs, Public authorities, Others 64% 0% 14% 21%
(5) Academics 20% 20% 20% 40%
Grand Total 26% 7% 35% 31%

101
3.5 Research and Development (R&D)
In the currently pending CCCTB proposal, the Commission has proposed a favourable treatment of costs
for Research and Development (R&D) by making these costs fully deductible in the tax year they are
incurred, with the exception of costs relating to immovable property.
What are your views on the existing framework for R&D?
Figure 18: Views on existing R&D framework
Source: European Commission
Table 27: Views on existing R&D framework – by type of respondent
Source: European Commission
A large majority of respondents expressed strong support for the existing framework.
Many among the responding NGOs, public authorities and other respondents replied
"other", mainly calling for clear definitions. It was also remarked that deduction of R&D
costs should be strictly limited to genuine research and development costs in order to
subsidise only real innovation.
The overwhelming majority of companies believe it is important to allow deduction of
R&D and support the existing framework.
60% of respondents from registered business/professional associations and
consultancy/law firms also support the existing framework. 17% are neutral, and a small
number don't know. The other respondents from this category mostly ask for a clear
definition of R&D, possibly consistent with the accounting definitions, or believe that
"Member States should have flexibility to design tax policy for R&D within the BEPS
work in order for the EU to remain attractive compared to extra-EU".
Type of RespondentIn favour of the existing
R&D frameworkNeutral
Against the existing
R&D frameworkDon't know Other
(1) Private individuals and
non registered associations55% 14% 9% 9% 14%
(2) Registered Associations 59% 17% 5% 8% 11%
(3) Company 80% 5% 7% 0% 7%
of which: SMEs 83% 6% 9% 0% 3%
Large enterprises 75% 5% 5% 0% 15%
(4) NGOs, Public authorities, Others 36% 7% 25% 0% 32%
(5) Academics 40% 20% 0% 0% 40%
Grand Total 61% 11% 9% 4% 14%

102
One option for rendering the CCCTB more favourable to promoting R&D could be to introduce more
generous provisions for deducting R&D costs, such as super deductions which are currently applied by a
number of Member States (e.g. Croatia, the Netherlands and the UK)?
What are your views on making the existing framework for R&D more favourable?
Would you suggest an alternative scheme? If so, please explain in your response and/or provide further
comments
Figure 19: Views on possible improvements to the existing R&D framework
Source: European Commission
Table 28: Views on possible improvements to the existing R&D framework
– by type of respondent
Source: European Commission
Most of the NGOs, public authorities are against R&D incentives for the reason that they
can be used for aggressive tax planning. They argue that there are other means to
stimulate R&D without risking new abuses. Some of them point out the lack of clear
definitions. Some respondents would like to go further and reverse intellectual property
regimes such as patent boxes.
With a completely different approach, almost all companies would welcome a more
favourable framework for R&D as it would foster the economy.
Half of the respondents from business/professional associations and consultancy/law
firms are in favour of making the existing framework for R&D more favourable. Their
suggestions include:
Super deductions (mostly);
Introduction of a common incentive rule such as an incremental deduction for
R&D or an EU Intellectual Property box;
Type of Respondent
In favour of
improvements to the
existing R&D framework
Neutral
Against improvements
to the existing R&D
framework
Don't know Other
(1) Private individuals and
non registered associations27% 18% 36% 5% 14%
(2) Registered Associations 50% 20% 3% 8% 19%
(3) Company 88% 7% 2% 2% 2%
of which: SMEs 80% 11% 3% 3% 3%
Large enterprises 100% 0% 0% 0% 0%
(4) NGOs, Public authorities, Others 25% 0% 71% 4% 0%
(5) Academics 60% 0% 20% 0% 20%
Grand Total 55% 12% 18% 5% 10%

103
Tax credits (cash premiums) because super deductions tend to most benefit
companies that are profitable;
Above-the-line R&D expenditure credits in EU countries so that even loss-
making companies can benefit from them.
Some respondents from this category believe that any EU initiative needs to build on the
recent work of OECD and/or that Member States should be allowed to retain their
flexibility in designing their own national R&D policies.
3.6 Debt equity bias
Corporate tax systems usually favour debt-financing over equity-financing by treating interest payments as
a tax deductible expense with no equivalent deduction for the return paid to equity.
Should debt bias be addressed in the proposal?
Figure 20: Views on whether debt bias should be addressed
Source: European Commission
Table 29: Views on whether debt bias should be addressed – by type of respondent
Source: European Commission
44% of respondents agree that the debt bias shall be addressed against 13.1% who think
it should not. The 'yes' surpasses the 'no' in all categories of respondents, even though a
large share of business/professional associations and consultancy/law firms chose the
category 'other'. The majority of those who agree with addressing the debt bias stress
distortions of economic decisions, notably related to investment.
Those among business/professional associations and consultancy/law firms who believe
that debt/equity bias should not be addressed as part of the CCCTB argue that the
CCCTB is primarily focused on the taxation of corporate groups and/or OECD/BEPS
Type of RespondentYes, debt bias
should be addressedNeutral
No, debt bias
should not be addressedDon't know Other
(1) Private individuals and
non registered associations55% 18% 14% 9% 5%
(2) Registered Associations 28% 19% 14% 6% 33%
(3) Company 63% 13% 14% 9% 2%
of which: SMEs 63% 11% 11% 14% 0%
Large enterprises 60% 15% 20% 0% 5%
(4) NGOs, Public authorities, Others 36% 32% 11% 7% 14%
(5) Academics 40% 40% 0% 20% 0%
Grand Total 44% 19% 13% 8% 15%

104
Action 4 recommendations need to be put in place and tested before considering a new
set of rules.
Some argue that equity and debt are two different instruments with different rights and
different costs and, as such, the tax treatment should not necessarily be the same and that
a different treatment is justified for the banking sector. A couple think that a detailed
assessment of the budgetary impact for each Member State is a pre-requisite; others
suggest that since equity financing is not readily available in the EU any changes should
not further impact the financing options available in the EU. A few respondents from this
category replied in a completely positive manner.
The corporate tax debt equity bias could be addressed via three possible policy options.
Option 1 is the Comprehensive Business Income Tax (CBIT) that disallows any financing costs as
deductible expense.
Option 2 is the Allowance for Corporate Equity (ACE) that allows the deductibility of actual interest
payments and of a notional interest on equity.
Option 3 is the Cost of capital Allowance (CoCA) that allows the deductibility of a notional interest on
capital (equity and debt).
In your view, which option would be best suited to address the corporate debt bias?
Figure 21: Views on options to address corporate tax debt equity bias
Source: European Commission
Table 30: Views on options to address corporate tax debt equity bias –
by type of respondent
Source: European Commission
More than 40% of the respondents favour an ACE system against 12% in favour of the
CBIT and 3% in favour of the CoCA. 18% do not know, 12% want no solution and
11.4% want something other than the ones proposed.
Most of the NGOs opt for the CBIT method whereas from the companies' perspective
there is resounding support for ACE. Several of those who support ACE argue that
Type of RespondentComprehensive Business
Income Tax (CBIT)
Allowance for Corporate
Equity (ACE)
Cost of Capital
Allowance (CoCA)None of the above Don't know Other
(1) Private individuals and
non registered associations21% 32% 5% 16% 21% 5%
(2) Registered Associations 0% 50% 2% 12% 14% 22%
(3) Company 4% 52% 5% 11% 29% 0%
of which: SMEs 6% 31% 9% 11% 43% 0%
Large enterprises 0% 90% 0% 10% 0% 0%
(4) NGOs, Public authorities, Others 52% 15% 0% 11% 0% 22%
(5) Academics 0% 50% 0% 25% 25% 0%
Grand Total 12% 43% 3% 12% 18% 12%

105
interest limitation shall be limited to OECD BEPS Action 4 and ask whether the proposal
is in line with OECD BEPS Action 4. Like the companies, a strong majority of
business/professional associations and consultancy/law firms expressed its preference for
ACE. Some warn against the risk of raising tax rates and levelling down of deductibility
of interest to pay for ACE.
3.7 Temporary mechanism for cross-border loss relief
The Commission envisages proposing a temporary mechanism for cross-border loss relief with recapture
until the consolidation step (CCCTB) is agreed. The aim will be to balance out the absence of the benefits
of consolidation during the first step (CCTB) of the proposal.
What are your views on such a temporary mechanism for cross-border loss relief?
Figure 22: Views on temporary cross-border loss relief
Source: European Commission
Table 31: Views on temporary cross-border loss relief – by type of respondent
Source: European Commission
The majority of the companies who responded argue that the lack of mechanisms
available to offset cross border losses is currently one of the major obstacles to the
completion of the single market and reduces the competitiveness of EU. In addition, a
few respondents suggest that the cross-border loss offset should be extended to non-EU
companies and permanent establishments, given that competitiveness of EU companies
needs to be regarded on a global scale.
In addition a strong majority of respondents from business/professional associations and
consultancy/law firms also believe that consolidation is essential. However, they would
accept a transitory and temporary cross-border loss relief as a second best approach.
Some envisage resistance from Member States in offering wide-ranging cross-border
relief as taxes should be paid where value is created. Others advocate the introduction of
Type of RespondentIn favour of a temporary
cross-border loss reliefNeutral
Against a temporary
cross-border loss reliefDon't know Other
(1) Private individuals and
non registered associations41% 14% 32% 5% 9%
(2) Registered Associations 52% 9% 3% 8% 28%
(3) Company 55% 25% 9% 5% 5%
of which: SMEs 54% 29% 9% 9% 0%
Large enterprises 55% 20% 10% 0% 15%
(4) NGOs, Public authorities, Others 4% 14% 71% 0% 11%
(5) Academics 80% 0% 20% 0% 0%
Grand Total 45% 15% 20% 5% 15%

106
an EU wide regime, not linked to the CCCTB, to be implemented into domestic
legislation.
Conversely most NGOs and civil society organizations don't support the introduction of a
temporary mechanism for cross-border loss relief. They believe that postponing
consolidation indefinitely while introducing a cross-border loss relief risks removing the
main benefit of the proposal, while shrinking the taxable base of multinational companies
and opening up the system to new types of aggressive tax planning.
3.8 Additional information provided by respondents
Is there anything else you would like to bring to the attention of the Commission?
The Commission services have analysed and factored into the summary all additional
comments and papers that were submitted.

107
Annex III: Who is affected by the initiative and how
The objective of this annex is to set out the practical implications of the initiative for
different types of companies and for national tax administrations.
The initiative directly affects companies falling under the mandatory scope, companies
that are given the possibility to opt for the CCCTB and tax administrations. In a first step,
all companies active in the EU would have to determine whether they fall under the
mandatory application, depending on the threshold on consolidated turnover.
Large companies above the high turnover threshold that are subject to mandatory
application of the CCCTB would be faced with new rules to compute the tax base in the
Member States in which they are active, including the rules on consolidation and formula
apportionment. This would inter alia entail a one-off cost for switching to new rules on
(i) depreciation, (ii) the valuation of assets and liabilities, and (iii) the deductibility of
expenses and exempt revenues, and for determining (iv) which parts of a group fall under
the CCCTB definition of a group (and consolidating the EU-wide tax base for this group)
and (v) the information required on the formula apportionment factors (assets,
employment and wage bill, sales by destination) for each group member.
It is estimated that a vast majority of companies under the mandatory scope would be
active cross-border (at least 80% for a threshold of EUR 750 million; at least 75% for a
threshold of EUR 500 million, see table below). For companies active in several EU
Member States, it is expected that the recurrent compliance costs will decrease
considerably. The same is true for domestic companies that would wish to expand their
operations to another EU Member State.
The fairly high turnover threshold envisaged under the preferred option would imply that
only a small share of groups would be subject to mandatory application. By means of
example, for a threshold of EUR 750 million the application would be compulsory for an
estimated 1.6% of company groups the CCCTB. It is estimated that at most 19% of the
groups subject to compulsory application are purely domestic groups.
SMEs and other companies which are not obliged to apply the CCCTB are free to stay
within their national systems and would as such not be affected by the initiative. Those
among these companies that consider the possibility to opt in would have to conduct a
cost-benefit assessment to decide whether they would benefit from applying the CCCTB.
Such cost-benefit analysis would also factor-in the costs for switching to the new system.
Tax administrations will also incur costs for implementing the new system, notably on
IT and staff training. There will also be a need to coordinate in the EU the uniform
implementation and practical application of the new rules. Eventually, tax
administrations are expected to benefit from reduced dealings with transfer pricing issues
and a reduced 'case number' to the extent that the tax affairs of a company group is
mainly dealt with by the administration of the Member State where the parent resides.
Since the CCCTB would not be made mandatory for all firms, the burden for national
administrations may overall go up slightly due to the required maintenance of two
parallel systems.

108
Table 32: Estimated shares of groups, turnover and domestic groups
for different size thresholds
Consolidated
turnover
Share of groups, compared
to total number of groups
Corresponding share
of unconsolidated
turnover
Share of groups active only
domestically compared to
total number of groups in this
bracket113
<= EUR 50 million 96.1% 19.9% 95.2%
> EUR 50 million 3.9% 81.1% 51.0%
> EUR 500 million 1.9% 68.6% 24.5%
> EUR 750 million 1.6% 64.2% 19.2%
Source: ORBIS and ORBIS Historical Ownership (December 2014)
113 This ratio has been computed for groups that have their Global Ultimate Owner (GUO) in the EU. In
other words, groups active in the EU but with GUO outside the EU are not reflected in this ratio. This
ratio therefore gives an upper estimate of the share of purely domestic groups.

109
Annex IV: Analytical Models used in preparing the Impact Assessment
1. CORTAX: A MODEL TO SIMULATE CORPORATE TAX POLICIES
1.1. Brief Description of the Model
The CORTAX model is a computable general equilibrium model designed to evaluate
the effects of corporate tax reforms in 28 EU countries capturing the optimal behaviour
of all agents in the economy. In the model, each country is assumed to have the same
structure in terms of consumption, savings, production and public finances (though the
data are country-specific). Countries are linked to each other via international trade in
goods markets, international goods markets and investment by multinationals. The model
also includes Japan, USA and a tax haven.
Firms are divided into three categories: multinationals headquarters, their subsidiaries
located abroad and domestic firms that only produce in their country of residence.
Multinationals and domestic firms differ to the extent that the former optimise profits
globally and are engaged in profit shifting activities across borders. Domestic firms pay
their corporate taxes in their country of residence according to the revenues generated in
this country only. Both domestic and multinational firms shift profits to tax haven to
reduce their tax burden. In the benchmark, all firms are equal and, whilst on aggregate
taxable profits are positive, there are random shocks affecting their revenues that can be
attributed to, for example, business cycle evolutions. These shocks may result in losses
that can be carried forward in the model.
In relation to government, there is a balanced budget where consumption and public debt
are a fixed proportion of GDP. Tax revenues and/or transfer payments adjust to keep a
constant public budget. The taxes included in CORTAX are taxes consumption and direct
taxes on income from corporate and labour, dividends, capital gains and interest.
Government consumption and government debt as a share of GDP are maintained
constant after a reform.
The effects of reforms can be expressed as changes in GDP, household consumption,
business investment and fiscal revenue. The model is elaborated using data from different
data sources including Eurostat, the OECD, the United Nations, the IMF and the Orbis
firm database (see Section 4.2 below for more details). In the present exercise, the model
has been constructed with a database for the year 2012. The structural description of the
model and the calibration process borrow heavily from Bettendorf et al. (2009b).
1.2. Model Validation and Peer Review
The CORTAX model has acquired a strong reputation among corporate tax experts. As
noted, the model was originally produced by CPB Netherlands, and has since been used
by experts affiliated to the Oxford University Centre for Business Taxation, the Erasmus
University Rotterdam, the Tinbergen Institute and CESifo. The model was previously
used in an Impact Assessment (European Commission, 2011a), which drew extensively
from a report produced for DG TAXUD (Bettendorf et al., 2009b). Among other policies,
the report analysed both a common corporate tax base and a common consolidated
corporate tax base for the EU.
The CORTAX model has been the basis for a number of publications in peer-reviewed
journals. Of particular note is Bettendorf et al. (2010a) in Economic Policy which

110
simulates a common consolidated corporate tax base (CCCTB) across the EU, with
further innovations of the ideas subsequently published in Fiscal Studies (Bettendorf et
al., 2010b). The issue of using CORTAX to analyse the debt bias in corporate taxation
was addressed in de Mooij and Devereux (2011b) published in International Tax and
Public Finance. An earlier publication in The World Economy used CORTAX to analyse
the impact of corporate taxation on the labour market (Bettendorf et al., 2009a). That the
model has stood up to the rigorous standards required to be accepted by journals of this
quality reflects the level of the theoretical and empirical work underlying the model, and
that it is appropriate for analysing key policy questions in the area of corporate taxation.
1.3. Discussions with External Experts
As noted in the previous section, the CORTAX model has been accepted within the
corporate taxation community for some years. The model has been used by leading
research institutes and universities, and work based around the model has been accepted
for publication in high-level, peer-reviewed academic journals in the area of fiscal policy.
Since this earlier body of work, the model data has been updated by the Tax Modelling
Group in JRC-Seville. This extensive recalibration process has been carried out in
conjunction with external experts, as appropriate. The team has collaborated closely with
Leon Bettendorf (CPB Netherlands), one of the original authors of the model, and lead
author for many of the reports and journal articles. Regarding the calibration, the team
has worked with Simon Loretz (Institute for Advanced Studies, Vienna), who produced
much of the data for the previous calibration of the model during his time at the Oxford
University Centre for Business Taxation, and was a co-author for the report that formed
the basis of the 2011 Impact Assessment (European Commission, 2011a).
1.4. Underlying Assumptions and Data Input
1.4.1 Baseline and key assumptions
In CORTAX, we account for two types of households: old and young. Their lifetime is
40-year periods each and their behaviour remains the same during the whole period.
Households maximise their intra-temporal utility function subject to a budget constraint,
where net savings from young workers (wages, current transfers and negative
consumption) are equal to negative value of net savings from old households. The effects
on welfare are calculated using the compensating variation. This is calculated as the
difference in transfers received by young households required to compensate the change
in utility.
Firms maximise their value subject to the production function and the accumulation
constraints on physical capital and fiscal depreciation. Total production is calculated as
the sum of production in all firms (domestic and multinationals) net of intermediate
inputs in foreign subsidiaries. Usually, the production function is a Cobb Douglas
combination of the fixed factor and the value added, which is a CES aggregate of labour
and capital. The model allows the parent company to charge a transfer price for intra-firm
deliveries that deviates from the equivalent price that would be charged if it had been an
inter-firm transaction (the ‘arms-length’ price), which reflects profit shifting in
multinationals. In the case of domestic firms, these practices are captured with the
existence of a tax haven. Profit shifting to tax havens depends on the difference between
the statutory rate in their respective countries and the tax rate in the tax haven.

111
The simulations are coded to ensure that the government budget remains balanced. This
is achieved in two ways. First, it is assumed that governments will adjust the corporate
tax rates to maintain constant corporate tax revenue, prior to any behavioural response
(i.e. ex-ante to the simulation). Any revenue changes due to the behavioural responses
(i.e. ex-post to the simulation) are accounted for by the government adjusting transfers to
retirees.
1.4.2 Key sources of macroeconomic and socio-economic data
The current calibration largely uses the same data sources as the original calibration of
CORTAX as outlined in Bettendorf and van der Horst (2006), though in a few cases
alternatives were used if these were considered more reliable, or the original source was
no longer available. The year 2012 was chosen as reference year for the calibration, as it
represented a good compromise between timeliness and completeness. The countries
covered are the 28 EU member states, the United States and Japan.
Population and employment statistics come from the United Nations and national
accounts data on income and expenditure are collected from OECD and Eurostat.
Purchasing power parity (PPPs) exchange rates are from the IMF and Eurostat and
general government consolidated gross debt as a percentage of GDP is from DG
ECF N’s Ameco Database. Additionally, CORTAX needs bilateral FD positions as part
of the calibration. For these, the modelling starts with the Eurostat bilateral positions.
Data on Foreign Direct Investment (FDI) flows by country of origin and country of
receipt are from Eurostat (financial account, direct investment, reporting economy). As a
number of countries have incomplete information on the country of origin of the inward
FDI stock, the modellers impute these values following the practice in Bettendorf and
van der Horst (2006), and a correction is made when the FDI data represent special
purpose entity activity.
Finally, CIT receipts as a percentage of GDP are from European and the OECD while
information on balance sheets and ownership structure are extracted from the Orbis
database, provided by Bureau Van Dijk. Although Orbis is a firm-level database, for the
purposes of the calibration it is only used to produce national-level estimates of debt
shares and of corporate investment shares (by type of asset) so as to calculate relevant
corporate tax parameters such as the cost of capital (financed via equity or debt).
1.4.3 Construction of the baseline and core policy simulations
The data described above is entered into the model, which provides a consistent and
connected framework for firms, household and governments. The data and the current
policies of each country are used to replicate the corporate taxation regime, and indeed
the production structure and household behaviour. The corporate taxation regime is
necessarily stylised (for example, not every deduction can be included), though the
simulations confirm that at a macro-level the CIT regimes are replicated well.
The core simulations have been chosen to reflect potential policy options for
harmonisation of corporate tax bases in the EU. Following the proposal (European
Commission, 2015a), two main reforms are considered: the common corporate tax base
(CCTB), and the common consolidated corporate tax base (CCCTB). Both reforms are
assumed to be mandatory for multinationals only (though the work also simulates the
case where domestic firms participate). The CCCTB proposal offers a holistic solution to

112
profit shifting. It combines a common tax base together with consolidation of each
multinational group's profit, removing the incentive to engage in profit shifting. Under
this reform, the consolidated tax base must then be apportioned to each country
according to an agreed formula. Both the CCTB and CCCTB require a definition of the
common tax base, which according to our interpretation of the legislation is defined as
follows: a 12.5 percent straight line depreciation rate for machinery (8 years), a 4 percent
rate for industrial buildings (25 years), a 6.67 percent rate for intangibles (15 years) and
an average value for inventories (alternative tax bases are also simulated as part of the
sensitivity analysis).
Debt and equity financing can be seen as imperfect substitute forms of capital use, and
their different tax treatment introduces an obvious distortion in the way firms and
investors choose to invest funds – the so-called debt bias. The main proposals to correct
for this tax-induced debt bias are, first, the comprehensive business income tax (CBIT),
which fully disallows the deductibility of interest, and so taxes all returns to investment
including the "normal" return. Second, an allowance for corporate capital (ACC)
provides an imputed return to investment, regardless of its form (debt or equity). Third,
an allowance for corporate equity (ACE/AGI, undistinguished in the model) keeps the
deductibility of interest (like in the traditional corporate tax design), but adds a
deductible imputed return for equity investments. All these are introduced by changing
how the corporate tax base is calculated. The change in tax liability has implications for
the cost of capital, and hence for investment decisions.
1.4.4 Sensitivity of model results and likely robustness to changes in the underlying
assumptions and/or data input
Extensive sensitivity analysis has been conducted around the core policy simulations.
These simulations provide additional insights into the consequences of altering the model
assumptions or policy choices, and offer a strong test of the robustness of the results. The
eight types of sensitivity analysis are as follows: (i) implementing the common corporate
(CCTB and CCCTB) for all firms, rather than just multinationals, (ii) alternative
definitions of the common tax base, (iii) stricter control on profit shifting, (iv) alternative
choices for capital-labour substitutability, (v) less compliance cost saving from
consolidation, (vi) compensate revenue with labour taxes, instead of changing transfer
payments, (vii) discrete location choice for firms, (viii) inclusion of a cross-border loss
offset provision with the common corporate tax base (CCTB), (ix) alternative
deductibility shares and rates for the ACE/AGI, and (x) alternative assumptions on the
ex-ante CIT rate closure.
The sensitivity analysis provides a more rounded picture of the model. Where different
model assumptions are simulated (such as alternative capital-labour substitutability or
less compliance cost savings), some changes in the magnitude of the effects are observed,
though the broad conclusions remain. For all core and sensitivity simulations full
country-level results are provided, as are additional tables as necessary to explain the
results.
2. EFFECTS OF FUNDAMENTAL TAX REFORMS ON EFFECTIVE TAXATION
2.1. Brief Description of the Model

113
Corporate tax systems in Europe usually encourage the use of debt rather than equity
financing as interest payments are deductible for tax purposes while equity returns are
not. This unequal treatment might cause economic problems, such as excessive leverage
in the corporate sector and an associated increased vulnerability to economic crises. The
report focuses on the current extent of the corporate debt bias in the tax systems of the
EU-28 Member States and informs about whether different reform options could in
principle manage to address the debt bias and promote investment, possibly in a revenue
neutral way.
The report analyses current interest deduction limitation rules, intended to prevent an
excessive use of debt financing, and assess the impact of interest deductions limitations
rules on effective tax burdens in the EU-28 Member States. The main focus of the study
is the analysis of the consequences of four fundamental tax reforms which try to
overcome the debt bias differently, i.e. the Comprehensive Business Income Tax (CBIT),
Allowance for Corporate Equity (ACE), Allowance for Corporate Capital (ACC), Cost of
capital Allowance (CoCA).
The study relies on the general framework of the Devereux/Griffith model which
provides different indicators of the effective tax burden levied on corporate investments.
The Devereux/Griffith model allows considering marginal and profitable investments and
different financing sources taking into account the taxes borne at the corporate level and
the level of the shareholders. For marginal investments, the model provides the cost of
capital and the effective marginal tax rate (EMTR) as a measure of effective taxation.
The cost of capital represents the minimum pre-tax rate of return required for a real
investment to achieve the same after-tax return as a safe investment in the capital market
and should, from a theoretical point of view, impact on the scale of investments. For
profitable investments, the effective average tax rate (EATR) is a more proper measure
of the effective tax burden levied on the investment return and is used to identify the
effect of taxation on discrete location choices.
The fundamental reform options will impact the tax bases at corporate and shareholder
level differently and, therefore, will affect Member States tax revenues. Member States
might be reluctant to suffer revenue losses or increase their statutory tax rates as this is
associated with lower investment rates and growth. The report provides options for a
revenue neutral introduction of the fundamental tax reforms as well as possible
consequences for the level of investment in the EU-28 Member States.
2.2. Model validation and peer review
The Devereux and Griffith methodology has acquired a strong reputation among
corporate tax experts. This approach is rooted in the model originally proposed by King
and Fullerton (1984) and as such has the advantage of allowing the computation of both
effective marginal tax rate and effective average tax rate under a unique framework.
The EMTR method has been extensively used to compute the effective tax rates levied
on capital income from different domestic investment over time and across countries.
However, as Devereux and Griffith (1998) demonstrate, this indicator may not be a
suitable one when the purpose of the analysis is the international location of capital. In
these circumstances, firms usually face a choice between two or more mutually exclusive
investment projects that are expected to earn some economic rent. The location choice
will be made on the basis of the highest post-tax economic rent, that is to say, where the

114
proportion of total income taken in taxes is the lowest. The most suitable measure for a
highly profitable multinational to adopt when deciding where to invest is the EATR, that
is, the present value of the expected total tax burden in relation to total profits. The
EATR is usually higher than the EMTR. The reason is that many tax deductions apply to
the cost of investment projects (which for the marginal investment project are equal to
the rate of return) but are irrelevant for economic rent. Once the strategic location choice
has been made, the cost of capital and the EMTR play an important role in determining
the optimal scale of the investment.
A range of studies have examined the theoretical foundation of the Devereux/ Griffith
model and its scope of application (Lammers 2002; Schreiber et al. 2002; Devereux and
Griffith, 2003). These forward-looking indicators permit to compare international tax
regimes and to isolate the structure of incentives and disincentives given by the different
tax systems to undertake a specific investment. Hence, these indicators are a useful
policy tools in the analysis of the effects of corporate tax differentials on resource
allocation.
The Devereux/Griffith approach was previously used in an Impact Assessment by the
European Commission (EEC 2001), following the advice of a panel of academic experts,
to comply with the mandate of the ECOFIN Council in December 1998 concerning the
scope of the analysis of effective tax rates.114
Since then the methodology has been
applied for the calculation of effective tax rates in the EU and other countries on a yearly
basis.
2.3. Underlying assumptions and data input
2.3.1. Baseline and key assumptions
To gain insights on the effects of different reform options on effective tax rates, the cost
of capital and the EATR of the reform scenario are compared to the pre-reform scenario
(status quo). The results for the effective tax rates for the year 2015 are used as the status
quo scenario.
The basic approach proposed by Devereux and Griffith is to consider hypothetical
incremental investment located in a specific country undertaken by a company resident
possibly in the same country, but also possibly in another country. The hypothetical
investment takes place in one period and generates a return in the next period. The
impact of taxation is analysed by considering a number of features of the tax system,
including the statutory tax rate, capital allowances, depreciation rules and the treatment
of different financing sources, the treatment of foreign source income, wealth taxes paid
by the company, as well as possibly the treatment at the corporate and personal level of
dividends paid by the company, and wealth and capital gains taxes.115
The tax database
comprises all relevant tax parameters for the EU-28 Member States.
Both the cost of capital and the EATR are computed for five different types of assets
(intangibles, buildings, machinery, financial assets, inventory), three different sources of
114 For a deeper analysis of the pros and cons of the forward-looking indicators for policy-makers, see
Giannini and Maggiulli (2002). 115 It is assumed that the tax system remains unchanged over the life of the investment.
115
financing (retained earnings, new equity, debt) and by three types of shareholders (zero-
rate, top-rate non-qualified and top-rate qualified) and can thereby be used to compare
the relative distortions introduced by the tax system in relation to certain investments or
financing sources both at the corporate level and shareholder level.
In presenting averages over different forms of assets, these assets are weighted equally,
while unequal weights are used for financing: retained earnings 55%, new equity 10%,
and debt 35% (OECD, 1991). As for true economic depreciation rates it is assumed in all
countries: intangibles (15.35%), industrial buildings (3.1%); machinery (17.5%),
financial assets (0%), and inventories (0%).
The alternative form of investment is assumed to be lending and the alternative
investments earns a real interest rate of 5%. The inflation rate is assumed to be 2% in all
countries. The computations of EATRs are based on a pre-tax rate of profitability of 20%
which corresponds to the standard economic assumption.
2.3.2. Construction of the core policy impact assessment
The report provides calculation of effective tax rates using the Devereux/Griffith model
for Member States with interest deduction limitation rules by assuming binding limits to
the deductibility of interest costs.
Thin capitalization or earnings stripping rules limit the deductibility of interest costs in
case of debt financing and can be found in more and more Member States. The
Devereux/Griffith model does not allow a detailed implementation of interest deduction
limitation rules. In previous reports on effective taxation in the European Union, it has
always been assumed that interest costs were deductible irrespective of the existence of
limitation rules. For the purpose of this study, it is assumed that the limitations with
regard to interest costs are applicable. In Member States with interest deduction
limitation rules, this will result in a complete non-deductibility of interest costs at the
corporate level. The chosen approach (applicable vs. non-applicable) will neglect
substantial differences in the existing interest limitation deduction rules of the Member
States at the corporate level, like a possible carry-forward of non-deductible interest.
Therefore, the report will interpret the results cautiously.
Moreover, for the analysis of fundamental tax reforms, the tax codes of Belgium and
Italy are modified. Both Member States have already implemented one type of
fundamental tax reform: the Allowance for Corporate Equity. For the analysis of the
other hypothetical fundamental tax reforms, it is consistent to assume that no other
fundamental tax reform is currently in place. Otherwise, the effects of two fundamental
tax reforms (e.g. CBIT and ACE) would overlap and might even contradict and
compensate each other.
2.3.3. Sensitivity of model results and likely robustness to changes in the
underlying assumptions and/or data input
The effect of the revenue neutral fundamental tax reforms on the EATR might differ if
the pre-tax rate of profitability is changed. Therefore, a sensitivity analysis with pre-tax
rates of profitability below and above the base case assumption of 20% is conducted. The
sensitivity of the effective tax measures to the assumed inflation and interest rates are
discussed in ZEW (2016b).

116
3. THE IMPACT OF TAX PLANNING ON FORWARD-LOOKING EFFECTIVE TAX RATES
3.1. Brief description of the model
Multinationals companies have the opportunity to apply profit shifting strategies to
reduce their tax payments in high-tax countries and minimize the overall effective tax
burden on their global profits. The tax planning strategies of multinational corporations
have been a key issue on the international policy agenda for some years now. The aim of
the report is to explore the implications of typical tax planning strategies on effective tax
rates for cross-border investments between the 28 EU member states and the US.
The report derives forward-looking average and marginal effective tax rates that
incorporate the possibility of sophisticated tax planning strategies by multinationals and
the existence of preferential tax regimes such as IP boxes. Profit shifting channels from
high-tax to low-tax countries cover intra-group debt shifting, royalty payments, as well as
transfer pricing of goods and services. A number of cases are considered, including
“triangular” structures involving the use of tax haven finance affiliates and the use of
hybrid entities and hybrid instruments. The report also provides insights on the potential
impact of anti-avoidance measures against so-called aggressive tax planning.
As in the annually updated report on effective tax rates conducted by ZEW, the study at
hand applies the Devereux/Griffith model to calculate cost of capital (CoC) and effective
average tax rates (EATR). This allows one to compare the results for different tax
planning structures to the results for direct cross-border investments known from the
annual updates.
3.2. Model validation and peer review
The Devereux and Griffith methodology has acquired a strong reputation among
corporate tax experts. This approach is rooted in the model originally proposed by King
and Fullerton (1984) and as such has the advantage of allowing the computation of both
effective marginal tax rate and effective average tax rate under a unique framework.
The Devereux/ Griffith approach was previously used in an Impact Assessment by the
European Commission (EEC 2001), following the advice of a panel of academic experts,
to comply with the mandate of the ECOFIN Council in December 1998 concerning the
scope of the analysis of effective tax rates.116
Since then the methodology has been
applied for the calculation of effective tax rates in the EU and other countries on a yearly
basis.
A range of studies have examined the theoretical foundation of the Devereux/ Griffith
model and its scope of application (Lammers 2002; Schreiber et al. 2002; Devereux et al.
2003). OECD (2007) provides specific considerations on cross-border METR/AETR
analysis with triangular financing structure. The issue of incorporating IP Box regimes
into a model of effective tax rates was addressed in Evers et al. (2015).
116 For a deeper analysis of the pros and cons of the forward-looking indicators for policy makers, see
Giannini and Maggiulli (2002).

117
3.3. Underlying assumptions and data input
3.3.1. Baseline and key assumptions
The basic framework underlying the Devereux/Griffith model for cross-border settings
with a parent company and its subsidiary located in different countries have been
established in several earlier studies undertaken by ZEW on behalf of the European
Commission. The focus here is on multinational corporations hence the case of
incorporated SMEs and partnerships is ignored. Given to the high mobility on the
international capital market, personal taxes are of little importance for decision making in
multinational enterprises. Therefore, the analysis is limited to the corporate level (i.e.
excluding shareholders' taxation).
The basic approach proposed by Devereux and Griffith is to consider hypothetical
incremental investment located in a specific country undertaken by a company resident
possibly in the same country, but also possibly in another country. The hypothetical
investment takes place in one period and generates a return in the next period. The
impact of taxation is analysed by considering a number of features of the tax system,
including the statutory tax rate, capital allowances, depreciation rules and the treatment
of different financing sources, the treatment of foreign source income, wealth taxes paid
by the company, as well as possibly the treatment at the corporate and personal level of
dividends paid by the company, and wealth and capital gains taxes.117
Both the cost of capital and the EATR are computed for five different types of assets
(intangibles, buildings, machinery, financial assets, inventory) and three different sources
of financing (retained earnings, new equity, debt). In presenting averages over different
forms of assets, these assets are weighted equally, while unequal weights are used for
financing: retained earnings 55%, new equity 10%, and debt 35% (OECD, 1991). As for
true economic depreciation rates it is assumed in all countries: intangibles (15.35%),
industrial buildings (3.1%); machinery (17.5%), financial assets (0%), and inventories
(0%).
The alternative form of investment is assumed to be lending and the alternative
investments earns a real interest rate of 5%. The inflation rate is assumed to be 2% in all
countries. The computations of EATRs are based on a pre-tax rate of profitability of 20%
which corresponds to the standard economic assumption.
3.3.2. Construction of the core policy impact assessment
The report extends the basic formulas underlying the Devereux/Griffith model for cross-
border settings - with a parent company and its subsidiary located in different countries -
for implementing representative profit shifting strategies via interest and royalty
payments. A number of cases are considered:
(1) Tax planning via an intermediate financing company resident in a tax-exempt
country which grants a loan to the subsidiary and receives the marginal return of
the investment as interest.
117 It is assumed that the tax system remains unchanged over the life of the investment.

118
(2) The second tax planning strategy replicates tax planning strategy 1 but assumes
that the intermediate company is resident in a fictitious EU average country.
(3) Tax planning strategy 3 replicates tax planning strategy 1 but assume that the loan
granted to the subsidiary has a hybrid element resulting in its classification as
equity capital in the country of residence of the intermediate company.
(4) Tax planning strategy 4 replicates tax planning strategy 2 considering a hybrid
loan.
(5) Under tax planning strategy 5 profits are not shifted via debt financing but via
royalty payments. It is assumed that the subsidiary invests in a bundle of assets
(buildings, machinery, inventory, and a financial asset) whereas the intangible
asset used in the production process is owned by a separate intellectual property
(IP) holding company resident in a tax-exempt country. The intangible is licensed
to the subsidiary which generates profits from the use of the intangible and
forwards these profits to the IP holding company in the form of a royalty
payment.
(6) Tax planning strategy 6 replicates tax planning strategy 5 but assumes that the IP
holding company is resident in the fictitious EU average country.
(7) Tax planning strategy 7 replicates tax planning strategy 5 but assumes that the IP
holding company is resident in one of the EU member states offering an IP-box
regime.
As for the tax-exempt country, two different assumptions are made: (i) "Offshore treaty"
is assumed to be a non-EU tax exempt country that does not levy any kind of profit and
non-profit taxes but has concluded tax treaties with all EU member states and the US
reducing all withholding taxes to zero; (ii) "Offshore no treaty" is assumed to be a non-
EU tax exempt country that that does not levy any kind of profit and non-profit taxes and
has not concluded tax treaties with all EU member states and the US, therefore domestic
withholding tax rates apply (up to 75% in France). The fictitious EU average country is
defined as an average EU member states. Relevant tax parameters for this country are the
arithmetic means of the respective tax parameters across all 28 EU member states.
The calculations are based on tax law data for the year 2015 (ZEW 2015). The tax
database comprises all relevant tax parameters for the EU-28 Member States. Additional
tax parameters used in the study at hand include (i) withholding taxes on dividends,
interest and royalties between EU and US companies; (ii) IP-box regimes in the EU
member states.
3.3.3. Sensitivity of model results and likely robustness to changes in the
underlying assumptions and/or data input
The effect of the revenue neutral fundamental tax reforms on the EATR might differ if
the pre-tax rate of profitability is changed. Therefore, a sensitivity analysis with pre-tax
rates of profitability below and above the base case assumption of 20% is conducted
(ZEW 2016c). The sensitivity of the effective tax measures to the assumed inflation and
interest rates are discussed in ZEW (2016b).

Annex V: Formula apportionment
This annex presents the formula apportionment outlined in the 2011 impact assessment
and proposal for a CCCTB. The approach of 2011 is furthermore complemented by
findings in the literature since then.
1. INTRODUCTION
The 2011 proposal for a CCCTB118
is a system of common rules for computing the tax
base of companies which are tax resident in the EU and of branches of third-country
companies located in the EU. Specifically, the common fiscal framework provides for
rules to compute each company's (or branch's) individual tax results, the consolidation of
those results, when there are other group members, and the apportionment of the
consolidated tax base to each eligible Member State.
In the CCCTB, the consolidated tax base is apportioned to the different jurisdictions in
which the group entities operate according to the formula set out in Articles 86-102 of the
2011 proposal for the CCCTB. The formula establishes a method to determine the
respective economic presence and activity of subsidiaries in a particular geographic
location ('allocation'), i.e. the taxable profit of a multinational entity within a specific
jurisdiction. Generally, for the purpose of establishing a taxable presence, formulary
systems apportion income with reference to inputs and outputs, which respectively reflect
supply and demand components of income production. The formula attributes profits to
those Member States where the economic activity takes place as measured by the factors
in the formula.
Formula apportionment is a necessary consequence of consolidation. In this annex, the
elements of the formula apportionment mechanism in the 2011 proposal of the CCCTB
will be outlined. Section 2 of this annex describes the proposed CCCTB's apportionment
formula and its allocation factors as defined in the Directive. Section 3 presents an
overview of the steps which led to the emergence of formulary apportionment as the
Commission's preferred allocation mechanism. Section 4 reviews the treatment of
formula apportionment in the 2011 Impact Assessment which accompanied the CCCTB
proposal, specifically with respect to the analysis and conclusions of three main studies:
(i) PricewaterhouseCoopers (PwC) Study: (ii) Amadeus and Orbis database; and (iii)
CORTAX study. Section 5, presents a brief review of literature on formula
apportionment, leading up to and following the 2011 CCCTB proposal. Section 5
concludes.
2. APPORTIONMENT FORMULA IN THE 2011 CCCTB
Following on from the work of the CCCTB Working Group, the formula proposed by the
Directive is based on company-specific data and comprises three equally weighted
factors (labour, assets and sales):
i. Labour is computed based on both payroll and the number of employees (each
item counts for half);
ii. Assets consist of all fixed tangible assets, meaning that intangibles and financial
assets are excluded from the formula apportionment;
118 SEC(2011) 315-316.

120
iii. Sales are taken into account to increase the taxing entitlement of the Member
State of destination.
The choice of the three factors stems from the need to reflect both the state of production
(supply side, measured by assets and/or labour payroll) and the state of demand (sales to
destination) to describe economic activity properly. Specifically, the apportionment share
of the consolidated tax base of a 'group member A' is determined by the following
formula:
Share A = 1
3
+
1
3 1
2+
+1
2
+
1
3
∗ ′
Sales are weighted by one-third, payroll by one-sixth, the number of employees by one-
sixth, and assets by one-third. The sum of the weights equals one so that 100% of the
CCCTB is apportioned across the Member States. Member States can then apply the
national corporation tax rates to their respective shares of taxable bases.
Apportionment factors
The provisions of the proposed Directive that regulate the sharing mechanisms are
contained in Article 86, which illustrates the general formula, up to Article 103, in which
the provisions deal with the three apportionment factors in detail.119
In accordance with Articles 90 and 91, the labour factor is subdivided into two equally
weighed components: payroll and number of employees as measured at the year end.
Specifics regarding the definition of employee, the inclusion of seconded employees and
temporary workers, as well as a broad definition of payroll and how it is allocated are
also provided. The inclusion of the two components in the labour factor reflects the need
to take into account cross-country disparities (due to the variance in labour productivity)
across the EU.
Pursuant to Articles 92, 93, and 94, assets include all fixed tangible assets (owned, fixed,
or rented), which are allocated to the economic owner or to the legal owner (in the event
that the first is not identifiable), and are valuated according to defined valuation
principles. Inventory, intangible and financial assets are excluded from the formula due
to their mobile nature and the risks of circumventing the system. The computation of the
asset factor includes all the costs incurred for research, development, marketing and
advertising in the six year period preceding the entry into the CCCTB system. The use of
the labour and asset factors gives appropriate weight to the interests of the Member State
of origin.
Finally, sales are taken into account in order to ensure fair participation of the Member
State of destination. The sales factor, defined in Article 95, consists of the proceeds from
the total sale of goods and supplies of services of a group member. The definition
excludes 'exempt revenues' and 'dividends' from the sales factor, as they respectively do
not contribute to the tax base and have no readily identifiable geographic location. Intra-
group sales of goods and supplies are excludable in accordance to the same principle, i.e.,
that a factor which does not contribute to the tax base should not be used to apportion the
base. The sales factor is attributed to group members on a 'destination' basis, as it is
119 See CCCTB Arts 86-103.

121
designed to reflect the state of demand (sales to destination), and specific rules address
situations in which the general rules might create 'nowhere' income.
In addition to the general rules, the CCCTB contains three provisions: the general anti-
abuse rule, the safeguard clause (applicable to apportionment) and an explicit grant of
rulemaking authority to the Commission to calculate apportionment factors. The
provisions provide an alternative method where the outcome of the apportionment does
not fairly represent the extent of business activity. The provisions determine the
composition of factors and the attribution of the tax base for specific industries.
Specifically, the CCCTB proposal includes special apportionment rules for four
industries: financial institutions; insurance undertakings; oil and gas; and transportation
(shipping, inland waterway transport, and air transport). Insofar as certain aspects of
formula apportionment could create planning opportunities, these provisions provide the
basis for limiting their scope.
3. HOW THE SHARING MECHANISM WAS CHOSEN
The Commission's proposed sharing mechanism, or apportionment formula, has been the
outcome of a comprehensive analysis. The Commission refined its ideas largely though
the CCCTB Working Groups: formula apportionment was among the main building
blocks of the CCCTB which was reviewed and analysed by the CCCTB WG and its sub-
group 6 on the sharing mechanism.120
The main findings are contained in various
working papers,121
analysing the main issues linked to valuation, location, availability of
data, advantages and disadvantages of the three factors of formula apportionment. In
addition to the consultations of the working group, the Commission conferred with
academic experts on allocation mechanisms122
and invited experts to evaluate the
formula, commissioned a study,123
published its own study,124
and conducted an Impact
Assessment125
on its chosen three-factor formula which accompanied the proposal for a
Council Directive on a CCCTB.
As an outcome to this extensive analysis, stakeholder and experts in the field have agreed
that the three-factor formula best fulfils the principles that have guided the design of the
sharing mechanism, i.e. the formula should: (i) be as simple as possible for taxpayers and
120 A subgroup was set up in December 2004 to analyse more closely the issue of sharing the tax base.
The subgroup was chaired by the Commission and met twice in Brussels in February and June 2007.
The results of those meetings are summarized in two Commission Working Documents that were
presented at the meetings of the main Working Group held after the meetings of the subgroup and can
be found at the following web-page:
http://ec.europa.eu/taxation_customs/taxation/company_tax/common_tax_base/article_3831_en.htm
and
http://ec.europa.eu/taxation_customs/taxation/company_tax/common_tax_base/article_4381_en.htm 121 See Working Paper 47 (The mechanism for sharing CCCTB), Working Paper 52, (An overview of the
main issues that emerge during the discussion on the mechanism for sharing CCCTB), paragraph III of
Working Paper 55, (Summary record of the meeting of the CCCTN Working group) and Working
Paper 60 (CCCTB: possible elements of the sharing mechanism). 122 Thus, for example a meeting with academic experts was held in arch 2004 on “the allocation
mechanism” and written contributions on the factors for apportioning income were requested and
received at other stages of the consultation process. 123 Weiner (2005). 124 Agúndez-García (2006). 125 European Commission (2011a), "Impact assessment, accompanying document to the proposal for a
council directive on a common consolidated corporate tax base (CCCTB) COM(2011) 121 final",
Commission Staff Working Document, SEC(2011) 316 final.

122
tax administrations to apply and easy for tax administrations to audit; (ii) be difficult for
taxpayers to manipulate, that is, it should not rely on factors that can be easily relocated
to exploit tax rate differentials across the EU; (iii) distribute the tax base among the
various entities concerned in a way that can be considered fair and equitable; and (iv) not
lead to undesirable effects in terms of tax competition. It was generally accepted that
there should be a uniform formula across the EU, with the same factors and weights for
all Member States.
The Commission's CCCTB apportionment mechanism constitutes a comparable system
to what has been used in Canada, US and Switzerland to distribute income across sub-
national boundaries in the last century. The above mentioned countries employ formulas
which attribute the tax base to taxing jurisdictions based on geographically determined
factors. As such, the evaluation of the US and Canadian experience provided insight on
the use of formulary methods and guidance for the Commission, limited in part by the
different political structures at hand, as it designed an apportionment system for the
EU.126
The Commission's choice of a uniform formula127
and equally weighted factors,128
the exclusion of intangible assets,129
and the provision of sector-specific formulae130
all
stem in part from the lessons learned in the application of formulary methods in North
America.
A subtle difference between the US apportionment formula and the 2011 CCCTB
apportionment formula is that the first is designed to apportion the tax base directly to a
particular state, whereas the later attributes income to its 'group members'131
(which
results in an indirect attribution of income to the various Member States). Allocating the
tax base to a group member assures that there is an EU Member State in which the base
will be taxable.132
4. TREATMENT OF FORMULA APPORTIONMENT IN THE 2011 IMPACT ASSESSMENT
Along with the Directive, in 2011 the Commission released an Impact Assessment.133
The impact of the apportionment formula on the following aspects is presented: (i)
impact on distribution of the corporate tax bases among the EU Member States (ii)
impact on the costs for tax administrations and on the compliance costs for taxpayers;
(iii) the main economy-wide impacts.
126 Weiner (2006). 127 In contrast to the US where each state is free to choose its own formula, Member states in the EU are
not allowed to apply domestic variations to the formula by attributing different weights to the factors.
Non uniform formulae have led to distorting tax competition on the factors and double taxation (or
double non taxation) in the US experience. 128 The US and Canada have employed formulas based on equally weighted origin-based supply and
destination-based demand factors. 129 In the US intangibles are excluded from the asset factor. 130 For certain economic sectors, the predefined formula does not adequately reflect the importance of the
various factors generating income. It is not uncommon for states to have special apportionment rules
for certain industries; however, the industries differ from those proposed in the CCCTB. 131 See CCCTB Arts 4(7), 55. 132 This addresses the theoretical possibility that the formula allocates tax base to a Member State where
the group has no taxable presence. 133 European Commission (2011), "Impact assessment, accompanying document to the proposal for a
council directive on a common consolidated corporate tax base (CCCTB) COM(2011) 121 final",
Commission Staff Working Document, SEC(2011) 316 final.

123
The 2011 Impact Assessment includes the results from (i) PwC Study: (ii) Amadeus and
Orbis database; and (iii) CORTAX study, which examine formula apportionment within
the context of a wider analysis aiming to quantify the impacts of alternative policy
options.
PwC case study: a survey was launched in 2008 among multinational companies
located in the EU. One task of the study was to quantify the impact of alternative
tax scenarios on the size of multinationals' taxable profit. Multinational
companies were surveyed with a questionnaire on the quantitative and qualitative
views on compliance under the current national systems for corporate income tax
and in the two hypothetical scenarios of CCTB and CCCTB.134
Of the 21
multinational companies surveyed, 13 participated in the PwC taxable profits case
study. The findings show that changing the weighing of the CCCTB
apportionment factors has little effect on the relative apportionment of the tax
base between countries. This result is attributed to a similar distribution of
apportionment factors across countries.135
ORBIS and Amadeus databases: the databases provide balance sheets and
profits and loss accounts for representative samples of about 6700 EU
multinational groups in the financial and about 2000 groups in the non-financial
sectors, respectively, over the 2002-2005 period. The data have been used to
calculate the effect of loss consolidation and, with particular reference to ORBIS,
to calibrate the CORTAX model.136
Using data from ORBIS and Amadeus
databases, shifts in the national tax bases after apportionment are evaluated by
comparing the formulary apportionment-based distribution of tax bases across
countries to the current profits-based distribution. Table 3 of the 2011 Impact
Assessment reports the results from the formula where the labour factor (split into
payroll and number of employees), assets and sales by destination are equally
weighted. The consolidated EU tax base distributed using the formula would be
larger in 12 Member States, smaller in 9 Member States, and unchanged in 2
Member States.137
The effects of alternative formulae are also evaluated.138
According to the study, the simulation of alternative sharing mechanisms, i.e.
changing apportionment factors, has very small effects on aggregate EU welfare.
CORTAX model: an applied computable general equilibrium (CGE) model that
describes the 27 countries of the EU at the time, plus the US and Japan. It is
designed to simulate the economic implications of unilateral and multilateral
corporate tax policies as well as the harmonisation of these policies. The model is
calibrated using data from the ORBIS database. Importantly, the simulations in
CORTAX are run under the working assumption that any changes in the
corporate tax base would be compensated by changes in the national tax rates to
guarantee ex-ante budget neutrality.139
Results include a quantification of welfare
effect of the reforms after firms' behavioural responses to the new tax system. In
CORTAX, the shift from separate accounting to consolidation with formula
apportionment has a number of effects: i) an impact on the distribution of
134 See annex 7 of the 2011 Impact Assessment for more details on this exercise. 135 See Table A.14 in annex 7 of the 2011 Impact Assessment. 136 See annex 3 of the 2011 Impact Assessment for a detailed description of the different ways in which
the data have been used. 137 The result is undetermined for 4 Member States. 138 See Table A.11 in annex 3 of the 2011 Impact Assessment. 139 See annex 10 of the 2011 Impact Assessment for more detail.

124
corporate tax bases across countries; ii) a removal of profit shifting within the
EU; iii) a shift from current distortions in international capital allocation towards
a new type of distortion associated with the formula factors; iv) a reduction in tax
compliance costs; v) the possibility to offset a loss in one Member State against
profits in other Member States. In turn, the welfare effects under the CCCTB
have been simulated using alternative sharing mechanisms.140
The switch to
payroll instead of employment mainly benefits high wage countries (in the former
EU15) at the expense of low-wage countries (like Romania and Bulgaria). The
larger weight on capital benefits capital-intensive countries like Belgium, Ireland
and the Netherlands. On balance, CORTAX suggests that the isolated aggregate
effect on welfare in the EU of any apportionment mechanism is very small. The
discussion above assumes away other dynamic effects that would affect the size
and distribution of the cake of corporate taxable profits in the EU in the long-
term. CORTAX simulations show that with respect to economy-wide impacts,
consolidation and apportionment have a positive economic effect. Overall the
CCCTB implies a welfare gain of about 0.02% to 0.06% of GDP in aggregated
terms for the EU as a whole.
5. FORMULA APPORTIONMENT IN THE ECONOMIC LITERATURE
Formula apportionment has been the subject of analysis in a large body of literature,
especially following the European Commission's interest in apportionment mechanisms.
The choice and relative weighing of the factors to be used in the apportionment formula
have been evaluated from an historical perspective, as well as from a conceptual and
political basis. This section summarizes the most relevant contributions with a focus on
findings in the literature after the 2011 proposal. The results of recent literature
contribute to an understanding of the macroeconomic effects induced by the potential
introduction of the CCCTB system.
In one of the first analyses of sharing mechanisms, Musgrave (1973) identifies the role of
consolidation and formula apportionment in solving transfer pricing problems within
multinational corporations. He points out that a formula for apportionment should be
easy to administer and reflect the elements measuring the processes involved in the
earning of net income. McLure (1980) shows theoretically that a corporate income tax
which is applied through an apportionment formula is essentially equivalent to a direct
tax levied on the factors of the formula. It follows that tax rate differences may distort the
allocation of formula apportionment factors.141
As to the factors in the formula, literature discusses micro- and macroeconomic factors as
possible choices. Schäfer and Spengel (2003) show that microeconomic (industry
specific factors) are preferable to macroeconomic factors (which are market specific or
linked to policy objectives) according to the principle of equity. Microeconomic factors
better reflect each group member’s share in the income generating activities of taxable
entities. Factors have also been individually analysed. For example, one essential matter
of concern regarding the payroll factor for apportioning consolidated income, is the
variance in wage levels across the EU, and hence the difference in labour costs across
Member States. 142
The number of employees is proposed as an alternative to the payroll
140 See Figure A.3 in annex 10 of the 2011 Impact Assessment. 141 See Gordon and Wilson (1986). 142 See also McLure (2002).

125
factor, with the premise that it may in turn lead to potential distortions due to differences
in the levels of labour productivity across the Member States.143
Real and artificial factor shifting
The literature documents a range of potential tax avoidance strategies under formula
apportionment. A study by Büttner et al. (2011) finds that profit-shifting activities of
multinational entities remain important within formulary apportionment if companies are
allowed to decide whether their affiliates are included in the consolidated group.
Multinational entities can strategically exploit the definition of a consolidated group, by
choosing to not consolidate if intra-group tax-rate differences are large, thereby
preserving profit shifting opportunities. Their theoretical model of multinational entities
shows that there are trade-offs to consolidation decision: "exclusion of affiliates costs
(loss-offset opportunities foregone), but there is also a benefit of non-consolidation
(maintaining profit-shifting opportunities)”. Greater dispersion of statutory tax rates
increases the benefit of leaving affiliates in low-tax jurisdictions unconsolidated. This
result is important for the EU and explains the choice of an 'all-or-nothing' option for
including companies in the consolidated group and the mandatory requirement to remain
within the CCCTB for five years. Furthermore, a study based on an experimental design
finds indications that multinational entities opting for taxation on a consolidated basis
may look for opportunities to shift profits to alternative investment locations outside the
European Union.144
Generally though, formula apportionment systems are less subject to the manipulation of
the tax base by companies through transfer pricing as discussed by Hellerstein (2005).
Allocation rules, in comparison to separate accounting rules, reduce the ability of
companies to use profit-shifting techniques, especially with regards to intra-group
financing.145
Hence, formula apportionment is regarded as less vulnerable to tax
avoidance practice146
when compared to separate accounting tax regimes, where the
allocation of income among jurisdiction is strongly affected by profit shifting strategies
of multinational entities.147
Studies also find that under formula apportionment systems
there is less incentive for corporate tax rate competition.148
On the other hand, there is evidence of tax-motivated factor shifting that entails real
shifts in economic activity. For instance, empirically analysed impacts of a payroll
formula apportionment regime on German business activity show a significant negative
correlation of the tax differential to payroll expense.149
Firms react to incentives in a
formula apportionment tax regime by changing the allocation of real production factors,
i.e., shifting payroll to low-tax jurisdictions.150
Distortions with respect to location
investment decisions have important policy implications. The impact varies among
sectors: multinational entities in the manufacturing industry may have more potential to
adjust the company structure to altered investment incentives under formula
apportionment, in comparison to companies in other industries, such as the
143 For a discussion see Agundez-Garcia (2006). 144 See Keser et al. (2014). 145 See also Mintz and Smart (2004). 146 Clausing et al. (2011) discuss this point in more detail. 147 See Dharmapala (2014). 148 See Kind et al. (2005). 149 See among others Thomsen et al. (2014). 150 See also Eichfelder et al. (2015).

126
pharmaceutical industries. Finally, taking optimal pre-tax investment decisions as a
given, a study of after-tax investment decisions of centrally managed multinational
entities under a formula apportionment system, finds that incentives to invest in a tax-
optimal manner tend to be lower under formula apportionment.151
The incentive to locate
apportionment factors in low-tax jurisdiction leads to economic distortions which are
undesirable from an economic standpoint, highlighting the importance of the choice of
factors; however it does not raise abundant issues related to artificial tax shifting152
.
6. CONCLUSION
In sum, the formula apportionment rules proposed in 2011, which draw in part from the
experiences with the formulary method in the US and Canada, were chosen for the
following reasons: (i) the micro-factors composing the formula reflect the supply and
demand sides of profit generating activities, (ii) the labour factor is split in two parts –
payroll and employees –taking into account disparities in labour productivity across the
EU, (iii) little sensitivity of the formula to different weights, i.e., changing the weights
has little effect on the relative apportionment of the tax base, (iv) intangible and financial
assets are excluded to prevent manipulation, (v) a uniform formula with identical factors
and weights in all Member States taking part in the CCCTB avoids distorting tax
competition and double taxation (or double non taxation), and finally (vi) the 'all-or-
nothing' approach limits tax-motivated manipulations of group structures.
Recent literature, including the contributions following the 2011 Directive, show that the
determinants for the choice of factors as concluded in the 2011 CCCTB impact
assessment remain relevant. There are certain risks for tax planning through 'factor
shifting' under formula apportionment, but that these are very limited and would require a
re-allocation of real factors, which is in general not mainly driven by tax considerations,
but where other economic considerations play a more important role. In conclusion, the
chosen sharing mechanism and the proposed formula reflect an approach which ensures
that profits are taxed where economic activity as measured by the apportionment factors
takes place.
151 See Ortmann and Erich (2015). 152 See Hellerstein (2012).

127
Annex VI: The Anti-Tax Avoidance Package
1. RECENT DEVELOPMENTS
At the global level, the challenges related to the taxation of multinational companies have
increased the political pressure to strengthen the international rules of co-operation in
corporate tax matters. Following the crisis and the increased revenue needs, the OECD
proposed an action plan on base erosion and profit shifting (BEPS) to reinforce the
current international tax rules and stabilise national tax bases. The BEPS project focuses
on the interaction of different (national) tax rules and tries to detect and close loopholes
in the current tax architecture. The BEPS action plan laid the basis for developing an EU
approach to implementing some international aspects of the common base that are linked
to the OECD/G20 BEPS project. This allows for a coordinated implementation of the
new international standards agreed in the package. The Treaties require that the
fundamental rights – including the freedom of establishment – be respected. Reforms
must therefore be tailored for the EU content and fix inconsistencies on an EU-wide
basis.
The BEPS action plan was swiftly followed, in January 2016, by the Anti-Tax Avoidance
Package. This package is made up of four proposals to ensure that tax is paid where the
value is generated and that tax information is effectively accessed.
The Anti-Tax Avoidance Directive153
puts forward tax rules aimed at preventing that
income goes untaxed (or taxed at very low level). It ensures coordination of the 28
national corporate rules in order to effectively limit aggressive tax planning. The
Commission proposal covered the following rules: interest limitation rule, exit taxation,
general anti-abuse rule, controlled foreign company rules, rules on hybrid mismatches
and switch-over clause. The latter was not retained in the text agreed by the Council. The
content of the agreed text is discussed in more detail below.
The Amendment to the existing Directive on administrative cooperation to implement
Country-by-Country Reporting foresees the automatic exchange of information on
country-by-country reports of multinational companies with consolidated revenues of at
least EUR 750 million will have to provide tax-related information on an annual basis for
each tax jurisdiction in which they do business. Member States will have to share the
information with the other Member States concerned.154
The new rules, adopted by the
ECOFIN Council in May 2016, aim at enhancing transparency, thereby providing
Member States with the information that they need to detect and prevent tax avoidance
schemes.
The Recommendation on Tax Treaty issues advises Member States how to reinforce their
tax treaties against abuse by aggressive tax planners in a way that is compliant with EU
law. It covers the introduction of general anti-abuse rules in tax treaties and the revision
of the definition of permanent establishment.
153 COM/2016/026 final 154 This information will be provided to the tax authorities of the Member States where the parent
company is established. If the parent company is not an EU tax resident, the reporting will be done
through its EU subsidiaries.

128
The Communication on External Strategy for Effective Taxation sets out a coordinated
EU approach against external risks of tax avoidance and to promote international tax
good governance.
The Anti-Tax Avoidance Package complements existing initiatives and forums to ensure
an effective taxation, enhance tax transparency and address the risk of double taxation. In
particular, it focusses on:
Transparency measures: In March 2015, the Commission launched a package of
measures to boost tax transparency. It included a proposal for an automatic
exchange of information on tax rulings, which was adopted by the Council in
December 2015. All advance cross-border tax rulings and advance pricing
arrangements will be subject to an automatic exchange of information as from
January 2017. Further to the introduction of non-public Country-by-Country
reporting, the Commission adopted in April 2016 a proposal to introduce public
reporting requirements for multinational entities.
Dispute resolution mechanism: The June action plan called for further improving
the dispute resolution mechanism. The Commission is currently exploring various
options for a coordinated EU approach to improve the current situation, following
a public consultation.
Joint Transfer Pricing Forum: The EU Joint Transfer Pricing Forum assists and
advises the Commission on transfer pricing tax issues. It proposes non-legislative
solutions to practical problems posed by transfer pricing practices in the EU. The
work of the forum centres around two areas: the Arbitration Convention, which is
a specific dispute resolution mechanism for transfer pricing cases; and the
practical application of transfer pricing rules in the EU. The June action plan
called on improving the transfer pricing framework in the EU in order to better
align the transfer pricing outcomes with value creation.
2. THE ADOPTED ANTI-TAX AVOIDANCE DIRECTIVE
The Anti-Tax Avoidance Directive puts forward tax rules aimed at preventing that
income goes untaxed (or taxed at very low level). It ensures optimal coordination of the
28 national corporate rules in order to effectively limit aggressive tax planning. The
proposal covers the following rules:
1. Interest Limitation Rule
Multinational enterprises have increasingly engaged in "shifting profits, often through
inflated interest payments, out of high tax jurisdictions into countries with lower tax
regimes. The interest limitation rule is necessary to discourage such practices by limiting
the deductibility of taxpayers’ net financial costs" (source: proposal for a Directive CO
2016/026 final). The proposed Directive foresees that net interest expenses cannot be
deducted above a fixed ratio (30%) expressed in terms of a taxpayer’s earnings before
interest tax depreciation and amortisation (EBITDA). This is complemented by a group
ratio rule, whereby the indebtedness of the overall group is considered for the purpose of
entitling taxpayers to deduct higher amounts of net financial costs. Finally, a safe-
harbour provision foresees that companies that have net interest expenses below EUR 3
million are not caught by the rules as these companies are less likely to engage in debt
shifting.

129
2. Exit taxation
Exit taxes aim at ensuring that states are in a position to tax the economic value of any
capital gain created in their territory even though this gain has not yet been realised at the
time of the exit. The proposed rule on exit taxation would allow taxpayers either to
immediately pay the amount of exit tax assessed or defer payment of the amount of tax.
3. General anti-abuse rule (GAAR)
The GAAR complements specific anti-abuse rules. It ensures that tax avoidance
strategies that were not envisaged by the legislator can be addressed, by granting the
authorities the power to deny taxpayers the benefit of aggressive tax planning
arrangements. The GAAR will apply domestically, intra-EU and internationally to
taxpayer’s arrangements that are non-genuine.
4. Controlled foreign company rules (CFC)
CFC rules allow the reattribution of this income of a (low-taxed) controlled subsidiary to
its parent company for tax purposes in certain situations. CFC rules therefore can ensure
that profits parked in low or no tax countries are effectively taxed. The proposed rules
cover both intra-EU and extra-EU situations.
5. Rules on hybrid mismatches
Hybrid mismatches arise from differences in the legal characterisation of payments
(financial instruments) or entities in different jurisdictions. The directive includes rules to
address hybrid mismatches in intra-EU situations, which should close the doors to
exploiting such mismatches both for entities and transactions.

130
Annex VII: Compliance Costs
The reduction of tax compliance costs remains an important argument in the debate about
harmonising the corporate tax base in the EU. The 2011 Impact Assessment analysed the
consequences of a CCCTB on compliance costs based on survey results, notably for
cross-border activities. This annex describes briefly the main finding on tax compliance
costs. The first section explains the relevance of compliance costs and summarizes the
main results from the literature. The second section reports the results of the 2011 Impact
Assessment and discusses them in the light of the recent literature. The last section
reviews the very limited information on the impacts on the costs of tax administrations.
1. THE ROLE OF COMPLIANCE COSTS IN TAXATION
Taxation has a significant impact on business decisions. Taxes on businesses are indeed a
key policy instrument of economic policy. One reason is that taxes can be changed
relatively quickly in comparison to other important determinants of investment levels
such as the public infrastructure or the skill level of the work force. Accordingly, tax
policy is an attractive tool for policy makers to react quickly to different economic
developments without too large time lags.
Taxation impacts businesses (and households) via three channels: (1) The tax payment
which corresponds to the amount to be paid after the tax has been declared. (2) The
welfare loss (deadweight loss) which arises from the economic distortions in (relative)
prices due to taxation (tax wedge) and (3) the compliance costs incurred by businesses as
well tax administrations for being tax compliant (or not), auditing and book keeping.
While the first two channels feature prominently in the public economics literature,
compliance costs are less discussed. One reason for this is the difficulty in measuring
compliance costs properly.
Most research focuses on measuring compliance costs using survey techniques. The first
step in order to isolate compliance costs for measurement is to define them properly. Tax
compliance costs are commonly defined as the cost borne by businesses for complying
with tax regulation, excluding the tax payment itself (Ramboll Management Consulting,
2013). The literature defines them as costs “incurred by taxpayers, or third parties such as
businesses, in meeting the requirements laid upon them in complying with a given
structure and level of tax” ( andford, Godwin, and Hardwick 1 , p. 10).
From an economic perspective, compliance costs can be regarded as an efficiency loss
and a waste of economic resources; they reduce private profits, but do not lead to higher
tax revenue. Reducing compliance costs is therefore clearly beneficial and has been
identified as a key objective in many national tax systems. In fact, most of the economic
literature focuses largely on measuring and reducing domestic tax compliance costs.
Evidence on cross-border tax compliance costs remains very scarce, although early
contributions such as the 1992 Ruding report provided a first survey of cross-border
compliance costs for EU companies. 965 companies of different size and sectors were
part of the survey and estimated compliance costs were found to be at around 3% of their

131
total income.155
The 2011 Impact Assessment has built on this work and provided some
more evidence on the size of the problem in the context of international investments.
Regarding the academic literature on the topic, Eichfelder and Vaillancourt (2014)
provided an extensive survey of the current empirical estimates of tax compliance for
different tax payers for the period between 1984 and 2014. For business taxes, the
surveyed studies show that (domestic) compliance costs are regressive. For large
companies they can be below 0.01% of turnover, while for SME the burden can be
several percentage points and according to some studies even exceed the actual tax
payment.
The literature as surveyed by Eichfelder and Vaillancourt (2014), as well as by Evans et
al. (2014) shows regressive compliance costs and a decline in relative terms with the size
of the business, whether measured by reference to turnover, income, number of
employees or any other proxy. The evidence suggests that the share of tax planning costs
in total compliance costs increases with company size. The research also shows that
those compliance costs do not appear to be diminishing over time (Lignier and Evans
2012; Lignier, Evans and Tran-Nam 2014).
In conclusion, compliance costs remain a major investment impediment for companies
both at the national level when complying with national rules, and at the international
level when deciding on cross-border investments. In the latter case, compliance becomes
even more costly since the rules of two countries have two be applied in addition to
international tax rules which have to be considered (double tax treaties).
The CCCTB could make two contributions. Firstly, it can reduce compliance costs
domestically since the system is easier and shorter than most national corporate income
tax laws. Secondly and discussed in more detail below, it offers substantial
improvements for companies which operate cross-border.
2. COMPANIES’ TAX COMPLIANCE COSTS
Changeover costs
Estimating tax related compliance costs presents a number of well-known
methodological difficulties. These are exacerbated when it comes to estimating costs
stemming from the adoption of a new system. That these costs can be substantial in some
cases is discussed by Eichfelder and Vaillancourt (2014) in the case of introduction of an
indirect tax in Australia. However, there is no evidence from the literature for setting up a
new CIT system. It should be emphasized that if the adoption of the new system were
made optional for firms, the decision process would most likely be based on a cost-
benefit analysis that will itself take time and resources. For companies for which the
CCCTB was mandatory, these specific costs were zero since a cost-benefit analysis was
obsolete. For companies which are in the mandatory scope of the CCCTB or which opt-
into the system, learning costs should be expected from the compliance to the new rules.
Table 33 reports the areas in which the surveyed multinationals expect costs from a
changeover to arise according to a PwC study conducted for the 2011 Impact
155 The summary of compliance cost issues in the annex 2 of the 2001 Communication on Tax obstacles
in the internal market provides a summary of the results of the Ruding survey as well as a discussion
of the literature available at the time.

132
Assessment. It should be noted that such costs will by definition be one-off costs, and
hence be outweighed by the savings in recurring outlays that companies face in dealing
with tax administrations.
Table 33: One-off costs expected to arise on a changeover from the current system
Type of cost % of respondents
Training staff 100.0%
Calculations to decide on whether to opt into CCCTB/CCTB 92.9%
Calculations to set up asset pool for tax depreciation under CCCTB/CCTB 85.7%
Development of new processes and systems 85.7%
Consulting/advisory fees 85.7%
Software license fees 64.3%
Other HR costs/relocation of staff 28.6%
Outsourcing compliance cost obligations 28.6%
Source: PricewaterhouseCoopers Survey on multinational firms.
Recurring compliance costs
Different methodologies have been used to quantify recurring compliance costs of the
CCCTB. In particular, different surveys have been carried out among firms as well as
among tax experts. The results of the PwC survey of 17 multinationals shows that the
respondents predict, on average, an increase of 4% in time spent overall for corporate
tax compliance activities in the event of a common base (see table 34). Although
somewhat puzzling, small increases are expected in the time spent on record keeping, on
the preparation of tax computation and on dealing with tax authorities. One reason for
this surprising result could be that respondents implicitly assumed that the new
legislation might lead to more exchanges and clarifications with tax administrations.
Also, in the case of a common base there remains the need to provide a tax declaration in
each Member State where the firm is active. In any case, the qualitative results show
strong belief that the introduction of a common base will have little or no impact. An
overwhelming majority of companies see the common base as equally burdensome
across all the categories covered.
Regarding the shift to a CCCTB system, participants to the survey predicted, on
average, a reduction of 8% in the time spent overall on corporate income tax
compliance activities. The main areas where time savings are expected refer to transfer
pricing documentation and to the preparation of tax computations. On the qualitative
side, the CCCTB option is deemed by the majority of the respondents less burdensome
than the current situation, with respect to the following areas: keeping up to date with
rules and regulations; single filing of the tax return and dealing with a single tax
authority; applying for clearances and rulings. The tasks of keeping records and dealing
with formulary apportionment are expected to be more burdensome. Altogether, the
qualitative picture confirms, on average, the quantitative estimation of an overall
decrease of time devoted to tax compliance activities in the event of a CCCTB.

133
Table 34: Average changes in compliance time when moving from the current situation to
CCTB and CCCTB
CCTB CCCTB
Record keeping 2% 1%
Transfer Pricing Documentation -1% -4%
Preparation of tax computations 1% -5%
Tax returns & payments 0% -1%
Dealing with the tax authorities 1% 2%
Mutual agreement procedures -1% -1%
Securing clearances and rulings 0% -1%
Learning and education 0% 0%
Total 4% -8%
Source: PricewaterhouseCoopers Survey on multinational firms.
Notes: Changes are expressed as a percentage change of the total time spent compared to the base case.
This data does not include the estimation of one-off variation due to the switching to another system. It relates
to the permanent time spent associated with the new definition of the taxable base.
The amount of compliance costs will depend on the wage level of employees in the different tax activities.
Switching the focus from existing companies to multinational enterprises that set up a
new subsidiary in a different Member States, significantly higher compliance time and
cost savings under the common base and most notably under the CCCTB regime can be
expected. Through expert assessment, Deloitte estimated that under a situation with
different tax codes in Member States, the additional recurrent compliance costs for a
large representative parent investing in a medium sized subsidiary amounts to 0.23% of
turnover, while for a medium parent this ratio more than doubles to 0.55% of turnover
(see table 3). These figures amount to roughly EUR 141,000 and 128,000 respectively,
calculated from the estimated compliance time.

Table 35: Compliance time and cost for setting up a new subsidiary
Large Parent
Current regime CCTB CCCTB
Time Cost Time % Diff. Cost % Diff. Time % Diff. Cost % Diff.
Record keeping for corporate tax purposes 5 261 3 740.60 3 063 -41.79% 2 992.46 -20.00% 3 592 -31.73% 5 708.94 52.62%
Transfer pricing documentation 22 255 36 165.74 22 162 -0.42% 36 143.08 -0.06% 0 -100.00% 0.00 -100.00%
Preparation of corporate tax computations 4 049 2 750.04 1 976 -51.19% 2 190.86 -20.33% 4 256 5.11% 4 761.47 73.14%
Prepayments for corporate tax 907 965.56 771 -14.99% 793.10 -17.86% 2 450 170.18% 2 662.13 175.71%
Corporate tax returns and payments 1 080 1 131.27 987 -8.58% 1 005.12 -11.15% 3 085 185.73% 3 505.17 209.84%
Dealing with the tax authorities for corporate tax 19 009 37 365.70 16 616 -12.59% 35,038.00 -6.23% 10 509 -44.71% 30 200.90 -19.17%
Mutual agreement procedures on transfer pricing 8 823 17 618.47 8 841 0.20% 17 677.73 0.34% 0 -100.00% 0.00 -100.00%
Clearances and rulings for corporate tax 14 430 34 912.77 14 541 0.77% 34,928.95 0.05% 1 288 -91.08% 3 996.90 -88.55%
Learning and education for corporate tax 10 000 5 220.08 8 264 -17.37% 5 388.20 3.22% 1 469 -85.31% 2 104.33 -59.69%
Any other cross-border corporate tax compliance formality 1 548 733.76 1 548 0.00% 733.02 -0.10% 0 -100.00% 0.00 -100.00%
Total estimated time spent/cost 87 362 140 603.97 78 768 -9.84% 136 890.52 -2.64% 26 649 -69.50% 52 939.85 -62.35%
Total estimated cost (% turnover) 0.23% 0.22% 0.09%

135
Table 35 (cont'd): Compliance time and cost for setting up a new subsidiary
Medium-sized Parent
Current regime CCTB CCCTB
Time Cost Time % Diff. Cost % Diff. Time % Diff. Cost % Diff.
Record keeping for corporate tax purposes 5 147 3 653.23 3 034 -41.05% 2 957.01 -19.06% 3 178 -38.26% 4 490.57 22.92%
Transfer pricing documentation 19 962 30 192.40 19 337 -3.13% 30 625.38 1.43% 0 -100.00% 0.00 -100.00%
Preparation of corporate tax computations 4 023 2 253.53 1 954 -51.42% 1 778.82 -21.07% 3 301 -17.94% 2 862.65 27.03%
Prepayments for corporate tax 896 636.81 760 -15.20% 524.54 -17.63% 1 880 109.73% 1 497.66 135.18%
Corporate tax returns and payments 1 075 871.48 987 -8.15% 790.31 -9.31% 2 433 126.34% 2 427.03 178.50%
Dealing with the tax authorities for corporate tax 18 686 32 968.18 16 347 -12.51% 30 604.60 -7.17% 10 675 -42.87% 24 889.54 -24.50%
Mutual agreement procedures on transfer pricing 8 609 17 076.44 8 434 -2.03% 17 115.31 0.23% 0 -100.00% 0.00 -100.00%
Clearances and rulings for corporate tax 13 893 34 175.02 14 083 1.37% 34 188.34 0.04% 1 266 -90.89% 3 958.48 -88.42%
Learning and education for corporate tax 9 997 5 201.14 8 422 -15.75% 5 579.09 7.27% 1 450 -85.49% 2 064.35 -60.31%
Any other cross-border corporate tax compliance formality 1 459 677.86 1 395 -4.42% 674.05 -0.56% 0 -100.00% 0.00 -100.00%
Total estimated time spent/cost 83 747 127 706.09 74 754 -10.74% 124 837.45 -2.25% 24 184 -71.12% 42 190.28 -66.96%
Total estimated cost (% turnover) 0.55% 0.54% 0.18%
Source: Deloitte Tax Experts survey.
Note: Time in minutes. Costs in Euros. Average of all investment flows

According to the study, the introduction of the CCTB would on average save
approximately 10% in compliance time and about 2.5% in compliance costs.156
This
difference can be explained by the fact that higher savings in time are related to internal
compliance activities (e.g. record keeping, preparation of tax computations, prepayments
and tax returns and payments) estimated as less expensive compared to external advisors.
Such savings are expected to occur because the CC(C)TB tax provisions are simpler and
more stable compared to the current frequently changing tax environment. However, the
main corporate compliance cost drivers are directly or indirectly related to transfer
pricing (transfer pricing documentation, clearances and rulings and mutual agreement
procedures), which account for about 60% of all compliance costs, remain unchanged
(see figure 1). Due to the elimination or reduction of transfer pricing related compliance
tasks, and of those related to contacts with tax authorities, an average decrease in total
compliance time of 70% can be expected if the additional cross-border investment is
made under the CCCTB regime.157
This results in a reduction of compliance costs of
62% for a group with a large parent and of 67% for a group with a medium-sized
parent.158
The corresponding monetary figures are about 53,000 and 42,000 Euros
respectively. The high savings linked to the abolition of transfer pricing and the sharp
reduction of costs in dealing with tax authorities are partly counterbalanced by other
activities: corporate tax computations, (pre)payments and tax returns will be most likely
centralized at the level of the principal tax payer, normally the parent company.159
However, all these tasks account only for about 10% of all compliance costs. All in all, as
the figures in table 35 suggest, the size of the parent seems to have only a minor impact
on total additional compliance time and costs savings under the CCTB and the CCCTB
regime.160
156 The individual investment flow results by country-pairs range between 4% to 16% savings in
additional compliance time and between -3% and 9% in compliance costs. 157 The individual results by country-pairs range between 11% to 91% savings in additional compliance
time. 158 Deloitte's tax experts expect that the group led by a medium parent can realise more savings on time
spent by external advisors that generally have higher costs per hour than the internal workforce. 159 The compliance time and cost savings would be even higher if it would be assumed that compliance
activities would be centralized at the level of the subsidiary ("CCCTB Sub lead"-scenario) operating in
a low wage country, rather than at the level of the EU parent ("CCCTB Parent lead"-scenario). 160 The results are fairly robust with respect to the sensitivity analysis performed. First, it is assumed that
the parent company and the subsidiary belong to different sectors. This would depict a situation in
which the central taxpayer lacks sector-specific and tax-related knowledge for its subsidiary. The
assumption has no impact on compliance time under the current regime and the common base,
whereas under the CCCTB regime an increase of 8% of compliance time can be expected.
Accordingly, the savings of compliance time and cost compared to the current situation would slightly
diminish to 65% and 50 % respectively. Second, if the investing company would be only a single
company without intra-group transactions significant lower compliance time can be expected for the
current regime and the common base whereas for the CCCTB, without the transfer pricing related task,
compliance time remains the same compared to the baseline investment. Again, in this case the savings
due to the CCCTB compared to the current regime would be smaller than in the baseline scenario.

137
Figure 23: Compliance time spent on setting up a new subsidiary
Source: Deloitte Tax Experts Survey
3. TAX ADMINISTRATIONS
Measuring the cost of tax administrations for levying a specific tax is a very difficult task
and has become even more difficult in recent years. The reason is that most tax
administrations (and the corresponding IT systems) are organised by functions and not
any more by type of tax. While there have been some attempts to calculate the front
office costs for single tax, these efforts led to limited information since back office
functions and costs (namely audit and debt collection) are estimated globally, and then
apportioned according to the share of each tax in the total revenue, or to the audit or
enforcement yield. In the context of the discussion here, this means that there is no
readily available data on the direct impact on tax administrations. In the following, we
elaborate on some qualitative arguments related to an introduction of a CCCTB and its
impact on tax administrations.
A move to any of the alternative policy options from the current situation will entail
some new costs for Member States' tax administrations. These costs include: the need for
coordination with other administrations (for example, in the application of double
taxation relief methods) and one-off costs like the need of personal training, upgrading of
IT systems, etc. Some of the alternative systems may save some of the current costs
which tax administrations incur, such as the costs of resolving intra-EU transfer-pricing
disputes or the general costs of monitoring transfer-price setting by companies (these
costs would be saved only by a CCCTB, but would remain in place under the common
base, since it would still operate under separate accounting). In case of optional policy
alternatives, the costs associated with maintaining two different systems simultaneously
should be estimated. These costs would be saved in the compulsory versions of the
CCCTB, where this alternative tax scheme would replace all current national corporate
tax systems.
Compliance time spent on setting up a new subsidiary
- Large parent, average of all countries investigated -Thousands of minutes
0
10
20
30
40
50
60
70
80
90
100
Current CCTB CCCTB
TP MUTUAL AGRREEMENTPROCEDURES
TP DOCUMENTATION
CLEARANCES AND RULINGS
LEARNING AND EDUCATION
DEALING WITH TAX AUTHORITIES
RECORD KEEPING
PREPARATION OF COMPUTATIONS
PREPAYMENTS
TAX RETURNS AND PAYMENTS
ANY OTHER

138
The parallel application of national CIT systems and the CCCTB will increase
administrative burden in tax administrations since two, albeit similar taxes need to be
managed. However, since multinational companies under the scope of the CCCTB will
only file one tax declaration in the EU, the total amount of tax declarations should
decline and ease the burden for tax administrations. Also, the fact that no more transfer
pricing documentation is necessary in the EU will reduce the burden on administrations.
The compliance costs for companies will decline for those cases where cross-border
investments are involved – partly because of the abolition of transfer pricing
documentation, more generally because there is only one set of rules to comply with.
Given the fact that the CCCTB is more streamlined than national systems, one could
expect that also domestic compliance costs are reduced. In any case, the choice to enter
the CCCTB will reflect compliance cost considerations, both for domestic firms and for
MNEs not subject to mandatory application. Generally, data on these questions are scarce
or in some cases missing.

139
Annex VIII: The 2011 Proposal for a CCCTB
1. TAX OBSTACLES IN THE SINGLE MARKET AND THE 2011 PROPOSAL FOR A CCCTB
While the integration of markets has made substantial progress in recent decades, the
same cannot be said for the taxation of income from pan-EU activities, which remains
largely a national task. This can lead to frictions in the single market due to tax obstacles
and has been recognized as a concern early in the European integration process.
The primary focus was on preventing problems which could hamper the development of
the single market, such as double taxation and tax discrimination. The Commission has
highlighted the issues and challenges of corporate tax systems in an Economic Union as
well as their role for competitiveness vis-à-vis third countries for many decades.
Proposals for reforming corporate taxation have been discussed in the European Union
since at least 1962 when the Neumark Committee called to gradually harmonize tax
systems in Europe. It was followed by the 1970 van den Tempel report and the 1992
Ruding report. In 1998 the Code of Conduct for business taxation was established to
limit harmful tax competition and identify specific tax regimes considered harmful. In the
same year, rules on the application of the State Aid rules to measures relating to direct
business taxation were published by the Commission. In 2001, the Commission
presented a Communication identifying concrete steps to eliminate tax obstacles to cross-
border trade in the EU. This was followed by ten years of technical preparation,
culminating in the Commission's 2011 proposal for a CCCTB.161
On 16 March 2011, the Commission tabled a proposal for a directive on a CCCTB which
lays down common rules for the calculation of the tax base applicable to companies
operating in the EU. This EU tax framework comprises a full set of corporate tax rules to
calculate the individual fiscal results of companies and permanent establishments which
are tax resident, or situated, in the EU. The system includes rules for consolidating those
results (profits and losses) when there are other group members and to apportion the
consolidated tax base to all relevant Member States if it is positive. In other words, a
qualifying company or group of companies would have to comply with only one set of
rules for computing its taxable income, rather than different rules in each Member State
where it operates. The consolidated tax base would be apportioned on the basis of a fixed
formula comprising three equally weighted factors: sales (by destination), labour and
assets. Each Member State would apply its own tax rate to the share of the tax base
apportioned through the formula. Only the calculation and apportionment of the tax base
would be harmonised. Member States would retain the power to set their own tax rates.
In 2011, the CCCTB was proposed as an optional system. All companies, irrespective of
size or whether they had cross-border operations, would be entitled, but not obliged, to
apply the system, provided that they fulfilled the eligibility requirements of the Directive.
A company which opted for the CCCTB would be committed to apply the system for an
initial term of five years. This would automatically be extended for successive periods of
three years unless a company applying the system as a single taxpayer or a group, as the
case may be, filed a notice of termination in the three months before a period of
applicability expired.
161 In addition, several academic reports called for more harmonisation in the field of corporate taxation.
See e.g. Klemm and Radaelli (2001) or Spengel and Zöllkau (2012) for two prominent contributions to
the debate.

140
The proposal also includes anti-abuse rules and stipulates how Member States should
administer the CCCTB under a 'one-stop-shop' approach.
In 2011, the CCCTB was primarily envisaged as a tool for removing tax obstacles which
companies occasionally suffer when they operate cross-border within the Internal
Market. Companies would thus benefit from cross-border loss relief, which is an
automatic outcome of consolidation (i.e. no more paying tax on profits in one Member
State to the extent that unrelieved losses are being made at the same time in another
Member State). The apportionment of the tax base through a formula would remove the
requirement for lengthy and costly recording and negotiating of intra-group transactions
at notional arm's length prices (i.e. no more transfer pricing within a CCCTB group).
Accordingly, compliance costs would be reduced by providing for a single set of tax
rules for calculating the tax base, instead of the 27 at the time. Having a common set of
rules would also reduce the possibility of double taxation or double non taxation and
mismatches in general.
2. WORK ON THE CCCTB PROPOSAL DURING 2011-2016
Intensive technical discussions and an article-by-article detailed analysis amongst
national experts in Council followed tabling the proposal for a CCCTB. After a first
reading was completed, the High Level Working Party (HLWP) agreed in March 2013
that work on the proposal should be structured as a step-by-step approach and Member
States should prioritise the matters related to the tax base. Accordingly, consolidation
would have to be addressed in a second step once the work on the base would have been
sufficiently advanced. At the time, Member States also stated that the proposal was not
yet ready for a political discussion. The Presidency was invited to draft a compromise
text on that basis.
After technical work on the elements of the tax base (i.e. skeleton - main computations,
timing and quantification, depreciation, treatment of losses) was accomplished under the
subsequent Presidencies (i.e. Lithuania & Greece), the Italian Presidency shifted its
attention towards highlighting the link between the CCCTB and the OECD initiative
against Base Erosion and Profit Shifting (BEPS). In this framework, discussions focussed
on the international aspects of the tax base as well as certain elements of the CCCTB
system, such as controlled foreign company (CFC) legislation and the interest limitation
rule (first inserted in a compromise text by the Presidency of Denmark). Both are closely
linked to the OECD BEPS work.
At the informal ECOFIN of October 2014, the Council discussed how to make concrete
progress on the CCCTB in the short to medium term. As outcome of this debate, the
Presidency concluded that future work on the CCCTB proposal should primarily be
centred on the international aspects of the system (in particular, Controlled Foreign
Company legislation and anti-abuse measures, hybrid mismatches, the interest limitation
rule and a definition of permanent establishment).
In the wake of the publication of the OECD BEPS action plan conclusions in October
2015, the Luxembourg Presidency resumed the in-depth technical examination of the
international and anti-abuse aspects of the CCCTB, with the aim to facilitate a
coordinated implementation of the OECD recommendations in the EU. In the meantime,
the Commission's action plan on Corporate Taxation of June 2015 had already
announced a comprehensive re-launch of the CCCTB proposal in 2016. In line with its
EU BEPS roadmap, the Presidency launched a discussion on the opportunity of splitting

141
the CCCTB proposal, in order to attempt a speedy adoption of the BEPS related and
international aspects. In July 2015, most delegations supported such a split and suggested
that the "anti-BEPS directive" address both third countries and intra-EU situations. At the
following technical meetings in Council, the Presidency brought further clarifications as
to how such EU legislation could materialise more concretely. In this context, the
Presidency reflected BEPS related issues which had already been subject to technical
examination into a consolidated text of the prospective “anti-BEP ” directive.
On 28th
January 2016 and while work on the re-launched CCCTB proposal was
progressing, the Commission tabled a proposal for a directive against tax avoidance
practices. As a matter of fact, the proposed instrument included most of the elements of
the international and BEPS related aspects of the CCCTB in an effort to lay down a
coordinated approach to implementing certain common minimum standards against tax
avoidance in the EU.
3. THE IMPACT ASSESSMENT FOR THE 2011 PROPOSAL
The analysis underlying key features of the 2011 proposal was based on many years of
work and input from within the Commission, external contractors and Member States
(CCCTB Working Group) as well as other stakeholders (including academia, tax
administrations, business and professional associations, think tanks). The CCCTB
Working Group was created in 2004 and held its last meeting in October 2010. The
group produced 68 papers and summary records of their meetings, all published on a
dedicated DG TAXUD website.162
Compliance costs
The main findings from the analysis were that firms' tax compliance costs are high and
significant, mostly due to frequent changes and complexity of tax laws, and that they are
regressive: The estimate for large companies is about 2% of taxes paid, while for small
and medium sized enterprises (SMEs) the figure is about 30% of taxes paid. Compliance
costs increase with cross-border activity and with increasing number of subsidiaries, have
not reduced over time and in particular the transfer pricing compliance burden has
increased over time.
For tax administrations, the 2011 Impact Assessment anticipated that they would benefit
mainly from saving costs in relation to transfer pricing (monitoring, dispute resolution).
At the same time there would be an additional cost for maintaining two systems in
parallel (Annex 9 of the 2011 Impact Assessment). For companies, optionality would
require a decision whether to opt into the system, but arriving at the optimal decision
entails a cost-benefit analysis, which takes resources. Focussing on recurring costs, i.e.
ignoring one-off switching costs, an increase in time spent on compliance activities by
4% was expected for the CCTB and a decrease by 8% for the CCCTB. Time costs for
setting up a new subsidiary in a Member State were estimated to decrease by 10-11% for
the CCTB and 62-67% for the CCCTB.
162 http://ec.europa.eu/taxation_customs/taxation/company_tax/common_tax_base/index_en.htm

142
Other tax obstacles in the single market
These obstacles mainly referred to 'over-taxation' and double taxation. Over-taxation
occurs whenever cross-border activities lead to tax liabilities that would not have
occurred in a domestic context. Based on the public consultation conducted for the 2011
Impact Assessment, double taxation occurs mainly in the context of cross-border
business restructurings or due to different tax treatments of transfer prices in different
Member States. Another source for double taxation is heterogeneity in double taxation
treaties and their interpretation. The increased number of requests received under the EU
Arbitration Convention between 2004 and 2008, along with the unresolved pending
cases, has also been seen as evidencing continued problems in the area of transfer
pricing.
Since only a few Member States offer limited forms of cross-border loss compensation,
groups operating cross-border have substantially fewer possibilities to offset losses
compared to domestic groups in most Member States (some do not provide any kind of
loss relief). Moreover, the limited or non-existing cross-border loss offset implies
differences in tax treatment of foreign permanent establishments and foreign subsidiaries.
The 2011 Impact Assessment notes "several further potentially important economic
effects of (cross-border) loss compensation: (i) improved neutrality between domestic
and cross-border investment; (ii) reduced risk of investment, as losses are better insured
(Domar-Musgrave effect), which may stimulate risk-taking and raise returns to capital in
the economy; (iii) increased efficiency in the international allocation of productive
capital; (iv) enhanced investment ability from financially constrained firms following
higher after-tax profits". Based on this, it was concluded that consolidation would be apt
to reducing over-taxation of cross-border economic activities and thereby improve
efficiency in the internal market. The quantitative analysis found that in a given year 50%
of non-financial and 17% of financial multinational groups could benefit from immediate
cross-border loss offset, leading to additional losses as a share of net current taxable
profits of 3% for the average non-financial group and 2.5% for the average financial
group. A PWC case study with 13 multinational companies found substantially higher
figures. The Computable General Equilibrium model used to simulate the reform pointed
to an a priori reduction of 15% in the corporate tax base and in the new equilibrium,
where the reform is designed in a budget neutral way, of about 4.5%.
Formula apportionment
The 2011 Impact Assessment concluded to allocate the consolidated tax base to a 'group
member A' according to the following formula:
Share A = 1
3
+
1
3 1
2+
+1
2
+
1
3
.
∗ ′
Aside from the extensive work by the CCCTB Working Group and consultations with
stakeholders, three specific pieces of analysis were included in the Impact Assessment in
order to compare the impact of different formulas: (i) a PWC survey of multinational
entities on compliance costs: (ii) impact of variations in the formula on the distribution of
tax bases across countries, using the Amadeus and ORBIS databases; and (iii) the
CORTAX study, which examined formula apportionment within the context of a wider
analysis aiming to quantify the impacts of alternative policy options. The formula was
evaluated against four criteria: 1. Simplicity for taxpayers and administrations; 2.

143
Difficult to manipulate, i.e. no easy relocation of factors to exploit tax-rate differentials
across the EU; 3. Fair and equitable distribution of the tax base; 4. No negative impact on
tax competition. More details on the rationale for the formula that was chosen can be
found in Annex V: Formula apportionment.
Depreciation regime
Based on work by the CCCTB Working Group, it was decided that fixed assets would be
depreciable for tax purposes with the exception of financial assets and those tangible
assets not subject to wear and tear and obsolescence. Fixed assets are all tangibles, those
intangibles acquired for a value where they are capable of being valued independently
and are used in the business in the production, maintenance or securing of income for
more than 12 months. The concept also includes financial assets (although these are
excluded from depreciation) but not assets of a small value (i.e. where the cost of their
acquisition, construction or improvement is less than EUR 1 000). Depreciable long-life
(at least 15 years) tangible and intangible fixed assets would be depreciated individually.
Remaining assets would go into a pool, which should simplify matters for both tax
authorities and taxpayers since it avoids the need to establish and maintain a list of every
single type of fixed asset and its useful life. Regarding the generosity level of the
depreciation allowances, the CORTAX simulations showed that the results improved
with increasing generosity of depreciation allowances. Accordingly, from the two options
on the depreciation regime for the pooled assets that were examined, the more generous
one was chosen.
Economic impacts
As for the present impact assessment, the economy-wide impacts were analysed based on
CORTAX simulations (Box 1 explains the features for the updated version of the model
used in this impact assessment). The CCTB and CCCTB were assessed, with two
variations on the scope (optional for all firms or compulsory for all firms) and three
variations on the depreciation regime. Since the CORTAX model cannot reasonably
capture the opt-in choice, it was assumed that all multinational entities would opt for the
CCCTB. The conclusion drawn based on the simulations was that the CCCTB was
preferable to the CCTB due to slightly better impacts on welfare. The conclusion on the
scope hinged on the depreciation regime. Under a base broadening reform (i.e. stricter
depreciation regime than in the baseline), it was better to make the CCCTB optional,
whereas a compulsory application was better with a more generous depreciation regime.
Preferred option in the 2011 Impact Assessment
The CCCTB was chosen over the CCTB, based on the CORTAX results and the
CCCTB's clearly superior results in terms of compliance cost savings and reduction in
other tax obstacles. Moreover, since only base broadening reforms were seriously
considered based on input from the CCCTB WG, the preferred option was the one that
would make the CCCTB optional for all firms. It should be kept in mind though that in
terms of economic impacts this corresponded to the scenario in which all multinational
entities applied the CCCTB.

144
Annex IX: Impact of the CCCTB on intra-group profit shifting
Table 36: Impact of the CCCTB on intra-group profit shifting
Member State Baseline CCCTB Change
Outward Inward Outward Inward Outward Inward
AT -0.3% 2.6% 0.0% 0.2% -100.0% -91.8%
BE -9.0% 2.9% 0.0% 1.5% -100.0% -50.1%
DK -0.3% 4.4% 0.0% 0.9% -100.0% -78.3%
FI 0.0% 2.9% 0.0% 0.4% -100.0% -86.9%
FR -7.7% 0.1% 0.0% 0.7% -100.0% 720.4%
DE -1.1% 0.7% 0.0% 0.2% -100.0% -74.1%
EL -0.2% 1.4% 0.0% 0.3% -100.0% -80.5%
HR -0.2% 11.6% 0.0% 0.2% -100.0% -98.0%
IE 0.0% 16.5% 0.0% 0.8% n/a -95.1%
IT -1.5% 0.9% 0.0% 0.3% -100.0% -70.2%
LU -1.8% 8.6% 0.0% 2.2% -100.0% -74.0%
NL -0.7% 11.1% 0.0% 1.9% -100.0% -82.9%
PT -1.0% 1.8% 0.0% 0.2% -100.0% -90.9%
ES -2.5% 0.1% 0.0% 0.0% -100.0% -78.8%
SE -1.1% 3.2% 0.0% 1.6% -100.0% -49.1%
UK -0.1% 6.1% 0.0% 0.3% -100.0% -95.3%
CY 0.0% 10.0% 0.0% 2.1% n/a -78.7%
CZ 0.0% 3.5% 0.0% 0.2% -100.0% -94.4%
EE -1.1% 4.7% 0.0% 0.4% -100.0% -90.7%
HU 0.0% 4.1% 0.0% 0.8% -100.0% -81.2%
LV -0.1% 4.9% 0.0% 0.3% -100.0% -94.6%
LT 0.0% 3.6% 0.0% 0.1% -100.0% -97.9%
MT -5.0% 0.0% 0.0% 0.0% -100.0% -98.3%
PL 0.0% 2.2% 0.0% 0.1% -100.0% -97.3%
SK -0.1% 4.5% 0.0% 0.1% -100.0% -96.8%
SL 0.0% 4.9% 0.0% 0.0% -100.0% -99.2%
BG 0.0% 4.6% 0.0% 0.2% n/a -96.2%
RO 0.0% 2.7% 0.0% 0.1% -100.0% -96.2%
Average* EU-28 -1.5% 5.5% 0.0% 1.0% -100% -82.2%
Source: Joint Research Centre of the European Commission (2016)
Notes: The values indicate changes in percent to the theoretical tax base without intra-group profit shifting. Take for
example Italy and assume it had a corporate income tax base amounting to 100 in the theoretical case where
profit shifting via transfer pricing would not be feasible for multinational entities. The baseline results
indicate that allowing for profit shifting via transfer pricing would lead to the new tax base of 100-
1.5+0.9=99.4. In other words, in the baseline scenario, Italy loses 1.5% of its corporate tax base due to
multinational entities shifting profits to other countries and gains 0.9% of its tax base due to multinational
entities shifting profits to Italy. Under the CCCTB, profits would no longer be shifted to other countries as it
would not reduce tax liabilities (i.e. outward equals zero). There remains a small inward shift of 0.3% which
is profits shifted to Italy from the US and Japan. *Average refers to the weighted EU average of the individual
country values.

145
Annex X: Measuring the cost of capital and effective average tax rates
This impact assessment uses analysis of the existing differences in effective corporate
tax rates within the EU. The aim is to detect possible tax induced distortions to the
allocation of resources in both domestic and international investments in a theoretical
framework which allows country comparisons. The analysis of the impact of taxation on
investment behaviour requires forward-looking indicators which include a large
majority of the relevant tax provisions relevant for corporate investment.
The annual report on effective tax levels in the EU carried out by the ZEW applies a
forward-looking approach originally developed by Devereux and Griffith (1998a,
1998b) and provides a comprehensive analysis of the effects of tax legislation on
investments for all 28 EU Member States and selected third countries.
The basic approach is to consider a hypothetical incremental investment located in a
specific country that is undertaken by a company resident in the same country or in
another country. Two tax measures are computed: the cost of capital and the effective
average tax rate. The cost of capital measures the required minimum pre-tax return of a
real investment (the 'marginal investment') to achieve the same after-tax return as a safe
investment in the capital market. The standard assumption by the ZEW for the real
return on the safe investment is 5%. The lower the cost of capital the more investments
are undertaken. If the cost of capital is exactly equal to the return from a safe
investment, the tax system does not distort the scale of investments. This approach is
based on the presumption that firms undertake all investment projects that earns at least
the required rate of return.
A complementary approach is to consider discrete choices for profitable investments
and in particular discrete location choices. The effective average tax rate measures the
relative difference between a fixed rate of pre-tax return of a profitable investment (the
standard assumption by the model is 20%) and its after-tax return.163
The effective
average tax rate is thus a measure of the attractiveness of a tax system.
In both cases, the hypothetical investment takes place in one period and generates a
return in the next period. The impact of taxation is analysed by considering a number of
features of the tax system, including the statutory tax rate, capital allowances, the
treatment of interest deduction, the allowance for corporate equity, the treatment of
foreign source income, wealth taxes paid by the company, as well as possibly the
treatment at the corporate and personal level of dividends paid by the company, and
wealth and capital gains taxes at the personal level.164
Both the cost of capital and the effective average tax rate are computed for five different
types of assets (intangibles, buildings, machinery, financial assets, inventory) and three
different sources of financing (retained earnings, new equity, debt). Further, both
measures are computed for the corporate level and the shareholder level, considering
three different types (zero-rate, top-rate non-qualified and top-rate qualified
shareholder) and can thereby be used to compare the relative distortions introduced by
the tax system in relation to certain investments or financing sources both at the
corporate level and shareholder level.
163 The effective average tax rate equals the effective marginal tax rate if the profitability is equal to the
cost of capital. 164 It is assumed that the tax system remains unchanged over the life of the investment.

146
In presenting averages over different forms of assets, these assets are weighted equally,
while unequal weights are used for financing: retained earnings 55%, new equity 10%
and debt 35% (based on OECD, 1991). As for true economic depreciation rates it is
assumed: intangibles (15.35%), industrial buildings (3.1%); machinery (17.5%),
financial assets (0%), and inventories (0%).
In the context of this Impact Assessment, two studies using the methodology described
above were produced by the ZEW. The first report analyses the impact of debt-bias
reforms on the cost of capital and effective average tax rates as well as the
consequences of a revenue neutral implementation. Four debt-bias reforms are
considered: a no interest deductibility (Comprehensive Business Income Tax, CBIT),
Allowance for Corporate Equity (ACE), Allowance for Corporate Capital (ACC), Cost
of Capital Allowance (CoCA).
A second report analyses the impact of certain tax planning strategies on tax burden
measures. The tax planning strategies considered involve profit shifting via cross-border
structures generally available to multinational corporations. Profit shifting channels
from high-tax to low-tax countries cover intra-group debt shifting, royalty payments and
the use of hybrid instruments.

147
Annex XI: Existence and design of R&D tax incentives in the EU
Table 37: R&D Incentives by EU Member States
Country
Type of R&D tax incentive Type of Tax
Expense-based Input-based
Tax credits Enhanced
allowance
Accelerated
depre-
ciation
Existing
expense-
based
incentive
Patent Box
Corporate
income
tax
Personal
income tax
Wage tax /
SSCs
BE X X X X X X
X
BG X
X X
X
CZ X* X
X
X
DK X X X X
X
DE
EE
IE X
X X X
EL
X
X X X
ES X
X X X
FR X
X X X X X
HR
X
X
X
IT X
X X X X
CY
X
X X X
LV
X X X
X
LT
X X X
X
LU
X X X X
HU
X
X X X
X
MT X
X X X
NL X X
X X X X X
AT X
X
X X X
PL X* X X X
X X
PT X
X X X
RO
X X X
X
SI
X X X
X X
SK
X
X
X
FI
SE X
X
X
UK X X X X X X
EU 15 15 10 24 13 24 6 7
Norway X
X
X
Canada X
X X
X X X
US X
X X
X
Israel X* X X X
X
Japan X X X X
X
Source: CPB(2014)
Notes: The temporary scheme in Finland has expired. Ireland has introduced a knowledge box.
*: Reduced corporate tax rate.
SSCs stands for social security contributions.

148
Table 38: Reduction in the effective tax burden from R&D tax incentives across firm size
Firm Size Effective tax burden reduction from R&D tax incentives Effective tax burden
reduction from combination
of SME incentives and R&D
incentives
Large From less than -1% (Luxembourg) to -20% (Lithuania).
[Reduction in 15 countries among 20 countries considered]
Not applicable
Tax base incentives
From -0.2% (France) to -20%
(Lithuania)
[Reduction in 14 countries
among 20 countries
considered]
Tax liability incentives
From -3% (The Netherlands) to -
6% (Ireland)
[Reduction in 7 countries among
20 countries considered
Medium From less than -1% (Luxembourg)
to -25% (Ireland).
[Reduction in 16 countries among 20 countries considered]
From less than -1%
(Luxembourg)
to -25% (Ireland).
Small From less than -1% (Luxembourg)
to -22% (Ireland).
[Reduction in 16 countries among 20 countries considered]
From less than -1%
(Luxembourg)
to -33% (Ireland).
Source: VVA and ZEW (2015)

149
Annex XII: The impact on tax revenues
Baseline vs CCCTB using CORTAX
The CORTAX simulations allow for some stylised insights on the impact on tax
revenues. Interpretation of these values should however be done with caution as a
number of factors impact on revenues. First, the calibration of the model tries to replicate
the baseline corporate tax bases for each Member State and, while this is done in the best
possible way to capture the EU-28 values, there remain some differences between the
actual and the simulated tax base for some Member States. Moreover and importantly,
the model makes the hypothesis that governments change ex-ante (that is before the
behavioural impact is taken into account) the corporate income tax rate for the CCCTB in
order to compensate for differences in the rules to compute the corporate tax base. This is
a technical – and necessary for model closure – assumption. In reality national
governments would be free to adjust tax rates in other ways. Overall, Table 39 shows the
impact on tax revenues for individual Member States and for the EU-28 as a whole.165
The results are difficult to interpret, for a number of reasons that are discussed below.
More importantly, there is a downward bias as they capture only in a limited manner the
positive impact on revenues due to the expected reduction in corporate tax avoidance.
Notably, the model does not cover the positive impact from the effective elimination in
the CCCTB of the use of patent boxes, the exploitation of hybrid mismatches and profit
shifting via intra-group debt shifts. Under the assumptions of the model, corporate tax
revenues are expected to decline by 0.27% of GDP. The largest decrease would amount
to 1% of GDP for Luxembourg, whereas at the other extreme corporate income tax
revenues would increase by 0.19% of GDP in Croatia. The impact on overall tax
revenues in the EU-28 is considerably smaller as losses in corporate tax collection are
partly compensated for by a higher collection of labour taxes driven by the positive
impacts on employment and wages. They decrease by 0.08% of GDP, ranging from a
decrease of -0.95% of GDP in Luxembourg to an increase of 0.29% of GDP in Croatia.
Individual results are subject to large caveats. Changes in corporate tax revenues are
influenced in many different ways in the model and most impacts are not uniform across
countries: (1) The CCCTB changes the depreciation rules. For some countries this means
a decrease in the tax base, for others it implies an increase. (2) Corporate income tax
rates are adjusted ex-ante to compensate for the changes in the base computation. (3)
Profit shifting via transfer pricing within the EU is no longer beneficial. This impact goes
in different directions for different Member States. The model tends to underestimate this
effect. (4) Consolidation of profits and losses within a company group tends to reduce the
overall tax base. (5) Formula apportionment distributes the tax base differently across
Member States compared to the existing separate accounting system. In addition, both
corporate income tax revenues and other tax revenues are impacted by the predicted
macroeconomic changes, notably with respect to GDP and labour market outcomes.
Due to the assumed adjustment in corporate income tax (CIT) rates and the many
different interactions of different impacts, the change in tax revenues is difficult to
predict for each individual Member State.
165 The impact from introducing the Allowance for growth and investment and the R&D tax incentives are
treated separately because the CORTAX model does not replicate the fact that an Allowance for
Growth and Investment is less generous than a full-fledged ACE and it does not cover the R&D tax
incentives.
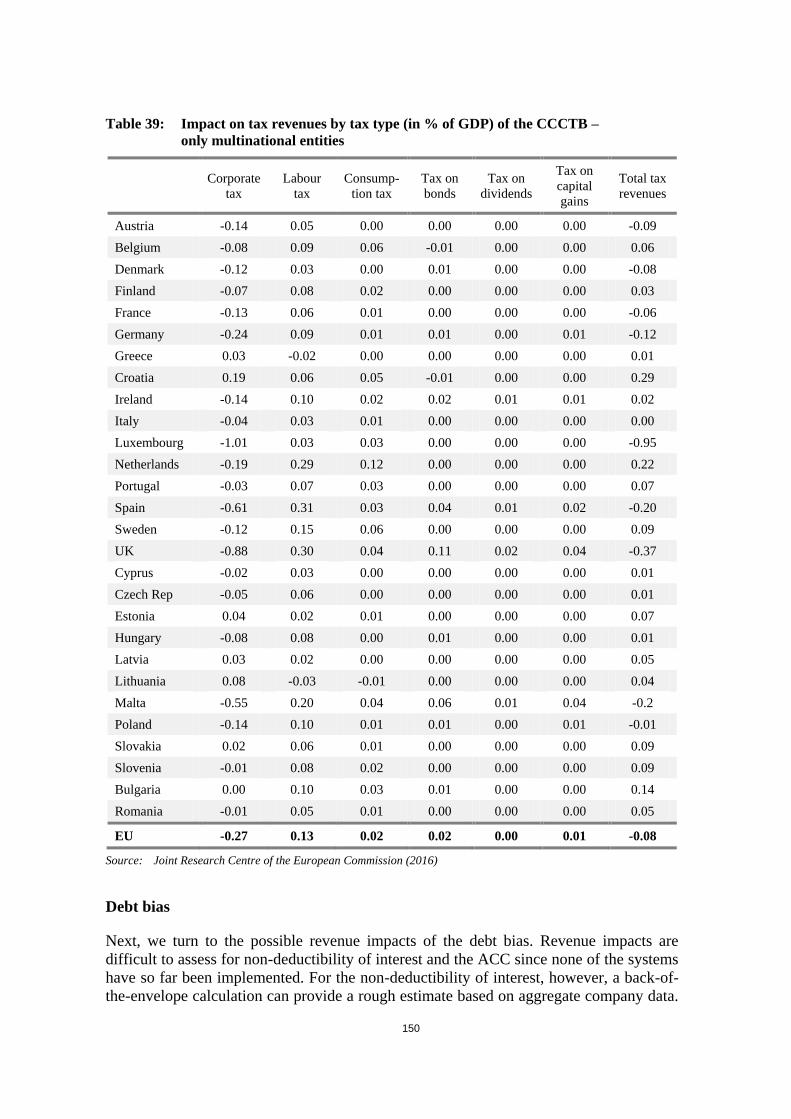
150
Table 39: Impact on tax revenues by tax type (in % of GDP) of the CCCTB –
only multinational entities
Corporate
tax
Labour
tax
Consump-
tion tax
Tax on
bonds
Tax on
dividends
Tax on
capital
gains
Total tax
revenues
Austria -0.14 0.05 0.00 0.00 0.00 0.00 -0.09
Belgium -0.08 0.09 0.06 -0.01 0.00 0.00 0.06
Denmark -0.12 0.03 0.00 0.01 0.00 0.00 -0.08
Finland -0.07 0.08 0.02 0.00 0.00 0.00 0.03
France -0.13 0.06 0.01 0.00 0.00 0.00 -0.06
Germany -0.24 0.09 0.01 0.01 0.00 0.01 -0.12
Greece 0.03 -0.02 0.00 0.00 0.00 0.00 0.01
Croatia 0.19 0.06 0.05 -0.01 0.00 0.00 0.29
Ireland -0.14 0.10 0.02 0.02 0.01 0.01 0.02
Italy -0.04 0.03 0.01 0.00 0.00 0.00 0.00
Luxembourg -1.01 0.03 0.03 0.00 0.00 0.00 -0.95
Netherlands -0.19 0.29 0.12 0.00 0.00 0.00 0.22
Portugal -0.03 0.07 0.03 0.00 0.00 0.00 0.07
Spain -0.61 0.31 0.03 0.04 0.01 0.02 -0.20
Sweden -0.12 0.15 0.06 0.00 0.00 0.00 0.09
UK -0.88 0.30 0.04 0.11 0.02 0.04 -0.37
Cyprus -0.02 0.03 0.00 0.00 0.00 0.00 0.01
Czech Rep -0.05 0.06 0.00 0.00 0.00 0.00 0.01
Estonia 0.04 0.02 0.01 0.00 0.00 0.00 0.07
Hungary -0.08 0.08 0.00 0.01 0.00 0.00 0.01
Latvia 0.03 0.02 0.00 0.00 0.00 0.00 0.05
Lithuania 0.08 -0.03 -0.01 0.00 0.00 0.00 0.04
Malta -0.55 0.20 0.04 0.06 0.01 0.04 -0.2
Poland -0.14 0.10 0.01 0.01 0.00 0.01 -0.01
Slovakia 0.02 0.06 0.01 0.00 0.00 0.00 0.09
Slovenia -0.01 0.08 0.02 0.00 0.00 0.00 0.09
Bulgaria 0.00 0.10 0.03 0.01 0.00 0.00 0.14
Romania -0.01 0.05 0.01 0.00 0.00 0.00 0.05
EU -0.27 0.13 0.02 0.02 0.00 0.01 -0.08
Source: Joint Research Centre of the European Commission (2016)
Debt bias
Next, we turn to the possible revenue impacts of the debt bias. Revenue impacts are
difficult to assess for non-deductibility of interest and the ACC since none of the systems
have so far been implemented. For the non-deductibility of interest, however, a back-of-
the-envelope calculation can provide a rough estimate based on aggregate company data.

151
Table 40 shows that interest on financial debt represents a sizeable share of profit before
tax. Column (6) shows that values vary between about 15 and 40% of profit before tax.166
Assuming that the non-deductible amount would be taxed at the same average rate as the
other profits, the results suggest an increase in corporate income tax collected of between
0.4 and 1% of GDP. Obviously, this result needs to be taken with extreme caution as it is
based on strong stylised assumptions and does not take into account the reaction of
businesses in terms of substitution, relocation and/or bankruptcy.
Table 40: Potential revenue impact of non-deductibility in selected countries (2014)
(1) (2) (3) (4) (5) (6) (7) (8)
Country Interest on
financial
debt
(% total
assets)
Tax on
profit
(% total
assets)
Net P&L
(% total
assets)
Profit
before tax
(% total
assets)
Profit
before tax
and
interest
(% total
assets)
Interest on
financial
debt
(% of
profit
before tax)
CIT
collected
(% GDP)
Potential
increase
in CIT
(% GDP)
=(2)+(3) =(4)+(1) =(1)/(4) =(7)*(1+6)
BE 2.17 1.10 4.03 5.13 7.30 42.30 3.19 1.35
CZ 0.80 0.90 4.20 5.10 5.90 15.69 3.38 0.53
DE 1.84 1.19 3.01 4.20 6.04 43.81 2.44 1.07
ES 2.41 0.36 6.28 6.64 9.05 36.30 2.44 0.88
FR 1.44 0.86 3.89 4.75 6.19 30.32 2.71 0.82
NL 2.39 1.10 14.51 15.61 18.00 15.31 2.58 0.39
PL 0.88 0.64 3.81 4.45 5.33 19.78 1.75 0.35
PT 2.89 1.21 1.36 2.57 5.46 112.45 2.84 3.20
Source: European Commission and BACH (Bank for the Accounts of Companies Harmonised)
Regarding the revenue impact of the ACE, de Mooij (2012, pp. 506-507) estimates the
potential effect for 14 OECD countries assuming an average notional rate of 4%, and
finds a potential decrease in the tax base by 14.1% and in tax collection by 0.49% of
GDP. Zangari (2014, pp. 17-20) discusses the budgetary impact of the Belgian ACE in
some details. He recalls the negative impact of the stock-based approach and of the
imperfect anti-avoidance framework on tax collection on the tax collection in Belgium.
He finds that for the period 2009-2011, the revenue losses of the ACE represent about a
third of CIT collected. However, as the author points to, this figure represents a gross
loss, which does not take into account the fact that companies have substituted debt for
equity, hence leading to lower deductible interest. He estimates that the revenue cost
needs to be corrected down by about between 5 and 15% due to lower deductible interest.
The National Bank of Belgium (2008) puts this correction at about a third of the gross
revenue loss in 2006. The example of Belgium may represent an extreme case because of
its specific design.
A closer look at the evolution of CIT collection in the Member States that have
implemented an ACE (Austria, Belgium, Latvia, Italy) does not reveal fundamental
changes in the trends compared to the trend of the EU-28 average.
166 Leaving aside the value for Portugal which seems to be an outlier.

152
Figure 24: Evolution of CIT collection in Member States with ACE experiences:
Austria and Belgium
Source: European Commission based on Taxation Trends data
Figure 25: Evolution of CIT collection in Member States with ACE experiences:
Italy and Latvia
Source: European Commission based on Taxation Trends data
We further assess the estimated effect of ACE by regressing the CIT to GDP ratio of 28
EU Member States for the period 1995-2014 on a set of variables, including the presence
of an ACE (Table 41). It appears that having an ACE does not seem to have any
statistically significant effect on CIT collection.

153
Table 41: Selected determinants of CIT collection
CIT in % GDP CIT in % GDP
Statutory CIT rate 0.060*** (0.009) 0.030*** (0.005)
ACE -0.109 (0.087) -0.082 (0.089)
Specific rate for SMEs -0.257** (0.093) -0.086 (0.103)
GDP Growth (%) 0.002*** (0.000) 0.002*** (0.001)
Country dummies Yes Yes
Year dummies Yes No
R² 0.775 0.713
Number of obs. 510 510
Source: European Commission, own computations based on data from Taxation Trends
Note: Huber-White Robust Standard Errors are between brackets.
***, ** and * denote statistical significance at the 1, 5 and 10% level, respectively.
With its design, notably its incremental feature and its anti-avoidance framework, the
AGI is supposed to lead to lower revenue losses than the ACE. The introduction of the
allowance can always be made revenue-neutral by introducing an offsetting CIT rate
increase.
R&D incentives
In terms of foregone tax revenues, granting an additional allowance of 33% should have
an overall neutral impact on CIT revenues as it corresponds to the R&D tax incentives
already offered in EU Member States.167
Table 42 presents the estimates of the likely
changes in CIT revenues under the two options for different rates of the allowance. The
likely forgone corporate income tax revenues vary from 5% for an additional allowance
of 100% to 15% for an allowance of 200%.
The estimates are broadly in line with OECD (2015c) which reports indirect support for
business R&D as shares of GDP for 19 EU Member States. The weighted average of the
reported EU shares was 0.08% of GDP or approximately EUR 11 billion. Assuming that
the foregone tax revenues would increase in direct proportion to changes in the B-index,
an additional allowance of 100% would imply roughly a 5% decline in total corporate
income tax revenues (exactly the effect in Table 42) whereas an allowance of 200%
would imply roughly a 13% decline in revenues (slightly lower than in Table 42).
It is important to note that these estimates do not take into account revenue gains from
the reversal of all patent boxes currently applied in the EU. Griffith et al (2014) simulate
the revenue impacts of introducing patent boxes in four countries. They find that tax
revenues from new patents are less than half of their pre-reform levels in the four
countries concerned. The impact from the removal of patent box regimes would be the
same for both options.
167 The effect will depend on the tax rates Member States choose after the introduction of a CCCTB.

154
Table 42: Reform scenarios and their possible impacts on total CIT revenues
Main estimate Minimum Maximum
CIT revenue change CIT revenue change CIT revenue change
as share of
total
in % of
GDP
as share of
total
in % of
GDP
as share of
total
in % of
GDP
Option 4a :
Full expensing +5% +0.13% +2% +0.05% +9% +0.21%
Option 4b:
100% bonus
allowance -5% -0.12% -2% -0.05% -8% -0.20%
Option 4b:
200% bonus
allowance -15% -0.38% -6% -0.14% -25% -0.63%
Source: Joint Research Centre and DG Taxation and Customs Union, European Commission.
Note: Estimates are obtained by working backwards from the elasticity of business R&D. Main estimates assume an
elasticity of business R&D with respect to the user cost of 0.8, a rate of return to R&D of 0.2 and a rate of
return to other types of investment of 0.08. The calculations are done in two steps. The actual tax base is
estimated starting from R&D investment, which is combined with information on the share of R&D over total
business investment (Eurostat), literature-derived estimates on the rates of return on R&D (Hall et al., 1999)
and the rate of return on other types of investment (Fama and French, 1999; Poterba, 1998), as well as the
level of total CIT revenue in the EU-28 (Eurostat). The net effect on CIT revenues is approximated by
subtracting estimated revenue losses from the gains implied by the reform.
The minimum and maximum bounds correspond to alternative choices in the above assumptions on elasticities
(as before 1.2, 1, 0.8 and 0.5), different rates of return on R&D investment (0.1, 0.2, 0.3 and 0.4), and
different shares of R&D in total business investment (17% suggested by Eurostat versus 12% suggested by
combining Orbis with the JRC Industrial R&D Investment Scoreboard).

155
Annex XIII: Sensitivity analysis on the AGI and the ACE
Allowance for growth and investment (AGI)
Modelling the AGI
As explained in Section 5.3.1 in the impact assessment, the CORTAX model used to
evaluate the impact of the different debt-bias reform options does not allow a proper
reflection of the incremental feature of the AGI, i.e. the fact that it is granted on equity
increases only. Instead, the model assumes that the allowance is given to the full stock of
equity. Hence, the simulations for the ACE and the AGI are identical.
To address this limitation, the effect of an AGI is simulated by restricting the share of the
equity stock that qualifies for the allowance. This restriction is based on the assumption
that over the long-term the economy grows at around 2% per year. One can assume that
on average companies grow at an identical rate. Hence, the AGI simulations assume an
increase in equity of 2% per year. If the allowance is granted for a period of ten years, the
share of the equity stock that qualifies for the AGI corresponds to 20%, the increase in
equity over this period. Table 43a presents the results of the simulations for an allowance
granted on 20% of the equity stock.
It should be stressed that these simulations probably underestimate the positive
macroeconomic effects of the AGI. Indeed, the effects on the cost of capital determine
the macroeconomic outcomes for investment which in turn affects GDP and other
variables such as employment. Given the design of the model, the effect of AGI is here
computed as the effect of an ACE applied to 20% of the stock of equity. This
underestimates the economic effects because in reality, the AGI would be granted fully
on new financing decisions. This means that an investment financed by new equity
would benefit from the allowance and reduce in full the cost of capital for this
investment. In contrast, granting the allowance on 20% of the equity stock does not
reward new equity investments as much as it does not reduce the cost of capital of such
an investment to the same extent. Thus the AGI is likely to have stronger positive
economic impacts than an allowance granted on 20% of the equity stock.
Sensitivity analysis of the AGI rate
The simulations in columns (a) to (f) vary with the rate of the allowance. In scenario (a)
the rate is the nominal risk-free long-term interest rate (equivalent to the one applied for
interest on debt) as defined in the CORTAX model. The results of this simulation are
compared with the effects of the CCCTB central scenario that has no debt bias treatment.
For example, implementing the AGI under this scenario would increase GDP by 0.37%
compared to an increase of 0.16% without the AGI. The loss in CIT revenues would be
0.11% of GDP compared to a loss of 0.08% of GDP without the AGI. Table 43b shows
the same simulations as absolute changes in the respective variables compared to the
CCCTB central scenario.
The simulations vary with the AGI rate applied to the 20% of equity stock. One can think
of this rate as the rate that a company would need to pay to compensate a shareholder for
the risk of investing in the company. As a minimum, the company would have to pay the
return that an alternative risk-free investment would yield. However, shareholders will
ask for a risk premium on top of this rate to compensate for the risk associated with an
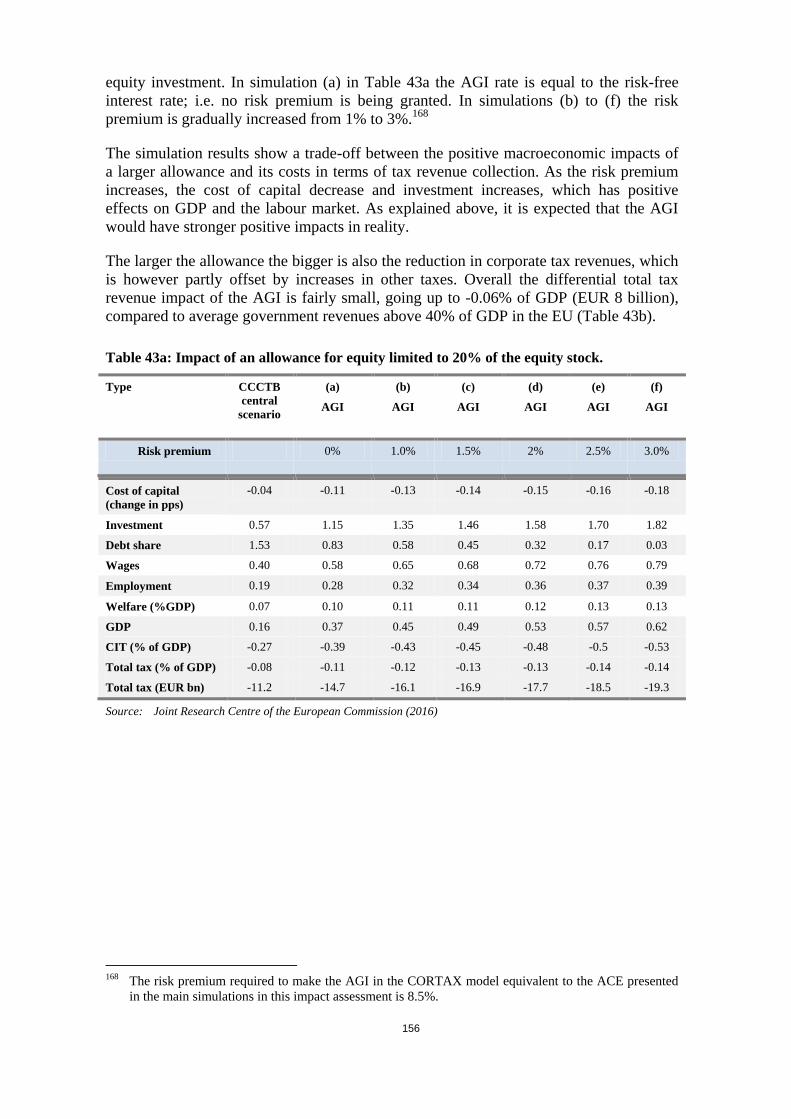
156
equity investment. In simulation (a) in Table 43a the AGI rate is equal to the risk-free
interest rate; i.e. no risk premium is being granted. In simulations (b) to (f) the risk
premium is gradually increased from 1% to 3%.168
The simulation results show a trade-off between the positive macroeconomic impacts of
a larger allowance and its costs in terms of tax revenue collection. As the risk premium
increases, the cost of capital decrease and investment increases, which has positive
effects on GDP and the labour market. As explained above, it is expected that the AGI
would have stronger positive impacts in reality.
The larger the allowance the bigger is also the reduction in corporate tax revenues, which
is however partly offset by increases in other taxes. Overall the differential total tax
revenue impact of the AGI is fairly small, going up to -0.06% of GDP (EUR 8 billion),
compared to average government revenues above 40% of GDP in the EU (Table 43b).
Table 43a: Impact of an allowance for equity limited to 20% of the equity stock.
Type CCCTB
central
scenario
(a)
AGI
(b)
AGI
(c)
AGI
(d)
AGI
(e)
AGI
(f)
AGI
Risk premium 0% 1.0% 1.5% 2% 2.5% 3.0%
Cost of capital
(change in pps)
-0.04 -0.11 -0.13 -0.14 -0.15 -0.16 -0.18
Investment 0.57 1.15 1.35 1.46 1.58 1.70 1.82
Debt share 1.53 0.83 0.58 0.45 0.32 0.17 0.03
Wages 0.40 0.58 0.65 0.68 0.72 0.76 0.79
Employment 0.19 0.28 0.32 0.34 0.36 0.37 0.39
Welfare (%GDP) 0.07 0.10 0.11 0.11 0.12 0.13 0.13
GDP 0.16 0.37 0.45 0.49 0.53 0.57 0.62
CIT (% of GDP) -0.27 -0.39 -0.43 -0.45 -0.48 -0.5 -0.53
Total tax (% of GDP) -0.08 -0.11 -0.12 -0.13 -0.13 -0.14 -0.14
Total tax (EUR bn) -11.2 -14.7 -16.1 -16.9 -17.7 -18.5 -19.3
Source: Joint Research Centre of the European Commission (2016)
168 The risk premium required to make the AGI in the CORTAX model equivalent to the ACE presented
in the main simulations in this impact assessment is 8.5%.

157
Table 43b: Incremental impact of an allowance for equity limited to 20% of the equity
compared to the CCCTB central scenario
Type CCCTB
central
scenario
(a)
AGI
(b)
AGI
(c)
AGI
(d)
AGI
(e)
AGI
(f)
AGI
Risk premium 0% 1.0% 1.5% 2% 2.5% 3.0%
Cost of capital
(change in pps)
0.0 -0.07 -0.09 -0.10 -0.11 -0.12 -0.14
Investment 0.0 0.58 0.78 0.89 1.01 1.13 1.25
Debt share 0.0 -0.70 -0.95 -1.08 -1.21 -1.36 -1.50
Wages 0.0 0.18 0.25 0.28 0.32 0.36 0.39
Employment 0.0 0.09 0.13 0.15 0.17 0.18 0.2
Welfare (% of GDP) 0.0 0.03 0.04 0.04 0.05 0.06 0.06
GDP 0.0 0.21 0.29 0.33 0.37 0.41 0.46
CIT (% of GDP) 0.0 -0.12 -0.16 -0.18 -0.21 -0.23 -0.26
Total tax (% of GDP) 0.0 -0.03 -0.04 -0.05 -0.05 -0.06 -0.06
Total tax (EUR bn) 0.0 -3.5 -4.9 -5.7 -6.5 -7.3 -8.1
Source: Joint Research Centre of the European Commission (2016)
Allowance for corporate equity (ACE)
The CORTAX simulations for the ACE presented in the main part of the impact
assessment assume that only 70% of the equity stock qualifies for the allowance, based
on empirical data. This assumption reflects the observation that in existing ACE systems
it is rarely the case that the full return on equity is deductible. Table 44 presents an
alternative simulation, where the full equity stock qualifies for the allowance (i.e. 100%).
As expected, the result is more positive economic impacts, but also a larger cost in terms
of tax revenues. The last four columns present the incremental impacts compared to the
CCCTB central scenario.

158
Table 44: Sensitivity analysis on the level of the ACE
Type CCCTB
central
scenario
(a)
ACE
(b)
ACE
Differential analysis CCCTB
central
scenario
(a)
ACE
(b)
ACE
Share of
equity stock
70% 100% Share of
equity stock
70% 100%
Risk premium 0% 0% Risk
premium
0% 0%
Cost of capital
(change in pps)
-0.04 -0.32 -0.50 Cost of
capital
(change in
pps)
0.0 -0.28 -0.46
Investment 0.57 3.36 5.47 Investment 0.0 2.79 4.90
Debt share 1.53 -1.79 -4.29 Debt share 0.0 -3.32 -5.82
Wages 0.40 1.26 1.88 Wages 0.0 0.86 1.48
Employment 0.19 0.65 1.00 Employment 0.0 0.46 0.81
Welfare (% of
GDP)
0.07 0.18 0.25 Welfare (%
of GDP)
0.0 0.11 0.18
GDP 0.16 1.17 1.91 GDP 0.0 1.01 1.75
CIT (% of GDP) -0.27 -0.85 -1.30 CIT (% of
GDP)
0.0 -0.58 -1.03
Total tax (% of
GDP)
-0.08 -0.23 -0.36 Total tax (%
of GDP)
0.0 -0.14 -0.28
Total tax (EUR
bn)
-11.2 -30.6 -48.4 Total tax
(EUR bn)
0.0 -19.4 -37.2
Source: Joint Research Centre of the European Commission (2016)


