Embed Size (px)
Citation preview
Sustainable biomass potential for biofuels –
A spatial assessment for Brazil and India
vorgelegt von Dipl.-Ing.
Selma Lossau geb. in Berlin
von der Fakultät II – Mathematik und Naturwissenschaften der Technischen Universität Berlin
zur Erlangung des akademischen Grades
Doktor der Ingenieurwissenschaften - Dr.-Ing. -
genehmigte Dissertation
Promotionsausschuss: Vorsitzender: Prof. Dr. Michael Gradzielski Gutachter: Prof. Dr. Reinhard Schomäcker Gutachterin: Prof. Dr. Birgit Kleinschmit Gutachter: Prof. Dr. Günther Fischer Tag der wissenschaftlichen Aussprache: 03. Juni 2015
Berlin 2017

2

I
Summary
�
There is a large interest in biofuels in Brazil and India as a substitute to fossil fuels, with a purpose of enhancing energy security and promoting rural development. The critical question is whether there is adequate spare land available in Brazil and India that is suited for biofuel feedstock production.
For these reasons, Daimler AG launched a project in co-operation with the International Institute for Applied System Analysis (IIASA) and the Technical University of Berlin to assess the biomass potential for biofuels employing the following sustainability criteria: The production of biofuels i) must exclude competition with food and feed supply; ii) does nor directly nor indirectly result in deforestation; iii) does not encroach in protected areas; iv) does not cause in biodiversity loss; v) does not compete for scarce fresh water resources and vi) will not cause land degradation due to inappropriate management; vii) must not contribute to GHG emissions and climate change as result of increased fertilizer use for crop production intensification or of conversion from crop production to biofuel. Applying the sustainability criteria outlined above this thesis aims for a spatially detailed assessment of biomass and biofuel potentials in promising future vehicle markets Brazil and India.
A new land resources database for Brazil has been created for a 30 arc-second (about 1 km2) grid-cell resolution comprising of land intensities of seven major land cover categories. This study combines available recent geographic land use data derived from remote sensing analysis with statistical information from Brazil’s latest agricultural Census and with forest data from FAO’s Forest Resource Assessment. Spatial allocation algorithms were applied to obtain spatial distributions for i) cropland, ii) pasture, iii) forest, iv) built-up land required for urban, industrial and infrastructure, v) barren and sparsely vegetated land, and vi) water. The remaining unused share in each grid-cell was termed vii) residual land areas. Residual land was further categorized according to its legal protection status, biodiversity value, and whether it belongs to the territory of the Amazon biome. Some 44% of the latter or 37 Mha is not located in the Amazon or in protected areas or in areas of high biodiversity value and could be earmarked for biofuel production. About 62 billion litres of bioethanol from miscanthus, followed by 34 billion litres and 31 billion litres from sugarcane and cassava respectively could be produced from residual land. Potential biodiesel production amounts to about 18 billion litres when residual land is used for jatropha cultivation or 7 billion litres for soybeans. In comparison current domestic demand for bioethanol is around 23 billion litres and 3 billion litres biodiesel.
In contrast to Brazil where significant extents of residual land exist the spare land for biofuel production in India is very limited. India launched a large program to promote biofuel production, particularly on wastelands: its implications has been studied intensively considering the fact that India is a large developing country with high population density and large rural population depending upon land for their livelihood. The study for India presents an assessment of biofuel production potentials on Indian wasteland, which combines available statistical information from the agricultural survey and specific statistical data of wastelands from the Wasteland Atlas with geospatial information for wasteland suitability for biofuel feedstocks obtained from the Global Agro-ecological zones (GAEZ) assessment, which was carried out for the purpose of this study. An iterative sequential downscaling procedure has been implemented to estimate culturable wasteland shares and suitability for biofuel feedstocks. Of the total land area of India (327 Mha), about 14% is wasteland of this total approximately 13 Mha would be suitable for growing biofuel feedstocks. The production potential of culturable wastelands amounts 12 billion litres in the case of miscanthus, followed by 4 billion litres bioethanol from sugarcane. Potential biodiesel production amounts about 7 billion litres biodiesel in the case of jatropha. In comparison 7 billion litres
II
bioethanol and 18 billion litres biodiesel would be required considering the biofuel blend of 20% targeted by the Indian government.
Results for Brazil and India provide biophysical potentials of residual land or culturable wasteland expressed in biomass (t/ha) and biofuel equivalents (l/t). Biofuel feedstocks production potentials have been equated to energy output (GJ), GHG saving potential (ton CO2eq) and replacement potentials of fossil transport fuels and. In addition the maximum possible amount of biofuels produced from residual land or culturable wasteland was determined by selecting the highest yielding biofuel feedstocks in terms of biofuel energy output (GJ/ton biomass). Further, key factors, which determine potential future uses of residual land or wasteland and its impact on biofuel production has been analysed.
III
Zusammenfassung
�
In den Ländern Brasilen und Indien herrscht großes Interesse an Biokraftstoffen. Zum einen sieht man in Biokraftstoffen die Chance die zukünftige Energieversorgung sicherzustellen und zum anderen ländliche Regionen mit einem hohen Anteil an Landwirtschaft durch den Anbau von Pflanzen für die Biokraftstoffproduktion zu unterstützen. Entscheidend ist hierbei, ob in diesen Ländern bisher ungenutzte Flächen existieren und ob diese für den Anbau von Pflanzen für die Biokraftstoffproduktion geeignet sind.
Aus diesem Grund hat die Daimler AG in Kooperation mit dem Internationalen Institut für angewandte Systemanalyse (IIASA) und der Technischen Universität Berlin ein Projekt initiiert, mit dem Ziel der geodatenbasierten Berechnung des nachhaltigen Biomassepotentials für die Erzeugung von Biokraftstoffen. Dabei wurden die folgenden Nachhaltigkeitskriterien berücksichtigt: Die Produktion der Biokraftstoffe darf i) nicht in Konkurrenz zur Nahrungs- und Futtermittelerzeugung stehen; ii) darf weder direkt, noch indirekt zu Entwaldung führen; iii) darf nicht auf geschützten Flächen erfolgen; iv) darf nicht auf Flächen mit hoher Biodiversität erfolgen; v) tritt nicht in Konkurrenz zu Frischwasserressourcen; vi) verursacht keine Landdegradierung aufgrund unangemessener Bewirtschaftung; vii) darf keine zusätzlichen Treibhausgas-Emissionen verursachen z.B. als Folge von vermehrtem Düngemitteleinsatz. Unter Berücksichtigung der o.g. Nachhaltigkeitskriterien zielt diese Arbeit auf eine räumlich detaillierte Bewertung von Biomasse – und Biokraftstoffpotentialen auf ungenutzten Landflächen in Brasilien und Indien.
Für Brasilien wurde eine neue geodatenbasierte Landflächennutzungs-Datenbank mit einer Rasterauflösung von 30 Bogensekunden (ca. 1 km2) generiert. Dabei wurden verfügbare Statistiken zur Landnutzung und Waldflächen mit geodatenbasierten Landnutzungsinformationen kombiniert. Es wird zwischen sieben Landüberdeckungsarten unterschieden: i) Ackerland, ii) Weideland, iii) Waldflächen, iv) Nutz- und Reservefläche für städtische und industrielle Infrastruktur, v) Ödland und spärlich bewachsenes Land und vi) Wasserflächen. Die nicht i) bis vi) zuzuordnenden Anteile jedes Rasters wurden zusammengefasst als vii) restliche Landflächen sog. „residual land“. Die restlichen Landflächen wurden weiter kategorisiert gemäß ihres rechtlichen Schutzstatus, ihrer Biodiversität und ob sie dem Amazonas zugewiesen sind. 44% des „residual land“ etwa 37 Millionen Hektar sind weder dem Amazonas-Gebiet noch Schutzgebieten bzw. Gebieten mit besonderer Biodiversität zuzuordnen. Diese Fläche steht für den potentiellen Anbau von Pflanzen für die Biokraftstoffproduktion zur Verfügung. Zirka 62 Milliarden Liter Bioethanol aus Miscanthus (auch als China-Schilf bekannt), gefolgt von 34 Milliarden Litern aus Zuckerrohr bzw. 31 Milliarden Litern aus Cassava könnte auf „residual land“- Flächen erzeugt werden. Das Potential für die Biodieselerzeugung liegt bei 18 Milliarden Litern, wenn diese Flächen für den Jatrophaanbau verwendet würden bzw. 7 Milliarden Litern bei entsprechender Bewirtschaftung mit Soja. Der aktuelle nationale Bedarf liegt bei 23 Milliarden Liter Bioethanol und 3 Milliarden Liter Biodiesel.
Im Unterschied zu Brasilien, wo ein signifikantes Flächenpotential besteht, sind diese zur Biokraftstoffproduktion geeigneten freien Landflächen in Indien stark limitiert. Indien hat ein ausgeweitetes Programm zur Unterstützung der Biokraftstoffproduktion ins Leben gerufen, hierbei steht die Nutzung von Ödlandflächen sog. „wasteland“- Flächen insbesondere im Fokus. Die geodatenbasierte Berechnung des nachhaltigen Biomassepotentials für die Erzeugung von Biokraftstoffen für Indien kombiniert verfügbare Statistiken zur Landnutzung und „wasteland“-Flächen mit Geoinformationen über die Tauglichkeit zur landwirtschaftlichen Nutzung. Dabei wurde eine sequenzielle Downscalingprozedur angewendet, um das Potential von kultivierbaren „wasteland“-Flächen abzuschätzen und deren Tauglichkeit für den Pflanzenanbau für die Biokraftstoffproduktion zu prognostizieren. Ungefähr 14% der 327 Millionen Hektar Gesamtfläche Indiens sind „wasteland“. Schätzungsweise 13 Millionen Hektar wären tauglich zum Anbau von Pflanzen für die Biokraftstoffproduktion. Das Produktionspotential der
IV
kultivierbaren „wasteland“- Flächen beträgt 12 Milliarden Liter Bioethanol beim Anbau von Miscanthus gefolgt von 4 Milliarden Liter bei Verwendung von Zuckerrohr. Das Potential für die Biodieselerzeugung liegt bei 7 Milliarden Litern, wenn diese Flächen für den Jatrophaanbau verwendet würden. 7 Milliarden Liter Bioethanol und 18 Milliarden Liter Biodiesel würden in Indien benötigt um eine 20% Beimischung von Biokraftstoff in Benzin oder Diesel zu erreichen.
Die Potentiale der Rohstofferzeugung für Biokraftstoffe wurden für Brasilien und Indien in Bezug auf die Energieausbeute (GJ) und das Einsparpotential von Treibhausgasen (Tonnen CO2 –Äquivalent) gegenübergestellt. Zusätzlich wurde der maximale Ertrag an Energie aus Biokraftstoffen ermittelt, unter der Annahme des Anbaus desjenigen Rohstoffs mit der höchstmöglichen Energiedichte (GJ/Tonne Biomasse). Um die zukünftige Verfügbarkeit von „residual land“ oder „wasteland“-Flächen zu untersuchen wurden landwirtschaftliche Bedarfs- und detaillierte Weidelandproduktivitätsuntersuchungen hinzugezogen.
V
Acknowledgement
�
It was a long way from starting this thesis and finishing it was not possible without help. It’s true that “Life is what happens” when you are completing your dissertation. Life doesn’t stand still, nor wait until you are finished and have time to manage it. I would like to thank the colleagues, friends and family who supported me throughout this time.
First of all I like to thank my supervisors Prof. Dr. Birgit Kleinschmit and Prof. Dr. Reiner Schomäcker who both supported me throughout the time. They gave me freedom to develop my own ideas and concepts, reviewed and criticized my work, and encouraged me to finish this thesis.
I am especially grateful to my contributing co-authors Prof. Dr. Günther Fischer, Dr. Sylvia Tramberend and Dr. Harrij van Velthuizen of the International Institute of Applied System Analysis (IIASA), which shared their ideas and work with me during the intense process of writing manuscripts. I appreciate all their contributions of time, ideas, and funding to make my PhD experience productive and stimulating. The joy and enthusiasm they have for their research was contagious and motivational for me, even during tough times in the PhD. I will never forget my stays at Laxenburg, working in royal rooms in the former summer residence of Queen Elisabeth (Sisi). Thanks to Amnah Kasman and Elisabeth Preihs who made all administrative issues during my stay at IIASA very easy.
Thank goes to Mr Eberhard Holder, which gave me the possibility to work at Daimler AG. He was a real help in letting me share all his experience and giving me the impression that he fully understood my concerns and improvements. He always supported me, even during though times of several reorganisations of our department and gave me time when I needed it to research and write.
The doctoral program enriched my time at Daimler AG. The group has been a source of friendships as well as good advice and collaboration. I am especially grateful to my PhD colleagues Dr. Verena Dorschel, Dr. Anna Heszler, Dr. Oliver Geißel and Dr. Christian Looman. Thank you for your encouragement, support and most of all your humour. You kept things light and me smiling.
I thank Professor Sobral from University of Pernambuco for kindly providing information on available land use data for Brazil. Additionally thank goes to Mr George Francis for providing support on available data for jatropha and miscanthus.
I would like to acknowledge the importance of the funding provided by the Wissenschaftlicher Beirat der Bundesregierung Globale Umweltveränderungen (WBGU), within the scope of the Young Scientist Summer Program (YSSP), organized by the International Institute for Systems analysis (IIASA).
Invaluable is the help from family and friends accompanying me during these years. Thank, Dr. Änne and Herrman König (for the nice flat, where I could stay my three first years at Stuttgart. A real help with my small Phd salary), Babara, Peter, Pia and Anna Kleine (who always supported me and who constantly asked me “are you done yet?”), Dr. Verena and Fabian Dorschel (for accommodation and nice dinners at several stopover in Mondsee on my long way from Stuttgart to Laxenburg), Sonja Jost, Lisa Zimmermann, Maria Herrera Glomm (for your encouraging words that kept me going)
Sebastian – We met first, when I entered the doctoral program at Daimler in February 2008. We immediately became friends and now we married just few months ago! You gave me a lot of strength, confidence and (even

VI
more important) practical advises during the time often stressful with lecturing, proposal writing, Lara caring – simply living.
Liebe Lara – eines Tages wirst du fähig sein dies hier zu lesen. Ich danke Dir, dass Du mir gezeigt hast, was wirklich wichtig im Leben ist - und das war sicherlich nicht das Schreiben von wissenschaftlichen Publikationen.
Liebe Eltern – danke für das grenzenlose Vertrauen, dass ihr immer in mich und meine Entscheidungen hattet. Nur durch die Mischung aus gesunder Skepsis und Begeisterungsfähigkeit, die ihr mir mitgegeben habt und die vielen Male, die ihr Euch so liebevoll um Lara gekümmert habt, konnte ich diese Aufgabe bewältigen.

VII
Author’s Declaration
I prepared this dissertation without illegal assistance. This work is original except where indicated by special reference in the text and no part of the dissertation has been submitted for any other degree. This dissertation has not been presented to any other University for examination, neither in Germany nor in another country.
Selma Lossau

VIII
IX
Contents
�
SUMMARY I
ZUSAMMENFASSUNG III
ACKNOWLEDGEMENT V
AUTHOR’S DECLARATION VII
CONTENTS IX
LIST OF FIGURES XII
LIST OF TABLES XV
LIST OF BOXES XVII
LIST OF ABBREVIATIONS XIX
CHAPTER 1 INTRODUCTION 1
1 Importance of biofuels, sustainability criteria’s 1
2 Focus region Brazil 2
3 Focus region India 3
4 Objective and research questions 5
5 Structure of the thesis 6
CHAPTER II BRAZIL’S CURRENT AND FUTURE LAND BALANCES: IS THERE RESIDUAL LAND FOR BIOENERGY PRODUCTION? 7
Abstract 7
1 Introduction 7
2 Methodology and data 8
2.1 Assessment of land balances and residual land 8
2.2 Allocation of residual-I, II and III land 13
2.3 Assessment of land quality 13
3 Results and discussion 16
3.1 Land balance and extents of residual land 16
3.2 Quality of residual land 17
X
3.3 Residual land for food, feed or bioenergy feedstock production? 24
3.4 Environmental conservation concerns 28
4 Scope and limitations of the study 29
5 Conclusions 29
Acknowledgement 30
CHAPTER III BIOFUELS FROM RESIDUAL LAND IN BRAZIL: AGRO-ECOLOGICAL ASSESSMENT FOR SUGARCANE, CASSAVA, MISCANTHUS, SOYBEAN AND JATROPHA 31
Abstract 31
1 Introduction 31
1.1 Importance of biofuels, sustainability criteria 31
1.2 Biofuel production in Brazil 32
2 Considered biofuel feedstocks 35
3 Methodology and data 38
3.1 Agro-ecological methodology 38
3.2 Brazilian land use database 39
4 Results 41
4.1 Suitability and biomass productivity of biofuel feedstocks on residual land 41
4.2 Biofuel potentials of residual land 49
5 Discussion 54
5.1 Potential contribution of biofuels to Brazil’s transport energy demand 54
5.2 GHG reduction potential 55
5.3 Replacement potential of fossil transport fuels 56
6 Conclusions 57
Acknowledgement 58
CHAPTER IV BIOFUELS FROM WASTELAND IN INDIA: AGRO-ECOLOGICAL ASSESSMENT FOR JATROPHA, MISCANTHUS AND SUGARCANE 59
Abstract 59
1 Introduction 59
XI
2 Current biofuel production in India 61
2.1 Bioethanol production 61
2.2 Biodiesel production 62
3 Methodology and Data 63
3.1 Allocation of wasteland 63
3.2 Land suitability for biofuel feedstock 66
3.3 Suitability of wasteland for biofuel feedstocks 67
3.4 Characterization of culturable wasteland and barren land using Wasteland Atlas statistics 69
71 3.5 Biofuel production potential of allocated wasteland
4 Results
4.1
72
Extent and quality of culturable wasteland 72
4.2 Biofuel potentials on residual land 74
5. Discussion 76
5.1 Replacement potential of fossil transport fuels in terms of the aims of policy 76
5.2 GHG reduction potential of biofuels grown on culturable wasteland 78
5.3 Barriers to biofuel development on wasteland 79
6 Conclusion 80
Acknowledgement 81
CHAPTER IV SYNTHESIS 83
1 Brazil: Concluding remarks and future research 83
2 India: Concluding remarks and future research 84
REFERENCES 85
Appendix A Brazilian residual land suitability for bioethanol feedstocks by micro-regions 97
Appendix B Brazilian residual land suitability for biodiesel feedstocks by micro-regions 111
Appendix C Indian culturable wasteland suitability for different biofuel feedstocks by district 123

XII
XIII
List of Figures
�
Figure II-1 Administrative regions Brazil
Figure II-2 Brazilian land resources database with land intensities (30 arc second grid-cell resolution)
Figure II-3 Distribution and intensity of residual land (30 arc second grid-cell resolution)
Figure II-4 Distribution and intensity of residual land and its occurrence on protected or biodiverse areas (30 arc second grid-cell resolution)
Figure II-5 Suitability and productivity of residual-III land for the umbrella crop (30 arc second grid-cell resolution)
Figure II-6 Cattle feed demand and supply for Brazil's cattle herd in 2006 by region
Figure II-7 Brazil's pastures by protection and importance for biodiversity
Figure III-1 Distribution and intensity of residual land shares (30 arc second grid-cell resolution)
Figure III-2 Overall structure and data integration of GAEZ
Figure III-3 Administrative regions Brazil
Figure III-4 Biofuel feedstock suitability of residual land by regions
Figure III-5 Rain-fed sugarcane suitability for residual land under mixed input level (30 arc second grid-cell resolution)
Figure III-6 Rain-fed cassava suitability for residual land under mixed input level (30 arc second grid-cell resolution)
Figure III-7 Rain-fed miscanthus suitability for residual land under mixed input level (30 arc second grid-cell resolution)
Figure III-8 Rain-fed soybean suitability for residual land under mixed input level (30 arc second grid-cell resolution)
Figure III-9 Rain-fed jatropha suitability for residual land under mixed input level (30 arc second grid-cell resolution)
Figure III-10 Biofuel potential from residual land by feedstock and regions
Figure III-11 Best biofuel feedstock solution for residual land by feedstock (30 arc second grid-cell resolution)
XIV
Figure III-12 Suitability of residual land for the biofuel feedstock with highest biofuel energy potential (30 arc second grid-cell resolution)
Figure III-13 Biofuel GHG saving potential from residual land
Figure III-14 Cruising range of one passenger car using biofuels from residual land
Figure IV-1 Administrative regions of India
Figure IV-2 Biofuel feedstock suitability of culturable wasteland by regions
Figure IV-3 Suitability for rain-fed sugarcane under high input management (30 arc second grid-cell resolution)
Figure IV-4 Suitability for rain-fed miscanthus under high input management (30 arc second grid-cell resolution)
Figure IV-5 Suitability for rain-fed jatropha under high input management (30 arc second grid-cell resolution)
Figure IV-6 Best biofuel feedstock solutions for culturable wasteland
Figure IV-7 Biofuel GHG saving potential from culturable wasteland
XV
List of Tables
�
Table II-1 Summary of the geographical and statistical data sources
Table II-2 Data sources applied for downscaling of major land use categories
Table II-3 Weights applied in the spatial downscaling procedure for different combined land cover classes
Table II-4 Definition of residual land applied in this study
Table II-5 Share of harvested area and production of ten major crops
Table II-6 Geary –Khamis dollars (GK$) for different crops
Table II-7 Major land use and residual land categories at state level calculated from Brazilian land resources database (30 arc second grid-cell resolution)
Table II-8 Suitability and productivity of residual-III land for the umbrella crop
Table II-9 Supply of consumable biomass from pasture and biomass demand from Brazils current and future cattle herd
Table III-1 Biophysical and energy characteristics of biofuel feedstocks
Table III-2 Agro-ecological characteristics of biofuel feedstocks
Table III-3 Specifications of levels of inputs and management systems used
Table III-4 Biofuel feedstock production potential from residual land by states
Table III-5 Best biofuel feedstock solutions for residual land (Part 1)
Table III-6 Best biofuel feedstock solutions for residual land (Part 2)
Table III-7 Potential contribution of biofuels to Brazil’s transport energy demand
Table IV-1 Definition of culturable wasteland and barren/unculturable land
Table IV-2 Major land categories aggregated by state
Table IV-3 Ranking and additional suitability constraints of Wasteland Atlas classes for individual biofuel feedstock
Table IV-4 Biophysical and energy characteristics of biofuel feedstocks
Table IV-5 Rain-fed production potentials of culturable wasteland, biofuel production potential and energy output for biofuel feedstocks
XVI
Table IV-6 Projected demand for biofuel in India for the year 2020
Table A-1 Brazilian residual land suitability for bioethanol feedstocks by micro-regions
Table A-2 Brazilian residual land suitability for Biodiesel feedstocks by micro-regions
Table A-3 Indian culturable wasteland suitability for different biofuel feedstocks by district
XVII
List of Boxes
�
Box II-1 Example for allocation of cropland using land cover reference weights
Box II-2 Example for suitability allocation for residual land
Box IV-1 GAEZ Methodology
Box IV-2 Allocation of suitability distribution for culturable wasteland
Box IV-3 Allocation of adjusted production potential of culturable wasteland using Wasteland Atlas statistics

XVIII
XIX
List of Abbreviations
�
AGB Above Ground Biomass
Census Annual agricultural survey
CO2eq Carbon dioxide equivalent
CRU Climate Research Unit
DACNET Department of Agriculture and Cooperation
DM Dry Matter
DW Dry Weight
E5 5% blend of ethanol in gasoline
E10 10% blend of ethanol in gasoline
E100 Pure ethanol (100%)
EBP Ethanol blending program
EC European Commission
EJ Exa Joules (1018 Joules)
EMBRAPA The Brazilian Agricultural Research Corporation
FAO Food and Agriculture Organization
FAOSTAT Statistics of the Food and Agriculture Organization
FFV Flex-Fuel Vehicles
FRA Forest Resource Assessment from Food and Agriculture Organization
g gram
GAEZ Global Agro-Ecological Zones
GAUL Global Administrative Unit Layers
GHG Greenhouse Gas
GIS Geographic Information System
GJ Giga Joules (109 Joules)
XX
GK$, Geary–Khamis Dollars
GLC Global Land Cover Database
GLCCD Global Land Cover Characterization Database
GPCC Global Precipitation Climatology Centre
ha Hectare
HWSD Harmonized World Soil Database
IBGE Brazilian Institute of Geography and Statistics
IFPRI International Food Policy Research Unit
IIASA International Institute for Applied System Analysis
ISRIC International Soil Reference and Information Centre
ISSCAS Institute of Soil Science Chinese Academy of Science
IUCN International Union for Conservation of Nature
JRC Joint Research Centre
l Litre
LCCS Land Cover Classification System
LUC Land Use Changes
LUT Land Utilization Types
MAPA Ministry of Agriculture, Livestock and Supply
Mha Million hectares
MMA Brazilian Ministry of the Environment
MS Moderately suitable (40–60% of maximum achievable yield)
ms Marginally suitable (20–40% of maximum achievable yield)
Mt Million tonnes
NBM National Biodiesel Mission
NBSC National Biofuel Steering Committee
NS Not suitable (less than 5% of maximum achievable yield)
XXI
PJ Peta Joules (1015 Joules)
PPAC Petroleum Planning and Analysis Cell
PROBIO National biodiversity database by Brazilian ministry of the environment
RED Renewable Energy Directive
RFA Renewable Fuels Agency
RTFO Renewable Transport Fuel Obligation
S Suitable (60–80% of maximum achievable yield)
SI Suitability Index
SRTM Shuttle Radar Topography Mission
t Tonnes
TERI The Energy and Resource Institute
Umbrella crop Combining production potential and suitability results of ten crops on the basis of maximum output value in a grid-cell into one so-called umbrella crop.
UNEP United Nations Environment Program
VmS Very marginally suitable (5-20% of maximum achievable yield)
VS Very suitable (80–100% of maximum achievable yield)
WAC Wasteland Atlas Category
WBGU Wissenschaftlicher Beirat der Bundesregierung Globale Umweltveränderungen
WCMC World Conversion Monitoring Center
WDPA World Database on Protected Areas
YSSP Young Scientist Summer Program

XXII
Introduction
1
Chapter I Introduction
1 Importance of biofuels, sustainability criteria’s
�
The transport sector is a critical sector of the socio-economy as it enhances societal cohesion through human mobility and it contributes to economic growth through effective and efficient movement of goods and services. Demographic changes and economic growth over the next half century will cause a more than a doubling of world transport capacity and substantially increased fuel demand, particularly in the developing countries (OFID-IIASA 2009). The automotive industry has made considerable progress regarding alternative motorization systems like electric/hybrid vehicles and fuel cell cars. But these mobility concepts will not be available in the short term. The challenges associated with range, infrastructure, recharging time, and uniform service station docking standards must be overcome before electric mobility becomes a practical everyday option (Daimler 2009). The combustion engine will continue to be the dominant engine system for many years to come, especially for freight transport. As a consequence, the automotive industry is interested in alternative fuels for its combustion engines and biofuels in particular. The key issues center around finding a sustainable source of biofuel production for the future that will keep the fuel costs at acceptable level. In addition, the use of biofuels should provide environmental benefits and endow the automobile industry potentially with CO2 credits (Riegel 2009).
A critical assessment of the biofuel potential is urgently required. Such an assessment, however, cannot be accomplished easily. Biomass production places characteristic demands on the physical environment with biofuel feedstocks showing temporally and spatially varying habitats, geographical extensions and yield ranges depending on factors such as local climate, terrain, soil conditions, and fresh water supply (Riegel 2009). Furthermore, an increased cultivation of agricultural feedstocks for liquid fuel production competes for scarce land, water and nutrients with food and feed production.
To produce biofuels, considerable amounts of biomass have to be provided, which will require an analysis of existing and potential biomass (OECD-IEA 2010). Recent studies have assessed the technical global biomass potential. There are ranging between 30 EJ (Hoogwijk et al. 2003) and 1,300 EJ (Smeets et al. 2007) in 2050, or between 8% and 350% of current global energy consumption (OECD-IEA 20014). A major cause for such large differences relates to the crucial factors of future land availability and yields, both being very uncertain. Particularly in developing regions, these global estimations indicate considerable potential for the cultivation of dedicated energy crops. Countries with favourable climatic conditions (such as wet tropical climates) or countries where modernization and intensification of agricultural production could free large tracts of land would be most promising for future biofuel production (OECD-IEA 2010).
However a fair amount of uncertainty results from the fact that most studies are either demand driven (focusing on the demand for bioenergy) or supply driven (focusing on the sources of bioenergy) and use a top-down approach (Berndes et al. 2003, Hoogwijk et al. 2003, Smeets et al. 2007). Secondly, most studies pay limited attention to quality and relevance of the data used, to the impact of the various factors that determine the bioenergy production potential (e.g. food consumption patterns, yields and the applied level of technology) and to the question, how an expanding bioenergy sector would interact with other land uses (e.g. food and feed production, biodiversity, soil and environmental conservation). Therefore, the availability of land that can be
Chapter I
2
dedicated to energy crops for the production of biofuels may be limited and requires careful assessment; more research on availability of land resources is clearly needed (OECD-IEA 2010).
Recently, doubts have been raised about the actual benefits of biofuels regarding the mitigation of greenhouse gas (GHG) emissions (Searchinger et al. 2008). There are also questions about potential environmental, social and economic impacts, such as competition with food supply, risks of reducing biodiversity, impacts on water quality and water availability, and lack of benefits to those directly affected by large scale introduction biofuels production (Walter et al. 2011).
For these reasons, Daimler AG launched a project in co-operation with the International Institute for Applied System Analysis (IIASA) and Technical University of Berlin to assess the biomass potential for biofuels in promising future vehicle markets Brazil and India employing the following sustainability criteria:
The production of biofuels i) must exclude competition with food and feed supply; ii) does nor directly nor indirectly result in deforestation; iii) does not encroach in protected areas; iv) does not cause in biodiversity loss; v) does not compete for scarce fresh water resources and vi) will not cause land degradation due to inappropriatemanagement; vii) must not contribute to GHG emissions and climate change as result of increased fertilizer usefor crop production intensification or of conversion from crop production to biofuel.
2 Focus region Brazil
�
Brazil is the world's second largest producer of fuel ethanol (EIA 2014), after the USA, that surpassed Brazil in 2004, and the world's largest exporter (OECD-IEA 2010). In 2013 Brazil produced 28 billion litres fuel ethanol, representing nearly a third of global production (F.O. Lichts 2013). Brazil exported 2.9 billion litres in 2013 (USDA 2014a), with the United States and South Korea as main destinations. Current regulations in Brazil enforce a 25% blend of ethanol with fossil gasoline used for vehicles (USDA 2014a). Internal use has grown continuously since the introduction of flex-fuel vehicles (FFVs) in 2003. FFVs can be fuelled by both, gasoline and ethanol, which substantially increased consumer flexibility in response to price hikes. In recent years, almost 90% of the new cars sold in Brazil were FFVs (Walter et al. 2011). Brazil has been the world’s leading producer and consumer of sugarcane based bioethanol. The majority of biofuel is used for the domestic transport sector. Brazil is also a key player in ethanol trade, yet trade barriers in the United States and the European Union currently limit export. However, as of 2012, the 54% import tariff for ethanol to the United States was abolished. Brazilian sugarcane based bioethanol production in 2011 and 2012 was 23 billion litres down from a peak of 28 billion litres in 2010 (USDA 2014a).
Brazil started biodiesel production in 2006. Installed production capacity increased rapidly in response to envisioned mandates. In 2010, the biodiesel use mandate has been set at 5%; recently since end of 2014 a 7% mandate has been set. In 2013 Brazil marketed 3.5 billion litres of biodiesel transport fuel representing a 6% share in the total diesel market. Soybean is by far the most important source for biodiesel production (72%) followed by animal fats (24%) and cotton seed (2%) (USDA 2014a). Current biofuel production is about 65% and 40% of installed capacity for bioethanol and biodiesel respectively making a rapid expansion possible in case of increased demand and availability of sufficient feedstock. Total production capacity is 40 billion litres bioethanol from 490 bio-refineries and 8.2 billion litres biodiesel from 64 biodiesel plants (USDA 2014a). The biodiesel industry has largely been driven by the renewable fuel obligation (OECD-IEA 2010). Around 92% of the biofuel plants authorised for commercialisation have the “Social Fuel” seal, a certificate, which requires purchasing a minimum amount of feedstock from small farmers. This program aims at stimulating the cultivation of a variety of oil crops
Introduction
3
for biodiesel production, including castor bean and oil palm, which can be grown respectively in the North-East and North of Brazil. However, in practice 72% of the national biodiesel production is being produced from soybean oil, planted in the South (Lapola et al. 2009). Although the government projects a three-fold increase in the biodiesel production up to 2015, it is still unclear which oil crops will be used.
Brazilian agriculture covering about one-fourth of the countries territory has expanded substantially during recent decades and is expected to expand further in response to growing demand for food, feed and biofuel feedstocks (OECD-FAO 2009). Today the vast majority of energy crops, primarily sugarcane for fuel ethanol production is grown in the favourable climatic conditions of Brazil’s South-East and Central-East regions. In view of the envisaged expansion of sugarcane, the Brazilian government conducted a broad study identifying areas suitable for sugar cane production. In addition new guidelines have been proposed for favouring energy crop feedstock production in underused or degraded pasture and from land under rain-fed cultivation (OECD-IEA 2010). However, expansion of cultivated land in Brazil has directly or indirectly caused deforestation and loss of biodiversity. This is raising concerns regarding environmental sustainability of biofuel feedstock production (Lapola et al. 2010, Sparovek et al. 2009). Brazil’s potential to sustainably produce biofuels for domestic demand and the world market is one of the key factor for mobilizing resources for the bio-based economy. The suitability for biofuel production strongly depends on local biophysical conditions and management regimes, especially in large countries with a wide range of agro-ecological conditions (Fischer et al. 2010). Any regional planning for biofuel feedstock expansion or intensification must account for the spatial (and temporal) variations of crop suitability and productivity in order to maximize energy return and GHG effectiveness per land area (Lapola et al. 2009).
3 Focus region India
�
India is the world’s fourth largest primary energy consumer and fourth largest petroleum consumer (EIA 2014). Rapid economic expansion of around 9% (OECD-IEA 2012b) in recent years has increased primary energy demand from 13 EJ in 1990 to 29 EJ in 2010, which is expected to more than double by 2035 (OECD-IEA 2012a). The highest growth rate occurs in the transport sector (WEO 2007), which is driven by road traffic with annual growth rates during recent years of 7 to 10% (USDA 2012). The current 2 EJ (year 2010) energy demand of the transport sector is expected to more than quadruple by 2035 (OECD-IEA 2012a). Diesel and gasoline cover more than 95% of the national transportation fuel requirement. This sector consumes 50% of India’s oil which is for 75% imported (OECD-IEA 2012b). Volatile oil prices and the uncertainty about sustained oil supplies have led the Indian Government to search for alternatives to fossil fuels and promote energy security. Biofuels are considered as a promising option, Biofuels (biodiesel or bioethanol) can be produced locally and can used as substitutes for fossil diesel and gasoline in the transportation sector. The National Biofuel Steering Committee (NBSC) under the Prime Minister had announced a target of substituting 20% of fossil fuel consumption by biodiesel and bioethanol by 2017 (USDA 2014b). The key challenge is to find sustainable feedstocks production systems and to develop sustainable biofuel supply chains for biofuel provision at acceptable costs. The use of biofuels should stimulate rural development through increased employment opportunities, should provide environmental benefits and support the automobile industry with CO2 credits (Riegel 2009).
In India sugar molasses, a by-product of the sugar industry, is the main feedstock for bioethanol production. India has an important sugar cane industry based on 5 Mha of cultivated land with a production potential of 342 Mt in the year 2011 (FAO 2011) Most of the sugarcane production is located in Maharashtra, where more than
Chapter I
4
one-thirds of sugarcane is being produced (DACNET 2007). Further sugarcane is grown in Uttar Pradesh (30%), Tamil Nadu (10%) and Karnataka (7%) states. Part of this production is used for bioethanol (1.2–1.8 Mt per year) (OFID-IIASA 2009) which can be produced from 330 distilleries (USDA 2014b). Support for fuel bioethanol production started in 2003, when India’s government mandated that nine states and four Union territories were required to sell E5, a 5% blend of ethanol in gasoline through its ambitious Ethanol Blending Program (EBP) (USDA 2014b). However, in view of supply constraints from the sugar industry, the original proposal was downsized to only 4 States and later fully suspended OFID-IIASA 2009). The recovery in sugar and molasses output during 2005/2006 generated renewed interest in the ethanol program. In October 2008 the government introduced an E10 mandate (10% blend of ethanol in gasoline) (F.O. Lichts 2008). Bioethanol and alcohol production in India depends largely on availability of sugar molasses.
Since sugarcane production in India is cyclical, bioethanol production also varies with sugar and sugarcane production and therefore does not assure optimum supply levels needed to meet the demand at any given time. Lower sugar molasses availability and consequent higher molasses prices affect the cost of production of bioethanol, thereby disrupting the supply of bioethanol for the blending program at pre-negotiated fixed bioethanol prices (USDA 2014b). Currently bioethanol consumption is restricted to the transportation sector only (Pisces 2011). India produces conventional bioethanol from sugar molasses; production of advanced bioethanol like sweet sorghum and miscanthus is in a nascent phase (research and development) (USDA 2014b).
In the case of biodiesel, India’s commercial production is almost non-existent. Due to high vegetable oil prices in the domestic market, it is not economically feasible to produce biodiesel. The Government of India had launched the National Biodiesel Mission (NBM) after identifying jatropha as the most non-edible tree-borne oilseed for biodiesel production. There are various advantages of growing jatropha as biofuel feedstock especially on marginal land. Jatropha is useful for soil conservation, tolerates marginal soils with low nutrient content, can grow without irrigation in a broad spectrum of rainfall regimes and is reported fairly resistant to pests and diseases (Achten et al. 2008). Yet, so far jatropha productivity is reported to be highly variable. Experiences with jatropha plantation show high uncertainty about the yield (the average being less than half of what was expected) and some ended in failure (Euler and Gorriz, 2004). Despite considerable investment and projects being undertaken in many countries, reliable scientific data on the agronomy of jatropha are not available. The development of jatropha sector hinges on how effectively cultivars performs these tasks and thus helps overcome main constraints, namely mobilisation of land, development of suitable plant varieties and suitable cultivation/harvesting techniques and creation of incentives for the stakeholders.
The Planning Commission of India set an ambitious target of planting 11.2 to 13.4 Mha of land to jatropha by the end of 2012 (USDA 2014b). Even though the central government and several state governments provide fiscal incentives in support of planting jatropha and several public institutions are supporting the biofuel mission (USDA 2014b) today, only small quantities of jatropha and other non-edible oilseeds are crushed for oil, mainly used for lighting. By 2008 more than 700,000 ha of land was brought under jatropha plantation, of which the majority comprises new plantations that are not yet productive (Biswas et al. 2013). As the result, the deadline for blending target of 20% for biodiesel has been postponed from 2011–2012 to 2006–2017 (OFID-IIASA 2009). However, currently, India is one of the largest cultivators of jatropha globally (Upham et al. 2012). Presently, commercial production and marketing of jatropha-based biodiesel in India is small, with estimates varying from 140 to 300 million litres per year (USDA 2012). There are about 6 biodiesel plants with a capacity of 480 million litres in India that produce biodiesel (USDA 2014b).
The critical question is whether there is adequate spare land available in India that is suited for biofuel feedstock production.

Introduction
5
Although India comprises only 2.4% of the world's land area, it supports world’s second largest population of 1.24 billion in 2012 (WDI 2014). India consists of 30 states with a total land area of 327 Mha, of which 54% is agricultural area including 168 Mha cropland and fallow land, and 10 Mha pasture (DACNET 2007). The high population density of nearly 380 persons per km2 and an annual population growth rate of 1.3% (WDI 2014) highlight scarce land availability for food, feed and biofuel production. Limited availability of agriculture land, slow agricultural productivity growth, increasing land demand by growing population, risks of acute food shortages and consequential price rises have prompted India policymakers to launch a large program which promotes biofuel feedstock to be grown on those wastelands that are otherwise unsuited to food or feed production, avoiding possible conflicts of fuel- versus food security and deforestation (USDA 2012). Although wasteland areas are readily available and its land prices are generally low, extent in which wasteland areas may be used for biofuel feedstock production requires a critical and a priori assessment of production potentials of India’s wastelands.
4 Objective and research questions
�
The production of biofuels i) must exclude competition with food and feed supply; ii) does nor directly nor indirectly result in deforestation; iii) does not encroach in protected areas; iv) does not cause in biodiversity loss; v) does not compete for scarce fresh water resources and vi) will not cause land degradation due to inappropriatemanagement; vii) must not contribute to GHG emissions and climate change as result of increased fertilizer usefor crop production intensification or of conversion from crop production to biofuel.
Applying the sustainability criteria outlined above this study aims for a spatially detailed assessment of biomass potentials from spare land (wasteland or otherwise residual land) for biofuel production in Brazil and India. These areas exclude all forests, all cropland and pastures currently used for agricultural production as well as all land in use for urban, industrial or infrastructure purposes. The analysis includes consideration of legally protected areas and areas with high biodiversity value. An iterative sequential downscaling procedure has been implemented to estimate these lands. The framework combines land evaluation methods with socioeconomic and multiple-criteria analysis to evaluate spatial and dynamic aspects of biomass potentials from spare land.
Furthermore the assessment aims to assess potential productivity of selected biofuel feedstocks on derived extents and locations of available spare land. For these areas the suitability and productivity of biofuel feedstocks is estimated and its suitability for biofuel feedstocks including estimates on (i) biophysical production potentials of biofuel feedstocks, (ii) attainable yield and production per district or micro-regions and states, calculated in terms of biomass (t/ha), biofuel equivalent (l/ha) and energy (GJ/ha), (iii) maximum possible amount of biofuels produced from culturable spare land in a grid-cell was determined by optimizing biofuel feedstocks yields in terms of biofuel energy output (GJ/t biomass), (iv) concentration of spare land with prime or good quality land for best performing feedstock and (v) the volume of GHG emissions saved (in CO2 equivalent) due to replacement of fossil transport fuels with biofuels from residual land.
In addition the study aims to identify key factors, which determine potential future uses of culturable spare land and its impact on biofuel production.
Based on the overall objectives a number of research questions are posed:
- Is there adequate spare land available in Brazil and India that is suited for biofuel feedstock production?- Which biofuel feedstocks are suitable to be introduced in these areas?
Chapter I
6
- Which biofuel feedstock yields can be attained, taking into account respective biophysical characteristicsof land?
- What are biofuel feedstock potentials of spare land?- What are biofuel potentials vis-à-vis different biofuel feedstock scenarios?- How much fossil fuels could be replaced?
- How big is the amount of GHG emissions, which could be saved due to replacement of fossil transportfuels with biofuels from spare land?
- Which are the key factors, which determine potential future uses of spare land and its impact on biofuelproduction?
5 Structure of the thesis
�
The thesis is organized in to five chapters (I-V). After introducing the importance of biofuels sustainability criteria’s, the current Biofuel situation in Brazil and India, research subject and questions in chapter I, chapter II and chapter III presents the results for Brazil.
Chapter II presents (i) data, methodology and results of the spatially detailed analysis of Brazil’s downscaled land balances for major land categories; ii) presents quantification of Brazil’s residual land, iii) presents an assessment of the quality of this residual land and iv) discusses key factors, which determine potential future uses of residual land and its impact on biofuel production.
The focus in chapter III is on (i) introducing selected biofuel feedstocks, sugarcane, cassava, miscanthus, soybean and jatropha and its biophysical requirements; (ii) presenting results for biofuel potentials in terms of biomass and biofuels and (iii) discussing potential for reducing GHGs and replacing fossil transport fuels when biofuels are grown on residual land.
Results for India are presented in chapter IV. This chapter presents (i) data and methodology applied for the spatial assessment of biomass yield potentials on culturable wasteland; (ii) results for biofuel potentials for sugarcane, miscanthus and jatropha in terms of biomass and biofuels and (iii) discusses the potential for reducing GHGs and replacing fossil transport fuels when biofuels are grown on culturable wasteland.
Finally, chapter V synthesises the results of the three preceding chapters and provides recommendations for future research.
Additionally, appendix A, B and C provides tables with results for biomass and biofuel potentials of different feedstocks at state, micro-region and district level for Brazil and India.
Brazil’s current and future land balances: Is there residual land for bioenergy production?
� 7
Chapter II
Brazil’s current and future land balances:
Is there residual land for bioenergy production?1
Abstract
�
A new land resources database for Brazil has been created for a 30 arc second (about 1 km2) grid-cell resolution comprising of land intensities of seven major land cover categories being consistent with year 2006 Census agricultural statistics at micro-region level and forest data from the forest resource assessment 2010 by Food and Agriculture Organization at biome level. Spatial allocation (‘downscaling’) algorithms were applied to obtain spatial distributions for i) cropland, ii) pasture, iii) forest, iv) built-up land required for urban, industrial and infrastructure, v) barren and sparsely vegetated land, and vi) water. The remaining unused share in each grid-cell was termed vii) residual land areas. Some 44% of the latter or 37 Mha is not located in the Amazon or in protected areas or in areas of high biodiversity value. This residual-III land equates to 50% of Brazil’s current cropland and is earmarked for potential biofuel feedstock production. Almost one-third of these areas would be very suitable or suitable for crop production. Agricultural demand projections combined with detailed pasture productivity calculations suggest that until 2030 current pasture land areas would be sufficient for both providing feed for Brazil’s increasing cattle herd and land areas for expanding croplands. In this case the 37 Mha residual land could be used for biofuel feedstock production.
Keywords: Brazilian land balance, residual land, sequential downscaling, sustainability criteria
1 Introduction
�
As demand for biofuel on the world market has been increasing, Brazil, today the largest producer and consumer of sugarcane bioethanol, is considered as a major potential supplier of biofuels. Large land endowments and technologically advanced sugarcane agro-industries developed since the 1970s place Brazil in a leading position for producing cheap biofuels with substantial potentials for mitigating human greenhouse gas (GHG) emissions.
Food security and promotion of renewable energy including modern uses of biomass as a source of energy are key goals in developing countries. This has raised the important question whether these concurring goals are conflicting interests impossible to reconcile or whether it is possible to integrate them into a common strategy for sustainable land use.
The availability of land that can be dedicated to agricultural land expansion for bioenergy crop production may be limited and requires careful assessment; more research on availability of land resources is clearly needed (OECD-IEA 2010). Doubts have been raised about the actual benefits of biofuels regarding the mitigation of GHG emissions due to indirect land use changes (Searchinger et al. 2008). There are also questions about potential environmental, social and economic impacts, such as competition with food supply, risks of reducing
��������������������������������������������������������1 Lossau S, Fischer G, Tramberend S, van Velthuizen H, Kleinschmit B, Schomäcker R. Brazil’s current and future land balances: Is there residual land for bioenergy production? Biomass and Bioenergy 2015; 81:452-461. ISSN 0961-9534. doi: http://dx.doi.org/10.1016/j.biombioe.2015.07.024
Chapter II
�8
biodiversity, impacts on water quality and water availability, and lack of benefits to those directly affected by large scale introduction biofuels production (Walter et al. 2011).
These challenges for Brazil endowed with significant land resources and land use change hot spot have both a local and global dimension (Jonas et al. 2014). Brazilian agriculture covering about one-fourth of the countries’ territory has expanded substantially during recent decades and is expected to expand further in response to growing demand for food, livestock feed and biofuel feedstocks (OECD-FAO 2009). At the same time maintaining environmental conservation of biodiversity rich ecosystems and avoiding GHG emissions from deforestation are essential for achieving sustainable land use locally and globally.
Securing food production involves both to meet the increasing demand locally for a rapidly growing middle class and to serve the growing markets for export of agricultural commodities. Brazil is spearheading the development of sugarcane derived bioethanol serving the country’s growing fleet of flex-fuel vehicles (FFVs) and increasing demand from the world market. Today the vast majority of biofuel feedstocks, primarily sugarcane for fuel ethanol production, are grown in the favourable climatic conditions of Brazil’s South-East and Central-East regions. In view of the envisaged expansion of sugarcane, the Brazilian government conducted a broad study identifying areas suitable for sugarcane production (CGEE 2012). In addition new guidelines have been proposed for favouring energy crop feedstock production in underutilized or degraded pasture land and from land under rain-fed cultivation (OECD-IEA 2010).
Land suitability for biofuel production strongly depends on local biophysical conditions and management regimes. Regional planning for biofuel feedstock expansion or intensification must account for the spatial (and temporal) variations of crop suitability and productivity in order to maximize energy return and GHG effectiveness per land area (Lapola et al. 2009).
For these reasons, Daimler AG launched a project in co-operation with the International Institute for Applied System Analysis (IIASA) and Technical University of Berlin to assess the biomass potential for biofuels taking into consideration the following sustainability criteria:
The production of biofuels i) must exclude competition with food and livestock feed supply; ii) does neither directly nor indirectly result in deforestation; iii) does not encroach in protected areas; iv) does not cause biodiversity loss; v) does not compete for scarce fresh water resources and vi) will not cause land degradation due to inappropriate management; vii) must not contribute to GHG emissions and climate change as result of increased fertilizer use for crop production intensification or of conversion from crop production to biofuel.
For complying with the first four of these sustainability criteria an important first step is to assess the availability and quality of available land resources in Brazil. Research presented in this paper contributes here by developing (i) spatially detailed land balances to identify “residual” land; (ii) assess the quality of residual land; (iii) and analyse potential land competition of residual land use for food, livestock feed and bioenergy production.
2 Methodology and data
�
2.1 Assessment of land balances and residual land
For the estimation of Brazil’s residual land areas an as accurate as possible current land use data base is of critical importance. This study combines available recent geographic land use data derived from remote sensing analysis
Brazil’s current and future land balances: Is there residual land for bioenergy production?
� 9
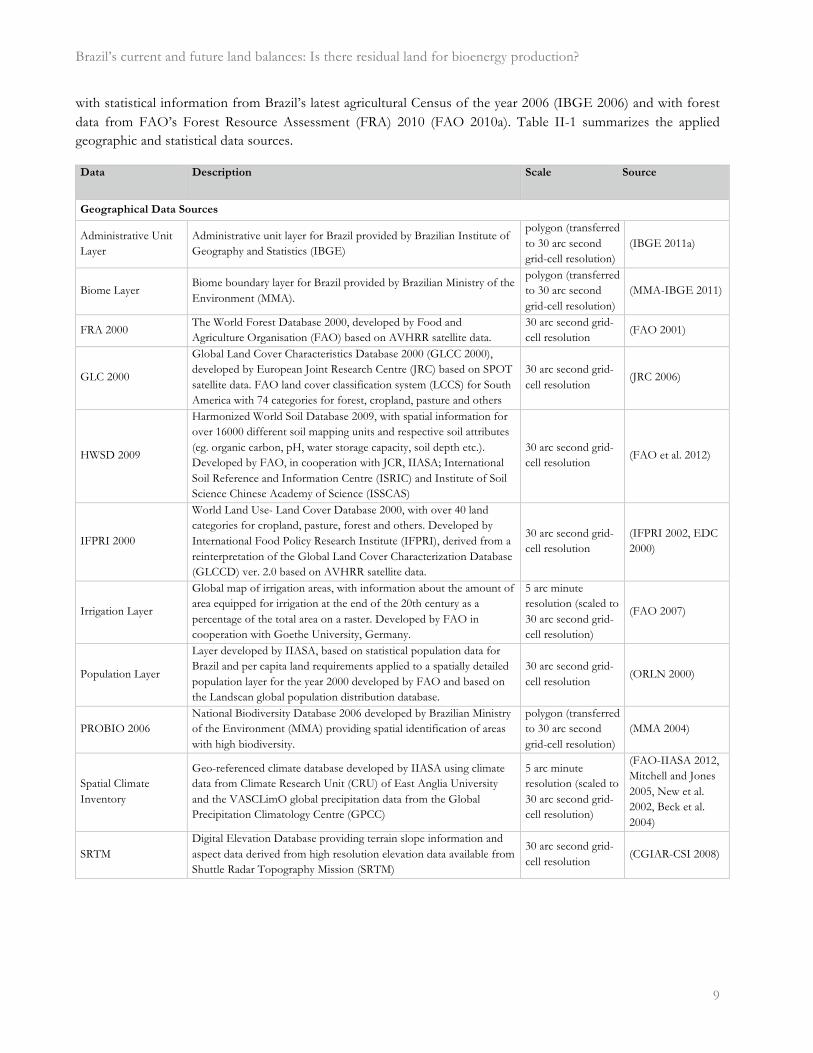
with statistical information from Brazil’s latest agricultural Census of the year 2006 (IBGE 2006) and with forest data from FAO’s Forest Resource Assessment (FRA) 2010 (FAO 2010a). Table II-1 summarizes the applied geographic and statistical data sources.
Data Description Scale Source
Geographical Data Sources
Administrative Unit Layer
Administrative unit layer for Brazil provided by Brazilian Institute of Geography and Statistics (IBGE)
polygon (transferred to 30 arc second grid-cell resolution)
(IBGE 2011a)
Biome Layer Biome boundary layer for Brazil provided by Brazilian Ministry of the Environment (MMA).
polygon (transferred to 30 arc second grid-cell resolution)
(MMA-IBGE 2011)
FRA 2000 The World Forest Database 2000, developed by Food and Agriculture Organisation (FAO) based on AVHRR satellite data.
30 arc second grid-cell resolution
(FAO 2001)
GLC 2000
Global Land Cover Characteristics Database 2000 (GLCC 2000), developed by European Joint Research Centre (JRC) based on SPOT satellite data. FAO land cover classification system (LCCS) for South America with 74 categories for forest, cropland, pasture and others
30 arc second grid-cell resolution
(JRC 2006)
HWSD 2009
Harmonized World Soil Database 2009, with spatial information for over 16000 different soil mapping units and respective soil attributes (eg. organic carbon, pH, water storage capacity, soil depth etc.). Developed by FAO, in cooperation with JCR, IIASA; International Soil Reference and Information Centre (ISRIC) and Institute of Soil Science Chinese Academy of Science (ISSCAS)
30 arc second grid-cell resolution
(FAO et al. 2012)
IFPRI 2000
World Land Use- Land Cover Database 2000, with over 40 land categories for cropland, pasture, forest and others. Developed by International Food Policy Research Institute (IFPRI), derived from a reinterpretation of the Global Land Cover Characterization Database (GLCCD) ver. 2.0 based on AVHRR satellite data.
30 arc second grid-cell resolution
(IFPRI 2002, EDC 2000)
Irrigation Layer
Global map of irrigation areas, with information about the amount of area equipped for irrigation at the end of the 20th century as a percentage of the total area on a raster. Developed by FAO in cooperation with Goethe University, Germany.
5 arc minute resolution (scaled to 30 arc second grid-cell resolution)
(FAO 2007)
Population Layer
Layer developed by IIASA, based on statistical population data for Brazil and per capita land requirements applied to a spatially detailed population layer for the year 2000 developed by FAO and based on the Landscan global population distribution database.
30 arc second grid-cell resolution
(ORLN 2000)
PROBIO 2006 National Biodiversity Database 2006 developed by Brazilian Ministry of the Environment (MMA) providing spatial identification of areas with high biodiversity.
polygon (transferred to 30 arc second grid-cell resolution)
(MMA 2004)
Spatial Climate Inventory
Geo-referenced climate database developed by IIASA using climate data from Climate Research Unit (CRU) of East Anglia University and the VASCLimO global precipitation data from the Global Precipitation Climatology Centre (GPCC)
5 arc minute resolution (scaled to 30 arc second grid-cell resolution)
(FAO-IIASA 2012, Mitchell and Jones 2005, New et al. 2002, Beck et al. 2004)
SRTM Digital Elevation Database providing terrain slope information and aspect data derived from high resolution elevation data available from Shuttle Radar Topography Mission (SRTM)
30 arc second grid-cell resolution
(CGIAR-CSI 2008)
Chapter II
�10
Protected Area Layer
A legally protected areas layer at 30 arc second grid-cell resolution was derived from the protected areas layer of the GAEZ, which is based on the World Database of Protected Areas (WDPA). World Database on Protected Areas including nationally and internationally protected areas developed by World Conversion Monitoring Center of the United Nations Environment Program (UNEP-WCMC) in cooperation with International Union for Conservation of Nature (IUCN)
30 arc second grid-cell resolution
(FAO-IIASA 2012, UNEP 2010)
Statistical Data Sources
Census 2006 Statistical survey data for cropland, pasture and livestock at micro-regional level collected by IBGE
559 micro-regions (IBGE 2006)
FRA 2010 Statistical forest data derived from FAO forest survey 2010 6 biomes (FAO 2010b)
FAOSTAT 2008 Statistical crop production data for the year 2008 derived from FAOs land resource statistics.
country level (FAO 2011)
Table II - 1 Summary of the geographical and statistical data sources
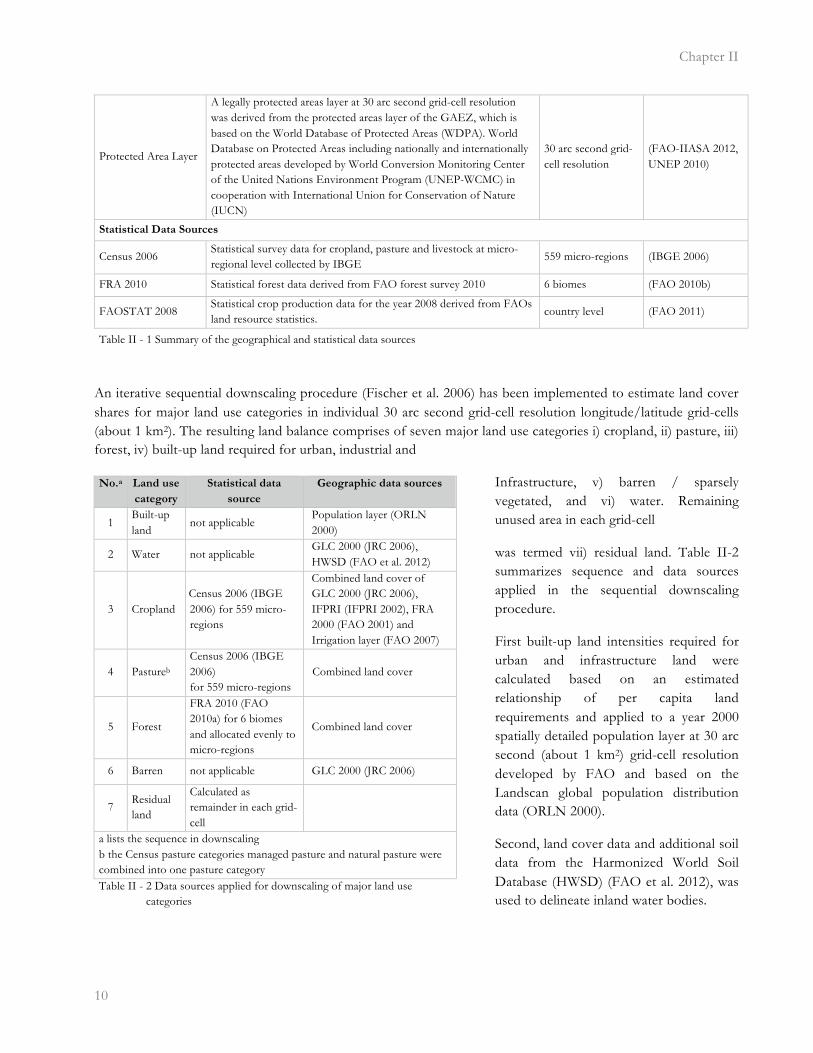
An iterative sequential downscaling procedure (Fischer et al. 2006) has been implemented to estimate land cover shares for major land use categories in individual 30 arc second grid-cell resolution longitude/latitude grid-cells (about 1 km2). The resulting land balance comprises of seven major land use categories i) cropland, ii) pasture, iii) forest, iv) built-up land required for urban, industrial and
Infrastructure, v) barren / sparsely vegetated, and vi) water. Remaining unused area in each grid-cell
was termed vii) residual land. Table II-2 summarizes sequence and data sources applied in the sequential downscaling procedure.
First built-up land intensities required for urban and infrastructure land were calculated based on an estimated relationship of per capita land requirements and applied to a year 2000 spatially detailed population layer at 30 arc second (about 1 km2) grid-cell resolution developed by FAO and based on the Landscan global population distribution data (ORLN 2000).
Second, land cover data and additional soil data from the Harmonized World Soil Database (HWSD) (FAO et al. 2012), was used to delineate inland water bodies.
No.a Land use
category
Statistical data
source
Geographic data sources
1 Built-up land
not applicable Population layer (ORLN 2000)
2 Water not applicable GLC 2000 (JRC 2006), HWSD (FAO et al. 2012)
3 Cropland Census 2006 (IBGE 2006) for 559 micro-regions
Combined land cover of GLC 2000 (JRC 2006), IFPRI (IFPRI 2002), FRA 2000 (FAO 2001) and Irrigation layer (FAO 2007)
4 Pastureb Census 2006 (IBGE 2006) for 559 micro-regions
Combined land cover
5 Forest
FRA 2010 (FAO 2010a) for 6 biomes and allocated evenly to micro-regions
Combined land cover
6 Barren not applicable GLC 2000 (JRC 2006)
7 Residual land
Calculated as remainder in each grid-cell
a lists the sequence in downscaling b the Census pasture categories managed pasture and natural pasture were combined into one pasture category Table II - 2 Data sources applied for downscaling of major land use
categories
Brazil’s current and future land balances: Is there residual land for bioenergy production?
� 11
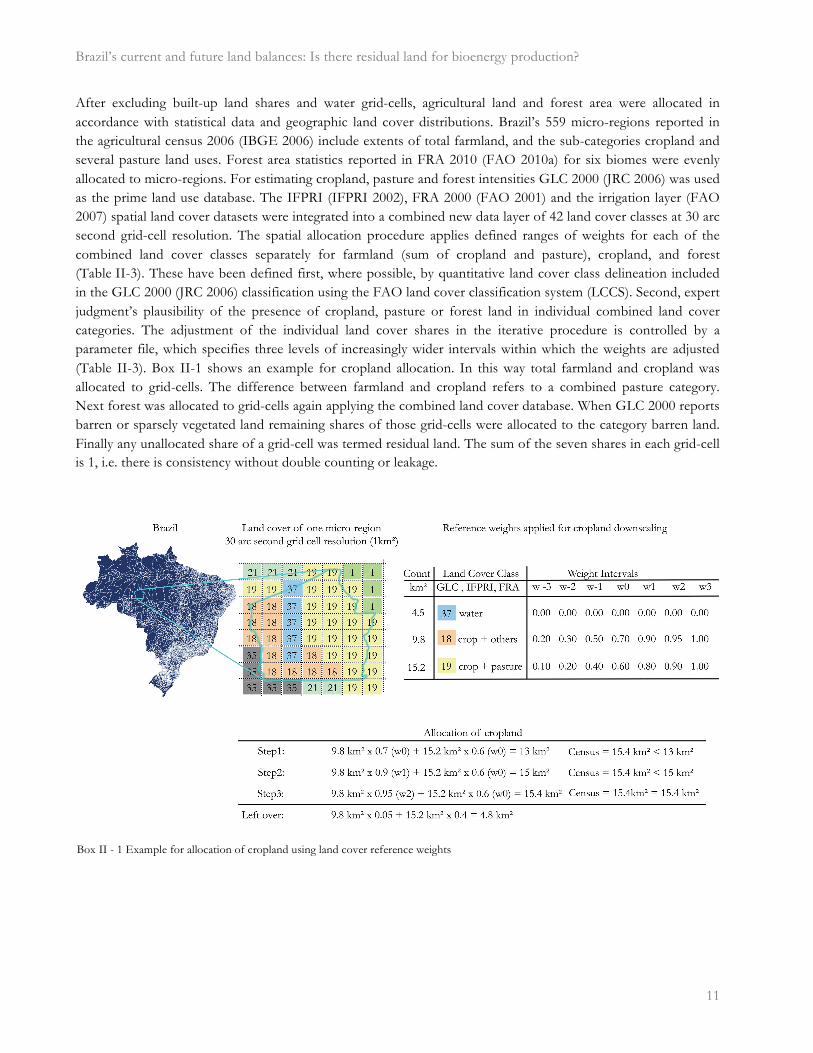
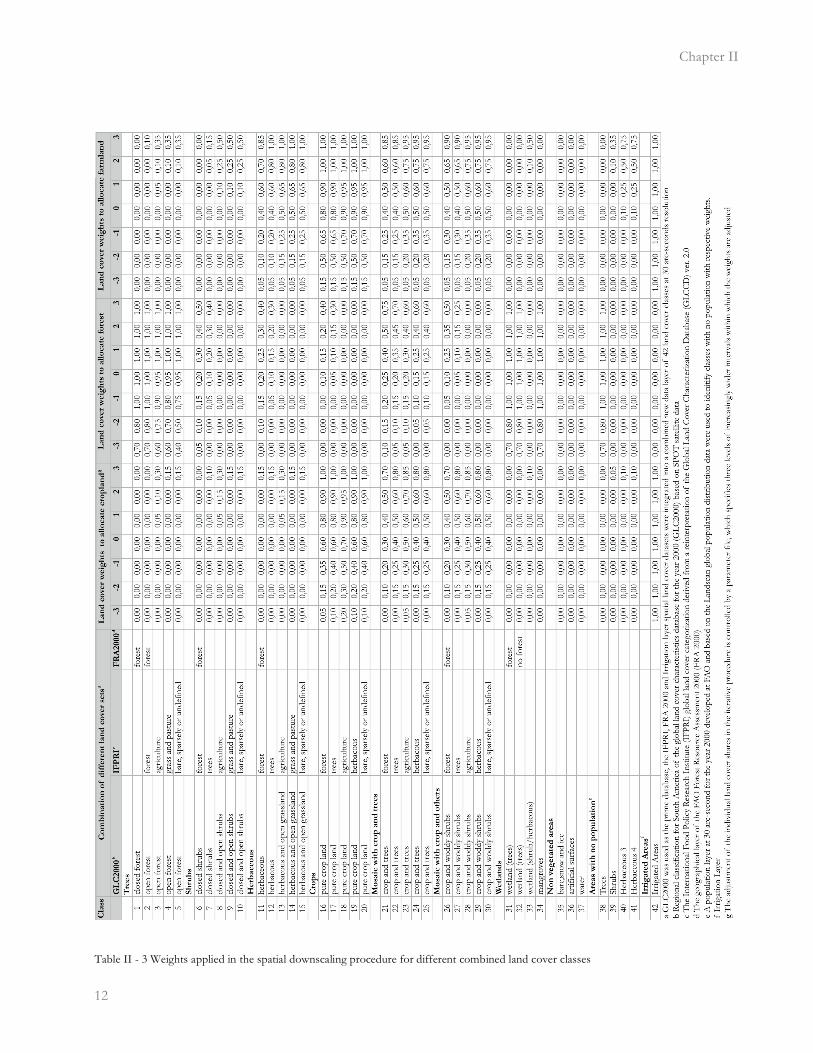
After excluding built-up land shares and water grid-cells, agricultural land and forest area were allocated in accordance with statistical data and geographic land cover distributions. Brazil’s 559 micro-regions reported in the agricultural census 2006 (IBGE 2006) include extents of total farmland, and the sub-categories cropland and several pasture land uses. Forest area statistics reported in FRA 2010 (FAO 2010a) for six biomes were evenly allocated to micro-regions. For estimating cropland, pasture and forest intensities GLC 2000 (JRC 2006) was used as the prime land use database. The IFPRI (IFPRI 2002), FRA 2000 (FAO 2001) and the irrigation layer (FAO 2007) spatial land cover datasets were integrated into a combined new data layer of 42 land cover classes at 30 arc second grid-cell resolution. The spatial allocation procedure applies defined ranges of weights for each of the combined land cover classes separately for farmland (sum of cropland and pasture), cropland, and forest (Table II-3). These have been defined first, where possible, by quantitative land cover class delineation included in the GLC 2000 (JRC 2006) classification using the FAO land cover classification system (LCCS). Second, expert judgment’s plausibility of the presence of cropland, pasture or forest land in individual combined land cover categories. The adjustment of the individual land cover shares in the iterative procedure is controlled by a parameter file, which specifies three levels of increasingly wider intervals within which the weights are adjusted (Table II-3). Box II-1 shows an example for cropland allocation. In this way total farmland and cropland was allocated to grid-cells. The difference between farmland and cropland refers to a combined pasture category. Next forest was allocated to grid-cells again applying the combined land cover database. When GLC 2000 reports barren or sparsely vegetated land remaining shares of those grid-cells were allocated to the category barren land. Finally any unallocated share of a grid-cell was termed residual land. The sum of the seven shares in each grid-cell is 1, i.e. there is consistency without double counting or leakage.
Box II - 1 Example for allocation of cropland using land cover reference weights
Chapter II
�12
Table II - 3 Weights applied in the spatial downscaling procedure for different combined land cover classes
Brazil’s current and future land balances: Is there residual land for bioenergy production?
� 13
2.2 Allocation of residual-I, II and III land
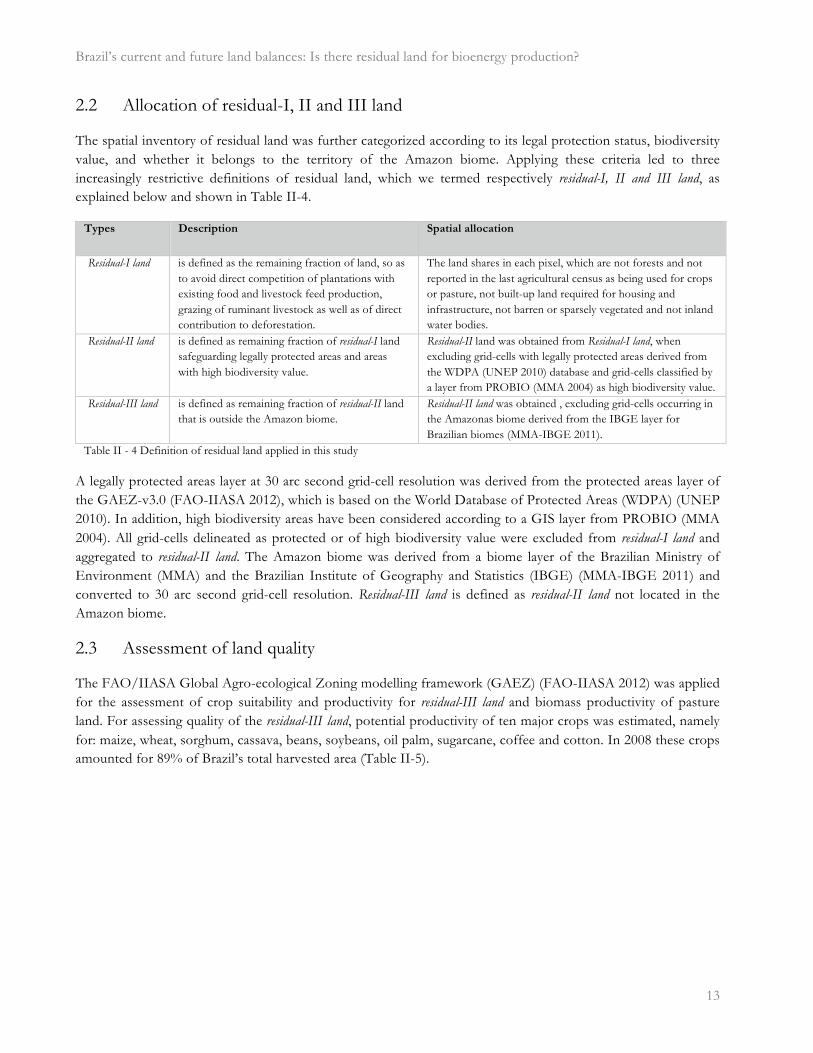
The spatial inventory of residual land was further categorized according to its legal protection status, biodiversity value, and whether it belongs to the territory of the Amazon biome. Applying these criteria led to three increasingly restrictive definitions of residual land, which we termed respectively residual-I, II and III land, as explained below and shown in Table II-4.
Types Description Spatial allocation
Residual-I land is defined as the remaining fraction of land, so as to avoid direct competition of plantations with existing food and livestock feed production, grazing of ruminant livestock as well as of direct contribution to deforestation.
The land shares in each pixel, which are not forests and not reported in the last agricultural census as being used for crops or pasture, not built-up land required for housing and infrastructure, not barren or sparsely vegetated and not inland water bodies.
Residual-II land is defined as remaining fraction of residual-I land safeguarding legally protected areas and areas with high biodiversity value.
Residual-II land was obtained from Residual-I land, when excluding grid-cells with legally protected areas derived from the WDPA (UNEP 2010) database and grid-cells classified by a layer from PROBIO (MMA 2004) as high biodiversity value.
Residual-III land is defined as remaining fraction of residual-II land that is outside the Amazon biome.
Residual-II land was obtained , excluding grid-cells occurring in the Amazonas biome derived from the IBGE layer for Brazilian biomes (MMA-IBGE 2011).
Table II - 4 Definition of residual land applied in this study
A legally protected areas layer at 30 arc second grid-cell resolution was derived from the protected areas layer of the GAEZ-v3.0 (FAO-IIASA 2012), which is based on the World Database of Protected Areas (WDPA) (UNEP 2010). In addition, high biodiversity areas have been considered according to a GIS layer from PROBIO (MMA 2004). All grid-cells delineated as protected or of high biodiversity value were excluded from residual-I land and aggregated to residual-II land. The Amazon biome was derived from a biome layer of the Brazilian Ministry of Environment (MMA) and the Brazilian Institute of Geography and Statistics (IBGE) (MMA-IBGE 2011) and converted to 30 arc second grid-cell resolution. Residual-III land is defined as residual-II land not located in the Amazon biome.
2.3 Assessment of land quality
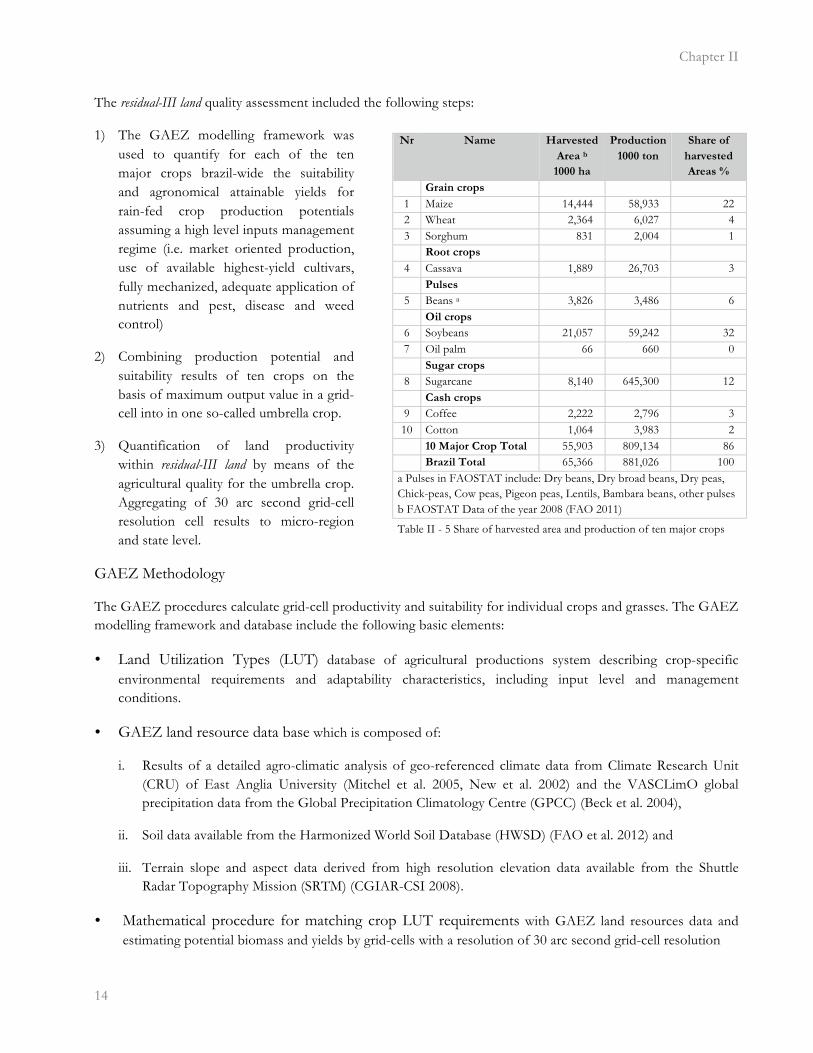
The FAO/IIASA Global Agro-ecological Zoning modelling framework (GAEZ) (FAO-IIASA 2012) was applied for the assessment of crop suitability and productivity for residual-III land and biomass productivity of pasture land. For assessing quality of the residual-III land, potential productivity of ten major crops was estimated, namely for: maize, wheat, sorghum, cassava, beans, soybeans, oil palm, sugarcane, coffee and cotton. In 2008 these crops amounted for 89% of Brazil’s total harvested area (Table II-5).
Chapter II
�14
The residual-III land quality assessment included the following steps:
1) The GAEZ modelling framework wasused to quantify for each of the tenmajor crops brazil-wide the suitabilityand agronomical attainable yields forrain-fed crop production potentialsassuming a high level inputs managementregime (i.e. market oriented production,use of available highest-yield cultivars,fully mechanized, adequate application ofnutrients and pest, disease and weedcontrol)
2) Combining production potential andsuitability results of ten crops on thebasis of maximum output value in a grid-cell into in one so-called umbrella crop.
3) Quantification of land productivitywithin residual-III land by means of theagricultural quality for the umbrella crop.Aggregating of 30 arc second grid-cellresolution cell results to micro-regionand state level.
GAEZ Methodology
The GAEZ procedures calculate grid-cell productivity and suitability for individual crops and grasses. The GAEZ modelling framework and database include the following basic elements:
• Land Utilization Types (LUT) database of agricultural productions system describing crop-specificenvironmental requirements and adaptability characteristics, including input level and managementconditions.
• GAEZ land resource data base which is composed of:
i. Results of a detailed agro-climatic analysis of geo-referenced climate data from Climate Research Unit(CRU) of East Anglia University (Mitchel et al. 2005, New et al. 2002) and the VASCLimO globalprecipitation data from the Global Precipitation Climatology Centre (GPCC) (Beck et al. 2004),
ii. Soil data available from the Harmonized World Soil Database (HWSD) (FAO et al. 2012) and
iii. Terrain slope and aspect data derived from high resolution elevation data available from the ShuttleRadar Topography Mission (SRTM) (CGIAR-CSI 2008).
• Mathematical procedure for matching crop LUT requirements with GAEZ land resources data andestimating potential biomass and yields by grid-cells with a resolution of 30 arc second grid-cell resolution
Nr Name Harvested
Area b
1000 ha
Production
1000 ton
Share of
harvested
Areas %
Grain crops
1 Maize 14,444 58,933 22 2 Wheat 2,364 6,027 4 3 Sorghum 831 2,004 1
Root crops
4 Cassava 1,889 26,703 3 Pulses
5 Beans a 3,826 3,486 6 Oil crops
6 Soybeans 21,057 59,242 32 7 Oil palm 66 660 0
Sugar crops
8 Sugarcane 8,140 645,300 12 Cash crops
9 Coffee 2,222 2,796 3 10 Cotton 1,064 3,983 2
10 Major Crop Total 55,903 809,134 86 Brazil Total 65,366 881,026 100
a Pulses in FAOSTAT include: Dry beans, Dry broad beans, Dry peas, Chick-peas, Cow peas, Pigeon peas, Lentils, Bambara beans, other pulses b FAOSTAT Data of the year 2008 (FAO 2011)
Table II - 5 Share of harvested area and production of ten major crops
Brazil’s current and future land balances: Is there residual land for bioenergy production?
� 15
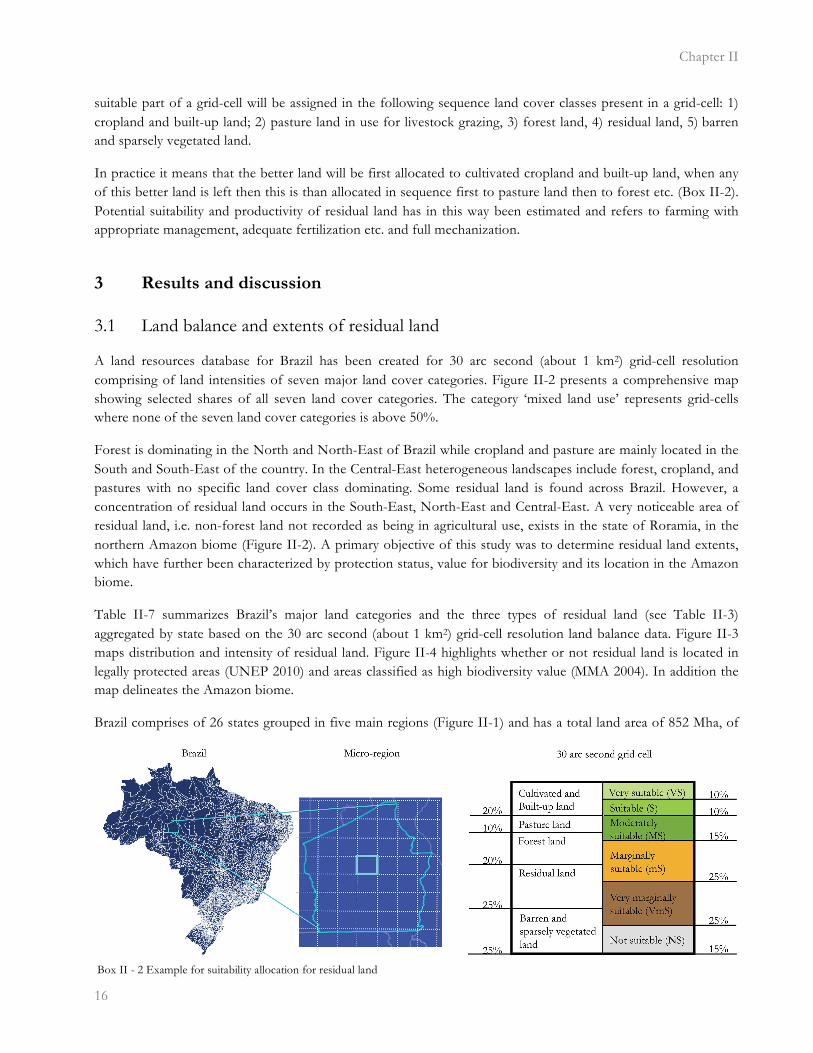
• Mapping and aggregation of grid-cell results providing average yields per administrative unit as well asdistributions of land by suitability in terms of six suitability classes:
VS or very suitable (80–100% of maximum achievable yield in Brazil);
S or suitable (60–80%);
MS or moderately suitable (40–60%);
mS or marginally suitable (20–40%);
VmS or very marginally suitable (5-20%), and
NS or not suitable (less than 5%)
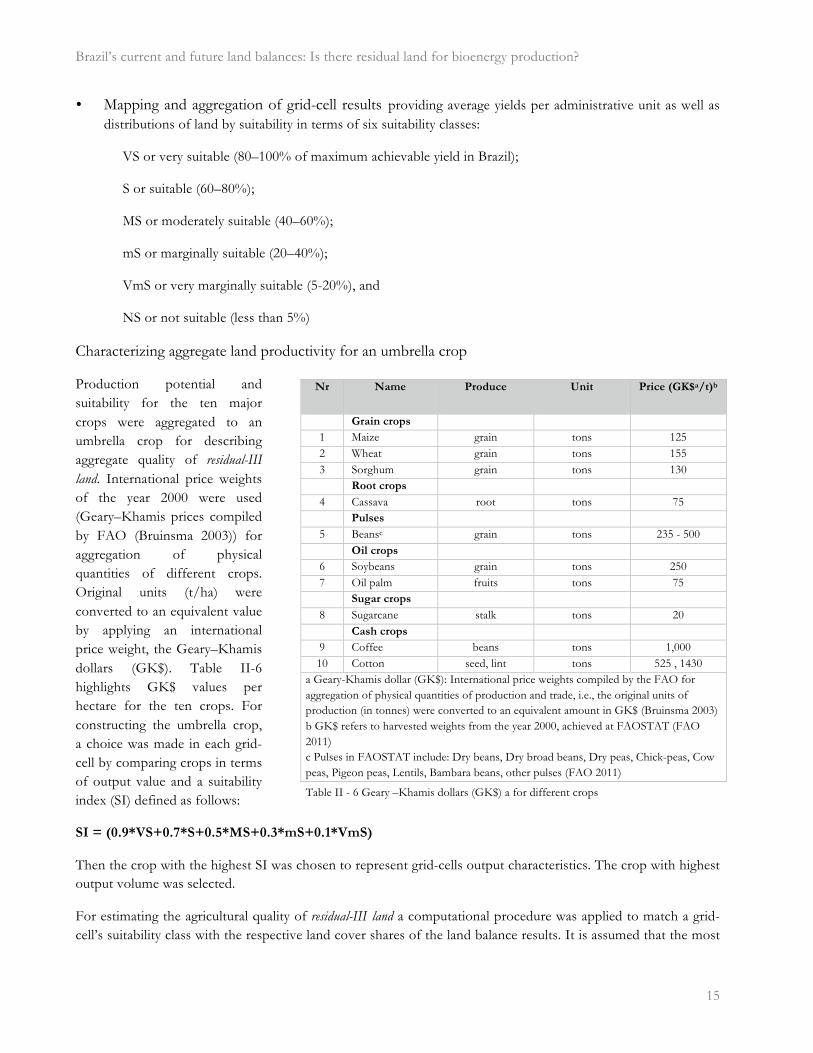
Characterizing aggregate land productivity for an umbrella crop
Production potential and suitability for the ten major crops were aggregated to an umbrella crop for describing aggregate quality of residual-III land. International price weights of the year 2000 were used (Geary–Khamis prices compiled by FAO (Bruinsma 2003)) for aggregation of physical quantities of different crops. Original units (t/ha) were converted to an equivalent value by applying an international price weight, the Geary–Khamis dollars (GK$). Table II-6 highlights GK$ values per hectare for the ten crops. For constructing the umbrella crop, a choice was made in each grid-cell by comparing crops in terms of output value and a suitability index (SI) defined as follows:
SI = (0.9*VS+0.7*S+0.5*MS+0.3*mS+0.1*VmS)
Then the crop with the highest SI was chosen to represent grid-cells output characteristics. The crop with highest output volume was selected.
For estimating the agricultural quality of residual-III land a computational procedure was applied to match a grid-cell’s suitability class with the respective land cover shares of the land balance results. It is assumed that the most
Nr Name Produce Unit Price (GK$a/t)b
Grain crops
1 Maize grain tons 125 2 Wheat grain tons 155 3 Sorghum grain tons 130
Root crops
4 Cassava root tons 75 Pulses
5 Beansc grain tons 235 - 500 Oil crops
6 Soybeans grain tons 250 7 Oil palm fruits tons 75
Sugar crops
8 Sugarcane stalk tons 20 Cash crops
9 Coffee beans tons 1,000 10 Cotton seed, lint tons 525 , 1430
a Geary-Khamis dollar (GK$): International price weights compiled by the FAO for aggregation of physical quantities of production and trade, i.e., the original units of production (in tonnes) were converted to an equivalent amount in GK$ (Bruinsma 2003) b GK$ refers to harvested weights from the year 2000, achieved at FAOSTAT (FAO 2011) c Pulses in FAOSTAT include: Dry beans, Dry broad beans, Dry peas, Chick-peas, Cow peas, Pigeon peas, Lentils, Bambara beans, other pulses (FAO 2011)
Table II - 6 Geary –Khamis dollars (GK$) a for different crops
Chapter II
�16
suitable part of a grid-cell will be assigned in the following sequence land cover classes present in a grid-cell: 1) cropland and built-up land; 2) pasture land in use for livestock grazing, 3) forest land, 4) residual land, 5) barren and sparsely vegetated land.
In practice it means that the better land will be first allocated to cultivated cropland and built-up land, when any of this better land is left then this is than allocated in sequence first to pasture land then to forest etc. (Box II-2). Potential suitability and productivity of residual land has in this way been estimated and refers to farming with appropriate management, adequate fertilization etc. and full mechanization.
3 Results and discussion
�
3.1 Land balance and extents of residual land
A land resources database for Brazil has been created for 30 arc second (about 1 km2) grid-cell resolution comprising of land intensities of seven major land cover categories. Figure II-2 presents a comprehensive map showing selected shares of all seven land cover categories. The category ‘mixed land use’ represents grid-cells where none of the seven land cover categories is above 50%.
Forest is dominating in the North and North-East of Brazil while cropland and pasture are mainly located in the South and South-East of the country. In the Central-East heterogeneous landscapes include forest, cropland, and pastures with no specific land cover class dominating. Some residual land is found across Brazil. However, a concentration of residual land occurs in the South-East, North-East and Central-East. A very noticeable area of residual land, i.e. non-forest land not recorded as being in agricultural use, exists in the state of Roramia, in the northern Amazon biome (Figure II-2). A primary objective of this study was to determine residual land extents, which have further been characterized by protection status, value for biodiversity and its location in the Amazon biome.
Table II-7 summarizes Brazil’s major land categories and the three types of residual land (see Table II-3) aggregated by state based on the 30 arc second (about 1 km2) grid-cell resolution land balance data. Figure II-3 maps distribution and intensity of residual land. Figure II-4 highlights whether or not residual land is located in legally protected areas (UNEP 2010) and areas classified as high biodiversity value (MMA 2004). In addition the map delineates the Amazon biome.
Brazil comprises of 26 states grouped in five main regions (Figure II-1) and has a total land area of 852 Mha, of
Box II - 2 Example for suitability allocation for residual land
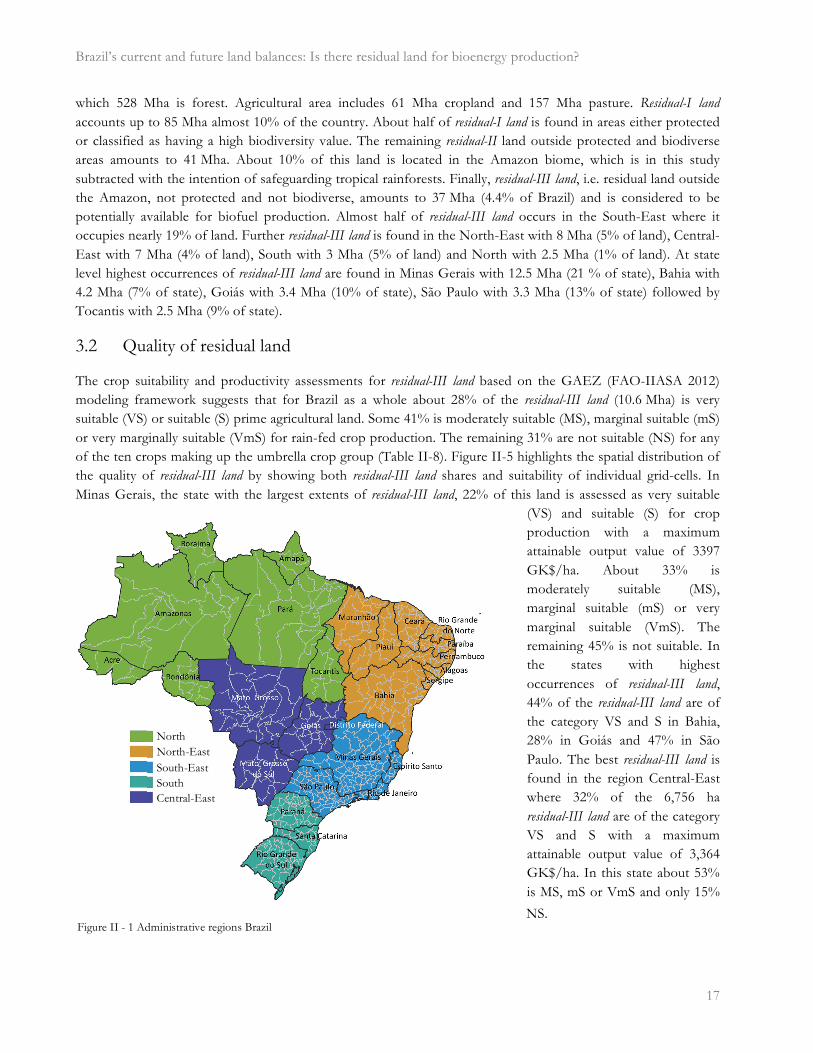
Brazil’s current and future land balances: Is there residual land for bioenergy production?
� 17
which 528 Mha is forest. Agricultural area includes 61 Mha cropland and 157 Mha pasture. Residual-I land accounts up to 85 Mha almost 10% of the country. About half of residual-I land is found in areas either protected or classified as having a high biodiversity value. The remaining residual-II land outside protected and biodiverse areas amounts to 41 Mha. About 10% of this land is located in the Amazon biome, which is in this study subtracted with the intention of safeguarding tropical rainforests. Finally, residual-III land, i.e. residual land outside the Amazon, not protected and not biodiverse, amounts to 37 Mha (4.4% of Brazil) and is considered to be potentially available for biofuel production. Almost half of residual-III land occurs in the South-East where it occupies nearly 19% of land. Further residual-III land is found in the North-East with 8 Mha (5% of land), Central-East with 7 Mha (4% of land), South with 3 Mha (5% of land) and North with 2.5 Mha (1% of land). At state level highest occurrences of residual-III land are found in Minas Gerais with 12.5 Mha (21 % of state), Bahia with 4.2 Mha (7% of state), Goiás with 3.4 Mha (10% of state), São Paulo with 3.3 Mha (13% of state) followed by Tocantis with 2.5 Mha (9% of state).
3.2 Quality of residual land
The crop suitability and productivity assessments for residual-III land based on the GAEZ (FAO-IIASA 2012) modeling framework suggests that for Brazil as a whole about 28% of the residual-III land (10.6 Mha) is very suitable (VS) or suitable (S) prime agricultural land. Some 41% is moderately suitable (MS), marginal suitable (mS) or very marginally suitable (VmS) for rain-fed crop production. The remaining 31% are not suitable (NS) for any of the ten crops making up the umbrella crop group (Table II-8). Figure II-5 highlights the spatial distribution of the quality of residual-III land by showing both residual-III land shares and suitability of individual grid-cells. In Minas Gerais, the state with the largest extents of residual-III land, 22% of this land is assessed as very suitable
(VS) and suitable (S) for crop production with a maximum attainable output value of 3397 GK$/ha. About 33% is moderately suitable (MS), marginal suitable (mS) or very marginal suitable (VmS). The remaining 45% is not suitable. In the states with highest occurrences of residual-III land, 44% of the residual-III land are of the category VS and S in Bahia, 28% in Goiás and 47% in São Paulo. The best residual-III land is found in the region Central-East where 32% of the 6,756 ha residual-III land are of the category VS and S with a maximum attainable output value of 3,364 GK$/ha. In this state about 53% is MS, mS or VmS and only 15%
NS. Figure II - 1 Administrative regions Brazil
North
South-East North-East
South Central-East
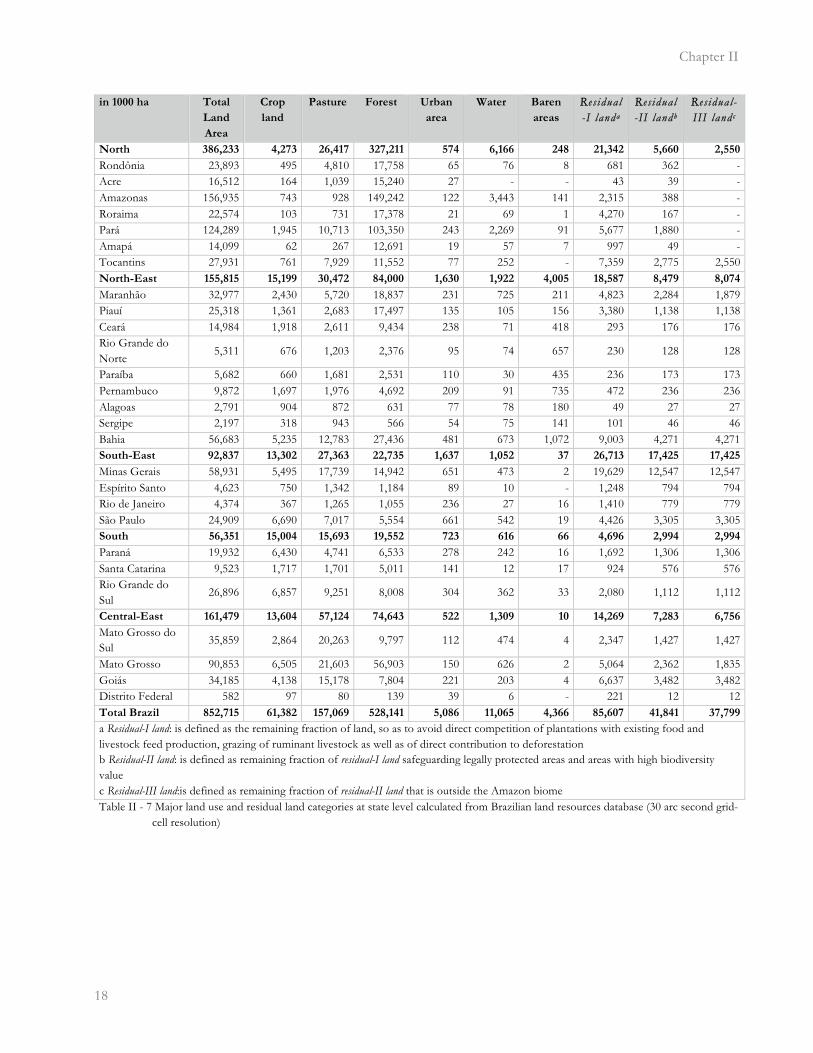
Chapter II
�18
in 1000 ha Total
Land
Area
Crop
land
Pasture Forest Urban
area
Water Baren
areas
RResidual-I landa
RRes idual-II landb
RRes idual -III land c
North 386,233 4,273 26,417 327,211 574 6,166 248 21,342 5,660 2,550
Rondônia 23,893 495 4,810 17,758 65 76 8 681 362 - Acre 16,512 164 1,039 15,240 27 - - 43 39 - Amazonas 156,935 743 928 149,242 122 3,443 141 2,315 388 - Roraima 22,574 103 731 17,378 21 69 1 4,270 167 - Pará 124,289 1,945 10,713 103,350 243 2,269 91 5,677 1,880 - Amapá 14,099 62 267 12,691 19 57 7 997 49 - Tocantins 27,931 761 7,929 11,552 77 252 - 7,359 2,775 2,550 North-East 155,815 15,199 30,472 84,000 1,630 1,922 4,005 18,587 8,479 8,074
Maranhão 32,977 2,430 5,720 18,837 231 725 211 4,823 2,284 1,879 Piauí 25,318 1,361 2,683 17,497 135 105 156 3,380 1,138 1,138 Ceará 14,984 1,918 2,611 9,434 238 71 418 293 176 176 Rio Grande do Norte
5,311 676 1,203 2,376 95 74 657 230 128 128
Paraíba 5,682 660 1,681 2,531 110 30 435 236 173 173 Pernambuco 9,872 1,697 1,976 4,692 209 91 735 472 236 236 Alagoas 2,791 904 872 631 77 78 180 49 27 27 Sergipe 2,197 318 943 566 54 75 141 101 46 46 Bahia 56,683 5,235 12,783 27,436 481 673 1,072 9,003 4,271 4,271 South-East 92,837 13,302 27,363 22,735 1,637 1,052 37 26,713 17,425 17,425
Minas Gerais 58,931 5,495 17,739 14,942 651 473 2 19,629 12,547 12,547 Espírito Santo 4,623 750 1,342 1,184 89 10 - 1,248 794 794 Rio de Janeiro 4,374 367 1,265 1,055 236 27 16 1,410 779 779 São Paulo 24,909 6,690 7,017 5,554 661 542 19 4,426 3,305 3,305 South 56,351 15,004 15,693 19,552 723 616 66 4,696 2,994 2,994
Paraná 19,932 6,430 4,741 6,533 278 242 16 1,692 1,306 1,306 Santa Catarina 9,523 1,717 1,701 5,011 141 12 17 924 576 576 Rio Grande do Sul
26,896 6,857 9,251 8,008 304 362 33 2,080 1,112 1,112
Central-East 161,479 13,604 57,124 74,643 522 1,309 10 14,269 7,283 6,756
Mato Grosso do Sul
35,859 2,864 20,263 9,797 112 474 4 2,347 1,427 1,427
Mato Grosso 90,853 6,505 21,603 56,903 150 626 2 5,064 2,362 1,835 Goiás 34,185 4,138 15,178 7,804 221 203 4 6,637 3,482 3,482 Distrito Federal 582 97 80 139 39 6 - 221 12 12 Total Brazil 852,715 61,382 157,069 528,141 5,086 11,065 4,366 85,607 41,841 37,799
a Residual-I land: is defined as the remaining fraction of land, so as to avoid direct competition of plantations with existing food and livestock feed production, grazing of ruminant livestock as well as of direct contribution to deforestation b Residual-II land: is defined as remaining fraction of residual-I land safeguarding legally protected areas and areas with high biodiversity value c Residual-III land:is defined as remaining fraction of residual-II land that is outside the Amazon biome Table II - 7 Major land use and residual land categories at state level calculated from Brazilian land resources database (30 arc second grid-
cell resolution)

Brazil’s current and future land balances: Is there residual land for bioenergy production?
� 19
Figure II - 2 Brazilian land resources database with land intensities (30 arc second grid-cell resolution)
dominantly forest > 75%
dominantly crop land > 75%
dominantly pasture > 75%
dominantly barren > 75%
dominantly residual > 75%
Major land use categories
mainly forest 50 – 75%
mainly crop land 50 – 75%
mainly pasture 50 – 75%
mainly residual 50 – 75%
crop land & pasture > 50%
mixed land use
urban > 50%
water
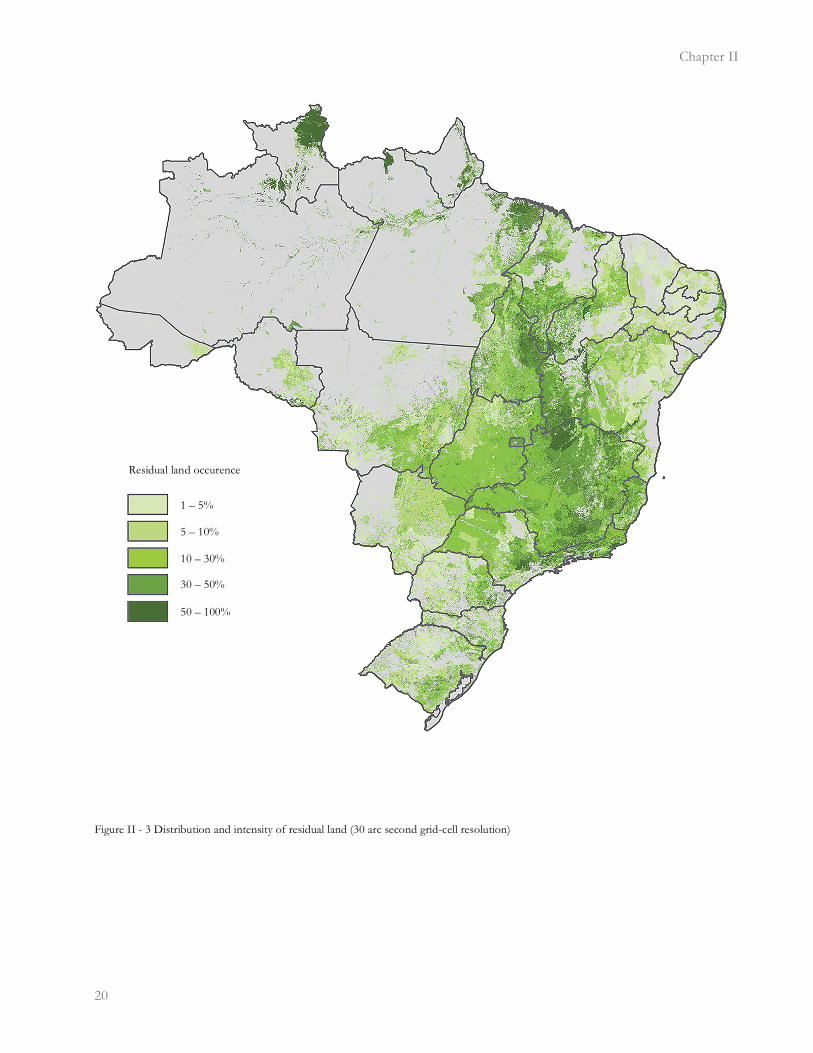
Chapter II
�20
Figure II - 3 Distribution and intensity of residual land (30 arc second grid-cell resolution)
1 – 5%
5 – 10%
10 – 30%
30 – 50%
50 – 100%
Residual land occurence
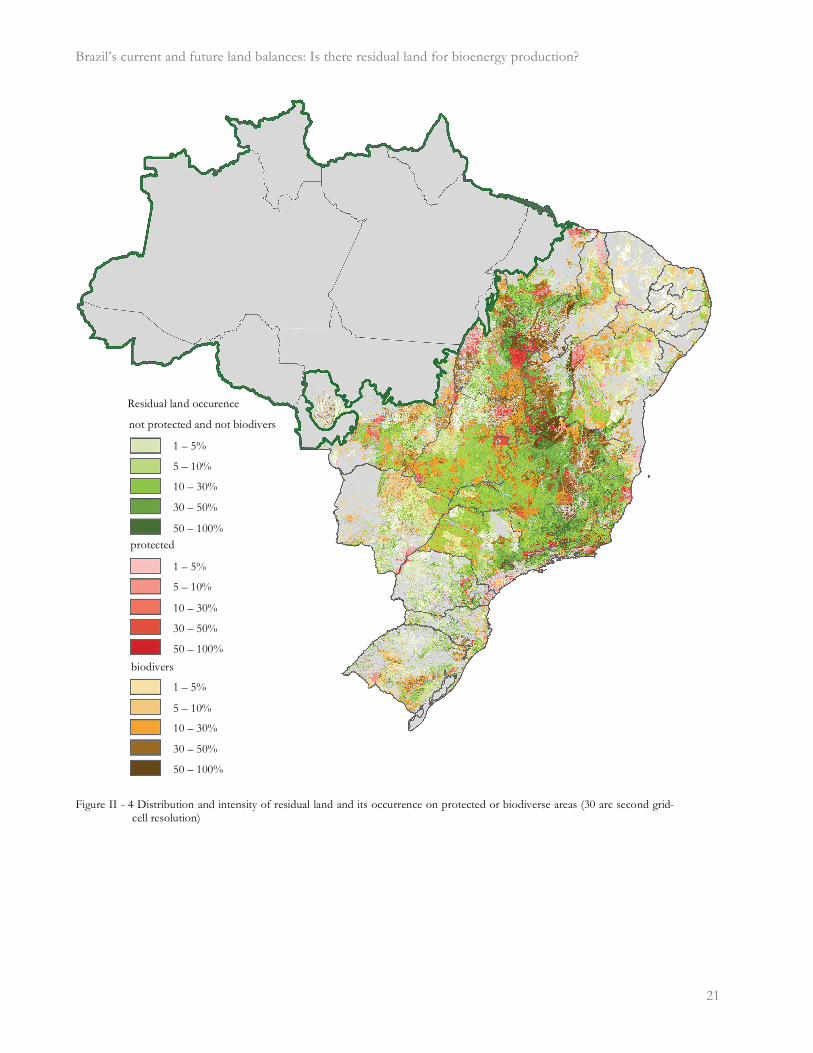
Brazil’s current and future land balances: Is there residual land for bioenergy production?
� 21
Figure II - 4 Distribution and intensity of residual land and its occurrence on protected or biodiverse areas (30 arc second grid-cell resolution)
1 – 5%
5 – 10%
10 – 30%
30 – 50%
50 – 100%
1 – 5%
5 – 10%
10 – 30%
30 – 50%
50 – 100%
1 – 5%
5 – 10%
10 – 30%
30 – 50%
50 – 100%
protected
biodivers
not protected and not biodivers
Residual land occurence
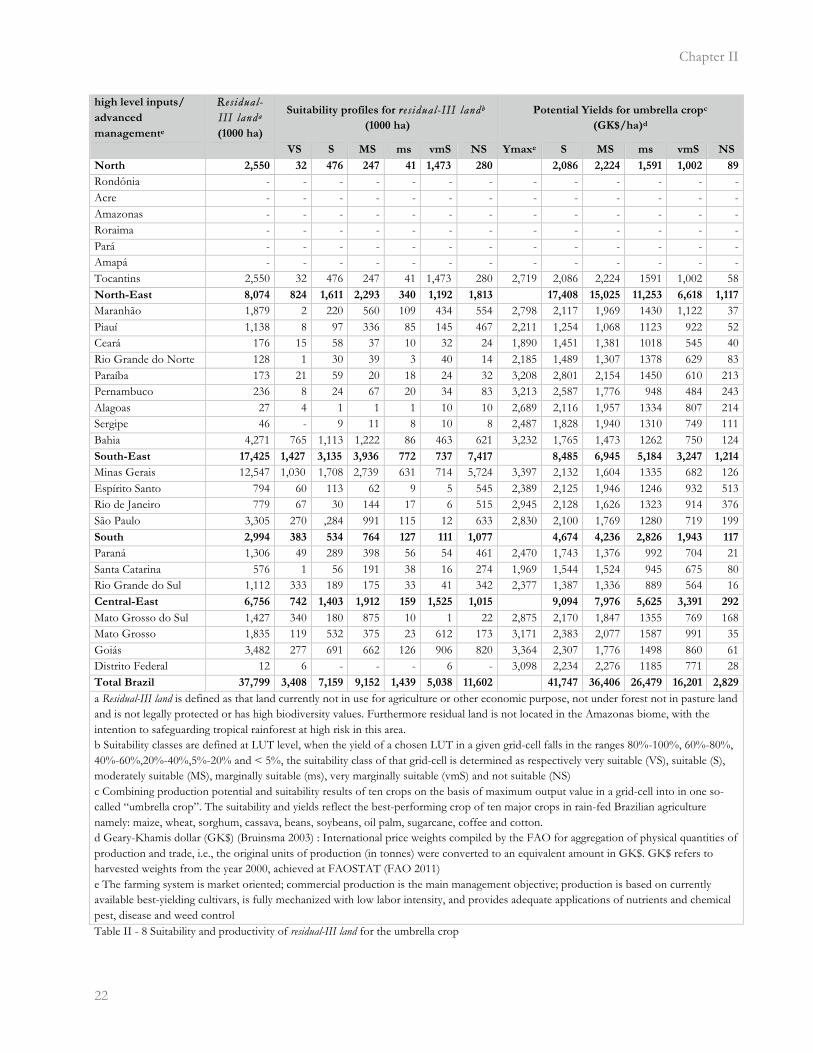
Chapter II
�22
high level inputs/
advanced
managemente
RResidual -III landa
(1000 ha)
Suitability profiles for rres idual -III landb (1000 ha)
Potential Yields for umbrella cropc
(GK$/ha)d
VS S MS ms vmS NS Ymaxe S MS ms vmS NS
North 2,550 32 476 247 41 1,473 280 2,086 2,224 1,591 1,002 89
Rondônia - - - - - - - - - - - - - Acre - - - - - - - - - - - - - Amazonas - - - - - - - - - - - - - Roraima - - - - - - - - - - - - - Pará - - - - - - - - - - - - - Amapá - - - - - - - - - - - - - Tocantins 2,550 32 476 247 41 1,473 280 2,719 2,086 2,224 1591 1,002 58 North-East 8,074 824 1,611 2,293 340 1,192 1,813 17,408 15,025 11,253 6,618 1,117
Maranhão 1,879 2 220 560 109 434 554 2,798 2,117 1,969 1430 1,122 37 Piauí 1,138 8 97 336 85 145 467 2,211 1,254 1,068 1123 922 52 Ceará 176 15 58 37 10 32 24 1,890 1,451 1,381 1018 545 40 Rio Grande do Norte 128 1 30 39 3 40 14 2,185 1,489 1,307 1378 629 83 Paraíba 173 21 59 20 18 24 32 3,208 2,801 2,154 1450 610 213 Pernambuco 236 8 24 67 20 34 83 3,213 2,587 1,776 948 484 243 Alagoas 27 4 1 1 1 10 10 2,689 2,116 1,957 1334 807 214 Sergipe 46 - 9 11 8 10 8 2,487 1,828 1,940 1310 749 111 Bahia 4,271 765 1,113 1,222 86 463 621 3,232 1,765 1,473 1262 750 124 South-East 17,425 1,427 3,135 3,936 772 737 7,417 8,485 6,945 5,184 3,247 1,214
Minas Gerais 12,547 1,030 1,708 2,739 631 714 5,724 3,397 2,132 1,604 1335 682 126 Espírito Santo 794 60 113 62 9 5 545 2,389 2,125 1,946 1246 932 513 Rio de Janeiro 779 67 30 144 17 6 515 2,945 2,128 1,626 1323 914 376 São Paulo 3,305 270 ,284 991 115 12 633 2,830 2,100 1,769 1280 719 199 South 2,994 383 534 764 127 111 1,077 4,674 4,236 2,826 1,943 117
Paraná 1,306 49 289 398 56 54 461 2,470 1,743 1,376 992 704 21 Santa Catarina 576 1 56 191 38 16 274 1,969 1,544 1,524 945 675 80 Rio Grande do Sul 1,112 333 189 175 33 41 342 2,377 1,387 1,336 889 564 16 Central-East 6,756 742 1,403 1,912 159 1,525 1,015 9,094 7,976 5,625 3,391 292
Mato Grosso do Sul 1,427 340 180 875 10 1 22 2,875 2,170 1,847 1355 769 168 Mato Grosso 1,835 119 532 375 23 612 173 3,171 2,383 2,077 1587 991 35 Goiás 3,482 277 691 662 126 906 820 3,364 2,307 1,776 1498 860 61 Distrito Federal 12 6 - - - 6 - 3,098 2,234 2,276 1185 771 28 Total Brazil 37,799 3,408 7,159 9,152 1,439 5,038 11,602 41,747 36,406 26,479 16,201 2,829
a Residual-III land is defined as that land currently not in use for agriculture or other economic purpose, not under forest not in pasture land and is not legally protected or has high biodiversity values. Furthermore residual land is not located in the Amazonas biome, with the intention to safeguarding tropical rainforest at high risk in this area. b Suitability classes are defined at LUT level, when the yield of a chosen LUT in a given grid-cell falls in the ranges 80%-100%, 60%-80%, 40%-60%,20%-40%,5%-20% and < 5%, the suitability class of that grid-cell is determined as respectively very suitable (VS), suitable (S), moderately suitable (MS), marginally suitable (ms), very marginally suitable (vmS) and not suitable (NS) c Combining production potential and suitability results of ten crops on the basis of maximum output value in a grid-cell into in one so-called “umbrella crop”. The suitability and yields reflect the best-performing crop of ten major crops in rain-fed Brazilian agriculture namely: maize, wheat, sorghum, cassava, beans, soybeans, oil palm, sugarcane, coffee and cotton. d Geary-Khamis dollar (GK$) (Bruinsma 2003) : International price weights compiled by the FAO for aggregation of physical quantities of production and trade, i.e., the original units of production (in tonnes) were converted to an equivalent amount in GK$. GK$ refers to harvested weights from the year 2000, achieved at FAOSTAT (FAO 2011) e The farming system is market oriented; commercial production is the main management objective; production is based on currently available best-yielding cultivars, is fully mechanized with low labor intensity, and provides adequate applications of nutrients and chemical pest, disease and weed control Table II - 8 Suitability and productivity of residual-III land for the umbrella crop
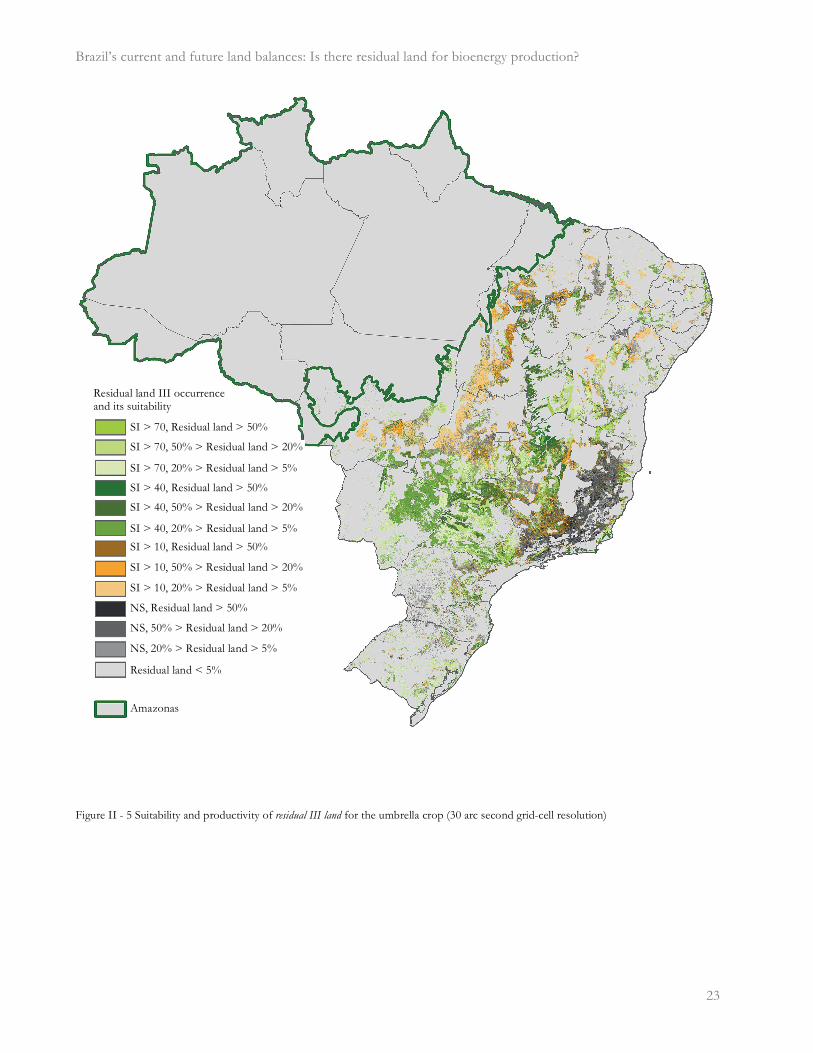
Brazil’s current and future land balances: Is there residual land for bioenergy production?
� 23
�
Figure II - 5 Suitability and productivity of residual III land for the umbrella crop (30 arc second grid-cell resolution)
SI > 70, Residual land > 50%
SI > 70, 50% > Residual land > 20%
SI > 70, 20% > Residual land > 5%
SI > 40, Residual land > 50%
SI > 40, 50% > Residual land > 20%
SI > 40, 20% > Residual land > 5%
SI > 10, Residual land > 50%
SI > 10, 50% > Residual land > 20%
SI > 10, 20% > Residual land > 5%
NS, Residual land > 50%
NS, 50% > Residual land > 20%
NS, 20% > Residual land > 5%
Residual land < 5%
Amazonas
Residual land III occurrence and its suitability

Chapter II
�24
3.3 Residual land for food, livestock feed or biofuel feedstock production?
The above described spatial land balance analysis calculates 87 Mha residual land, of which less than half of this area or 41 Mha are neither protected nor classified as having a high biodiversity value. Further subtracting the Amazon biome suggests 37 Mha of residual land (here termed residual-III land) potentially available for sustainable expansion of biofuel feedstock production. This compares with current cropland and pasture area extents of 61 Mha and 157 Mha (IBGE 2006) respectively.
Future bioenergy production potential on residual land depends on overall developments of Brazil’s agricultural sector. Linkages between food security, biofuel production and environmental conservation are complex and crucially depend on future changes in production intensity (crop yields and livestock feeding efficiency), trade in agricultural products as well as land use regulations. Competition for land resources may increase prices of land and thereby affect production costs and the competitive position of biofuel feedstock production (Fischer et al. 2009).
Brazilian territorial dynamics have been characterized by the rapid expansion of cultivated land in the North-East and Central-East for soybean and cotton production and in the South-East for sugarcane and coffee cultivation (Piketty et al. 2009). Cattle ranching in the Legal Brazilian Amazon correlates significantly with deforestation (Cederberg et al. 2011, Cohn et al. 2011). These land use changes are closely related to large-scale conversion of pastures in southern Brazil to cropland (Lapola et al. 2010, Sparovek et al. 2009). Recently public policy and interventions in beef and soy supply chains have contributed to a 70% decline in deforestation in the Brazilian Amazon. Since 2009 annual deforestation rates were 0.5 to 0.6 Mha (Nepstad et al. 2014).
Results of this study highlight that 28% of residual-III land concentrated in the South-East (4.6 Mha), North-East (2.4 Mha) and Central-East (2.1 Mha) is very suitable or suitable for food and livestock feed crop production (Table II-8) and may thus compete with biofuel feedstock production. About half of residual-III land in the North-East (3.8 Mha) and in the Central-East (3.5 Mha) is of lower suitability for crop production. In these lower land quality areas pasture expansion for beef production may compete with biofuel feedstock.
The following discussion presents estimates on future cropland area requirements and livestock production and discusses implications for potential pasture demand and the availability of residual-III land for bioenergy feedstock production.
Future cropland area requirements
The Foresight project “Global Food and Farming Futures” includes 2010-2030 perspectives on productive capacity of Brazilian agriculture (Santana et al. 2011). It assumes a continuation of historic trends and applies a non-causal forecasting method consisting of univariante time series models and variables of global economic growth, population growth, commodity price development, productivity, and agricultural trade policies. The Ministry of Agriculture, Livestock and Supply (MAPA) used the same methodology for their study “Projections of Agribusiness Brazil 2009/10 to 2019/20” (MAPA-AGE 2009). Scenario analysis in both studies focused on agricultural production, harvested area, consumption and trade for ten dominant crops in Brazil (soybeans, sugarcane, cassava, coffee, cotton, edible beans, maize, rice, sorghum, and wheat). These crops comprised more than 90 % of the total harvested area in 2010 (FAO 2011). Scenario results of MAPA are similar to those produced by Foresight (Santana et al. 2011).
Brazil’s current and future land balances: Is there residual land for bioenergy production?
� 25
Foresight suggests that Brazil’s total harvested area of the ten crops increases by more than 20% (13 Mha) from 62 Mha in 2010 to 75 Mha in 2030. Harvested area increases are due to a significant expansion of soybeans (almost 40% or. 9.3 Mha) and sugarcane (more than 40% or 3.8 Mha). Assuming that growth rates for other crops follow historic trends by 2030 the additional demand for harvested area would be about 14.2 Mha2. Cultivated cropland demand projections depend on the combined effect of developments in harvested area and the multiple cropping practices. Agricultural intensification in Brazil included increased double cropping, intercropping or mixed cropping and shorter fallow periods caused the MCI to increase from 89% in 1990 to 95% in 2009 (FAO 2011). Assuming for 2030 that the MCI remains at the level of 2009 suggests that additional cropland area requirements by 2030 are in the order of 15 Mha.
Livestock production and demand for pasture
The predominant livestock production system is ruminant grazing, relying on year round use of natural and sown pastures (Carvalho 2006, FAO-AGAL 2005). Cattle-rearing is continuously intensifying due to technological developments in animal health, nutrition, breed improvement, introduction of more productive fodder and meadow grasses, improved pasture and livestock management and cattle-rearing systems. In recent years a major trend has been the increasing use of feedlots for finishing cattle before slaughter. Such feeding period takes typically about 70 days. By 2010 some 3 million cattle were finish-fed in feedlots, a four-fold increase over the past two decades (FNP 2011). Another on-going intensification trend is the increase of crop based livestock feed supply, in particular in the dry season. Though, the vast majority or nearly 98% of Brazilian beef production is still based on pasture systems alone.
The Census 2006, reports a cattle herd of 172 million heads and a total utilized pasture area of 157 Mha comprising of three pasture categories, sown pastures (58%), natural pastures (36%) and degraded pastures (6%). As of 2007, the cattle herd size reported in the Census 2006 was adjusted upwards from 172 to 205 million heads in IBGE’s annual publications on ‘Municipal Livestock Production’ (see Table 2 in (IBGE 2011b)) By the end of 2011 Brazil’s cattle herd had further increased to 213 million head (IBGE 2011b).
Estimates on future land demand for raising sustainable cattle herds are based on the feasibility of increasing Brazil’s stocking rates on pasture areas. Several studies suggest Brazil’s sustainable stocking rates can be increased by 2030 to 1.6 (Santana et al. 2011, Sparovek et al. 2012), 1.8 (Princes’ Rainforests Project) or up to 2.5 (IMS 2011a, IMS 2011b) cattle heads per hectare. This would be achieved through a combination of the following measures: (i) sowing of highly productive grasses and adopting rotational livestock grazing systems; (ii) reclamation of degraded pastures; (iii) stimulating productive systems with feedlots; (iv) supplementing with additional livestock feed concentrates in dry periods; (v) encouraging integrated crop-livestock systems.
However, accurate stocking rates are difficult to estimate due to differences in reported pasture areas. The 157 Mha pasture land reported in Census 2006 is similar with data from remote sensing analysis provided by the PROBIO project (MMA 2004) quoted with 148 Mha in 2002 (Bustamante et al. 2012). Sparovek et al. report a total pasture land extent of 211 Mha of which 158 Mha is used for beef-cattle production (Sparovek et al. 2012). The scenarios of a recent Worldbank study (de Gouvello 2010) assume 205 Mha in 2008. The Outlook Brazil 2022 (FIESP-ICONE 2012) applies in their projections pasture land extents of 182 Mha in 2011, which is assumed to decline to 176 Mha by 2022. Both studies project similar trends of slightly declining pasture extents based on the assumption that less pasture is required due to anticipated livestock productivity increases. Finally,
��������������������������������������������������������2 FAOSTAT reports for the year 2010: 65 Mha harvested area for all crops in and 59 Mha harvested area for ten dominant crops (90.7%). 13 Mha * (1+0.907) =14.2 Mha
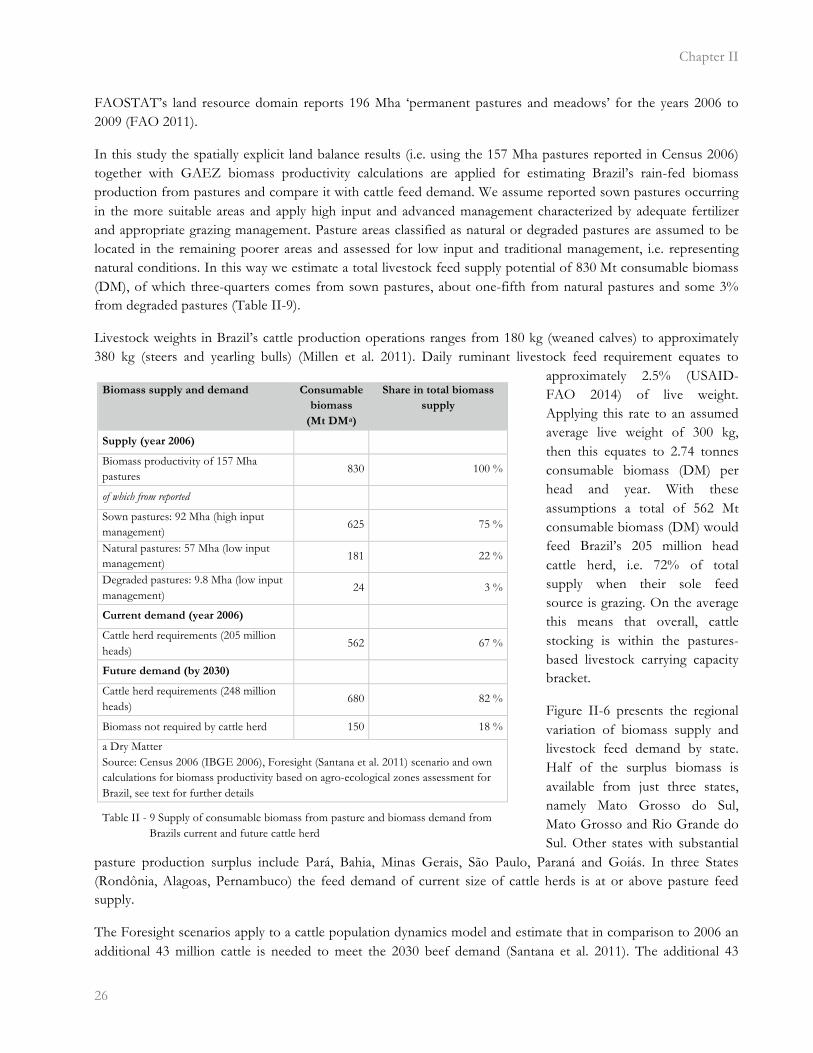
Chapter II
�26
FAOSTAT’s land resource domain reports 196 Mha ‘permanent pastures and meadows’ for the years 2006 to 2009 (FAO 2011).
In this study the spatially explicit land balance results (i.e. using the 157 Mha pastures reported in Census 2006) together with GAEZ biomass productivity calculations are applied for estimating Brazil’s rain-fed biomass production from pastures and compare it with cattle feed demand. We assume reported sown pastures occurring in the more suitable areas and apply high input and advanced management characterized by adequate fertilizer and appropriate grazing management. Pasture areas classified as natural or degraded pastures are assumed to be located in the remaining poorer areas and assessed for low input and traditional management, i.e. representing natural conditions. In this way we estimate a total livestock feed supply potential of 830 Mt consumable biomass (DM), of which three-quarters comes from sown pastures, about one-fifth from natural pastures and some 3% from degraded pastures (Table II-9).
Livestock weights in Brazil’s cattle production operations ranges from 180 kg (weaned calves) to approximately 380 kg (steers and yearling bulls) (Millen et al. 2011). Daily ruminant livestock feed requirement equates to
approximately 2.5% (USAID-FAO 2014) of live weight. Applying this rate to an assumed average live weight of 300 kg, then this equates to 2.74 tonnes consumable biomass (DM) per head and year. With these assumptions a total of 562 Mt consumable biomass (DM) would feed Brazil’s 205 million head cattle herd, i.e. 72% of total supply when their sole feed source is grazing. On the average this means that overall, cattle stocking is within the pastures-based livestock carrying capacity bracket.
Figure II-6 presents the regional variation of biomass supply and livestock feed demand by state. Half of the surplus biomass is available from just three states, namely Mato Grosso do Sul, Mato Grosso and Rio Grande do Sul. Other states with substantial
pasture production surplus include Pará, Bahia, Minas Gerais, São Paulo, Paraná and Goiás. In three States (Rondônia, Alagoas, Pernambuco) the feed demand of current size of cattle herds is at or above pasture feed supply.
The Foresight scenarios apply to a cattle population dynamics model and estimate that in comparison to 2006 an additional 43 million cattle is needed to meet the 2030 beef demand (Santana et al. 2011). The additional 43
Biomass supply and demand Consumable
biomass
(Mt DMa)
Share in total biomass
supply
Supply (year 2006)
Biomass productivity of 157 Mha pastures
830 100 %
of which from reported
Sown pastures: 92 Mha (high input management)
625 75 %
Natural pastures: 57 Mha (low input management)
181 22 %
Degraded pastures: 9.8 Mha (low input management)
24 3 %
Current demand (year 2006)
Cattle herd requirements (205 million heads)
562 67 %
Future demand (by 2030)
Cattle herd requirements (248 million heads)
680 82 %
Biomass not required by cattle herd 150 18 %
a Dry Matter Source: Census 2006 (IBGE 2006), Foresight (Santana et al. 2011) scenario and own calculations for biomass productivity based on agro-ecological zones assessment for Brazil, see text for further details
Table II - 9 Supply of consumable biomass from pasture and biomass demand from Brazils current and future cattle herd
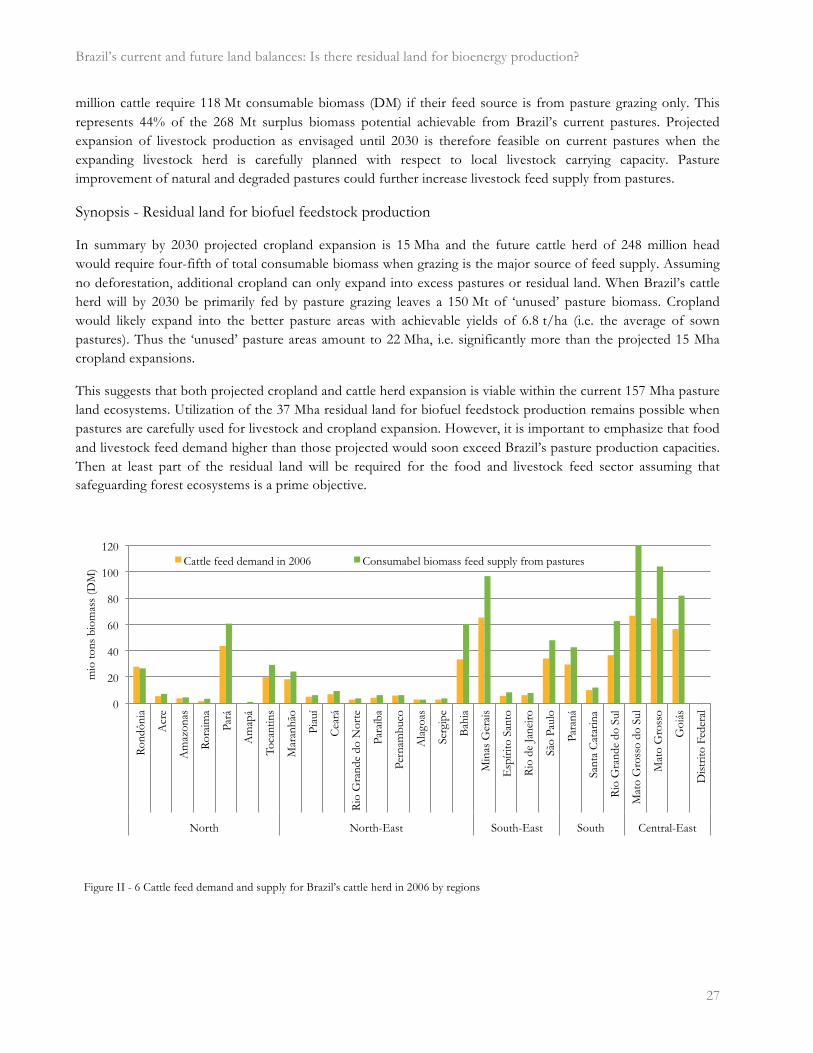
Brazil’s current and future land balances: Is there residual land for bioenergy production?
� 27
million cattle require 118 Mt consumable biomass (DM) if their feed source is from pasture grazing only. This represents 44% of the 268 Mt surplus biomass potential achievable from Brazil’s current pastures. Projected expansion of livestock production as envisaged until 2030 is therefore feasible on current pastures when the expanding livestock herd is carefully planned with respect to local livestock carrying capacity. Pasture improvement of natural and degraded pastures could further increase livestock feed supply from pastures.
Synopsis - Residual land for biofuel feedstock production
In summary by 2030 projected cropland expansion is 15 Mha and the future cattle herd of 248 million head would require four-fifth of total consumable biomass when grazing is the major source of feed supply. Assuming no deforestation, additional cropland can only expand into excess pastures or residual land. When Brazil’s cattle herd will by 2030 be primarily fed by pasture grazing leaves a 150 Mt of ‘unused’ pasture biomass. Cropland would likely expand into the better pasture areas with achievable yields of 6.8 t/ha (i.e. the average of sown pastures). Thus the ‘unused’ pasture areas amount to 22 Mha, i.e. significantly more than the projected 15 Mha cropland expansions.
This suggests that both projected cropland and cattle herd expansion is viable within the current 157 Mha pasture land ecosystems. Utilization of the 37 Mha residual land for biofuel feedstock production remains possible when pastures are carefully used for livestock and cropland expansion. However, it is important to emphasize that food and livestock feed demand higher than those projected would soon exceed Brazil’s pasture production capacities. Then at least part of the residual land will be required for the food and livestock feed sector assuming that safeguarding forest ecosystems is a prime objective.
0
20
40
60
80
100
120
Ron
dôni
a
Acr
e
Am
azon
as
Ror
aim
a
Pará
Am
apá
Toca
ntin
s
Mar
anhã
o
Piau
í
Cea
rá
Rio
Gra
nde
do N
orte
Para
íba
Pern
ambu
co
Ala
goas
Serg
ipe
Bah
ia
Min
as G
erai
s
Esp
írito
San
to
Rio
de
Jane
iro
São
Paul
o
Para
ná
Sant
a C
atar
ina
Rio
Gra
nde
do S
ul
Mat
o G
ross
o do
Sul
Mat
o G
ross
o
Goi
ás
Dis
trito
Fed
eral
North North-East South-East South Central-East
mio
tons
bio
mas
s (D
M)
Cattle feed demand in 2006 Consumabel biomass feed supply from pastures
Figure II - 6 Cattle feed demand and supply for Brazil’s cattle herd in 2006 by regions
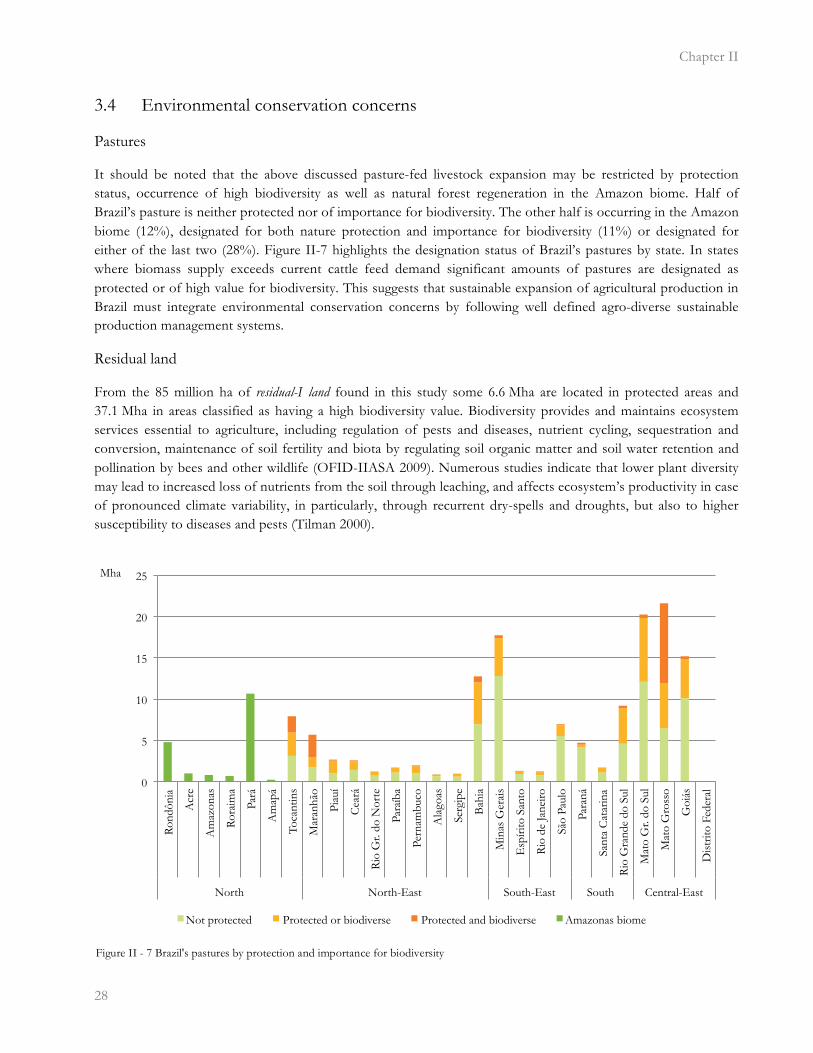
Chapter II
�28
3.4 Environmental conservation concerns
Pastures
It should be noted that the above discussed pasture-fed livestock expansion may be restricted by protection status, occurrence of high biodiversity as well as natural forest regeneration in the Amazon biome. Half of Brazil’s pasture is neither protected nor of importance for biodiversity. The other half is occurring in the Amazon biome (12%), designated for both nature protection and importance for biodiversity (11%) or designated for either of the last two (28%). Figure II-7 highlights the designation status of Brazil’s pastures by state. In states where biomass supply exceeds current cattle feed demand significant amounts of pastures are designated as protected or of high value for biodiversity. This suggests that sustainable expansion of agricultural production in Brazil must integrate environmental conservation concerns by following well defined agro-diverse sustainable production management systems.
Residual land
From the 85 million ha of residual-I land found in this study some 6.6 Mha are located in protected areas and 37.1 Mha in areas classified as having a high biodiversity value. Biodiversity provides and maintains ecosystem services essential to agriculture, including regulation of pests and diseases, nutrient cycling, sequestration and conversion, maintenance of soil fertility and biota by regulating soil organic matter and soil water retention and pollination by bees and other wildlife (OFID-IIASA 2009). Numerous studies indicate that lower plant diversity may lead to increased loss of nutrients from the soil through leaching, and affects ecosystem’s productivity in case of pronounced climate variability, in particularly, through recurrent dry-spells and droughts, but also to higher susceptibility to diseases and pests (Tilman 2000).
0
5
10
15
20
25
Ron
dôni
a
Acr
e
Am
azon
as
Ror
aim
a
Pará
Am
apá
Toca
ntin
s
Mar
anhã
o
Piau
í
Cea
rá
Rio
Gr.
do N
orte
Para
íba
Pern
ambu
co
Ala
goas
Serg
ipe
Bah
ia
Min
as G
erai
s
Esp
írito
San
to
Rio
de
Jane
iro
São
Paul
o
Para
ná
Sant
a C
atar
ina
Rio
Gra
nde
do S
ul
Mat
o G
r. do
Sul
Mat
o G
ross
o
Goi
ás
Dis
trito
Fed
eral
North North-East South-East South Central-East
Mha
Not protected Protected or biodiverse Protected and biodiverse Amazonas biome
Figure II - 7 Brazil's pastures by protection and importance for biodiversity
Brazil’s current and future land balances: Is there residual land for bioenergy production?
� 29
When residual land would be used for biofuel feedstock production increasing biofuel production presents both opportunity and challenges from an environmental perspective. The diversity of potential biofuel feedstocks may create an opportunity for large-scale conversion of monoculture production systems (IATP 2008) to diversified agricultural cropping systems generating more environmental benefits from agricultural land, while keeping farmers on the land. Non-traditional feedstocks (cassava, jatropha, miscanthus) are particularly suited for low input production systems. On the other hand current trends in the biofuel industry with conventional biofuel feedstocks grown on large scale monocultures with high levels of fertilizer applications and biocides usage to control weeds or combat pest and diseases may strongly reduce local and regional biodiversity.
4 Scope and limitations of the study
�
Results need to be considered in the context of the following scope and limitations of the study:
• One of the challenges has been to deal with existing land cover datasets and its lack of consistency on thelocation and type of current land use. By comparing results of remote sensing products interpretations withCensus data, weaknesses and strengths of individual products became apparent and had to be dealt with byusing appropriate algorithms developed for this very purpose at IIASA.
• A 30 arc second grid-cell resolution (about 1 km2) was chosen reflecting the grid-cell size of the remotesensing products. Although 1 km2 can be considered as a high resolution for a large country such as Brazil,the majority of agriculture fields and parcels are much smaller. Especially cultivated land occurs inheterogeneous land cover associations. Another issue refers to the difficulty to distinguish between cultivatedland, pasture land, shrub land, woodland and plantations in remote sensing interpretations (You et al. 2008).
• While the Census 2006 provide the most recent and complete agricultural statistics of Brazil it should benoted that the Census is based on an enumeration at the level of the agricultural holding, i.e., the economicunit dedicated to agricultural production under single management, regardless area size, title, legal form,production purposes or value. The Census data do not account for the remaining non-agricultural part of amicro-region (IBGE 2006).
5 Conclusions
�
A new land resources database for Brazil has been created for a 30 arc second grid-cell resolution comprising of land intensities of major land cover categories being consistent with year 2006 census agricultural statistics at micro-regions and FRA 2010 forest areas at biome. Spatial allocation (‘downscaling’) algorithms were applied to obtain spatial distributions of land use categories including a remaining unused share in each grid-cell, termed ‘residual land’ areas.
Residual-III land, not located in the Amazon or in protected areas or in areas of high biodiversity value, is earmarked for potential biofuel feedstock production. A total of 37 Mha of residual-III land (4.4% of Brazil) were found throughout the country. This equates to 60% of Brazil’s current cropland and underlines the results of various studies that there is surplus land available in Brazil. Almost half of residual-III land occurs in the South-East where it occupies almost 20% of land. Other regions with residual-III land include the North-East (8 Mha), Central-East (7 Mha) and South (3 Mha). One third of residual-III land is found in one state, Minas Gerais
Chapter II
�30
(12.5 Mha). Land productivity of residual land varies. About 28% of the residual-III land is prime agricultural land, 41% is moderate to marginally suitable while the remaining 31% is not suitable for crop production.
Although the current use of residual land is unknown, we assessed competition between food, livestock feed and bioenergy feedstock production. Agricultural demand projections combined with detailed pasture productivity calculations suggest that until 2030 current pasture land areas would be sufficient for both providing feed for Brazil’s increasing cattle herd and land areas for expanding croplands. In this case the 37 Mha residual land could be used for biofuel feedstock production.
The analysis emphasizes that increasing stocking density on pastures is to be planned carefully. It is important to highlight that some states are already close to their pasture livestock carrying capacity and would need to rely on additional livestock feed sources such as fodder crops (from cultivated land), crop residues and by-products.
The prevalence and overall quality of residual land across Brazil provide a basis for assessing agronomic potential for specific biofuel feedstocks in different regions. Depending on type of feedstock, land quality and conversion technology, substantial quantities of biofuel feedstocks could be produced on residual-III land. However, not all land with identified technical potential of residual land qualifies equally for the practical implementation of biofuel feedstock plantations. Hence, in addition to the quality and suitability of residual land also location-specific investment requirement and transport cost as well as future demand for food, livestock feed and pasture land will play an important role in the discussion of residual land potentials for biofuel feedstocks.
Food and livestock feed demand higher than those projected for 2030 would exceed Brazil’s pasture production capacities, then at least part of the residual land will be required for the food and livestock feed sector assuming that safeguarding forest ecosystems is a prime objective.
Further research
The focus of a follow-up research is the assessment of production potentials of key biofuel feedstocks on residual- III land. Established feedstocks, in particular sugarcane and soybean, are compared with alternative biofuel feedstocks such as cassava, jatropha and miscanthus.
Acknowledgement
�
The authors thank Daimler for the jointly work and Professor Sobral from University of Pernambuco for kindly providing information on available land use data for Brazil. We would like to acknowledge the importance of the funding provided by the Wissenschaftlicher Beirat der Bundesregierung Globale Umweltveränderungen (WBGU), within the scope of the Young Scientist Summer Program (YSSP), organized by the International Institute for Systems analysis (IIASA)
� 31
Biofuels from Residual Land in Brazil: Agro-ecological assessment for Sugarcane, Cassava, Miscanthus, Soybean and Jatropha
Chapter III
Biofuels from Residual Land in Brazil:
Agro-ecological assessment for Sugarcane, Cassava, Miscanthus, Soybean and
Jatropha3
Abstract
�
A spatially detailed assessment of available residual land in Brazil finds 37 Mha of residual land, of which Legal Amazonia, highly biodiverse ecosystems and protected areas are excluded. This residual land equates to 4.4 % of Brazil’s geographical area and compares to about 50% of Brazil’s current land used for crop cultivation.
This residual land has been assessed for potential biofuel feedstock cultivation. Potential productivity is expressed in (t/ha) and biofuel equivalents (l/t). Potential performance of the established feedstocks, sugarcane and soybean, has been compared with alternative biofuel feedstocks i.e., cassava, jatropha and miscanthus. Almost three-quarters of residual land is found, to some degree, suitable for biofuel feedstock production. Most productive on residual land is miscanthus (62 billion litres of bioethanol), followed sugarcane and cassava with respectively 34 billion litres and 31 billion litres bioethanol. Production potentials of the same residual land for biodiesel production vary between 18 billion litres for jatropha and 7 billion litres for soybeans. Energy potentials of residual land ranges between 242 PJ (biodiesel from soybeans) to 1,320 PJ (bioethanol from miscanthus). Further, for residual land share in a grid-cell the maximum amount of biofuel energy, was determined by selecting for each grid-cell the best yielding biofuel feedstocks in terms of biofuel energy output. The assessment also addresses greenhouse gas saving potential (ton CO2eq) and replacement potentials of fossil transport fuels in Brazil.
Keywords: Residual land, GAEZ methodology, Biofuel, Brazil, GHG savings
1 Introduction
�
1.1 Importance of biofuels, sustainability criteria
The transport sector enhances societal cohesion through human mobility and contributes to economic growth through effective and efficient movement of goods and services. Demographic changes and economic growth will cause a more than a doubling of world transport capacity over the next half century and substantially increase fuel demand, particularly in the developing countries (OFID-IIASA 2009). The automotive industry has made considerable progress regarding alternative motorization systems like electric/hybrid vehicles and fuel cell cars. But these mobility concepts will not be available in the short term. The challenges associated with range, infrastructure, recharging time, and uniform service station docking standards must be overcome before electric mobility becomes a practical everyday option (Daimler 2009). The combustion engine will continue to be the dominant engine system for many years to come, especially for freight transport. Therefore the automotive
��������������������������������������������������������
3 Lossau S, Fischer G, Tramberend S, van Velthuizen H, Kleinschmit B, Schomäcker R. Biofuels from Residual Land in Brazil: Agro-ecological assessment for Sugarcane, Cassava, Miscanthus, Soybean and Jatropha. Forthcoming at Biomass and Bioenergy, Elsevier B.V, Amsterdam, Netherlands�
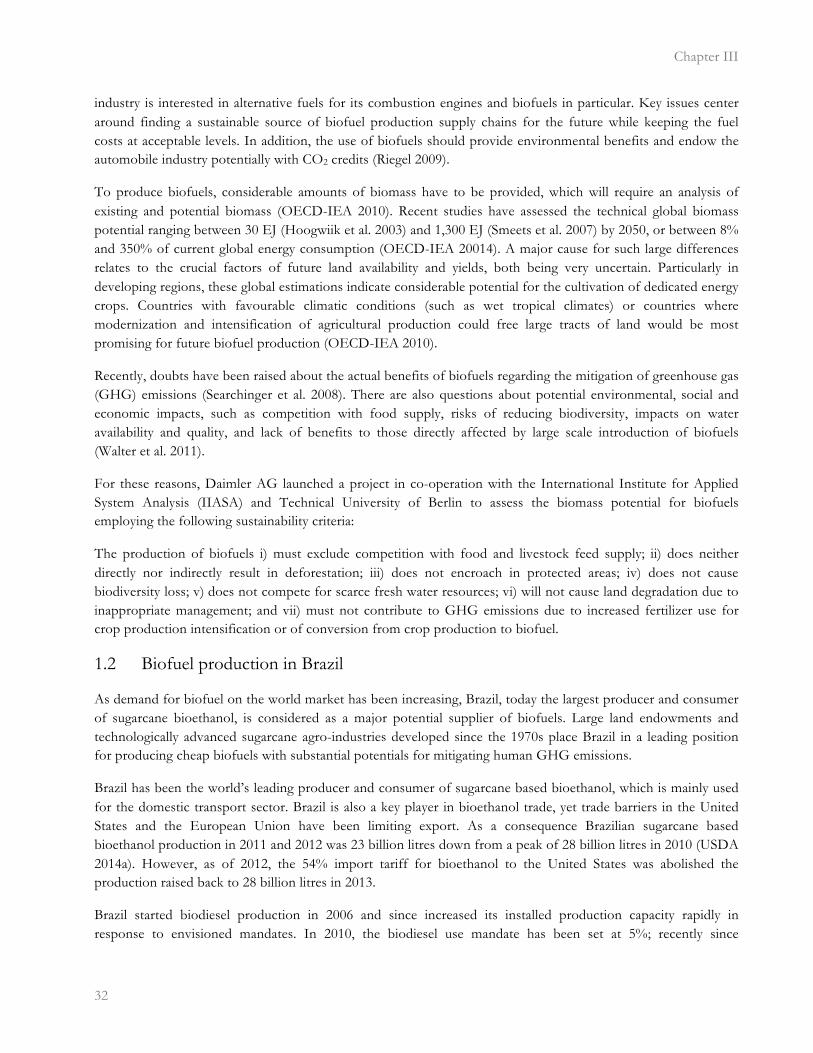
Chapter III
�32
industry is interested in alternative fuels for its combustion engines and biofuels in particular. Key issues center around finding a sustainable source of biofuel production supply chains for the future while keeping the fuel costs at acceptable levels. In addition, the use of biofuels should provide environmental benefits and endow the automobile industry potentially with CO2 credits (Riegel 2009).
To produce biofuels, considerable amounts of biomass have to be provided, which will require an analysis of existing and potential biomass (OECD-IEA 2010). Recent studies have assessed the technical global biomass potential ranging between 30 EJ (Hoogwiik et al. 2003) and 1,300 EJ (Smeets et al. 2007) by 2050, or between 8% and 350% of current global energy consumption (OECD-IEA 20014). A major cause for such large differences relates to the crucial factors of future land availability and yields, both being very uncertain. Particularly in developing regions, these global estimations indicate considerable potential for the cultivation of dedicated energy crops. Countries with favourable climatic conditions (such as wet tropical climates) or countries where modernization and intensification of agricultural production could free large tracts of land would be most promising for future biofuel production (OECD-IEA 2010).
Recently, doubts have been raised about the actual benefits of biofuels regarding the mitigation of greenhouse gas (GHG) emissions (Searchinger et al. 2008). There are also questions about potential environmental, social and economic impacts, such as competition with food supply, risks of reducing biodiversity, impacts on water availability and quality, and lack of benefits to those directly affected by large scale introduction of biofuels (Walter et al. 2011).
For these reasons, Daimler AG launched a project in co-operation with the International Institute for Applied System Analysis (IIASA) and Technical University of Berlin to assess the biomass potential for biofuels employing the following sustainability criteria:
The production of biofuels i) must exclude competition with food and livestock feed supply; ii) does neither directly nor indirectly result in deforestation; iii) does not encroach in protected areas; iv) does not cause biodiversity loss; v) does not compete for scarce fresh water resources; vi) will not cause land degradation due to inappropriate management; and vii) must not contribute to GHG emissions due to increased fertilizer use for crop production intensification or of conversion from crop production to biofuel.
1.2 Biofuel production in Brazil
As demand for biofuel on the world market has been increasing, Brazil, today the largest producer and consumer of sugarcane bioethanol, is considered as a major potential supplier of biofuels. Large land endowments and technologically advanced sugarcane agro-industries developed since the 1970s place Brazil in a leading position for producing cheap biofuels with substantial potentials for mitigating human GHG emissions.
Brazil has been the world’s leading producer and consumer of sugarcane based bioethanol, which is mainly used for the domestic transport sector. Brazil is also a key player in bioethanol trade, yet trade barriers in the United States and the European Union have been limiting export. As a consequence Brazilian sugarcane based bioethanol production in 2011 and 2012 was 23 billion litres down from a peak of 28 billion litres in 2010 (USDA 2014a). However, as of 2012, the 54% import tariff for bioethanol to the United States was abolished the production raised back to 28 billion litres in 2013.
Brazil started biodiesel production in 2006 and since increased its installed production capacity rapidly in response to envisioned mandates. In 2010, the biodiesel use mandate has been set at 5%; recently since
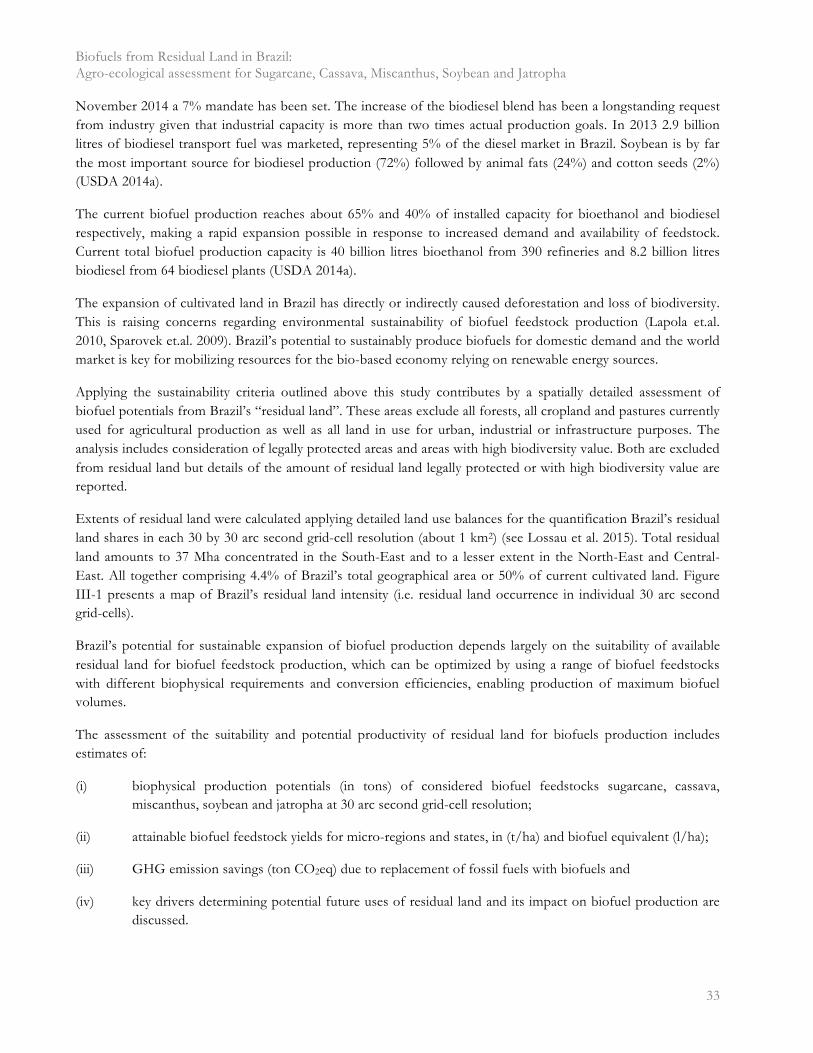
Biofuels from Residual Land in Brazil: Agro-ecological assessment for Sugarcane, Cassava, Miscanthus, Soybean and Jatropha
� 33
November 2014 a 7% mandate has been set. The increase of the biodiesel blend has been a longstanding request from industry given that industrial capacity is more than two times actual production goals. In 2013 2.9 billion litres of biodiesel transport fuel was marketed, representing 5% of the diesel market in Brazil. Soybean is by far the most important source for biodiesel production (72%) followed by animal fats (24%) and cotton seeds (2%) (USDA 2014a).
The current biofuel production reaches about 65% and 40% of installed capacity for bioethanol and biodiesel respectively, making a rapid expansion possible in response to increased demand and availability of feedstock. Current total biofuel production capacity is 40 billion litres bioethanol from 390 refineries and 8.2 billion litres biodiesel from 64 biodiesel plants (USDA 2014a).
The expansion of cultivated land in Brazil has directly or indirectly caused deforestation and loss of biodiversity. This is raising concerns regarding environmental sustainability of biofuel feedstock production (Lapola et.al. 2010, Sparovek et.al. 2009). Brazil’s potential to sustainably produce biofuels for domestic demand and the world market is key for mobilizing resources for the bio-based economy relying on renewable energy sources.
Applying the sustainability criteria outlined above this study contributes by a spatially detailed assessment of biofuel potentials from Brazil’s “residual land”. These areas exclude all forests, all cropland and pastures currently used for agricultural production as well as all land in use for urban, industrial or infrastructure purposes. The analysis includes consideration of legally protected areas and areas with high biodiversity value. Both are excluded from residual land but details of the amount of residual land legally protected or with high biodiversity value are reported.
Extents of residual land were calculated applying detailed land use balances for the quantification Brazil’s residual land shares in each 30 by 30 arc second grid-cell resolution (about 1 km2) (see Lossau et al. 2015). Total residual land amounts to 37 Mha concentrated in the South-East and to a lesser extent in the North-East and Central-East. All together comprising 4.4% of Brazil’s total geographical area or 50% of current cultivated land. Figure III-1 presents a map of Brazil’s residual land intensity (i.e. residual land occurrence in individual 30 arc secondgrid-cells).
Brazil’s potential for sustainable expansion of biofuel production depends largely on the suitability of available residual land for biofuel feedstock production, which can be optimized by using a range of biofuel feedstocks with different biophysical requirements and conversion efficiencies, enabling production of maximum biofuel volumes.
The assessment of the suitability and potential productivity of residual land for biofuels production includes estimates of:
(i) biophysical production potentials (in tons) of considered biofuel feedstocks sugarcane, cassava,miscanthus, soybean and jatropha at 30 arc second grid-cell resolution;
(ii) attainable biofuel feedstock yields for micro-regions and states, in (t/ha) and biofuel equivalent (l/ha);
(iii) GHG emission savings (ton CO2eq) due to replacement of fossil fuels with biofuels and
(iv) key drivers determining potential future uses of residual land and its impact on biofuel production arediscussed.
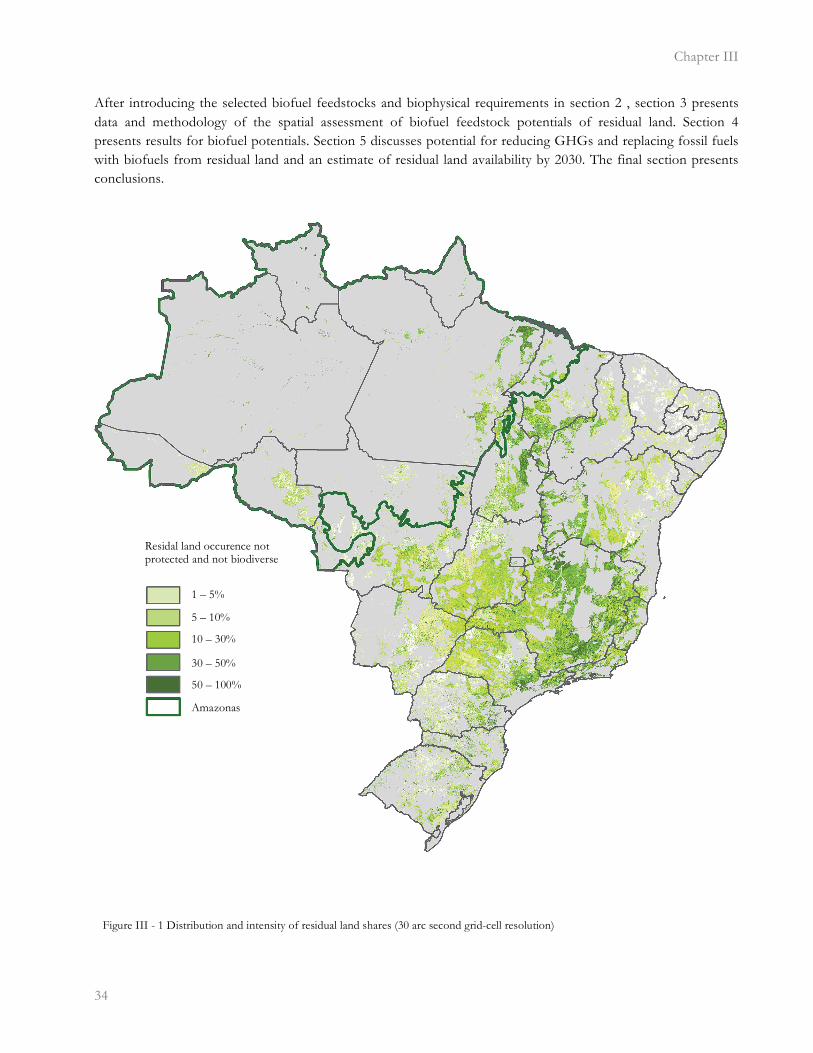
Chapter III
�34
After introducing the selected biofuel feedstocks and biophysical requirements in section 2 , section 3 presents data and methodology of the spatial assessment of biofuel feedstock potentials of residual land. Section 4 presents results for biofuel potentials. Section 5 discusses potential for reducing GHGs and replacing fossil fuels with biofuels from residual land and an estimate of residual land availability by 2030. The final section presents conclusions.
Figure III - 1 Distribution and intensity of residual land shares (30 arc second grid-cell resolution)
Residal land occurence not protected and not biodiverse
1 – 5%
5 – 10%
10 – 30%
30 – 50%
50 – 100%
Amazonas
Biofuels from Residual Land in Brazil: Agro-ecological assessment for Sugarcane, Cassava, Miscanthus, Soybean and Jatropha
� 35
2 Considered biofuel feedstocks
�
Biofuel production is dominated by two types of fuels, bioethanol and biodiesel. Bioethanol is produced from sugar or starch feedstocks, biodiesel from oil feedstocks (OFID-IIASA 2009). Brazil is the world’s largest producer of sugarcane (61% of global production) and the second largest of soybean (9% of global production) (FAO 2011). Both crops are used for biofuel production. Alternative biofuel feedstocks, cassava, jatropha and miscanthus are of interest for cultivation on residual land due tolerances to marginal environmental conditions and produce biomass and energy with modest applications of agro-chemicals.
Biofuel production from miscanthus relies on second-generation conversion technologies. This conversion technology is uncertain on the near- and mid-term for commercial-scale application.
Table III-1 presents an overview of biophysical and energy characteristics of the biofuel feedstocks.
Table III-2 presents an overview of argo-ecological characteristics of the biofuel feedstocks.
In the following main features of individual feedstocks are described.
Sugarcane (saccharum officinarum)
Sugarcane processing allows producer’s flexibility in allocating to sugar and bioethanol markets (OFID-IIASA 2009). High yield potentials and well-established conversion technologies in Brazil’s long-established sugarcane industry have placed Brazilian sugarcane bioethanol as the first renewable fuel to be cost-competitive in the transport sector. Almost half of Brazil’s sugarcane production is used for bioethanol production (Lapola et al. 2010). Most of the sugarcane production is located in the South-East, where almost two-thirds of bioethanol is being produced (IBGE 2006). Most sugarcane is grown in São Paulo (54%), Alagoas (11%) and Paraná (6%) states. In view of expansion trends of sugarcane production, the Brazilian government commissioned a national study to identify areas potentially suitable for sugarcane production (OECD-IEA 2010).
Cassava (manihot esculenta)
Cassava is a perennial woody shrub producing an edible root with high starch content. It is also called yucca, manioc, mandioca or tapioca. It is grown in many tropical countries where it is produced mostly by smallholders on marginal or sub marginal lands. It has long been used as a food security crop; cassava roots can be stored in the ground for several months and harvested off-season.
Cassava is an emerging feedstock bioethanol production because: (i) extended harvesting periods support year-round supply for bioethanol production; (ii) high starch productivity; (iii) and requires limited agro-chemical inputs between planting and harvesting. In addition cassava produces a considerable amount of woody, lingo-cellulosic biomass, which could potentially be used as feedstock for future second-generation bioethanol or as supplementary energy source in cassava-processing. In Brazil the majority of cassava is grown in the North-East (54%), followed by North (21%) and South (13%) Brazil (IBGE 2006). Cassava today is primarily used for starch production.
Miscanthus (miscanthus x giganteus)
Miscanthus is a perennial feedstock with a high cellulose yield potential and low input requirements, which makes the plant a leading candidate for second-generation cellulosic bioethanol production (DOE 2006). Miscanthus
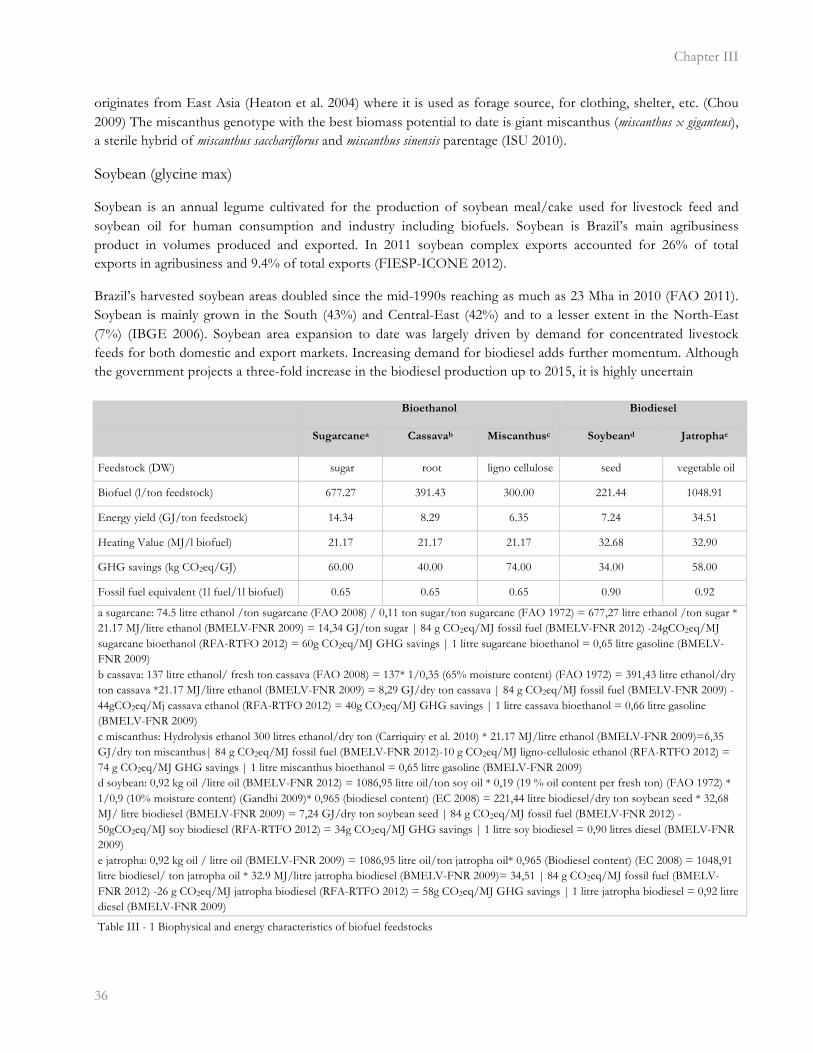
Chapter III
�36
originates from East Asia (Heaton et al. 2004) where it is used as forage source, for clothing, shelter, etc. (Chou 2009) The miscanthus genotype with the best biomass potential to date is giant miscanthus (miscanthus x giganteus), a sterile hybrid of miscanthus sacchariflorus and miscanthus sinensis parentage (ISU 2010).
Soybean (glycine max)
Soybean is an annual legume cultivated for the production of soybean meal/cake used for livestock feed and soybean oil for human consumption and industry including biofuels. Soybean is Brazil’s main agribusiness product in volumes produced and exported. In 2011 soybean complex exports accounted for 26% of total exports in agribusiness and 9.4% of total exports (FIESP-ICONE 2012).
Brazil’s harvested soybean areas doubled since the mid-1990s reaching as much as 23 Mha in 2010 (FAO 2011). Soybean is mainly grown in the South (43%) and Central-East (42%) and to a lesser extent in the North-East (7%) (IBGE 2006). Soybean area expansion to date was largely driven by demand for concentrated livestock feeds for both domestic and export markets. Increasing demand for biodiesel adds further momentum. Although the government projects a three-fold increase in the biodiesel production up to 2015, it is highly uncertain
Bioethanol Biodiesel
Sugarcanea Cassavab Miscanthusc Soybeand Jatrophae
Feedstock (DW) sugar root ligno cellulose seed vegetable oil
Biofuel (l/ton feedstock) 677.27 391.43 300.00 221.44 1048.91
Energy yield (GJ/ton feedstock) 14.34 8.29 6.35 7.24 34.51
Heating Value (MJ/l biofuel) 21.17 21.17 21.17 32.68 32.90
GHG savings (kg CO2eq/GJ) 60.00 40.00 74.00 34.00 58.00
Fossil fuel equivalent (1l fuel/1l biofuel) 0.65 0.65 0.65 0.90 0.92
a sugarcane: 74.5 litre ethanol /ton sugarcane (FAO 2008) / 0,11 ton sugar/ton sugarcane (FAO 1972) = 677,27 litre ethanol /ton sugar * 21.17 MJ/litre ethanol (BMELV-FNR 2009) = 14,34 GJ/ton sugar | 84 g CO2eq/MJ fossil fuel (BMELV-FNR 2012) -24gCO2eq/MJ sugarcane bioethanol (RFA-RTFO 2012) = 60g CO2eq/MJ GHG savings | 1 litre sugarcane bioethanol = 0,65 litre gasoline (BMELV-FNR 2009) b cassava: 137 litre ethanol/ fresh ton cassava (FAO 2008) = 137* 1/0,35 (65% moisture content) (FAO 1972) = 391,43 litre ethanol/dry ton cassava *21.17 MJ/litre ethanol (BMELV-FNR 2009) = 8,29 GJ/dry ton cassava | 84 g CO2eq/MJ fossil fuel (BMELV-FNR 2009) -44gCO2eq/Mj cassava ethanol (RFA-RTFO 2012) = 40g CO2eq/MJ GHG savings | 1 litre cassava bioethanol = 0,66 litre gasoline (BMELV-FNR 2009) c miscanthus: Hydrolysis ethanol 300 litres ethanol/dry ton (Carriquiry et al. 2010) * 21.17 MJ/litre ethanol (BMELV-FNR 2009)=6,35 GJ/dry ton miscanthus| 84 g CO2eq/MJ fossil fuel (BMELV-FNR 2012)-10 g CO2eq/MJ ligno-cellulosic ethanol (RFA-RTFO 2012) = 74 g CO2eq/MJ GHG savings | 1 litre miscanthus bioethanol = 0,65 litre gasoline (BMELV-FNR 2009) d soybean: 0,92 kg oil /litre oil (BMELV-FNR 2012) = 1086,95 litre oil/ton soy oil * 0,19 (19 % oil content per fresh ton) (FAO 1972) * 1/0,9 (10% moisture content) (Gandhi 2009)* 0,965 (biodiesel content) (EC 2008) = 221,44 litre biodiesel/dry ton soybean seed * 32,68 MJ/ litre biodiesel (BMELV-FNR 2009) = 7,24 GJ/dry ton soybean seed | 84 g CO2eq/MJ fossil fuel (BMELV-FNR 2012) -50gCO2eq/MJ soy biodiesel (RFA-RTFO 2012) = 34g CO2eq/MJ GHG savings | 1 litre soy biodiesel = 0,90 litres diesel (BMELV-FNR 2009) e jatropha: 0,92 kg oil / litre oil (BMELV-FNR 2009) = 1086,95 litre oil/ton jatropha oil* 0,965 (Biodiesel content) (EC 2008) = 1048,91 litre biodiesel/ ton jatropha oil * 32.9 MJ/litre jatropha biodiesel (BMELV-FNR 2009)= 34,51 | 84 g CO2eq/MJ fossil fuel (BMELV-FNR 2012) -26 g CO2eq/MJ jatropha biodiesel (RFA-RTFO 2012) = 58g CO2eq/MJ GHG savings | 1 litre jatropha biodiesel = 0,92 litre diesel (BMELV-FNR 2009)
Table III - 1 Biophysical and energy characteristics of biofuel feedstocks

Biofuels from Residual Land in Brazil: Agro-ecological assessment for Sugarcane, Cassava, Miscanthus, Soybean and Jatropha
� 37
whether soybean oil will continue to be the main feedstock for such a large increase. Rapid expansion of soybean production has already resulted in several adverse ecological and social impacts due to its large land requirements (which has directly or indirectly contributed to deforestation in the Amazonian region) (Gibbs et al. 2010, Davidson et al. 2012). Soybean provides relative low energy return per area of land, low mitigation of GHG emissions, it also competes with food markets and finally production costs of biodiesel from soybean are high (Lapola et al. 2010).
Jatropha (jatropha curcas)
Jatropha is a perennial deciduous small tree or large shrub native from Central America. It grows up to 30-50 years, can bear fruits after 12 months and reaches its maximum productivity by 5 years (Atabani et al. 2013). As many species of the family Euphorbiaceae, jatropha contains highly toxic compounds and is thus not used for livestock fodder, instead being used for fencing. Jatropha oil is not edible and is traditionally used for manufacturing soap and medicinal applications (OFID-IIASA 2009). Jatropha’s seeds contain around 25-40% oil (Moncaleano-Escandon et al. 2013) and yields are estimated to range between 439 - 2,217 litres oil per ha (Jongschaap et al. 2007). Jatropha oil is well suited for biodiesel production and meets American and European standards (Achten et al. 2008).
Based on these interesting properties, potentials and hyped claims, investors, policy makers and clean development mechanism project developers got interested in jatropha as a means to concurrently tackle the challenges of renewable energy supply and GHG emission reduction (Achten et al. 2008).
The cultivation of Jatropha as a biofuel feedstock has started only recently. There is extensive research on the development of new varieties suited for different environments (IREDA 2013). Three-fourth of Latin America’s jatropha projects are in Brazil where a total of 15,800 ha is currently cultivated (GEXSI 2008). The Brazilian Agricultural Research Corporation (EMBRAPA) regards jatropha as a promising source for biodiesel production and has recently started an R&D program, on jatropha cultivation (Lapola et al. 2010).
Biofuel feedstock Agro-ecological characteristics
Sugarcane (Saccharum officinarum)
Sugarcane belongs to the crops with a C4 photosynthetic pathway; it is adapted to perform best under conditions of relatively high temperatures. Sugar cane is a perennial with determinate growth habit; its yield is located in the stem as sucrose and the yield formation period is about two-thirds to three-quarters of its cultivated life span. Sugarcane is best adapted to tropical lowland climates; it does particularly well in somewhat drier zones under irrigation, but is sensitive to frost. Ecological requirements of sugarcane include warm, sunny conditions and generous soil moisture supply during most of its cultivation cycle. Sugarcane prefers deep, well drained and well structured and aerated loamy to clayey fertile soils (OFID-IIASA 2009).
Cassava (Manihot esculenta)
Cassava is a C3 crop adapted to perform best in tropical lowland conditions. It produces yields across a range of moisture regimes from semi-arid to per-humid. Ecological requirements of cassava are modest in terms of soil fertility and moisture supply. Cassava can be grown on soils with low fertility. On very fertile soils the vegetative growth of cassava is very luxurious at the expense of the roots. Cassava is very sensitive to salinity, prefers moderately deep soils that are at least moderately well drained. Cassava is sensitive to waterlogging and no flooding should occur (OFID-IIASA 2009).
Miscanthus (Mscanthus x giganteus)
Miscanthus has high yield potential for cellulose fiber production. Its extensive underground rhizome system is a storage organ for nutrients and forms shoots every year (OFID-IIASA 2009). Experience in Europe suggests giant miscanthus being productive over a wide geographic range in temperate, sub-tropical and tropical regions, performs on marginal land, but it is not appropriate for dry regions (Heaton et al. 2011). From its second season onwards giant miscanthus grows to a height of 2.5–3.5 m. It remains productive for over 15 years (up to 25 years) (McKervey et al. 2008) and has low fertilizer
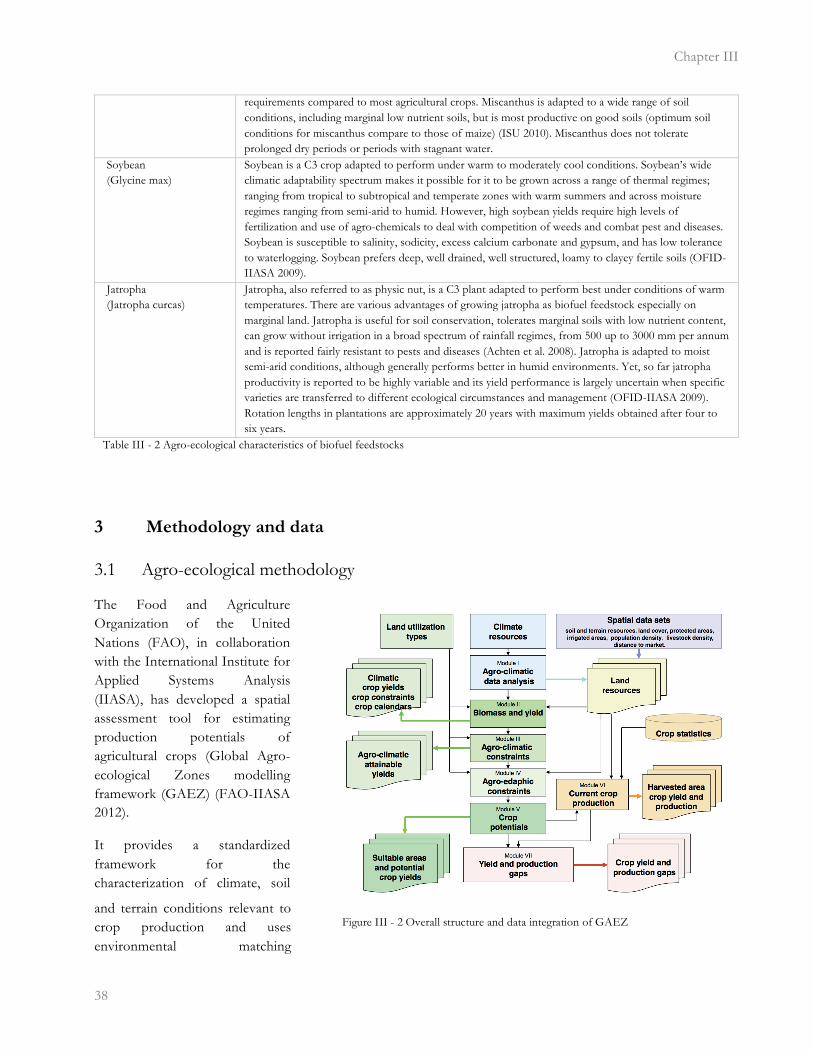
Chapter III
�38
requirements compared to most agricultural crops. Miscanthus is adapted to a wide range of soil conditions, including marginal low nutrient soils, but is most productive on good soils (optimum soil conditions for miscanthus compare to those of maize) (ISU 2010). Miscanthus does not tolerate prolonged dry periods or periods with stagnant water.
Soybean (Glycine max)
Soybean is a C3 crop adapted to perform under warm to moderately cool conditions. Soybean’s wide climatic adaptability spectrum makes it possible for it to be grown across a range of thermal regimes; ranging from tropical to subtropical and temperate zones with warm summers and across moisture regimes ranging from semi-arid to humid. However, high soybean yields require high levels of fertilization and use of agro-chemicals to deal with competition of weeds and combat pest and diseases. Soybean is susceptible to salinity, sodicity, excess calcium carbonate and gypsum, and has low tolerance to waterlogging. Soybean prefers deep, well drained, well structured, loamy to clayey fertile soils (OFID-IIASA 2009).
Jatropha (Jatropha curcas)
Jatropha, also referred to as physic nut, is a C3 plant adapted to perform best under conditions of warm temperatures. There are various advantages of growing jatropha as biofuel feedstock especially on marginal land. Jatropha is useful for soil conservation, tolerates marginal soils with low nutrient content, can grow without irrigation in a broad spectrum of rainfall regimes, from 500 up to 3000 mm per annum and is reported fairly resistant to pests and diseases (Achten et al. 2008). Jatropha is adapted to moist semi-arid conditions, although generally performs better in humid environments. Yet, so far jatropha productivity is reported to be highly variable and its yield performance is largely uncertain when specific varieties are transferred to different ecological circumstances and management (OFID-IIASA 2009). Rotation lengths in plantations are approximately 20 years with maximum yields obtained after four to six years.
Table III - 2 Agro-ecological characteristics of biofuel feedstocks
3 Methodology and data
�
3.1 Agro-ecological methodology
The Food and Agriculture Organization of the United Nations (FAO), in collaboration with the International Institute for Applied Systems Analysis (IIASA), has developed a spatial assessment tool for estimating production potentials of agricultural crops (Global Agro-ecological Zones modelling framework (GAEZ) (FAO-IIASA 2012).
It provides a standardized framework for thecharacterization of climate, soil
and terrain conditions relevant to crop production and uses environmental matching
Figure III - 2 Overall structure and data integration of GAEZ
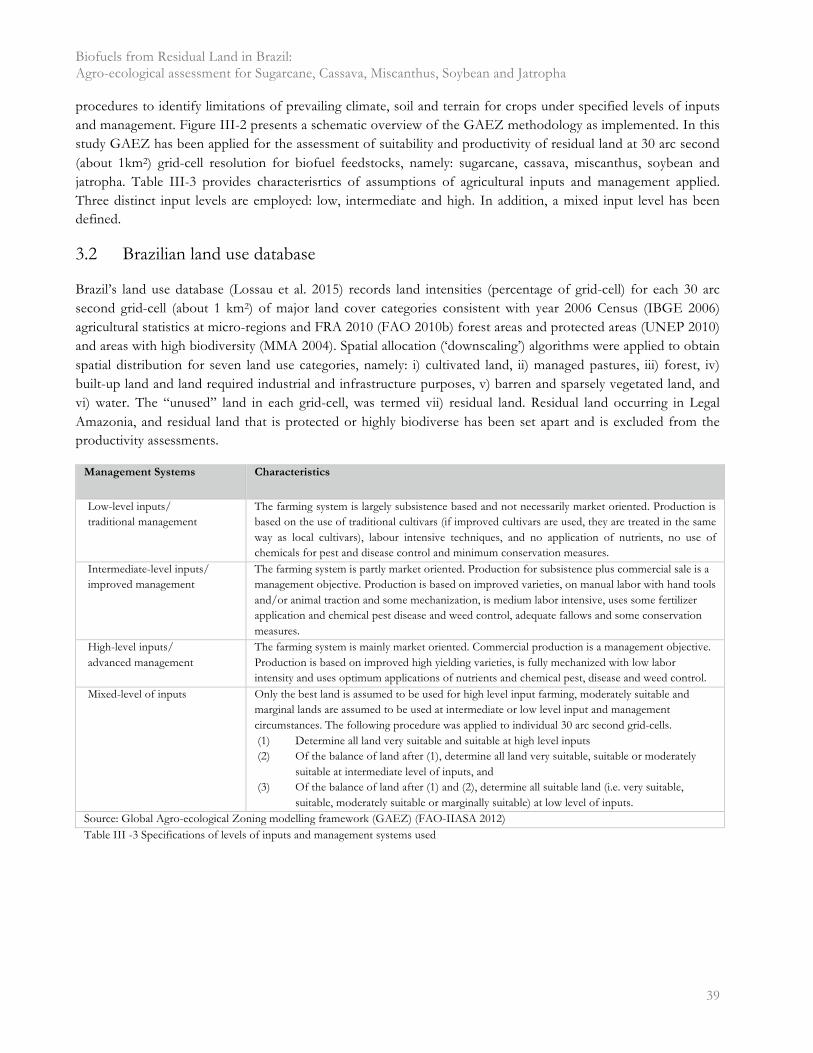
Biofuels from Residual Land in Brazil: Agro-ecological assessment for Sugarcane, Cassava, Miscanthus, Soybean and Jatropha
� 39
procedures to identify limitations of prevailing climate, soil and terrain for crops under specified levels of inputs and management. Figure III-2 presents a schematic overview of the GAEZ methodology as implemented. In this study GAEZ has been applied for the assessment of suitability and productivity of residual land at 30 arc second (about 1km2) grid-cell resolution for biofuel feedstocks, namely: sugarcane, cassava, miscanthus, soybean and jatropha. Table III-3 provides characterisrtics of assumptions of agricultural inputs and management applied. Three distinct input levels are employed: low, intermediate and high. In addition, a mixed input level has been defined.
3.2 Brazilian land use database
Brazil’s land use database (Lossau et al. 2015) records land intensities (percentage of grid-cell) for each 30 arc second grid-cell (about 1 km2) of major land cover categories consistent with year 2006 Census (IBGE 2006) agricultural statistics at micro-regions and FRA 2010 (FAO 2010b) forest areas and protected areas (UNEP 2010) and areas with high biodiversity (MMA 2004). Spatial allocation (‘downscaling’) algorithms were applied to obtain spatial distribution for seven land use categories, namely: i) cultivated land, ii) managed pastures, iii) forest, iv) built-up land and land required industrial and infrastructure purposes, v) barren and sparsely vegetated land, and vi) water. The “unused” land in each grid-cell, was termed vii) residual land. Residual land occurring in LegalAmazonia, and residual land that is protected or highly biodiverse has been set apart and is excluded from theproductivity assessments.
Management Systems Characteristics
Low-level inputs/ traditional management
The farming system is largely subsistence based and not necessarily market oriented. Production is based on the use of traditional cultivars (if improved cultivars are used, they are treated in the same way as local cultivars), labour intensive techniques, and no application of nutrients, no use of chemicals for pest and disease control and minimum conservation measures.
Intermediate-level inputs/ improved management
The farming system is partly market oriented. Production for subsistence plus commercial sale is a management objective. Production is based on improved varieties, on manual labor with hand tools and/or animal traction and some mechanization, is medium labor intensive, uses some fertilizer application and chemical pest disease and weed control, adequate fallows and some conservation measures.
High-level inputs/ advanced management
The farming system is mainly market oriented. Commercial production is a management objective. Production is based on improved high yielding varieties, is fully mechanized with low labor intensity and uses optimum applications of nutrients and chemical pest, disease and weed control.
Mixed-level of inputs Only the best land is assumed to be used for high level input farming, moderately suitable and marginal lands are assumed to be used at intermediate or low level input and management circumstances. The following procedure was applied to individual 30 arc second grid-cells. (1) Determine all land very suitable and suitable at high level inputs(2) Of the balance of land after (1), determine all land very suitable, suitable or moderately
suitable at intermediate level of inputs, and(3) Of the balance of land after (1) and (2), determine all suitable land (i.e. very suitable,
suitable, moderately suitable or marginally suitable) at low level of inputs.Source: Global Agro-ecological Zoning modelling framework (GAEZ) (FAO-IIASA 2012) Table III -3 Specifications of levels of inputs and management systems used
�
�
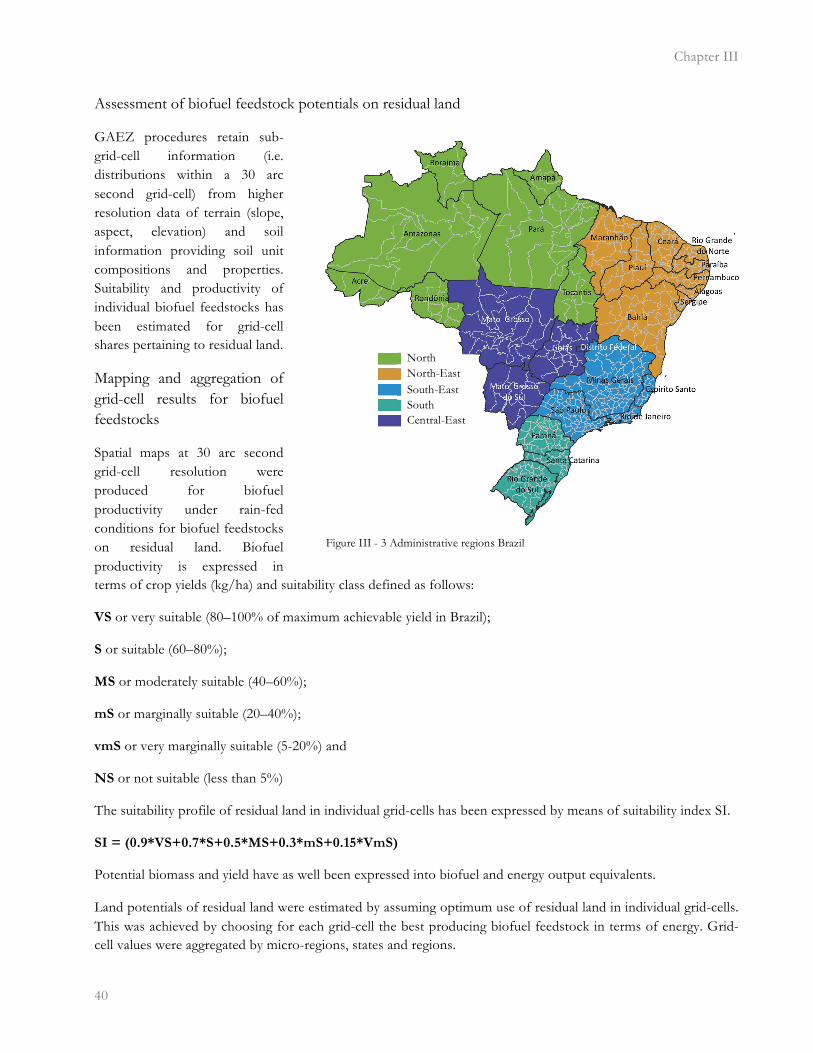
Chapter III
�40
Assessment of biofuel feedstock potentials on residual land
GAEZ procedures retain sub-grid-cell information (i.e. distributions within a 30 arc second grid-cell) from higher resolution data of terrain (slope, aspect, elevation) and soil information providing soil unit compositions and properties. Suitability and productivity of individual biofuel feedstocks has been estimated for grid-cell shares pertaining to residual land.
Mapping and aggregation of grid-cell results for biofuel feedstocks
Spatial maps at 30 arc second grid-cell resolution were produced for biofuel productivity under rain-fed conditions for biofuel feedstocks on residual land. Biofuel productivity is expressed in terms of crop yields (kg/ha) and suitability class defined as follows:
VS or very suitable (80–100% of maximum achievable yield in Brazil);
S or suitable (60–80%);
MS or moderately suitable (40–60%);
mS or marginally suitable (20–40%);
vmS or very marginally suitable (5-20%) and
NS or not suitable (less than 5%)
The suitability profile of residual land in individual grid-cells has been expressed by means of suitability index SI.
SI = (0.9*VS+0.7*S+0.5*MS+0.3*mS+0.15*VmS)
Potential biomass and yield have as well been expressed into biofuel and energy output equivalents.
Land potentials of residual land were estimated by assuming optimum use of residual land in individual grid-cells. This was achieved by choosing for each grid-cell the best producing biofuel feedstock in terms of energy. Grid-cell values were aggregated by micro-regions, states and regions.
Figure III - 3 Administrative regions Brazil
North
South-East North-East
South Central-East
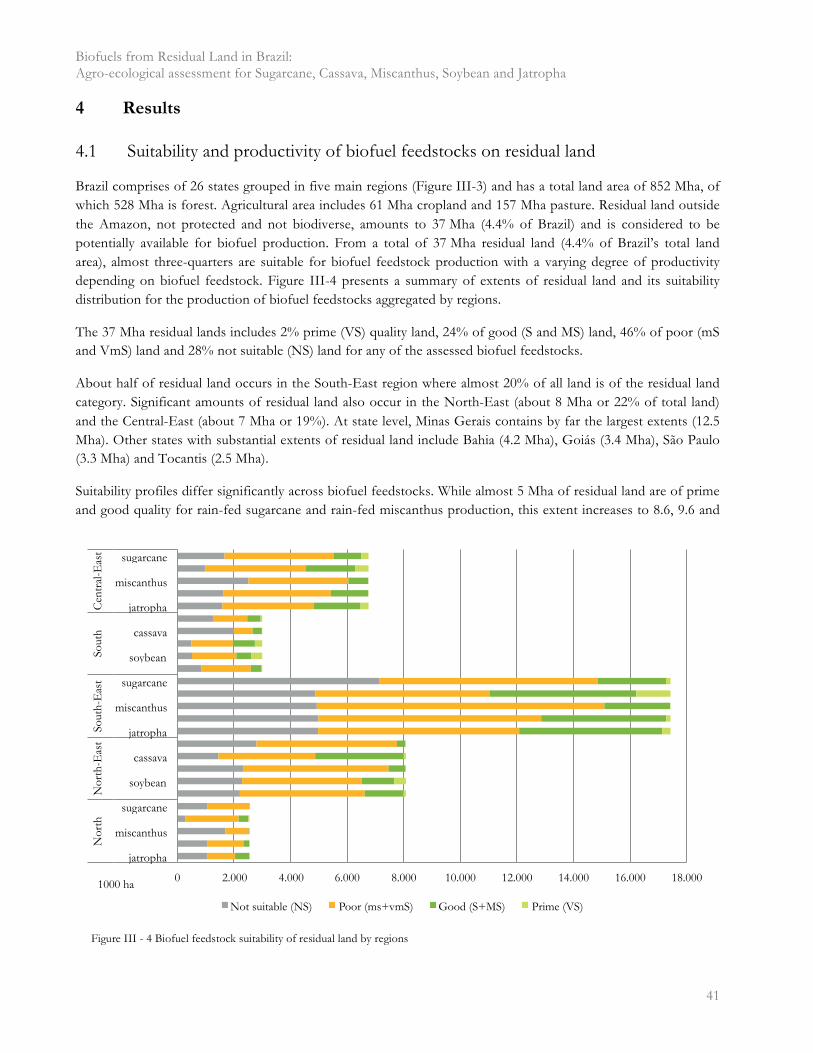
Biofuels from Residual Land in Brazil: Agro-ecological assessment for Sugarcane, Cassava, Miscanthus, Soybean and Jatropha
� 41
4 Results
�
4.1 Suitability and productivity of biofuel feedstocks on residual land
Brazil comprises of 26 states grouped in five main regions (Figure III-3) and has a total land area of 852 Mha, of which 528 Mha is forest. Agricultural area includes 61 Mha cropland and 157 Mha pasture. Residual land outside the Amazon, not protected and not biodiverse, amounts to 37 Mha (4.4% of Brazil) and is considered to be potentially available for biofuel production. From a total of 37 Mha residual land (4.4% of Brazil’s total land area), almost three-quarters are suitable for biofuel feedstock production with a varying degree of productivity depending on biofuel feedstock. Figure III-4 presents a summary of extents of residual land and its suitability distribution for the production of biofuel feedstocks aggregated by regions.
The 37 Mha residual lands includes 2% prime (VS) quality land, 24% of good (S and MS) land, 46% of poor (mS and VmS) land and 28% not suitable (NS) land for any of the assessed biofuel feedstocks.
About half of residual land occurs in the South-East region where almost 20% of all land is of the residual land category. Significant amounts of residual land also occur in the North-East (about 8 Mha or 22% of total land) and the Central-East (about 7 Mha or 19%). At state level, Minas Gerais contains by far the largest extents (12.5 Mha). Other states with substantial extents of residual land include Bahia (4.2 Mha), Goiás (3.4 Mha), São Paulo (3.3 Mha) and Tocantis (2.5 Mha).
Suitability profiles differ significantly across biofuel feedstocks. While almost 5 Mha of residual land are of prime and good quality for rain-fed sugarcane and rain-fed miscanthus production, this extent increases to 8.6, 9.6 and
0 2.000 4.000 6.000 8.000 10.000 12.000 14.000 16.000 18.000
jatropha
miscanthus
sugarcane
soybean
cassava
jatropha
miscanthus
sugarcane
soybean
cassava
jatropha
miscanthus
sugarcane
Nor
th
Nor
th-E
ast
Sout
h-E
ast
Sout
h C
entr
al-E
ast
Not suitable (NS) Poor (ms+vmS) Good (S+MS) Prime (VS)
1000 ha
Figure III - 4 Biofuel feedstock suitability of residual land by regions

Chapter III
�42
12.5 Mha when residual land is used for the rain-fed production of soybean, jatropha and cassava respectively. Depending on feedstock, between 40 and 50% of the residual land is marginally suitable for biofuel feedstock production. In these poor areas economic feedstock production may only be feasible with substantial investments in land improvement and irrigation. Almost 10 Mha or 28% of the residual land is not suitable for any of the biofuel feedstocks of this study. The highest production potential occurs in Minas Gerais, the state with largest extents of residual land, however the per average hectare production is low. Figures III-5 – III-9 present maps depicting the suitability of residual land for the five biofuel feedstocks; sugarcane, cassava, miscanthus, soybean and jatropha. Table III-4 compares suitable residual land and potential rain-fed production from residual land in Brazil for the biofuel feedstocks assuming mixed level of input (Table III-3)..
Sugarcane Sugarcane cultivation on residual land could produce potentially up to 50 Mt sugar. Half of this potential is located in the South-East (in particular in the state of Minas Gerais and São Paulo) and one-quarter in the Central-East (primarily in Mato Grosso do Sul and Goiás). About 54% of total potential sugar production from residual land or 27 Mt would come from prime and good quality land with average yields around 5 to 10 t/ha sugar. In comparison in 2010 Brazil’s sugar production was over 70 Mt from 9 Mha implying an average yield of 7.9 t/ha sugar (FAO 2011).
Cassava 80 Mt of cassava roots (DW) could be produced from Brazil’s residual land, half of which is located in the South-East. About 83% of total potential cassava production from residual land or 66 Mt (DW) would come from prime and good land with average yields of between 5 to 9 t/ha. Brazil is the second largest cassava producer in the world. In 2010 production was 24 Mt fresh weight roots (or 8.4 Mt (DW)) from 1.7 Mha, corresponding to an average yield of 4.6 t/ha (DW) (FAO 2011).
Miscanthus Some 25 Mha of residual land is suitable for miscanthus production. Total production potential over all suitability classes amounts to 208 Mt above ground biomass (DW). About half of the production potential would occur in the residual land in the South-East region with a potential production of 100 Mt (DW). Maximum attainable yield could be achieved in Rio Grande do Sul, where maximum rain-fed yield potentials are over of 33 t/ha (DW). Average yields that could be attained in prime and good land would be in the order of 19 t/ha.
Soybean Total potential soybean production from residual land is 33 Mt grain (DW). Three-quarters of this potential (25 Mt) would come from prime and good quality residual land with average yields of around 3.0 t/ha (DW). Almost half of total production potential is found in the South-East (16.6 Mt (DW)). Highest yields are around 5 t/ha (DW) and are found in Rio Grande do Sul. For comparison, in 2010 Brazil’s soybean production was over 68 Mt or 61 Mt (DW), harvested from 23 Mha with an average yield of 2.9 t/ha (or 2.6 t/ha DW) soybean grain (FAO 2011).
Jatropha Some 27 Mha of residual land is suitable for jatropha cultivation, of which 9 Mha are of prime and good quality. Total jatropha oil production potential in all residual land is 17 Mt. Average potential yields on prime and good land are in the order of 1.3 t/ha vegetable oil. Note that potential jatropha yields can only be achieved after 3-4 years (Atabani et al. 2013)
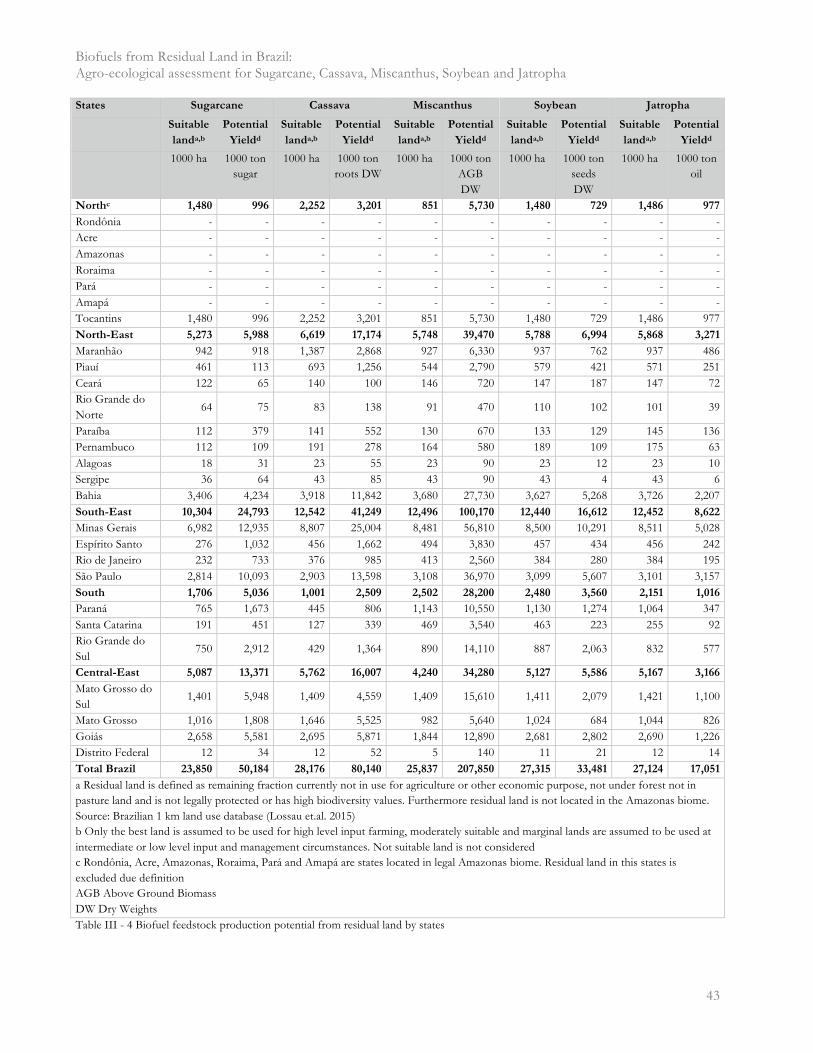
Biofuels from Residual Land in Brazil: Agro-ecological assessment for Sugarcane, Cassava, Miscanthus, Soybean and Jatropha
� 43
States Sugarcane Cassava Miscanthus Soybean Jatropha
Suitable
landa,b
Potential
Yieldd
Suitable
landa,b
Potential
Yieldd
Suitable
landa,b
Potential
Yieldd
Suitable
landa,b
Potential
Yieldd
Suitable
landa,b
Potential
Yieldd
1000 ha 1000 ton sugar
1000 ha 1000 ton roots DW
1000 ha 1000 ton AGB DW
1000 ha 1000 ton seeds DW
1000 ha 1000 ton oil
Northc 1,480 996 2,252 3,201 851 5,730 1,480 729 1,486 977
Rondônia - - - - - - - - - - Acre - - - - - - - - - - Amazonas - - - - - - - - - - Roraima - - - - - - - - - - Pará - - - - - - - - - - Amapá - - - - - - - - - - Tocantins 1,480 996 2,252 3,201 851 5,730 1,480 729 1,486 977 North-East 5,273 5,988 6,619 17,174 5,748 39,470 5,788 6,994 5,868 3,271
Maranhão 942 918 1,387 2,868 927 6,330 937 762 937 486 Piauí 461 113 693 1,256 544 2,790 579 421 571 251 Ceará 122 65 140 100 146 720 147 187 147 72 Rio Grande do Norte
64 75 83 138 91 470 110 102 101 39
Paraíba 112 379 141 552 130 670 133 129 145 136 Pernambuco 112 109 191 278 164 580 189 109 175 63 Alagoas 18 31 23 55 23 90 23 12 23 10 Sergipe 36 64 43 85 43 90 43 4 43 6 Bahia 3,406 4,234 3,918 11,842 3,680 27,730 3,627 5,268 3,726 2,207 South-East 10,304 24,793 12,542 41,249 12,496 100,170 12,440 16,612 12,452 8,622
Minas Gerais 6,982 12,935 8,807 25,004 8,481 56,810 8,500 10,291 8,511 5,028 Espírito Santo 276 1,032 456 1,662 494 3,830 457 434 456 242 Rio de Janeiro 232 733 376 985 413 2,560 384 280 384 195 São Paulo 2,814 10,093 2,903 13,598 3,108 36,970 3,099 5,607 3,101 3,157 South 1,706 5,036 1,001 2,509 2,502 28,200 2,480 3,560 2,151 1,016
Paraná 765 1,673 445 806 1,143 10,550 1,130 1,274 1,064 347 Santa Catarina 191 451 127 339 469 3,540 463 223 255 92 Rio Grande do Sul
750 2,912 429 1,364 890 14,110 887 2,063 832 577
Central-East 5,087 13,371 5,762 16,007 4,240 34,280 5,127 5,586 5,167 3,166
Mato Grosso do Sul
1,401 5,948 1,409 4,559 1,409 15,610 1,411 2,079 1,421 1,100
Mato Grosso 1,016 1,808 1,646 5,525 982 5,640 1,024 684 1,044 826 Goiás 2,658 5,581 2,695 5,871 1,844 12,890 2,681 2,802 2,690 1,226 Distrito Federal 12 34 12 52 5 140 11 21 12 14 Total Brazil 23,850 50,184 28,176 80,140 25,837 207,850 27,315 33,481 27,124 17,051
a Residual land is defined as remaining fraction currently not in use for agriculture or other economic purpose, not under forest not in pasture land and is not legally protected or has high biodiversity values. Furthermore residual land is not located in the Amazonas biome. Source: Brazilian 1 km land use database (Lossau et.al. 2015) b Only the best land is assumed to be used for high level input farming, moderately suitable and marginal lands are assumed to be used at intermediate or low level input and management circumstances. Not suitable land is not considered c Rondônia, Acre, Amazonas, Roraima, Pará and Amapá are states located in legal Amazonas biome. Residual land in this states is excluded due definition AGB Above Ground Biomass DW Dry Weights Table III - 4 Biofuel feedstock production potential from residual land by states

Chapter III
�44
Figure III - 5 Rain-fed sugarcane suitability for residual land under mixed input level (30 arc second grid-cell resolution)
Prime, Residual land > 50%
Prime, 50% > Residual land > 20%
Prime, 20% > Residual land > 5%
Good, Residual land > 50%
Good, 50% > Residual land > 20%
Good, 20% > Residual land > 5%
Poor, Residual land > 50%
Poor, 50% > Residual land > 20%
Poor, 20% > Residual land > 5%
Not suitable , Residual land > 50%
Not suitable, 50% > Residual land > 20%
Not suitable, 20% > Residual land > 5%
Residual land > 5%
Residal land occurence and its suitability for sugarcane
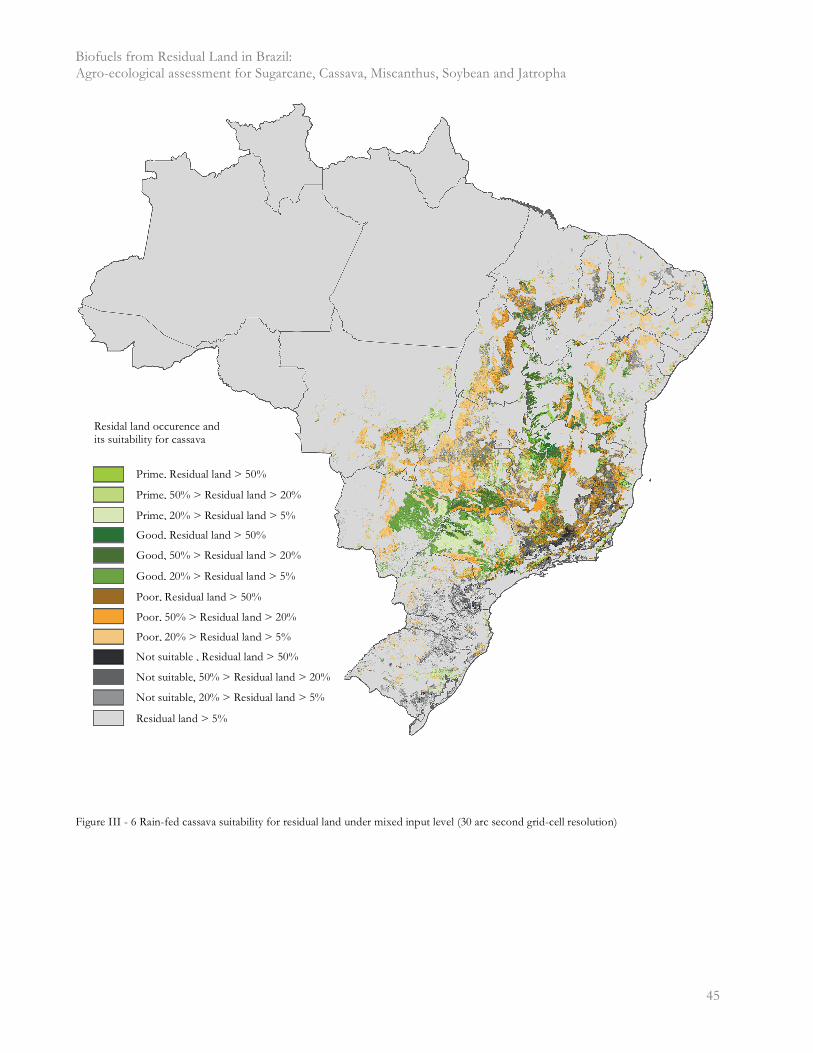
Biofuels from Residual Land in Brazil: Agro-ecological assessment for Sugarcane, Cassava, Miscanthus, Soybean and Jatropha
� 45
Figure III - 6 Rain-fed cassava suitability for residual land under mixed input level (30 arc second grid-cell resolution)
Prime, Residual land > 50%
Prime, 50% > Residual land > 20%
Prime, 20% > Residual land > 5%
Good, Residual land > 50%
Good, 50% > Residual land > 20%
Good, 20% > Residual land > 5%
Poor, Residual land > 50%
Poor, 50% > Residual land > 20%
Poor, 20% > Residual land > 5%
Not suitable , Residual land > 50%
Not suitable, 50% > Residual land > 20%
Not suitable, 20% > Residual land > 5%
Residual land > 5%
Residal land occurence and its suitability for cassava
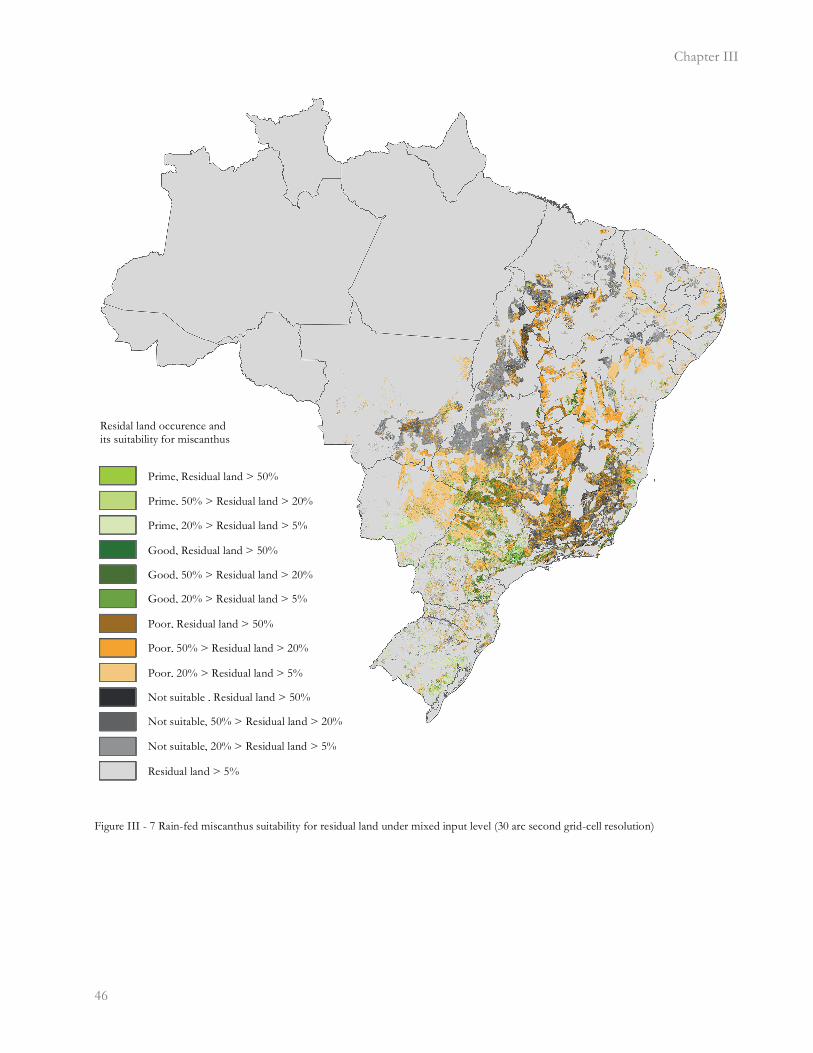
Chapter III
�46
Figure III - 7 Rain-fed miscanthus suitability for residual land under mixed input level (30 arc second grid-cell resolution)
Prime, Residual land > 50%
Prime, 50% > Residual land > 20%
Prime, 20% > Residual land > 5%
Good, Residual land > 50%
Good, 50% > Residual land > 20%
Good, 20% > Residual land > 5%
Poor, Residual land > 50%
Poor, 50% > Residual land > 20%
Poor, 20% > Residual land > 5%
Not suitable , Residual land > 50%
Not suitable, 50% > Residual land > 20%
Not suitable, 20% > Residual land > 5%
Residual land > 5%
Residal land occurence and its suitability for miscanthus
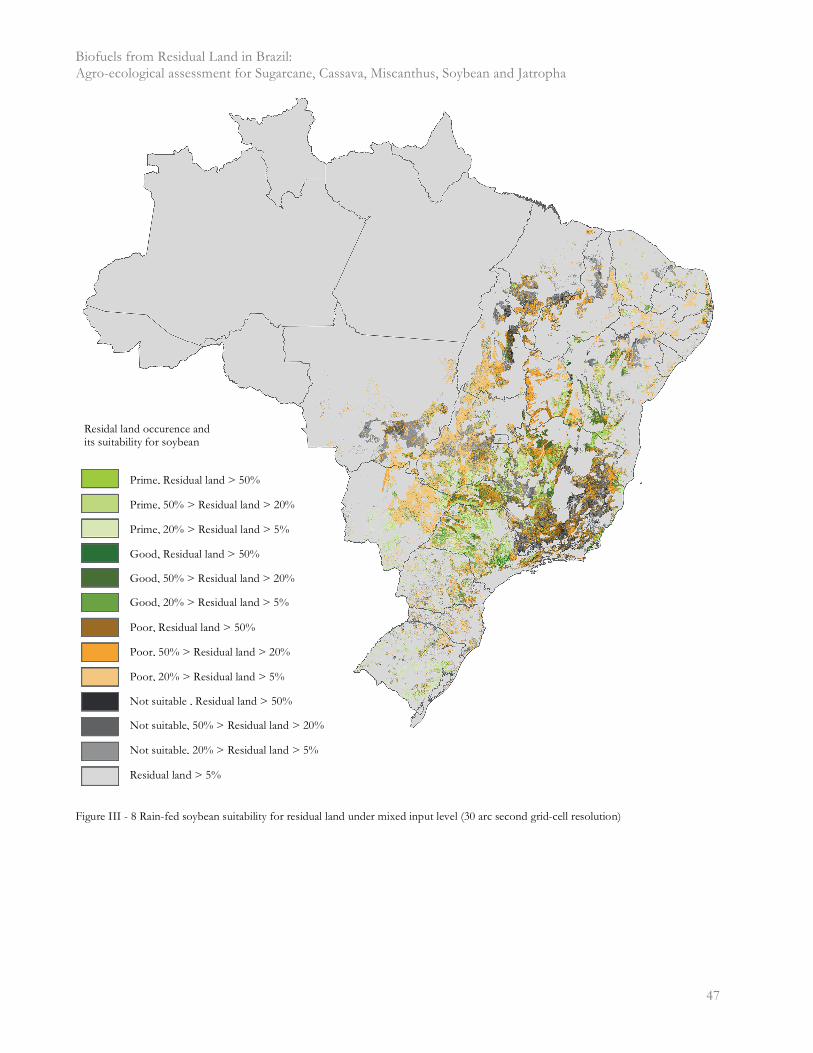
Biofuels from Residual Land in Brazil: Agro-ecological assessment for Sugarcane, Cassava, Miscanthus, Soybean and Jatropha
� 47
Figure III - 8 Rain-fed soybean suitability for residual land under mixed input level (30 arc second grid-cell resolution)
Prime, Residual land > 50%
Prime, 50% > Residual land > 20%
Prime, 20% > Residual land > 5%
Good, Residual land > 50%
Good, 50% > Residual land > 20%
Good, 20% > Residual land > 5%
Poor, Residual land > 50%
Poor, 50% > Residual land > 20%
Poor, 20% > Residual land > 5%
Not suitable , Residual land > 50%
Not suitable, 50% > Residual land > 20%
Not suitable, 20% > Residual land > 5%
Residual land > 5%
Residal land occurence and its suitability for soybean
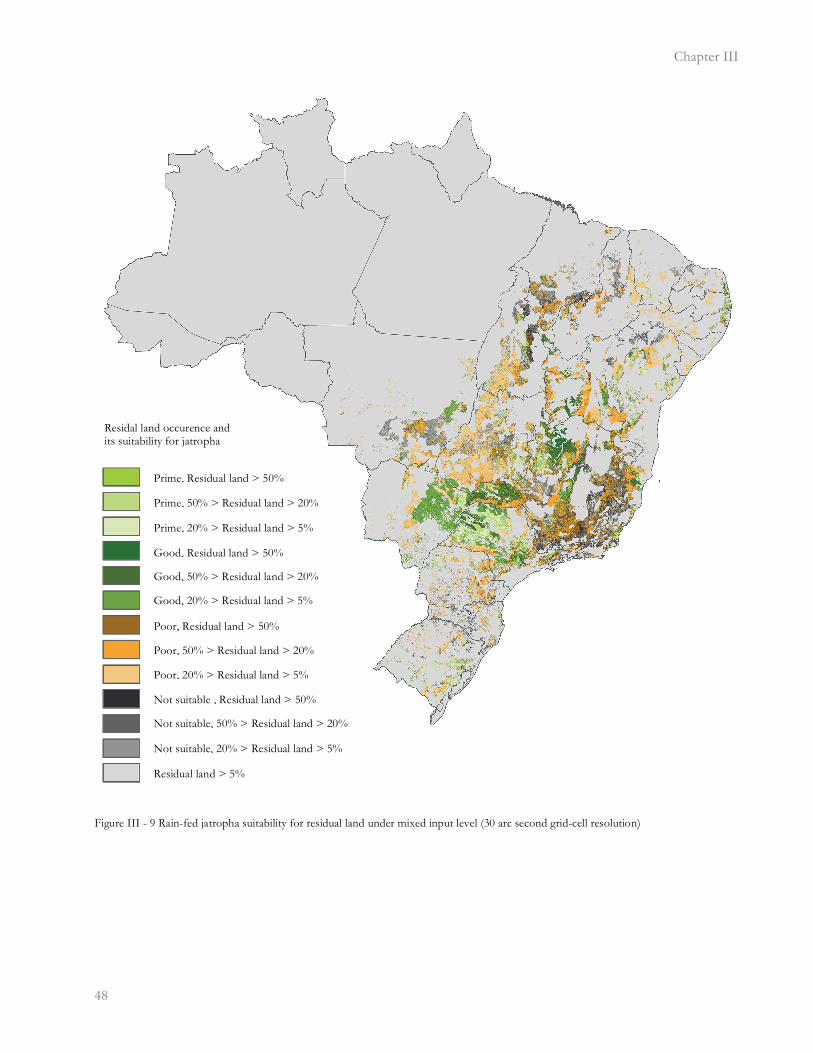
Chapter III
�48
Figure III - 9 Rain-fed jatropha suitability for residual land under mixed input level (30 arc second grid-cell resolution)
Prime, Residual land > 50%
Prime, 50% > Residual land > 20%
Prime, 20% > Residual land > 5%
Good, Residual land > 50%
Good, 50% > Residual land > 20%
Good, 20% > Residual land > 5%
Poor, Residual land > 50%
Poor, 50% > Residual land > 20%
Poor, 20% > Residual land > 5%
Not suitable , Residual land > 50%
Not suitable, 50% > Residual land > 20%
Not suitable, 20% > Residual land > 5%
Residual land > 5%
Residal land occurence and its suitability for jatropha
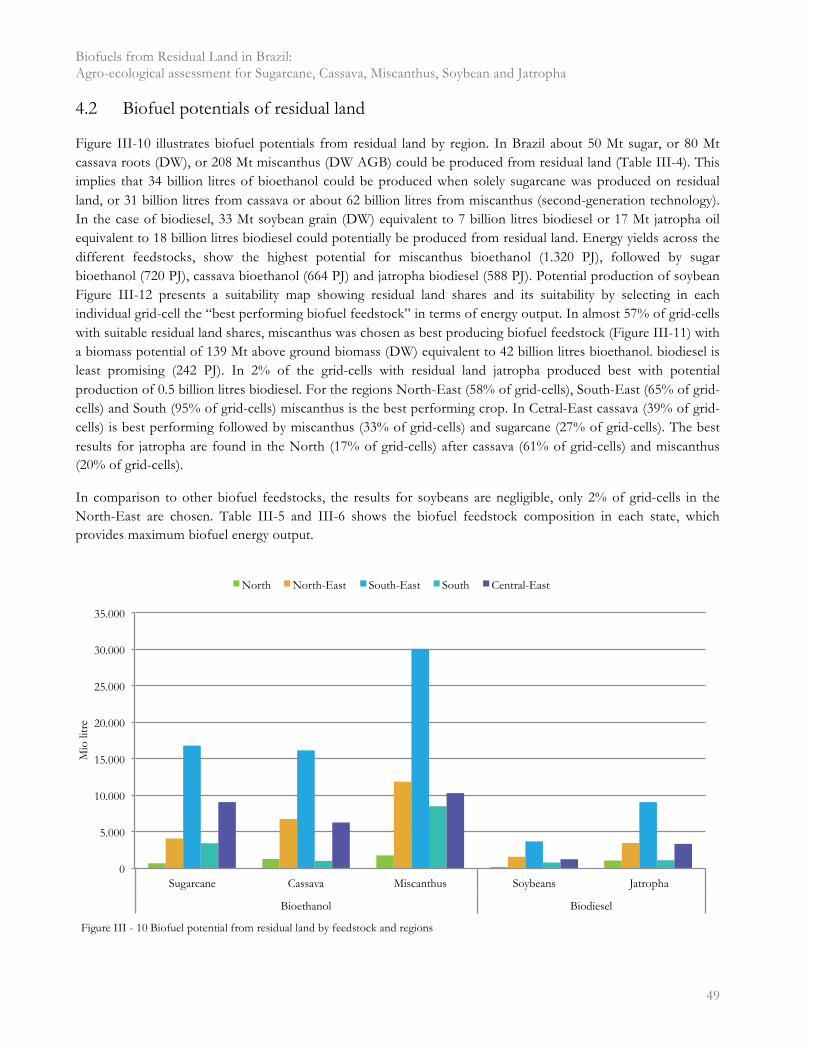
Biofuels from Residual Land in Brazil: Agro-ecological assessment for Sugarcane, Cassava, Miscanthus, Soybean and Jatropha
� 49
4.2 Biofuel potentials of residual land
Figure III-10 illustrates biofuel potentials from residual land by region. In Brazil about 50 Mt sugar, or 80 Mt cassava roots (DW), or 208 Mt miscanthus (DW AGB) could be produced from residual land (Table III-4). This implies that 34 billion litres of bioethanol could be produced when solely sugarcane was produced on residual land, or 31 billion litres from cassava or about 62 billion litres from miscanthus (second-generation technology). In the case of biodiesel, 33 Mt soybean grain (DW) equivalent to 7 billion litres biodiesel or 17 Mt jatropha oil equivalent to 18 billion litres biodiesel could potentially be produced from residual land. Energy yields across the different feedstocks, show the highest potential for miscanthus bioethanol (1.320 PJ), followed by sugar bioethanol (720 PJ), cassava bioethanol (664 PJ) and jatropha biodiesel (588 PJ). Potential production of soybean Figure III-12 presents a suitability map showing residual land shares and its suitability by selecting in each individual grid-cell the “best performing biofuel feedstock” in terms of energy output. In almost 57% of grid-cells with suitable residual land shares, miscanthus was chosen as best producing biofuel feedstock (Figure III-11) with a biomass potential of 139 Mt above ground biomass (DW) equivalent to 42 billion litres bioethanol. biodiesel is least promising (242 PJ). In 2% of the grid-cells with residual land jatropha produced best with potential production of 0.5 billion litres biodiesel. For the regions North-East (58% of grid-cells), South-East (65% of grid-cells) and South (95% of grid-cells) miscanthus is the best performing crop. In Cetral-East cassava (39% of grid-cells) is best performing followed by miscanthus (33% of grid-cells) and sugarcane (27% of grid-cells). The best results for jatropha are found in the North (17% of grid-cells) after cassava (61% of grid-cells) and miscanthus (20% of grid-cells).
In comparison to other biofuel feedstocks, the results for soybeans are negligible, only 2% of grid-cells in the North-East are chosen. Table III-5 and III-6 shows the biofuel feedstock composition in each state, which provides maximum biofuel energy output.
0
5.000
10.000
15.000
20.000
25.000
30.000
35.000
Sugarcane Cassava Miscanthus Soybeans Jatropha
Bioethanol Biodiesel
Mio
litr
e
North North-East South-East South Central-East
Figure III - 10 Biofuel potential from residual land by feedstock and regions
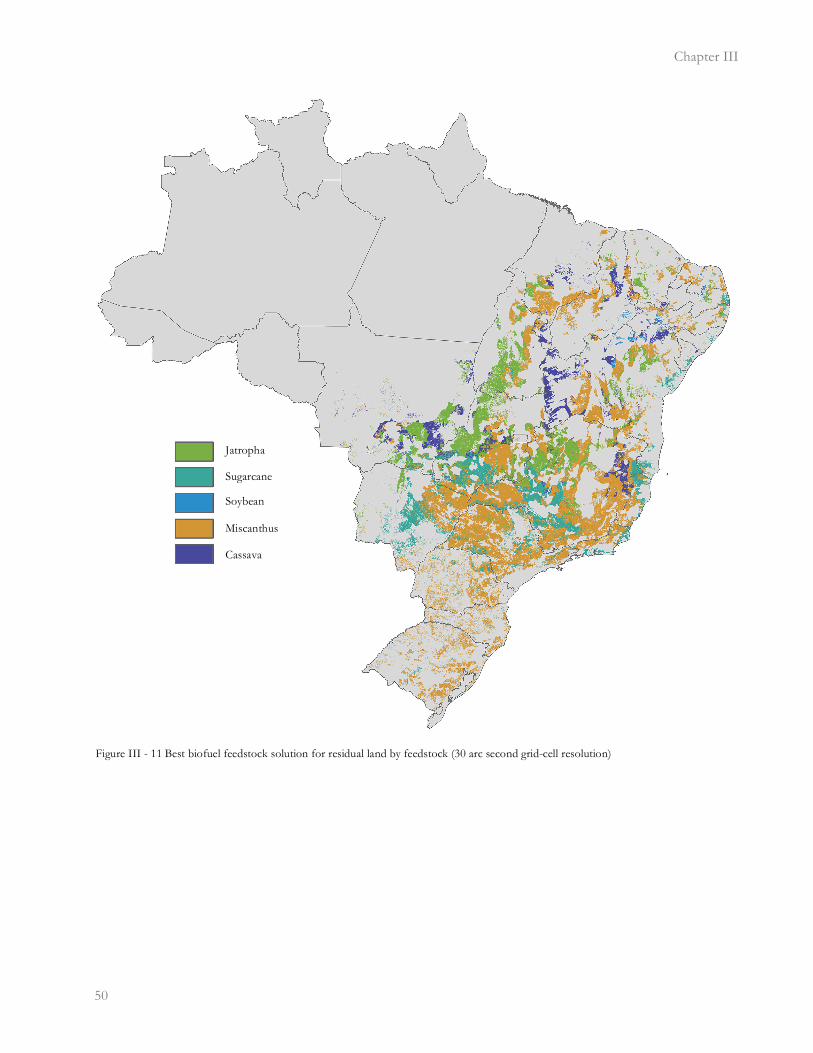
Chapter III
�50
Figure III - 11 Best biofuel feedstock solution for residual land by feedstock (30 arc second grid-cell resolution)
Jatropha
Sugarcane
Soybean
Miscanthus
Cassava
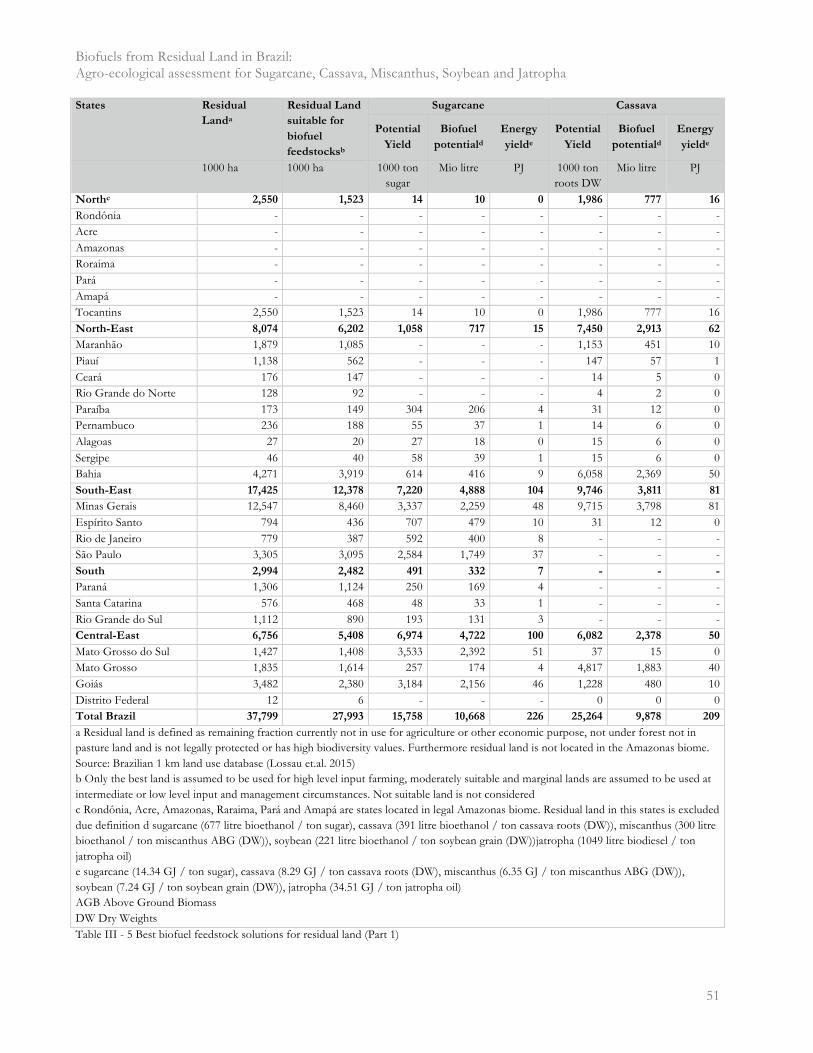
Biofuels from Residual Land in Brazil: Agro-ecological assessment for Sugarcane, Cassava, Miscanthus, Soybean and Jatropha
� 51
States Residual
Landa
Residual Land
suitable for
biofuel
feedstocksb
Sugarcane Cassava
Potential
Yield
Biofuel
potentiald
Energy
yielde
Potential
Yield
Biofuel
potentiald
Energy
yielde
1000 ha 1000 ha 1000 ton sugar
Mio litre PJ 1000 ton roots DW
Mio litre PJ
Northc 2,550 1,523 14 10 0 1,986 777 16
Rondônia - - - - - - - - Acre - - - - - - - - Amazonas - - - - - - - - Roraima - - - - - - - - Pará - - - - - - - - Amapá - - - - - - - - Tocantins 2,550 1,523 14 10 0 1,986 777 16 North-East 8,074 6,202 1,058 717 15 7,450 2,913 62
Maranhão 1,879 1,085 - - - 1,153 451 10 Piauí 1,138 562 - - - 147 57 1 Ceará 176 147 - - - 14 5 0 Rio Grande do Norte 128 92 - - - 4 2 0 Paraíba 173 149 304 206 4 31 12 0 Pernambuco 236 188 55 37 1 14 6 0 Alagoas 27 20 27 18 0 15 6 0 Sergipe 46 40 58 39 1 15 6 0 Bahia 4,271 3,919 614 416 9 6,058 2,369 50 South-East 17,425 12,378 7,220 4,888 104 9,746 3,811 81
Minas Gerais 12,547 8,460 3,337 2,259 48 9,715 3,798 81 Espírito Santo 794 436 707 479 10 31 12 0 Rio de Janeiro 779 387 592 400 8 - - - São Paulo 3,305 3,095 2,584 1,749 37 - - - South 2,994 2,482 491 332 7 - - -
Paraná 1,306 1,124 250 169 4 - - - Santa Catarina 576 468 48 33 1 - - - Rio Grande do Sul 1,112 890 193 131 3 - - - Central-East 6,756 5,408 6,974 4,722 100 6,082 2,378 50
Mato Grosso do Sul 1,427 1,408 3,533 2,392 51 37 15 0 Mato Grosso 1,835 1,614 257 174 4 4,817 1,883 40 Goiás 3,482 2,380 3,184 2,156 46 1,228 480 10 Distrito Federal 12 6 - - - 0 0 0 Total Brazil 37,799 27,993 15,758 10,668 226 25,264 9,878 209
a Residual land is defined as remaining fraction currently not in use for agriculture or other economic purpose, not under forest not in pasture land and is not legally protected or has high biodiversity values. Furthermore residual land is not located in the Amazonas biome. Source: Brazilian 1 km land use database (Lossau et.al. 2015) b Only the best land is assumed to be used for high level input farming, moderately suitable and marginal lands are assumed to be used at intermediate or low level input and management circumstances. Not suitable land is not considered c Rondônia, Acre, Amazonas, Raraima, Pará and Amapá are states located in legal Amazonas biome. Residual land in this states is excluded due definition d sugarcane (677 litre bioethanol / ton sugar), cassava (391 litre bioethanol / ton cassava roots (DW)), miscanthus (300 litre bioethanol / ton miscanthus ABG (DW)), soybean (221 litre bioethanol / ton soybean grain (DW))jatropha (1049 litre biodiesel / ton jatropha oil) e sugarcane (14.34 GJ / ton sugar), cassava (8.29 GJ / ton cassava roots (DW), miscanthus (6.35 GJ / ton miscanthus ABG (DW)), soybean (7.24 GJ / ton soybean grain (DW)), jatropha (34.51 GJ / ton jatropha oil) AGB Above Ground Biomass DW Dry Weights Table III - 5 Best biofuel feedstock solutions for residual land (Part 1)
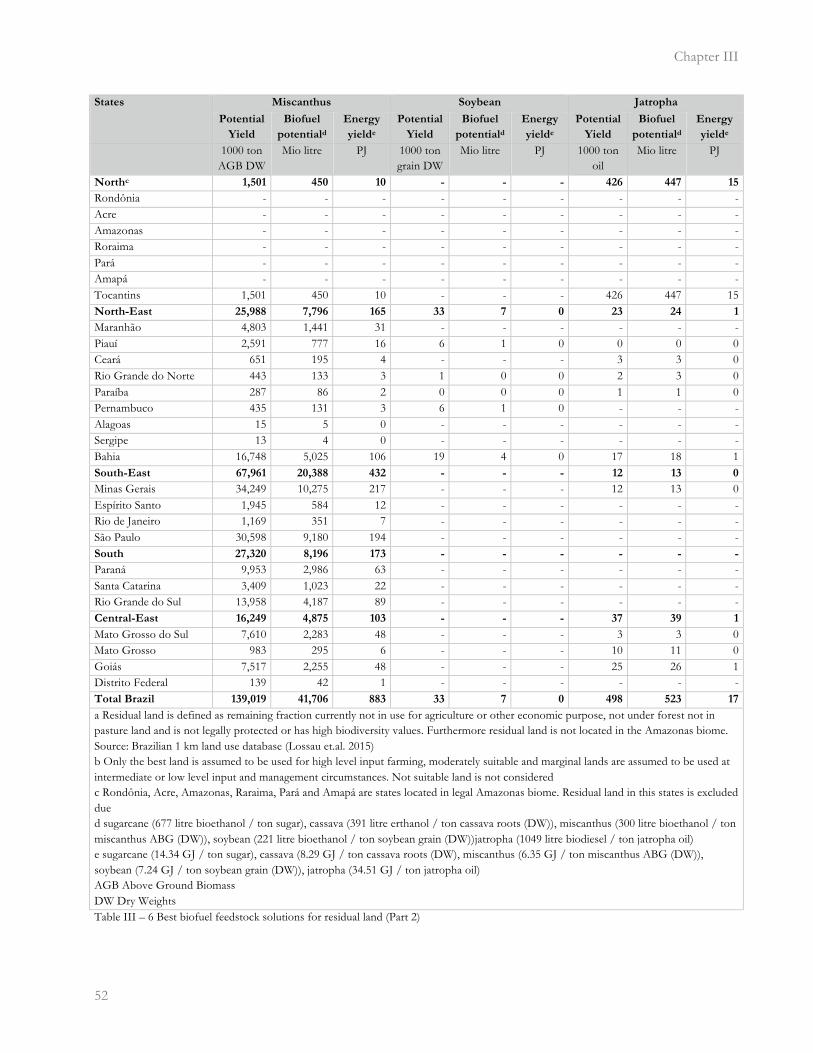
Chapter III
�52
States Miscanthus Soybean Jatropha
Potential
Yield
Biofuel
potentiald
Energy
yielde
Potential
Yield
Biofuel
potentiald
Energy
yielde
Potential
Yield
Biofuel
potentiald
Energy
yielde
1000 ton AGB DW
Mio litre PJ 1000 ton grain DW
Mio litre PJ 1000 ton oil
Mio litre PJ
Northc 1,501 450 10 - - - 426 447 15
Rondônia - - - - - - - - - Acre - - - - - - - - - Amazonas - - - - - - - - - Roraima - - - - - - - - - Pará - - - - - - - - - Amapá - - - - - - - - - Tocantins 1,501 450 10 - - - 426 447 15 North-East 25,988 7,796 165 33 7 0 23 24 1
Maranhão 4,803 1,441 31 - - - - - - Piauí 2,591 777 16 6 1 0 0 0 0 Ceará 651 195 4 - - - 3 3 0 Rio Grande do Norte 443 133 3 1 0 0 2 3 0 Paraíba 287 86 2 0 0 0 1 1 0 Pernambuco 435 131 3 6 1 0 - - - Alagoas 15 5 0 - - - - - - Sergipe 13 4 0 - - - - - - Bahia 16,748 5,025 106 19 4 0 17 18 1 South-East 67,961 20,388 432 - - - 12 13 0
Minas Gerais 34,249 10,275 217 - - - 12 13 0 Espírito Santo 1,945 584 12 - - - - - - Rio de Janeiro 1,169 351 7 - - - - - - São Paulo 30,598 9,180 194 - - - - - - South 27,320 8,196 173 - - - - - -
Paraná 9,953 2,986 63 - - - - - - Santa Catarina 3,409 1,023 22 - - - - - - Rio Grande do Sul 13,958 4,187 89 - - - - - - Central-East 16,249 4,875 103 - - - 37 39 1
Mato Grosso do Sul 7,610 2,283 48 - - - 3 3 0 Mato Grosso 983 295 6 - - - 10 11 0 Goiás 7,517 2,255 48 - - - 25 26 1 Distrito Federal 139 42 1 - - - - - - Total Brazil 139,019 41,706 883 33 7 0 498 523 17
a Residual land is defined as remaining fraction currently not in use for agriculture or other economic purpose, not under forest not in pasture land and is not legally protected or has high biodiversity values. Furthermore residual land is not located in the Amazonas biome. Source: Brazilian 1 km land use database (Lossau et.al. 2015) b Only the best land is assumed to be used for high level input farming, moderately suitable and marginal lands are assumed to be used at intermediate or low level input and management circumstances. Not suitable land is not considered c Rondônia, Acre, Amazonas, Raraima, Pará and Amapá are states located in legal Amazonas biome. Residual land in this states is excluded due d sugarcane (677 litre bioethanol / ton sugar), cassava (391 litre erthanol / ton cassava roots (DW)), miscanthus (300 litre bioethanol / ton miscanthus ABG (DW)), soybean (221 litre bioethanol / ton soybean grain (DW))jatropha (1049 litre biodiesel / ton jatropha oil) e sugarcane (14.34 GJ / ton sugar), cassava (8.29 GJ / ton cassava roots (DW), miscanthus (6.35 GJ / ton miscanthus ABG (DW)), soybean (7.24 GJ / ton soybean grain (DW)), jatropha (34.51 GJ / ton jatropha oil) AGB Above Ground Biomass DW Dry Weights Table III – 6 Best biofuel feedstock solutions for residual land (Part 2)
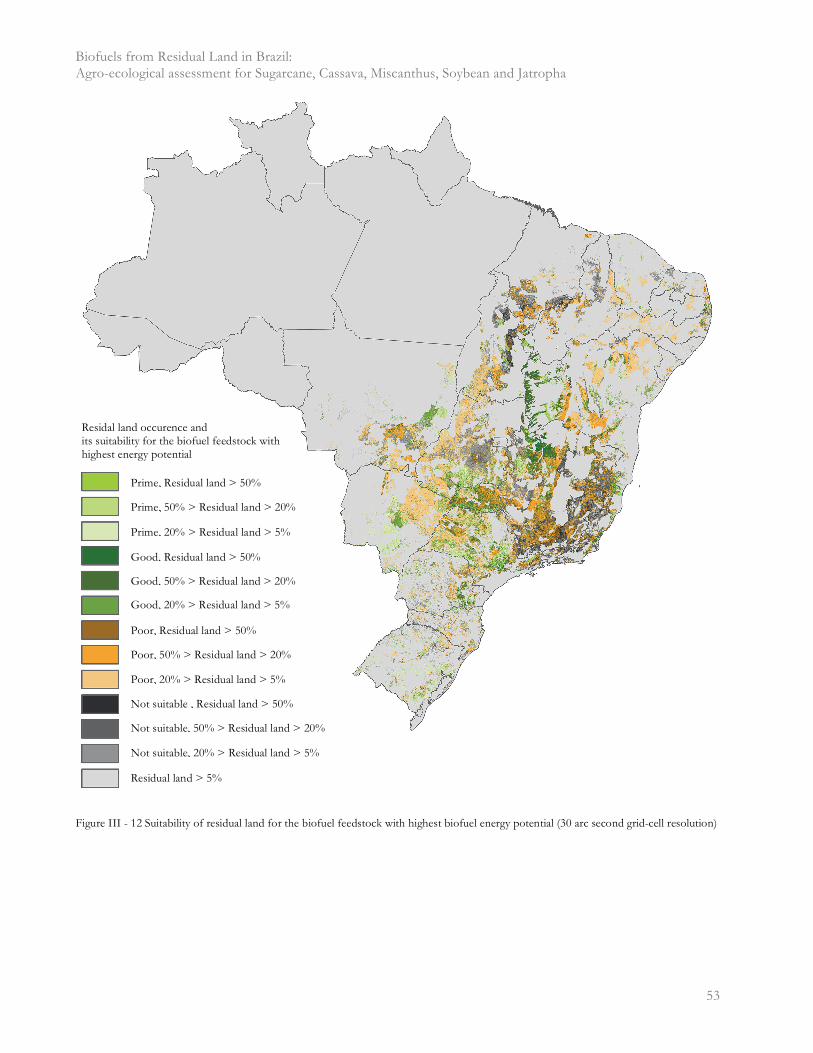
Biofuels from Residual Land in Brazil: Agro-ecological assessment for Sugarcane, Cassava, Miscanthus, Soybean and Jatropha
� 53
Figure III - 12 Suitability of residual land for the biofuel feedstock with highest biofuel energy potential (30 arc second grid-cell resolution)
Residal land occurence and its suitability for the biofuel feedstock with highest energy potential
Prime, Residual land > 50%
Prime, 50% > Residual land > 20%
Prime, 20% > Residual land > 5%
Good, Residual land > 50%
Good, 50% > Residual land > 20%
Good, 20% > Residual land > 5%
Poor, Residual land > 50%
Poor, 50% > Residual land > 20%
Poor, 20% > Residual land > 5%
Not suitable , Residual land > 50%
Not suitable, 50% > Residual land > 20%
Not suitable, 20% > Residual land > 5%
Residual land > 5%
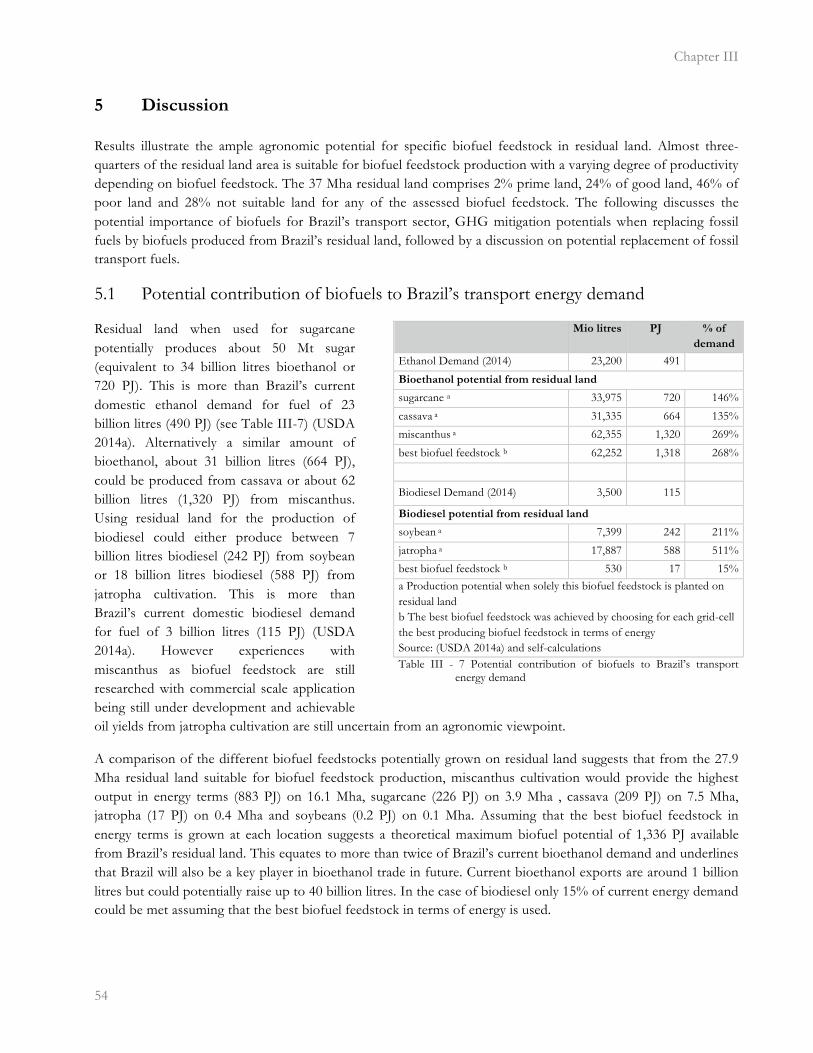
Chapter III
�54
5 Discussion
�
Results illustrate the ample agronomic potential for specific biofuel feedstock in residual land. Almost three-quarters of the residual land area is suitable for biofuel feedstock production with a varying degree of productivity depending on biofuel feedstock. The 37 Mha residual land comprises 2% prime land, 24% of good land, 46% of poor land and 28% not suitable land for any of the assessed biofuel feedstock. The following discusses the potential importance of biofuels for Brazil’s transport sector, GHG mitigation potentials when replacing fossil fuels by biofuels produced from Brazil’s residual land, followed by a discussion on potential replacement of fossil transport fuels.
5.1 Potential contribution of biofuels to Brazil’s transport energy demand
Residual land when used for sugarcane potentially produces about 50 Mt sugar (equivalent to 34 billion litres bioethanol or 720 PJ). This is more than Brazil’s current domestic ethanol demand for fuel of 23 billion litres (490 PJ) (see Table III-7) (USDA 2014a). Alternatively a similar amount of bioethanol, about 31 billion litres (664 PJ), could be produced from cassava or about 62 billion litres (1,320 PJ) from miscanthus. Using residual land for the production of biodiesel could either produce between 7 billion litres biodiesel (242 PJ) from soybean or 18 billion litres biodiesel (588 PJ) from jatropha cultivation. This is more than Brazil’s current domestic biodiesel demand for fuel of 3 billion litres (115 PJ) (USDA 2014a). However experiences with miscanthus as biofuel feedstock are still researched with commercial scale application being still under development and achievable oil yields from jatropha cultivation are still uncertain from an agronomic viewpoint.
A comparison of the different biofuel feedstocks potentially grown on residual land suggests that from the 27.9 Mha residual land suitable for biofuel feedstock production, miscanthus cultivation would provide the highest output in energy terms (883 PJ) on 16.1 Mha, sugarcane (226 PJ) on 3.9 Mha , cassava (209 PJ) on 7.5 Mha, jatropha (17 PJ) on 0.4 Mha and soybeans (0.2 PJ) on 0.1 Mha. Assuming that the best biofuel feedstock in energy terms is grown at each location suggests a theoretical maximum biofuel potential of 1,336 PJ available from Brazil’s residual land. This equates to more than twice of Brazil’s current bioethanol demand and underlines that Brazil will also be a key player in bioethanol trade in future. Current bioethanol exports are around 1 billion litres but could potentially raise up to 40 billion litres. In the case of biodiesel only 15% of current energy demand could be met assuming that the best biofuel feedstock in terms of energy is used.
Mio litres PJ % of
demand
Ethanol Demand (2014) 23,200 491
Bioethanol potential from residual land
sugarcane a 33,975 720 146%
cassava a 31,335 664 135%
miscanthus a 62,355 1,320 269%
best biofuel feedstock b 62,252 1,318 268%
Biodiesel Demand (2014) 3,500 115
Biodiesel potential from residual land
soybean a 7,399 242 211%
jatropha a 17,887 588 511%
best biofuel feedstock b 530 17 15% a Production potential when solely this biofuel feedstock is planted on residual land b The best biofuel feedstock was achieved by choosing for each grid-cell the best producing biofuel feedstock in terms of energy Source: (USDA 2014a) and self-calculations Table III - 7 Potential contribution of biofuels to Brazil’s transport
energy demand
Biofuels from Residual Land in Brazil: Agro-ecological assessment for Sugarcane, Cassava, Miscanthus, Soybean and Jatropha
� 55
However, not all land with identified technical potential of residual land qualifies equally for the practical implementation of biofuel feedstock plantations. Hence, in addition to the quality and suitability of residual land also location-specific investment requirement and transport cost as well as future demand for food, livestock feed and pasture land will play an important role in the discussion of residual land potentials for biofuel feedstocks.
Farm economics and logistics will favour production of biofuel feedstocks in areas of high residual land concentration with prime and good quality. Most such areas are concentrated in the West of Bahia, all over São Paulo, in the East of Mato Grosso and in the West of Paraná. In these areas the residual land shares per pixel are higher than 33% and in addition more than half of the land is from prime or good quality for biofuel feedstocks.
By 2030 availability of the 37 Mha residual land for biofuel feedstock production is possible when pastures are carefully used for livestock and cropland expansion (see Lossau et al. 2015). However, it is important to emphasize that food and livestock feed demand higher than those projected would exceed Brazil’s pasture production capacities, then at least part of the residual land will be required for the food and livestock feed sector assuming that safeguarding forest ecosystems is a prime objective.
5.2 GHG reduction potential
Over the past few years there has been a debate on the extent to which biofuels reduce GHG in view of emissions associated with direct and indirect land-use changes (LUC) triggered by biofuel production (Edwards et al. 2010, Tyner et al. 2010, Bauen et al. 2010, Rettenmaier et al. 2009, Lange 2010). GHG emission factors vary depending on the specific biofuel production process, feedstock production practices, and amount and type of agro-chemicals used. The Renewable Energy Directive 2009 (RED) (EC 2009) by the European Commission (EC) has put forward regulations discouraging LUC for expansion of the bioenergy feedstock production area. The Renewable Energy Directive provides values for carbon intensities for different biofuel chains in CO2 equivalent (CO2eq) per MJ of biofuel for sugarcane bioethanol and soybean biodiesel. For jatropha biodiesel, cassava and miscanthus bioethanol GHG emission values are taken from the Renewable Transport Fuel Obligation (RTFO) (RFA-RTFO 2012). GHG values for different biofuel systems, summarized by Renewable Fuels Agency (RFA), specify values for each step of the fuel chain, from crop production to filling station. The GHG emission factors are presented in Table III-1.
Biofuel GHG emissions are compared with the energy systems replaced. The fossil reference system indicates 83,8 g CO2eq emissions per MJ of consumed gasoline or diesel (EC 2009). Figure III-13 presents potential GHG emissions saving assuming that the feedstock with the highest energy potential in residual land is used for replacing fossil transport fuels.
Results suggest that sugarcane bioethanol has a significant potential for GHG mitigation. About 43 Mt CO2eq could be saved annually by using sugarcane bioethanol from Brazil’s residual land. The GHG mitigation savings associated with biodiesel from soybeans are more modest; only 8 Mt CO2eq could be saved. More promising is cassava bioethanol with a GHG saving potential about 27 Mt CO2eq. The best biofuel option for reducing GHG emissions of the transport sector is miscanthus bioethanol (98 Mt CO2eq) followed by jatropha biodiesel (34 Mt CO2eq).
Reference values of GHG within the framework of the sustainability directive of the Renewable Energy Directive, are conservative (Rettenmaier et al. 2014). The levels of CO2 mitigation associated with biofuels could be substantially reduced when accounting the use of co-products and to use of process energy from renewable sources rather than from fossil fuels (OECD-IEA 2011). The Renewable Energy Directive attributes a bonus of
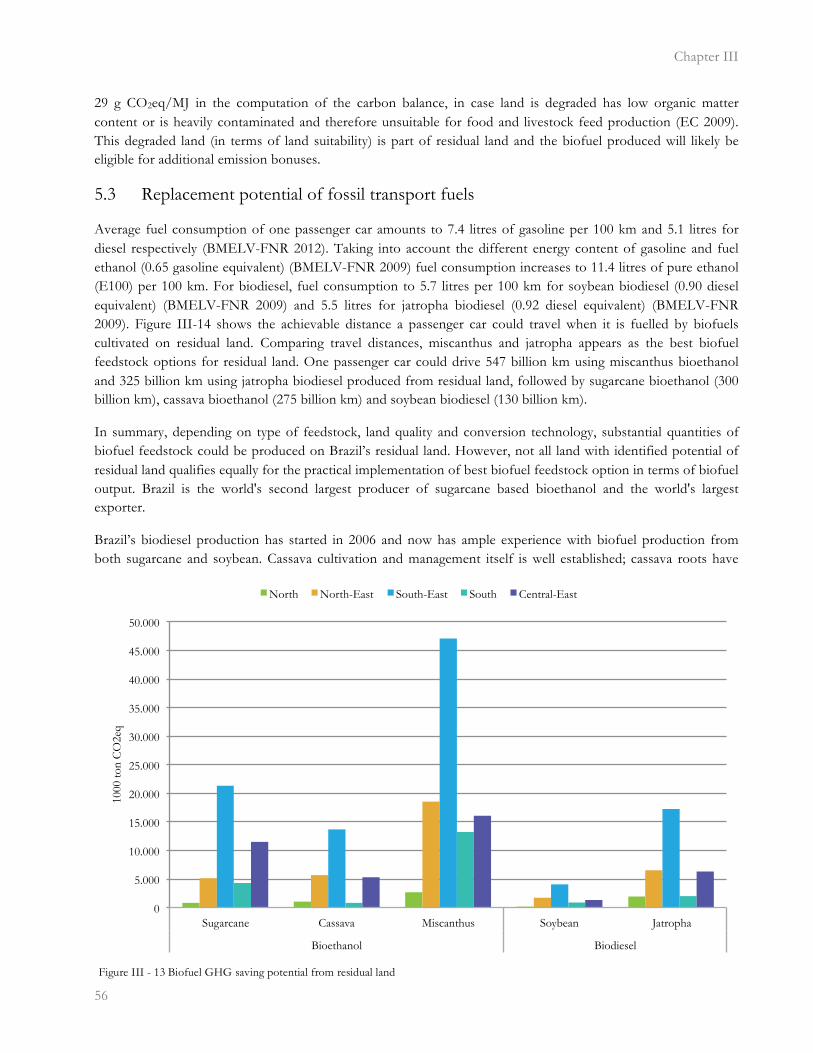
Chapter III
�56
29 g CO2eq/MJ in the computation of the carbon balance, in case land is degraded has low organic matter content or is heavily contaminated and therefore unsuitable for food and livestock feed production (EC 2009). This degraded land (in terms of land suitability) is part of residual land and the biofuel produced will likely be eligible for additional emission bonuses.
5.3 Replacement potential of fossil transport fuels
Average fuel consumption of one passenger car amounts to 7.4 litres of gasoline per 100 km and 5.1 litres for diesel respectively (BMELV-FNR 2012). Taking into account the different energy content of gasoline and fuel ethanol (0.65 gasoline equivalent) (BMELV-FNR 2009) fuel consumption increases to 11.4 litres of pure ethanol (E100) per 100 km. For biodiesel, fuel consumption to 5.7 litres per 100 km for soybean biodiesel (0.90 diesel equivalent) (BMELV-FNR 2009) and 5.5 litres for jatropha biodiesel (0.92 diesel equivalent) (BMELV-FNR 2009). Figure III-14 shows the achievable distance a passenger car could travel when it is fuelled by biofuels cultivated on residual land. Comparing travel distances, miscanthus and jatropha appears as the best biofuel feedstock options for residual land. One passenger car could drive 547 billion km using miscanthus bioethanol and 325 billion km using jatropha biodiesel produced from residual land, followed by sugarcane bioethanol (300 billion km), cassava bioethanol (275 billion km) and soybean biodiesel (130 billion km).
In summary, depending on type of feedstock, land quality and conversion technology, substantial quantities of biofuel feedstock could be produced on Brazil’s residual land. However, not all land with identified potential of residual land qualifies equally for the practical implementation of best biofuel feedstock option in terms of biofuel output. Brazil is the world's second largest producer of sugarcane based bioethanol and the world's largest exporter.
Brazil’s biodiesel production has started in 2006 and now has ample experience with biofuel production from both sugarcane and soybean. Cassava cultivation and management itself is well established; cassava roots have
0
5.000
10.000
15.000
20.000
25.000
30.000
35.000
40.000
45.000
50.000
Sugarcane Cassava Miscanthus Soybean Jatropha
Bioethanol Biodiesel
1000
ton
CO
2eq
North North-East South-East South Central-East
Figure III - 13 Biofuel GHG saving potential from residual land

Biofuels from Residual Land in Brazil: Agro-ecological assessment for Sugarcane, Cassava, Miscanthus, Soybean and Jatropha
� 57
long been produced as food crop. In the case of jatropha and miscanthus, relevant experience is currently not available both at the feedstock production level and for the industrial biofuel production. Varying of degrees of spatial concentration and quality and suitability of residual land, location-specific investment requirements, feedstock transportation costs, and future demand for food and livestock feed will motivate future exploitation of residual land potentials for biofuel feedstock production.
6 Conclusions
�
A detailed land balance analysis of Brazil (Lossau et al. 2015) suggests availability of 37 Mha residual land, an area equivalent to about 50% of current cropland. Residual land excludes cropland, pastures, forests, urban areas, the Amazon biome, and all areas designated as protected or of high biodiversity value. Residual land is mainly concentrated in the South-East (17 Mha), other important regions include the North-East (8 Mha) and Central-East (7 Mha).
Land suitability assessment of residual land reveals that almost three-quarters of the residual land area is to some degree suitable for biofuel feedstock production. Of the 37 Mha residual land 2% is prime of quality land, 24% of good land, of 46% poor land and 28% of not suitable land for the assessed biofuel feedstocks.
Residual land when used for sugarcane potentially produces about 50 Mt sugar (equivalent to 34 billion litres bioethanol or 720 PJ). This is more than Brazil’s current domestic ethanol demand of 23 billion litres (491 PJ) (USDA 2014a). Alternatively a similar amount of bioethanol, about 31 billion litres (664 PJ), could be produced from cassava or about 62 billion litres (1,320 PJ) from miscanthus. However miscanthus conversion to biofuel requires second-generation technologies, for which commercial-scale application is still under development.
-
50.000
100.000
150.000
200.000
250.000
300.000
Sugarcane Cassava Miscanthus Soybean Jatropha
Bioethanol Biodiesel
Mio
km
North North-East South-East South Central-East
Figure III - 14 Cruising range of one passenger car using biofuels from residual land

Chapter III
�58
Using residual land for the production of biodiesel could either produce between 7 billion litres biodiesel (242 PJ) from soybeans or 18 billion litres biodiesel (588 PJ) from jatropha cultivation. However, achievable oil yields from jatropha cultivation are still uncertain from an agronomic point of view.
Assuming that the best biofuel feedstock in energy terms is grown in each location, suggests a theoretical maximum biofuel potential of 1,378 PJ available from Brazil’s residual land. Of this potential the majority is from miscanthus grown on 16 Mha, followed by cassava on 7.5 Mha and sugarcane grown on 4 Mha. Jatropha derived biodiesel is the best option in energy terms only on 0.4 Mha followed by soybean on 0.1 Mha residual land.
Not all land with identified technical potential of residual land qualifies equally for the practical implementation of biofuel feedstock plantations. Varying of degrees of spatial concentration and quality and suitability of residual land, location-specific investment requirements, feedstock transportation costs, and future demand for food and livestock feed will motivate future exploitation of residual land potentials for biofuel feedstock production.
Only when the livestock sector continues to increase its non-pasture based feed share, the 37 Mha (27.5 Mha) residual land can be available for the use of biofuel feedstock production beyond 2010 (Lossau et al. 2015). Potential future biofuel feedstock production from residual land may need adjustment due to climate change impacts, to be explored in follow-up research.
Acknowledgement
�
The authors thank Professor Sobral from University of Pernambuco for kindly providing information on available land use data for Brazil. Additionally thanks goes to Mr George Francis for providing support on available data for jatropha and miscanthus. We would like to acknowledge the importance of the funding provided by the Wissenschaftlicher Beirat der Bundesregierung Globale Umweltveränderungen (WBGU), within the scope of the Young Scientist Summer Program (YSSP), organized by the International Institute for Systems analysis (IIASA).
Biofuels from Wasteland in India: Agro-ecological assessment for Jatropha, Miscanthus and Sugarcane
� 59
Chapter IV
Biofuels from Wasteland in India:
Agro-ecological assessment for Jatropha, Miscanthus and Sugarcane4
Abstract
�
There is a large interest in biofuels in India as a substitute to fossil fuels, with a purpose of enhancing energy security and promoting rural development. India has set an ambitious target of substituting 20% of fossil fuel consumption of biodiesel and bioethanol by 2017. India has announced a national biofuel policy and launched a large program to promote biofuel production, particularly for wastelands. The implications need to be studied intensively considering the fact that India is a large transitional economy with high population density and large rural population depending upon agricultural activities for their livelihood. Another factor is that Indian economy is experiencing high growth rate, which increases demands for food and livestock products. This paper presents an assessment of biofuel production potentials on Indian wasteland, which combines available statistical information from the agricultural survey and specific statistical data of wastelands from the Wasteland Atlas with geospatial information for wasteland suitability for biofuel feedstocks obtained from the Global Agro-ecological Zones (GAEZ) assessment, which was carried out for the purpose of this study. Downscaling procedures have been implemented to estimate the suitability of biofuel feedstocks on culturable wasteland. Results indicate that of the total continental area of India (327 Mha), 14% of which is considered wasteland contains less than one-third (13 Mha) that is somehow suitable for growing biofuels feedstocks. The potential productivity estimates of wasteland, expressed in biomass (t/ha) and biofuel equivalents (l/t), for established biofuel feedstock sugarcane has been compared with alternative biofuel feedstocks, miscanthus and jatropha. The production potential of wastelands we estimate to be 3.9 billion litres bioethanol for sugarcane and 11.7 billion litres for miscanthus. Potential biodiesel production of jatropha was estimated to be about 6.6 billion litres biodiesel. Biofuel feedstocks production potentials have been converted to energy output (GJ) and equated with GHG saving potential (ton CO2eq). Further, for the culturable wasteland share in a district the maximum amount of biofuel energy, was determined by selecting for each district the best yielding biofuel feedstocks in terms of biofuel energy output
Keywords: Wasteland, GAEZ methodology, Biofuel, India, GHG savings
1 Introduction
�
India is the world’s fourth largest primary energy consumer and fourth largest petroleum consumer (EIA 2014). Rapid economic expansion of around 9% (OECD-IEA 2012b) in recent years has increased primary energy demand from 13 EJ in 1990 to 29 EJ in 2010, which is expected to more than double by 2035 (OECD-IEA 2012a). The highest growth rate occurs in the transport sector (WEO 2007), which is driven by road traffic with annual growth rates during recent years of 7 to 10% (USDA 2012). The current 2 EJ energy demand of the transport sector is expected to more than quadruple by 2035 (OECD-IEA 2012a). Diesel and gasoline cover
��������������������������������������������������������
��Lossau S, Fischer G, Tramberend S, van Velthuizen H, Kleinschmit B, Schomäcker R. Biofuels from Wasteland in India: Agro-ecological assessment for Jatropha, Miscanthus and Sugarcane. Forthcoming at Biomass and Bioenergy, Elsevier B.V, Amsterdam, Netherlands�
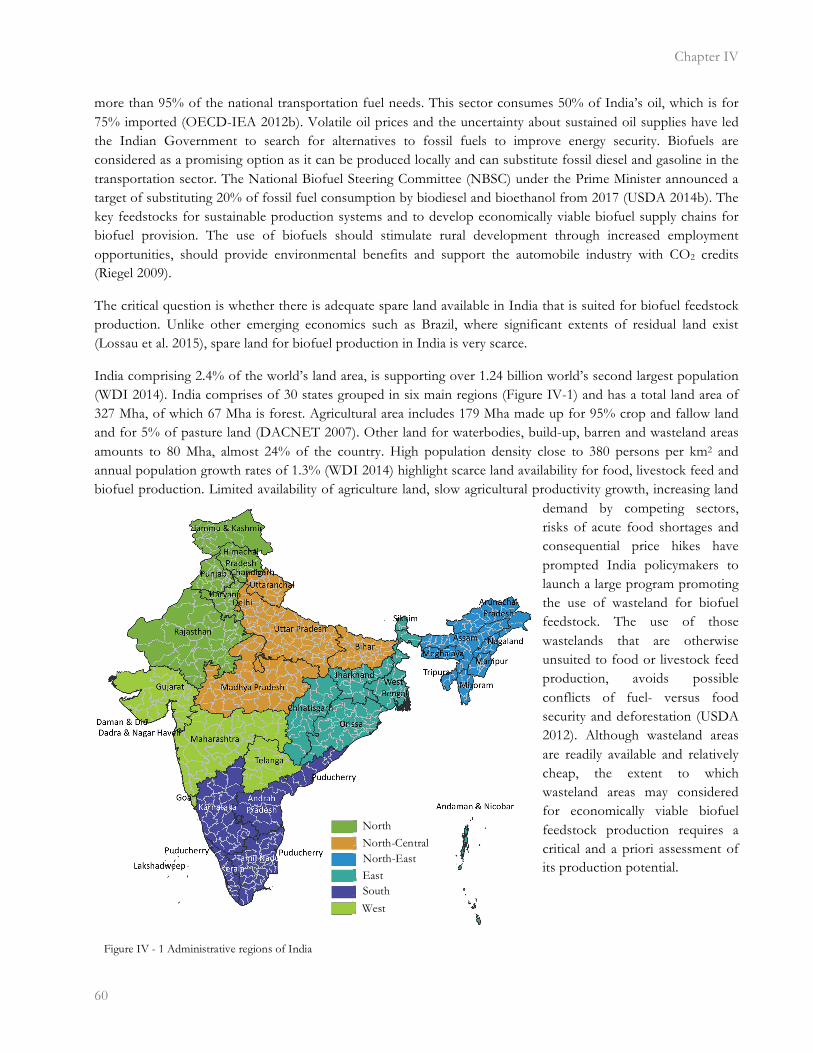
Chapter IV
�60
more than 95% of the national transportation fuel needs. This sector consumes 50% of India’s oil, which is for 75% imported (OECD-IEA 2012b). Volatile oil prices and the uncertainty about sustained oil supplies have led the Indian Government to search for alternatives to fossil fuels to improve energy security. Biofuels are considered as a promising option as it can be produced locally and can substitute fossil diesel and gasoline in the transportation sector. The National Biofuel Steering Committee (NBSC) under the Prime Minister announced a target of substituting 20% of fossil fuel consumption by biodiesel and bioethanol from 2017 (USDA 2014b). The key feedstocks for sustainable production systems and to develop economically viable biofuel supply chains for biofuel provision. The use of biofuels should stimulate rural development through increased employment opportunities, should provide environmental benefits and support the automobile industry with CO2 credits (Riegel 2009).
The critical question is whether there is adequate spare land available in India that is suited for biofuel feedstock production. Unlike other emerging economics such as Brazil, where significant extents of residual land exist (Lossau et al. 2015), spare land for biofuel production in India is very scarce.
India comprising 2.4% of the world’s land area, is supporting over 1.24 billion world’s second largest population (WDI 2014). India comprises of 30 states grouped in six main regions (Figure IV-1) and has a total land area of 327 Mha, of which 67 Mha is forest. Agricultural area includes 179 Mha made up for 95% crop and fallow land and for 5% of pasture land (DACNET 2007). Other land for waterbodies, build-up, barren and wasteland areas amounts to 80 Mha, almost 24% of the country. High population density close to 380 persons per km2 and annual population growth rates of 1.3% (WDI 2014) highlight scarce land availability for food, livestock feed and biofuel production. Limited availability of agriculture land, slow agricultural productivity growth, increasing land
demand by competing sectors, risks of acute food shortages and consequential price hikes have prompted India policymakers to launch a large program promoting the use of wasteland for biofuel feedstock. The use of those wastelands that are otherwise unsuited to food or livestock feed production, avoids possible conflicts of fuel- versus food security and deforestation (USDA 2012). Although wasteland areas are readily available and relatively cheap, the extent to which wasteland areas may considered for economically viable biofuel feedstock production requires a critical and a priori assessment of its production potential.
Figure IV - 1 Administrative regions of India�
North North-Central North-East East South
West
Biofuels from Wasteland in India: Agro-ecological assessment for Jatropha, Miscanthus and Sugarcane
� 61
For these reasons, Daimler AG in co-operation with the International Institute for Applied System Analysis (IIASA) and the Technical University of Berlin launched a project to locate and subsequently assess suitability and yield potentials of wasteland for promising biofuel feedstocks.
The research combines available statistical information from India’s agricultural survey (DACNET 2007) and statistical data contained in the Wasteland Atlas of India (NRSC 2010). Derived locations and extents of wasteland have been assessed for feedstock production potentials (FAO-IIASA 2012). Suitability and productivity of jatropha, sugarcane and miscanthus is estimated as follows:
(i) Assessment of biophysical production potentials of wastelands for sugarcane (currently cultivated for biofuel production); jatropha (currently tested) and miscanthus (option for additional feedstock currently under consideration);
(ii) Aggregation of attainable yield and production of wasteland by district and by state, calculated in terms of biomass (t/ha), biofuel equivalent (l/ha) and energy (GJ/ha);
(iii) Quantification of greenhouse gas (GHG) saved (in tonnes CO2 equivalent (CO2eq)) through replacement of fossil fuels with biofuels from wasteland;
(iv) Maximizing biofuels produced from wasteland at district level by selection of biofuel feedstocks in terms of biofuel energy output (GJ/ton biomass);
(v) Assessing the degree of concentration of suitable wasteland based on best performing feedstock;
(vi) Determining potential future use of wasteland for biofuel feedstocks and its impact on biofuel production and CO2 emission reductions
After introducing the current Indian status of biofuel production in section 2, section 3 presents data and methodology applied for the location of wasteland and the assessment of biomass yield potentials. Section 4 presents results for biofuel potentials in terms of biomass and energy. In section 5 potentials for reducing GHGs and substitution fossil fuels for biofuels are discussed. The final section presents conclusions.
2 Current biofuel production in India
�
2.1 Bioethanol production
In India sugar molasses, a by-product of the sugar industry, is the main feedstock for bioethanol production. India has an important sugar cane industry based on 5 Mha of cultivated land with a production of 342 Mt in the year 2011 (FAO 2011). Most of the sugarcane production is located in Maharashtra, where more than one-thirds of sugarcane is being produced (DACNET 2007). Further. sugarcane is grown in Uttar Pradesh (30%), Tamil Nadu (10%) and Karnataka (7%) states. Only a small part of this production is used for bioethanol (1.2–1.8 Mt per year (OFID-IIASA 2009)) which can be produced from 330 distilleries (USDA 2014b). Support for fuel bioethanol production started in 2003, when India’s government mandated that nine States and four Union territories were required to sell E-5, a 5% blend of ethanol in gasoline through its ambitious Ethanol Blending Program (EBP) (USDA 2014b). However, in view of supply constraints from the sugar industry, the original proposal was first reduced to only 4 states and later fully suspended (OFID-IIASA 2009). The recovery of sugar

Chapter IV
�62
and molasses output during 2005– 06 generated renewed interest in the ethanol program. In October 2008 the government introduced an E-10 mandate (F.O. Lichts 2008).
Sugarcane (Saccharum officinarum) production in India is cyclical; the ethanol production varies with sugar and sugarcane production and does not warrant optimum supply levels needed to meet the demand at any given time. Reduced sugar molasses availability and consequent higher molasses prices affect the cost of production of ethanol and disrupts the supply of ethanol for the blending program at pre-negotiated fixed ethanol prices (USDA 2014). Bioethanol utilization is restricted to the transportation sector only (Pisces 2011). In India conventional bioethanol is solely produced from sugar molasses; production of bioethanol from miscanthus (second-generation cellulosic ethanol production) is in a nascent phase only (research and development) (USDA 2012).
Miscanthus (miscanthus x giganteus), is a perennial feedstock with a high cellulose yield potential and moderate input requirements, which makes the plant a leading candidate for second-generation cellulosic ethanol production (DOE 2006). Miscanthus originates from East Asia (Heaton E et al. 2004) where it is used for forage, clothing, shelter, etc. (Chou 2009). From its second season onwards miscanthus grows to a height of 2.5–3.5 m. It remains productive for over 15 years (up to 25 years) (McKervey et al. 2008) and has relative low fertilizer requirements compared to most agricultural crops. Miscanthus is adapted a wide range of soil conditions, including marginal low nutrient soils, but is most productive on good agricultural soils (ISU 2010). The Ministry of New and Renewable Energy, especially through the Department of Biotechnology, and the Ministry of Science and Technology have promoted research and development in second- generation biofuels (ADB 2011).
2.2 Biodiesel production
Commercial production of biodiesel, is almost non-existent in India. Due to high vegetable oil prices in the domestic market, biodiesel production is currently un-economic. The Government of India launched the National Biodiesel Mission (NBM), which identified jatropha as promising oilseed for biodiesel production.
Jathropha (Jatropha curcas), is a perennial large shrub native from Central America. It has a rotation length of 30 to 50 years and can bear fruits after 12 months and reaches its maximum productivity 5 years after planting (Atabani et al. 2013). There are various promising features of growing jatropha as biofuel feedstock. It grows relatively well under marginal conditions, i.e. it tolerates marginal soils with low nutrient content, can grow in a broad range of rainfall regimes, from 500 up to 3000 mm per annum, is reported fairly resistant to pests and diseases and proved to be useful for soil conservation (Achten et al. 2008). Jatropha is well adapted to moist semi-arid conditions, however it performs best in humid environments. Yet, jatropha’s productivity is reported to be highly variable and its yield performance is uncertain when specific varieties are transferred to different ecological circumstances and management (OFID-IIASA 2009). Jatropha’s seeds contain around 25 to 40% oil (Moncaleano-Escandon et al. 2013). Seed yield of jatropha varies widely, reported yields range between 439 to 2,217 litre oil per ha (Jongschaap et al. 2007).
India’s Planning Commission had set an ambitious target of planting between 11.2 to 13.4 Mha of land to jatropha by the end of 2012 (USDA 2014b). Today, even though the central government and several state governments provide fiscal incentives in support of planting jatropha and several public institutions are supporting the biofuel mission (USDA 2014b), only small quantities of jatropha and other non-edible oilseeds are crushed for oil, mainly used for lighting. By 2008 more than 700,000 ha of land was planted with jatropha. This mostly concerns new plantations that are as to date not yet fully productive (Biswas et al. 2013). The ambitious blending target of 20% for biodiesel had to be postponed from 2011/2012 to 2016/2017 (OFID-IIASA 2009).
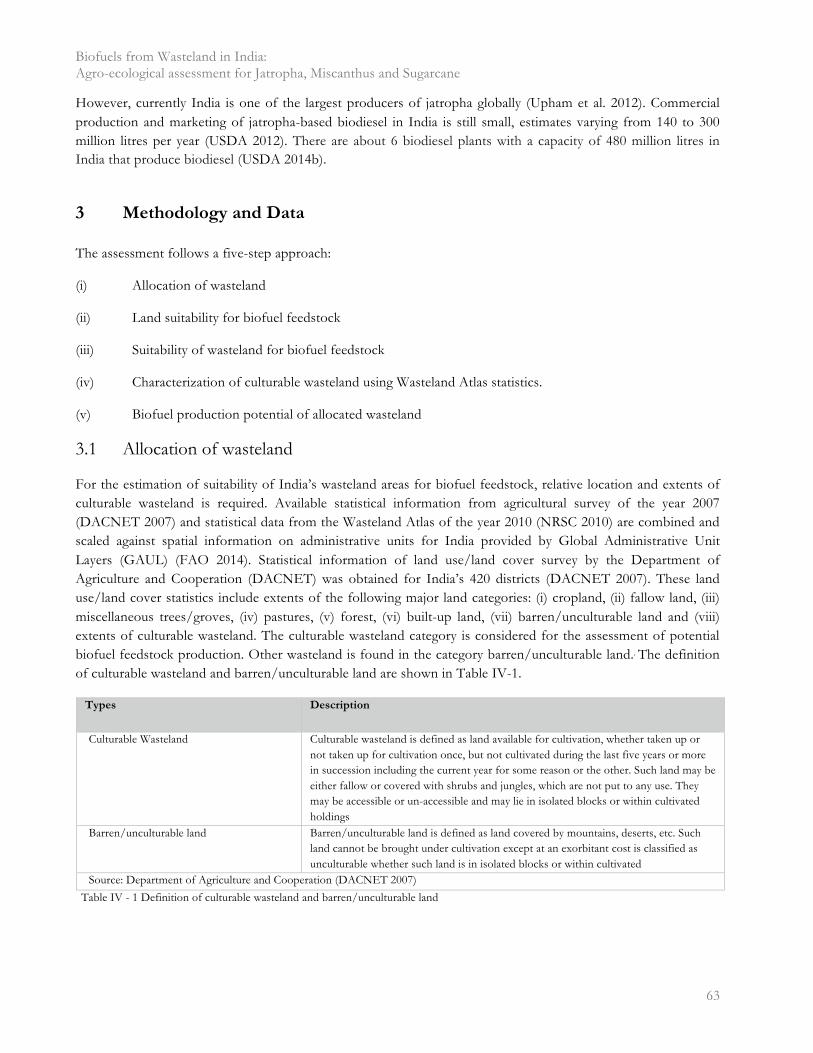
Biofuels from Wasteland in India: Agro-ecological assessment for Jatropha, Miscanthus and Sugarcane
� 63
However, currently India is one of the largest producers of jatropha globally (Upham et al. 2012). Commercial production and marketing of jatropha-based biodiesel in India is still small, estimates varying from 140 to 300 million litres per year (USDA 2012). There are about 6 biodiesel plants with a capacity of 480 million litres in India that produce biodiesel (USDA 2014b).
3 Methodology and Data
�
The assessment follows a five-step approach:
(i) Allocation of wasteland
(ii) Land suitability for biofuel feedstock
(iii) Suitability of wasteland for biofuel feedstock
(iv) Characterization of culturable wasteland using Wasteland Atlas statistics.
(v) Biofuel production potential of allocated wasteland
3.1 Allocation of wasteland
For the estimation of suitability of India’s wasteland areas for biofuel feedstock, relative location and extents of culturable wasteland is required. Available statistical information from agricultural survey of the year 2007 (DACNET 2007) and statistical data from the Wasteland Atlas of the year 2010 (NRSC 2010) are combined and scaled against spatial information on administrative units for India provided by Global Administrative Unit Layers (GAUL) (FAO 2014). Statistical information of land use/land cover survey by the Department of Agriculture and Cooperation (DACNET) was obtained for India’s 420 districts (DACNET 2007). These land use/land cover statistics include extents of the following major land categories: (i) cropland, (ii) fallow land, (iii) miscellaneous trees/groves, (iv) pastures, (v) forest, (vi) built-up land, (vii) barren/unculturable land and (viii) extents of culturable wasteland. The culturable wasteland category is considered for the assessment of potential biofuel feedstock production. Other wasteland is found in the category barren/unculturable land.. The definition of culturable wasteland and barren/unculturable land are shown in Table IV-1.
Types Description
Culturable Wasteland Culturable wasteland is defined as land available for cultivation, whether taken up or not taken up for cultivation once, but not cultivated during the last five years or more in succession including the current year for some reason or the other. Such land may be either fallow or covered with shrubs and jungles, which are not put to any use. They may be accessible or un-accessible and may lie in isolated blocks or within cultivated holdings
Barren/unculturable land Barren/unculturable land is defined as land covered by mountains, deserts, etc. Such land cannot be brought under cultivation except at an exorbitant cost is classified as unculturable whether such land is in isolated blocks or within cultivated
Source: Department of Agriculture and Cooperation (DACNET 2007)
Table IV - 1 Definition of culturable wasteland and barren/unculturable land
Chapter IV
�64
In total 13 Mha (4% of total geographical area) are surveyed as culturable wasteland and 17 Mha (5% of total geographical area) as barren/unculturable land (DACNET 2007). Table IV-2 summarizes major land categories including culturable wasteland and barren/unculturable land aggregated at state level.
According to estimates presented in the Wastelands Atlas of India - a satellite-based land survey by the Indian Ministry of Rural Development - the total area under wastelands is 47 Mha (14% of the total geographical area). The wasteland is consisting of 23 different wasteland categories (Table IV-3) (NRSC 2010). The difference between the 47 Mha of wasteland estimates in the Wasteland Atlas 2010 and the 30 Mha (culturable wasteland and barren/unculturable land) surveyed by DACNET can be explained through different wasteland definitions and the fact, that Wasteland Atlas categories like shifting cultivation areas, degraded forest, pasture or land under plantation crops, urban land and used for infrastructure and industrial purposes might already included in the DACNET categories cropland, fallow land, miscellaneous trees/groves, pasture, forest and built-up land.
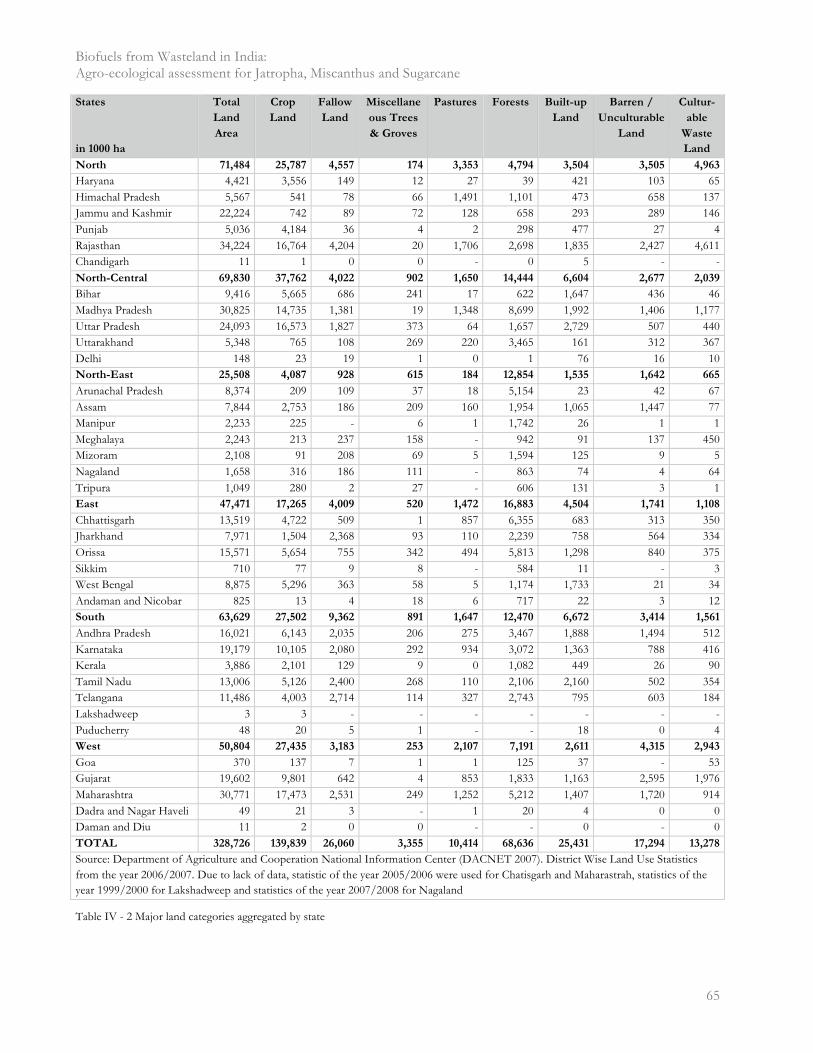
Biofuels from Wasteland in India: Agro-ecological assessment for Jatropha, Miscanthus and Sugarcane
� 65
States
in 1000 ha
Total
Land
Area
Crop
Land
Fallow
Land
Miscellane
ous Trees
& Groves
Pastures Forests Built-up
Land
Barren /
Unculturable
Land
Cultur-
able
Waste
Land
North 71,484 25,787 4,557 174 3,353 4,794 3,504 3,505 4,963
Haryana 4,421 3,556 149 12 27 39 421 103 65 Himachal Pradesh 5,567 541 78 66 1,491 1,101 473 658 137 Jammu and Kashmir 22,224 742 89 72 128 658 293 289 146 Punjab 5,036 4,184 36 4 2 298 477 27 4 Rajasthan 34,224 16,764 4,204 20 1,706 2,698 1,835 2,427 4,611 Chandigarh 11 1 0 0 - 0 5 - - North-Central 69,830 37,762 4,022 902 1,650 14,444 6,604 2,677 2,039
Bihar 9,416 5,665 686 241 17 622 1,647 436 46 Madhya Pradesh 30,825 14,735 1,381 19 1,348 8,699 1,992 1,406 1,177 Uttar Pradesh 24,093 16,573 1,827 373 64 1,657 2,729 507 440 Uttarakhand 5,348 765 108 269 220 3,465 161 312 367 Delhi 148 23 19 1 0 1 76 16 10 North-East 25,508 4,087 928 615 184 12,854 1,535 1,642 665
Arunachal Pradesh 8,374 209 109 37 18 5,154 23 42 67 Assam 7,844 2,753 186 209 160 1,954 1,065 1,447 77 Manipur 2,233 225 - 6 1 1,742 26 1 1 Meghalaya 2,243 213 237 158 - 942 91 137 450 Mizoram 2,108 91 208 69 5 1,594 125 9 5 Nagaland 1,658 316 186 111 - 863 74 4 64 Tripura 1,049 280 2 27 - 606 131 3 1 East 47,471 17,265 4,009 520 1,472 16,883 4,504 1,741 1,108
Chhattisgarh 13,519 4,722 509 1 857 6,355 683 313 350 Jharkhand 7,971 1,504 2,368 93 110 2,239 758 564 334 Orissa 15,571 5,654 755 342 494 5,813 1,298 840 375 Sikkim 710 77 9 8 - 584 11 - 3 West Bengal 8,875 5,296 363 58 5 1,174 1,733 21 34 Andaman and Nicobar 825 13 4 18 6 717 22 3 12 South 63,629 27,502 9,362 891 1,647 12,470 6,672 3,414 1,561
Andhra Pradesh 16,021 6,143 2,035 206 275 3,467 1,888 1,494 512 Karnataka 19,179 10,105 2,080 292 934 3,072 1,363 788 416 Kerala 3,886 2,101 129 9 0 1,082 449 26 90 Tamil Nadu 13,006 5,126 2,400 268 110 2,106 2,160 502 354 Telangana 11,486 4,003 2,714 114 327 2,743 795 603 184 Lakshadweep 3 3 - - - - - - - Puducherry 48 20 5 1 - - 18 0 4 West 50,804 27,435 3,183 253 2,107 7,191 2,611 4,315 2,943
Goa 370 137 7 1 1 125 37 - 53 Gujarat 19,602 9,801 642 4 853 1,833 1,163 2,595 1,976 Maharashtra 30,771 17,473 2,531 249 1,252 5,212 1,407 1,720 914 Dadra and Nagar Haveli 49 21 3 - 1 20 4 0 0 Daman and Diu 11 2 0 0 - - 0 - 0 TOTAL 328,726 139,839 26,060 3,355 10,414 68,636 25,431 17,294 13,278
Source: Department of Agriculture and Cooperation National Information Center (DACNET 2007). District Wise Land Use Statistics from the year 2006/2007. Due to lack of data, statistic of the year 2005/2006 were used for Chatisgarh and Maharastrah, statistics of the year 1999/2000 for Lakshadweep and statistics of the year 2007/2008 for Nagaland
Table IV - 2 Major land categories aggregated by state
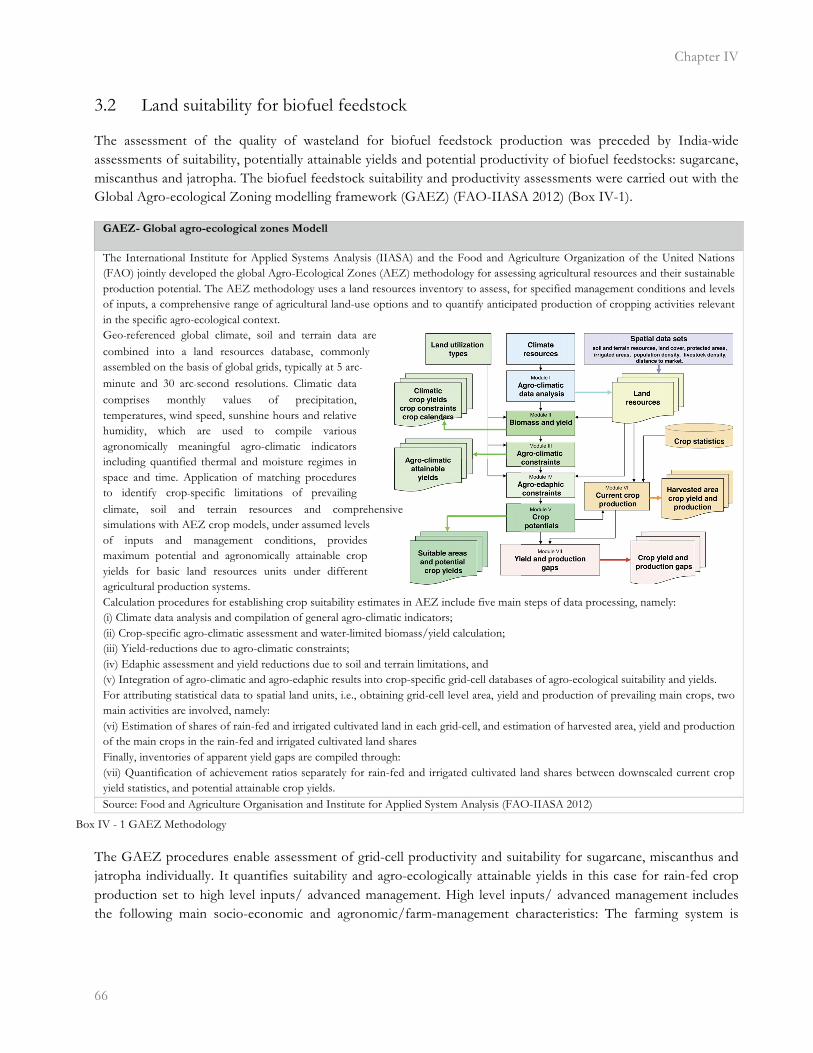
Chapter IV
�66
3.2 Land suitability for biofuel feedstock
The assessment of the quality of wasteland for biofuel feedstock production was preceded by India-wide assessments of suitability, potentially attainable yields and potential productivity of biofuel feedstocks: sugarcane, miscanthus and jatropha. The biofuel feedstock suitability and productivity assessments were carried out with the Global Agro-ecological Zoning modelling framework (GAEZ) (FAO-IIASA 2012) (Box IV-1).
GAEZ- Global agro-ecological zones Modell
The International Institute for Applied Systems Analysis (IIASA) and the Food and Agriculture Organization of the United Nations (FAO) jointly developed the global Agro-Ecological Zones (AEZ) methodology for assessing agricultural resources and their sustainable production potential. The AEZ methodology uses a land resources inventory to assess, for specified management conditions and levels of inputs, a comprehensive range of agricultural land-use options and to quantify anticipated production of cropping activities relevant in the specific agro-ecological context. Geo‐referenced global climate, soil and terrain data are combined into a land resources database, commonly assembled on the basis of global grids, typically at 5 arc‐minute and 30 arc‐second resolutions. Climatic data comprises monthly values of precipitation, temperatures, wind speed, sunshine hours and relative humidity, which are used to compile various agronomically meaningful agro-climatic indicators including quantified thermal and moisture regimes in space and time. Application of matching procedures to identify crop‐specific limitations of prevailing climate, soil and terrain resources and comprehensive simulations with AEZ crop models, under assumed levels of inputs and management conditions, provides maximum potential and agronomically attainable crop yields for basic land resources units under different agricultural production systems. Calculation procedures for establishing crop suitability estimates in AEZ include five main steps of data processing, namely: (i) Climate data analysis and compilation of general agro-climatic indicators; (ii) Crop-specific agro-climatic assessment and water-limited biomass/yield calculation; (iii) Yield-reductions due to agro-climatic constraints; (iv) Edaphic assessment and yield reductions due to soil and terrain limitations, and (v) Integration of agro-climatic and agro-edaphic results into crop-specific grid-cell databases of agro-ecological suitability and yields. For attributing statistical data to spatial land units, i.e., obtaining grid-cell level area, yield and production of prevailing main crops, two main activities are involved, namely: (vi) Estimation of shares of rain-fed and irrigated cultivated land in each grid-cell, and estimation of harvested area, yield and production of the main crops in the rain-fed and irrigated cultivated land shares Finally, inventories of apparent yield gaps are compiled through: (vii) Quantification of achievement ratios separately for rain-fed and irrigated cultivated land shares between downscaled current crop yield statistics, and potential attainable crop yields. Source: Food and Agriculture Organisation and Institute for Applied System Analysis (FAO-IIASA 2012)
The GAEZ procedures enable assessment of grid-cell productivity and suitability for sugarcane, miscanthus and jatropha individually. It quantifies suitability and agro-ecologically attainable yields in this case for rain-fed crop production set to high level inputs/ advanced management. High level inputs/ advanced management includes the following main socio-economic and agronomic/farm-management characteristics: The farming system is
Box IV - 1 GAEZ Methodology
ve
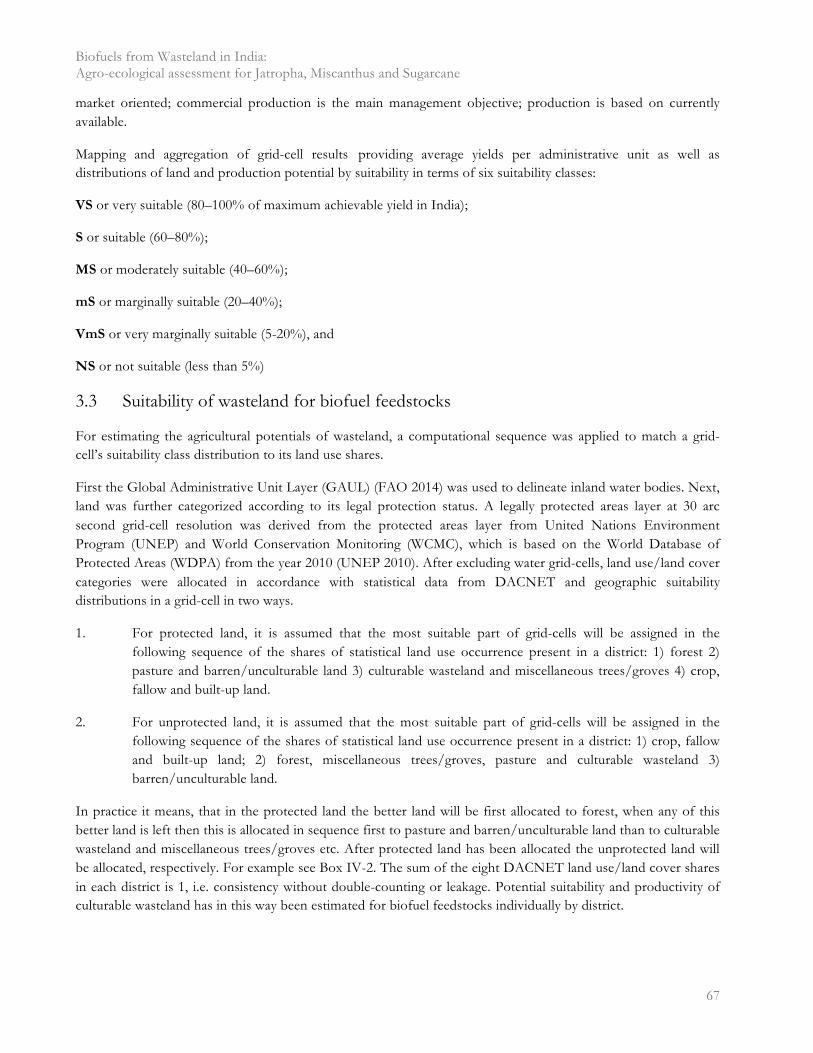
Biofuels from Wasteland in India: Agro-ecological assessment for Jatropha, Miscanthus and Sugarcane
� 67
market oriented; commercial production is the main management objective; production is based on currently available.
Mapping and aggregation of grid-cell results providing average yields per administrative unit as well as distributions of land and production potential by suitability in terms of six suitability classes:
VS or very suitable (80–100% of maximum achievable yield in India);
S or suitable (60–80%);
MS or moderately suitable (40–60%);
mS or marginally suitable (20–40%);
VmS or very marginally suitable (5-20%), and
NS or not suitable (less than 5%)
3.3 Suitability of wasteland for biofuel feedstocks
For estimating the agricultural potentials of wasteland, a computational sequence was applied to match a grid-cell’s suitability class distribution to its land use shares.
First the Global Administrative Unit Layer (GAUL) (FAO 2014) was used to delineate inland water bodies. Next, land was further categorized according to its legal protection status. A legally protected areas layer at 30 arc second grid-cell resolution was derived from the protected areas layer from United Nations Environment Program (UNEP) and World Conservation Monitoring (WCMC), which is based on the World Database of Protected Areas (WDPA) from the year 2010 (UNEP 2010). After excluding water grid-cells, land use/land cover categories were allocated in accordance with statistical data from DACNET and geographic suitability distributions in a grid-cell in two ways.
1. For protected land, it is assumed that the most suitable part of grid-cells will be assigned in the following sequence of the shares of statistical land use occurrence present in a district: 1) forest 2) pasture and barren/unculturable land 3) culturable wasteland and miscellaneous trees/groves 4) crop, fallow and built-up land.
2. For unprotected land, it is assumed that the most suitable part of grid-cells will be assigned in the following sequence of the shares of statistical land use occurrence present in a district: 1) crop, fallow and built-up land; 2) forest, miscellaneous trees/groves, pasture and culturable wasteland 3) barren/unculturable land.
In practice it means, that in the protected land the better land will be first allocated to forest, when any of this better land is left then this is allocated in sequence first to pasture and barren/unculturable land than to culturable wasteland and miscellaneous trees/groves etc. After protected land has been allocated the unprotected land will be allocated, respectively. For example see Box IV-2. The sum of the eight DACNET land use/land cover shares in each district is 1, i.e. consistency without double-counting or leakage. Potential suitability and productivity of culturable wasteland has in this way been estimated for biofuel feedstocks individually by district.
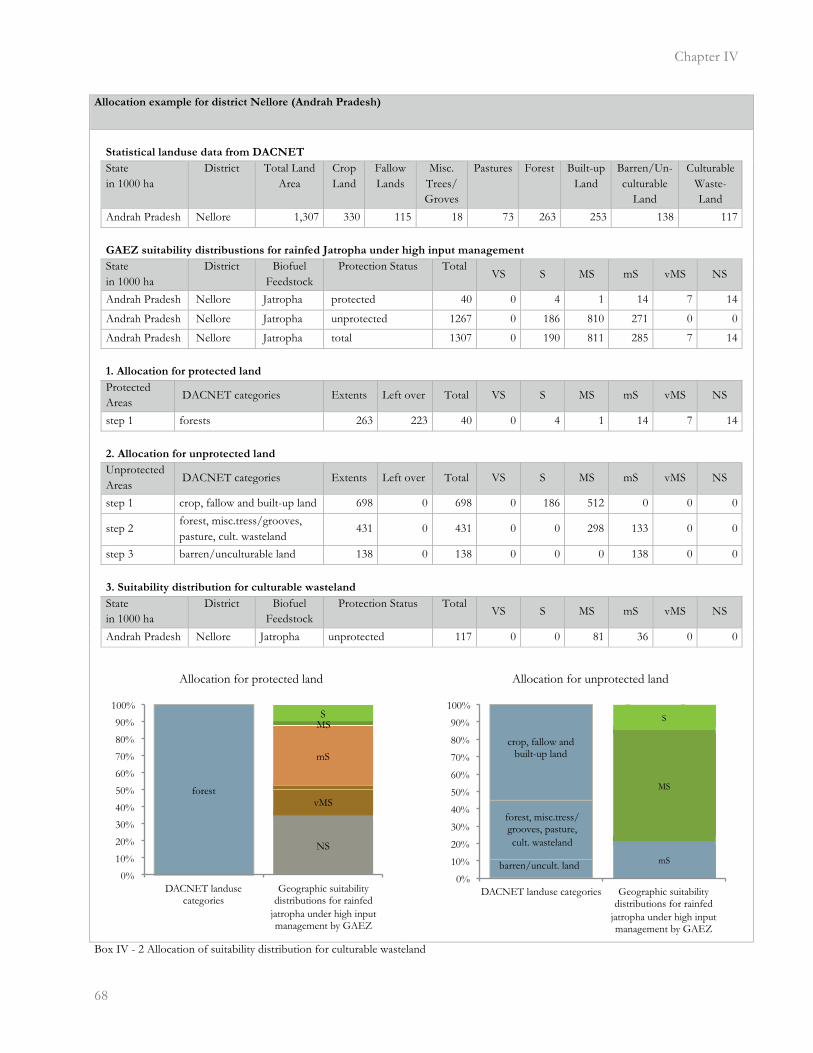
Chapter IV
�68
Allocation example for district Nellore (Andrah Pradesh)
Statistical landuse data from DACNET
State in 1000 ha
District Total Land Area
Crop Land
Fallow Lands
Misc. Trees/ Groves
Pastures Forest Built-up Land
Barren/Un- culturable
Land
Culturable Waste- Land
Andrah Pradesh Nellore 1,307 330 115 18 73 263 253 138 117
GAEZ suitability distribustions for rainfed Jatropha under high input management
State in 1000 ha
District Biofuel Feedstock
Protection Status Total VS S MS mS vMS NS
Andrah Pradesh Nellore Jatropha protected 40 0 4 1 14 7 14
Andrah Pradesh Nellore Jatropha unprotected 1267 0 186 810 271 0 0
Andrah Pradesh Nellore Jatropha total 1307 0 190 811 285 7 14
1. Allocation for protected land
Protected Areas
DACNET categories Extents Left over Total VS S MS mS vMS NS
step 1 forests 263 223 40 0 4 1 14 7 14
2. Allocation for unprotected land
Unprotected Areas
DACNET categories Extents Left over Total VS S MS mS vMS NS
step 1 crop, fallow and built-up land 698 0 698 0 186 512 0 0 0
step 2
forest, misc.tress/grooves, pasture, cult. wasteland
431 0 431 0 0 298 133 0 0
step 3 barren/unculturable land 138 0 138 0 0 0 138 0 0
3. Suitability distribution for culturable wasteland
State in 1000 ha
District Biofuel Feedstock
Protection Status Total VS S MS mS vMS NS
Andrah Pradesh Nellore Jatropha unprotected 117 0 0 81 36 0 0 Box IV - 2 Allocation of suitability distribution for culturable wasteland
mS
MS
S
0%
10%
20%
30%
40%
50%
60%
70%
80%
90%
100%
DACNET landuse categories Geographic suitability distributions for rainfed
jatropha under high input management by GAEZ
Allocation for unprotected land
crop, fallow and built-up land
forest, misc.tress/grooves, pasture, cult. wasteland
barren/uncult. land
NS
vMS
mS
MS
forest
S
0%
10%
20%
30%
40%
50%
60%
70%
80%
90%
100%
DACNET landuse categories
Geographic suitability distributions for rainfed
jatropha under high input management by GAEZ
Allocation for protected land
Biofuels from Wasteland in India: Agro-ecological assessment for Jatropha, Miscanthus and Sugarcane
� 69
3.4 Characterization of culturable wasteland and barren land using Wasteland Atlas statistics
The information in the Wasteland Atlas (NRSC 2010) provides additional suitability constraints for biofuel feedstock productivity. The allocation procedure applies weights for each of the 23 Wasteland Atlas classes (NRSC 2010) for individual biofuel feedstocks. The weights have been based on information contained in Wasteland Atlas class descriptions (NRSC 2010) and data on feedstock sensitivities to different soil and terrain conditions. Table IV-3 gives an overview of 23 wasteland classes and suitability constraints for sugarcane, miscanthus and jatropha.
Wasteland Atlas Classes Ranking
Parameter
Inherent Suitability Constraints
Category Description Extents
1000 ha
Sugarcane
%
Miscanthus
%
Jatropha
%
WAC 1 Gullied and /or ravinous land (medium) 700 0 0 0 WAC 2 Gullied and /or ravinous land (deep) 171 0 0 0 WAC 3 Land with dense scrub 9,339 1 75 90 90 WAC 4 Land with open scrub 9,163 2 50 75 75 WAC 5 Waterlogged and marshy land (permanent) 253 0 0 0 WAC 6 Waterlogged and marshy land (seasonal) 299 3 25 0 0 WAC 7 Land affected by salinity/alkalinity (moderate) 543 3 0 0 25 WAC 8 Land affected by salinity/alkalinity (strong) 174 0 0 0 WAC 9 Shifting cultivation area (current Jhum) 563 5 75 90 90 WAC 10 Shifting cultivation area (abandoned Jhum) 461 6 50 75 75 WAC 11 Under utilised/degraded notified forest land 8,577 7 50 75 75 WAC 12 Under utilised/degraded notified forest land (agriculture) 1,639 6 75 90 90 WAC 13 Degraded pastures/grazing land 720 7 50 75 75 WAC 14 Degraded land under plantation crop 32 7 50 75 75 WAC 15 Sands-riverine 243 4 0 0 0 WAC 16 Sands-coastal sand 72 0 0 0 WAC 17 Sands-desertic 528 0 0 0 WAC 18 Sands-(semi stab.-stab>40m) 1,119 0 0 0 WAC 19 Sands-(semi stab.-stab moderately. high 15-40m) 1,563 0 0 0 WAC 20 Mining wastelands 51 0 0 0 WAC 21 Industrial wastelands 6 8 0 0 0 WAC 22 Barren rocky/stone waste/sheet rock area 6,937 0 0 0 WAC 23 Snow covered and/or glacial area 4,069 0 0 0 Total Wasteland 47,221 a ranking parameters for wasteland Atlas classes according to most likely occurrence in the culturable wasteland DACNET category. Wasteland classes without ranking parameters are most likely occuring in the barren/unculturable land DACNET category WAC: Wasteland Atlas Category Source: Department of Land Resources Ministry of Rural Development (DACNET 2007), Govt. of India, Wasteland Atlas of India 2010 (NRSC 2010) Table IV - 3 Ranking and additional suitability constraints of Wasteland Atlas classes for individual biofuel feedstock

Chapter IV
�70
Allocation example of adjusted production potential for jatropha from culturable wasteland for the district Bastar
(Chhattisgarh)
Wasteland Atlas Categories (Wasteland Atlas)
WAC 1 2 3 4 5 6 7 8 9 10 11 12 13 14 15 16 17 18 19 20 21 22 23
Suitability Constraint Jatropha
0.00 0.00 0.90 0.75 0.00 0.00 0.25 0.00 0.90 0.75 0.75 0.90 0.75 0.75 0.00 0.00 0.00 0.00 0.00 0.00 0.00 0.00 0.00
Wasteland in 1000 ha
0.00 0.00 8.54 3.23 0.00 0.00 0.00 0.00 0.00 0.00 14.7 24.9 0.00 0.00 0.05 0.00 0.00 0.00 0.00 0.00 0.00 1.64 0.00
Production potential of culturable wasteland by GAEZ
State District Biofuel
crop barren/unculturable land
culturable wasteland
Production Potential of culturable wasteland in 1000 ton of oil
1000 ha 1000 ha Total VS S MS mS vMS
Chhattisgarh Bastar Jatropha 39.60 58.89 154.94 5.15 113.02 33.00 3.56 0.22
Allocation of Wasteland Atlas categories to culturable wasteland
Step Description Culturable Wasteland
Left over 1000 ha
Extents 1000 ha
Suitability Constraints
step 1 WAC 3 50.35 8.54 0.90
step 2 WAC 4 47.12 3.23
0.75
step 3 WAC 6 ,WAC 7 47.12 - 0.25
step 4 WAC 15 47.07 0.05 0.00
step 5 WAC 9 47.07 - 0.90
step 6 WAC 10, WAC 12 22.14 24.93 0.90
step 7 WAC 11, WAC 13 , WAC 14 7.44 14.70 0.75
step 8 WAC 21 7.44 - 0.00
step 9 Culturable wasteland left and barren/uncult. land < WAC Rest 7.44
0.00
step 10
Culturable wasteland left and barren/ uncult. land (39.60) > WAC Rest (1.64)
- 7.44 1.00
step 11 Suitability constraints for district 58.89 0.87
Adjusted Production potential of culturable wasteland
State District Biofuel
crop Suitability
Constraints culturable wasteland
Production Potential of culturable wasteland in 1000 ton of oil
1000 ha Total VS S MS mS vMS
Chhattisgarh Bastar Jatropha 0.87 58.89 134.21 4.48 98.33 28.71 3.10 0.19
Box IV – 3 Allocation of adjusted production potential of culturable wasteland using Wasteland Atlas statistics
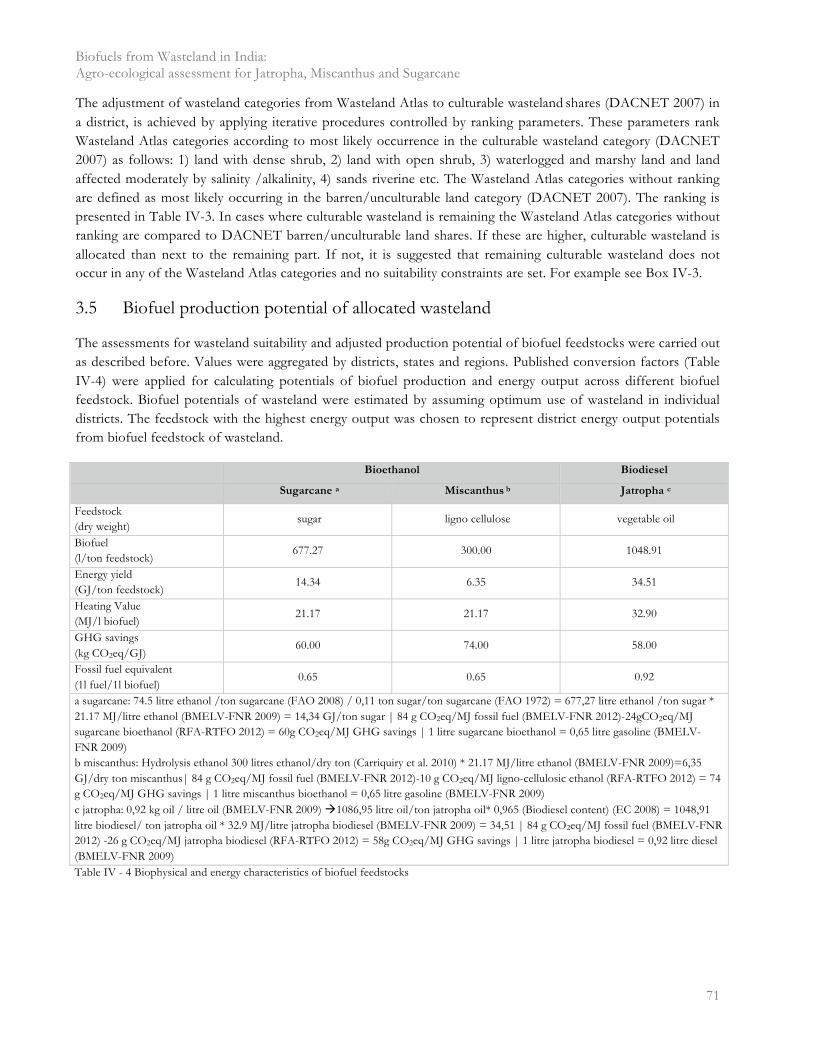
Biofuels from Wasteland in India: Agro-ecological assessment for Jatropha, Miscanthus and Sugarcane
� 71
The adjustment of wasteland categories from Wasteland Atlas to culturable wasteland shares (DACNET 2007) in a district, is achieved by applying iterative procedures controlled by ranking parameters. These parameters rank Wasteland Atlas categories according to most likely occurrence in the culturable wasteland category (DACNET 2007) as follows: 1) land with dense shrub, 2) land with open shrub, 3) waterlogged and marshy land and land affected moderately by salinity /alkalinity, 4) sands riverine etc. The Wasteland Atlas categories without ranking are defined as most likely occurring in the barren/unculturable land category (DACNET 2007). The ranking is presented in Table IV-3. In cases where culturable wasteland is remaining the Wasteland Atlas categories without ranking are compared to DACNET barren/unculturable land shares. If these are higher, culturable wasteland is allocated than next to the remaining part. If not, it is suggested that remaining culturable wasteland does not occur in any of the Wasteland Atlas categories and no suitability constraints are set. For example see Box IV-3.
3.5 Biofuel production potential of allocated wasteland
The assessments for wasteland suitability and adjusted production potential of biofuel feedstocks were carried out as described before. Values were aggregated by districts, states and regions. Published conversion factors (Table IV-4) were applied for calculating potentials of biofuel production and energy output across different biofuel feedstock. Biofuel potentials of wasteland were estimated by assuming optimum use of wasteland in individual districts. The feedstock with the highest energy output was chosen to represent district energy output potentials from biofuel feedstock of wasteland.
Bioethanol Biodiesel
Sugarcane a Miscanthus b Jatropha c
Feedstock (dry weight)
sugar ligno cellulose vegetable oil
Biofuel (l/ton feedstock)
677.27 300.00 1048.91
Energy yield (GJ/ton feedstock)
14.34 6.35 34.51
Heating Value (MJ/l biofuel)
21.17 21.17 32.90
GHG savings (kg CO2eq/GJ)
60.00 74.00 58.00
Fossil fuel equivalent (1l fuel/1l biofuel)
0.65 0.65 0.92
a sugarcane: 74.5 litre ethanol /ton sugarcane (FAO 2008) / 0,11 ton sugar/ton sugarcane (FAO 1972) = 677,27 litre ethanol /ton sugar * 21.17 MJ/litre ethanol (BMELV-FNR 2009) = 14,34 GJ/ton sugar | 84 g CO2eq/MJ fossil fuel (BMELV-FNR 2012)-24gCO2eq/MJ sugarcane bioethanol (RFA-RTFO 2012) = 60g CO2eq/MJ GHG savings | 1 litre sugarcane bioethanol = 0,65 litre gasoline (BMELV-FNR 2009) b miscanthus: Hydrolysis ethanol 300 litres ethanol/dry ton (Carriquiry et al. 2010) * 21.17 MJ/litre ethanol (BMELV-FNR 2009)=6,35 GJ/dry ton miscanthus| 84 g CO2eq/MJ fossil fuel (BMELV-FNR 2012)-10 g CO2eq/MJ ligno-cellulosic ethanol (RFA-RTFO 2012) = 74 g CO2eq/MJ GHG savings | 1 litre miscanthus bioethanol = 0,65 litre gasoline (BMELV-FNR 2009) c jatropha: 0,92 kg oil / litre oil (BMELV-FNR 2009) �1086,95 litre oil/ton jatropha oil* 0,965 (Biodiesel content) (EC 2008) = 1048,91 litre biodiesel/ ton jatropha oil * 32.9 MJ/litre jatropha biodiesel (BMELV-FNR 2009) = 34,51 | 84 g CO2eq/MJ fossil fuel (BMELV-FNR 2012) -26 g CO2eq/MJ jatropha biodiesel (RFA-RTFO 2012) = 58g CO2eq/MJ GHG savings | 1 litre jatropha biodiesel = 0,92 litre diesel (BMELV-FNR 2009) Table IV - 4 Biophysical and energy characteristics of biofuel feedstocks
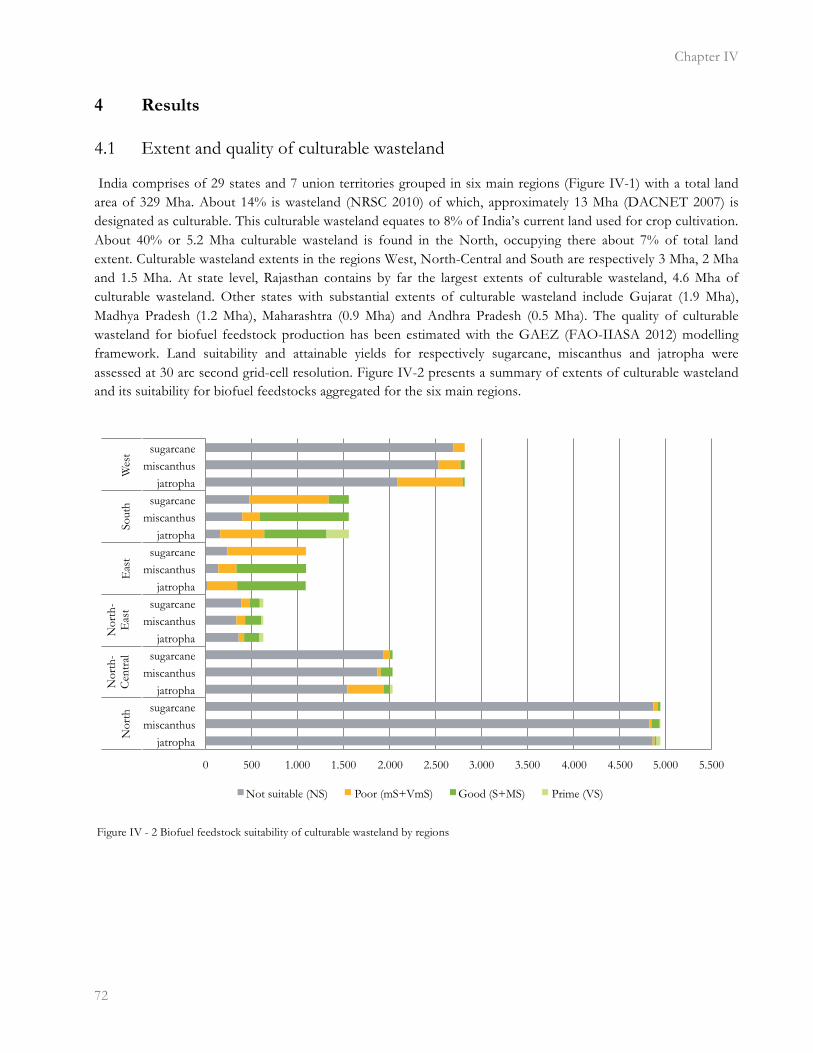
Chapter IV
�72
4 Results
�
4.1 Extent and quality of culturable wasteland
India comprises of 29 states and 7 union territories grouped in six main regions (Figure IV-1) with a total land area of 329 Mha. About 14% is wasteland (NRSC 2010) of which, approximately 13 Mha (DACNET 2007) is designated as culturable. This culturable wasteland equates to 8% of India’s current land used for crop cultivation. About 40% or 5.2 Mha culturable wasteland is found in the North, occupying there about 7% of total land extent. Culturable wasteland extents in the regions West, North-Central and South are respectively 3 Mha, 2 Mha and 1.5 Mha. At state level, Rajasthan contains by far the largest extents of culturable wasteland, 4.6 Mha of culturable wasteland. Other states with substantial extents of culturable wasteland include Gujarat (1.9 Mha), Madhya Pradesh (1.2 Mha), Maharashtra (0.9 Mha) and Andhra Pradesh (0.5 Mha). The quality of culturable wasteland for biofuel feedstock production has been estimated with the GAEZ (FAO-IIASA 2012) modelling framework. Land suitability and attainable yields for respectively sugarcane, miscanthus and jatropha were assessed at 30 arc second grid-cell resolution. Figure IV-2 presents a summary of extents of culturable wasteland and its suitability for biofuel feedstocks aggregated for the six main regions.
0 500 1.000 1.500 2.000 2.500 3.000 3.500 4.000 4.500 5.000 5.500
jatropha miscanthus
sugarcane jatropha
miscanthus sugarcane
jatropha miscanthus
sugarcane jatropha
miscanthus sugarcane
jatropha miscanthus
sugarcane jatropha
miscanthus sugarcane
Nor
th
Nor
th-
Cen
tral
N
orth
-E
ast
Eas
t So
uth
Wes
t
Not suitable (NS) Poor (mS+VmS) Good (S+MS) Prime (VS)
Figure IV - 2 Biofuel feedstock suitability of culturable wasteland by regions
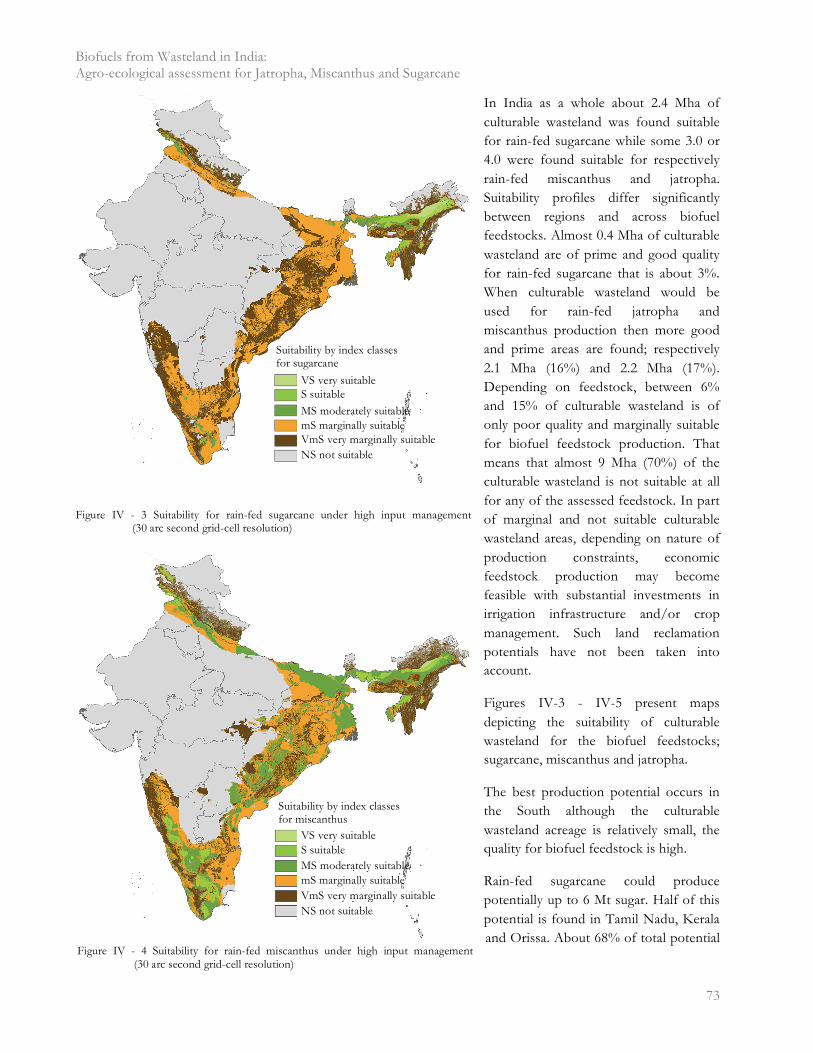
Biofuels from Wasteland in India: Agro-ecological assessment for Jatropha, Miscanthus and Sugarcane
� 73
In India as a whole about 2.4 Mha of culturable wasteland was found suitable for rain-fed sugarcane while some 3.0 or 4.0 were found suitable for respectively rain-fed miscanthus and jatropha. Suitability profiles differ significantly between regions and across biofuel feedstocks. Almost 0.4 Mha of culturable wasteland are of prime and good quality for rain-fed sugarcane that is about 3%. When culturable wasteland would be used for rain-fed jatropha and miscanthus production then more good and prime areas are found; respectively 2.1 Mha (16%) and 2.2 Mha (17%). Depending on feedstock, between 6% and 15% of culturable wasteland is of only poor quality and marginally suitable for biofuel feedstock production. That means that almost 9 Mha (70%) of the culturable wasteland is not suitable at all for any of the assessed feedstock. In part of marginal and not suitable culturable wasteland areas, depending on nature of production constraints, economic feedstock production may become feasible with substantial investments in irrigation infrastructure and/or crop management. Such land reclamation potentials have not been taken into account.
Figures IV-3 - IV-5 present maps depicting the suitability of culturable wasteland for the biofuel feedstocks; sugarcane, miscanthus and jatropha.
The best production potential occurs in the South although the culturable wasteland acreage is relatively small, the quality for biofuel feedstock is high.
Rain-fed sugarcane could produce potentially up to 6 Mt sugar. Half of this potential is found in Tamil Nadu, Kerala and Orissa. About 68% of total potential
Figure IV - 4 Suitability for rain-fed miscanthus under high input management(30 arc second grid-cell resolution)
Figure IV - 3 Suitability for rain-fed sugarcane under high input management (30 arc second grid-cell resolution)
Figure IV - 5 Suitability for rain-fed jatropha under high input management (30 arc second grid-cell resolution)
Suitability by index classes for sugarcane
VS very suitable S suitable
NS not suitable
Suitability by index classes for miscanthus
MS moderately suitable mS marginally suitable VmS very marginally suitable
VS very suitable S suitable
NS not suitable
MS moderately suitable mS marginally suitable VmS very marginally suitable
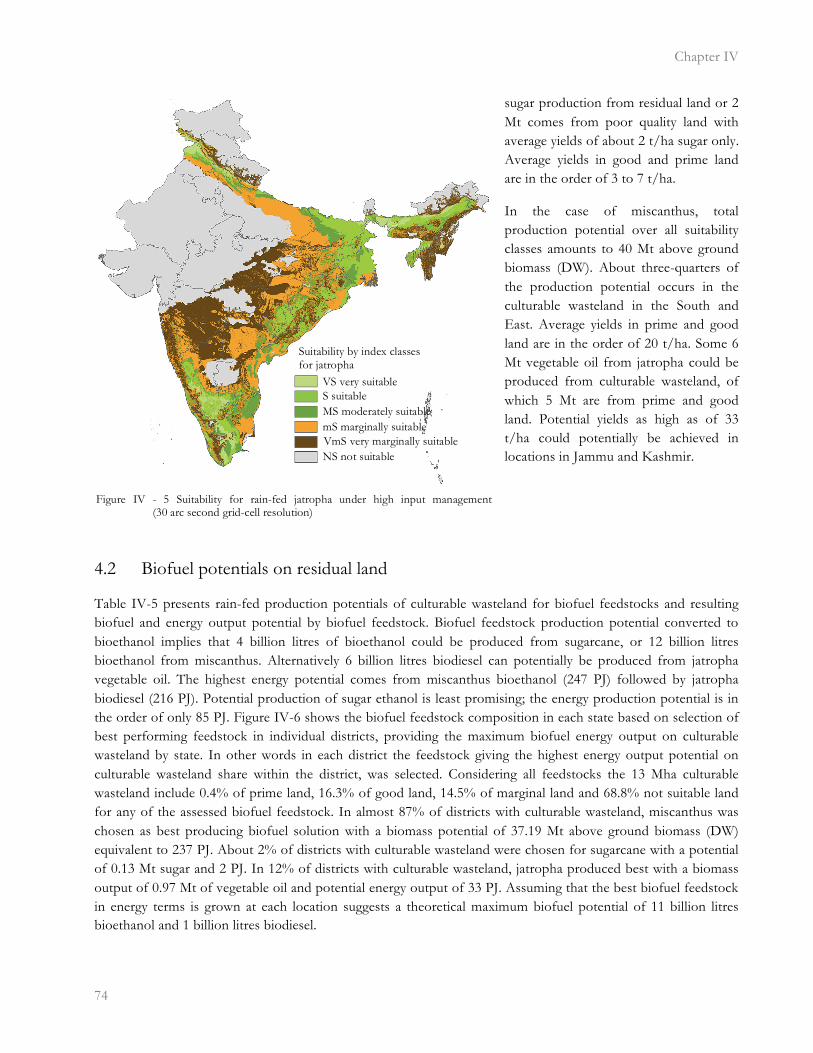
Chapter IV
�74
sugar production from residual land or 2 Mt comes from poor quality land with average yields of about 2 t/ha sugar only. Average yields in good and prime land are in the order of 3 to 7 t/ha.
In the case of miscanthus, total production potential over all suitability classes amounts to 40 Mt above ground biomass (DW). About three-quarters of the production potential occurs in the culturable wasteland in the South and East. Average yields in prime and good land are in the order of 20 t/ha. Some 6 Mt vegetable oil from jatropha could be produced from culturable wasteland, of which 5 Mt are from prime and good land. Potential yields as high as of 33 t/ha could potentially be achieved in locations in Jammu and Kashmir.
4.2 Biofuel potentials on residual land
Table IV-5 presents rain-fed production potentials of culturable wasteland for biofuel feedstocks and resulting biofuel and energy output potential by biofuel feedstock. Biofuel feedstock production potential converted to bioethanol implies that 4 billion litres of bioethanol could be produced from sugarcane, or 12 billion litres bioethanol from miscanthus. Alternatively 6 billion litres biodiesel can potentially be produced from jatropha vegetable oil. The highest energy potential comes from miscanthus bioethanol (247 PJ) followed by jatropha biodiesel (216 PJ). Potential production of sugar ethanol is least promising; the energy production potential is in the order of only 85 PJ. Figure IV-6 shows the biofuel feedstock composition in each state based on selection of best performing feedstock in individual districts, providing the maximum biofuel energy output on culturable wasteland by state. In other words in each district the feedstock giving the highest energy output potential on culturable wasteland share within the district, was selected. Considering all feedstocks the 13 Mha culturable wasteland include 0.4% of prime land, 16.3% of good land, 14.5% of marginal land and 68.8% not suitable land for any of the assessed biofuel feedstock. In almost 87% of districts with culturable wasteland, miscanthus was chosen as best producing biofuel solution with a biomass potential of 37.19 Mt above ground biomass (DW) equivalent to 237 PJ. About 2% of districts with culturable wasteland were chosen for sugarcane with a potential of 0.13 Mt sugar and 2 PJ. In 12% of districts with culturable wasteland, jatropha produced best with a biomass output of 0.97 Mt of vegetable oil and potential energy output of 33 PJ. Assuming that the best biofuel feedstock in energy terms is grown at each location suggests a theoretical maximum biofuel potential of 11 billion litres bioethanol and 1 billion litres biodiesel.
Suitability by index classes for jatropha
VS very suitable S suitable
NS not suitable
MS moderately suitable mS marginally suitable VmS very marginally suitable
Figure IV - 5 Suitability for rain-fed jatropha under high input management (30 arc second grid-cell resolution)

Biofuels from Wasteland in India: Agro-ecological assessment for Jatropha, Miscanthus and Sugarcane
� 75
States
Sugarcane Miscanthus Jatropha
Product.
Potentiala
Biofuel
potentialb
Energy
yieldc
Product.
Potentiala
Biofuel
potentialb
Energy
yieldc
Product.
Potentiala
Biofuel
potentialb
Energy
yieldc
1000 ton sugar
Mio litre PJ 1000 ton AGB DW
Mio litre PJ 1000 ton oil
Mio litre PJ
North 198 134 3 1,664 499 11 176 185 6
Haryana - - - - - - - - - Himachal Pradesh 5 3 0 38 12 0 7 7 0 Jammu and Kashmir 83 56 1 564 169 4 82 86 3 Punjab 103 70 1 1,026 308 7 82 86 3 Rajasthan 7 5 0 35 10 0 5 6 0 Chandigarh - - - - - - - - - North-Central 270 183 4 2,160 648 14 501 526 17
Bihar 66 45 1 514 154 3 78 82 3 Madhya Pradesh - - - - - - - - - Uttar Pradesh - - - 432 130 3 182 191 6 Uttarakhand 49 33 1 458 137 3 126 132 4 Delhi 155 105 2 757 227 5 116 122 4 North-East 796 539 11 2,960 888 19 407 427 14
Arunachal Pradesh 112 76 2 356 107 2 47 49 2 Assam 314 213 5 678 203 4 94 98 3 Manipur 0 0 0 0 0 0 0 0 0 Meghalaya 365 247 5 1,908 572 12 264 277 9 Mizoram - - - - - - - - - Nagaland 2 1 0 9 3 0 1 1 0 Tripura 3 2 0 9 3 0 1 1 0 East 1,765 1,195 25 12,857 3,857 82 1,980 2,077 68
Chhattisgarh 15 10 0 85 25 1 11 11 0 Jharkhand 399 270 6 3,375 1,012 21 542 568 19 Orissa 416 281 6 3,559 1,068 23 535 561 18 Sikkim 852 577 12 5,373 1,612 34 818 858 28 West Bengal - - - - - - - - - Andaman and Nicobar 84 57 1 465 140 3 75 78 3 South 2,706 1,832 39 16,929 5,079 107 2,656 2,786 92
Andhra Pradesh 552 373 8 4,650 1,395 30 581 609 20 Karnataka 886 600 13 5,346 1,604 34 894 938 31 Kerala 246 167 4 1,239 372 8 194 204 7 Tamil Nadu - - - - - - - - - Telangana 2 1 0 50 15 0 5 5 0 Lakshadweep 984 666 14 5,255 1,576 33 797 836 27 Puducherry 35 24 1 388 116 2 186 195 6 West 167 113 2 2,289 687 15 552 579 19
Goa - - - - - - - - - Gujarat - - - - - - - - - Maharashtra - - - 31 9 0 3 3 0 Dadra and Nagar Haveli - - - - - - - - - Daman and Diu 167 113 2 2,258 677 14 548 575 19 Total 5,903 3,996 85 38,860 11,658 247 6,273 6,580 216
a The farming system is market oriented; commercial production is the main management objective; production is based on currently available best-yielding cultivars, is fully mechanized with low labor intensity, and provides adequate applications of nutrients and chemical pest, disease and weed control b sugarcane (677 litre bioethanol / ton sugar), miscanthus (300 litre bioethanol / ton miscanthus ABG (DW)), jatropha (1049 litre biodiesel / ton jatropha oil) c sugarcane (14.34 GJ / ton sugar), miscanthus (6.35 GJ / ton miscanthus ABG (DW)), jatropha (34.51 GJ / ton jatropha oil) AGB Above Ground Biomass DW dry weights
Table IV - 5 Rain-fed production potentials of culturable wasteland, biofuel production potential and energy output for biofuel feedstocks
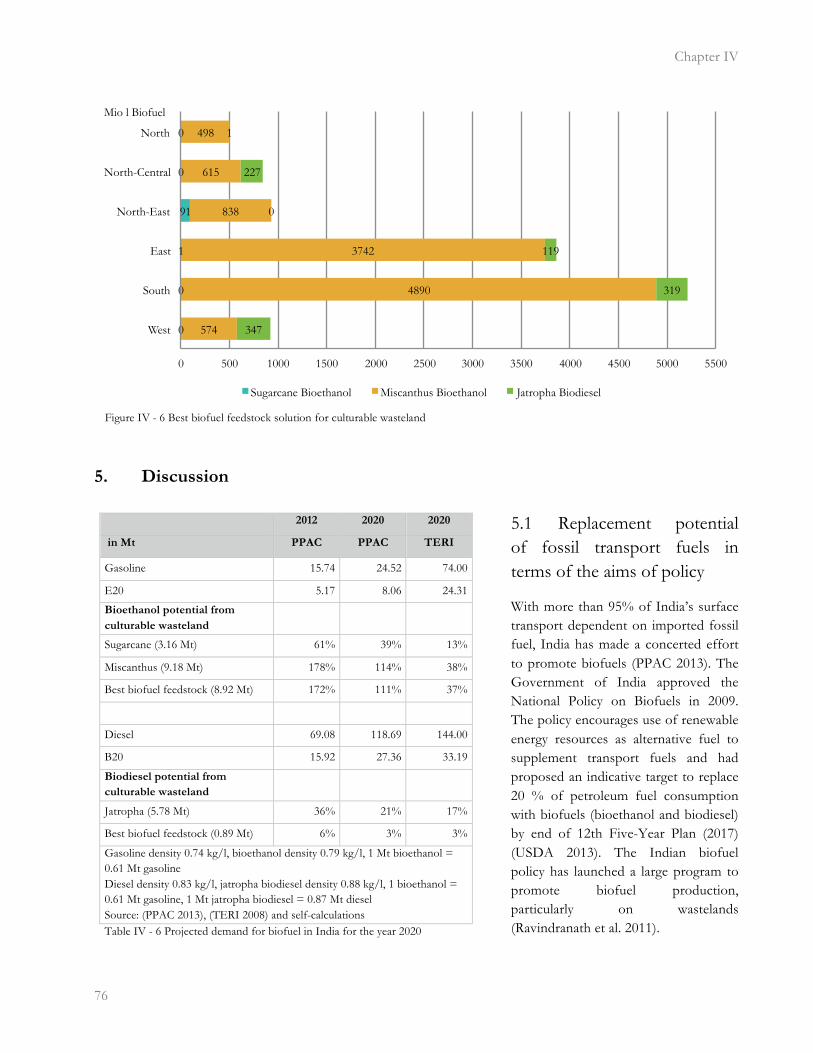
Chapter IV
�76
5. Discussion
�
5.1 Replacement potential of fossil transport fuels in terms of the aims of policy
With more than 95% of India’s surface transport dependent on imported fossil fuel, India has made a concerted effort to promote biofuels (PPAC 2013). The Government of India approved the National Policy on Biofuels in 2009. The policy encourages use of renewable energy resources as alternative fuel to supplement transport fuels and had proposed an indicative target to replace 20 % of petroleum fuel consumption with biofuels (bioethanol and biodiesel) by end of 12th Five-Year Plan (2017) (USDA 2013). The Indian biofuel policy has launched a large program to promote biofuel production, particularly on wastelands (Ravindranath et al. 2011).
2012 2020 2020
in Mt PPAC PPAC TERI
Gasoline 15.74 24.52 74.00
E20 5.17 8.06 24.31
Bioethanol potential from
culturable wasteland
Sugarcane (3.16 Mt) 61% 39% 13%
Miscanthus (9.18 Mt) 178% 114% 38%
Best biofuel feedstock (8.92 Mt) 172% 111% 37%
Diesel 69.08 118.69 144.00
B20 15.92 27.36 33.19
Biodiesel potential from
culturable wasteland
Jatropha (5.78 Mt) 36% 21% 17%
Best biofuel feedstock (0.89 Mt) 6% 3% 3%
Gasoline density 0.74 kg/l, bioethanol density 0.79 kg/l, 1 Mt bioethanol = 0.61 Mt gasoline Diesel density 0.83 kg/l, jatropha biodiesel density 0.88 kg/l, 1 bioethanol = 0.61 Mt gasoline, 1 Mt jatropha biodiesel = 0.87 Mt diesel Source: (PPAC 2013), (TERI 2008) and self-calculations Table IV - 6 Projected demand for biofuel in India for the year 2020
�
0
0
1
91
0
0
574
4890
3742
838
615
498
347
319
119
0
227
1
0 500 1000 1500 2000 2500 3000 3500 4000 4500 5000 5500
West
South
East
North-East
North-Central
North
Sugarcane Bioethanol Miscanthus Bioethanol Jatropha Biodiesel
Mio l Biofuel
Figure IV - 6 Best biofuel feedstock solution for culturable wasteland
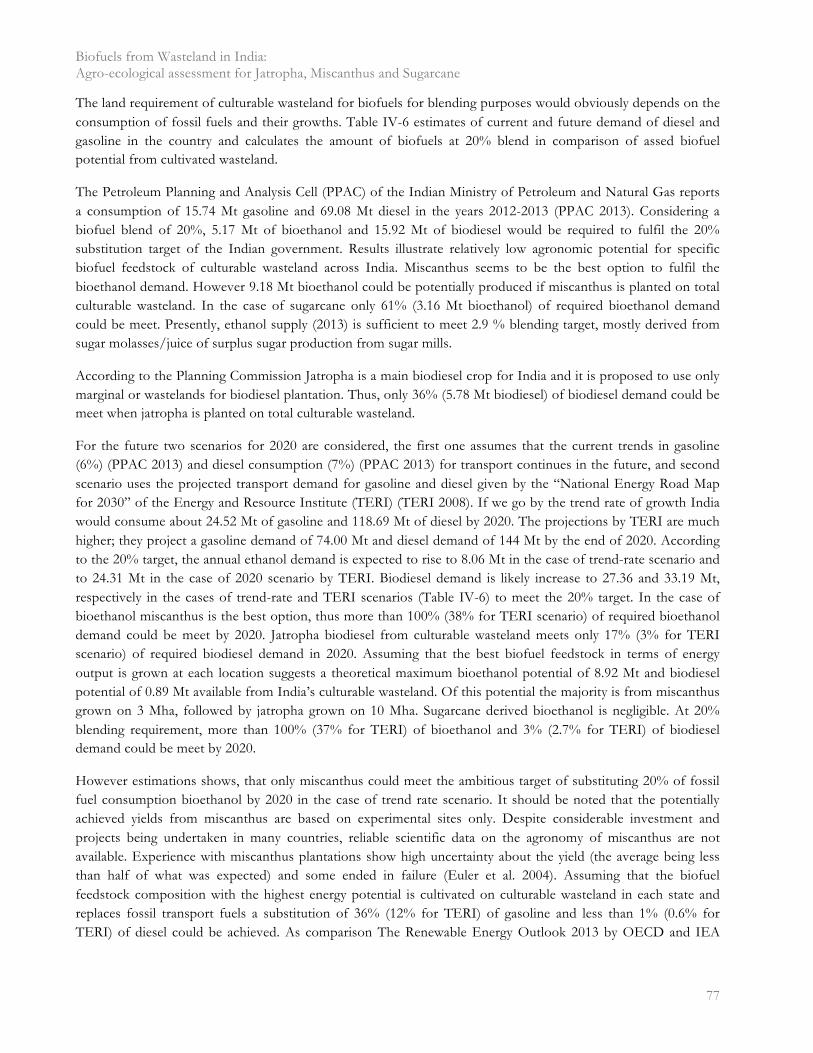
Biofuels from Wasteland in India: Agro-ecological assessment for Jatropha, Miscanthus and Sugarcane
� 77
The land requirement of culturable wasteland for biofuels for blending purposes would obviously depends on the consumption of fossil fuels and their growths. Table IV-6 estimates of current and future demand of diesel and gasoline in the country and calculates the amount of biofuels at 20% blend in comparison of assed biofuel potential from cultivated wasteland.
The Petroleum Planning and Analysis Cell (PPAC) of the Indian Ministry of Petroleum and Natural Gas reports a consumption of 15.74 Mt gasoline and 69.08 Mt diesel in the years 2012-2013 (PPAC 2013). Considering a biofuel blend of 20%, 5.17 Mt of bioethanol and 15.92 Mt of biodiesel would be required to fulfil the 20% substitution target of the Indian government. Results illustrate relatively low agronomic potential for specific biofuel feedstock of culturable wasteland across India. Miscanthus seems to be the best option to fulfil the bioethanol demand. However 9.18 Mt bioethanol could be potentially produced if miscanthus is planted on total culturable wasteland. In the case of sugarcane only 61% (3.16 Mt bioethanol) of required bioethanol demand could be meet. Presently, ethanol supply (2013) is sufficient to meet 2.9 % blending target, mostly derived from sugar molasses/juice of surplus sugar production from sugar mills.
According to the Planning Commission Jatropha is a main biodiesel crop for India and it is proposed to use only marginal or wastelands for biodiesel plantation. Thus, only 36% (5.78 Mt biodiesel) of biodiesel demand could be meet when jatropha is planted on total culturable wasteland.
For the future two scenarios for 2020 are considered, the first one assumes that the current trends in gasoline (6%) (PPAC 2013) and diesel consumption (7%) (PPAC 2013) for transport continues in the future, and second scenario uses the projected transport demand for gasoline and diesel given by the “National Energy Road Map for 2030” of the Energy and Resource Institute (TERI) (TERI 2008). If we go by the trend rate of growth India would consume about 24.52 Mt of gasoline and 118.69 Mt of diesel by 2020. The projections by TERI are much higher; they project a gasoline demand of 74.00 Mt and diesel demand of 144 Mt by the end of 2020. According to the 20% target, the annual ethanol demand is expected to rise to 8.06 Mt in the case of trend-rate scenario and to 24.31 Mt in the case of 2020 scenario by TERI. Biodiesel demand is likely increase to 27.36 and 33.19 Mt, respectively in the cases of trend-rate and TERI scenarios (Table IV-6) to meet the 20% target. In the case of bioethanol miscanthus is the best option, thus more than 100% (38% for TERI scenario) of required bioethanol demand could be meet by 2020. Jatropha biodiesel from culturable wasteland meets only 17% (3% for TERI scenario) of required biodiesel demand in 2020. Assuming that the best biofuel feedstock in terms of energy output is grown at each location suggests a theoretical maximum bioethanol potential of 8.92 Mt and biodiesel potential of 0.89 Mt available from India’s culturable wasteland. Of this potential the majority is from miscanthus grown on 3 Mha, followed by jatropha grown on 10 Mha. Sugarcane derived bioethanol is negligible. At 20% blending requirement, more than 100% (37% for TERI) of bioethanol and 3% (2.7% for TERI) of biodiesel demand could be meet by 2020.
However estimations shows, that only miscanthus could meet the ambitious target of substituting 20% of fossil fuel consumption bioethanol by 2020 in the case of trend rate scenario. It should be noted that the potentially achieved yields from miscanthus are based on experimental sites only. Despite considerable investment and projects being undertaken in many countries, reliable scientific data on the agronomy of miscanthus are not available. Experience with miscanthus plantations show high uncertainty about the yield (the average being less than half of what was expected) and some ended in failure (Euler et al. 2004). Assuming that the biofuel feedstock composition with the highest energy potential is cultivated on culturable wasteland in each state and replaces fossil transport fuels a substitution of 36% (12% for TERI) of gasoline and less than 1% (0.6% for TERI) of diesel could be achieved. As comparison The Renewable Energy Outlook 2013 by OECD and IEA
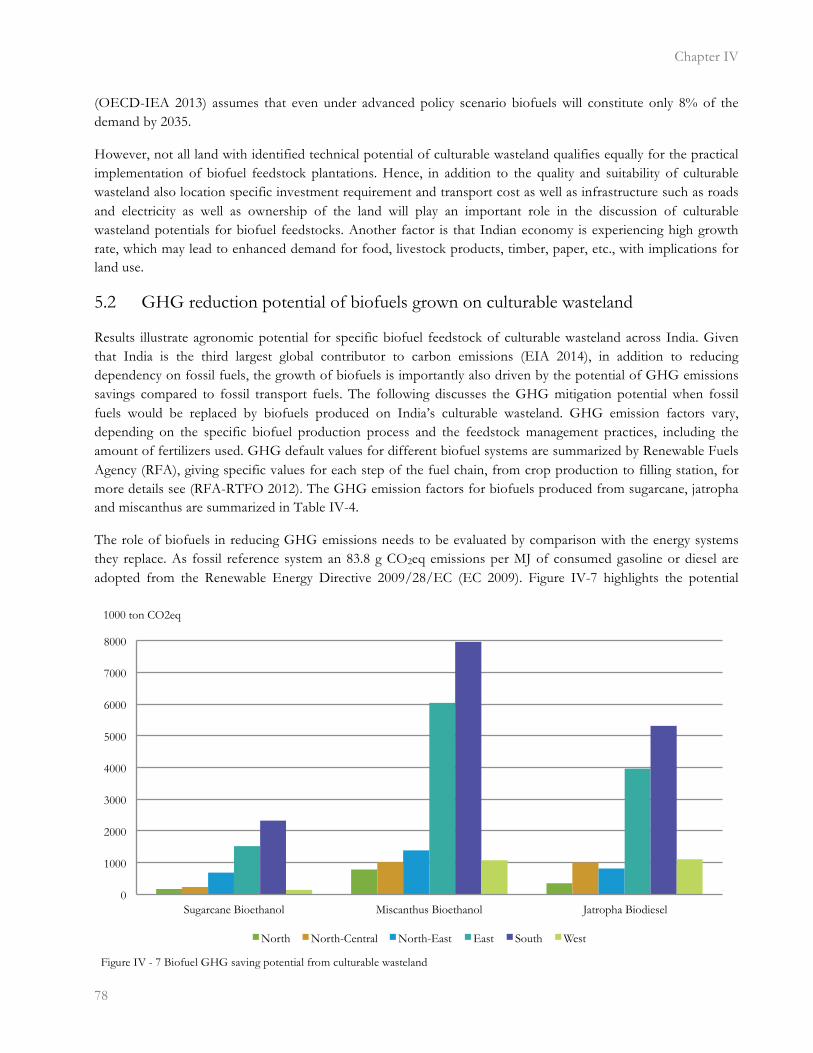
Chapter IV
�78
(OECD-IEA 2013) assumes that even under advanced policy scenario biofuels will constitute only 8% of the demand by 2035.
However, not all land with identified technical potential of culturable wasteland qualifies equally for the practical implementation of biofuel feedstock plantations. Hence, in addition to the quality and suitability of culturable wasteland also location specific investment requirement and transport cost as well as infrastructure such as roads and electricity as well as ownership of the land will play an important role in the discussion of culturable wasteland potentials for biofuel feedstocks. Another factor is that Indian economy is experiencing high growth rate, which may lead to enhanced demand for food, livestock products, timber, paper, etc., with implications for land use.
5.2 GHG reduction potential of biofuels grown on culturable wasteland
Results illustrate agronomic potential for specific biofuel feedstock of culturable wasteland across India. Given that India is the third largest global contributor to carbon emissions (EIA 2014), in addition to reducing dependency on fossil fuels, the growth of biofuels is importantly also driven by the potential of GHG emissions savings compared to fossil transport fuels. The following discusses the GHG mitigation potential when fossil fuels would be replaced by biofuels produced on India’s culturable wasteland. GHG emission factors vary, depending on the specific biofuel production process and the feedstock management practices, including the amount of fertilizers used. GHG default values for different biofuel systems are summarized by Renewable Fuels Agency (RFA), giving specific values for each step of the fuel chain, from crop production to filling station, for more details see (RFA-RTFO 2012). The GHG emission factors for biofuels produced from sugarcane, jatropha and miscanthus are summarized in Table IV-4.
The role of biofuels in reducing GHG emissions needs to be evaluated by comparison with the energy systems they replace. As fossil reference system an 83.8 g CO2eq emissions per MJ of consumed gasoline or diesel are adopted from the Renewable Energy Directive 2009/28/EC (EC 2009). Figure IV-7 highlights the potential
0
1000
2000
3000
4000
5000
6000
7000
8000
Sugarcane Bioethanol Miscanthus Bioethanol Jatropha Biodiesel
1000 ton CO2eq
North North-Central North-East East South West
Figure IV - 7 Biofuel GHG saving potential from culturable wasteland

Biofuels from Wasteland in India: Agro-ecological assessment for Jatropha, Miscanthus and Sugarcane
� 79
GHG emissions saving potential from culturable wasteland for different biofuel feedstocks by regions. Results demonstrate, that biodiesel from jatropha shows potential for GHG mitigation. 13 Mt CO2eq could be saved annually by using sugarcane bioethanol from India’s culturable wasteland instead of gasoline. The GHG mitigation saving associated with bioethanol from sugarcane are more modest, replacing gasoline could only save 5 Mt CO2eq. The best biofuel option for reducing GHG emissions of the transport sector is miscanthus bioethanol (18 Mt CO2eq). However, estimates for miscanthus and jatropha processes are theoretical or based on pilot plants implying higher uncertainties for commercial scale production (OECD-IEA 2011). In its Renewable Energy Directive 2009 (EC 2009), the European Commission (EC) has put forward sustainability regulations and attributes a bonus of 29 g CO2eq/MJ in the computation of the carbon balance, if evidence is provided that the land is degraded with a low organic matter content or heavily contaminated and thus unsuitable for the cultivation of food and livestock feed production. Since we allocated the unfavourable land (in terms of land suitability) to culturable wasteland, biofuel produced from this land will likely be eligible for this additional emission bonus.
5.3 Barriers to biofuel development on wasteland
Total ethanol supply for ethanol blending program during 2013 is anticipated to be just sufficient to meet the 3% blending target (USDA 2013) while production of biodiesel in India is commercially insignificant at present. This stands in contrast to the National Biofuel Policy,which aims to replace 20% of petroleum fuel consumption with biofuels by end of 12th Five-Year Plan (2016/2017) (USDA, 2012b).
One reason for the stagnating biofuel development could be that India’s biofuel program relied more heavily on promoting jatropha than on other biodiesel feedstocks or feedstocks for bioethanol production. The development of jatropha cultivation including technology, plant varieties and practices, is in a nascent stage. As a result, the yield is very low. It should be noted that achieving yields from jatropha is based on experimental sites only. Despite considerable investment and projects being undertaken in many regions, reliable scientific data on the agronomy of jatropha are not available. Experience with jatropha plantations show high uncertainty about the yield (the average being less than half of what was expected) and some ended in failure (Euler et al. 2004). The development of jatropha sector hinges on how effectively farmers performs these tasks and thus helps overcome main constraints, namely mobilisation of land, development of suitable plant varieties and suitable cultivation/harvesting techniques and creation of incentives for the stakeholders.
The failure to develop appropriate institutions responsible for the development of plant verities, dissemination of true information to farmers and feedback from the farmers, have largely resulted in little progress in respect of biofuel mission (Biswas et al. 2013). On the part of a farmer, adoption of an entirely new crop variety as jatropha requires that he should be provided with adequate information about the crop, its risk and return, and more importantly its cultivation practices. Based on this information, the farmer takes the decision whether to cultivate or not. The farmer would then look for finance, seeds and other inputs for cultivation. Traditionally, farmers were very much involved in the innovation process through cross breeding, selection of higher yielding plants, etc. and thus they used to have clear knowledge of the cultivation practices of a new crop, its risk and return. Under the modern system of crop innovation and diffusion, agricultural extension centres including demonstration farms pass on the relevant information about method of farming, risk and return of a new crop innovated in a national research centre. Over a couple of decades during green revolution in India, several new varieties of rice, wheat, pulses, oilseeds, potatoes and other crops were innovated in the national and regional research laboratories. Subsequently, the innovated crops were diffused to the farmers with the help of extension/demonstration centres. In the process, two-way communication networks between farmers and
Chapter IV
�80
inventors were established. Over the years, this system has been institutionalized. These institutions have been supplemented by private operators, such as local retailers selling seeds, fertilisers, pesticides and other farm inputs that provide information to the farmers. The minimum support price policy of the government provided added incentives to the farmers to grow new crops by reducing price risk.
An other reason could be the wasteland availability for biofuel feedstocks. With regard to availability of land for growing biofuel feedstocks, there is no consensus among policy-makers. According to Wasteland Atlas of India (NRSC 2010), about 55 Mha of lands is considered to be wastelands. Out of these, 13 Mha is considered to be suitable for growing biofuel according to the criteria of Ministry of Rural Development (DACNET 2007). The availability refers only to the physical availability. By contrast, the access of land for biofuel feedstock plantations depends on a number of factors including access to infrastructure such as roads and electricity as well as ownership of the land.
One of the major problems with these lands is that although they are rightly declared as wasteland, they are not necessarily left unused and readily available for planting jatropha or other biofuel feedstocks. In general, a sizeable section of the wasteland is used by poor people for fuel, grazing animals and collection of some other products, which are vital for their livelihood (Findlater et al. 2011). Barring a few cases, they were not given proper land rights and their occupations are usually treated as encroachment (Friends of the Earth Europe 2009). According to TERI (TERI 2008) about 5.6 million ha of wastelands has been allotted to many poor families under various programs over the last 20 years. With the insistence of NGOs and government officials, particularly forest officials, these poor people diverted the marginal/wasteland for planting jatropha. Their traditional source of livelihood is dislocated and at the same time jatropha has brought little hope for them due to yield. However, it is possible to grow biofuel feedstocks on wastelands for the betterment of the livelihood of the users, who may be convinced to grow these plants by providing adequate incentive and information and demonstrating the yield and other benefits. Even for the unoccupied wastelands if farmers have to be involved for plantation, it requires the same process of providing incentives, information and demonstration.
6 Conclusion
�
Of the total land area of India (327 Mha), about 14% (NRSC 2010) is wasteland of this total, approximately 13 Mha (DACNET 2007) would be suitable for growing biofuel feedstocks. An iterative sequential downscaling procedure has been implemented to estimate culturable wasteland shares and suitability for biofuel feedstocks. Land suitability assessment results illustrate the prevalence and overall quality of culturable wasteland for different biofuel feedstocks across India. Only 30% of 13 Mha culturable wasteland area is suitable for biofuel feedstock production with a varying degree of productivity depending on biofuel feedstock.
Culturable wasteland when used for sugarcane produces about 6 Mt sugar (equivalent to 4 billion litres bioethanol or 85 PJ), Half of India’s current domestic ethanol demand of 6 billion litres considering a biofuel blend of 20% (PPAC 2013). Alternatively about 12 billion litres (247 PJ) could be produced from miscanthus. Using culturable wasteland land for the production of biodiesel could produce 7 billion litres biodiesel (216 PJ) from jatropha cultivation. A comparison of the different biofuel feedstocks potentially grown on culturable wasteland suggests that from the 4 Mha culturable wasteland suitable for biofuel feedstock production, miscanthus cultivation would provide the highest output in energy terms (237 PJ) on 2.7 Mha, sugarcane (2 PJ) on 0.1 Mha and jatropha (33 PJ) on 1.2 Mha. Assuming that the best biofuel feedstock in energy terms is grown at each location suggests a theoretical maximum biofuel potential of 272 PJ available from Indias culturable wasteland. However experiences
Biofuels from Wasteland in India: Agro-ecological assessment for Jatropha, Miscanthus and Sugarcane
� 81
with miscanthus as biofuel feedstock are still researched with commercial scale application being still under development and achievable oil yields from jatropha cultivation are still uncertain from an agronomic point of view. Not all land with identified technical potential of culturable wasteland qualifies equally for the practical implementation of biofuel feedstock plantations. One of the major problems with these lands is that although they are rightly declared as wasteland, they are not necessarily left unused. It is quite likely that given the population pressure of India in the rural areas, a large part of the wasteland is occupied by marginal farmers and landless people. Future demand for food, livestock feed and pasture land will play an important role in the discussion of culturable wasteland potentials for biofuel feedstocks. According to the results of this study the biofuel program of the National Biofuel Policy, which aims to replace 20 percent of petroleum and diesel fuel consumption with biofuels by end of 12th Five-Year Plan (2016/2017), seems very ambitiousness and difficult to reach.
Acknowledgement
�
The authors thank Mr George Francis for providing support on available data for jatropha and miscanthus. We would like to acknowledge the importance of the funding provided by the Wissenschaftlicher Beirat der Bundesregierung Globale Umweltveränderungen (WBGU), within the scope of the Young Scientist Summer Program (YSSP), organized by the International Institute for Systems analysis (IIASA).

Chapter IV
�82
Synthesis
� 83
Chapter V Synthesis
1 Brazil: Concluding remarks and future research
�
A detailed land balance analysis suggests 37 Mha residual land in Brazil, an area equivalent to about 50% of current croplands. Residual land excludes cropland and pastures reported in Brazil Census 2006, forests, urban areas, the Amazon biome, and all areas designated as protected or of high biodiversity value. Residual land is mainly concentrated in the South-East (17 Mha), other important regions include the North-East (8 Mha) and Central-East (7 Mha).
Land suitability assessment results illustrate the prevalence and overall quality of residual land for different biofuel feedstocks across Brazil. Almost three-quarters of the residual land area is suitable for biofuel feedstock production with a varying degree of productivity depending on biofuel feedstock. The 37 Mha residual land comprises 2% prime land, 24% of good land, 46% of poor land and 28% not suitable land for any of the assessed biofuel feedstock.
Residual land when used for sugarcane produces about 50 Mt sugar (equivalent to 34 billion litres bioethanol or 720 PJ), more than Brazil’s current domestic ethanol demand of 23 billion litres (490 PJ) (USDA 2014a). Alternatively a similar amount of bioethanol, about 31 billion litres (664 PJ) could be produced from cassava or about 62 billion litres (1,320 PJ) from miscanthus.
Using residual land for the production of biodiesel could either produce between 7 billion litres biodiesel (242 PJ) from soybeans or 18 billion litres biodiesel (588 PJ) from jatropha cultivation. This is much higher than Brazil’s current domestic biodiesel demand for fuel of 3 billion litres (115 PJ) (USDA 2014a).
A comparison of the different biofuel feedstocks potentially grown on residual land suggests that from the 27.9 Mha residual land suitable for biofuel feedstock production, miscanthus cultivation would provide the highest output in energy terms (883 PJ) on 16.1 Mha, sugarcane (226 PJ) on 3.9 Mha , cassava (209 PJ) on 7.5 Mha, jatropha (17 PJ) on 0.4 Mha and soybeans (0.2 PJ) on 0.1 Mha. Assuming that the best biofuel feedstock in energy terms is grown at each location suggests a theoretical maximum biofuel potential of 1,336 PJ available from Brazil’s residual land. However experiences with miscanthus as biofuel feedstock are still researched with commercial scale application being still under development and achievable oil yields from jatropha cultivation are still uncertain from an agronomic point of view.
However, not all land with identified technical potential of residual land qualifies equally for the practical implementation of biofuel feedstock plantations. Hence, in addition to the quality and suitability of residual land also location-specific investment requirement and transport cost as well as future demand for food, livestock feed and pasture land will play an important role in the discussion of residual land potentials for biofuel feedstocks.
Farm economics and logistics will favour production of biofuel feedstocks in areas of high residual land concentration with prime and good quality. Most such areas are concentrated in the West of Bahia, all over São Paulo, in the East of Mato Grosso and in the West of Paraná. In these areas the residual land shares per pixel are higher than 33% and in addition more than half the land is of prime or good quality for biofuel feedstocks.
Future residual land availability does not necessarily have to decrease due to projected demand increases in crop and livestock products until 2030, assuming pastures for livestock grazing are well utilized and managed and
Chapter V
�84
cropland expansion is respecting livestock carrying capacities and existing designation for nature protection and biodiversity.
Only when the livestock sector continuous to increase its non-pasture based feed the 37 Mha (27.5 Mha) residual land may be used for biofuel feedstock production beyond 2010. Potential future biofuel feedstock production from residual land may need adjustment due to climate change impacts, to be explored in follow-up research.
2 India: Concluding remarks and future research
�
Of the total land area of India (327 Mha), about 14% (NRSC 2010) is wasteland of this total, approximately 13 Mha (DACNET 2007) would be culturable for biofuel feedstocks. An iterative sequential downscaling procedure has been implemented to estimate culturable wasteland shares and suitability for biofuel feedstocks. Land suitability assessment results illustrate the prevalence and overall quality of culturable wasteland for different biofuel feedstocks across India. Only 30% of culturable wasteland area is suitable for biofuel feedstock production with a varying degree of productivity depending on biofuel feedstock.
Culturable wasteland when used for sugarcane produces about 6 Mt sugar (equivalent to 4 billion litres bioethanol or 85 PJ), Half of India’s current domestic ethanol demand of 6 billion litres considering a biofuel blend of 20% (PPAC 2013). Alternatively about 12 billion litres (24 PJ) could be produced from miscanthus.
Using culturable wasteland land for the production of biodiesel could produce 7 billion litres biodiesel (216 PJ) from jatropha cultivation. A comparison of the different biofuel feedstocks potentially grown on culturable wasteland suggests that from the 4 Mha culturable wasteland suitable for biofuel feedstock production, miscanthus cultivation would provide the highest output in energy terms (237 PJ) on 2.7 Mha, sugarcane (2 PJ) on 0.1 Mha and jatropha (33 PJ) on 1.2 Mha. Assuming that the best biofuel feedstock in energy terms is grown at each location suggests a theoretical maximum biofuel potential of 272 PJ available from Indias culturable wasteland. However experiences with miscanthus as biofuel feedstock are still researched with commercial scale application being still under development and achievable oil yields from jatropha cultivation are still uncertain from an agronomic viewpoint. However, not all land with identified technical potential of culturable wasteland qualifies equally for the practical implementation of biofuel feedstock plantations. One of the major problems with these lands is that although they are rightly declared as wasteland, they are not necessarily left unused. It is quite likely that given the population pressure of India in the rural areas, a large part of the wasteland is occupied by marginal farmers and landless people. Future demand for food, livestock feed and pasture land will play an important role in the discussion of culturable wasteland potentials for biofuel feedstocks. According to the results of this study the biofuel program of the National Biofuel Policy, which aims to replace 20% of petroleum and diesel fuel consumption with biofuels by end of 12th Five-Year Plan (2016/2017), seems very ambitiousness and difficult to reach.
References
� 85
References
�
Achten WMJ (2008), Verchot L, Franken YJ, Mathijs E, Singh VP, Aerts R, Muys B. Jatropha bio-diesel production and use, Biomass and Bioenergy 2008; 32:1063–1084
ADB (2011), Asian Development Bank (ADB). Food Security, Energy Security, and Inclusive Growth in India,The Role of Biofuels. ADB 2011; Publication Stock No. RPT113105.ISBN 978-92-9092-315-2. Available from: http://203.131.219.245/oldbranches/n_puey/News/world%20bank/Food%20Security,%20Energy%20Security,%20and%20Inclusive%20Growth%20in%20India%20%20The%20Role%20of%20Biofuels.pdf [accessed Mai 2013]
Atabani AE (2013), Silitonga AS, Ong HC, Mahlia TMI, Masjuki HH, Irfan Anjum Badruddin, Fayaz H. Non-edible vegetable oils: A critical evaluation of oil extraction, fatty acid compositions, biodiesel production, characteristics, engine performance and emissions production. Renewable and Sustainable Energy Reviews 2013;18: 211–245
Bauen A (2010), Chudziak C, Vad K, Watson P. A causal descriptive approach to modelling the GHG emissions associated with the indirect land use impacts of biofuels, Study for the UK Department for Transport. E4Tech 2010. Available from: http://www.apere.org/doc/1010_e4tech.pdf
Beck C (2004), Grieser J, Rudolf B. A new monthly precipitation climatology for the global land areas for the period 1951 to 2000. German Weather Service, Climate Status Report 2004;181-190. Variability Analyses of Surface Climate Observations (VASClimO) data-set available from: http://www.dwd.de/bvbw/appmanager/bvbw/dwdwwwDesktop?_nfpb=true&_pageLabel=_dwdwww_klima_umwelt_datenzentren_wzn&T12404818261141645314319gsbDocumentPath=Navigation%2FOeffentlichkeit%2FKlima__Umwelt%2FKlimadatenzentren%2FWZN%2FVasclimo%2Fhome__node.html%3F__nnn%3Dtrue [accessed January 2013]
Berndes G (2003), Hoogwijk M, van den Broek R. The contribution of biomass in the future global energy supply: a review of 17 studies, Biomass & Bioenergy 2003:25;1-28. oi:10.1016/S0961-9534(02)00185-X
Biswas PK (2013), Pohit S. What ails India’s biodiesel programme. Energy Policy 2013;52:789–796.
BMELV-FNR (2012), Federal Ministry of Food, Agriculture and Consumer Protection (BMELV), Fachagentur Nachwachsende Rohstoffe (FNR). Biokraftstoffe Eine vergleichende Analyse. FNR 2009. Available from: http://www.fnr-server.de/ftp/pdf/literatur/pdf_236-biokraftstoffvergleich_2009.pdf [accessed September 2012]
BMELV-FNR (2009), Federal Ministry of Food, Agriculture and Consumer Protection (BMELV), Fachagentur Nachwachsende Rohstoffe (FNR). Bioenergy in Germany: Facts and Figures. FNR 2012. Available from: http://mediathek.fnr.de/media/downloadable/files/samples/b/a/basisdaten_engl_web_neu.pdf [accessed November 2012]
References
�86
Bruinsma J (2003). World agriculture towards 2015/2030: an FAO perspective. Earthscan publications 2003. Available from: http://www.fao.org/fileadmin/user_upload/esag/docs/y4252e.pdf [accessed April 2013]
Bustamante MMC (2012), Nobre CA, Smeraldi R, Aguiar APD, Barioni LG, Ferreira LG, Longo K, May P, Pinto AS, Ometto JPHB. Estimating greenhouse gas emissions from cattle raising in Brazil. Climatic Change 2012;115:559–577. DOI 10.1007/s10584-012-0443-3 Available from: http://link.springer.com/content/pdf/10.1007%2Fs10584-012-0443-3.pdf [accessed February 2014]
Carriquiry MA (2010), Du X, Timilsina GR. Second-Generation Biofuels Economics and Policies. The World Bank Policy Research Working Paper 2010;WPS 5406. Available from: http://www-wds.worldbank.org/servlet/WDSContentServer/WDSP/IB/2010/08/30/000158349_20100830090558/Rendered/PDF/WPS5406.pdf [accessed November 2012]
Carvalho PC (2006). Country Pasture/Forage Resource Profiles. 2006. http://www.fao.org/ag/AGP/AGPC/doc/Counprof/PDF%20files/Brazil-English.pdf
Cederberg C (2011), Persson UM, Neovius K, Molander S & Clift R. Including Carbon Emissions from Deforestation in the Carbon Footprint of Brazilian Beef. Environmental Science & Technology 2011:45(5);1773–1779. doi: 10.1021/es103240z Available from: http://pubs.acs.org/doi/pdf/10.1021/es103240z [accessed April 2013]
CGEE (2012), Centro de Gestão e Estudos Estratégicos (CGEE). Sustainability of sugarcane bioenergy, Updated edition. CGEE 2012. ISBN 978-85-60755-47-9. Available from: http://www.cgee.org.br/publicacoes/sustainability.php [assessed September 2014]
CGIAR-CSI (2008), Consultative Group on International Agricultural Research- Consortium of Spatial Information (CGIAR-CSI). Shuttle Radar Topographic Mission (SRTM) data. SRTM data sets available from: http://srtm.csi.cgiar.org [accessed January 2010].
Chou CH (2009). Miscanthus plants used as an alternative biofuel material: The basic studies on ecology and molecular evolution, Renewable Energy 2009;34:908–1912.
Cohn A (2011), Bowman M, Zilberman D, O’Neill K. The viability of cattle ranching intensification in Brazil as a strategy to spare land and mitigate greenhouse gas emissions. CIGAR Research Programme on Climate Change, Agriculture and Food Security (CCAFS) 2011;Working Paper No.11. Available from: http://ccafs.cgiar.org/sites/default/files/assets/docs/ccafs-wp-11-the-viability-of-cattle-ranching-intensification.pdf [accessed February 2013]
DACNET (2007), Department of Agriculture and Cooperation National Information Center (DACNET). District Wise Land Use Statistics from the year 2006/2007. Available from: http://lus.dacnet.nic.in [accessed November 2012]
Daimler (2009). Blue Zero: Customized Electric Drive Technology, Daimler HighTechReport 2009:01;09.
Davidson EA (2012), de Araujo AC, Artaxo P, Balch JK, Brown F, Bustamante MMC, Coe1 MT, DeFries RS, Keller M, Longo M, Munger JW, Schroeder W, Soares-Filho BS, Souza Jr CM, Wofsy SC. The

References
� 87
Amazon basin in transition. Nature 2012;481(7381):321-328. doi:10.1038/nature10717. Available from: http://www.fs.fed.us/global/iitf/pubs/ja_iitf_2012_Davidson001.pdf [accessed Mai 2012]
De Gouvello C (2010). Brazil Low-carbon Country Case Study. The International Bank for Reconstruction and Development / The World Bank 2010. Available from: http://siteresources.worldbank.org/BRAZILEXTN/Resources/Brazil_LowcarbonStudy.pdf [accessed February 2014]
DOE (2006), U.S. Department of Energy,Office of Energy Efficiency and Renewable Energy (DOE), Office of Science (SC). Breaking the Biological Barriers to Cellulosic Ethanol: A Joint Research Agenda, A Research Roadmap Resulting from the Biomass to Biofuels Workshop December 2005. DOE 2006;DOE/SC-0095. Available from: http://genomicscience.energy.gov/biofuels/2005workshop/b2blowres63006.pdf [accessed Mai 2012]
EC (2008), European Commission. Directive EN 14214:2003: Automotive fuels - Fatty acid methyl esters (FAME) for diesel engines - Requirements and test methods. European Committee for Standardization 2008;ICS 75.160.20. Available from: http://www.novaol.it/novaol/export/sites/default/allegati/EN14214.pdf [accessed November 2012]
EC (2009), European Commission. Directive 2009/28/EC: on the promotion of the use of energy from renewable sources and amending and subsequently repealing Directives 2001/77/EC and 2003/30/EC. Official Journal of the European Union 2009; L 140/16. Available from: http://eur-lex.europa.eu/LexUriServ/LexUriServ.do?uri=Oj:L:2009:140:0016:0062:en:PDF [accessed November 2012]
EDC (2000), EROS Data Centre (EDC). Global land cover characterization version 2.0 (GLCC v2.0). EDC 2000. Available from http://edcwww.cr.usgs.gov;2000 [assessed July 2013]
Edwards R (2010), Mulligan D, Marelli L. Indirect Land-use change from increased biofuels demand. Comparison of models and results for marginal biofuels production from different feedstocks. EC Joint Research Centre (JRC) 2010; EUR 24485 EN. ISBN 978-92-79-16391-3. Available from: http://ec.europa.eu/energy/renewables/consultations/doc/public_consultation_iluc/study_4_iluc_modelling_comparison.pdf [accessed October 2012]
EIA (2004), U.S. Energy Information Administration (EIA), Independet Statistics & Anlaysis: International Energy Statistics.2014. Available from: http://www.eia.gov/cfapps/ipdbproject/IEDIndex3.cfm?tid=5&pid=5&aid=2 [assessed September 2014]
Estrin AN (2009), Eng P. Development of the Jatropha cultivation and biodiesel production: case study of Karnataka State, India. Imperial College London, Center for Environmental Policy 2009; Docotor thesis. Available from:
Euler H (2004), Euler H, Gorriz D. Case Study “Jatropha Curcas”. Global Facilitation Unit for Underutilized Species (GFU), Deutsche Gesellschaft fu ̈r Technische Zusammenarbeit (GTZ) GmbH 2004.

References
�88
Available from: http://www.cropsforthefuture.org/publication/strategic-document/Case%20Study%20Jatropha%20curcas%20in%20India.pdf [accessed February 2013]
F.O. Lichts (2008). World Ethanol and Biofuel Report. Licht Interactive Data.5 May 2008
F.O. Lichts (2013). World Ethanol and Biofuel Report. Licht Interactive Data. Available from: http://www.ethanolrfa.org/pages/statistics#E [assessed Mai 2013]
FAO (1972), Food and agriculture organization of the United Nations (FAO). Technical Conversion Factors for Agricultural Commodities;1972. Available from: http://www.fao.org/fileadmin/templates/ess/documents/methodology/tcf.pdf [accessed September 2012]
FAO (2001), Food and agriculture organization of the United Nations (FAO). Global Forest Resources Assessment 2000: Main report. FAO 2001;FAO Forestry Paper 140. ISSN 0258-6150.
FAO (2007), Food and agriculture organization of the United Nations (FAO), University of Bonn. Global Map of Irrigation Areas version 4.0.1 (GMIA 4.0.1). FAO 2007. Available from: http://www.fao.org/nr/water/aquastat/irrigationmap/index10.stm [accessed June 2013]
FAO (2008), Food and agriculture organization of the United Nations (FAO).The State of food and agriculture. FAO report 2008. ISSN 0081-4539. Available from: ftp://ftp.fao.org/docrep/fao/011/i0100e/i0100e.pdf [accessed September 2012]
FAO (2010a), Food and Agriculture Organization of the United Nations (FAO), Forestry Department. Global Forest Resources Assessment 2010 (FRA 2010), Country Report Brazil; 2010. Available from: http://www.fao.org/forestry/20288-0f6ee8584eea8bff0d20ad5cebcb071cf.pdf [accessed January 2013]
FAO (2010b), Food and Agriculture Organization of the United Nations (FAO), Forestry Department. Global Forest Resources Assessment 2010 (FRA 2010), Country Report Brazil; 2010. Available from: http://www.fao.org/forestry/20288-0f6ee8584eea8bff0d20ad5cebcb071cf.pdf [accessed January 2013]
FAO (2011), Food and agriculture organization of the United Nations (FAO), Statistics Division (FAOSTAT); 2011. Available from: http://faostat.fao.org/site/377/DesktopDefault.aspx?PageID=377#ancor [accessed April 2013]
FAO (2014), Food and agriculture organization of the United Nations (FAO). Global administrative unit layer (GAUL). Available from: http://www.fao.org/geonetwork/srv/en/metadata.show?id=12691 [accessed September 2014]
FAO (2012), Food and agriculture organization of the United Nations (FAO), Institute for Applied System Analysis (IIASA), International Soil Reference and Information Centre (ISRIC), Institute of Soil Science – Chinese Academy of Sciences (ISSCAS), Joint Research Centre of the European Commission (JRC). Harmonized World Soil Database version 1.2 (HWSD v1.2). IIASA 2012. Available from: http://www.iiasa.ac.at/Research/LUC/External-World-soil-database/HTML/ [accessed June 2013]
References
� 89
FAO-AGAL (2005), Food and agriculture organization of the United Nations (FAO), Livestcok Information sector Analysis and Policy Branch (AGAL). Livestock sector brief: Brazil. FAO 2005. Available from: http://www.fao.org/ag/againfo/resources/en/publications/sector_briefs/lsb_BRA.pdf [accessed February 2014]
FAO-IIASA (2012), Food and agriculture organization of the United Nations (FAO), Institute for Applied System Analysis (IIASA). Global Agro-ecological Zones: Model Documetation GEAZ v.03. IIASA 2012. Available from: http://webarchive.iiasa.ac.at/Research/LUC/GAEZv3.0/docs/GAEZ_Model_Documentation.pdf [accessed November 2012]
FIESP-ICONE (2012), Agribusiness projections, Federation of Industries of the State of São Paulo (FIESP), Institute for International Trade Negotiations (ICONE). Outlook Brasil 2022 - projec ̧o ̃es para o agronego ́cio. FIESP/ICONE 2012; CDU 339.56.ISBN 978-85-7201-008-5. Available from: http://transfer.sede.embrapa.br/SGE/referencia_para_leitura/Outlook%20Brasil%20FIESP.pdf [accessed November 2013]
Findlater KM (2011), Kandlikar M. Land use and second-generation biofuel feedstocks: the unconsidered impacts of Jatropha biodiesel in Rajasthan, India. Energy Policy 39, 3404–3413.
Fischer G (2006), Ermolieva T, Ermoliev Y, van Velthuizen H. Sequential downscaling methods for estimation from aggregate data, IIASA Interim Report IR-06-002. IIASA 2006. Available from: http://www.iiasa.ac.at/publication/more_IR-06-002.php [accessed April 2013]
Fischer G (2009), Prieler S, van Velthuizen H, Berndes G, Faaij A, Londo M, de Wit M. Biofuel production potentials in Europe: Sustainable use of cultivated land and pastures, Part II: Land use scenarios, Biomass & Bioenergy 2010:34; 173-187. doi:10.1016/j.biombioe.2009.07.009
Fischer G (2010), Prieler S, van Velthuizen H, Lensink S, Londo M, de Wit M. Biofuel Production Potentials in Europe: Sustainable use of cultivated land and pastures. Part I: Land productivity potentials, Biomass & Bioenergy 2010:34; 159-172. doi:10.1016/j.biombioe.2009.07.008
FNP (2011), Informa Economics South America (FNP), Agra Pesquisas Ltda. Anuário da Pecuária Brasileira. 1st ed (ANUALPEC 2011). FNP 2011, São Paulo, Brazil.
Friends of the Earth Europe (2009). Losing the Plot: The Threats to Community Land and the Rural Poor Through the Spread of the Biofuel Jatropha in India. Brussels, Belgium.
Gandhi AP (2009). Review Article: Quality of soybean and its food products. International Food Research Journal 2009;16:11-19. Available from: http://www.ifrj.upm.edu.my/16%20(1)%202009/02%20IFRJ-2008-134%20Gandhi%20India%20FINAL.pdf [accessed November 2012]
GEXSI (2008), Global Exchange for Social Investment (GEXSI). Global Market Study on Jatropha, Final Report; GEXSI LLP 2008. Available from http://www.jatropha-alliance.org/fileadmin/documents/GEXSI_Global-Jatropha-Study_FULL-REPORT.pdf [accessed Mai 2012]
References
�90
Gibbs HK (2010), Ruesch AS, Achard F, Clayton MK, Holmgren P, Ramankutty N, Foley JA. Tropical forests were the primary sources of new agricultural land in the 1980s and 1990s. Proceedings of the National Academy of Sciences (PNAS), PNAS 2010;107(38):16732–16737. Available from: http://www.pnas.org/content/107/38/16732.full.pdf+html [accessed Mai 2012]
Heaton EA (2004), Voigt T, Long SP. A quantitative review comparing the yields of two candidate C4 perennial biomass crops in relation to nitrogen, temperature and water. Biomass and Bioenergy 2004;27:21–30.
Heaton EA (2011), Boersma N, Caveny JD, Voigt TB, Dohleman FG. Miscanthus (Miscanthus x giganteus) for Biofuel Production, Extension 2011. Available from: http://www.extension.org/pages/26625/miscanthus-miscanthus-x-giganteus-for-biofuel-production [accessed Mai 2012]
Hoogwijk M (2003), Faaij A, van den Broek R, Berndes G, Gielen D, Turkenburg W. Exploration of the Ranges of the Global Potential of Biomass for Energy, Biomass and Bioenergy 2003:25; 119-113. doi:10.1016/S0961-9534(02)00191-5
IATP (2008), Institute for Agriculture and Trade Policy (IATP). Biofuel and Global Biodiversity. IATP 2008. Available from: http://www.iatp.org/files/258_2_102584_0.pdf [accessed March 2014]
IBGE (2006), Instituto Brasileiro de Geografia e Estatística (IBGE). Censos Agropecuario 2006. Available from: http://downloads.ibge.gov.br/downloads_estatisticas.htm [accessed June 2013]
IBGE (2011a), The Brazilian Institute of Geography and Statistics (IBGE). Administrative Unit Layer Brazil. Available from: http://downloads.ibge.gov.br/downloads_geociencias.htm [accessed May 2013]
IBGE (2011b), The Brazilian Institute of Geography and Statistics (IBGE). Survey Municipal Livestock Production. IBGE 2011; ISSN 0101-4234. Available from: ftp://ftp.ibge.gov.br/Producao_Pecuaria/Producao_da_Pecuaria_Municipal/2011/ppm2011.pdf [accessed January 2014]
IFPRI (2002), International Food Policy Research Institute (IFPRI). Global agricultural extent v2.0. IFPRI 2002.
IMS (2011a), International Meat Secretariat (IMS). Brazil works towards sustainable cattle sector. Market Featured Articles;2011. Available from: http://www.thebeefsite.com/articles/2781/brazil-works-towards-sustainable-cattle-sector [accessed February 2014]
IMS (2011b), International Meat Secretariat (IMS). Brazil-Towards a sustainable cattle sector. IMS 2011; Newsletter No 469. Available from: http://www.abiec.com.br/download/IMS_Newsletter_469.pdf [accessed March 2014]
IREDA (2013), Indian Renewable Energy Development Agency (IREDA). Target 17: racing against time:Energy booster for Indian biofuel sector. Journal Energy Next 2013;Vol.3: Is.7 Available from: http://www.sgbiofuels.com/AdminSavR/en/uploaded_files/115-Energy-Next_-May_2013_Cover.pdf [accessed May 2013]
References
� 91
ISU (2010), Iowa State University Department of Agronomy (ISU). Factsheet biomass: miscanthus, Giant Miscanthus for Biomass Production. ISU 2010; AG201.Available from: http://www.extension.iastate.edu/Publications/AG201.pdf [accessed Mai 2012]
Jonas M (2014), Ometto JP, Batistella M, Franklin O, Hall M, Lapola DM, Moran EF, Tramberend S, Queiroz BL, Schaffartzik A, Shvidenko A, Nilsson SB, Nobre CA. Sustaining ecosystem services: Overcoming the dilemma posed by local actions and planetary boundaries, Earth’s Future 2014:2;407-420. doi: 10.1002 /2013EF000224. Available from: http://onlinelibrary.wiley.com/store/10.1002/2013EF000224/asset/eft239.pdf?v=1&t=i1j29t2b&s=5941f68b602ad13a260ed9d6904616b80acedcc9 [assessed September 2014]
Jongschaap REE (2007), Corre ́ WJ, Bindraban PS, Brandenburg WA. Claims and Facts on Jatropha curcas L., Global Jatropha curcas evaluation, breeding and propagation programme. Plant Research International B.V. Wageningen 2007; Report 158. Available from: http://edepot.wur.nl/41683 [accessed Mai 2012]
JRC (2006), EC Joint Research Centre (JRC). Global 2000 land cover (GLC 2000): A vegetation map of south America. JRC 2006;EUR 20159 EN. ISBN 92-894-4449-5. GLC 2000 data-sets available from: http://bioval.jrc.ec.europa.eu/products/glc2000/glc2000.php [accessed January 2013]
Lange M (2010). The GHG Balance of Biofuels Taking into Account Land Use Change, Kiel Institute for the World Economy (ifw) 2010; Kiel working paper No. 1619. Available from: http://www.ifw-members.ifw-kiel.de/publications/the-ghg-balance-of-biofuels-taking-into-account-land-use-change/working-paper-the-ghg-balance-of-biofuels-taking-into-account-land-use-change.pdf [accessed October 2012]
Lapola DM (2009), Priessa JA, Bondeau A. Modeling the land requirements and potential productivity of sugarcane and jatropha in Brazil and India using the LPJmL dynamic global vegetation model, Biomass and Bioenergy 2009;33: 1087–1095. doi:10.1016/j.biombioe.2009.04.005
Lapola DM (2010), Schaldacha R, Alcamoa J, Bondeaud A, Koch J, Koelking C, Priess JA. Indirect land-use changes can overcome carbon savings from biofuels in Brazil. Proceedings of the National Academy of Sciences USA 2010; 107:3388–3393.
Lossau S (2015), Fischer G, Tramberend S, van Velthuizen H, Kleinschmit B, Schomäcker R. Brazil’s current and future land balances: Is there residual land for bioenergy production? Biomass and Bioenergy 2015:81:452-461. ISSN 0961-9534. doi:10.1016/j.biombioe.2015.07.024
MAPA-AGE (2009), Ministry of Agriculture, Livestock and Food Supply (MAPA), Strategic Management Advisory Board (AGE). Projections of Agribusiness Brazil 2009/10 to 2019/20. MAPA/AGE 2011. Available from: http://argus.iica.ac.cr:19555/Documents/PROJECOES_INGLES_0.pdf [accessed February 2014]
McKervey Z (2008), Woods VB, Easson DL. Miscanthus as an energy crop and its potential for Northern Ireland, A review of current knowledge. Agri-Food and Biosciences Istitute (AFBI) Hillsborough 2008; AFBI occasional publication No 8. Available from: http://www.afbini.gov.uk/afbi_miscanthus.pdf [accessed Mai 2012]
References
�92
Millen DDR (2011), Pacheco RDL, Meyer PM, Rodrigues PHM, De Beni Arrigoni M. Current outlook and future perspectives of beef production in Brazil. Animal Frontiers 2011; 1(2):46-52.Doi:10.2557/af.2011-0017. Available from: http://animalfrontiers.org/content/1/2/46.full.pdf [accessed February 2014]
Mitchell TD (2005), Jones PD. An improved method of constructing a database of monthly climate observations and associated high-resolution grids, International Journal of Climatology 2005:25; 693-712. doi: 10.1002/joc.1181. CRU TS v 2.1 data-set available from: http://www.cru.uea.ac.uk/cru/data/hrg/cru_ts_2.10/ [accessed January 2013]
MMA (2004), Brazilian Ministry of the Environment (MMA). National Biodiversity Project (PROBIO): Areas for the conservation, sustainable use and benefit sharing of Brazilian biological diversity. MMA 2004. Available from: http://mapas.mma.gov.br/i3geo/datadownload.htm [accessed June 2010]
MMA-IBGE (2011), Brazilian Ministry of the Environment (MMA), The Brazilian Institute of Geography and Statistics (IBGE). Biome Layer Brazil. Available from: http://mapas.mma.gov.br/i3geo/datadownload.htm [accessed May 2013]
Moncaleano-Escandon J (2013), Silva BCV, Silva SRS, Granja JAA, Alves MCJL, Pompelli MF. Germination responses of Jatropha curcas L. seeds to storage and aging, Industrial Crops and Products 2013;44:684–690
Nepstad D (2014), McGrath D, Stickler C, Alencar A, Azevedo A, Swette B, Bezerra T, DiGiano M, Shimada J, da Motta RS, Armijo E, Castello L, Brando P, Hansen MC, McGrath-Horn M, Carvalho O, Hess L. Slowing Amazon deforestation through public policy and interventions in beef and soy supply chains. Science 2014:344;1118-1123. doi: 10.1126/science.1248525.
New M (2002), Lister D, Hulme M, Makin I. A high-resolution data set of surface climate over global land areas, Climate Research 2002:21;1-25. CRU-CL2.0 data-set available from: http://www.cru.uea.ac.uk/~timm/grid/CRU_CL_2_0.html [accessed June 2010]
NRSC (2010), Department of Land Resources Ministry of Rural Development Govt. of India, National Remote Sensing Centre Indian Space Research Organisation Dept. of Space (NRSC). Wasteland Atlas of India 2010. NRSC 2010. Available from: http://dolr.nic.in/dolr/wasteland_atlas.asp [accessed November 2012]
OECD-FAO (2009), Organization for Economic Co-Operation and Development (OECD), Food and agriculture organization of the United Nations (FAO). Agricultural Outlook 2009-2018.OECD 2009. Available from: http://www.oecd.org/site/oecd-faoagriculturaloutlook/43040036.pdf [assessed January 2013]
OECD-IEA (2010), Organisation for Economic Co-Operation and Development (OECD), International Energy Agency (IEA). Sustainable Production of Second-Generation Biofuels. IEA 2010. Available from: http://www.oecd.org/dataoecd/17/12/44567743.pdf [assessed September 2010]
OECD-IEA (2011), The Organisation for Economic Co-operation and Development (OECD), International Energy Agency (IEA). Technology Roadmap Biofuels for Transport. OECD/IEA 2011. Available
References
� 93
from: http://www.iea.org/publications/freepublications/publication/biofuels_roadmap.pdf [accessed October 2012]
OECD-IEA (2012a), Organisation for Economic Co-Operation and Development (OECD), International Energy Agency (IEA). Renewable Energy Outlook: World Outlook 2013. OECD/IEA 2013. Available from: http://www.iea.org/publications/freepublications/publication/world-energy-outlook-2012.html [assessed September 2013]
OECD-IEA (2012b), "Organisation for Economic Co-Operation and Development (OECD), International Energy Agency (IEA). Understanding Energy Challenges in India:
Policies, Players and Issues. OECD/IEA 2012. Available from: http://www.iea.org/publications/freepublications/publication/india_study_final_web.pdf [assessed September 2013]"
OECD-IEA (2013), Organisation for Economic Co-Operation and Development (OECD), International Energy Agency (IEA). Renewable Energy Outlook: World Outlook 2013. OECD/IEA 2013. Available from: http://www.worldenergyoutlook.org/publications/weo-2013/ [assessed September 2014]
OECD-IEA (2014), Organisation for Economic Co-Operation and Development (OECD), International Energy Agency (IEA). Key World Energy Statistics 2014. OECD/IEA 2013. Available from: http://www.iea.org/publications/freepublications/publication/KeyWorld2014.pdf [assessed September 2014]
OFID-IIASA (2009), OPEC Found of International Development (OFID), Institute for Applied System Analysis (IIASA). Biofuels and Food Security, Final Report. IIASA publishing 2009. Available from: http://www.ofid.org/LinkClick.aspx?fileticket=4PjzcrL3584%3D&tabid=112&mid=552 [assessed January 2014]
ORLN (2000), Oak Ridge National Laboratory for the United States Department of Defence (ORNL). Landscan Population Density Layer. ORLN 2000. Available from: http://www.ornl.gov/sci/landscan/landscan_popden_ArcMap.shtml [accessed Mai 2013]
Piketty M (2009), Wichert M, Fallot A, Aimola L. Assessing land availability to produce biomass for energy: The case of Brazilian charcoal for steel making, Biomass & Bioenergy 2009:33; 180-190. doi:10.1016/j.biombioe.2008.06.002
Pisces (2011), Policy Innovation Systems for Clean Energy Security (PISCES), M.S Swaminathan Research Foundation (MSSRF). Bioenergy Resource Status in India, Working Paper. PISCES 2011. Available from: http://www.pisces.or.ke/sites/default/files/Bioenergy%20Resource%20Status%20in%20India.pdf [accessed February 2013]
PPAC (2013), Petroleum Planning and Analysis Cell (PPAC), Ministry of Petroleum & Natural Gas, Government of India. Report: All India Study on Sectoral Demand of Diesel & Petrol. Nielson 2013.
Ravindranath NH (2011), Sita Lakshmi C, Ritumbra Manuvie, Balachandra P. Biofuel production and implications for land use, food production and environment in India. Energy Policy 2011;39:5737–5745
References
�94
Rettenmaier N (2009), Reinhardt G. Biofuels: GHG emission reduction potential in science and policy, Biofuels conference: Biofuel Research – a Transatlantic Dialogue 2009. Institute for Energy and Environmental Research Heidelberg (IFEU) 2009. Available from: http://www.fnr-server.de/cms35/fileadmin/allgemein/images/veranstaltungen/biofuelconference/S2_4-Reinhardt-proceedings-NR.pdf [accessed October 2012]
RFA (2012), Renewable Fuel Association (RFA), Renewable Transport Fuel Obligation (RTFO). Carbon intensity data sets. RFA 2012. Available from: assets.dft.gov.uk/publications/carbon.../detailed-carbon-intensity-data.xls [accessed April 2012]
Riegel F (2009). The Substitution Potential of Biofuels in Aviation: A Global Assessment Considering Sustainability Criteria. Conference Publication in the 17th European Biomass Conference & Exhibition, Hamburg June 29 to July 03, 2009.
Santana CAM (2011), Torres DAP, Guiducci RN, Alves MA, Garagorry FL, Souza GS, Assa ED, Pellegrino GQ, Barioni LG, Souza MO, Filho HC, Marra R, Mota MM. Regional case study: R5 Productive capacity of Brazilian agriculture: a long-term perspective. Forsight Project on Global Food and Farming Futures 2011. Available from http://www.bis.gov.uk/assets/foresight/docs/food-and-farming/regional/11-594-r5-productive-capacity-of-brazilian-agriculture.pdf [accessed February 2014]
Searchinger T (2008), Heimlich R, Houghton RA, Dong F, Elobeid A, Fabiosa J, Tokgoz S, Hayes D, Yu TH. Use of U.S. croplands for biofuels increases greenhouse gases through emissions from land-use change, Science 2008:319; 10.1126/science1152747.
Smeets E (2007), Faaij A, Lewandowski I, Turkenburg W. A Bottom-Up Assessment and Review of Global Bioenergy Potentials to 2050, Energy and Combustion Science 2007:33; 56-106. doi:10.1016/j.pecs.2006.08.001
Sparovek G (2009), Barretto A, Berndes G, Martins S, Maule S. Environmental, land-use and economic implications of Brazilian sugarcane expansion 1996–2006. Mitig Adapt Strateg Glob Change 2009;14:285–298.doi: 10.1007/s11027-008-9164-3.
Sparovek G (2012), Berndes G, Barretto A, Klug I. The revision of the Brazilian Forest Act: increased deforestation or a historic step towards balancing agricultural development and nature conservation? Environmental Science and Policy 2012;16:65-72. Available from: http://www.esalq.usp.br/lcb/lerf/divulgacao/recomendados/artigos/sparovek2011.pdf [accessed February 2014]
TERI (2008), The Energy and Resource Institute (TERI), Office of the Principal Scientific Adviser, Government of India. National Energy Map for India: Technology Vision 2030. TERI 2006; PSA/2006/3. Available from: http://www.teriin.org/div/psa-fullreport.pdf [accessed January 2014]
Tilman D (2000). Causes, consequences and ethics of biodiversity, Nature 2000:405; 208-211. doi:10.1038/35012217
Tyner W (2010), Taheripour F, Zhuang Q, Birur D, Baldos U. Land-use changes and Consequent CO2 Emissions due to US Corn Ethanol Production: A Comprehensive Analysis, Purdue University
References
� 95
2010. Available from: https://www.gtap.agecon.purdue.edu/resources/download/5200.pdf [accessed October 2012]
UNEP (2010), (United Nations Environment Programme (UNEP), World Conservation Monitoring Centre (WCMC), International Union for Conservation of Nature World (IUCN), Commission on Protected Areas (WCPA). World Database on Protected Areas (WDPA). WDPA data- sets available from: http://www.wdpa.org/AnnualRelease.aspx. [accessed August 2013]
Upham P (2012), Kuttapan V, Tomei J. Sustainable livelihoods and cultivation of Jatropha curcas for biodiesel in India: reflections on alternative agronomic models. The Tyndall Centre, University of Oxford and Newcastle University 2012; Tyndall Working Paper 150. Available from: http://www.tyndall.ac.uk/sites/default/files/twp150_0.pdf [accessed Mai 2013]
USAID-FAO (2014), United States Agency for International Development (USAID), Food and agriculture organization of the United Nations (FAO). Training Material: Home Made Animal Feed Concentrates. Available from: http://pdf.usaid.gov/pdf_docs/PNADT827.pdf [assessed January 2014]
USDA (2012), U.S. Department of Agriculture (USDA) Foreign Agricultural Service, Global Agriculture Information Service (GAIN). India, Biofuels Annual, Annual Report 2012. GAIN report no. IN2081.Available from: http://gain.fas.usda.gov/Recent%20GAIN%20Publications/Biofuels%20Annual_New%20Delhi_India_6-20-2012.pdf [accessed February 2013]
USDA (2013), U.S. Department of Agriculture (USDA) Foreign Agricultural Service, Global Agriculture Information Service (GAIN). India, Biofuels Annual, Annual Report 2013. GAIN report no. IN3073.Available from: http://gain.fas.usda.gov/Recent%20GAIN%20Publications/Biofuels%20Annual_New%20Delhi_India_8-13-2013.pdf [accessed June 2013]
USDA (2014a), U.S. Department of Agriculture (USDA) Foreign Agricultural Service, Global Agriculture Information Service (GAIN). Brazil, Biofuels Annual, Annual Report 2014. GAIN report no. BR14004.Available from: http://gain.fas.usda.gov/Recent%20GAIN%20Publications/Biofuels%20Annual_Sao%20Paulo%20ATO_Brazil_7-25-2014.pdf [accessed December 2014]
USDA (2014b), U.S. Department of Agriculture (USDA) Foreign Agricultural Service, Global Agriculture Information Service (GAIN). India, Biofuels Annual, Annual Report 2014. GAIN report no. IN4055.Available from: http://gain.fas.usda.gov/Recent%20GAIN%20Publications/Biofuels%20Annual_New%20Delhi_India_7-1-2014.pdf [accessed December 2014]
Walter A (2011), Dolzan P, Quilodra O, de Oliveira JG, da Silva C, Piacente F, Segerstedt A. Sustainability Assessment of Bio-ethanol Production in Brazil considering Land Use Change, GHG emissions and Socio-economic aspects, Energy Policy 2011:39;5703-5716. doi:10.1016/j.enpol.2010.07.043, 2010.
WDI (2014), World Development Indicator) (2012), World Bank, retrieved in July 2012. http://databank.worldbank.org/ddp/home.do?Step=12&id=4&CNO=2
References
�96
WEO (2007), Worldwatch Institute (2007). Biofuels for transport. Global potential and implications for sustainable energy and agriculture. Earthscan, London, UK, ISBN: 978-84407-422-8.
You L (2008), Wood S, Sebastian K. Comparing and synthesizing different global agricultural land datasets for crop allocation modelling, The International Archives of the Photo#metry, Remote Sensing and Spatial Information Sciences 2008:XXXVII; Part B
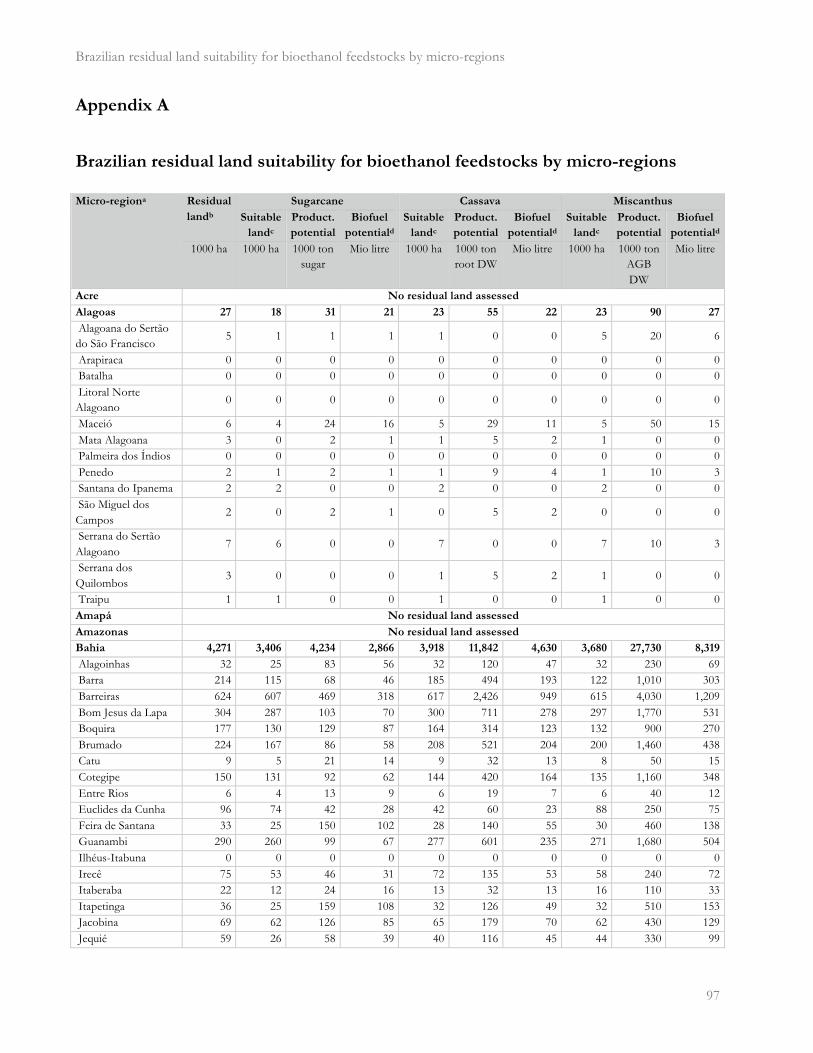
Brazilian residual land suitability for bioethanol feedstocks by micro-regions
� 97
Appendix A
Brazilian residual land suitability for bioethanol feedstocks by micro-regions
�
Micro-regiona Residual
landb
Sugarcane Cassava Miscanthus
Suitable
landc
Product.
potential
Biofuel
potentiald
Suitable
landc
Product.
potential
Biofuel
potentiald
Suitable
landc
Product.
potential
Biofuel
potentiald
1000 ha 1000 ha 1000 ton sugar
Mio litre 1000 ha 1000 ton root DW
Mio litre 1000 ha 1000 ton AGB DW
Mio litre
Acre No residual land assessed
Alagoas 27 18 31 21 23 55 22 23 90 27
Alagoana do Sertão do São Francisco
5 1 1 1 1 0 0 5 20 6
Arapiraca 0 0 0 0 0 0 0 0 0 0 Batalha 0 0 0 0 0 0 0 0 0 0 Litoral Norte Alagoano
0 0 0 0 0 0 0 0 0 0
Maceió 6 4 24 16 5 29 11 5 50 15 Mata Alagoana 3 0 2 1 1 5 2 1 0 0 Palmeira dos Índios 0 0 0 0 0 0 0 0 0 0 Penedo 2 1 2 1 1 9 4 1 10 3 Santana do Ipanema 2 2 0 0 2 0 0 2 0 0 São Miguel dos Campos
2 0 2 1 0 5 2 0 0 0
Serrana do Sertão Alagoano
7 6 0 0 7 0 0 7 10 3
Serrana dos Quilombos
3 0 0 0 1 5 2 1 0 0
Traipu 1 1 0 0 1 0 0 1 0 0 Amapá No residual land assessed
Amazonas No residual land assessed
Bahia 4,271 3,406 4,234 2,866 3,918 11,842 4,630 3,680 27,730 8,319
Alagoinhas 32 25 83 56 32 120 47 32 230 69 Barra 214 115 68 46 185 494 193 122 1,010 303 Barreiras 624 607 469 318 617 2,426 949 615 4,030 1,209 Bom Jesus da Lapa 304 287 103 70 300 711 278 297 1,770 531 Boquira 177 130 129 87 164 314 123 132 900 270 Brumado 224 167 86 58 208 521 204 200 1,460 438 Catu 9 5 21 14 9 32 13 8 50 15 Cotegipe 150 131 92 62 144 420 164 135 1,160 348 Entre Rios 6 4 13 9 6 19 7 6 40 12 Euclides da Cunha 96 74 42 28 42 60 23 88 250 75 Feira de Santana 33 25 150 102 28 140 55 30 460 138 Guanambi 290 260 99 67 277 601 235 271 1,680 504 Ilhéus-Itabuna 0 0 0 0 0 0 0 0 0 0 Irecê 75 53 46 31 72 135 53 58 240 72 Itaberaba 22 12 24 16 13 32 13 16 110 33 Itapetinga 36 25 159 108 32 126 49 32 510 153 Jacobina 69 62 126 85 65 179 70 62 430 129 Jequié 59 26 58 39 40 116 45 44 330 99
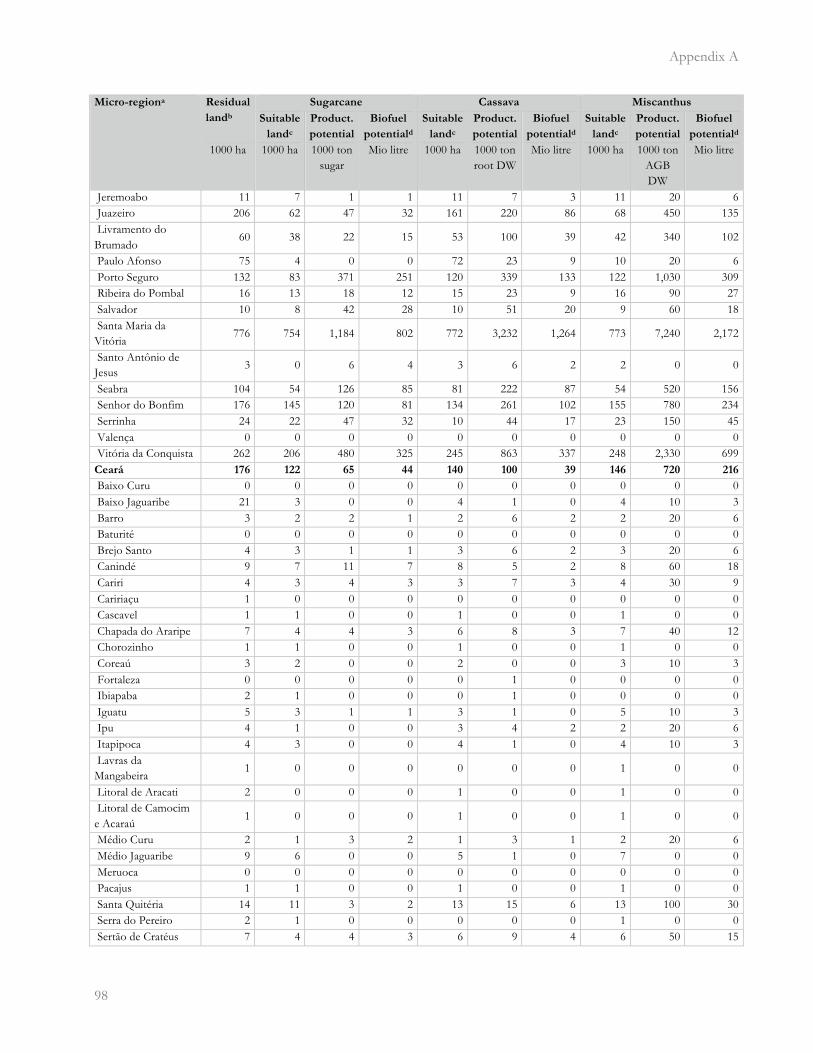
Appendix A
�98
Micro-regiona Residual
landb
Sugarcane Cassava Miscanthus
Suitable
landc
Product.
potential
Biofuel
potentiald
Suitable
landc
Product.
potential
Biofuel
potentiald
Suitable
landc
Product.
potential
Biofuel
potentiald
1000 ha 1000 ha 1000 ton sugar
Mio litre 1000 ha 1000 ton root DW
Mio litre 1000 ha 1000 ton AGB DW
Mio litre
Jeremoabo 11 7 1 1 11 7 3 11 20 6 Juazeiro 206 62 47 32 161 220 86 68 450 135 Livramento do Brumado
60 38 22 15 53 100 39 42 340 102
Paulo Afonso 75 4 0 0 72 23 9 10 20 6 Porto Seguro 132 83 371 251 120 339 133 122 1,030 309 Ribeira do Pombal 16 13 18 12 15 23 9 16 90 27 Salvador 10 8 42 28 10 51 20 9 60 18 Santa Maria da Vitória
776 754 1,184 802 772 3,232 1,264 773 7,240 2,172
Santo Antônio de Jesus
3 0 6 4 3 6 2 2 0 0
Seabra 104 54 126 85 81 222 87 54 520 156 Senhor do Bonfim 176 145 120 81 134 261 102 155 780 234 Serrinha 24 22 47 32 10 44 17 23 150 45 Valença 0 0 0 0 0 0 0 0 0 0 Vitória da Conquista 262 206 480 325 245 863 337 248 2,330 699 Ceará 176 122 65 44 140 100 39 146 720 216
Baixo Curu 0 0 0 0 0 0 0 0 0 0 Baixo Jaguaribe 21 3 0 0 4 1 0 4 10 3 Barro 3 2 2 1 2 6 2 2 20 6 Baturité 0 0 0 0 0 0 0 0 0 0 Brejo Santo 4 3 1 1 3 6 2 3 20 6 Canindé 9 7 11 7 8 5 2 8 60 18 Cariri 4 3 4 3 3 7 3 4 30 9 Caririaçu 1 0 0 0 0 0 0 0 0 0 Cascavel 1 1 0 0 1 0 0 1 0 0 Chapada do Araripe 7 4 4 3 6 8 3 7 40 12 Chorozinho 1 1 0 0 1 0 0 1 0 0 Coreaú 3 2 0 0 2 0 0 3 10 3 Fortaleza 0 0 0 0 0 1 0 0 0 0 Ibiapaba 2 1 0 0 0 1 0 0 0 0 Iguatu 5 3 1 1 3 1 0 5 10 3 Ipu 4 1 0 0 3 4 2 2 20 6 Itapipoca 4 3 0 0 4 1 0 4 10 3 Lavras da Mangabeira
1 0 0 0 0 0 0 1 0 0
Litoral de Aracati 2 0 0 0 1 0 0 1 0 0 Litoral de Camocim e Acaraú
1 0 0 0 1 0 0 1 0 0
Médio Curu 2 1 3 2 1 3 1 2 20 6 Médio Jaguaribe 9 6 0 0 5 1 0 7 0 0 Meruoca 0 0 0 0 0 0 0 0 0 0 Pacajus 1 1 0 0 1 0 0 1 0 0 Santa Quitéria 14 11 3 2 13 15 6 13 100 30 Serra do Pereiro 2 1 0 0 0 0 0 1 0 0 Sertão de Cratéus 7 4 4 3 6 9 4 6 50 15

Brazilian residual land suitability for bioethanol feedstocks by micro-regions
� 99
Micro-regiona Residual
landb
Sugarcane Cassava Miscanthus
Suitable
landc
Product.
potential
Biofuel
potentiald
Suitable
landc
Product.
potential
Biofuel
potentiald
Suitable
landc
Product.
potential
Biofuel
potentiald
1000 ha 1000 ha 1000 ton sugar
Mio litre 1000 ha 1000 ton root DW
Mio litre 1000 ha 1000 ton AGB DW
Mio litre
Sertão de Inhamuns 26 22 18 12 24 6 2 24 70 21 Sertão de Quixeramobim
19 17 6 4 18 5 2 18 70 21
Sertão de Senador Pompeu
10 9 2 1 10 2 1 10 10 3
Sobral 14 11 3 2 13 13 5 13 100 30 Uruburetama 0 0 0 0 0 0 0 0 0 0 Várzea Alegre 3 2 1 1 2 2 1 2 10 3 Distrito Federal 12 12 34 23 12 52 20 5 140 42
BrasÌlia 12 12 34 23 12 52 20 5 140 42 Espírito Santo 794 276 1,032 699 456 1,662 650 494 3,830 1,149
Afonso Cláudio 49 3 4 3 11 19 7 16 60 18 Alegre 56 2 2 1 13 19 7 17 60 18 Barra de São Francisco
131 20 23 16 60 101 39 68 220 66
Cachoeiro de Itapemirim
48 3 6 4 14 27 11 16 80 24
Colatina 125 19 23 16 56 63 25 64 180 54 Guarapari 21 6 24 16 10 59 23 11 110 33 Itapemirim 50 36 155 105 49 325 127 49 570 171 Linhares 49 18 67 45 30 134 52 32 260 78 Montanha 97 87 414 280 96 505 197 96 1,250 375 Nova Venécia 71 31 70 47 56 62 24 60 220 66 Santa Teresa 46 29 149 101 11 19 7 17 60 18 São Mateus 32 3 4 3 31 195 76 32 510 153 Vitória 19 15 89 60 17 131 51 17 260 78 Goiás 3,482 2,658 5,581 3,778 2,695 5,871 2,296 1,844 12,890 3,867
Anápolis 152 79 14 9 80 92 36 31 90 27 Anicuns 96 62 6 4 62 52 20 13 20 6 Aragarças 94 67 26 18 68 67 26 12 60 18 Catalão 183 140 352 238 145 889 348 143 1,170 351 Ceres 141 85 89 60 85 94 37 63 330 99 Chapada dos Veadeiros
3 2 5 3 2 7 3 1 30 9
Entorno de Brasília 405 256 265 179 257 452 177 117 910 273 Goiânia 162 106 89 60 106 290 113 42 650 195 Iporá 76 38 10 7 37 16 6 14 40 12 Meia Ponte 286 244 970 657 250 661 258 218 1,630 489 Pires do Rio 165 128 183 124 131 512 200 85 740 222 Porangatu 244 187 147 100 188 327 128 86 580 174 Quirinópolis 252 241 1,010 684 243 485 190 242 2,090 627 Rio Vermelho 121 86 9 6 91 65 25 7 20 6 São Miguel do Araguaia
161 141 44 30 149 211 83 27 160 48
Sudoeste de Goiás 692 603 1,680 1,137 609 1,289 504 597 3,350 1,005 Vale do Rio dos Bois 196 166 603 408 166 208 81 117 620 186 Vão do Paranã 54 27 78 53 27 150 59 27 360 108
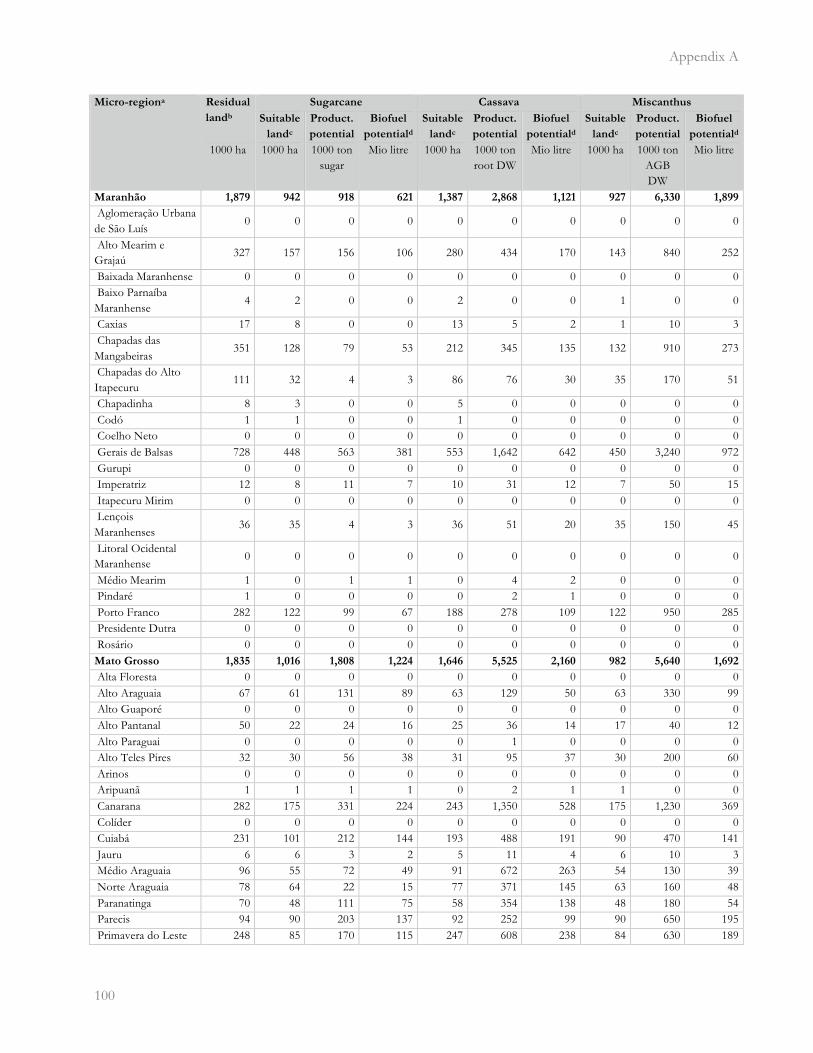
Appendix A
�100
Micro-regiona Residual
landb
Sugarcane Cassava Miscanthus
Suitable
landc
Product.
potential
Biofuel
potentiald
Suitable
landc
Product.
potential
Biofuel
potentiald
Suitable
landc
Product.
potential
Biofuel
potentiald
1000 ha 1000 ha 1000 ton sugar
Mio litre 1000 ha 1000 ton root DW
Mio litre 1000 ha 1000 ton AGB DW
Mio litre
Maranhão 1,879 942 918 621 1,387 2,868 1,121 927 6,330 1,899
Aglomeração Urbana de São Luís
0 0 0 0 0 0 0 0 0 0
Alto Mearim e Grajaú
327 157 156 106 280 434 170 143 840 252
Baixada Maranhense 0 0 0 0 0 0 0 0 0 0 Baixo Parnaíba Maranhense
4 2 0 0 2 0 0 1 0 0
Caxias 17 8 0 0 13 5 2 1 10 3 Chapadas das Mangabeiras
351 128 79 53 212 345 135 132 910 273
Chapadas do Alto Itapecuru
111 32 4 3 86 76 30 35 170 51
Chapadinha 8 3 0 0 5 0 0 0 0 0 Codó 1 1 0 0 1 0 0 0 0 0 Coelho Neto 0 0 0 0 0 0 0 0 0 0 Gerais de Balsas 728 448 563 381 553 1,642 642 450 3,240 972 Gurupi 0 0 0 0 0 0 0 0 0 0 Imperatriz 12 8 11 7 10 31 12 7 50 15 Itapecuru Mirim 0 0 0 0 0 0 0 0 0 0 Lençois Maranhenses
36 35 4 3 36 51 20 35 150 45
Litoral Ocidental Maranhense
0 0 0 0 0 0 0 0 0 0
Médio Mearim 1 0 1 1 0 4 2 0 0 0 Pindaré 1 0 0 0 0 2 1 0 0 0 Porto Franco 282 122 99 67 188 278 109 122 950 285 Presidente Dutra 0 0 0 0 0 0 0 0 0 0 Rosário 0 0 0 0 0 0 0 0 0 0 Mato Grosso 1,835 1,016 1,808 1,224 1,646 5,525 2,160 982 5,640 1,692
Alta Floresta 0 0 0 0 0 0 0 0 0 0 Alto Araguaia 67 61 131 89 63 129 50 63 330 99 Alto Guaporé 0 0 0 0 0 0 0 0 0 0 Alto Pantanal 50 22 24 16 25 36 14 17 40 12 Alto Paraguai 0 0 0 0 0 1 0 0 0 0 Alto Teles Pires 32 30 56 38 31 95 37 30 200 60 Arinos 0 0 0 0 0 0 0 0 0 0 Aripuanã 1 1 1 1 0 2 1 1 0 0 Canarana 282 175 331 224 243 1,350 528 175 1,230 369 Colíder 0 0 0 0 0 0 0 0 0 0 Cuiabá 231 101 212 144 193 488 191 90 470 141 Jauru 6 6 3 2 5 11 4 6 10 3 Médio Araguaia 96 55 72 49 91 672 263 54 130 39 Norte Araguaia 78 64 22 15 77 371 145 63 160 48 Paranatinga 70 48 111 75 58 354 138 48 180 54 Parecis 94 90 203 137 92 252 99 90 650 195 Primavera do Leste 248 85 170 115 247 608 238 84 630 189
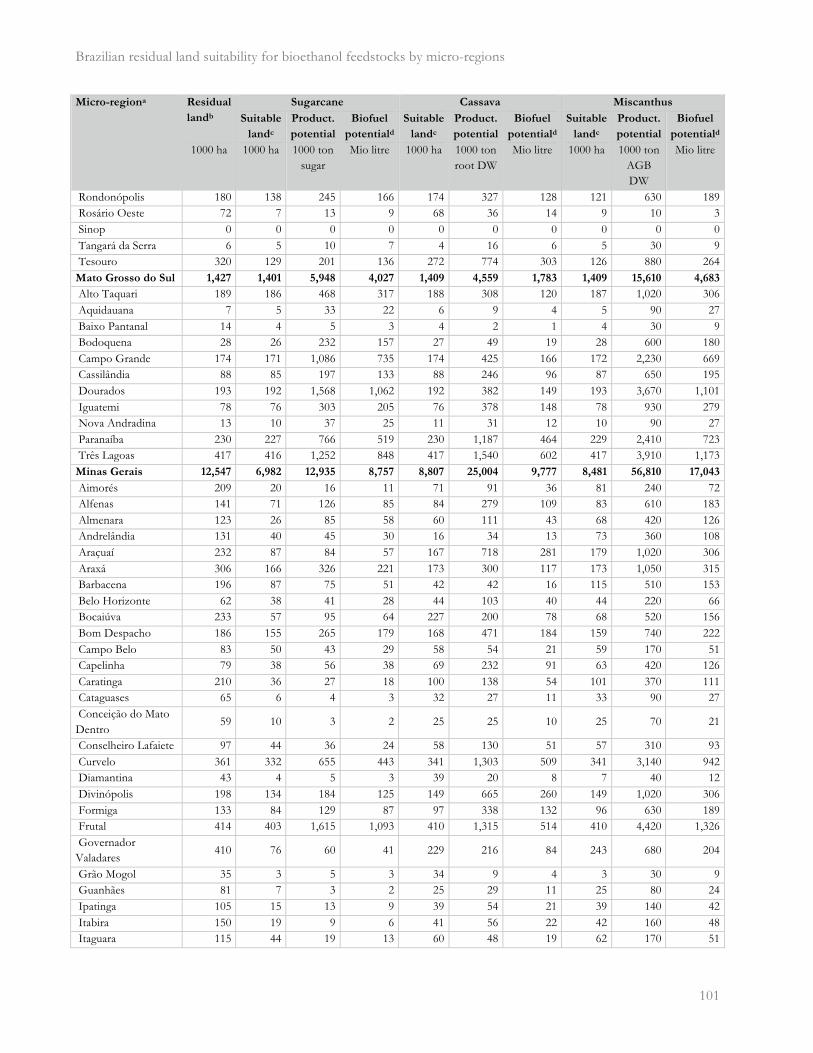
Brazilian residual land suitability for bioethanol feedstocks by micro-regions
� 101
Micro-regiona Residual
landb
Sugarcane Cassava Miscanthus
Suitable
landc
Product.
potential
Biofuel
potentiald
Suitable
landc
Product.
potential
Biofuel
potentiald
Suitable
landc
Product.
potential
Biofuel
potentiald
1000 ha 1000 ha 1000 ton sugar
Mio litre 1000 ha 1000 ton root DW
Mio litre 1000 ha 1000 ton AGB DW
Mio litre
Rondonópolis 180 138 245 166 174 327 128 121 630 189 Rosário Oeste 72 7 13 9 68 36 14 9 10 3 Sinop 0 0 0 0 0 0 0 0 0 0 Tangará da Serra 6 5 10 7 4 16 6 5 30 9 Tesouro 320 129 201 136 272 774 303 126 880 264 Mato Grosso do Sul 1,427 1,401 5,948 4,027 1,409 4,559 1,783 1,409 15,610 4,683
Alto Taquari 189 186 468 317 188 308 120 187 1,020 306 Aquidauana 7 5 33 22 6 9 4 5 90 27 Baixo Pantanal 14 4 5 3 4 2 1 4 30 9 Bodoquena 28 26 232 157 27 49 19 28 600 180 Campo Grande 174 171 1,086 735 174 425 166 172 2,230 669 Cassilândia 88 85 197 133 88 246 96 87 650 195 Dourados 193 192 1,568 1,062 192 382 149 193 3,670 1,101 Iguatemi 78 76 303 205 76 378 148 78 930 279 Nova Andradina 13 10 37 25 11 31 12 10 90 27 Paranaíba 230 227 766 519 230 1,187 464 229 2,410 723 Três Lagoas 417 416 1,252 848 417 1,540 602 417 3,910 1,173 Minas Gerais 12,547 6,982 12,935 8,757 8,807 25,004 9,777 8,481 56,810 17,043
Aimorés 209 20 16 11 71 91 36 81 240 72 Alfenas 141 71 126 85 84 279 109 83 610 183 Almenara 123 26 85 58 60 111 43 68 420 126 Andrelândia 131 40 45 30 16 34 13 73 360 108 Araçuaí 232 87 84 57 167 718 281 179 1,020 306 Araxá 306 166 326 221 173 300 117 173 1,050 315 Barbacena 196 87 75 51 42 42 16 115 510 153 Belo Horizonte 62 38 41 28 44 103 40 44 220 66 Bocaiúva 233 57 95 64 227 200 78 68 520 156 Bom Despacho 186 155 265 179 168 471 184 159 740 222 Campo Belo 83 50 43 29 58 54 21 59 170 51 Capelinha 79 38 56 38 69 232 91 63 420 126 Caratinga 210 36 27 18 100 138 54 101 370 111 Cataguases 65 6 4 3 32 27 11 33 90 27 Conceição do Mato Dentro
59 10 3 2 25 25 10 25 70 21
Conselheiro Lafaiete 97 44 36 24 58 130 51 57 310 93 Curvelo 361 332 655 443 341 1,303 509 341 3,140 942 Diamantina 43 4 5 3 39 20 8 7 40 12 Divinópolis 198 134 184 125 149 665 260 149 1,020 306 Formiga 133 84 129 87 97 338 132 96 630 189 Frutal 414 403 1,615 1,093 410 1,315 514 410 4,420 1,326 Governador Valadares
410 76 60 41 229 216 84 243 680 204
Grão Mogol 35 3 5 3 34 9 4 3 30 9 Guanhães 81 7 3 2 25 29 11 25 80 24 Ipatinga 105 15 13 9 39 54 21 39 140 42 Itabira 150 19 9 6 41 56 22 42 160 48 Itaguara 115 44 19 13 60 48 19 62 170 51
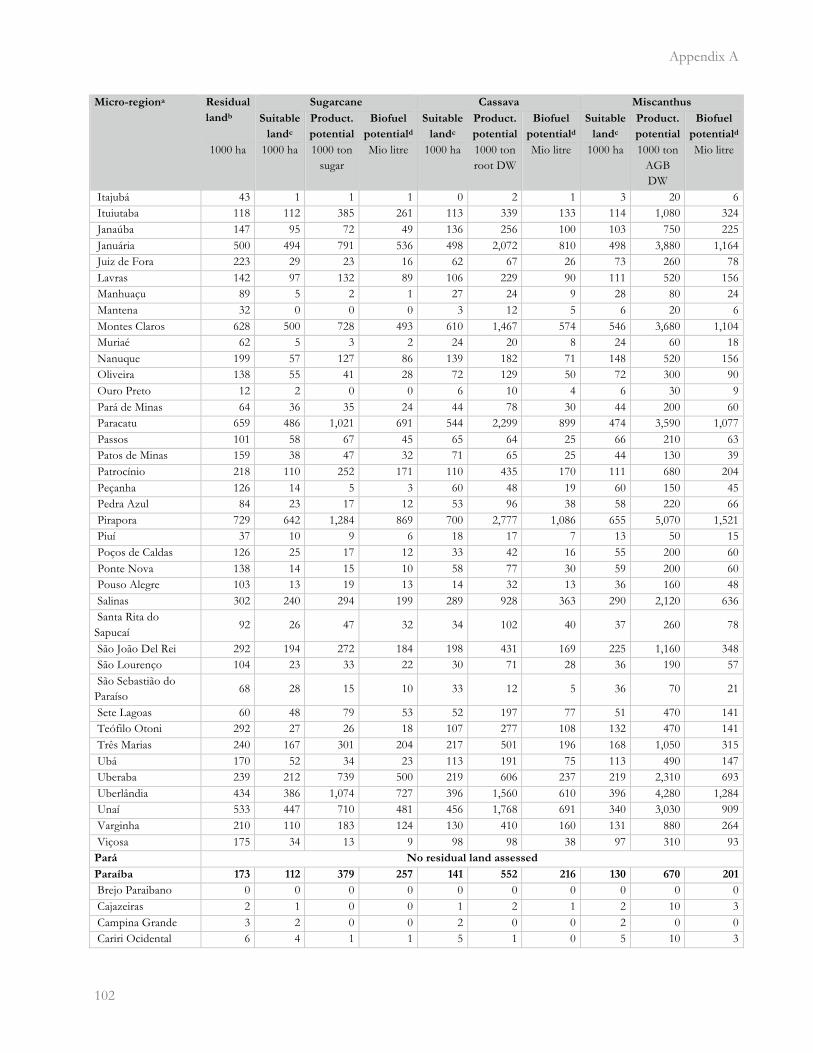
Appendix A
�102
Micro-regiona Residual
landb
Sugarcane Cassava Miscanthus
Suitable
landc
Product.
potential
Biofuel
potentiald
Suitable
landc
Product.
potential
Biofuel
potentiald
Suitable
landc
Product.
potential
Biofuel
potentiald
1000 ha 1000 ha 1000 ton sugar
Mio litre 1000 ha 1000 ton root DW
Mio litre 1000 ha 1000 ton AGB DW
Mio litre
Itajubá 43 1 1 1 0 2 1 3 20 6 Ituiutaba 118 112 385 261 113 339 133 114 1,080 324 Janaúba 147 95 72 49 136 256 100 103 750 225 Januária 500 494 791 536 498 2,072 810 498 3,880 1,164 Juiz de Fora 223 29 23 16 62 67 26 73 260 78 Lavras 142 97 132 89 106 229 90 111 520 156 Manhuaçu 89 5 2 1 27 24 9 28 80 24 Mantena 32 0 0 0 3 12 5 6 20 6 Montes Claros 628 500 728 493 610 1,467 574 546 3,680 1,104 Muriaé 62 5 3 2 24 20 8 24 60 18 Nanuque 199 57 127 86 139 182 71 148 520 156 Oliveira 138 55 41 28 72 129 50 72 300 90 Ouro Preto 12 2 0 0 6 10 4 6 30 9 Pará de Minas 64 36 35 24 44 78 30 44 200 60 Paracatu 659 486 1,021 691 544 2,299 899 474 3,590 1,077 Passos 101 58 67 45 65 64 25 66 210 63 Patos de Minas 159 38 47 32 71 65 25 44 130 39 Patrocínio 218 110 252 171 110 435 170 111 680 204 Peçanha 126 14 5 3 60 48 19 60 150 45 Pedra Azul 84 23 17 12 53 96 38 58 220 66 Pirapora 729 642 1,284 869 700 2,777 1,086 655 5,070 1,521 Piuí 37 10 9 6 18 17 7 13 50 15 Poços de Caldas 126 25 17 12 33 42 16 55 200 60 Ponte Nova 138 14 15 10 58 77 30 59 200 60 Pouso Alegre 103 13 19 13 14 32 13 36 160 48 Salinas 302 240 294 199 289 928 363 290 2,120 636 Santa Rita do Sapucaí
92 26 47 32 34 102 40 37 260 78
São João Del Rei 292 194 272 184 198 431 169 225 1,160 348 São Lourenço 104 23 33 22 30 71 28 36 190 57 São Sebastião do Paraíso
68 28 15 10 33 12 5 36 70 21
Sete Lagoas 60 48 79 53 52 197 77 51 470 141 Teófilo Otoni 292 27 26 18 107 277 108 132 470 141 Três Marias 240 167 301 204 217 501 196 168 1,050 315 Ubá 170 52 34 23 113 191 75 113 490 147 Uberaba 239 212 739 500 219 606 237 219 2,310 693 Uberlândia 434 386 1,074 727 396 1,560 610 396 4,280 1,284 Unaí 533 447 710 481 456 1,768 691 340 3,030 909 Varginha 210 110 183 124 130 410 160 131 880 264 Viçosa 175 34 13 9 98 98 38 97 310 93 Pará No residual land assessed
Paraíba 173 112 379 257 141 552 216 130 670 201
Brejo Paraibano 0 0 0 0 0 0 0 0 0 0 Cajazeiras 2 1 0 0 1 2 1 2 10 3 Campina Grande 3 2 0 0 2 0 0 2 0 0 Cariri Ocidental 6 4 1 1 5 1 0 5 10 3

Brazilian residual land suitability for bioethanol feedstocks by micro-regions
� 103
Micro-regiona Residual
landb
Sugarcane Cassava Miscanthus
Suitable
landc
Product.
potential
Biofuel
potentiald
Suitable
landc
Product.
potential
Biofuel
potentiald
Suitable
landc
Product.
potential
Biofuel
potentiald
1000 ha 1000 ha 1000 ton sugar
Mio litre 1000 ha 1000 ton root DW
Mio litre 1000 ha 1000 ton AGB DW
Mio litre
Cariri Oriental 4 3 0 0 4 1 0 4 10 3 Catolé do Rocha 3 0 0 0 1 1 0 2 10 3 Curimataú Ocidental 17 10 1 1 16 2 1 16 20 6 Curimataú Oriental 1 1 0 0 1 0 0 1 0 0 Esperança 0 0 0 0 0 0 0 0 0 0 Guarabira 0 0 0 0 0 1 0 0 0 0 Itabaiana 3 3 12 8 2 21 8 2 40 12 Itaporanga 4 2 0 0 3 0 0 3 0 0 João Pessoa 31 25 147 100 26 180 70 19 140 42 Litoral Norte 27 23 73 49 25 111 43 22 140 42 Litoral Sul 18 10 46 31 11 72 28 8 60 18 Patos 3 0 0 0 2 1 0 2 0 0 Piancó 7 3 0 0 6 0 0 7 0 0 Sapé 23 21 97 66 22 154 60 19 190 57 Seridó Ocidental Paraibano
0 0 0 0 0 0 0 0 0 0
Seridó Oriental Paraibano
8 0 0 0 8 1 0 2 0 0
Serra do Teixeira 2 0 0 0 1 0 0 1 0 0 Sousa 8 1 0 0 1 2 1 7 10 3 Umbuzeiro 3 1 0 0 2 1 0 2 0 0 Paraná 1,306 765 1,673 1,133 445 806 315 1,143 10,550 3,165
Apucarana 11 6 8 5 9 9 4 9 60 18 Assaí 32 21 45 30 26 29 11 30 250 75 Astorga 0 0 0 0 0 0 0 0 0 0 Campo Mourão 27 18 47 32 20 37 14 20 230 69 Capanema 7 5 9 6 6 3 1 7 60 18 Cascavel 47 21 37 25 29 15 6 38 270 81 Cerro Azul 13 5 5 3 2 6 2 5 40 12 Cianorte 14 14 35 24 13 62 24 12 150 45 Cornélio Procópio 15 13 51 35 13 18 7 13 210 63 Curitiba 114 32 53 36 3 3 1 105 1,220 366 Faxinal 4 2 3 2 4 3 1 4 30 9 Floraí 2 1 4 3 2 2 1 2 20 6 Foz do Iguaçu 3 3 9 6 2 6 2 3 30 9 Francisco Beltrão 36 13 21 14 10 3 1 25 150 45 Goioerê 11 8 18 12 8 19 7 8 110 33 Guarapuava 83 30 48 32 2 1 0 65 490 147 Ibaiti 48 27 54 37 43 46 18 45 180 54 Irati 37 28 42 28 0 0 0 36 330 99 Ivaiporã 24 14 28 19 18 22 9 19 160 48 Jacarezinho 4 2 20 14 3 7 3 3 50 15 Jaguariaíva 76 50 104 70 27 44 17 72 600 180 Lapa 58 44 76 51 0 0 0 51 750 225 Londrina 6 5 8 5 6 6 2 6 50 15 Maringá 26 21 66 45 23 30 12 23 210 63 Palmas 37 3 5 3 0 0 0 35 480 144
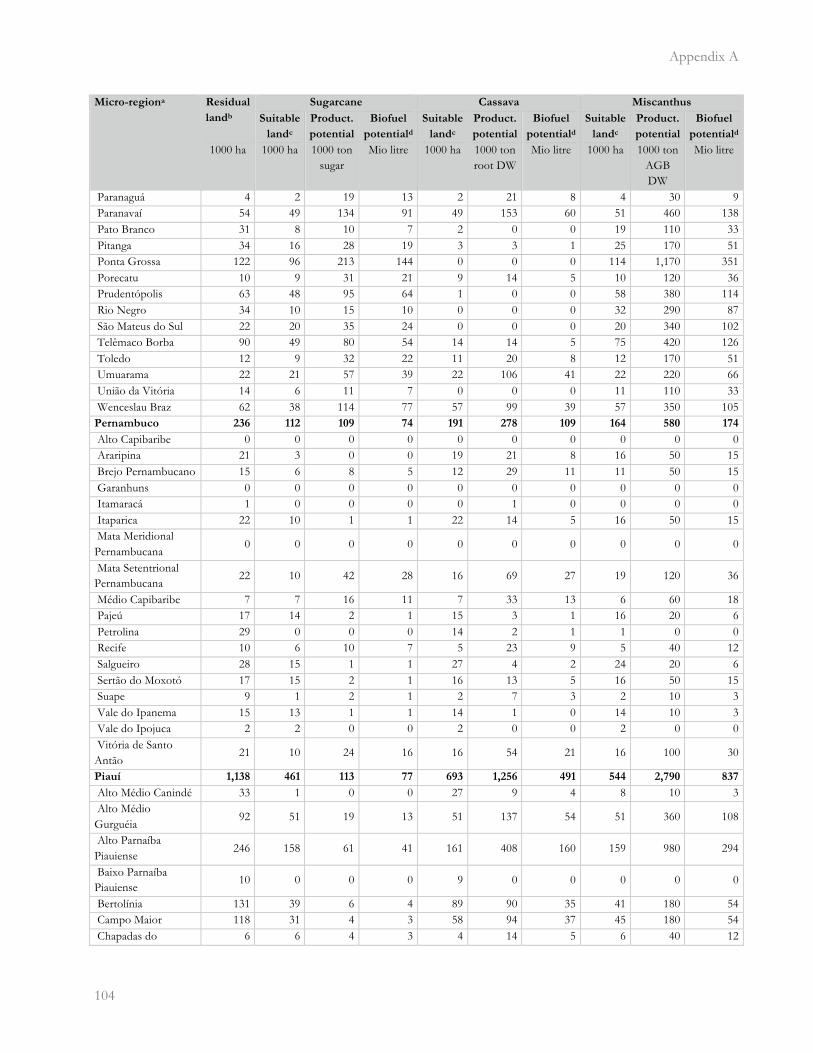
Appendix A
�104
Micro-regiona Residual
landb
Sugarcane Cassava Miscanthus
Suitable
landc
Product.
potential
Biofuel
potentiald
Suitable
landc
Product.
potential
Biofuel
potentiald
Suitable
landc
Product.
potential
Biofuel
potentiald
1000 ha 1000 ha 1000 ton sugar
Mio litre 1000 ha 1000 ton root DW
Mio litre 1000 ha 1000 ton AGB DW
Mio litre
Paranaguá 4 2 19 13 2 21 8 4 30 9 Paranavaí 54 49 134 91 49 153 60 51 460 138 Pato Branco 31 8 10 7 2 0 0 19 110 33 Pitanga 34 16 28 19 3 3 1 25 170 51 Ponta Grossa 122 96 213 144 0 0 0 114 1,170 351 Porecatu 10 9 31 21 9 14 5 10 120 36 Prudentópolis 63 48 95 64 1 0 0 58 380 114 Rio Negro 34 10 15 10 0 0 0 32 290 87 São Mateus do Sul 22 20 35 24 0 0 0 20 340 102 Telêmaco Borba 90 49 80 54 14 14 5 75 420 126 Toledo 12 9 32 22 11 20 8 12 170 51 Umuarama 22 21 57 39 22 106 41 22 220 66 União da Vitória 14 6 11 7 0 0 0 11 110 33 Wenceslau Braz 62 38 114 77 57 99 39 57 350 105 Pernambuco 236 112 109 74 191 278 109 164 580 174
Alto Capibaribe 0 0 0 0 0 0 0 0 0 0 Araripina 21 3 0 0 19 21 8 16 50 15 Brejo Pernambucano 15 6 8 5 12 29 11 11 50 15 Garanhuns 0 0 0 0 0 0 0 0 0 0 Itamaracá 1 0 0 0 0 1 0 0 0 0 Itaparica 22 10 1 1 22 14 5 16 50 15 Mata Meridional Pernambucana
0 0 0 0 0 0 0 0 0 0
Mata Setentrional Pernambucana
22 10 42 28 16 69 27 19 120 36
Médio Capibaribe 7 7 16 11 7 33 13 6 60 18 Pajeú 17 14 2 1 15 3 1 16 20 6 Petrolina 29 0 0 0 14 2 1 1 0 0 Recife 10 6 10 7 5 23 9 5 40 12 Salgueiro 28 15 1 1 27 4 2 24 20 6 Sertão do Moxotó 17 15 2 1 16 13 5 16 50 15 Suape 9 1 2 1 2 7 3 2 10 3 Vale do Ipanema 15 13 1 1 14 1 0 14 10 3 Vale do Ipojuca 2 2 0 0 2 0 0 2 0 0 Vitória de Santo Antão
21 10 24 16 16 54 21 16 100 30
Piauí 1,138 461 113 77 693 1,256 491 544 2,790 837
Alto Médio Canindé 33 1 0 0 27 9 4 8 10 3 Alto Médio Gurguéia
92 51 19 13 51 137 54 51 360 108
Alto Parnaíba Piauiense
246 158 61 41 161 408 160 159 980 294
Baixo Parnaíba Piauiense
10 0 0 0 9 0 0 0 0 0
Bertolínia 131 39 6 4 89 90 35 41 180 54 Campo Maior 118 31 4 3 58 94 37 45 180 54 Chapadas do 6 6 4 3 4 14 5 6 40 12
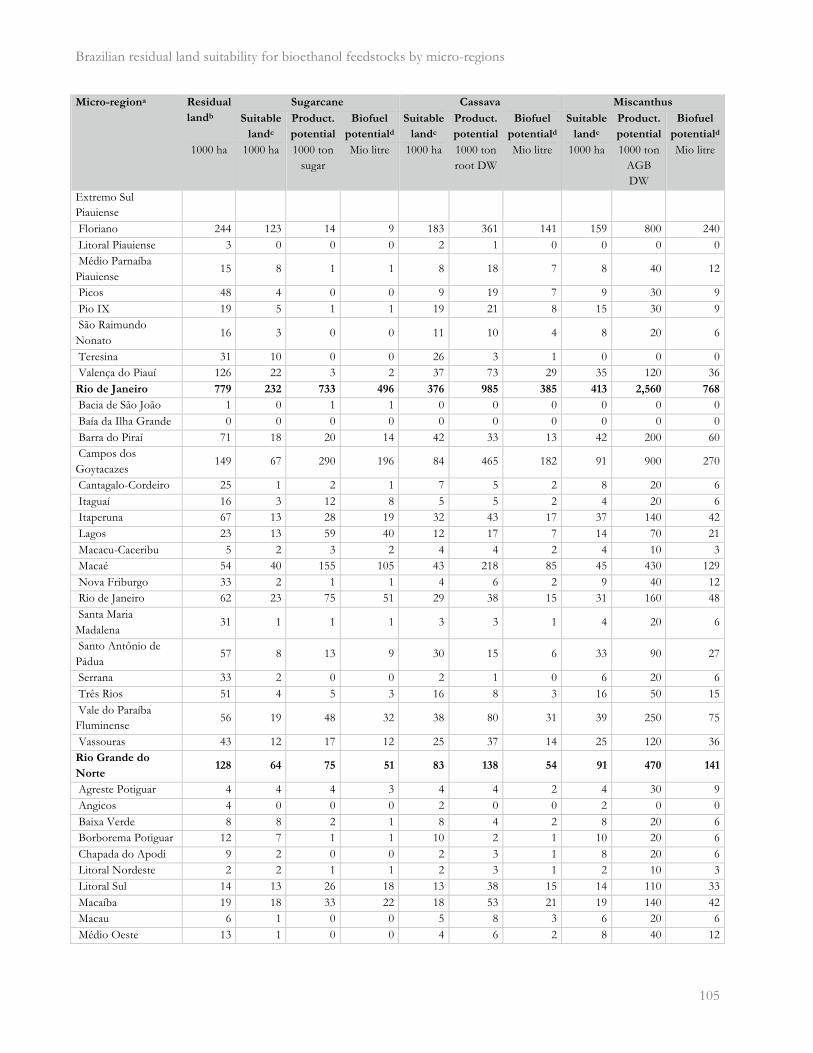
Brazilian residual land suitability for bioethanol feedstocks by micro-regions
� 105
Micro-regiona Residual
landb
Sugarcane Cassava Miscanthus
Suitable
landc
Product.
potential
Biofuel
potentiald
Suitable
landc
Product.
potential
Biofuel
potentiald
Suitable
landc
Product.
potential
Biofuel
potentiald
1000 ha 1000 ha 1000 ton sugar
Mio litre 1000 ha 1000 ton root DW
Mio litre 1000 ha 1000 ton AGB DW
Mio litre
Extremo Sul Piauiense Floriano 244 123 14 9 183 361 141 159 800 240 Litoral Piauiense 3 0 0 0 2 1 0 0 0 0 Médio Parnaíba Piauiense
15 8 1 1 8 18 7 8 40 12
Picos 48 4 0 0 9 19 7 9 30 9 Pio IX 19 5 1 1 19 21 8 15 30 9 São Raimundo Nonato
16 3 0 0 11 10 4 8 20 6
Teresina 31 10 0 0 26 3 1 0 0 0 Valença do Piauí 126 22 3 2 37 73 29 35 120 36 Rio de Janeiro 779 232 733 496 376 985 385 413 2,560 768
Bacia de São João 1 0 1 1 0 0 0 0 0 0 Baía da Ilha Grande 0 0 0 0 0 0 0 0 0 0 Barra do Piraí 71 18 20 14 42 33 13 42 200 60 Campos dos Goytacazes
149 67 290 196 84 465 182 91 900 270
Cantagalo-Cordeiro 25 1 2 1 7 5 2 8 20 6 Itaguaí 16 3 12 8 5 5 2 4 20 6 Itaperuna 67 13 28 19 32 43 17 37 140 42 Lagos 23 13 59 40 12 17 7 14 70 21 Macacu-Caceribu 5 2 3 2 4 4 2 4 10 3 Macaé 54 40 155 105 43 218 85 45 430 129 Nova Friburgo 33 2 1 1 4 6 2 9 40 12 Rio de Janeiro 62 23 75 51 29 38 15 31 160 48 Santa Maria Madalena
31 1 1 1 3 3 1 4 20 6
Santo Antônio de Pádua
57 8 13 9 30 15 6 33 90 27
Serrana 33 2 0 0 2 1 0 6 20 6 Três Rios 51 4 5 3 16 8 3 16 50 15 Vale do Paraíba Fluminense
56 19 48 32 38 80 31 39 250 75
Vassouras 43 12 17 12 25 37 14 25 120 36 Rio Grande do
Norte 128 64 75 51 83 138 54 91 470 141
Agreste Potiguar 4 4 4 3 4 4 2 4 30 9 Angicos 4 0 0 0 2 0 0 2 0 0 Baixa Verde 8 8 2 1 8 4 2 8 20 6 Borborema Potiguar 12 7 1 1 10 2 1 10 20 6 Chapada do Apodi 9 2 0 0 2 3 1 8 20 6 Litoral Nordeste 2 2 1 1 2 3 1 2 10 3 Litoral Sul 14 13 26 18 13 38 15 14 110 33 Macaíba 19 18 33 22 18 53 21 19 140 42 Macau 6 1 0 0 5 8 3 6 20 6 Médio Oeste 13 1 0 0 4 6 2 8 40 12
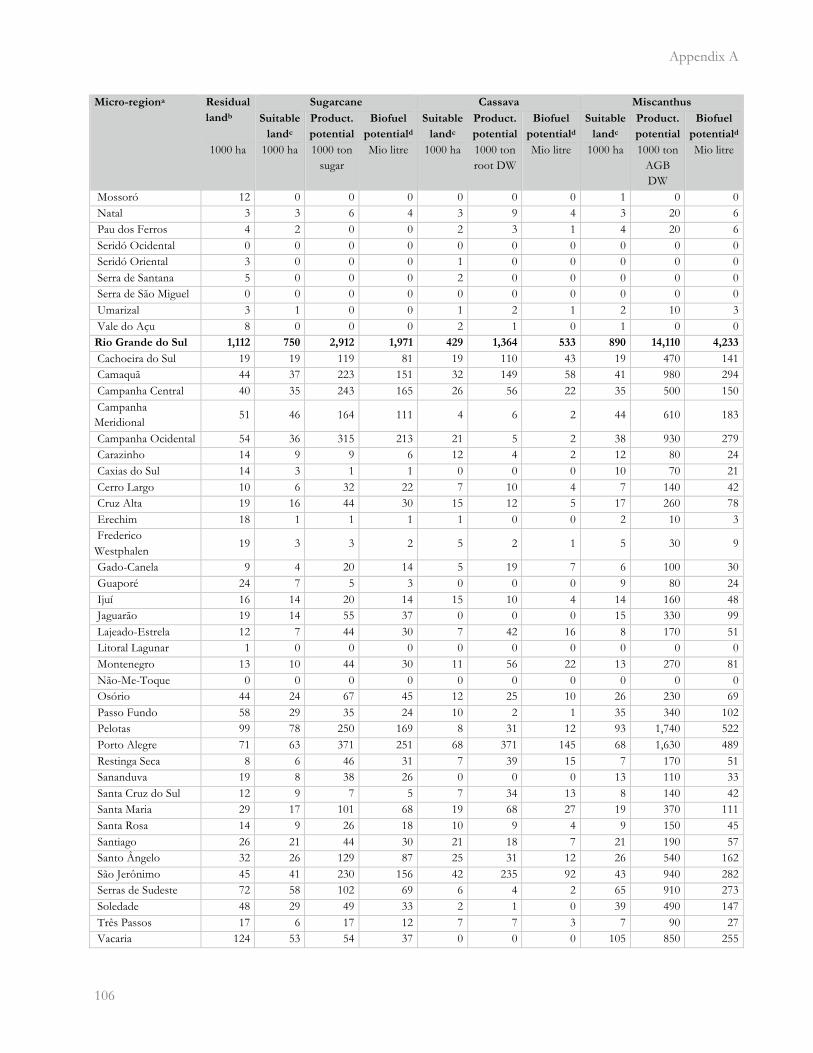
Appendix A
�106
Micro-regiona Residual
landb
Sugarcane Cassava Miscanthus
Suitable
landc
Product.
potential
Biofuel
potentiald
Suitable
landc
Product.
potential
Biofuel
potentiald
Suitable
landc
Product.
potential
Biofuel
potentiald
1000 ha 1000 ha 1000 ton sugar
Mio litre 1000 ha 1000 ton root DW
Mio litre 1000 ha 1000 ton AGB DW
Mio litre
Mossoró 12 0 0 0 0 0 0 1 0 0 Natal 3 3 6 4 3 9 4 3 20 6 Pau dos Ferros 4 2 0 0 2 3 1 4 20 6 Seridó Ocidental 0 0 0 0 0 0 0 0 0 0 Seridó Oriental 3 0 0 0 1 0 0 0 0 0 Serra de Santana 5 0 0 0 2 0 0 0 0 0 Serra de São Miguel 0 0 0 0 0 0 0 0 0 0 Umarizal 3 1 0 0 1 2 1 2 10 3 Vale do Açu 8 0 0 0 2 1 0 1 0 0 Rio Grande do Sul 1,112 750 2,912 1,971 429 1,364 533 890 14,110 4,233
Cachoeira do Sul 19 19 119 81 19 110 43 19 470 141 Camaquã 44 37 223 151 32 149 58 41 980 294 Campanha Central 40 35 243 165 26 56 22 35 500 150 Campanha Meridional
51 46 164 111 4 6 2 44 610 183
Campanha Ocidental 54 36 315 213 21 5 2 38 930 279 Carazinho 14 9 9 6 12 4 2 12 80 24 Caxias do Sul 14 3 1 1 0 0 0 10 70 21 Cerro Largo 10 6 32 22 7 10 4 7 140 42 Cruz Alta 19 16 44 30 15 12 5 17 260 78 Erechim 18 1 1 1 1 0 0 2 10 3 Frederico Westphalen
19 3 3 2 5 2 1 5 30 9
Gado-Canela 9 4 20 14 5 19 7 6 100 30 Guaporé 24 7 5 3 0 0 0 9 80 24 Ijuí 16 14 20 14 15 10 4 14 160 48 Jaguarão 19 14 55 37 0 0 0 15 330 99 Lajeado-Estrela 12 7 44 30 7 42 16 8 170 51 Litoral Lagunar 1 0 0 0 0 0 0 0 0 0 Montenegro 13 10 44 30 11 56 22 13 270 81 Não-Me-Toque 0 0 0 0 0 0 0 0 0 0 Osório 44 24 67 45 12 25 10 26 230 69 Passo Fundo 58 29 35 24 10 2 1 35 340 102 Pelotas 99 78 250 169 8 31 12 93 1,740 522 Porto Alegre 71 63 371 251 68 371 145 68 1,630 489 Restinga Seca 8 6 46 31 7 39 15 7 170 51 Sananduva 19 8 38 26 0 0 0 13 110 33 Santa Cruz do Sul 12 9 7 5 7 34 13 8 140 42 Santa Maria 29 17 101 68 19 68 27 19 370 111 Santa Rosa 14 9 26 18 10 9 4 9 150 45 Santiago 26 21 44 30 21 18 7 21 190 57 Santo Ângelo 32 26 129 87 25 31 12 26 540 162 São Jerônimo 45 41 230 156 42 235 92 43 940 282 Serras de Sudeste 72 58 102 69 6 4 2 65 910 273 Soledade 48 29 49 33 2 1 0 39 490 147 Três Passos 17 6 17 12 7 7 3 7 90 27 Vacaria 124 53 54 37 0 0 0 105 850 255
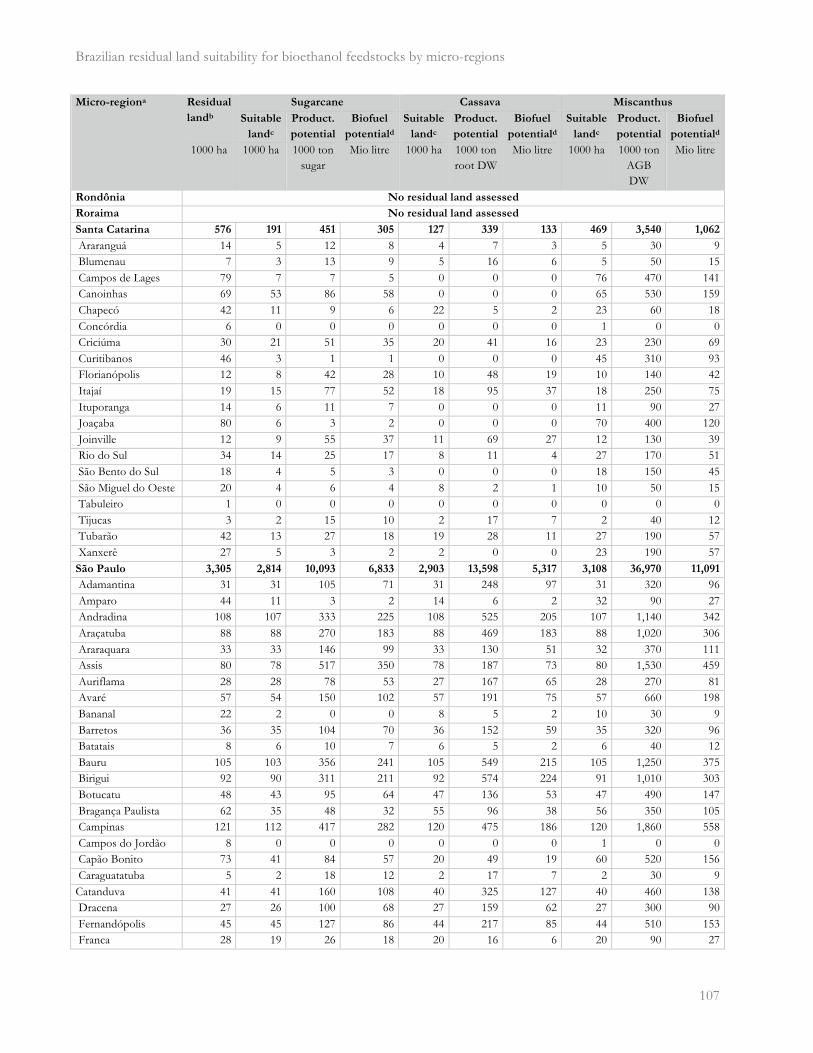
Brazilian residual land suitability for bioethanol feedstocks by micro-regions
� 107
Micro-regiona Residual
landb
Sugarcane Cassava Miscanthus
Suitable
landc
Product.
potential
Biofuel
potentiald
Suitable
landc
Product.
potential
Biofuel
potentiald
Suitable
landc
Product.
potential
Biofuel
potentiald
1000 ha 1000 ha 1000 ton sugar
Mio litre 1000 ha 1000 ton root DW
Mio litre 1000 ha 1000 ton AGB DW
Mio litre
Rondônia No residual land assessed
Roraima No residual land assessed
Santa Catarina 576 191 451 305 127 339 133 469 3,540 1,062
Araranguá 14 5 12 8 4 7 3 5 30 9 Blumenau 7 3 13 9 5 16 6 5 50 15 Campos de Lages 79 7 7 5 0 0 0 76 470 141 Canoinhas 69 53 86 58 0 0 0 65 530 159 Chapecó 42 11 9 6 22 5 2 23 60 18 Concórdia 6 0 0 0 0 0 0 1 0 0 Criciúma 30 21 51 35 20 41 16 23 230 69 Curitibanos 46 3 1 1 0 0 0 45 310 93 Florianópolis 12 8 42 28 10 48 19 10 140 42 Itajaí 19 15 77 52 18 95 37 18 250 75 Ituporanga 14 6 11 7 0 0 0 11 90 27 Joaçaba 80 6 3 2 0 0 0 70 400 120 Joinville 12 9 55 37 11 69 27 12 130 39 Rio do Sul 34 14 25 17 8 11 4 27 170 51 São Bento do Sul 18 4 5 3 0 0 0 18 150 45 São Miguel do Oeste 20 4 6 4 8 2 1 10 50 15 Tabuleiro 1 0 0 0 0 0 0 0 0 0 Tijucas 3 2 15 10 2 17 7 2 40 12 Tubarão 42 13 27 18 19 28 11 27 190 57 Xanxerê 27 5 3 2 2 0 0 23 190 57 São Paulo 3,305 2,814 10,093 6,833 2,903 13,598 5,317 3,108 36,970 11,091
Adamantina 31 31 105 71 31 248 97 31 320 96 Amparo 44 11 3 2 14 6 2 32 90 27 Andradina 108 107 333 225 108 525 205 107 1,140 342 Araçatuba 88 88 270 183 88 469 183 88 1,020 306 Araraquara 33 33 146 99 33 130 51 32 370 111 Assis 80 78 517 350 78 187 73 80 1,530 459 Auriflama 28 28 78 53 27 167 65 28 270 81 Avaré 57 54 150 102 57 191 75 57 660 198 Bananal 22 2 0 0 8 5 2 10 30 9 Barretos 36 35 104 70 36 152 59 35 320 96 Batatais 8 6 10 7 6 5 2 6 40 12 Bauru 105 103 356 241 105 549 215 105 1,250 375 Birigui 92 90 311 211 92 574 224 91 1,010 303 Botucatu 48 43 95 64 47 136 53 47 490 147 Bragança Paulista 62 35 48 32 55 96 38 56 350 105 Campinas 121 112 417 282 120 475 186 120 1,860 558 Campos do Jordão 8 0 0 0 0 0 0 1 0 0 Capão Bonito 73 41 84 57 20 49 19 60 520 156 Caraguatatuba 5 2 18 12 2 17 7 2 30 9 Catanduva 41 41 160 108 40 325 127 40 460 138 Dracena 27 26 100 68 27 159 62 27 300 90 Fernandópolis 45 45 127 86 44 217 85 44 510 153 Franca 28 19 26 18 20 16 6 20 90 27
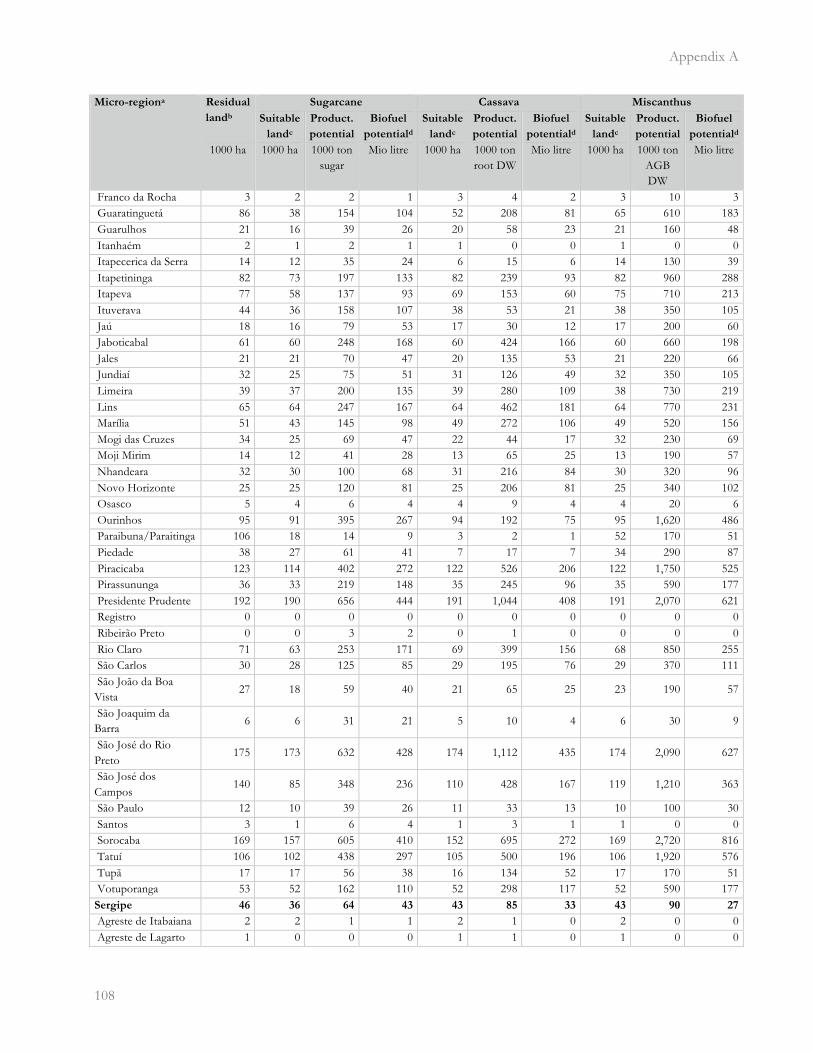
Appendix A
�108
Micro-regiona Residual
landb
Sugarcane Cassava Miscanthus
Suitable
landc
Product.
potential
Biofuel
potentiald
Suitable
landc
Product.
potential
Biofuel
potentiald
Suitable
landc
Product.
potential
Biofuel
potentiald
1000 ha 1000 ha 1000 ton sugar
Mio litre 1000 ha 1000 ton root DW
Mio litre 1000 ha 1000 ton AGB DW
Mio litre
Franco da Rocha 3 2 2 1 3 4 2 3 10 3 Guaratinguetá 86 38 154 104 52 208 81 65 610 183 Guarulhos 21 16 39 26 20 58 23 21 160 48 Itanhaém 2 1 2 1 1 0 0 1 0 0 Itapecerica da Serra 14 12 35 24 6 15 6 14 130 39 Itapetininga 82 73 197 133 82 239 93 82 960 288 Itapeva 77 58 137 93 69 153 60 75 710 213 Ituverava 44 36 158 107 38 53 21 38 350 105 Jaú 18 16 79 53 17 30 12 17 200 60 Jaboticabal 61 60 248 168 60 424 166 60 660 198 Jales 21 21 70 47 20 135 53 21 220 66 Jundiaí 32 25 75 51 31 126 49 32 350 105 Limeira 39 37 200 135 39 280 109 38 730 219 Lins 65 64 247 167 64 462 181 64 770 231 Marília 51 43 145 98 49 272 106 49 520 156 Mogi das Cruzes 34 25 69 47 22 44 17 32 230 69 Moji Mirim 14 12 41 28 13 65 25 13 190 57 Nhandeara 32 30 100 68 31 216 84 30 320 96 Novo Horizonte 25 25 120 81 25 206 81 25 340 102 Osasco 5 4 6 4 4 9 4 4 20 6 Ourinhos 95 91 395 267 94 192 75 95 1,620 486 Paraibuna/Paraitinga 106 18 14 9 3 2 1 52 170 51 Piedade 38 27 61 41 7 17 7 34 290 87 Piracicaba 123 114 402 272 122 526 206 122 1,750 525 Pirassununga 36 33 219 148 35 245 96 35 590 177 Presidente Prudente 192 190 656 444 191 1,044 408 191 2,070 621 Registro 0 0 0 0 0 0 0 0 0 0 Ribeirão Preto 0 0 3 2 0 1 0 0 0 0 Rio Claro 71 63 253 171 69 399 156 68 850 255 São Carlos 30 28 125 85 29 195 76 29 370 111 São João da Boa Vista
27 18 59 40 21 65 25 23 190 57
São Joaquim da Barra
6 6 31 21 5 10 4 6 30 9
São José do Rio Preto
175 173 632 428 174 1,112 435 174 2,090 627
São José dos Campos
140 85 348 236 110 428 167 119 1,210 363
São Paulo 12 10 39 26 11 33 13 10 100 30 Santos 3 1 6 4 1 3 1 1 0 0 Sorocaba 169 157 605 410 152 695 272 169 2,720 816 Tatuí 106 102 438 297 105 500 196 106 1,920 576 Tupã 17 17 56 38 16 134 52 17 170 51 Votuporanga 53 52 162 110 52 298 117 52 590 177 Sergipe 46 36 64 43 43 85 33 43 90 27
Agreste de Itabaiana 2 2 1 1 2 1 0 2 0 0 Agreste de Lagarto 1 0 0 0 1 1 0 1 0 0
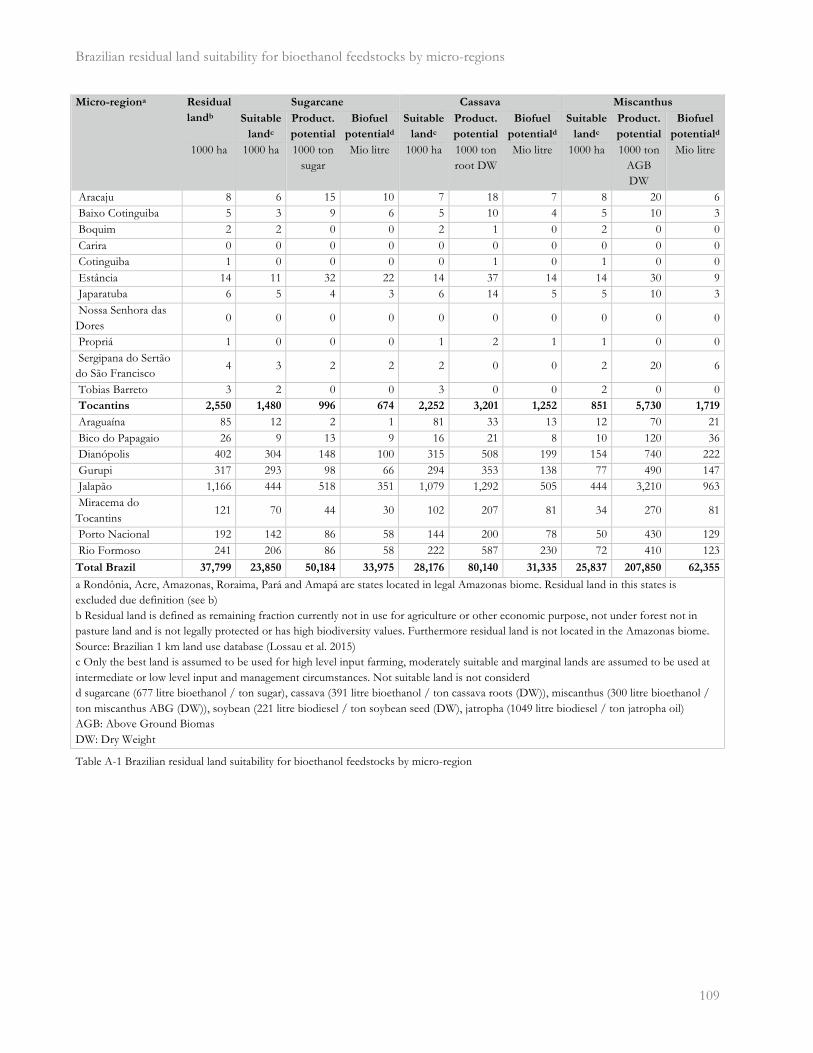
Brazilian residual land suitability for bioethanol feedstocks by micro-regions
� 109
Micro-regiona Residual
landb
Sugarcane Cassava Miscanthus
Suitable
landc
Product.
potential
Biofuel
potentiald
Suitable
landc
Product.
potential
Biofuel
potentiald
Suitable
landc
Product.
potential
Biofuel
potentiald
1000 ha 1000 ha 1000 ton sugar
Mio litre 1000 ha 1000 ton root DW
Mio litre 1000 ha 1000 ton AGB DW
Mio litre
Aracaju 8 6 15 10 7 18 7 8 20 6 Baixo Cotinguiba 5 3 9 6 5 10 4 5 10 3 Boquim 2 2 0 0 2 1 0 2 0 0 Carira 0 0 0 0 0 0 0 0 0 0 Cotinguiba 1 0 0 0 0 1 0 1 0 0 Estância 14 11 32 22 14 37 14 14 30 9 Japaratuba 6 5 4 3 6 14 5 5 10 3 Nossa Senhora das Dores
0 0 0 0 0 0 0 0 0 0
Propriá 1 0 0 0 1 2 1 1 0 0 Sergipana do Sertão do São Francisco
4 3 2 2 2 0 0 2 20 6
Tobias Barreto 3 2 0 0 3 0 0 2 0 0 Tocantins 2,550 1,480 996 674 2,252 3,201 1,252 851 5,730 1,719
Araguaína 85 12 2 1 81 33 13 12 70 21 Bico do Papagaio 26 9 13 9 16 21 8 10 120 36 Dianópolis 402 304 148 100 315 508 199 154 740 222 Gurupi 317 293 98 66 294 353 138 77 490 147 Jalapão 1,166 444 518 351 1,079 1,292 505 444 3,210 963 Miracema do Tocantins
121 70 44 30 102 207 81 34 270 81
Porto Nacional 192 142 86 58 144 200 78 50 430 129 Rio Formoso 241 206 86 58 222 587 230 72 410 123 Total Brazil 37,799 23,850 50,184 33,975 28,176 80,140 31,335 25,837 207,850 62,355
a Rondônia, Acre, Amazonas, Roraima, Pará and Amapá are states located in legal Amazonas biome. Residual land in this states is excluded due definition (see b) b Residual land is defined as remaining fraction currently not in use for agriculture or other economic purpose, not under forest not in pasture land and is not legally protected or has high biodiversity values. Furthermore residual land is not located in the Amazonas biome. Source: Brazilian 1 km land use database (Lossau et al. 2015) c Only the best land is assumed to be used for high level input farming, moderately suitable and marginal lands are assumed to be used at intermediate or low level input and management circumstances. Not suitable land is not considerd d sugarcane (677 litre bioethanol / ton sugar), cassava (391 litre bioethanol / ton cassava roots (DW)), miscanthus (300 litre bioethanol / ton miscanthus ABG (DW)), soybean (221 litre biodiesel / ton soybean seed (DW), jatropha (1049 litre biodiesel / ton jatropha oil) AGB: Above Ground Biomas DW: Dry Weight
Table A-1 Brazilian residual land suitability for bioethanol feedstocks by micro-region

Appendix B
�110
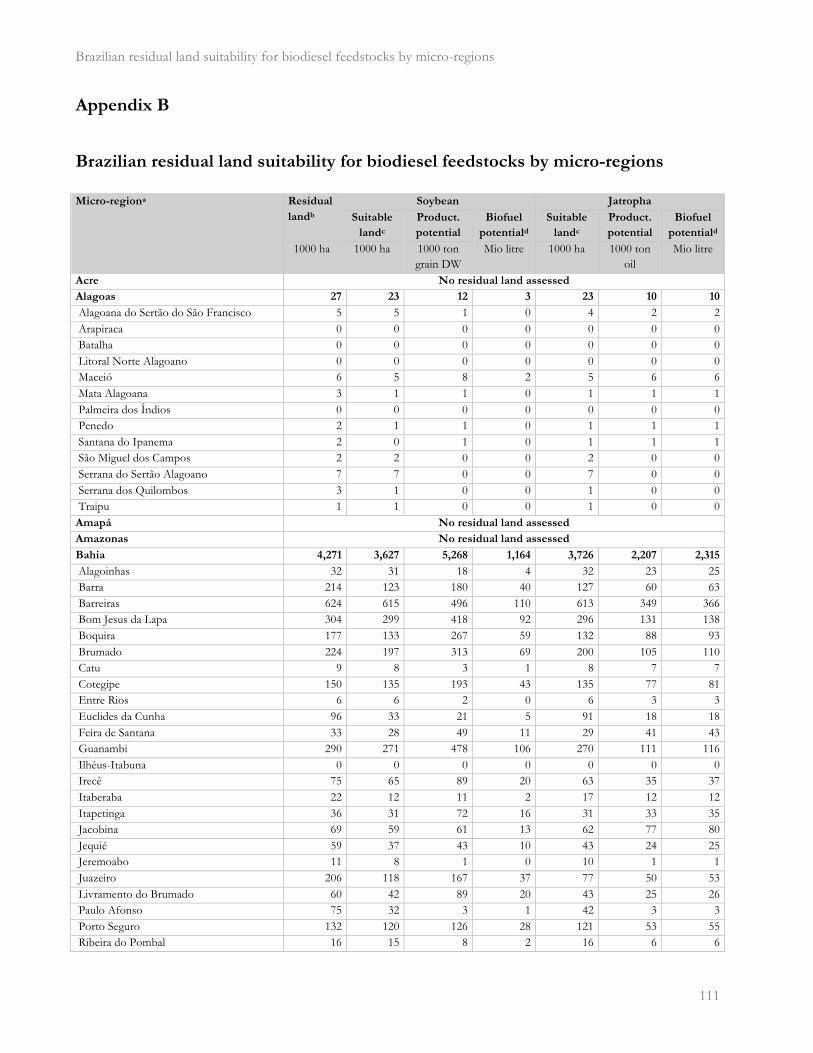
Brazilian residual land suitability for biodiesel feedstocks by micro-regions
� 111
Appendix B
Brazilian residual land suitability for biodiesel feedstocks by micro-regions
�
Micro-regiona Residual
landb
Soybean Jatropha
Suitable
landc
Product.
potential
Biofuel
potentiald
Suitable
landc
Product.
potential
Biofuel
potentiald
1000 ha 1000 ha 1000 ton grain DW
Mio litre 1000 ha 1000 ton oil
Mio litre
Acre No residual land assessed
Alagoas 27 23 12 3 23 10 10
Alagoana do Sertão do São Francisco 5 5 1 0 4 2 2 Arapiraca 0 0 0 0 0 0 0 Batalha 0 0 0 0 0 0 0 Litoral Norte Alagoano 0 0 0 0 0 0 0 Maceió 6 5 8 2 5 6 6 Mata Alagoana 3 1 1 0 1 1 1 Palmeira dos Índios 0 0 0 0 0 0 0 Penedo 2 1 1 0 1 1 1 Santana do Ipanema 2 0 1 0 1 1 1 São Miguel dos Campos 2 2 0 0 2 0 0 Serrana do Sertão Alagoano 7 7 0 0 7 0 0 Serrana dos Quilombos 3 1 0 0 1 0 0 Traipu 1 1 0 0 1 0 0 Amapá No residual land assessed
Amazonas No residual land assessed
Bahia 4,271 3,627 5,268 1,164 3,726 2,207 2,315
Alagoinhas 32 31 18 4 32 23 25 Barra 214 123 180 40 127 60 63 Barreiras 624 615 496 110 613 349 366 Bom Jesus da Lapa 304 299 418 92 296 131 138 Boquira 177 133 267 59 132 88 93 Brumado 224 197 313 69 200 105 110 Catu 9 8 3 1 8 7 7 Cotegipe 150 135 193 43 135 77 81 Entre Rios 6 6 2 0 6 3 3 Euclides da Cunha 96 33 21 5 91 18 18 Feira de Santana 33 28 49 11 29 41 43 Guanambi 290 271 478 106 270 111 116 Ilhéus-Itabuna 0 0 0 0 0 0 0 Irecê 75 65 89 20 63 35 37 Itaberaba 22 12 11 2 17 12 12 Itapetinga 36 31 72 16 31 33 35 Jacobina 69 59 61 13 62 77 80 Jequié 59 37 43 10 43 24 25 Jeremoabo 11 8 1 0 10 1 1 Juazeiro 206 118 167 37 77 50 53 Livramento do Brumado 60 42 89 20 43 25 26 Paulo Afonso 75 32 3 1 42 3 3 Porto Seguro 132 120 126 28 121 53 55 Ribeira do Pombal 16 15 8 2 16 6 6
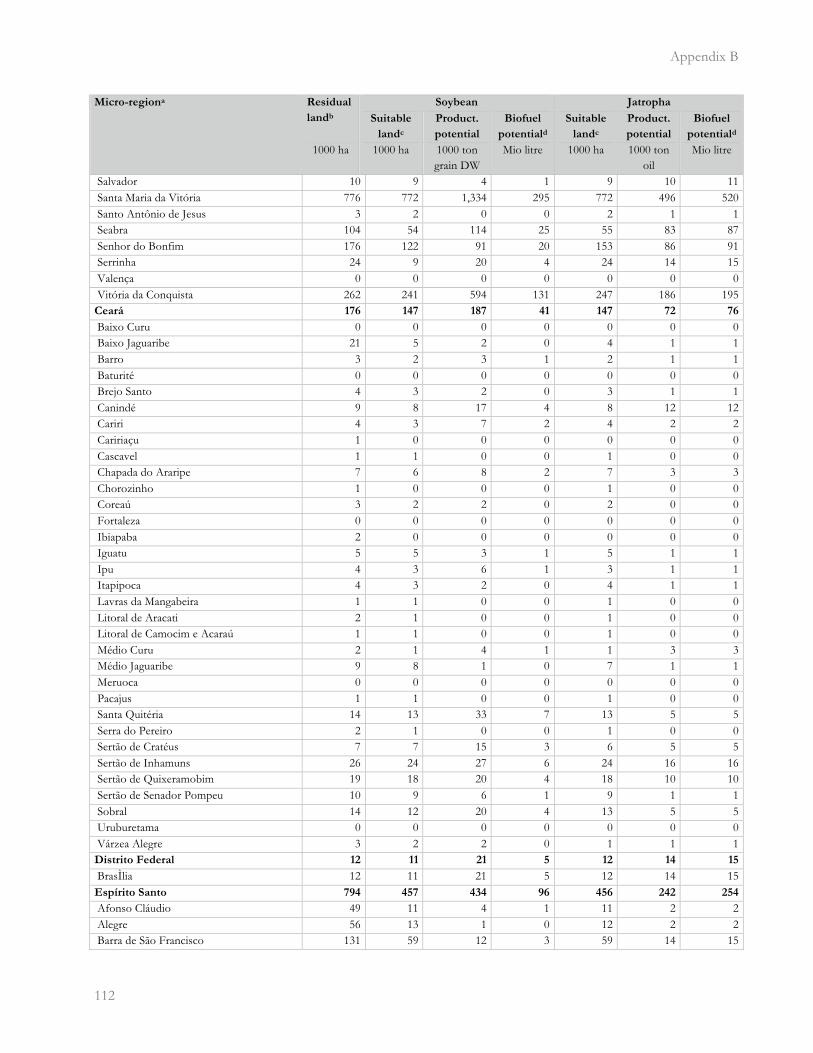
Appendix B
�112
Micro-regiona Residual
landb
Soybean Jatropha
Suitable
landc
Product.
potential
Biofuel
potentiald
Suitable
landc
Product.
potential
Biofuel
potentiald
1000 ha 1000 ha 1000 ton grain DW
Mio litre 1000 ha 1000 ton oil
Mio litre
Salvador 10 9 4 1 9 10 11 Santa Maria da Vitória 776 772 1,334 295 772 496 520 Santo Antônio de Jesus 3 2 0 0 2 1 1 Seabra 104 54 114 25 55 83 87 Senhor do Bonfim 176 122 91 20 153 86 91 Serrinha 24 9 20 4 24 14 15 Valença 0 0 0 0 0 0 0 Vitória da Conquista 262 241 594 131 247 186 195 Ceará 176 147 187 41 147 72 76
Baixo Curu 0 0 0 0 0 0 0 Baixo Jaguaribe 21 5 2 0 4 1 1 Barro 3 2 3 1 2 1 1 Baturité 0 0 0 0 0 0 0 Brejo Santo 4 3 2 0 3 1 1 Canindé 9 8 17 4 8 12 12 Cariri 4 3 7 2 4 2 2 Caririaçu 1 0 0 0 0 0 0 Cascavel 1 1 0 0 1 0 0 Chapada do Araripe 7 6 8 2 7 3 3 Chorozinho 1 0 0 0 1 0 0 Coreaú 3 2 2 0 2 0 0 Fortaleza 0 0 0 0 0 0 0 Ibiapaba 2 0 0 0 0 0 0 Iguatu 5 5 3 1 5 1 1 Ipu 4 3 6 1 3 1 1 Itapipoca 4 3 2 0 4 1 1 Lavras da Mangabeira 1 1 0 0 1 0 0 Litoral de Aracati 2 1 0 0 1 0 0 Litoral de Camocim e Acaraú 1 1 0 0 1 0 0 Médio Curu 2 1 4 1 1 3 3 Médio Jaguaribe 9 8 1 0 7 1 1 Meruoca 0 0 0 0 0 0 0 Pacajus 1 1 0 0 1 0 0 Santa Quitéria 14 13 33 7 13 5 5 Serra do Pereiro 2 1 0 0 1 0 0 Sertão de Cratéus 7 7 15 3 6 5 5 Sertão de Inhamuns 26 24 27 6 24 16 16 Sertão de Quixeramobim 19 18 20 4 18 10 10 Sertão de Senador Pompeu 10 9 6 1 9 1 1 Sobral 14 12 20 4 13 5 5 Uruburetama 0 0 0 0 0 0 0 Várzea Alegre 3 2 2 0 1 1 1 Distrito Federal 12 11 21 5 12 14 15
BrasÌlia 12 11 21 5 12 14 15 Espírito Santo 794 457 434 96 456 242 254
Afonso Cláudio 49 11 4 1 11 2 2 Alegre 56 13 1 0 12 2 2 Barra de São Francisco 131 59 12 3 59 14 15
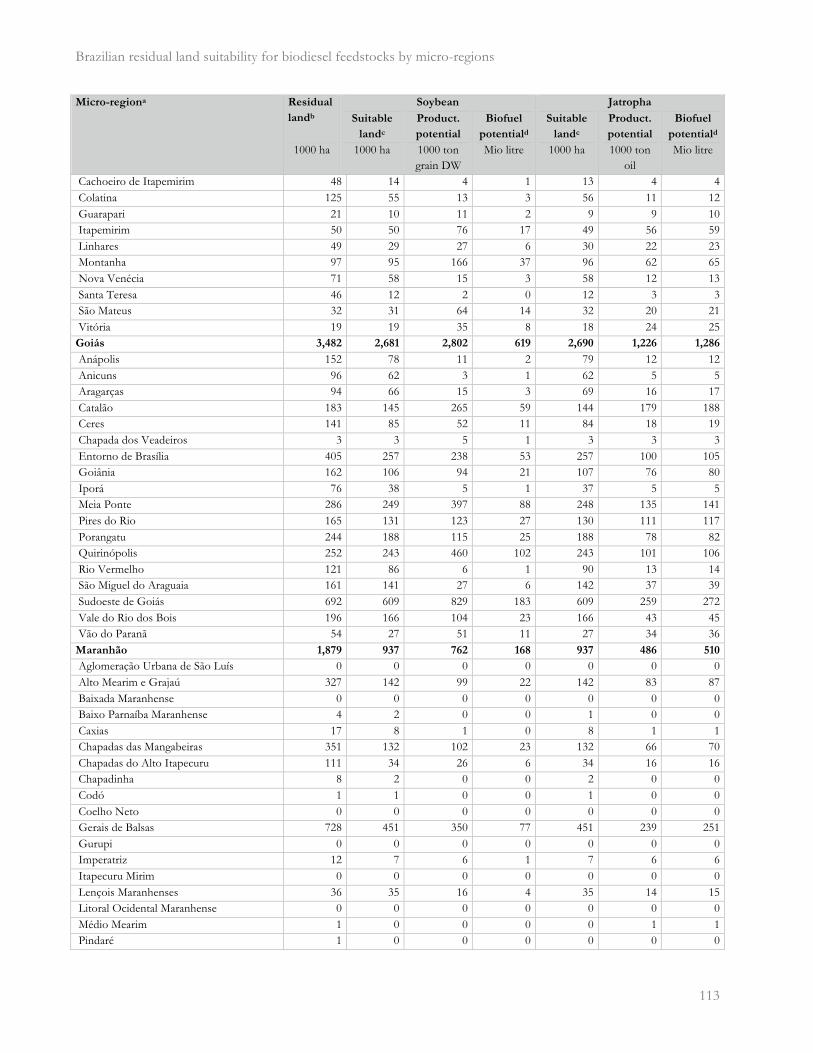
Brazilian residual land suitability for biodiesel feedstocks by micro-regions
� 113
Micro-regiona Residual
landb
Soybean Jatropha
Suitable
landc
Product.
potential
Biofuel
potentiald
Suitable
landc
Product.
potential
Biofuel
potentiald
1000 ha 1000 ha 1000 ton grain DW
Mio litre 1000 ha 1000 ton oil
Mio litre
Cachoeiro de Itapemirim 48 14 4 1 13 4 4 Colatina 125 55 13 3 56 11 12 Guarapari 21 10 11 2 9 9 10 Itapemirim 50 50 76 17 49 56 59 Linhares 49 29 27 6 30 22 23 Montanha 97 95 166 37 96 62 65 Nova Venécia 71 58 15 3 58 12 13 Santa Teresa 46 12 2 0 12 3 3 São Mateus 32 31 64 14 32 20 21 Vitória 19 19 35 8 18 24 25 Goiás 3,482 2,681 2,802 619 2,690 1,226 1,286
Anápolis 152 78 11 2 79 12 12 Anicuns 96 62 3 1 62 5 5 Aragarças 94 66 15 3 69 16 17 Catalão 183 145 265 59 144 179 188 Ceres 141 85 52 11 84 18 19 Chapada dos Veadeiros 3 3 5 1 3 3 3 Entorno de Brasília 405 257 238 53 257 100 105 Goiânia 162 106 94 21 107 76 80 Iporá 76 38 5 1 37 5 5 Meia Ponte 286 249 397 88 248 135 141 Pires do Rio 165 131 123 27 130 111 117 Porangatu 244 188 115 25 188 78 82 Quirinópolis 252 243 460 102 243 101 106 Rio Vermelho 121 86 6 1 90 13 14 São Miguel do Araguaia 161 141 27 6 142 37 39 Sudoeste de Goiás 692 609 829 183 609 259 272 Vale do Rio dos Bois 196 166 104 23 166 43 45 Vão do Paranã 54 27 51 11 27 34 36 Maranhão 1,879 937 762 168 937 486 510
Aglomeração Urbana de São Luís 0 0 0 0 0 0 0 Alto Mearim e Grajaú 327 142 99 22 142 83 87 Baixada Maranhense 0 0 0 0 0 0 0 Baixo Parnaíba Maranhense 4 2 0 0 1 0 0 Caxias 17 8 1 0 8 1 1 Chapadas das Mangabeiras 351 132 102 23 132 66 70 Chapadas do Alto Itapecuru 111 34 26 6 34 16 16 Chapadinha 8 2 0 0 2 0 0 Codó 1 1 0 0 1 0 0 Coelho Neto 0 0 0 0 0 0 0 Gerais de Balsas 728 451 350 77 451 239 251 Gurupi 0 0 0 0 0 0 0 Imperatriz 12 7 6 1 7 6 6 Itapecuru Mirim 0 0 0 0 0 0 0 Lençois Maranhenses 36 35 16 4 35 14 15 Litoral Ocidental Maranhense 0 0 0 0 0 0 0 Médio Mearim 1 0 0 0 0 1 1 Pindaré 1 0 0 0 0 0 0
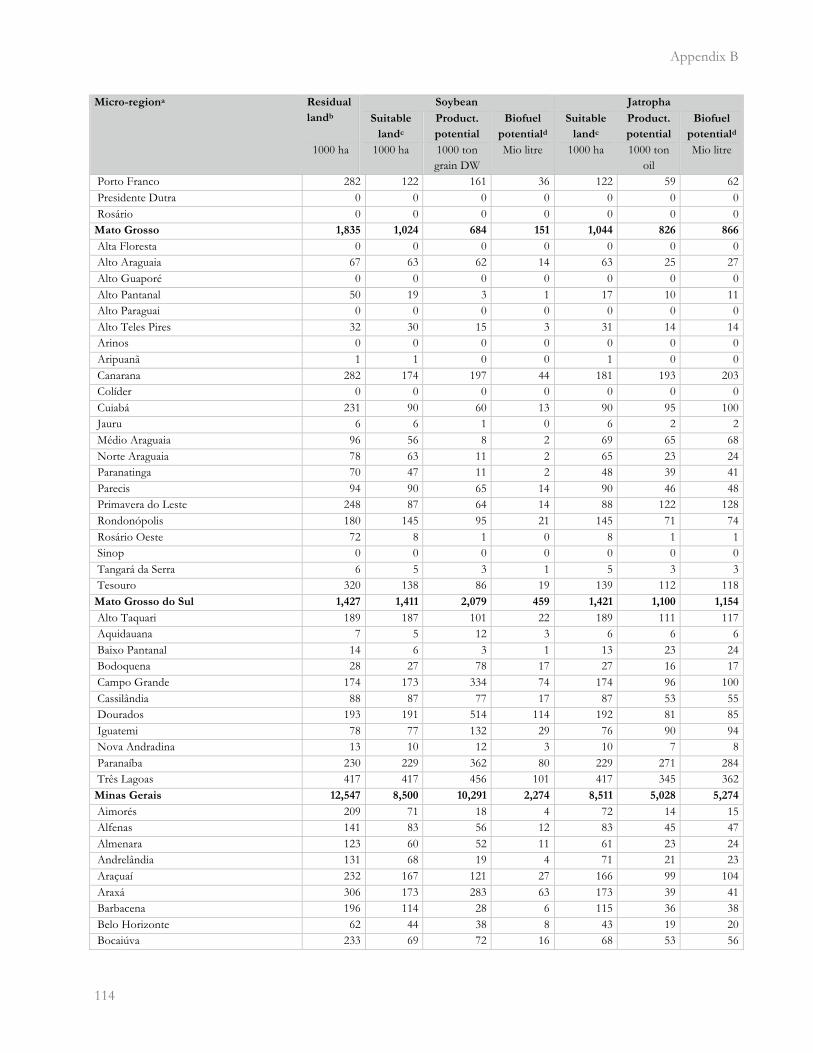
Appendix B
�114
Micro-regiona Residual
landb
Soybean Jatropha
Suitable
landc
Product.
potential
Biofuel
potentiald
Suitable
landc
Product.
potential
Biofuel
potentiald
1000 ha 1000 ha 1000 ton grain DW
Mio litre 1000 ha 1000 ton oil
Mio litre
Porto Franco 282 122 161 36 122 59 62 Presidente Dutra 0 0 0 0 0 0 0 Rosário 0 0 0 0 0 0 0 Mato Grosso 1,835 1,024 684 151 1,044 826 866
Alta Floresta 0 0 0 0 0 0 0 Alto Araguaia 67 63 62 14 63 25 27 Alto Guaporé 0 0 0 0 0 0 0 Alto Pantanal 50 19 3 1 17 10 11 Alto Paraguai 0 0 0 0 0 0 0 Alto Teles Pires 32 30 15 3 31 14 14 Arinos 0 0 0 0 0 0 0 Aripuanã 1 1 0 0 1 0 0 Canarana 282 174 197 44 181 193 203 Colíder 0 0 0 0 0 0 0 Cuiabá 231 90 60 13 90 95 100 Jauru 6 6 1 0 6 2 2 Médio Araguaia 96 56 8 2 69 65 68 Norte Araguaia 78 63 11 2 65 23 24 Paranatinga 70 47 11 2 48 39 41 Parecis 94 90 65 14 90 46 48 Primavera do Leste 248 87 64 14 88 122 128 Rondonópolis 180 145 95 21 145 71 74 Rosário Oeste 72 8 1 0 8 1 1 Sinop 0 0 0 0 0 0 0 Tangará da Serra 6 5 3 1 5 3 3 Tesouro 320 138 86 19 139 112 118 Mato Grosso do Sul 1,427 1,411 2,079 459 1,421 1,100 1,154
Alto Taquari 189 187 101 22 189 111 117 Aquidauana 7 5 12 3 6 6 6 Baixo Pantanal 14 6 3 1 13 23 24 Bodoquena 28 27 78 17 27 16 17 Campo Grande 174 173 334 74 174 96 100 Cassilândia 88 87 77 17 87 53 55 Dourados 193 191 514 114 192 81 85 Iguatemi 78 77 132 29 76 90 94 Nova Andradina 13 10 12 3 10 7 8 Paranaíba 230 229 362 80 229 271 284 Três Lagoas 417 417 456 101 417 345 362 Minas Gerais 12,547 8,500 10,291 2,274 8,511 5,028 5,274
Aimorés 209 71 18 4 72 14 15 Alfenas 141 83 56 12 83 45 47 Almenara 123 60 52 11 61 23 24 Andrelândia 131 68 19 4 71 21 23 Araçuaí 232 167 121 27 166 99 104 Araxá 306 173 283 63 173 39 41 Barbacena 196 114 28 6 115 36 38 Belo Horizonte 62 44 38 8 43 19 20 Bocaiúva 233 69 72 16 68 53 56

Brazilian residual land suitability for biodiesel feedstocks by micro-regions
� 115
Micro-regiona Residual
landb
Soybean Jatropha
Suitable
landc
Product.
potential
Biofuel
potentiald
Suitable
landc
Product.
potential
Biofuel
potentiald
1000 ha 1000 ha 1000 ton grain DW
Mio litre 1000 ha 1000 ton oil
Mio litre
Bom Despacho 186 159 275 61 160 66 70 Campo Belo 83 58 34 8 58 13 14 Capelinha 79 63 50 11 64 40 42 Caratinga 210 100 20 4 101 23 25 Cataguases 65 32 2 0 33 5 5 Conceição do Mato Dentro 59 26 3 1 26 6 6 Conselheiro Lafaiete 97 58 19 4 58 23 24 Curvelo 361 341 566 125 342 302 317 Diamantina 43 6 5 1 5 4 4 Divinópolis 198 149 133 29 150 97 102 Formiga 133 97 81 18 96 53 56 Frutal 414 411 891 197 410 294 309 Governador Valadares 410 230 50 11 230 40 42 Grão Mogol 35 3 9 2 3 5 5 Guanhães 81 25 2 0 25 5 5 Ipatinga 105 40 9 2 39 9 10 Itabira 150 42 6 1 43 10 11 Itaguara 115 61 19 4 61 11 12 Itajubá 43 2 1 0 2 1 1 Ituiutaba 118 114 195 43 114 77 81 Janaúba 147 103 193 43 104 66 70 Januária 500 498 600 133 498 423 444 Juiz de Fora 223 72 10 2 73 15 16 Lavras 142 110 82 18 110 43 45 Manhuaçu 89 27 1 0 28 4 4 Mantena 32 5 0 0 4 1 1 Montes Claros 628 546 911 201 546 324 340 Muriaé 62 24 2 0 24 5 5 Nanuque 199 139 44 10 139 31 32 Oliveira 138 72 25 6 72 23 25 Ouro Preto 12 6 0 0 6 1 1 Pará de Minas 64 42 35 8 44 16 16 Paracatu 659 489 932 206 490 451 473 Passos 101 66 22 5 65 16 16 Patos de Minas 159 45 50 11 45 7 7 Patrocínio 218 111 257 57 111 79 83 Peçanha 126 61 6 1 59 8 9 Pedra Azul 84 54 32 7 54 14 14 Pirapora 729 660 1,057 234 659 560 588 Piuí 37 13 6 1 14 2 2 Poços de Caldas 126 49 10 2 53 10 11 Ponte Nova 138 59 10 2 59 13 14 Pouso Alegre 103 21 7 2 24 8 8 Salinas 302 288 599 132 288 188 197 Santa Rita do Sapucaí 92 36 16 4 37 18 18 São João Del Rei 292 224 159 35 225 98 102 São Lourenço 104 34 14 3 34 14 14 São Sebastião do Paraíso 68 35 5 1 35 4 4
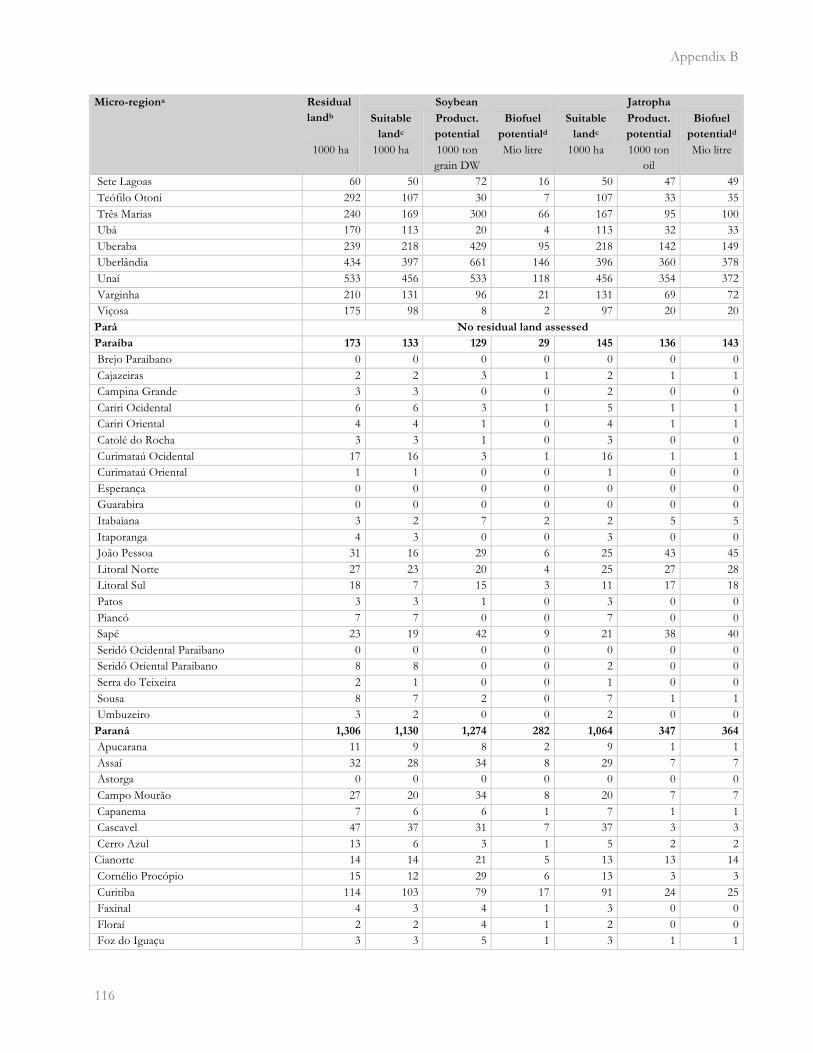
Appendix B
�116
Micro-regiona Residual
landb
Soybean Jatropha
Suitable
landc
Product.
potential
Biofuel
potentiald
Suitable
landc
Product.
potential
Biofuel
potentiald
1000 ha 1000 ha 1000 ton grain DW
Mio litre 1000 ha 1000 ton oil
Mio litre
Sete Lagoas 60 50 72 16 50 47 49 Teófilo Otoni 292 107 30 7 107 33 35 Três Marias 240 169 300 66 167 95 100 Ubá 170 113 20 4 113 32 33 Uberaba 239 218 429 95 218 142 149 Uberlândia 434 397 661 146 396 360 378 Unaí 533 456 533 118 456 354 372 Varginha 210 131 96 21 131 69 72 Viçosa 175 98 8 2 97 20 20 Pará No residual land assessed
Paraíba 173 133 129 29 145 136 143
Brejo Paraibano 0 0 0 0 0 0 0 Cajazeiras 2 2 3 1 2 1 1 Campina Grande 3 3 0 0 2 0 0 Cariri Ocidental 6 6 3 1 5 1 1 Cariri Oriental 4 4 1 0 4 1 1 Catolé do Rocha 3 3 1 0 3 0 0 Curimataú Ocidental 17 16 3 1 16 1 1 Curimataú Oriental 1 1 0 0 1 0 0 Esperança 0 0 0 0 0 0 0 Guarabira 0 0 0 0 0 0 0 Itabaiana 3 2 7 2 2 5 5 Itaporanga 4 3 0 0 3 0 0 João Pessoa 31 16 29 6 25 43 45 Litoral Norte 27 23 20 4 25 27 28 Litoral Sul 18 7 15 3 11 17 18 Patos 3 3 1 0 3 0 0 Piancó 7 7 0 0 7 0 0 Sapé 23 19 42 9 21 38 40 Seridó Ocidental Paraibano 0 0 0 0 0 0 0 Seridó Oriental Paraibano 8 8 0 0 2 0 0 Serra do Teixeira 2 1 0 0 1 0 0 Sousa 8 7 2 0 7 1 1 Umbuzeiro 3 2 0 0 2 0 0 Paraná 1,306 1,130 1,274 282 1,064 347 364
Apucarana 11 9 8 2 9 1 1 Assaí 32 28 34 8 29 7 7 Astorga 0 0 0 0 0 0 0 Campo Mourão 27 20 34 8 20 7 7 Capanema 7 6 6 1 7 1 1 Cascavel 47 37 31 7 37 3 3 Cerro Azul 13 6 3 1 5 2 2 Cianorte 14 14 21 5 13 13 14 Cornélio Procópio 15 12 29 6 13 3 3 Curitiba 114 103 79 17 91 24 25 Faxinal 4 3 4 1 3 0 0 Floraí 2 2 4 1 2 0 0 Foz do Iguaçu 3 3 5 1 3 1 1
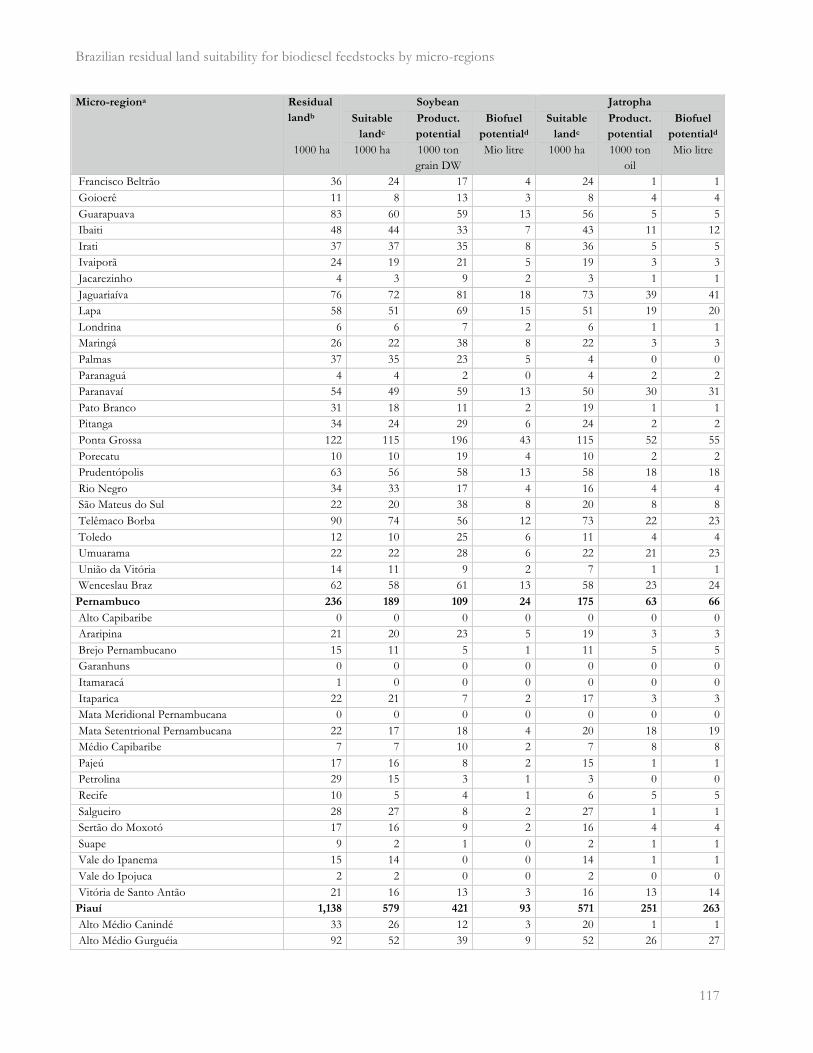
Brazilian residual land suitability for biodiesel feedstocks by micro-regions
� 117
Micro-regiona Residual
landb
Soybean Jatropha
Suitable
landc
Product.
potential
Biofuel
potentiald
Suitable
landc
Product.
potential
Biofuel
potentiald
1000 ha 1000 ha 1000 ton grain DW
Mio litre 1000 ha 1000 ton oil
Mio litre
Francisco Beltrão 36 24 17 4 24 1 1 Goioerê 11 8 13 3 8 4 4 Guarapuava 83 60 59 13 56 5 5 Ibaiti 48 44 33 7 43 11 12 Irati 37 37 35 8 36 5 5 Ivaiporã 24 19 21 5 19 3 3 Jacarezinho 4 3 9 2 3 1 1 Jaguariaíva 76 72 81 18 73 39 41 Lapa 58 51 69 15 51 19 20 Londrina 6 6 7 2 6 1 1 Maringá 26 22 38 8 22 3 3 Palmas 37 35 23 5 4 0 0 Paranaguá 4 4 2 0 4 2 2 Paranavaí 54 49 59 13 50 30 31 Pato Branco 31 18 11 2 19 1 1 Pitanga 34 24 29 6 24 2 2 Ponta Grossa 122 115 196 43 115 52 55 Porecatu 10 10 19 4 10 2 2 Prudentópolis 63 56 58 13 58 18 18 Rio Negro 34 33 17 4 16 4 4 São Mateus do Sul 22 20 38 8 20 8 8 Telêmaco Borba 90 74 56 12 73 22 23 Toledo 12 10 25 6 11 4 4 Umuarama 22 22 28 6 22 21 23 União da Vitória 14 11 9 2 7 1 1 Wenceslau Braz 62 58 61 13 58 23 24 Pernambuco 236 189 109 24 175 63 66
Alto Capibaribe 0 0 0 0 0 0 0 Araripina 21 20 23 5 19 3 3 Brejo Pernambucano 15 11 5 1 11 5 5 Garanhuns 0 0 0 0 0 0 0 Itamaracá 1 0 0 0 0 0 0 Itaparica 22 21 7 2 17 3 3 Mata Meridional Pernambucana 0 0 0 0 0 0 0 Mata Setentrional Pernambucana 22 17 18 4 20 18 19 Médio Capibaribe 7 7 10 2 7 8 8 Pajeú 17 16 8 2 15 1 1 Petrolina 29 15 3 1 3 0 0 Recife 10 5 4 1 6 5 5 Salgueiro 28 27 8 2 27 1 1 Sertão do Moxotó 17 16 9 2 16 4 4 Suape 9 2 1 0 2 1 1 Vale do Ipanema 15 14 0 0 14 1 1 Vale do Ipojuca 2 2 0 0 2 0 0 Vitória de Santo Antão 21 16 13 3 16 13 14 Piauí 1,138 579 421 93 571 251 263
Alto Médio Canindé 33 26 12 3 20 1 1 Alto Médio Gurguéia 92 52 39 9 52 26 27
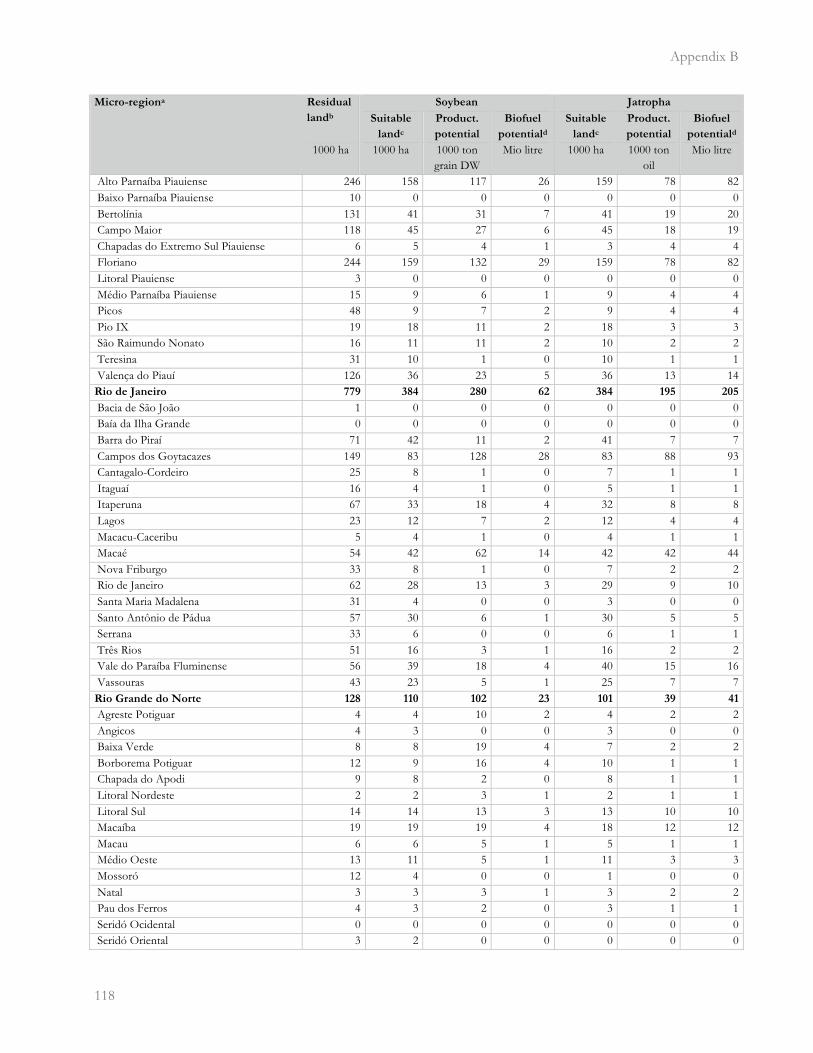
Appendix B
�118
Micro-regiona Residual
landb
Soybean Jatropha
Suitable
landc
Product.
potential
Biofuel
potentiald
Suitable
landc
Product.
potential
Biofuel
potentiald
1000 ha 1000 ha 1000 ton grain DW
Mio litre 1000 ha 1000 ton oil
Mio litre
Alto Parnaíba Piauiense 246 158 117 26 159 78 82 Baixo Parnaíba Piauiense 10 0 0 0 0 0 0 Bertolínia 131 41 31 7 41 19 20 Campo Maior 118 45 27 6 45 18 19 Chapadas do Extremo Sul Piauiense 6 5 4 1 3 4 4 Floriano 244 159 132 29 159 78 82 Litoral Piauiense 3 0 0 0 0 0 0 Médio Parnaíba Piauiense 15 9 6 1 9 4 4 Picos 48 9 7 2 9 4 4 Pio IX 19 18 11 2 18 3 3 São Raimundo Nonato 16 11 11 2 10 2 2 Teresina 31 10 1 0 10 1 1 Valença do Piauí 126 36 23 5 36 13 14 Rio de Janeiro 779 384 280 62 384 195 205
Bacia de São João 1 0 0 0 0 0 0 Baía da Ilha Grande 0 0 0 0 0 0 0 Barra do Piraí 71 42 11 2 41 7 7 Campos dos Goytacazes 149 83 128 28 83 88 93 Cantagalo-Cordeiro 25 8 1 0 7 1 1 Itaguaí 16 4 1 0 5 1 1 Itaperuna 67 33 18 4 32 8 8 Lagos 23 12 7 2 12 4 4 Macacu-Caceribu 5 4 1 0 4 1 1 Macaé 54 42 62 14 42 42 44 Nova Friburgo 33 8 1 0 7 2 2 Rio de Janeiro 62 28 13 3 29 9 10 Santa Maria Madalena 31 4 0 0 3 0 0 Santo Antônio de Pádua 57 30 6 1 30 5 5 Serrana 33 6 0 0 6 1 1 Três Rios 51 16 3 1 16 2 2 Vale do Paraíba Fluminense 56 39 18 4 40 15 16 Vassouras 43 23 5 1 25 7 7 Rio Grande do Norte 128 110 102 23 101 39 41
Agreste Potiguar 4 4 10 2 4 2 2 Angicos 4 3 0 0 3 0 0 Baixa Verde 8 8 19 4 7 2 2 Borborema Potiguar 12 9 16 4 10 1 1 Chapada do Apodi 9 8 2 0 8 1 1 Litoral Nordeste 2 2 3 1 2 1 1 Litoral Sul 14 14 13 3 13 10 10 Macaíba 19 19 19 4 18 12 12 Macau 6 6 5 1 5 1 1 Médio Oeste 13 11 5 1 11 3 3 Mossoró 12 4 0 0 1 0 0 Natal 3 3 3 1 3 2 2 Pau dos Ferros 4 3 2 0 3 1 1 Seridó Ocidental 0 0 0 0 0 0 0 Seridó Oriental 3 2 0 0 0 0 0
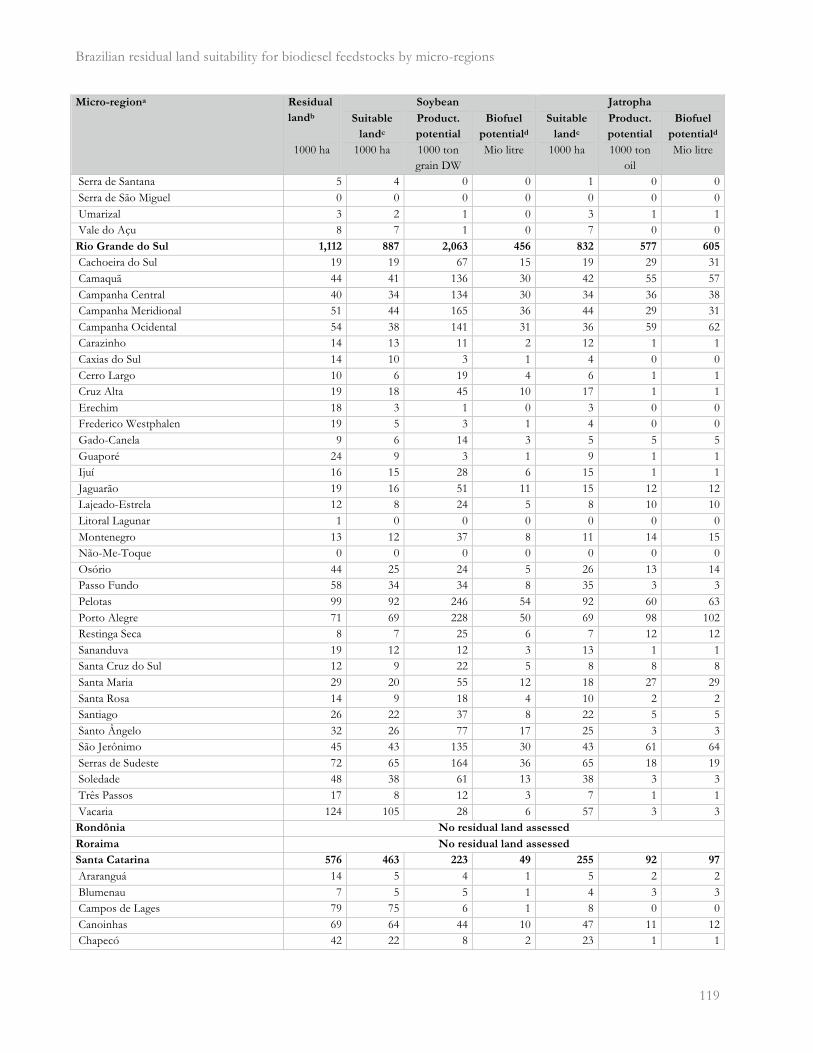
Brazilian residual land suitability for biodiesel feedstocks by micro-regions
� 119
Micro-regiona Residual
landb
Soybean Jatropha
Suitable
landc
Product.
potential
Biofuel
potentiald
Suitable
landc
Product.
potential
Biofuel
potentiald
1000 ha 1000 ha 1000 ton grain DW
Mio litre 1000 ha 1000 ton oil
Mio litre
Serra de Santana 5 4 0 0 1 0 0 Serra de São Miguel 0 0 0 0 0 0 0 Umarizal 3 2 1 0 3 1 1 Vale do Açu 8 7 1 0 7 0 0 Rio Grande do Sul 1,112 887 2,063 456 832 577 605
Cachoeira do Sul 19 19 67 15 19 29 31 Camaquã 44 41 136 30 42 55 57 Campanha Central 40 34 134 30 34 36 38 Campanha Meridional 51 44 165 36 44 29 31 Campanha Ocidental 54 38 141 31 36 59 62 Carazinho 14 13 11 2 12 1 1 Caxias do Sul 14 10 3 1 4 0 0 Cerro Largo 10 6 19 4 6 1 1 Cruz Alta 19 18 45 10 17 1 1 Erechim 18 3 1 0 3 0 0 Frederico Westphalen 19 5 3 1 4 0 0 Gado-Canela 9 6 14 3 5 5 5 Guaporé 24 9 3 1 9 1 1 Ijuí 16 15 28 6 15 1 1 Jaguarão 19 16 51 11 15 12 12 Lajeado-Estrela 12 8 24 5 8 10 10 Litoral Lagunar 1 0 0 0 0 0 0 Montenegro 13 12 37 8 11 14 15 Não-Me-Toque 0 0 0 0 0 0 0 Osório 44 25 24 5 26 13 14 Passo Fundo 58 34 34 8 35 3 3 Pelotas 99 92 246 54 92 60 63 Porto Alegre 71 69 228 50 69 98 102 Restinga Seca 8 7 25 6 7 12 12 Sananduva 19 12 12 3 13 1 1 Santa Cruz do Sul 12 9 22 5 8 8 8 Santa Maria 29 20 55 12 18 27 29 Santa Rosa 14 9 18 4 10 2 2 Santiago 26 22 37 8 22 5 5 Santo Ângelo 32 26 77 17 25 3 3 São Jerônimo 45 43 135 30 43 61 64 Serras de Sudeste 72 65 164 36 65 18 19 Soledade 48 38 61 13 38 3 3 Três Passos 17 8 12 3 7 1 1 Vacaria 124 105 28 6 57 3 3 Rondônia No residual land assessed
Roraima No residual land assessed
Santa Catarina 576 463 223 49 255 92 97
Araranguá 14 5 4 1 5 2 2 Blumenau 7 5 5 1 4 3 3 Campos de Lages 79 75 6 1 8 0 0 Canoinhas 69 64 44 10 47 11 12 Chapecó 42 22 8 2 23 1 1
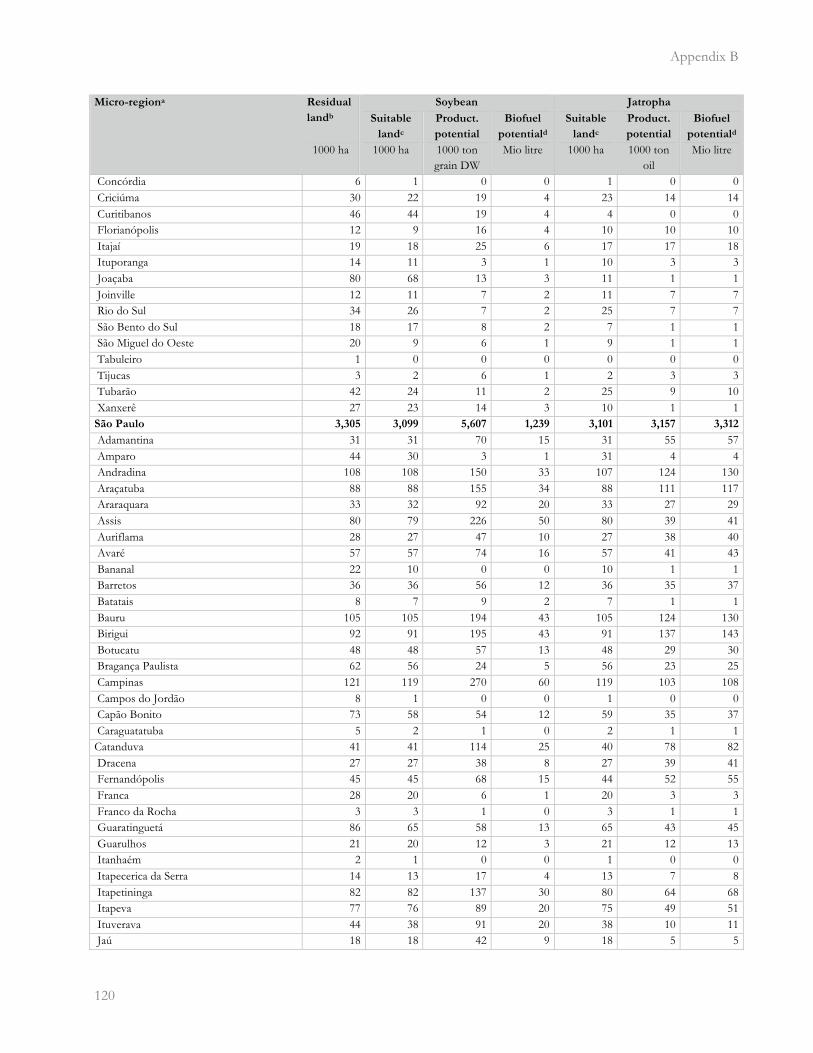
Appendix B
�120
Micro-regiona Residual
landb
Soybean Jatropha
Suitable
landc
Product.
potential
Biofuel
potentiald
Suitable
landc
Product.
potential
Biofuel
potentiald
1000 ha 1000 ha 1000 ton grain DW
Mio litre 1000 ha 1000 ton oil
Mio litre
Concórdia 6 1 0 0 1 0 0 Criciúma 30 22 19 4 23 14 14 Curitibanos 46 44 19 4 4 0 0 Florianópolis 12 9 16 4 10 10 10 Itajaí 19 18 25 6 17 17 18 Ituporanga 14 11 3 1 10 3 3 Joaçaba 80 68 13 3 11 1 1 Joinville 12 11 7 2 11 7 7 Rio do Sul 34 26 7 2 25 7 7 São Bento do Sul 18 17 8 2 7 1 1 São Miguel do Oeste 20 9 6 1 9 1 1 Tabuleiro 1 0 0 0 0 0 0 Tijucas 3 2 6 1 2 3 3 Tubarão 42 24 11 2 25 9 10 Xanxerê 27 23 14 3 10 1 1 São Paulo 3,305 3,099 5,607 1,239 3,101 3,157 3,312
Adamantina 31 31 70 15 31 55 57 Amparo 44 30 3 1 31 4 4 Andradina 108 108 150 33 107 124 130 Araçatuba 88 88 155 34 88 111 117 Araraquara 33 32 92 20 33 27 29 Assis 80 79 226 50 80 39 41 Auriflama 28 27 47 10 27 38 40 Avaré 57 57 74 16 57 41 43 Bananal 22 10 0 0 10 1 1 Barretos 36 36 56 12 36 35 37 Batatais 8 7 9 2 7 1 1 Bauru 105 105 194 43 105 124 130 Birigui 92 91 195 43 91 137 143 Botucatu 48 48 57 13 48 29 30 Bragança Paulista 62 56 24 5 56 23 25 Campinas 121 119 270 60 119 103 108 Campos do Jordão 8 1 0 0 1 0 0 Capão Bonito 73 58 54 12 59 35 37 Caraguatatuba 5 2 1 0 2 1 1 Catanduva 41 41 114 25 40 78 82 Dracena 27 27 38 8 27 39 41 Fernandópolis 45 45 68 15 44 52 55 Franca 28 20 6 1 20 3 3 Franco da Rocha 3 3 1 0 3 1 1 Guaratinguetá 86 65 58 13 65 43 45 Guarulhos 21 20 12 3 21 12 13 Itanhaém 2 1 0 0 1 0 0 Itapecerica da Serra 14 13 17 4 13 7 8 Itapetininga 82 82 137 30 80 64 68 Itapeva 77 76 89 20 75 49 51 Ituverava 44 38 91 20 38 10 11 Jaú 18 18 42 9 18 5 5

Brazilian residual land suitability for biodiesel feedstocks by micro-regions
� 121
Micro-regiona Residual
landb
Soybean Jatropha
Suitable
landc
Product.
potential
Biofuel
potentiald
Suitable
landc
Product.
potential
Biofuel
potentiald
1000 ha 1000 ha 1000 ton grain DW
Mio litre 1000 ha 1000 ton oil
Mio litre
Jaboticabal 61 61 164 36 59 101 106 Jales 21 21 32 7 21 32 33 Jundiaí 32 32 43 10 31 29 31 Limeira 39 38 99 22 38 58 61 Lins 65 65 160 35 64 109 115 Marília 51 49 80 18 48 58 61 Mogi das Cruzes 34 31 11 2 30 9 10 Moji Mirim 14 14 23 5 13 13 14 Nhandeara 32 32 71 16 31 50 53 Novo Horizonte 25 25 76 17 25 51 53 Osasco 5 5 2 0 5 2 2 Ourinhos 95 94 218 48 94 38 40 Paraibuna/Paraitinga 106 49 4 1 49 5 5 Piedade 38 34 32 7 34 17 18 Piracicaba 123 123 261 58 122 108 113 Pirassununga 36 35 96 21 36 53 55 Presidente Prudente 192 192 322 71 192 230 241 Registro 0 0 0 0 0 0 0 Ribeirão Preto 0 0 1 0 0 0 0 Rio Claro 71 68 129 29 69 80 84 São Carlos 30 30 64 14 30 41 43 São João da Boa Vista 27 22 35 8 22 13 14 São Joaquim da Barra 6 6 17 4 6 2 2 São José do Rio Preto 175 175 381 84 174 267 280 São José dos Campos 140 119 135 30 120 99 104 São Paulo 12 10 8 2 11 5 5 Santos 3 1 0 0 1 0 0 Sorocaba 169 167 381 84 167 184 193 Tatuí 106 105 265 59 106 109 114 Tupã 17 16 41 9 16 29 30 Votuporanga 53 53 101 22 52 72 75 Sergipe 46 43 4 1 43 6 6
Agreste de Itabaiana 2 2 0 0 2 0 0 Agreste de Lagarto 1 1 0 0 1 0 0 Aracaju 8 7 2 0 7 2 2 Baixo Cotinguiba 5 5 0 0 5 1 1 Boquim 2 2 0 0 2 0 0 Carira 0 0 0 0 0 0 0 Cotinguiba 1 1 0 0 1 0 0 Estância 14 13 1 0 13 3 3 Japaratuba 6 6 1 0 5 1 1 Nossa Senhora das Dores 0 0 0 0 0 0 0 Propriá 1 1 0 0 1 0 0 Sergipana do Sertão do São Francisco 4 3 0 0 4 1 1 Tobias Barreto 3 2 0 0 2 0 0 Tocantins 2,550 1,480 729 161 1,486 977 1,025
Araguaína 85 11 7 2 11 7 8 Bico do Papagaio 26 9 18 4 9 5 5
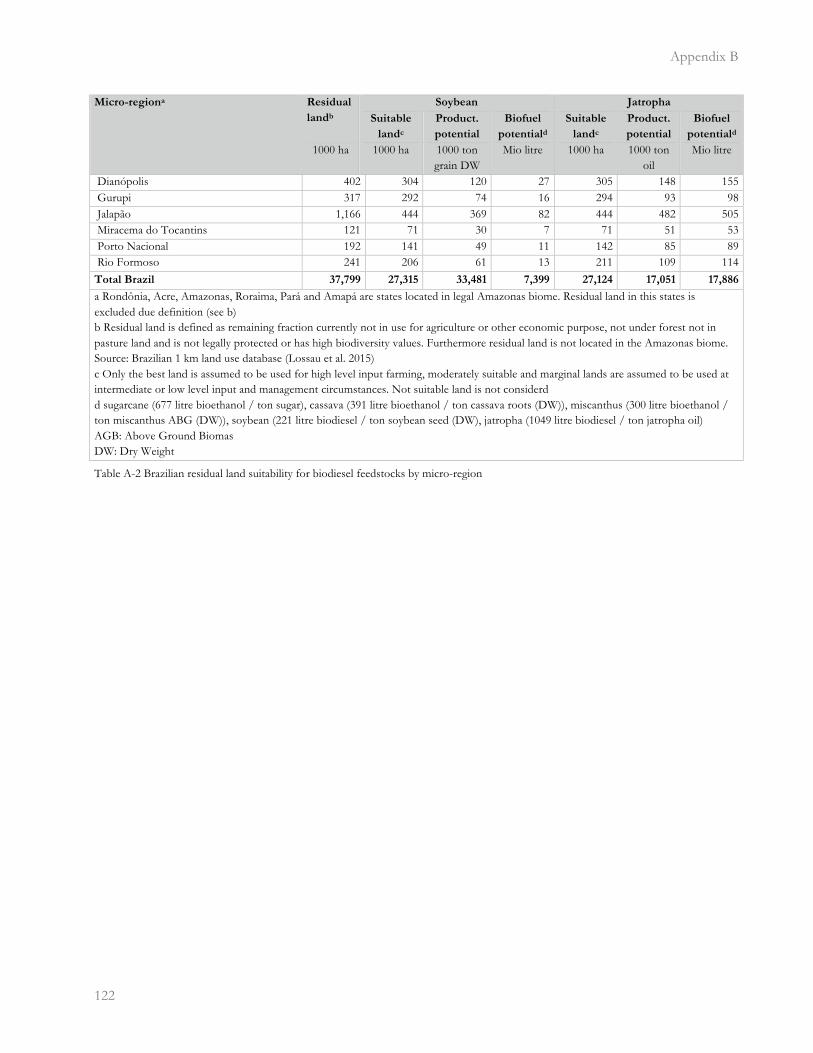
Appendix B
�122
Micro-regiona Residual
landb
Soybean Jatropha
Suitable
landc
Product.
potential
Biofuel
potentiald
Suitable
landc
Product.
potential
Biofuel
potentiald
1000 ha 1000 ha 1000 ton grain DW
Mio litre 1000 ha 1000 ton oil
Mio litre
Dianópolis 402 304 120 27 305 148 155 Gurupi 317 292 74 16 294 93 98 Jalapão 1,166 444 369 82 444 482 505 Miracema do Tocantins 121 71 30 7 71 51 53 Porto Nacional 192 141 49 11 142 85 89 Rio Formoso 241 206 61 13 211 109 114 Total Brazil 37,799 27,315 33,481 7,399 27,124 17,051 17,886
a Rondônia, Acre, Amazonas, Roraima, Pará and Amapá are states located in legal Amazonas biome. Residual land in this states is excluded due definition (see b) b Residual land is defined as remaining fraction currently not in use for agriculture or other economic purpose, not under forest not in pasture land and is not legally protected or has high biodiversity values. Furthermore residual land is not located in the Amazonas biome. Source: Brazilian 1 km land use database (Lossau et al. 2015) c Only the best land is assumed to be used for high level input farming, moderately suitable and marginal lands are assumed to be used at intermediate or low level input and management circumstances. Not suitable land is not considerd d sugarcane (677 litre bioethanol / ton sugar), cassava (391 litre bioethanol / ton cassava roots (DW)), miscanthus (300 litre bioethanol / ton miscanthus ABG (DW)), soybean (221 litre biodiesel / ton soybean seed (DW), jatropha (1049 litre biodiesel / ton jatropha oil) AGB: Above Ground Biomas DW: Dry Weight
Table A-2 Brazilian residual land suitability for biodiesel feedstocks by micro-region
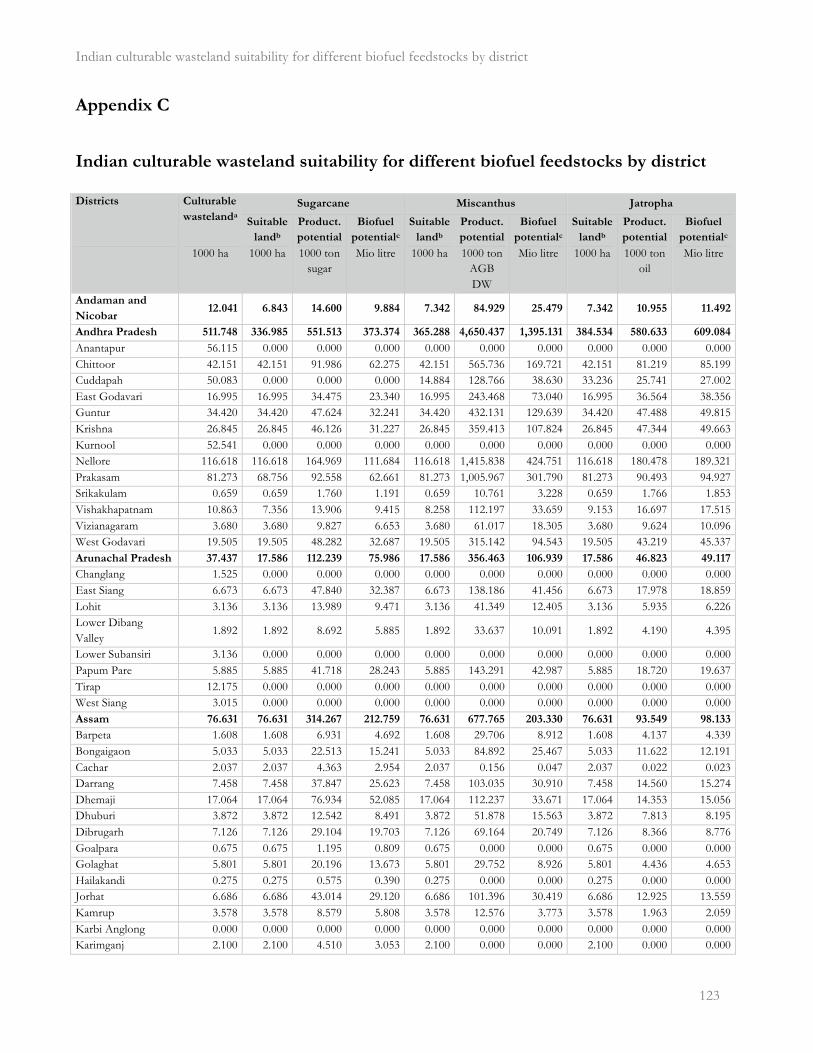
Indian culturable wasteland suitability for different biofuel feedstocks by district
� 123
Appendix C
Indian culturable wasteland suitability for different biofuel feedstocks by district
�
Districts Culturable
wastelanda
Sugarcane Miscanthus Jatropha
Suitable
landb
Product.
potential
Biofuel
potentialc
Suitable
landb
Product.
potential
Biofuel
potentialc
Suitable
landb
Product.
potential
Biofuel
potentialc
1000 ha 1000 ha 1000 ton sugar
Mio litre 1000 ha 1000 ton AGB DW
Mio litre 1000 ha 1000 ton oil
Mio litre
Andaman and
Nicobar 12.041 6.843 14.600 9.884 7.342 84.929 25.479 7.342 10.955 11.492
Andhra Pradesh 511.748 336.985 551.513 373.374 365.288 4,650.437 1,395.131 384.534 580.633 609.084
Anantapur 56.115 0.000 0.000 0.000 0.000 0.000 0.000 0.000 0.000 0.000 Chittoor 42.151 42.151 91.986 62.275 42.151 565.736 169.721 42.151 81.219 85.199 Cuddapah 50.083 0.000 0.000 0.000 14.884 128.766 38.630 33.236 25.741 27.002 East Godavari 16.995 16.995 34.475 23.340 16.995 243.468 73.040 16.995 36.564 38.356 Guntur 34.420 34.420 47.624 32.241 34.420 432.131 129.639 34.420 47.488 49.815 Krishna 26.845 26.845 46.126 31.227 26.845 359.413 107.824 26.845 47.344 49.663 Kurnool 52.541 0.000 0.000 0.000 0.000 0.000 0.000 0.000 0.000 0.000 Nellore 116.618 116.618 164.969 111.684 116.618 1,415.838 424.751 116.618 180.478 189.321 Prakasam 81.273 68.756 92.558 62.661 81.273 1,005.967 301.790 81.273 90.493 94.927 Srikakulam 0.659 0.659 1.760 1.191 0.659 10.761 3.228 0.659 1.766 1.853 Vishakhapatnam 10.863 7.356 13.906 9.415 8.258 112.197 33.659 9.153 16.697 17.515 Vizianagaram 3.680 3.680 9.827 6.653 3.680 61.017 18.305 3.680 9.624 10.096 West Godavari 19.505 19.505 48.282 32.687 19.505 315.142 94.543 19.505 43.219 45.337 Arunachal Pradesh 37.437 17.586 112.239 75.986 17.586 356.463 106.939 17.586 46.823 49.117
Changlang 1.525 0.000 0.000 0.000 0.000 0.000 0.000 0.000 0.000 0.000 East Siang 6.673 6.673 47.840 32.387 6.673 138.186 41.456 6.673 17.978 18.859 Lohit 3.136 3.136 13.989 9.471 3.136 41.349 12.405 3.136 5.935 6.226 Lower Dibang Valley
1.892 1.892 8.692 5.885 1.892 33.637 10.091 1.892 4.190 4.395
Lower Subansiri 3.136 0.000 0.000 0.000 0.000 0.000 0.000 0.000 0.000 0.000 Papum Pare 5.885 5.885 41.718 28.243 5.885 143.291 42.987 5.885 18.720 19.637 Tirap 12.175 0.000 0.000 0.000 0.000 0.000 0.000 0.000 0.000 0.000 West Siang 3.015 0.000 0.000 0.000 0.000 0.000 0.000 0.000 0.000 0.000 Assam 76.631 76.631 314.267 212.759 76.631 677.765 203.330 76.631 93.549 98.133
Barpeta 1.608 1.608 6.931 4.692 1.608 29.706 8.912 1.608 4.137 4.339 Bongaigaon 5.033 5.033 22.513 15.241 5.033 84.892 25.467 5.033 11.622 12.191 Cachar 2.037 2.037 4.363 2.954 2.037 0.156 0.047 2.037 0.022 0.023 Darrang 7.458 7.458 37.847 25.623 7.458 103.035 30.910 7.458 14.560 15.274 Dhemaji 17.064 17.064 76.934 52.085 17.064 112.237 33.671 17.064 14.353 15.056 Dhuburi 3.872 3.872 12.542 8.491 3.872 51.878 15.563 3.872 7.813 8.195 Dibrugarh 7.126 7.126 29.104 19.703 7.126 69.164 20.749 7.126 8.366 8.776 Goalpara 0.675 0.675 1.195 0.809 0.675 0.000 0.000 0.675 0.000 0.000 Golaghat 5.801 5.801 20.196 13.673 5.801 29.752 8.926 5.801 4.436 4.653 Hailakandi 0.275 0.275 0.575 0.390 0.275 0.000 0.000 0.275 0.000 0.000 Jorhat 6.686 6.686 43.014 29.120 6.686 101.396 30.419 6.686 12.925 13.559 Kamrup 3.578 3.578 8.579 5.808 3.578 12.576 3.773 3.578 1.963 2.059 Karbi Anglong 0.000 0.000 0.000 0.000 0.000 0.000 0.000 0.000 0.000 0.000 Karimganj 2.100 2.100 4.510 3.053 2.100 0.000 0.000 2.100 0.000 0.000
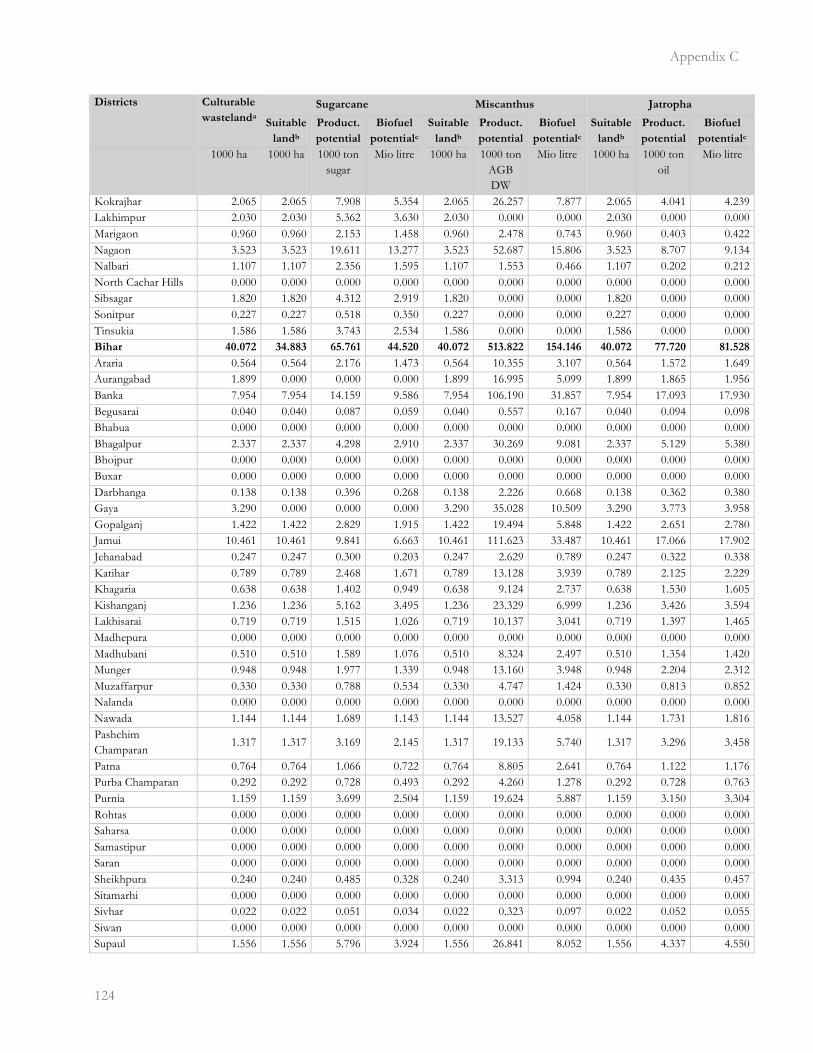
Appendix C
�124
Districts Culturable
wastelanda
Sugarcane Miscanthus Jatropha
Suitable
landb
Product.
potential
Biofuel
potentialc
Suitable
landb
Product.
potential
Biofuel
potentialc
Suitable
landb
Product.
potential
Biofuel
potentialc
1000 ha 1000 ha 1000 ton sugar
Mio litre 1000 ha 1000 ton AGB DW
Mio litre 1000 ha 1000 ton oil
Mio litre
Kokrajhar 2.065 2.065 7.908 5.354 2.065 26.257 7.877 2.065 4.041 4.239 Lakhimpur 2.030 2.030 5.362 3.630 2.030 0.000 0.000 2.030 0.000 0.000 Marigaon 0.960 0.960 2.153 1.458 0.960 2.478 0.743 0.960 0.403 0.422 Nagaon 3.523 3.523 19.611 13.277 3.523 52.687 15.806 3.523 8.707 9.134 Nalbari 1.107 1.107 2.356 1.595 1.107 1.553 0.466 1.107 0.202 0.212 North Cachar Hills 0.000 0.000 0.000 0.000 0.000 0.000 0.000 0.000 0.000 0.000 Sibsagar 1.820 1.820 4.312 2.919 1.820 0.000 0.000 1.820 0.000 0.000 Sonitpur 0.227 0.227 0.518 0.350 0.227 0.000 0.000 0.227 0.000 0.000 Tinsukia 1.586 1.586 3.743 2.534 1.586 0.000 0.000 1.586 0.000 0.000 Bihar 40.072 34.883 65.761 44.520 40.072 513.822 154.146 40.072 77.720 81.528
Araria 0.564 0.564 2.176 1.473 0.564 10.355 3.107 0.564 1.572 1.649 Aurangabad 1.899 0.000 0.000 0.000 1.899 16.995 5.099 1.899 1.865 1.956 Banka 7.954 7.954 14.159 9.586 7.954 106.190 31.857 7.954 17.093 17.930 Begusarai 0.040 0.040 0.087 0.059 0.040 0.557 0.167 0.040 0.094 0.098 Bhabua 0.000 0.000 0.000 0.000 0.000 0.000 0.000 0.000 0.000 0.000 Bhagalpur 2.337 2.337 4.298 2.910 2.337 30.269 9.081 2.337 5.129 5.380 Bhojpur 0.000 0.000 0.000 0.000 0.000 0.000 0.000 0.000 0.000 0.000 Buxar 0.000 0.000 0.000 0.000 0.000 0.000 0.000 0.000 0.000 0.000 Darbhanga 0.138 0.138 0.396 0.268 0.138 2.226 0.668 0.138 0.362 0.380 Gaya 3.290 0.000 0.000 0.000 3.290 35.028 10.509 3.290 3.773 3.958 Gopalganj 1.422 1.422 2.829 1.915 1.422 19.494 5.848 1.422 2.651 2.780 Jamui 10.461 10.461 9.841 6.663 10.461 111.623 33.487 10.461 17.066 17.902 Jehanabad 0.247 0.247 0.300 0.203 0.247 2.629 0.789 0.247 0.322 0.338 Katihar 0.789 0.789 2.468 1.671 0.789 13.128 3.939 0.789 2.125 2.229 Khagaria 0.638 0.638 1.402 0.949 0.638 9.124 2.737 0.638 1.530 1.605 Kishanganj 1.236 1.236 5.162 3.495 1.236 23.329 6.999 1.236 3.426 3.594 Lakhisarai 0.719 0.719 1.515 1.026 0.719 10.137 3.041 0.719 1.397 1.465 Madhepura 0.000 0.000 0.000 0.000 0.000 0.000 0.000 0.000 0.000 0.000 Madhubani 0.510 0.510 1.589 1.076 0.510 8.324 2.497 0.510 1.354 1.420 Munger 0.948 0.948 1.977 1.339 0.948 13.160 3.948 0.948 2.204 2.312 Muzaffarpur 0.330 0.330 0.788 0.534 0.330 4.747 1.424 0.330 0.813 0.852 Nalanda 0.000 0.000 0.000 0.000 0.000 0.000 0.000 0.000 0.000 0.000 Nawada 1.144 1.144 1.689 1.143 1.144 13.527 4.058 1.144 1.731 1.816 Pashchim Champaran
1.317 1.317 3.169 2.145 1.317 19.133 5.740 1.317 3.296 3.458
Patna 0.764 0.764 1.066 0.722 0.764 8.805 2.641 0.764 1.122 1.176 Purba Champaran 0.292 0.292 0.728 0.493 0.292 4.260 1.278 0.292 0.728 0.763 Purnia 1.159 1.159 3.699 2.504 1.159 19.624 5.887 1.159 3.150 3.304 Rohtas 0.000 0.000 0.000 0.000 0.000 0.000 0.000 0.000 0.000 0.000 Saharsa 0.000 0.000 0.000 0.000 0.000 0.000 0.000 0.000 0.000 0.000 Samastipur 0.000 0.000 0.000 0.000 0.000 0.000 0.000 0.000 0.000 0.000 Saran 0.000 0.000 0.000 0.000 0.000 0.000 0.000 0.000 0.000 0.000 Sheikhpura 0.240 0.240 0.485 0.328 0.240 3.313 0.994 0.240 0.435 0.457 Sitamarhi 0.000 0.000 0.000 0.000 0.000 0.000 0.000 0.000 0.000 0.000 Sivhar 0.022 0.022 0.051 0.034 0.022 0.323 0.097 0.022 0.052 0.055 Siwan 0.000 0.000 0.000 0.000 0.000 0.000 0.000 0.000 0.000 0.000 Supaul 1.556 1.556 5.796 3.924 1.556 26.841 8.052 1.556 4.337 4.550

Indian culturable wasteland suitability for different biofuel feedstocks by district
� 125
Districts Culturable
wastelanda
Sugarcane Miscanthus Jatropha
Suitable
landb
Product.
potential
Biofuel
potentialc
Suitable
landb
Product.
potential
Biofuel
potentialc
Suitable
landb
Product.
potential
Biofuel
potentialc
1000 ha 1000 ha 1000 ton sugar
Mio litre 1000 ha 1000 ton AGB DW
Mio litre 1000 ha 1000 ton oil
Mio litre
Vaishali 0.055 0.055 0.090 0.061 0.055 0.679 0.204 0.055 0.095 0.100 Chandigarh 0.000 0.000 0.000 0.000 0.000 0.000 0.000 0.000 0.000 0.000
Chhattisgarh 349.770 200.651 399.268 270.304 248.607 3,374.791 1,012.437 346.048 541.783 568.331
Bastar 58.887 55.655 130.371 88.261 57.301 881.176 264.353 58.887 134.209 140.785 Bilaspur 15.340 1.286 1.896 1.284 6.199 71.178 21.353 15.340 17.440 18.295 Dantewada 123.607 108.768 218.041 147.614 116.679 1,654.927 496.478 122.095 235.217 246.742 Dhamtari 3.581 1.087 1.236 0.837 1.871 18.310 5.493 3.581 3.393 3.559 Durg 24.588 0.000 0.000 0.000 0.000 0.000 0.000 24.588 23.884 25.054 Janjgir-Champa 10.247 0.000 0.000 0.000 3.369 32.776 9.833 10.247 9.688 10.163 Jashpur 6.695 6.695 10.071 6.818 6.695 76.243 22.873 6.695 9.438 9.901 Kanker 23.692 8.102 12.574 8.512 12.241 150.002 45.001 23.692 28.087 29.463 Kawardha 3.236 0.000 0.000 0.000 0.471 3.434 1.030 3.236 3.044 3.193 Korba 13.426 0.714 0.689 0.466 6.894 69.209 20.763 11.217 11.219 11.769 Koriya 0.000 0.000 0.000 0.000 0.000 0.000 0.000 0.000 0.000 0.000 Mahasamund 5.359 3.440 4.674 3.164 5.359 62.151 18.645 5.359 6.230 6.536 Raigarh 7.852 6.002 8.858 5.997 7.852 100.279 30.084 7.852 10.177 10.676 Raipur 34.598 8.902 10.857 7.350 23.675 255.107 76.532 34.598 35.129 36.851 Raj Nandgaon 18.662 0.000 0.000 0.000 0.000 0.000 0.000 18.662 14.628 15.345 Surguja 0.000 0.000 0.000 0.000 0.000 0.000 0.000 0.000 0.000 0.000 Dadra and Nagar
Haveli 0.150 0.000 0.000 0.000 0.000 0.000 0.000 0.000 0.000 0.000
Daman and Diu 0.059 0.000 0.000 0.000 0.000 0.000 0.000 0.000 0.000 0.000
Daman 0.059 0.000 0.000 0.000 0.000 0.000 0.000 0.000 0.000 0.000 Junagadh 0.000 0.000 0.000 0.000 0.000 0.000 0.000 0.000 0.000 0.000 Delhi 9.893 0.000 0.000 0.000 0.000 0.000 0.000 0.000 0.000 0.000
Delhi 9.893 0.000 0.000 0.000 0.000 0.000 0.000 0.000 0.000 0.000 Goa 52.829 0.000 0.000 0.000 13.875 30.832 9.250 14.800 3.245 3.404
Gujarat 1,903.730 0.000 0.000 0.000 0.000 0.000 0.000 0.000 0.000 0.000
Ahmadabad 25.700 0.000 0.000 0.000 0.000 0.000 0.000 0.000 0.000 0.000 Amreli 11.900 0.000 0.000 0.000 0.000 0.000 0.000 0.000 0.000 0.000 Anand 10.500 0.000 0.000 0.000 0.000 0.000 0.000 0.000 0.000 0.000 Banas Kantha 17.800 0.000 0.000 0.000 0.000 0.000 0.000 0.000 0.000 0.000 Bharuch 35.500 0.000 0.000 0.000 0.000 0.000 0.000 0.000 0.000 0.000 Bhavnagar 23.600 0.000 0.000 0.000 0.000 0.000 0.000 0.000 0.000 0.000 Dahod 2.600 0.000 0.000 0.000 0.000 0.000 0.000 0.000 0.000 0.000 Gandhinagar 4.900 0.000 0.000 0.000 0.000 0.000 0.000 0.000 0.000 0.000 Jamnagar 32.200 0.000 0.000 0.000 0.000 0.000 0.000 0.000 0.000 0.000 Junagadh 8.800 0.000 0.000 0.000 0.000 0.000 0.000 0.000 0.000 0.000 Kachchh 1,591.230 0.000 0.000 0.000 0.000 0.000 0.000 0.000 0.000 0.000 Kheda 2.300 0.000 0.000 0.000 0.000 0.000 0.000 0.000 0.000 0.000 Mahesana 4.600 0.000 0.000 0.000 0.000 0.000 0.000 0.000 0.000 0.000 Narmada 3.700 0.000 0.000 0.000 0.000 0.000 0.000 0.000 0.000 0.000 Navsari 6.900 0.000 0.000 0.000 0.000 0.000 0.000 0.000 0.000 0.000 Panch Mahals 11.900 0.000 0.000 0.000 0.000 0.000 0.000 0.000 0.000 0.000 Patan 15.600 0.000 0.000 0.000 0.000 0.000 0.000 0.000 0.000 0.000 Porbandar 4.700 0.000 0.000 0.000 0.000 0.000 0.000 0.000 0.000 0.000 Rajkot 13.000 0.000 0.000 0.000 0.000 0.000 0.000 0.000 0.000 0.000

Appendix C
�126
Districts Culturable
wastelanda
Sugarcane Miscanthus Jatropha
Suitable
landb
Product.
potential
Biofuel
potentialc
Suitable
landb
Product.
potential
Biofuel
potentialc
Suitable
landb
Product.
potential
Biofuel
potentialc
1000 ha 1000 ha 1000 ton sugar
Mio litre 1000 ha 1000 ton AGB DW
Mio litre 1000 ha 1000 ton oil
Mio litre
Sabar Kantha 14.100 0.000 0.000 0.000 0.000 0.000 0.000 0.000 0.000 0.000 Surat 33.600 0.000 0.000 0.000 0.000 0.000 0.000 0.000 0.000 0.000 Surendranagar 15.700 0.000 0.000 0.000 0.000 0.000 0.000 0.000 0.000 0.000 The Dangs 0.000 0.000 0.000 0.000 0.000 0.000 0.000 0.000 0.000 0.000 Vadodara 6.500 0.000 0.000 0.000 0.000 0.000 0.000 0.000 0.000 0.000 Valsad 6.400 0.000 0.000 0.000 0.000 0.000 0.000 0.000 0.000 0.000 Haryana 57.257 2.723 4.671 3.162 3.408 38.475 11.542 3.408 6.904 7.242
Ambala 0.187 0.187 0.311 0.211 0.187 3.011 0.903 0.187 0.424 0.445 Bhiwani 0.000 0.000 0.000 0.000 0.000 0.000 0.000 0.000 0.000 0.000 Faridabad 0.000 0.000 0.000 0.000 0.000 0.000 0.000 0.000 0.000 0.000 Fatehabad 0.000 0.000 0.000 0.000 0.000 0.000 0.000 0.000 0.000 0.000 Gurgaon 0.000 0.000 0.000 0.000 0.000 0.000 0.000 0.000 0.000 0.000 Hisar 0.000 0.000 0.000 0.000 0.000 0.000 0.000 0.000 0.000 0.000 Jhajjar 9.929 0.000 0.000 0.000 0.000 0.000 0.000 0.000 0.000 0.000 Jind 0.000 0.000 0.000 0.000 0.000 0.000 0.000 0.000 0.000 0.000 Kaithal 0.000 0.000 0.000 0.000 0.000 0.000 0.000 0.000 0.000 0.000 Karnal 0.685 0.000 0.000 0.000 0.685 0.880 0.264 0.685 0.561 0.588 Kurukshetra 0.163 0.163 0.230 0.156 0.163 2.033 0.610 0.163 0.262 0.274 Mahendragarh 1.421 0.000 0.000 0.000 0.000 0.000 0.000 0.000 0.000 0.000 Panchkula 2.132 2.132 3.661 2.478 2.132 28.514 8.554 2.132 5.076 5.325 Panipat 1.509 0.000 0.000 0.000 0.000 0.000 0.000 0.000 0.000 0.000 Rewari 15.478 0.000 0.000 0.000 0.000 0.000 0.000 0.000 0.000 0.000 Rohtak 11.133 0.000 0.000 0.000 0.000 0.000 0.000 0.000 0.000 0.000 Sirsa 13.473 0.000 0.000 0.000 0.000 0.000 0.000 0.000 0.000 0.000 Sonepat 0.906 0.000 0.000 0.000 0.000 0.000 0.000 0.000 0.000 0.000 Yamuna Nagar 0.241 0.241 0.469 0.318 0.241 4.038 1.211 0.241 0.582 0.610 Himachal Pradesh 134.323 49.018 83.178 56.312 53.612 563.923 169.177 53.178 82.051 86.072
Bilaspur 6.218 2.092 1.434 0.971 2.652 17.746 5.324 2.652 1.802 1.891 Chamba 6.372 0.000 0.000 0.000 0.000 0.000 0.000 0.000 0.000 0.000 Hamirpur 10.759 8.884 6.450 4.367 10.600 60.784 18.235 10.600 4.577 4.801 Kangra 27.402 10.328 19.673 13.319 11.680 133.562 40.069 11.426 19.748 20.716 Kinnaur 3.444 0.000 0.000 0.000 0.000 0.000 0.000 0.000 0.000 0.000 Kullu 0.000 0.000 0.000 0.000 0.000 0.000 0.000 0.000 0.000 0.000 Lahul and Spiti 0.597 0.000 0.000 0.000 0.000 0.000 0.000 0.000 0.000 0.000 Mandi 4.508 0.065 0.058 0.039 0.211 1.719 0.516 0.123 0.162 0.170 Shimla 21.329 0.000 0.000 0.000 0.000 0.000 0.000 0.000 0.000 0.000 Sirmaur 15.968 0.969 0.829 0.561 1.366 13.918 4.175 1.287 2.320 2.434 Solan 14.544 3.498 7.298 4.941 3.922 54.239 16.272 3.908 8.841 9.274 Una 23.182 23.182 47.435 32.114 23.182 281.955 84.587 23.182 44.601 46.786 Jammu and
Kashmir 138.968 24.729 103.273 69.916 62.876 1,026.444 307.933 25.353 81.816 85.825
Anantnag 0.000 0.000 0.000 0.000 0.000 0.000 0.000 0.000 0.000 0.000 Badgam 4.578 0.000 0.000 0.000 0.000 0.000 0.000 0.000 0.000 0.000 Baramulla 10.831 10.207 33.326 22.562 10.831 197.948 59.384 10.831 34.708 36.409 Doda 22.315 0.000 0.000 0.000 0.000 0.000 0.000 0.000 0.000 0.000 Jammu 31.487 0.000 0.000 0.000 31.487 444.861 133.458 0.000 0.000 0.000 Kargil 3.022 0.000 0.000 0.000 0.000 0.000 0.000 0.000 0.000 0.000
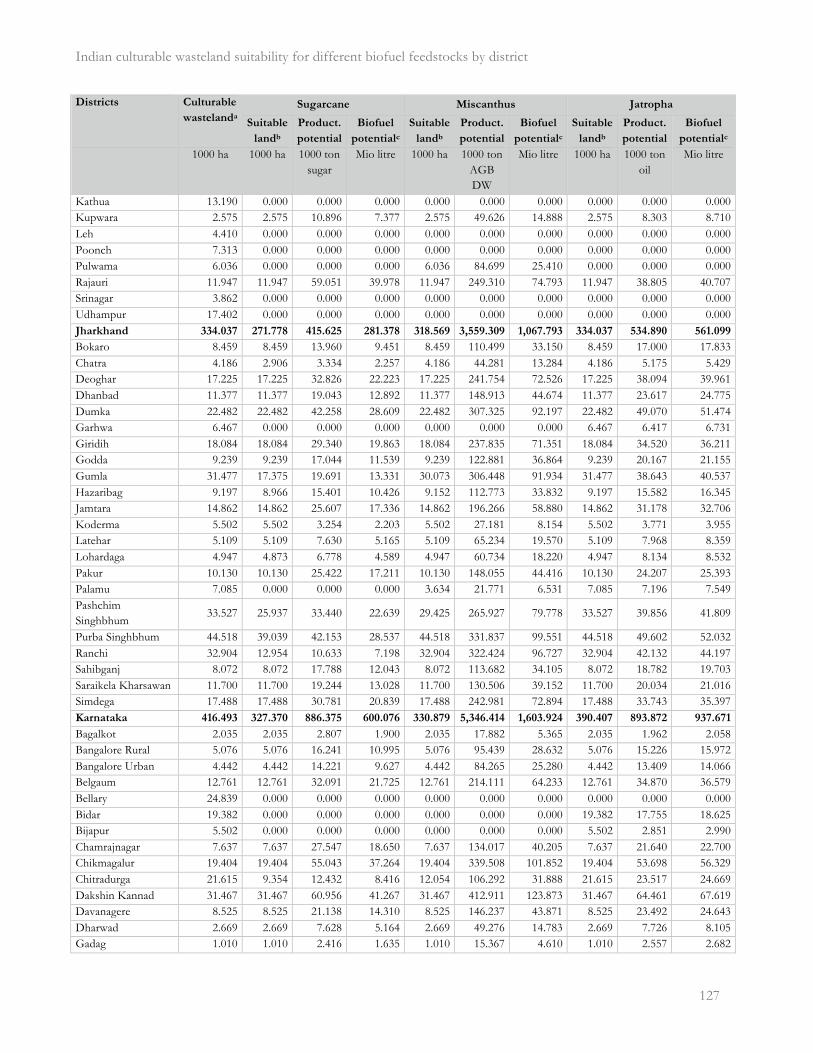
Indian culturable wasteland suitability for different biofuel feedstocks by district
� 127
Districts Culturable
wastelanda
Sugarcane Miscanthus Jatropha
Suitable
landb
Product.
potential
Biofuel
potentialc
Suitable
landb
Product.
potential
Biofuel
potentialc
Suitable
landb
Product.
potential
Biofuel
potentialc
1000 ha 1000 ha 1000 ton sugar
Mio litre 1000 ha 1000 ton AGB DW
Mio litre 1000 ha 1000 ton oil
Mio litre
Kathua 13.190 0.000 0.000 0.000 0.000 0.000 0.000 0.000 0.000 0.000 Kupwara 2.575 2.575 10.896 7.377 2.575 49.626 14.888 2.575 8.303 8.710 Leh 4.410 0.000 0.000 0.000 0.000 0.000 0.000 0.000 0.000 0.000 Poonch 7.313 0.000 0.000 0.000 0.000 0.000 0.000 0.000 0.000 0.000 Pulwama 6.036 0.000 0.000 0.000 6.036 84.699 25.410 0.000 0.000 0.000 Rajauri 11.947 11.947 59.051 39.978 11.947 249.310 74.793 11.947 38.805 40.707 Srinagar 3.862 0.000 0.000 0.000 0.000 0.000 0.000 0.000 0.000 0.000 Udhampur 17.402 0.000 0.000 0.000 0.000 0.000 0.000 0.000 0.000 0.000 Jharkhand 334.037 271.778 415.625 281.378 318.569 3,559.309 1,067.793 334.037 534.890 561.099
Bokaro 8.459 8.459 13.960 9.451 8.459 110.499 33.150 8.459 17.000 17.833 Chatra 4.186 2.906 3.334 2.257 4.186 44.281 13.284 4.186 5.175 5.429 Deoghar 17.225 17.225 32.826 22.223 17.225 241.754 72.526 17.225 38.094 39.961 Dhanbad 11.377 11.377 19.043 12.892 11.377 148.913 44.674 11.377 23.617 24.775 Dumka 22.482 22.482 42.258 28.609 22.482 307.325 92.197 22.482 49.070 51.474 Garhwa 6.467 0.000 0.000 0.000 0.000 0.000 0.000 6.467 6.417 6.731 Giridih 18.084 18.084 29.340 19.863 18.084 237.835 71.351 18.084 34.520 36.211 Godda 9.239 9.239 17.044 11.539 9.239 122.881 36.864 9.239 20.167 21.155 Gumla 31.477 17.375 19.691 13.331 30.073 306.448 91.934 31.477 38.643 40.537 Hazaribag 9.197 8.966 15.401 10.426 9.152 112.773 33.832 9.197 15.582 16.345 Jamtara 14.862 14.862 25.607 17.336 14.862 196.266 58.880 14.862 31.178 32.706 Koderma 5.502 5.502 3.254 2.203 5.502 27.181 8.154 5.502 3.771 3.955 Latehar 5.109 5.109 7.630 5.165 5.109 65.234 19.570 5.109 7.968 8.359 Lohardaga 4.947 4.873 6.778 4.589 4.947 60.734 18.220 4.947 8.134 8.532 Pakur 10.130 10.130 25.422 17.211 10.130 148.055 44.416 10.130 24.207 25.393 Palamu 7.085 0.000 0.000 0.000 3.634 21.771 6.531 7.085 7.196 7.549 Pashchim Singhbhum
33.527 25.937 33.440 22.639 29.425 265.927 79.778 33.527 39.856 41.809
Purba Singhbhum 44.518 39.039 42.153 28.537 44.518 331.837 99.551 44.518 49.602 52.032 Ranchi 32.904 12.954 10.633 7.198 32.904 322.424 96.727 32.904 42.132 44.197 Sahibganj 8.072 8.072 17.788 12.043 8.072 113.682 34.105 8.072 18.782 19.703 Saraikela Kharsawan 11.700 11.700 19.244 13.028 11.700 130.506 39.152 11.700 20.034 21.016 Simdega 17.488 17.488 30.781 20.839 17.488 242.981 72.894 17.488 33.743 35.397 Karnataka 416.493 327.370 886.375 600.076 330.879 5,346.414 1,603.924 390.407 893.872 937.671
Bagalkot 2.035 2.035 2.807 1.900 2.035 17.882 5.365 2.035 1.962 2.058 Bangalore Rural 5.076 5.076 16.241 10.995 5.076 95.439 28.632 5.076 15.226 15.972 Bangalore Urban 4.442 4.442 14.221 9.627 4.442 84.265 25.280 4.442 13.409 14.066 Belgaum 12.761 12.761 32.091 21.725 12.761 214.111 64.233 12.761 34.870 36.579 Bellary 24.839 0.000 0.000 0.000 0.000 0.000 0.000 0.000 0.000 0.000 Bidar 19.382 0.000 0.000 0.000 0.000 0.000 0.000 19.382 17.755 18.625 Bijapur 5.502 0.000 0.000 0.000 0.000 0.000 0.000 5.502 2.851 2.990 Chamrajnagar 7.637 7.637 27.547 18.650 7.637 134.017 40.205 7.637 21.640 22.700 Chikmagalur 19.404 19.404 55.043 37.264 19.404 339.508 101.852 19.404 53.698 56.329 Chitradurga 21.615 9.354 12.432 8.416 12.054 106.292 31.888 21.615 23.517 24.669 Dakshin Kannad 31.467 31.467 60.956 41.267 31.467 412.911 123.873 31.467 64.461 67.619 Davanagere 8.525 8.525 21.138 14.310 8.525 146.237 43.871 8.525 23.492 24.643 Dharwad 2.669 2.669 7.628 5.164 2.669 49.276 14.783 2.669 7.726 8.105 Gadag 1.010 1.010 2.416 1.635 1.010 15.367 4.610 1.010 2.557 2.682
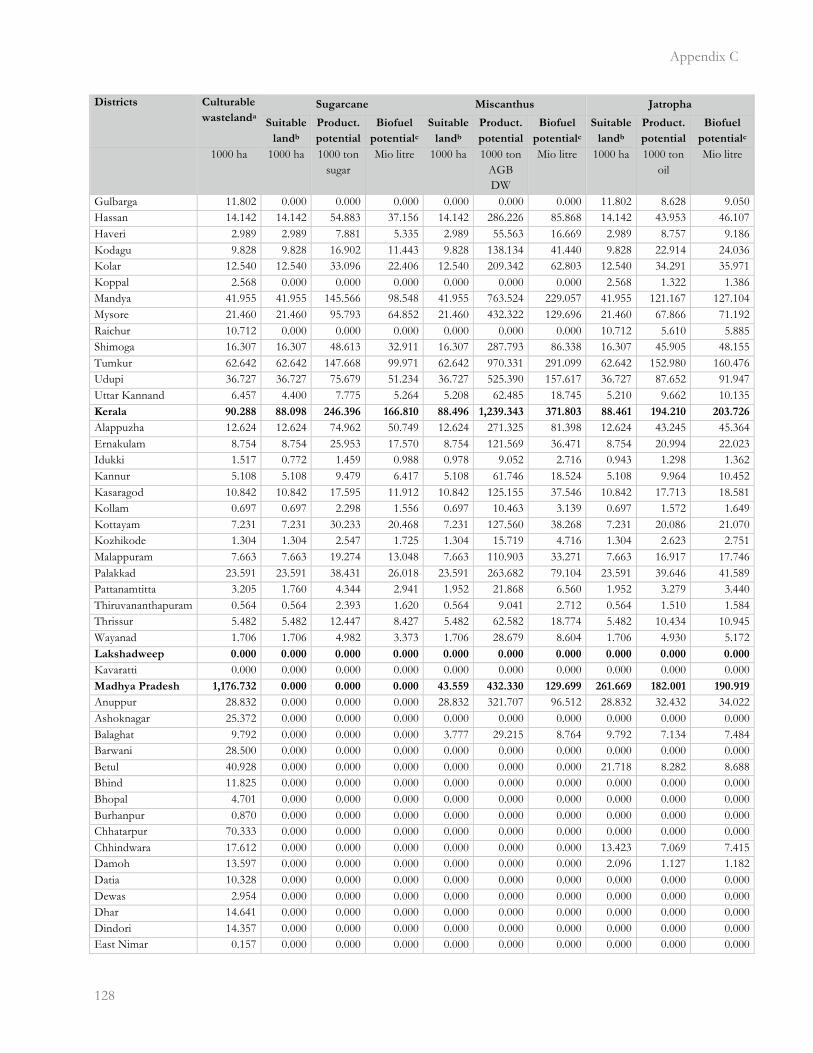
Appendix C
�128
Districts Culturable
wastelanda
Sugarcane Miscanthus Jatropha
Suitable
landb
Product.
potential
Biofuel
potentialc
Suitable
landb
Product.
potential
Biofuel
potentialc
Suitable
landb
Product.
potential
Biofuel
potentialc
1000 ha 1000 ha 1000 ton sugar
Mio litre 1000 ha 1000 ton AGB DW
Mio litre 1000 ha 1000 ton oil
Mio litre
Gulbarga 11.802 0.000 0.000 0.000 0.000 0.000 0.000 11.802 8.628 9.050 Hassan 14.142 14.142 54.883 37.156 14.142 286.226 85.868 14.142 43.953 46.107 Haveri 2.989 2.989 7.881 5.335 2.989 55.563 16.669 2.989 8.757 9.186 Kodagu 9.828 9.828 16.902 11.443 9.828 138.134 41.440 9.828 22.914 24.036 Kolar 12.540 12.540 33.096 22.406 12.540 209.342 62.803 12.540 34.291 35.971 Koppal 2.568 0.000 0.000 0.000 0.000 0.000 0.000 2.568 1.322 1.386 Mandya 41.955 41.955 145.566 98.548 41.955 763.524 229.057 41.955 121.167 127.104 Mysore 21.460 21.460 95.793 64.852 21.460 432.322 129.696 21.460 67.866 71.192 Raichur 10.712 0.000 0.000 0.000 0.000 0.000 0.000 10.712 5.610 5.885 Shimoga 16.307 16.307 48.613 32.911 16.307 287.793 86.338 16.307 45.905 48.155 Tumkur 62.642 62.642 147.668 99.971 62.642 970.331 291.099 62.642 152.980 160.476 Udupi 36.727 36.727 75.679 51.234 36.727 525.390 157.617 36.727 87.652 91.947 Uttar Kannand 6.457 4.400 7.775 5.264 5.208 62.485 18.745 5.210 9.662 10.135 Kerala 90.288 88.098 246.396 166.810 88.496 1,239.343 371.803 88.461 194.210 203.726
Alappuzha 12.624 12.624 74.962 50.749 12.624 271.325 81.398 12.624 43.245 45.364 Ernakulam 8.754 8.754 25.953 17.570 8.754 121.569 36.471 8.754 20.994 22.023 Idukki 1.517 0.772 1.459 0.988 0.978 9.052 2.716 0.943 1.298 1.362 Kannur 5.108 5.108 9.479 6.417 5.108 61.746 18.524 5.108 9.964 10.452 Kasaragod 10.842 10.842 17.595 11.912 10.842 125.155 37.546 10.842 17.713 18.581 Kollam 0.697 0.697 2.298 1.556 0.697 10.463 3.139 0.697 1.572 1.649 Kottayam 7.231 7.231 30.233 20.468 7.231 127.560 38.268 7.231 20.086 21.070 Kozhikode 1.304 1.304 2.547 1.725 1.304 15.719 4.716 1.304 2.623 2.751 Malappuram 7.663 7.663 19.274 13.048 7.663 110.903 33.271 7.663 16.917 17.746 Palakkad 23.591 23.591 38.431 26.018 23.591 263.682 79.104 23.591 39.646 41.589 Pattanamtitta 3.205 1.760 4.344 2.941 1.952 21.868 6.560 1.952 3.279 3.440 Thiruvananthapuram 0.564 0.564 2.393 1.620 0.564 9.041 2.712 0.564 1.510 1.584 Thrissur 5.482 5.482 12.447 8.427 5.482 62.582 18.774 5.482 10.434 10.945 Wayanad 1.706 1.706 4.982 3.373 1.706 28.679 8.604 1.706 4.930 5.172 Lakshadweep 0.000 0.000 0.000 0.000 0.000 0.000 0.000 0.000 0.000 0.000
Kavaratti 0.000 0.000 0.000 0.000 0.000 0.000 0.000 0.000 0.000 0.000 Madhya Pradesh 1,176.732 0.000 0.000 0.000 43.559 432.330 129.699 261.669 182.001 190.919
Anuppur 28.832 0.000 0.000 0.000 28.832 321.707 96.512 28.832 32.432 34.022 Ashoknagar 25.372 0.000 0.000 0.000 0.000 0.000 0.000 0.000 0.000 0.000 Balaghat 9.792 0.000 0.000 0.000 3.777 29.215 8.764 9.792 7.134 7.484 Barwani 28.500 0.000 0.000 0.000 0.000 0.000 0.000 0.000 0.000 0.000 Betul 40.928 0.000 0.000 0.000 0.000 0.000 0.000 21.718 8.282 8.688 Bhind 11.825 0.000 0.000 0.000 0.000 0.000 0.000 0.000 0.000 0.000 Bhopal 4.701 0.000 0.000 0.000 0.000 0.000 0.000 0.000 0.000 0.000 Burhanpur 0.870 0.000 0.000 0.000 0.000 0.000 0.000 0.000 0.000 0.000 Chhatarpur 70.333 0.000 0.000 0.000 0.000 0.000 0.000 0.000 0.000 0.000 Chhindwara 17.612 0.000 0.000 0.000 0.000 0.000 0.000 13.423 7.069 7.415 Damoh 13.597 0.000 0.000 0.000 0.000 0.000 0.000 2.096 1.127 1.182 Datia 10.328 0.000 0.000 0.000 0.000 0.000 0.000 0.000 0.000 0.000 Dewas 2.954 0.000 0.000 0.000 0.000 0.000 0.000 0.000 0.000 0.000 Dhar 14.641 0.000 0.000 0.000 0.000 0.000 0.000 0.000 0.000 0.000 Dindori 14.357 0.000 0.000 0.000 0.000 0.000 0.000 0.000 0.000 0.000 East Nimar 0.157 0.000 0.000 0.000 0.000 0.000 0.000 0.000 0.000 0.000
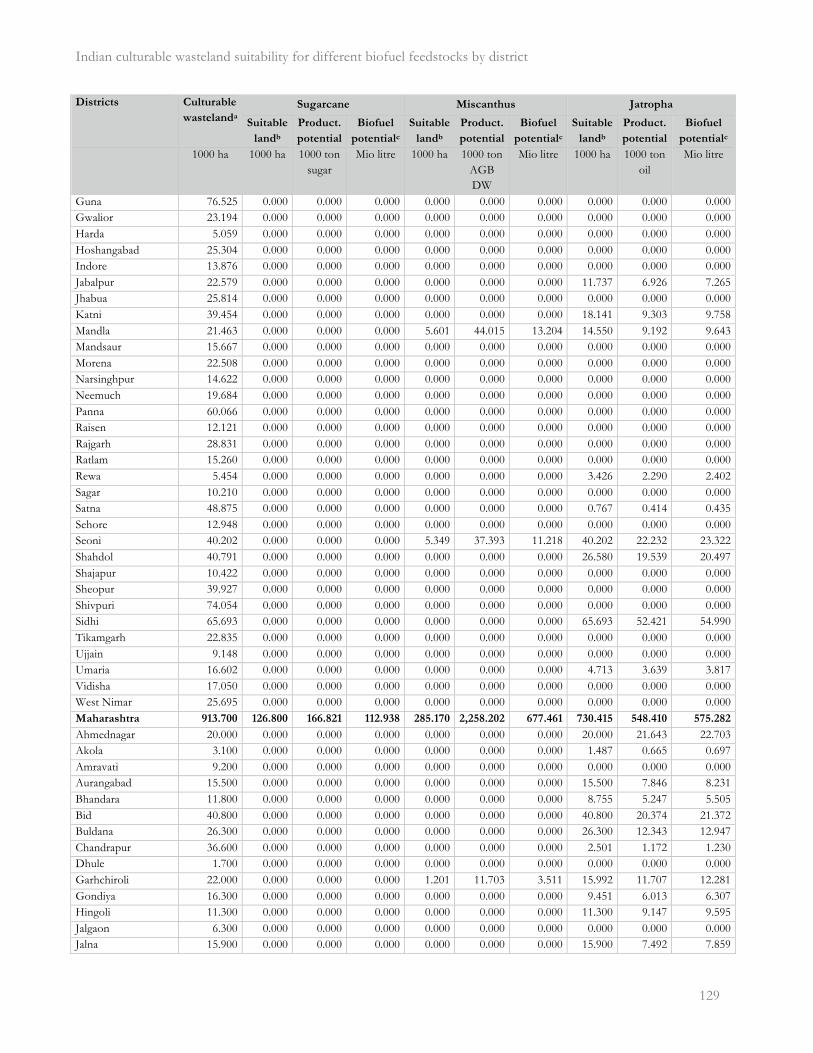
Indian culturable wasteland suitability for different biofuel feedstocks by district
� 129
Districts Culturable
wastelanda
Sugarcane Miscanthus Jatropha
Suitable
landb
Product.
potential
Biofuel
potentialc
Suitable
landb
Product.
potential
Biofuel
potentialc
Suitable
landb
Product.
potential
Biofuel
potentialc
1000 ha 1000 ha 1000 ton sugar
Mio litre 1000 ha 1000 ton AGB DW
Mio litre 1000 ha 1000 ton oil
Mio litre
Guna 76.525 0.000 0.000 0.000 0.000 0.000 0.000 0.000 0.000 0.000 Gwalior 23.194 0.000 0.000 0.000 0.000 0.000 0.000 0.000 0.000 0.000 Harda 5.059 0.000 0.000 0.000 0.000 0.000 0.000 0.000 0.000 0.000 Hoshangabad 25.304 0.000 0.000 0.000 0.000 0.000 0.000 0.000 0.000 0.000 Indore 13.876 0.000 0.000 0.000 0.000 0.000 0.000 0.000 0.000 0.000 Jabalpur 22.579 0.000 0.000 0.000 0.000 0.000 0.000 11.737 6.926 7.265 Jhabua 25.814 0.000 0.000 0.000 0.000 0.000 0.000 0.000 0.000 0.000 Katni 39.454 0.000 0.000 0.000 0.000 0.000 0.000 18.141 9.303 9.758 Mandla 21.463 0.000 0.000 0.000 5.601 44.015 13.204 14.550 9.192 9.643 Mandsaur 15.667 0.000 0.000 0.000 0.000 0.000 0.000 0.000 0.000 0.000 Morena 22.508 0.000 0.000 0.000 0.000 0.000 0.000 0.000 0.000 0.000 Narsinghpur 14.622 0.000 0.000 0.000 0.000 0.000 0.000 0.000 0.000 0.000 Neemuch 19.684 0.000 0.000 0.000 0.000 0.000 0.000 0.000 0.000 0.000 Panna 60.066 0.000 0.000 0.000 0.000 0.000 0.000 0.000 0.000 0.000 Raisen 12.121 0.000 0.000 0.000 0.000 0.000 0.000 0.000 0.000 0.000 Rajgarh 28.831 0.000 0.000 0.000 0.000 0.000 0.000 0.000 0.000 0.000 Ratlam 15.260 0.000 0.000 0.000 0.000 0.000 0.000 0.000 0.000 0.000 Rewa 5.454 0.000 0.000 0.000 0.000 0.000 0.000 3.426 2.290 2.402 Sagar 10.210 0.000 0.000 0.000 0.000 0.000 0.000 0.000 0.000 0.000 Satna 48.875 0.000 0.000 0.000 0.000 0.000 0.000 0.767 0.414 0.435 Sehore 12.948 0.000 0.000 0.000 0.000 0.000 0.000 0.000 0.000 0.000 Seoni 40.202 0.000 0.000 0.000 5.349 37.393 11.218 40.202 22.232 23.322 Shahdol 40.791 0.000 0.000 0.000 0.000 0.000 0.000 26.580 19.539 20.497 Shajapur 10.422 0.000 0.000 0.000 0.000 0.000 0.000 0.000 0.000 0.000 Sheopur 39.927 0.000 0.000 0.000 0.000 0.000 0.000 0.000 0.000 0.000 Shivpuri 74.054 0.000 0.000 0.000 0.000 0.000 0.000 0.000 0.000 0.000 Sidhi 65.693 0.000 0.000 0.000 0.000 0.000 0.000 65.693 52.421 54.990 Tikamgarh 22.835 0.000 0.000 0.000 0.000 0.000 0.000 0.000 0.000 0.000 Ujjain 9.148 0.000 0.000 0.000 0.000 0.000 0.000 0.000 0.000 0.000 Umaria 16.602 0.000 0.000 0.000 0.000 0.000 0.000 4.713 3.639 3.817 Vidisha 17.050 0.000 0.000 0.000 0.000 0.000 0.000 0.000 0.000 0.000 West Nimar 25.695 0.000 0.000 0.000 0.000 0.000 0.000 0.000 0.000 0.000 Maharashtra 913.700 126.800 166.821 112.938 285.170 2,258.202 677.461 730.415 548.410 575.282
Ahmednagar 20.000 0.000 0.000 0.000 0.000 0.000 0.000 20.000 21.643 22.703 Akola 3.100 0.000 0.000 0.000 0.000 0.000 0.000 1.487 0.665 0.697 Amravati 9.200 0.000 0.000 0.000 0.000 0.000 0.000 0.000 0.000 0.000 Aurangabad 15.500 0.000 0.000 0.000 0.000 0.000 0.000 15.500 7.846 8.231 Bhandara 11.800 0.000 0.000 0.000 0.000 0.000 0.000 8.755 5.247 5.505 Bid 40.800 0.000 0.000 0.000 0.000 0.000 0.000 40.800 20.374 21.372 Buldana 26.300 0.000 0.000 0.000 0.000 0.000 0.000 26.300 12.343 12.947 Chandrapur 36.600 0.000 0.000 0.000 0.000 0.000 0.000 2.501 1.172 1.230 Dhule 1.700 0.000 0.000 0.000 0.000 0.000 0.000 0.000 0.000 0.000 Garhchiroli 22.000 0.000 0.000 0.000 1.201 11.703 3.511 15.992 11.707 12.281 Gondiya 16.300 0.000 0.000 0.000 0.000 0.000 0.000 9.451 6.013 6.307 Hingoli 11.300 0.000 0.000 0.000 0.000 0.000 0.000 11.300 9.147 9.595 Jalgaon 6.300 0.000 0.000 0.000 0.000 0.000 0.000 0.000 0.000 0.000 Jalna 15.900 0.000 0.000 0.000 0.000 0.000 0.000 15.900 7.492 7.859
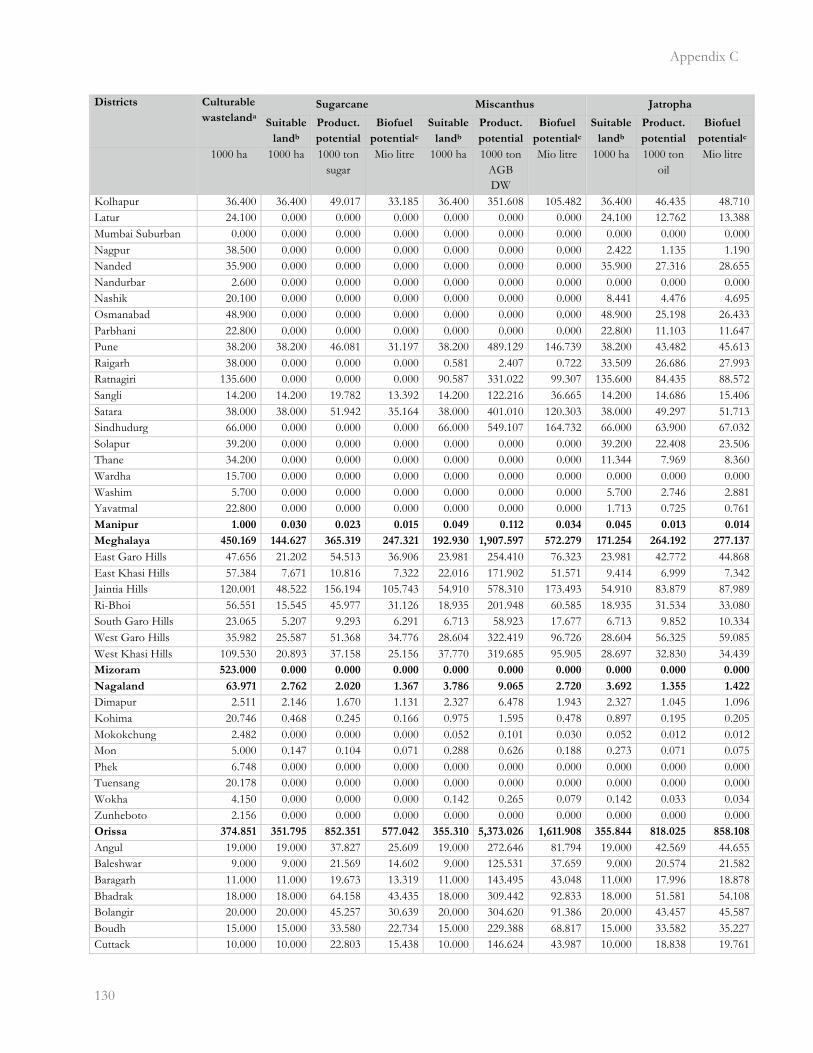
Appendix C
�130
Districts Culturable
wastelanda
Sugarcane Miscanthus Jatropha
Suitable
landb
Product.
potential
Biofuel
potentialc
Suitable
landb
Product.
potential
Biofuel
potentialc
Suitable
landb
Product.
potential
Biofuel
potentialc
1000 ha 1000 ha 1000 ton sugar
Mio litre 1000 ha 1000 ton AGB DW
Mio litre 1000 ha 1000 ton oil
Mio litre
Kolhapur 36.400 36.400 49.017 33.185 36.400 351.608 105.482 36.400 46.435 48.710 Latur 24.100 0.000 0.000 0.000 0.000 0.000 0.000 24.100 12.762 13.388 Mumbai Suburban 0.000 0.000 0.000 0.000 0.000 0.000 0.000 0.000 0.000 0.000 Nagpur 38.500 0.000 0.000 0.000 0.000 0.000 0.000 2.422 1.135 1.190 Nanded 35.900 0.000 0.000 0.000 0.000 0.000 0.000 35.900 27.316 28.655 Nandurbar 2.600 0.000 0.000 0.000 0.000 0.000 0.000 0.000 0.000 0.000 Nashik 20.100 0.000 0.000 0.000 0.000 0.000 0.000 8.441 4.476 4.695 Osmanabad 48.900 0.000 0.000 0.000 0.000 0.000 0.000 48.900 25.198 26.433 Parbhani 22.800 0.000 0.000 0.000 0.000 0.000 0.000 22.800 11.103 11.647 Pune 38.200 38.200 46.081 31.197 38.200 489.129 146.739 38.200 43.482 45.613 Raigarh 38.000 0.000 0.000 0.000 0.581 2.407 0.722 33.509 26.686 27.993 Ratnagiri 135.600 0.000 0.000 0.000 90.587 331.022 99.307 135.600 84.435 88.572 Sangli 14.200 14.200 19.782 13.392 14.200 122.216 36.665 14.200 14.686 15.406 Satara 38.000 38.000 51.942 35.164 38.000 401.010 120.303 38.000 49.297 51.713 Sindhudurg 66.000 0.000 0.000 0.000 66.000 549.107 164.732 66.000 63.900 67.032 Solapur 39.200 0.000 0.000 0.000 0.000 0.000 0.000 39.200 22.408 23.506 Thane 34.200 0.000 0.000 0.000 0.000 0.000 0.000 11.344 7.969 8.360 Wardha 15.700 0.000 0.000 0.000 0.000 0.000 0.000 0.000 0.000 0.000 Washim 5.700 0.000 0.000 0.000 0.000 0.000 0.000 5.700 2.746 2.881 Yavatmal 22.800 0.000 0.000 0.000 0.000 0.000 0.000 1.713 0.725 0.761 Manipur 1.000 0.030 0.023 0.015 0.049 0.112 0.034 0.045 0.013 0.014
Meghalaya 450.169 144.627 365.319 247.321 192.930 1,907.597 572.279 171.254 264.192 277.137
East Garo Hills 47.656 21.202 54.513 36.906 23.981 254.410 76.323 23.981 42.772 44.868 East Khasi Hills 57.384 7.671 10.816 7.322 22.016 171.902 51.571 9.414 6.999 7.342 Jaintia Hills 120.001 48.522 156.194 105.743 54.910 578.310 173.493 54.910 83.879 87.989 Ri-Bhoi 56.551 15.545 45.977 31.126 18.935 201.948 60.585 18.935 31.534 33.080 South Garo Hills 23.065 5.207 9.293 6.291 6.713 58.923 17.677 6.713 9.852 10.334 West Garo Hills 35.982 25.587 51.368 34.776 28.604 322.419 96.726 28.604 56.325 59.085 West Khasi Hills 109.530 20.893 37.158 25.156 37.770 319.685 95.905 28.697 32.830 34.439 Mizoram 523.000 0.000 0.000 0.000 0.000 0.000 0.000 0.000 0.000 0.000
Nagaland 63.971 2.762 2.020 1.367 3.786 9.065 2.720 3.692 1.355 1.422
Dimapur 2.511 2.146 1.670 1.131 2.327 6.478 1.943 2.327 1.045 1.096 Kohima 20.746 0.468 0.245 0.166 0.975 1.595 0.478 0.897 0.195 0.205 Mokokchung 2.482 0.000 0.000 0.000 0.052 0.101 0.030 0.052 0.012 0.012 Mon 5.000 0.147 0.104 0.071 0.288 0.626 0.188 0.273 0.071 0.075 Phek 6.748 0.000 0.000 0.000 0.000 0.000 0.000 0.000 0.000 0.000 Tuensang 20.178 0.000 0.000 0.000 0.000 0.000 0.000 0.000 0.000 0.000 Wokha 4.150 0.000 0.000 0.000 0.142 0.265 0.079 0.142 0.033 0.034 Zunheboto 2.156 0.000 0.000 0.000 0.000 0.000 0.000 0.000 0.000 0.000 Orissa 374.851 351.795 852.351 577.042 355.310 5,373.026 1,611.908 355.844 818.025 858.108
Angul 19.000 19.000 37.827 25.609 19.000 272.646 81.794 19.000 42.569 44.655 Baleshwar 9.000 9.000 21.569 14.602 9.000 125.531 37.659 9.000 20.574 21.582 Baragarh 11.000 11.000 19.673 13.319 11.000 143.495 43.048 11.000 17.996 18.878 Bhadrak 18.000 18.000 64.158 43.435 18.000 309.442 92.833 18.000 51.581 54.108 Bolangir 20.000 20.000 45.257 30.639 20.000 304.620 91.386 20.000 43.457 45.587 Boudh 15.000 15.000 33.580 22.734 15.000 229.388 68.817 15.000 33.582 35.227 Cuttack 10.000 10.000 22.803 15.438 10.000 146.624 43.987 10.000 18.838 19.761
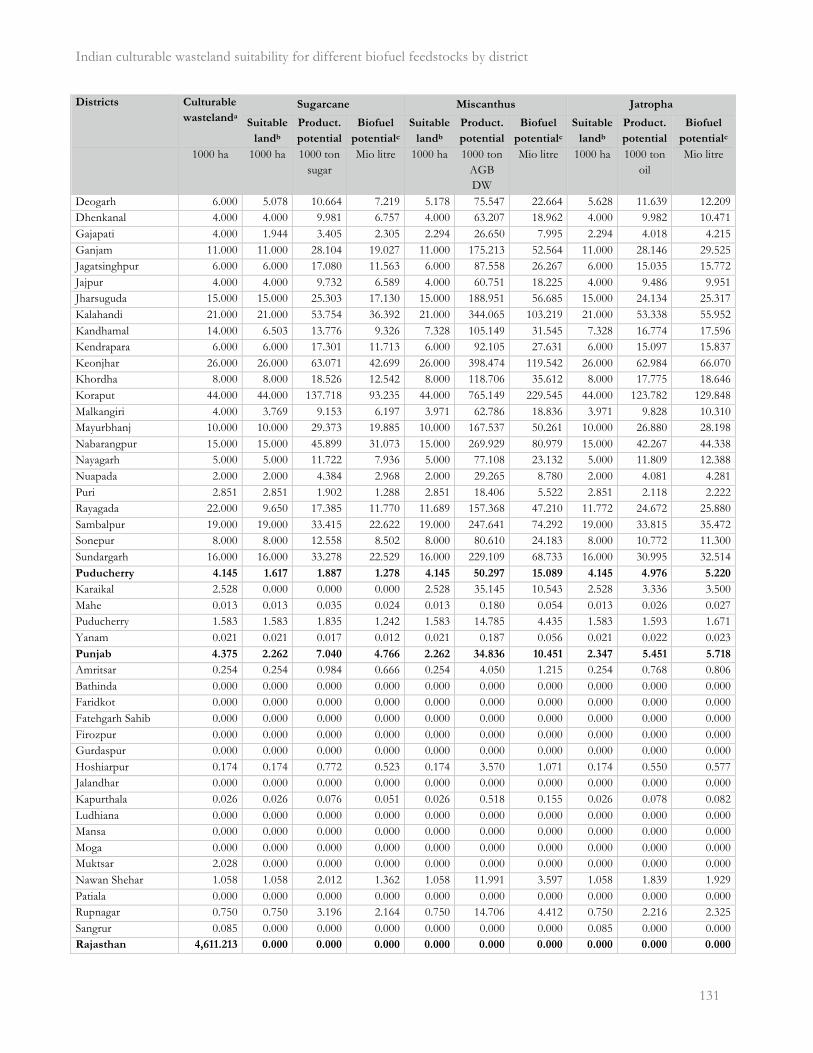
Indian culturable wasteland suitability for different biofuel feedstocks by district
� 131
Districts Culturable
wastelanda
Sugarcane Miscanthus Jatropha
Suitable
landb
Product.
potential
Biofuel
potentialc
Suitable
landb
Product.
potential
Biofuel
potentialc
Suitable
landb
Product.
potential
Biofuel
potentialc
1000 ha 1000 ha 1000 ton sugar
Mio litre 1000 ha 1000 ton AGB DW
Mio litre 1000 ha 1000 ton oil
Mio litre
Deogarh 6.000 5.078 10.664 7.219 5.178 75.547 22.664 5.628 11.639 12.209 Dhenkanal 4.000 4.000 9.981 6.757 4.000 63.207 18.962 4.000 9.982 10.471 Gajapati 4.000 1.944 3.405 2.305 2.294 26.650 7.995 2.294 4.018 4.215 Ganjam 11.000 11.000 28.104 19.027 11.000 175.213 52.564 11.000 28.146 29.525 Jagatsinghpur 6.000 6.000 17.080 11.563 6.000 87.558 26.267 6.000 15.035 15.772 Jajpur 4.000 4.000 9.732 6.589 4.000 60.751 18.225 4.000 9.486 9.951 Jharsuguda 15.000 15.000 25.303 17.130 15.000 188.951 56.685 15.000 24.134 25.317 Kalahandi 21.000 21.000 53.754 36.392 21.000 344.065 103.219 21.000 53.338 55.952 Kandhamal 14.000 6.503 13.776 9.326 7.328 105.149 31.545 7.328 16.774 17.596 Kendrapara 6.000 6.000 17.301 11.713 6.000 92.105 27.631 6.000 15.097 15.837 Keonjhar 26.000 26.000 63.071 42.699 26.000 398.474 119.542 26.000 62.984 66.070 Khordha 8.000 8.000 18.526 12.542 8.000 118.706 35.612 8.000 17.775 18.646 Koraput 44.000 44.000 137.718 93.235 44.000 765.149 229.545 44.000 123.782 129.848 Malkangiri 4.000 3.769 9.153 6.197 3.971 62.786 18.836 3.971 9.828 10.310 Mayurbhanj 10.000 10.000 29.373 19.885 10.000 167.537 50.261 10.000 26.880 28.198 Nabarangpur 15.000 15.000 45.899 31.073 15.000 269.929 80.979 15.000 42.267 44.338 Nayagarh 5.000 5.000 11.722 7.936 5.000 77.108 23.132 5.000 11.809 12.388 Nuapada 2.000 2.000 4.384 2.968 2.000 29.265 8.780 2.000 4.081 4.281 Puri 2.851 2.851 1.902 1.288 2.851 18.406 5.522 2.851 2.118 2.222 Rayagada 22.000 9.650 17.385 11.770 11.689 157.368 47.210 11.772 24.672 25.880 Sambalpur 19.000 19.000 33.415 22.622 19.000 247.641 74.292 19.000 33.815 35.472 Sonepur 8.000 8.000 12.558 8.502 8.000 80.610 24.183 8.000 10.772 11.300 Sundargarh 16.000 16.000 33.278 22.529 16.000 229.109 68.733 16.000 30.995 32.514 Puducherry 4.145 1.617 1.887 1.278 4.145 50.297 15.089 4.145 4.976 5.220
Karaikal 2.528 0.000 0.000 0.000 2.528 35.145 10.543 2.528 3.336 3.500 Mahe 0.013 0.013 0.035 0.024 0.013 0.180 0.054 0.013 0.026 0.027 Puducherry 1.583 1.583 1.835 1.242 1.583 14.785 4.435 1.583 1.593 1.671 Yanam 0.021 0.021 0.017 0.012 0.021 0.187 0.056 0.021 0.022 0.023 Punjab 4.375 2.262 7.040 4.766 2.262 34.836 10.451 2.347 5.451 5.718
Amritsar 0.254 0.254 0.984 0.666 0.254 4.050 1.215 0.254 0.768 0.806 Bathinda 0.000 0.000 0.000 0.000 0.000 0.000 0.000 0.000 0.000 0.000 Faridkot 0.000 0.000 0.000 0.000 0.000 0.000 0.000 0.000 0.000 0.000 Fatehgarh Sahib 0.000 0.000 0.000 0.000 0.000 0.000 0.000 0.000 0.000 0.000 Firozpur 0.000 0.000 0.000 0.000 0.000 0.000 0.000 0.000 0.000 0.000 Gurdaspur 0.000 0.000 0.000 0.000 0.000 0.000 0.000 0.000 0.000 0.000 Hoshiarpur 0.174 0.174 0.772 0.523 0.174 3.570 1.071 0.174 0.550 0.577 Jalandhar 0.000 0.000 0.000 0.000 0.000 0.000 0.000 0.000 0.000 0.000 Kapurthala 0.026 0.026 0.076 0.051 0.026 0.518 0.155 0.026 0.078 0.082 Ludhiana 0.000 0.000 0.000 0.000 0.000 0.000 0.000 0.000 0.000 0.000 Mansa 0.000 0.000 0.000 0.000 0.000 0.000 0.000 0.000 0.000 0.000 Moga 0.000 0.000 0.000 0.000 0.000 0.000 0.000 0.000 0.000 0.000 Muktsar 2.028 0.000 0.000 0.000 0.000 0.000 0.000 0.000 0.000 0.000 Nawan Shehar 1.058 1.058 2.012 1.362 1.058 11.991 3.597 1.058 1.839 1.929 Patiala 0.000 0.000 0.000 0.000 0.000 0.000 0.000 0.000 0.000 0.000 Rupnagar 0.750 0.750 3.196 2.164 0.750 14.706 4.412 0.750 2.216 2.325 Sangrur 0.085 0.000 0.000 0.000 0.000 0.000 0.000 0.085 0.000 0.000 Rajasthan 4,611.213 0.000 0.000 0.000 0.000 0.000 0.000 0.000 0.000 0.000
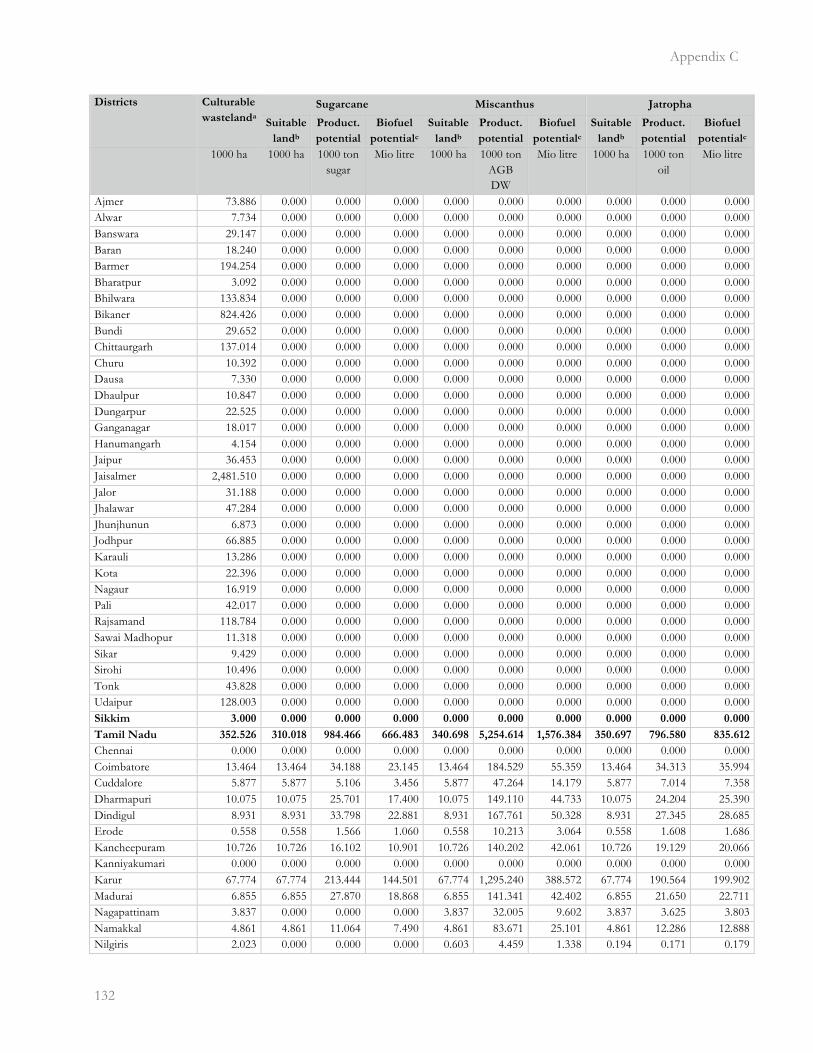
Appendix C
�132
Districts Culturable
wastelanda
Sugarcane Miscanthus Jatropha
Suitable
landb
Product.
potential
Biofuel
potentialc
Suitable
landb
Product.
potential
Biofuel
potentialc
Suitable
landb
Product.
potential
Biofuel
potentialc
1000 ha 1000 ha 1000 ton sugar
Mio litre 1000 ha 1000 ton AGB DW
Mio litre 1000 ha 1000 ton oil
Mio litre
Ajmer 73.886 0.000 0.000 0.000 0.000 0.000 0.000 0.000 0.000 0.000 Alwar 7.734 0.000 0.000 0.000 0.000 0.000 0.000 0.000 0.000 0.000 Banswara 29.147 0.000 0.000 0.000 0.000 0.000 0.000 0.000 0.000 0.000 Baran 18.240 0.000 0.000 0.000 0.000 0.000 0.000 0.000 0.000 0.000 Barmer 194.254 0.000 0.000 0.000 0.000 0.000 0.000 0.000 0.000 0.000 Bharatpur 3.092 0.000 0.000 0.000 0.000 0.000 0.000 0.000 0.000 0.000 Bhilwara 133.834 0.000 0.000 0.000 0.000 0.000 0.000 0.000 0.000 0.000 Bikaner 824.426 0.000 0.000 0.000 0.000 0.000 0.000 0.000 0.000 0.000 Bundi 29.652 0.000 0.000 0.000 0.000 0.000 0.000 0.000 0.000 0.000 Chittaurgarh 137.014 0.000 0.000 0.000 0.000 0.000 0.000 0.000 0.000 0.000 Churu 10.392 0.000 0.000 0.000 0.000 0.000 0.000 0.000 0.000 0.000 Dausa 7.330 0.000 0.000 0.000 0.000 0.000 0.000 0.000 0.000 0.000 Dhaulpur 10.847 0.000 0.000 0.000 0.000 0.000 0.000 0.000 0.000 0.000 Dungarpur 22.525 0.000 0.000 0.000 0.000 0.000 0.000 0.000 0.000 0.000 Ganganagar 18.017 0.000 0.000 0.000 0.000 0.000 0.000 0.000 0.000 0.000 Hanumangarh 4.154 0.000 0.000 0.000 0.000 0.000 0.000 0.000 0.000 0.000 Jaipur 36.453 0.000 0.000 0.000 0.000 0.000 0.000 0.000 0.000 0.000 Jaisalmer 2,481.510 0.000 0.000 0.000 0.000 0.000 0.000 0.000 0.000 0.000 Jalor 31.188 0.000 0.000 0.000 0.000 0.000 0.000 0.000 0.000 0.000 Jhalawar 47.284 0.000 0.000 0.000 0.000 0.000 0.000 0.000 0.000 0.000 Jhunjhunun 6.873 0.000 0.000 0.000 0.000 0.000 0.000 0.000 0.000 0.000 Jodhpur 66.885 0.000 0.000 0.000 0.000 0.000 0.000 0.000 0.000 0.000 Karauli 13.286 0.000 0.000 0.000 0.000 0.000 0.000 0.000 0.000 0.000 Kota 22.396 0.000 0.000 0.000 0.000 0.000 0.000 0.000 0.000 0.000 Nagaur 16.919 0.000 0.000 0.000 0.000 0.000 0.000 0.000 0.000 0.000 Pali 42.017 0.000 0.000 0.000 0.000 0.000 0.000 0.000 0.000 0.000 Rajsamand 118.784 0.000 0.000 0.000 0.000 0.000 0.000 0.000 0.000 0.000 Sawai Madhopur 11.318 0.000 0.000 0.000 0.000 0.000 0.000 0.000 0.000 0.000 Sikar 9.429 0.000 0.000 0.000 0.000 0.000 0.000 0.000 0.000 0.000 Sirohi 10.496 0.000 0.000 0.000 0.000 0.000 0.000 0.000 0.000 0.000 Tonk 43.828 0.000 0.000 0.000 0.000 0.000 0.000 0.000 0.000 0.000 Udaipur 128.003 0.000 0.000 0.000 0.000 0.000 0.000 0.000 0.000 0.000 Sikkim 3.000 0.000 0.000 0.000 0.000 0.000 0.000 0.000 0.000 0.000
Tamil Nadu 352.526 310.018 984.466 666.483 340.698 5,254.614 1,576.384 350.697 796.580 835.612
Chennai 0.000 0.000 0.000 0.000 0.000 0.000 0.000 0.000 0.000 0.000 Coimbatore 13.464 13.464 34.188 23.145 13.464 184.529 55.359 13.464 34.313 35.994 Cuddalore 5.877 5.877 5.106 3.456 5.877 47.264 14.179 5.877 7.014 7.358 Dharmapuri 10.075 10.075 25.701 17.400 10.075 149.110 44.733 10.075 24.204 25.390 Dindigul 8.931 8.931 33.798 22.881 8.931 167.761 50.328 8.931 27.345 28.685 Erode 0.558 0.558 1.566 1.060 0.558 10.213 3.064 0.558 1.608 1.686 Kancheepuram 10.726 10.726 16.102 10.901 10.726 140.202 42.061 10.726 19.129 20.066 Kanniyakumari 0.000 0.000 0.000 0.000 0.000 0.000 0.000 0.000 0.000 0.000 Karur 67.774 67.774 213.444 144.501 67.774 1,295.240 388.572 67.774 190.564 199.902 Madurai 6.855 6.855 27.870 18.868 6.855 141.341 42.402 6.855 21.650 22.711 Nagapattinam 3.837 0.000 0.000 0.000 3.837 32.005 9.602 3.837 3.625 3.803 Namakkal 4.861 4.861 11.064 7.490 4.861 83.671 25.101 4.861 12.286 12.888 Nilgiris 2.023 0.000 0.000 0.000 0.603 4.459 1.338 0.194 0.171 0.179
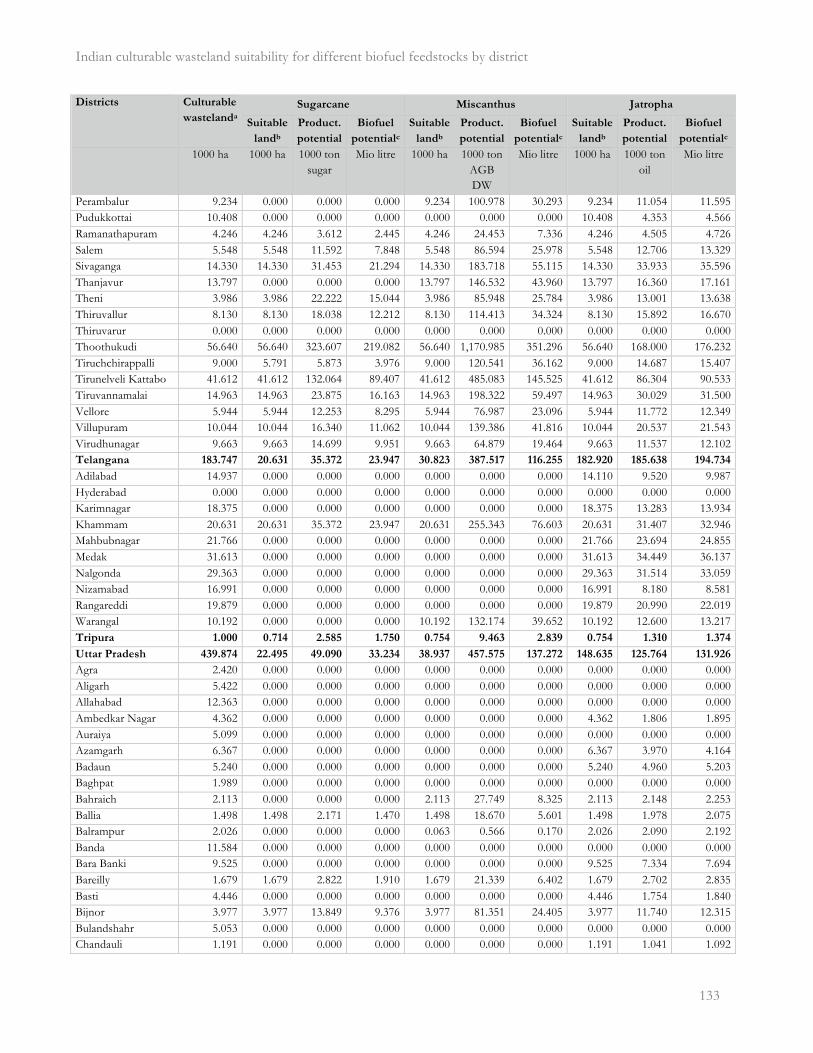
Indian culturable wasteland suitability for different biofuel feedstocks by district
� 133
Districts Culturable
wastelanda
Sugarcane Miscanthus Jatropha
Suitable
landb
Product.
potential
Biofuel
potentialc
Suitable
landb
Product.
potential
Biofuel
potentialc
Suitable
landb
Product.
potential
Biofuel
potentialc
1000 ha 1000 ha 1000 ton sugar
Mio litre 1000 ha 1000 ton AGB DW
Mio litre 1000 ha 1000 ton oil
Mio litre
Perambalur 9.234 0.000 0.000 0.000 9.234 100.978 30.293 9.234 11.054 11.595 Pudukkottai 10.408 0.000 0.000 0.000 0.000 0.000 0.000 10.408 4.353 4.566 Ramanathapuram 4.246 4.246 3.612 2.445 4.246 24.453 7.336 4.246 4.505 4.726 Salem 5.548 5.548 11.592 7.848 5.548 86.594 25.978 5.548 12.706 13.329 Sivaganga 14.330 14.330 31.453 21.294 14.330 183.718 55.115 14.330 33.933 35.596 Thanjavur 13.797 0.000 0.000 0.000 13.797 146.532 43.960 13.797 16.360 17.161 Theni 3.986 3.986 22.222 15.044 3.986 85.948 25.784 3.986 13.001 13.638 Thiruvallur 8.130 8.130 18.038 12.212 8.130 114.413 34.324 8.130 15.892 16.670 Thiruvarur 0.000 0.000 0.000 0.000 0.000 0.000 0.000 0.000 0.000 0.000 Thoothukudi 56.640 56.640 323.607 219.082 56.640 1,170.985 351.296 56.640 168.000 176.232 Tiruchchirappalli 9.000 5.791 5.873 3.976 9.000 120.541 36.162 9.000 14.687 15.407 Tirunelveli Kattabo 41.612 41.612 132.064 89.407 41.612 485.083 145.525 41.612 86.304 90.533 Tiruvannamalai 14.963 14.963 23.875 16.163 14.963 198.322 59.497 14.963 30.029 31.500 Vellore 5.944 5.944 12.253 8.295 5.944 76.987 23.096 5.944 11.772 12.349 Villupuram 10.044 10.044 16.340 11.062 10.044 139.386 41.816 10.044 20.537 21.543 Virudhunagar 9.663 9.663 14.699 9.951 9.663 64.879 19.464 9.663 11.537 12.102 Telangana 183.747 20.631 35.372 23.947 30.823 387.517 116.255 182.920 185.638 194.734
Adilabad 14.937 0.000 0.000 0.000 0.000 0.000 0.000 14.110 9.520 9.987 Hyderabad 0.000 0.000 0.000 0.000 0.000 0.000 0.000 0.000 0.000 0.000 Karimnagar 18.375 0.000 0.000 0.000 0.000 0.000 0.000 18.375 13.283 13.934 Khammam 20.631 20.631 35.372 23.947 20.631 255.343 76.603 20.631 31.407 32.946 Mahbubnagar 21.766 0.000 0.000 0.000 0.000 0.000 0.000 21.766 23.694 24.855 Medak 31.613 0.000 0.000 0.000 0.000 0.000 0.000 31.613 34.449 36.137 Nalgonda 29.363 0.000 0.000 0.000 0.000 0.000 0.000 29.363 31.514 33.059 Nizamabad 16.991 0.000 0.000 0.000 0.000 0.000 0.000 16.991 8.180 8.581 Rangareddi 19.879 0.000 0.000 0.000 0.000 0.000 0.000 19.879 20.990 22.019 Warangal 10.192 0.000 0.000 0.000 10.192 132.174 39.652 10.192 12.600 13.217 Tripura 1.000 0.714 2.585 1.750 0.754 9.463 2.839 0.754 1.310 1.374
Uttar Pradesh 439.874 22.495 49.090 33.234 38.937 457.575 137.272 148.635 125.764 131.926
Agra 2.420 0.000 0.000 0.000 0.000 0.000 0.000 0.000 0.000 0.000 Aligarh 5.422 0.000 0.000 0.000 0.000 0.000 0.000 0.000 0.000 0.000 Allahabad 12.363 0.000 0.000 0.000 0.000 0.000 0.000 0.000 0.000 0.000 Ambedkar Nagar 4.362 0.000 0.000 0.000 0.000 0.000 0.000 4.362 1.806 1.895 Auraiya 5.099 0.000 0.000 0.000 0.000 0.000 0.000 0.000 0.000 0.000 Azamgarh 6.367 0.000 0.000 0.000 0.000 0.000 0.000 6.367 3.970 4.164 Badaun 5.240 0.000 0.000 0.000 0.000 0.000 0.000 5.240 4.960 5.203 Baghpat 1.989 0.000 0.000 0.000 0.000 0.000 0.000 0.000 0.000 0.000 Bahraich 2.113 0.000 0.000 0.000 2.113 27.749 8.325 2.113 2.148 2.253 Ballia 1.498 1.498 2.171 1.470 1.498 18.670 5.601 1.498 1.978 2.075 Balrampur 2.026 0.000 0.000 0.000 0.063 0.566 0.170 2.026 2.090 2.192 Banda 11.584 0.000 0.000 0.000 0.000 0.000 0.000 0.000 0.000 0.000 Bara Banki 9.525 0.000 0.000 0.000 0.000 0.000 0.000 9.525 7.334 7.694 Bareilly 1.679 1.679 2.822 1.910 1.679 21.339 6.402 1.679 2.702 2.835 Basti 4.446 0.000 0.000 0.000 0.000 0.000 0.000 4.446 1.754 1.840 Bijnor 3.977 3.977 13.849 9.376 3.977 81.351 24.405 3.977 11.740 12.315 Bulandshahr 5.053 0.000 0.000 0.000 0.000 0.000 0.000 0.000 0.000 0.000 Chandauli 1.191 0.000 0.000 0.000 0.000 0.000 0.000 1.191 1.041 1.092
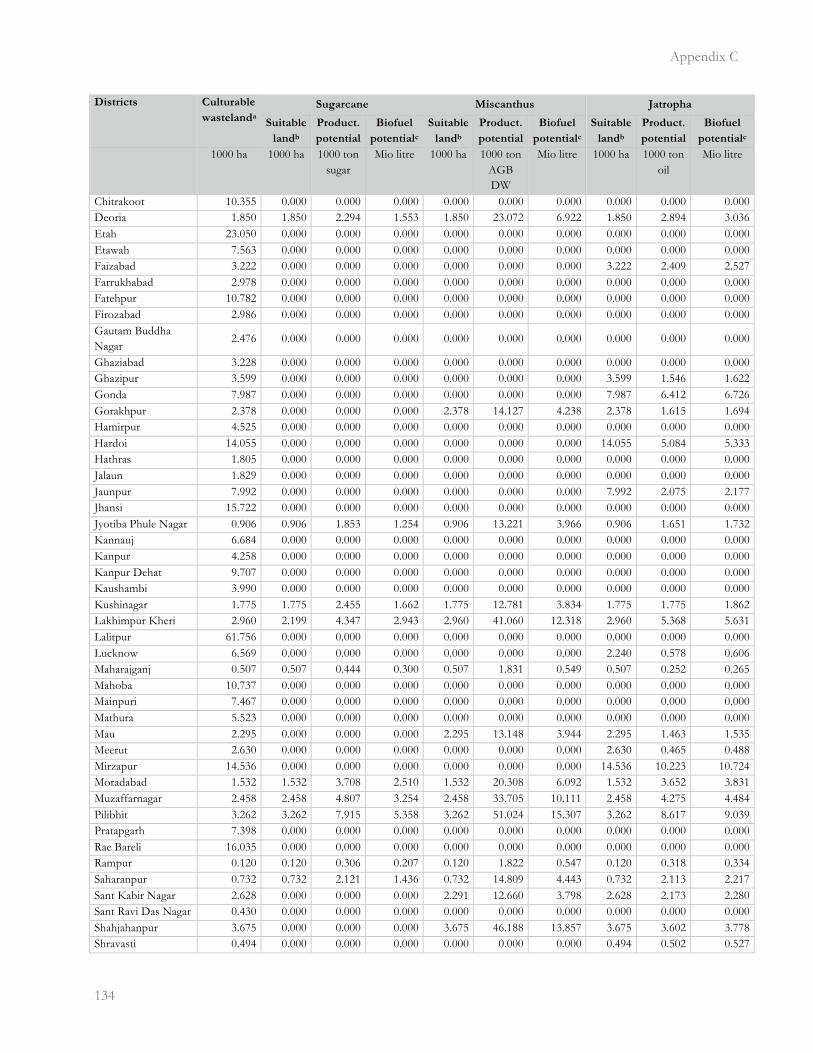
Appendix C
�134
Districts Culturable
wastelanda
Sugarcane Miscanthus Jatropha
Suitable
landb
Product.
potential
Biofuel
potentialc
Suitable
landb
Product.
potential
Biofuel
potentialc
Suitable
landb
Product.
potential
Biofuel
potentialc
1000 ha 1000 ha 1000 ton sugar
Mio litre 1000 ha 1000 ton AGB DW
Mio litre 1000 ha 1000 ton oil
Mio litre
Chitrakoot 10.355 0.000 0.000 0.000 0.000 0.000 0.000 0.000 0.000 0.000 Deoria 1.850 1.850 2.294 1.553 1.850 23.072 6.922 1.850 2.894 3.036 Etah 23.050 0.000 0.000 0.000 0.000 0.000 0.000 0.000 0.000 0.000 Etawah 7.563 0.000 0.000 0.000 0.000 0.000 0.000 0.000 0.000 0.000 Faizabad 3.222 0.000 0.000 0.000 0.000 0.000 0.000 3.222 2.409 2.527 Farrukhabad 2.978 0.000 0.000 0.000 0.000 0.000 0.000 0.000 0.000 0.000 Fatehpur 10.782 0.000 0.000 0.000 0.000 0.000 0.000 0.000 0.000 0.000 Firozabad 2.986 0.000 0.000 0.000 0.000 0.000 0.000 0.000 0.000 0.000 Gautam Buddha Nagar
2.476 0.000 0.000 0.000 0.000 0.000 0.000 0.000 0.000 0.000
Ghaziabad 3.228 0.000 0.000 0.000 0.000 0.000 0.000 0.000 0.000 0.000 Ghazipur 3.599 0.000 0.000 0.000 0.000 0.000 0.000 3.599 1.546 1.622 Gonda 7.987 0.000 0.000 0.000 0.000 0.000 0.000 7.987 6.412 6.726 Gorakhpur 2.378 0.000 0.000 0.000 2.378 14.127 4.238 2.378 1.615 1.694 Hamirpur 4.525 0.000 0.000 0.000 0.000 0.000 0.000 0.000 0.000 0.000 Hardoi 14.055 0.000 0.000 0.000 0.000 0.000 0.000 14.055 5.084 5.333 Hathras 1.805 0.000 0.000 0.000 0.000 0.000 0.000 0.000 0.000 0.000 Jalaun 1.829 0.000 0.000 0.000 0.000 0.000 0.000 0.000 0.000 0.000 Jaunpur 7.992 0.000 0.000 0.000 0.000 0.000 0.000 7.992 2.075 2.177 Jhansi 15.722 0.000 0.000 0.000 0.000 0.000 0.000 0.000 0.000 0.000 Jyotiba Phule Nagar 0.906 0.906 1.853 1.254 0.906 13.221 3.966 0.906 1.651 1.732 Kannauj 6.684 0.000 0.000 0.000 0.000 0.000 0.000 0.000 0.000 0.000 Kanpur 4.258 0.000 0.000 0.000 0.000 0.000 0.000 0.000 0.000 0.000 Kanpur Dehat 9.707 0.000 0.000 0.000 0.000 0.000 0.000 0.000 0.000 0.000 Kaushambi 3.990 0.000 0.000 0.000 0.000 0.000 0.000 0.000 0.000 0.000 Kushinagar 1.775 1.775 2.455 1.662 1.775 12.781 3.834 1.775 1.775 1.862 Lakhimpur Kheri 2.960 2.199 4.347 2.943 2.960 41.060 12.318 2.960 5.368 5.631 Lalitpur 61.756 0.000 0.000 0.000 0.000 0.000 0.000 0.000 0.000 0.000 Lucknow 6.569 0.000 0.000 0.000 0.000 0.000 0.000 2.240 0.578 0.606 Maharajganj 0.507 0.507 0.444 0.300 0.507 1.831 0.549 0.507 0.252 0.265 Mahoba 10.737 0.000 0.000 0.000 0.000 0.000 0.000 0.000 0.000 0.000 Mainpuri 7.467 0.000 0.000 0.000 0.000 0.000 0.000 0.000 0.000 0.000 Mathura 5.523 0.000 0.000 0.000 0.000 0.000 0.000 0.000 0.000 0.000 Mau 2.295 0.000 0.000 0.000 2.295 13.148 3.944 2.295 1.463 1.535 Meerut 2.630 0.000 0.000 0.000 0.000 0.000 0.000 2.630 0.465 0.488 Mirzapur 14.536 0.000 0.000 0.000 0.000 0.000 0.000 14.536 10.223 10.724 Moradabad 1.532 1.532 3.708 2.510 1.532 20.308 6.092 1.532 3.652 3.831 Muzaffarnagar 2.458 2.458 4.807 3.254 2.458 33.705 10.111 2.458 4.275 4.484 Pilibhit 3.262 3.262 7.915 5.358 3.262 51.024 15.307 3.262 8.617 9.039 Pratapgarh 7.398 0.000 0.000 0.000 0.000 0.000 0.000 0.000 0.000 0.000 Rae Bareli 16.035 0.000 0.000 0.000 0.000 0.000 0.000 0.000 0.000 0.000 Rampur 0.120 0.120 0.306 0.207 0.120 1.822 0.547 0.120 0.318 0.334 Saharanpur 0.732 0.732 2.121 1.436 0.732 14.809 4.443 0.732 2.113 2.217 Sant Kabir Nagar 2.628 0.000 0.000 0.000 2.291 12.660 3.798 2.628 2.173 2.280 Sant Ravi Das Nagar 0.430 0.000 0.000 0.000 0.000 0.000 0.000 0.000 0.000 0.000 Shahjahanpur 3.675 0.000 0.000 0.000 3.675 46.188 13.857 3.675 3.602 3.778 Shravasti 0.494 0.000 0.000 0.000 0.000 0.000 0.000 0.494 0.502 0.527
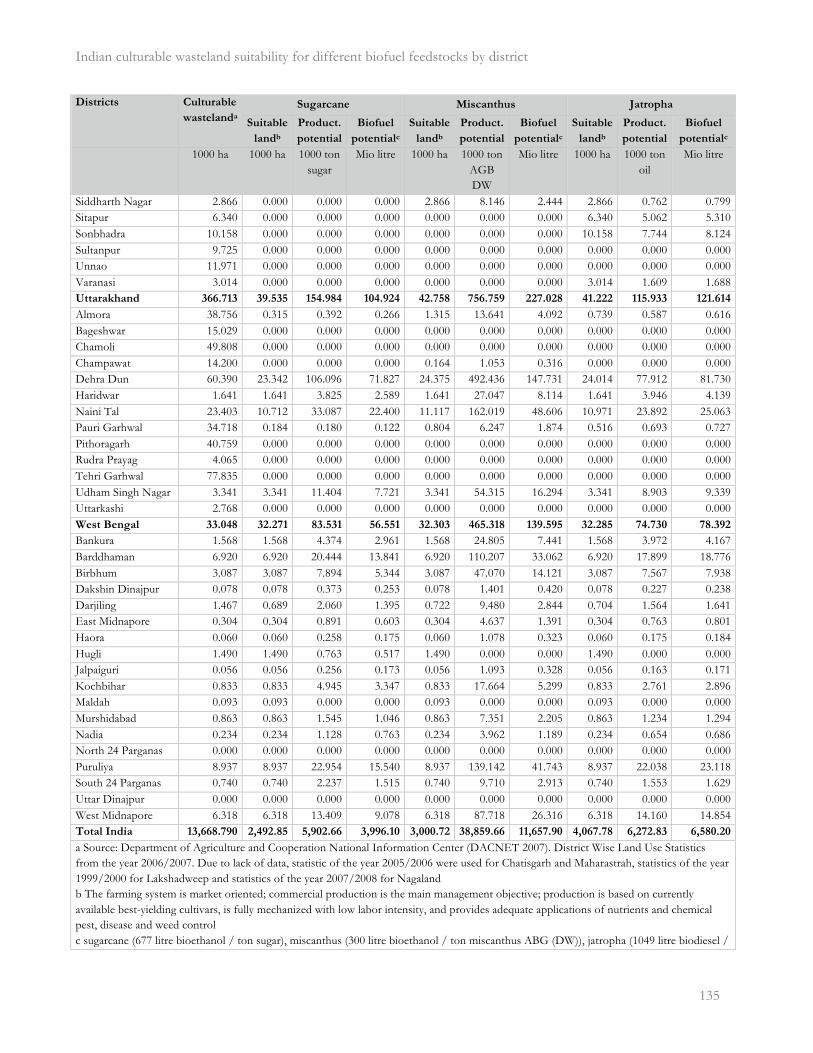
Indian culturable wasteland suitability for different biofuel feedstocks by district
� 135
Districts Culturable
wastelanda
Sugarcane Miscanthus Jatropha
Suitable
landb
Product.
potential
Biofuel
potentialc
Suitable
landb
Product.
potential
Biofuel
potentialc
Suitable
landb
Product.
potential
Biofuel
potentialc
1000 ha 1000 ha 1000 ton sugar
Mio litre 1000 ha 1000 ton AGB DW
Mio litre 1000 ha 1000 ton oil
Mio litre
Siddharth Nagar 2.866 0.000 0.000 0.000 2.866 8.146 2.444 2.866 0.762 0.799 Sitapur 6.340 0.000 0.000 0.000 0.000 0.000 0.000 6.340 5.062 5.310 Sonbhadra 10.158 0.000 0.000 0.000 0.000 0.000 0.000 10.158 7.744 8.124 Sultanpur 9.725 0.000 0.000 0.000 0.000 0.000 0.000 0.000 0.000 0.000 Unnao 11.971 0.000 0.000 0.000 0.000 0.000 0.000 0.000 0.000 0.000 Varanasi 3.014 0.000 0.000 0.000 0.000 0.000 0.000 3.014 1.609 1.688 Uttarakhand 366.713 39.535 154.984 104.924 42.758 756.759 227.028 41.222 115.933 121.614
Almora 38.756 0.315 0.392 0.266 1.315 13.641 4.092 0.739 0.587 0.616 Bageshwar 15.029 0.000 0.000 0.000 0.000 0.000 0.000 0.000 0.000 0.000 Chamoli 49.808 0.000 0.000 0.000 0.000 0.000 0.000 0.000 0.000 0.000 Champawat 14.200 0.000 0.000 0.000 0.164 1.053 0.316 0.000 0.000 0.000 Dehra Dun 60.390 23.342 106.096 71.827 24.375 492.436 147.731 24.014 77.912 81.730 Haridwar 1.641 1.641 3.825 2.589 1.641 27.047 8.114 1.641 3.946 4.139 Naini Tal 23.403 10.712 33.087 22.400 11.117 162.019 48.606 10.971 23.892 25.063 Pauri Garhwal 34.718 0.184 0.180 0.122 0.804 6.247 1.874 0.516 0.693 0.727 Pithoragarh 40.759 0.000 0.000 0.000 0.000 0.000 0.000 0.000 0.000 0.000 Rudra Prayag 4.065 0.000 0.000 0.000 0.000 0.000 0.000 0.000 0.000 0.000 Tehri Garhwal 77.835 0.000 0.000 0.000 0.000 0.000 0.000 0.000 0.000 0.000 Udham Singh Nagar 3.341 3.341 11.404 7.721 3.341 54.315 16.294 3.341 8.903 9.339 Uttarkashi 2.768 0.000 0.000 0.000 0.000 0.000 0.000 0.000 0.000 0.000 West Bengal 33.048 32.271 83.531 56.551 32.303 465.318 139.595 32.285 74.730 78.392
Bankura 1.568 1.568 4.374 2.961 1.568 24.805 7.441 1.568 3.972 4.167 Barddhaman 6.920 6.920 20.444 13.841 6.920 110.207 33.062 6.920 17.899 18.776 Birbhum 3.087 3.087 7.894 5.344 3.087 47.070 14.121 3.087 7.567 7.938 Dakshin Dinajpur 0.078 0.078 0.373 0.253 0.078 1.401 0.420 0.078 0.227 0.238 Darjiling 1.467 0.689 2.060 1.395 0.722 9.480 2.844 0.704 1.564 1.641 East Midnapore 0.304 0.304 0.891 0.603 0.304 4.637 1.391 0.304 0.763 0.801 Haora 0.060 0.060 0.258 0.175 0.060 1.078 0.323 0.060 0.175 0.184 Hugli 1.490 1.490 0.763 0.517 1.490 0.000 0.000 1.490 0.000 0.000 Jalpaiguri 0.056 0.056 0.256 0.173 0.056 1.093 0.328 0.056 0.163 0.171 Kochbihar 0.833 0.833 4.945 3.347 0.833 17.664 5.299 0.833 2.761 2.896 Maldah 0.093 0.093 0.000 0.000 0.093 0.000 0.000 0.093 0.000 0.000 Murshidabad 0.863 0.863 1.545 1.046 0.863 7.351 2.205 0.863 1.234 1.294 Nadia 0.234 0.234 1.128 0.763 0.234 3.962 1.189 0.234 0.654 0.686 North 24 Parganas 0.000 0.000 0.000 0.000 0.000 0.000 0.000 0.000 0.000 0.000 Puruliya 8.937 8.937 22.954 15.540 8.937 139.142 41.743 8.937 22.038 23.118 South 24 Parganas 0.740 0.740 2.237 1.515 0.740 9.710 2.913 0.740 1.553 1.629 Uttar Dinajpur 0.000 0.000 0.000 0.000 0.000 0.000 0.000 0.000 0.000 0.000 West Midnapore 6.318 6.318 13.409 9.078 6.318 87.718 26.316 6.318 14.160 14.854 Total India 13,668.790 2,492.85 5,902.66 3,996.10 3,000.72 38,859.66 11,657.90 4,067.78 6,272.83 6,580.20
a Source: Department of Agriculture and Cooperation National Information Center (DACNET 2007). District Wise Land Use Statistics from the year 2006/2007. Due to lack of data, statistic of the year 2005/2006 were used for Chatisgarh and Maharastrah, statistics of the year 1999/2000 for Lakshadweep and statistics of the year 2007/2008 for Nagaland b The farming system is market oriented; commercial production is the main management objective; production is based on currently available best-yielding cultivars, is fully mechanized with low labor intensity, and provides adequate applications of nutrients and chemical pest, disease and weed control c sugarcane (677 litre bioethanol / ton sugar), miscanthus (300 litre bioethanol / ton miscanthus ABG (DW)), jatropha (1049 litre biodiesel /
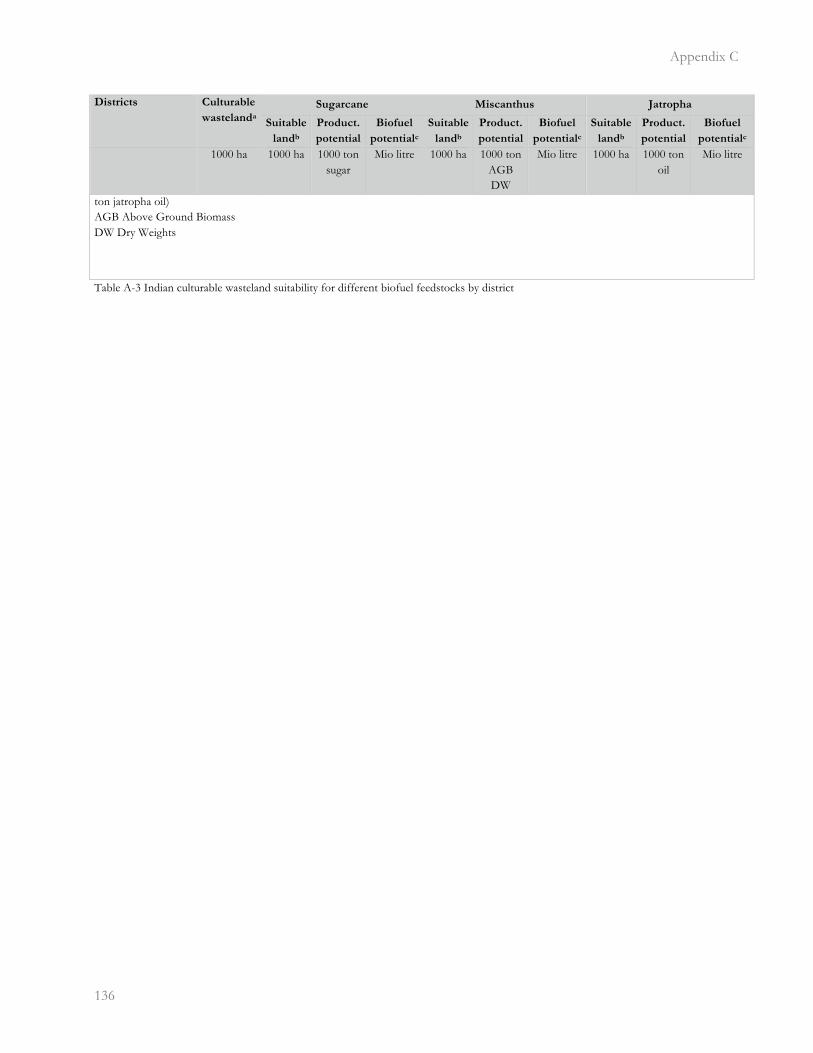
Appendix C
�136
Districts Culturable
wastelanda
Sugarcane Miscanthus Jatropha
Suitable
landb
Product.
potential
Biofuel
potentialc
Suitable
landb
Product.
potential
Biofuel
potentialc
Suitable
landb
Product.
potential
Biofuel
potentialc
1000 ha 1000 ha 1000 ton sugar
Mio litre 1000 ha 1000 ton AGB DW
Mio litre 1000 ha 1000 ton oil
Mio litre
ton jatropha oil) AGB Above Ground Biomass DW Dry Weights
Table A-3 Indian culturable wasteland suitability for different biofuel feedstocks by district
�


