Embed Size (px)
Citation preview
SUSPICIOUS SIGNS: EFFECTS OF NEWSCASTER SCRIPTS, SYMBOLS, AND ACTIONS ON AUDIENCE PERCEPTIONS OF NEWS ORGANIZATION BIAS
A Dissertation presented to
the faculty of the Graduate School University of Missouri-Columbia
In Partial Fulfillment Of the Requirements for the Degree
Doctor of Philosophy
by
Stacey Woelfel
Dr. John Petrocik, Dissertation Supervisor
May 2006
The undersigned, appointed by the Dean of the Graduate School, have examined the dissertation entitled
SUSPICIOUS SIGNS: EFFECTS OF NEWSCASTER SCRIPTS, SYMBOLS, AND ACTIONS ON
AUDIENCE PERCEPTIONS OF NEWS ORGANIZATION BIAS
Presented by Stacey Woelfel A candidate for the degree of Doctor of Philosophy And hereby certify that in their opinion if is worthy of acceptance.
Professor John Petrocik
Professor James Endersby
Professor Mike McKean
Professor David Webber
Professor Catherine Holland
To my father, William, who was the smartest man I ever knew…
ACKNOWLEDGMENTS
I would like to thank everyone in the Department of Political Science who helped
me complete this very long project. Thanks must first go to Dr. John Petrocik, who was
as good an editor as any journalist could ever want. I also offer my deepest appreciation
to Dr. James Endersby for his assistance in supporting the completion of my dissertation.
Of course, I also owe a great deal of gratitude to the rest of the committee—Dr. David
Webber, Dr. Catherine Holland, and Prof. Mike McKean.
I would also like to acknowledge the contributions of Dr. Richard Hardy to my
decision to seek this degree and his assistance in completing my coursework and
comprehensive examination.
Finally, I would like to thank my wife, Rebecca, for her help and support during
the project, and my children, Alexander and Lauren, for their continued patience through
this entire effort.
ii
TABLE OF CONTENTS Acknowledgements ………………………………………………………..…ii
List of Tables………………………………………………………………….vii
List of Figures ………………………………………………………………...ix
Preface: A Ribbon of Controversy……………………………………….........1
Chapter
1. In Search of the Source of Perceptions of Bias ………..…....18
Dissertation Outline
2. The Roles and Effects of Media in Politics …………………27
American Press Emerges from the British Model
The Rise of the Penny Press and Reader Appeal
Early Stirrings of an Impartial Press
The Birth of a Scientific Approach to Communication and Media Theory Models of Interpersonal Human Communications
The Role of Journalist—Independent or Power Broker?
American Press Freedoms and the Cause of Bias
3. The Effects of Media on the Political Process …..…...............56
Early Audience Effects Studies
The People’s Choice: Media and Politics Examined
The Limited Effects Model
iii
External Messages, Internal Conflicts Psychodynamic Model Sociocultural Model
Source Credibility
Agenda Setting Setting the Public Agenda Setting the Media Agenda
Setting the Policy Agenda Finding Bias in the Media Agenda
Media as Framers of Debate
Priming Audiences to Change Perceptions
Learning from Media
Media Effects on Behavior
4. The Politics of Journalists……….. …………………...........105
The Political Makeup of the American Journalist
Evidence of a Liberal Bias
The Power of Professional Standards
The Issue of Trust and Credibility
5. Determinants of Subject Appropriateness and Measurement…………………………………..157
Historical Roots of Centrality
Electoral and Ideological Similarities
Demographic Characteristics
Media Habits and Perceptions
Media Trust Index
iv
6. Research Methods and Hypotheses ………………………..187
The Richness of Symbols
Sharing Meaning through Symbols
Symbols and Language in Political Communication
The Mediation of Political Communication
Communicating with Stories
Approach of the Study
Experimental Design
Hypotheses of the Study
7. A Kinder General View: Subject Perceptions of Media Fairness, Accuracy, and Balance ……………………….……………212
Defining Fairness, Accuracy, and Balance—
Journalists’ View Perceptions of a Flawed Media System Mixed Local Perceptions Comparing Across Different Formats of Questions General Dissatisfaction Across Subjects Ideological Differences are Minimal A Developmental Difference in Critical Thinking Comparisons between National and Local Perceptions Comparing Subjects by Media Trust Indices Evaluation of Effect of Subject Differences
v
8. Viewer Perceptions of Media Bias across Exposures …...…231
Random Assignment of Subjects to Exposure Groups
Differences in Perceptions of Newscaster by Exposure Level
Changes in Perceptions of Fairness from Pretest to Posttest
Changes in Perceptions of Accuracy from Pretest to Posttest
Changes in Perceptions of Balance from Pretest
to Posttest
The Positive Image of Local News
Exposure Group Differences
Pretest Media Views versus Post-Experimental Effects
9. Do Issues Matter? Change in Perceptions of Media Trust by Issue …………………….............254
10. Ideological and Experiential Effects………………………..273
11. Conclusion: A Fleeting Frame in a Lifetime of Moving Images……………………………….….298
Appendix
1. Survey Documents …………………………………………311
2. Video Scripts ………………………………………………329
Bibliography ……………………………………………………………….347
Vita ………………………………………….……….………….…….……376
vi
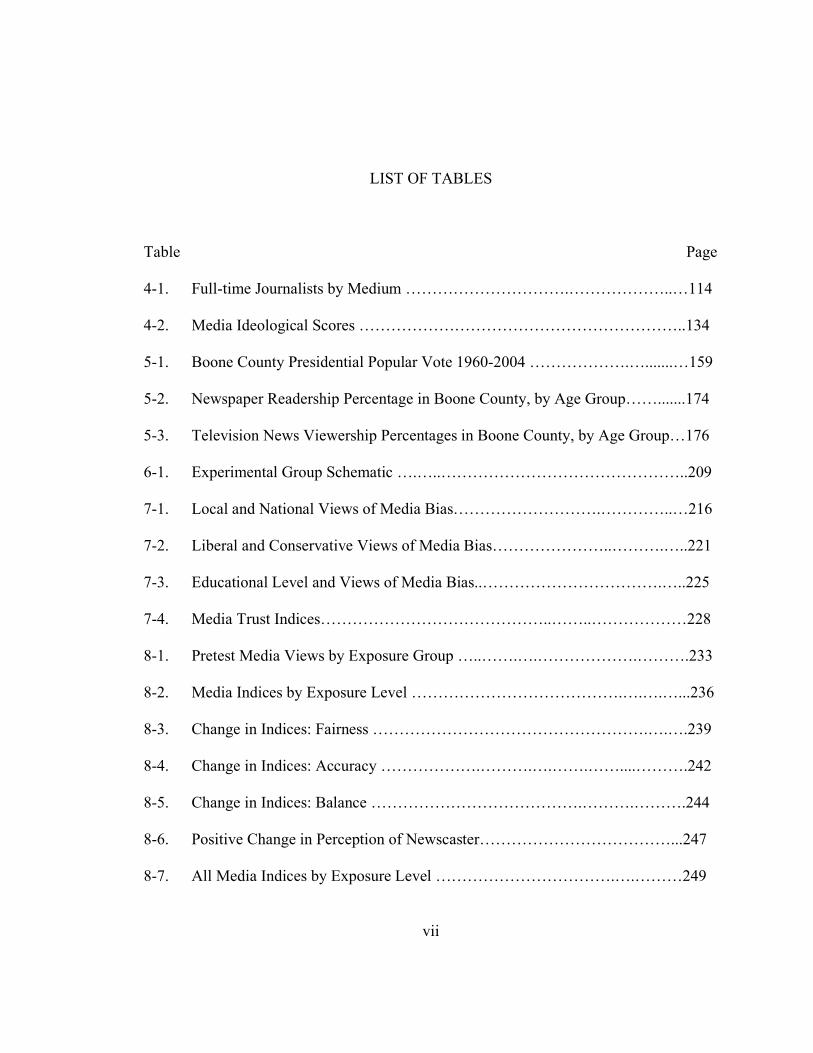
LIST OF TABLES
Table Page 4-1. Full-time Journalists by Medium ………………………….………………..…114 4-2. Media Ideological Scores ……………………………………………………..134 5-1. Boone County Presidential Popular Vote 1960-2004 ……………….….......…159 5-2. Newspaper Readership Percentage in Boone County, by Age Group…….......174 5-3. Television News Viewership Percentages in Boone County, by Age Group…176 6-1. Experimental Group Schematic ….…..………………………………………..209 7-1. Local and National Views of Media Bias……………………….…………..…216 7-2. Liberal and Conservative Views of Media Bias…………………..……….…..221 7-3. Educational Level and Views of Media Bias..…………………………….…..225 7-4. Media Trust Indices……………………………………..……..………………228 8-1. Pretest Media Views by Exposure Group …..…….….……………….……….233 8-2. Media Indices by Exposure Level ………………………………….….….…...236 8-3. Change in Indices: Fairness …………………………………………….….….239 8-4. Change in Indices: Accuracy ……………….……….….…….……....……….242 8-5. Change in Indices: Balance ………………………………….……….……….244 8-6. Positive Change in Perception of Newscaster………………………………...247 8-7. All Media Indices by Exposure Level …………………………….….………249
vii
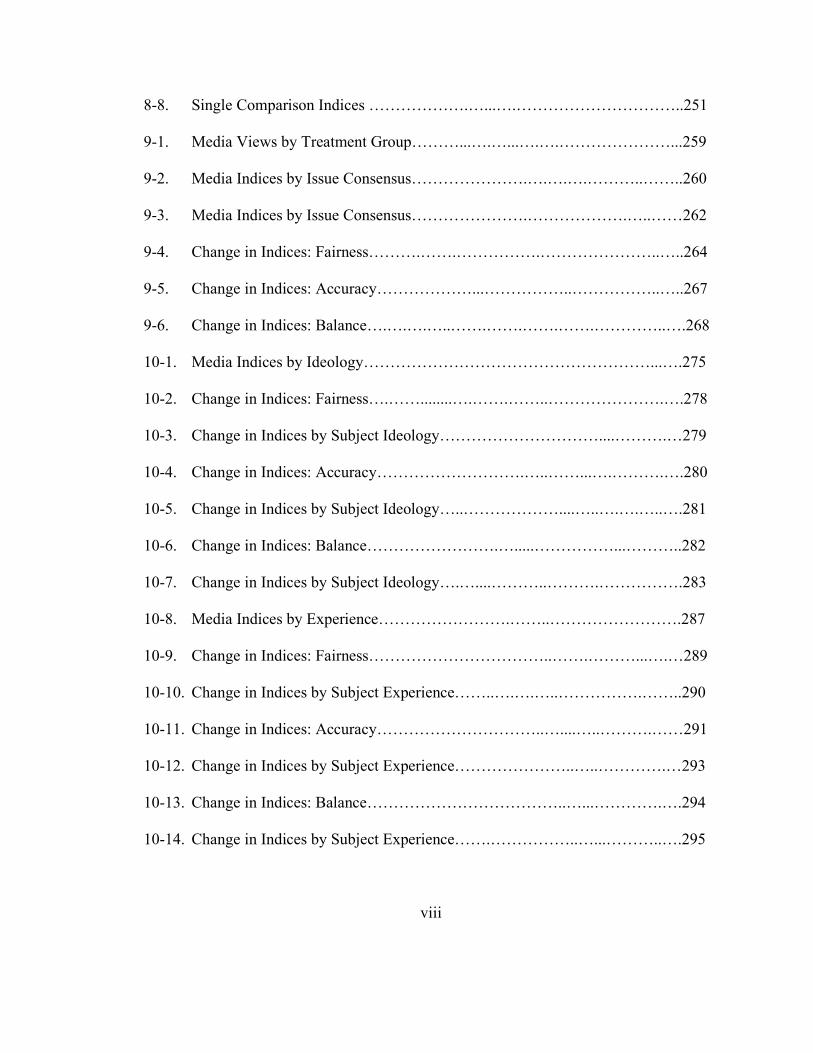
8-8. Single Comparison Indices ……………….…...….…………………………..251 9-1. Media Views by Treatment Group………...….…...….….…………………...259 9-2. Media Indices by Issue Consensus………………….….….….………..……..260 9-3. Media Indices by Issue Consensus………………….……………….…..……262 9-4. Change in Indices: Fairness……….…….…………….…………………..…..264 9-5. Change in Indices: Accuracy………………...……………..……………..…..267 9-6. Change in Indices: Balance….….….…..…….…….…….…….…………..….268 10-1. Media Indices by Ideology………………………………………………...….275 10-2. Change in Indices: Fairness….……........….…….……..………………….….278 10-3. Change in Indices by Subject Ideology…………………………....……….…279 10-4. Change in Indices: Accuracy……………………….…..……...….……….….280 10-5. Change in Indices by Subject Ideology…..………………....…..….….…..….281 10-6. Change in Indices: Balance…………………….….....……………...………..282 10-7. Change in Indices by Subject Ideology….…....………..……….…………….283 10-8. Media Indices by Experience…………………….……..…………………….287 10-9. Change in Indices: Fairness……………………………..…….………...….…289 10-10. Change in Indices by Subject Experience……..….….…..…………….……..290 10-11. Change in Indices: Accuracy…………………………..…....…..……….……291 10-12. Change in Indices by Subject Experience…………………..…..………….…293 10-13. Change in Indices: Balance………………………………..…...………….….294 10-14. Change in Indices by Subject Experience…….……………..…...………..….295
viii
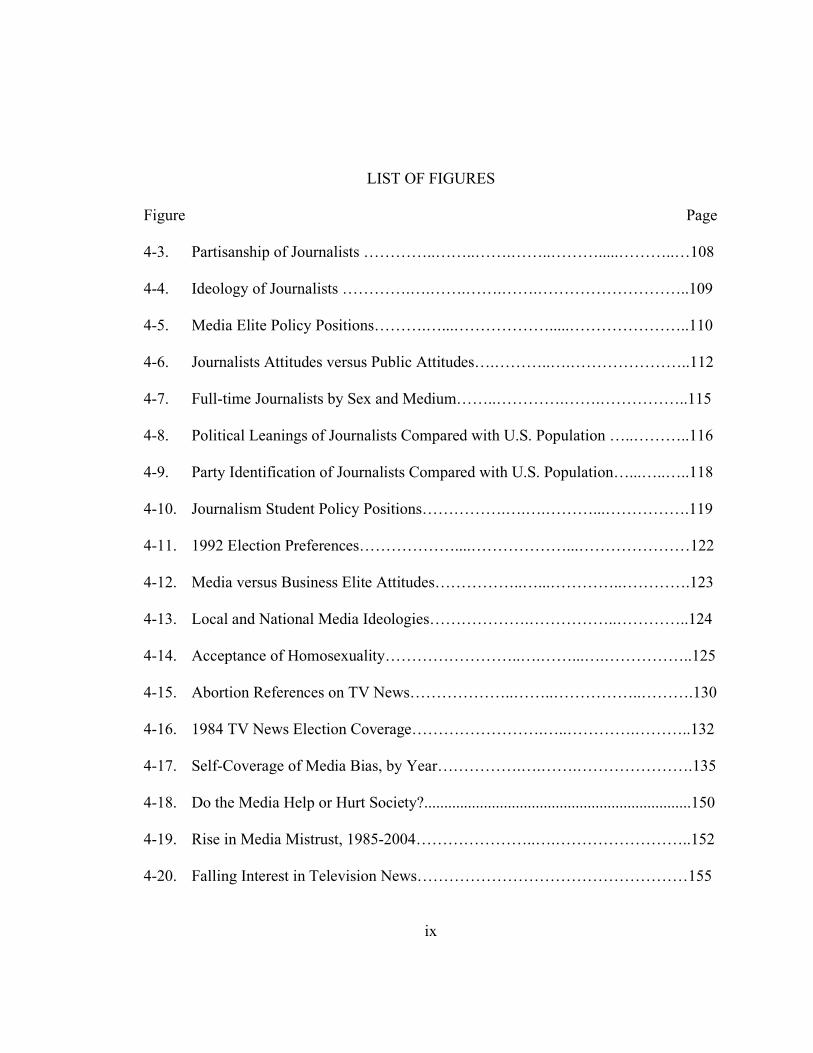
LIST OF FIGURES
Figure Page 4-3. Partisanship of Journalists …………..……..…….……..……….....………..…108 4-4. Ideology of Journalists ………….….…….…….…….………………………..109 4-5. Media Elite Policy Positions……….…...……………….....…………………..110 4-6. Journalists Attitudes versus Public Attitudes….………..….…………………..112 4-7. Full-time Journalists by Sex and Medium……..………….…….……………..115 4-8. Political Leanings of Journalists Compared with U.S. Population …..………..116 4-9. Party Identification of Journalists Compared with U.S. Population…...…..…..118 4-10. Journalism Student Policy Positions…………….….….………...…………….119 4-11. 1992 Election Preferences………………....………………...…………………122 4-12. Media versus Business Elite Attitudes……………..…...…………..………….123 4-13. Local and National Media Ideologies……………….……………..…………..124 4-14. Acceptance of Homosexuality……………………..….……...….……………..125 4-15. Abortion References on TV News………………..……..……………..……….130 4-16. 1984 TV News Election Coverage…………………….…..………….………..132 4-17. Self-Coverage of Media Bias, by Year…………….….…….………………….135 4-18. Do the Media Help or Hurt Society?...................................................................150 4-19. Rise in Media Mistrust, 1985-2004…………………..….……………………..152 4-20. Falling Interest in Television News……………………………………………155
ix
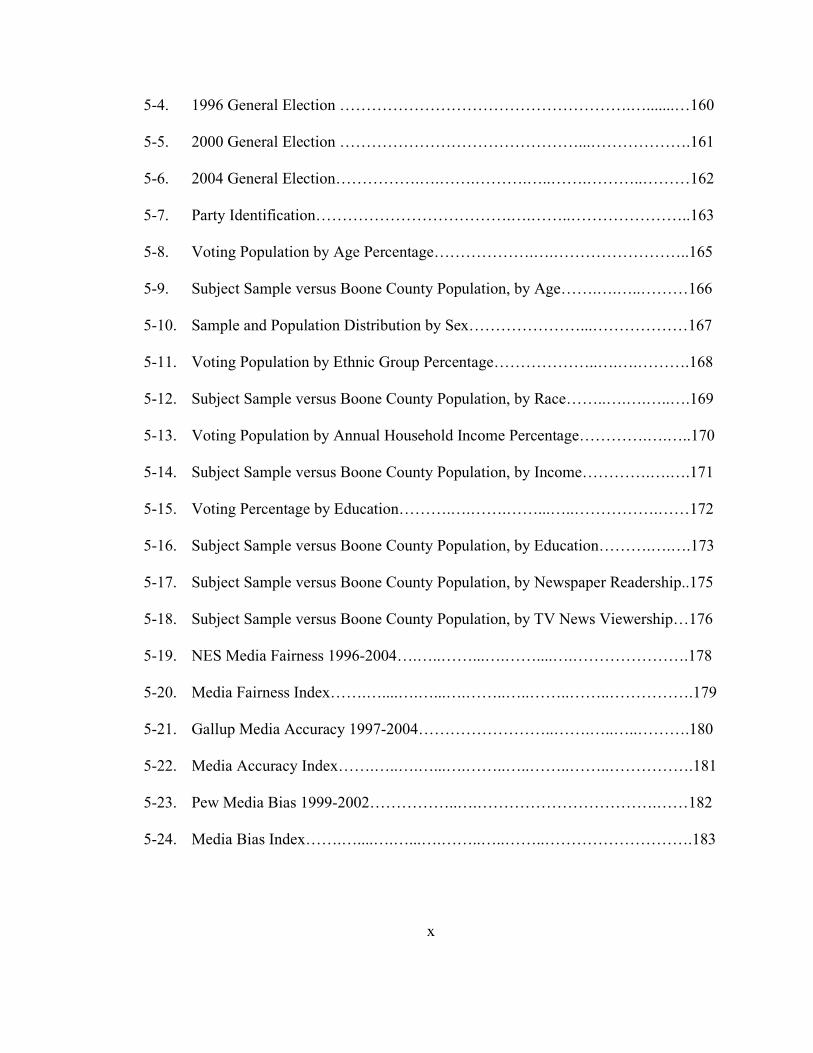
5-4. 1996 General Election ……………………………………………….….......…160 5-5. 2000 General Election ………………………………………...……………….161 5-6. 2004 General Election…………….….…….……….…..…….………..………162 5-7. Party Identification……………………………….….……..…………………..163 5-8. Voting Population by Age Percentage……………….….……………………..165 5-9. Subject Sample versus Boone County Population, by Age…….….…..………166 5-10. Sample and Population Distribution by Sex…………………...………………167 5-11. Voting Population by Ethnic Group Percentage………………..….….……….168 5-12. Subject Sample versus Boone County Population, by Race……..….….…..….169 5-13. Voting Population by Annual Household Income Percentage………….….…..170 5-14. Subject Sample versus Boone County Population, by Income………….….….171 5-15. Voting Percentage by Education……….….…….……...…..…………….……172 5-16. Subject Sample versus Boone County Population, by Education……….….….173 5-17. Subject Sample versus Boone County Population, by Newspaper Readership..175 5-18. Subject Sample versus Boone County Population, by TV News Viewership…176 5-19. NES Media Fairness 1996-2004….…..……...….……....….………………….178 5-20. Media Fairness Index…….…....….…...….……..…..……..……..…………….179 5-21. Gallup Media Accuracy 1997-2004……………………..…….…..…..……….180 5-22. Media Accuracy Index…….…..….…...….……..…..……..……..…………….181 5-23. Pew Media Bias 1999-2002……………..….…………………………….……182 5-24. Media Bias Index…….…....….…...….……..…..……..……………………….183
x
5-25. Media Fairness, Accuracy, and Balance……….….…….…….…….…..……..184 5-26. Media Fairness, Accuracy, and Balance……….….…….…….…….…..……..185
xi
1
Preface: A Ribbon of Controversy
Immediately following the events of September 11, 2001, viewers began to see a
surge of patriotic displays by television newsrooms around the country. The displays
were not totally unanticipated, as similar displays had manifested themselves in the days
of the first Gulf War. At that time, some anchors and reporters had donned red, white,
and blue ribbons to show some sort of patriotic support. The movement was not
widespread, and it came and went in the course of a few months. But it did foretell the
conflict ahead over issues of newsroom ethics, public opinion, and political pressure.
As news director at KOMU-TV in Columbia, Missouri, I lead a unique
newsroom that bridges the gulf between the academic and professional worlds. KOMU-
TV is the commercial, NBC affiliate for central Missouri, but it also serves as the
teaching lab for students learning television news techniques at the University of
Missouri School of Journalism. Despite the state ownership and the academic mission,
the newsroom runs as much like a commercial, professional operation as possible. A
small staff of faculty editors runs the newsroom. A dozen or so full-time staff members
assist the faculty members. Students do the rest of the work—reporting, photography,
producing, editing, and writing.
A local general manager, who answers to the chancellor of the Columbia campus,
manages the station. As a faculty member as well as news director, I answer to both that
general manager, and the dean of the School of Journalism. Daily management is left to
the news director, as well as most long-term policies. In general, the campus is not
involved in the operations of the station.
2
In late September of 2001, the newsroom was very busy with the 9/11 aftermath
and all the coverage it had generated. The station had done well the day of the attack, as
well as in the days that followed. It had set the local standard for covering not only the
events going on in New York, Washington, and Pennsylvania, but also for giving local
viewers the information they needed to see what in their lives has changed since the
attacks. I had worked many long days overseeing the coverage, and had a let much of this
everyday work pile up. Among the tasks needing attention was an e-mail memo to the
faculty, staff, and students reminding them of the station’s unwritten policy of not
wearing any adornments that would send personal messages or express personal opinions.
The policy was one that had been in place—in unwritten fashion—for my entire
tenure as news director. Simply stated, newsroom personnel were not to wear ribbons,
pins, buttons, or other items that would be used to send a message. The belief was that
several ethical principles were at stake. Firstly, such items were out of place on newscasts
because they put newscasters in the position of injecting personal opinions into the news
presentations. No matter how universally accepted or noble those opinions might be, it is
not the role of the journalist to exhibit them on the air. Secondly, patriotic or other
symbols serve the purpose of making the anchor or reporter wearing them somehow
newsworthy or noticeable for their own sakes. Many journalists believe that this is not
their role.
On September 17, after seeing the proliferation of patriotic pins and ribbons that
had been springing up on network and other local newscasts, I distributed a brief e-mail.
It stated:
“This probably won't be a popular decision for some of you, but I need to remind everyone that our news broadcasts are not the place for
3
personal statements of support for any cause--no matter how deserving the cause seems to be. This includes the little red, white, and blue ribbons that a lot of people are sporting these days. Our job is to deliver the news as free from outside influences as possible. And while it seems that there could be no one who would object to us wearing such symbols, you might be surprised. And it also sets a precedent where countless other causes would want us to wear their symbols as well. I could go on with more reasons, but let me just say this. Leave the ribbons at home when reporting or anchoring for KOMU News. What you do on your own time is up to you, though I would urge you to consider the fact that you are always ‘on the clock’ in terms of being known as a reporter and representative of the station.” (Woelfel, Sept. 17, 2001)
The e-mail went to approximately 300 faculty, staff, and students, all with ties to
the KOMU-TV newsroom. The response from those originally addressed was negligible.
One weathercaster disagreed with the directives of the memo, but agreed to follow its
instructions. The rest of the recipients agreed the notion of not displaying personal
opinions on air was nothing new to them. That consensus arose from a consistency in
teaching within journalism education. Common journalism curriculum provides students
with the ethical framework from which they can draw their own conclusions about the
proper actions to take when faced with pressure to conform. This memo did not conflict
with that ethical framework.
But it was soon to become apparent that it did conflict with what many outside the
newsroom thought the journalist’s role should be during times of national crisis—
particularly those in political positions in the state of Missouri. Shortly after the e-mail
went out to the KOMU group, it ended up in the electronic inboxes of a number of
Missouri state legislators. The first e-mail from that group inquiring about the memo
arrived on September 21. A state senator wrote to see if the memo had indeed come from
the newsroom. After receiving confirmation it had, that particular senator never raised the
4
issue again. But by the following Monday, the legislators who were writing had become
much more aggressive in their approach with me. A Republican state representative from
Kansas City, Matthew V. Bartle, was the first to issue a threat to the funding of the
University of Missouri. He wrote (in part):
“It is more than a little troubling that in your rush not to offend that you would ban the wearing of a symbol of compassion for those who have suffered immense tragedy. This is not a matter of journalistic even-handedness. This is a matter of simple decency and respect for our fellow human-beings. As a member of the state legislature in Missouri, I am going to evaluating far more carefully state funding that goes to the school of journalism. If this is what you are teaching the next generation of journalists, I question whether the taxpayers of this state will support it. By copy of this email to the Governmental Relations office for the University, I am hoping that the administration will look into this matter.” (Bartle, Sept. 24, 2001)1
By this time, one week after writing the original memo, a great deal of time each day was
consumed by answering e-mails, phone calls, and letters regarding the policy. I made an
attempt to respond to each correspondent as quickly as possible—particularly when that
person seemed to have some mistaken impression regarding the purpose of the memo.
Representative Bartle was among a growing number of people who misconstrued the
policy to be for the purpose of avoiding any offense to viewers. That was never part of its
intent. The reply to him was typical:
“As a Columbia native and Mizzou graduate, I'm sure you are aware of the School of Journalism's worldwide reputation for excellence. For nearly one hundred years, we have been teaching what we as a faculty believe to be the proper skills and knowledge for the working journalist--include training in ethics. The memo you cite is one of those lessons. Not all
1 Note: All e-mails have been edited to correct typographical, spelling, and grammar errors. The text has not otherwise been shortened, nor the content altered, unless noted.
5
ethical decisions are popular with either the public or those who must exercise them. But it is a measure of the strength of the ethical position and the person who holds it to see if it can remain intact against prevailing sentiment. I'm sure you have encountered similar conflicts with the many ethical decisions one must make as an attorney--perhaps more than in any other profession. I encourage you to do your research and find out how the School of Journalism actually does use the portion of its budget that comes from state appropriations. I think you'll be pleased with most of the lessons taught--even if you aren't in total agreement with the ethical responsibilities a journalist must carry. I think you'll also realize that the Governmental Affairs office at the University has no input into the academic freedom of the Journalism School faculty, or the editorial decisions made at KOMU-TV, KBIA-FM, or the Columbia Missourian.” (Woelfel, Sept. 24, 2001)
Bartle wrote back almost immediately. He questioned whether reporters were
allowed to wear school colors, and if running advertising on the station should be
considered as showing “allegiance” to capitalism. The he concluded his e-mail with this:
“When questioned on matters like this, it is not uncommon for journalists to sound the high tones of journalistic integrity. It sounds good and in many cases it is appropriate. In this case, however, journalistic integrity cannot conceal simple foolishness. Decisions like yours do immense harm to your profession. Decisions like yours cause the public to question the reliability and intelligence of journalists. Like it or not, recipients of public monies must answer to the public. If the public disapproves of what is being done with their money, they have the right to direct funds elsewhere. I am sure that we will find that the KOMU news department is a recipient of public money.” (Bartle, Sept. 24, 2001, second response).
In fact, the KOMU-TV operation as a whole does not receive any public money. As a
commercial television station, it is expected to earn enough each year to operate
profitably and without state appropriations. In most years, the station profit is enough to
fund other university programs, thereby actually reducing the need for some state
6
expenditures. The reply to Bartle addressed the additional concerns he outlined in his last
e-mail, and invited him to come see the operation and its funding source:
“I would welcome you to come see our facility to find out the real lessons being taught within these walls. We have been voted again and again as the school that best prepares young journalists for television news careers. That success is something of which I am very proud. And the station's commercial success is something in which the University and state can also take pride. Our success in the market helps keep us financially self-sufficient and free from the need for any state appropriations that might leave the perception of having to answer editorially to state government. Heck, we even give some extra back to the University to pay its bills.” (Woelfel, Sept. 25, 2001)
It would be unfair, however, to expect every state legislator to know the internal
funding methods of each department the state operates. So I was ready to pass on the
funding formula to each who wrote to question the policy. Rep. Bartle passed his
exchange to a number of his colleagues. Representative Chuck Purgason, a Republican
from Caulfield, wrote:
“Could you please let me know if the information that I have received is correct when it comes to your station and its policy on the American Flag? As a member of the budget committee in the state, I will certainly look into this policy when it comes to funding in the next legislative cycle if this information is shown to be true.” (Purgason, Sept. 25, 2001)
Representative Carl Bearden, a St. Charles Republican, also read the exchange
with Bartle:
“I have read your response to Representative Bartle's e-mail regarding the display of patriotic symbols by journalists working at the various University media outlets. The response fails to indicate any basis for invoking Journalistic Ethics. In fact, the decision appears to be based more on someone's perceived political correctness than journalistic ethics.
If the School of Journalism is in fact more focused on political correctness issues than on true journalistic ethics, then I would contend that the well earned reputation of the program is in jeopardy. While the
7
Governmental Affairs office may not have any input, the University Curators and Administration must guard the reputation of the University and the School of Journalism from actions such as this one. I trust that as a result of this errant application of journalistic integrity, they will indeed review the decision.” (Bearden, Sept. 25, 2001)
Representative Bearden was the first to threaten going to the university’s governing
board, the Board of Curators. It was no empty threat. The curators would indeed consider
the policy soon.
By Tuesday, September 25, the e-mails were coming in large numbers—and not
only from state legislators. The memo had been posted by an unknown party or parties on
a number of bulletin boards and other web sites frequented by journalists. This set up a
nationwide discussion of the pros and cons of the position. Also, all through this period, I
was sharing the correspondences I was receiving from the legislators with my students
via the same e-mail group to which he had sent the original e-mail. These digests of all
the activity provided excellent material for classroom and informal discussions. But much
as the original memo had found a wider audience, these e-mails soon made it into a story
in the Columbia Missourian, the School of Journalism’s daily laboratory newspaper for
Columbia. The newspaper ran the story on the morning of September 27, prompting local
radio stations to make it the topic of conversation that morning. The newsroom was
flooded with phone calls and e-mails from angry viewers demanding the policy change.
Many also announced plans to ask their state legislators to seek some sort of retribution
against the television station. So e-mail was pouring in from viewers and other
journalists, as well as from the state leaders. Many of the e-mails were less than polite.
Some called for my firing, while others suggested I look for work in Afghanistan.
8
“I am outraged at your decision to not allow the display of the flag or ribbons by on-air people. I guess when it comes to the real decision time people’s true colors show. This is a disgrace and a slap in the face of every victim of September 11 and their families, not to mention the US Service personnel that are going into harm’s way to protect your assets. I will not watch your station again under any circumstances.” (Bowling, Sept. 27, 2001). “What the hell is wrong with you? It has been my experience and understanding that most people affiliated with Universities are tree-hugging hippie freaks, but what you have done by not allowing patriotic symbols on your news casts is just treason. I will never watch your news again and I will write all sponsors that support your show and boycott them. Unlike you, I am proud to be an American.” (Hoffman, Sept. 27, 2001). “I was shocked when I heard of your e-mail to your staff. News people usually scream free speech, but now you are restricting speech. As a veteran I feel that every American has a right to show their support for our country. You claim that it is an ethical issue. Your station is the most biased station I have ever watched. You take positions against the death penalty. You speak out against pro-lifers. How can you say that you are trying not to take a position? I am glad companies are pulling their advertising from your station. I will encourage any company I do business with to do the same. I will also ask my representative to pull all funding from the school of journalism until major changes are made to your station. I will also encourage my friends and family to do the same.” (Jung, Sept. 27, 2001)
“I heard you on KFRU this morning and I think you are a coward for not allowing the anchors to display their patriotism. Maybe you should go live in Afghanistan.” (“Denise,” Sept. 27, 2001)
At the same time, the letters from legislators were also taking on a less professional and
more aggressive tone. Republican representative Martin “Bubs” Hohulin from Lamar did
not see any reason to mince words:
“Add me to the list of legislators appalled by your memo and the arrogant reply you sent to Rep. Bartle. The bulk of funding for the University comes from the taxpayers, of which we are their representatives. I would suggest you come down from your ivory tower in the make believe world of academia and sample the real world. We have no obligation to fund your part of the University, or any part for that matter. I too will be in
9
contact with the Government Affairs office. They do not control your 'academic freedom', but with no money, you could be a little less free.” (Hohulin, Sept. 25, 2001).
Interestingly, not all mail received was negative:
“For what it’s worth, I agree with your policy of not allowing on-air news staff to display support for any cause, even patriotic. During this time of uncertainty, tragedy, and talk of war, everyone relies heavily on newscasters to present unbiased news coverage. I tune in to a station to get the facts and I don’t want to feel, even in the slightest way, as though these facts might be tainted by a strong sense of patriotism, loyalty to the U. S. government or President Bush.” (Bromley, Sept. 27, 2001) But those exchanges were the exception, not the rule, and many viewers
did follow through and speak to legislators about the issue. That was evident in
the e-mails still coming from those legislators, mixed in with all the mail from the
general public. Representative Carl Bearden, in response to a School of
Journalism alumnus writing in support of the policy, invoked his constituency:
“I continue to maintain the decision is a bad one. Feedback from a number of my constituents who pay the taxes that support the University system confirm that view. Decisions have consequences. Although it is not my intent to call for an investigation of the issue, if the result of the errant decision made by station management is that closer scrutiny is applied to University funding, so be it. It is neither blackmail nor is it unreasonable.” (Bearden, Sept. 27, 2001)
Not all the feedback sent to legislators opposed the KOMU policy. Some e-mail
included copies of a few letters sent to legislators by either their constituents or members
of the university or journalism communities. These letters called on legislators not to
punish the school for proper ethical actions:
“Mr. Bartle, to call state funding into question because you disagree with an inner-office ethical decision made by a semi-private media institution is in direct conflict with the principle of freedom of the press. You called the
10
decision "censorship of journalists," yet I find the threat of press-coercion by the state a much more menacing possibility than a TV station that is missing a few red-white-and-blue ribbons. Which brings us to Mr. Purgason's statement about the need for the state to review the policy: Do you really think that the state has any right to question the ethical judgments of a news station that is funded by private advertising, not the state? Would you suggest that the United States Congress review ABC for making the same policy decision? (Which the national network did after the terrorist attacks.) I would argue that in order for the press to maintain its roles as a governmental watchdog and public informant, it must be free from review by the state. The suggestion of state-review is decidedly against the press's First Amendment rights.” (Mueller, Sept. 28, 2001)
But the mail and calls were running about nine to one against the policy. It is easy
to imagine the correspondence from constituents to legislators was running at an even
higher negative ratio.
With that constituent support, legislators turned their attention toward the
university administration to see what could be done there. This left the School of
Journalism and Chancellor’s office to begin drafting their own responses to the
approaching criticism.
At the School of Journalism, that action came in the form of resolution of faculty
support for KOMU and myself. The decision to pass the resolution was not an easy one.
Some members of the faculty disagreed completely with the decision. Others found it to
be the correct policy for commercial newsrooms, but worried about limiting the academic
freedom of students in a teaching environment. But nearly all agreed the threat of
political and budgetary sanctions was wrong. After one meeting and some e-mail
balloting, the School’s faculty passed this resolution on October 2:
“A recent editorial decision made at KOMU-TV that prohibited journalists from wearing red, white and blue ribbons during their reporting and on-air appearances has ignited an important public debate.
11
The action at KOMU was taken as an effort to preserve a fundamental principle of journalism – editorial independence. The faculty of the Missouri School of Journalism supports the action and supports the right of faculty editors to make policy decisions in our newsrooms. Preserving editorial independence is essential. Journalists best serve the people of this country by reporting independently and neutrally. It is a principle almost universally shared among those in the nation’s press corps, and it is something the public should expect and demand. Such a principle is relatively easy to uphold in most circumstances and in most news coverage. The events of Sept. 11, however, are unprecedented in the working careers of our faculty and most of the nation’s press corps. Not since Pearl Harbor has our nation been directly attacked, and not since the War of 1812 has our mainland been attacked by foreign forces. As journalists and journalism educators, we have struggled since Sept. 11 with how best to uphold the fundamental principle of editorial independence in the face of an attack on our nation. We are a diverse group of people with the same range of feelings and the same degree of patriotism present in the community and nation. Many journalism organizations have taken the course KOMU has taken – striving to maintain complete independence even in such trying times. Others have openly displayed their colors by displaying the American flag on television screens hour after hour. History fails to help us resolve this dilemma. Some of American journalism’s most revered figures, including Edward R. Murrow and Ernie Pyle, were open advocates of the Allied cause during World War II. Others of that era merely reported independently on the events of the day. This debate provides an excellent opportunity for all of us – faculty, students and members of the public – to debate the fundamental role of journalists when their nation is under attack. Accordingly, we call on our Dean to convene one or more public forums so the serious issues involved can be adequately and openly debated. Topics to be discussed should include:
• The value of journalistic independence. • The role of journalists when their nation is under attack. • The relationship between professional journalistic activity and
citizenship. • The role of journalists in creating a civil and ultimately peaceful
political society.
12
We believe it is important for journalists and the public to engage in a discussion of the issue of editorial independence and its importance in a free society. We believe it is important that students, particularly those who disagree with decisions made in our newsrooms, feel empowered to voice their views. We also believe that our many international students, some of whom have expressed concerns about our coverage and our "Americanized" view of the current worldwide problem, need a forum in which to explore those issues. Finally, we urge that the forum include an examination of the scholarship of our field, particularly a critical examination of media performance during times of war, media coverage of international issues, and media coverage of conflict and crisis.” (University of Missouri School of Journalism, 2001).
Meanwhile, across campus, the Office of the Chancellor had been drafting its own
statement of position on the matter. The office had been flooded with calls, letters, and e-
mails from politicians, alumni, and supporters of the university. Most of those contacting
the chancellor were vehemently opposed to the policy. Faced with either pleasing
important constituents or the possibility of compromising the reputation of its exemplary
School of Journalism, the office issued a statement that tried to do neither. In part it said:
“During this time of national distress, the news director of KOMU-TV, the University's television station, asked members of the on-air news team to continue to observe station policy that bars the wearing of any special insignia during a news broadcast including red, white and blue ribbons. This policy has been in effect for many years and is a common practice in broadcast journalism throughout this country to assure editorial independence. The University administration and the station manager were unaware of the directive. The station news operation, which is separate from KOMU’s business operations, is responsible to our School of Journalism, and is charged with teaching skills and knowledge for working journalists, which also includes training in journalism ethics. In this regard, the station is a teaching laboratory. Other national news operations, including those of major TV networks, have currently carried
13
out a similar policy of not permitting personal insignia to be worn on air. The journalism faculty has voiced its support of the action and the ‘rights of faculty editors to make policy decisions in their newsrooms’ and further stated ‘it is important for journalists and the public to engage in a discussion of the issue of editorial independence and its importance in a free society.’ The station's news policy, when made public, has resulted in a number of letters, emails and calls to the University protesting it. MU deeply regrets that this policy has caused offense to KOMU viewers and other citizens. This was an action taken in the TV news room to assure editorial independence that did not in any way reflect a policy of the University. We are proud to be a state university--proud to represent our state at the national level in so many ways, and even more proud to represent the United States of America in international circles.” (Wallace, 2001).
The chancellor’s statement did not end the conflict. Instead, it angered some on both
sides. Legislators were unhappy the chancellor did not take a stronger stand to change the
policy. Representative David Levin, a Republican from St. Louis County wrote to the
University system president--the chancellor’s superior--and continued to threaten action:
“Apparently you're suggesting Mr. Woelfel and the University are not accountable to the taxpayers and their elected representatives. I will support efforts to hold the University and Mr. Woelfel accountable. Accountability includes consequence for actions.” (Levin, 2001)
Journalism alumni were also unhappy with the statement from the chancellor.
Most felt the wording said little to support the KOMU policy or me personally. Many
said they had wished for the chancellor to have issued a strongly worded message of
support, rather than one designed to placate the larger constituencies of the university. A
few took time to write the chancellor with their complaints. This letter was typical:
“The decision by KOMU's news director not to allow its folks to wear patriotic ribbons on air was both brave and laudable. I am deeply disappointed that you could not stand in support of that decision. I understand that you are facing political pressure from politicians who found the policy objectionable, and that you need to stay in good graces
14
with those folks to keep the university financially sound. But you owe it to the journalists you are training to stand up for sound ethical policies when they are enacted and not bow to what is politically correct. As Disney and other large corporations continue to buy up our news outlets and the line between journalism and entertainment continues to blur, I was very proud to see Mizzou take the hard stand on behalf of good old-fashioned ethics. I was a political reporter for a decade and as such gave up the right to attend political rallies for my chosen party or to put signs in my yard for any candidates. It's just part of the job. KOMU's reporters can wear ribbons off the air. They aren't being deprived of any rights of citizenship.” (Barnes, 2001).
The question of just what official position the university would take on the
matter reached the highest levels on October 10. The university’s board of
curators met by conference call to vote on a resolution concerning the use of
patriotic symbols by university students and employees. The board is made up of
nine members appointed by the governor of Missouri. No more than five can be
from one political party. Several members of that board were very unhappy with
the KOMU policy and had complained to the dean of journalism school and the
chancellor for some time. Ultimately, the board passed this resolution:
“WHEREAS, the extraordinary events of September 11 have forever changed the United States of America and the international community; and WHEREAS, the University of Missouri community is profoundly saddened by the loss of so many lives to acts of terrorism and has responded with spontaneous and heartwarming expressions of personal support for those who have suffered the loss of loved ones and friends; and WHEREAS, the American people have united in their commitment to uphold the principles of individual freedom and justice for all; and WHEREAS, the University of Missouri remains committed to the free and open expression of ideas, and to the preservation of individual liberty, academic freedom and freedom of the press; and
15
WHEREAS, the Board of Curators has received numerous communications indicating the need to clarify and articulate University policy with respect to the display of patriotic symbols during a time of national concern over acts of terrorism against the United States of America; and WHEREAS, the Collected Rules and Regulations of the University of Missouri do not preclude individuals from displaying patriotic symbols that express individual support for the United States of America, nor does the Board of Curators see any necessity to make such a modification in the Collected Rules and Regulations: NOW, THEREFORE, BE IT RESOLVED, that the Board of Curators encourages administrators and supervisors to extend wide latitude to individuals in the University community who desire to display symbols of their sympathy for those directly affected by acts of terrorism, or who desire to express their patriotism and love of the United States of America in appropriate ways, consistent with concerns for health and safety in the work environment; and BE IT FURTHER RESOLVED, that the Board of Curators further encourages members of the University of Missouri community to demonstrate the utmost respect for members of all cultures, religions and nationalities in keeping with the University’s commitment to tolerance and understanding of divergent viewpoints; and BE IT FURTHER RESOLVED, that the Secretary to the Board of Curators cause this resolution to be spread upon the minutes of this meeting.” (Board of Curators, 2001)
The resolution had little effect ending the controversy. Some of the legislators
saw it as a statement calling on the chancellor to fire me if I did not change the policy.
But the spokesman for the curators said the board believed the resolution would have no
effect on newsroom policy or the employment of the news director.
Legislators remained unhappy with the outcome of the curators’ resolution. But
their pressure subsided at that point, though angry e-mails from viewers and others
around the country just hearing about the policy did not. The legislators would have
another chance to address the subject. Their next full session in Jefferson City began in
16
January 2002, and as soon as budget matters were taken up, the attacks on me, KOMU,
and the University of Missouri resumed. In April, in the midst of approving the $400
million appropriation the university would receive in the upcoming fiscal year, the
subject of KOMU’s ribbon ban was discussed on the floors of the Missouri House and
Senate. Members of both chambers recalled the events of the previous fall and pointed to
newsroom actions and those of the university administration, calling both not worthy of
funding. One legislator even went so far as to say—while in session on the House floor—
that he would like to punch me in the nose. That prompted long-time capitol regulars to
announce that I was only the second person in modern times to be threatened with
physical violence from the floor of the general assembly. Adolph Hitler was the first.
The actions on the floor brought a new round of attention—local and national—
on our policy and the furor it had created. Some were astonished by the actions underway
in Jefferson City. This journalist from Nevada was typical:
“I read with horror this evening about the "punishment" Missouri legislators have leveled upon KOMU and the University of Missouri for what they consider an unpatriotic decision last fall. While I believe, personally, cases may be made for and against your policy (regarding the wearing of American flag pins by your staff), I find the actions of your state's legislature to be 100 percent outrageous. Unfortunately, it appears KOMU cannot effectively act as an independent voice of journalism, nor as a training ground for those studying our craft -- at least, not without the threat of retribution. The people of Missouri should be ashamed of their elected leaders. I hope you will continue your best efforts, there or elsewhere, to objectively inform your viewers.” (Shelley, 2002)
But others—mainly local viewers just hearing about the policy for the first time as
the budget battle played out in the local papers, renewed their complaints that it was the
wrong action at the wrong time:
17
“Is it possible that Patriotism is not out of style and that the problem with your readers and viewers is the very fact that the horrendous threat to our nation seems to be buried in the politically correct mind of those who might be out of touch with what is most important to us, our freedom. Is it possible that in retrospect, a policy made by one individual reflects poorly on the majority of those in the School of Journalism, yet no one has the courage to correct the error for fear of being accused of not supporting the School? Could some in the legislature be correct in referring to the attitude of the school as arrogant to a fault?” (Chase, 2002).
Speechmaking over, it became time for legislators to decide if they would actually
cut funding over the policy. Representative Bubs Hohulin called for a $5 million cut.
Those writing the appropriations measures deemed that figure too high, but they allowed
$500 thousand figure to be added by amendment. That amendment received early
approval and stayed a part of the appropriations legislation until the waning days of the
session. As the statutory deadline approached to approve the budget, senators cut the
budget reduction aimed at the KOMU policy to $50 thousand. Many in the room decided
the half-million dollar figure was too high and would hurt too many programs at the
university. And all acknowledged the cuts would not affect KOMU at all, due to its self-
supported status, and most likely would have no impact on the School of Journalism.
18
Chapter 1: In Search of the Source of Perceptions of Bias
The events of late 2001 and early 2002 in Columbia, Missouri showed the current
tension present in American media. Missouri legislators called for patriotism and
“proper” conduct from Missouri journalists. Those journalists, in return, fought for
independence from government pressure to affect content and presentation. That
independence was seen as necessary to ensure a perception among viewers that the news
is unbiased in its presentation. The original fear in the newsroom was that the wearing of
patriotic symbols would give the impression to viewers the journalists has taken a side—
not a pro-American side—but the side of the administration in power. Legislators made
the fight something more—a struggle for independence from government control.
The American people are caught in a struggle of their own. They find themselves
in the middle of a war of words over which media outlets are biased, which are
mouthpieces for government policy, which pander to special interest groups, and if any
are left which tell the “true” story. That was the landscape for viewers as the American
media began the 21st Century. In 1985, 45% of Americans polled said the media were
biased in some way. By summer of 2001, that number had risen to 59% (Kohut, 2001, p.
14).
The eight-month dispute in Missouri over the proper role patriotic symbols do—
or do not—play on newscasts reveals a dispute that has been going on for much longer.
Clearly, there is little agreement among politicians, the public, or even journalists
regarding the impact and propriety of allowing symbols on air. All of the politicians who
wrote opposed to the KOMU policy were Republicans. Does that make the display of
19
patriotism in the form of a personal adornment a conservative trait? If so, then it would
be wrong for neutral journalists to wear such adornments. Among viewers, many who
opposed the policy mentioned support for President George W. Bush, while many of
those who supported the policy mentioned a distrust of the current administration. Does
that indicate a perception of bias among viewers watching newscast that carry such
symbols?
Along with the visual symbols, words are the basis of journalism—even on
television. Just how the symbols, the pictures, the video, and the words fit together to tell
the stories the consumers of journalism receive is at the heart of this research. The goal is
is to test possible causes for perceptions of media bias in viewers related to visual
imagery and symbolism they see, related to the words they hear at the same time. It will
probe the triggers necessary for viewers to perceive a presentation as biased, as well as
what threshold those cues must cross to be noticed. And it will test those proposed cues
across a range of issues, from consensual to divisive.
Dissertation Outline
Following this introduction, Chapter 2 surveys the development of the American
media system from partisanship to independence, with an examination of the rise of
impartial and unbiased reporting. The chapter chronicles the emergence of the American
press from the British traditions, beginning with colonial times. From the development in
America of a partisan press to the popular penny press, the evolution of the wants and
needs of the consumers of American journalism began to shape what would become the
worldwide standard of independent and impartial reporting in the last century.
20
Inexorably tied to the need for commercial appeal, this development of a sometimes
sensational, sometimes controversial, and always-profitable media system is the root
from which current journalist performance grows, and current satisfaction (or
dissatisfaction) with media standards exists. As the ability to measure audience wants
and needs grew more specific in that century, so too grew the theories designed to explain
media use and effect. Those theories made it possible to more easily understand the role
media played in distributing policy and other governmental information to the people.
With that understanding of the power of journalism came the first notions of bias. Before
that time, the partisan nature of the press made bias impossible. Only with an impartial
press was bias possible. The emergence of a perception of bias by media practitioners
gives rise to the necessity for this current research. This chapter sets up the foundation
for the need to understand the minute sources of perceptions of bias and how they have
evolved into this century.
Chapter 3 helps develop the foundation for this research further by making the
connection between media and politics by exploring the past century of literature on that
relationship. The chapter begins with a review of the early recognition of effects media
had on their audiences and how early research sought to explore the connections between
media message and consumer behavior. While this early research centered on motion
pictures and propaganda films, researchers eventually turned toward printed and
broadcast news as a primary source for media effects on consumers. As researchers
developed stronger theories for how media consumers use what they read, hear, and see
to make political decisions, the potential effects of perceived bias in that presentation
became more important. The chapter explores the most powerful of media effects in the
21
area of politics and public policy—agenda setting. Through a thorough examination of
what is know about the ability of the media to tell people what to think about, the
potential effects of perceived bias in story selection is explored. Additionally, an
examination of the role of the media as the framers of debate shows the important role
journalists can have not only in setting the public agenda, but shaping the way in which
the important agenda items are viewed and discussed. This framing power, too, is subject
to perceptions of bias by audience members. Closely related, the powers of the media to
prime an audience to associate and remember important messages in groups, and to foster
learning in audience members, give journalists that much more of a chance to introduce
perceived bias in their messages. The chapter concludes with an examination of the
literature of media effects on political behavior, where any perceived bias might have its
ultimate effect on the political process.
Chapter 4 reviews the existing knowledge of the political beliefs and partisan
interests of members of the news media. Delving into journalists’ personal political
beliefs is a surprisingly new pursuit. From the first large scale polling effort in 1976
through the most recent surveys of the mainstream press, the chapter examines the
aggregate political makeup of the media and how it compares with the general public and
elites in other occupations. Defining the political views of journalists is a first step to
understanding the perceptions of bias seen by news consumers. The next step is
exploring the evidence of actual—not perceived—bias in news product. The chapter
reviews the major arguments for and against a liberal bias in American media, right up to
the most recent studies of coverage during the current Bush administration. An
examination of the effects of corporate ownership on media independence and a possible
22
conservative bias leads the chapter to the need to explore the rise of professional
standards in media to attempt to stave off perceptions of bias and lack of independence.
This last section of the chapter involves a review of the practices journalists employ to
put forth an appearance of impartiality and unbiasedness in their coverage. The last
section of the chapter ties those practices to basis of the ribbon debate—whether news
consumers can perceive bias through certain actions of journalists, even where it does
note exist.
Moving from the literature review of media bias and effects, Chapter 5 begins to
establish the basis for the research asked in this set of experiments. The chapter describes
the general population of central Missouri and how its demographic breakdown compares
to a cross-section of the rest of the state and the nation. Missouri is often described as a
state with an east and west coast (St. Louis and Kansas City), a rural middle, and, most
importantly, a cross section of the political makeup of the nation. Boone County is often
seen as a smaller counterpart to the entire state, with a sampling of the political spectrum
of the state and of the country spread between its cities, towns, and rural areas. The
chapter describes the demographic and electoral patterns of the county as a basis for its
representativeness for this research. The chapter also explores the comparison of news
consumers in Boone County to the habits of the rest of the nation. This comparison
shows the relative media use of the potential subjects in the research and how their
dependence on television news makes them good subjects for a study that centers on the
perceived bias of local television news coverage of political and controversial matters.
With subjects selected for the research, the chapter is able to compare their base
demographic and ideological dimensions with the general population, giving a baseline of
23
prior beliefs before experimental exposure. Finally, the chapter develops a media trust
index with which to compare the views of the subjects on the media to national survey
data. This instrument is crucial to the cross-comparison of data from numerous national
studies with varying question formats and scales of comparison. The media trust index
(and its component parts—media fairness index, media accuracy index, and media
balance index) will also serve as the primary unit of comparison across all experiments in
the study. It serves as the common language by which all results in this work can be
studied, and through which future research ca be conducted.
As the research begins with the question of how symbols are perceived in the
journalism context, Chapter 6 begins with a review of the research into symbols and how
meaning is transmitted from sender to receiver. The focus is on both political and non-
political symbols, with an emphasis on the intended message the receiver perceives,
along with any noise that can alter or block that signal entirely. Turning to the use of
symbols in political communication, the chapter first describes specific research into how
the political communicator uses symbols. Then the focus turns to the mediated use of
symbols and the role the transmission media play in delivering an altered message to the
receiver. The use of the “story” as a symbol carrier becomes the main focus, leading up
to the approach of the study. In that approach, the use of patriotism, abortion, and same
sex marriage scenarios is supported with details on the currency and relevance of those
subjects. An experimental design is described which involves the production of false
“news breaks” that will allow the introduction of biasing political symbols into the news
presentation, as well as the use of biasing language to increase the chance for a
measurable experimental outcome. A measurement system involving a dozen
24
experimental groups and more than 200 subjects is described to show the scope and
breadth of the experimentation. The chapter concludes with ten hypotheses to be tested,
each connected to the original research questions and the literature supporting them.
Review of the experimental data begins in Chapter 7. Building from the
professional norms of journalism, the chapter sets up the views of the media and their
biases as seen by the experimental subjects prior to their exposure to the videotaped
presentation. The subjects’ views are compared to the broadly held views of the general
public in the three defining areas of the study—fairness, accuracy, and balance. While
the national polls show an erosion of trust in the media to deliver the news in an unbiased
fashion, the local subjects are not as harsh as the nation. That is not to say the local
subjects do not have a negative view of the media. The chapter outlines that view and the
possible reasons for its negative status. Delving further into the causes of the perceptions
of the media, the chapter explores any differences in the subjects based on ideology, as
well as demographic differences in the subjects.
Evaluations of the post-experimental data begin with Chapter 8. The chapter
focuses on the main hypotheses of the experiment—that subject perceptions of media
bias will vary according to the level of symbolic and verbal bias introduced by
experimental exposure. The subjects are described according to their distribution across
experimental groups, and the results of the post-experimental perceptions of local media
and national media bias are compared using the media trust index. The posttest
perceptions are then compared to the pretest perceptions in order to determine the effects
of the exposure to varying levels of bias. Those changes are compared across the three
perception parameters—fairness, accuracy, and balance—with a separate analysis of
25
each. Finally, the chapter examines the apparent positivity effect that surrounds local
television news and its newscasters and the effects it may have on the experimental
outcome.
In much the same way Chapter 8 examines the effects of the experiments based
on the degree of bias seen by the subjects, Chapter 9 examines the effects based on the
issue seen by the subjects. The issues—patriotism, same sex marriage, and abortion are
compared to each other through the pretest and posttest measurements of subject
evaluations. Subjects’ responses are once again compared for changes in perceptions of
fairness, accuracy, and balance for each of the issues used in the experiments. This
approach to evaluating the outcome of the experiments is necessary to try to explain as
fully as possible to effects of the manipulation of the independent variables on the
dependent variables. Looking only at the levels of bias for all groups defined cannot
show the differences issues play in the receptions and evaluation of media messages, just
as an evaluation of issues would not have given a complete picture. The chapter
concludes with some conjecture as to the possibility of issue “fatigue” occurring at the
time of the experiments with the subjects. That evaluation, along with the results of the
issue comparisons, gives readers a clearer picture of all possible issue effects on the local
audience.
The penultimate chapter moves beyond the degrees of bias and issues covered to
examine the makeup of the subjects and how, after all exposures, that makeup could be
responsible for the changes in attitude seen in some of the experimental outcomes.
Chapter 10 concentrates on two apparently meaningful variables in the subjects—their
ideology and their life experience. By once again analyzing the pretest and posttest

26
results with the filter of these ideological and demographic factors, it is possible for the
experiment to begin to reveal some of the inertia of public opinion about their media
sources and just how much force it takes to change that inertia and send consumer
opinion down a different path. The chapter takes the earlier evaluation of the
experimental results and divides the subjects differently to explore whether those in the
middle could be the most affected by biases in news presentation. That analysis is
repeated for both the ideological and experiential differences in the subjects.
Finally, Chapter 11 concludes the research by taking the findings and comparing
them with the common journalistic practices in use today. The chapter gives guidance to
journalists and readers concerning the impact of their words and images on the
perceptions of local audience members regarding fairness, accuracy, and balance in
newscasts.
27
Chapter 2:
The Roles and Effects of Media in Politics Was the furor over the lack of patriotic pins on the air of a small, local television
station worth nationwide attention and all the threats and stubbornness? If the answer is
yes, then the reason for the importance of this single, symbolic act must lie at the
intersection of media and politics. For journalists to risk their livelihood to stand for their
side showed a very strong conviction that the absence of the symbols was essential for
political balance in their stories. And for politicians to respond with such passion showed
an equally strong belief that patriotism is a universal good that cannot taint journalism
with its display. The difference between the sides is their understanding of roles the
media have to serve the public, and the effects media have carrying out those roles.
To state that media have effects on their various audiences is to state the obvious.
The mass media came into being to inform, entertain, incite, enlighten, and imbue
knowledge in the mass publics they addressed. From a time of infancy as the nation itself
was being born, American media developed slowly and steadily as both an economic
force and a tool for informing voters, shaping opinion, and setting the public agenda.
After an adolescence that flirted with partisanship and prurience, media moved into
adulthood at the dawn of the Twentieth Century. The ideal for the modern journalist was
an impartial observer, nonpartisan, ethical, with the goal to perfectly inform the electorate
of this complex democracy. But ideals can be hard to reach, and American journalism
was no different. Media had its effects, though not always expected or desired. The
origin of these effects—particularly those that cannot always be predicted, as with the
28
patriotic ribbons—bear witness to the changing perceptions of the audience members
regarding the media they consume.
American Press Emerges from the British Model
The American experience of media was born of the British model that boasted
more press freedom than ever seen before, but that still relied on monarchical control of
the press that resulted in far more slant than what we would think of as press bias today
(Aspinall, 1949, p. 33). The ruling king in England decreed that printing presses in the
colonies would operate only with the consent of the ruling local governor (Martin, 2001,
p. 36). Clearly the concern of the monarch was to control information critical of his reign,
making sure it had no effect on readers to build doubt in his power to rule. In an early
attempt to fight the built-in bias with an attempt at fairness, some publishers sought to
abide by this rule, while also giving equal play to the various sides of any issue. An early
printer himself, Benjamin Franklin summed up this approach to minimize effect in 1731:
[Printers are] educated in the belief that when men differ in opinion, both sides ought equally to have the advantage of being heard by the public; and that when truth and error have fair play, the former is always an overmatch for the latter. Hence they cheerfully serve all contending writers that pay them well, without regarding on which side they are of the question in dispute (Van Doren, 1941, p. 100). Franklin’s writes of the need for printers to uphold the responsibility of giving the
public a full view of the issues it faces. Though perhaps more than Franklin was
asserting at the time, the notion of complete information through the printed press can be
seen as the foundation for the impartial press that would come later. But the colonial
Americans would not live under the king’s limits or Franklin’s philosophy for long, soon
seeking out ways to publish documents designed to incite colonists to reject the king’s
29
rule and rise up to form an independent state. In the years following the victory of the
British in the French and Indian War, colonists saw unjust taxation by the British to pay
for the war as a means to bring about revolution. The colonial mass media, in the form of
newspapers, magazines, pamphlets, and broadsides, worked to stir a passion in the early
Americans that would help foment a revolt against British rule.
But that ability to print freely and bring about change did not happen naturally
under British rule. The colonial courts had to first rule on the ability of publishers to print
items critical of those in power. The landmark case that set those rights into case law
involved New York Weekly Journal editor John Peter Zenger and his articles attacking
New York Governor William Cosby. Zenger was jailed for criminal libel, but his trial
brought a new standard to libel prosecution in both Britain and the colonies. Zenger’s
lawyer argued that the standard for guilt in a libel case should not be whether the
defendant had published the critical material, but whether the material was true (Stempel,
2003, p. 2). Zenger’s acquittal on the defense of truth set the standard that would allow
early American journalists to begin seeing real effects with their writings.
An example of some of this early effect-seeking media would be Samuel Adams’
Journal of Occurrences. Adams began the first news service with this journal, offering
newspapers around the colonies a running diary of the deeds of British soldiers based in
Boston. The listing of events was written in such a manner that American outrage could
be its only effect (Streitmatter, 1997, pp. 7-9). Revolutionary publishing continued with
the intent of driving readers to support the cause and drive the British from American
shores. It should not appear that all printed matter of the day supported the revolution.
Some in fact was printed by loyalists to the crown. But the newspapers found they had
30
the most readers when printing those accounts that called for revolt, not loyalty (Davis,
1992, pp. 47-8).
Following the war, the press found its new role as affecting change and
supporting democracy to be one with which it was very comfortable. Editors and
publishers saw themselves as the architects of the revolution and the protectors of the
new democracy (Dooley, 1997, p. 62). Early American journalists saw themselves
surpassing historians in the role of bringing about the noble effect of democracy and a
new constitution, and even a worldwide rebirth of freedom:
Newspapers, originally, fanned that favored flame of Liberty, which first was kindled on the Columbian Altar, and from thence with unexampled rapidity has spread to the furthest bourne of Europe, illuminating the universe of Man in its progress, and giving freedom to myriads of lives (Massachusetts Mercury, 1793, p. 1).
The arguments for the formation of the new constitution and its government were
once again, as in revolutionary times, argued on the pages of widely distributed
publications. Newspapers played their role once again, publishing the strongest
arguments in favor of the new constitution with Hamilton, Madison, and Jay’s Federalist
Papers. The strength of these arguments for the document came, in large part, from the
strength of the newspapers that carried the essays. Pro-Federalist editors outnumbered
their Anti-Federalist counterparts, and that gap grew as subscriptions to the Anti-
Federalist publications dropped (Dooley, 1997, p. 49). Clearly, the press has its effect on
the formation of the constitutional government we now have.
Despite the high ideals at stake in the debate over the form of the constitution, and
the following years of editorial strife over how the government was operating, the
language and approach used to gain effect with the readers was often far from the high
31
ground. Terms like “adulterer,” “traitor,” “vile,” and “dregs of society” were used
regularly to refer to the people whom revere as the founding fathers today (Sloan, 1988,
pp. 100-2). The use of these terms—ones that would appear far too severe today—came
about because of the ongoing passion journalists and citizens felt for the issues of the day.
Newspapers found themselves with the need to be strongly on one side of the major
issues of the day, and not playing it down the center as Franklin had suggested seventy
years earlier. For the common American, freedom in the press had come to mean, by the
beginning of the Nineteenth Century, that those newspapers which agree with my point of
view should be free to print anything they like, while those who support opposing views
should be kept from publishing (Sloan, 1987, p. 84). It is a belief that will color the next
few decades of journalism in America, and come back in strength some two hundred
years hence.
The Rise of the Penny Press and Reader Appeal
In the Nineteenth Century, the elite and expensive newspapers of the
revolutionary era, the newspapers that, through their partisan messages, had affected the
political beliefs and voting behavior of many colonial citizens would find that the
growing American population was becoming more literate and developing an appetite for
a different sort of press. The traditional newspapers that had seen American through its
colonial times and into the new constitutional era were expensive. Many cost five or six
cents, and were clearly aimed at a moneyed elite that could afford such an extravagance
(Mindich, 1998, pp. 16-7). As the population grew, readers wanted more than partisan
political accounts. Crime news pushed political news from the front pages of the new
32
newspapers spring up in most major cities. They cost only a penny, far cheaper than their
Eighteenth Century forbearers. This new “Penny Press” was able to capture the passion
of the audience with more than just politics. In fact, they would not announce their own
partisanship, often claiming to have none (Mindich, 1998, pp. 17-8). These claims came
at a time when partisanship of the emerging middle class was powerful. Party
identification came to be a very important factor for the political socialization of the
newly enfranchised voters. So the penny press and its move from consistently-announced
partisanship should not be seen as a depoliticizing of American. Instead, it can be seen as
a real commercialization of journalism and a move toward mass marketing (Schudsen,
1990, p. 69). That move will also help set up another era of mass effects.
Each successive presidential administration was working to hold onto newspaper
support by issuing large government printing contracts to newspapers whose editors and
publishers supported the president and his policies (Smith, 1977, pp. 56-60). This helped
hold many papers to some sort of political tie. By the end of the Civil War, independent
papers still numbered in the vast minority, often making up fewer than a fourth of all
papers published in a state (Rutenbeck, 1993, pp. 41-2). More common was a newspaper
that would switch allegiances to sway with the sentiments of voters—and newspaper
buyers. In the highly competitive New York newspaper market, papers like the World
would favor the candidate who seemed most favored by potential readers. The paper’s
editor, Manton Marble, bought the publication, switched its editorial view from
Republican to Democrat, but then announced the paper’s position was in the middle, and
that he would be hiring a Republican to replace himself as editor (Rutenbeck, 1993, pp.
47-8).
33
Early Stirrings of an Impartial Press
Though the Nineteenth Century press was still very partisan, there were early
signs here and there that the game of playing politics to garner readers would eventually
end for the American journalist. A new word, “objectivity,” would find its way into the
printer’s lexicon. As early as Civil War times, journalists began to develop rules about
how they would go about their reporting (Payne, 1940, 251). By 1876, an early
newspaper publishers’ association in Missouri, the Missouri Press Association, had
written four rules its editors should follow, somewhat reminiscent of Franklin’s call for
impartiality:
First: Allow no temptation to secure your consent to the publication of articles long or short, in prose or poetry, original or selected, which are demoralizing in their character…. Second: …Give the substance. Omit the useless details…. Third: …As preliminary to profitable writing, and as a preparation for it, much reading and study is essential. Much brain-work, and often exhaustive research and more exhaustive thought, all unknown and quite frequently unappreciated by those who read newspapers…. Fourth, and lastly: We are just entering upon the Centennial Presidential campaign…Great and singular perils and strong temptations to bitter words and partisan excesses, will environ the press. Let us illustrate a royal virtue by resisting them…while we are sometimes partisans we are always patriots—above all, that we are not only editors, we are gentleman (Banning, 1999, pp. 23-4). Later, in the early part of the next century, national journalism organizations like
the Sigma Delta Chi and the American Society of Newspaper Editors would follow suit,
calling specifically for truth and objectivity in their codes of ethics (Banning, 1999, p.
25). But these came after a period of sensational journalism that highlighted the end of
the Nineteenth Century. This “yellow journalism” period was more about luring readers
with lurid reports than any of the four ideals cited in the Missouri Press Association code.
34
Not only were the most pandering stories developed for print, but reporters were
regularly known to change facts in their stories to make them stronger, or even add
fictional characters and quotes to purportedly factual stories, all for the sake of selling
more newspapers (Ferre’, 1988, pp. 193-4). This yellow approach did have audience
effect—a continuation of the partisan press period. Critics of the day feared the sordid
crime reports would actually turn young people to a life of crime, and backed the
statement with statistics showing a rising delinquency rate among juveniles (New York
Times, 1897, p. 3). More serious analysis did indeed postulate media effects on readers of
the day. It was feared readers would become desensitized to crime, and those with
criminal tendencies would be given a road map to criminal activity they could have never
conceived on their own, along with a printed push to go commit those crimes (Ferre’,
1988, p. 197).
But perhaps the reporter’s own desensitization to the stories unfolding before him,
along with a growing lack of respect for authority, led to the development of late
Nineteenth and early Twentieth Century journalists with a skeptical view of life in
general, and a specific skepticism aimed at those in power—regardless of party. Buoyed
by success with garnering readers through sensational accounts of war and crime, the
reporters went after politicians with the same glee. That brought about a feeling if real
independence amongst journalists, and the eventual birth of an era of public service in
journalism. This approach served not only to protect journalists from the wrath of those
in power they covered, but to also help deflect any criticism from readers who would
question the excesses of the press in covering stories (Kaplan, 2002, p. 167).
35
So as the Twentieth Century progressed, the partisan press of the past remained
often only on the mastheads of newspapers like the Arkansas Democrat-Gazette, and in
the opinion pages where editorials still took partisan positions. The news pages began to
fill with journalism focused not on partisanship to build a nation or line the pockets of a
wealthy owner, but on a new objectivity bent on ushering in an air of civic responsibility
from which publishing profits could still be made. This was the first time it became
important to reporters and editors to minimize bias in stories and try to find an impartial
middle from which to reporter. The idea changed the very structure and practices of daily
journalism. News agendas were no longer based on what those in power wanted covered.
Even the structure of the story changed to highlight the “news” at the top, then go on to
relate details (Kaplan, 2002, p. 192). The change forced political leaders and policy
makers to change their approaches in courting and cajoling the press. As more and more
people moved into the “profession” of journalism, the need for a coordinated approach to
address reporter questions grew. Even presidents worked to try to come up with a plan to
meet the growing news demand. Woodrow Wilson finally succeeded in centralizing
much of the information coming from his White House through the use of the Committee
on Public Information, the nation’s first official press relations bureau (Ponder, 1994, p.
265).
With the century underway, and a new, more independent press covering those in
political power, the modern structure of mass media was in place. A biased approach
was no longer acceptable in most newsrooms. Media effects had changed through the
years, leading to the point were a strong media, at work for its readers, listeners, and
36
viewers, had become the people’s eyes and ears in every room where politics was played
out.
The Birth of a Scientific Approach to Communication and Media Theory
The maturation of media into a search for an unbiased approach that satisfied all
readers coincided with the rising prominence of scientific inquiry into the sociology and
other studies of how human being associate and interact. The study of communication
strived to find theories that would explain how the sender of information transmitted his
data, how the receiver perceived that data once received, and what paths the data traveled
to get between both parties. This research would allow scholars to understand structural
bias in the transmission of communication, as well as perceived bias in the reception of
that information by its intended and unintended receivers.
One of the earliest conceptualizations of that process came from sociologist
Harold Lasswell. Lasswell (1948) described as simple model of communication as thus:
Who Says What In Which Channel To Whom With What Effect?
This model in question form captures the essential elements of communication
theory as it analyzes the interaction of actors transmitting data. “Who” asks for a
definition of the actor transmitting the data. The content of that data is important as well,
so “Says What” defines it in the context of the message. Lasswell wanted to be sure the
model captured the notion that there is more than one route for the message to take
between sender and receiver, so “In Which Channel” places that variable into the verbal
37
equation. A receiver is equally important to have as a sender, if real communication is to
take place, and “To Whom” acknowledges that idea. Finally, most communication
research, and particularly that which examines political communication, focuses on the
effect of that communication. The final fragment of the sentence applies that focus.
But applied to the search for bias in media communication, Lasswell’s model
cannot tell the sender—journalists—if their messages are being perceived as being
biased. Lasswell lacks a specific pathway for feedback to the sender from the receiver,
short of just reversing the model. But at about the same time Lasswell introduced his
model, Wiener introduced the concept of cybernetics with its intrinsic feedback
mechanism. Weiner (1948) was a mathematician who strove to model who human beings
and animals interact with their each other and their surroundings—including
communication. Weiner saw all parties involved in communication as objects which
interact through continuous loops of information, feeding back changing elements of that
communication. This notion of a stream of information, two-way (or more), that
continuously travels between actors and affects their actions can be applied to a theory of
political communication in which political actors use the mass media as their information
transmission path, or “channel” in Lasswell’s terminology, as well as another path from
which they can receive feedback information from members of the public. In this model,
the introduction of bias by the transmission path, the mass media, would have an effect
on the message received by the public, and also affect the feedback information going
back to the political actors.
Shannon and Weaver (1949) took a more complex view than the two previous
models. An information source produces a message. That message goes to a transmitter,
38
which then send the message (or “signal”) along a “channel” toward a receiver. Along the
way, noise is introduced that can alter or block the message. Finally, the signal reaches
the receiver and arrives at its destination. The important contribution to the theory here is
the way the system deals with noise. The authors suggest that the sender uses redundancy
to make sure any part of the message altered or blocked by noise still reaches the
receiver. In terms of the research of this study, that noise could consist of any political
bias introduced by journalists in their mediation of the message as it is transmitted to the
audience. The application of this notion of repeated messages, along with Lasswell’s
concept of multiple channels, depicts a modern political communication system where
bias and incomplete reporting appear as noise, and the use of differing media and
approaches to messages accounts for the redundancy and multiple channels in the
approach. Consider the political campaign using this model. The information source is
the candidate. He transmits, through public announcement, a policy position. That signal
is carried by the news media—print and broadcast—with each acting as a different
channel. The noise sources along that transmission paths are the biases of the writers and
reporters, their competence as journalists, the editorial policies of the various media
organizations, misprints and mispronunciations, and many other possible errors in
transmission. The receivers—voters—have redundant pathways through which they can
receive the candidate’s signal. They process the differing messages received, and pass
them on to the destination—their cognitive decision for choosing for whom to vote.
39
Models of Interpersonal Human Communications
Despite what seems like a good fit for political communication with this
information theory model, there are those who argue that the work of Shannon and
Weaver cannot be applied to direct human communication. Newcomb (1953) centers on
personal communication and the attitudes senders and receivers have toward each other
and the object at the center of the communication. The model incorporates the esteem the
senders and receivers have toward each other and the strength that esteem adds to the
messages sent between A and B. Put into practice when communication about an idea or
object takes, place, Newcomb sees the communication flowing more easily between
actors who find themselves in mutual esteem. This has implications in the examination of
political communication, both when those in power and the public share that mutual
esteem, as well as when the media and their audiences do. If an audience sees a political
leader improperly due to a bias in the media transmission of the leader’s messages, the
audience may lose esteem for that political leader. For Newcomb’s model to work
properly, it is the responsibility of the media to transmit messages without bias.
Working from Newcomb’s model, Bruce H. Westley and Malcolm S. MacLean,
Jr. (1957) devised an interactive system of communication that directly introduces the
effects of news media as a participant in the exchange of messages. Far more complex
than Newcomb’s model, Westley and MacLean allow for infinite objects to be
transmitted to a receiver. The objects can be events, ideas, or even people. A
communicator has access to those same objects and can transmit them to the receiver
after making alterations. But the receiver may employ an intermediary who intercepts
objects and retransmits those objects to the receiver, altering them as well. That
40
intermediary represents the mass media acting to filter news (objects) that it can then
retransmit to an audience (the receiver). An important feedback loop exists between the
audience and the media in this model, as well as between the audience and the creators of
the objects—newsmakers. The model describes the role of the intermediary as being a
nonpurposeful intervener in the transmission of the objects to the receiver. This mirrors
the goal of objectivity in the media. They intend to filter and pass messages without
adding any personal bias or changing the objects to some personal end. But can the media
be successful in being nonpurposeful in their transmissions? The model does account for
those times when they, intentionally or unintentionally, are not. Because it allows
receivers to send feedback to the intermediaries regarding the objects they are receiving.
Furthermore, the model allows receivers to stop employing those intermediaries that do
not continue to fulfill the receiver’s needs. One weakness in this model, when applied to
media, is whether the feedback look is really as robust as the model suggests. Critics like
Barron (1973) argue the media are resistant to meaningful access for feedback, and shut
out most messages they receive from the audience (Barron 1973, p. 304). This view is
consistent with the ongoing insistence from media that their messages are not biased,
despite many studies that show the bias exists.
Osgood (1954) also modeled communication between individuals with a shorter
route than previous theory. The source and transmitter are one in the same to Osgood, as
are the receiver and the destination. This model differs greatly from the information
theory model because the message contains meaning, rather than just raw data. Osgood’s
notion that the sender can change the message is important for any examination of bias—
intended or unintended. It speaks directly to the newscaster effect central to this research:
41
When individual A talks to individual B, for example, his postures, gestures, facial expressions and even manipulations with objects (e.g. laying down a playing card, pushing a bowl of food within reach) may all be part of the message, as of course are events in the sound wave channel (Osgood 1954, p. 2).
This model is crucial in supporting any claim that the message itself contains the biases
visually or aurally introduced by the message sender—the newscaster or journalist.
Additional models from about the same period further refine the flow of
information between sender and receiver. Schramm (1954) introduced the “field of
experience” each party has in common with the other is the place at which the signal
transmission takes place. Within this shared experiential space, the sender can transmit a
message that the receiver can fully comprehend. Applied to political communication, that
concept supports the “humanization” of the candidate with a myriad of shared
experiences with the common person. The visual of a photo opportunity are a way to
place that political actor into a familiar shared space with the voter—a factory, a ball
game, a hospital.
The Role of the Journalist—Independent or Power Broker?
As broadcasting—and particularly television—emerged as a power media force in
the latter half of the Twentieth Century, media theorists also emerged with competing
theories of how the print and broadcast media affect audiences and the workings of
government and politics. Theories multiplied as quickly as satellite television channels,
leaving a well-examined, if somewhat cluttered field of study for anyone trying to
determine the roles media play in society and how those roles affect their audiences.
42
Some see media as pawns of the state system in which they were operated, while other
see them as more independent entities that independently help support the host system.
An early and important work on the role of media postulated “four theories of the
press” defining the role the media play in linking the public to those in power. Siebert,
Peterson, and Schramm (1963) defined all media interactions with society and
government as either authoritarian, libertarian, social responsibility bearing or Soviet-
Communist in nature. Under the authoritarian model, the media are controlled by the
government and used as tools to carry out government policy and gather the support of
the populace for those policies. Media ownership may be public or private, but the right
to publish comes from a governmental decree. Control comes through the use of licensing
of journalists and publishers, governmental permits, and sometimes censorship. No one is
allowed to criticize the governmental structure or those in power. In contrast, the
libertarian model permits criticism of the rulers, and opens that opportunity to any private
interest financially capable of publishing. Here the role of the media is to discover truth
and place a check on governmental power. Only blatant defamation and obscenity are
banned. For a still freer media, Siebert, Peterson, and Schramm described a social
responsibility model. Under this system, the media are open to anyone with something to
write or say. Ownership is usually private, though government will run some media in the
public interest. The mission for media is to inform and raise the level of debate on
important topics. The only limits placed on media forbid serious invasions of privacy.
This form of media is found in the Twentieth Century America at the center of this
research. The final form of media is the Soviet-Communist form. The media here have a
clear governmental role. Ownership is public, with media run by government officials
43
themselves. The media exist to keep leaders in power, and any criticism of those leaders
or their policies is strictly forbidden (Siebert, Peterson, and Schramm, 1963).
If the social responsibility model is to represent the modern media experience in
this United States, then it is necessary to see how bias would alter the operation of its
ideal type. Providing information and raising the level of debate are noble causes, but too
general as statements of purpose or effect. Information is only as valuable as its quality,
accuracy, and timeliness. All media could be said to provide information. The question
to examine here is whether the social responsibility model, with its lack of external
controls, leaves no one able to determine if the information provided is accurate,
unbiased, and indeed able to raise the level of debate. Again, debate may arise over any
sort of information. But for democratic machinery to operate properly, it must be
lubricated by messages that are distributed free from bias and slant. The social
responsibility model does not account for the introduction of impure information nor a
way for citizens to reject what they find to be unfair and biased.
Merrill (1974) addressed the possibility of a biased press by depicting the range of
media systems from authoritarian to libertarian to be much more of a continuum than a
dichotomy. He saw press systems as being able to be pushed more toward one side or the
other by governmental and popular pressures. Those pressures can come externally,
through government censorship and control. But they can also arise internally, through
the improper editorial policies that allow personal biases to make their way into the
messages transmitted. Ultimately, Merrill fears the American system is sliding
downward toward more control and less freedom for the press (Merrill, 1974).
44
Following Merrill and Gurevitch (1982), Altschull (1984) returns to the four
theories approach, as well as Merrill’s models, ignore the reality of media members as
agents of power. Altschull finds the earlier theorists too concerned with East-West
conflict and threats, and blind to the evidence that no media, under any system, can ever
be free. Instead, he argues, there are three competing models of media as agents of
economic, political, and social power. Altschull suggests a market/capital model, a
Marxist/socialist model, and an advancing/developing model. Market model media work
to support capitalist doctrine through informing the public, keeping a watch on
government, and seeking truth. The market media are free from outside control and work
toward objectivity and serving the public right to know. But in the Marxist model of
media, the press works to educate workers and help form a class consciousness. The press
is free to an extent, but controls exist to be sure that free press takes the proper form and
approach. This model works as an agent for power by supporting state desires to
indoctrinate the public to its way of thinking and to demand support for the policies in
place. Finally, the developing model sees media as a governmental partner seeking
beneficial change and peaceful existence. The media are free, but subservient to the needs
to keep the nation vital and strong. To that end, a national level press policy guides the
activities of the media. Ultimately, Altschull sees similarities across the three systems. As
agents of those in power, the media always mirror the views of the powerful. Even
though each system claims press freedoms, those freedoms are narrowly defined in the
context of the society and it powerful actors. Keane (1992) agrees, citing five types of
control exercised in all political systems—including democracy—in order to maintain
media as a tool to serve the powerful in times of crisis: emergency powers of censorship,
45
secrecy of armed forces, lying, state propaganda through advertising, and indirect control
through corporate ties (Keane 1992, p. 17-22). And in all these models and systems,
media claim to serve their audiences, though they really serve those in power (Altschull,
1984).
But what Altschull and Keane fail to incorporate in their views is that the media
are often agents of power in their own right—perhaps unintentionally—yet still agents
who wield power to alter messages and change information. Critics of media bias point
to the persistent biases they see in media presentations and the uniformity with which
those biases are found across many media outlets. Those critics argue the media has the
power to alter messages from those in power or those seeking power, which lessens the
leaders’ power and adds to control by the media. Kellner (1981) argues the capitalist
theory as it stands cannot account for the contributions modern media, and particularly
television, make to the demise of capitalism. News programs show disintegration of
economic interests around the world. Kellner suggests television causes confusion in the
mind of viewers over which economic and political systems actually work (Kellner
1981). And with the fragmentation of the television audience at the end of the Twentieth
Century, the power of television to support one political system seems even less potent.
Still the connections between the ruling elites and media elites seem to be supported by
strong evidence. Gans (1979) found newsroom leaders often supportive of the status quo
and the governmental/press system in place. But the findings did not show an economic
self-interest among newsroom elites. Instead, Gans found an overall acceptance of the
existing system and a desire to improve it as a whole (Gans 1979b). Earlier that same
year, Gans suggested journalists shared eight “enduring values” which helped give the
46
American media its push toward supporting the status quo capitalist system. Gans
identified those values as: ethnocentrism, altruistic democracy, responsible capitalism,
small-town pastoralism, individualism, moderatism, order, and leadership (Gans 1979).
The parallels between these values and those most would consider to be the core of the
American capitalistic/democratic model are striking. More importantly perhaps, a closer
examination of the shared values of journalists would go beyond Gans’ values and
include many that would be seen as core liberal values. If Gans argument that shared
values of journalists help support the status quo through story framing that supports those
values, then it must be considered that shared liberal values would add a similar dose of
liberal values to news framing. Dreier (1982) showed the value of responsible capitalism
to be very strongly correlated within both sets of organizations (Dreier 1982). Koch
(1990) argued that the media are an instrument of those in power and daily show that the
wrongs of society are rare and unique, and always found out by those in charge.
Governmental actors use the media to build and reinforce legitimacy with the electorate.
Koch considers unbiased, objective news to be a myth through which the audience is
made to believe those in power are responsive, responsible, and resolute in their actions.
American Press Freedoms and the Cause of Bias
The particular case of “free” media in western democracies deserves closer
examination. Today, we see this freedom as one of the founding values of American
democracy. And in those founding times, the virtue of a free press was expounded upon
as if the notion came from heaven. Consider the works of Tunis Wortman, writing in
support of this cause in 1800:
47
Who, alas! is aware in how eminent a degree the vices and crimes of the multitude, are attributable to the abuses and corruption of political institution? Shall it then be said, that the ages which are to come, must derive no friendly lesson from of the experience of those that have passed? Shall no corrective be administered to the follies and wretchedness of society? Knowledge is the only guardian which can prevent us from becoming the vassals of tyranny and the dupes of imposture (Wortman 1800, p. 30).
Because of this heritage, citizens of the United States consider their democracy to be
foremost among the free press states of the world. But many Americans were shocked to
see the Reporters Without Borders ranking of press freedom that place the United States
rank 22nd among the 167 nations ranked, falling behind even former Soviet republics in
eastern Europe (Reporters Without Borders, 2004). Americans see the First Amendment
to the Constitution as guaranteeing an almost immeasurable freedom for American media
to report unfettered by any governmental influence. But the freedoms in this country have
evolved over time, and have never come as an absolute. Levy (1960) was the first to
suggest that the intent of the framers was to prevent prior restraint of newspaper
printing—and nothing more. More specific still, some hold that the First Amendment was
to bind the government from committing an even more limited action—federal licensing
of printed materials before publication (Georgetown Law Journal 1973, p. 6). Court cases
broadened the reach of the amendment over the years, although the United States
Supreme Court did not extend it to the states in case law until 1925 (Gitlow v. New York
1925), and didn’t lay the foundation for a reporter’s privilege to keep sources confidential
until 1972 (Barron and Dienes 1979, p. 425). With these increasing freedoms came more
power for media to determine policies and act according to their own assessments of
fairness and balance. The constitutional protections of freedom guaranteed a certain
freedom from external criticism for biased practices.
48
Sloan and Schwartz (1988) describe four schools interpreting the source of
constitutional freedom for media. The Nationalist School held sway throughout nearly all
the nineteenth century. Historians in this camp wrote of the freedoms in terms of their
fulfillment of the natural rights of the individual moving him toward an ideal type for
mankind. This analysis relied heavily on the notions of America as a laboratory to
explore the utmost in freedoms (Sloan and Schwartz 1988, p. 161). Bias was not a
concern in the rush to build a publishing industry and form a nation. Back in the earlier
years of that nation, nineteenth century courts saw press freedom cases not as
constitutional matters, but instead, as extensions of common law cases—and of far less
lofty concerns than the Nationalists imagined. Early publishers worked to make their
cases from an institutional standpoint—and one supporting their right to make money
publishing—claiming that they alone held a position in society that would allow them to
act as “watchdogs” of the government, representing the people where they could not
represent themselves. This view is consistent with Sloan and Schwartz’s description of
the Progressive School of the first half of the twentieth century. Progressives viewed
press freedoms as a tool the founders established to protect the commercial interests of
the new nation and thereby preserve their personal financial interests by maintaining the
status quo (Sloan and Schwartz 1988, p. 163). Again, the interests of the press
superceded any external concerns for the job that they did protecting those commercial
interests, whether biased or not. This view contrasts with the latter twentieth century
belief that the media “work” to help the individual gain knowledge and power in relation
to the government (Gleason 1990, pp. 4-5). That view is often touted when speakers want
to stress the theoretical role of the journalist and the media in representing the people.
49
Here, the notion of an accurate and unbiased press is implied. If the public is to gain
knowledge and hold power over the government, a fair representation of that government
and its actions must be presented. This view relates closely to the Professional School
that developed post-World War I. Scholars were looking for a non-libertarian view of
media freedom, and found it in a number of treatments. Levy was part of the body of
literature building here, all of which questioned the grand assumptions of ideal liberty
and attributed the American experience instead to a conglomeration of smaller
contributing factors (Sloan and Schwartz 1988, p. 169). And finally, a fourth, rather new
school, founded at the height of the cold war, suggests our version of media freedom
stems from the benefits this view had for those in certain political positions of power at
the time of the revolution. This Neo-Libertarian view incorporates many of the early
criticisms of the pure freedoms model, though it gives journalists a less high place among
the reasons for our freedoms.
Journalists, for their part, hold on to the claim of being an important—or in some
cases, indispensable—part of American government. Pulitzer Prize winner Clark R.
Mollenhoff, then the Washington Bureau Chief for the Des Moines Register, put it like
this:
Ours is a profession that gives us the opportunity to be a strong voice and a strong force for good government. We can mold good public officials into better public officials by demanding top performance. We can make bad public officials toe the line or risk exposure and ouster (Mollenhoff 1968, p. 190).
That statement plays well with journalism meetings and in the classroom, for it speaks to
a power journalists have to make government better. Here again, the notion of an
unbiased press is only assumed at best. In fact, critics could argue that Mollenhoff’s
50
notion of the role of the press gives license to leave balance behind and to be advocates
for certain policies and practices. That is a far cry from any implied impartiality.
Gonzalez (1992) would argue for a need for an advocate press because of its existence
thanks to a “positive” right, alien to the rest of the constitution. He finds the ability of this
right for press freedom to be carried out hampered by the persistent political power of
any regime that works against true democracy, and weakened because it must be enforced
by the very same government it is designed to protect against (Gonzalez 1992, p. 10).
Dennis (1996) points out media freedom is fettered by many other legal guarantees and
traditions, including libel and defamation laws, and the need for national security, and
non-constitutional pressures, like media ownership, press policies, and clever
manipulation of media take away even more freedom (Dennis and Merrill 1996, p. 11).
Some scholars have argued that the constitutional freedoms guaranteed for American
speech and media should not even apply to all things. Sunstein (1993) suggests a two-tier
approach where important political speech be given full freedoms, while a second tier of
less important speech be given lower priority and therefore be open to regulation by
government (Sunstein 1993, p. 130). Response to that notion brings criticism from those
who would argue the tiers are indistinguishable if one examines issues based on
usefulness in life, and not just being political in nature (Nickel 2000, p. 8). And
journalists bristle at the notion that a bureaucrat would decided which speech is protected
and which is not, leaving room in journalistic circles to call for more advocacy on the
part of the press, and again, less impartiality.
Bridging the early printed press freedoms to today’s electronic media, one other
limit on freedom appears. While the Bill of Rights was written at a time when the only
51
press was a printed one, the broadcast media arrive under strong government regulation.
Citing the limited size of the electromagnetic spectrum on which over the air television
and radio is broadcast, the federal government claimed the power to regulate to preserve
that spectrum and exercised that power through the Communications Act of 1934, a
power the Supreme Court upheld in 1943 (NBC v. United States 1943) and again in 1969
(Red Lion Broadcasting v. FCC 1969). Some scholars, like Barron (1967) have argued
that the media are essentially the same, regardless of the scarcity of their delivery
medium, and should share the same constitutional protections—including being free from
licensing. But others feel the intrinsic differences between the makeup of the media are
served by regulating them differently. Bollinger (1976) claimed a completely free print
media could work as the framers intended as a watchdog and safeguard on governmental
action, while a partially regulated broadcast media could do a sufficient job with minimal
governmental intervention. In fact, the engine of commercial competition between them
should do more than enough to offset any effects of the government licensing (Bollinger
1976, pp. 32-3). But that remains an uncomfortable position for scholars who still
envision the perfect freedoms they feel the framers intended. They continue to call for a
modern reinterpretation of the First Amendment, one that recognizes the changes new
media have wrought (Powe 1987, p. 254). Others call for a reexamination of the notion of
regulating media so that the corporate interests of the limited number of owners do not
cause freedom of the media to infringe on freedom of the press. Lichtenburg (1987)
makes her case that we can trust government at least as much as we can trust
corporations, so it may be wise to consider allowing government to limit the actions of
media-owning corporations in order to allow a diversity of ideas and true freedom of the
52
press to flourish (Lichtenberg 1987, p. 353). Lichtenburg would reach this balance
through regulation of media structure, not media content. Graber (1986) concurs, citing
many failures on the part of the “free” media to hold up their end of the constitutional
bargain handed them by the framers. Graber sees media institutions as holding a place in
society where their right to profit has been protected where few others have been. That
special place deserves more from those holding it. Graber calls for the people to expect
more from their media and the government to enforce it (Graber, 1986, pp. 274-5).
Perhaps media consumers are more capable now of taking Graber’s advice, thanks
to advancing technology. In 1947, Martin asserted that press freedoms often begin with
the right to start a publication without a government license, which equates to freedom to
start an unregulated business. Martin saw that few citizens could take advantage of that
freedom, unless they had millions of dollars at their disposal (Martin 1947, p. 140). But
Martin’s critique rings less true in an age of personal on-line publishing, though
established media still command far greater audiences. But citizens may be motivated to
begin their own publishing, being often unimpressed with the job the media does “on
their behalf.” Frequent complaints about media’s own inability to respond, just like
government, lead audiences to distrust the media, too (Wolfson 1985, p. 5). This trend
will be reviewed in depth in Chapter 4. But happy news consumers—perhaps unyet
willing to begin their own news organizations—brings today’s journalism back to a point
early in the nation’s history where partisanship may entice readers and viewers to change
media habits. Might not a media outlet seen as biased and too liberal lead to demand for
another outlet openly biased and conservative? Any perceived bias, no matter how
53
unintentional, leaves those offended audience members often looking not for the middle
again, but for media on their “side.”
Theoretical freedom aside, it is important to return to the interdependency of the
media and the government, which comes more strongly than just in shared values. Ball-
Rokeach and DeFleur (1976) suggested the mass publics would grow more dependent on
media in times of crisis or conflict, and the media would in turn, grow more dependent on
official and governmental sources. The commutative nature of media therefore builds
public dependency on government through the media (Ball-Rokeach and DeFleur 1976).
Hindman (2004) tested that theory in the wake of one of the largest crisis events of
modern times, September 11, and found overwhelming evidence that public support for
the news media went up substantially, public support for political leaders went up
substantially as well, and the relationship between approval for both grew stronger
(Hindman 2004). A concurrent study though, examining the earlier media test of the first
Gulf War, found more press independence from official government sources than recent
studies would have suggested. Althaus (2003) claimed that despite all the government
factors that would predict a lapdog press—strong executive, submissive Congress, and an
easy villain in Saddam Hussein—media went further to find independent points of view.
But this apparent independence was not total nor consistent, and Althaus suggests that
journalist’s laziness and lack of knowledge about the topics they cover often allows
“pushover” journalism still occurs with regularity (Althaus 2003, p. 404). Could this lazy
approach to news, coupled with natural human emotion in times of crisis, open up the
door for more bias in news presentation that goes unchecked by newsroom policies meant
to ferret it out?
54
Bias producing or not, a cozy relationship with government may not be the worst
association media members have—it may that with their own shareholders. A. J. Liebling
wrote: “The function of the press in society is to inform, but its role is to make money
(Liebling 1961, p. 4). Critics of the current state of the media, like McChesney (2003),
claim the economic role of the media as a corporate revenue source make it impossible
for them to maintain their role as the informers of society in an operating democracy.
Smith (1978) one considered market forces to increase the likelihood of independence
and impartiality in media. Now, he sees those market forces pushing out those twin
virtues. Commercial pressures for broadcasts and publications to make more profit every
year have driven all but the most staunchly stubborn editorial chiefs to allow commercial
tie-ins and even downright endorsements in the editorial pages and air time. Beyond these
abuses, major corporate media owners use editorial times to promote other commercial
ventures within the company, often terming it as simply “synergy” (McChesney, 2003, p.
311).
Bennett (1996) sees this trend toward bowing to commercial pressures as doing
more than just inserting commercialism into news pages and newscasts. The commercial
pressures have changed the basic approaches to news that the media have used to fulfill
their role as that democratic information provider. Bennett sees the pressure for
commercial success changing the very nature of individual media messages. That trend is
away from contextually strong, issue-oriented information and toward snapshot-like
messages that emphasize features of personal characteristics over information that frames
larger political questions (Bennett 1996, p. 382). And the lure of tailoring a news
presentation to fit the political disposition of the largest audience persists. If the nation
55
swings right, economic models make a shift in editorial policy to the right perfectly
logical. Common journalistic practices should prevent such a shift, but economic
pressures may prevail.
Purists see the role of the media as one that can have positive effects on the levels
of political information flow in the nation. Consider this call to action:
First, journalists are important, indeed crucial providers of certain categories of political communication; second, the public needs the political communication services of journalists, who will not only educate them politically, but will guard against politicians and government officials who might threaten democracy or act in their own interests instead of those of the public (Dooley 1997, p.127).
But the neither the United States Constitution nor more than two hundred years of
journalism history and practice can guarantee that the media in this country can carry out
those duties without introducing bias into the messages they deliver. The history of the
county tallies far more years in the partisan media column than in the impartial media list.
And book after book of media theories fail to see media practitioners who often perform
below the level of quality suggested by the ideal type. What exists is a structure that has
no high impediment to the introduction of bias, and a public which is often unsure how
the messages it is receiving have been altered since the time they left the original
transmitter.
56
Chapter 3 The Effects of Media on the Political Process
The development of mass media from colonial American to the beginning of the
Twenty-First Century came with change and evolution, not only in the effects the media
had on their audiences, but in the understanding of those effects. Early studies were
crude by today’s standards, but were able to develop a basic understanding of those basic
media effects. As media became more sophisticated, so too did the instruments to
measure effects, and the theories built with those measurements. Important theories
regarding the ability of media messages to influence salience of issues and the evaluative
approach audience members took with those issues changed the understanding of how
audiences use the information they get from the media. Political leaders began to
understand the workings of mediated political realities, and set out to use that knowledge
to craft their messages for the largest impact with the audience. But central to any use of
the media to communicate political messages is the continuing threat of bias as a filter to
distort the message. In each of the developments of media effects theory to follow, the
specter of bias still looms as a possible distortion to the message. And these developing
theories of media effects are necessary before examining any evidence of bias mixed
amongst those effects.
Early Audience Effects Studies
Though there were clearly assumptions of media effects of political beliefs and
behaviors from the beginning of the American experience, the first scientific studies of
57
those effects did not take place until following World War I. It was a time when the
scientific tools were being invented that would allow quantitative measurement of the
individual and his beliefs and behaviors. Sociology was maturing as a science, and the
practitioners of social science research were turning their attention toward trying to
answer many of the questions that existed about how and why men and women behave
the way the do in a social setting. At the same time, a new medium with the apparent
potential for great effects had arrived on the scene—the motion picture industry.
Researchers believed this new medium of moving—and later, talking—pictures would be
very effective in motivating attitude and behavior change in its audience (Lowery and
DeFleur 1983, pp. 33-4). Some were concerned about the violent or romantic content in
even the earliest films. One researcher painstakingly cataloged movie content and found
nearly seventy-five percent to be about love, violence, or sex (Dale 1935, p. 8). The effect
that subject matter might have on children brought together sociologists, educators, and
psychologists to develop an experimental series that would determine motion picture
effects. Funded by The Payne Fund, a private philanthropic foundation, the study was the
starting point for modern media effects research.
While the Payne Fund studies did not address political content and therefore,
could not address the bias question central to this research, the series of experiments
involved laid a framework for many studies to come that would address how all media—
not just motion pictures—affect their audiences, including politically. The central media
effects research topics were learning, emotional stimulation, attitude change, and change
in behavior.
58
Payne Fund researchers began by examining whether audiences actually learn any
information from watching motion pictures. Holaday and Stoddard (1933) found that the
effects of motion picture information on learning were very high—higher than during
laboratory-based memory experiments testing other types of learning. The researchers
also found a “sleeper” effect that showed information retention was even higher six
months after viewing the films (Holaday and Stoddard 1933, p. 128). Modern studies of
information reception and learning from news have developed from this early study.
It is commonly accepted today that movies can bring about emotional responses
in their audiences. But Payne Fund researchers worked to find the scientific linkage
between motion picture content and emotion. Dysinger and Ruckmick (1933) tested both
children and adults to see if the motion pictures they were viewing would generate any
spark of emotion. The researchers pioneered the use of mechanical testing of response
through the use of electronic sensors to measure galvanic skin response and breathing
patterns of filmgoers. They found that both children and adults responded to motion
pictures in physical way, though children were much more likely to have emotional
responses. The researchers credited the difference to the ability of adults to separate
movie fantasy from reality (Dysinger and Ruckmick 1933, pp. 110-9).
Attitude change is another staple of political effects research that got its start in
the Payne Fund studies. Researchers focused then on the effects of motion picture content
on changing the attitudes of children toward racial and social issues. Peterson and
Thurstone (1933) studied the short-term effects of watching single films and multiple
films, as well as long-term attitude change. The research showed significant attitude
change for children watching single films, and also significant cumulative attitude change
59
for those who watched a series of films. They also found that the attitude change
measured persisted over time extending into multiple months and even years. At least as
interesting as the outcome of these experiments is the way in which they were conducted.
The research developed a design that measured subject’s attitudes before the experiment,
then exposed them to the motion picture subject matter, and then retested the subjects
again to determine attitude change. While lacking the use of control groups and other
modern refinements, this pretest-posttest design became a standard approach to testing
attitude change in all age groups. It is the basic experimental design on which this current
research is based.
The final groundbreaking research from the Payne Fund studies involved studying
motion pictures as the possible cause of what was seen as a rising juvenile delinquency
rate. Though that research topic seems almost quaint by today’s standard, the experiments
laid a foundation for behavior change research that would address media’s effects on
political behavior. Blumer and Hauser (1933) did not use quantitative research as in the
other Payne Fund studies, but took a qualitative approach of extensive interviewing of
their subjects. The research showed that children used movie examples to guide their
play, and fondly remembered that play into adulthood. Most significant of the research, it
showed that the memories derived from early motion picture viewing had long term
effects that affected the ways people dressed, ate, and socialized (Blumer and Hauser
1933, p. 141).
A successor to the Payne Fund study also looked at the effects of a developing
form of popular entertainment—radio drama. In 1938, a young Orson Welles took part in
a live radio adaptation of H. G. Wells War of the Worlds. The program was produced to
60
simulate a normal night of radio listening that is interrupted by strange reports that turn
out to be invaders from Mars landing in New Jersey. Of the many listeners that evening,
about a million believed it was a real invasion (Sparks 2002, p. 46). Along the east coast
of the United States in particular, panic spread from city to city as listeners expected the
Martian invaders to arrive at any time. CBS apologized for the trouble the next day—a
Halloween eve broadcast that went wrong. But one thing went “right” in all the turmoil—
researchers at Princeton University in New Jersey saw an opportunity to find out why a
fake broadcast has convinced so many people it was real. Cantril (1940) found that
audience members were quick to believe events depicted in the broadcast were actually
happening because they trusted radio as a news source. The entertainment program
sounded just like the actual radio news programs they were used to hearing, so they
believed it was real, too (Sparks 2002, p. 46).
The results of the Payne Fund research, as well as that of the War of the Worlds
broadcast, lead early researchers to believe that mass media were very powerful in
affecting their audiences. The commonly held view was that media messages traveled in
uniform ways to audience members and were directly received in the same way by those
audience members. This theory of a direct delivery system, straight from media message
into the heart of the audience member earned colorful names like the “Magic Bullet,”
“Hypodermic Needle,” and “Transmission Belt” theories of mass media effect (DeFleur
and Ball-Rokeach 1982, p. 161). Critics saw the theory as defining the mass media
message senders as too powerful, the audience receivers too homogenous, and the path in
between too clear of obstacles (Katz and Lazarsfeld 1955, p. 20). But the notion of a
powerful effect drawn from media messages acting on innate urges and emotions was
61
completely consistent with the science of the time, which saw human behavior shaped
mostly by instinctive response to stimuli (DeFleur and Ball-Rokeach 1982, p. 162).
Though never a formally stated theory, the magic bullet concept seemed to make sense.
There was no scientific evidence present to contradict its outlook on media effects.
So the magic bullet theory, along with the Payne Fund and War of the Worlds
study had begun the modern era of media effects research, but their areas of study were,
for the most part, not that closely related to politics. Some of the Payne Fund attitude
testing of children dealt with ethnic and social stereotypes—problems normally dealt
with in the public policy setting. But the bulk of these studies were done to find the
effects of entertainment media or direct propaganda on their audiences. It would be
fifteen years after the Payne Funds studies before groundbreaking new research would be
published that included data on how media consumption affects political and voting
behavior.
The People’s Choice: Media and Politics Examined
Three authors in 1940 set out with the simple, yet extremely important purpose of
determining how voters made their minds on whom to vote. The results were far from
simple. The People’s Choice set the stage for a new use of survey research techniques to
reveal the reasons behind voting behavior. The authors selected a single Ohio county as
the setting for that survey research. Erie County was small (with a stable population of
about forty thousand individuals), mostly white, and spilt fairly evenly between rural
agricultural workers and a blue-collar workforce. It was located in a part of the state far
62
enough away from the big cities that they didn’t dominate economy or the culture, but
close enough that the national and local media from the cities reached the county.
If the location of the study was typical, the approach the researchers took was not.
Lazarsfeld, Berelson, and Gaudet (1948) chose 3000 people from the Erie County voting-
age population. This large sample was broken down into groups consisting of six hundred
members each. These panels were the cores of the longitudinal research design. The
entire sample of three thousand individuals were interviewed at May, the beginning of the
presidential campaign season—at least in 1940. Then, the six hundred members of one
single panel were interviewed six more times—monthly, right through the election. This
design was different from earlier media effects research in that it tested changes over time
in the same sample. But another difference proved to be even more important. In July,
August, and October, three other panels of six hundred members each were interviewed
at the same time as the main panel. These parallel interviews of three other groups
provided a control to determine if the act of interviewing subjects would affect their
behavior leading up to the time to vote. This use of control groups to measure and
subtract for any experimental effect proved to be very important for future research. The
differences between the main panel group and the three control groups were very small
(Lazarsfeld, Berelson, and Gaudet 1948, p. 159), meaning this approach would be used in
future research on media effects.
Aside from a research method that was groundbreaking, the results shed first light
on many facets of the voting decision process. Much of the study dealt with other factors
affecting voting aside from media. The researchers found that the major predictors of
voting choice were socioeconomic status, religion, rural-urban residence, occupation, and
63
age. In the end, these social predictors where summed up with the simple statement,
“Different social characteristics, different votes” (Lazarsfeld, Berelson, and Gaudet 1948,
p. 21). The factors of socioeconomic status, religion, and rural-urban residence proved to
be the strongest predictors of voting behavior and came to make up the index of political
predisposition (IPP) for each voter. That put voters into one of six categories: (1)
Strongly Republican, (2) Moderately Republican, (3) Slightly Republican, (4) Slightly
Democratic, (5) Moderately Democratic, and (6) Strongly Democratic. The IPP called for
someone who was rural dweller with a high socioeconomic status and who identified
himself as a Protestant to be in category 1. At the other end of the spectrum, a city-
dweller with low socioeconomic status who identifies as a Catholic would be in category
6. And members in each category correlated strongly with their predicted voting patterns
(Lazarsfeld, Berelson, and Gaudet 1948, p. 26).
Aside from these social characteristics, media influence was also part of the study.
The study introduced three concepts that describe the effects messages received through
mass media have when combined with those pre-existing social determiners of voting
patterns. The authors describe these mediated influences as activation, reinforcement, and
conversion. Activation describes the process by which media-delivered information
arouses a desire to vote that is entirely consistent with the voting pattern predicted by the
individual’s IPP. The process begins when some political information—what Lazarsfeld,
Berelson, and Gaudet (1948) refer to as propaganda—reaches the voter and is received.
The reception of this media message brings on an increase in political interest. As that
interest increases, the voter begins to pay more attention to other political messages
around him, particularly those consistent with the IPP-predicted voting tendencies. This
64
notion of selective attention to only some of the political information available shows
how the voter reinforces those IPP-predicted characteristics. Finally, the decision to vote
come on this activated interest and selective exposure to the facts at hand.
Lowery and DeFleur (1983) point out that the mechanism of activation comes in
conflict with the classical notion of a rational voter who weighs all costs and benefits
with any political decision and makes his choice based on the decision that provides the
greatest utility for that individual. Activation does not allow for the weighing of ALL
differing points of view. Instead it shortcuts some options to make the process easier for
voters.
If activation shows media’s ability to take what would appear to be a non-voter
and drive that person to research at least some of the issues at hand and make the decision
to vote, what of the voters who already have a voting intention? The authors found that a
continuing flow of propaganda from the voter’s party helps to reinforce the decision the
voter has already made about casting the ballot. The information comes over time, not all
in one set period, and it serves the purpose “to secure and stabilize” support and eventual
vote intention (Lazarsfeld, Berelson, and Gaudet 1948, p. 215). The media-centered
effect of reinforcement does not build more voters for a particular candidate, as activation
can, but it does help guarantee that likely voters cast those ballots on election day.
If activation and reinforcement work to motivate partisans (as predicted by their
IPP categories) to vote for a particular candidate, can media actually move voters to vote
for someone not consistent with their predicted support pattern? The third media effect,
conversion, is the power to do just that. But that power only works for a small percentage
of the voters in any given area. Most have made up their minds and remain steadfast,
65
thanks to the reinforcement power of the media. Others are activated to make a vote that
is consistent with the social framework in which they are making their voting decisions.
That leaves a handful of voters not strongly affected by their IPP pre-determinants, and
under pressure from conflicts within the framework (like being a rural-dwelling
Catholic). These voters do not fall strongly into a voting predictor category, and could be
seen as converting from one side to another in the lead up to the election.
This examination of media effects in Erie County also began with the assumption
that the propaganda messages of the parties were spread across the population in a
massive wave, too broad for anyone to miss. That view is consistent with the magic bullet
theory that depicts persuasive media messages as a direct shot from party sender to voter
receiver (Lazarsfeld, Berelson, and Gaudet 1948, p. 120). Though the authors of this
study did not plan to test the magic bullet theory, some of the results suggested the
distribution of attention among voters to media messages was far from even. As the
election approached and more and more political information was available to voters,
those voters did not receive the information in increasing numbers similar to its
distribution (Lazarsfeld, Berelson, and Gaudet 1948, p. 121). In fact, the research found
those voters who consumed a great deal of media-delivered political information in one
medium, such as radio, also consumed the most in other media as well. These tended to
be voters with high interest levels, those who had already decided, and those with high
SES levels. These particular individuals came to play an important role in the final theory
to arise from the work—the theory of two-step flow facilitated by opinion leaders.
Lazarsfeld, Berelson, and Gaudet’s concept of the two-step flow model was
simple. They pictured information flowing through the media to opinion leaders—those
66
high SES individuals with high political interest who had already made their voting
decisions—and from those leaders to the rest of the voting population. Those final
recipients of information (coming from opinion leaders) were those who were not as
likely to pay attention to media (Lazarsfeld, Berelson, and Gaudet 1948, p. 151). Opinion
leaders were successful in reaching the less interested voters because they were seen, not
as sources of propaganda—which those voters might avoid, but as trusted individuals
without a set political agenda. That distinction is an important one, because this early
study seems almost naïve in its assumptions of the pure intentions of political leaders,
opinion leaders, and the media. Though the work assumes a propagandistic purpose to
information coming from political leaders, it sees that message as unaltered through the
remaining steps in its flow to the voter. Therefore, the model does not account for bias or
its effects on the voter.
The Limited Effects Model
Lazarsfeld picked up the notion of opinion leaders and their role in delivering
political information again, and along with Elihu Katz, set down a systematic appraisal of
the role of these individuals. Designed to further test the two-step flow model derived
from the Erie Co. experiments, the authors chose the city of Decatur, Illinois for this
study. Decatur had the right size population, a tendency toward the center in social,
political, and economic areas, and was located in the Midwest. The subjects were all
women, eight hundred in all, all at least sixteen years old. (Katz and Lazarsfeld 1955, p.
335-8). The authors took four approaches in a qualitative attempt to identify opinion
leaders. The subjects were asked directly about whom they went to for advice regularly.
67
They were also measured for opinion change, and then asked if they had talked to anyone
about the subject on which they had experienced the change. A third approach asked
simply for a list of everyday contacts the women had with whom they would talk and
converse. And finally, the subjects were asked in they themselves had given advice to
others at any point recently (Lowery and DeFleur 1982, pp. 187-8). That final question,
asking women to place themselves as opinion leaders, developed the mail sample for the
research—six hundred ninety-three women who had claimed some position of opinion
leadership over their peers. The study focused on fashion, movie selection, and shopping
opinion leaders, and in those venues, women were quick to point out their own personal
value to others in helping make decisions. But in the area of public affairs opinion
leadership, women claimed that men were the main source of their own opinions (Katz
and Lazarsfeld 1955, p. 276). This seems somewhat sexist in today’s context, but was
consistent with the post-World War II female role. Still, some women did claim to be a
source for opinion formation, and they belonged to a group that was mainly of higher
socioeconomic status. This was the main factor predicting opinion leadership in women.
Other contributing factors were the number of social contacts a woman had, and to a
lesser extent, her age, with younger women being more active as leaders. Carter and
Clarke (1962) would later question the social contact evaluative dimension, as they found
that watchers of educational television were often opinion leaders, but seldom had a large
number of social contacts or “gregariousness,” as Katz and Lazarsfeld had suggested.
So the magic bullet theory, with its picture of global, widespread effects, gave
way to a limited effects model that showed that mediated political messages were not
bullets or needles, but instead were something much weaker—unable to penetrate the
68
selective perceptions of many voters. Klapper (1960) went so far as to say that there was
no evidence of a cause and effect relationship between mass media exposure and any
attitudes or behavior on the part of audience members, with any actual effects being very
minor. This notion of limited effects from media gave rise to a new model and new
ground for more research.
With a new model of limited effects with which to work, research became much
more precise in its search for describing the impact of mediated political messages on
voters and potential voters. McLeod and Reeves (1980) stressed there is no one media
effect, or even a group of media effects. Though they were not specifically studying
political media use, they found that there are four dichotomies of media effects possible
to study. The first dichotomy follows basic economic theory in stating that all media
effects happen at either the micro or macro levels. Micro-level effects happen at the level
of the individual audience member. The Payne Fund studies or the People’s Choice
experiments would be examination of micro-level effects in mediated political
communication. In contrast, macro-level studies examine the aggregate effect of media
messages and delivery systems on whole communities or nations.
Another dichotomous division of media effects study involves the consideration
of how content in the media affects audiences, compared to the medium itself. Sparks
(2002) compares measuring the effect of television content on children’s behaviors,
versus the sedentary behavior pattern used to watch television.
McLeod and Reeves (1980) also challenged the long-held belief that media
effects were always related to attitudinal change in the subjects. They believed that
cognitive changes also took place as audience members used mass media. This is a major
69
jumping-off point for much research that delves into how media impact what we think
about, not just how we act on those thoughts.
Finally, building on findings from the People’s Choice research, McLeod and
Reeves (1980) suggested that the findings by Lazarsfeld and company that much of the
political information voters used helped to reinforce already held attitudes, not just
change them, gave rise to a theory of opinion stabilization, and not just opinion change
due to media exposure.
The limited effects model lays a foundation for research to come that questions
what effects, if any, media messages have on their intended audiences. The research into
perceptions of bias grows directly from the limited effects literature, as the measurement
of media bias demonstrates very different perceptions from the same stimulus. The way
the subjects and audience members receive the sent messages is key to understanding
when those audience members see bias, and when they do not. Central to understanding
those effects are the psychological and sociological explanations of media effects.
External Messages, Internal Effects
If the effects of media were limited, as the emerging data revealed, then by what
mechanisms do political and persuasive media messages actually affect the behavior of
individuals? Two models compete to explain the methods of effective persuasion via the
mass media. The psychodynamic model relies on the ability of the sent message to
somehow affect innate psychological attributes in the individual, motivating an action or
change in actions on the part of the individual. The sociocultural model, by contrast, calls
for persuasive messages to resonate within an individual’s social context and motivate
70
action by either reinforcing or changing that individual’s definitions of the proper action
for those in his social setting.
Psychodynamic Model
The psychodynamic model is by far the more extensively researched and accepted
of the two competing models. Some experiments have shown great ability under this
model to affect behavior, particularly when using a message that includes a threat
designed to cause a fear response (Kraus, El-Assal, and DeFleur 1966, p. 25). But, of
course, not all attempts to persuade, even using fear, are successful. That resistance to
attitude or behavioral change comes from the variables the message senders cannot
control—individual differences in the personalities and psychologies of the audience
members receiving the messages. So Rokeach (1973) and others suggested a modified
psychodynamic model that places a person’s internal value structure at the heart of
persuasion. In this value change model, audience members who find their own values to
be inconsistent with what they see as idea values will change their own values to reach
the ideal. Media centered research (Sanders and Atwood 1979) shows mass media
exposure to information that sets up a dissonance between a person’s held values and
what are depicted as the ideals can cause behavioral change in order to reduce or
eliminate the dissonance.
Sociocultural Model
The sociocultural model differs from the psychodynamic in that it relies on the
individuals desire to fit into a social norm, rather than be in congruence with a self-
chosen ideal. Social pressure can be an immensely persuading power, and if the mediated
messages can give audience members the impression that they are deviant from the
71
accepted norms, attitude and behavior change may take place to move oneself closer to
that norm (DeFleur and Ball-Rokeach 1982, p. 228).
Source Credibility
One final question especially significant to the current experiment revolves
around attitude and belief change as it is related to the credibility of the source. The
literature of psychology has extensively examined the benefits of credibility as well as
the sources for perceptions of credibility. The literature points to credibility coming from
the sources themselves, the message perceptions, the channels used to relay the message
from the source, and the status of the receiver of the message. Though physical
attractiveness of the source is often seen as a producer of higher credibility (Mills and
Aronson 1965, p. 176), the literature points to a perceived similarity between source and
recipient as a powerful predictor of high credibility (Feldman 1984, p. 149). More
important, though, are the message variables that influence the credibility of the source.
Pornpitakpan (2004) outlined twelve factors found in the message content that help
increase the credibility of the source. The strongest of these seems to be from a source
that presents a message incongruous with its own self-interests (Pornpitakpan 2004, p.
254). That is a difficult finding to apply to the study of bias in media sources, as those
media sources should distribute their messages with no self-interest in the content of what
they deliver.
News media believe themselves to be credible at all times—a perfect source of
information. And while news media do not see their role as changing the minds of voters
when delivering political news and information, those in charge of the news media outlets
believe their credibility allows audience members to gather reliable information for
72
making voting and other political decisions. And studies in the effectiveness of
information from credible versus non-credible sources on attitude and behavior change
show that credibility does count. Hovland and Weiss (1951) tested audiences receiving
the same message, but from two very different sources. In each of four experimental
trials, one source was a media outlet with high prestige and credibility (a prominent
medical journal, a leading U. S. nuclear scientist, etc.) while the other source was
considered to be of low or unreliable credibility (popular magazine, Soviet newspaper,
etc.). Though each subject read the same material, the sources were different for each
pair. In three out of four cases, the subjects who saw their article attributed to the higher
credibility source were more likely to change opinions than those who believed their
article came from the lower credibility source (Hovland and Weiss 1951, p. 646). Further
research by McGinnies and Ward (1974) confirmed this effect across multiple cultures.
And Anderson (1971) suggests a credible source multiplies the weight of the message to
the receiver. Research aimed specifically as judging media source credibility and its
effect on the delivery of the message found similar results. Page, Shapiro, and Dempsey
(1984) found the experts fared better than politicians as highly credible sources of
information in stories. The authors were quick to point out that their study was not so
much about media effects as source effects from appearing in media, but it is important to
note that journalists themselves, when delivering editorial messages, fared equally as well
as scientific or other experts, and far better than politicians.
But the mass media—particularly the news media—derive credibility from more
than being a delivery vehicle for third party experts. Media members derive their own
perceptions of credibility with the audience. Members for the media select stories, write
73
articles, collect sound and video, and process it all through individual editorial and
creative approaches. Television has a built in trustworthiness (Andreoli and Worchel
1978, p. 62) that allows some leeway with audience members before credibility is lost.
But the same threats to credibility to exist, and perceptions of bias in the audience will
erode that credibility.
Agenda Setting
Agenda setting is perhaps the most widely researched of all the possible media
effects. Much more is known about how media messages affect the motivations of
audience members to move issues higher in their salience structure than with many of the
other effects media can create. The agenda setting process, both from media to audience,
and internally setting the media agenda itself, can shed much light on the possible
introduction of bias into media content. Because while a message itself may be impartial
and without bias, the selection of which messages to relay can tell much about the
internal interests and possible biases of the journalist making the editorial decisions. The
literature of agenda setting does much to reveal where those biases may be injected into
the process.
Setting the Public Agenda
Bernard Cohen’s (1963) one line definition is perhaps the most widely quoted
sentence in all of media effects research:
The press may not be successful much of the time in telling people what to think, but it is stunningly successful in telling its readers what to think about. (Cohen 1963, p. 13)
74
Cohen’s quote came a decade before the seminal work that would catapult agenda
setting theory to the forefront of media effects research. But the notion that media
messages can help set an agenda for attention and though goes back to before Cohen’s
summary of the effect. Long (1958) actually used the terms “agenda” and “setting” in his
description of the power of newspapers to shape what people think and talk about:
In a sense, the newspaper is the prime mover in setting the territorial agenda. It has a great part in determining what most people will be talking about, what most people will think the facts are, and what most people will regard as the way problems are to be dealt with (Long 1958, p. 260).
Long’s thoughts are echoed in the words of Kurt and Gladys Engel Lang the next year
with their notion of a media that compels its audience to examine certain topics. The
Langs see media presenting reports and other objects that actually force the attention of
audience members to the issues (Lang and Lang 1959, p. 232).
But the work that gave the theory its names, as well as put an army of researchers
to work testing its hypotheses came in 1972 when Maxwell McCombs and Donald Shaw
introduced their theory of how the mass media tell audiences what to think about.
McCombs and Shaw asserted “the mass media set the agenda for each political campaign,
influencing the salience of attitudes toward the political issues” (McCombs and Shaw
1972, p. 177). The authors directed their research toward political campaigns in general
and chose the 1968 presidential campaign specifically on which to test their hypotheses.
Randomly choosing registered voters from the Chapel Hill, North Carolina voter rolls
(both men were professors at the University of North Carolina), McCombs and Shaw
interviewed one hundred uncommitted voters regarding their views of what were the key
issues in the upcoming election. At the same time, the authors reviewed and classified the
75
news coverage in the major newspapers, news magazines, and network television
broadcast leading up to the election. When comparing what voters said were the major
issues in the campaign and what issues received the most media coverage, the authors
found a remarkably strong correlation between media attention and audience salience.
And this strong correlation was present with both major (longer, more significant) and
minor (shorter, less significant) stories in the media (McCombs and Shaw 1972, pp. 180-
1).
McCombs and Shaw also wanted to test the power of selective perception versus
the news media. If the commonly held theories of selective perception held true, than
partisans would not expose themselves to the information media are carrying from
candidates in the other parties. But if agenda setting were at work, those partisans would
emphasize equally the positions of candidates in any part, so long as the news media had
given them attention. Results of the Chapel Hill subjects showed a stronger relationship
between news media attention and subject interest than between partisanship and subject
interest (McCombs and Shaw 1972, pp. 182).
One other interesting set of correlations was amongst the news media members
themselves. McCombs and Shaw found very high correlations in the coverage patterns of
the various media analyzed. Accounting for the differing missions and strengths of print
versus broadcast media, as well as any biases within certain media organizations (though
the authors did not test for those biases), the correlation showed the media are very likely
to find the same issues newsworthy during a campaign, thus adding strength to their
collective agenda setting power.

76
The correlation strengths found in McCombs and Shaw’s article had their own
agenda setting function, focusing the eyes of many researchers on a field of research that
would surely withstand more scrutiny in the search to refine this new theory. Correlation
does not guarantee causality, and more research was needed to see if the messages chosen
to be passed by news media were indeed the cause for the agenda the voters in Chapel
Hill had chosen.
One such experiment took place in a controlled laboratory experiment, rather than
at the same time a public campaign was underway. Iyengar, Peters, and Kinder (1982)
took television newscasts and edited the content to further emphasis coverage of U. S.
defense policy in the coverage. They brought in subjects, surveyed them about their base
political issue saliencies, and then showed them newscasts for four days. A control group
was surveyed and saw regular newscasts without the changes to emphasize defense. After
exposure to their respective newscasts, the group that saw the defense-heavy newscasts
ranked defense much higher as an important issue, while the group that did not see the
altered newscasts did not (Iyengar, Peters, and Kinder 1982, p. 852). Other issues covered
normally in the newscasts showed no significant issue salience change.
Later, Iyengar and Kinder (1987) used a controlled experimental setting again to
test agenda setting for a very limited set of policy positions. Three groups were shown
news programs focusing on either national defense, pollution, or inflation. When tested
after seeing the news programs over just a four-day period, each group expressed the
most concern and interest in the topic which they had been shown.
While experimental studies were proving the strength of the agenda setting power
of media at the laboratory level, other studies were comparing that strength across other
77
levels of analysis. Palmgreen and Clarke (1977) measured the ability of media to set the
agenda on local issues, as compared to the national issue McCombs and Shaw had
studied. They hypothesized that local issues would be less subject to salience
manipulation because of “the greater ability of individuals personally to observe local
political problems, the nature and strength of local interpersonal political communication
networks, and the relatively heavier media coverage of national political issues.”
(Palmgreen and Clarke 1977, p. 438). The authors examined newspaper and television
content in Toledo, Ohio, cataloging both local and national political issues. They then
surveyed voting age residents to gauge their salient issue positions. The results showed
correlations at both levels, indicating agenda setting taking place at both levels, but the
correlation levels for national issues (.82) was far higher than for local issues (.53)
(Palmgreen and Clarke 1977, p. 445). Findings also showed stronger agenda setting
power on local issues by newspaper coverage, but stronger power to set the national
agenda with television network newscasts. At another level of dichotomy, the degree to
which an issue is “abstract” to audience members has some bearing on the degree to
which media coverage of the issue affects salience among voters. Yagade and Dozier
(1990) suggest those issues that are abstract and therefore hard for members of the public
to visualize do not carry the same agenda setting power when covered by media.
Evidence exists to show that agenda setting occurs for the personal characteristics
of candidates involved in a political race, and not just the issues. Kiousis, Bantimaroudis,
and Ban found effects on subject evaluation of the character of fictional politicians when
media focused on those characteristics. But the research stopped short of showing any
change in the overall salience of a candidate based on that sort of coverage. But research
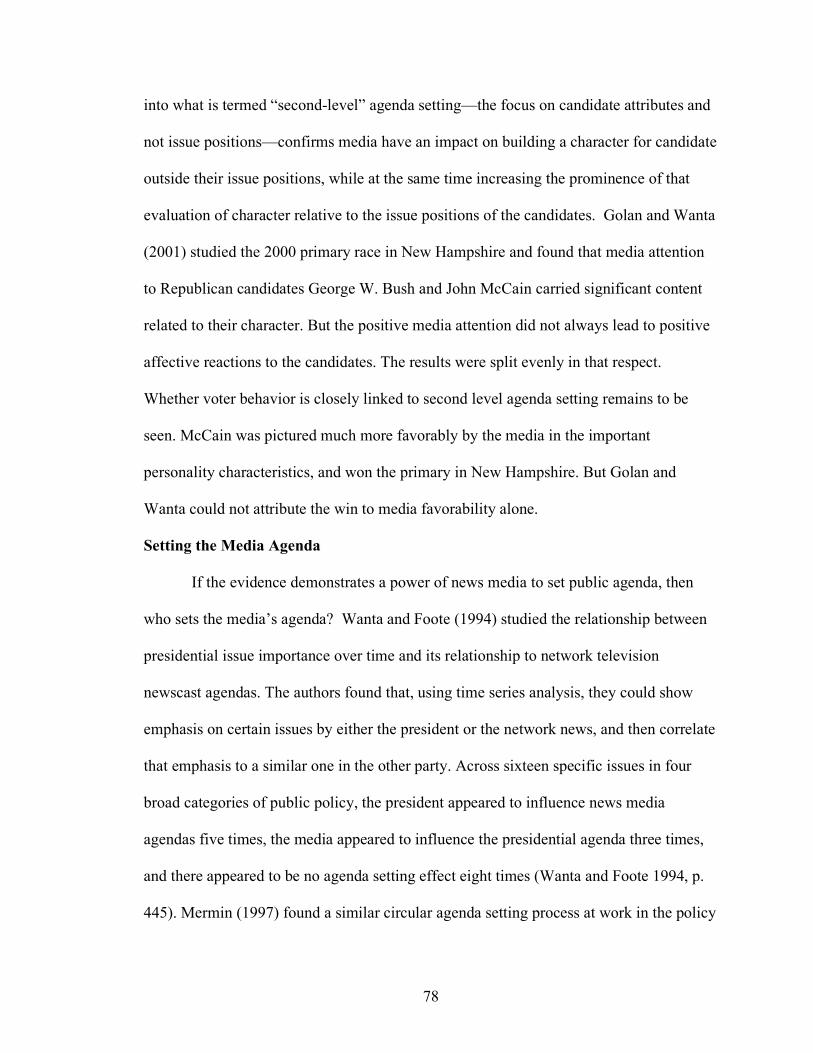
78
into what is termed “second-level” agenda setting—the focus on candidate attributes and
not issue positions—confirms media have an impact on building a character for candidate
outside their issue positions, while at the same time increasing the prominence of that
evaluation of character relative to the issue positions of the candidates. Golan and Wanta
(2001) studied the 2000 primary race in New Hampshire and found that media attention
to Republican candidates George W. Bush and John McCain carried significant content
related to their character. But the positive media attention did not always lead to positive
affective reactions to the candidates. The results were split evenly in that respect.
Whether voter behavior is closely linked to second level agenda setting remains to be
seen. McCain was pictured much more favorably by the media in the important
personality characteristics, and won the primary in New Hampshire. But Golan and
Wanta could not attribute the win to media favorability alone.
Setting the Media Agenda
If the evidence demonstrates a power of news media to set public agenda, then
who sets the media’s agenda? Wanta and Foote (1994) studied the relationship between
presidential issue importance over time and its relationship to network television
newscast agendas. The authors found that, using time series analysis, they could show
emphasis on certain issues by either the president or the network news, and then correlate
that emphasis to a similar one in the other party. Across sixteen specific issues in four
broad categories of public policy, the president appeared to influence news media
agendas five times, the media appeared to influence the presidential agenda three times,
and there appeared to be no agenda setting effect eight times (Wanta and Foote 1994, p.
445). Mermin (1997) found a similar circular agenda setting process at work in the policy
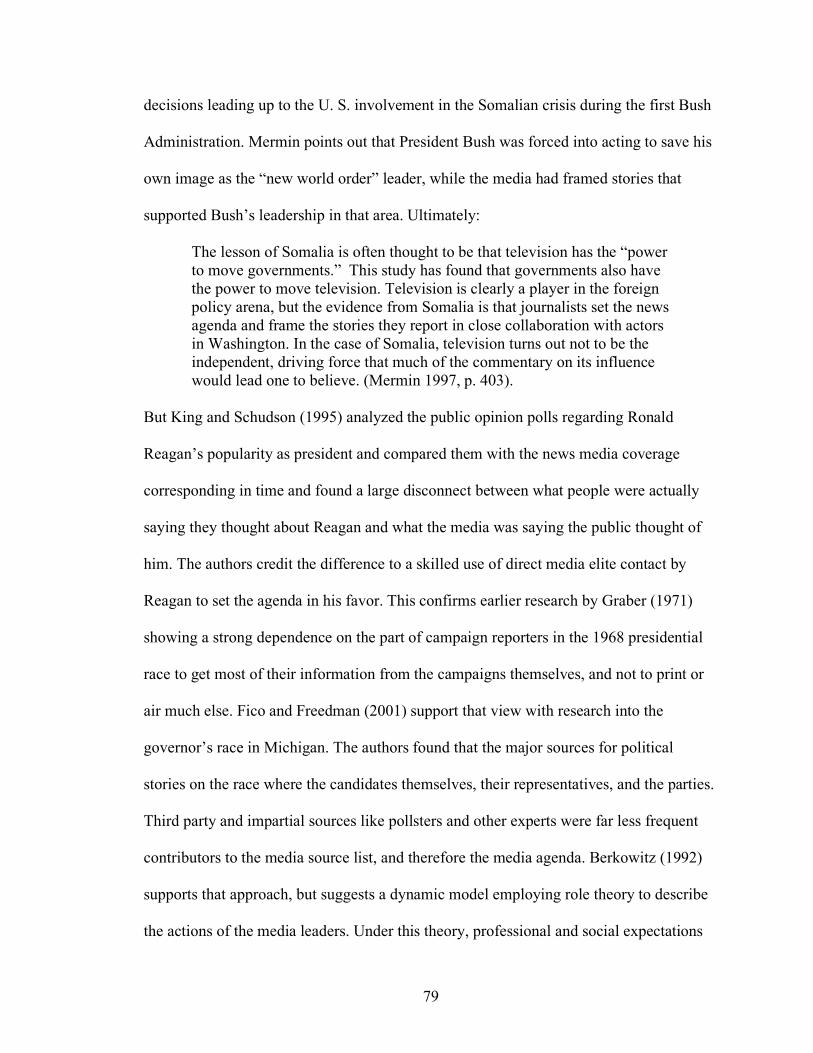
79
decisions leading up to the U. S. involvement in the Somalian crisis during the first Bush
Administration. Mermin points out that President Bush was forced into acting to save his
own image as the “new world order” leader, while the media had framed stories that
supported Bush’s leadership in that area. Ultimately:
The lesson of Somalia is often thought to be that television has the “power to move governments.” This study has found that governments also have the power to move television. Television is clearly a player in the foreign policy arena, but the evidence from Somalia is that journalists set the news agenda and frame the stories they report in close collaboration with actors in Washington. In the case of Somalia, television turns out not to be the independent, driving force that much of the commentary on its influence would lead one to believe. (Mermin 1997, p. 403).
But King and Schudson (1995) analyzed the public opinion polls regarding Ronald
Reagan’s popularity as president and compared them with the news media coverage
corresponding in time and found a large disconnect between what people were actually
saying they thought about Reagan and what the media was saying the public thought of
him. The authors credit the difference to a skilled use of direct media elite contact by
Reagan to set the agenda in his favor. This confirms earlier research by Graber (1971)
showing a strong dependence on the part of campaign reporters in the 1968 presidential
race to get most of their information from the campaigns themselves, and not to print or
air much else. Fico and Freedman (2001) support that view with research into the
governor’s race in Michigan. The authors found that the major sources for political
stories on the race where the candidates themselves, their representatives, and the parties.
Third party and impartial sources like pollsters and other experts were far less frequent
contributors to the media source list, and therefore the media agenda. Berkowitz (1992)
supports that approach, but suggests a dynamic model employing role theory to describe
the actions of the media leaders. Under this theory, professional and social expectations
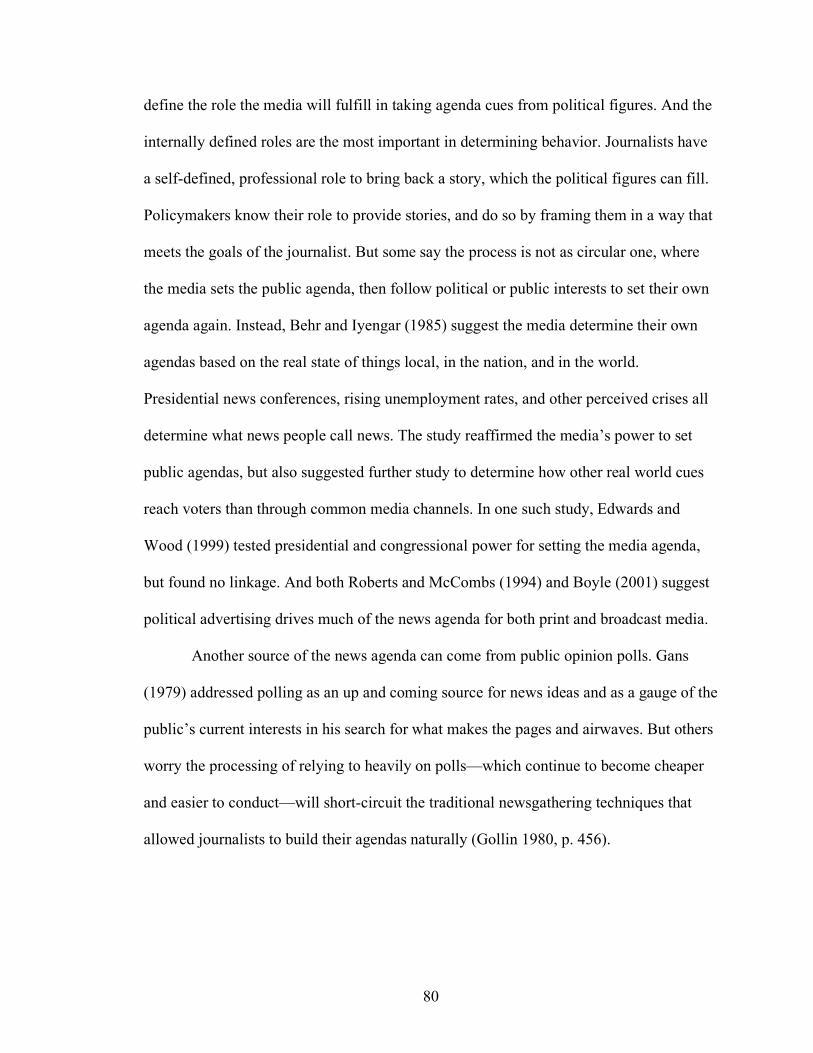
80
define the role the media will fulfill in taking agenda cues from political figures. And the
internally defined roles are the most important in determining behavior. Journalists have
a self-defined, professional role to bring back a story, which the political figures can fill.
Policymakers know their role to provide stories, and do so by framing them in a way that
meets the goals of the journalist. But some say the process is not as circular one, where
the media sets the public agenda, then follow political or public interests to set their own
agenda again. Instead, Behr and Iyengar (1985) suggest the media determine their own
agendas based on the real state of things local, in the nation, and in the world.
Presidential news conferences, rising unemployment rates, and other perceived crises all
determine what news people call news. The study reaffirmed the media’s power to set
public agendas, but also suggested further study to determine how other real world cues
reach voters than through common media channels. In one such study, Edwards and
Wood (1999) tested presidential and congressional power for setting the media agenda,
but found no linkage. And both Roberts and McCombs (1994) and Boyle (2001) suggest
political advertising drives much of the news agenda for both print and broadcast media.
Another source of the news agenda can come from public opinion polls. Gans
(1979) addressed polling as an up and coming source for news ideas and as a gauge of the
public’s current interests in his search for what makes the pages and airwaves. But others
worry the processing of relying to heavily on polls—which continue to become cheaper
and easier to conduct—will short-circuit the traditional newsgathering techniques that
allowed journalists to build their agendas naturally (Gollin 1980, p. 456).
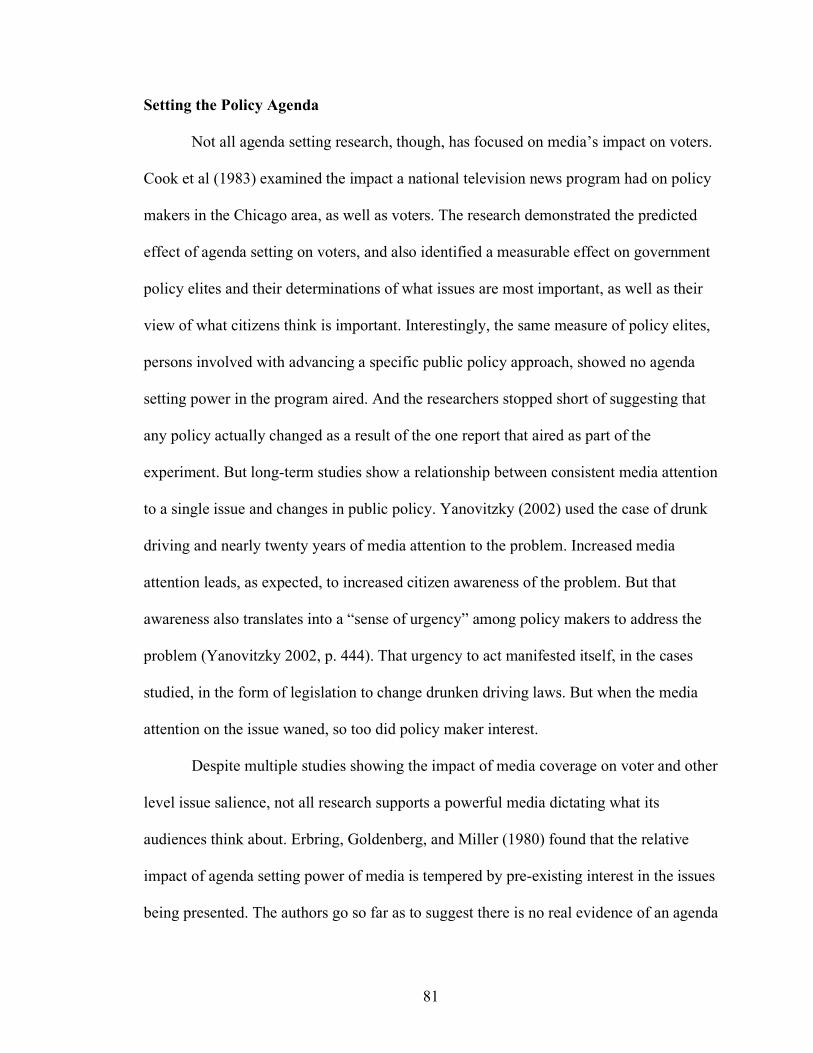
81
Setting the Policy Agenda
Not all agenda setting research, though, has focused on media’s impact on voters.
Cook et al (1983) examined the impact a national television news program had on policy
makers in the Chicago area, as well as voters. The research demonstrated the predicted
effect of agenda setting on voters, and also identified a measurable effect on government
policy elites and their determinations of what issues are most important, as well as their
view of what citizens think is important. Interestingly, the same measure of policy elites,
persons involved with advancing a specific public policy approach, showed no agenda
setting power in the program aired. And the researchers stopped short of suggesting that
any policy actually changed as a result of the one report that aired as part of the
experiment. But long-term studies show a relationship between consistent media attention
to a single issue and changes in public policy. Yanovitzky (2002) used the case of drunk
driving and nearly twenty years of media attention to the problem. Increased media
attention leads, as expected, to increased citizen awareness of the problem. But that
awareness also translates into a “sense of urgency” among policy makers to address the
problem (Yanovitzky 2002, p. 444). That urgency to act manifested itself, in the cases
studied, in the form of legislation to change drunken driving laws. But when the media
attention on the issue waned, so too did policy maker interest.
Despite multiple studies showing the impact of media coverage on voter and other
level issue salience, not all research supports a powerful media dictating what its
audiences think about. Erbring, Goldenberg, and Miller (1980) found that the relative
impact of agenda setting power of media is tempered by pre-existing interest in the issues
being presented. The authors go so far as to suggest there is no real evidence of an agenda
82
setting function of the media at the individual level. They report that interpersonal
communication is still a stronger source of issue salience than media effects for anyone
with a network through which to receive political information. Shaw (1977) and later
Wanta and Wu (1992), suggested that a combination of media attention and interpersonal
communications about major issues has the strongest impact on personal agenda setting,
and a higher frequency of those interpersonal contacts will have the largest effect on
salience. MacKuen (1984) asserts voters are affected by media agenda setting power in
varying ways, most dependent on the individual’s ability to process media information,
and at what speed (McKuen 1984, p. 387). Further still, the motivation of the subject to
expose himself to information has some bearing, as does the potential benefits seen for
taking part in the information gathering process. The research suggests it takes longer to
mold the issue salience of those with lower interest and involvement in politics, and that
the function of media agenda setting on those voters is quite limited, requiring candidates
or issue advocates who which to move the agenda with those voters to spend great deals
of time to do so (McKuen 1984, p. 388). And Zhu (1992) suggests limits on the agenda
setting power of media based on the individual’s ability to only carry so much
information on current issues at one time. Zhu considers it a zero-sum prospect where the
gain of one issue in salience must come at the loss of another.
Complicating the agenda setting and other research on the effects of mass media
is the “third-person effect.” Davison (1983) describes this effect as the belief an
individual has that persuasive media messages are likely to affect someone else, but not
the individual himself. Davison conducted four experiments to test his theory of a third-
person effect, asking subjects to evaluate the effect of media messages on themselves,
83
and then on others. In each case, the subjects stated they believed others would be more
affected by the media messages than would they. Davison went on to operationalize
third-person effect into another area of media studies important to this study—bias.
Davison suggests voter perceptions of media bias (which will be examined more
thoroughly in the next chapter) may be accounted for by audience members beliefs that
others will be more affected by information about the other “side” appearing in an
otherwise balanced story. They are sensitive that any information about their opponents
will have a strong effect on other voters. Lasorsa (1989) found the same effect amongst
viewers of the 1987 ABC-TV miniseries “Amerika,” where viewers worried this fictional
look at what the United States would be like under a Soviet occupation. Viewers at both
ends of the political spectrum worried the program would affect those opposite the, going
as far as suggesting it would cause problems between the United States and the Soviet
Union in real life. Tiedge et al (1991) conducted larger scale telephone surveys in
Milwaukee and St. Louis to test third-person effects. The authors found nearly ninety
percent of the respondents reported some level of third-person effects. Looking at the
implications of such a high number, Tiedge and his colleagues worry that this strong
perception of media effects could lead to an erosion of First Amendment freedoms due to
worry about the manipulation of “other” voters. Testing the third-person hypothesis
against actual media reports of a predicted earthquake in southeast Missouri in 1990,
Atwood (1994) found that those who did not believe the earthquake prediction prior to
the predicted date of occurrence exhibited higher third-person effect, stating others
probably believed it would happen, while those who believed the prediction would come
true showed first-person effect, often stating others probably didn’t believe. Across all

84
subjects, media credibility was low leading up to the prediction, causing more third-
person effect with those who thought those medial reports were sensational and
exaggerated. Neuwirth and Frederick (2002) introduced the concept of second-person
effects to describe the view audience members have that media reports will affect them
and others in the audience in a shared perspective. The authors claim this part of the
equation has been overlooked, and should be part of the overall effects equation.
Finding Bias in the Media Agenda
First-person, third-person, or somewhere in between, agenda setting research
continues in an attempt to determine just how far the effect of mass media goes in
shaping the beliefs and behaviors of the electorate. Returning to the roots of his first
study, Donald Shaw, along with Shannon Martin (1992) asked whether that agenda
setting function might be responsible for realigning classical groupings of voters by
interest, pushing them toward a new direction in their search for policy change. The see
media as “social magnets” that are erasing the historical predictors of policy position of
gender, race, age, level of education, and socioeconomic status (Shaw and Martin 1992,
p. 912). Television drives the new engine of interest group formation, with frequent
television viewing being a very strong indicator of issue salience change. The change is
dramatic, as the authors predict, “We may in the future use issues to define groups”
(Shaw and Martin 1992, p. 919). Shaw’s partner in the original study also contributed to
this view of news media agenda setting power as a force for reshaping communities.
McCombs (1997) developed a continuum of behavior patterns that journalists exhibit in
the role of building community interest toward a common goal. At one end, where the
journalist is quite passive, lies “professional detachment.” For these journalists, agenda
85
setting is a happenstance of their craft, not a goal to which they give effort. Further along
the continuum, journalists who favor “targeted involvement” occasionally work to bring
about some change in a specific area of public policy. McCombs cites investigative
journalists as a good example. Further along still is the behavior of “boosterism,” where
journalists work actively to advance a community as a whole, discarding traditional
notions of impartiality. Finally, at the far end of the spectrum from professional
detachment is “proactive agenda setting.” This is most commonly exhibited as what
many call “public journalism.” This behavior puts journalists at the forefront of
determining desirable policy and pushing it through to implementation. The increasing
involvement of journalists in deciding what is desirable policy and advocating change to
implement that policy goes beyond any definition of what impartial journalism should be.
Similarly, Weaver (1994) describes the agenda setting power of the “new”
media—which popular writers Alter (1992), Balz (1992), Harwood (1992), and Turque,
Fineman, and Bingham (1992) define as talk shows, MTV, toll-free telephone numbers,
computer bulletin boards, and town hall meetings—to bring voters back from a level of
alienation the political leaders and traditional news media have created over recent
elections. But some research describes a more traditional top-down relationship between
the “old” media and the new. Roberts, Wanta, and Dzwo (2002) showed that electronic
bulletin board traffic during the 1996 presidential campaign reflected the agenda set by
the mainstream, traditional media. Time series analysis demonstrated a short term (one or
two day) impact of traditional media on new media. Interestingly, the most traditional of
media had the largest effect in the study. The New York Times—itself a major agenda
setter for other media (Dearing and Rogers 1996, p. 33)—showed seven significant
86
correlations with content on electronic bulletin boards, while CNN (Cable News
Network) showed only three—and all in one policy area (Roberts, Wanta and Dzwo
2002, p. 463). In terms of traditional media and their own new media counterparts,
Althaus and Tewksbury (2002) showed there is a difference in the personal issue agendas
of readers of the traditional New York Times and its online version. The authors
associated the differences with the quantity of public affairs coverage in the printed and
online versions. If news consumers continue to desert the traditional media for the
convenience of new media, the future impact of media on personal agendas may need
reevaluation.
Regardless of the future of agenda setting research, the current literature on the
effects of the media has direct bearing on the this study. Wanta and Hu (1994) showed
that media credibility is closely tied to its ability to reach voters and set the agenda.
Voters who see the media a credible will come to rely more heavily on it for their
political and other information. Conversely, those who perceive a media outlet as biased
or partial to one side or another will steer clear of the outlet’s output and will not
experience any agenda setting effects from the content there. While one station or
newspaper that loses agenda setting power will have no measurable effect on the public
agenda as a whole, sweeping perceptions of bias and massive moves from traditional
media to new or alternative sources of information (i.e. Fox News Channel or
conservative talk radio) can create measurable shifts in public agenda away from the
traditional focus of the established media and into new areas with different ideological
slant.
87
Media as Framers of the Debate
Growing directly from the agenda setting literature is the theory of framing as
another measure of the direct effect of media on the orientation and actions of voters.
Though some like Scheufele (2000) argue that the framing approach should be viewed as
a separate line of research from agenda setting, most include framing as a refinement of
the agenda setting process, more focused on content than mere exposure (Gamson 1992).
Media frames are “a central organizing idea or story line that provides meaning to an
unfolding strip of events” (Gamson and Modigliani 1987, p. 143). These sorts of frames
guide journalists as they work to put their creative input into the stories they write, print,
and broadcast. But audience frames are different, serving as a guide for processing
information received (Entman 1993, p. 53). Research in media effects often place us
media frames as an independent variable measuring their impact on the dependent
variable of audience frames (Scheufele 2000, p. 307). Iyengar (1987) described media
frames at the network news level as series of episodic (associated with events) or
thematic (associated with more abstract issues) depictions. Some of these frames were
reflected in the audience frames of those who saw the television news programs. Price,
Tewksbury, and Powers (1997) found that audience members exposed to media frames
begin to adopt the central information of the media reports into their own audience
frames, to the exclusion of other information they had stored prior to the exposure.
Nelson, Clawson, and Oxley (1997) found the power of media framing strong enough to
make even a Ku Klux Klan demonstration palatable to television news viewers—so long
as it was framed in free speech language. The same authors assert that the framing
mechanism is one of bringing to the surface already held beliefs deep in the individual,
88
rather than changing those beliefs. The framing of a media messages changes the weight
of the belief in the classic equation for attitude (A = Σviwi), where A represents attitude
toward an object, v represents the value of belief about the object, and w represents the
weight the belief holds in the attitude structure (Nelson, Oxley, and Clawson 1997, pp.
225-6). Framing increases the weight of the belief, and that increased weight multiplies to
shift it higher in the individual’s attitude structure. Consequently, belief change is not
always present, though judgments related to the issue framed usually do show some
difference in importance (Nelson and Oxley 1999, p. 1059). Druckman and Nelson
(2003) tested framing power against prior issue knowledge. Their results supported the
view that those who already had knowledge of an issue were more likely to show effects
from media framing. Their study showed no persistent effect from the framing among
those first affected, but the effect does demonstrate some longevity in other studies.
Tewksbury, Jones, Peske, Raymond, and Vig (2000) tested the persistence of belief
weeks after exposure to a single newspaper article on a controversial subject. They found
that the comments of subjects still reflected a shift in the belief matrix three weeks later.
One example of media framing of issues and how audiences receive the effects of
that framing involves the public evaluation of benefits of policy changes for certain
groups. Nelson and Kinder (1996) defined frames as “constructions” of a particular issue
which help the audience decide what to think about it. Frames are a mechanism for elites,
both media and political (through the media) tell the average citizen what is important.
Candidates understand the importance of news media framing in reaching
individual audience frames, and they try to manipulate the media to align their own
frames to the candidates’ frames. Miller, Andsager, and Riechert (1998) examined the
89
news releases distributed by the Republican presidential candidates during the 1996
campaign. News releases are, of course, designed to obtain news coverage. And in each,
following the language of framing, the candidates hope to achieve a positive depiction of
themselves in the stories the news media tell. Media, as independent entities, develop
their frames separately from the candidates, but use, in part, information received through
news releases. The authors found that the candidates often framed themselves in very
similar ways, with issue orientations that were often hard to distinguish. But the media
separated the candidates in their own framing of the events, thwarting much of what the
candidates were trying to do with the news releases. But Entman (2003) introduces the
concept of cascading activation as applied to framing. He uses post-9/11 White House
framing attempts to measure the ability of a high level elite (like the President) to affect
media framing and public beliefs. Entman models a cascading network activation where
the White House frames its communication with other political elites, those elites frame
their communication with the media, the media create news frames based on the political
frames, and the audience adjusts its beliefs at the bottom of the cascade (Entman 2003, p.
419). The model describes an amplification effect through the additional level of political
elites, and that amplification affects the media. With the 9/11 context, the relative
agreement of both Republican and Democrat political elites sent strong framing cues to
the media. Those cues overwhelmed dissonant cues from fellow journalists suggesting a
Saudi connection be explored by the media. It was not.
Finally, credibility—a central topic of this project—plays an important factor in
framing as it does in agenda setting. Druckman (2001) tested the framing power of
various media sources. High credibility media, like the New York Times, had a stronger
90
framing effect with its audience than low credibility media like the National Enquirer.
The evidence showed a systematic approach of audience members to find a credible and
believable source with whom they can trust their framing responsibilities. If perceptions
of bias in the traditional media push the credibility of those outlets lower in the minds of
a sufficient percentage of news consumers, then those traditional media will sink to the
level of the tabloid press, leaving a void for new media to fill. As with the agenda setting
discussion, large-scale dissatisfaction with perceived liberal media bias can push the
audiences in a conservative direction, changing the framing analysis of the news.
Priming Audiences to Change Perceptions
Just as framing is closely related to agenda setting, so too, is priming. Priming is
the effect media have on their audiences causing them to remember and associate
thoughts with a certain candidate or other story object, and rank those thoughts in some
order. Clearly any bias in the news presentation toward one particular ideology can have
a major priming effect, moving the audience member in the same direction as the bias
was slanted.
First described by Iyengar and Kinder (1987), Berkowitz and Jo (1994) define
priming as occurring when:
People witness, read, or hear of an event via the mass media, ideas having a similar meaning are activated in them for a short time afterward, and…these thoughts in turn can activate other semantically related ideas and action tendencies (Berkowitz and Jo 1994, p. 45).
The effects of priming are often studied alongside agenda setting effects. The fine
difference is that agenda setting cues audience members on what issues to think about
and consider in their evaluation of candidates, but priming tells helps define how those
91
dimensions will be evaluated. Kim, Scheufele, and Shanahan (2002) demonstrated this
difference in the local issue setting. The group measured attitude change toward a park
development in the city of Ithaca, New York. They found not only a measure of agenda
setting in the populace that consumed mass media, but they also found priming had taken
place to help those audience members rank the importance of certain portions of the
policy proposal. In this way, the agenda setting had once again told people what to think
about, but the priming had told them what to think.
Evidence exists that candidates use priming to help voters evaluate them in the
way most favorable for their candidacy, even without the consent or knowledge of the
mass media facilitating the priming content. Jacobs and Shapiro (1994) looked over
private public opinion polls used by the Kennedy campaign in 1960 to determine what
issues and images would be most favorable to the Democrat’s White House run. As the
authors point out, using a priming strategy takes advantage of the electorate’s incomplete
and inefficient use of campaign information. The approach used by Kennedy as depicted
by Jacobs and Shapiro completes a feedback loop from the electorate to the candidate
through polling) to the media (through news releases and public statements) and back to
the people (through newscasts and newspaper publication).
Mendelsohn (1996) sees the priming effect as a destabilizing force in Canadian
elections because it emphasizes personal candidate attributes rather than traditional party
and issue importance. And media in both Canada and the United States assist by
depicting parties as unimportant in the electoral process. But Pan and Kosicki (1997)
warn that giving too much weight to the priming effect of media would be unwise. Their
study of priming effect on the George H. W. Bush campaign in 1991 and 1992 shows that
92
media priming is part of a much larger priming picture, where other sources of
information add more to the priming equation. And another examination of that same
campaign by Krosnick and Brannon (1993) credits news media priming of the role Bush
played in leading the war inflated his performance ratings while the war was on, but left
quickly at its end. And McGraw and Ling (2003) found priming on individual candidates
does have an impact on voter evaluations of the candidate, but that priming effect does
not occur in reference to groups, like feminists.
Priming analysis of media effects can be troubling to those who see bias in the
media. Because priming seems to cross the line over just telling audience members what
to think about, and enters into the arena of guiding those audience members into areas of
how to evaluate candidates and issues (in the political setting), biased presentations
appear to have the power to make major changes in the perceptions of candidates and
issues.
Learning from Media
Agenda setting, framing, and priming all rely on information traveling from the
transmitter—mass media—and into the receivers—audience members. Once there, does
it persist? Is learning taking place when people consume the mass media—particularly
television news? As this question was first examined, the amount of learning taking
place among television news viewers seemed to be very limited. Patterson and McClure
(1976) found television news to be next to worthless when if came to transmitting
candidate positions to the voters. The pair found political advertising to be far more
effective. Neuman (1976) found very limited unaided recall among network news
93
viewers, with many remember no stories at all and just a few remembering only one or
two from an entire broadcast. But he is quick to suggest that his study was limited and
more testing was necessary to involve real-world recall and use of televised news
information. And Clarke and Fredin (1978) found while newspaper readers gained a
preference for one U. S. Senate candidate over another based in part on media reports,
television viewers showed no such gains. The unanswered question of learning from
news turned back to another variation on the previously discussed two-step flow theory.
News diffusion research emerged from that theory as an attempt to better explain how
information reaches audiences and how it persists once there. Early studies showed many
variables other than the news presentation itself were important to the ability of the
audience members to learn. Gaziano (1983) cited educational level as the most important
factor in learning, along with viewing time and story structure. Greenberg and Parker
(1965) showed that viewers learn about high interest stories in an “S” curve pattern—first
few know about it, then many learn quickly what has happened, then diffusion reaches a
lower rate again. In this scenario, most learning takes place from television. But on non-
crisis news, Funkhouser and McCombs (1971) found learning growing slowly and then
leveling off over a longer period of time. And those who were more interested in the
news topics held onto information longer after learning about it. These early studies and
others pointed to seven factors of news diffusion that affect learning from television news
content:
1) amount of coverage 2) the frequency of story repetition 3) level of interest among viewers 4) education level 5) level in interaction with social groups 6) socioeconomic/group status
94
7) pre-existing knowledge on the subject (Davis and Robinson 1986a, p. 41)
Tichenor, Donahue, and Olien (1970) refined these factors into a “knowledge gap” model
of learning that works to explain why highly covered events remain unlearned by a large
percentage of news consumers. The model centers on the difference in socioeconomic
status among those consumers (as measured by education level) and states that those with
higher socioeconomic status will gain knowledge at a faster rate than those with lower
socioeconomic status, and that difference in rates will create a knowledge gap that will
continue to widen over time. The authors stress that the lower SES consumers will not be
uninformed, but that there will be a measurable difference between their level of learning
and those with higher SES. They attribute the different rates to differing communication
skills sets, differing levels of previously stored knowledge about the given subject,
differing amounts of social contact through which stimulus can flow, differences in
willingness to expose oneself to and retain information, and difference in news media
selection, where printed media favors higher learning than broadcast media. One final
note from the study suggests that the limited resources of the media force them on to
other stories before the lower SES consumers can “catch up” and close the knowledge
gap. But the desire to learn from news has also proven to be a factor in retention and
learning. Eveland (2001) tested whether someone with the goal to learn when watching
news would indeed learn more than those without the motivation. He asserts his cognitive
mediation model places the motivation to learn with the news consumer. The consumer
can engage the cognitive processes of news attention and elaborative processing to survey
the news for information. This need to survey will result in higher learning as a side
effect. Eveland (2002) modified his model to add an element of information processing as
95
a mediating process. This confirmed his notion that news attention and elaboration (or
processing) are the driving factors to knowledge gain, and not the surveillance function.
A significant study applying psychological theories to the ways in which news
consumers learn came through the application of schema theory. Graber (1988) defines a
schema as “a cognitive structure consisting of organized knowledge about situations and
individuals that has been abstracted from prior experiences.” (Graber 1988, p. 28).
Schemata contain a general reference of facts and relationships between commonly
encountered objects. They act to give people an expectation of what “normally” happens
in a given set of circumstances. And the schemata also carry pre-made value judgments
about the situations referenced. When a person encounters a situation that has a schematic
equivalent—or is close to one—his mind plays out the expectations, making adjustments
for the details of the particular situation. Graber claims schemata can be linked so that
thoughts travel from one to another is they are of related material. The important aspect
of schema theory is that the use of schemata allows people to work beyond their limited
cognitive capacities to deal with incoming information. That information can be political,
and the source of the flow can be the mass media. Applied to politics, schemata assist
voters to decide what candidate and policy information to process and store, organize
new candidate and policy information and fit it into existing schema, make educated
guesses to fill in any gaps of information about political ideas or actors, and solve
problems—including decisions to vote. Using a panel design that allowed her to work
with twenty-one subjects over the course of one year, Graber was able to find strong
support for an overall theory of schematic processing by her panelists, but at the same
time note remarkable differences in the personal schema of each individual.
96
Aside from the internal processes and characteristics of the news consumers, the
characteristics of the stories themselves can affect learning. In tests of both American and
British viewers, Davis and Robinson (1986b) discovered the placement of a story in a
newscast, as well as its length can change learning attributes. The lead story, as well as
longer stories, persists in viewer memory longer than the others in the newscast. Clearly
a bias in story placement (such as placing a story strongly associated with liberal issues
as the lead story) can be an example of a structural bias in television news having a
learning effect on the audience. If liberal biases place liberal stories higher in the
newscast on a consistent basis, then the audience will learn more about those stories with
the liberal slant than about neutral or conservative stories in the newscasts.
Subjective factors in the presentation of the news also proved to be correlated
with learning, such as visual excitement and elements of surprise. Perse (1990) found that
those motivated to watch local television news were receptive to learning from what they
saw there, while those less motivated were not. The style of the news presentation matters
to learning as well. “Tabloid” television news style has become more popular in recent
years. It is characterized by Grabe et all (2000) as the use of music, sound effects, slow
motion, flash frames as transitions between shots, and obtrusiveness of reporter’s voice
track. When tested against a more standard television news production format, viewers
remembered more and learned more about the individual stories they viewed. These
elements may stimulate the emotional centers of the brain, making recall more possible.
Lang, Newhagen and Reeves (1996) found that negative stories seemed to arouse the
same emotional reaction and were easier to recall. These findings are consistent with a
“dual coding” theory of media reception that suggests the audio portion and video portion
97
of television news content are processed separately in the brain. Newhagen and Reeves
(1992) were critical of previous research that always tested learning and memory from
television news only by the written/verbal content. Their examination of memory over
time measured for both visual and verbal information showed more learning and longer
retention of visual images over time, but at the expense of the verbal content of the
stories. And the lack of context with which television news viewers can evaluate
information is often cited as an impediment to learning. Graber (1990) describes
television news as a mass of sometimes unrelated content that can be difficult to sift
through and sort for proper evaluation and storage. Brians and Wattenberg (1996) agreed,
finding a weak association between television news content and learning, as compared to
political advertising and newspapers, but positing the possibility for more learning if
television’s structural deficiencies are remedied.
Other theories compete with learning theory as to the direct effects of television
on its audience. Cultivation theory, as described by George Gerbner and others, considers
the impact television viewing has on its audiences and predicts that those audience
members who watch more television content are more likely to share beliefs with the
predominant view of the television content they are viewing (Potter 1994, p. 1). But its
emphasis as been mostly on violence in entertainment television and not focused a great
deal on news.
McQuail (1985) argues for a more sociological approach, where the analysis of
media effects is framed not just in the attention of those sending the messages, but also in
the sociological context of how the messages are generated, transmitted, and received, as
well as the context in which the received messages are analyzed. There is as much power
98
in the receiver as in the sender, under this model. And the media channels themselves are
not neutral pipelines; rather, they are complex social constructions that carry their own
sets of norms, practices, and effects (McQuail 1985, p. 94). McQuail’s analysis may not
be part of the mainstream media learning literature, but his depiction of the media as
more than neutral conduits of information is insightful for examining the effects of bias
on learning. There seems to be ample evidence that the norms and practices of the media
can introduce biases into the news product. If, as indicated, there are learning effects that
emphasize one ideology over others, then the bias has a repetitive effect that can grow
over time.
Media Effects on Behavior
With all the research centered on how audiences receive and process the
information they receive from the mass media, what does it actually cause them to do?
Can political behavior be prompted or modified by exposure to mass mediated political
information? At the heart of this question lies the search for what causes citizens to take
part in democracy. While a thorough review of that literature is outside the scope of this
research, research into how media affect that participation have been numerous. Since
information is part of the equation the rational voter uses to make his electoral choices, it
would seem clear that media would play a role in promoting participation. But much of
the literature has suggested media—particularly television news—does just the opposite.
Michael Robinson (1976), at the height of the post-Watergate doldrums in American
politics, suggests a “videomalaise” existed that stemmed from television’s constant
99
portrayal of government officials as corrupt and dishonest. Robinson summed it up like
this:
The inadvertent viewer, through television, witnesses these images of the society, regarding them as essentially evil and indicative of sociopolitical decay. Unable or unwilling to reject the network reports, the inadvertent viewer may turn against the group most directly responsible for the conflict, against the social and political institutions involved, or against himself, feeling unable to deal with a political system “like this.” (Robinson 1976, p. 430)
The only alternative for this voter, said Robinson, was to remove himself from this
corrupt system and no longer participate. Later research separated the videomalaise
concept into two component parts: powerlessness and cynicism. Robinson’s view
predicts that increased television news exposure will lead to a feeling of more
powerlessness and more cynicism. Measuring those factors independently, Bowen,
Stamm, and Clark (2000) found that television news viewership did lead to more of a
feeling of powerlessness in test subjects, but not a higher level of cynicism. But the
television viewers were no less likely to participate than newspaper readers, raising
questions as to whether there is an overall media malaise, or that a feeling of
powerlessness does not contribute to nonparticipation. Other research by Miller (1974)
and Roper (1977) did find a relationship between increase television news viewing and a
decline in political participation and general efficacy. But Leshner and McKean (1997),
studying an off-year U. S. Senate race in Missouri, also found no increase in voter
cynicism associated with high media use. And the study further contradicted the
videomalaise hypothesis by showing television news as the “only mass communication
channel that significantly predicts higher political knowledge levels” (Leshner and
McKean 1997, p. 78). And Domke et al (1987) found a voter’s previous support for a
100
candidate and positive or negative media coverage—in print or on television—were the
two strongest factors in predicting vote preference.
A theory that could be seen as connecting the powerlessness of the videomalaise
concept with media-driven public opinion is the theory of the “spiral of silence.” Noelle-
Neumann (1984) showed societies tendency to shun deviance pushes those with differing
views into a fear of isolation if they reveal those views publicly. Those holding the
minority view will continuously check the mass media to see if the majority view is still
in power. If it is they will refuse to discuss their views with others, for fear of isolation.
The media, setting its agenda in part from what it is able to gather of public opinion,
hears less and less dissenting views, and reports more of the majority opinion. This
drives the minority opinion deeper into the spiral from which he can never return to the
majority, effectively eliminating his point of view from public discourse. An alternative
view of this effect incorporates the notion of bias into the effect. If media bias props up a
false view of the majority, while the real majority favors a different ideology, emerging
media sources can arise to take audience from the traditional media, rather than let those
un-served by the mainstream media fall into the spiral. Some would argue the increased
popularity of right-focused media could be explained by this alternative view of the spiral
of silence. The spiral empties not into ideological oblivion, but into a separate and
growing circle of the displeased. This view would support McLeod, Becker, and Burns
(1974) interpretation of the spiral, suggesting that voters pay attention to media reports to
act as reinforcements to their own thinking, particularly the views of elites.
One theory of participation can by examined in terms of the concept of “social
capital.” Putnam (1995) describes social capital as the building of connections in society
101
through which a network of partners can work to build a stronger civil society and
Thomas (1998) calls it a social infrastructure “which a society gradually accumulates
through the microlevel interactions of individuals” (Thomas 1998, p. 167). Media can act
as agents to contribute to stronger social capital, or to take away from it. Moy and
Scheufele (2000), examining the effects of media consumption on social trust, found that
news media use is not related to either a decline or increase in political trust.
In fact, media can provide one of the tools to move citizens to action. Lemert
(1981) described mobilizing information as a main source of motivation to act politically.
Lemert defines mobilizing information as a fact or facts that helps people to move to
action on information they already have in their possession. Lemert describes three types
of mobilizing information: locational, identificational, and tactical. Locational mobilizing
information gives audience members a time and a place for an action to take place. An
example might a media report that gives the place and time of an upcoming political
rally. Identificational mobilizing information describes a person or group so that they can
act in reaction to that group. And tactical mobilizing information provides examples of
behaviors that might be followed, such as a labor strike. While mobilizing messages exist
in news reports all the time, they are not necessarily designed to start some form of
participation. Lemert calls those specific messages, usually made up of one or more
pieces of mobilizing information, mobilizing messages. Journalists may not want to issue
these messages, seeing them as partisan or a useless detail. But at times, journalists
consent to give these urges to political participation when the cause is either seen as large
enough, or neutral enough to rise to the level of newsworthiness. On these occasions the
journalists become “crusaders” of sort with the mission to change public policy for the
102
betterment of society. As with the concept of civic journalism, the media then move out
of their role as impartial messengers of information to become an important part of the
policy machine. As such, bias is a given. And if the side the media chooses to champion
is not the side of all audience members, then perceptions of bias are sure to arise from
coverage of the policies at hand.
Leff, Protess, and Brooks (1986) found the investigative reporter technique has a
great deal of impact on changing the views of citizens regarding the depicted
wrongdoing, but had limited impact on policymakers. But not all mobilizing messages
are intentional. Page and Shapiro (1992) see the media as unwitting (or partially-witting)
accomplices to the policymakers’ plans to use deceit and misinformation to move public
opinion in support of planned policies. They state:
Our findings that media-reported statements and actions strongly affect Americans’ policy preferences, and that government officials can influence public opinion by controlling certain international events, raise important questions about democratic theory…The possibility that the public is systematically misled in its policy preferences also threatens the main thrust of our argument about the rationality of public opinion (Page and Shapiro 1992, p. 355).
The authors’ final point is that the American public does act rationally on the information
it receives from the mass media. But governmental motivations to support its own
policies leads to deceptions fed to journalists as news. So the effect the journalism has on
the citizenry is to get them to follow the wrong course, thereby supporting the
government position. Bishop (2005) supports the assertion of Page and Shapiro and gives
the example of the “Contract with America,” the pledge by campaigning Republicans
running for Congress in 1994 to make “common sense” changes in the America’s public
policy. Journalists were fed information in this case, not from public officials, but from
103
Republican pollster and strategist Frank Luntz that showed sixty percent support by
Americans for each of the ten policy positions found in the “contract.” Subsequent
scholarly reviews of independent public opinion research at the time of Luntz poll data
showed that support to be non-existent. But no journalists did the same research work the
scholars did, so only the Luntz information was reported.
Returning to the audience and why members would use a media with apparent
flaws in its information flow, the tradition of Blumler and Katz’s (1974) uses and
gratifications interpretation of how audience actively choose and use the media left many
wondering if there was a model with less free will on the part of audience members. Ball-
Rokeach and DeFleur (1976) developed a dependency theory model, showing the public
with much less free will in their media choices. The authors see the public growing
dependent on the mass media, relying on it to tell them when to change their opinions. As
that mass-mediated information continues to meet the public’s needs better and better,
they grow even more depended on it, giving the media even more influence. And as times
of crisis arrive, the reliance on the media for public opinion guidance becomes supreme.
While those authors speak of all media, Nimmo and Combs (1990) explain it is television
news on which the public has become increasingly dependent. As they say, “the logic of
television has become the logic of much of the mass media” (Nimmo and Combs 1990, p.
26). Just how that logic is formed and how it is carried out is determined by the makeup
of those who report, write, and edit televisions news—their knowledge, biases, and
beliefs.
In conclusion, the literature of media effects is filled with opportunities for the
personal biases of journalists or the structural biases of the institutions of journalism to
104
change the ways people think and act. While there is no magic bullet, the limited effects
of media can be strong enough to change the salience of issues, change the way voters
and citizens evaluate issues, and change the comprehension and retention of information
about policies and policy makers. A perfectly neutral media adds no effect to the
messages delivered to their audiences. But if bias exists in the media, it can enter the
messages. But what bias does exist among journalists and their institutions? An
examination of the evidence to answer that question is to follow.
105
Chapter 4: The Politics of Journalists
In his call for a new personality of journalism, Merrill (1996) calls for journalists
to be “romantic, poetic, Dionysian, mystical, intuitive, emotional, subjective, personal,
informal, directive, persuasive, humanistic, judgmental, and liberal” (Merrill 1996, p. 23).
This “existential” approach is a far cry from how most journalists would describe
themselves. Journalists consider themselves impartial, cold, unfeeling, and all business.
But what are their real, political characteristics? And how do those characteristics affect
the stories journalists write and publish. Many talk of a liberal bias in the American news
media, though journalists defend their work as merely the questioning of authority. That
question is central to this study.
All modern studies of the personal politics of journalists show their mean political
leanings to be to the left of the general public, their audiences. As a result of that
knowledge of the liberal ideological makeup of many journalists, further studies abound
showing the result of that orientation is a news product that also emphasizes the left over
the right. But journalists have blunted the sharpness of those arguments, using their
professional standards and practices as a shield. They argue that the profession of
journalism follows procedures that prevent the personal ideology of the journalist from
coloring the story. An important element of those procedures is the eschewing of any
symbols or signs that would belie ones personal prejudices or politics—such as the
political lapel symbols at the center of this research.
106
The Political Makeup of the American Journalist
Despite the fact that a handful of journalists, through the performance of their
duties on television or as high-profile print reporters, become celebrities in their own
rights, the American public consumes a tremendous volume of news without knowing
much about who produces it. Aside from the charges of talk radio hosts, very little is said
about the politics of journalists, or even why they do the jobs they do. But just who the
journalists who deliver our news each day are is a vital question. As Dennis (1996) states:
We do not worry much about a doctor’s politics or religion influencing the kind of care we get, and we assume that even lawyers with whom we disagree on most things are capable of defending our interests in court. At the same time, we care greatly about the health and sanitary habits of those who work in restaurants and sausage factories. For such reasons, we should care about journalists and their news-processing practices. (Dennis 1996, p. xi)
But how to go about learning as much about those who grind out news all day as we do
those who grind out sausage? One was is for those news grinders to tell us about
themselves. Yet surprisingly few authors have gone about a systemic taxonomy of the
working journalist in the United States. The first published work that relied on extensive
journalist surveys limited itself to the depression-era Washington press corps. Roston
(1937) asked the capitol reporters of the day to answer questionnaires about themselves
and the jobs they do and the thoughts they have about those jobs. Much of the survey
asked questions about education or demographic background, but some of the answers
defined a league of men somewhat cynical about the system in which they worked and
how much freedom existed aside from the freedom for publishers to make money.
Twenty-five years later, Rivers (1962) went back to the same group to see how their
makeup and views had changed. There were fewer men, more college degrees, but many
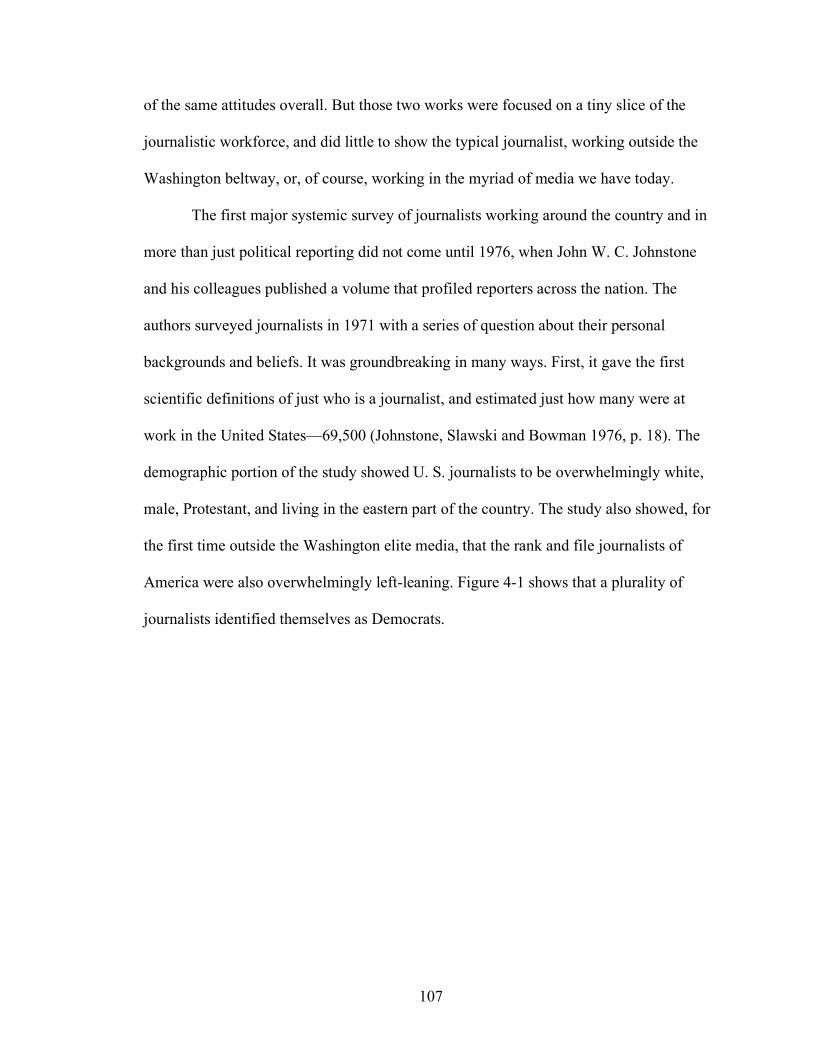
107
of the same attitudes overall. But those two works were focused on a tiny slice of the
journalistic workforce, and did little to show the typical journalist, working outside the
Washington beltway, or, of course, working in the myriad of media we have today.
The first major systemic survey of journalists working around the country and in
more than just political reporting did not come until 1976, when John W. C. Johnstone
and his colleagues published a volume that profiled reporters across the nation. The
authors surveyed journalists in 1971 with a series of question about their personal
backgrounds and beliefs. It was groundbreaking in many ways. First, it gave the first
scientific definitions of just who is a journalist, and estimated just how many were at
work in the United States—69,500 (Johnstone, Slawski and Bowman 1976, p. 18). The
demographic portion of the study showed U. S. journalists to be overwhelmingly white,
male, Protestant, and living in the eastern part of the country. The study also showed, for
the first time outside the Washington elite media, that the rank and file journalists of
America were also overwhelmingly left-leaning. Figure 4-1 shows that a plurality of
journalists identified themselves as Democrats.
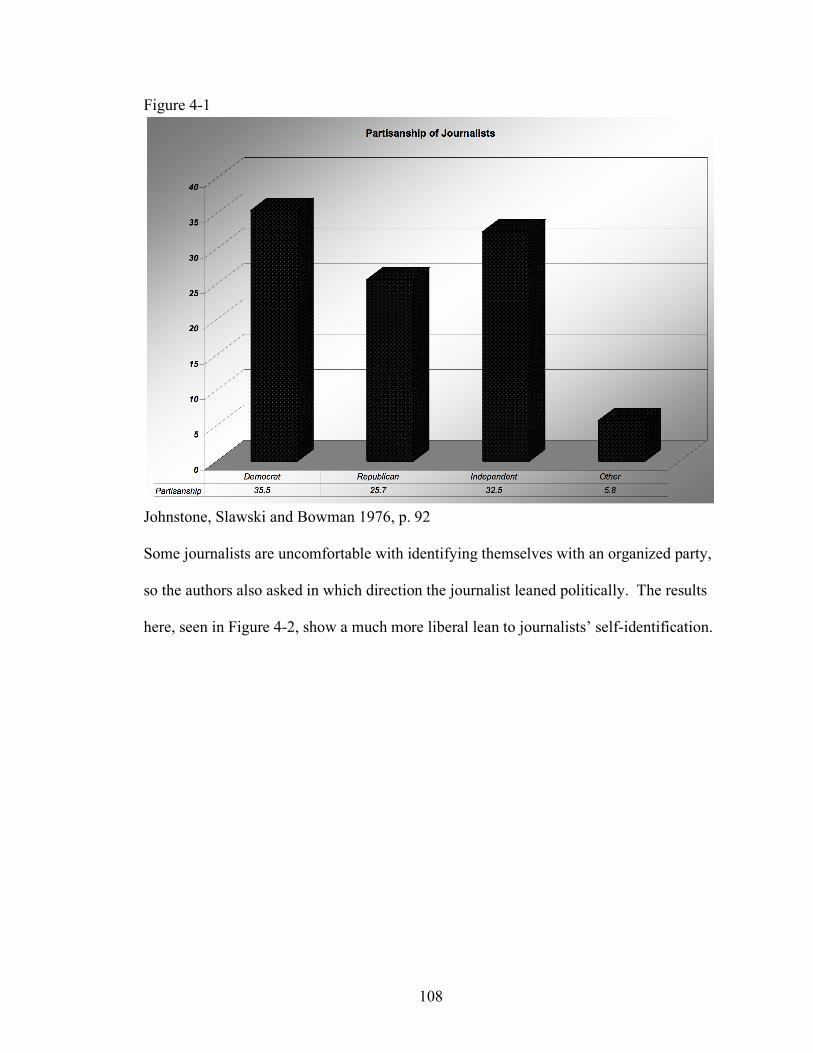
108
Figure 4-1
Johnstone, Slawski and Bowman 1976, p. 92 Some journalists are uncomfortable with identifying themselves with an organized party,
so the authors also asked in which direction the journalist leaned politically. The results
here, seen in Figure 4-2, show a much more liberal lean to journalists’ self-identification.
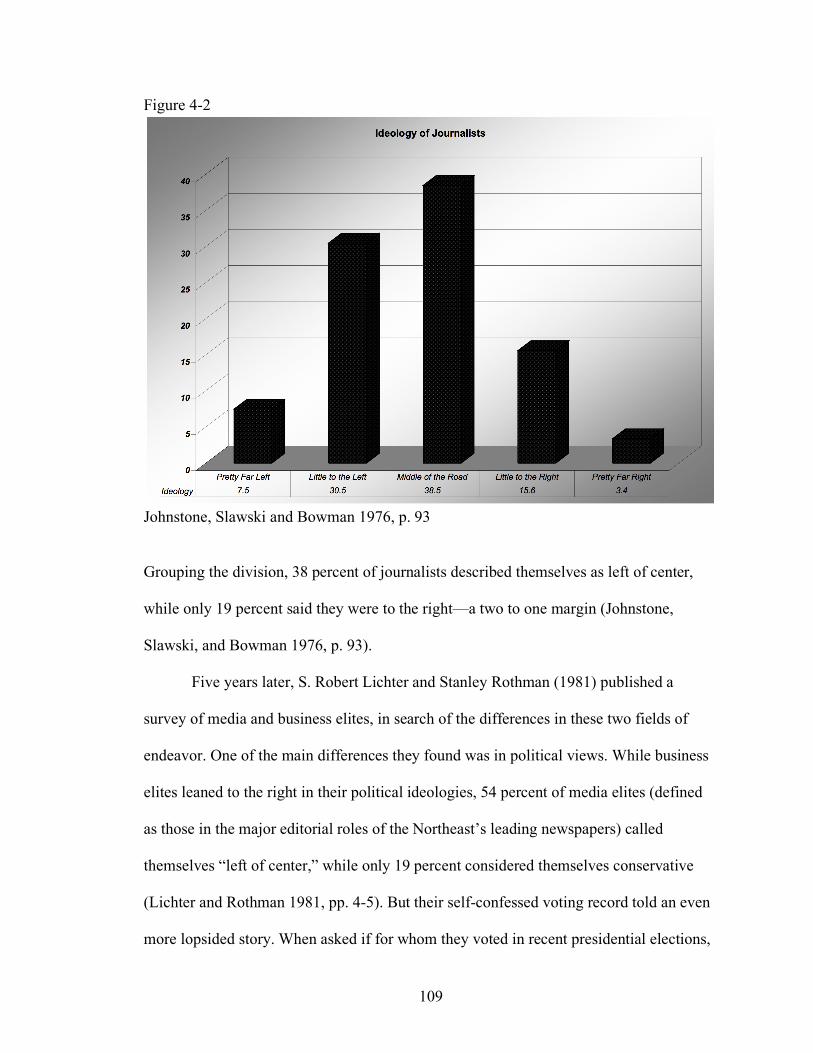
109
Figure 4-2
Johnstone, Slawski and Bowman 1976, p. 93
Grouping the division, 38 percent of journalists described themselves as left of center,
while only 19 percent said they were to the right—a two to one margin (Johnstone,
Slawski, and Bowman 1976, p. 93).
Five years later, S. Robert Lichter and Stanley Rothman (1981) published a
survey of media and business elites, in search of the differences in these two fields of
endeavor. One of the main differences they found was in political views. While business
elites leaned to the right in their political ideologies, 54 percent of media elites (defined
as those in the major editorial roles of the Northeast’s leading newspapers) called
themselves “left of center,” while only 19 percent considered themselves conservative
(Lichter and Rothman 1981, pp. 4-5). But their self-confessed voting record told an even
more lopsided story. When asked if for whom they voted in recent presidential elections,
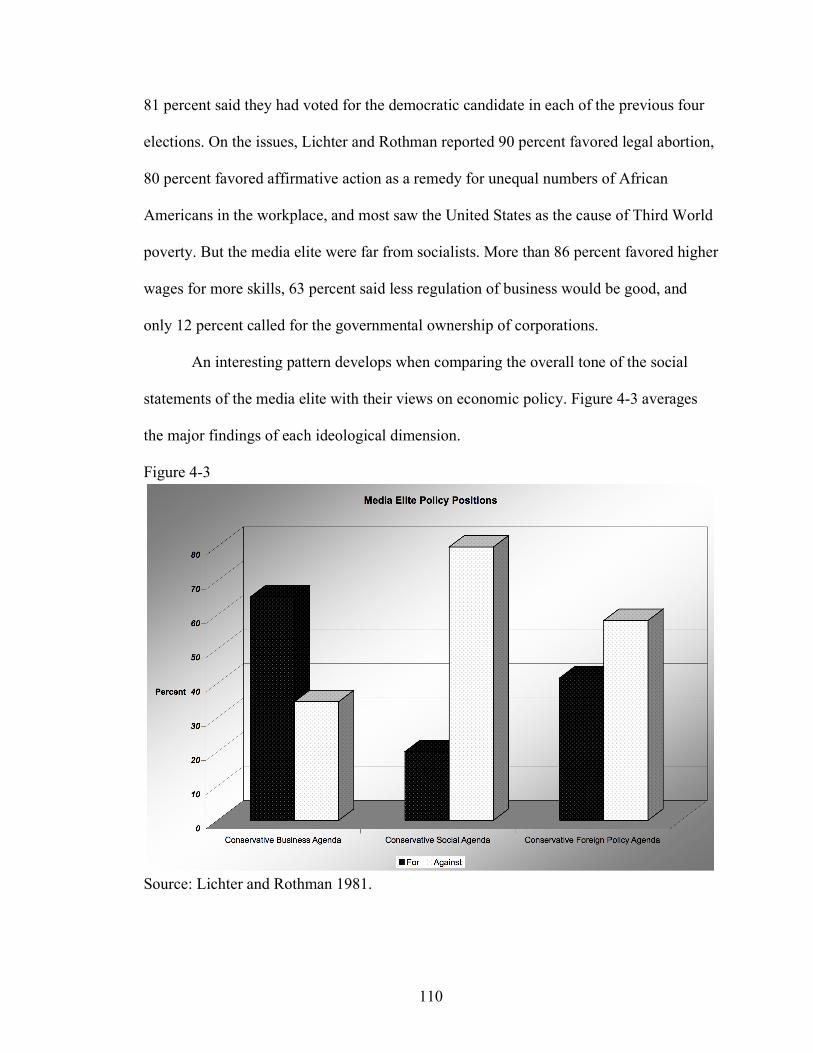
110
81 percent said they had voted for the democratic candidate in each of the previous four
elections. On the issues, Lichter and Rothman reported 90 percent favored legal abortion,
80 percent favored affirmative action as a remedy for unequal numbers of African
Americans in the workplace, and most saw the United States as the cause of Third World
poverty. But the media elite were far from socialists. More than 86 percent favored higher
wages for more skills, 63 percent said less regulation of business would be good, and
only 12 percent called for the governmental ownership of corporations.
An interesting pattern develops when comparing the overall tone of the social
statements of the media elite with their views on economic policy. Figure 4-3 averages
the major findings of each ideological dimension.
Figure 4-3
Source: Lichter and Rothman 1981.
111
The study ends with a new definition of the media elite as a new leadership group
with the power to affect policy.
Academic research was far from the only way to shed light on the political
makeup of the typical journalist as compared to his audience members. In 1985, the Los
Angeles Times polled 2,703 newspaper reporters and editors across the country, as well
three thousand members of the general public. The survey showed a wide split between
the journalists who produce the nation’s newspapers and their readers. Of eighteen
political dimensions measured in the survey, journalists were more liberal in their
positioning than the public on all but one. One of the most striking differences was on
how the journalists labeled themselves. Fifty-five percent called themselves liberal, while
only 23 percent of the public did the same. Journalists favored more regulation of
business more than twice as often as their readers. On the controversial issue of the time,
to divest American investments in South Africa to act as an economic sanction to end
apartheid, a majority of journalists favored the action while only half as many readers—a
definite minority—favored the same. And by a three to one margin, journalists disagreed
with allowing prayer in schools, while the general public was three in one in favor of it.
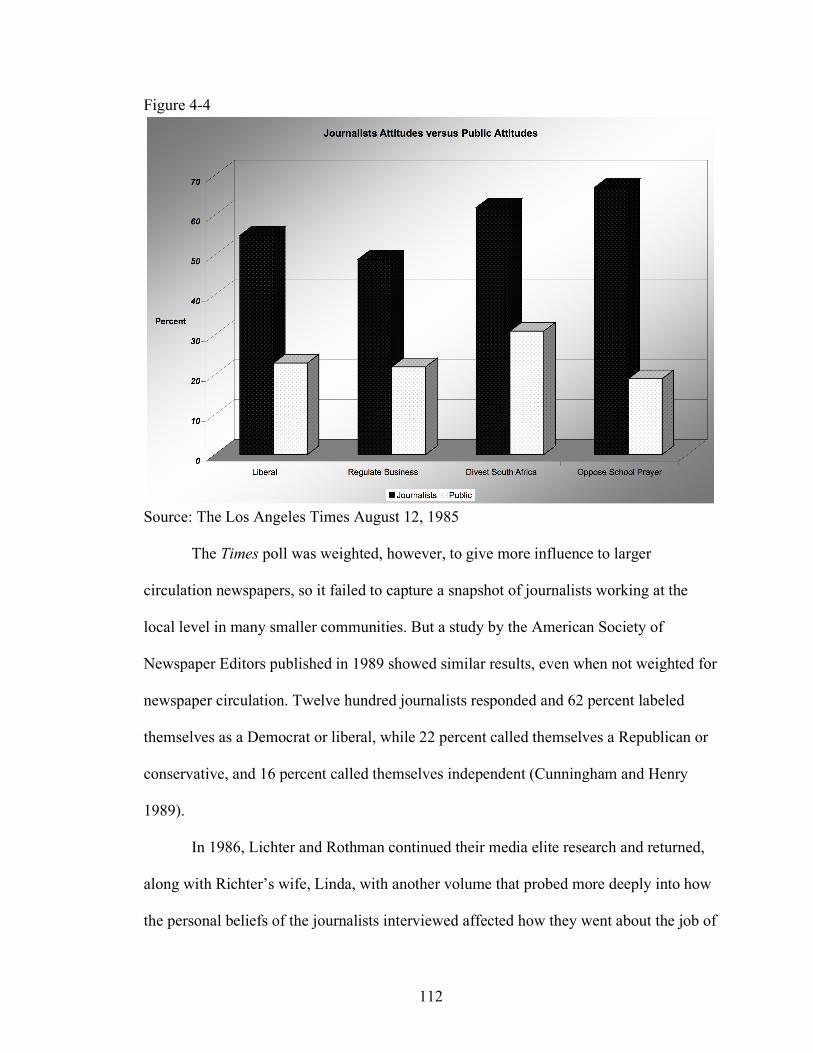
112
Figure 4-4
Source: The Los Angeles Times August 12, 1985
The Times poll was weighted, however, to give more influence to larger
circulation newspapers, so it failed to capture a snapshot of journalists working at the
local level in many smaller communities. But a study by the American Society of
Newspaper Editors published in 1989 showed similar results, even when not weighted for
newspaper circulation. Twelve hundred journalists responded and 62 percent labeled
themselves as a Democrat or liberal, while 22 percent called themselves a Republican or
conservative, and 16 percent called themselves independent (Cunningham and Henry
1989).
In 1986, Lichter and Rothman continued their media elite research and returned,
along with Richter’s wife, Linda, with another volume that probed more deeply into how
the personal beliefs of the journalists interviewed affected how they went about the job of
113
reporting the news. Lichter, Rothman, and Lichter (1986) once again relied on the
nation’s national media—based in the northeastern U. S. They did not survey local
journalists or those across the country. In 1979 and 1980, they conducted interviews with
238 journalists from The New York Times, the Washington Post, the Wall Street Journal,
Time, Newsweek, U. S. News and World Report, ABC, CBS, NBC, and PBS. Again, 54
percent called themselves politically liberal, while 17 percent called themselves
politically conservative, down two percent from the authors’ previous study. Their study
showed a media elite that voted overwhelmingly Democratic, and when turning to
nonpartisan sources, turned to liberal sources first on topics of welfare reform, consumer
protection, pollution and the environment, and nuclear energy. Journalists were often
twice and sometimes three times more likely to use a liberal source in one of these
controversial stories as they were a liberal one. And the reason they gave for going to the
liberals first and more often—they were more reliable sources (Lichter, Rothman, and
Lichter 1986, p. 57).
Also in 1986, and again in 1991 and 1996, David H. Weaver and G. Cleveland
Wilhoit replicated the Johnston study to determine how the demographic and ideological
makeup of the American journalism workforce had shifted. They defined a journalist as
anyone responsible for preparing, publishing, or transmitting news or other informational
stories. These included full-time reporters, writers, correspondents, columnists,
photojournalists, editors, and other news people, but did not include those involved with
the technical production of the news (Weaver and Wilhoit 1996, p. 248). The population
for the study consisted of all journalists working for English language, general
consumption news media in the United States. That population excludes those working
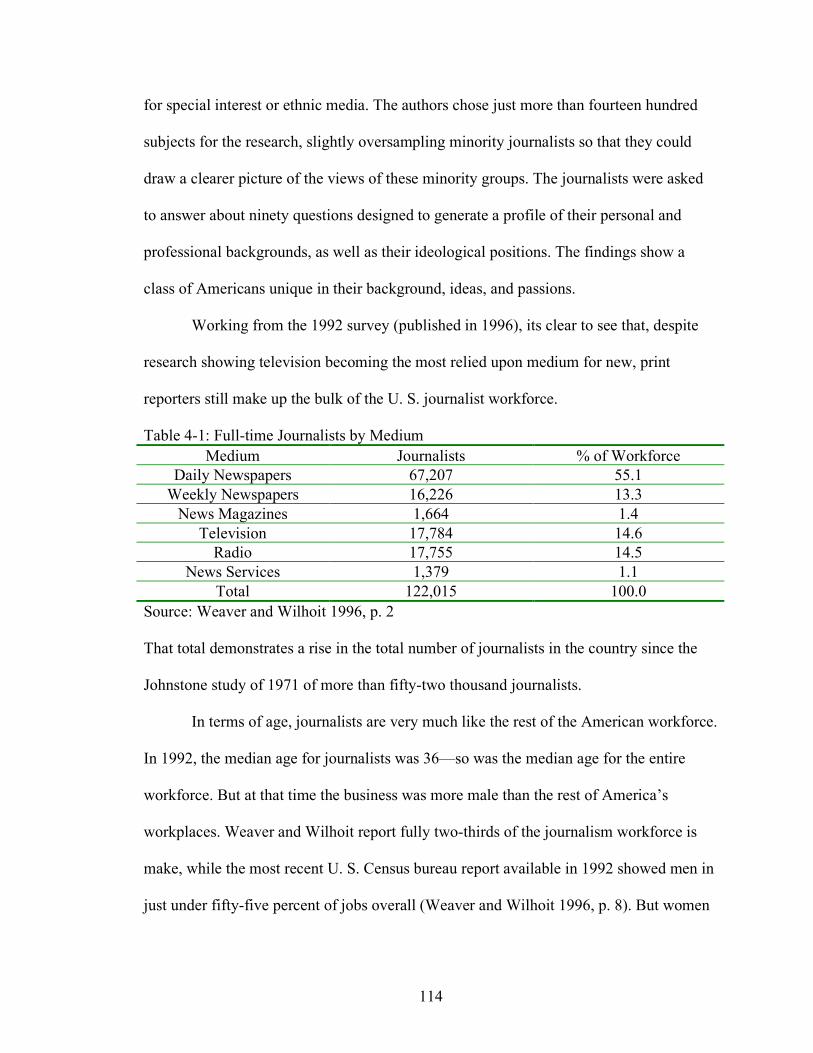
114
for special interest or ethnic media. The authors chose just more than fourteen hundred
subjects for the research, slightly oversampling minority journalists so that they could
draw a clearer picture of the views of these minority groups. The journalists were asked
to answer about ninety questions designed to generate a profile of their personal and
professional backgrounds, as well as their ideological positions. The findings show a
class of Americans unique in their background, ideas, and passions.
Working from the 1992 survey (published in 1996), its clear to see that, despite
research showing television becoming the most relied upon medium for new, print
reporters still make up the bulk of the U. S. journalist workforce.
Table 4-1: Full-time Journalists by Medium Medium Journalists % of Workforce
Daily Newspapers 67,207 55.1 Weekly Newspapers 16,226 13.3
News Magazines 1,664 1.4 Television 17,784 14.6
Radio 17,755 14.5 News Services 1,379 1.1
Total 122,015 100.0 Source: Weaver and Wilhoit 1996, p. 2 That total demonstrates a rise in the total number of journalists in the country since the
Johnstone study of 1971 of more than fifty-two thousand journalists.
In terms of age, journalists are very much like the rest of the American workforce.
In 1992, the median age for journalists was 36—so was the median age for the entire
workforce. But at that time the business was more male than the rest of America’s
workplaces. Weaver and Wilhoit report fully two-thirds of the journalism workforce is
make, while the most recent U. S. Census bureau report available in 1992 showed men in
just under fifty-five percent of jobs overall (Weaver and Wilhoit 1996, p. 8). But women
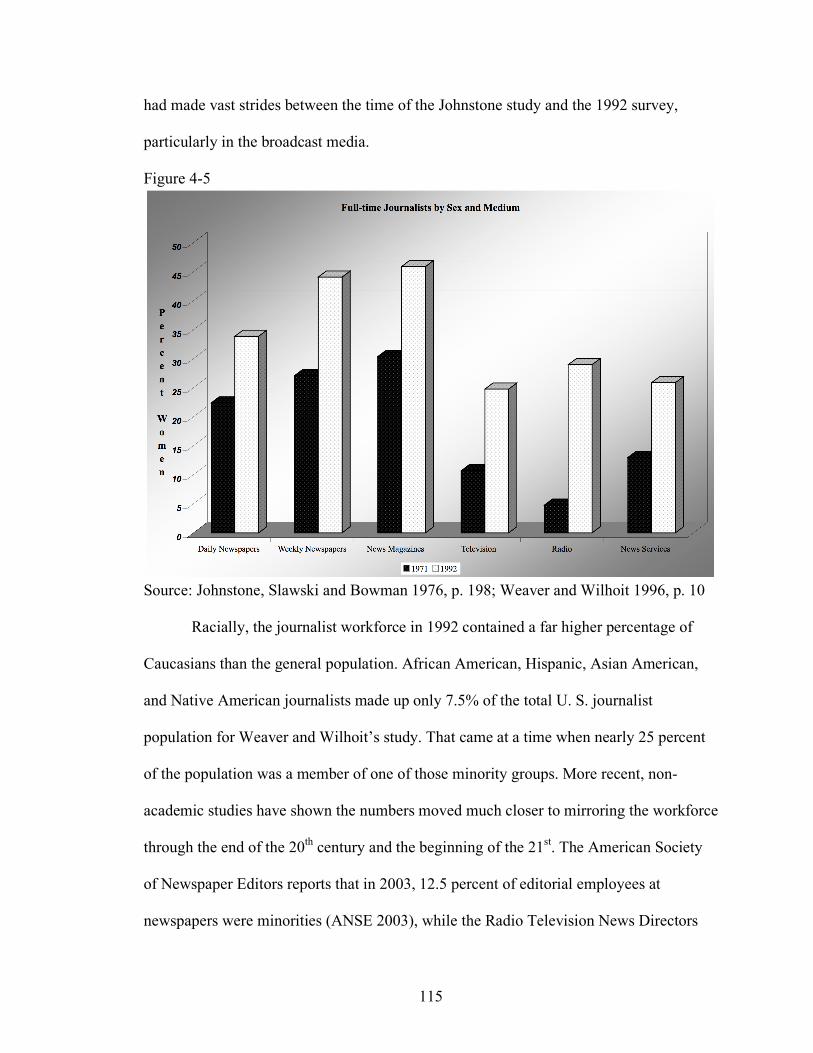
115
had made vast strides between the time of the Johnstone study and the 1992 survey,
particularly in the broadcast media.
Figure 4-5
Source: Johnstone, Slawski and Bowman 1976, p. 198; Weaver and Wilhoit 1996, p. 10
Racially, the journalist workforce in 1992 contained a far higher percentage of
Caucasians than the general population. African American, Hispanic, Asian American,
and Native American journalists made up only 7.5% of the total U. S. journalist
population for Weaver and Wilhoit’s study. That came at a time when nearly 25 percent
of the population was a member of one of those minority groups. More recent, non-
academic studies have shown the numbers moved much closer to mirroring the workforce
through the end of the 20th century and the beginning of the 21st. The American Society
of Newspaper Editors reports that in 2003, 12.5 percent of editorial employees at
newspapers were minorities (ANSE 2003), while the Radio Television News Directors
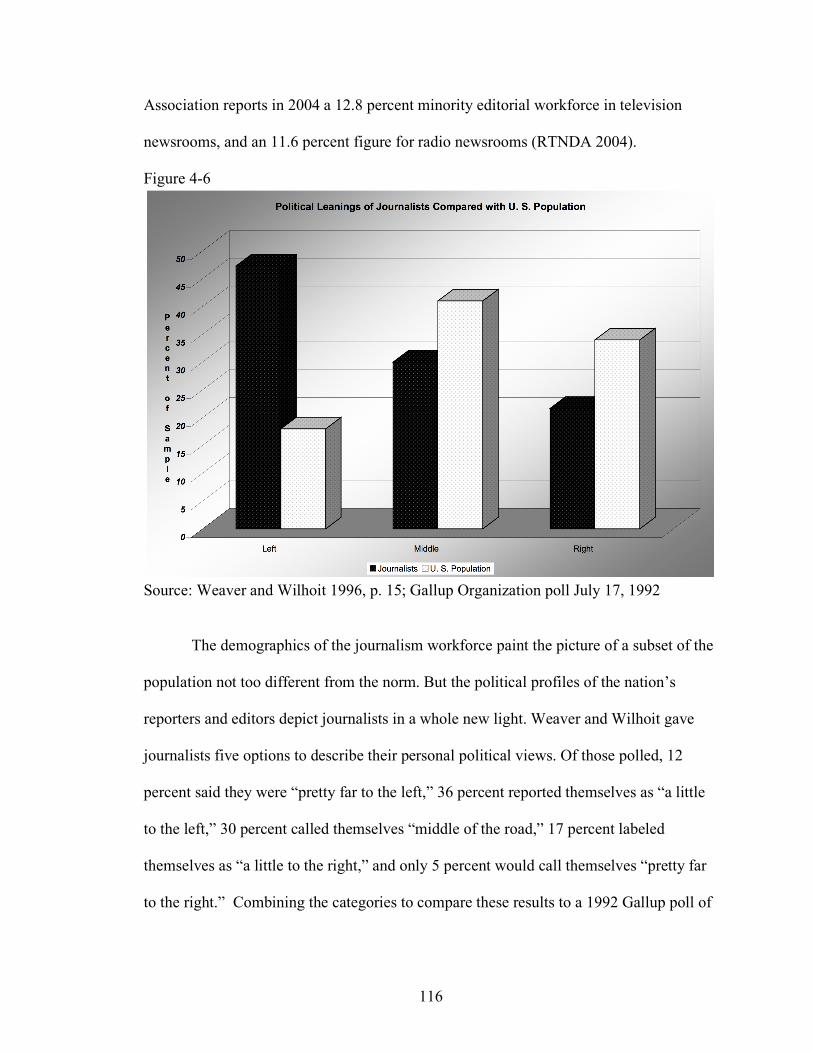
116
Association reports in 2004 a 12.8 percent minority editorial workforce in television
newsrooms, and an 11.6 percent figure for radio newsrooms (RTNDA 2004).
Figure 4-6
Source: Weaver and Wilhoit 1996, p. 15; Gallup Organization poll July 17, 1992
The demographics of the journalism workforce paint the picture of a subset of the
population not too different from the norm. But the political profiles of the nation’s
reporters and editors depict journalists in a whole new light. Weaver and Wilhoit gave
journalists five options to describe their personal political views. Of those polled, 12
percent said they were “pretty far to the left,” 36 percent reported themselves as “a little
to the left,” 30 percent called themselves “middle of the road,” 17 percent labeled
themselves as “a little to the right,” and only 5 percent would call themselves “pretty far
to the right.” Combining the categories to compare these results to a 1992 Gallup poll of
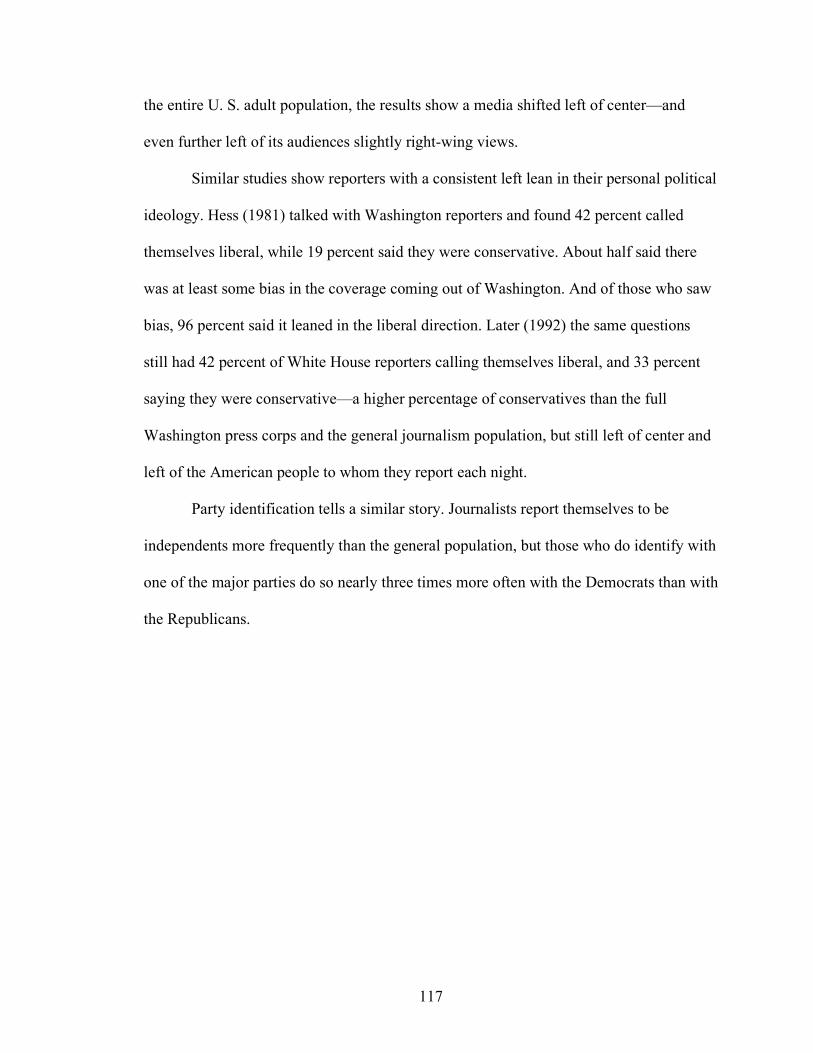
117
the entire U. S. adult population, the results show a media shifted left of center—and
even further left of its audiences slightly right-wing views.
Similar studies show reporters with a consistent left lean in their personal political
ideology. Hess (1981) talked with Washington reporters and found 42 percent called
themselves liberal, while 19 percent said they were conservative. About half said there
was at least some bias in the coverage coming out of Washington. And of those who saw
bias, 96 percent said it leaned in the liberal direction. Later (1992) the same questions
still had 42 percent of White House reporters calling themselves liberal, and 33 percent
saying they were conservative—a higher percentage of conservatives than the full
Washington press corps and the general journalism population, but still left of center and
left of the American people to whom they report each night.
Party identification tells a similar story. Journalists report themselves to be
independents more frequently than the general population, but those who do identify with
one of the major parties do so nearly three times more often with the Democrats than with
the Republicans.
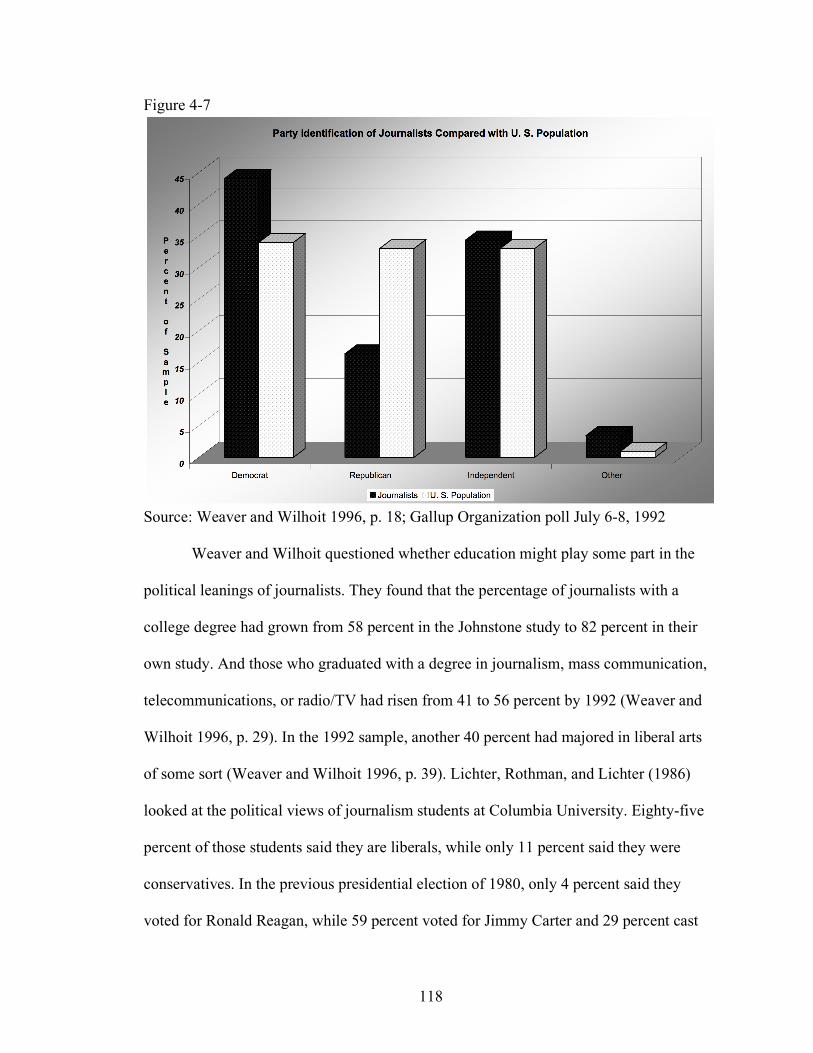
118
Figure 4-7
Source: Weaver and Wilhoit 1996, p. 18; Gallup Organization poll July 6-8, 1992
Weaver and Wilhoit questioned whether education might play some part in the
political leanings of journalists. They found that the percentage of journalists with a
college degree had grown from 58 percent in the Johnstone study to 82 percent in their
own study. And those who graduated with a degree in journalism, mass communication,
telecommunications, or radio/TV had risen from 41 to 56 percent by 1992 (Weaver and
Wilhoit 1996, p. 29). In the 1992 sample, another 40 percent had majored in liberal arts
of some sort (Weaver and Wilhoit 1996, p. 39). Lichter, Rothman, and Lichter (1986)
looked at the political views of journalism students at Columbia University. Eighty-five
percent of those students said they are liberals, while only 11 percent said they were
conservatives. In the previous presidential election of 1980, only 4 percent said they
voted for Ronald Reagan, while 59 percent voted for Jimmy Carter and 29 percent cast
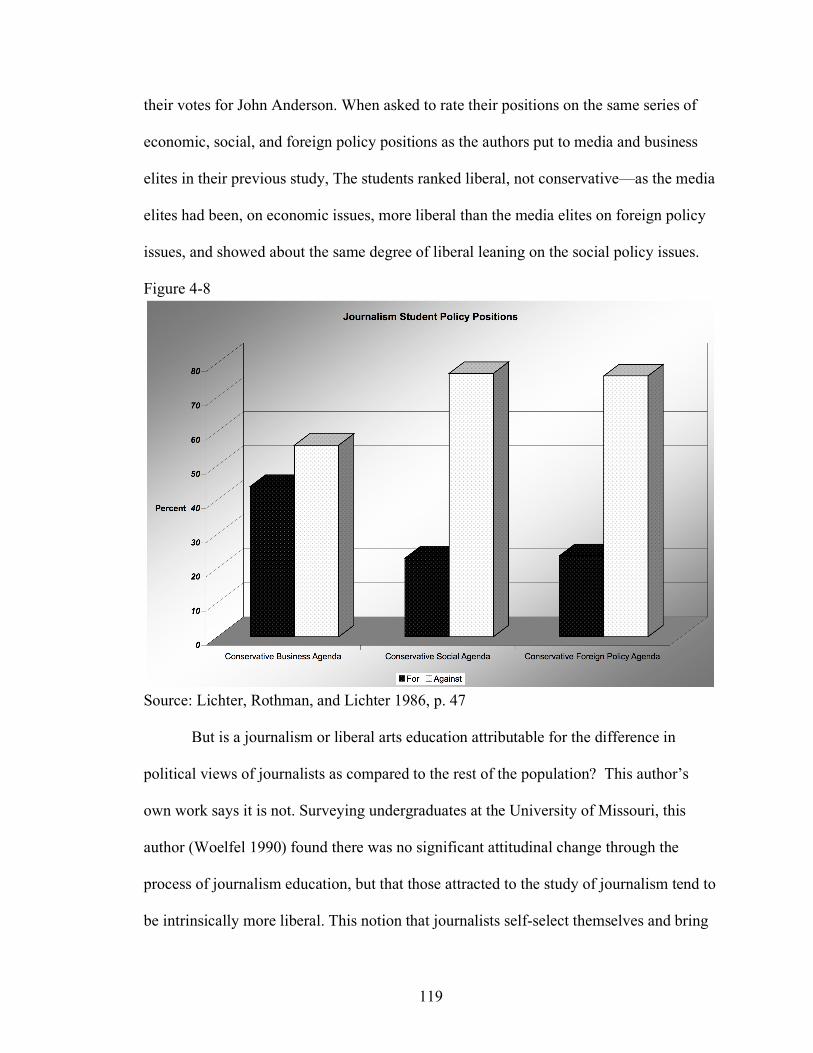
119
their votes for John Anderson. When asked to rate their positions on the same series of
economic, social, and foreign policy positions as the authors put to media and business
elites in their previous study, The students ranked liberal, not conservative—as the media
elites had been, on economic issues, more liberal than the media elites on foreign policy
issues, and showed about the same degree of liberal leaning on the social policy issues.
Figure 4-8
Source: Lichter, Rothman, and Lichter 1986, p. 47
But is a journalism or liberal arts education attributable for the difference in
political views of journalists as compared to the rest of the population? This author’s
own work says it is not. Surveying undergraduates at the University of Missouri, this
author (Woelfel 1990) found there was no significant attitudinal change through the
process of journalism education, but that those attracted to the study of journalism tend to
be intrinsically more liberal. This notion that journalists self-select themselves and bring
120
through that selection a certain set of innate characteristics has support in the literature.
Kimball and Lubell (1960) found that high school newspaper writers intending to go on
into the field of journalism were very motivated to join the profession as a way to be
useful in making society better (Kimball and Lubell, 1960, p. 413). Bartley (1972)
claimed that the typical person to pursue a career in journalism is “idealistic, interested
more in the larger society, and politically liberal … (and) is likely to come from among
those situated well toward the idealistic extreme” (Bartley 1972, p. 11).
Weaver and Wilhoit might also capture part of the reason for a perceived liberal
bias in their questions regarding the motivation for becoming a journalist. The most
frequent response was an “early love for writing,” but the third most frequent response
was a desire to “make a difference.” Journalists who answer the question like this
specifically tended to want to right wrongs with their work (Weaver and Wilhoit 1996, p
53). Often, one of the defenses of journalists against charges of a liberal bias is a
tendency to question authority, that some journalists feel runs counter to conservative
trust and confidence in authority. Consistent with this desire to question authority, many
journalists cited job dissatisfaction due to external political constraints on their reporting.
Those constraints came from many sources, but journalists frequently mentioned
government officials and record keepers as making it harder to publish the truth of what
goes on in government (Weaver and Wilhoit 1996, p. 69). Johnstone, Slawski, and
Bowman (1976) saw a similar theme in their research, done at the height of the Viet Nam
War era. Those authors saw two distinct “camps” among journalists with regard to what
they saw their role to be. The older, more established journalists perpetuated the role as a
detached, impartial, and objective observer to public affairs. But the younger journalists
121
saw themselves as advocates for a larger “truth.” That mood carried through Viet Nam
and into the Nixon/Watergate era. Both the Viet Nam War and Watergate became
symbols for a powerful, conservative establishment pitted against an idealistic, liberal
citizenry. And journalists of the day were often seen as part of the latter (Johnstone,
Slawski, and Bowman 1976, p. 102). This adversarial role reached the forefront, and
journalists professionally socialized in those and intervening years carry that mindset
with them to work. Surveyed in 1992, fully one-third of journalists say investigating
government claims is one of their primary goals (Weaver and Wilhoit 1996, p. 136). This
is a change from the World War II era when the majority of journalists saw themselves,
not as adversaries to government, but as neutral disseminators of information to the
people (Bates 1995, pp. 30-31).
But not all reporters consider the government and political parties their
adversaries. Some consider them their employer—at least before they became reporters.
Bozell and Baker (1990) list 178 reporters, editors, and producers who at one time
worked in political positions for Democratic administrations or in support of those
administrations, while only 57 had held a similar position with a Republican
administration. They find the pattern even more pronounced at the network news
executive level. The same authors showed that journalists for mainstream publications
who occasionally freelance articles for political publications do so fifteen times more
frequently for liberal publications than they do for conservative one (Bozell and Baker
1990, pp. 81-5).
Since Weaver and Wilhoit, studies have not shown any significant change in the
attitudes and beliefs of journalists. Rothman and Black (2001) revisited media and
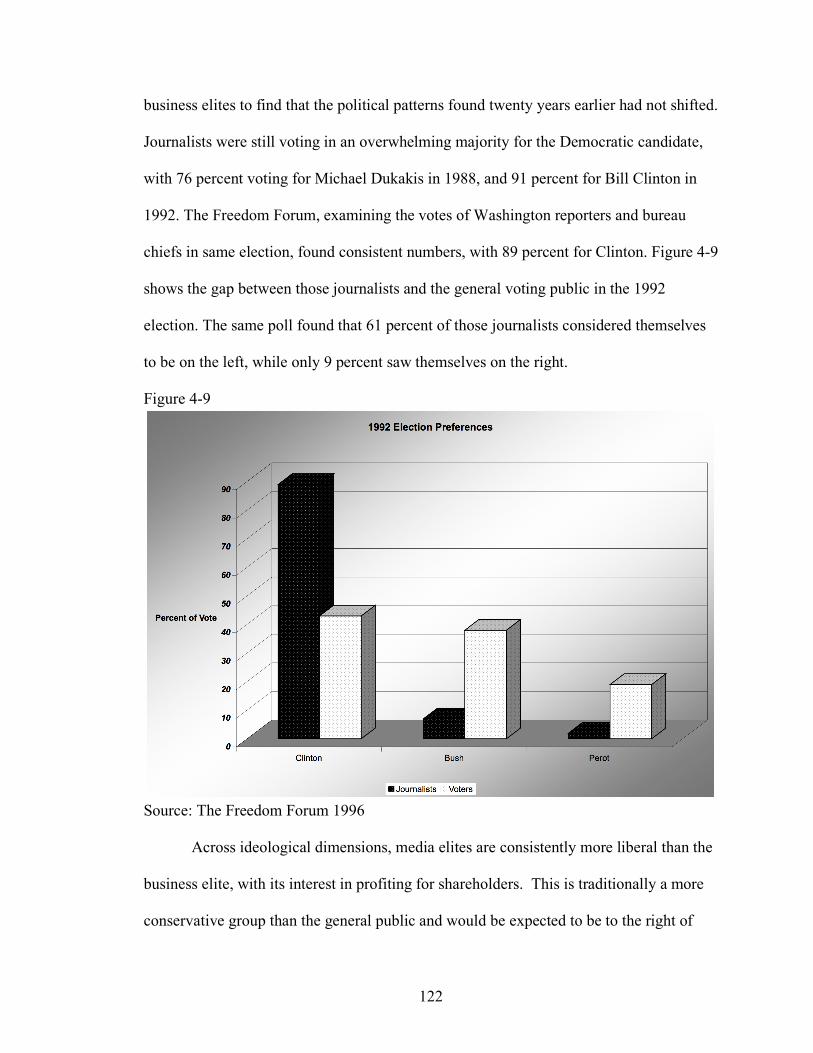
122
business elites to find that the political patterns found twenty years earlier had not shifted.
Journalists were still voting in an overwhelming majority for the Democratic candidate,
with 76 percent voting for Michael Dukakis in 1988, and 91 percent for Bill Clinton in
1992. The Freedom Forum, examining the votes of Washington reporters and bureau
chiefs in same election, found consistent numbers, with 89 percent for Clinton. Figure 4-9
shows the gap between those journalists and the general voting public in the 1992
election. The same poll found that 61 percent of those journalists considered themselves
to be on the left, while only 9 percent saw themselves on the right.
Figure 4-9
Source: The Freedom Forum 1996
Across ideological dimensions, media elites are consistently more liberal than the
business elite, with its interest in profiting for shareholders. This is traditionally a more
conservative group than the general public and would be expected to be to the right of
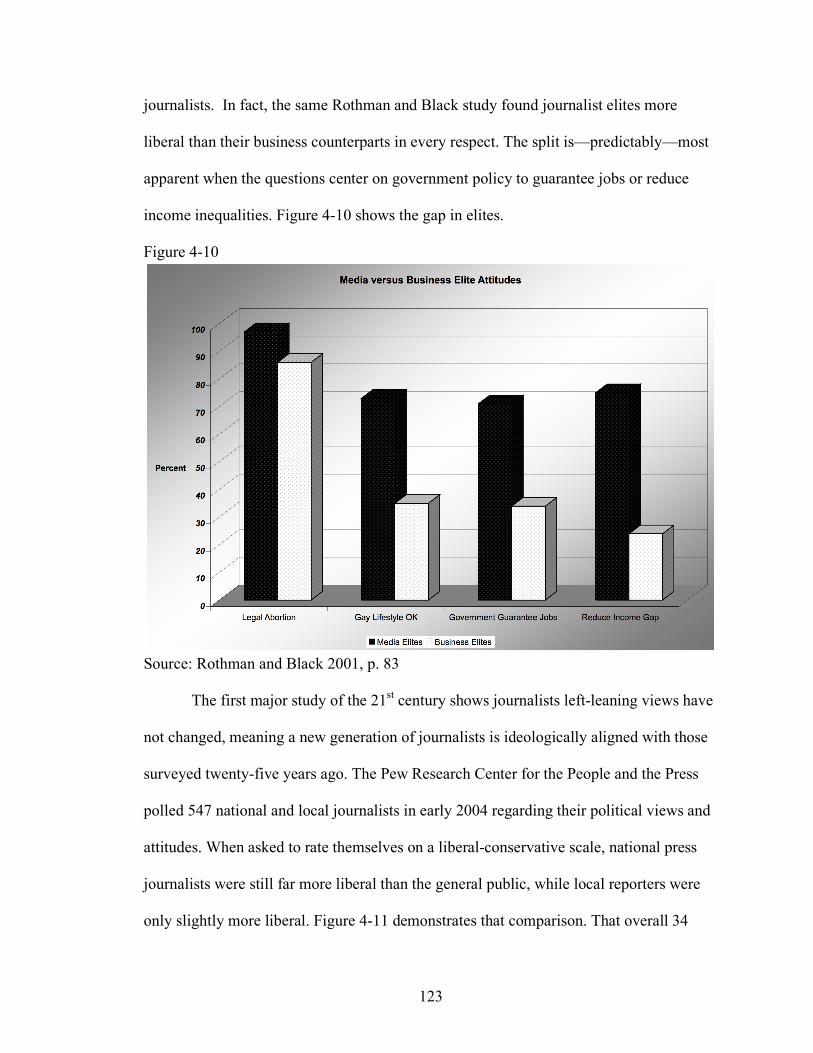
123
journalists. In fact, the same Rothman and Black study found journalist elites more
liberal than their business counterparts in every respect. The split is—predictably—most
apparent when the questions center on government policy to guarantee jobs or reduce
income inequalities. Figure 4-10 shows the gap in elites.
Figure 4-10
Source: Rothman and Black 2001, p. 83 The first major study of the 21st century shows journalists left-leaning views have
not changed, meaning a new generation of journalists is ideologically aligned with those
surveyed twenty-five years ago. The Pew Research Center for the People and the Press
polled 547 national and local journalists in early 2004 regarding their political views and
attitudes. When asked to rate themselves on a liberal-conservative scale, national press
journalists were still far more liberal than the general public, while local reporters were
only slightly more liberal. Figure 4-11 demonstrates that comparison. That overall 34
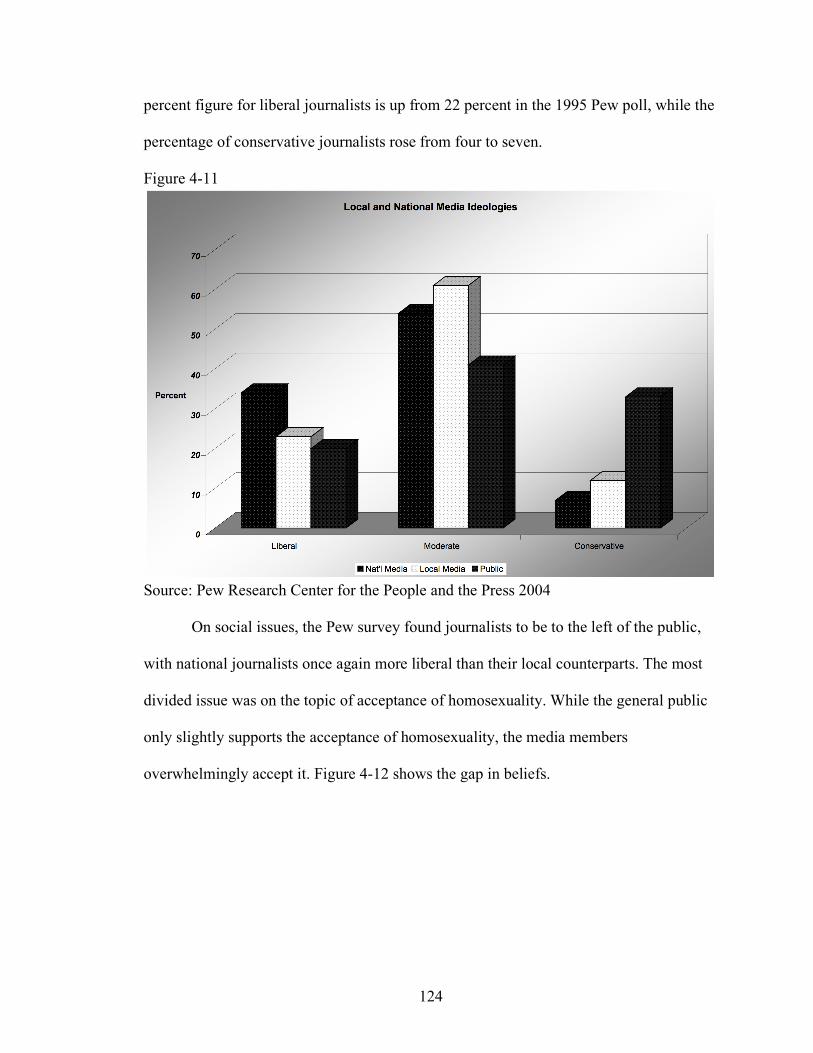
124
percent figure for liberal journalists is up from 22 percent in the 1995 Pew poll, while the
percentage of conservative journalists rose from four to seven.
Figure 4-11
Source: Pew Research Center for the People and the Press 2004
On social issues, the Pew survey found journalists to be to the left of the public,
with national journalists once again more liberal than their local counterparts. The most
divided issue was on the topic of acceptance of homosexuality. While the general public
only slightly supports the acceptance of homosexuality, the media members
overwhelmingly accept it. Figure 4-12 shows the gap in beliefs.
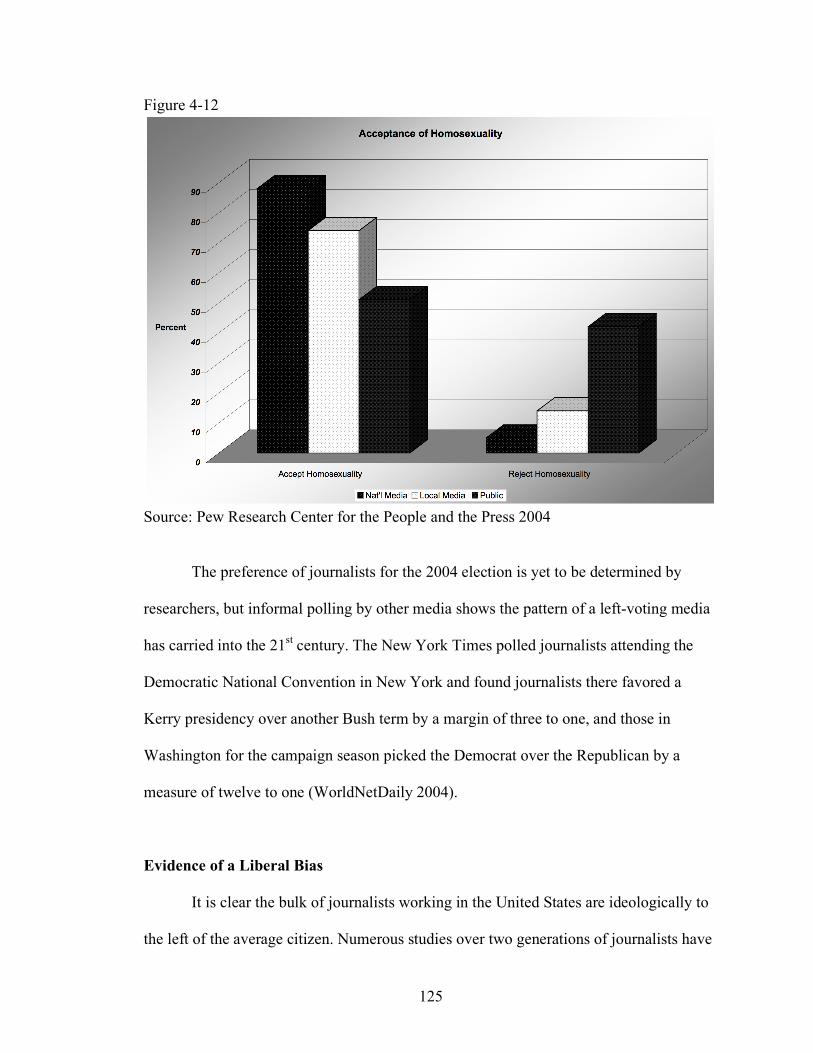
125
Figure 4-12
Source: Pew Research Center for the People and the Press 2004
The preference of journalists for the 2004 election is yet to be determined by
researchers, but informal polling by other media shows the pattern of a left-voting media
has carried into the 21st century. The New York Times polled journalists attending the
Democratic National Convention in New York and found journalists there favored a
Kerry presidency over another Bush term by a margin of three to one, and those in
Washington for the campaign season picked the Democrat over the Republican by a
measure of twelve to one (WorldNetDaily 2004).
Evidence of a Liberal Bias
It is clear the bulk of journalists working in the United States are ideologically to
the left of the average citizen. Numerous studies over two generations of journalists have
126
shown this to be an ideological consistency. But is there an effect on the balance and
fairness of the news these liberal journalists produce? Some on the right charge that the
media elites are out of touch with their readers and viewers, unable to judge the value of
NASCAR in the lives of everyday Americans (Coulter 2002, p. 205). But conservative
critics say that is just one picket on the left-leaning fence standing between liberal
journalists and news consumers.
With the impartial media being a 20th century invention, there was an acceptance
of bias before that time. But as audiences and politicians began to expect fair treatment
for all sides, the hint of a lean one way or another was suddenly a cause for alarm. The
first references to a biased media centered around what may seem odd today—a
conservative slant. Everette (1997) points out that Franklin D. Roosevelt called the press
“200 percent Republican” and Adlai Stevenson was fond of talking about the “one-party
press” (Everette 1997, p. 3). Both Democrats saw rampant right-leaning bias in the
newspapers owned and run by big-business Republicans. But it was a Republican Vice
President who put the modern model of media bias in place. Speaking in Des Moines,
Iowa on November 13, 1969, Spiro Agnew called on the American people to demand
more from a television news media than they were being given.
And the people of America are challenged, too -- challenged to press for responsible news presentation. The people can let the networks know that they want their news straight and objective. The people can register their complaints on bias through mail to the networks and phone calls to local stations. This is one case where the people must defend themselves, where the citizen, not the Government, must be the reformer; where the consumer can be the most effective crusader (Agnew 1969).
Nowhere in the speech did Agnew say the words “liberal” or “left” of
“Democrat,” but the message was clear. He redefined the problem of bias in the media
127
from the right to the left in an instant. Strouse (1975) reports the media were “scared into
inaction” (Strouse 1975, p. 108). Editorials stopped their criticism of the president and
commentators followed suit. And this change came just one year after the majority of
major newspapers endorsed the Nixon-Agnew ticket for reelection (Lee and Solomon
1990, p. 142). As authors and scholars began to look into the perceived bias in the news,
their findings were a mixed bag. Efron (1971) took Agnew’s lead and fired off the first
volley of shots across the bow of the media establishment. Her study proved to be a
jumping off point for those to come over the next thirty years, citing a systematic and
consistent liberal bias to the daily output of the news media. Cirino (1971) details a list of
practices leading to bias, which foreshadows much future research. Cirino suggest
journalists show bias when choosing sources, choosing stories to cover, by omitting
details, in the selection of questions for interviews, by choosing placement of stories, in
image selection, and of course, in the writing of the stories (Cirino 1971, pp. 136-79). But
Cirino does not attack the media as being liberal in their bias. Instead, he charges the
media have an agenda to carry out, mainly commercial and non-political, and that they
alter and distort their stories to support this agenda.
Epstein (1975) describes a “bias for change” in television network news, which he
believes can be perceived as a liberal bias by viewers. The need to show stories easily
comprehended by audiences everywhere leads to an oversimplification of the details and
a resulting appearance that most stories can be resolved by a change in which one side
defeats the other (Epstein 1975, p. 205). Epstein sees the real problem for journalists to
be in the structure of how they gather their facts and are subject to manipulation by the
sources of those facts, and the demands of the medium for which they write. Patterson
128
(1997) agrees with this “news as conflict” definition, particularly in the political arena.
And Hatchen (2001) contends the journalist’s habit of magnifying the bad while nearly
hiding the good forces the audience to see an increasingly depressing view of the world.
There is an association of the media with the bad news itself, causing a feeling of
uneasiness in just turning it on or opening the paper (Hatchen 2001, p. 115). Fallows
(1996) has an even darker view. He describes journalists as portraying “American life as
a race to the bottom” (Fallows 1996, p. 7). This brings distrust of not only the media, but
Fallows says, of all institutions political, social, or commercial.
Kuypers (2002) details the processes of liberal bias in the news. It begins with
“sandwiching,” a practice in which story objects of different ideology or substance are
placed next to or within one another. This placement often causes unflattering
comparisons between the two, usually to the detriment of the conservative point of view.
The ratio of liberal to conservative sources is often uneven, with as much as fourteen
times more liberal views than conservative (Kuypers 2002, p. 212).
Much of the discussion of the specifics of a liberal bias in the media starts with
language. Critics say the words journalists use—or do not use—display their true biases
to their audience. One word that often gives that clue is the word “liberal” itself. Bozell
and Baker (1990) examined the language used in major newspapers to describe the
political leanings of certain groups. The authors found the word “liberal” tacked on as a
descriptor of groups like the Brookings Institution, the National Organization for
Women, and the Leadership Conference on Civil Rights a tiny fraction of the time the
label “conservative” is applied to the counterparts of the above mentioned organizations,
the Heritage Foundation, the Concerned Women for America, and the Free Congress
129
Foundation (Bozell and Baker 1990, p. 101). On the controversial subject of abortion,
each side has chosen a euphemistic name to help make a sympathetic point with the
public. Those in favor of the right to a legal abortion call themselves “pro-choice,” while
those opposed to the right to a legal abortion call themselves “pro-life.” But what do the
news media call them? A study of the main network television newscasts in 1988 shows
a large discrepancy in terms. Figure 4-13 shows the percentage of mentions with the
positive term for each group (pro-choice or pro-life) compared with the negative terms
(primarily “anti-abortion”). In all, 97 percent of mentions of those in favor of abortion
rights used the term “pro-choice” while only 21 percent of references to those against
legal abortion used their term “pro-life” (Bozell and Baker 1990, pp. 105-6).
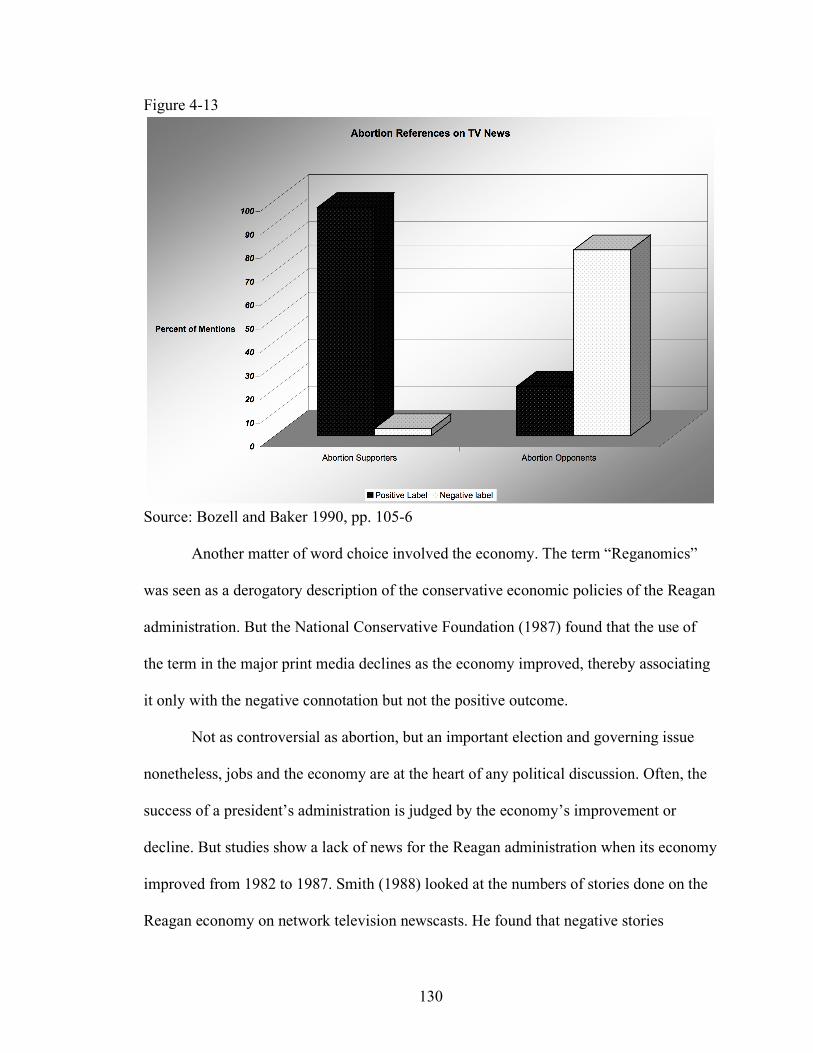
130
Figure 4-13
Source: Bozell and Baker 1990, pp. 105-6
Another matter of word choice involved the economy. The term “Reganomics”
was seen as a derogatory description of the conservative economic policies of the Reagan
administration. But the National Conservative Foundation (1987) found that the use of
the term in the major print media declines as the economy improved, thereby associating
it only with the negative connotation but not the positive outcome.
Not as controversial as abortion, but an important election and governing issue
nonetheless, jobs and the economy are at the heart of any political discussion. Often, the
success of a president’s administration is judged by the economy’s improvement or
decline. But studies show a lack of news for the Reagan administration when its economy
improved from 1982 to 1987. Smith (1988) looked at the numbers of stories done on the
Reagan economy on network television newscasts. He found that negative stories
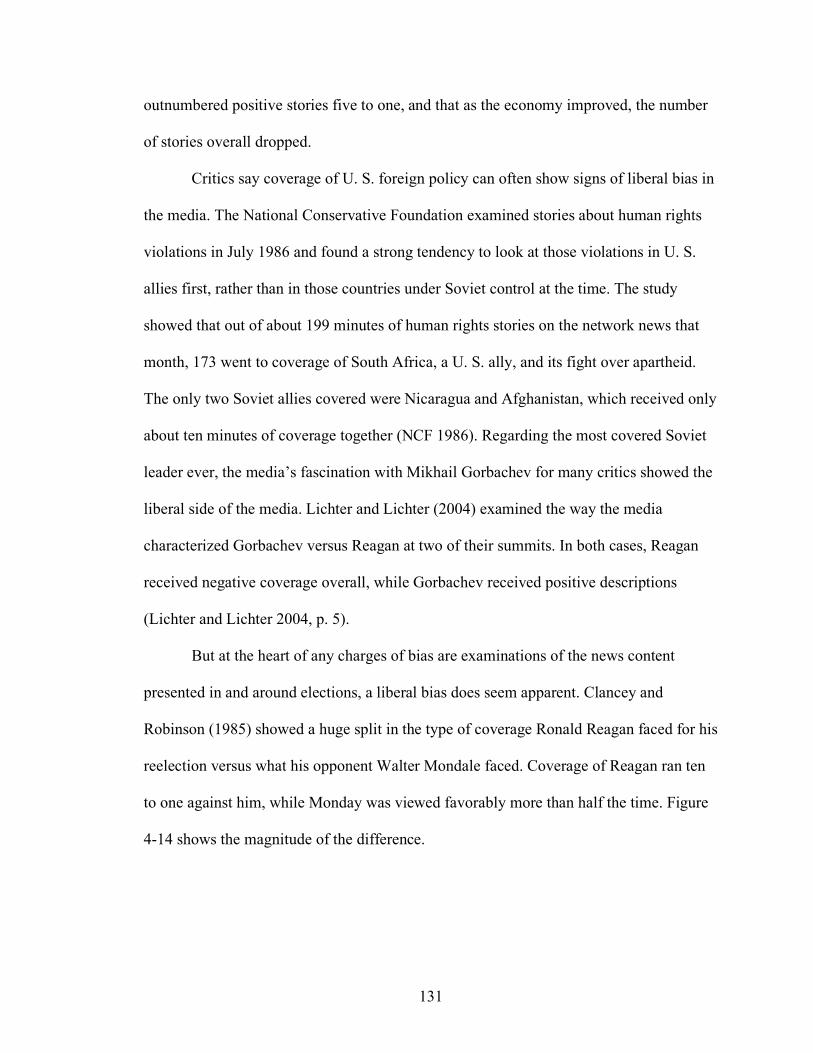
131
outnumbered positive stories five to one, and that as the economy improved, the number
of stories overall dropped.
Critics say coverage of U. S. foreign policy can often show signs of liberal bias in
the media. The National Conservative Foundation examined stories about human rights
violations in July 1986 and found a strong tendency to look at those violations in U. S.
allies first, rather than in those countries under Soviet control at the time. The study
showed that out of about 199 minutes of human rights stories on the network news that
month, 173 went to coverage of South Africa, a U. S. ally, and its fight over apartheid.
The only two Soviet allies covered were Nicaragua and Afghanistan, which received only
about ten minutes of coverage together (NCF 1986). Regarding the most covered Soviet
leader ever, the media’s fascination with Mikhail Gorbachev for many critics showed the
liberal side of the media. Lichter and Lichter (2004) examined the way the media
characterized Gorbachev versus Reagan at two of their summits. In both cases, Reagan
received negative coverage overall, while Gorbachev received positive descriptions
(Lichter and Lichter 2004, p. 5).
But at the heart of any charges of bias are examinations of the news content
presented in and around elections, a liberal bias does seem apparent. Clancey and
Robinson (1985) showed a huge split in the type of coverage Ronald Reagan faced for his
reelection versus what his opponent Walter Mondale faced. Coverage of Reagan ran ten
to one against him, while Monday was viewed favorably more than half the time. Figure
4-14 shows the magnitude of the difference.
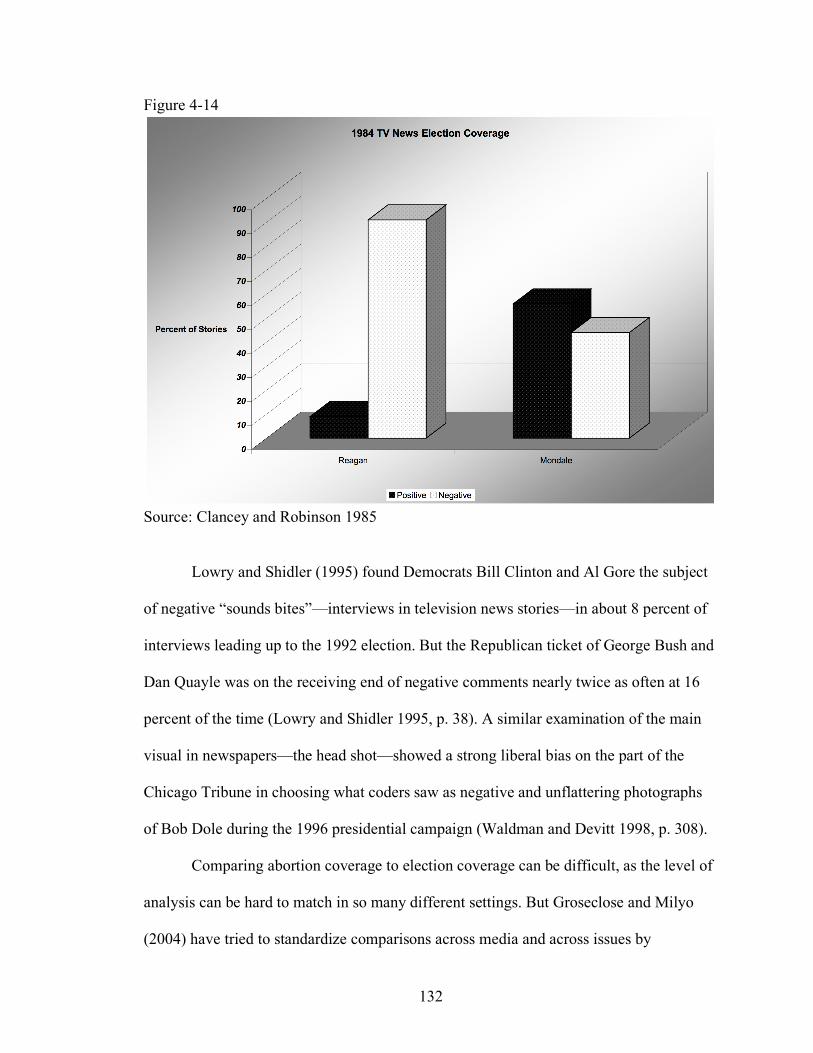
132
Figure 4-14
Source: Clancey and Robinson 1985
Lowry and Shidler (1995) found Democrats Bill Clinton and Al Gore the subject
of negative “sounds bites”—interviews in television news stories—in about 8 percent of
interviews leading up to the 1992 election. But the Republican ticket of George Bush and
Dan Quayle was on the receiving end of negative comments nearly twice as often at 16
percent of the time (Lowry and Shidler 1995, p. 38). A similar examination of the main
visual in newspapers—the head shot—showed a strong liberal bias on the part of the
Chicago Tribune in choosing what coders saw as negative and unflattering photographs
of Bob Dole during the 1996 presidential campaign (Waldman and Devitt 1998, p. 308).
Comparing abortion coverage to election coverage can be difficult, as the level of
analysis can be hard to match in so many different settings. But Groseclose and Milyo
(2004) have tried to standardize comparisons across media and across issues by
133
employing an analysis of the Americans for Democratic Action ideological rankings for
members of Congress. Under the liberal group’s rankings, a perfectly liberal legislator
would receive a score of 100, while a perfectly conservative lawmaker would receive a
score of zero. Based on members’ rankings, the authors rated the think tanks and other
policy groups most often cited by those legislators. Then they scored television and print
news content for the appearance of representatives of those groups. That gave an
estimated ADA score for each media outlet. The results show only two of the twenty
media sources scored ranked as conservative, while the other 18 ranks as most liberal.
Table 4-2 shows the relative rank of each to the center, scored as 50.1 based on the mean
of the members of Congress over the past 40 years.
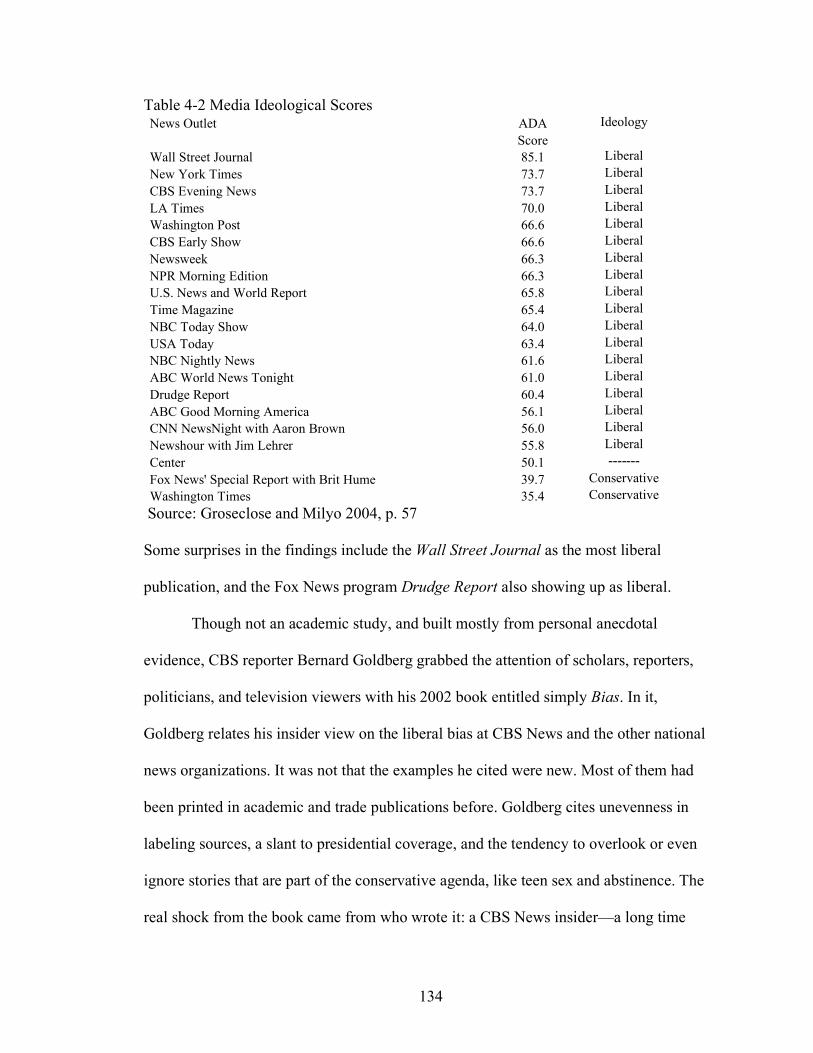
134
Table 4-2 Media Ideological Scores News Outlet ADA Ideology Score Wall Street Journal 85.1 Liberal New York Times 73.7 Liberal CBS Evening News 73.7 Liberal LA Times 70.0 Liberal Washington Post 66.6 Liberal CBS Early Show 66.6 Liberal Newsweek 66.3 Liberal NPR Morning Edition 66.3 Liberal U.S. News and World Report 65.8 Liberal Time Magazine 65.4 Liberal NBC Today Show 64.0 Liberal USA Today 63.4 Liberal NBC Nightly News 61.6 Liberal ABC World News Tonight 61.0 Liberal Drudge Report 60.4 Liberal ABC Good Morning America 56.1 Liberal CNN NewsNight with Aaron Brown 56.0 Liberal Newshour with Jim Lehrer 55.8 Liberal Center 50.1 ------- Fox News' Special Report with Brit Hume 39.7 Conservative Washington Times 35.4 Conservative
Source: Groseclose and Milyo 2004, p. 57
Some surprises in the findings include the Wall Street Journal as the most liberal
publication, and the Fox News program Drudge Report also showing up as liberal.
Though not an academic study, and built mostly from personal anecdotal
evidence, CBS reporter Bernard Goldberg grabbed the attention of scholars, reporters,
politicians, and television viewers with his 2002 book entitled simply Bias. In it,
Goldberg relates his insider view on the liberal bias at CBS News and the other national
news organizations. It was not that the examples he cited were new. Most of them had
been printed in academic and trade publications before. Goldberg cites unevenness in
labeling sources, a slant to presidential coverage, and the tendency to overlook or even
ignore stories that are part of the conservative agenda, like teen sex and abstinence. The
real shock from the book came from who wrote it: a CBS News insider—a long time
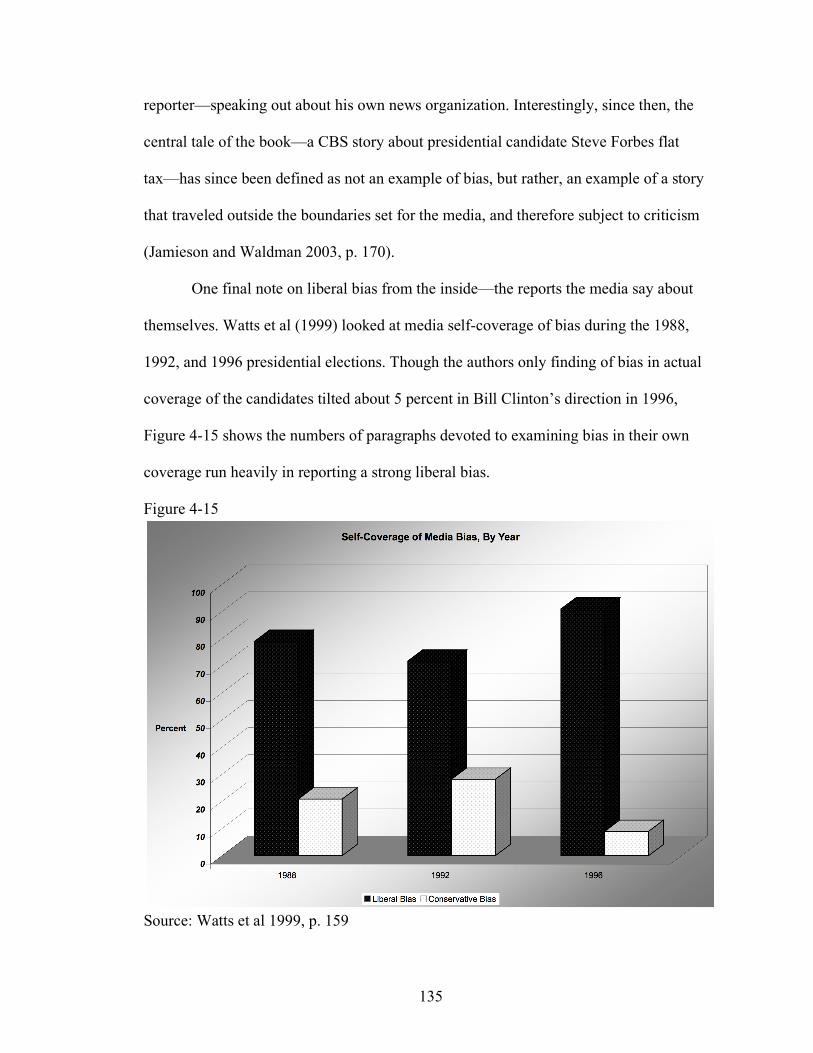
135
reporter—speaking out about his own news organization. Interestingly, since then, the
central tale of the book—a CBS story about presidential candidate Steve Forbes flat
tax—has since been defined as not an example of bias, but rather, an example of a story
that traveled outside the boundaries set for the media, and therefore subject to criticism
(Jamieson and Waldman 2003, p. 170).
One final note on liberal bias from the inside—the reports the media say about
themselves. Watts et al (1999) looked at media self-coverage of bias during the 1988,
1992, and 1996 presidential elections. Though the authors only finding of bias in actual
coverage of the candidates tilted about 5 percent in Bill Clinton’s direction in 1996,
Figure 4-15 shows the numbers of paragraphs devoted to examining bias in their own
coverage run heavily in reporting a strong liberal bias.
Figure 4-15
Source: Watts et al 1999, p. 159
136
Liberals counter all the evidence pointing toward a bias in content brought on by
journalists’ political ideologies with an argument that the effects of the conservative
ownership and business interests of the media far outweigh any influence individual
journalists could have. Lee and Solomon (1990) invoke Dwight Eisenhower’s warning
of a growing “military-industrial complex” in their own warning of the increasing size of
the media giants in the country. The cite General Electric—a military and industrial
player in its own right—as a prime example of the reason to add “media” to
Eisenhower’s warning. Aside from a history as a large defense contractor, and even using
Ronald Reagan as a spokesman in his pre-presidential acting days, Lee and Solomon say
the influence of GE on the news division of its subsidiary NBC is quite direct. The cite
the example of the corporate editing of an NBC Today Show story in 1989 that quoted
from a federal investigation into faulty bolts GE and other corporations were selling to
government for airplanes, bridges, and even NASA projects. GE demanded the news
division remove this paragraph from the report:
Recently, General Electric engineers discovered they had a big problem. One out of three bolts from one of their major suppliers was bad. Even more alarming, GE accepted the bad bolts without any certification of compliance for eight years (Lee and Solomon 1990, pp. 77-8).
The reporter working on the story was shocked and claimed his news bosses were
“overprotective of a corporate owner” (Lee and Solomon 1990, p. 78). But the authors
say the conservative bias at NBC goes beyond protecting its owner—to promoting it. In
1987, NBC aired an hour-long special on the success of the nuclear power industry in
France. The program looked at successes in operating the system that provides the French
power, but glossed over the still troubling issue of disposal of nuclear waste. And the
entire documentary aired with no mention that NBC’s corporate parent was this country’s
137
second largest nuclear energy vendor. And weeks later, when two nuclear power plant
accidents injured half a dozen workers in France, NBC News did not report it (Lee and
Solomon 1990, p. 78).
Harder to gauge than specific acts of boosterism on the part of media properties or
re-editing of damaging stories is the self-censorship of stories reporters at corporately
owned media never do. Former FCC Chairman Nicholas Johnson described the process
of self-censorship as a learned behavior:
The story is told of a reporter who first comes up with an investigative story idea, writes it up and submits it to the editor and is told the story is not going to run. He wonders why, but the next time he is cautious enough to check with the editor first. He is told by the editor that it would be better not to write that story. The third time he thinks of an investigative story idea he doesn’t bother the editor with it because he knows it’s silly. The fourth time he doesn’t even think of the idea anymore. (Lee and Solomon 1990, p. 98). The chilling effect on reporters is obvious in this example. Certain stories—
usually about advertisers or the corporate interests of the owners—are never done
because the journalists know they will not run. A case in point may exist with ABC’s
20/20 program. Its executive producer in the late 1980s was Mace Neufeld. Neufeld’s
wife was a publicist for the nuclear and chemical industries. Journalists working for ABC
complained that Neufeld routinely rejected story ideas about nuclear power and only
aired one that promoted the irradiation of food (Cohen and Solomon 1995, pp. 66-7).
It may be that the right has become better at giving the media what it wants. The
changes in attention span and story length into the 1990s and beyond lead Lieberman
(2000) to suggest the “liberal” media played right into the plans of the new conservative
movement. Repetition is the key to getting a conservative message to the media and
through it to the audience. Lieberman cites the privatization of Social Security as a
138
conservative issue that has been repeated for years. Foundation money from the Cato
Institute and other sources allows for the repetition to continue for a long period. And as
these groups rise in stature, then supplant the universities as idea generators (Lieberman
2000, p. 37). Lieberman suggests the new generation of journalists is more open to ideas
of conservatism and have used their own suppositions of liberal bias to give the “other
side” a stronger footing in the newsroom.
This notion of controlling the flow of information to newsrooms fits nicely with
the propaganda model put forth by Chomsky and Herman (1988) in Manufacturing
Consent. The model employs a series of “filters” in the hands of media ownership that
control the information reaching the public and help to gather popular consent for
conservative policies. The raw materials of news must travel through the filters and be
manufactured into a final product. The filters begin with the ownership of the media
outlet, continue through the controls of advertisers, travel through the waves of official
sources common to news, face another filter of negative feedback from viewers and
readers, and finally pass through the last filter of an anticommunist sentiment. At that
point, the news is ready for consumptions, but devoid of any substance that would harm
the conservative power structure (Herman 1999, pp. 24-8). The Glasgow University
Media Group (GUMG 1976) found an innate bias in the approach taken by British
journalists in covering labor issues. Though the authors see the bias as systemic and not a
personal or intentional effort, their findings proved to be the foundation for much of the
systemic analysis of bias in the media.
Beyond all the evidence of a systemic conservative bias to the way the media
report the news, liberal critics have one source of conservative news to which they
139
consistently point—the Fox News Channel. The Murdoch-owned, Ailes-run news
network surpassed CNN during the Iraq War as the most popular on cable and satellite
(Bauder 2003). The channel proclaims it slogan as “We report, you decide.” But liberals
have decided the network is a mouthpiece for the right. And they may be right. Kull
(2003) shows that Fox News viewers had more misperceptions about the Iraq War than
viewers of any other network or print medium. When asked if Al-Queda links were
present, weapons of mass destruction found, or world support for the war existed, 45
percent of Fox viewers had at least one misperception. PBS viewers and NPR listeners
had the fewest misperceptions, at 11 percent (Kull 2003, p. 15).
Misperceptions and all, the public views conservatives as gaining ground in the
control of the American media. Garin-Hart-Yang Research Group (2004) asked voters if
conservatives or liberals have more power in the media today. Of all voters, 36 percent
said liberals dominate, while 41 percent say conservatives do. But the poll splits along
lines of ideology, as liberals saw conservatives more in control (58 to 18 percent) and
conservatives saw more liberals at the helm, (51 to 29 percent). Moderates and
Independents also saw conservatives in charge of more media (Garin-Hart-Yang 2004, p.
2).
Not all research falls on one side or the other of the bias question. Russo (1971)
looked at the precipitating event for the Agnew speech, the Vietnam War, and found no
bias against Richard Nixon in network news coverage on NBC and CBS in 1969 and
1970. He also found no change in the way the networks covered the war in the wake of
the 1969 Agnew speech (Russo 1971, p. 542). Niven (2002) compiled coverage two
presidents, 200 governors, eight mayors, and 266 members of Congress to examine
140
liberal/conservative biases in any news reports. Niven built a baseline of study that could
be compared across all offices, national or local. He used common issues all the
officeholders faced, rather than try to compare the different eras and public moods of
varying election cycles. Niven applied his research method to unemployment policy for
presidents, crime policy for governors and mayors, and the House banking scandal for
members of Congress. In each of the levels of analysis, the front page appearance, length
of articles, and prominence of the office holder in the articles is virtually identical. But
more importantly, there was no statistical significance in the mean tone of the articles
based on partisanship (Niven 2002, p. 93).
Academic research, summed across time, seems to point to a tradition of either
unbiased coverage, or at least bias for both sides that evens itself out. D’Alessio and
Allen (2000) compared fifty-nine presidential bias studies from 1948 to 1996 and found
no statistical evidence of bias over the course of all the elections. And though some
election coverage was pro-Republican and some pro-Democrat by individual election, the
authors attributed those differences to random error (D’Alessio and Allen 2000, p. 133,
140).
The Power of Professional Standards
Many journalists lean left, a few journalists lean right, or as West (2001) points
out, a confused audience sees evidence of both almost daily (West 2001, pp. 81-2). Does
all this matter? Does how a journalist votes affect the way he reports? Or can
professional standards, as Dennis (1996) suggests, hold off any hint of bias?
141
NBC correspondent Roger Mudd, facing a group of journalism students and
educators in 1971, defined the role of the media as this,
What the national media, and mainly television, have done is to believe that their chief duty is to put before the nation its unfinished business: pollution, the Vietnam War, discrimination, continuing violence, motor traffic, slums. The media have become the nation’s critics, and as critics no political administration, regardless of how hard it tries, will satisfy them” (Kristol 1972, p. 50).
The key phrases in that simple definition are “unfinished business” and “nation’s critics.”
Mudd’s definition shows the heart of the argument that journalists must set an agenda for
change for the betterment of society, and do so as representatives of all citizens, asking
the necessary questions of those in authority, regardless of political party or position.
Evidence exists to support this view. Groeling and Kernell (1998) found an anti-
presidential bias in the major television network coverage, based on coverage choices to
emphasize a downturn in presidential popularity. But the study showed the bias existed
through both the first Bush and Clinton administrations, crossing both Republican and
Democrat party lines. A similar study of coverage of members of Congress who change
parties showed that newspaper approaches to the stories are uniform regardless of the
switcher’s party affiliation (Niven 2003, p. 322).
The Vietnam War was in issue that split Americans and asked them to take sides
as “hawks” or “doves.” While the battle raged in southeast Asia to win the war, another
raged at home to win the American people over to the side of the Johnson and Nixon
administrations. Ultimately, historians say the two presidents lost the media war, bringing
on the defeat in Asia. Media coverage of the war, especially on television, brought home
stories and images a lot of people did not want to see. But was the media opposed to the
war and did that affect the content of what they printed and broadcast? Hallin (1984)
142
investigated whether the American press became an “oppositional” media during the war.
Hallin examined nearly 800 television news stories about the war, looking for a shift in
the content of the coverage from slightly supportive to strongly in opposition. Hallin
admits the news appears to get more critical as the war progresses. But a closer look at
the data shows the media, on the most negative stories, following leads they could not
ignore—the Tet Offensive, the leaking of the Pentagon Papers, or the My Lai massacre
(Hallin 1984, p. 12). In addition, the media relied heavily on official sources, even at the
height of the most critical coverage, giving those official sources credibility to continue
to lead the war effort. Beyond those official sources, the opposition party in government
was rarely quoted, and the system itself that lead to the war was also given a pass by most
reporters (Hallin 1984, p. 18-9). Steele (1995) found the same pattern in coverage of the
first Persian Gulf War as reporters relied on official sources to provide a nearly endless
stream of information and interviews for the voracious news appetite reporters were
feeding at the time.
Helm (1988) also takes on Rothman and Lichter (1987) who blame bias in the
news media for the strong reaction Americans developed to nuclear energy. Helm asserts
the changes in public sentiment are real enough, but the evidence that the media caused
those changes is nonexistent. Instead, he points to a declining trust in the United States in
the institutions of science. But Rothman and Lichter (1988) counter with correlation data
that shows the public mood on nuclear power declining as negative stories increase.
And what about a biased audience? Gunther (1992) examined the positions of the
audience members relative to the stories they consumed and found a stronger perception
of bias among those who were personally involved with the issue covered. Gunther
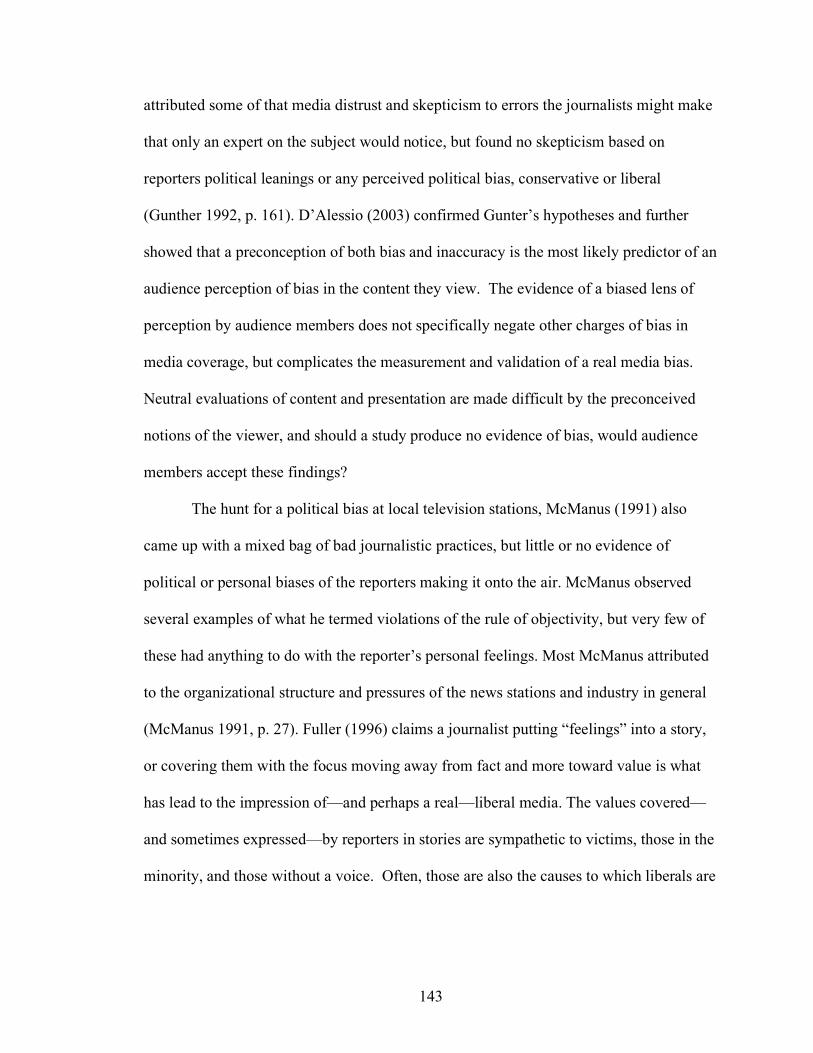
143
attributed some of that media distrust and skepticism to errors the journalists might make
that only an expert on the subject would notice, but found no skepticism based on
reporters political leanings or any perceived political bias, conservative or liberal
(Gunther 1992, p. 161). D’Alessio (2003) confirmed Gunter’s hypotheses and further
showed that a preconception of both bias and inaccuracy is the most likely predictor of an
audience perception of bias in the content they view. The evidence of a biased lens of
perception by audience members does not specifically negate other charges of bias in
media coverage, but complicates the measurement and validation of a real media bias.
Neutral evaluations of content and presentation are made difficult by the preconceived
notions of the viewer, and should a study produce no evidence of bias, would audience
members accept these findings?
The hunt for a political bias at local television stations, McManus (1991) also
came up with a mixed bag of bad journalistic practices, but little or no evidence of
political or personal biases of the reporters making it onto the air. McManus observed
several examples of what he termed violations of the rule of objectivity, but very few of
these had anything to do with the reporter’s personal feelings. Most McManus attributed
to the organizational structure and pressures of the news stations and industry in general
(McManus 1991, p. 27). Fuller (1996) claims a journalist putting “feelings” into a story,
or covering them with the focus moving away from fact and more toward value is what
has lead to the impression of—and perhaps a real—liberal media. The values covered—
and sometimes expressed—by reporters in stories are sympathetic to victims, those in the
minority, and those without a voice. Often, those are also the causes to which liberals are
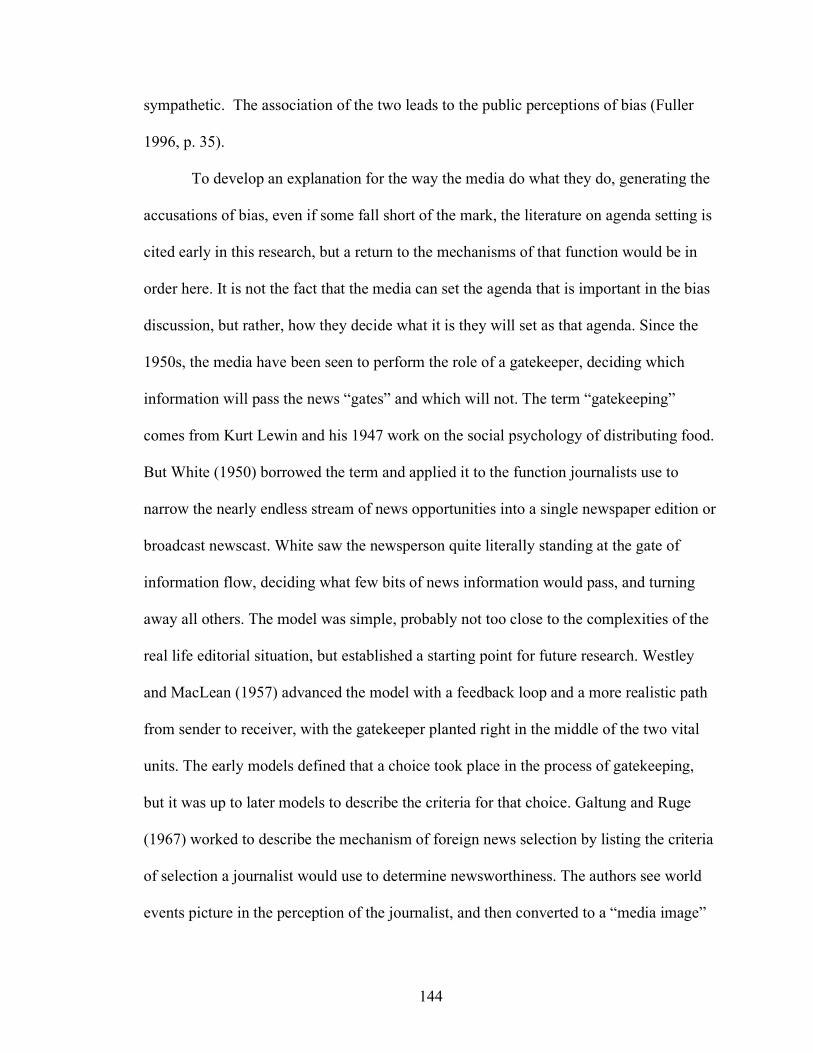
144
sympathetic. The association of the two leads to the public perceptions of bias (Fuller
1996, p. 35).
To develop an explanation for the way the media do what they do, generating the
accusations of bias, even if some fall short of the mark, the literature on agenda setting is
cited early in this research, but a return to the mechanisms of that function would be in
order here. It is not the fact that the media can set the agenda that is important in the bias
discussion, but rather, how they decide what it is they will set as that agenda. Since the
1950s, the media have been seen to perform the role of a gatekeeper, deciding which
information will pass the news “gates” and which will not. The term “gatekeeping”
comes from Kurt Lewin and his 1947 work on the social psychology of distributing food.
But White (1950) borrowed the term and applied it to the function journalists use to
narrow the nearly endless stream of news opportunities into a single newspaper edition or
broadcast newscast. White saw the newsperson quite literally standing at the gate of
information flow, deciding what few bits of news information would pass, and turning
away all others. The model was simple, probably not too close to the complexities of the
real life editorial situation, but established a starting point for future research. Westley
and MacLean (1957) advanced the model with a feedback loop and a more realistic path
from sender to receiver, with the gatekeeper planted right in the middle of the two vital
units. The early models defined that a choice took place in the process of gatekeeping,
but it was up to later models to describe the criteria for that choice. Galtung and Ruge
(1967) worked to describe the mechanism of foreign news selection by listing the criteria
of selection a journalist would use to determine newsworthiness. The authors see world
events picture in the perception of the journalist, and then converted to a “media image”
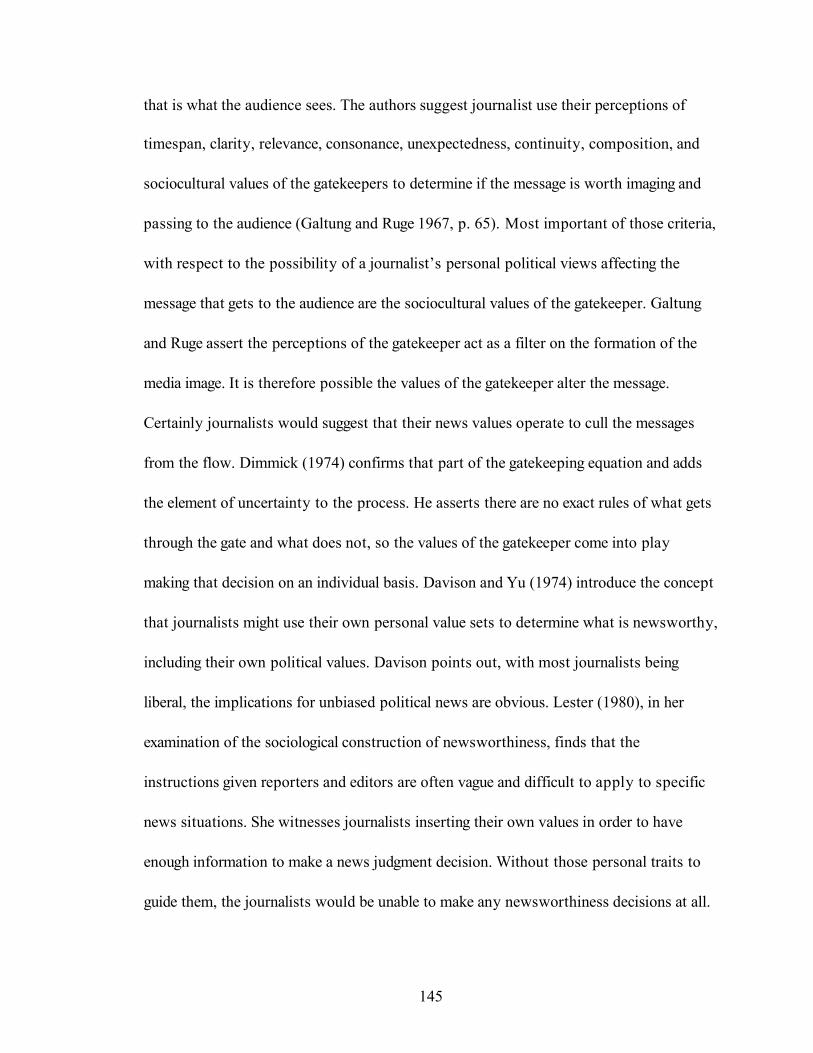
145
that is what the audience sees. The authors suggest journalist use their perceptions of
timespan, clarity, relevance, consonance, unexpectedness, continuity, composition, and
sociocultural values of the gatekeepers to determine if the message is worth imaging and
passing to the audience (Galtung and Ruge 1967, p. 65). Most important of those criteria,
with respect to the possibility of a journalist’s personal political views affecting the
message that gets to the audience are the sociocultural values of the gatekeeper. Galtung
and Ruge assert the perceptions of the gatekeeper act as a filter on the formation of the
media image. It is therefore possible the values of the gatekeeper alter the message.
Certainly journalists would suggest that their news values operate to cull the messages
from the flow. Dimmick (1974) confirms that part of the gatekeeping equation and adds
the element of uncertainty to the process. He asserts there are no exact rules of what gets
through the gate and what does not, so the values of the gatekeeper come into play
making that decision on an individual basis. Davison and Yu (1974) introduce the concept
that journalists might use their own personal value sets to determine what is newsworthy,
including their own political values. Davison points out, with most journalists being
liberal, the implications for unbiased political news are obvious. Lester (1980), in her
examination of the sociological construction of newsworthiness, finds that the
instructions given reporters and editors are often vague and difficult to apply to specific
news situations. She witnesses journalists inserting their own values in order to have
enough information to make a news judgment decision. Without those personal traits to
guide them, the journalists would be unable to make any newsworthiness decisions at all.
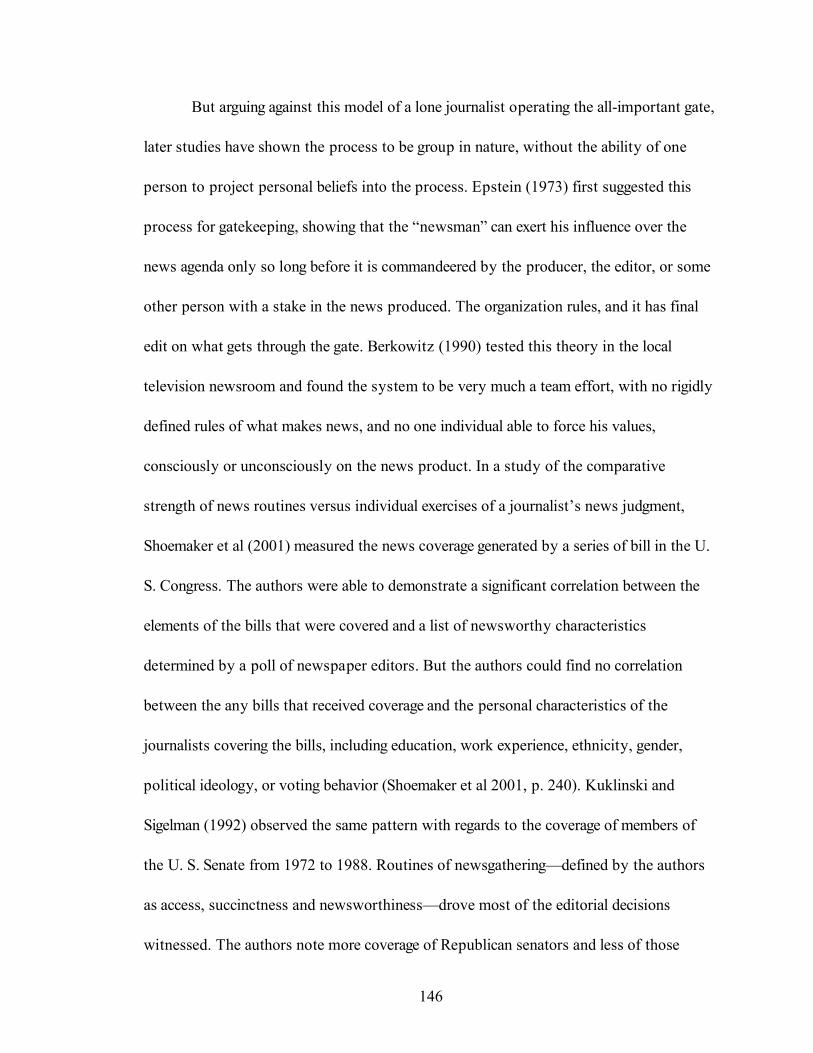
146
But arguing against this model of a lone journalist operating the all-important gate,
later studies have shown the process to be group in nature, without the ability of one
person to project personal beliefs into the process. Epstein (1973) first suggested this
process for gatekeeping, showing that the “newsman” can exert his influence over the
news agenda only so long before it is commandeered by the producer, the editor, or some
other person with a stake in the news produced. The organization rules, and it has final
edit on what gets through the gate. Berkowitz (1990) tested this theory in the local
television newsroom and found the system to be very much a team effort, with no rigidly
defined rules of what makes news, and no one individual able to force his values,
consciously or unconsciously on the news product. In a study of the comparative
strength of news routines versus individual exercises of a journalist’s news judgment,
Shoemaker et al (2001) measured the news coverage generated by a series of bill in the U.
S. Congress. The authors were able to demonstrate a significant correlation between the
elements of the bills that were covered and a list of newsworthy characteristics
determined by a poll of newspaper editors. But the authors could find no correlation
between the any bills that received coverage and the personal characteristics of the
journalists covering the bills, including education, work experience, ethnicity, gender,
political ideology, or voting behavior (Shoemaker et al 2001, p. 240). Kuklinski and
Sigelman (1992) observed the same pattern with regards to the coverage of members of
the U. S. Senate from 1972 to 1988. Routines of newsgathering—defined by the authors
as access, succinctness and newsworthiness—drove most of the editorial decisions
witnessed. The authors note more coverage of Republican senators and less of those
147
opposed to President Reagan and his policies. They attributed these discrepancies not to
a sudden conservative bias in the newsrooms covering the Senate, but to the skillful
manipulation of the routines of newsgathering by Republican strategists (Kuklinski and
Sigelman 1992, p. 827-8). This same successful manipulation of the news agenda is
apparent outside the walls of the Capitol as well. Danielian and Page (1994) show the
ratio of “talking heads” on television skews heavily toward business interests, followed
closely by special interest groups. It is the conclusion of the authors that the routine of
news coverage could be at the heart of the inequity, as could the inequality in ability of
those seeking an audience through the media. Even the coverage of protests is driven by a
non-partisan bias—the biggest ones get the most coverage (McCarthy, McPhail, and
Smith 1996, p. 494).
Still more evidence suggesting individual journalists—at least in the traditional
media—have less and less control as isolated, personal gatekeepers, comes in the study of
on-line and “new” media. Williams and Delli Carpini (2000) use the Lewinsky scandal to
show that the traditional news powers not in control of what information flowed to the
public. The authors suggest the internet provides the means by which news consumers
can circumvent the traditional “gates” of the established media, and find the information
they seek on their own. With the mainstream media gates knocked down, the authors
point out “if there are no gates, there can be no gatekeepers” (Williams and Delli Carpini
2000, p. 62).
But Merrill (1996) makes it clear the bias exists. And while he claims it is not
intentional, and merely part of the nature of asking a human being to tell a story,
148
Bagdikian (1969) returns us to the question those on the left and right will continue to
raise, regarding that gap between the measurable, mechanical execution of news rules and
the human, changing evaluation of news judgment,
The gatekeeper, though he seems to perform like one, is not a valueless machine operating in a vacuum. His decisions, resulting in the printing of most stories seen by the public, reflect his personal as well as his professional values and all the surrounding pressures converging on him (Bagdikian 1969, p. 107).
This analysis directly asks the question of whether a craft so connected to the human
element can stay impartial and above any bias or slant. With the answer lies the evidence
of the value and credibility of the journalists themselves.
The Issue of Trust and Credibility
Credibility is key for both policy makers and policy mediators. Page, Shapiro, and
Dempsey (1987) report that high credibility is directly correlated with the ability to
influence public opinion change, both among presidents and TV news commentators. For
journalists, credibility carries with it a financial benefit—those with high credibility are
more likely to find ratings and circulation success than those with low credibility.
Moreover, the overall perception of the professionalism of the practice of journalism has
a direct bearing on the trust of the audience (Liebes 2001, p. 295). And ultimately,
journalists value the prestige the label of credible gives them and their employer.
Washington Post editor Ben Bradlee summed it up when he explained the worth of
credibility to his newspaper, “The credibility of a newspaper is its most precious asset
and it depends almost entirely on the integrity of its reporters” (Maraniss 1981, p.1)
149
But the polls tell a mixed, yet sometimes troubling, story about the relationship
the press has with its public. At about the time Agnew made his speech, the television
newscast was highly regarded, and twice as likely to be the first choice for news as the
newspaper (Wamsley and Pride 1972, p. 436). But as far back as 1936, when asked if the
press should be able to print anything about a public official, 42 percent said reporters
should have some limits (Erskine 1970, p. 631). By 1969, shortly after Spiro Agnew
made his charges against the press, a poll asking whether newspapers were fair when
covering political and social issues showed a plurality of 45 percent who believed they
were not, while television fared only a little better, with a plurality of 42 percent also
claiming unfairness in coverage (Erskine 1970, p. 636-7). Ad when asked if they believed
the Vice President’s criticism of the TV networks was correct, 56 percent agreed (Erskine
1970, p. 638). Even post-Watergate, in a series of interviews done in five cities in 1979,
some subjects were willing to allow government control of media. Immerwahr et al
(1982) asked subjects if they agreed or disagreed with this statement, “The president has
a right to close down a newspaper that prints stories he feels are biased and inaccurate.
Agree or Disagree?” Twenty-two percent agreed the president should have that right.
Asked further if there should be, “A law prohibiting television news stories that
embarrass the president, the government or the country. Favor or oppose?” nearly a third
of the subjects—29 percent—said there should be such a law (Immerwahr et al 1982, p.
182-4). In the late 1990s, Yalof and Dautrich found survey results showing a stronger
feeling of support for general First Amendment rights, but still some reservations on the
part of subjects to allow media to act in complete freedom. A 2002 survey by the Roper
Organization asked if the media help society solve its problems or get in the way of
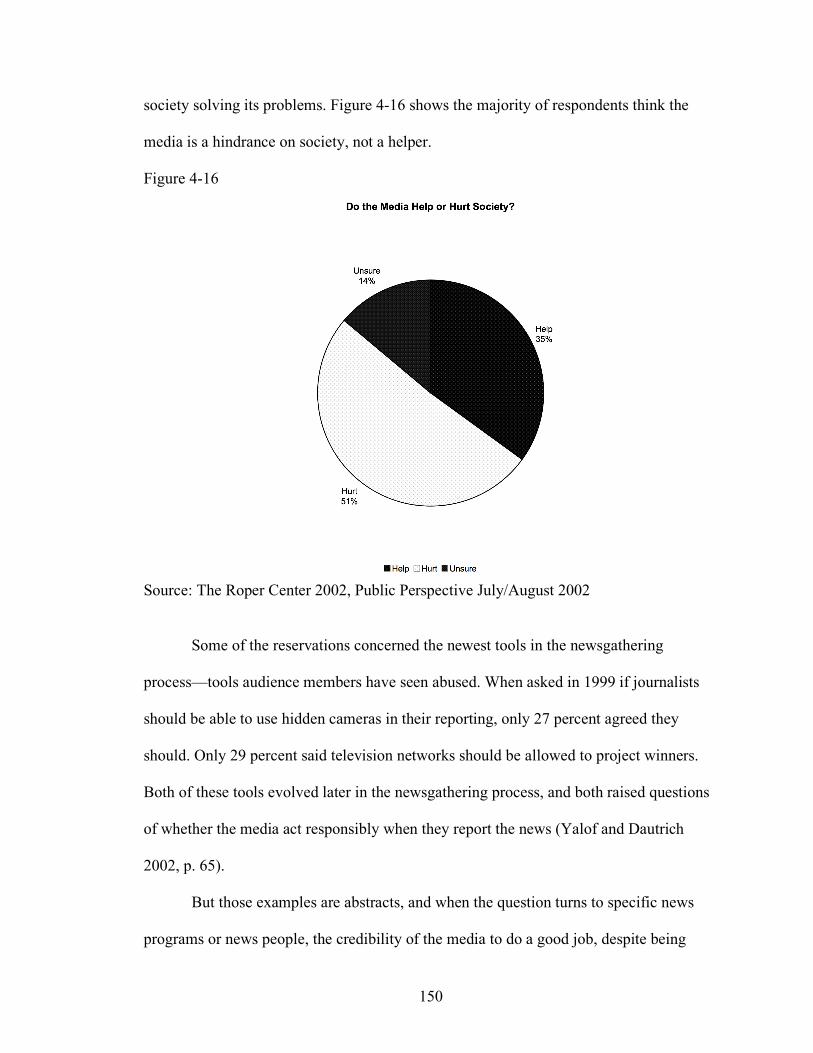
150
society solving its problems. Figure 4-16 shows the majority of respondents think the
media is a hindrance on society, not a helper.
Figure 4-16
Source: The Roper Center 2002, Public Perspective July/August 2002
Some of the reservations concerned the newest tools in the newsgathering
process—tools audience members have seen abused. When asked in 1999 if journalists
should be able to use hidden cameras in their reporting, only 27 percent agreed they
should. Only 29 percent said television networks should be allowed to project winners.
Both of these tools evolved later in the newsgathering process, and both raised questions
of whether the media act responsibly when they report the news (Yalof and Dautrich
2002, p. 65).
But those examples are abstracts, and when the question turns to specific news
programs or news people, the credibility of the media to do a good job, despite being
151
critical of those in power goes up considerably. Robinson and Kohut (1988) examined
Roper poll data to find that the audience for television news held the “hard” news
program in high regard and believability. The authors found both the personality of the
news presenter, as well as the reputation of the organization that employs that presenter
were factors in that trust. Still, that personal nature of trust in journalists and their
practices can turn in an instant, when those personal practices are revealed as distasteful
to the audience. Fallows (1996) relays the episode of the television program Ethics in
America on which television news anchors Peter Jennings and Mike Wallace were asked
a hypothetical question of what they would do if they were with a group of enemy
soldiers who happened to come upon a traveling group of American troops. When asked
if they would warn the Americans, Jennings at first said he would, but changed his
answer when Wallace emphatically declared that a shouted warning was not part of this
obligation as a reporter—that he was there to cover the story, nothing more (Fallows
1996, pp. 10-6). The answer shocked the military men in attendance, the moderator, and
clearly a great many people watching at home. The seeming lack of patriotism on the part
of Wallace (and later Jennings) was unthinkable to many of the viewers of the program. It
shook their trust in the personalities that bring them the news, as well as the structure of
newsgathering itself.
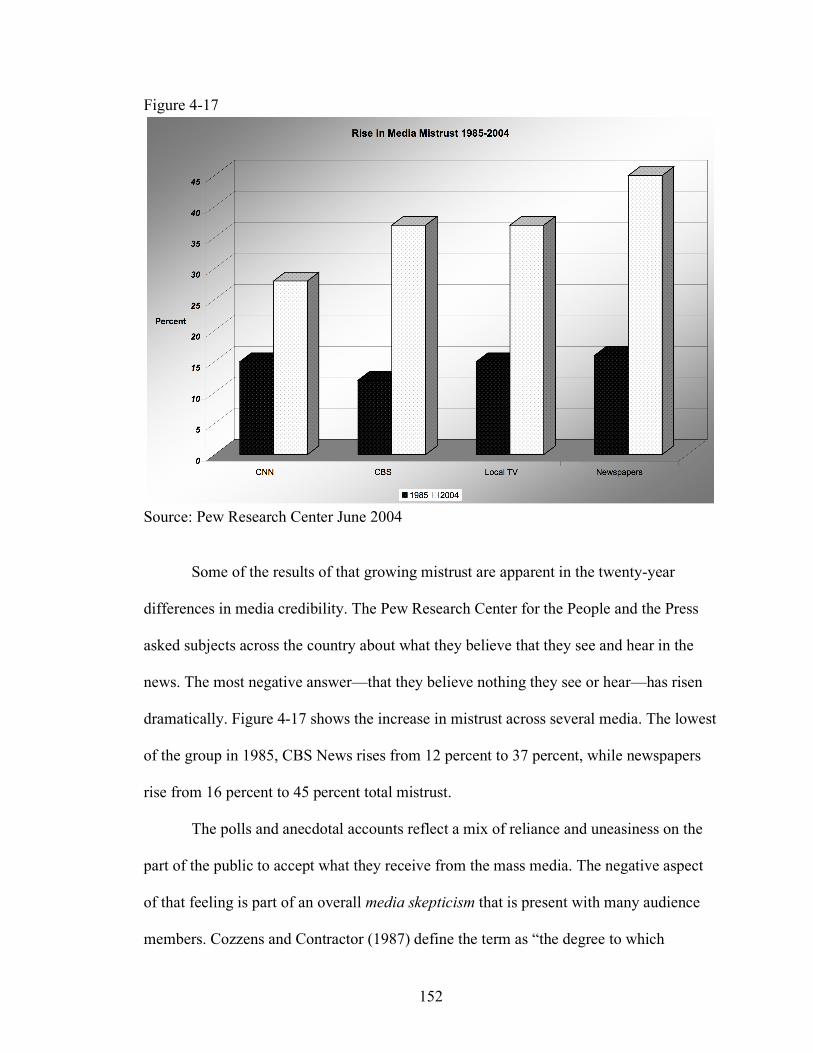
152
Figure 4-17
Source: Pew Research Center June 2004
Some of the results of that growing mistrust are apparent in the twenty-year
differences in media credibility. The Pew Research Center for the People and the Press
asked subjects across the country about what they believe that they see and hear in the
news. The most negative answer—that they believe nothing they see or hear—has risen
dramatically. Figure 4-17 shows the increase in mistrust across several media. The lowest
of the group in 1985, CBS News rises from 12 percent to 37 percent, while newspapers
rise from 16 percent to 45 percent total mistrust.
The polls and anecdotal accounts reflect a mix of reliance and uneasiness on the
part of the public to accept what they receive from the mass media. The negative aspect
of that feeling is part of an overall media skepticism that is present with many audience
members. Cozzens and Contractor (1987) define the term as “the degree to which
153
individuals are skeptical toward the reality presented in the mass media” (Cozzens and
Contractor 1987, p. 438). Those authors see this skepticism building over time through
the maturation of the individual, and a tendency to take on the ability to discount all they
see as reality. In addition, as audience members learn the economic and political motives
of the media, they become more skeptical of the reality of what is presented versus what
could be gained by altering that reality. Finally, conflicts between their own personal
experiences and the experiences they see related in the media cause dissonance in their
belief structure (Cozzens and Contractor 1987, p. 439). That last factor bears directly on
the credibility of the media when reporting political stories. If an audience member’s
personal experience with a candidate or issue differs from the way that candidate or issue
is portrayed in the media, the dissonance is not likely to lead to opinion change in the
audience members. Instead, it adds to the skepticism that audience member has about the
mediator of the information. Gunther (1988) suggested that strong feelings about an issue
might increase interest and lower credibility even further, but Stamm and Dube (1994)
discounted that contention. Still, Gunter suggests that even a discounted media could
have some bearing on public opinion. He depicts an audience member who has
discounted media credibility, yet still see reports done there as either having a persuasive
third-person effect on others, or mirroring public opinion of the others around her (Gunter
1998, p. 499).
The pressure is on for the traditional news media to maintain credibility and
reduce media skepticism to a bare minimum. New media information sources are gaining
in credibility as they reach more audience members and provide less dissonance with
regards to their political points of view. Tsfati and Cappella (2003) suggest the trust is
154
gone from mainstream news and that many who consume it do so only because the new
media is not available in the style or quantity they require (Tsfati and Cappella 2003, p.
519). The Pew Internet and American Life Project (2002) asked people if they were
watching television for their news. Figure 4-18 shows that young people are increasingly
not interested in television as a news source.
But the styles are multiplying, as is the quantity of alternatives available, meaning
the mainstream media needs to address its crisis of credibility before it becomes the
second choice for most audiences. Kurtz (2005) sees the arrival of the “blog” (short for
web log, an online diary often focused on politics), as a replacement for traditional
political reporting. And Sutter (2001) likens the liberal media to a cartel—successful in
part because its members are limited in number by the costs of entering the business.
Should the cost go down, as they are with new media possibilities, then the cartel may
cease to exist (Sutter 2001, p. 449).
The crisis of credibility holds the key to the future for the journalist model
developed a century ago. Conservatives predict a “meltdown” of a media that is too
liberal to provide the information the public needs (Bozell 2004, p. 259). Liberals fear a
return to the partisan press of old. The words, images, and actions of today’s media will
decide which comes to pass.
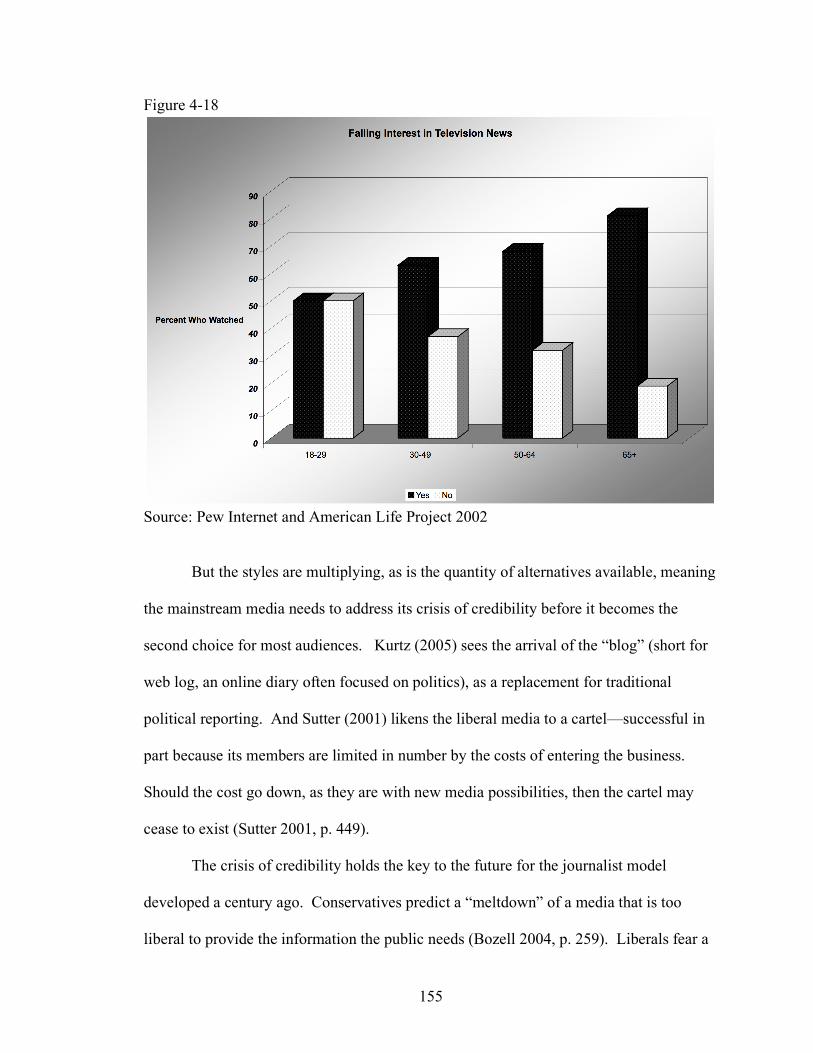
155
Figure 4-18
Source: Pew Internet and American Life Project 2002
But the styles are multiplying, as is the quantity of alternatives available, meaning
the mainstream media needs to address its crisis of credibility before it becomes the
second choice for most audiences. Kurtz (2005) sees the arrival of the “blog” (short for
web log, an online diary often focused on politics), as a replacement for traditional
political reporting. And Sutter (2001) likens the liberal media to a cartel—successful in
part because its members are limited in number by the costs of entering the business.
Should the cost go down, as they are with new media possibilities, then the cartel may
cease to exist (Sutter 2001, p. 449).
The crisis of credibility holds the key to the future for the journalist model
developed a century ago. Conservatives predict a “meltdown” of a media that is too
liberal to provide the information the public needs (Bozell 2004, p. 259). Liberals fear a
156
return to the partisan press of old. The words, images, and actions of today’s media will
decide which comes to pass. And certainly a part of what makes up that decision will
depend on the audience perceptions of their individual newscasters and their professional
conduct on the air and on the job. One question to be answered is how far those
journalists can go in expressing their personal ideology and convictions before those
professional standards can no longer maintain an air of fairness and unbiasedness.
157
Chapter 5: Determinants of Subject Appropriateness and Measurement
Missouri voters seem to behave much like the American electorate in general.
Consider these results for presidential elections in the 20th and 21st centuries:
• Of the 26 presidential elections held, Missouri supported the Republican candidate 13 times and the Democratic candidate 13 times—an even split.
• Missourians supported the winning presidential candidate in 25 of 26 election.
Only in 1956 did the state not pick the winner, voting instead to unseat incumbent Dwight Eisenhower in favor of Democrat Adlai Stevenson.
• The longest run for any party was five elections, with Democrat Franklin D.
Roosevelt winning all four of his elections in Missouri, followed by favorite son Harry S Truman. Republicans won three elections in a row twice—once from 1920 through 1928, and again in the Reagan-Bush years from 1980 through 1988.
Missouri boasts the best record in the country as a bellwether for the electoral
tendencies of other forty-nine. And Missourians are often proud to point to the overall
ability of its citizens to act as stand-ins for the rest of the nation. Missouri is described as
a mix of north, south, east, and west, with racial and other demographic descriptors that
reflect America as a whole (Suellentrop 2004). That mix provides the perfect setting in
which to conduct a study that explores the perceptions of television news viewers,
themselves a mix of all demographic characteristics. It is desirable to test assumptions of
media effects on an audience that consists of representative individuals who have lived
through a controversy over what is the appropriate role of the media in a time of crisis.
And that representative nature to the audience makes the results of the study more
generalizable to other regions and the nation as a whole.
Likewise, Boone County is a microcosm of Missouri, bringing together the
diverse elements of rural and urban, highly educated and not, left and right, to form a tiny
cross section of the nation’s political strata. Beginning with their historic roots, both the
158
county and the state have proved to be fairly representative of the how the rest of the
country views politics. And demographic analysis shows the county in particular
strongly mirrors the much larger U. S. constituency in many ways.
Historical Roots of Centrality
The state’s demographic centrality springs, in fact, from its geographic location.
Missouri’s beginnings as a gateway to western exploration, trade, and settlement brought
immigrants from across the globe. Under Spanish and French rule, the territory
prospered. Early Americans made their way to the area as well, bringing their diverse
ethnic and political backgrounds (McReynolds 1962, pp. 13-28). After becoming a state
in 1821, Missouri maintained its position balanced between east and west, but also
between north and south. In the civil war period, Missouri exemplified the “border state,”
with neighbors and even family members fighting against each other (Karsch 1956, p.
40).
Missouri’s political character was set in Civil War times. Those who sided with
the north and Abraham Lincoln were Republicans. Those wore the gray of the South
were Democrats. In Missouri state government, parties shifted power back and forth in
the seventy years following the Civil War, until Democrats gained power and held it well
into the 1970s (Leuthold 1994, pp. 2-3). Republicans gained ground through the rest of
the century, and took complete control of state government in 2005 (Wagar 2005, p. A1).
Under the umbrella of Missouri’s changing political face, there are distinct
regions that maintain distinct party leanings. The cities of St. Louis and Kansas City
remain heavily Democratic, while the southwestern part of the state is staunchly
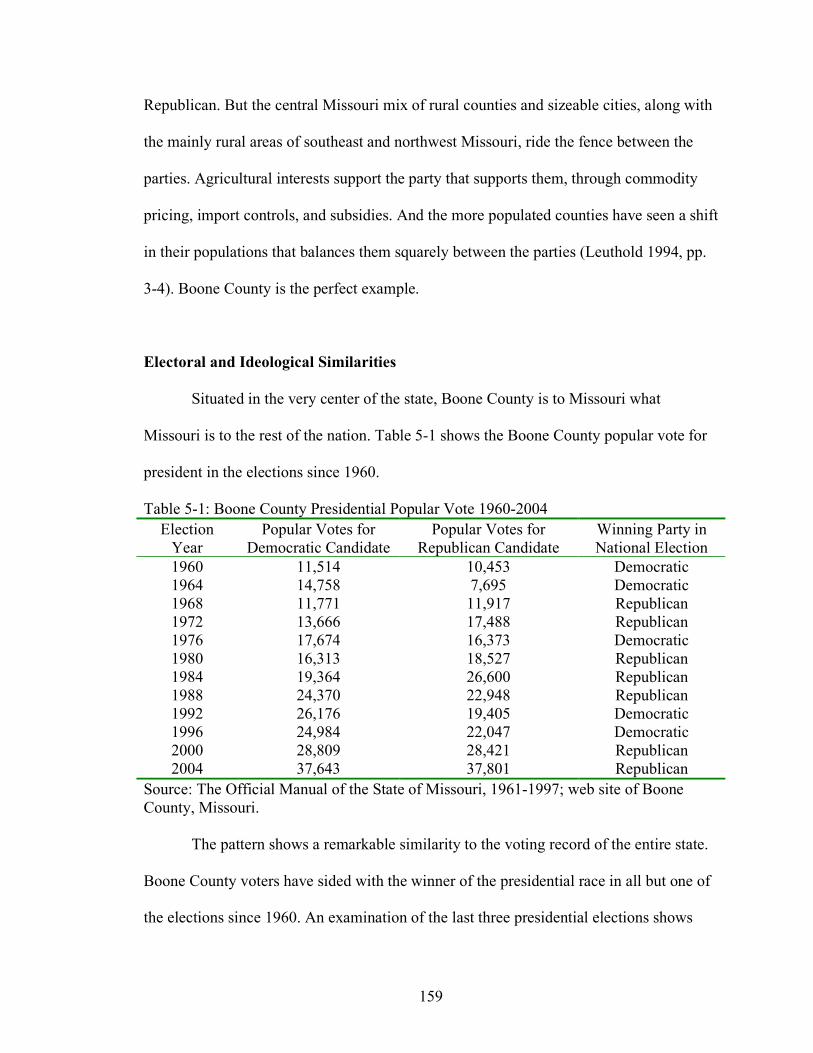
159
Republican. But the central Missouri mix of rural counties and sizeable cities, along with
the mainly rural areas of southeast and northwest Missouri, ride the fence between the
parties. Agricultural interests support the party that supports them, through commodity
pricing, import controls, and subsidies. And the more populated counties have seen a shift
in their populations that balances them squarely between the parties (Leuthold 1994, pp.
3-4). Boone County is the perfect example.
Electoral and Ideological Similarities
Situated in the very center of the state, Boone County is to Missouri what
Missouri is to the rest of the nation. Table 5-1 shows the Boone County popular vote for
president in the elections since 1960.
Table 5-1: Boone County Presidential Popular Vote 1960-2004 Election
Year Popular Votes for
Democratic Candidate Popular Votes for
Republican Candidate Winning Party in National Election
1960 11,514 10,453 Democratic 1964 14,758 7,695 Democratic 1968 11,771 11,917 Republican 1972 13,666 17,488 Republican 1976 17,674 16,373 Democratic 1980 16,313 18,527 Republican 1984 19,364 26,600 Republican 1988 24,370 22,948 Republican 1992 26,176 19,405 Democratic 1996 24,984 22,047 Democratic 2000 28,809 28,421 Republican 2004 37,643 37,801 Republican
Source: The Official Manual of the State of Missouri, 1961-1997; web site of Boone County, Missouri. The pattern shows a remarkable similarity to the voting record of the entire state.
Boone County voters have sided with the winner of the presidential race in all but one of
the elections since 1960. An examination of the last three presidential elections shows
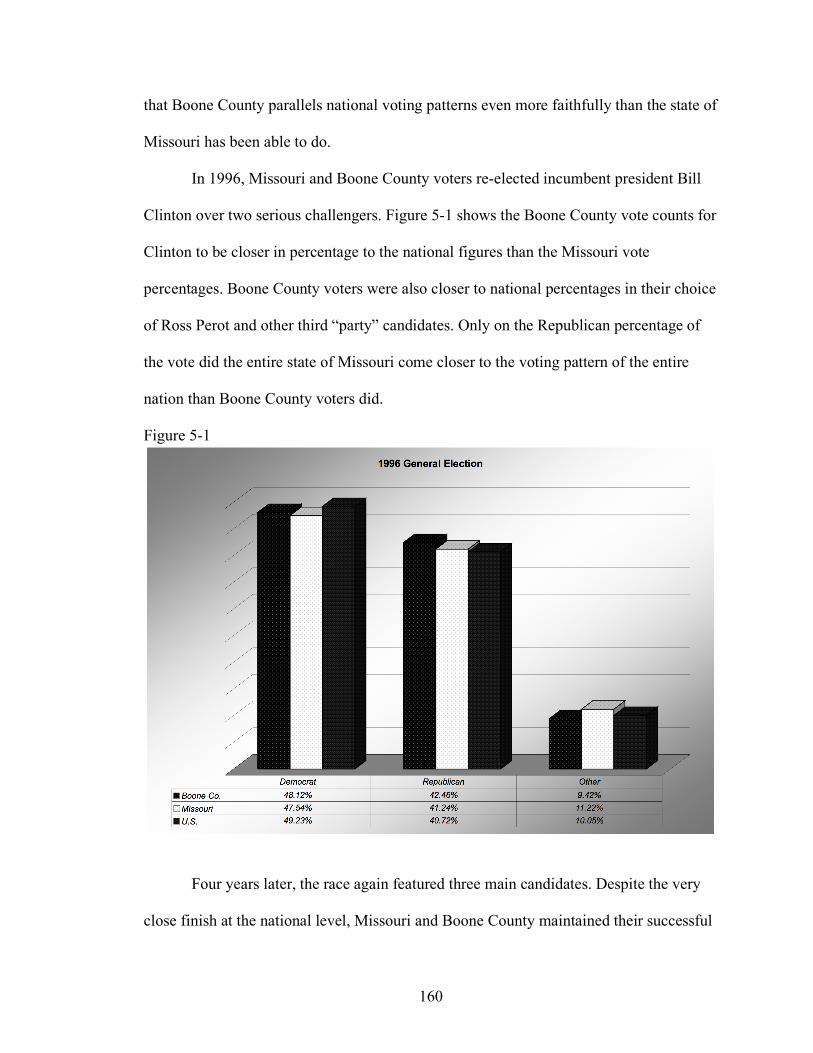
160
that Boone County parallels national voting patterns even more faithfully than the state of
Missouri has been able to do.
In 1996, Missouri and Boone County voters re-elected incumbent president Bill
Clinton over two serious challengers. Figure 5-1 shows the Boone County vote counts for
Clinton to be closer in percentage to the national figures than the Missouri vote
percentages. Boone County voters were also closer to national percentages in their choice
of Ross Perot and other third “party” candidates. Only on the Republican percentage of
the vote did the entire state of Missouri come closer to the voting pattern of the entire
nation than Boone County voters did.
Figure 5-1
Four years later, the race again featured three main candidates. Despite the very
close finish at the national level, Missouri and Boone County maintained their successful
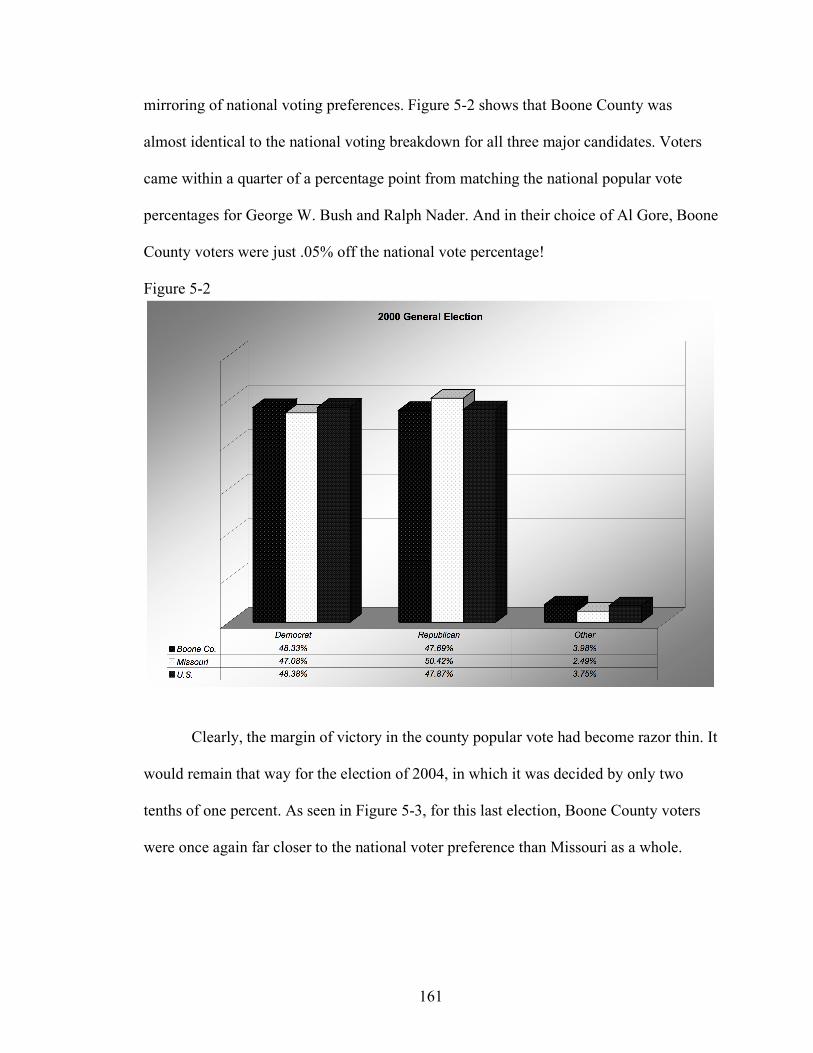
161
mirroring of national voting preferences. Figure 5-2 shows that Boone County was
almost identical to the national voting breakdown for all three major candidates. Voters
came within a quarter of a percentage point from matching the national popular vote
percentages for George W. Bush and Ralph Nader. And in their choice of Al Gore, Boone
County voters were just .05% off the national vote percentage!
Figure 5-2
Clearly, the margin of victory in the county popular vote had become razor thin. It
would remain that way for the election of 2004, in which it was decided by only two
tenths of one percent. As seen in Figure 5-3, for this last election, Boone County voters
were once again far closer to the national voter preference than Missouri as a whole.
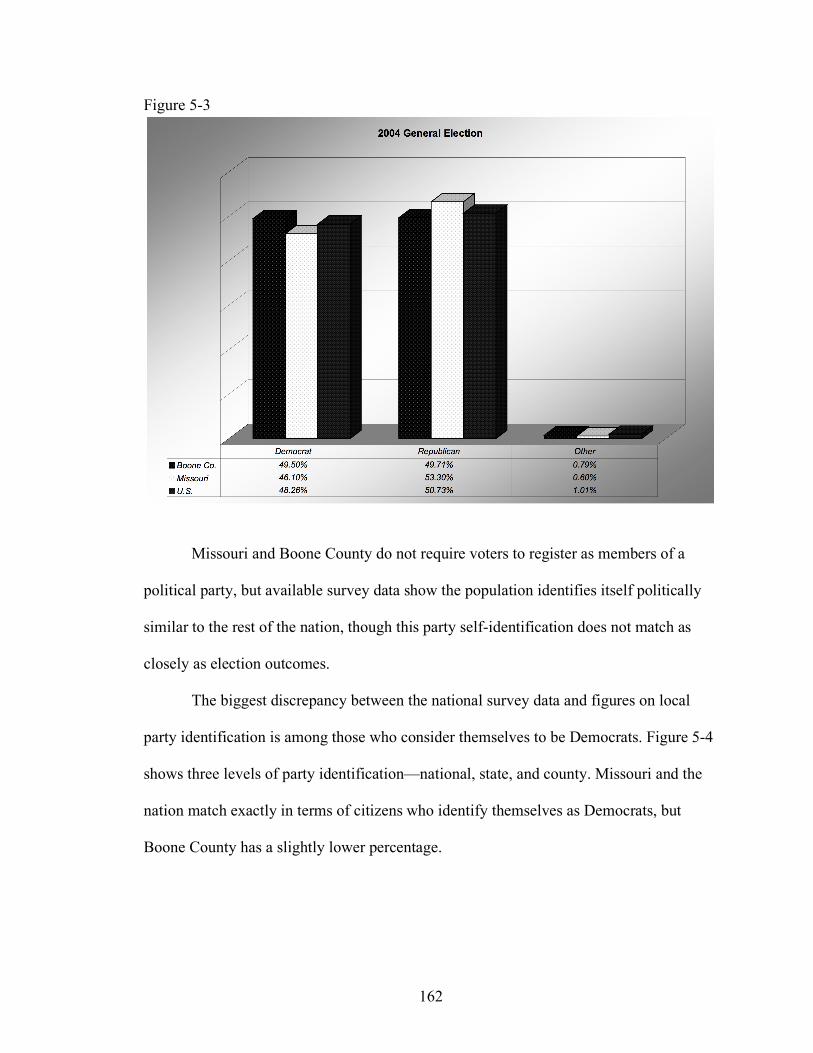
162
Figure 5-3
Missouri and Boone County do not require voters to register as members of a
political party, but available survey data show the population identifies itself politically
similar to the rest of the nation, though this party self-identification does not match as
closely as election outcomes.
The biggest discrepancy between the national survey data and figures on local
party identification is among those who consider themselves to be Democrats. Figure 5-4
shows three levels of party identification—national, state, and county. Missouri and the
nation match exactly in terms of citizens who identify themselves as Democrats, but
Boone County has a slightly lower percentage.
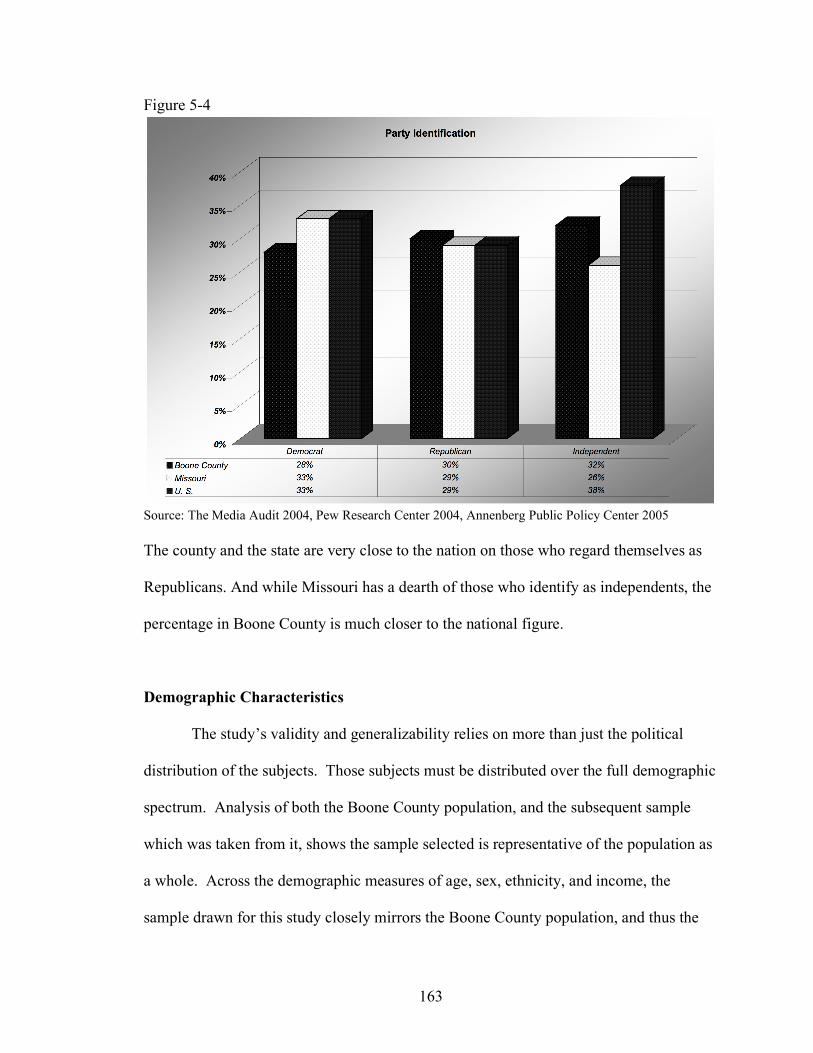
163
Figure 5-4
Source: The Media Audit 2004, Pew Research Center 2004, Annenberg Public Policy Center 2005 The county and the state are very close to the nation on those who regard themselves as
Republicans. And while Missouri has a dearth of those who identify as independents, the
percentage in Boone County is much closer to the national figure.
Demographic Characteristics
The study’s validity and generalizability relies on more than just the political
distribution of the subjects. Those subjects must be distributed over the full demographic
spectrum. Analysis of both the Boone County population, and the subsequent sample
which was taken from it, shows the sample selected is representative of the population as
a whole. Across the demographic measures of age, sex, ethnicity, and income, the
sample drawn for this study closely mirrors the Boone County population, and thus the
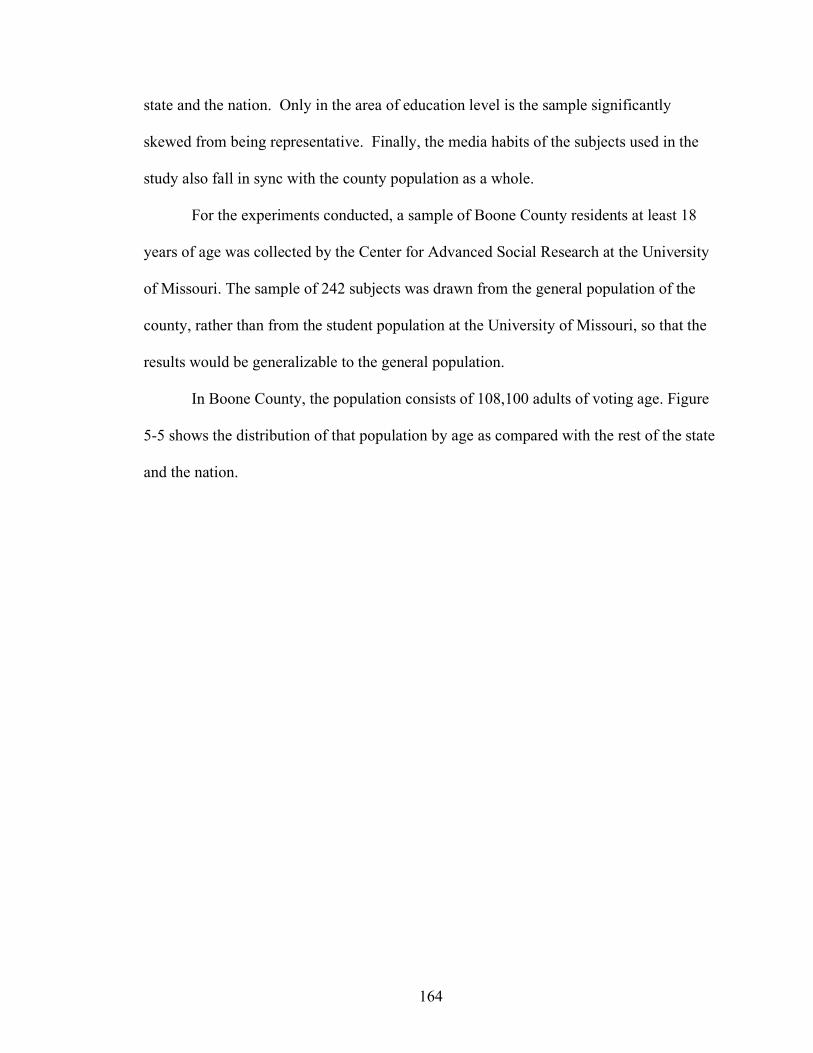
164
state and the nation. Only in the area of education level is the sample significantly
skewed from being representative. Finally, the media habits of the subjects used in the
study also fall in sync with the county population as a whole.
For the experiments conducted, a sample of Boone County residents at least 18
years of age was collected by the Center for Advanced Social Research at the University
of Missouri. The sample of 242 subjects was drawn from the general population of the
county, rather than from the student population at the University of Missouri, so that the
results would be generalizable to the general population.
In Boone County, the population consists of 108,100 adults of voting age. Figure
5-5 shows the distribution of that population by age as compared with the rest of the state
and the nation.
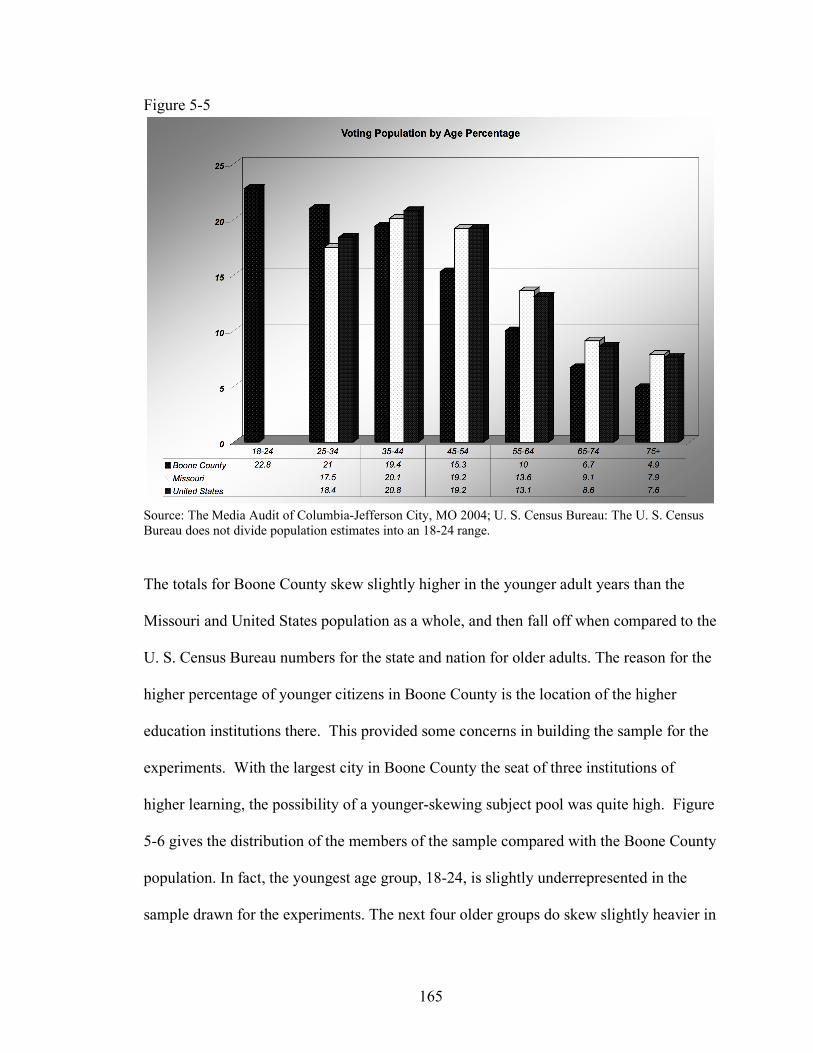
165
Figure 5-5
Source: The Media Audit of Columbia-Jefferson City, MO 2004; U. S. Census Bureau: The U. S. Census Bureau does not divide population estimates into an 18-24 range.
The totals for Boone County skew slightly higher in the younger adult years than the
Missouri and United States population as a whole, and then fall off when compared to the
U. S. Census Bureau numbers for the state and nation for older adults. The reason for the
higher percentage of younger citizens in Boone County is the location of the higher
education institutions there. This provided some concerns in building the sample for the
experiments. With the largest city in Boone County the seat of three institutions of
higher learning, the possibility of a younger-skewing subject pool was quite high. Figure
5-6 gives the distribution of the members of the sample compared with the Boone County
population. In fact, the youngest age group, 18-24, is slightly underrepresented in the
sample drawn for the experiments. The next four older groups do skew slightly heavier in
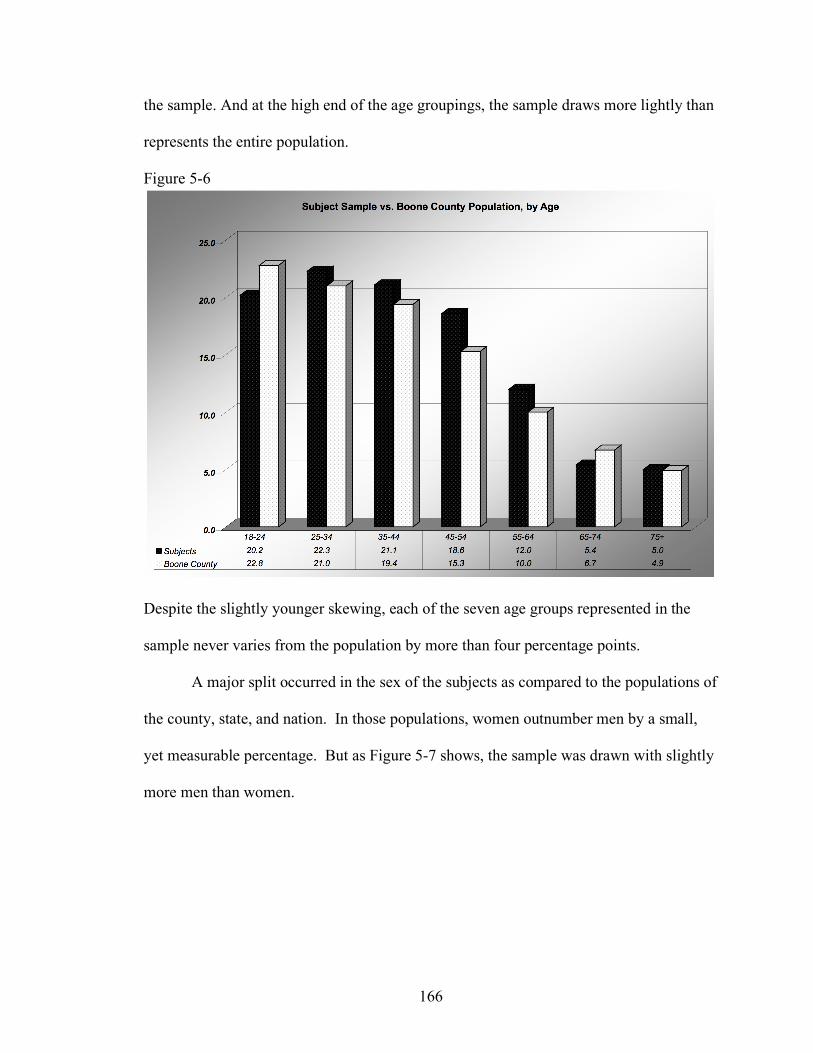
166
the sample. And at the high end of the age groupings, the sample draws more lightly than
represents the entire population.
Figure 5-6
Despite the slightly younger skewing, each of the seven age groups represented in the
sample never varies from the population by more than four percentage points.
A major split occurred in the sex of the subjects as compared to the populations of
the county, state, and nation. In those populations, women outnumber men by a small,
yet measurable percentage. But as Figure 5-7 shows, the sample was drawn with slightly
more men than women.
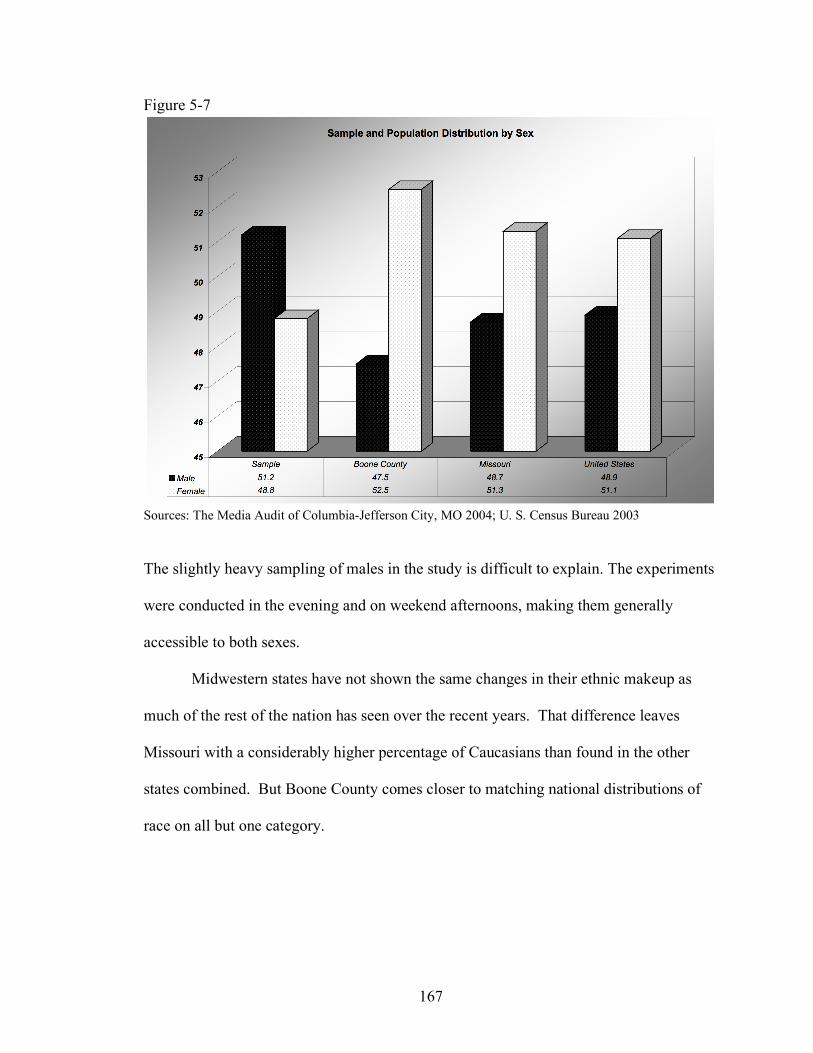
167
Figure 5-7
Sources: The Media Audit of Columbia-Jefferson City, MO 2004; U. S. Census Bureau 2003
The slightly heavy sampling of males in the study is difficult to explain. The experiments
were conducted in the evening and on weekend afternoons, making them generally
accessible to both sexes.
Midwestern states have not shown the same changes in their ethnic makeup as
much of the rest of the nation has seen over the recent years. That difference leaves
Missouri with a considerably higher percentage of Caucasians than found in the other
states combined. But Boone County comes closer to matching national distributions of
race on all but one category.
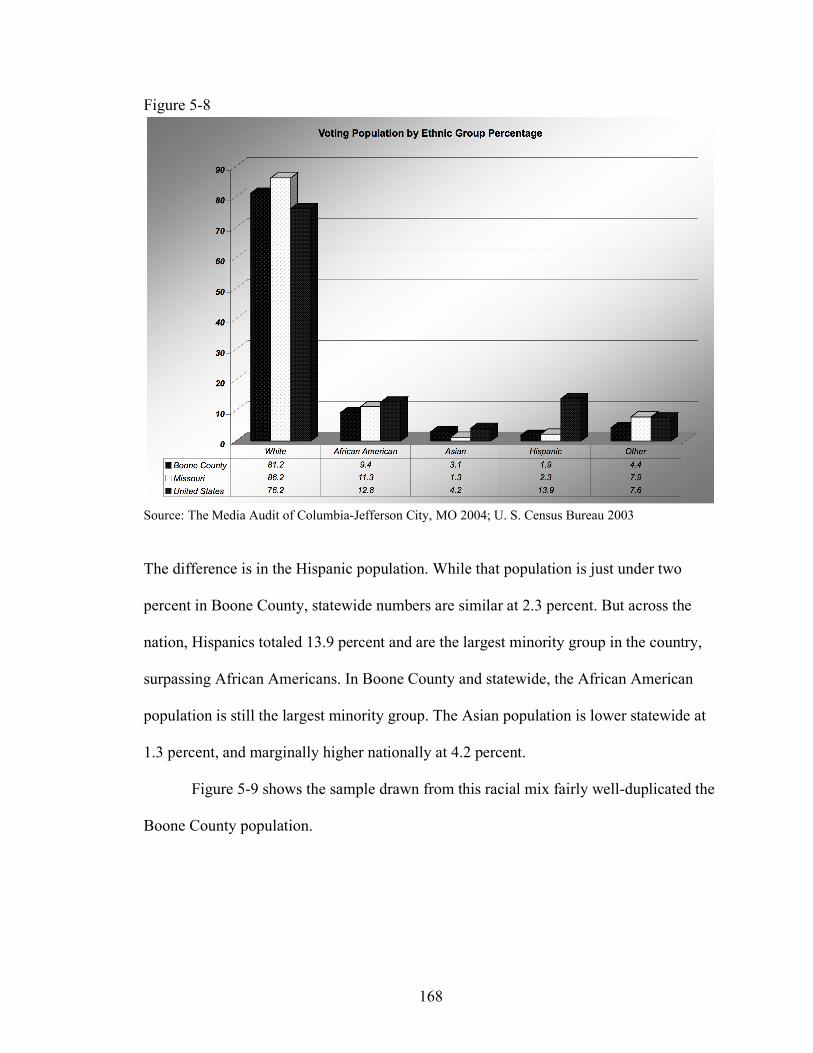
168
Figure 5-8
Source: The Media Audit of Columbia-Jefferson City, MO 2004; U. S. Census Bureau 2003
The difference is in the Hispanic population. While that population is just under two
percent in Boone County, statewide numbers are similar at 2.3 percent. But across the
nation, Hispanics totaled 13.9 percent and are the largest minority group in the country,
surpassing African Americans. In Boone County and statewide, the African American
population is still the largest minority group. The Asian population is lower statewide at
1.3 percent, and marginally higher nationally at 4.2 percent.
Figure 5-9 shows the sample drawn from this racial mix fairly well-duplicated the
Boone County population.
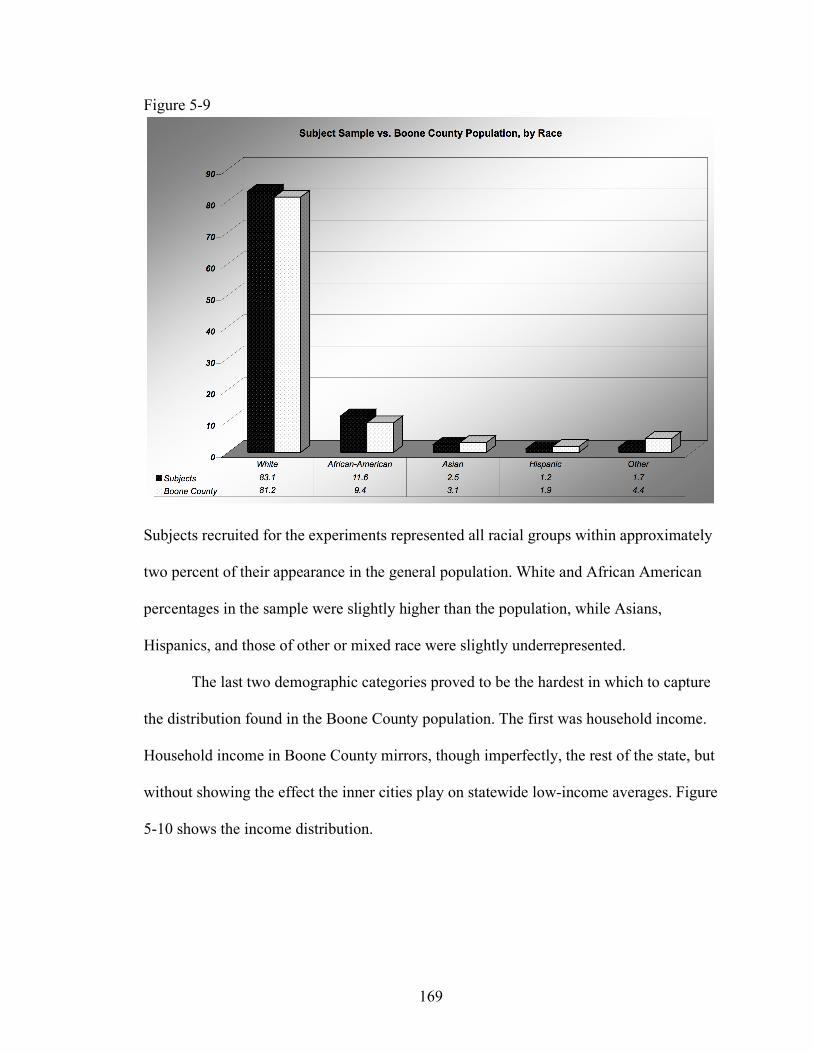
169
Figure 5-9
Subjects recruited for the experiments represented all racial groups within approximately
two percent of their appearance in the general population. White and African American
percentages in the sample were slightly higher than the population, while Asians,
Hispanics, and those of other or mixed race were slightly underrepresented.
The last two demographic categories proved to be the hardest in which to capture
the distribution found in the Boone County population. The first was household income.
Household income in Boone County mirrors, though imperfectly, the rest of the state, but
without showing the effect the inner cities play on statewide low-income averages. Figure
5-10 shows the income distribution.
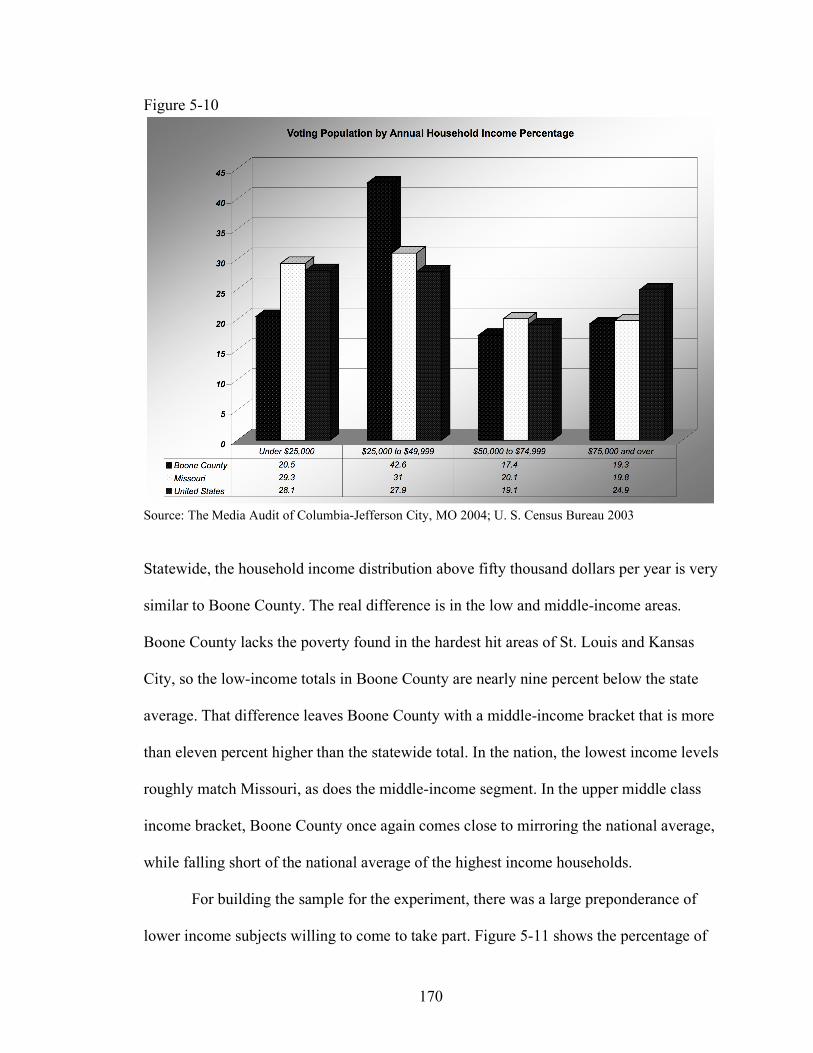
170
Figure 5-10
Source: The Media Audit of Columbia-Jefferson City, MO 2004; U. S. Census Bureau 2003
Statewide, the household income distribution above fifty thousand dollars per year is very
similar to Boone County. The real difference is in the low and middle-income areas.
Boone County lacks the poverty found in the hardest hit areas of St. Louis and Kansas
City, so the low-income totals in Boone County are nearly nine percent below the state
average. That difference leaves Boone County with a middle-income bracket that is more
than eleven percent higher than the statewide total. In the nation, the lowest income levels
roughly match Missouri, as does the middle-income segment. In the upper middle class
income bracket, Boone County once again comes close to mirroring the national average,
while falling short of the national average of the highest income households.
For building the sample for the experiment, there was a large preponderance of
lower income subjects willing to come to take part. Figure 5-11 shows the percentage of
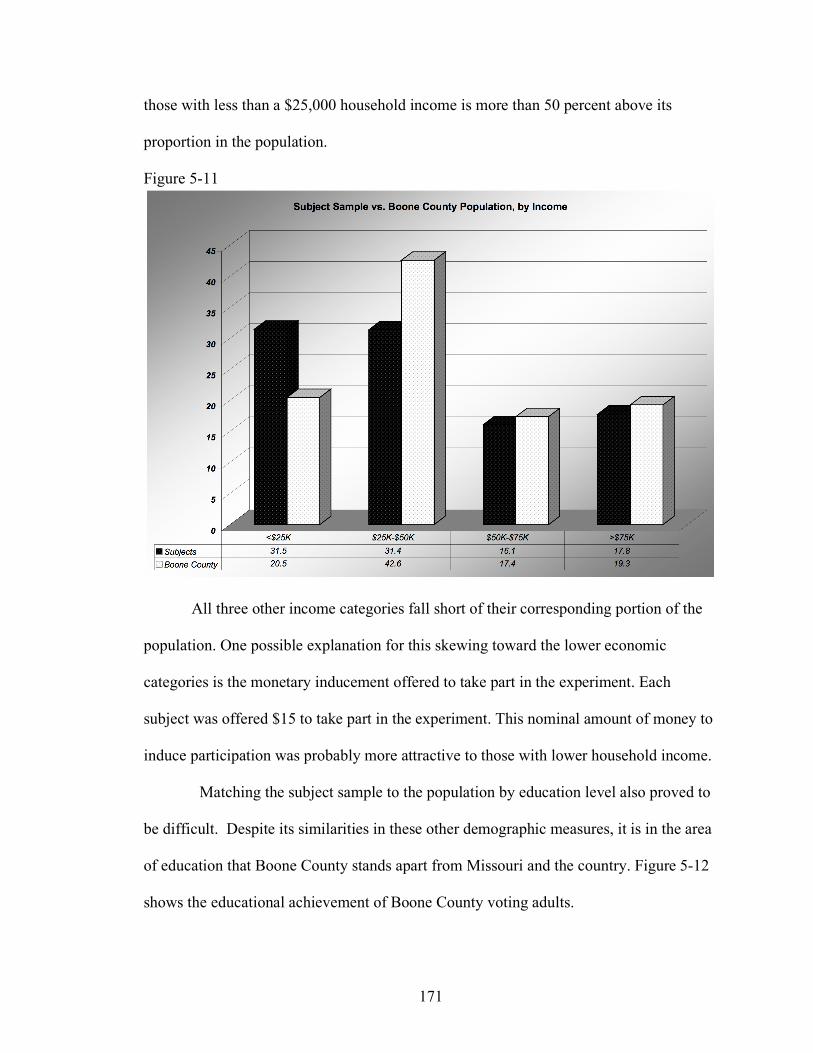
171
those with less than a $25,000 household income is more than 50 percent above its
proportion in the population.
Figure 5-11
All three other income categories fall short of their corresponding portion of the
population. One possible explanation for this skewing toward the lower economic
categories is the monetary inducement offered to take part in the experiment. Each
subject was offered $15 to take part in the experiment. This nominal amount of money to
induce participation was probably more attractive to those with lower household income.
Matching the subject sample to the population by education level also proved to
be difficult. Despite its similarities in these other demographic measures, it is in the area
of education that Boone County stands apart from Missouri and the country. Figure 5-12
shows the educational achievement of Boone County voting adults.
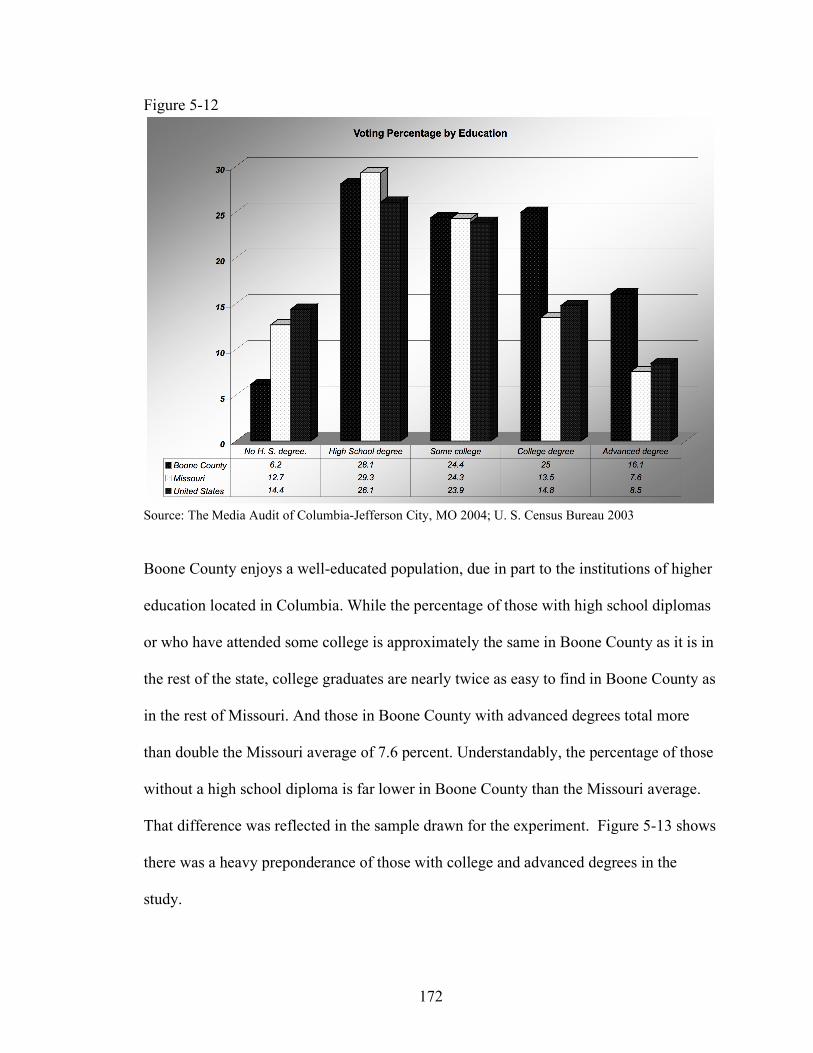
172
Figure 5-12
Source: The Media Audit of Columbia-Jefferson City, MO 2004; U. S. Census Bureau 2003
Boone County enjoys a well-educated population, due in part to the institutions of higher
education located in Columbia. While the percentage of those with high school diplomas
or who have attended some college is approximately the same in Boone County as it is in
the rest of the state, college graduates are nearly twice as easy to find in Boone County as
in the rest of Missouri. And those in Boone County with advanced degrees total more
than double the Missouri average of 7.6 percent. Understandably, the percentage of those
without a high school diploma is far lower in Boone County than the Missouri average.
That difference was reflected in the sample drawn for the experiment. Figure 5-13 shows
there was a heavy preponderance of those with college and advanced degrees in the
study.
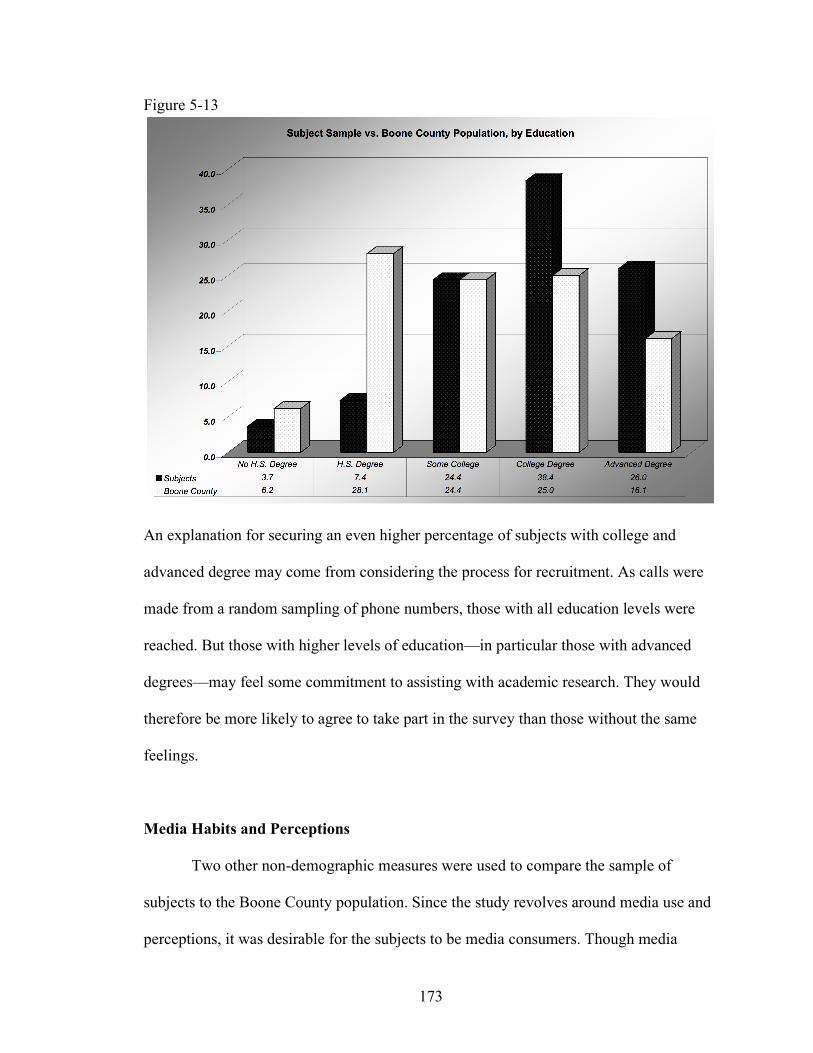
173
Figure 5-13
An explanation for securing an even higher percentage of subjects with college and
advanced degree may come from considering the process for recruitment. As calls were
made from a random sampling of phone numbers, those with all education levels were
reached. But those with higher levels of education—in particular those with advanced
degrees—may feel some commitment to assisting with academic research. They would
therefore be more likely to agree to take part in the survey than those without the same
feelings.
Media Habits and Perceptions
Two other non-demographic measures were used to compare the sample of
subjects to the Boone County population. Since the study revolves around media use and
perceptions, it was desirable for the subjects to be media consumers. Though media
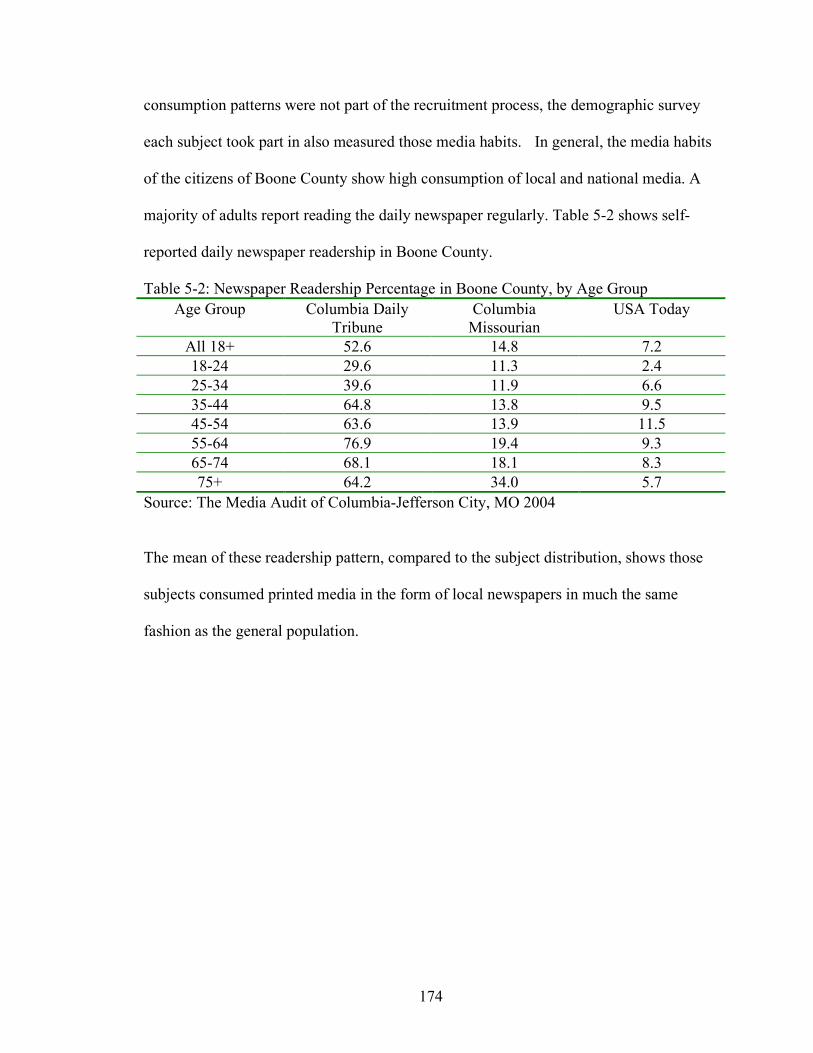
174
consumption patterns were not part of the recruitment process, the demographic survey
each subject took part in also measured those media habits. In general, the media habits
of the citizens of Boone County show high consumption of local and national media. A
majority of adults report reading the daily newspaper regularly. Table 5-2 shows self-
reported daily newspaper readership in Boone County.
Table 5-2: Newspaper Readership Percentage in Boone County, by Age Group Age Group Columbia Daily
Tribune Columbia
Missourian USA Today
All 18+ 52.6 14.8 7.2 18-24 29.6 11.3 2.4 25-34 39.6 11.9 6.6 35-44 64.8 13.8 9.5 45-54 63.6 13.9 11.5 55-64 76.9 19.4 9.3 65-74 68.1 18.1 8.3 75+ 64.2 34.0 5.7
Source: The Media Audit of Columbia-Jefferson City, MO 2004
The mean of these readership pattern, compared to the subject distribution, shows those
subjects consumed printed media in the form of local newspapers in much the same
fashion as the general population.
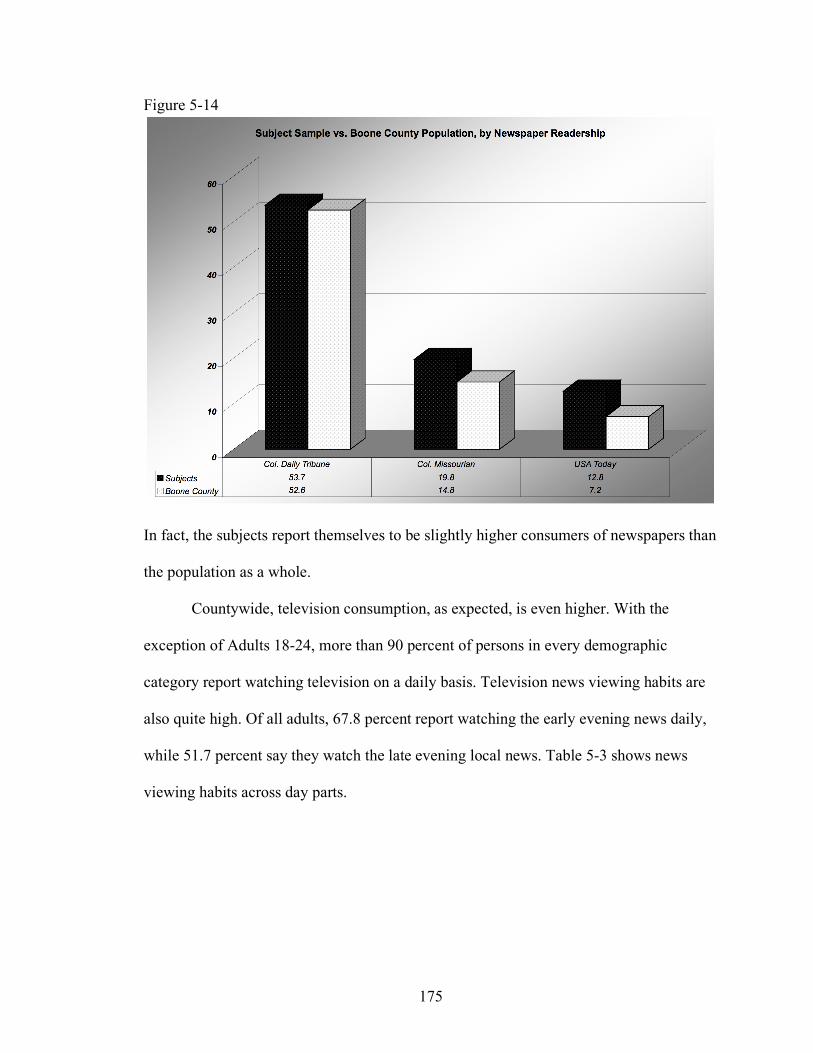
175
Figure 5-14
In fact, the subjects report themselves to be slightly higher consumers of newspapers than
the population as a whole.
Countywide, television consumption, as expected, is even higher. With the
exception of Adults 18-24, more than 90 percent of persons in every demographic
category report watching television on a daily basis. Television news viewing habits are
also quite high. Of all adults, 67.8 percent report watching the early evening news daily,
while 51.7 percent say they watch the late evening local news. Table 5-3 shows news
viewing habits across day parts.
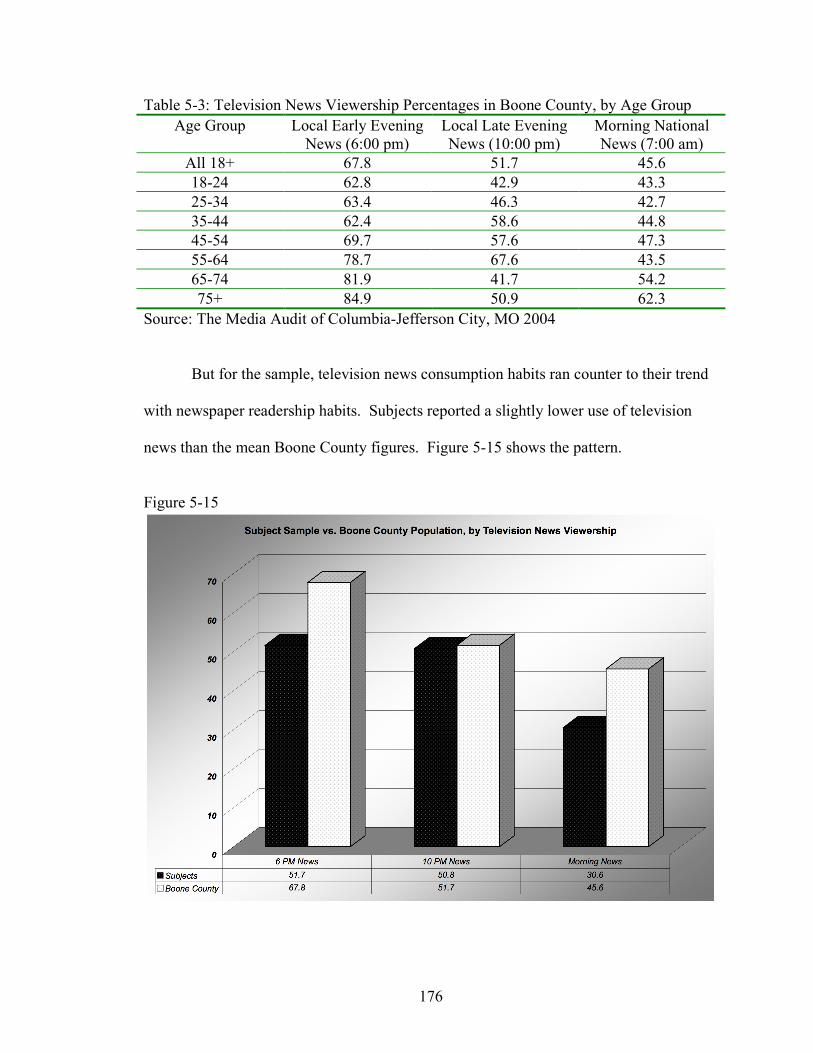
176
Table 5-3: Television News Viewership Percentages in Boone County, by Age Group Age Group Local Early Evening
News (6:00 pm) Local Late Evening News (10:00 pm)
Morning National News (7:00 am)
All 18+ 67.8 51.7 45.6 18-24 62.8 42.9 43.3 25-34 63.4 46.3 42.7 35-44 62.4 58.6 44.8 45-54 69.7 57.6 47.3 55-64 78.7 67.6 43.5 65-74 81.9 41.7 54.2 75+ 84.9 50.9 62.3
Source: The Media Audit of Columbia-Jefferson City, MO 2004
But for the sample, television news consumption habits ran counter to their trend
with newspaper readership habits. Subjects reported a slightly lower use of television
news than the mean Boone County figures. Figure 5-15 shows the pattern.
Figure 5-15
177
The subjects were only asked, however, about three particular news viewing times—two
local and one national. These times match those asked in the Media Audit data, but do not
capture other local or national news viewing times. It is also possible that the higher
education level of the subjects participating in the study makes them less likely to watch
television and more likely to read for news and entertainment.
With those viewing and reading habits in mind, how do these subjects assess the
job the media do for their audiences? That question leads to a new variable that will
ultimately test the hypotheses presented herein. In building an overall index of media
confidence, it is necessary to use divergent sources of data on how the media are
perceived by readers and viewers.
Media Trust Index
Just as they collect demographic information with which we can better understand
the voting and policy preferences citizens develop, large studies in political behavior
often collect information about subject attitudes toward the media. The questions ask
subjects to rate the media in terms of their fairness, their accuracy, and their balance in
covering the issues. Some ask specifically about political issues, some ask the questions
in a more general sense. It is possible, through the combination of the data generated by
the major polling organization’s media questions, to develop an overall barometer of the
attitudes of the public toward the news media. This “media trust index” is useful in
measuring changes in attitudes toward the media over time—including an experimental
interval.
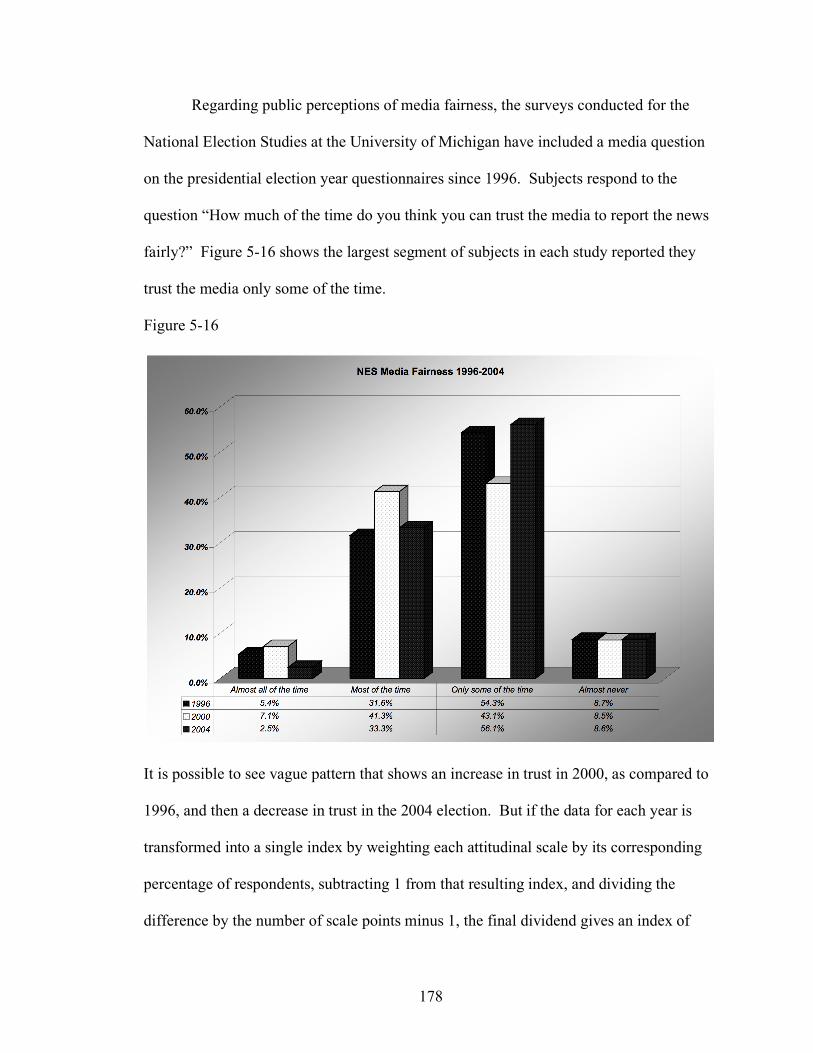
178
Regarding public perceptions of media fairness, the surveys conducted for the
National Election Studies at the University of Michigan have included a media question
on the presidential election year questionnaires since 1996. Subjects respond to the
question “How much of the time do you think you can trust the media to report the news
fairly?” Figure 5-16 shows the largest segment of subjects in each study reported they
trust the media only some of the time.
Figure 5-16
It is possible to see vague pattern that shows an increase in trust in 2000, as compared to
1996, and then a decrease in trust in the 2004 election. But if the data for each year is
transformed into a single index by weighting each attitudinal scale by its corresponding
percentage of respondents, subtracting 1 from that resulting index, and dividing the
difference by the number of scale points minus 1, the final dividend gives an index of
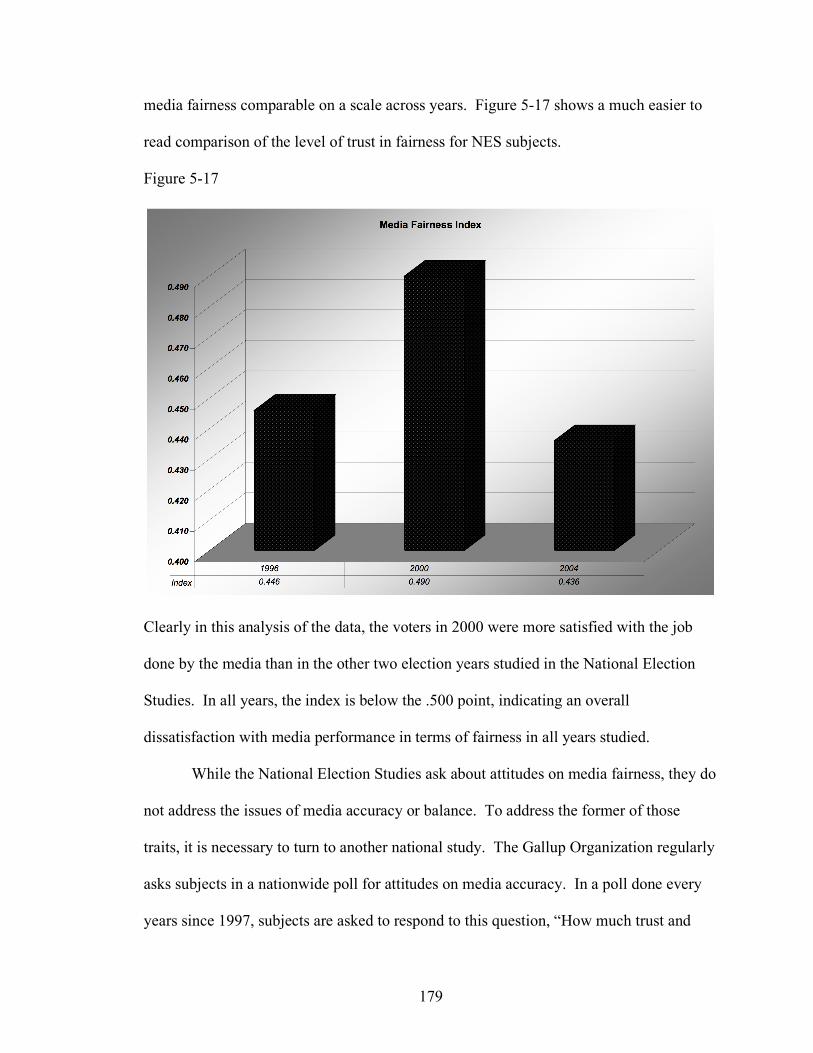
179
media fairness comparable on a scale across years. Figure 5-17 shows a much easier to
read comparison of the level of trust in fairness for NES subjects.
Figure 5-17
Clearly in this analysis of the data, the voters in 2000 were more satisfied with the job
done by the media than in the other two election years studied in the National Election
Studies. In all years, the index is below the .500 point, indicating an overall
dissatisfaction with media performance in terms of fairness in all years studied.
While the National Election Studies ask about attitudes on media fairness, they do
not address the issues of media accuracy or balance. To address the former of those
traits, it is necessary to turn to another national study. The Gallup Organization regularly
asks subjects in a nationwide poll for attitudes on media accuracy. In a poll done every
years since 1997, subjects are asked to respond to this question, “How much trust and
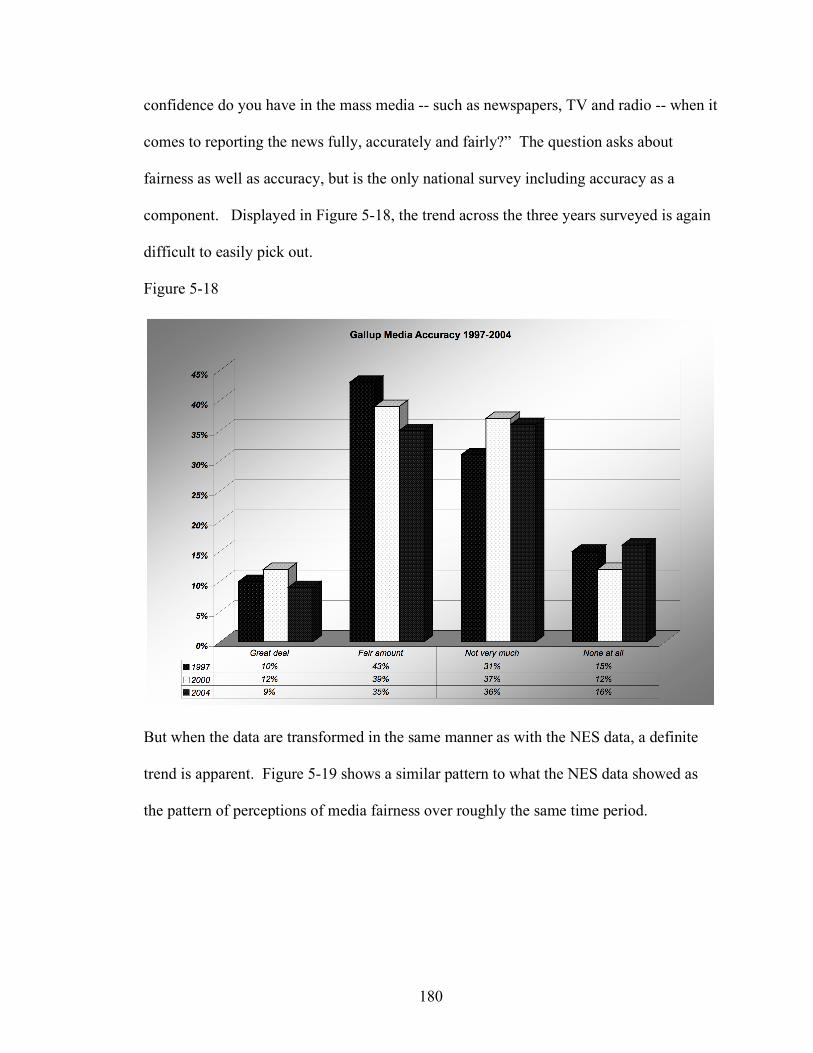
180
confidence do you have in the mass media -- such as newspapers, TV and radio -- when it
comes to reporting the news fully, accurately and fairly?” The question asks about
fairness as well as accuracy, but is the only national survey including accuracy as a
component. Displayed in Figure 5-18, the trend across the three years surveyed is again
difficult to easily pick out.
Figure 5-18
But when the data are transformed in the same manner as with the NES data, a definite
trend is apparent. Figure 5-19 shows a similar pattern to what the NES data showed as
the pattern of perceptions of media fairness over roughly the same time period.
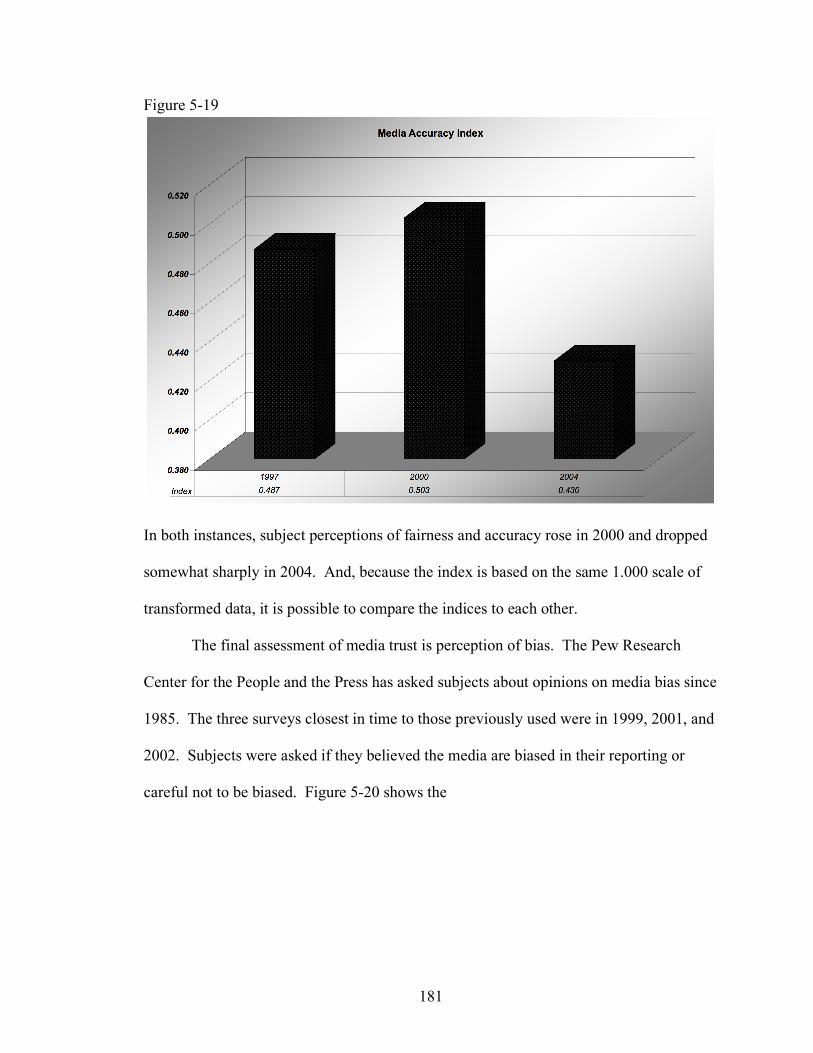
181
Figure 5-19
In both instances, subject perceptions of fairness and accuracy rose in 2000 and dropped
somewhat sharply in 2004. And, because the index is based on the same 1.000 scale of
transformed data, it is possible to compare the indices to each other.
The final assessment of media trust is perception of bias. The Pew Research
Center for the People and the Press has asked subjects about opinions on media bias since
1985. The three surveys closest in time to those previously used were in 1999, 2001, and
2002. Subjects were asked if they believed the media are biased in their reporting or
careful not to be biased. Figure 5-20 shows the
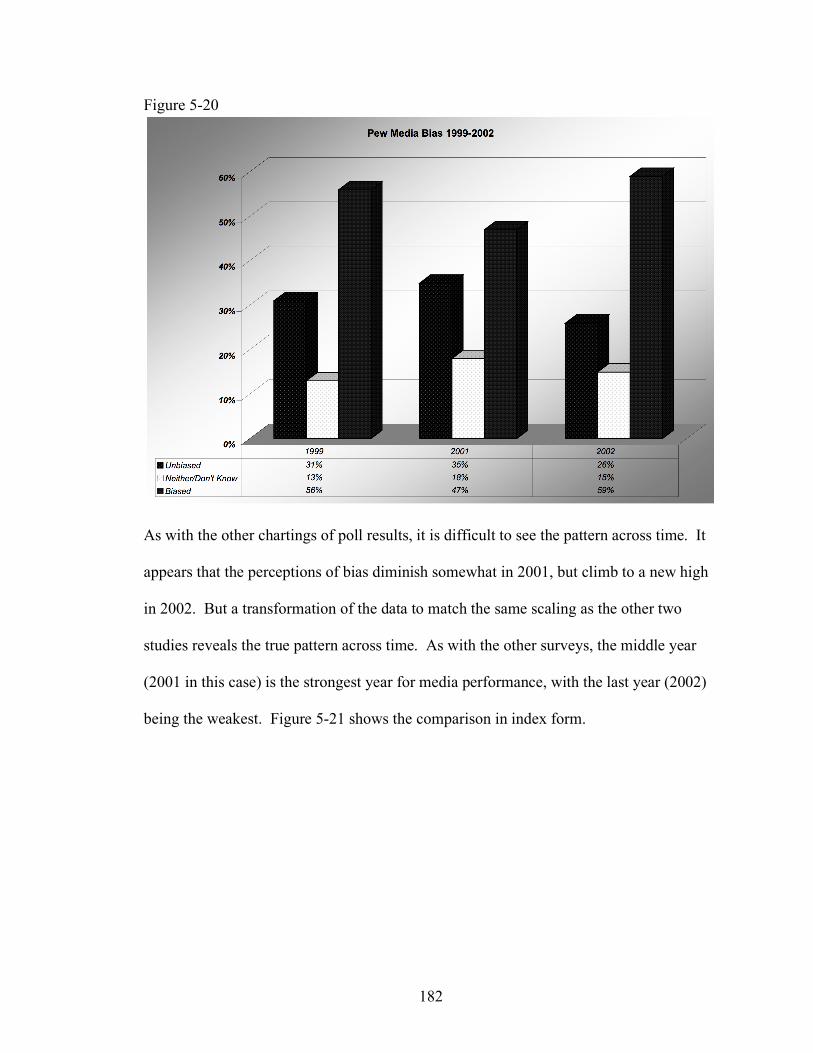
182
Figure 5-20
As with the other chartings of poll results, it is difficult to see the pattern across time. It
appears that the perceptions of bias diminish somewhat in 2001, but climb to a new high
in 2002. But a transformation of the data to match the same scaling as the other two
studies reveals the true pattern across time. As with the other surveys, the middle year
(2001 in this case) is the strongest year for media performance, with the last year (2002)
being the weakest. Figure 5-21 shows the comparison in index form.
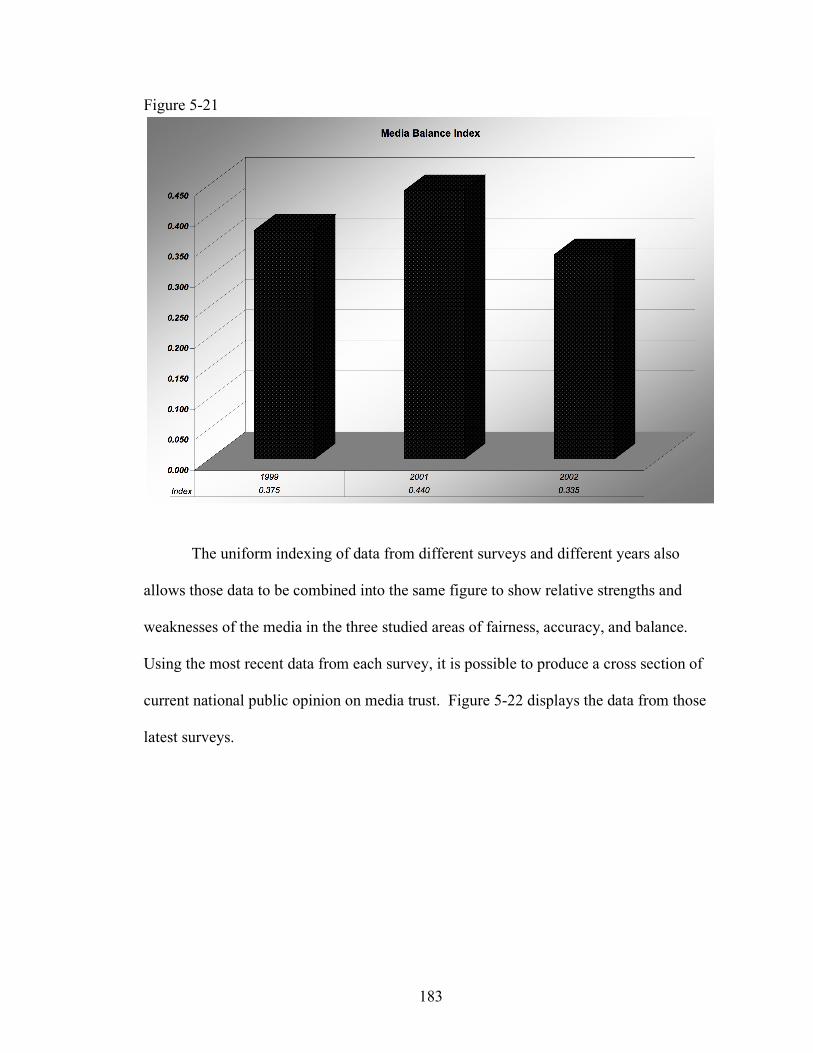
183
Figure 5-21
The uniform indexing of data from different surveys and different years also
allows those data to be combined into the same figure to show relative strengths and
weaknesses of the media in the three studied areas of fairness, accuracy, and balance.
Using the most recent data from each survey, it is possible to produce a cross section of
current national public opinion on media trust. Figure 5-22 displays the data from those
latest surveys.
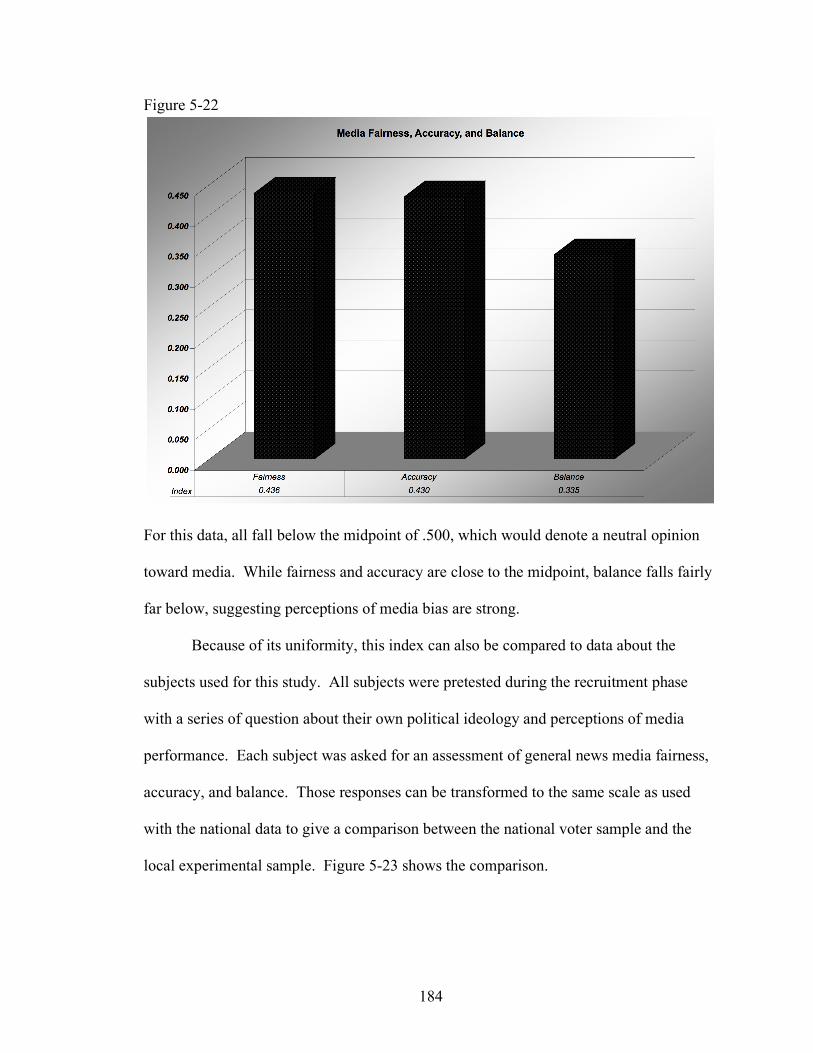
184
Figure 5-22
For this data, all fall below the midpoint of .500, which would denote a neutral opinion
toward media. While fairness and accuracy are close to the midpoint, balance falls fairly
far below, suggesting perceptions of media bias are strong.
Because of its uniformity, this index can also be compared to data about the
subjects used for this study. All subjects were pretested during the recruitment phase
with a series of question about their own political ideology and perceptions of media
performance. Each subject was asked for an assessment of general news media fairness,
accuracy, and balance. Those responses can be transformed to the same scale as used
with the national data to give a comparison between the national voter sample and the
local experimental sample. Figure 5-23 shows the comparison.
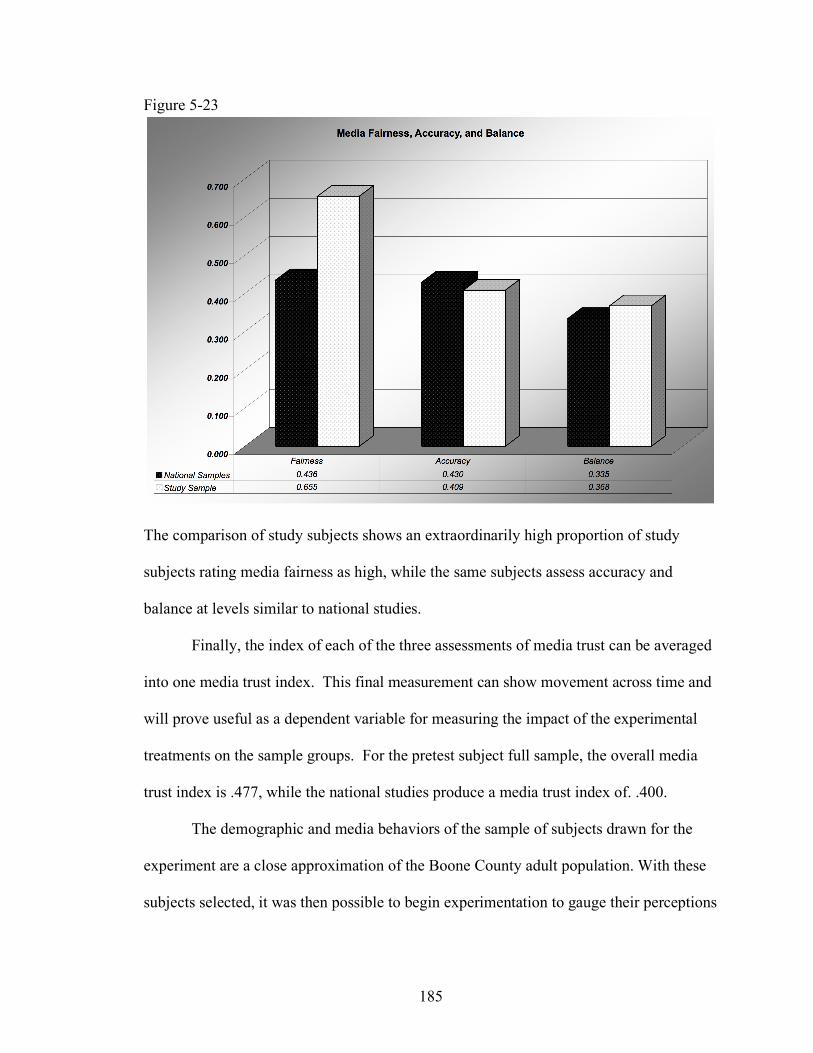
185
Figure 5-23
The comparison of study subjects shows an extraordinarily high proportion of study
subjects rating media fairness as high, while the same subjects assess accuracy and
balance at levels similar to national studies.
Finally, the index of each of the three assessments of media trust can be averaged
into one media trust index. This final measurement can show movement across time and
will prove useful as a dependent variable for measuring the impact of the experimental
treatments on the sample groups. For the pretest subject full sample, the overall media
trust index is .477, while the national studies produce a media trust index of. .400.
The demographic and media behaviors of the sample of subjects drawn for the
experiment are a close approximation of the Boone County adult population. With these
subjects selected, it was then possible to begin experimentation to gauge their perceptions
186
of news products as the visual and written presentations were manipulated to test three
areas of public policy.
187
Chapter 6: Research Methods and Hypotheses
The goals of the research have been to measure the effect of the use of imbedded
messages on audience perceptions of newscaster objectivity, trustworthiness, and
balance. Messages in news reports come primarily from the words the newscasters
speak. But there are other messages in the form of visual symbols. This research
combines written and spoken words, discrete visual symbols, and specific news video
examples to measure subject response to each of those message carriers. The simplest of
those embedded messages, presented in the form of a lapel button or pin, makes up the
“soft” or least persuasive of the treatments. The addition of the use of biased language in
the verbal portion of the newscasts example produces a “moderate” form of the treatment.
Finally, the further addition of biased video to the lapel pin and verbal biases yields a
“hard” treatment approach for subject exposures. All treatments manipulate the
symbols—verbal or visual—that television news viewers encounter whenever they view
the medium. And it is through the power those symbols carry that bias can be introduced
into the messages.
The Richness of Symbols
Symbols are found more frequently than on television news or in the media in
general. They are around us all day, every day. They direct our travel to work, control
our activity on our computers, and guide our paths to dining, entertainment, and more.
Symbols are the way we organize our lives and our relationships to the world in which
we live. Their use helps define man as the “symbol-using animal” (Burke 1989, p. 70).
188
These symbols are not essential to maintaining life, but the very fact that they are here
and that people use them to construct a reality, makes them an essential part of our
connection to others (Firth 1973, p. 20).
So how do symbols come about? Some of the earliest work in the origin and
purpose of symbols as a means of communication between people came from Edward
Sapir. Sapir developed the notion of two types of symbols—referential and
condensational. Referential symbols were those that came as direct substitutes for real
world objects. As such, they hold commonly accepted meanings to act as another
currency of idea exchange among people. But condensational symbols arise differently
and, while they serve the same purpose to deliver meaning through communication
among individuals, these symbols develop as an emotional output of the human mind,
and not a mere representation of reality (Sapir 1934, pp. 492-5).
Elder and Cobb, in their study of the use of political symbols, found they arise for
three reasons. First, human beings have a need for efficiency. Symbols can provide a
short and wordless way to communicate sophisticated meaning easily and briefly (Elder
& Cobb 1973, p. 20). Who could argue that the simple use of two fingers to make a
“peace sign” during the Viet Nam war communicated volumes about the politics of the
owner of the fingers? Secondly, the need for a common reference point in
communications forces people to agree upon a common meaning for the symbols they
use (Elder & Cobb 1973, p. 20). Clearly, we all must agree that a red light means stop,
and a green light means go. Any variance from those accepted definitions can be
disastrous. And finally, Elder and Cobb see that groups, particularly disadvantaged ones,
create symbols to help define and place themselves in a higher profile among the general
189
population (Elder & Cobb 1973, p. 21). The now-familiar symbol for a disabled person’s
parking space has taken on new social context and elevated that group to a higher level of
awareness with the public. Each of these reasons for using symbols has bearing on the
study at hand. The use of a flag pin on one’s lapel provides an efficient way of sending a
message. But what exactly is that message? Common meaning may be hard for some to
agree upon when viewing the pin wearer. Does he wear it as a patriot in support of the
country—or does he wear it mockingly as some did with flags across the seats of their
pants during the Viet Nam war era? Does the flag show he supports the war against
terrorism—or does it show support for the American service people he wants to see
brought home immediately? Does the flag show support for the current administration
and its policies—or does it ask for an alternative to bring back American values.
Common meaning can be difficult to find when symbols take on the role of political
communication.
Sharing Meaning through Symbols
The idea that symbols are a shortcut for people to use to find a common meaning
during communication is crucial to the discussion of whether bias can arise from the
inconsistent understanding of what symbols represent. Murray Edelman emphasizes the
difference between information and meaning, arguing that the two are not only different,
but also often at odds. Meaning, according to Edelman, is about order and the ability to
comprehend information—too much of which is available to our minds. Without
common meaning and the symbols that make it possible, the processing of information
would become too big a burden for most of us (Edelman 1971, pp. 31-33). Symbols allow
190
our minds to take issues with a large information base and process them as if they were
much smaller and more manageable (Moles 1968, p. 63).
But the common meaning need not be universal in its understanding. Instead, the
understanding group is usually smaller. Different nationalities and ethnic groups view
certain gestures and symbols in their own ways as funny, rude, or evoking any number of
responses. None of these responses would necessarily be generated in another culture (La
Russo 1977, p.163).
Researchers in semiotics also look at a three-part explanation for why symbols
gain common meaning. They see the symbol itself, the concrete object or notion it stands
for, and the perceiver of the symbol all to be essential elements in deciding what a given
symbol means (Siegel & Carey 1989, p. 18). In this way, the elements of the triad of
connected symbols, objects, and individuals need to be examined together, and cannot be
pulled apart for microexamination. If that would happen, the meanings break down as the
triad dissolves. Edelman reinforces that notion that symbols and the people who perceive
them are inexorably connected. He argues that since symbols have no intrinsic meaning,
they can bring out a “concentrated form” of both meanings and emotions in the group
that accepts a common meaning of those symbols. The individual and group are key, as
Edelman emphasizes, “The meanings, however, are not in the symbols. They are in
society and therefore in men.” (Edelman 1964, p. 11).
It is in men (and women) as individuals that the processing of symbolic
information occurs. Often that processing results in an emotional response from the
receiver of the symbolic information. It could be argued that symbolic communication is
really the communication of ideas and not emotion. Emotion is generated by the
191
combining of the known meanings associated with the symbols and the reaction of the
mind and body to those symbols in the receiver (Buck 1984, pp. 335-6). As this study
examines three issues that can generate a great deal of emotion in citizens, this theory of
how meaning and emotion interact is very important. The flag of one’s nation is a very
powerful emotional symbol. It can lead soldiers in battle to their deaths, make citizens
cry as it passes by in a parade, and exhilarate athletes entering international competition.
Likewise, the symbols for and against abortion and gay rights come with powerful
emotional elements that, in some cases, make up more of their meaning that the non-
emotional components. Each of these symbols generates a reaction in the receiver of the
message.
Those reactions, unlike the symbols that have a shared and agreed upon, yet still
non-intrinsic meaning, are built in to our minds and bodies. They arise despite or even
against our will as a result of a certain stimulus. Because the notion of the “spontaneous”
communication is built upon the foundation that these are internal feelings manifested on
external symbols, they cannot be disguised, pretended, or falsified (Mead 1934, p. 16).
Smith takes this classification of symbols even further with his theory of the
symbolizing process. He sees four uses of symbols in human thought processing. First,
symbols allow us to remember or conjure up absent people, places, or things—building a
sense of history and being grounded in it. Second, the common understanding of symbols
allows for shared experience of those memories and representations. Third, symbols are
not restricted only to the tangible. Crucial to the study of political symbols, Smith finds
the symbolism in use when representing “freedom” or “honor” to be very important.
192
Finally, the first three uses of symbols help build a total culture of symbols which is
shared by members of a common community (Smith 1990, pp. 9-10).
It is necessary to step aside from the common definitions of the term “symbol” to
say for the sake of this research what symbols are not. Though any research in the area of
symbolic communications would have to classify the spoken and written word as
symbols themselves (Pranger 1968, pp. 157-8), this examination of the use of patriotic
symbols will interest itself only in nonverbal symbols. In fact, that distinction is
important in examining a field such as journalism where both verbal and nonverbal
communication takes place. There is in fact, according to Chase, a “tyranny of words” in
our approaches to examining human communication that masks much of the underlying
value and impact of nonverbal cues (Chase 1938, p. 46). Lacking the use of verbal speech
with words, animals exhibit their reliance on simple symbols all the time (Hayes 1994, p.
176). By stripping away the preponderance of spoken communication using words as
symbols, it becomes easier to see the pervasiveness of nonverbal symbols in human
communications.
Symbols and Language in Political Communication
It is through this non-verbal power of symbols that this examination of the
relative power of that non-verbal messaging will be explored. It seems clear that the
power of symbols in television presentations—even unintentional—will have an impact
on the understanding taken from the program by the viewers.
With a basic understanding of how symbols come about and how they help the
human mind process information, the role of symbols in politics is a subset of that larger
193
issue. The study of symbols falls under the general field of study in political
communications. Research in this field is seen as crucial to understanding the relationship
between the political power holders and the general public. That relationship is based on
the use of symbols as an intermediary between the political power structure and the
public, where symbols help create a “pseudo-environment” that stands between the public
and the actual environment to which the symbols refer (Lippmann 1949, p.10). Parties
and their icons act as symbols, for instance, without which often participation and interest
decline (Schaffner, Streb, & Wright 2001, p. 25). Some would go as far as to say there is
no reality of political life without that which is created by the use of symbols and other
forms of political communication (Nimmo & Combs 1983, p. 4). And the roots of that
use of symbols for political communication shares the common elements found in all
symbolic communication.
Early research in political communication moved through several theories that left
much to be desired. The mechanistic approach saw communication as a “bullet” or
“hypodermic” process that had political speakers shooting or injecting needed
communications directly into the public receiver (Fisher 1978, p. 74). In this framework,
all information was sent in a similar manner and understood in a similar manner by its
recipients. Aberrations in experimental data using the mechanistic approach soon gave
rise to intrapersonal theory that could better explain the differences seen when a group of
observers heard the same political message but received it differently. This theory held
that even though each of us might be exposed to the same communications data, we
would use our differences in upbringing, education, and personality to process it
differently (Smith, 1990, p. 2). But people do not receive political information in a
194
vacuum—nor do they process it there. Instead, they talk among family, friends, and
neighbors and add these external stimuli to their processing of the information. The
significant theories of Lazarsfeld, Berelson, and Gaudet introduced us to this social
framework wherein groups such as opinion leaders, mass media, and others mattered in
the flow of information to and from political leaders and the people (Lazarsfeld,
Berelson, & Gaudet 1948).
The specific use of non-verbal symbols for political purposes arises in the use of
the “icons” of politics. These include the nation’s flag, its colors (in our American
instance, red, white and blue), or other emblems of power, such as the presidential seal
(Bennett 1980, p. 252).
When examining that flow of information through symbolic interpretation, the
limitations that symbolic use puts on the perceiver are significant when considering the
patriotic symbols themselves. Edelman develops the notion of “constriction of
perception” that can come about when symbols are used. Since symbols often depict a
very black and white view of a much more complicated set of values or option, their use
can limit the field of view for the symbol’s perceiver to consider all alternatives
(Edelman 1977, p. 145). Important to this research would be the example of the wearing
of a flag. Since that would be perceived by many to be a show of patriotism and support
for the nation, does the absence of a flag denote lack of patriotism? The use or lack of
use of symbols can often give viewers a quick reference to distinguish the “bad guys
from the good guys” (Sears 1993, p. 114). Edelman emphasized this simplification and
need for reassurance in the public—reassurance provided by the use of symbols to depict
good and bad (Edelman 1964, p. 15).
195
This hunger for symbols to simplify a complicated world into easier to digest
portions starts at a young age—perhaps as early as pre-school (Corbett 1991, p. 220).
Classical conditioning in school and by peer groups directs children how to perceive
symbols in many cases before they are even able to read the written word (Sears 1983, p.
124). These early childhood predispositions toward the meaning of certain patriotic
symbols are very likely to become central to the individuals political core and stay there
throughout life (Hyman 1959, p. 7). Once established, these predispositions toward
symbols do persist through the rest of life. According to the symbolic politics view, these
early experiences (through adolescence) with symbols develop their sets of
predispositions that do not change much for many people in the future (Sears 1993, p.
123).
Recognizing that the predispositions are in place in the typical adult new
consumer, one must then ask how the processing of information is affected by the
internal symbolic cues. The symbolic processing theory shows that there is a strong
affective response to symbols that at the same time both transcends and undercuts
thoughtful appraisal or previous knowledge of the subject in which the symbols appears.
This affective response is something political candidates count on their advertising to
evoke, and it does prove effective in the campaign communication research (Sears 1993,
p. 133). This repeated evocation of responses by a given set of symbols develops a
“habit” of response that is very consistent over time, and moves the perceiver farther and
farther from the original source of the emotion toward the symbol, leaving only the
history of responses on which to base future responses.
196
Ultimately, symbols lead to the formation of images about candidates, leaders,
and other political institutions. The media play a role in transferring the symbol to the
intended (and unintended) receivers and making that image creation possible (Nimmo
1974, p. 48).
The Mediation of Political Communication
With an audience of potential voters just full of preconceived responses to
symbols, what exactly is it the media transmit to those open, waiting minds? Before
answering that question, it is important to examine the how of the transmission from the
media selection perspective. Harold Lasswell said communication requires simply a
sender transmitting a message through a selected medium to a receiver, all with an effect
in mind (Lasswell 1948, p. 37). Television is now most often the medium of choice for
that transmission—both for media consumers and the political leaders trying to reach
them. A national poll taken in January 2002 asked for respondents’ primary sources for
news about national and international events. Eighty-two percent cited television as one
of those sources, while only 42 percent said newspapers were among their choices of
information providers. Even in this age of internet-fast news retrieval, only fourteen
percent listed that source among their regular sources for news consumption (Roper
2002). That comfort with having news delivered by television is not a product of
September 11 or any other 21st century news event. After the birth of television news in
the 1950s, infancy, childhood, and adolescence were compacted to a very short time. By
1963, television had become Americans’ favorite source for news (Nimmo & Combs
1983, p. 25). And why not? Television is a passive medium, to which only a minimal
197
amount of attention must be directed at any given time. That lack of active viewing is not
without its consequences, though. Television news viewers often miscomprehend what it
is they are watching—sometimes at alarmingly high rates (Jacoby, Hoyer & Sheluga
1980, p. 80). Television also breeds insensitivity to go along with its passivity, since the
sheer volume of tragedy to which a viewer is subjected each year is enormous (Davies,
Bathurst, & Bathurst 1990, p. 112).
As the American public became more and more enamored of television, then the
effect of this medium on that public became more and more pronounced. The mass
media—lead by television—began to step in to relay information in easily digested bits
so that people could continue to update with knowledge and belief sets. But as the media
took on a greater and greater role, then a dependency grew for the public to use the media
almost exclusively for learning about society’s events (Ball-Rokeach & DeFleur 1976,
pp. 3-21). And as television grew among the media, its power to control the agenda and
the style of news grew right along with it (Altheide & Snow 1979, p. 10). The very nature
of television news is that it gives a bare minimum set of facts from which the viewer can
learn about the story. Nimmo and Combs call it an “acquaintance medium” and not a
source from which the public can draw deep understanding or knowledge of the subject
being covered (Nimmo & Combs 1983, p. 45). But the newer, more data-rich Internet is
not climbing to be a replacement that will awaken American news consumers for their
torpor. Research on its ability to prompt users to become more active participants in the
democratic process says it still lags far behind television as a source for information
(Bimber, 2001, p. 64). And an increasingly narrow targeting of tightly-defined news
information for a particular market of news consumers on both the internet and television
198
is leading to less and less exposure to divergent or challenging points of view (Mutz &
Martin 2001, p. 111).
Communicating with Stories
Television news’ style of storytelling began to affect the stories told. First and
foremost, television news has an almost insatiable hunger for pictures, for video. It
cannot tell stories well without the visual element. And many decisions on coverage are
based on pictures available (Woodward 1997, p. 83). Once those stories are chosen,
television’s impact as an agenda setter is well documented—particularly for those who
are not deeply interested in world or even local affairs (Iyengar & Kinder 1987, p. 63).
Television news is able to generate the highest levels of audience interest when it tells
stories—no matter how complicated—through the example of a single person (Jamieson
& Campbell 1983, p. 18). While this approach makes the story easy to digest and
certainly helps tell even the most complicated issue in terms of its effect on the
individual, it nearly completely moves the story out of its historical, social, and economic
context (Bennett, 1983, p. 8), and very often out of its political context as well
(Ansolabehere, Behr, & Iyengar 1993, p. 4). This sort of “humanization” approach leads
to an episodic framing of stories, where only small parts are told at any given time, often
lacking the context of the larger issues that would be more properly framed in thematic
terms (Iyengar 1991, p. 73). This episodic framing also emphasizes events over issues as
the subject of stories—another factor in pushing the historical and political context of
issues to some back burner of the news stove (Gamson & Modigliani 1989, p.23).
199
The act of stripping the context from television news stories to humanize or
otherwise make them better stories to tell introduces the possibility of the addition of bias
to the message. The choices reporters and editors make to tell the story better can change
the subtle meaning of the messages sent. Imagine a reporter working on a story about the
governor proposing cuts in state Medicaid funding. The reporter decides to humanize his
story around a person who stands to lose coverage. The choice of that central character
does much to add context—perhaps false context—to the message sent to viewers.
Should the reporter choose a black, single mother as his central character, viewers may
see the governor as someone unfair to that minority group. But the true context of the
cuts may be something entirely different. Perhaps most of the cuts will actually affect
retirees or part-time workers. That true context is lost from the story and lost by the
viewers of the story.
Decisions on storytelling technique that affect the mediated messages of context
are made daily by reporters and editors with no thought as to how those decisions affect
the underlying messages of their stories. These reporters and editors have a commitment,
in most cases, to telling the truth and getting facts correct. But they often add visual and
symbolic messages to stories without thought to the changes those messages will make in
the way the audience receives the message.
This unintended stripping of historical and political information by television
comes at a time when that very same medium has contributed to a perceived decline in
the general public knowledge on such issues. The rise of television as an entertainment
medium meant vast numbers of hours are often spent by school-aged children in front if
it—often times many more hours than spent in front of their teachers at school (Graber
200
1989, p. 184). There have been “golden” periods when entertainment programs strived to
open discourse and discussion about important social and political issues within the
confines of their fictional teleplays, but those attempts usually end lighter fare dominates
the ratings (Lichter, Lichter & Rothman, 1991, p. 5-8). Still, the growth of television as
our dominant form of time-consuming entertainment has taken much time away from
newspapers, or even general conversation with friends and neighbors about what is
happening in government and society. This lack of well-rounded intercourse on the issues
of the day has left people with television news often as their own source for political
information (Robinson & Levy 1986, p. 211). Limited political information often then
leaves the viewer more susceptible to the nonverbal and symbolic images they receive
from television. This susceptibility manifests itself in the form of more openness to the
emotional appeals of symbols, while often ignoring the intellectual information that goes
along with, or even contradicts, the emotional dimension (Sullivan & Masters 1993, p.
327). Beyond this weakness, the narrative form of the media often leads to a need to
accept the status quo of the institutions and their power, and to ignore possibly
newsworthiness therein to make “room” for the narrative approach and its rather bulky
frame (Hanson 1999, p. 7).
The use of symbols on television news carries with it the responsibility of
examining not only the intentional messages being relayed as part of the broadcast, but
also those unintentional or unconscious messages that may also be embedded in the main
message. The symbols we come to see on television news become part of the political
images that legitimize and support the status quo (Bennett 1983, p. 34). A
disproportionately high exposure to repeated symbols not directly connected to the
201
message may actually alter or mask the intended message (Lasswell, Lerner, & de Sola
Pool 1970, p. 20). It is that position in the status quo that this study will test.
Approach of the Study
The symbols and messages tested have been placed in neutral television content,
consisting of various sets of visual and written messages designed to show bias on the
part of the news anchor and organization. One set concentrates on an issue that enjoys
much consensus with the population—patriotism in the wake of September 11, one set
concentrates on the generally divisive issue of legalizing gay marriage, and one set
concentrates on the extremely divisive issues surrounding abortion rights.
The relevance of patriotism to this study has been established, but the significance
of the gay marriage debate and the abortion rights fight are also clear. It is quite possible
the issue of gay marriage was the deciding one in the 2004 campaign for the U.S.
presidency. Despite a nation at war and disappointing economic news, a strong plurality
of voters polled about why they voted the way they did cited “moral values” as the reason
they can their vote for George W. Bush (Burkeman 2004, p. 1). A strong sense of their
moral outrage came from court decisions and the general push to legalize same-sex
marriage in a number of states (Law 2004, p. 1). The desire for some sort of marriage
between couples of the same sex is not a construct of the 21st century, however. Churches
such as the United Church of Christ and the Unitarian Universalist Association perform
ceremonies joining same-sex couples. But these ceremonies are not marriages and have
not been recognized as legal in any state. And early movements in the 1970s saw court
202
cases go against gay marriage in a number of states (Swan 1997, p. 111). At the federal
level, Congress in 1996 passed the “Defense of Marriage Act,” which stated, in part:
“In determining the meaning of any Act of Congress, or of any ruling, regulation, or interpretation of the various administrative bureaus and agencies of the United States, the word `marriage' means only a legal union between one man and one woman as husband and wife, and the word `spouse' refers only to a person of the opposite sex who is a husband or a wife (Defense of Marriage Act 1996).”
The measure passed with a wide margin and was signed into law by President Bill
Clinton. Clinton signed the bill under pressure from conservative Christians during his
race for re-election, and even ran advertising on Christian radio stations celebrating the
signing of the legislation (Rimmerman 2002, p. 76). Some faiths are more tolerant of
homosexuality and guaranteeing equal protection for gay citizens—such as Roman
Catholics (Gallup and Castelli 1987, pp. 62-3), but the lopsided margin of victory, as well
as the support of a Democratic president, reflects more than just conservative Christians
being against gay marriage. Overall public opinion stood firmly against legal marriage
for people of the same sex (Gray 1996, p. 1). The same year the Defense of Marriage Act
vote was taken, the percentage of Americans supporting gay marriage, fell to 28 percent
(Niebuhr 1996, p. A18). Media coverage of gay issues had grown through the AIDS
crisis of the 1980s and the same-sex marriage and domestic partnership debates of the
1990s (Rimmerman 2002, p. 112). Demonstrations were common to see on television,
and the spectacle of lines of gay men and women assembling to marry in Boston and San
Francisco in 2004 was just too good for the television news medium to pass up. While
many would have rather not witnessed it, the language and symbols of gay marriage were
splashed across the nightly newscast. In fact, the “Focus on the Family” conservative
203
Christian organization routinely sent material to its supporters portraying media members
as manipulated by and even supportive of the gay rights movement (Herman 2000, p.
143-4).
The effect of this prevalence of gay rights stories and images bears investigation.
The political effect of media coverage of the issue raises questions of the role the media
played in bringing the issue to the forefront of the 2004 campaigns, and to the meaning
viewers took from newscasters’ choices of video depicting ceremonies, as well as the
ways in which the stories were written.
The fight over abortion rights has been a common part of American political
discourse since the Roe. V. Wade decision legalized abortion across the United States in
1973. The Texas case shattered previous legal precedent and set up a hierarchy of interest
the courts must consider when hearing abortion cases—first, a woman’s privacy; second,
a doctor’s professional rights; and third, the interest of each state in protecting the
wellbeing of its citizens (Stetson 2001, pp. 251-3). The court decision carried the issue of
abortion rights to the center stage of policy debate—even when voters have been in
general consensus on the issue. Some pollsters found that Americans considered
themselves split two ways—for legal abortion or against it (Craig & O’Brien 1993, p.
262). But when probed about the specifics of why a woman would seek an abortion, the
split is not so black and white. Presented with a pregnancy occurring from rape, a badly
deformed fetus, or a threat to the mother’s life, more than 80 percent of those polled find
abortion acceptable. It is only on those abortions performed for to end pregnancy as a
convenience that the population splits, with half in favor and half opposed to abortion for
those reasons (Petrocik 1996, p. 3).
204
With the population generally decided on where it stands regarding abortion over
the last thirty years, rhetoric and symbols have been the tools those on the polar ends of
the debate have used in their fight to move Americans more strongly into support of legal
abortion, or away from it altogether. The language used by supporters of legal abortion
has the procedure performed on a “fetus,” while opponents of abortion call that the
“unborn child” (Woliver 1996, p. 7). Even the names of the groups on each side of the
debate are an attempt to evoke positive feelings toward the cause. The “pro-life” element
feels no on can be against “life,” while the “pro-choice” side knows it is central to the
American way of thinking to always have a “choice” (Luker 1984, p. 17). This rhetorical
setting makes an abortion element to the experimental research ideal. The role of the
mass media in shaping public opinion on abortion policy is often defined by the success
proponents of one position have using language and symbols. And those with success in
framing their position in the proper language have the upper hand in the policy discourse
(Ferree et al. 2002, p. 17). Often it is the way in which the complex details of the abortion
policy debate are presented that affects attitudes the most (Jaffe, Lindheim & Lee 1981,
p. 99). Television is a medium where the voice, words, and symbols of each side are
foremost, and though television newscasters work to portray the issue in the most
balanced light of all journalists (Marsh & Chambers 1981, pp. 145-6), the possibility that
television’s ability to relay symbols and words in an unintentionally uneven fashion
deserves a closer look. This study takes part of that symbolism—the word “life”—and
uses it in the news context to measure the influence it has on perceptions of fairness and
balance as perceived by viewers.
205
Experimental Design
The use of a controlled, cross-sectional experiment of descriptive proved to be an
efficient way to produce generalizable results for comparison. The approach allowed the
identification of any relationship between the variables and helped measure for
correlation or cause—if any (Rosenthal & Rosnow 1991, p. 17). Through the use of
controlled exposure of a simulated television news content to a series of small
experimental groups made up of a representative sample of television news viewers, it
was possible to test for the effects of the cues sent by newscasters to their audiences—
whether intentional or unintentional. The classic experimental design consisted of a
pretest to determine a baseline for the dependent variable to be studied, an experimental
exposure of randomly-selected subjects to a treatment, a randomly-selected control group
not exposed to the treatment, and a posttest of all subjects to determine any effect on the
dependent variable (deVaus 2001, pp. 47-50). A modified pretest-posttest experimental
design with two levels of control groups was used for this research. This approach
allowed for the most accurate measurement of both treatment effects and experimentally-
introduced effects (Smith 1991, pp.187-90). The population from which the samples were
taken is adult residents of Boone County, Missouri. Structured group questionnaire
sessions were used to collect the data. This approach allowed more rapid collection of
data than individual questionnaire interviews, while keeping the subjects focused on the
research subject and limiting the amount of time necessary to conduct the experiments
(Morgan 2002, p. 147). Experimental groups of about twenty people (or multiple small
groups totaling about 20) were assembled for the experiments. Phone callers from the
Center for Advanced Social Research at the University of Missouri made phone calls to
206
recruit participants. All selected were adults, eighteen years of age or older, residing in
Boone County. During the recruiting process, the subjects answered a short slate of
questions to measure the political orientation and existing view of the media of the group
member. The questions were used to qualify the subject for the experiments, but to paint
a picture of the subject taken significantly prior to the experimental exposure so as to
minimize any measurement effects.
Subjects then assembled in twelve experimental groups, each exposed to a
different experimental treatment. Nine of the twelve groups watched a short videotape to
begin the experiment. Realism is key to external validity of the research, so subjects were
lead to believe what they were viewing actual television news and other programs
(Aronson & Carlsmith 1968, p. 25). To give the experimental treatment that realism, the
tape viewed consisted of half of a segment from the NBC News program “Dateline
NBC,” a short commercial break, a “news break” during which the actual experimental
exposure took place, another short commercial break, and then the remainder of the
Dateline NBC segment. That Dateline NBC segment was a non-political feature on art
theft. The commercial were likewise non-political.
Some of the content of the “news break,” however, was political. Variation in the
contents of the tapes came in the use of the independent variables of various newscast
content representing a particular stand on one of the three test issues. Three different
levels or styles of presentation for each issue was used. The first presentation style was
the “soft” presentation, consisting of a subtle visual clue in the form of an anchor lapel
symbol. The second presentation style was the “moderate” presentation, consisting of
story content that is written in a biased fashion toward a position on the issue. The final
207
presentation style was the “hard” presentation, consisting of a visual reference to actual
anchor participation on one side of the issue. This same series of presentations were
presented to additional groups for each of the other two issues studied. The news break
was consistent across all tapes, using the same anchor and the same basic set. Then, for
each issue set, a fourth group acted as a control saw a video presentation that consists of
the same elements as the other groups, but without the local news break content. The
Dateline NBC program had only a break with commercials.
Following viewing the video, each group member was asked to complete another
questionnaire. The standard questionnaire format is a valuable way to measure the
attitudes of subjects in a uniform, consistent fashion. A successful questionnaire gathers
the information needed to verify the study’s hypotheses, compels respondents to answer
truthfully, and minimizes the risk of error (Malhotra 1999, p. 32). Successful
questionnaires must gather the empirical evidence sought, without confusing or boring
the subjects (Folz 1996, pp. 79-80). The questionnaire for this research, with
approximately 25 multichotomous questions, was designed to measure any change in
attitude toward the media based on the tape the group had just seen. The questions were
attitude scale measurements, best suited for measure consistent subject opinions about the
reviewed material (Oskamp 1977, pp. 54-55). The questions did not require great recall
on the part of the subjects, which can lead to subject fatigue and disinterest in the process
(Bradburn, Rips, & Shevell 1987, p. 157). Instead, the questions focused on subject
opinions easily recalled and addressable by the answer scale. Analysis used the Likert
scale model of interval measurement, which allows statistical analysis of the attitudes
measures by the questionnaires (O’Sullivan & Rassel 1995, p. 274). Different
208
questionnaires were presented to subjects based on the particular ideological subject the
tape had addressed, and measured subject feelings toward the dependent variables of
balance, truthfulness, and trustworthiness on the part of the media. The order of the
questions took the subject through a logical review of what he/she just viewed, without
confusing or boring the subject (Bradburn & Sudman 1988, pp. 153-4). Questionnaire
results were then subjected to an analysis of variance statistical test, looking for
significant differences in the effects of various treatments on viewer perceptions of news
media bias, so as to test the hypotheses. Internal validity of the experiment is crucial if it
is to reveal correlation or causal relationships. This validity will be maintained by
guarding against testing, instrumentation, and selection effects, among others (Cook &
Campbell 1979, pp. 51-68).
Members of the control group for each issue category who saw the videotape
presentations without the local news break answered the same questionnaires as the other
subjects in the same issue experiment treatment.
Beyond those subjects who assembled to watch the videotapes, an additional
control group of subjects was asked the recruiting questions by phone, but not asked to
come to the experiment. Instead, those same subjects received a call at the time the
experiments were taking place, asking the same post questionnaires. Table 6-1 describes
the entire experiment.
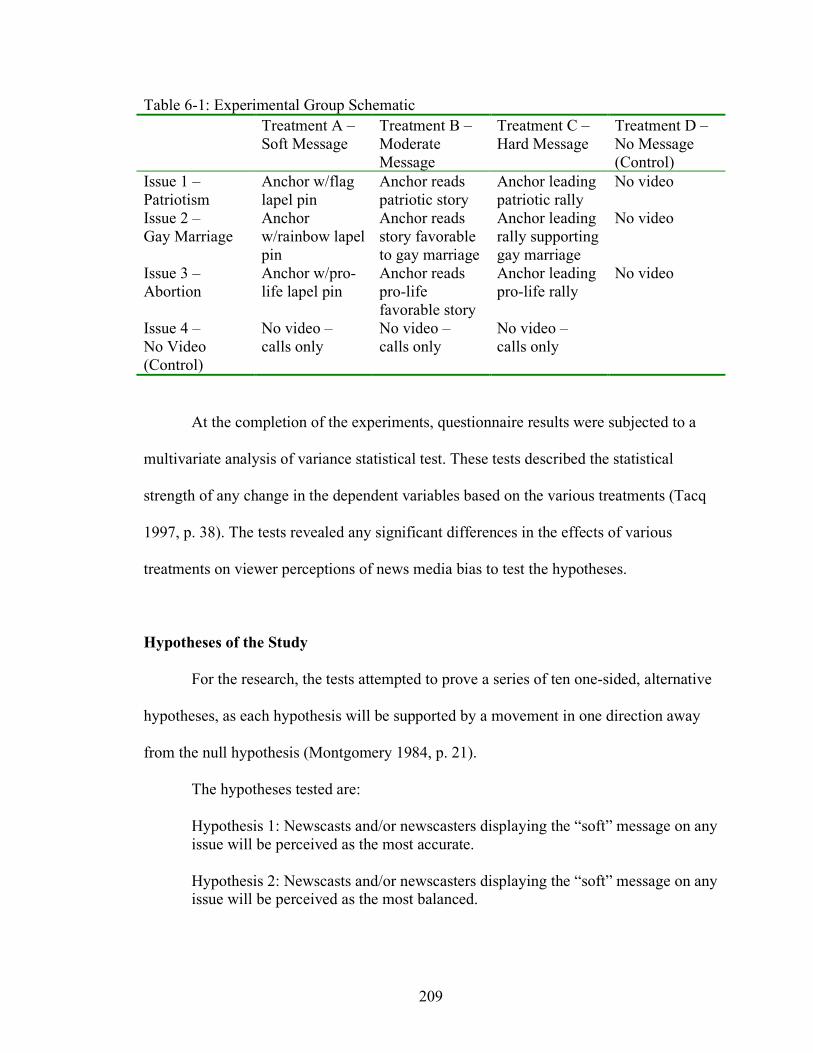
209
Table 6-1: Experimental Group Schematic Treatment A –
Soft Message Treatment B – Moderate Message
Treatment C – Hard Message
Treatment D – No Message (Control)
Issue 1 – Patriotism
Anchor w/flag lapel pin
Anchor reads patriotic story
Anchor leading patriotic rally
No video
Issue 2 – Gay Marriage
Anchor w/rainbow lapel pin
Anchor reads story favorable to gay marriage
Anchor leading rally supporting gay marriage
No video
Issue 3 – Abortion
Anchor w/pro-life lapel pin
Anchor reads pro-life favorable story
Anchor leading pro-life rally
No video
Issue 4 – No Video (Control)
No video – calls only
No video – calls only
No video – calls only
At the completion of the experiments, questionnaire results were subjected to a
multivariate analysis of variance statistical test. These tests described the statistical
strength of any change in the dependent variables based on the various treatments (Tacq
1997, p. 38). The tests revealed any significant differences in the effects of various
treatments on viewer perceptions of news media bias to test the hypotheses.
Hypotheses of the Study
For the research, the tests attempted to prove a series of ten one-sided, alternative
hypotheses, as each hypothesis will be supported by a movement in one direction away
from the null hypothesis (Montgomery 1984, p. 21).
The hypotheses tested are:
Hypothesis 1: Newscasts and/or newscasters displaying the “soft” message on any issue will be perceived as the most accurate. Hypothesis 2: Newscasts and/or newscasters displaying the “soft” message on any issue will be perceived as the most balanced.
210
Hypothesis 3: Newscasts and/or newscasters displaying the “hard” message on any issue will be perceived as the least accurate. Hypothesis 4: Newscasts and/or newscasters displaying the “hard” message on any issue will be perceived as the least balanced. Hypothesis 5: Subjects viewing any of the patriotism treatments will find newscasts and/or newscaster to be more loyal to the United States government. Hypothesis 6: Subjects viewing the “hard” patriotism treatment will find newscasts and/or newscaster to be the most loyal to the United States government. Hypothesis 7: Subjects viewing any of the gay marriage treatments will find newscasts and/or newscaster to be more biased in favor of gay rights. Hypothesis 8: Subjects viewing the “hard” gay right treatment will find newscasts and/or newscaster to be the most biased in favor of gay rights. Hypothesis 9: Subjects viewing any of the abortion treatments will find newscasts and/or newscaster to be more biased against abortion rights for women. Hypothesis 10: Subjects viewing the “hard” abortion treatment will find newscasts and/or newscaster to be the most biased against abortion rights for women.
The literature suggests the more potent the symbols used in the experimental
newscast, the greater the effect viewing those symbols will have on the viewer. Symbols
can transmit more complex or higher-level messages simply (Bennett 1983, p. 41), so the
simple symbols used in the earliest part of each experiment have the power to transmit
messages about the newscaster and his positions. Viewed spatially, voters do notice the
difference between themselves and their perceptions of media outlet placement on the
ideological axis—particularly conservative viewers (Ognianova & Endersby 1996, pp.
17-20). So the symbols do not represent fixed points of reference for viewers—they will
shift depending on viewer perceptions and the context in which they are found (Bennett
1983, p. 42).
211
The ultimate goal of the research is to find the levels of actual bias inserted into
news content and presentation that generate a perception of bias within audience
members. Those with different demographic background and political ideologies, as
well as varying levels of media trust, will react differently to the bias stimulus. Finding
the threshold of bias perception for each of these groups will be enlightening for political
scientists and journalists alike.
212
Chapter 7: A Kinder General View: Subjects Perceptions of
Media Fairness, Accuracy, and Balance The concepts of fairness, accuracy, and balance in the media have become
standards by which media organizations believe they should be judged. But more
importantly, it now appears some members of the public have gone from a position of
general trust to begin to use the same criteria to determine which members of the media
are doing a good job, and which are not. There appears to be no universal agreement on
which media organizations do a fair, accurate, and balanced job of gathering and
reporting the news. The differences in perception are visible in national surveys on the
issue, as well as in comparisons with the local subjects used for this research. In fact, just
what makes up a fair, accurate, and balanced approach to the news is a matter of some
dispute. This chapter will examine the perceptions of viewers regarding fairness and
other trust elements on television news, and whether those news consumers think of
fairness, accuracy, and balance in the same way media leaders do.
Differences in perceptions by media audience members stem from ideological
differences, varying abilities to process mediated data, and the type of media consumed.
If this research is to shed light on how media practices influence the perceptions of
fairness, accuracy, and balance as judged by the general public, then it is necessary to
begin the examination of the experimental data with a comparison of the local subjects
views to the national views on media. The local subjects’ ideological views, as well as
their demographic characteristics will serve as comparison points for their respective
positions on media. To serve that purpose, this chapter will analyze the subjects’ pretest
perceptions of media performance, looking for outlying positions that might be particular
213
to Boone County and its residents. The analysis will look specifically for the
representativeness of the local audience to serve as test subjects for the entire nation.
Clearly, in a study of perceptions on political new coverage, the subjects’ ideological
positions will be an important comparison point. That analysis will utilize the subjects’
self-defined ideological position, along with corroboration of other ideological measuring
sticks, to determine if ideology plays a role locally in media trust. Additionally, subjects’
ideological differences in sex, race, age, income, and educational level will serve as
factors of comparison to determine if those differences play a part in media trust
evaluations. Understanding the differences subjects bring to their evaluations of the
media as defined by their sociological differences will help isolate the effects of the
research.
Defining Fairness, Accuracy, and Balance—Journalists’ View
The search for a common understanding of the job media members should do is not
new. The codes of ethics of major journalism organizations specifically and generally
invoke the concepts as an intrinsic part of any reputable journalism organization. The
Radio Television News Directors Association, which represents broadcast and other
electronic journalists, demands both fairness and balance in reporting in its code of
ethics. The code states, “Professional electronic journalists should present the news fairly
and impartially, placing primary value on significance and relevance” (RTNDA 2000).
The code goes on to call for accuracy as one of the six guiding principle broadcast
journalists should hold close, “Professional electronic journalists should pursue truth
214
aggressively and present the news accurately, in context, and as completely as possible”
(RTNDA 2000).
The Society of Professional Journalists, representing primarily the print
journalists in the nation, also calls for the three principles to guide its members. The
preamble to its ethics code focuses on the principles as essential to quality journalism:
Members of the Society of Professional Journalists believe that public enlightenment is the forerunner of justice and the foundation of democracy. The duty of the journalist is to further those ends by seeking truth and providing a fair and comprehensive account of events and issues. Conscientious journalists from all media and specialties strive to serve the public with thoroughness and honesty. Professional integrity is the cornerstone of a journalist's credibility. Members of the Society share a dedication to ethical behavior and adopt this code to declare the Society's principles and standards of practice (SPJ 1996).
Many journalists strive to take seriously the ethical principles of the two organizations—
many do not. The difference is central to this research and often leads to differing
perceptions of the media among viewers and readers.
Perceptions of a Flawed Media System
Studies frequently show a decline in the public evaluation of the media in general
when evaluated for fairness, accuracy, and balance. The Project for Excellence in
Journalism shows a precipitous drop in regard for the media over a seventeen-year period
ending in 2002. Those who found the media to be accurate dropped from 55 percent to 35
percent. Specific questions about fairness in the last two presidential elections showed a
13 point shift among audience members toward rating the media to be less fair to
Democrats, and a 19 point shift toward less fairness toward Republicans (Project for
Excellence in Journalism 2005). The most recent studies of fairness, accuracy, and
balance show that audiences rate the media in general at less than 50 percent across the
215
board. For the 2004 National Election Studies, researchers asked respondents how much
of the time they could count on the media to report the news fairly. Just fewer than 36
percent said most or almost all the time. But 65 percent said they could count on media
fairness only some of the time—or none of the time at all (NES 2004). Likewise, in 2004
when the Gallup Organization asked citizens if how much confidence they had in the
news media to report the news fully and accurately, 44 percent said they could trust the
media, while 52 percent believed they could trust what the read and saw very little or
none at all (Gallup 2004). Finally, in its most recent survey on media attitudes in 2002,
the Pew Research Center for the People and the Press asked about perceived balance in
the media. Only 26 percent of those responding said they thought the media were careful
not to be biased, while 59 percent disagreed (Pew 2002).
Mixed Local Perceptions
Seen as a whole, the national view of the news media in general is not flattering.
And the local subjects in this study share many of the same negative feelings toward the
mass media in general as has been measured recently among the national population. To
make the local measurements, all subjects were asked a short pretest questionnaire during
the recruiting process. The questions probed their feelings about the media in general, as
well as their ideological positions. Three questions asked specifically about subjects’
views of the media’s ability to be fair, accurate, and balanced. Subjects could choose
responses along a four or five-point scale, rating the media performance as well as the
strength of their feelings about that rating.
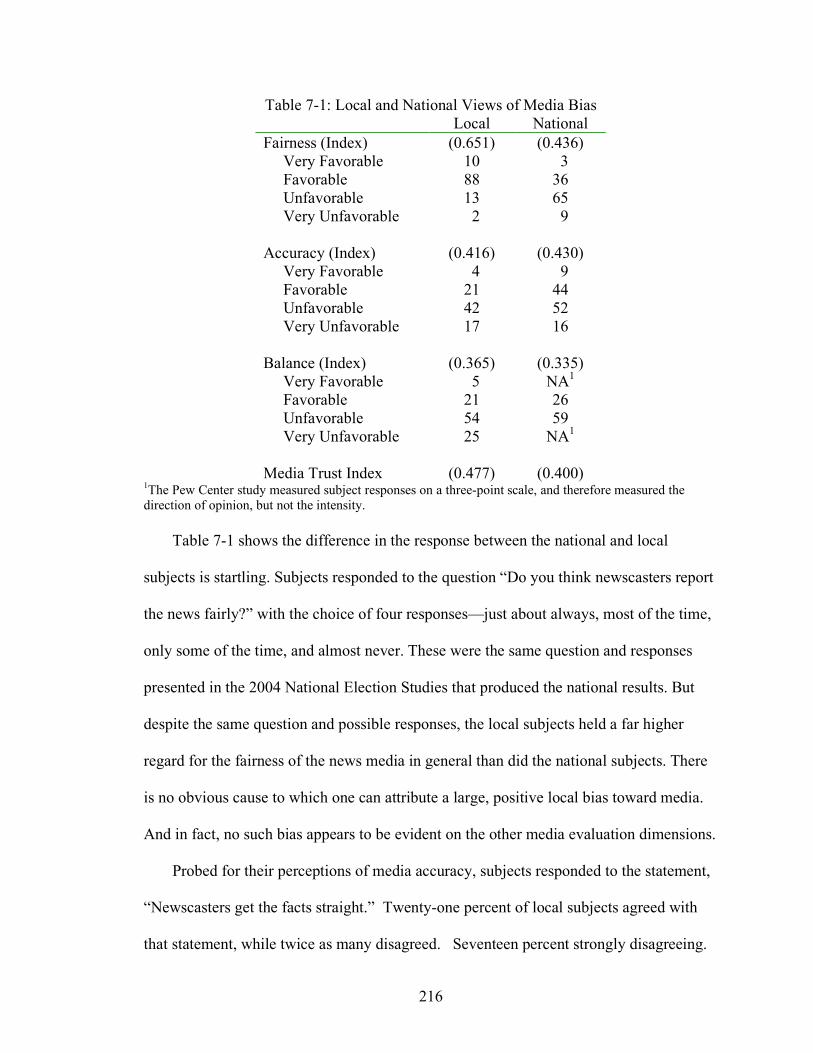
216
Table 7-1: Local and National Views of Media Bias Local National Fairness (Index) (0.651) (0.436) Very Favorable 10 3 Favorable 88 36 Unfavorable 13 65 Very Unfavorable 2 9 Accuracy (Index) (0.416) (0.430) Very Favorable 4 9 Favorable 21 44 Unfavorable 42 52 Very Unfavorable 17 16 Balance (Index) (0.365) (0.335) Very Favorable 5 NA1 Favorable 21 26 Unfavorable 54 59 Very Unfavorable 25 NA1
Media Trust Index (0.477) (0.400)
1The Pew Center study measured subject responses on a three-point scale, and therefore measured the direction of opinion, but not the intensity.
Table 7-1 shows the difference in the response between the national and local
subjects is startling. Subjects responded to the question “Do you think newscasters report
the news fairly?” with the choice of four responses—just about always, most of the time,
only some of the time, and almost never. These were the same question and responses
presented in the 2004 National Election Studies that produced the national results. But
despite the same question and possible responses, the local subjects held a far higher
regard for the fairness of the news media in general than did the national subjects. There
is no obvious cause to which one can attribute a large, positive local bias toward media.
And in fact, no such bias appears to be evident on the other media evaluation dimensions.
Probed for their perceptions of media accuracy, subjects responded to the statement,
“Newscasters get the facts straight.” Twenty-one percent of local subjects agreed with
that statement, while twice as many disagreed. Seventeen percent strongly disagreeing.
217
That group most strongly in disagreement with a view of media accuracy nearly exactly
mirrors the national subjects’ response at 16 percent. And those with negative perceptions
of accuracy overall total 42 percent—10 percent less than the national survey, but far
closer than the perceptions of fairness.
The question of balance also matches local and national opinion very closely. Local
subjects reacted to the statement, “Newscasters are careful not to be biased.” Twenty-one
percent agreed with the statement locally, while 54 percent disagreed. Nationally, 59
percent perceived media members lacking balance. Locally, 25 percent strongly
perceived that bias. The strongest national perceptions are not available because the most
recent study available, the 2002 Pew Center study only allowed respondents a positive,
negative, or neutral response to a question about media balance.
Comparing Across Different Formats of Questions
Because the local subject perceptions are measured using questions formed from
national polling data, the fairness, accuracy, and balance dimensions come with different
attitudinal scales. To reformat the results for cross comparison, it is possible to use the
standardization procedure discussed in Chapter 5. The procedure involves taking the data
from each question set, local and national, and transforming into a single index by
weighting each attitudinal scale by its corresponding percentage of respondents,
subtracting 1 from that resulting index, and dividing the difference by the number of
scale points minus 1. All measures of perception are then shown as a percentage between
0 and 1 on a consistent scale, with 0 being the most negative evaluation, and 1 being the
most positive (see appendix for a complete description of the transformation). Comparing
218
the resulting indices in Table 7-1 alongside percentages of response generates a snapshot
of the general attitude toward the media for both local and national survey groups.
The comparison of indices shows great similarity between the local and national
sample except across one dimension—fairness. For the local subjects, fairness is seen as
reasonably high, nearly two-thirds of the way up the scale. One way to explain its high
magnitude could be the four-point scale used to assess opinions on that category only.
The scale was chosen to match national surveys asking the same question, but biases the
responses to the positive or negative because of the lack of a central or neutral response
as found on the five-point scale used for the other questions. But while this difference
might explain variation between the local fairness index and those indicating accuracy
and balance perceptions for the local subjects, it cannot explain the difference between
the local fairness index and the national fairness index. Subjects used the same four-point
scale for both measurements. Perhaps the perception that rural and Midwestern residents
are more likely to be less harsh in their evaluations plays some part here. Those who live
away from the big coastal cities have a reputation to be more easygoing, more
neighborly, and more friendly. People can anecdotally describe a kinder attitude from
these non-urban subjects, but could it explain the higher rating on fairness? That is
unlikely. If Midwestern attitudes were responsible for large difference in the perceptions
of media performance, then those great differences in perceptions should be evident
across all questions. They generally are not. There is some slightly positive difference in
perceptions of accuracy and balance demonstrated by the local subjects, but not on the
scale of the difference found on the fairness questions. It seems likely the “Midwestern
difference” could explain the 3 percent difference shown in the balance question, but not
219
the large difference in perceptions of fairness. And this explanation falls short explaining
the slightly lower evaluation of accuracy among local subjects.
General Dissatisfaction Across Subjects
Aside from the surprisingly high local fairness evaluation, the perceptions of
media performance fall well below the .500 level. The index calls for a score of 1.000 if
all subjects found media to be doing absolutely perfectly, while a score of 0.000 would
indicate a perception of an absolutely imperfect performance. The midpoint of .500
would indicate a mean perception of neither a good nor bad performance. Since all but
the local fairness index falls below .500, the mean perception for both groups is that
media do an inadequate job of providing fair, accurate, and balanced coverage of the
news. The finding is consistent with the decline in media satisfaction recorded by most
research in the age of television news. When presented with a question on the
performance of abstract or unnamed media members (“Do you think newscasters report
the news fairly?”), subjects often give a more negative response than they do when asked
about specific media members. The abstract questions conjure images of the general
offenses of the media, while questions on specific members of the press bring to mind
qualities and personality of that individual. Thus the negative perceptions of the media
seen nearly universally in the national studies, as well as the local pretest results, reflect
this non-personal attitude on the media. This difference between abstract general media
perceptions and specific individual evaluations becomes more important in the posttest
analyses.
220
Ideological Differences are Minimal
While the composite perceptions of the subject groups showed some minor
differences from national surveys, how would the group differ within and between its
own members? This study revolves around predicted ideological differences in stimuli
and response of subjects; therefore it is logical to examine the initial differences ideology
correlates with among local subjects. Would conservatives and liberals define fairness,
accuracy, and balance in the same way? This is an important question if there is to be an
understanding of the differences in perceptions between viewers of different ideological
backgrounds. If the opposites ends of the spectrum define fairness, accuracy, and balance
in substantially the same way, then a common set of questions will yield similar
perceptions by members of both ideological groups.
To begin, ideology of local subjects was determined by three questions asked in
the recruitment pretest questionnaire. First, subjects were asked to place themselves on a
seven-point scale from extremely conservative to extremely liberal. Next, subjects were
asked to give an opinion on the responsibility of government to provide services to its
people. Subjects could prefer fewer services than are now provided, more services, or
maintaining the current level of services. Those who chose fewer services were coded as
conservative, while those who asked for more services were designated to be liberal.
Finally, subjects were asked to react to two differing roles of government, and to select
the proper role. One statement said simply, “The less the government, the better.”
Subjects who chose this role for government were categorized as conservatives. The
other statement relayed the opinion, “There are more things government should be
doing.” Those who chose that statement were placed in the liberal designation. Results of
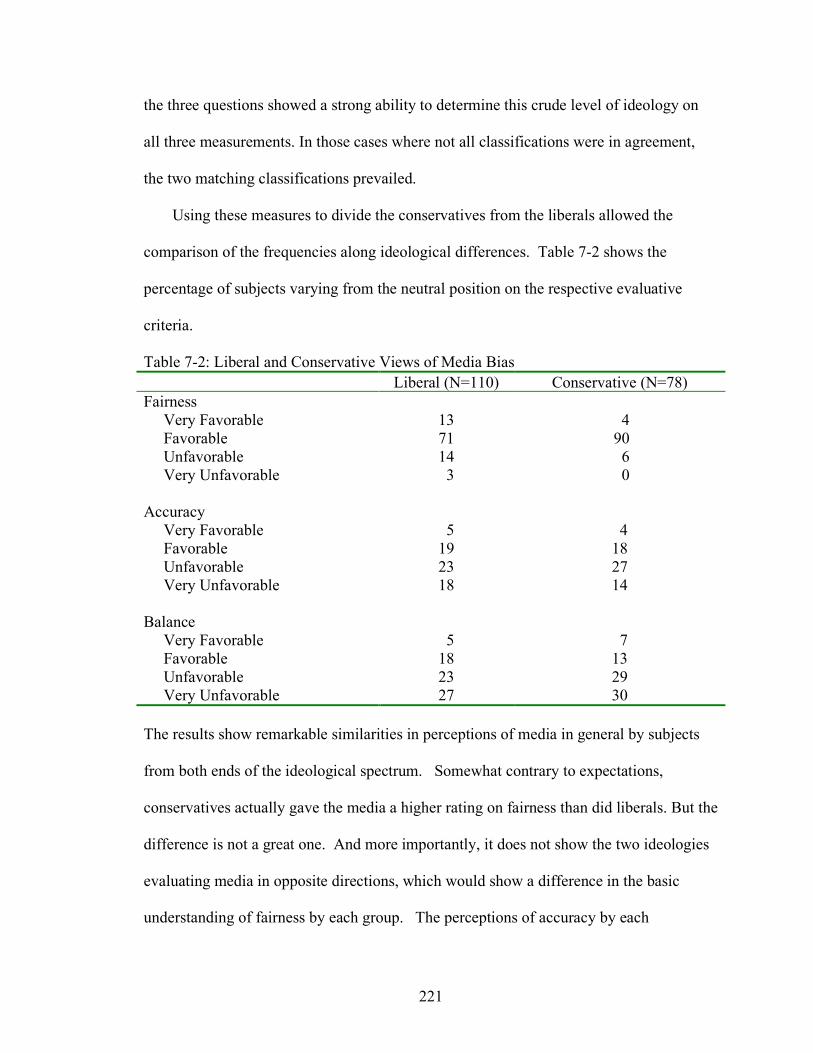
221
the three questions showed a strong ability to determine this crude level of ideology on
all three measurements. In those cases where not all classifications were in agreement,
the two matching classifications prevailed.
Using these measures to divide the conservatives from the liberals allowed the
comparison of the frequencies along ideological differences. Table 7-2 shows the
percentage of subjects varying from the neutral position on the respective evaluative
criteria.
Table 7-2: Liberal and Conservative Views of Media Bias Liberal (N=110) Conservative (N=78) Fairness Very Favorable 13 4 Favorable 71 90 Unfavorable 14 6 Very Unfavorable 3 0 Accuracy Very Favorable 5 4 Favorable 19 18 Unfavorable 23 27 Very Unfavorable 18 14 Balance Very Favorable 5 7 Favorable 18 13 Unfavorable 23 29 Very Unfavorable 27 30 The results show remarkable similarities in perceptions of media in general by subjects
from both ends of the ideological spectrum. Somewhat contrary to expectations,
conservatives actually gave the media a higher rating on fairness than did liberals. But the
difference is not a great one. And more importantly, it does not show the two ideologies
evaluating media in opposite directions, which would show a difference in the basic
understanding of fairness by each group. The perceptions of accuracy by each
222
ideological group are almost identical, again showing a similar basis on which to judge
accuracy, regardless of ideological point of view. And while conservatives were slightly
less likely to find the media balanced in their approach, the difference is not large and, as
with the evaluations of fairness, shows the evaluation is done the same way by both
groups. Comparing only the extremely positive or negative opinions in does not separate
the ideologies either. Both liberals and conservatives were far more likely to rate media
performance extremely negatively than they were to rate it extremely positively. The
fairness dimension once again stands apart from the perceptions on the other two
dimensions. No conservatives held an extreme negative view in relation to fairness, but 4
percent had the extreme positive view. Three percent of liberals held the extreme
negative view, but 10 percent more had the extreme positive view. Since nearly all
subjects chose the safer central position when evaluating media fairness, it may be that
the subjects as a whole do not understand exactly what “fairness” is in terms of media.
Without a clear notion of what fairness is, it is difficult to get emotionally connected to
the topic to develop a very strong opinion about. Since those strong opinions are seen on
both the accuracy and balance dimensions, we can assume a better subject understanding
of those terms.
Those stronger feelings about media accuracy and balance tip toward the
negative. Both liberals and conservatives line up in greater numbers with very
unfavorable views of accuracy than very favorable views. Thirteen percent more liberals
and 10 percent more conservatives see the media doing a very bad job with accuracy than
doing a good job. Even more strongly, 22 percent more liberals and 23 percent more
conservatives perceive the media doing a very bad job with balance than see it doing a
223
very good job. The very similar percentages contradict the commonly-held notion that
conservatives are the strongest critics of the news media and its perceived liberal bias,
while liberals sit back and enjoy the bias to their benefit. In fact, both ideological groups
among these subjects are equally discontented with the performance of media as a whole.
Ultimately, the ideological comparison of the results shows a great consistency
between the ends of the political spectrum regarding the role of the media in doing their
jobs. Conservatives and liberals generally agreed on the quality of the work of the media.
That agreement showed similar agreement on how the reporting should be done. And the
fact that both groups rate the media highly on fairness shows some agreement between
how journalists define fairness and how the audiences—regardless of ideology—do as
well.
A Developmental Difference in Critical Thinking
The pretest comparisons of the subjects based on their ideology show a similar
thought pattern in their approach to critical analysis of media performance. Regardless of
political beliefs, the subjects shared common complaints about the media, as well as a
standard view of the media role in delivering the news. That shared analytical
perspective not only produced similar pretest views of media performance when
comparing subjects of differing ideological perceptions, but showed a common view of
media when broken down by sex, age, and income as well. The numbers of subjects
falling into the non-white racial category was too small to produce any meaningful
analysis. But it was possible to demonstrate a difference in the view of the media when
analyzing subjects based on their educational level. Here, it was possible to find
224
statistically significant differences in perceptions of media fairness and balance when
comparing low education and high education subjects.
Subjects were divided into two groups—those who had attended college and those
who had no college experience. But unlike the previous comparisons of pair of subject
groups, the split by educational level shown in Table 7-3 yields some fairly large
differences in perceptions of media performance. Those with no college educational
experience are considerably less critical of media performance than those with at least
some college education. The non-college subjects are more than four times as likely to
view media fairness very favorably, more than nine times as likely to view media
accuracy very favorably, and nearly three times as likely to give the same high marks to
media balance. The relative differences are not as strong at the other end of the scale,
where the views of media are fairly similar. Only in their analysis of balance in the
media were the non-college educated subjects kinder—about half as likely to rate the
media very unfavorably on balance.
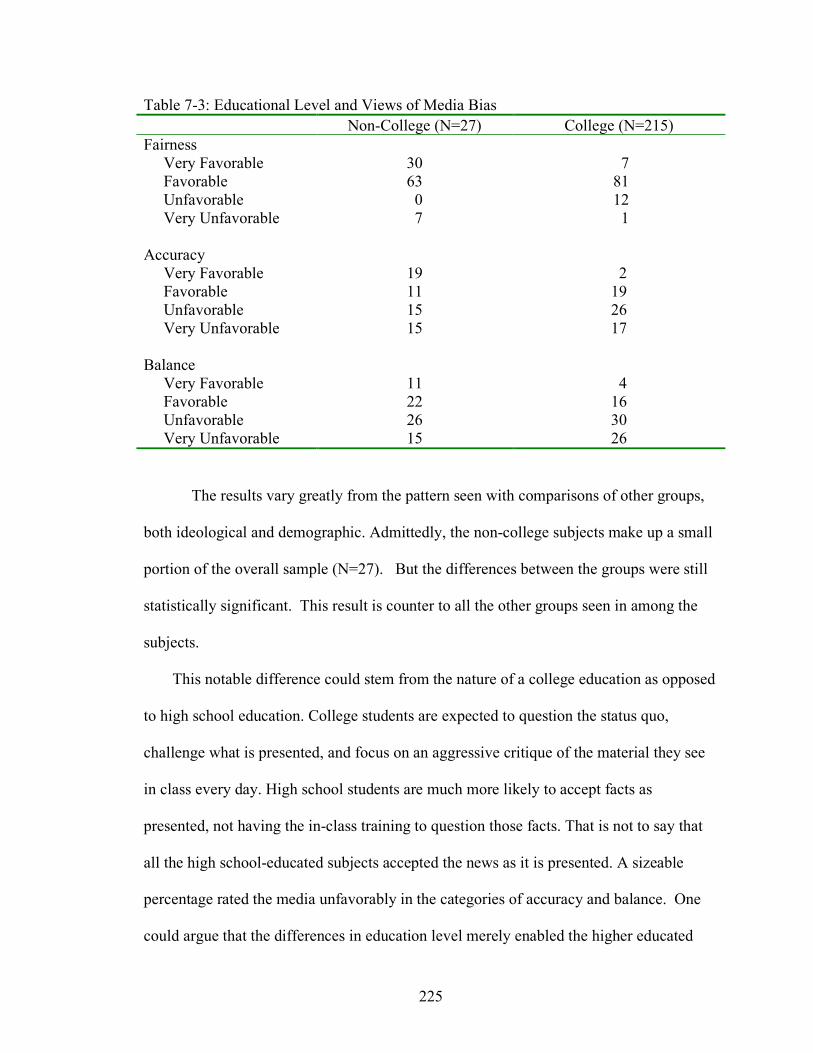
225
Table 7-3: Educational Level and Views of Media Bias Non-College (N=27) College (N=215) Fairness Very Favorable 30 7 Favorable 63 81 Unfavorable 0 12 Very Unfavorable 7 1 Accuracy Very Favorable 19 2 Favorable 11 19 Unfavorable 15 26 Very Unfavorable 15 17 Balance Very Favorable 11 4 Favorable 22 16 Unfavorable 26 30 Very Unfavorable 15 26
The results vary greatly from the pattern seen with comparisons of other groups,
both ideological and demographic. Admittedly, the non-college subjects make up a small
portion of the overall sample (N=27). But the differences between the groups were still
statistically significant. This result is counter to all the other groups seen in among the
subjects.
This notable difference could stem from the nature of a college education as opposed
to high school education. College students are expected to question the status quo,
challenge what is presented, and focus on an aggressive critique of the material they see
in class every day. High school students are much more likely to accept facts as
presented, not having the in-class training to question those facts. That is not to say that
all the high school-educated subjects accepted the news as it is presented. A sizeable
percentage rated the media unfavorably in the categories of accuracy and balance. One
could argue that the differences in education level merely enabled the higher educated
226
subjects to make ideology a more salient factor in their evaluation of media. But two facts
argue against that supposition. First, as shown earlier in the chapter, the differences in
perceptions due to ideology were not significant. Second, if those with low education
level are removed from the analysis, the ideological differences in those subjects
remaining do not contribute to a significant difference in media views. This leaves the
more likely explanation to be that those subjects who attended college received the
training to be more critical consumers of news. That training would allow them to
perceive poor performance more easily and to convert those experiences into meaningful
analyses of the overall ability of the media to remain fair, accurate, and balanced. Those
who did not receive that additional training would be less likely to perceive and express
negative perceptions of the media.
Comparisons between National and Local Perceptions
The pretest perceptions of the media by local subjects are similar to the national
survey results in both the direction of the opinion and the strength of it. The percentage of
favorable opinions of the media across all three evaluative dimensions is largely below
50 percent, both locally and nationally. The exception falls only on the questions of
fairness, where the lack of a neutral evaluation on the scale forced a more positive result.
But in spite of that artifact of the survey, local subjects have a perception the news media
are more fair than the national polls (which used the same scale) would suggest is the
commonly held belief. Eighty-seven percent of local subjects found the news media to
be fair, while only 35 percent felt the same way nationwide. While a difference that large
does not seem to show similarity between the subject sample and the general population,
227
a look at those with the most unfavorable view of the media in each group tells a different
story. Those who felt the media did the worst job on fairness measured 9 percent in the
national poll, and 2 percent in the local sample. That difference is much smaller than
seen with those less passionate about their view, and somewhat blunts the difference
between the two groups.
Comparing Subjects by Media Trust Indices
One final method to use for evaluation of national and local difference, as well as
difference between and within the experimental groups, is to compare those groups using
the media fairness, accuracy, balance, and overall trust indices developed in Chapter 5.
This standardized mean of all respondents allows single number comparison of the
relative perceptions of each group and subgroup. Those indices above .500 show a mean
positive attitude toward that evaluative dimension, while those below show a negative
attitude. The strength of those attitudes becomes more apparent as the indices approach
the fully positive index of 1.000, or the fully negative index of 0.000.
The indices in Table 7-4 show that nationally, perceptions of media fairness are
negative, while the local sample is fairly positive. That is, in part, an effect of the four-
point scale used for that question. Perceptions of media accuracy and balance are
negative over all, and both consistent with national data. The far right column gives the
overall media trust index for each group, showing that both local and national data define
a media audience critical of its performance. Local subjects are less negative than studies
show the nation to be. Following down that rightmost column, conservatives and liberals
in the local subject groups share virtually identical views of media performance, while
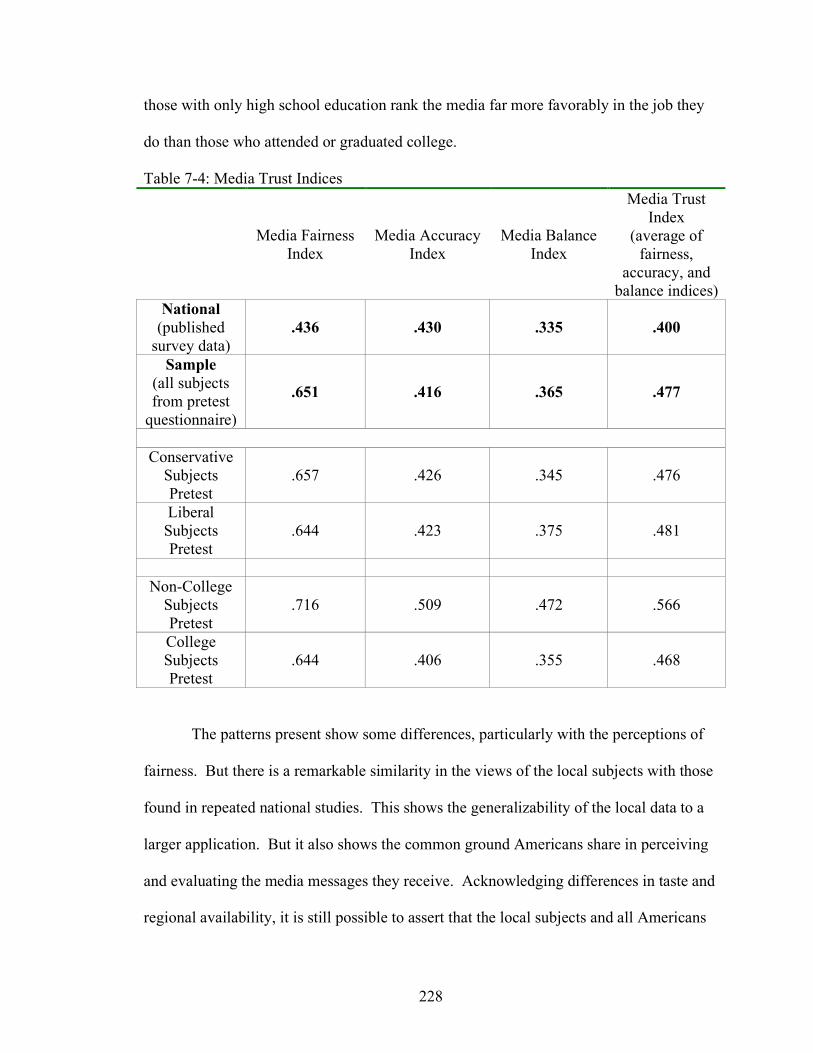
228
those with only high school education rank the media far more favorably in the job they
do than those who attended or graduated college.
Table 7-4: Media Trust Indices
Media Fairness Index
Media Accuracy Index
Media Balance Index
Media Trust Index
(average of fairness,
accuracy, and balance indices)
National (published
survey data) .436 .430 .335 .400
Sample (all subjects from pretest
questionnaire)
.651 .416 .365 .477
Conservative
Subjects Pretest
.657 .426 .345 .476
Liberal Subjects Pretest
.644 .423 .375 .481
Non-College
Subjects Pretest
.716 .509 .472 .566
College Subjects Pretest
.644 .406 .355 .468
The patterns present show some differences, particularly with the perceptions of
fairness. But there is a remarkable similarity in the views of the local subjects with those
found in repeated national studies. This shows the generalizability of the local data to a
larger application. But it also shows the common ground Americans share in perceiving
and evaluating the media messages they receive. Acknowledging differences in taste and
regional availability, it is still possible to assert that the local subjects and all Americans
229
view the same aggregate media. They receive similar messages and see similar flaws in
those messages and the way in which they are processes and delivered.
Evaluation of Effect of Subject Differences
What effect could the differences among experimental subject and the national
perceptions have on the outcome of these experiments? The primary source of the
differences among local subject groups comes from the random assignment of subjects to
relatively small groups. Each experimental group consisted of approximately twenty
subjects viewing a single exposure and treatment approach. Approximately 60 subjects
took part in each exposure range. With groups of that number, the random assignment of
approximately 240 subjects cannot erase all variations in demographic differences.
Opinion grouping differences will also form in each subgroup.
Any differences in the anticipated results could point to experimental effects worth
noting and evaluating on their own. But beyond the experimental effects, differences in
perceptions by individual subjects, once correlated with pretest attitudinal differences,
could reveal perceptual or other screening processes that affect each subject’s evaluation
of the media product.
One other effect to observe is how the differences between the national media
perceptions and local subject perceptions will appear in the posttest outcomes. The
composite media trust index for the nation shows a population less pleased with the job
the media do than the local subjects would appear to share. While the 8 percent difference
in the index is not particularly large, it does show a direction in which local subjects seem
to lean regarding their views of the media. Midwestern values and customs could make it
230
more difficult for subjects to be critical of what they perceive. And the effect of watching
an apparently local newscaster may be the biggest influence to produce a more positive
opinion of the news media than the abstract evaluation given at the national level and in
the local pretest. Surveys of opinions about local news and newscasters rank them far
higher than any general view of the news media in which local institutions and journalists
are not cited. The Radio Television News Directors Foundation asked local news viewers
to evaluate the television news they watch in terms of fairness and balance, as well as
overall credibility. Those polled rated the local news as 85 percent fair, with 20 percent
finding it very fair (RTNDF 2000). Despite asking question mirroring national polling,
the local survey yielded figures far higher than the 36 percent finding the media fair and 9
percent finding the media very fair in the latest National Election Studies poll. Fifty-five
percent in the RTNDF poll find local television news to be balanced in its coverage
(RTNDF 2000). The 2004 NES poll puts that percentage at 26 percent.
The combination of a local subject group more likely to evaluate journalists in a
positive manner, combined with the appearance of a “local” newscaster delivering the
news, may cloud the perceptions subjects have of the manipulated news content they see.
While the local subjects are a reasonably good duplication of television news viewers
everywhere, the experimental differences may introduce additional elements to be
considered in the final evaluation of the outcome of those experiments.
231
Chapter 8: Viewer Perceptions of Media Bias Across Exposures
At the heart of this research is the question of whether visual or verbal cues about
the opinions of newscasters will be perceived by viewers and influence their trust in
media. That trust can be measured through perceptions of fairness, accuracy, and balance
in news presentations. Studies show consumers have overall negative views of the news
media in general, though there are more positive evaluations of specific members of the
media. The base judgments individuals make on the media exist as a latent structure of
evaluation, able to serve as a starting point for perceiving new media messages.
Commonly accepted theories of perceptual screening expect new information will have
little effect to change consumers’ views of media performance. Most are not finely
attuned to changes in content that will signal subtle bias. Therefore the challenge of the
experiment is to determine at what level—if any—a biased message will break through
the perceptual screens and have the ideological force to change the inertia of individual
set perceptions.
The precipitating news media memo featured in Chapter 1 sprang from a belief
that some television news viewers would perceive a small lapel pin as a sign of the
ideological position of a newscaster. That belief assumes a very sensitive perception on
the part of those viewers to focus on that symbol amidst all the other visual and auditory
information present in a television news presentation. If professional norms in
journalism are to call for no outward symbols that might be perceived as ideologically
biased—no matter how small—then is there experimental data to show that such an edict
is at all effective in portraying a perceivable image to the viewers? If that data exists,
232
then viewers are much more sensitive to ideological clues than most research predicts.
This chapter will explore at what level the subjects were able to perceive the bias inserted
in the news presentation, and what force was necessary to break through the inertia of
their latent beliefs about the news media to allow them to more negatively evaluate
newscaster performance than they would normally by likely to do.
Random Assignment of Subjects to Exposure Groups
Pretest examinations of the local subjects show most demographic differences are
inconsequential to the evaluation they have of media performance. Only level of
education impacted the ability of subjects to think critically and question the performance
of the media. With that analysis complete, it was possible to turn to examining the
effects of written and visual bias in the presentation of the local newscaster. Subjects
were randomly assigned to exposure and treatment groups or a control group. There were
three exposure groups (soft, moderate, and hard), three treatment groups (patriotism, gay
marriage, and abortion), and control groups for each treatment group as well as another
control group not actually brought to the experiment. In all, subjects were divided
between those thirteen possible groups for assignment.
Random assignment of the subjects to the groups does not necessarily ensure that
the groups will come to the experiment with the same preconceptions of media
performance. But an examination of the pretest responses divided by exposure group
allows any pattern of bias in group assignments to be apparent. Table 8-1 shows the
favorable and unfavorable percentages for each of the exposure groups of approximately
60 subjects each.
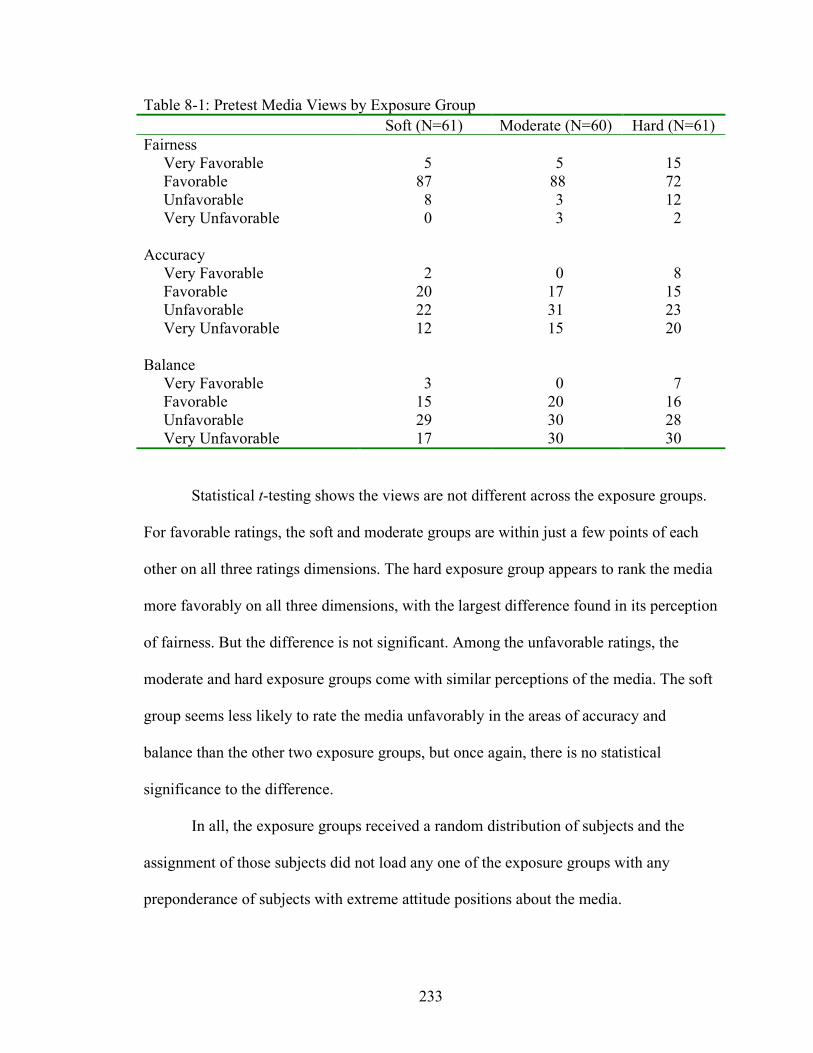
233
Table 8-1: Pretest Media Views by Exposure Group Soft (N=61) Moderate (N=60) Hard (N=61) Fairness Very Favorable 5 5 15 Favorable 87 88 72 Unfavorable 8 3 12 Very Unfavorable 0 3 2 Accuracy Very Favorable 2 0 8 Favorable 20 17 15 Unfavorable 22 31 23 Very Unfavorable 12 15 20 Balance Very Favorable 3 0 7 Favorable 15 20 16 Unfavorable 29 30 28 Very Unfavorable 17 30 30 Statistical t-testing shows the views are not different across the exposure groups.
For favorable ratings, the soft and moderate groups are within just a few points of each
other on all three ratings dimensions. The hard exposure group appears to rank the media
more favorably on all three dimensions, with the largest difference found in its perception
of fairness. But the difference is not significant. Among the unfavorable ratings, the
moderate and hard exposure groups come with similar perceptions of the media. The soft
group seems less likely to rate the media unfavorably in the areas of accuracy and
balance than the other two exposure groups, but once again, there is no statistical
significance to the difference.
In all, the exposure groups received a random distribution of subjects and the
assignment of those subjects did not load any one of the exposure groups with any
preponderance of subjects with extreme attitude positions about the media.
234
With the pretest perceptions of the subjects providing a starting point, it is
possible to begin to examine perceptions of the impartiality of news brought on by the
experimental manipulation of the newscast content. The subjects were randomly
assigned to one of twelve experimental groups for the in-person experiment. Each of the
three treatments (patriotism, gay marriage, and abortion) had three exposure levels (soft,
moderate, and hard), plus a control group. Approximately 20 subjects were assigned to
each group. Subjects in each group saw a videotape that consisted of a segment of a
non-controversial Dateline NBC segment on art theft. The NBC segment was identical
for each group. But within that segment, subjects in non-control groups also saw a local
news break. That news break was presented differently to each group. Those in the soft
exposure group heard the news presented in what most journalists would perceive to be
an unbiased fashion. But they saw a lapel pin on the anchor sympathetic to one
controversial story in the news break. Those in the moderate group also saw the same
pin, but heard the controversial story written in a somewhat biased fashion, favoring one
side of the conflict. And those subjects in the hard exposure group saw the pin, as well as
the newscaster participating in a rally with one side in the controversial story. That group
also heard a news script severely biased toward the same side.
After viewing the videotape segments containing the newscast variables, the
subjects answered a questionnaire concerning their perceptions of fairness, accuracy, and
balance in the video they had just seen, and once again about the media in general. The
hypotheses of this experiment predict that all subjects would evaluate the newscaster
more negatively due to the consistent introduction of a lapel pin to add bias to each
experimental exposure. Those subjects who saw the “soft” exposure would see no more
235
bias in the reporting, as the verbal communication for that exposure level was presented
in an unbiased manner. The hypotheses call for those who saw the “moderate” exposure
level to find the newscaster more biased, due to the lapel pin, as well as the introduction
of some biased language in the writing of the report. And finally, the hypotheses predict
those who saw the “hard” exposure level tapes would find the newscaster the most
biased, thanks to the pin, the biased language in the written presentation, and the
additional video of the newscaster participating in a rally supporting one side of the issue.
Differences in Perceptions of Newscaster by Exposure Level
Subjects ranked the fairness, accuracy, and balance of the stories on either a four
or five point scale, with the highest ranking being the most favorable. The opinions of
each like exposure level across all treatment groups were combined to increase the total
subjects in each subsample. The standardization procedure introduced in Chapter 5 was
used to prepare the data for comparison across differing scales. The procedure involves
taking the data from each question set, and transforming into a single index by weighting
each attitudinal scale. The process yields a mean score—between 0 and 1—that allows
for comparison of the different questions. Means closer to 1 indicate more positive
reaction to the question, while those approaching 0 indicate a more negative reaction (see
appendix for a complete description of the transformation).
Those standardized results for the comparison of exposure levels appear in Table
8-2, which allows a quick comparison on the positive or negative rankings of the
newscaster by exposure level.
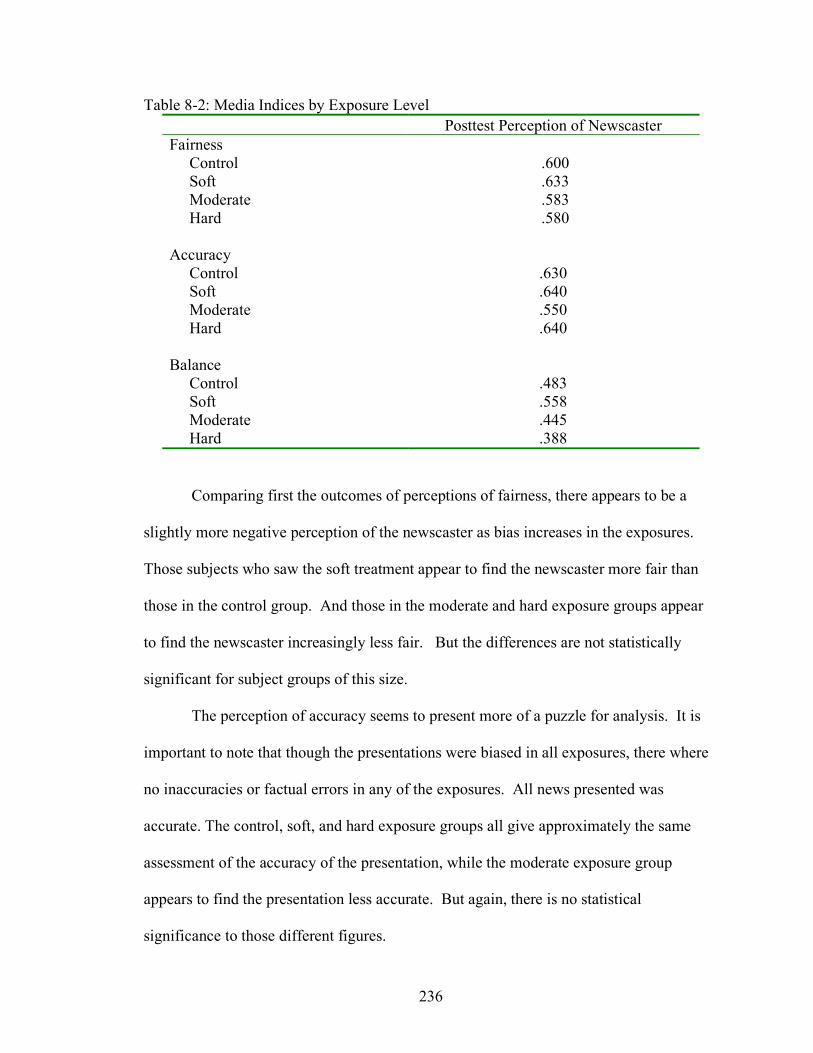
236
Table 8-2: Media Indices by Exposure Level Posttest Perception of Newscaster Fairness Control .600 Soft .633 Moderate .583 Hard .580 Accuracy Control .630 Soft .640 Moderate .550 Hard .640 Balance Control .483 Soft .558 Moderate .445 Hard .388
Comparing first the outcomes of perceptions of fairness, there appears to be a
slightly more negative perception of the newscaster as bias increases in the exposures.
Those subjects who saw the soft treatment appear to find the newscaster more fair than
those in the control group. And those in the moderate and hard exposure groups appear
to find the newscaster increasingly less fair. But the differences are not statistically
significant for subject groups of this size.
The perception of accuracy seems to present more of a puzzle for analysis. It is
important to note that though the presentations were biased in all exposures, there where
no inaccuracies or factual errors in any of the exposures. All news presented was
accurate. The control, soft, and hard exposure groups all give approximately the same
assessment of the accuracy of the presentation, while the moderate exposure group
appears to find the presentation less accurate. But again, there is no statistical
significance to those different figures.
237
The perceptions of balance are most interesting, because the set appears to exhibit
the predicted pattern of response from subjects. Of those non-control subjects, those in
the soft exposure group has the highest mean perception of balance at .558—the only
non-negative perception of balance among all the groups. Those in the moderate group
has the next highest mean, and those in the hard exposure group had the lowest mean at
.388. The relatively small size of each exposure group leaves these differences just
barely falling short of statistical significance however.
The results seem tantalizingly close to showing a measurable impact of the bias
material on the perceptions of viewers. Perhaps a larger sample of subjects participating
in each part of the experiment would have shown significant results. Or repeated trials
with the same subjects over a longer period of time may have helped the effects of the
bias penetrate the perceptual screens of the viewers. In fact, the lack of results—despite
an overwhelmingly biased presentation in the cast of the hard exposure groups—shows
the power of the subjects previous beliefs to deflect the effects of a single exposure that
largely runs counter to those beliefs.
The local newscaster used for the experiment was a person not known to the
experimental subjects, so there was no personal, prior perception of his fairness,
accuracy, or balance within the subjects. But there appeared to have been a strong,
positive reaction to him personally seen in the data.
Change in Perceptions of Fairness from Pretest to Posttest
The lack of a statistically significant difference in newscaster perception between
exposure groups begs a deeper examination for changes brought on by the bias exposure
238
level. Comparing the change in mean perception of bias between pretest, which
measured core levels of bias perception in media in general, to posttest perceptions of the
newscaster and of the media in general could show some change brought on by the
varying levels of bias.
In Table 8-3, three comparisons can be made to determine any effects from the
different levels of experimentation in which the subjects took part. A comparison of the
leftmost and center columns shows the effects of each level of exposure on the aggregate
subject view of the media in general. Experimental hypotheses predict the posttest indices
in the center column will be lower than their corresponding pretest values in leftmost
column, due to the bias introduced by the experiment in the form of the lapel pin and
biased language and video used. Only the control group should remain unchanged since
those subjects saw no biased presentation. Likewise, initial expectations predict a
comparison of leftmost column pretest indices to corresponding values in the rightmost
column would see the same decline. This comparison would relate the pretest perceptions
of media in general to the perceptions subjects have post-testing of the newscaster they
saw in the videotapes during the experiment. Finally, a comparison of the posttest index
values in center column to those in rightmost should show similar values. The subjects’
posttest perceptions of the media in general (seen in the center column) should not differ
greatly from their posttest perceptions of the specific experimental newscaster shown in
rightmost column.
There appears to be a sizeable drop in index values from pretest to posttest
regarding the media in general. Table 8-3 shows the change in indices compared across
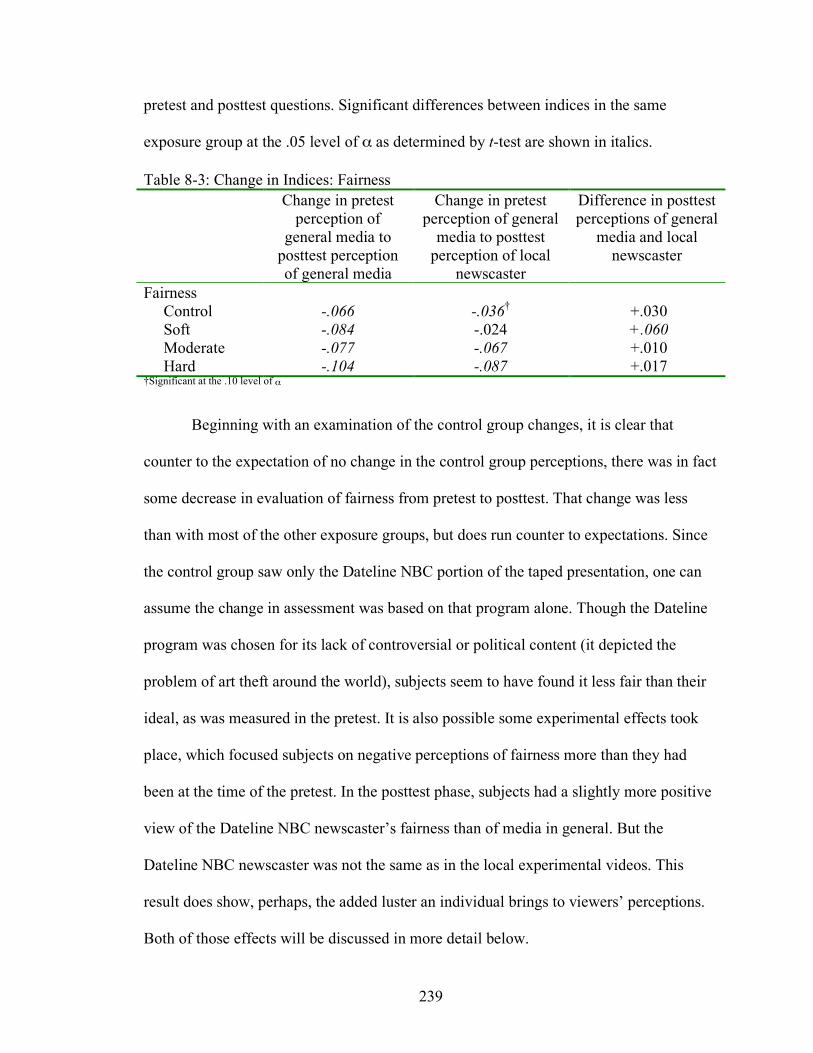
239
pretest and posttest questions. Significant differences between indices in the same
exposure group at the .05 level of α as determined by t-test are shown in italics.
Table 8-3: Change in Indices: Fairness Change in pretest
perception of general media to
posttest perception of general media
Change in pretest perception of general
media to posttest perception of local
newscaster
Difference in posttest perceptions of general
media and local newscaster
Fairness Control -.066 -.036† +.030 Soft -.084 -.024 +.060 Moderate -.077 -.067 +.010 Hard -.104 -.087 +.017 †Significant at the .10 level of α
Beginning with an examination of the control group changes, it is clear that
counter to the expectation of no change in the control group perceptions, there was in fact
some decrease in evaluation of fairness from pretest to posttest. That change was less
than with most of the other exposure groups, but does run counter to expectations. Since
the control group saw only the Dateline NBC portion of the taped presentation, one can
assume the change in assessment was based on that program alone. Though the Dateline
program was chosen for its lack of controversial or political content (it depicted the
problem of art theft around the world), subjects seem to have found it less fair than their
ideal, as was measured in the pretest. It is also possible some experimental effects took
place, which focused subjects on negative perceptions of fairness more than they had
been at the time of the pretest. In the posttest phase, subjects had a slightly more positive
view of the Dateline NBC newscaster’s fairness than of media in general. But the
Dateline NBC newscaster was not the same as in the local experimental videos. This
result does show, perhaps, the added luster an individual brings to viewers’ perceptions.
Both of those effects will be discussed in more detail below.
240
Looking beyond the control group to the experimental exposure groups, there is a
slight pattern to confirm the expectations of the experiment. In the change from pretest
perceptions of general media fairness to posttest perceptions, there appears to be a trend
for the change to be more severe as the bias introduced into the experiment becomes
more severe. All three exposure levels appear to show greater decreases in perceptions of
trust than the control group showed. But the moderate exposure group actually runs
counter to expectations, showing a slightly smaller decrease in fairness perceptions than
the soft exposure group.
A more-expected pattern is present when viewing the change from pretest
perceptions of fairness of the media in general to posttest perceptions of the local
newscaster seen in the experiment. Though the soft exposure group had less of a drop in
its perception than the control group, each of the three experimental exposure group
reported a drop in perceptions of fairness that increased as more bias was added to the
experiment. As expected, the hard exposure group showed the biggest decrease in
perceptions of fairness.
Looking beyond the individual changes in mean perception, it is possible to see
the harshest post-experimental views of media fairness come with the hard exposure
group. Across all measurement dimensions those subjects display the most negative
perception in nearly every case—even if the overall perceptions of the subjects move in
the positive direction. This consistency among hard exposure group subjects lends some
credence to the hypotheses calling for the harshest evaluations to arise from the group.
But perhaps a better question to ask of these results is this—why did not all the subjects
find the hard exposure video to be unfair? The newscaster wears a pin supporting one
241
side of the issue, he reads news copy that supports one side and attacks the other, he
appears at the event being covered working with protestors on his side, and he makes a
blatant appeal at the end of the newscast to support that side. There appears to be some
pressure for subjects to reject what they are seeing as being meaningful in their
evaluation of the fairness of the newscaster and media in general. It remains to be seen if
that same apparent pressure will exist in all exposures. But that effect may be tied to the
local newscaster himself.
Change in Perceptions of Accuracy from Pretest to Posttest
While the pattern of change in perception of fairness following some predicted
patterns, the case was entirely different regarding perceptions of accuracy. As stated
earlier, all the stories shown subjects, no matter how biased, were accurate. But because
most critics of the news media lump accuracy in with fairness and balance when finding
bias, accuracy was tested alongside the other two.
Table 8-4 shows there was actually no decrease at all in perceptions of accuracy
from pretest to posttest (the apparent negative change in the moderate group is not
statistically significant). Instead, in all but one group of subjects, the evaluations of the
local media improved over those made of media in general in the pretest phase
(significant differences between indices in the same exposure group at the .05 level of α
as determined by t-test are shown in italics).
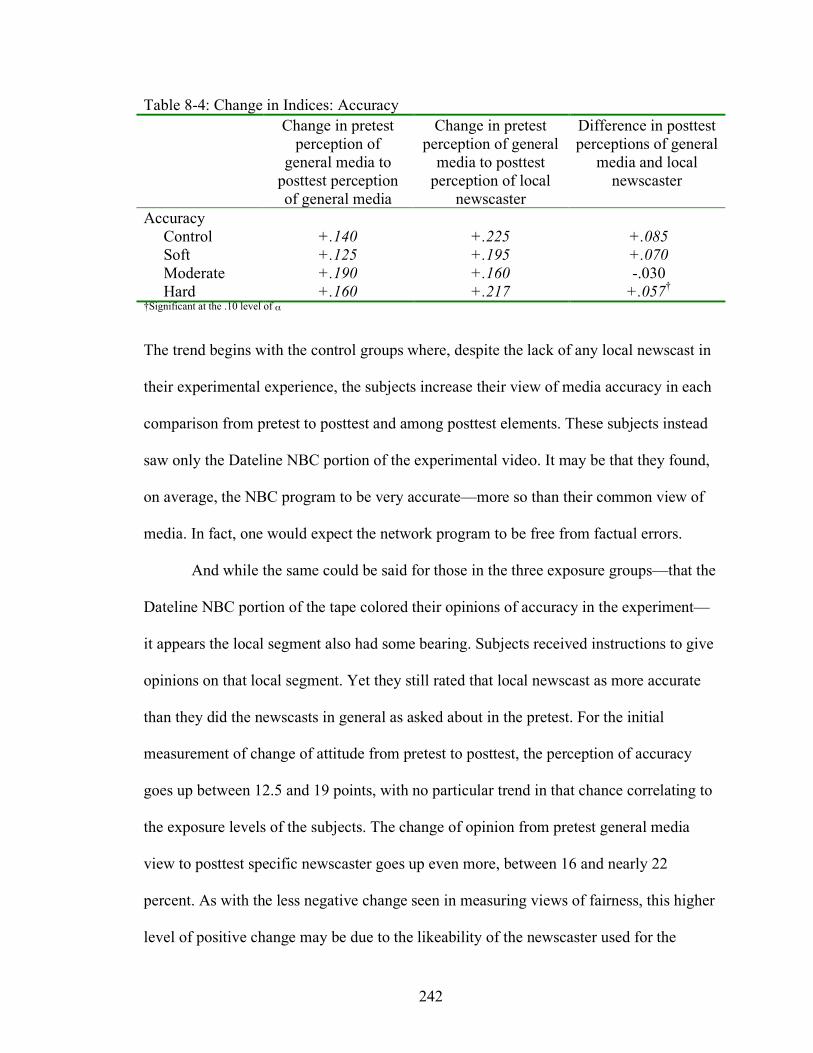
242
Table 8-4: Change in Indices: Accuracy Change in pretest
perception of general media to
posttest perception of general media
Change in pretest perception of general
media to posttest perception of local
newscaster
Difference in posttest perceptions of general
media and local newscaster
Accuracy Control +.140 +.225 +.085 Soft +.125 +.195 +.070 Moderate +.190 +.160 -.030 Hard +.160 +.217 +.057† †Significant at the .10 level of α
The trend begins with the control groups where, despite the lack of any local newscast in
their experimental experience, the subjects increase their view of media accuracy in each
comparison from pretest to posttest and among posttest elements. These subjects instead
saw only the Dateline NBC portion of the experimental video. It may be that they found,
on average, the NBC program to be very accurate—more so than their common view of
media. In fact, one would expect the network program to be free from factual errors.
And while the same could be said for those in the three exposure groups—that the
Dateline NBC portion of the tape colored their opinions of accuracy in the experiment—
it appears the local segment also had some bearing. Subjects received instructions to give
opinions on that local segment. Yet they still rated that local newscast as more accurate
than they did the newscasts in general as asked about in the pretest. For the initial
measurement of change of attitude from pretest to posttest, the perception of accuracy
goes up between 12.5 and 19 points, with no particular trend in that chance correlating to
the exposure levels of the subjects. The change of opinion from pretest general media
view to posttest specific newscaster goes up even more, between 16 and nearly 22
percent. As with the less negative change seen in measuring views of fairness, this higher
level of positive change may be due to the likeability of the newscaster used for the
243
experiment. And finally, the difference in opinion from local newscaster to news in
general, both posttests are mixed. One group of subjects, those seeing the moderate
exposure level, found the local newscaster less accurate, while the other two groups
found him to be more accurate.
If the reason for the increased perceptions of accuracy among almost all the
subjects are not to be attributed to the Dateline NBC program, then what could be the
cause for the nearly unanimous change in perception from pretest to post. It is once again
possible to suggest that some experimental effect is at work in the change in attitudes. As
noted when evaluating the change in the control group members’ views of fairness, the
impact of asking people to come to take part in an experiment must certainly focus them
on the task at hand and make them re-evaluate their views of media. The pretest caught
them by surprise, but even with some time passing between pretest and the administration
of the experiment, the “assignment” of taking part in an experiment focuses the subjects
on the task. Then, when confronted with the Dateline NBC program (which appeared
accurate in every way) and/or the local news break (which, while biased, was also
accurate in total), the many of subjects found that they saw news presentations that were
more accurate than those the conjured from thin air at the time of the pretest. Then, a
quick question on accuracy evoked horror stories. But the pretest offered nothing horrible
in terms of accuracy, and those earlier views softened.
Perhaps the most interesting observation to arise from the comparison of the
changes in perceptions of accuracy is that the subjects seem to be able to detach their
perceptions of bias in fairness from their perceptions of accuracy. Despite finding the
local news less fair than their views of the news media in general, the bulk of the subjects
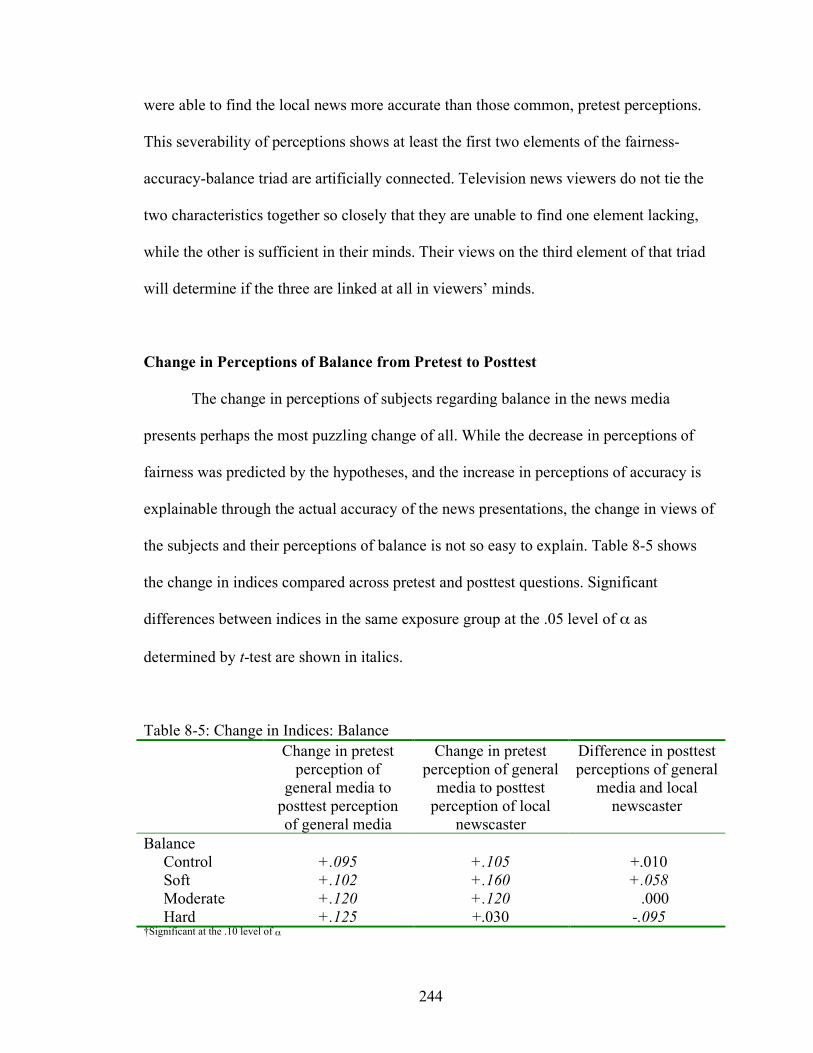
244
were able to find the local news more accurate than those common, pretest perceptions.
This severability of perceptions shows at least the first two elements of the fairness-
accuracy-balance triad are artificially connected. Television news viewers do not tie the
two characteristics together so closely that they are unable to find one element lacking,
while the other is sufficient in their minds. Their views on the third element of that triad
will determine if the three are linked at all in viewers’ minds.
Change in Perceptions of Balance from Pretest to Posttest
The change in perceptions of subjects regarding balance in the news media
presents perhaps the most puzzling change of all. While the decrease in perceptions of
fairness was predicted by the hypotheses, and the increase in perceptions of accuracy is
explainable through the actual accuracy of the news presentations, the change in views of
the subjects and their perceptions of balance is not so easy to explain. Table 8-5 shows
the change in indices compared across pretest and posttest questions. Significant
differences between indices in the same exposure group at the .05 level of α as
determined by t-test are shown in italics.
Table 8-5: Change in Indices: Balance Change in pretest
perception of general media to
posttest perception of general media
Change in pretest perception of general
media to posttest perception of local
newscaster
Difference in posttest perceptions of general
media and local newscaster
Balance Control +.095 +.105 +.010 Soft +.102 +.160 +.058 Moderate +.120 +.120 .000 Hard +.125 +.030 -.095 †Significant at the .10 level of α
245
Much like the findings of changes in perceptions of accuracy, most of the subjects
actually improved their view of the news media and the local newscaster subsequent to
seeing the experimental videos. The change between pretest and posttest perceptions of
the general news media went up fairly consistently across the control and all
experimental groups, ranging from a 9.5 to 12.5 point increase. This change is consistent
with some of the similar shifts seen on the other two dimensions of the fairness-accuracy-
balance evaluation criteria. There once again seems to be an experimental effect that, by
focusing the attention of the subjects on the media for the time between the pretest and
posttest, focuses them on the specific, more positive work down by journalists in that
brief period. The focus on those specifics balances some of the “horror stories” subjects
had in their minds at the time of the pretest, leaving them with a slightly more positive
feeling on the media in general. This focus on what the media are doing correctly would
explain why there is a fairly consistent positive change among both the control and
experimental groups. It would argue that it cannot be due to the experimental videos with
the manipulated content, which the control groups’ subjects did not see.
The change in perception regarding the local newscaster, however, appears to
show more than just the experimental effect of a focus on more positive aspects of media.
All the assessments are once again more positive than the pretest notions regarding media
balance. But the control is somewhat of a midpoint, while the soft exposure subjects
found the newscaster to be more balanced, and the hard exposure group found him to be
less balanced. When compared to the change for the media in general, as seen by the
subjects posttest, the local newscaster exceed the general media perceptions for the soft
group, is the same for the moderate group, and drops nearly ten percent for the hard
246
exposure group. This difference in perceptions of the local newscaster as compared to
media in general would tend to indicate a harsher evaluation of balance from the subjects
regarding the performance seen in the experimental videos. The soft exposure group saw
the newscaster present a balanced account of the news. They find him likeable, and
reflect that in their aggregate positive evaluation of his abilities, as compared to their
perceptions of media in general. The moderate group saw a somewhat less balanced
presentation by the local newscaster, but his likeable nature mitigates their criticism of
his handling of the content and he ends up evaluated much the same way as the general
media. But the hard exposure group does not let the newscaster’s personal charm
overwhelm the grossly unbalanced presentation it sees. Subjects in that group were able
to separate their views of the general media from this specific performance by a single
newscaster, finding the general media better in balancing the news than they did in their
hasty, pretest evaluation, but finding this local newscaster substantially less balanced than
their revised general view.
The balance measurements show up as an interesting amalgam of the fairness and
accuracy examinations. While the groups were consistent in their more negative
evaluations of the fairness dimension across all exposures, and more positive across all
exposures when perceiving accuracy, the split between positive and negative on the
balance question shows that there appears to be a threshold at which preconceived
notions of media trust aspects must be reconsidered. The subjects were able to forgive
what they saw in the local newscast if it did not push the limits of what they would
consider to be balanced coverage too much. But as the bias reached its maximum, they
had to rate the local newscaster more harshly than the media in general. Again, the effect
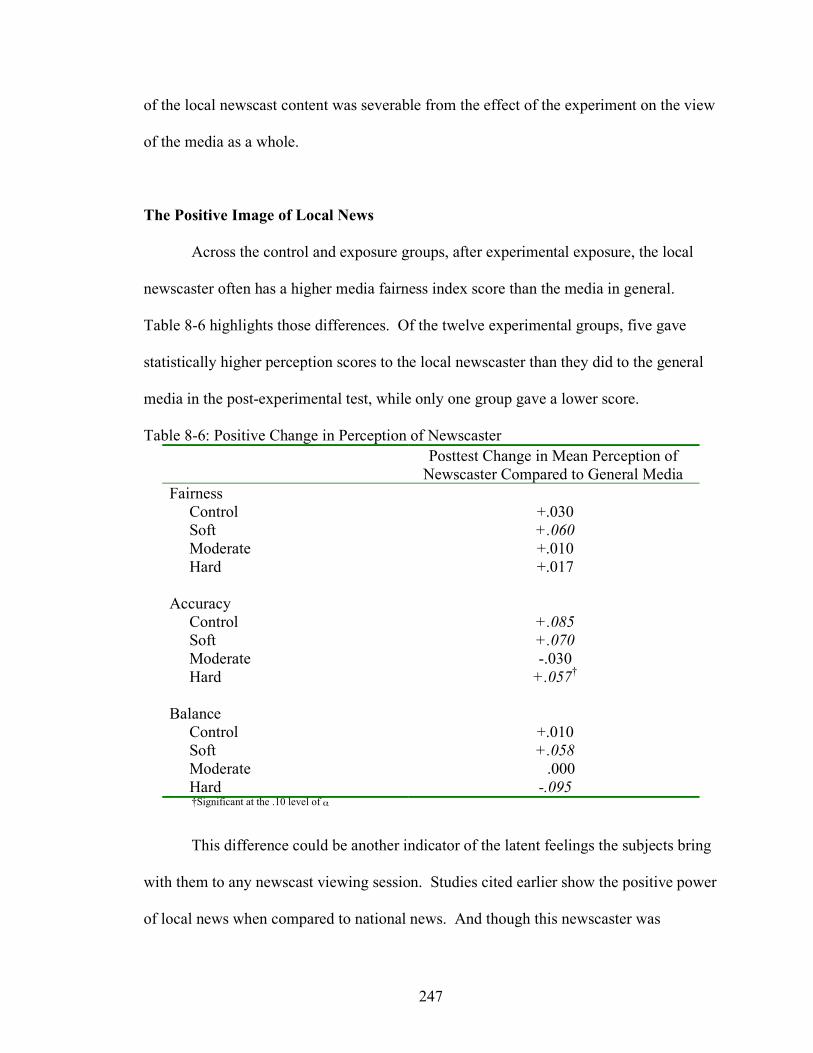
247
of the local newscast content was severable from the effect of the experiment on the view
of the media as a whole.
The Positive Image of Local News
Across the control and exposure groups, after experimental exposure, the local
newscaster often has a higher media fairness index score than the media in general.
Table 8-6 highlights those differences. Of the twelve experimental groups, five gave
statistically higher perception scores to the local newscaster than they did to the general
media in the post-experimental test, while only one group gave a lower score.
Table 8-6: Positive Change in Perception of Newscaster Posttest Change in Mean Perception of
Newscaster Compared to General Media Fairness Control +.030 Soft +.060 Moderate +.010 Hard +.017 Accuracy Control +.085 Soft +.070 Moderate -.030 Hard +.057† Balance Control +.010 Soft +.058 Moderate .000 Hard -.095
†Significant at the .10 level of α
This difference could be another indicator of the latent feelings the subjects bring
with them to any newscast viewing session. Studies cited earlier show the positive power
of local news when compared to national news. And though this newscaster was
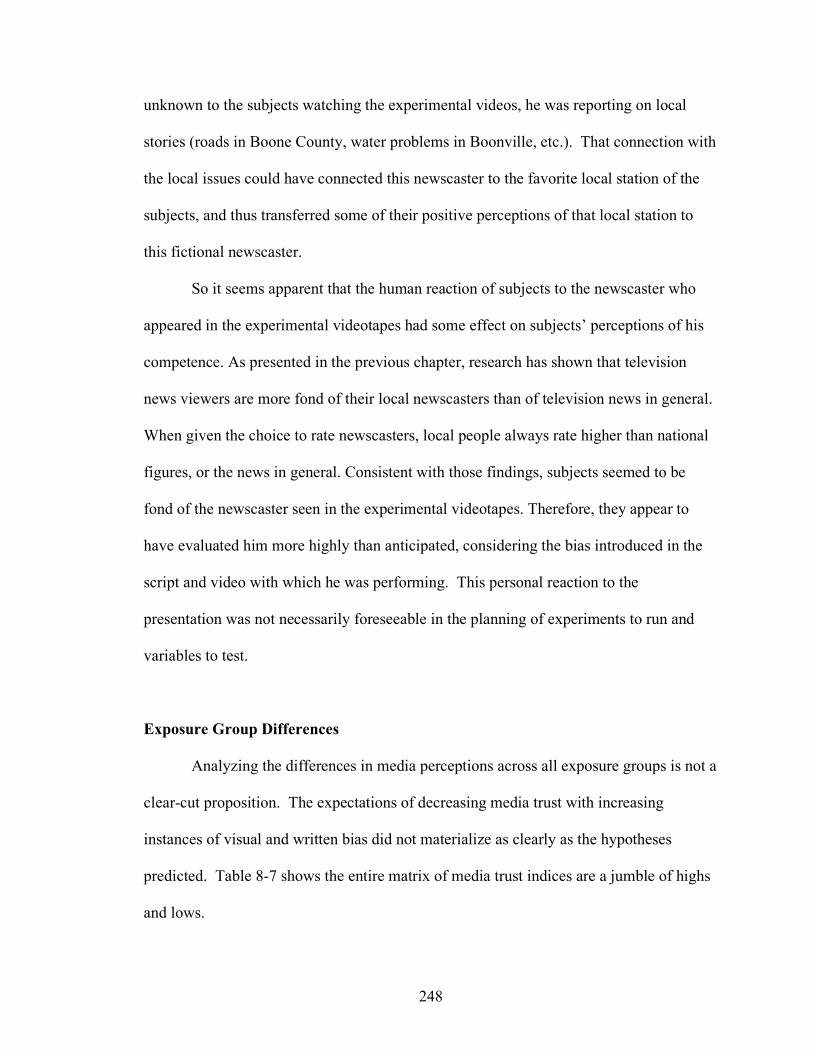
248
unknown to the subjects watching the experimental videos, he was reporting on local
stories (roads in Boone County, water problems in Boonville, etc.). That connection with
the local issues could have connected this newscaster to the favorite local station of the
subjects, and thus transferred some of their positive perceptions of that local station to
this fictional newscaster.
So it seems apparent that the human reaction of subjects to the newscaster who
appeared in the experimental videotapes had some effect on subjects’ perceptions of his
competence. As presented in the previous chapter, research has shown that television
news viewers are more fond of their local newscasters than of television news in general.
When given the choice to rate newscasters, local people always rate higher than national
figures, or the news in general. Consistent with those findings, subjects seemed to be
fond of the newscaster seen in the experimental videotapes. Therefore, they appear to
have evaluated him more highly than anticipated, considering the bias introduced in the
script and video with which he was performing. This personal reaction to the
presentation was not necessarily foreseeable in the planning of experiments to run and
variables to test.
Exposure Group Differences
Analyzing the differences in media perceptions across all exposure groups is not a
clear-cut proposition. The expectations of decreasing media trust with increasing
instances of visual and written bias did not materialize as clearly as the hypotheses
predicted. Table 8-7 shows the entire matrix of media trust indices are a jumble of highs
and lows.
249
Table 8-7: All Media Indices by Exposure Level Column 1:
Pretest Perception of General Media
Column 2: Posttest Perception of
General Media
Column 3: Posttest Perception
of Newscaster Fairness Control .636 .570 .600 Soft .657 .573 .633 Moderate .650 .573 .583 Hard .667 .563 .580 Accuracy Control .405 .545 .630 Soft .445 .570 .640 Moderate .390 .580 .550 Hard .423 .583 .640 Balance Control .378 .473 .483 Soft .398 .500 .558 Moderate .325 .445 .445 Hard .358 .483 .388
The soft exposure level was intended to test the lapel pin effects by comparing a
non-biased newscast to subject expectations, with the only variable to be the lapel pin
worn by the newscaster. It was expected that the pin would cause viewers to see the
newscaster as less fair, less accurate, and less balanced than their ideal type, as measured
in their pretest and posttest general evaluations. In fact, there was no reduction in the
evaluation of the newscaster due to the introduction of the pin variable when compared to
the control groups (which did not see the pin). In fact, the local newscaster is regarded
more highly than the media in general by subjects in most exposure groups across all
three evaluative criteria. The lapel pin alone appears to have had no negative effect and
could possibly have had a positive effect on the subjects’ evaluation of the newscaster.
Interestingly, subjects in the soft exposure groups did change their perceptions of the
media in general more negatively in the evaluation of fairness. But perceptions of
250
accuracy and balance were higher posttest for all in the soft exposure groups. This, once
again, could likely be due to a positivity effect of asking subjects to focus on media
performance for the experiment itself, thereby erasing some vague notions of poor media
performance, and replacing them with specific examples of at least adequate
performance.
The moderate exposure groups appear to begin to show the effects of the
experimental video on the subjects’ opinions of the media. While the attitudes about
general media accuracy and balance still rise as compared with their pretest levels—most
likely due to the same experimental effects as the soft exposure groups—the evaluations
of general media fairness appear to drop for all three evaluations. It is possible the
positivity effect seen with the soft exposure subjects is overridden by the biased language
used in the moderate presentations. It is important to note, however, that the stories in
each exposure group contain no inaccuracies. Rather, they are contrived to be unfair and
unbalanced. So perceptions of accuracy proper should not be affected by the videotape
exposure. Still, there is the possibility of guilt by association if the subjects have begun to
perceive the newscaster as lacking the journalistic skills to remain fair and balanced.
The subjects in the hard exposure groups appear to have reached the point that
the biased presentation does cross the threshold between what they will accept as
trustworthy journalism. There is fairly clear evidence in the fairness evaluation that the
effects seen among the hard exposure group subjects shows they not only found the local
newscaster less fair, but also attributed some of his sins to the media in general. There
was no such effect in terms of accuracy, however, which remained evaluated as high
among the hard exposure group subjects. In the evaluation of balance, though, it was seen
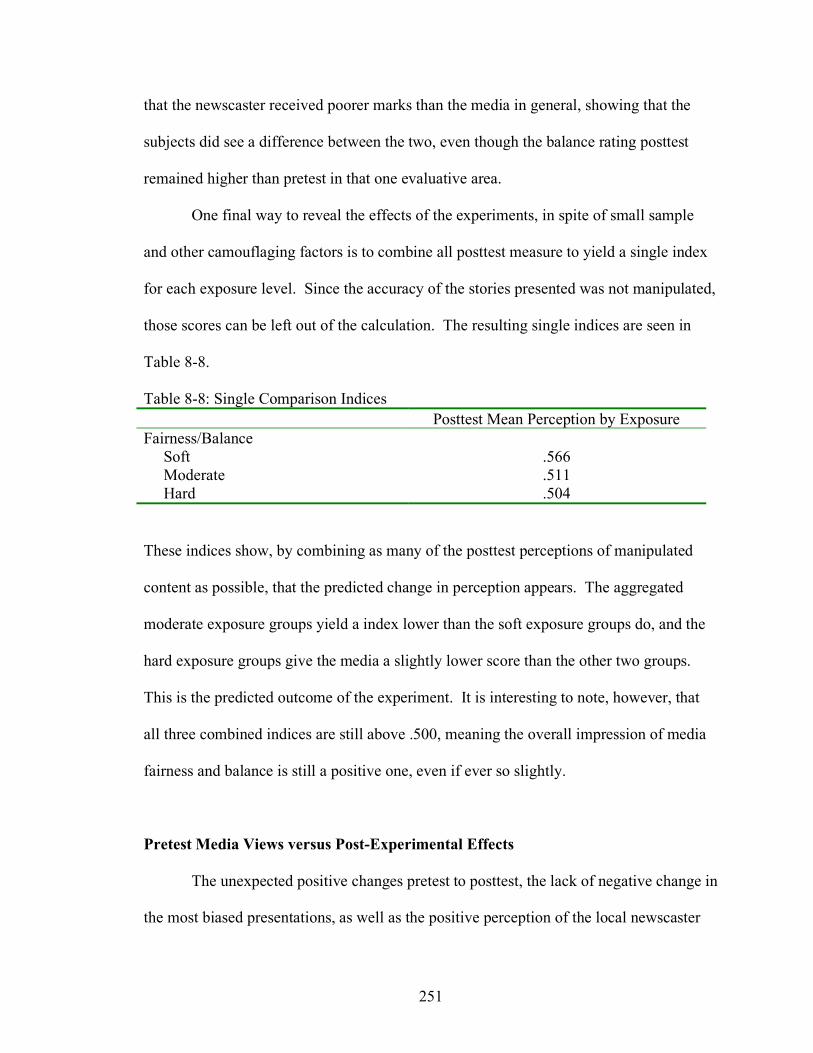
251
that the newscaster received poorer marks than the media in general, showing that the
subjects did see a difference between the two, even though the balance rating posttest
remained higher than pretest in that one evaluative area.
One final way to reveal the effects of the experiments, in spite of small sample
and other camouflaging factors is to combine all posttest measure to yield a single index
for each exposure level. Since the accuracy of the stories presented was not manipulated,
those scores can be left out of the calculation. The resulting single indices are seen in
Table 8-8.
Table 8-8: Single Comparison Indices Posttest Mean Perception by Exposure
Fairness/Balance Soft .566 Moderate .511 Hard .504
These indices show, by combining as many of the posttest perceptions of manipulated
content as possible, that the predicted change in perception appears. The aggregated
moderate exposure groups yield a index lower than the soft exposure groups do, and the
hard exposure groups give the media a slightly lower score than the other two groups.
This is the predicted outcome of the experiment. It is interesting to note, however, that
all three combined indices are still above .500, meaning the overall impression of media
fairness and balance is still a positive one, even if ever so slightly.
Pretest Media Views versus Post-Experimental Effects
The unexpected positive changes pretest to posttest, the lack of negative change in
the most biased presentations, as well as the positive perception of the local newscaster
252
could be attributable to experimental effect or a well-researched effect found in local
television news research, or could demonstrate measurement of two different variables by
the experiments. In regards to the changes in the control group perceptions, when
questioned during the recruitment phase of the experiment, the subjects were asked their
opinions on the media before being asked to take part in the video phase of the
experiment. Subjects were simply asked to answer some questions about their views on
government and the media. The subjects were unable to take time to prepare for the
interview, give more attention to media content, or contemplate their feelings on the state
of media performance. The answers they gave to the telephone interviewers were their
instinctual reactions, not tempered by time or thought. This mental state produced
responses that displayed the latent perceptions of the news media. These impressions, on
the average, were quite negative, built from a history with the media.
But once asked to participate in person for the experiment, the subjects let those
core feeling about the media remain at rest, and viewed the tapes without preconceived
ideas. This approach yielded lower evaluations in some cases, higher in others, as
compared to the pretest. But subjects had no conscious association between the two
measurement events. So the comparisons between pretest and posttest perceptions of
media do not yield predicted results because they, in terms of the reference perspective of
the subjects, do not measure two points in time on the same variable.
While it is impossible to control for that effect, as well as the positive feelings
toward the newscaster in these limited experiments, the data in this chapter appear to
indicate the experiment would yield the expected results if it were possible to measure
only for them. Future experiments into this topic may produce more meaningful results
253
if it is possible to measure the views of the subjects on the same issues of media
performance, rather than across different issues.
254
Chapter 9: Do Issues Matter?
Change in Perceptions of Media Trust by Issue
Analysis of the subject reactions to varying levels of bias in the newscast
presentation were blunted by local newscaster popularity and perceptual screening that
deflected much of the negative perceptual change. Perhaps the issues covered on the
local news breaks did not reach a high enough salience to register on the subjects’
collective consciousness. But the examinations in the last chapter were done by
combining all three issue areas covered in the experiments—patriotism, gay marriage,
and abortion. If those issues were analyzed separately, would there be a difference based
on issue salience? This question can make the experimental data more meaningful by
soliciting more information about how the subjects reacted to the bias among certain
issue areas. Those areas, ranging from consensual issues to very divisive ones, help
define the range of reaction subjects exhibit. It is possible to evaluate the individual issue
effects separately by combining exposure levels, but dividing all subjects by issue
examined.
Most who involve themselves in politics like to think that issues matter. It is
comforting to believe that voters and viewers alike consider salient issues differently than
those that do not matter to them, and allocate their attention according to some hierarchy
of needs and desires that might be brought about by political attention to those issues. If
this view is consistent with reality, than the substance of the issues used in this
experiment should affect subjects differently. Those that are more controversial should
split the subjects groups, leaving some subjects seeing bias while others do not. But those
255
that are commonly held in the same regard among subjects should not see that difference
in opinions.
But this approach to analysis is not without its pitfalls. First, television news is
often devoid of many ideological details and positions. It is, but its very nature, a simple
telling of simple stories, with pictures and sound to match. Television reporters run
toward fires and car accidents—and often run away from complex policy stories with big
ideas. Therefore, viewers do not relate seeing strong issue content on television very
often. Add to that the increasingly obvious evidence that the trust viewers have in local
newscasters—even those they have not seen before—counteracts a lot of faults they
would find in news coverage. So while important issue and policy stories might rise
higher on an individual subject’s personal salience structure, the role of television news
and its likeable presenters will work strongly to erase any perceptions of bias from the
viewer’s perceptions.
Patriotism: A Non-Issue?
When determining the order of issues, but consensual to divisive, patriotism
appears a good place to begin. It may be difficult to call it an issue at all. But the story
used in the news break centers on the recital of the pledge of allegiance in school, so that
can be considered the issue for that set of subjects. Bias was added to this experiment
with the flag lapel pin of the newscaster, the script that gave a favorable description of
pro-pledge protestors, and the involvement of the newscaster in the pledge rally.
Expectations of attitude change among subjects who see this video are low, since
reverence for the American flag, support of the pledge of allegiance, and patriotism in
256
general are common beliefs held by most Americans and therefore, most of the subjects.
That common view gives rise to the expectation that there will be little difference in
attitudes between the pretest and posttest evaluations the patriotism subjects give. For if
the subjects see no harm in displaying patriotic symbols on their lapels, or requiring
children to recite the pledge of allegiance in schools, there is an intrinsic lack of
motivation to see a newscaster who exhibits the same behaviors as biased. At the same
time, those subjects who do not see the call to support the pledge in schools (those in the
soft and moderate exposure groups), there is no stimulus there to see bias either. So the
difference between those groups should be minimal, and the mean difference of all
groups, pretest to posttest, should be minimal.
Gay Marriage: Unpopular, But Not Divided
Just as images of patriotism and the pledge share a common meaning to many,
gay marriage also lines up many citizens on the same side of the line. Public opinion
polls show many people oppose legal, same-sex marriages. In states where there has been
a popular vote to allow same-sex marriages, a large majority of voters have said no to the
legal right. That majority consistently sees same-sex marriage as wrong, and does not see
gray areas. Conversely, those in favor of setting up the legal framework for same-sex
marriages see no gray area either. They are typically in favor of that legal right, and have
no reservations or limits on it outside those also placed on opposite sex couples.
Because of this preponderance of people on one side of this issue, this issue
should take on similar, but opposite perception changes as the patriotism issue. The
newscaster calls for legalizing gay marriage, and thus most subjects should find him at
257
odds with their position on the issue. This is the opposite case from the patriotism
stories. This predicts a lower index score for fairness and balance for the newscaster
than seen for the patriotism treatment. Accuracy is once again not manipulated in the
experiment, and should not show the same effects as the other two dimensions.
Abortion: The Sides Divide
Moving away from the relative agreement found in majorities which support
displays of patriotism, and oppose gay marriage, subjects in the final group of
experiments saw bias surrounding an issue that has been controversial for most of their
lives. For more than thirty years, the legal status of abortion has been the subject of
lawsuits, political debate, and divided public opinion in the United States. People differ in
their opinions of whether abortion should be illegal, but those differences are not black
and white. As stated in Chapter 6, there are mitigating factors that can move opinion from
an anti-abortion stance to one of permitting the procedure. Those factors include the
health of the mother, birth defects in the fetus, of a pregnancy that results from rape or
incest. So while a person may consider themselves anti-abortion or “pro-life,” that
seemingly solid position can change if presented with one of these factors.
This middle ground in which the issue position depends on the specific
circumstances of the case, rather than on a dogmatic following of an immoveable belief
muddies the water for this experiment. Those subjects who see the newscaster wearing a
pro-life lapel pin or supporting anti-abortion protestors may be able to evaluate that
support in different ways. If they see the protestors as a group wanting to end abortion on
demand as a birth control option, then there are many who would feel the same way. But
258
if they see those same protestors as a force to put an end to abortions to save mothers’
lives, or end a pregnancy following incest or rape, the numbers on that side of the issue
would be very small. Because of the possibility that subjects may read the intent of the
protestors differently, it is possible to assume that there will be a stronger change in
attitude pretest to posttest than seen with the patriotism or gay marriage subjects, yet not
so much change that there is a drastic shift caused by either the “Pro Life” lapel pin or the
biased news copy or video. This ambivalence in the message sent by the protestors and
the newscaster will split the groups, allowing more of an effect to show in media trust
evaluations than in the other two treatment groups where the message is much more
unequivocal.
Random Assignment to Treatment Groups
Before beginning the analysis of subject perceptual change, it is important to
measure the distribution of subjects by treatment group to assure random distribution.
Subjects were randomly assigned to the patriotism, gay marriage, or abortion treatment
groups. Pretest measures of the subjects’ set views of media show, in Table 9-1, that
subjects of any one set of beliefs were not overly represented in any one treatment group.
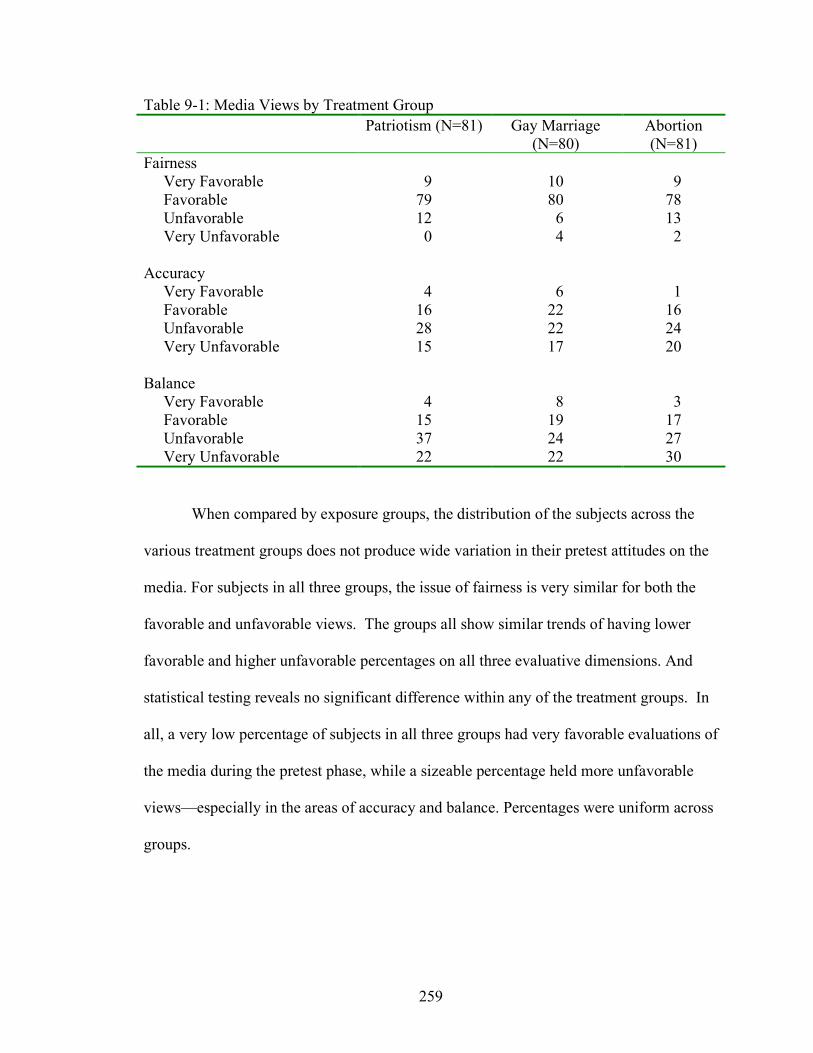
259
Table 9-1: Media Views by Treatment Group Patriotism (N=81) Gay Marriage
(N=80) Abortion (N=81)
Fairness Very Favorable 9 10 9 Favorable 79 80 78 Unfavorable 12 6 13 Very Unfavorable 0 4 2 Accuracy Very Favorable 4 6 1 Favorable 16 22 16 Unfavorable 28 22 24 Very Unfavorable 15 17 20 Balance Very Favorable 4 8 3 Favorable 15 19 17 Unfavorable 37 24 27 Very Unfavorable 22 22 30
When compared by exposure groups, the distribution of the subjects across the
various treatment groups does not produce wide variation in their pretest attitudes on the
media. For subjects in all three groups, the issue of fairness is very similar for both the
favorable and unfavorable views. The groups all show similar trends of having lower
favorable and higher unfavorable percentages on all three evaluative dimensions. And
statistical testing reveals no significant difference within any of the treatment groups. In
all, a very low percentage of subjects in all three groups had very favorable evaluations of
the media during the pretest phase, while a sizeable percentage held more unfavorable
views—especially in the areas of accuracy and balance. Percentages were uniform across
groups.
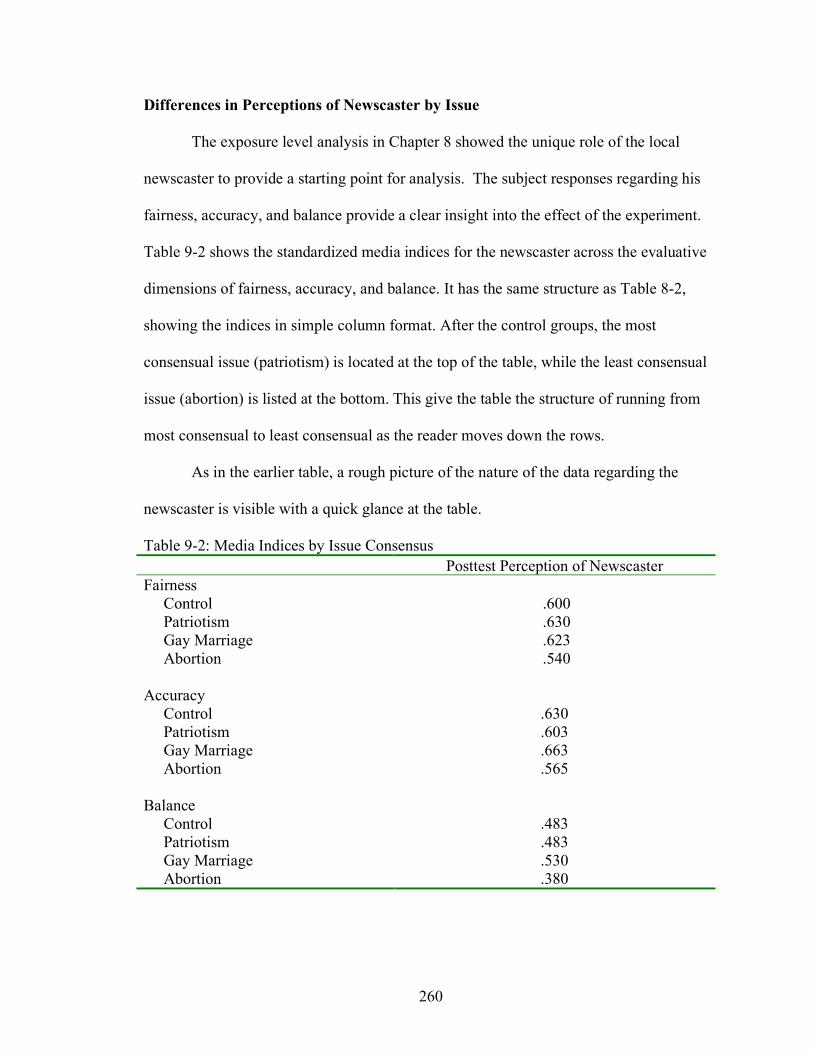
260
Differences in Perceptions of Newscaster by Issue
The exposure level analysis in Chapter 8 showed the unique role of the local
newscaster to provide a starting point for analysis. The subject responses regarding his
fairness, accuracy, and balance provide a clear insight into the effect of the experiment.
Table 9-2 shows the standardized media indices for the newscaster across the evaluative
dimensions of fairness, accuracy, and balance. It has the same structure as Table 8-2,
showing the indices in simple column format. After the control groups, the most
consensual issue (patriotism) is located at the top of the table, while the least consensual
issue (abortion) is listed at the bottom. This give the table the structure of running from
most consensual to least consensual as the reader moves down the rows.
As in the earlier table, a rough picture of the nature of the data regarding the
newscaster is visible with a quick glance at the table.
Table 9-2: Media Indices by Issue Consensus Posttest Perception of Newscaster Fairness Control .600 Patriotism .630 Gay Marriage .623 Abortion .540 Accuracy Control .630 Patriotism .603 Gay Marriage .663 Abortion .565 Balance Control .483 Patriotism .483 Gay Marriage .530 Abortion .380
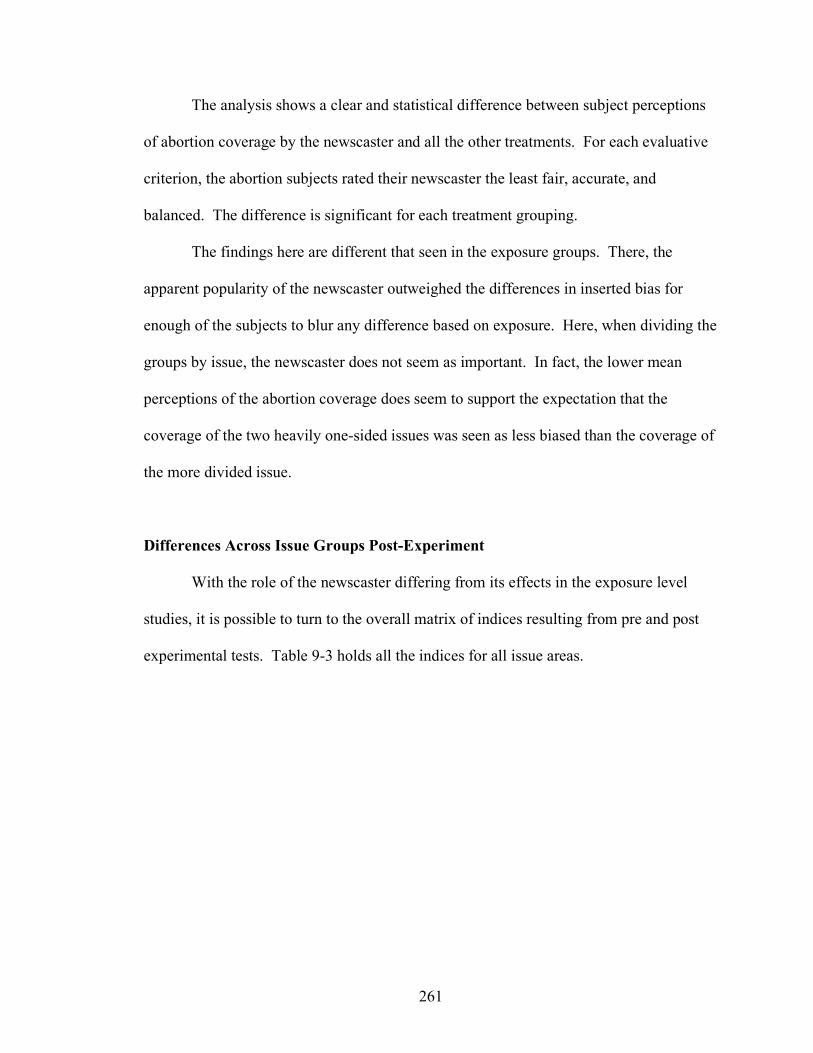
261
The analysis shows a clear and statistical difference between subject perceptions
of abortion coverage by the newscaster and all the other treatments. For each evaluative
criterion, the abortion subjects rated their newscaster the least fair, accurate, and
balanced. The difference is significant for each treatment grouping.
The findings here are different that seen in the exposure groups. There, the
apparent popularity of the newscaster outweighed the differences in inserted bias for
enough of the subjects to blur any difference based on exposure. Here, when dividing the
groups by issue, the newscaster does not seem as important. In fact, the lower mean
perceptions of the abortion coverage does seem to support the expectation that the
coverage of the two heavily one-sided issues was seen as less biased than the coverage of
the more divided issue.
Differences Across Issue Groups Post-Experiment
With the role of the newscaster differing from its effects in the exposure level
studies, it is possible to turn to the overall matrix of indices resulting from pre and post
experimental tests. Table 9-3 holds all the indices for all issue areas.
262
Table 9-3: Media Indices by Issue Consensus Column 1:
Pretest Perception of General Media
Column 2: Posttest Perception of
General Media
Column 3: Posttest Perception
of Newscaster Fairness Control .636 .570 .600 Patriotism .660 .580 .630 Gay Marriage .660 .610 .623 Abortion .650 .520 .540 Accuracy Control .405 .545 .630 Patriotism .410 .570 .603 Gay Marriage .448 .633 .663 Abortion .403 .528 .565 Balance Control .378 .473 .483 Patriotism .305 .480 .483 Gay Marriage .415 .500 .530 Abortion .360 .450 .380
Examining the patriotism group first, it is possible to see that across nine
opportunities for measurement, those who took part in this experimental exposure to the
manipulated newscast gave the news media higher index ratings than the control group in
five of the nine instances, neutral in one of those instances, and lower in the remaining
three. The subjects viewing the patriotism experiment ranked the media consistently
higher on fairness at every measurement point, both pretest and posttest. Accuracy was
also higher with this group on all but its evaluation of the local newscaster. And the
evaluation of balance was mixed, with the pretest much lower than the control group, but
the posttests the same to slightly higher. This general tendency for the patriotism subjects
to see the media performance more favorably posttest is somewhat consistent with
expectations that the consensual nature of the patriotism debate will make it difficult for
the subjects to find bias in the presentation.
263
The subjects who saw the gay marriage subjects did not follow the predicted
pattern. It is quickly evident that group of subjects was exceedingly positive in its
evaluations, rating the media higher than the control abortion groups on each of the nine
measurement opportunities, and higher than the patriotism group on seven of nine
opportunities. The range of positivity runs from just less than 2 percent up to nearly 9
percent.
The subjects viewing the abortion experiment were much more negative than both
the control subjects and the patriotism subjects. Of the nine measurement opportunities,
the abortion subjects scored the media lower than both the control and patriotism groups
on eight. Only on their pretest evaluation of general media fairness did the abortion group
subjects rank higher than the control group.
So patterns relating to the type of treatment subjects saw are hard to make out
amidst the data present. The fact that those in the abortion treatment groups were harsher
critics of the local and general media than those in the other groups does support the
assertion that the split nature of the issue raised its salience among the subjects.
With those general differences in mind, some expected, some surprising, it is
possible to examine the statistical significance of each difference, as well as its individual
meaning in terms of fairness, accuracy, and balance by isolating those evaluative areas
and looking at the changes within.
Change in Perceptions of Fairness from Pretest to Posttest
An analysis of the change from pretest to posttest may show that the apparent lack
of a newscaster effect among the issue treatments may not actually exist. Table 9-4
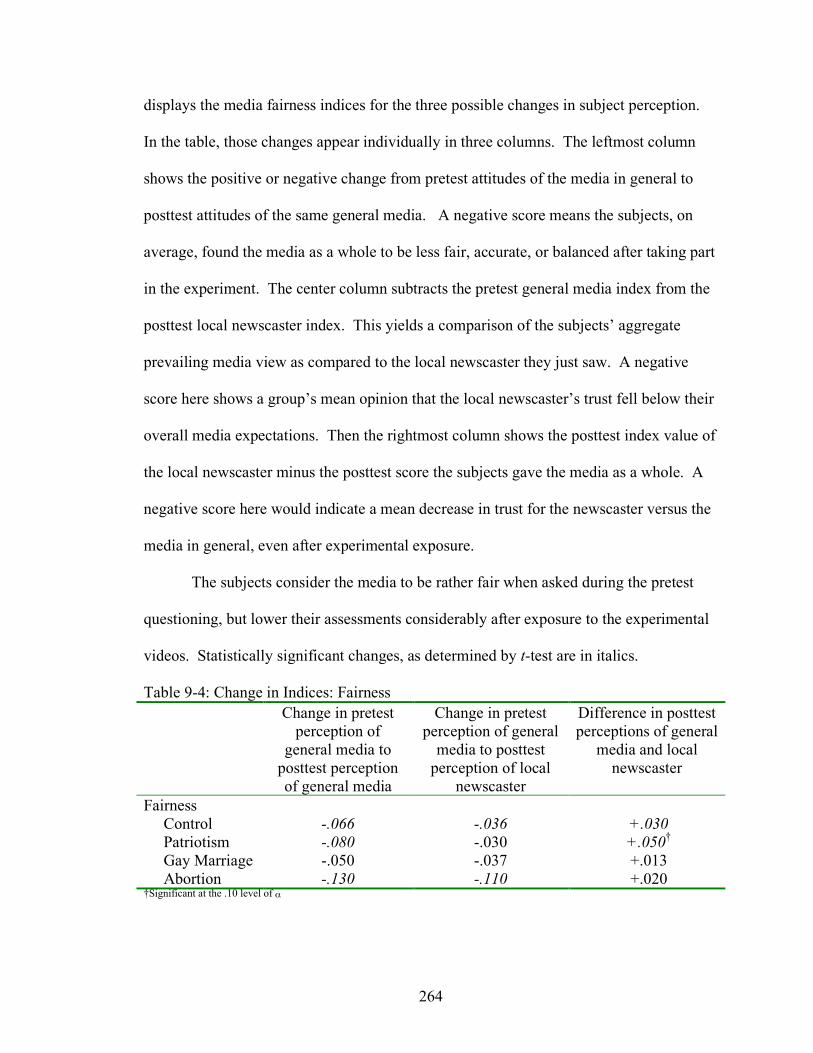
264
displays the media fairness indices for the three possible changes in subject perception.
In the table, those changes appear individually in three columns. The leftmost column
shows the positive or negative change from pretest attitudes of the media in general to
posttest attitudes of the same general media. A negative score means the subjects, on
average, found the media as a whole to be less fair, accurate, or balanced after taking part
in the experiment. The center column subtracts the pretest general media index from the
posttest local newscaster index. This yields a comparison of the subjects’ aggregate
prevailing media view as compared to the local newscaster they just saw. A negative
score here shows a group’s mean opinion that the local newscaster’s trust fell below their
overall media expectations. Then the rightmost column shows the posttest index value of
the local newscaster minus the posttest score the subjects gave the media as a whole. A
negative score here would indicate a mean decrease in trust for the newscaster versus the
media in general, even after experimental exposure.
The subjects consider the media to be rather fair when asked during the pretest
questioning, but lower their assessments considerably after exposure to the experimental
videos. Statistically significant changes, as determined by t-test are in italics.
Table 9-4: Change in Indices: Fairness Change in pretest
perception of general media to
posttest perception of general media
Change in pretest perception of general
media to posttest perception of local
newscaster
Difference in posttest perceptions of general
media and local newscaster
Fairness Control -.066 -.036 +.030 Patriotism -.080 -.030 +.050† Gay Marriage -.050 -.037 +.013 Abortion -.130 -.110 +.020 †Significant at the .10 level of α
265
As seen in the examination of treatment level differences in Chapter 8, there is a
significant dip in perceptions of fairness among most subjects after they have seen the
experimental videos. Only the gay marriage subjects did not experience a significant
change. This runs counter to the expected outcome that those subjects would show a
decrease in trust since the issue was presented favoring the position that is opposite what
the majority favors. The largest drop in perceived fairness belongs to the abortion group,
which exceeded the drops in perceived fairness of the control and patriotism groups.
Abortion group subjects saw their perceptions of media fairness drop 13 points from
pretest levels when considering the performance of the media in general, 11 points when
considering the performance of the local newscaster seen on the tape. Patriotism group
subjects were not as harsh in their assessments of the local newscaster, with no
significant change in their opinion of him, but they did exhibit an 8 point drop in their
feelings toward general media performance. The control group outcomes are identical to
those examined along with the treatment level analysis. The pattern of decrease remains
perplexing, as those subjects saw only the Dateline NBC and commercial portions of the
video presentation, and did not see the local newscaster or any local news content.
The fact that the abortion group, and not the gay marriage group, was the most
volatile supports the assertions at the beginning of this chapter regarding a split view of
the issue. Among the subjects randomly selected to take part in the abortion group, the
abortion issue does somewhat divide the group. Posttest survey questions not used in the
examination of fairness, accuracy, and balance perceptions show this tendency. When
subjects are asked to react to the statement, “Newscasters give the true facts about
abortion,” the breakdown of opinions leans toward a general feeling that newscasters do a
266
poor job reporting about abortion. Fifty percent disagree with the statement, 18 percent
agree, and 31 percent neither agree nor disagree. Further, when asked to respond to the
statement, “Newscasters report about alternatives to abortion,” fully 53 percent disagreed,
while only 18 percent agreed. The abortion subject group appears to be stacked with
people against legal abortion and critical of the job newscasters do. Therefore, a newscast
segment biased against abortion generated the strongest perception change in terms of
fairness. That could come—not from a disagreement with the position of the
newscaster—but from a higher level of salience for the issue itself. These subjects share
a great deal of consensus on issues of patriotism. They see their neighbors sharing those
same views. So the patriotism issue does not have much daily salience to them.
Likewise, while the majority is opposed to gay marriage, that issue does not reach them
on a daily basis either. But many of these subjects share the feeling that the news media
is doing an inadequate job of covering the abortion issue correctly. So when presented
with an abortion story, they pay closer attention to it and are more willing to give a
meaningful evaluation of the job the newscaster (and media in general), do. In fact, those
questions measuring general media performance are likely to be measuring past
performance of the media as much as (or more than) the short experimental exposure.
A question asked of subject regarding gay marriage may support another possible
cause for abortion to be more negatively viewed than the gay marriage. When asked to
react to the statement, “Newscasters have overblown the gay marriage debate,” 50
percent agreed, while only 30 percent disagreed. This shows a certain “news fatigue”
among the subjects to the topic of gay marriage. Perhaps they had seen too many stories
and heard too many reports about the subject. It may be that many of the subjects did not
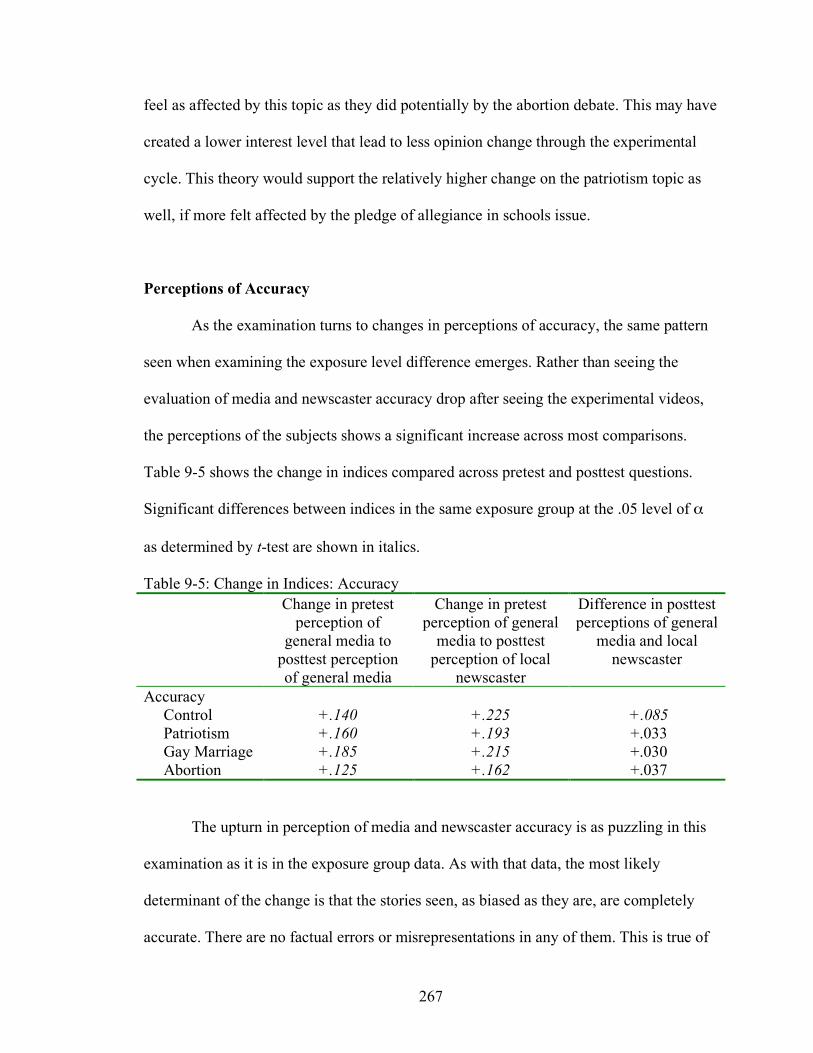
267
feel as affected by this topic as they did potentially by the abortion debate. This may have
created a lower interest level that lead to less opinion change through the experimental
cycle. This theory would support the relatively higher change on the patriotism topic as
well, if more felt affected by the pledge of allegiance in schools issue.
Perceptions of Accuracy
As the examination turns to changes in perceptions of accuracy, the same pattern
seen when examining the exposure level difference emerges. Rather than seeing the
evaluation of media and newscaster accuracy drop after seeing the experimental videos,
the perceptions of the subjects shows a significant increase across most comparisons.
Table 9-5 shows the change in indices compared across pretest and posttest questions.
Significant differences between indices in the same exposure group at the .05 level of α
as determined by t-test are shown in italics.
Table 9-5: Change in Indices: Accuracy Change in pretest
perception of general media to
posttest perception of general media
Change in pretest perception of general
media to posttest perception of local
newscaster
Difference in posttest perceptions of general
media and local newscaster
Accuracy Control +.140 +.225 +.085 Patriotism +.160 +.193 +.033 Gay Marriage +.185 +.215 +.030 Abortion +.125 +.162 +.037
The upturn in perception of media and newscaster accuracy is as puzzling in this
examination as it is in the exposure group data. As with that data, the most likely
determinant of the change is that the stories seen, as biased as they are, are completely
accurate. There are no factual errors or misrepresentations in any of them. This is true of
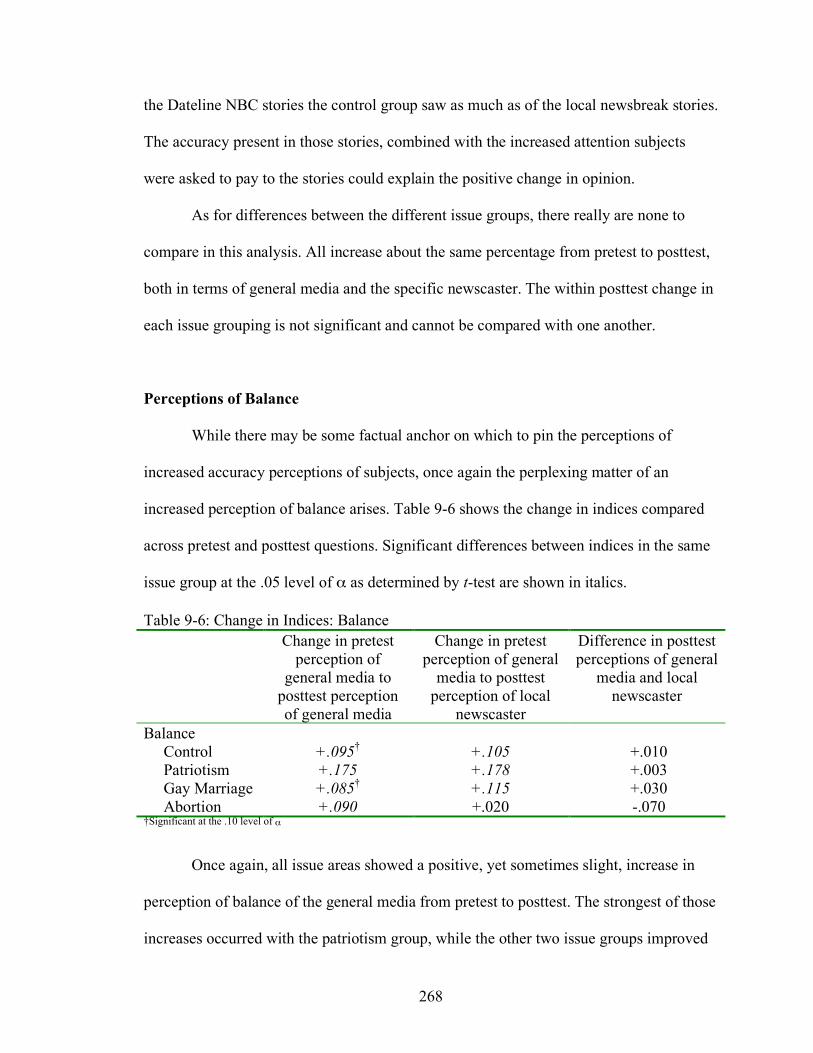
268
the Dateline NBC stories the control group saw as much as of the local newsbreak stories.
The accuracy present in those stories, combined with the increased attention subjects
were asked to pay to the stories could explain the positive change in opinion.
As for differences between the different issue groups, there really are none to
compare in this analysis. All increase about the same percentage from pretest to posttest,
both in terms of general media and the specific newscaster. The within posttest change in
each issue grouping is not significant and cannot be compared with one another.
Perceptions of Balance
While there may be some factual anchor on which to pin the perceptions of
increased accuracy perceptions of subjects, once again the perplexing matter of an
increased perception of balance arises. Table 9-6 shows the change in indices compared
across pretest and posttest questions. Significant differences between indices in the same
issue group at the .05 level of α as determined by t-test are shown in italics.
Table 9-6: Change in Indices: Balance Change in pretest
perception of general media to
posttest perception of general media
Change in pretest perception of general
media to posttest perception of local
newscaster
Difference in posttest perceptions of general
media and local newscaster
Balance Control +.095† +.105 +.010 Patriotism +.175 +.178 +.003 Gay Marriage +.085† +.115 +.030 Abortion +.090 +.020 -.070 †Significant at the .10 level of α
Once again, all issue areas showed a positive, yet sometimes slight, increase in
perception of balance of the general media from pretest to posttest. The strongest of those
increases occurred with the patriotism group, while the other two issue groups improved
269
at about the same level as the control group. The good showing by the media and
newscaster among the patriotism group could support the theory that the consensual
issues would produce less negative attitude change among the subjects. In fact, the data
present suggests it presented so much less negative attitude change it ended as a
reasonably strong positive change. On the pretest, subjects were asked to recall their
perceptions of news media balance with no prior warning. Those who would end up in
the patriotism test group rated the media the lowest of all groups, with a Media Balance
Index of .305. But those same subjects, seeing a demonstration of patriotism by the local
newscaster, changed their opinions of the news media the most, raising it more than 17
percent. At the same time, those in the other issue groups began with somewhat higher
opinions of news media balance at the pretest stage, and then raised those opinions a
marginally significant amount after watching more controversial stories than did the
patriotism group.
The Effect of Issues in Subject Matter on Viewer Evaluation
This chapter attempted to show that the dependent variable effects predicted in
Chapter 8 would be greater among those issue sets that were more controversial. The
results of this chapter show that the effect of controversial material on perceptions of bias
is present in some cases, but is not clear-cut in its effects.
The answer to the lack of significant change—or change in an unexpected
direction—may lie with subject personality and human nature. These are not factors to
take lightly. The two previous chapters argued that human reaction to the newscaster
who appears in the experimental videotapes had some effect on subjects’ perceptions of
270
his competence. Subjects seemed to be fond of the newscaster, and therefore evaluated
him more highly than anticipated, considering the bias introduced in the script and video
with which he was performing. At the same time, subjects seemed to rate his accuracy
lower than media in general, an apparent effect of his young age. Both of these are
personal reactions to the presentation, not necessarily foreseeable in the planning of
experiments to run and variables to test.
The selection of subject matter for this experiment was not random. Three issues
were selected to test variations in the controversial nature of the ideas presented, as well
as the ability represent the issue both visually and in written form. Those differences in
the issues chosen could affect the outcome of the experiments in the manner found.
The first of the issues that could generate the observed outcome is the patriotism
issue. This is not a controversial issue. It was included to test the original genesis for the
research, regarding the propriety of newscasters wearing patriotic pins and other regalia
on the air. It is highly unlikely that a large percentage of the subjects viewing the
patriotism experiments were opposed to the wearing of the flag pin (as seen in all
exposure levels) or the participation of the newscaster in the patriotism rally on the
capitol steps (as seen in the hard exposure group). It is highly likely the subjects agreed
with all that was said in each script—even those that would rate as improper, unbalanced,
and entirely unfair by most journalists reckoning. The relatively high scores the
patriotism treatment earned from subjects are entirely consistent with the consensus the
issue shares with most people. Beyond that consensus, and far less measurable, there is a
“feel good” aspect to seeing the flag of your country, hearing about people fighting for it
271
and the Pledge of Allegiance. That feeling can affect the outcome of the experiment as
strongly as the carefully controlled variables can.
If an issue so widely embraced as showing one’s patriotism and bring on a higher
evaluation of media performance, than how can one as seemingly unpopular as gay
marriage do seemingly the same thing? The answer could lie with the approach taken by
the fictional protestors seen in the story, as well as the newscaster’s role in their protest.
The gay marriage issue really came of age during the course of conducting this
experiment. From the state vote in Missouri on gay marriage in August 2004 to the run
up to the presidential elections and the Republican focus on this issue, newscasts were
filled with angry people on both sides of this issue, aiming to shout down their
opponents. Those in favor of gay marriage saw hate-filled religious zealots leading the
charge to deny gay couples the simple civil right afforded heterosexual partners. Those
opposed to gay marriage saw an immoral lifestyle being shoved down the throats of
America’s cities and states. These images seem to support the “topic fatigue” argument
made earlier in this chapter. Additionally, in sharp contrast to the stories aired on
newscast in 2003 and 2004, came the stories as played out in the experimental video.
Protestors rallied in an orderly fashion, asking for a legal change in Missouri’s statutes.
There was no shouting, no graphic displays, no loud demands. And though, based on the
outcome of Missouri’s gay marriage vote in 2004, very few taking part in the
experiments would support gay marriage, most of the subjects also seemed not to object
to the subject being covered in the way that it was. That satisfaction was reflected in the
attitude change of the subjects who saw the gay marriage experiments.
272
But the reaction to the abortion experiments was neither supportive nor accepting,
as seen with patriotism and gay marriage. Subjects reacted negatively to the subject
matter of the reports. They found media performance of the local newscaster to be
consistently unfair, inaccurate, and unbalanced and perhaps, through guilt by association,
newscaster in general were also given lower evaluations than pretest levels. The reason
behind this reaction may lie in a combination of the reactions to the patriotism and gay
marriage experiments. First, though not as widely embraced as the American flag, most
Americans (and Missourians) have a position on abortion that would allow it in many
circumstances—rape, incest, the health of the number are just a few. If the bulk of the
subjects fell in line with these majority views, then the protestors depicted are on the
opposite side of the issue. But that alone would not lead to the negative evaluations.
Those were possibly evoked by the combination of the issue running counter to the
position of most of the subjects, as well as the protests being all too familiar to those
subjects. Abortion protestors, unlike gay marriage protestors, have been a regular sight on
the news for more than a generation. There is no newness to their arguments, as one
might find with the gay marriage protestors. And quite possibly the combination of being
on the wrong side of the issue, while at the same time boring the subjects with an old
argument proved to generate enough negative feelings in the subjects to earn the poor
evaluations.
273
Chapter 10: Ideological and Experiential Effects
Patterns have emerged from the data presented in the previous chapters, patterns
that show a different level of effect on those subjects in the center. For all subjects,
changes in the independent variable of the video exposure had slight to no impact on the
outcome of the experiment, as did the subject matter depicted in those videos. But for
those subjects at the extremes—right or left, high or low—those effects did not assert
themselves as strongly as was predicted by the experimental hypotheses. A much
stronger “inertia” effect appeared to come from preset notions of media performance,
learned over time, as well a similar learned pattern of trust and respect for local
newscasters. However, those subjects in the middle of most experimental groups—those
without strong ideological or other set preferences—did seem to exhibit more of an effect
in the dependent variables. The ideological centrists then, are an interesting group to
study further. They come to the experiment without strong ideological views. In fact,
they seem to arrive without many pre-existing views at all. So, unlike those subjects at
the stronger ends of the ideological spectrum, they are more able to be swayed by what
they see.
This assumption is based on the notion that ideology and the degree of experience
with media exposures may “set” the perception levels of the subjects. It is possible to
expect those with certain ideological views to have perceptual screening in place that
would deflect some unexpected media effects, while emphasizing others. And those with
long experience as media consumers would have an established expectation of
performance by the media. A perceptual screen similar to the ideological variety could
274
remove dissonant media messages before the subject can acknowledge them. But centrist
subjects may lack many of those screens, leaving them more open to experimental
effects.
A Three-Way Analysis of Ideological Effects
In contrast to the conservative-liberal split in Chapter 7, subjects for this analysis
are assigned to the conservative, middle, or liberal group for analysis. First this allows the
analysis to isolate subjects who are more strongly conservative or liberal and measure
their reactions more fully. And more importantly, the addition of a “middle” group allows
the analysis to isolate those subjects to see effects particular to them. Subject positions
are determined by the self-defined ideological identification from the pretest, combined
with the other ideological screening pretest questions to verify the self-identification.
Subjects were asked to place themselves on a seven-point scale, with 1 being the most
conservative and 7 the most liberal. Two additional questions asked subjects to give their
opinions of the proper role and size of government. Those who preferred a small, limited
government were also assigned to the conservative group, while those who preferred a
larger, more powerful government were grouped with the liberals. Those subjects who
had conflicting answers were placed in the group which matched two of their three
answers. And those who were in the middle of two or more of the assessments went to
the centrist group.
Subjects who fell into the conservative ratings were assigned to the conservative
group (N = 79), those who were roughly in the center ideological went into the centrist
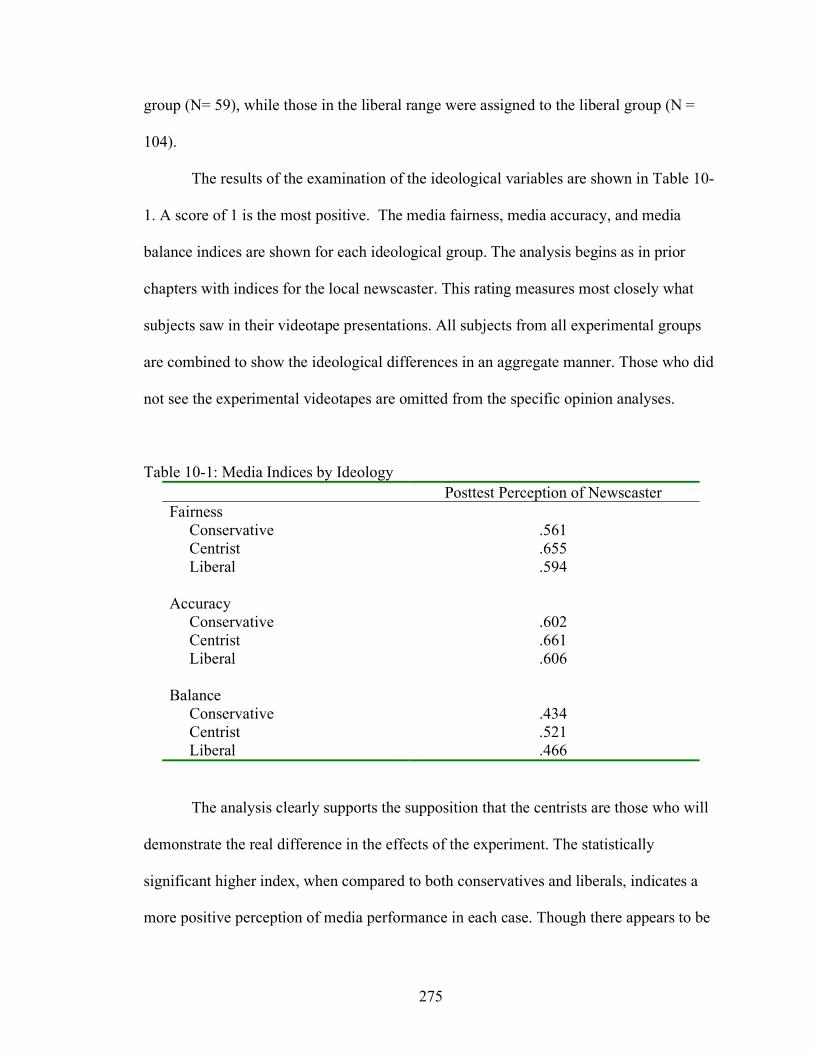
275
group (N= 59), while those in the liberal range were assigned to the liberal group (N =
104).
The results of the examination of the ideological variables are shown in Table 10-
1. A score of 1 is the most positive. The media fairness, media accuracy, and media
balance indices are shown for each ideological group. The analysis begins as in prior
chapters with indices for the local newscaster. This rating measures most closely what
subjects saw in their videotape presentations. All subjects from all experimental groups
are combined to show the ideological differences in an aggregate manner. Those who did
not see the experimental videotapes are omitted from the specific opinion analyses.
Table 10-1: Media Indices by Ideology Posttest Perception of Newscaster Fairness Conservative .561 Centrist .655 Liberal .594 Accuracy Conservative .602 Centrist .661 Liberal .606 Balance Conservative .434 Centrist .521 Liberal .466
The analysis clearly supports the supposition that the centrists are those who will
demonstrate the real difference in the effects of the experiment. The statistically
significant higher index, when compared to both conservatives and liberals, indicates a
more positive perception of media performance in each case. Though there appears to be
276
a slight difference between them, conservatives and liberals are not different from each
other by any statistical test.
Why A Softer Center?
The assumption for the outcome of this analysis was that, due to the overall
conservative approach the newscaster took on two of three treatments, the liberal subjects
were most likely to rate media performance more negatively post experiment, the
conservative subjects less negatively, and the centrist subjects fall in between. But in fact,
the data point to a wholly different outcome. Why would those centrist subjects see such
a rosy picture of the media after the experiment? And why would conservative and liberal
subjects rate the media about the same?
The likely answer to the second question may help with the first. Those subjects
further to the ends of the ideological spectrum carry with them an internal history of
media interactions filtered through their own political point of view. While the
conservative subjects may have, on average, seen news presentations during the
experiment that were more sympathetic to their point of view, it is very likely their
lifelong experience with news media bias has been—in their own perceptions—just the
opposite. Studies show a widely-held belief in a liberal media bias, supported by the party
identification and voting pattern of many journalists. In addition, conservatives often
have specific stories with which to support that view. Likewise, liberal subjects may have
seen what they perceived as a more conservatively biased news presentation during the
experiments, which ran counter to their general perception that the media do a fair and
balanced job. So, conservatives come to the experiment with a fairly negative sense of
277
media trust and are slightly buoyed by the experience. Liberals come with a somewhat
neutral view of media performance and are affected slightly negatively by the
experimental exposure. Thus, both groups of subjects end up at nearly the same level of
media trust post-experiment. But not so for the centrists. By definition, they come to the
experiment less cued to political biases in media output—they are simply less interested
and passionate about ideological differences perceived in media performance. Ideological
bias is both less noticeable and less important to them. That lack of discernment carries
into the experimental setting, where the subjects would be far less critical of bias in the
presentation. This puts them in a position where the positivity factors discussed earlier
can have more of an effect. The attention of the experiment, the likeability of the
newscaster, and the generally solid performance on all but the test story helps build a
more positive view of the media during the experiment. That improved view becomes
evident in this analysis.
Perceptions of Fairness
An analysis of the individual bias indicators across all three measurement areas
reveals more detail of the ideological differences in subjects and how they perceived the
media performance. Of particular interest is the difference between subjects’ pretest
notions of media fairness, accuracy, and balance, and their perceptions of the local
newscaster in the test videos. That change can tell the most about the impact of the
experimental exposures and how successful they were to move the subjects from their
long-seated beliefs on media performance. If there is a great deal of negative change in
the perceptions of the newscaster, then the subjects are more easily swayed to change
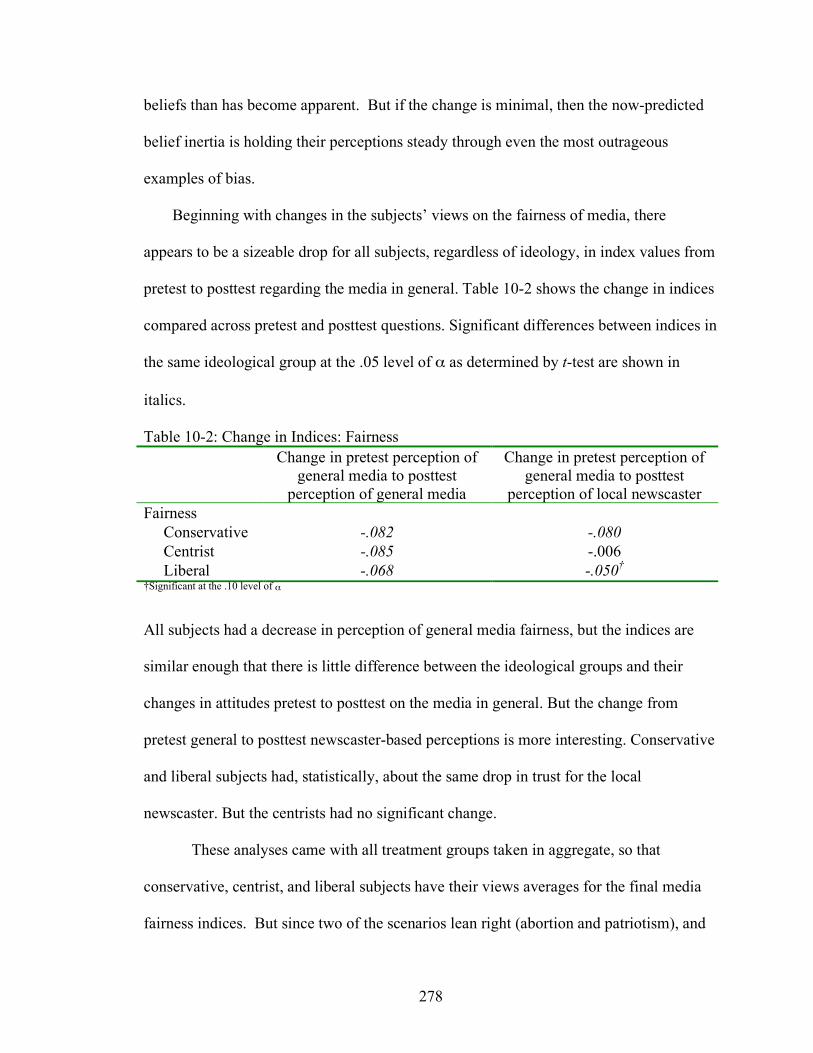
278
beliefs than has become apparent. But if the change is minimal, then the now-predicted
belief inertia is holding their perceptions steady through even the most outrageous
examples of bias.
Beginning with changes in the subjects’ views on the fairness of media, there
appears to be a sizeable drop for all subjects, regardless of ideology, in index values from
pretest to posttest regarding the media in general. Table 10-2 shows the change in indices
compared across pretest and posttest questions. Significant differences between indices in
the same ideological group at the .05 level of α as determined by t-test are shown in
italics.
Table 10-2: Change in Indices: Fairness Change in pretest perception of
general media to posttest perception of general media
Change in pretest perception of general media to posttest
perception of local newscaster Fairness Conservative -.082 -.080 Centrist -.085 -.006 Liberal -.068 -.050† †Significant at the .10 level of α
All subjects had a decrease in perception of general media fairness, but the indices are
similar enough that there is little difference between the ideological groups and their
changes in attitudes pretest to posttest on the media in general. But the change from
pretest general to posttest newscaster-based perceptions is more interesting. Conservative
and liberal subjects had, statistically, about the same drop in trust for the local
newscaster. But the centrists had no significant change.
These analyses came with all treatment groups taken in aggregate, so that
conservative, centrist, and liberal subjects have their views averages for the final media
fairness indices. But since two of the scenarios lean right (abortion and patriotism), and
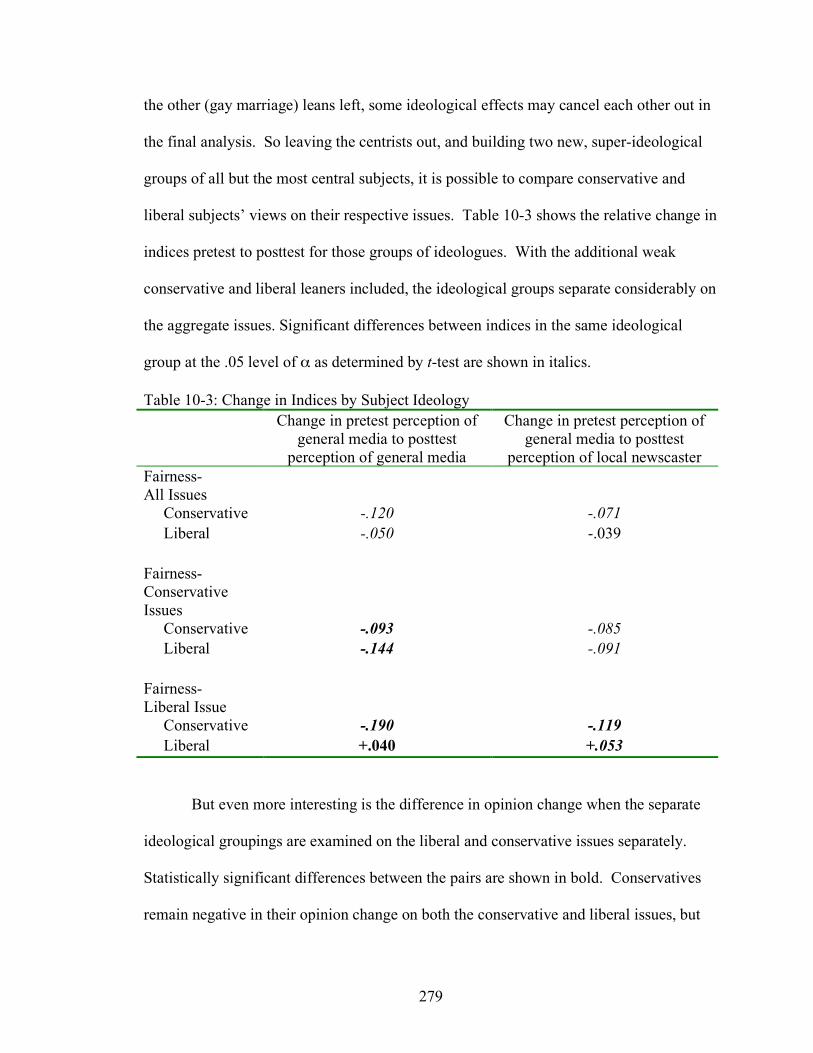
279
the other (gay marriage) leans left, some ideological effects may cancel each other out in
the final analysis. So leaving the centrists out, and building two new, super-ideological
groups of all but the most central subjects, it is possible to compare conservative and
liberal subjects’ views on their respective issues. Table 10-3 shows the relative change in
indices pretest to posttest for those groups of ideologues. With the additional weak
conservative and liberal leaners included, the ideological groups separate considerably on
the aggregate issues. Significant differences between indices in the same ideological
group at the .05 level of α as determined by t-test are shown in italics.
Table 10-3: Change in Indices by Subject Ideology Change in pretest perception of
general media to posttest perception of general media
Change in pretest perception of general media to posttest
perception of local newscaster Fairness- All Issues
Conservative -.120 -.071 Liberal -.050 -.039 Fairness- Conservative Issues
Conservative -.093 -.085 Liberal -.144 -.091 Fairness- Liberal Issue
Conservative -.190 -.119 Liberal +.040 +.053
But even more interesting is the difference in opinion change when the separate
ideological groupings are examined on the liberal and conservative issues separately.
Statistically significant differences between the pairs are shown in bold. Conservatives
remain negative in their opinion change on both the conservative and liberal issues, but
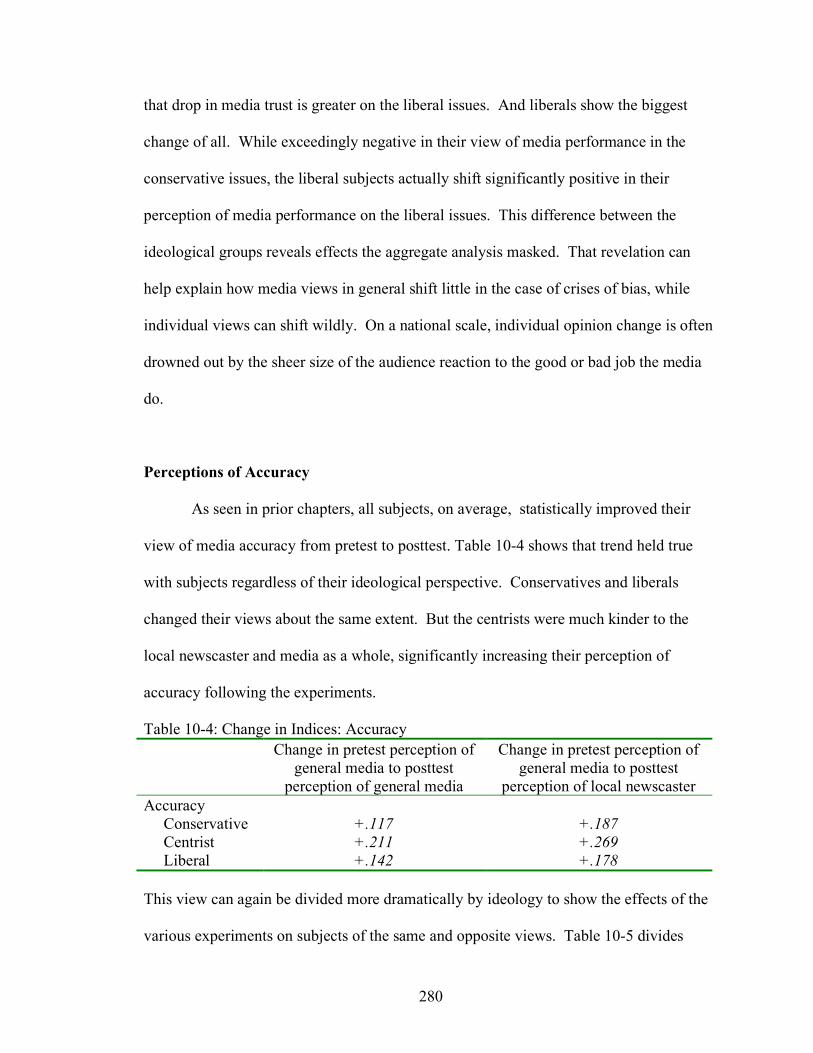
280
that drop in media trust is greater on the liberal issues. And liberals show the biggest
change of all. While exceedingly negative in their view of media performance in the
conservative issues, the liberal subjects actually shift significantly positive in their
perception of media performance on the liberal issues. This difference between the
ideological groups reveals effects the aggregate analysis masked. That revelation can
help explain how media views in general shift little in the case of crises of bias, while
individual views can shift wildly. On a national scale, individual opinion change is often
drowned out by the sheer size of the audience reaction to the good or bad job the media
do.
Perceptions of Accuracy
As seen in prior chapters, all subjects, on average, statistically improved their
view of media accuracy from pretest to posttest. Table 10-4 shows that trend held true
with subjects regardless of their ideological perspective. Conservatives and liberals
changed their views about the same extent. But the centrists were much kinder to the
local newscaster and media as a whole, significantly increasing their perception of
accuracy following the experiments.
Table 10-4: Change in Indices: Accuracy Change in pretest perception of
general media to posttest perception of general media
Change in pretest perception of general media to posttest
perception of local newscaster Accuracy Conservative +.117 +.187 Centrist +.211 +.269 Liberal +.142 +.178
This view can again be divided more dramatically by ideology to show the effects of the
various experiments on subjects of the same and opposite views. Table 10-5 divides
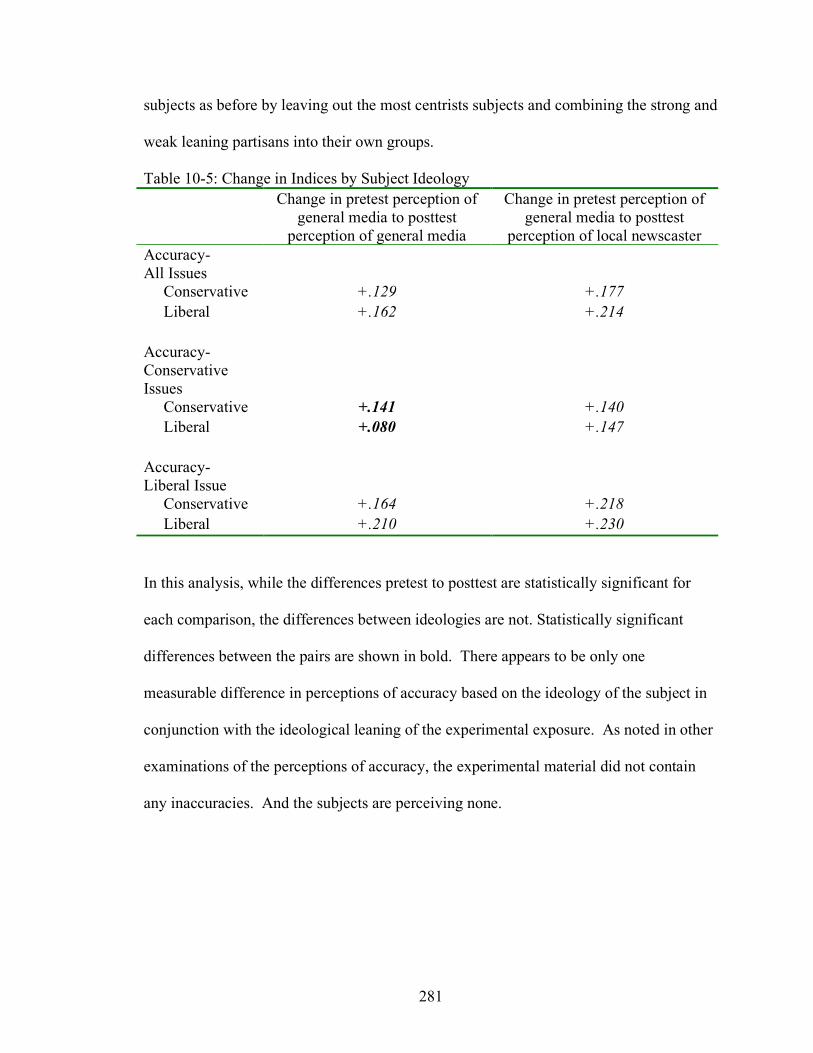
281
subjects as before by leaving out the most centrists subjects and combining the strong and
weak leaning partisans into their own groups.
Table 10-5: Change in Indices by Subject Ideology Change in pretest perception of
general media to posttest perception of general media
Change in pretest perception of general media to posttest
perception of local newscaster Accuracy- All Issues
Conservative +.129 +.177 Liberal +.162 +.214 Accuracy- Conservative Issues
Conservative +.141 +.140 Liberal +.080 +.147 Accuracy- Liberal Issue
Conservative +.164 +.218 Liberal +.210 +.230
In this analysis, while the differences pretest to posttest are statistically significant for
each comparison, the differences between ideologies are not. Statistically significant
differences between the pairs are shown in bold. There appears to be only one
measurable difference in perceptions of accuracy based on the ideology of the subject in
conjunction with the ideological leaning of the experimental exposure. As noted in other
examinations of the perceptions of accuracy, the experimental material did not contain
any inaccuracies. And the subjects are perceiving none.
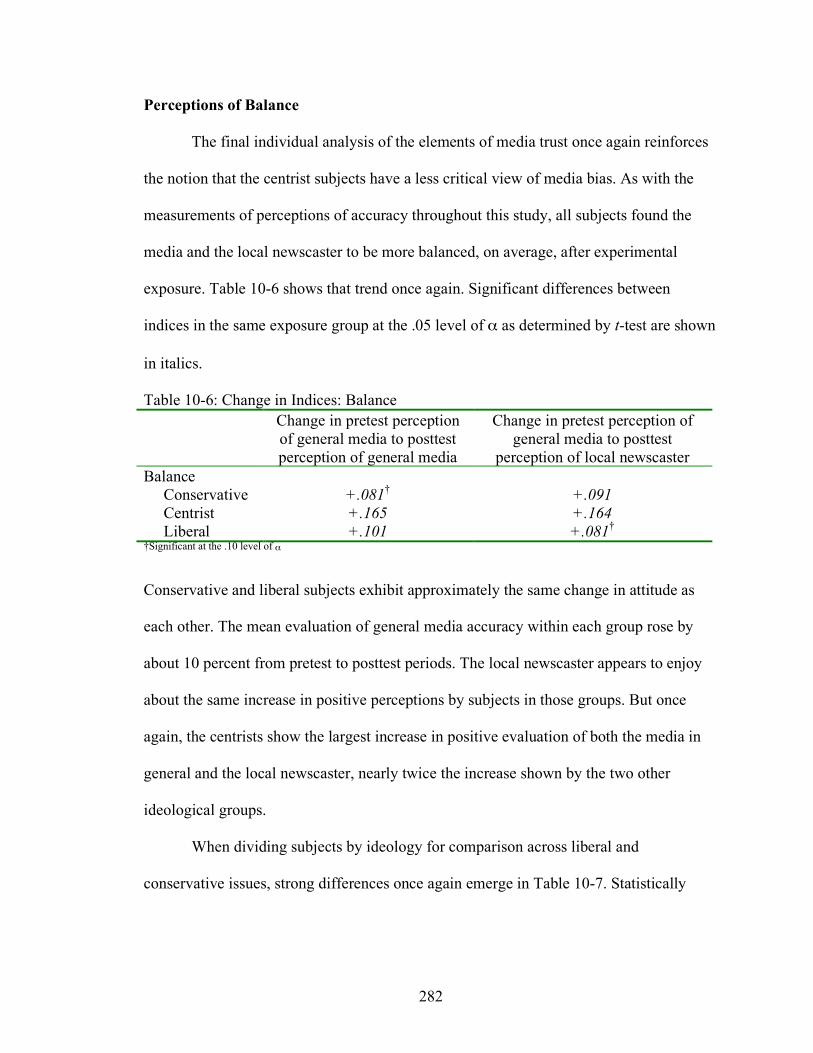
282
Perceptions of Balance
The final individual analysis of the elements of media trust once again reinforces
the notion that the centrist subjects have a less critical view of media bias. As with the
measurements of perceptions of accuracy throughout this study, all subjects found the
media and the local newscaster to be more balanced, on average, after experimental
exposure. Table 10-6 shows that trend once again. Significant differences between
indices in the same exposure group at the .05 level of α as determined by t-test are shown
in italics.
Table 10-6: Change in Indices: Balance Change in pretest perception
of general media to posttest perception of general media
Change in pretest perception of general media to posttest
perception of local newscaster Balance Conservative +.081† +.091 Centrist +.165 +.164 Liberal +.101 +.081† †Significant at the .10 level of α
Conservative and liberal subjects exhibit approximately the same change in attitude as
each other. The mean evaluation of general media accuracy within each group rose by
about 10 percent from pretest to posttest periods. The local newscaster appears to enjoy
about the same increase in positive perceptions by subjects in those groups. But once
again, the centrists show the largest increase in positive evaluation of both the media in
general and the local newscaster, nearly twice the increase shown by the two other
ideological groups.
When dividing subjects by ideology for comparison across liberal and
conservative issues, strong differences once again emerge in Table 10-7. Statistically
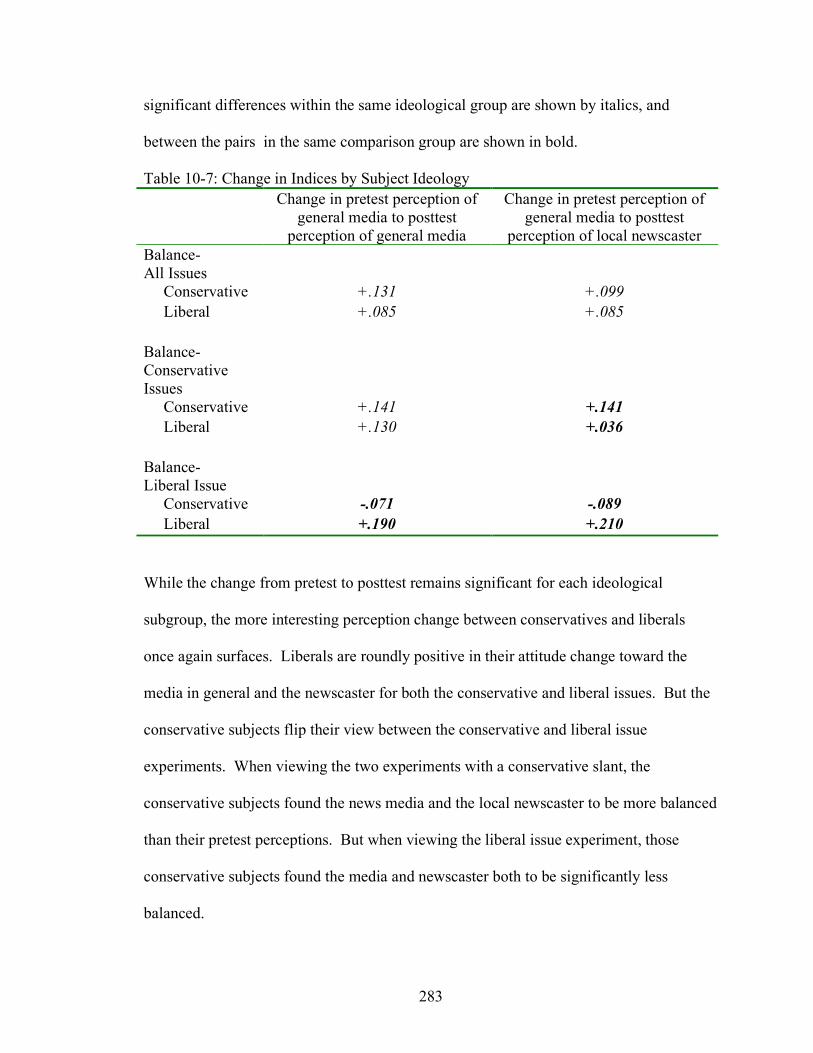
283
significant differences within the same ideological group are shown by italics, and
between the pairs in the same comparison group are shown in bold.
Table 10-7: Change in Indices by Subject Ideology Change in pretest perception of
general media to posttest perception of general media
Change in pretest perception of general media to posttest
perception of local newscaster Balance- All Issues
Conservative +.131 +.099 Liberal +.085 +.085 Balance- Conservative Issues
Conservative +.141 +.141 Liberal +.130 +.036 Balance- Liberal Issue
Conservative -.071 -.089 Liberal +.190 +.210
While the change from pretest to posttest remains significant for each ideological
subgroup, the more interesting perception change between conservatives and liberals
once again surfaces. Liberals are roundly positive in their attitude change toward the
media in general and the newscaster for both the conservative and liberal issues. But the
conservative subjects flip their view between the conservative and liberal issue
experiments. When viewing the two experiments with a conservative slant, the
conservative subjects found the news media and the local newscaster to be more balanced
than their pretest perceptions. But when viewing the liberal issue experiment, those
conservative subjects found the media and newscaster both to be significantly less
balanced.
284
Throughout all the individual analyses of the factors of media trust, the centrists
rate the media more positively than their counterparts further to each end of the
ideological spectrum. With the centrists removed from the analysis, the ideologues return
to seeing some differences based on their ideology. This consistent demonstration by the
centrists of a less critical evaluation of the media, even after seeing stories clearly
politically biased in their presentation, does seem to confirm that those centrist subjects
are far less sensitive to the ideological content of their news—even when the topic is
political itself. This concept leads to the conclusion that media are hard pressed to please
viewers who bring stronger ideological views to their news consumption, no matter on
which end of the spectrum those views fall.
Experiential Expectations
Unlike with the ideological differences, pretest analysis showed there was some
difference in media perceptions based on educational level. Those subjects who did not
attend college were far more positive in their evaluations of media performance on the
pretest. The development of critical thinking skills that is encouraged in the college
setting helps make those who take part in higher education much more critical consumers
of many “products”—including mass media output. Those who do not develop those
critical thinking skills as fully often will accept what is presented, rather than question it.
The pretest phase bore this theory out, with those without higher education being far less
critical. In the posttest phase, the expectation is that those with college education would
be more perceptive of bias inserted in the news break content, and more likely to
critically analyze that content and attribute lower perceptions of fairness, accuracy, and
285
balance to the newscaster and the news media. Those who do not have the more
sophisticated critical thinking skills will be less likely to notice the bias, and less likely to
connect what they see in the newsbreak with poor newscaster or news media
performance.
For the experiential analysis, differences in the actual content of the news break
should not make a difference in degree of outcome. Therefore, the combined analysis of
all exposure and treatment groups should detect subtler changes than those that might be
masked in the ideological part of the experiment due to the direction of the bias in stories.
That could lead to an easier finding of statistically significant results in the experiential
analysis.
Experience Matters—In Part
Because people gain in their ability to be more discerning as they age and achieve
more education, the common sense expectation is that the most experienced subjects
would be the most critical of the three groups. Those subjects have longer experience as
media consumers and can put that experience to use more quickly evaluating what they
see and hear. Conversely, the subjects with the least experience should be the ones who,
on average, are the least critical of media performance. By the same reasoning as used
with setting expectations of the more experienced subjects, those low experience subjects
have much less media consumption experience and may approach what they see in a
more naïve, accepting manner. Those subjects in the medium experience group would
then fall somewhere in between the high and low groups.
286
To test those assumptions, a new variable describing differences in the
educational and experience was developed, combining the age and education
demographics of the subjects. Those adult subjects under the age of 35, except those with
advanced college degrees, were placed in the low experience group (N = 78). Those
subjects aged 55 and older, or with advanced college degrees went into the high
experience group (N = 79). All others went into the middle experience group (N= 85).
Using this new division of subjects, the results were analyzed for changes pretest
and posttest. The results show that a division of subjects by life experience—age and
education—produces a less critical center, just as when subjects were divided by
ideology. Table 10-8 shows the differences in the mean post-experimental evaluation of
the newscaster those subjects in the low, medium, and high experience groups. The table
displays the corresponding media fairness, media accuracy, and media balance indices for
each experience group, as well as for the control subjects. All subjects from all
experimental groups are combined to show the experience differences in an aggregate
manner.
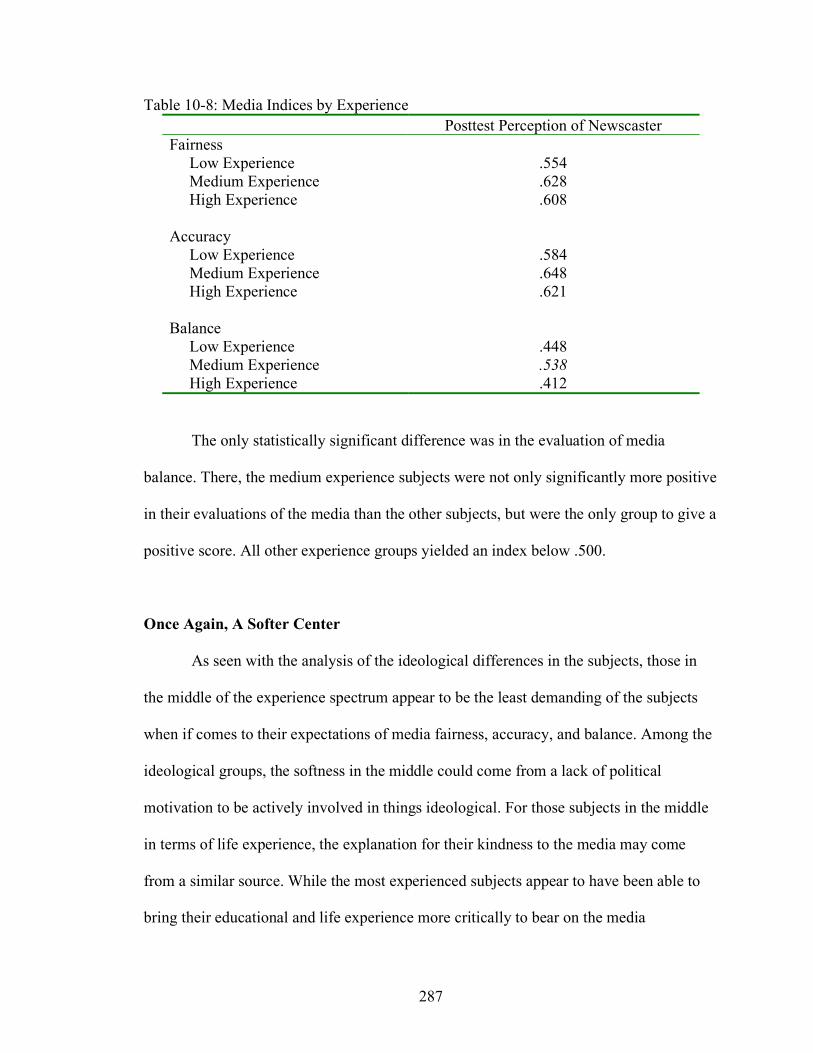
287
Table 10-8: Media Indices by Experience Posttest Perception of Newscaster Fairness Low Experience .554 Medium Experience .628 High Experience .608 Accuracy Low Experience .584 Medium Experience .648 High Experience .621 Balance Low Experience .448 Medium Experience .538 High Experience .412
The only statistically significant difference was in the evaluation of media
balance. There, the medium experience subjects were not only significantly more positive
in their evaluations of the media than the other subjects, but were the only group to give a
positive score. All other experience groups yielded an index below .500.
Once Again, A Softer Center
As seen with the analysis of the ideological differences in the subjects, those in
the middle of the experience spectrum appear to be the least demanding of the subjects
when if comes to their expectations of media fairness, accuracy, and balance. Among the
ideological groups, the softness in the middle could come from a lack of political
motivation to be actively involved in things ideological. For those subjects in the middle
in terms of life experience, the explanation for their kindness to the media may come
from a similar source. While the most experienced subjects appear to have been able to
bring their educational and life experience more critically to bear on the media
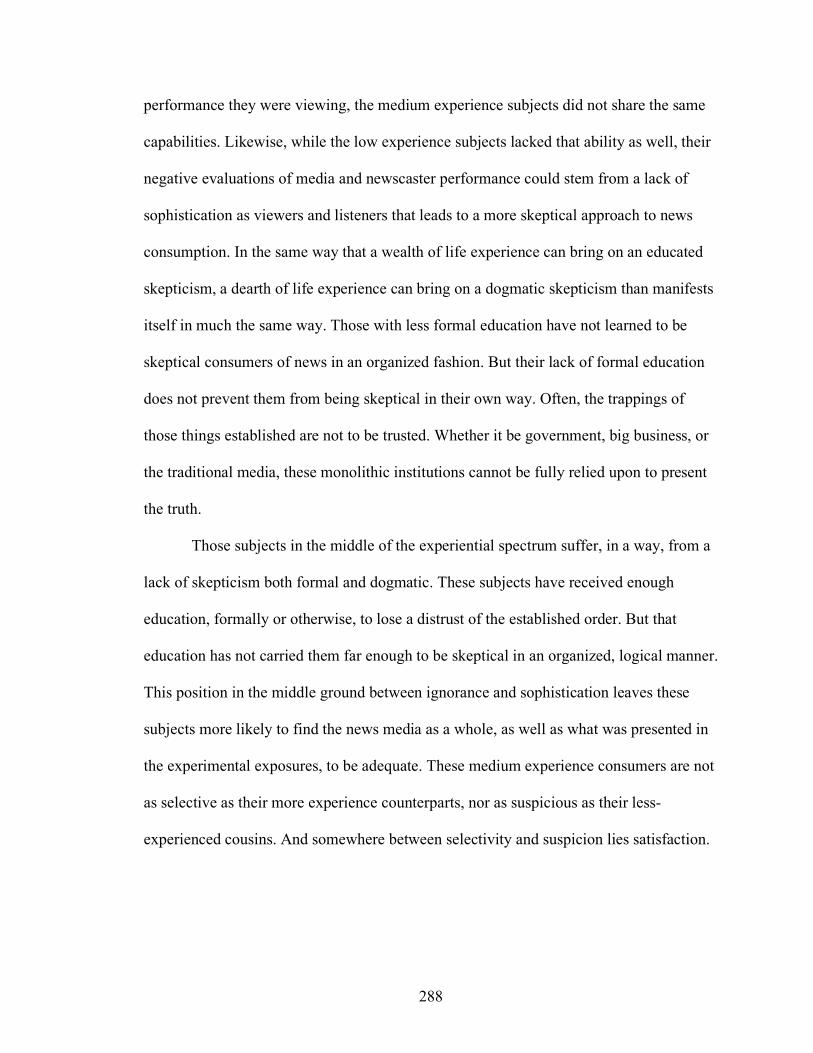
288
performance they were viewing, the medium experience subjects did not share the same
capabilities. Likewise, while the low experience subjects lacked that ability as well, their
negative evaluations of media and newscaster performance could stem from a lack of
sophistication as viewers and listeners that leads to a more skeptical approach to news
consumption. In the same way that a wealth of life experience can bring on an educated
skepticism, a dearth of life experience can bring on a dogmatic skepticism than manifests
itself in much the same way. Those with less formal education have not learned to be
skeptical consumers of news in an organized fashion. But their lack of formal education
does not prevent them from being skeptical in their own way. Often, the trappings of
those things established are not to be trusted. Whether it be government, big business, or
the traditional media, these monolithic institutions cannot be fully relied upon to present
the truth.
Those subjects in the middle of the experiential spectrum suffer, in a way, from a
lack of skepticism both formal and dogmatic. These subjects have received enough
education, formally or otherwise, to lose a distrust of the established order. But that
education has not carried them far enough to be skeptical in an organized, logical manner.
This position in the middle ground between ignorance and sophistication leaves these
subjects more likely to find the news media as a whole, as well as what was presented in
the experimental exposures, to be adequate. These medium experience consumers are not
as selective as their more experience counterparts, nor as suspicious as their less-
experienced cousins. And somewhere between selectivity and suspicion lies satisfaction.
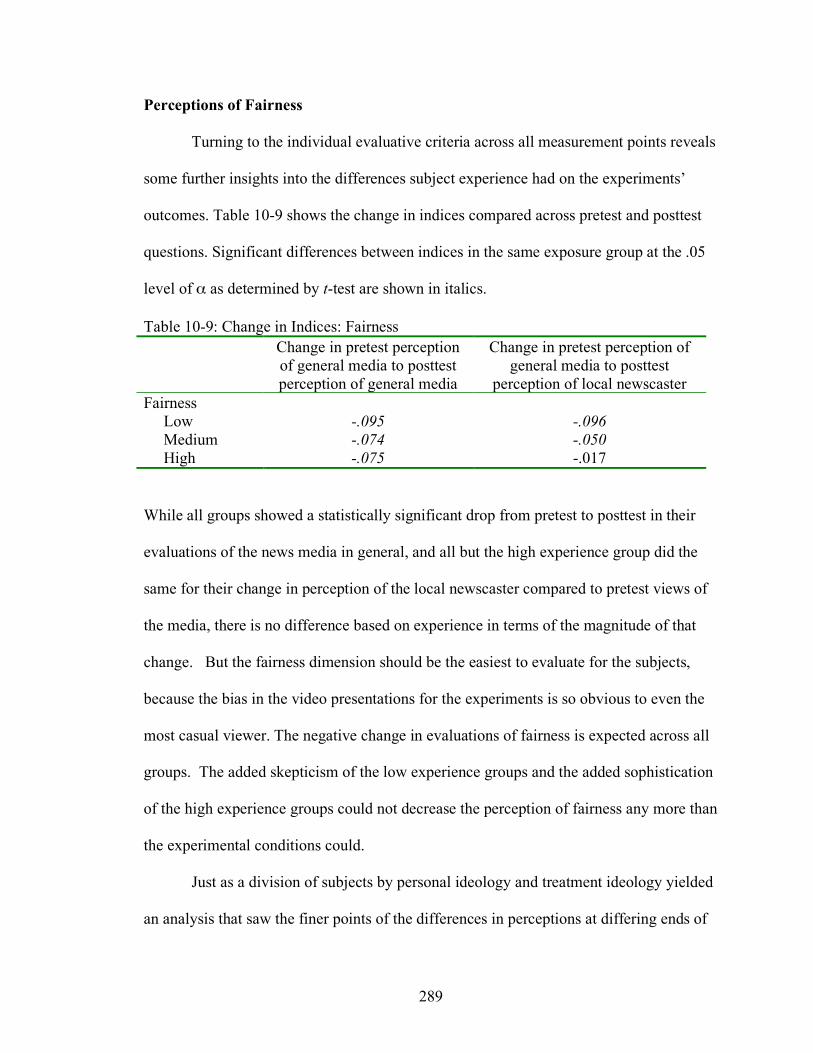
289
Perceptions of Fairness
Turning to the individual evaluative criteria across all measurement points reveals
some further insights into the differences subject experience had on the experiments’
outcomes. Table 10-9 shows the change in indices compared across pretest and posttest
questions. Significant differences between indices in the same exposure group at the .05
level of α as determined by t-test are shown in italics.
Table 10-9: Change in Indices: Fairness Change in pretest perception
of general media to posttest perception of general media
Change in pretest perception of general media to posttest
perception of local newscaster Fairness Low -.095 -.096 Medium -.074 -.050 High -.075 -.017
While all groups showed a statistically significant drop from pretest to posttest in their
evaluations of the news media in general, and all but the high experience group did the
same for their change in perception of the local newscaster compared to pretest views of
the media, there is no difference based on experience in terms of the magnitude of that
change. But the fairness dimension should be the easiest to evaluate for the subjects,
because the bias in the video presentations for the experiments is so obvious to even the
most casual viewer. The negative change in evaluations of fairness is expected across all
groups. The added skepticism of the low experience groups and the added sophistication
of the high experience groups could not decrease the perception of fairness any more than
the experimental conditions could.
Just as a division of subjects by personal ideology and treatment ideology yielded
an analysis that saw the finer points of the differences in perceptions at differing ends of
290
the political spectrum, a similar division of subjects my age and educational experience
my also by insightful. The subjects were split first by education, with those who had not
graduated from college in the low education group, and those who had college or
graduate degrees in the high education group. The subjects were also divided based on
their chronological age, with those under 45 in the “Young” classification and those 55
and over in the “Old” classification. Those 45 to 54 were intentionally excluded from the
analysis to magnify the differences in the groups and to try to even the numbers in each
subdivision.
Table 10-10 shows the results of the analysis, displayed as the difference in
indices for each comparison. Those differences between pretest and posttest evaluations
that are statistically significant are indicated in italics, while those significant differences
between the young/old subdivisions are shown in bold.. In judging fairness, the trend is
generally to find the media and the newscaster less fair after viewing the experimental
video. But those old subjects with low education actually found both the media and the
newscaster significantly more fair after the experimental exposure. There is no
significant difference between young and old subjects with high education.
Table 10-10: Change in Indices by Subject Experience Change in pretest perception of
general media to posttest perception of general media
Change in pretest perception of general media to posttest
perception of local newscaster Fairness- Low Education -.053 -.017 Young -.085 -.052 Old +.111 +.139 Fairness- High Education -.096 -.066 Young -.131 -.100 Old -.112 -.078
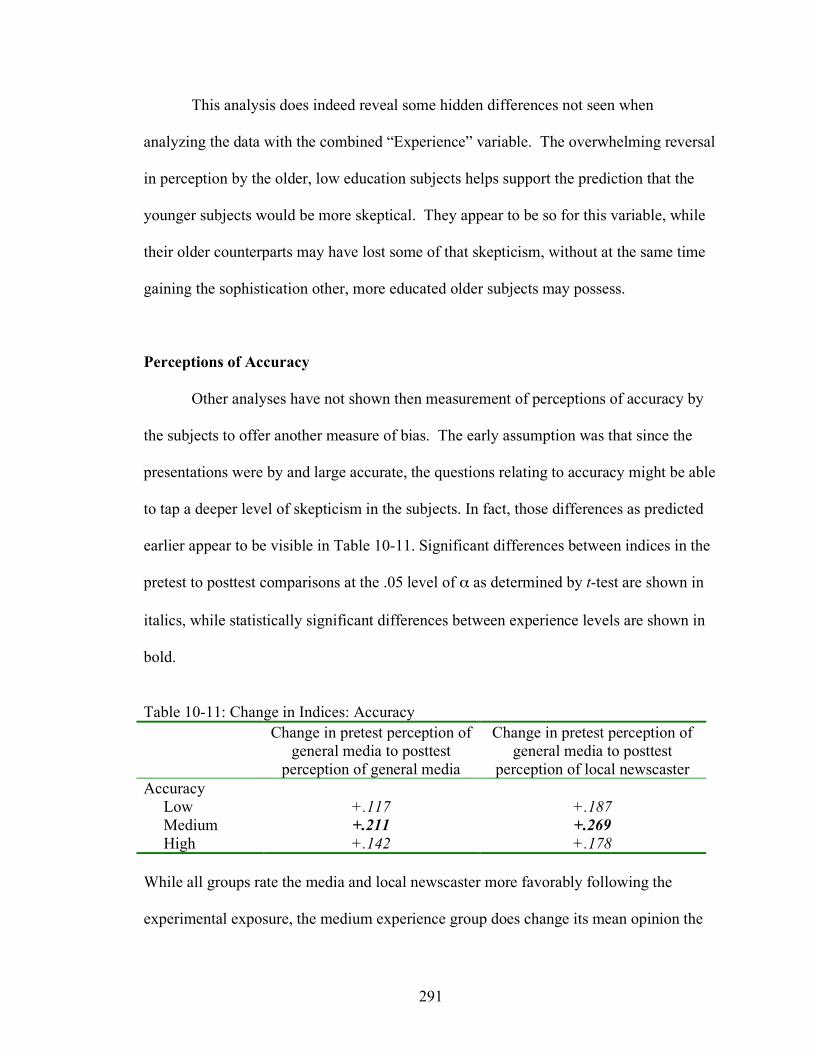
291
This analysis does indeed reveal some hidden differences not seen when
analyzing the data with the combined “Experience” variable. The overwhelming reversal
in perception by the older, low education subjects helps support the prediction that the
younger subjects would be more skeptical. They appear to be so for this variable, while
their older counterparts may have lost some of that skepticism, without at the same time
gaining the sophistication other, more educated older subjects may possess.
Perceptions of Accuracy
Other analyses have not shown then measurement of perceptions of accuracy by
the subjects to offer another measure of bias. The early assumption was that since the
presentations were by and large accurate, the questions relating to accuracy might be able
to tap a deeper level of skepticism in the subjects. In fact, those differences as predicted
earlier appear to be visible in Table 10-11. Significant differences between indices in the
pretest to posttest comparisons at the .05 level of α as determined by t-test are shown in
italics, while statistically significant differences between experience levels are shown in
bold.
Table 10-11: Change in Indices: Accuracy Change in pretest perception of
general media to posttest perception of general media
Change in pretest perception of general media to posttest
perception of local newscaster Accuracy Low +.117 +.187 Medium +.211 +.269 High +.142 +.178
While all groups rate the media and local newscaster more favorably following the
experimental exposure, the medium experience group does change its mean opinion the
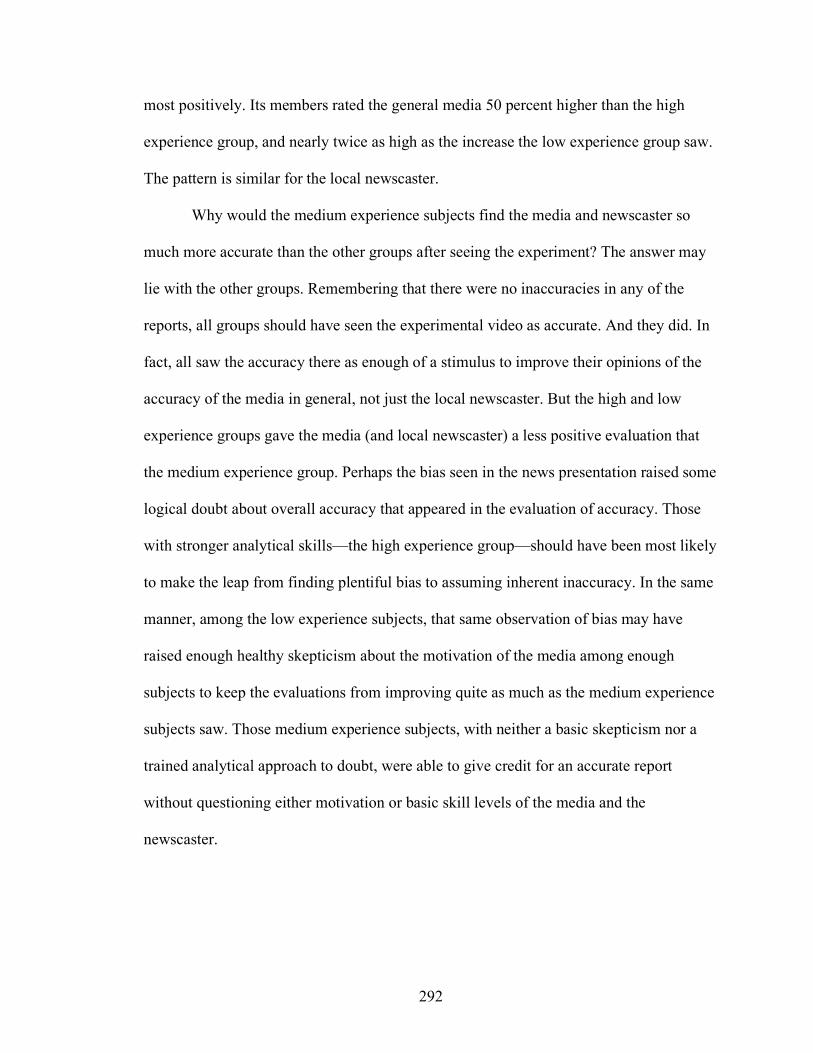
292
most positively. Its members rated the general media 50 percent higher than the high
experience group, and nearly twice as high as the increase the low experience group saw.
The pattern is similar for the local newscaster.
Why would the medium experience subjects find the media and newscaster so
much more accurate than the other groups after seeing the experiment? The answer may
lie with the other groups. Remembering that there were no inaccuracies in any of the
reports, all groups should have seen the experimental video as accurate. And they did. In
fact, all saw the accuracy there as enough of a stimulus to improve their opinions of the
accuracy of the media in general, not just the local newscaster. But the high and low
experience groups gave the media (and local newscaster) a less positive evaluation that
the medium experience group. Perhaps the bias seen in the news presentation raised some
logical doubt about overall accuracy that appeared in the evaluation of accuracy. Those
with stronger analytical skills—the high experience group—should have been most likely
to make the leap from finding plentiful bias to assuming inherent inaccuracy. In the same
manner, among the low experience subjects, that same observation of bias may have
raised enough healthy skepticism about the motivation of the media among enough
subjects to keep the evaluations from improving quite as much as the medium experience
subjects saw. Those medium experience subjects, with neither a basic skepticism nor a
trained analytical approach to doubt, were able to give credit for an accurate report
without questioning either motivation or basic skill levels of the media and the
newscaster.
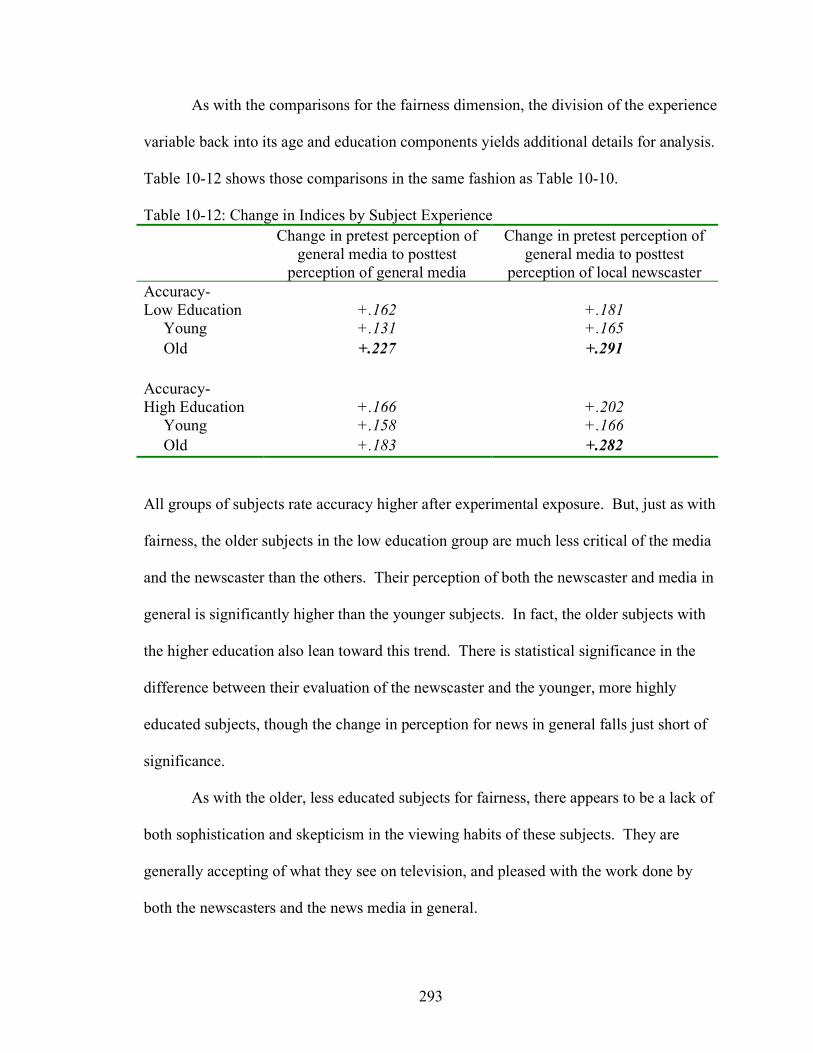
293
As with the comparisons for the fairness dimension, the division of the experience
variable back into its age and education components yields additional details for analysis.
Table 10-12 shows those comparisons in the same fashion as Table 10-10.
Table 10-12: Change in Indices by Subject Experience Change in pretest perception of
general media to posttest perception of general media
Change in pretest perception of general media to posttest
perception of local newscaster Accuracy- Low Education +.162 +.181 Young +.131 +.165 Old +.227 +.291 Accuracy- High Education +.166 +.202 Young +.158 +.166 Old +.183 +.282
All groups of subjects rate accuracy higher after experimental exposure. But, just as with
fairness, the older subjects in the low education group are much less critical of the media
and the newscaster than the others. Their perception of both the newscaster and media in
general is significantly higher than the younger subjects. In fact, the older subjects with
the higher education also lean toward this trend. There is statistical significance in the
difference between their evaluation of the newscaster and the younger, more highly
educated subjects, though the change in perception for news in general falls just short of
significance.
As with the older, less educated subjects for fairness, there appears to be a lack of
both sophistication and skepticism in the viewing habits of these subjects. They are
generally accepting of what they see on television, and pleased with the work done by
both the newscasters and the news media in general.
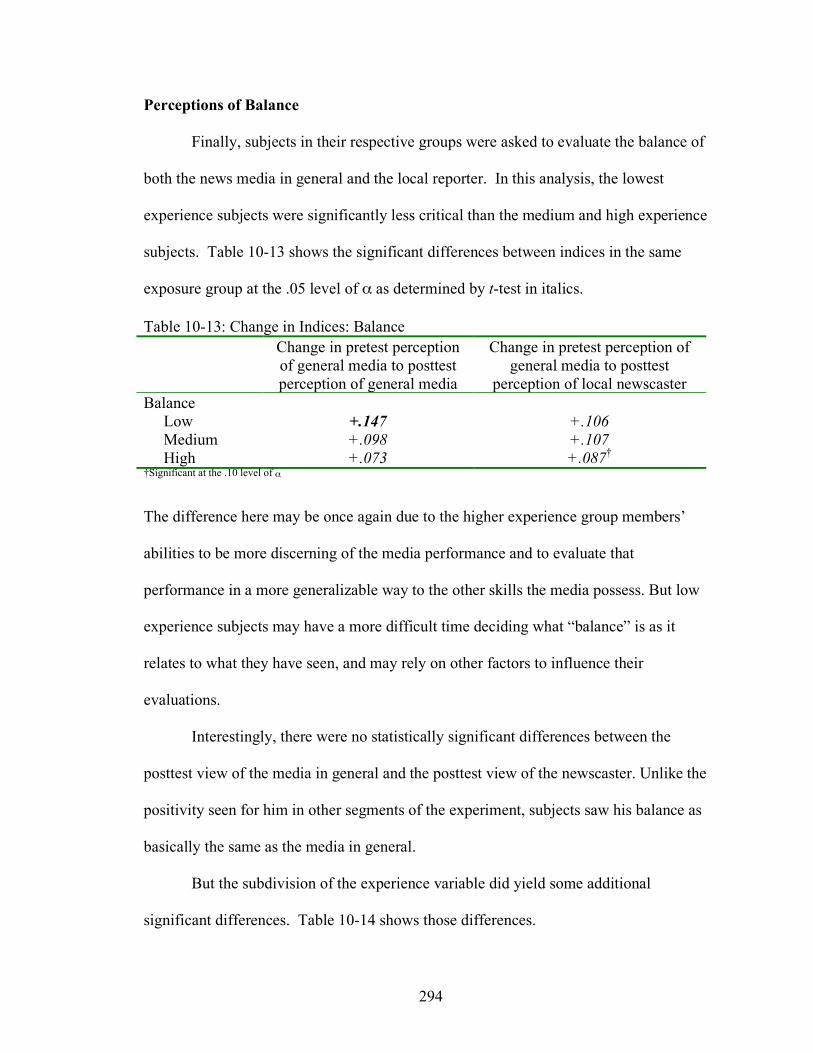
294
Perceptions of Balance
Finally, subjects in their respective groups were asked to evaluate the balance of
both the news media in general and the local reporter. In this analysis, the lowest
experience subjects were significantly less critical than the medium and high experience
subjects. Table 10-13 shows the significant differences between indices in the same
exposure group at the .05 level of α as determined by t-test in italics.
Table 10-13: Change in Indices: Balance Change in pretest perception
of general media to posttest perception of general media
Change in pretest perception of general media to posttest
perception of local newscaster Balance Low +.147 +.106 Medium +.098 +.107 High +.073 +.087† †Significant at the .10 level of α
The difference here may be once again due to the higher experience group members’
abilities to be more discerning of the media performance and to evaluate that
performance in a more generalizable way to the other skills the media possess. But low
experience subjects may have a more difficult time deciding what “balance” is as it
relates to what they have seen, and may rely on other factors to influence their
evaluations.
Interestingly, there were no statistically significant differences between the
posttest view of the media in general and the posttest view of the newscaster. Unlike the
positivity seen for him in other segments of the experiment, subjects saw his balance as
basically the same as the media in general.
But the subdivision of the experience variable did yield some additional
significant differences. Table 10-14 shows those differences.
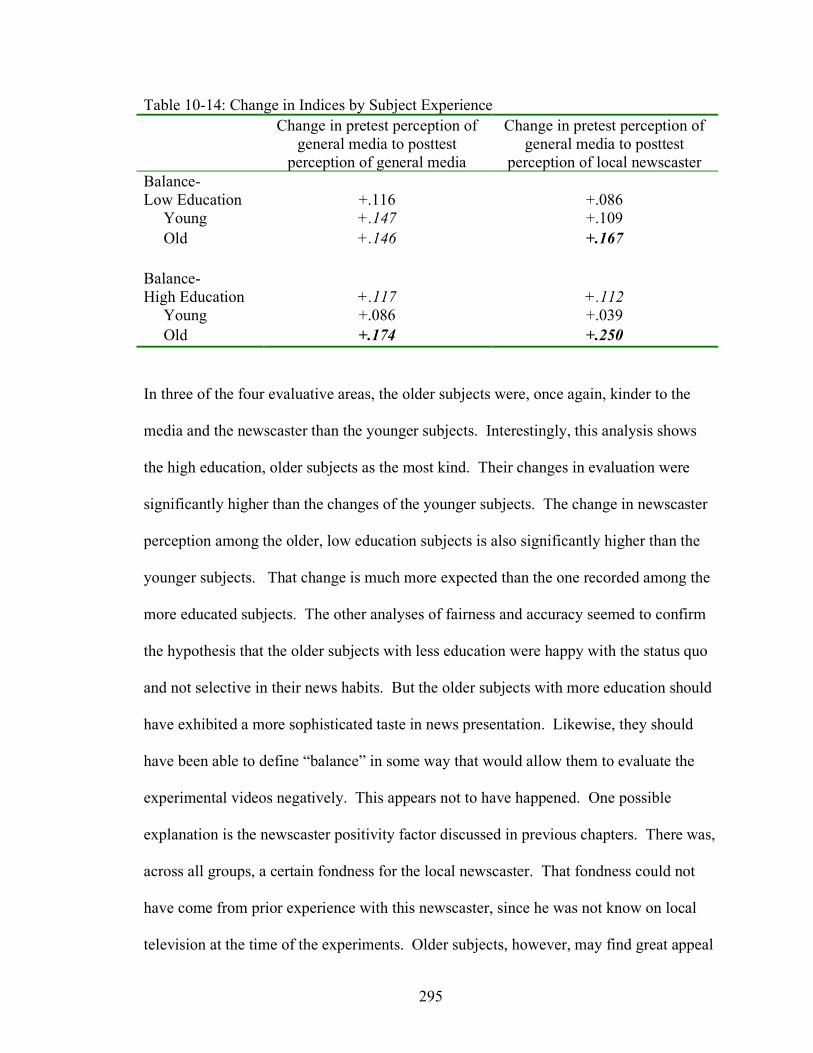
295
Table 10-14: Change in Indices by Subject Experience Change in pretest perception of
general media to posttest perception of general media
Change in pretest perception of general media to posttest
perception of local newscaster Balance- Low Education +.116 +.086 Young +.147 +.109 Old +.146 +.167 Balance- High Education +.117 +.112 Young +.086 +.039 Old +.174 +.250
In three of the four evaluative areas, the older subjects were, once again, kinder to the
media and the newscaster than the younger subjects. Interestingly, this analysis shows
the high education, older subjects as the most kind. Their changes in evaluation were
significantly higher than the changes of the younger subjects. The change in newscaster
perception among the older, low education subjects is also significantly higher than the
younger subjects. That change is much more expected than the one recorded among the
more educated subjects. The other analyses of fairness and accuracy seemed to confirm
the hypothesis that the older subjects with less education were happy with the status quo
and not selective in their news habits. But the older subjects with more education should
have exhibited a more sophisticated taste in news presentation. Likewise, they should
have been able to define “balance” in some way that would allow them to evaluate the
experimental videos negatively. This appears not to have happened. One possible
explanation is the newscaster positivity factor discussed in previous chapters. There was,
across all groups, a certain fondness for the local newscaster. That fondness could not
have come from prior experience with this newscaster, since he was not know on local
television at the time of the experiments. Older subjects, however, may find great appeal
296
in his youthful appearance and good looks—perhaps like a child or grandchild would
have. This effect might help explain why the newscaster evaluation would increase more
than the general media evaluation for the older, less educated subjects.
Experimental Effects and Experience
In addition to the data considered above, there is one other consideration that
comes when dividing the subjects by life experience. The most experienced subjects may
have reacted to the process of the experiment much differently than the others due to their
personal experiences with media. Seeing those local stories that played before and after
then experimental political story may have evoked years of good—or bad—memories of
local media performance. If those memories were good ones—as research shows they
often are when it comes to local television media—they could have transferred some of
that positive feeling to the experimental news product the subjects were viewing, giving
them an overall more positive evaluation of the news media than they displayed during
the pretest questioning. Also, as noted in the changes in perceptions of balance, they
appear to have found a young man with whom they are comfortable. His evaluation is
uniformly positive, suggesting that he was seen as an ideal newscaster in the eyes of the
more experienced subjects. Perhaps he reminded them of someone they had admired
before. Perhaps he just fit the stereotype of a good anchorman. With either possibility, as
well as others that could conjure positive evaluations, the local newscaster may have
benefited from the years of positive local television news viewing experience these older
subjects brought to the experiments.
297
Content or Contempt?
This analysis of the data, both from ideological and experiential perspective,
seems to show that the subjects who came to the experiment with a more sophisticated or
suspicious view of the media were more negative in their evaluations, while those who
came with a simplistic set of analytical skills or disinterested point of view were more
positive.
This evaluation is consistent with the common understanding of the perceptual
screening most people use when viewing political or other information that could
potentially come in conflict with their previously held beliefs. Those perceptual screens
are strong, and the likelihood of one exposure changing personal opinions is low. The
lack of strong changes in opinion among the subjects—even those who saw the most
biased of newscast presentations—is also consistent with this notion of a perceptual
screen preventing the subjects from experiencing drastic opinion changes.
The data show an interesting predicament for news media practitioners. Those
news consumers willing to pay the most attention to the media messages are least likely
to receive it in the way intended, paying little attention to any message that might break
through perceptual screening. Those least educated or least attentive seem to be the most
likely to receive the messages fully, though the processing of those messages will be less
than sophisticated.
298
Chapter 11: A Fleeting Frame in a Lifetime of Moving Images
Should a tiny piece of metal and paint, less than a quarter of a square inch in size,
have caused worries over media bias from one coast to the other in the fall of 2001? The
dispute started over the wave of patriotism that spread across the nation in the wake of
the September 11 attacks. Some journalists, including this author, worried the wearing of
an American flag lapel pin by on-air newscasters would send a strong signal of bias to
some viewers—bias of support for the current administration and its developing policies
to deal with terrorism. Journalists did not want viewers to think they had taken an
ideological side in public policy and discourse. Critics argued that didn’t matter, that the
showing of patriotism through the display and use of the American flag was what was
important. Those critics wanted the media to take a side—the American side—in the
growing worldwide conflict over how to deal with 21st Century terrorism. And they
wanted media viewers to know which side their newscasters were on.
But what no one argued at the time is that the viewers might not notice the flag
pin at all—at least not in terms of how they viewed the impartiality or bias of their
newscasters. Journalists assumed viewers watched the newscasts with fierce intensity—
picking up every subtle detail of visual and written information. Those journalists—the
good ones, anyway—craft each word of their stories as if they are as valuable as gold.
News photographers—again, the good ones—compose each shot of video like a
masterpiece. And newscasters give birth to each word like children, sending them out to
the unseen audience for each to be received, recorded, and remembered. But television
news viewers have a different way of watching the news. They come to the screen with
299
preconceived notions of what they will see. Some picture a liberal media elite
transmitting messages that must be filtered and processed before they can be received.
Others see a source of news that has already been “processed” by people they trust—their
local news team. But very few—perhaps none—are scrutinizing every image and
processing the details right down to, well, a lapel pin.
So while journalists may object and politicians may insist, that lapel pins are
proper attire for newscasters, this research has set out to see if a pin can make a
difference in how newscasters are perceived and trusted. Beyond that, this research has
looked at the larger question of just what it takes to move newscaster trust in one
direction or the other. Through visual and verbal clues, the examination has focused on
the power of news to break through perceptual screens and reach the core of the viewer.
Isolated Exposures
This research has shown that viewers experience the media as part of a continuum
of media experience, not as a finite viewing experience. Those subjects who came to the
experiments had spent their lives up to that point receiving media messages via
newspaper, radio, billboard, internet, skywriting, and yes, television. It is safe to say the
experience was not a new one for a single participant. The act of sitting down in front of
the television and turning one’s attention to a news broadcast is as familiar to most as
sitting before a parent, teacher, or clergyman. That familiarity brings with it the ability
for people to know what they are seeing from the moment it appears on the screen. The
conventions of a newscaster sitting at a desk, reading stories, talking to other newscasters
reading stories from the field, and returning to the studio again is one understood by
300
nearly everyone. There are no mysteries to unravel for the television news viewer—no
program to follow so one can know the rules of the game. This saves time for news
consumers, because they know what to expect when they watch. But there’s a price to be
paid for this familiarity. For those who watch regularly become lulled by the sameness of
the product and find themselves prone to inattention and intellectual shortcuts. Those
shortcuts are ways for viewers’ brains to fill in what is about to happen. The crime occurs
and the police officer gives the details. The missing child returns and the parents gush
their thanks to the television cameras. The Republican makes a policy statement, and the
Democrat derides him. These scenes, replayed over and over on the television news, steal
its dramatic power. Who carefully reads every word of a book he has already read
before?
Beyond the familiarity of the news broadcast, each viewer has a system of
perceptual screens that work on all media. These screens block out some messages that
are dissonant with respect to one’s belief structure, and let others through in a filtered
manner. Politically speaking, the screens work to reinforce our trust and confidence in the
politicians we support, and to block any messages that would shake that confidence.
Likewise the same system of screens passes along messages that reduce members of
other parties and ideologies in our eyes, keeping them from gaining stature and trust. It is
a powerful system that is well understood in the literature of political science.
Along with those perceptual screens, television news viewers bring to the nightly
newscast another set of beliefs surrounded by a screening mechanism. In this case, the
beliefs are those carried by the news consumer about the quality of the newscasters they
view and the trust—or distrust—they have for them. A long time newscaster on a popular
301
local station can be like an incumbent politician. The newscaster sits at the center of a
system of trust and confidence. Long time experience with him and his newscast builds a
strong belief in the fairness, accuracy, and balance of what he tells the viewer. Challenges
to that position of trust in the form of competing newscasters from other stations trying to
win new viewers are met with a bristle of perceptual screens. The “incumbent”
newscaster has an incredibly high chance of retaining viewer through any challenge by
the competition, just as a long incumbent politician has a very high change of re-election
against all challengers.
But the television newscaster is not the perfect news delivery system. Each is
human, and backed by a team of human assistants. They make mistakes, sometimes get it
wrong, and sometimes insert their own personal biases. Over a length of viewing, news
consumers notice this as well. Distrust can build and grow over time if a viewer perceives
bias in the newscast. But this research has shown it is not an immediate process.
Short-Term Attitude Change Toward Media
This experiment explored the process whereby news consumers view and
assimilate what they see in typical television news content. Each subject had a brief
exposure to biased news material. Brief is the key word here, as the longest exposure—to
the lapel pin in each scenario—lasted no more than four minutes for any given group.
The exposure to the more severe bias—the manipulated script and video content—was
much shorter. It was less than a minute for each group. That exposure had to counter,
with many of the subjects, decades of experience with the mass media, including local
television news. For the typical subject, those experiences had been overwhelmingly
302
positive before the experiment took place. Even those who came with a sense of a biased
media—usually in the liberal direction—had previous good experiences with local news
in most cases. So room after room full of subjects brought years of positive experiences
with local television news they found to be fair, accurate, and balanced to bear on the few
minutes of television they watched in an experimental setting. The weight of all that
media experience gave those previously held beliefs a lot of inertia to remain right where
they were when the subjects arrived.
In the experiments, the subtle clues that might suggest bias were routinely
rejected. The flag pin, worn to promote patriotism for those hearing about the pledge of
allegiance, the rainbow pin worn to promote gay marriage for those hearing about same
sex marriage, and the pro-life pin worn to promote the anti-abortion agenda for those
hearing about the abolition of abortion all had the same effect on the subjects—none at
all. Perhaps the exposure was too short; perhaps the pins were consistent with what the
subjects had seen on the newscasters before. Or perhaps, even with the higher than usual
attention the subjects were paying to the news breaks, they were unable to associate the
lapel pin on the newscaster with the controversial story being presented in the newscast.
Particularly on those exposures where the stories themselves were presented in an
unbiased fashion and only the lapel pin gave the visual cue of bias were there no effects
seen.
Those exposures that combined the lapel pin with news copy written in a biased
manner seemed to have no real effect either. Clearly, the lapel pin itself could not bring
about a perception change in the subjects. And combined with bias in the news writing,
the effects still seemed too subtle to make a difference in how the subjects would rate the
303
newscaster and the news media in general. It is possible the subjects just accepted a
single story (the only one in the newsbreak that was manipulated was the controversial
one on patriotism, gay marriage, or abortion) that was a little slanted in one direction.
This was probably consistent with most subjects television news experience where at
least part of the time the stories are not perfect, not covered right down the middle. So it
can easily be expected that the subjects, bringing their viewing experience to the table,
saw nothing so terribly out of the ordinary in those moderate treatments that they had to
change their preconceived views of the job the news media does—especially the local
media.
It was only with the most severe example of bias—the actual participation of the
newscaster in a public demonstration that exhibited an ideological point of view—that
some of the subjects sat up and took notice. It is important to note that only some of the
subjects noted this blatantly biased activity and presentation. For the others, the screens
held their places and kept the overall perception of news media trust about where it had
been before the experiment.
These results show that single exposures of bias carry very little weight in the
mind of the news consumer. The “true” picture each viewer has of the news media outlets
that come into play everyday is really a motion picture. Its first frame is recorded at the
time the consumer begins to watch news to obtain a view of the world. Those initial
impressions mean a lot, settling into an expected pattern over time. Each successive
exposure adds another frame to the consumer’s internal epic, adding additional
information to the overall view, but not changing it in its own fleeting time. Just as one
could drop a single frame from the wrong film into another movie and most of the
304
audience would not notice, the same is true of news exposures. The viewers do not
respond to subliminal messages. In fact, this research suggests they hardly respond to the
blatant messages.
Possible Research Problems
The research is, like any other, subject to experimental error. It is possible the
subjects did perceive bias from their very first glimpse of the lapel pin, yet the
instruments did not record it. The sample size for the experiment is limited. Just shy of
250 people took part, with small groups of only 20 or so seeing each of the experimental
treatments. Demographically, the numbers of subjects from any one age or educational
group are also small. Too few minorities took part in the study to give any meaningful
analysis to the role race plays in perceptions of media bias. Larger numbers of subjects
could have yielded more significant results on many of the analyses where none were
found.
The analysis also attempted to test three types of story content for differing
effects. With the exception of some ideological differences of subjects affecting some
outcomes, the content has not show itself to be significantly different in affecting
perceptions of bias. More study on one content area might yield more effects. Likewise,
multiple exposures would likely have an additive effect on those subjects, particularly
those in the ideological or experiential middle, driving them to see more bias over time.
The addition of more subjects or the focusing of the experiments on repeated
instances of bias may have revealed what these experiments did not detect—a sensitivity
to media content connected directly to perceptions of bias. The results that suggest
305
ideology does not play a role in perceiving bias are surprising ones. The accusations of a
liberal news media are increasingly more common, with those on the conservative side
adding to an already long list of trespasses by self-sworn impartial journalists. Those on
the left have added to their accusations of a right-leaning media, citing both increasing
corporate interests in the media, as well as a growing exhibition of on-air patriotism—the
very impetus for this research. Dividing the subjects’ posttest results by ideological
grouping did yield some small perceptions of bias when viewing those issues that leaned
the other way political. The right-leaning bias in two of the three experiments did just a
little to please conservative. And the one issue liberals where liberals saw an agreeable
bias did move conservatives to react a bit stronger than the rest. But even the ideological
differences between the two points of view were not enough to allow the bias in these
presentations to change long-standing belief structures. In fact, pretest measures seemed
to suggest both ideologies shared some common ground on media performance and
expectations of what makes up fair, accurate, and balanced reporting.
Lessons for the Politicians and Journalists
At the beginning of this research, politician and journalists were on opposite sides
of a fight over what makes a good journalist. The politicians—many of them, at least—
believed a patriotic journalist was a place to start. Journalists believed that the outward
showing of patriotism could only be a start down the road to a perception of bias that
could undermine their longstanding role as an impartial watchdog. They stressed that any
physical sign that could be taken to mean a siding with one point of view or ideology
could only be taken as a sign that the newscaster was not as fair and balanced as possible.
306
One could surmise then, from this research, that the politicians had it right and the
journalists had it wrong. The experimental evidence seems to demonstrate that if the
newscasters had worn the lapel pins in the days following September 11, then very few
viewers would have considered them to be biased or wrong in their actions. The
experimental evidence shows that the subjects were, as a group, quite tolerant of the
addition of lapel pins on the newscaster—even when that pin blatantly took the side of
one of the controversial issues the newscaster was covering. So when the politicians
argued that the flag lapel pin would not have much of an effect in transmitting a
perception of bias to news viewers, they were right. But they were right for the wrong
reason. It is not the type of pin the newscaster wears that makes it fail to draw out a
perception of bias. The flag is not a nobler symbol than a rainbow or pro-life pin—not in
terms of this research’s findings. The reason the flag pins could not have coaxed calls of
bias post-September 11 is that they were not the norm before that time. Studies showed
few newscasters wore the pins prior to the terrorist attacks. Many now no longer wear
them. The exposure of the audience to the flag lapel pins was fleeting. It was only a
small part of that larger media consumption picture. This research suggests anchors have
a great deal of freedom—for a short time. Many viewers would write off any apparent
biases that conflict with their long term perceptions of the newscaster as just aberrations.
Some others would see it as confirmation of a bias they already perceived in the
newscaster. In the case of a lapel pin, unless that worn symbol was associated with
increased bias in the words and pictures accompanying the newscaster’s appearances, and
unless those biases were present for a longer period than just a momentary exposure, the
307
evidence here points to no real shift in perceptions of bias among the bulk of media
consumers.
Journalists, though, should not try to claim any victory from this research either.
Viewers do not hang on every word, every picture they see on television. They are
distracted by other stimuli, divorced from any real engagement with the newscaster and
his message, and distant from the messages themselves. Journalists would be wrong to
think that the smallest things they do are magnified to bigger than life-sized when
captured by the television camera and shot through the ether to their ultimate
destinations. But they would also be wrong to think that, over time, none of it mattered.
The relatively positive impressions held by the subjects in this experiment of television
news—especially local television news—were built from many years of exposure to
media messages perceived as generally fair, accurate, and balanced. In fact, the general
agreement by subjects of different ideologies and demographic characteristics about the
job the media do shows that journalists have done at least an adequate job of training
their audience members on what to expect quality journalism to be.
What Are Journalism’s Real Threats?
But there are dangers for journalists in ignoring thoughts of ethics and remaining
unbiased. The work of generations of journalists before them gives reporters of today the
foundation from which they work. While that foundation has its cracks, it still supports a
system of reporting that is widely accepted by people in this country regardless of their
ideology, socioeconomic background, or personal beliefs. That foundation was built by a
myriad of decisions about what was the right way to report, and what was the wrong way.
308
As in this experiment, few of those individual decisions made much of a difference in the
overall impression news consumers had of the media. But as a collection of decisions,
they have had a collective power to shape what Americans think of journalism today.
Moving from the macro to the micro then highlights the other concern for
journalists. While the overall impression of the media remained relatively strong despite
the experimental exposures, there were changes at the individual level. Some subjects
reacted a great deal to what they had seen. But their individual changes in perception
were masked by the aggregate lack of opinion change in most of the groups. Likewise,
though subjects came to the experiment with a relatively positive view of the local media,
some individuals among them were completely unhappy with the news they receive from
television. These outliers were also masked by the larger sense of aggregate satisfaction.
The signals sent by media are received by individuals, not groups or viewers or subjects.
Each individual receives the signal in a slightly different manner, based on prior media
experience and those internal perceptual screens. If journalists find that consumers are,
even as individuals, changing their opinions from positive to negative, then a ground
swell can occur that will result in ever lower perceptions of media trust. Some would say
it has already begun, as evidenced by the rapid rise in popularity of the so-called “new
media.” While others say that popularity is driven by the on demand aspect of the
availability of the news product, some insist that this new media vehicle is one way
around the stranglehold the traditional media have on news distribution. And to bring the
argument full circle, most of those critics are conservatives who see the traditional media
as a liberal institution that blocks the distribution of unbiased news reporting.
309
Further Study with the Media Trust Index
The main analytical variable used in this study, the media trust index, has
potential for longitudinal study that would help reveal more patterns of media trust over
longer period of time. A historical analysis of public opinion polls regarding media
performance—particularly in the areas of fairness, accuracy, and balance—would yield
interesting results to show the trends in media trust over the last 10, 25, 50 years or more.
Because the index is easily calculated from any format of question, it is suited to compare
varying survey instruments done at different points in time. Scholars and journalists alike
would probably anecdotally expect a decreasing level of media trust in the modern
journalism era. Calculating the media fairness index, media accuracy index, and media
balance index, and combining them into the overall media trust index for those years
would but hard numbers to the anecdotal evidence.
Future experimental study could use the same media trust index to compare long-
term change in attitude toward media with repeated exposure. A single group of subjects,
subjected to repeated exposures of the same media bias, could more readily yield the
results expected in this research. The subjects would see repeated newscasts employing
the same newscaster presenting the news of the day. Through repeated exposures to the
same bias—perhaps a lapel pin once again—the subjects would have time for
adjustments to their previously held beliefs to take hold. Different groups of subjects
could see different levels of bias, each one adding more blatant and obvious signs of lack
of balance and fairness. The numbers of exposures needed to change opinion
significantly could be record for each level of bias exposure. It is through this sort of
310
running study over a considerable period of time that the media trust index measurements
could show how viewers really change their opinions about television news.
The Real Ribbon of Controversy
This research began with the furor surrounding the banning of flag pins and red,
white, and blue ribbons from the air in an attempt to ensure perceptions of unbiased
reporting. That beginning led to the discovery of the real ribbon of controversy, the
ongoing ribbon of media experiences viewers weave as they spend a lifetime in front of
their television sets. The ribbon is woven from each individual experience consumers
have watching the news, judging its fairness, accuracy, and balance, and recording those
judgments in the fabric of the ribbon. The longer the ribbon is woven, the stronger its
threads become. Individual instances of bias cannot break the ribbon or cut its fabric.
Only through repeated exposures to unexpected stimuli carrying biases messages does the
ribbon start to unravel. The unraveling develops slowly, and can be repaired through a
return to the old norms that brought on the baseline level of media trust. Or it can
continue if the level of bias changes permanently, resetting the pattern of the ribbon to a
new and different one.
This research did not succeed in unraveling the ribbon most subjects brought with
them to the experiments. They carried it out looking much the same as it did when they
carried it in. A single exposure could only stretch and bend the ribbon a bit before it
returned to shape.
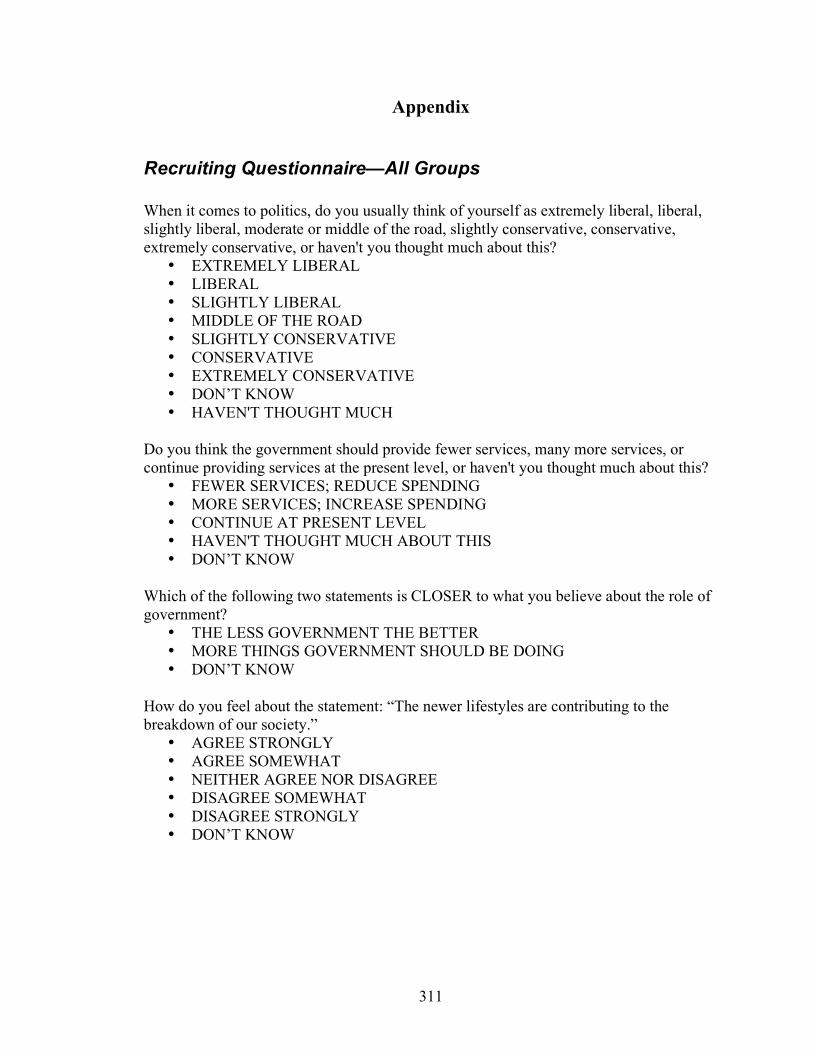
311
Appendix
Recruiting Questionnaire—All Groups When it comes to politics, do you usually think of yourself as extremely liberal, liberal, slightly liberal, moderate or middle of the road, slightly conservative, conservative, extremely conservative, or haven't you thought much about this?
• EXTREMELY LIBERAL • LIBERAL • SLIGHTLY LIBERAL • MIDDLE OF THE ROAD • SLIGHTLY CONSERVATIVE • CONSERVATIVE • EXTREMELY CONSERVATIVE • DON’T KNOW • HAVEN'T THOUGHT MUCH
Do you think the government should provide fewer services, many more services, or continue providing services at the present level, or haven't you thought much about this?
• FEWER SERVICES; REDUCE SPENDING • MORE SERVICES; INCREASE SPENDING • CONTINUE AT PRESENT LEVEL • HAVEN'T THOUGHT MUCH ABOUT THIS • DON’T KNOW
Which of the following two statements is CLOSER to what you believe about the role of government?
• THE LESS GOVERNMENT THE BETTER • MORE THINGS GOVERNMENT SHOULD BE DOING • DON’T KNOW
How do you feel about the statement: “The newer lifestyles are contributing to the breakdown of our society.”
• AGREE STRONGLY • AGREE SOMEWHAT • NEITHER AGREE NOR DISAGREE • DISAGREE SOMEWHAT • DISAGREE STRONGLY • DON’T KNOW
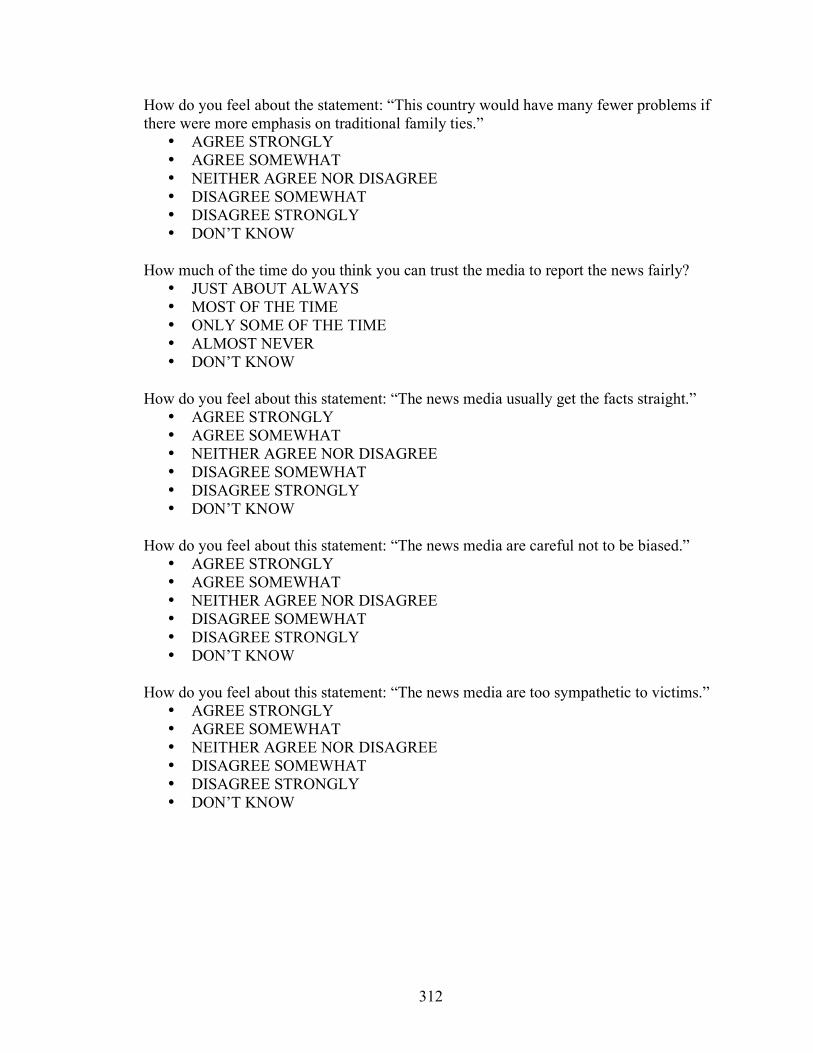
312
How do you feel about the statement: “This country would have many fewer problems if there were more emphasis on traditional family ties.”
• AGREE STRONGLY • AGREE SOMEWHAT • NEITHER AGREE NOR DISAGREE • DISAGREE SOMEWHAT • DISAGREE STRONGLY • DON’T KNOW
How much of the time do you think you can trust the media to report the news fairly?
• JUST ABOUT ALWAYS • MOST OF THE TIME • ONLY SOME OF THE TIME • ALMOST NEVER • DON’T KNOW
How do you feel about this statement: “The news media usually get the facts straight.”
• AGREE STRONGLY • AGREE SOMEWHAT • NEITHER AGREE NOR DISAGREE • DISAGREE SOMEWHAT • DISAGREE STRONGLY • DON’T KNOW
How do you feel about this statement: “The news media are careful not to be biased.”
• AGREE STRONGLY • AGREE SOMEWHAT • NEITHER AGREE NOR DISAGREE • DISAGREE SOMEWHAT • DISAGREE STRONGLY • DON’T KNOW
How do you feel about this statement: “The news media are too sympathetic to victims.”
• AGREE STRONGLY • AGREE SOMEWHAT • NEITHER AGREE NOR DISAGREE • DISAGREE SOMEWHAT • DISAGREE STRONGLY • DON’T KNOW
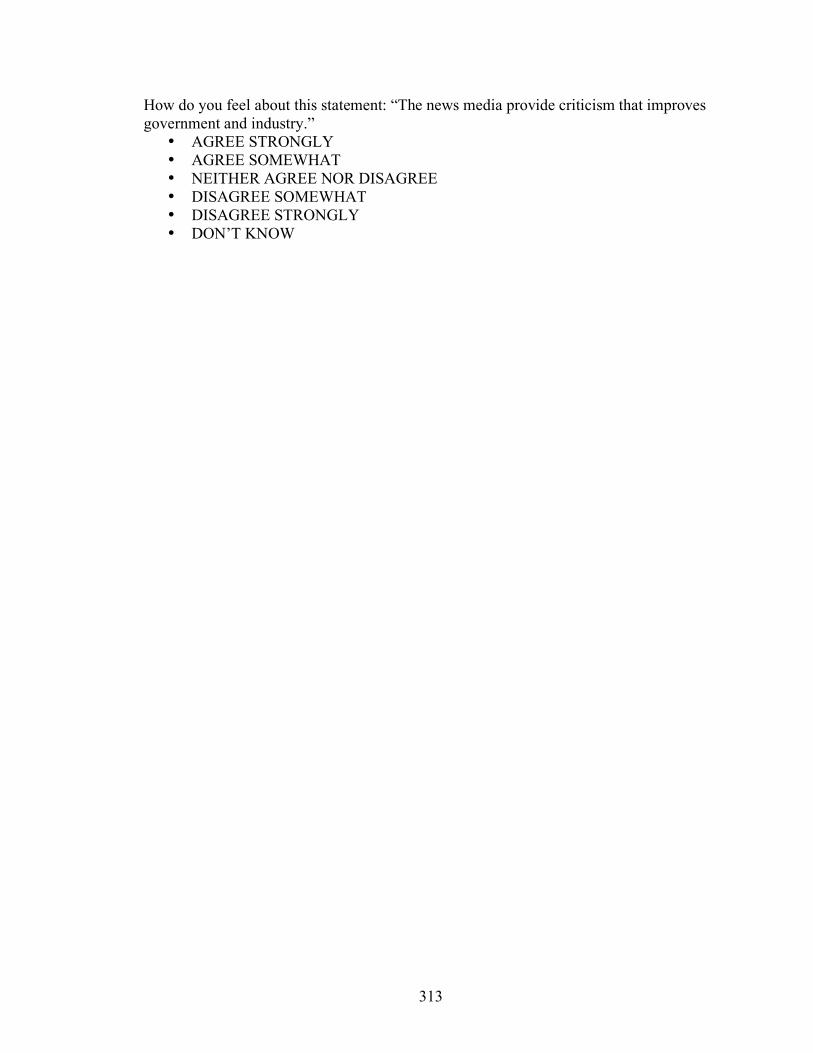
313
How do you feel about this statement: “The news media provide criticism that improves government and industry.”
• AGREE STRONGLY • AGREE SOMEWHAT • NEITHER AGREE NOR DISAGREE • DISAGREE SOMEWHAT • DISAGREE STRONGLY • DON’T KNOW
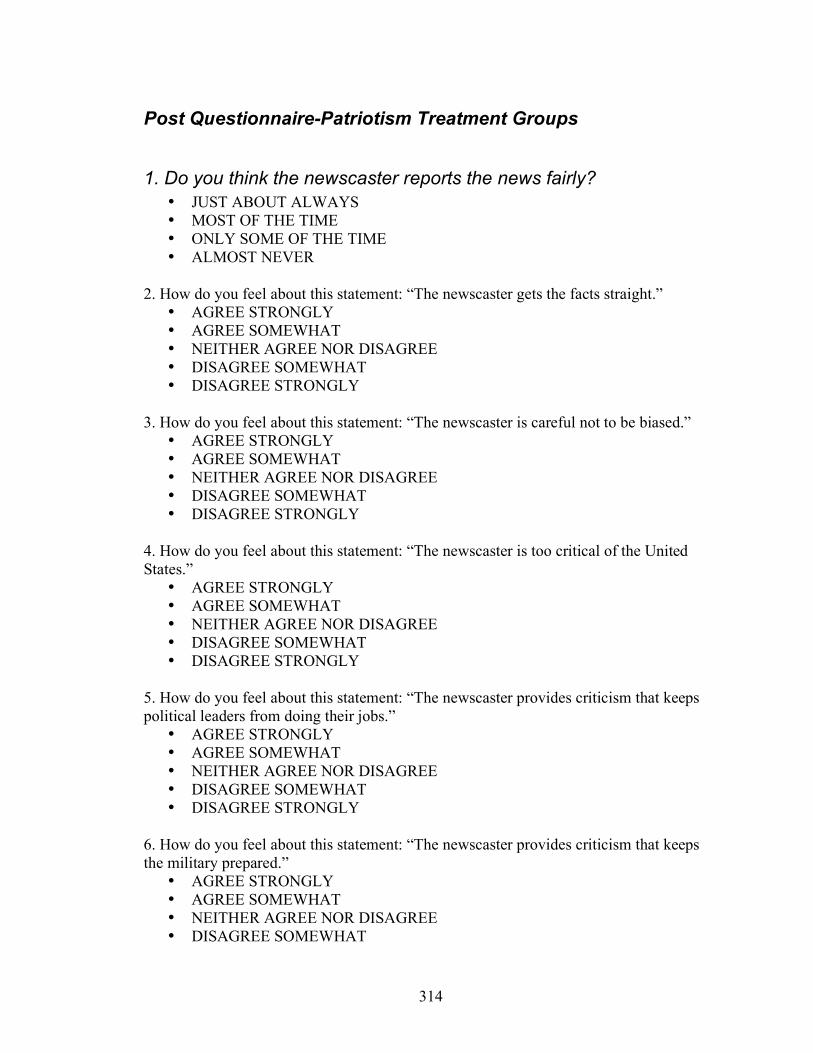
314
Post Questionnaire-Patriotism Treatment Groups
1. Do you think the newscaster reports the news fairly? • JUST ABOUT ALWAYS • MOST OF THE TIME • ONLY SOME OF THE TIME • ALMOST NEVER
2. How do you feel about this statement: “The newscaster gets the facts straight.”
• AGREE STRONGLY • AGREE SOMEWHAT • NEITHER AGREE NOR DISAGREE • DISAGREE SOMEWHAT • DISAGREE STRONGLY
3. How do you feel about this statement: “The newscaster is careful not to be biased.”
• AGREE STRONGLY • AGREE SOMEWHAT • NEITHER AGREE NOR DISAGREE • DISAGREE SOMEWHAT • DISAGREE STRONGLY
4. How do you feel about this statement: “The newscaster is too critical of the United States.”
• AGREE STRONGLY • AGREE SOMEWHAT • NEITHER AGREE NOR DISAGREE • DISAGREE SOMEWHAT • DISAGREE STRONGLY
5. How do you feel about this statement: “The newscaster provides criticism that keeps political leaders from doing their jobs.”
• AGREE STRONGLY • AGREE SOMEWHAT • NEITHER AGREE NOR DISAGREE • DISAGREE SOMEWHAT • DISAGREE STRONGLY
6. How do you feel about this statement: “The newscaster provides criticism that keeps the military prepared.”
• AGREE STRONGLY • AGREE SOMEWHAT • NEITHER AGREE NOR DISAGREE • DISAGREE SOMEWHAT
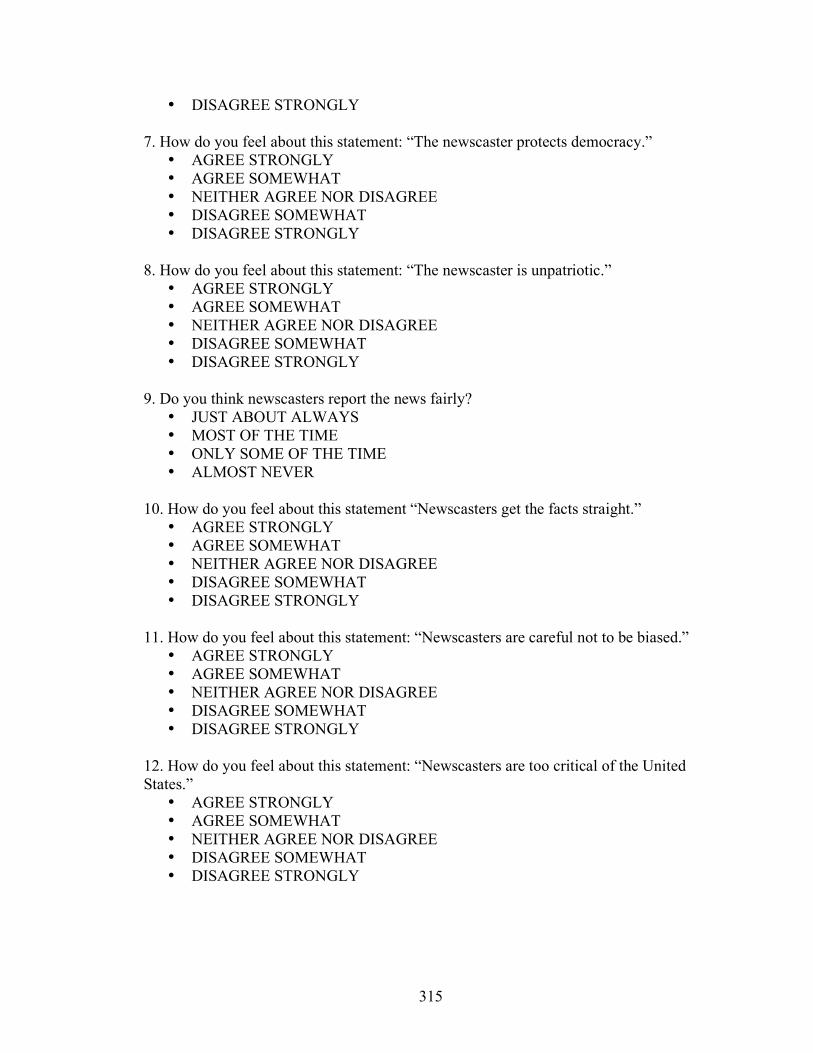
315
• DISAGREE STRONGLY 7. How do you feel about this statement: “The newscaster protects democracy.”
• AGREE STRONGLY • AGREE SOMEWHAT • NEITHER AGREE NOR DISAGREE • DISAGREE SOMEWHAT • DISAGREE STRONGLY
8. How do you feel about this statement: “The newscaster is unpatriotic.”
• AGREE STRONGLY • AGREE SOMEWHAT • NEITHER AGREE NOR DISAGREE • DISAGREE SOMEWHAT • DISAGREE STRONGLY
9. Do you think newscasters report the news fairly?
• JUST ABOUT ALWAYS • MOST OF THE TIME • ONLY SOME OF THE TIME • ALMOST NEVER
10. How do you feel about this statement “Newscasters get the facts straight.”
• AGREE STRONGLY • AGREE SOMEWHAT • NEITHER AGREE NOR DISAGREE • DISAGREE SOMEWHAT • DISAGREE STRONGLY
11. How do you feel about this statement: “Newscasters are careful not to be biased.”
• AGREE STRONGLY • AGREE SOMEWHAT • NEITHER AGREE NOR DISAGREE • DISAGREE SOMEWHAT • DISAGREE STRONGLY
12. How do you feel about this statement: “Newscasters are too critical of the United States.”
• AGREE STRONGLY • AGREE SOMEWHAT • NEITHER AGREE NOR DISAGREE • DISAGREE SOMEWHAT • DISAGREE STRONGLY

316
13. How do you feel about this statement: “Newscasters provide criticism that keeps political leaders from doing their jobs.”
• AGREE STRONGLY • AGREE SOMEWHAT • NEITHER AGREE NOR DISAGREE • DISAGREE SOMEWHAT • DISAGREE STRONGLY
14. How do you feel about this statement: “Newscasters provide criticism that keeps the military prepared.”
• AGREE STRONGLY • AGREE SOMEWHAT • NEITHER AGREE NOR DISAGREE • DISAGREE SOMEWHAT • DISAGREE STRONGLY
15. How do you feel about this statement: “Newscasters protect democracy.”
• AGREE STRONGLY • AGREE SOMEWHAT • NEITHER AGREE NOR DISAGREE • DISAGREE SOMEWHAT • DISAGREE STRONGLY
16. How do you feel about this statement: “Newscasters are unpatriotic.”
• AGREE STRONGLY • AGREE SOMEWHAT • NEITHER AGREE NOR DISAGREE • DISAGREE SOMEWHAT • DISAGREE STRONGLY
17. How do you feel about this statement: “Newscasters are too sympathetic to victims.”
• AGREE STRONGLY • AGREE SOMEWHAT • NEITHER AGREE NOR DISAGREE • DISAGREE SOMEWHAT • DISAGREE STRONGLY
18. How do you feel about this statement: “Newscasters provide criticism that keeps legislators responsive to their constituencies.”
• AGREE STRONGLY • AGREE SOMEWHAT • NEITHER AGREE NOR DISAGREE • DISAGREE SOMEWHAT • DISAGREE STRONGLY

317
19. How do you feel about this statement: “Newscasters are supportive of the gay lifestyle.”
• AGREE STRONGLY • AGREE SOMEWHAT • NEITHER AGREE NOR DISAGREE • DISAGREE SOMEWHAT • DISAGREE STRONGLY
20. How do you feel about this statement: “Newscasters support traditional marriage and family values.”
• AGREE STRONGLY • AGREE SOMEWHAT • NEITHER AGREE NOR DISAGREE • DISAGREE SOMEWHAT • DISAGREE STRONGLY
21. How do you feel about this statement: “Newscasters have overblown the gay marriage debate.”
• AGREE STRONGLY • AGREE SOMEWHAT • NEITHER AGREE NOR DISAGREE • DISAGREE SOMEWHAT • DISAGREE STRONGLY
22. How do you feel about this statement: “Newscasters are not critical of doctors who perform abortions.”
• AGREE STRONGLY • AGREE SOMEWHAT • NEITHER AGREE NOR DISAGREE • DISAGREE SOMEWHAT • DISAGREE STRONGLY
23. How do you feel about this statement: “Newscasters support equal rights for women.”
• AGREE STRONGLY • AGREE SOMEWHAT • NEITHER AGREE NOR DISAGREE • DISAGREE SOMEWHAT • DISAGREE STRONGLY
24. How do you feel about this statement: “Newscasters report fairly on the pro-choice movement.”
• AGREE STRONGLY • AGREE SOMEWHAT • NEITHER AGREE NOR DISAGREE • DISAGREE SOMEWHAT • DISAGREE STRONGLY

318
25. How do you feel about this statement: “Newscasters give the true facts about abortion.”
• AGREE STRONGLY • AGREE SOMEWHAT • NEITHER AGREE NOR DISAGREE • DISAGREE SOMEWHAT • DISAGREE STRONGLY
26. How do you feel about this statement: “Newscasters report about alternatives to abortion.”
• AGREE STRONGLY • AGREE SOMEWHAT • NEITHER AGREE NOR DISAGREE • DISAGREE SOMEWHAT • DISAGREE STRONGLY
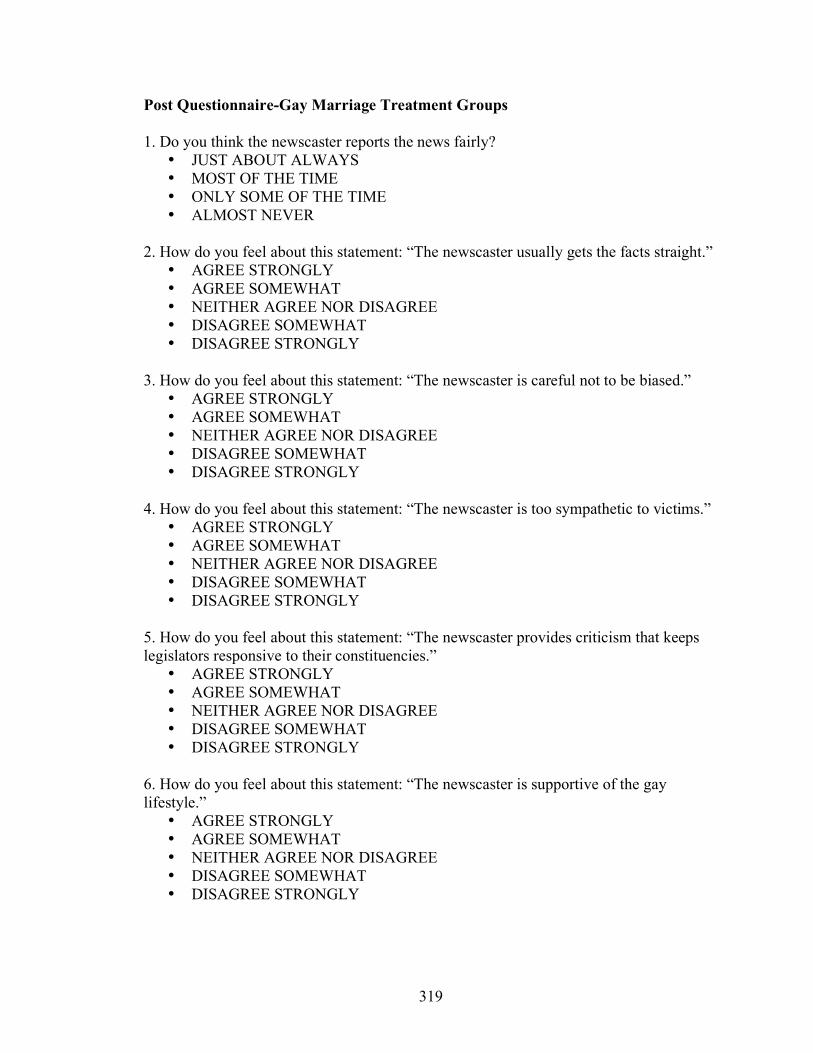
319
Post Questionnaire-Gay Marriage Treatment Groups 1. Do you think the newscaster reports the news fairly?
• JUST ABOUT ALWAYS • MOST OF THE TIME • ONLY SOME OF THE TIME • ALMOST NEVER
2. How do you feel about this statement: “The newscaster usually gets the facts straight.”
• AGREE STRONGLY • AGREE SOMEWHAT • NEITHER AGREE NOR DISAGREE • DISAGREE SOMEWHAT • DISAGREE STRONGLY
3. How do you feel about this statement: “The newscaster is careful not to be biased.”
• AGREE STRONGLY • AGREE SOMEWHAT • NEITHER AGREE NOR DISAGREE • DISAGREE SOMEWHAT • DISAGREE STRONGLY
4. How do you feel about this statement: “The newscaster is too sympathetic to victims.”
• AGREE STRONGLY • AGREE SOMEWHAT • NEITHER AGREE NOR DISAGREE • DISAGREE SOMEWHAT • DISAGREE STRONGLY
5. How do you feel about this statement: “The newscaster provides criticism that keeps legislators responsive to their constituencies.”
• AGREE STRONGLY • AGREE SOMEWHAT • NEITHER AGREE NOR DISAGREE • DISAGREE SOMEWHAT • DISAGREE STRONGLY
6. How do you feel about this statement: “The newscaster is supportive of the gay lifestyle.”
• AGREE STRONGLY • AGREE SOMEWHAT • NEITHER AGREE NOR DISAGREE • DISAGREE SOMEWHAT • DISAGREE STRONGLY
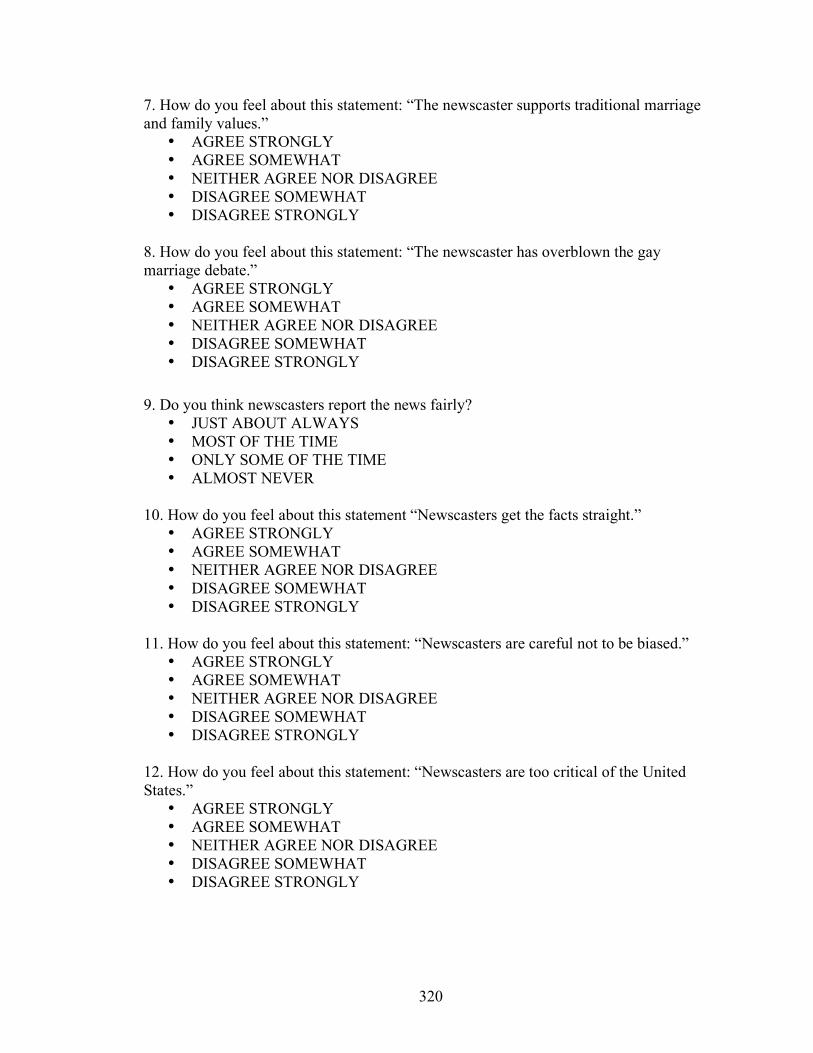
320
7. How do you feel about this statement: “The newscaster supports traditional marriage and family values.”
• AGREE STRONGLY • AGREE SOMEWHAT • NEITHER AGREE NOR DISAGREE • DISAGREE SOMEWHAT • DISAGREE STRONGLY
8. How do you feel about this statement: “The newscaster has overblown the gay marriage debate.”
• AGREE STRONGLY • AGREE SOMEWHAT • NEITHER AGREE NOR DISAGREE • DISAGREE SOMEWHAT • DISAGREE STRONGLY
9. Do you think newscasters report the news fairly?
• JUST ABOUT ALWAYS • MOST OF THE TIME • ONLY SOME OF THE TIME • ALMOST NEVER
10. How do you feel about this statement “Newscasters get the facts straight.”
• AGREE STRONGLY • AGREE SOMEWHAT • NEITHER AGREE NOR DISAGREE • DISAGREE SOMEWHAT • DISAGREE STRONGLY
11. How do you feel about this statement: “Newscasters are careful not to be biased.”
• AGREE STRONGLY • AGREE SOMEWHAT • NEITHER AGREE NOR DISAGREE • DISAGREE SOMEWHAT • DISAGREE STRONGLY
12. How do you feel about this statement: “Newscasters are too critical of the United States.”
• AGREE STRONGLY • AGREE SOMEWHAT • NEITHER AGREE NOR DISAGREE • DISAGREE SOMEWHAT • DISAGREE STRONGLY
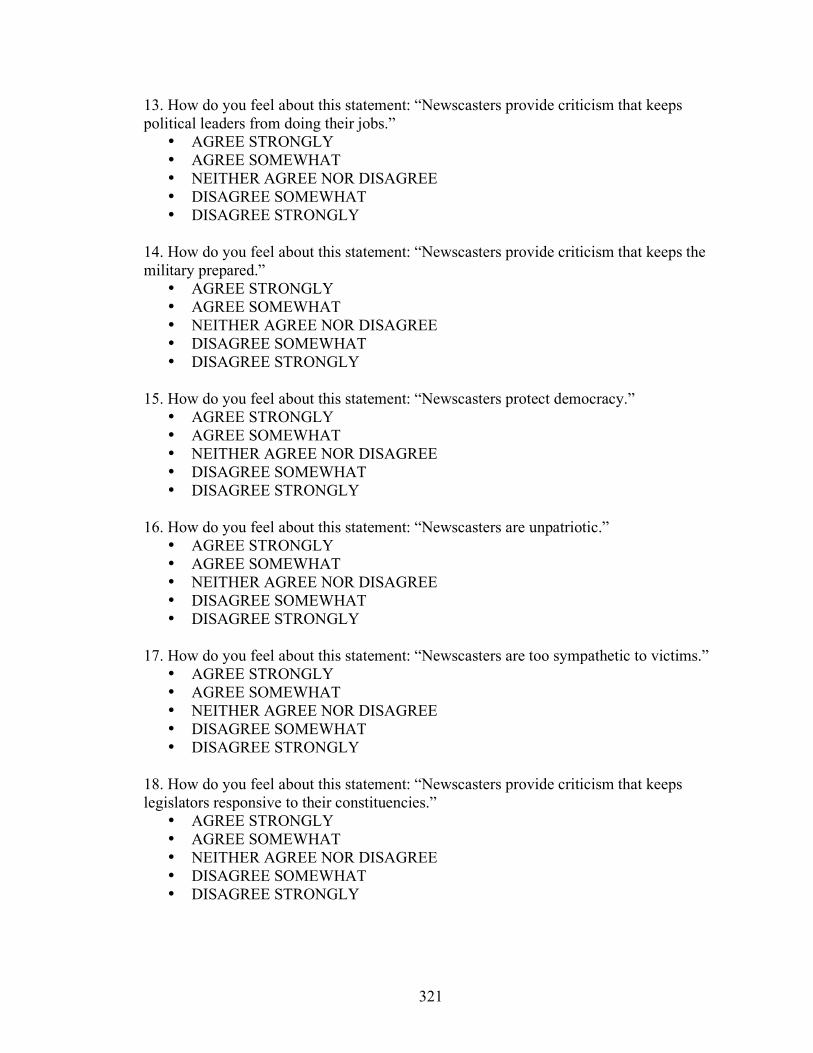
321
13. How do you feel about this statement: “Newscasters provide criticism that keeps political leaders from doing their jobs.”
• AGREE STRONGLY • AGREE SOMEWHAT • NEITHER AGREE NOR DISAGREE • DISAGREE SOMEWHAT • DISAGREE STRONGLY
14. How do you feel about this statement: “Newscasters provide criticism that keeps the military prepared.”
• AGREE STRONGLY • AGREE SOMEWHAT • NEITHER AGREE NOR DISAGREE • DISAGREE SOMEWHAT • DISAGREE STRONGLY
15. How do you feel about this statement: “Newscasters protect democracy.”
• AGREE STRONGLY • AGREE SOMEWHAT • NEITHER AGREE NOR DISAGREE • DISAGREE SOMEWHAT • DISAGREE STRONGLY
16. How do you feel about this statement: “Newscasters are unpatriotic.”
• AGREE STRONGLY • AGREE SOMEWHAT • NEITHER AGREE NOR DISAGREE • DISAGREE SOMEWHAT • DISAGREE STRONGLY
17. How do you feel about this statement: “Newscasters are too sympathetic to victims.”
• AGREE STRONGLY • AGREE SOMEWHAT • NEITHER AGREE NOR DISAGREE • DISAGREE SOMEWHAT • DISAGREE STRONGLY
18. How do you feel about this statement: “Newscasters provide criticism that keeps legislators responsive to their constituencies.”
• AGREE STRONGLY • AGREE SOMEWHAT • NEITHER AGREE NOR DISAGREE • DISAGREE SOMEWHAT • DISAGREE STRONGLY
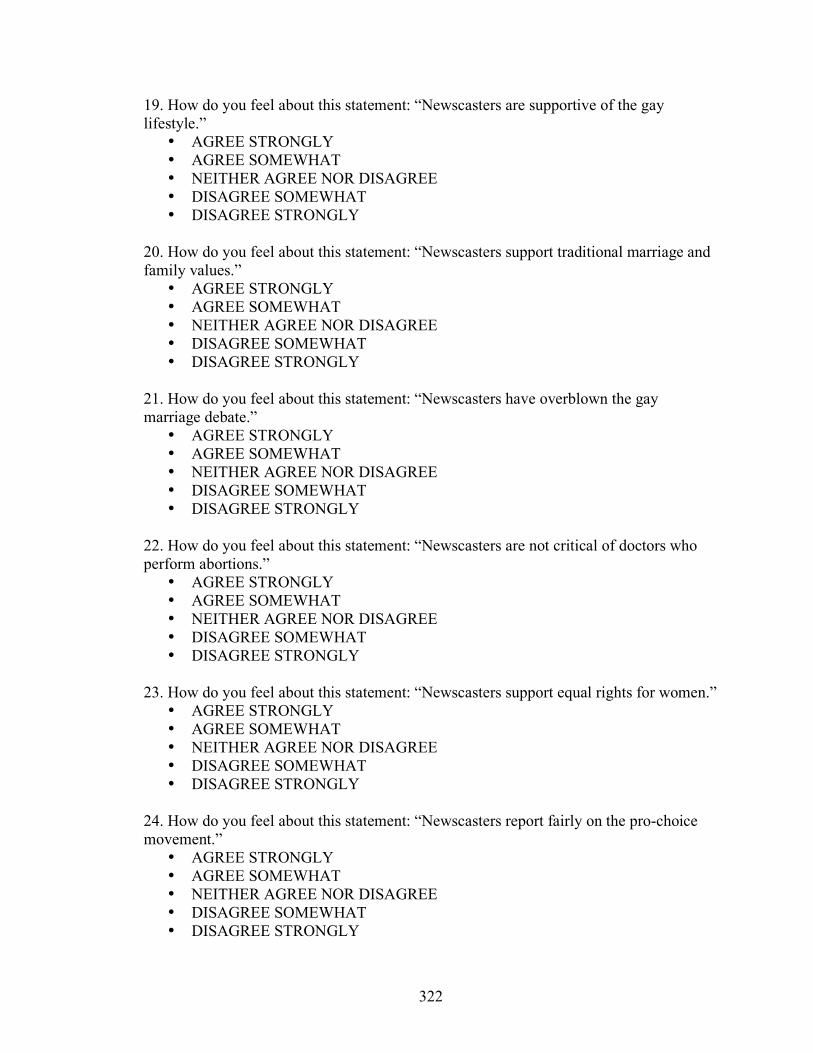
322
19. How do you feel about this statement: “Newscasters are supportive of the gay lifestyle.”
• AGREE STRONGLY • AGREE SOMEWHAT • NEITHER AGREE NOR DISAGREE • DISAGREE SOMEWHAT • DISAGREE STRONGLY
20. How do you feel about this statement: “Newscasters support traditional marriage and family values.”
• AGREE STRONGLY • AGREE SOMEWHAT • NEITHER AGREE NOR DISAGREE • DISAGREE SOMEWHAT • DISAGREE STRONGLY
21. How do you feel about this statement: “Newscasters have overblown the gay marriage debate.”
• AGREE STRONGLY • AGREE SOMEWHAT • NEITHER AGREE NOR DISAGREE • DISAGREE SOMEWHAT • DISAGREE STRONGLY
22. How do you feel about this statement: “Newscasters are not critical of doctors who perform abortions.”
• AGREE STRONGLY • AGREE SOMEWHAT • NEITHER AGREE NOR DISAGREE • DISAGREE SOMEWHAT • DISAGREE STRONGLY
23. How do you feel about this statement: “Newscasters support equal rights for women.”
• AGREE STRONGLY • AGREE SOMEWHAT • NEITHER AGREE NOR DISAGREE • DISAGREE SOMEWHAT • DISAGREE STRONGLY
24. How do you feel about this statement: “Newscasters report fairly on the pro-choice movement.”
• AGREE STRONGLY • AGREE SOMEWHAT • NEITHER AGREE NOR DISAGREE • DISAGREE SOMEWHAT • DISAGREE STRONGLY

323
25. How do you feel about this statement: “Newscasters give the true facts about abortion.”
• AGREE STRONGLY • AGREE SOMEWHAT • NEITHER AGREE NOR DISAGREE • DISAGREE SOMEWHAT • DISAGREE STRONGLY
26. How do you feel about this statement: “Newscasters report about alternatives to abortion.”
• AGREE STRONGLY • AGREE SOMEWHAT • NEITHER AGREE NOR DISAGREE • DISAGREE SOMEWHAT • DISAGREE STRONGLY
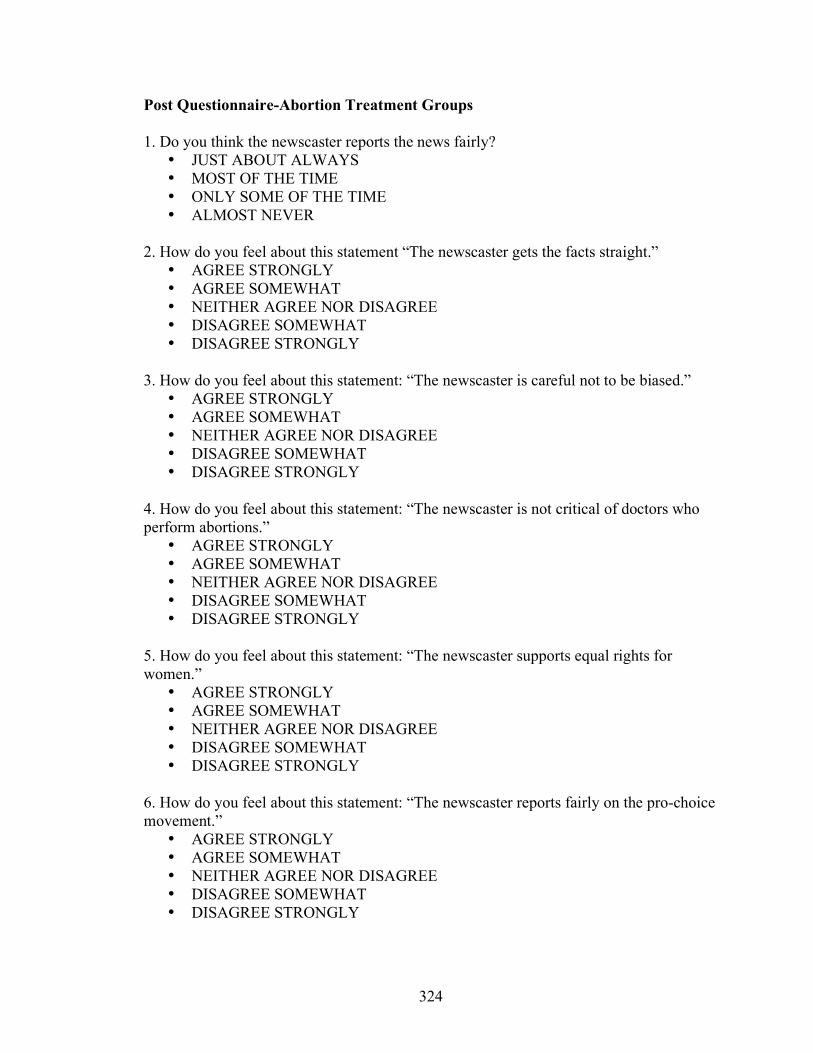
324
Post Questionnaire-Abortion Treatment Groups 1. Do you think the newscaster reports the news fairly?
• JUST ABOUT ALWAYS • MOST OF THE TIME • ONLY SOME OF THE TIME • ALMOST NEVER
2. How do you feel about this statement “The newscaster gets the facts straight.”
• AGREE STRONGLY • AGREE SOMEWHAT • NEITHER AGREE NOR DISAGREE • DISAGREE SOMEWHAT • DISAGREE STRONGLY
3. How do you feel about this statement: “The newscaster is careful not to be biased.”
• AGREE STRONGLY • AGREE SOMEWHAT • NEITHER AGREE NOR DISAGREE • DISAGREE SOMEWHAT • DISAGREE STRONGLY
4. How do you feel about this statement: “The newscaster is not critical of doctors who perform abortions.”
• AGREE STRONGLY • AGREE SOMEWHAT • NEITHER AGREE NOR DISAGREE • DISAGREE SOMEWHAT • DISAGREE STRONGLY
5. How do you feel about this statement: “The newscaster supports equal rights for women.”
• AGREE STRONGLY • AGREE SOMEWHAT • NEITHER AGREE NOR DISAGREE • DISAGREE SOMEWHAT • DISAGREE STRONGLY
6. How do you feel about this statement: “The newscaster reports fairly on the pro-choice movement.”
• AGREE STRONGLY • AGREE SOMEWHAT • NEITHER AGREE NOR DISAGREE • DISAGREE SOMEWHAT • DISAGREE STRONGLY
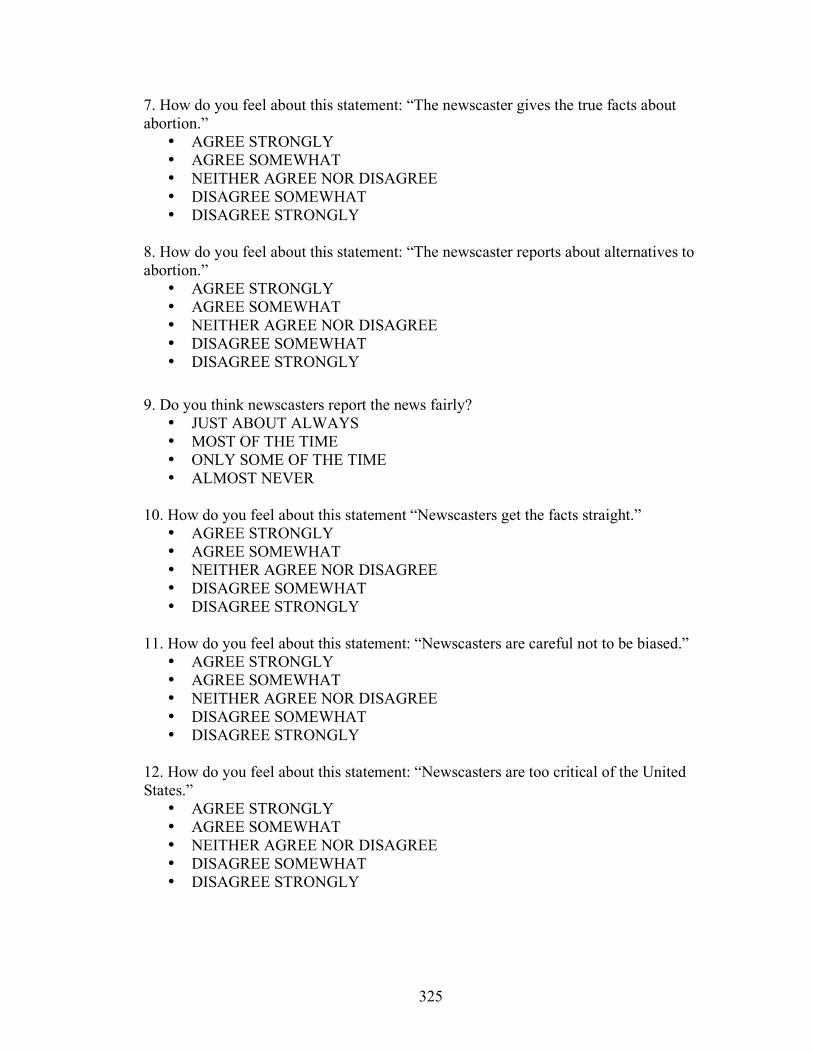
325
7. How do you feel about this statement: “The newscaster gives the true facts about abortion.”
• AGREE STRONGLY • AGREE SOMEWHAT • NEITHER AGREE NOR DISAGREE • DISAGREE SOMEWHAT • DISAGREE STRONGLY
8. How do you feel about this statement: “The newscaster reports about alternatives to abortion.”
• AGREE STRONGLY • AGREE SOMEWHAT • NEITHER AGREE NOR DISAGREE • DISAGREE SOMEWHAT • DISAGREE STRONGLY
9. Do you think newscasters report the news fairly?
• JUST ABOUT ALWAYS • MOST OF THE TIME • ONLY SOME OF THE TIME • ALMOST NEVER
10. How do you feel about this statement “Newscasters get the facts straight.”
• AGREE STRONGLY • AGREE SOMEWHAT • NEITHER AGREE NOR DISAGREE • DISAGREE SOMEWHAT • DISAGREE STRONGLY
11. How do you feel about this statement: “Newscasters are careful not to be biased.”
• AGREE STRONGLY • AGREE SOMEWHAT • NEITHER AGREE NOR DISAGREE • DISAGREE SOMEWHAT • DISAGREE STRONGLY
12. How do you feel about this statement: “Newscasters are too critical of the United States.”
• AGREE STRONGLY • AGREE SOMEWHAT • NEITHER AGREE NOR DISAGREE • DISAGREE SOMEWHAT • DISAGREE STRONGLY

326
13. How do you feel about this statement: “Newscasters provide criticism that keeps political leaders from doing their jobs.”
• AGREE STRONGLY • AGREE SOMEWHAT • NEITHER AGREE NOR DISAGREE • DISAGREE SOMEWHAT • DISAGREE STRONGLY
14. How do you feel about this statement: “Newscasters provide criticism that keeps the military prepared.”
• AGREE STRONGLY • AGREE SOMEWHAT • NEITHER AGREE NOR DISAGREE • DISAGREE SOMEWHAT • DISAGREE STRONGLY
15. How do you feel about this statement: “Newscasters protect democracy.”
• AGREE STRONGLY • AGREE SOMEWHAT • NEITHER AGREE NOR DISAGREE • DISAGREE SOMEWHAT • DISAGREE STRONGLY
16. How do you feel about this statement: “Newscasters are unpatriotic.”
• AGREE STRONGLY • AGREE SOMEWHAT • NEITHER AGREE NOR DISAGREE • DISAGREE SOMEWHAT • DISAGREE STRONGLY
17. How do you feel about this statement: “Newscasters are too sympathetic to victims.”
• AGREE STRONGLY • AGREE SOMEWHAT • NEITHER AGREE NOR DISAGREE • DISAGREE SOMEWHAT • DISAGREE STRONGLY
18. How do you feel about this statement: “Newscasters provide criticism that keeps legislators responsive to their constituencies.”
• AGREE STRONGLY • AGREE SOMEWHAT • NEITHER AGREE NOR DISAGREE • DISAGREE SOMEWHAT • DISAGREE STRONGLY

327
19. How do you feel about this statement: “Newscasters are supportive of the gay lifestyle.”
• AGREE STRONGLY • AGREE SOMEWHAT • NEITHER AGREE NOR DISAGREE • DISAGREE SOMEWHAT • DISAGREE STRONGLY
20. How do you feel about this statement: “Newscasters support traditional marriage and family values.”
• AGREE STRONGLY • AGREE SOMEWHAT • NEITHER AGREE NOR DISAGREE • DISAGREE SOMEWHAT • DISAGREE STRONGLY
21. How do you feel about this statement: “Newscasters have overblown the gay marriage debate.”
• AGREE STRONGLY • AGREE SOMEWHAT • NEITHER AGREE NOR DISAGREE • DISAGREE SOMEWHAT • DISAGREE STRONGLY
22. How do you feel about this statement: “Newscasters are not critical of doctors who perform abortions.”
• AGREE STRONGLY • AGREE SOMEWHAT • NEITHER AGREE NOR DISAGREE • DISAGREE SOMEWHAT • DISAGREE STRONGLY
23. How do you feel about this statement: “Newscasters support equal rights for women.”
• AGREE STRONGLY • AGREE SOMEWHAT • NEITHER AGREE NOR DISAGREE • DISAGREE SOMEWHAT • DISAGREE STRONGLY
24. How do you feel about this statement: “Newscasters report fairly on the pro-choice movement.”
• AGREE STRONGLY • AGREE SOMEWHAT • NEITHER AGREE NOR DISAGREE • DISAGREE SOMEWHAT • DISAGREE STRONGLY
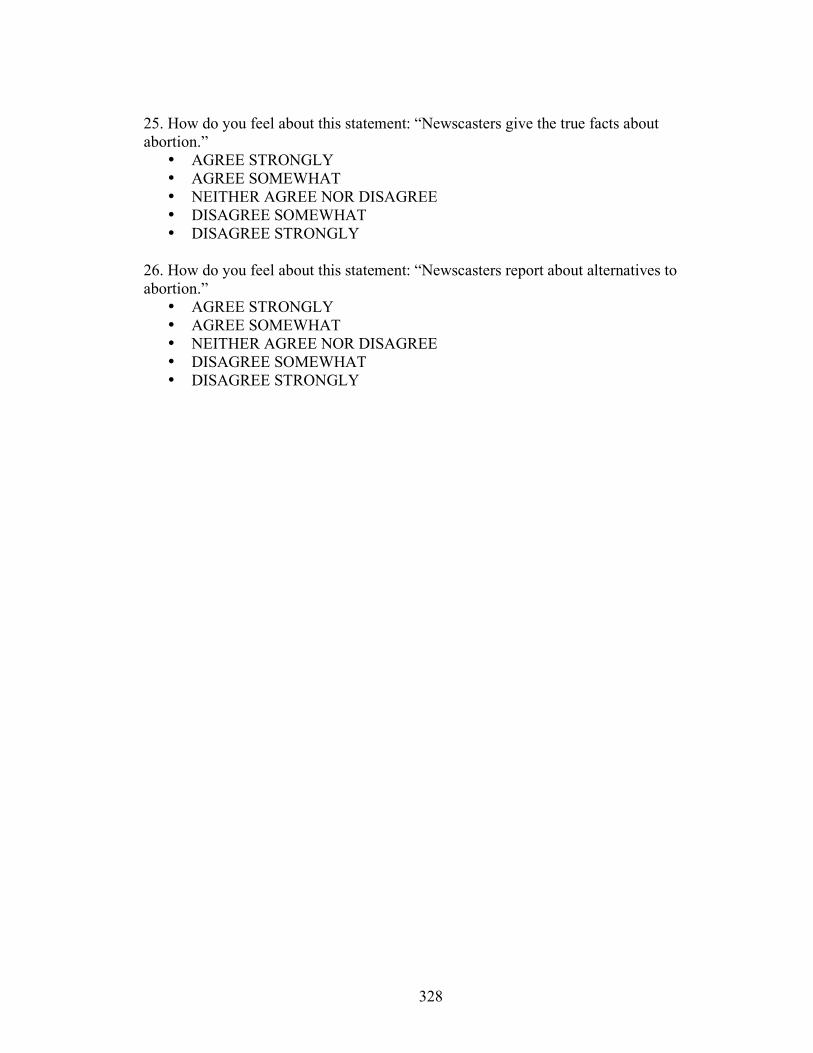
328
25. How do you feel about this statement: “Newscasters give the true facts about abortion.”
• AGREE STRONGLY • AGREE SOMEWHAT • NEITHER AGREE NOR DISAGREE • DISAGREE SOMEWHAT • DISAGREE STRONGLY
26. How do you feel about this statement: “Newscasters report about alternatives to abortion.”
• AGREE STRONGLY • AGREE SOMEWHAT • NEITHER AGREE NOR DISAGREE • DISAGREE SOMEWHAT • DISAGREE STRONGLY
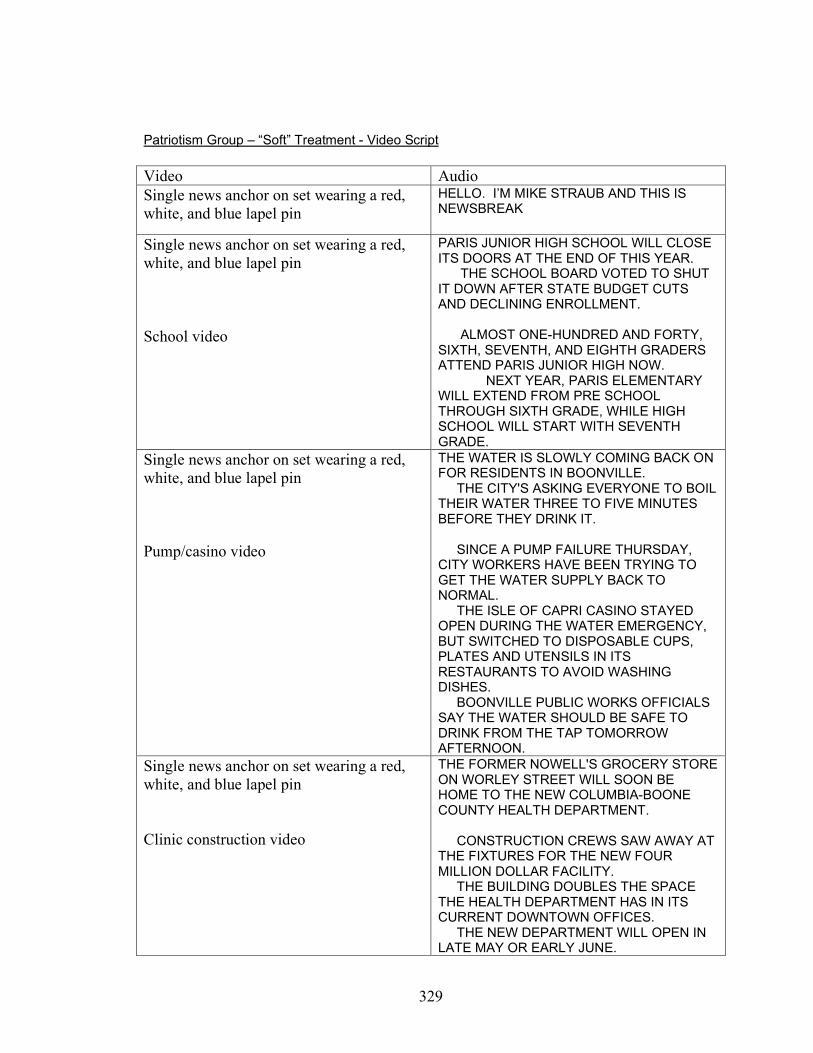
329
Patriotism Group – “Soft” Treatment - Video Script Video Audio Single news anchor on set wearing a red, white, and blue lapel pin
HELLO. I’M MIKE STRAUB AND THIS IS NEWSBREAK
Single news anchor on set wearing a red, white, and blue lapel pin School video
PARIS JUNIOR HIGH SCHOOL WILL CLOSE ITS DOORS AT THE END OF THIS YEAR. THE SCHOOL BOARD VOTED TO SHUT IT DOWN AFTER STATE BUDGET CUTS AND DECLINING ENROLLMENT. ALMOST ONE-HUNDRED AND FORTY, SIXTH, SEVENTH, AND EIGHTH GRADERS ATTEND PARIS JUNIOR HIGH NOW. NEXT YEAR, PARIS ELEMENTARY WILL EXTEND FROM PRE SCHOOL THROUGH SIXTH GRADE, WHILE HIGH SCHOOL WILL START WITH SEVENTH GRADE.
Single news anchor on set wearing a red, white, and blue lapel pin Pump/casino video
THE WATER IS SLOWLY COMING BACK ON FOR RESIDENTS IN BOONVILLE. THE CITY'S ASKING EVERYONE TO BOIL THEIR WATER THREE TO FIVE MINUTES BEFORE THEY DRINK IT. SINCE A PUMP FAILURE THURSDAY, CITY WORKERS HAVE BEEN TRYING TO GET THE WATER SUPPLY BACK TO NORMAL. THE ISLE OF CAPRI CASINO STAYED OPEN DURING THE WATER EMERGENCY, BUT SWITCHED TO DISPOSABLE CUPS, PLATES AND UTENSILS IN ITS RESTAURANTS TO AVOID WASHING DISHES. BOONVILLE PUBLIC WORKS OFFICIALS SAY THE WATER SHOULD BE SAFE TO DRINK FROM THE TAP TOMORROW AFTERNOON.
Single news anchor on set wearing a red, white, and blue lapel pin Clinic construction video
THE FORMER NOWELL'S GROCERY STORE ON WORLEY STREET WILL SOON BE HOME TO THE NEW COLUMBIA-BOONE COUNTY HEALTH DEPARTMENT. CONSTRUCTION CREWS SAW AWAY AT THE FIXTURES FOR THE NEW FOUR MILLION DOLLAR FACILITY. THE BUILDING DOUBLES THE SPACE THE HEALTH DEPARTMENT HAS IN ITS CURRENT DOWNTOWN OFFICES. THE NEW DEPARTMENT WILL OPEN IN LATE MAY OR EARLY JUNE.
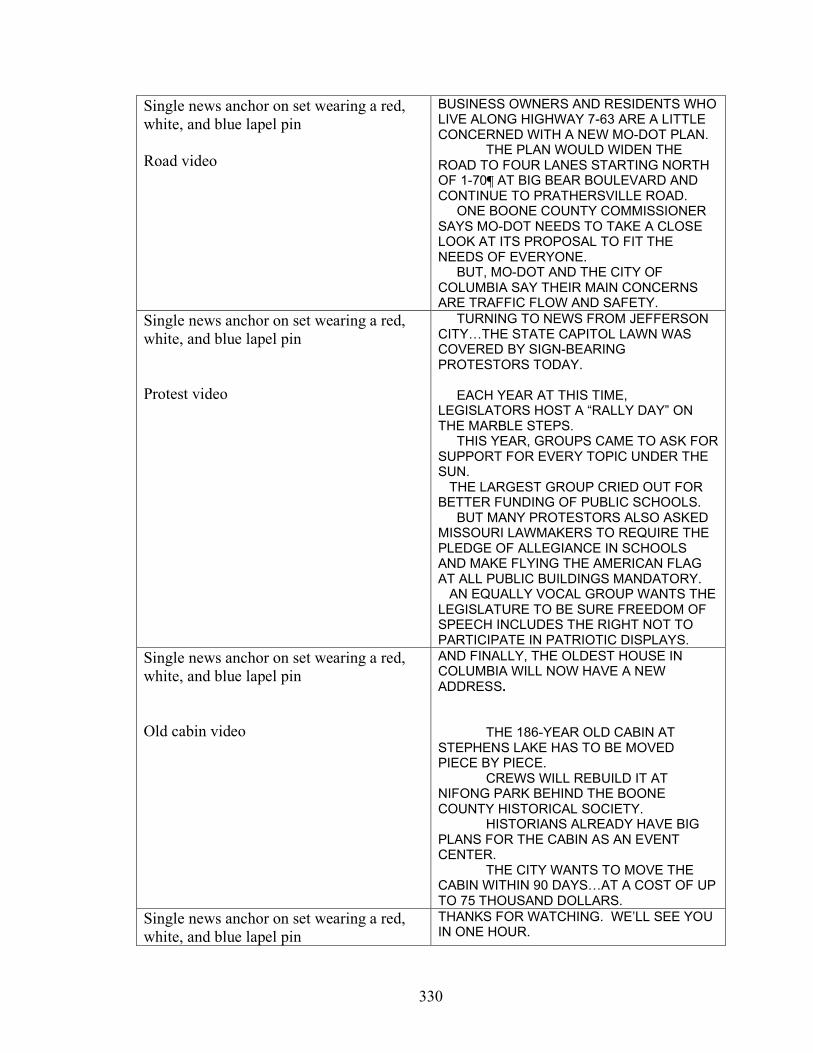
330
Single news anchor on set wearing a red, white, and blue lapel pin Road video
BUSINESS OWNERS AND RESIDENTS WHO LIVE ALONG HIGHWAY 7-63 ARE A LITTLE CONCERNED WITH A NEW MO-DOT PLAN. THE PLAN WOULD WIDEN THE ROAD TO FOUR LANES STARTING NORTH OF 1-70¶ AT BIG BEAR BOULEVARD AND CONTINUE TO PRATHERSVILLE ROAD. ONE BOONE COUNTY COMMISSIONER SAYS MO-DOT NEEDS TO TAKE A CLOSE LOOK AT ITS PROPOSAL TO FIT THE NEEDS OF EVERYONE. BUT, MO-DOT AND THE CITY OF COLUMBIA SAY THEIR MAIN CONCERNS ARE TRAFFIC FLOW AND SAFETY.
Single news anchor on set wearing a red, white, and blue lapel pin Protest video
TURNING TO NEWS FROM JEFFERSON CITY…THE STATE CAPITOL LAWN WAS COVERED BY SIGN-BEARING PROTESTORS TODAY. EACH YEAR AT THIS TIME, LEGISLATORS HOST A “RALLY DAY” ON THE MARBLE STEPS. THIS YEAR, GROUPS CAME TO ASK FOR SUPPORT FOR EVERY TOPIC UNDER THE SUN. THE LARGEST GROUP CRIED OUT FOR BETTER FUNDING OF PUBLIC SCHOOLS. BUT MANY PROTESTORS ALSO ASKED MISSOURI LAWMAKERS TO REQUIRE THE PLEDGE OF ALLEGIANCE IN SCHOOLS AND MAKE FLYING THE AMERICAN FLAG AT ALL PUBLIC BUILDINGS MANDATORY. AN EQUALLY VOCAL GROUP WANTS THE LEGISLATURE TO BE SURE FREEDOM OF SPEECH INCLUDES THE RIGHT NOT TO PARTICIPATE IN PATRIOTIC DISPLAYS.
Single news anchor on set wearing a red, white, and blue lapel pin Old cabin video
AND FINALLY, THE OLDEST HOUSE IN COLUMBIA WILL NOW HAVE A NEW ADDRESS. THE 186-YEAR OLD CABIN AT STEPHENS LAKE HAS TO BE MOVED PIECE BY PIECE. CREWS WILL REBUILD IT AT NIFONG PARK BEHIND THE BOONE COUNTY HISTORICAL SOCIETY. HISTORIANS ALREADY HAVE BIG PLANS FOR THE CABIN AS AN EVENT CENTER. THE CITY WANTS TO MOVE THE CABIN WITHIN 90 DAYS…AT A COST OF UP TO 75 THOUSAND DOLLARS.
Single news anchor on set wearing a red, white, and blue lapel pin
THANKS FOR WATCHING. WE’LL SEE YOU IN ONE HOUR.
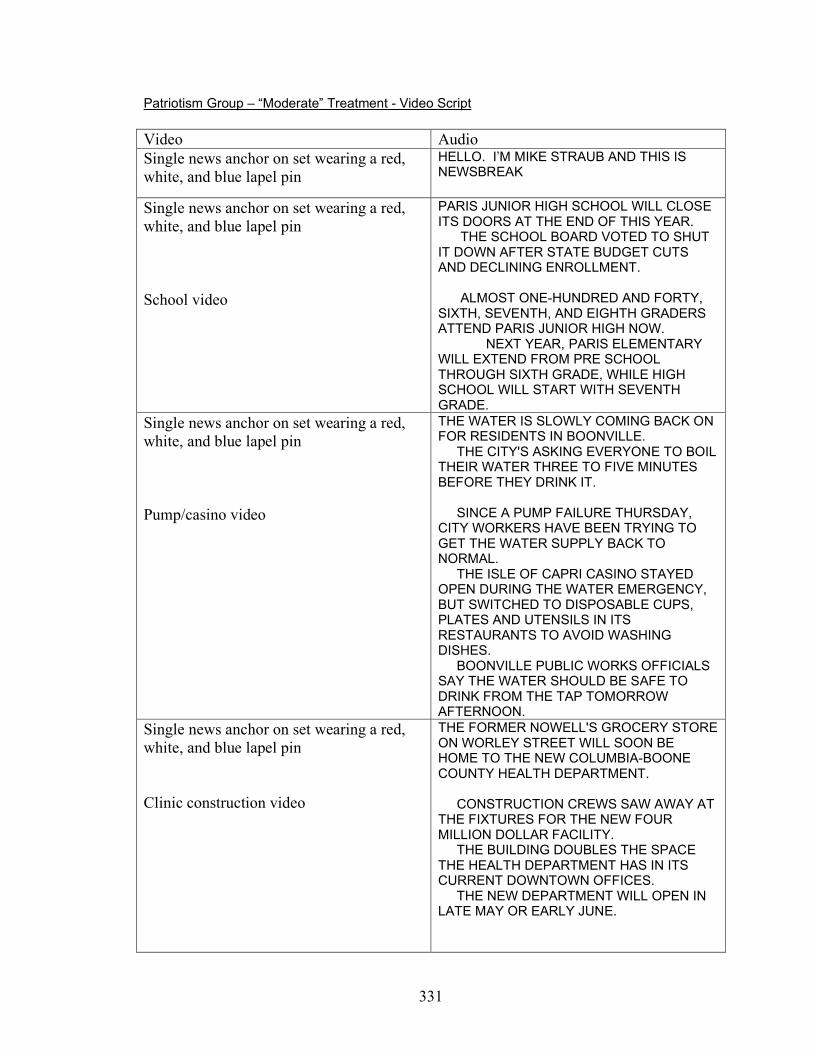
331
Patriotism Group – “Moderate” Treatment - Video Script Video Audio Single news anchor on set wearing a red, white, and blue lapel pin
HELLO. I’M MIKE STRAUB AND THIS IS NEWSBREAK
Single news anchor on set wearing a red, white, and blue lapel pin School video
PARIS JUNIOR HIGH SCHOOL WILL CLOSE ITS DOORS AT THE END OF THIS YEAR. THE SCHOOL BOARD VOTED TO SHUT IT DOWN AFTER STATE BUDGET CUTS AND DECLINING ENROLLMENT. ALMOST ONE-HUNDRED AND FORTY, SIXTH, SEVENTH, AND EIGHTH GRADERS ATTEND PARIS JUNIOR HIGH NOW. NEXT YEAR, PARIS ELEMENTARY WILL EXTEND FROM PRE SCHOOL THROUGH SIXTH GRADE, WHILE HIGH SCHOOL WILL START WITH SEVENTH GRADE.
Single news anchor on set wearing a red, white, and blue lapel pin Pump/casino video
THE WATER IS SLOWLY COMING BACK ON FOR RESIDENTS IN BOONVILLE. THE CITY'S ASKING EVERYONE TO BOIL THEIR WATER THREE TO FIVE MINUTES BEFORE THEY DRINK IT. SINCE A PUMP FAILURE THURSDAY, CITY WORKERS HAVE BEEN TRYING TO GET THE WATER SUPPLY BACK TO NORMAL. THE ISLE OF CAPRI CASINO STAYED OPEN DURING THE WATER EMERGENCY, BUT SWITCHED TO DISPOSABLE CUPS, PLATES AND UTENSILS IN ITS RESTAURANTS TO AVOID WASHING DISHES. BOONVILLE PUBLIC WORKS OFFICIALS SAY THE WATER SHOULD BE SAFE TO DRINK FROM THE TAP TOMORROW AFTERNOON.
Single news anchor on set wearing a red, white, and blue lapel pin Clinic construction video
THE FORMER NOWELL'S GROCERY STORE ON WORLEY STREET WILL SOON BE HOME TO THE NEW COLUMBIA-BOONE COUNTY HEALTH DEPARTMENT. CONSTRUCTION CREWS SAW AWAY AT THE FIXTURES FOR THE NEW FOUR MILLION DOLLAR FACILITY. THE BUILDING DOUBLES THE SPACE THE HEALTH DEPARTMENT HAS IN ITS CURRENT DOWNTOWN OFFICES. THE NEW DEPARTMENT WILL OPEN IN LATE MAY OR EARLY JUNE.
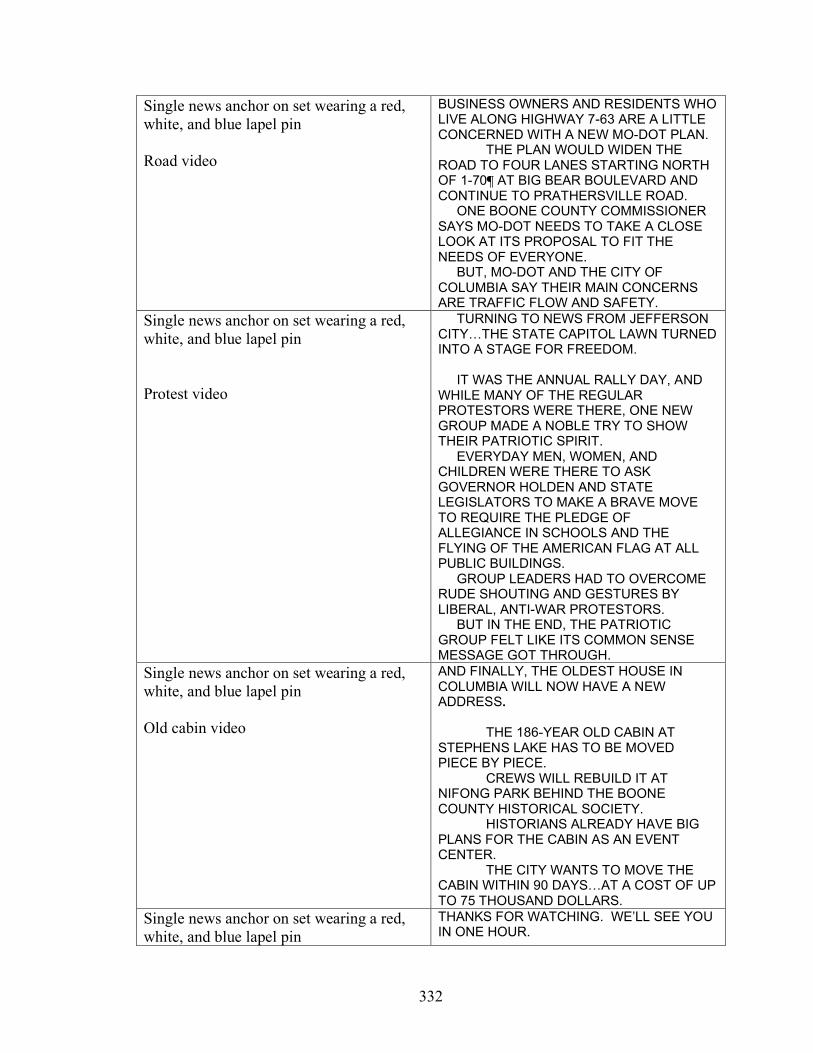
332
Single news anchor on set wearing a red, white, and blue lapel pin Road video
BUSINESS OWNERS AND RESIDENTS WHO LIVE ALONG HIGHWAY 7-63 ARE A LITTLE CONCERNED WITH A NEW MO-DOT PLAN. THE PLAN WOULD WIDEN THE ROAD TO FOUR LANES STARTING NORTH OF 1-70¶ AT BIG BEAR BOULEVARD AND CONTINUE TO PRATHERSVILLE ROAD. ONE BOONE COUNTY COMMISSIONER SAYS MO-DOT NEEDS TO TAKE A CLOSE LOOK AT ITS PROPOSAL TO FIT THE NEEDS OF EVERYONE. BUT, MO-DOT AND THE CITY OF COLUMBIA SAY THEIR MAIN CONCERNS ARE TRAFFIC FLOW AND SAFETY.
Single news anchor on set wearing a red, white, and blue lapel pin Protest video
TURNING TO NEWS FROM JEFFERSON CITY…THE STATE CAPITOL LAWN TURNED INTO A STAGE FOR FREEDOM. IT WAS THE ANNUAL RALLY DAY, AND WHILE MANY OF THE REGULAR PROTESTORS WERE THERE, ONE NEW GROUP MADE A NOBLE TRY TO SHOW THEIR PATRIOTIC SPIRIT. EVERYDAY MEN, WOMEN, AND CHILDREN WERE THERE TO ASK GOVERNOR HOLDEN AND STATE LEGISLATORS TO MAKE A BRAVE MOVE TO REQUIRE THE PLEDGE OF ALLEGIANCE IN SCHOOLS AND THE FLYING OF THE AMERICAN FLAG AT ALL PUBLIC BUILDINGS. GROUP LEADERS HAD TO OVERCOME RUDE SHOUTING AND GESTURES BY LIBERAL, ANTI-WAR PROTESTORS. BUT IN THE END, THE PATRIOTIC GROUP FELT LIKE ITS COMMON SENSE MESSAGE GOT THROUGH.
Single news anchor on set wearing a red, white, and blue lapel pin Old cabin video
AND FINALLY, THE OLDEST HOUSE IN COLUMBIA WILL NOW HAVE A NEW ADDRESS. THE 186-YEAR OLD CABIN AT STEPHENS LAKE HAS TO BE MOVED PIECE BY PIECE. CREWS WILL REBUILD IT AT NIFONG PARK BEHIND THE BOONE COUNTY HISTORICAL SOCIETY. HISTORIANS ALREADY HAVE BIG PLANS FOR THE CABIN AS AN EVENT CENTER. THE CITY WANTS TO MOVE THE CABIN WITHIN 90 DAYS…AT A COST OF UP TO 75 THOUSAND DOLLARS.
Single news anchor on set wearing a red, white, and blue lapel pin
THANKS FOR WATCHING. WE’LL SEE YOU IN ONE HOUR.
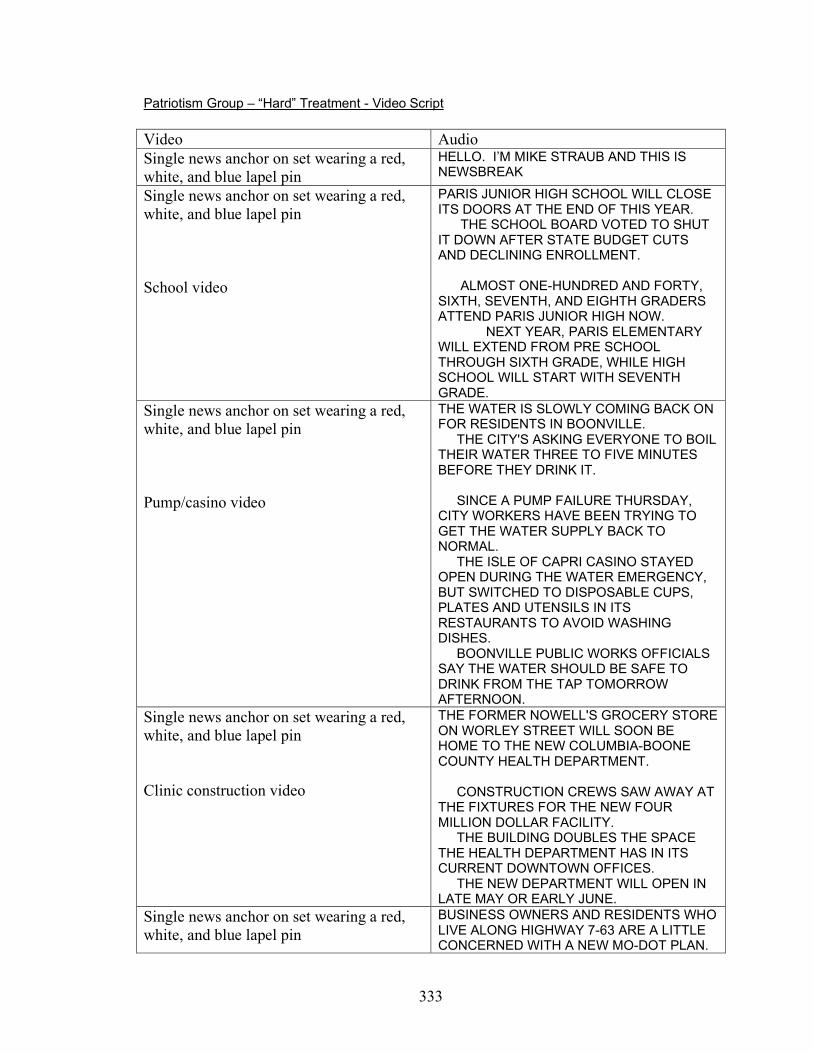
333
Patriotism Group – “Hard” Treatment - Video Script Video Audio Single news anchor on set wearing a red, white, and blue lapel pin
HELLO. I’M MIKE STRAUB AND THIS IS NEWSBREAK
Single news anchor on set wearing a red, white, and blue lapel pin School video
PARIS JUNIOR HIGH SCHOOL WILL CLOSE ITS DOORS AT THE END OF THIS YEAR. THE SCHOOL BOARD VOTED TO SHUT IT DOWN AFTER STATE BUDGET CUTS AND DECLINING ENROLLMENT. ALMOST ONE-HUNDRED AND FORTY, SIXTH, SEVENTH, AND EIGHTH GRADERS ATTEND PARIS JUNIOR HIGH NOW. NEXT YEAR, PARIS ELEMENTARY WILL EXTEND FROM PRE SCHOOL THROUGH SIXTH GRADE, WHILE HIGH SCHOOL WILL START WITH SEVENTH GRADE.
Single news anchor on set wearing a red, white, and blue lapel pin Pump/casino video
THE WATER IS SLOWLY COMING BACK ON FOR RESIDENTS IN BOONVILLE. THE CITY'S ASKING EVERYONE TO BOIL THEIR WATER THREE TO FIVE MINUTES BEFORE THEY DRINK IT. SINCE A PUMP FAILURE THURSDAY, CITY WORKERS HAVE BEEN TRYING TO GET THE WATER SUPPLY BACK TO NORMAL. THE ISLE OF CAPRI CASINO STAYED OPEN DURING THE WATER EMERGENCY, BUT SWITCHED TO DISPOSABLE CUPS, PLATES AND UTENSILS IN ITS RESTAURANTS TO AVOID WASHING DISHES. BOONVILLE PUBLIC WORKS OFFICIALS SAY THE WATER SHOULD BE SAFE TO DRINK FROM THE TAP TOMORROW AFTERNOON.
Single news anchor on set wearing a red, white, and blue lapel pin Clinic construction video
THE FORMER NOWELL'S GROCERY STORE ON WORLEY STREET WILL SOON BE HOME TO THE NEW COLUMBIA-BOONE COUNTY HEALTH DEPARTMENT. CONSTRUCTION CREWS SAW AWAY AT THE FIXTURES FOR THE NEW FOUR MILLION DOLLAR FACILITY. THE BUILDING DOUBLES THE SPACE THE HEALTH DEPARTMENT HAS IN ITS CURRENT DOWNTOWN OFFICES. THE NEW DEPARTMENT WILL OPEN IN LATE MAY OR EARLY JUNE.
Single news anchor on set wearing a red, white, and blue lapel pin
BUSINESS OWNERS AND RESIDENTS WHO LIVE ALONG HIGHWAY 7-63 ARE A LITTLE CONCERNED WITH A NEW MO-DOT PLAN.
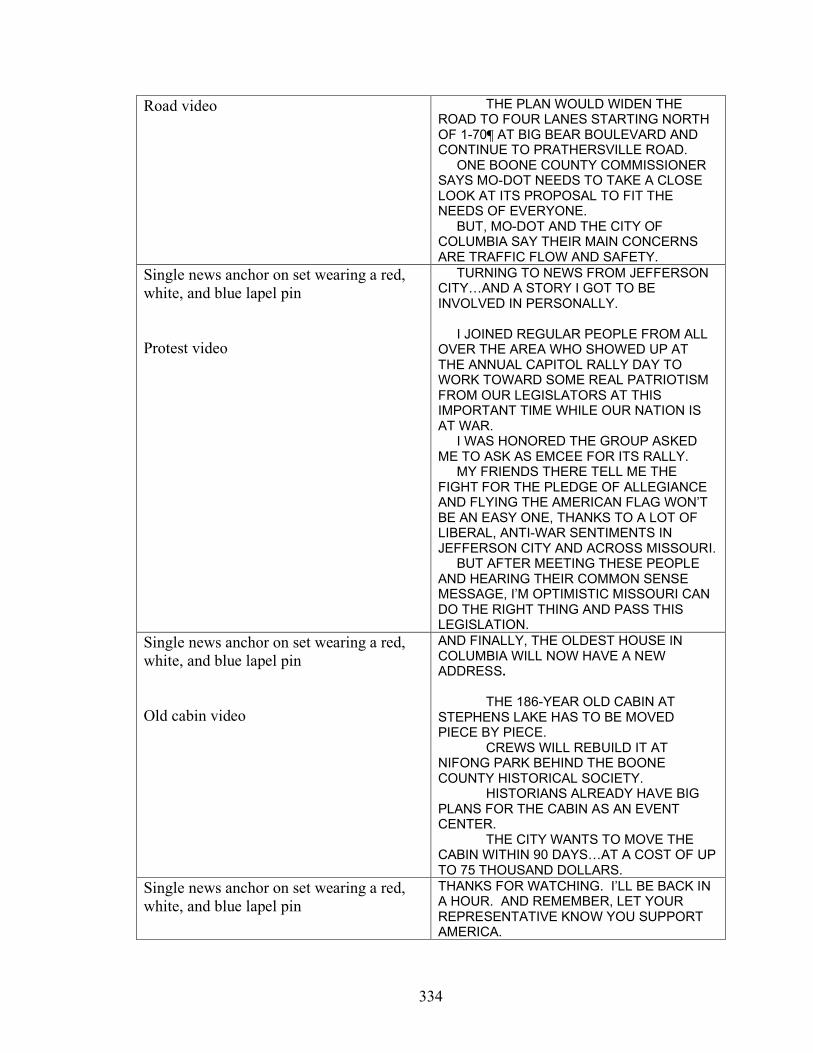
334
Road video THE PLAN WOULD WIDEN THE ROAD TO FOUR LANES STARTING NORTH OF 1-70¶ AT BIG BEAR BOULEVARD AND CONTINUE TO PRATHERSVILLE ROAD. ONE BOONE COUNTY COMMISSIONER SAYS MO-DOT NEEDS TO TAKE A CLOSE LOOK AT ITS PROPOSAL TO FIT THE NEEDS OF EVERYONE. BUT, MO-DOT AND THE CITY OF COLUMBIA SAY THEIR MAIN CONCERNS ARE TRAFFIC FLOW AND SAFETY.
Single news anchor on set wearing a red, white, and blue lapel pin Protest video
TURNING TO NEWS FROM JEFFERSON CITY…AND A STORY I GOT TO BE INVOLVED IN PERSONALLY. I JOINED REGULAR PEOPLE FROM ALL OVER THE AREA WHO SHOWED UP AT THE ANNUAL CAPITOL RALLY DAY TO WORK TOWARD SOME REAL PATRIOTISM FROM OUR LEGISLATORS AT THIS IMPORTANT TIME WHILE OUR NATION IS AT WAR. I WAS HONORED THE GROUP ASKED ME TO ASK AS EMCEE FOR ITS RALLY. MY FRIENDS THERE TELL ME THE FIGHT FOR THE PLEDGE OF ALLEGIANCE AND FLYING THE AMERICAN FLAG WON’T BE AN EASY ONE, THANKS TO A LOT OF LIBERAL, ANTI-WAR SENTIMENTS IN JEFFERSON CITY AND ACROSS MISSOURI. BUT AFTER MEETING THESE PEOPLE AND HEARING THEIR COMMON SENSE MESSAGE, I’M OPTIMISTIC MISSOURI CAN DO THE RIGHT THING AND PASS THIS LEGISLATION.
Single news anchor on set wearing a red, white, and blue lapel pin Old cabin video
AND FINALLY, THE OLDEST HOUSE IN COLUMBIA WILL NOW HAVE A NEW ADDRESS. THE 186-YEAR OLD CABIN AT STEPHENS LAKE HAS TO BE MOVED PIECE BY PIECE. CREWS WILL REBUILD IT AT NIFONG PARK BEHIND THE BOONE COUNTY HISTORICAL SOCIETY. HISTORIANS ALREADY HAVE BIG PLANS FOR THE CABIN AS AN EVENT CENTER. THE CITY WANTS TO MOVE THE CABIN WITHIN 90 DAYS…AT A COST OF UP TO 75 THOUSAND DOLLARS.
Single news anchor on set wearing a red, white, and blue lapel pin
THANKS FOR WATCHING. I’LL BE BACK IN A HOUR. AND REMEMBER, LET YOUR REPRESENTATIVE KNOW YOU SUPPORT AMERICA.

335
Gay Marriage Group – “Soft” Treatment - Video Script Video Audio Single news anchor on set wearing a rainbow lapel pin
HELLO. I’M MIKE STRAUB AND THIS IS NEWSBREAK
Single news anchor on set wearing a rainbow lapel pin School video
PARIS JUNIOR HIGH SCHOOL WILL CLOSE ITS DOORS AT THE END OF THIS YEAR. THE SCHOOL BOARD VOTED TO SHUT IT DOWN AFTER STATE BUDGET CUTS AND DECLINING ENROLLMENT. ALMOST ONE-HUNDRED AND FORTY, SIXTH, SEVENTH, AND EIGHTH GRADERS ATTEND PARIS JUNIOR HIGH NOW. NEXT YEAR, PARIS ELEMENTARY WILL EXTEND FROM PRE SCHOOL THROUGH SIXTH GRADE, WHILE HIGH SCHOOL WILL START WITH SEVENTH GRADE.
Single news anchor on set wearing a rainbow lapel pin Pump/casino video
THE WATER IS SLOWLY COMING BACK ON FOR RESIDENTS IN BOONVILLE. THE CITY'S ASKING EVERYONE TO BOIL THEIR WATER THREE TO FIVE MINUTES BEFORE THEY DRINK IT. SINCE A PUMP FAILURE THURSDAY, CITY WORKERS HAVE BEEN TRYING TO GET THE WATER SUPPLY BACK TO NORMAL. THE ISLE OF CAPRI CASINO STAYED OPEN DURING THE WATER EMERGENCY, BUT SWITCHED TO DISPOSABLE CUPS, PLATES AND UTENSILS IN ITS RESTAURANTS TO AVOID WASHING DISHES. BOONVILLE PUBLIC WORKS OFFICIALS SAY THE WATER SHOULD BE SAFE TO DRINK FROM THE TAP TOMORROW AFTERNOON.
Single news anchor on set wearing a rainbow lapel pin Clinic construction video
THE FORMER NOWELL'S GROCERY STORE ON WORLEY STREET WILL SOON BE HOME TO THE NEW COLUMBIA-BOONE COUNTY HEALTH DEPARTMENT. CONSTRUCTION CREWS SAW AWAY AT THE FIXTURES FOR THE NEW FOUR MILLION DOLLAR FACILITY. THE BUILDING DOUBLES THE SPACE THE HEALTH DEPARTMENT HAS IN ITS CURRENT DOWNTOWN OFFICES. THE NEW DEPARTMENT WILL OPEN IN LATE MAY OR EARLY JUNE.
Single news anchor on set wearing a rainbow lapel pin
BUSINESS OWNERS AND RESIDENTS WHO LIVE ALONG HIGHWAY 7-63 ARE A LITTLE CONCERNED WITH A NEW MO-DOT PLAN.
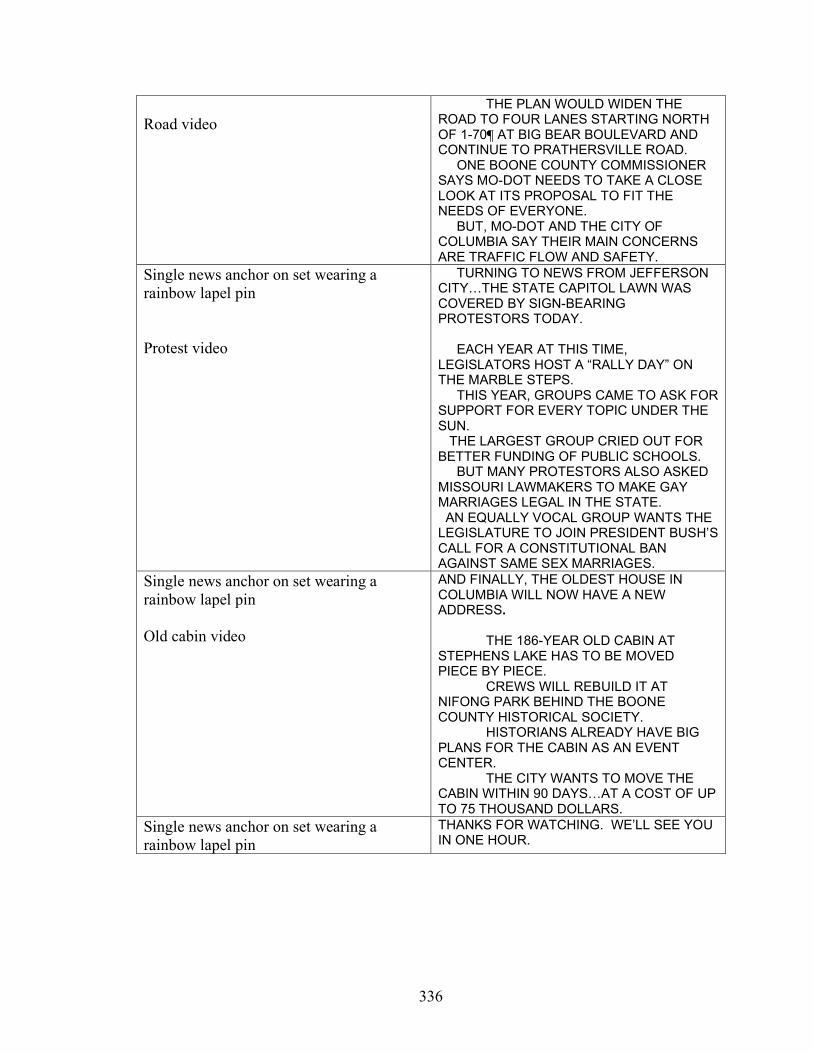
336
Road video
THE PLAN WOULD WIDEN THE ROAD TO FOUR LANES STARTING NORTH OF 1-70¶ AT BIG BEAR BOULEVARD AND CONTINUE TO PRATHERSVILLE ROAD. ONE BOONE COUNTY COMMISSIONER SAYS MO-DOT NEEDS TO TAKE A CLOSE LOOK AT ITS PROPOSAL TO FIT THE NEEDS OF EVERYONE. BUT, MO-DOT AND THE CITY OF COLUMBIA SAY THEIR MAIN CONCERNS ARE TRAFFIC FLOW AND SAFETY.
Single news anchor on set wearing a rainbow lapel pin Protest video
TURNING TO NEWS FROM JEFFERSON CITY…THE STATE CAPITOL LAWN WAS COVERED BY SIGN-BEARING PROTESTORS TODAY. EACH YEAR AT THIS TIME, LEGISLATORS HOST A “RALLY DAY” ON THE MARBLE STEPS. THIS YEAR, GROUPS CAME TO ASK FOR SUPPORT FOR EVERY TOPIC UNDER THE SUN. THE LARGEST GROUP CRIED OUT FOR BETTER FUNDING OF PUBLIC SCHOOLS. BUT MANY PROTESTORS ALSO ASKED MISSOURI LAWMAKERS TO MAKE GAY MARRIAGES LEGAL IN THE STATE. AN EQUALLY VOCAL GROUP WANTS THE LEGISLATURE TO JOIN PRESIDENT BUSH’S CALL FOR A CONSTITUTIONAL BAN AGAINST SAME SEX MARRIAGES.
Single news anchor on set wearing a rainbow lapel pin Old cabin video
AND FINALLY, THE OLDEST HOUSE IN COLUMBIA WILL NOW HAVE A NEW ADDRESS. THE 186-YEAR OLD CABIN AT STEPHENS LAKE HAS TO BE MOVED PIECE BY PIECE. CREWS WILL REBUILD IT AT NIFONG PARK BEHIND THE BOONE COUNTY HISTORICAL SOCIETY. HISTORIANS ALREADY HAVE BIG PLANS FOR THE CABIN AS AN EVENT CENTER. THE CITY WANTS TO MOVE THE CABIN WITHIN 90 DAYS…AT A COST OF UP TO 75 THOUSAND DOLLARS.
Single news anchor on set wearing a rainbow lapel pin
THANKS FOR WATCHING. WE’LL SEE YOU IN ONE HOUR.
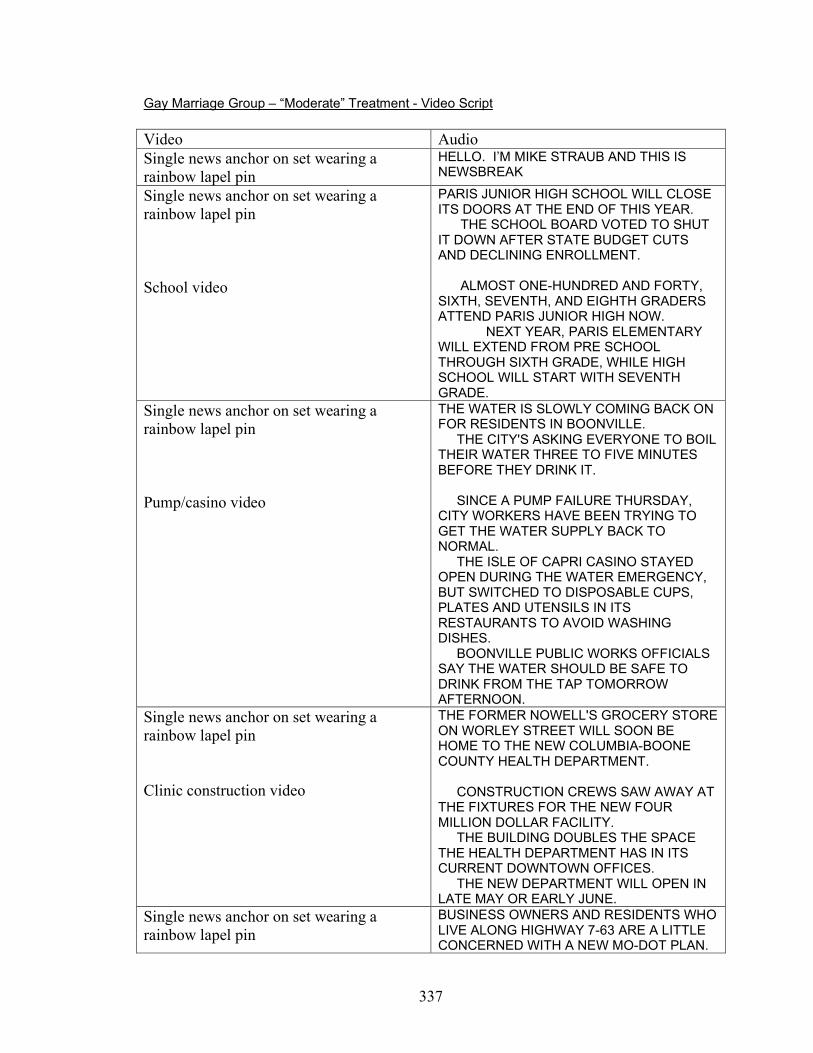
337
Gay Marriage Group – “Moderate” Treatment - Video Script Video Audio Single news anchor on set wearing a rainbow lapel pin
HELLO. I’M MIKE STRAUB AND THIS IS NEWSBREAK
Single news anchor on set wearing a rainbow lapel pin School video
PARIS JUNIOR HIGH SCHOOL WILL CLOSE ITS DOORS AT THE END OF THIS YEAR. THE SCHOOL BOARD VOTED TO SHUT IT DOWN AFTER STATE BUDGET CUTS AND DECLINING ENROLLMENT. ALMOST ONE-HUNDRED AND FORTY, SIXTH, SEVENTH, AND EIGHTH GRADERS ATTEND PARIS JUNIOR HIGH NOW. NEXT YEAR, PARIS ELEMENTARY WILL EXTEND FROM PRE SCHOOL THROUGH SIXTH GRADE, WHILE HIGH SCHOOL WILL START WITH SEVENTH GRADE.
Single news anchor on set wearing a rainbow lapel pin Pump/casino video
THE WATER IS SLOWLY COMING BACK ON FOR RESIDENTS IN BOONVILLE. THE CITY'S ASKING EVERYONE TO BOIL THEIR WATER THREE TO FIVE MINUTES BEFORE THEY DRINK IT. SINCE A PUMP FAILURE THURSDAY, CITY WORKERS HAVE BEEN TRYING TO GET THE WATER SUPPLY BACK TO NORMAL. THE ISLE OF CAPRI CASINO STAYED OPEN DURING THE WATER EMERGENCY, BUT SWITCHED TO DISPOSABLE CUPS, PLATES AND UTENSILS IN ITS RESTAURANTS TO AVOID WASHING DISHES. BOONVILLE PUBLIC WORKS OFFICIALS SAY THE WATER SHOULD BE SAFE TO DRINK FROM THE TAP TOMORROW AFTERNOON.
Single news anchor on set wearing a rainbow lapel pin Clinic construction video
THE FORMER NOWELL'S GROCERY STORE ON WORLEY STREET WILL SOON BE HOME TO THE NEW COLUMBIA-BOONE COUNTY HEALTH DEPARTMENT. CONSTRUCTION CREWS SAW AWAY AT THE FIXTURES FOR THE NEW FOUR MILLION DOLLAR FACILITY. THE BUILDING DOUBLES THE SPACE THE HEALTH DEPARTMENT HAS IN ITS CURRENT DOWNTOWN OFFICES. THE NEW DEPARTMENT WILL OPEN IN LATE MAY OR EARLY JUNE.
Single news anchor on set wearing a rainbow lapel pin
BUSINESS OWNERS AND RESIDENTS WHO LIVE ALONG HIGHWAY 7-63 ARE A LITTLE CONCERNED WITH A NEW MO-DOT PLAN.
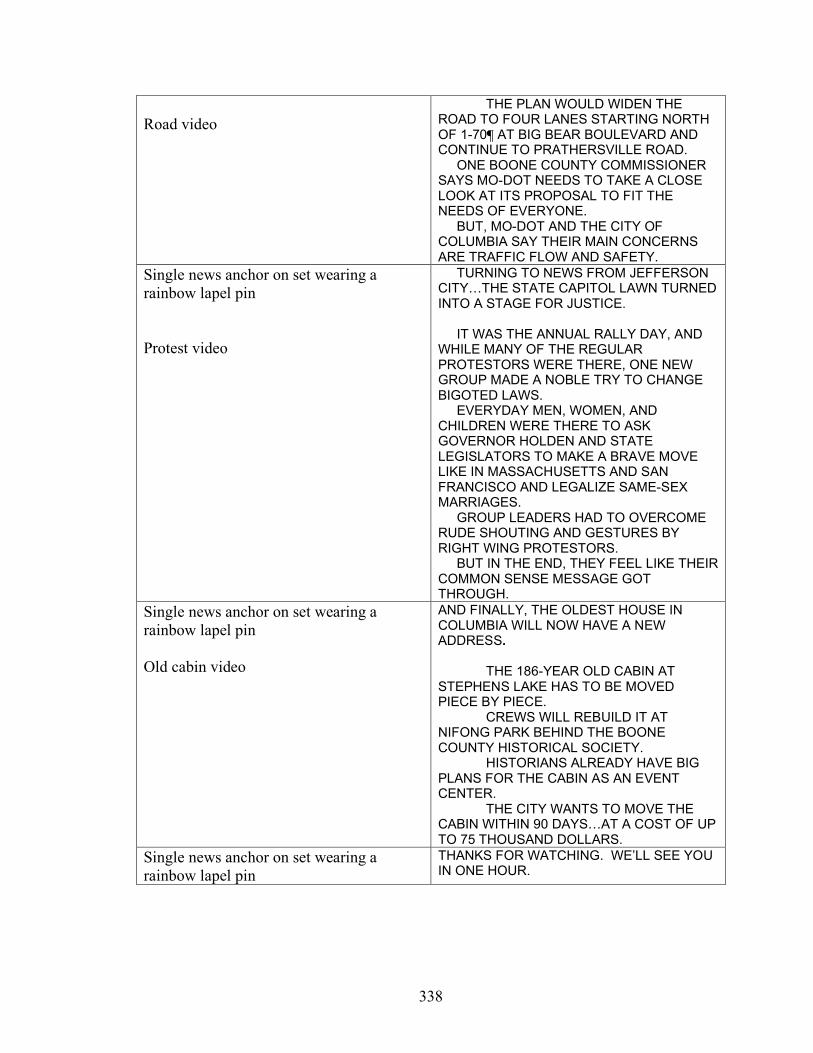
338
Road video
THE PLAN WOULD WIDEN THE ROAD TO FOUR LANES STARTING NORTH OF 1-70¶ AT BIG BEAR BOULEVARD AND CONTINUE TO PRATHERSVILLE ROAD. ONE BOONE COUNTY COMMISSIONER SAYS MO-DOT NEEDS TO TAKE A CLOSE LOOK AT ITS PROPOSAL TO FIT THE NEEDS OF EVERYONE. BUT, MO-DOT AND THE CITY OF COLUMBIA SAY THEIR MAIN CONCERNS ARE TRAFFIC FLOW AND SAFETY.
Single news anchor on set wearing a rainbow lapel pin Protest video
TURNING TO NEWS FROM JEFFERSON CITY…THE STATE CAPITOL LAWN TURNED INTO A STAGE FOR JUSTICE. IT WAS THE ANNUAL RALLY DAY, AND WHILE MANY OF THE REGULAR PROTESTORS WERE THERE, ONE NEW GROUP MADE A NOBLE TRY TO CHANGE BIGOTED LAWS. EVERYDAY MEN, WOMEN, AND CHILDREN WERE THERE TO ASK GOVERNOR HOLDEN AND STATE LEGISLATORS TO MAKE A BRAVE MOVE LIKE IN MASSACHUSETTS AND SAN FRANCISCO AND LEGALIZE SAME-SEX MARRIAGES. GROUP LEADERS HAD TO OVERCOME RUDE SHOUTING AND GESTURES BY RIGHT WING PROTESTORS. BUT IN THE END, THEY FEEL LIKE THEIR COMMON SENSE MESSAGE GOT THROUGH.
Single news anchor on set wearing a rainbow lapel pin Old cabin video
AND FINALLY, THE OLDEST HOUSE IN COLUMBIA WILL NOW HAVE A NEW ADDRESS. THE 186-YEAR OLD CABIN AT STEPHENS LAKE HAS TO BE MOVED PIECE BY PIECE. CREWS WILL REBUILD IT AT NIFONG PARK BEHIND THE BOONE COUNTY HISTORICAL SOCIETY. HISTORIANS ALREADY HAVE BIG PLANS FOR THE CABIN AS AN EVENT CENTER. THE CITY WANTS TO MOVE THE CABIN WITHIN 90 DAYS…AT A COST OF UP TO 75 THOUSAND DOLLARS.
Single news anchor on set wearing a rainbow lapel pin
THANKS FOR WATCHING. WE’LL SEE YOU IN ONE HOUR.
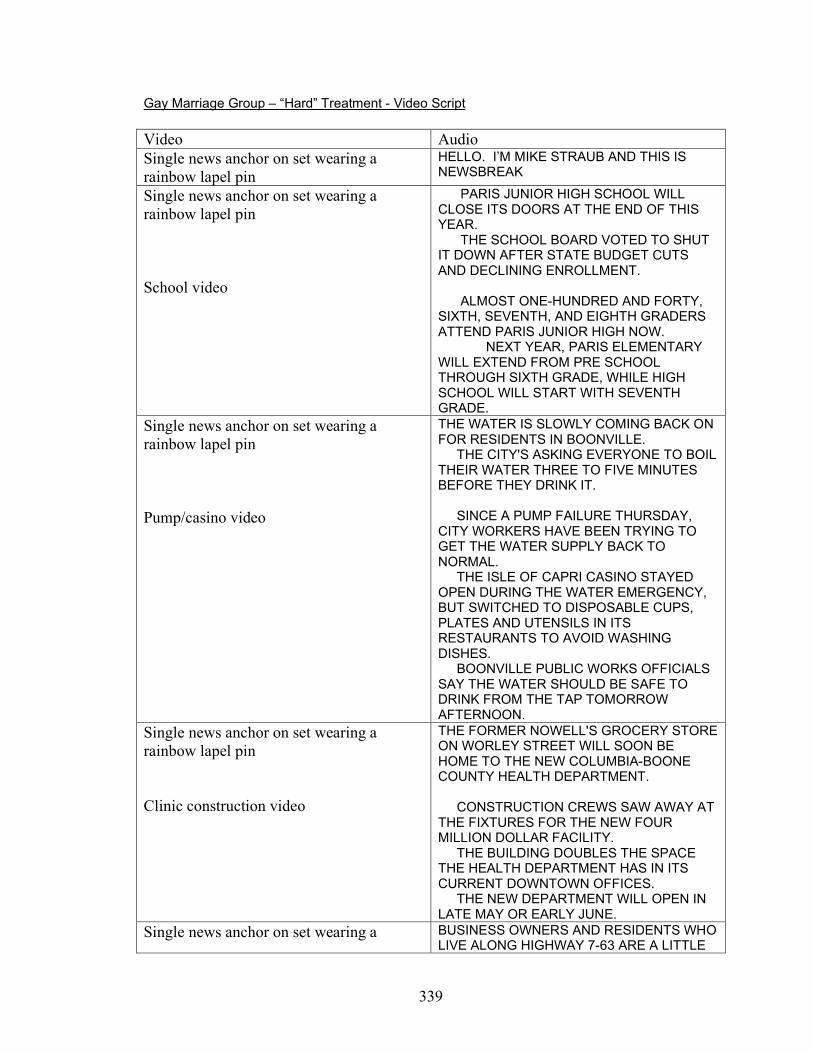
339
Gay Marriage Group – “Hard” Treatment - Video Script Video Audio Single news anchor on set wearing a rainbow lapel pin
HELLO. I’M MIKE STRAUB AND THIS IS NEWSBREAK
Single news anchor on set wearing a rainbow lapel pin School video
PARIS JUNIOR HIGH SCHOOL WILL CLOSE ITS DOORS AT THE END OF THIS YEAR. THE SCHOOL BOARD VOTED TO SHUT IT DOWN AFTER STATE BUDGET CUTS AND DECLINING ENROLLMENT. ALMOST ONE-HUNDRED AND FORTY, SIXTH, SEVENTH, AND EIGHTH GRADERS ATTEND PARIS JUNIOR HIGH NOW. NEXT YEAR, PARIS ELEMENTARY WILL EXTEND FROM PRE SCHOOL THROUGH SIXTH GRADE, WHILE HIGH SCHOOL WILL START WITH SEVENTH GRADE.
Single news anchor on set wearing a rainbow lapel pin Pump/casino video
THE WATER IS SLOWLY COMING BACK ON FOR RESIDENTS IN BOONVILLE. THE CITY'S ASKING EVERYONE TO BOIL THEIR WATER THREE TO FIVE MINUTES BEFORE THEY DRINK IT. SINCE A PUMP FAILURE THURSDAY, CITY WORKERS HAVE BEEN TRYING TO GET THE WATER SUPPLY BACK TO NORMAL. THE ISLE OF CAPRI CASINO STAYED OPEN DURING THE WATER EMERGENCY, BUT SWITCHED TO DISPOSABLE CUPS, PLATES AND UTENSILS IN ITS RESTAURANTS TO AVOID WASHING DISHES. BOONVILLE PUBLIC WORKS OFFICIALS SAY THE WATER SHOULD BE SAFE TO DRINK FROM THE TAP TOMORROW AFTERNOON.
Single news anchor on set wearing a rainbow lapel pin Clinic construction video
THE FORMER NOWELL'S GROCERY STORE ON WORLEY STREET WILL SOON BE HOME TO THE NEW COLUMBIA-BOONE COUNTY HEALTH DEPARTMENT. CONSTRUCTION CREWS SAW AWAY AT THE FIXTURES FOR THE NEW FOUR MILLION DOLLAR FACILITY. THE BUILDING DOUBLES THE SPACE THE HEALTH DEPARTMENT HAS IN ITS CURRENT DOWNTOWN OFFICES. THE NEW DEPARTMENT WILL OPEN IN LATE MAY OR EARLY JUNE.
Single news anchor on set wearing a BUSINESS OWNERS AND RESIDENTS WHO LIVE ALONG HIGHWAY 7-63 ARE A LITTLE
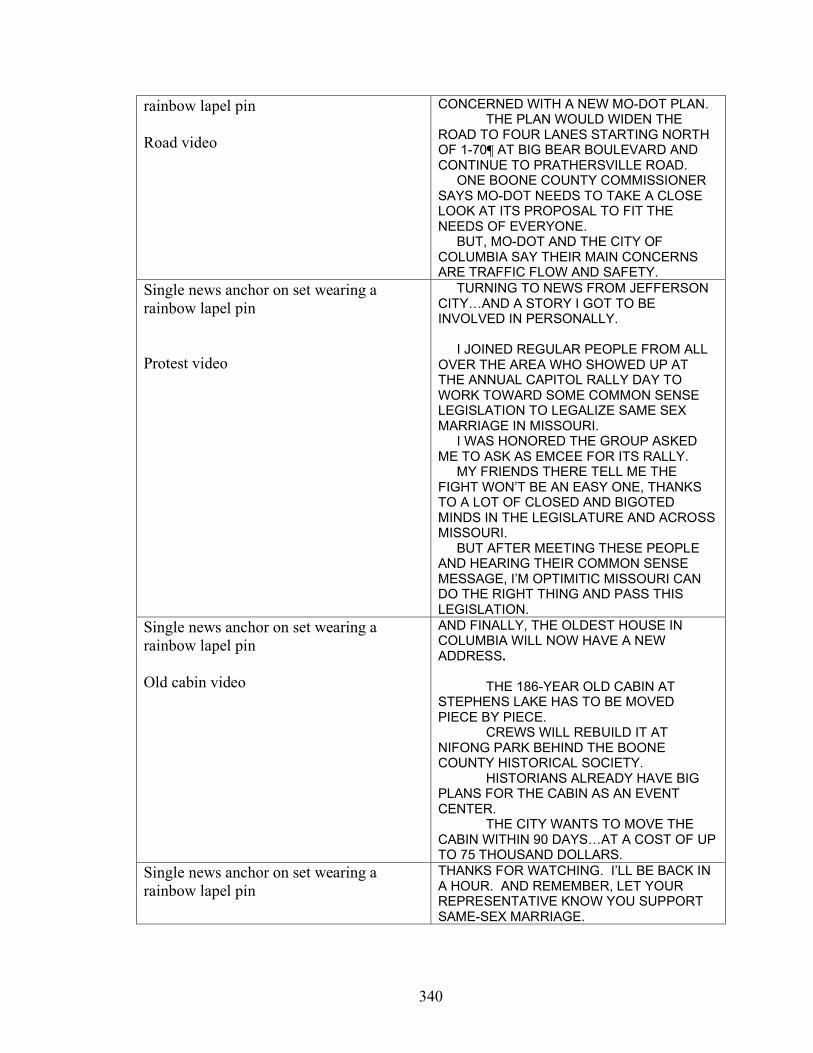
340
rainbow lapel pin Road video
CONCERNED WITH A NEW MO-DOT PLAN. THE PLAN WOULD WIDEN THE ROAD TO FOUR LANES STARTING NORTH OF 1-70¶ AT BIG BEAR BOULEVARD AND CONTINUE TO PRATHERSVILLE ROAD. ONE BOONE COUNTY COMMISSIONER SAYS MO-DOT NEEDS TO TAKE A CLOSE LOOK AT ITS PROPOSAL TO FIT THE NEEDS OF EVERYONE. BUT, MO-DOT AND THE CITY OF COLUMBIA SAY THEIR MAIN CONCERNS ARE TRAFFIC FLOW AND SAFETY.
Single news anchor on set wearing a rainbow lapel pin Protest video
TURNING TO NEWS FROM JEFFERSON CITY…AND A STORY I GOT TO BE INVOLVED IN PERSONALLY. I JOINED REGULAR PEOPLE FROM ALL OVER THE AREA WHO SHOWED UP AT THE ANNUAL CAPITOL RALLY DAY TO WORK TOWARD SOME COMMON SENSE LEGISLATION TO LEGALIZE SAME SEX MARRIAGE IN MISSOURI. I WAS HONORED THE GROUP ASKED ME TO ASK AS EMCEE FOR ITS RALLY. MY FRIENDS THERE TELL ME THE FIGHT WON’T BE AN EASY ONE, THANKS TO A LOT OF CLOSED AND BIGOTED MINDS IN THE LEGISLATURE AND ACROSS MISSOURI. BUT AFTER MEETING THESE PEOPLE AND HEARING THEIR COMMON SENSE MESSAGE, I’M OPTIMITIC MISSOURI CAN DO THE RIGHT THING AND PASS THIS LEGISLATION.
Single news anchor on set wearing a rainbow lapel pin Old cabin video
AND FINALLY, THE OLDEST HOUSE IN COLUMBIA WILL NOW HAVE A NEW ADDRESS. THE 186-YEAR OLD CABIN AT STEPHENS LAKE HAS TO BE MOVED PIECE BY PIECE. CREWS WILL REBUILD IT AT NIFONG PARK BEHIND THE BOONE COUNTY HISTORICAL SOCIETY. HISTORIANS ALREADY HAVE BIG PLANS FOR THE CABIN AS AN EVENT CENTER. THE CITY WANTS TO MOVE THE CABIN WITHIN 90 DAYS…AT A COST OF UP TO 75 THOUSAND DOLLARS.
Single news anchor on set wearing a rainbow lapel pin
THANKS FOR WATCHING. I’LL BE BACK IN A HOUR. AND REMEMBER, LET YOUR REPRESENTATIVE KNOW YOU SUPPORT SAME-SEX MARRIAGE.
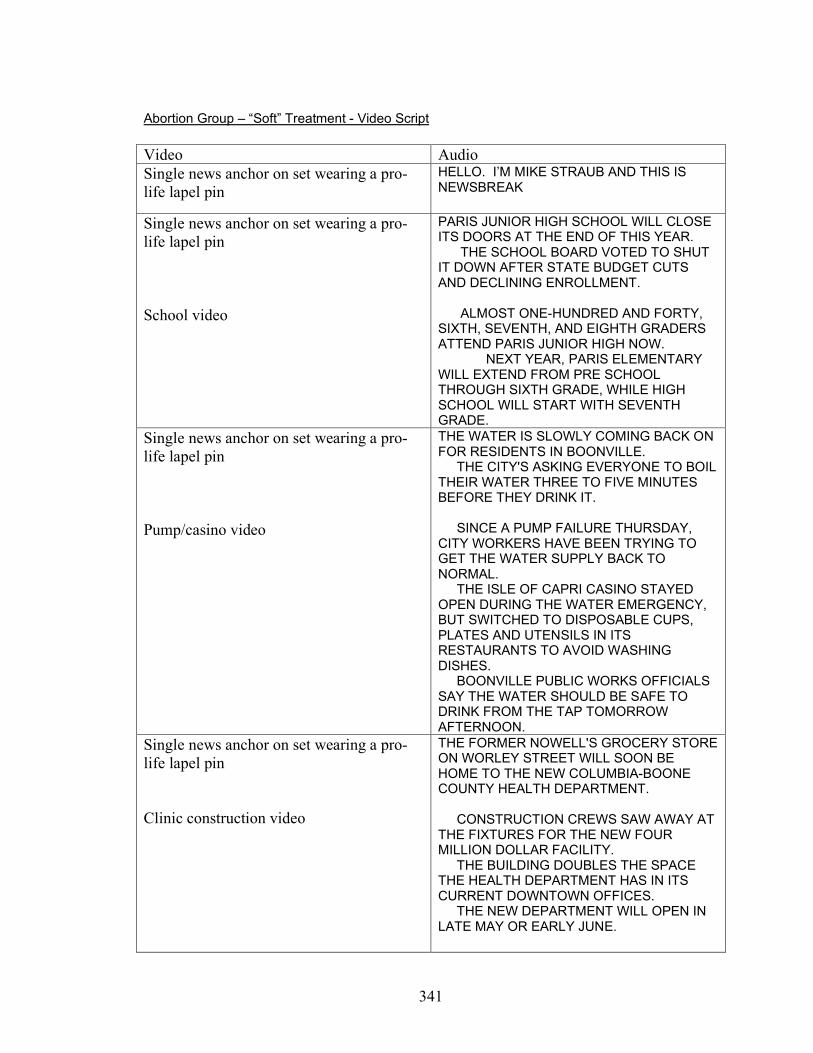
341
Abortion Group – “Soft” Treatment - Video Script Video Audio Single news anchor on set wearing a pro-life lapel pin
HELLO. I’M MIKE STRAUB AND THIS IS NEWSBREAK
Single news anchor on set wearing a pro-life lapel pin School video
PARIS JUNIOR HIGH SCHOOL WILL CLOSE ITS DOORS AT THE END OF THIS YEAR. THE SCHOOL BOARD VOTED TO SHUT IT DOWN AFTER STATE BUDGET CUTS AND DECLINING ENROLLMENT. ALMOST ONE-HUNDRED AND FORTY, SIXTH, SEVENTH, AND EIGHTH GRADERS ATTEND PARIS JUNIOR HIGH NOW. NEXT YEAR, PARIS ELEMENTARY WILL EXTEND FROM PRE SCHOOL THROUGH SIXTH GRADE, WHILE HIGH SCHOOL WILL START WITH SEVENTH GRADE.
Single news anchor on set wearing a pro-life lapel pin Pump/casino video
THE WATER IS SLOWLY COMING BACK ON FOR RESIDENTS IN BOONVILLE. THE CITY'S ASKING EVERYONE TO BOIL THEIR WATER THREE TO FIVE MINUTES BEFORE THEY DRINK IT. SINCE A PUMP FAILURE THURSDAY, CITY WORKERS HAVE BEEN TRYING TO GET THE WATER SUPPLY BACK TO NORMAL. THE ISLE OF CAPRI CASINO STAYED OPEN DURING THE WATER EMERGENCY, BUT SWITCHED TO DISPOSABLE CUPS, PLATES AND UTENSILS IN ITS RESTAURANTS TO AVOID WASHING DISHES. BOONVILLE PUBLIC WORKS OFFICIALS SAY THE WATER SHOULD BE SAFE TO DRINK FROM THE TAP TOMORROW AFTERNOON.
Single news anchor on set wearing a pro-life lapel pin Clinic construction video
THE FORMER NOWELL'S GROCERY STORE ON WORLEY STREET WILL SOON BE HOME TO THE NEW COLUMBIA-BOONE COUNTY HEALTH DEPARTMENT. CONSTRUCTION CREWS SAW AWAY AT THE FIXTURES FOR THE NEW FOUR MILLION DOLLAR FACILITY. THE BUILDING DOUBLES THE SPACE THE HEALTH DEPARTMENT HAS IN ITS CURRENT DOWNTOWN OFFICES. THE NEW DEPARTMENT WILL OPEN IN LATE MAY OR EARLY JUNE.
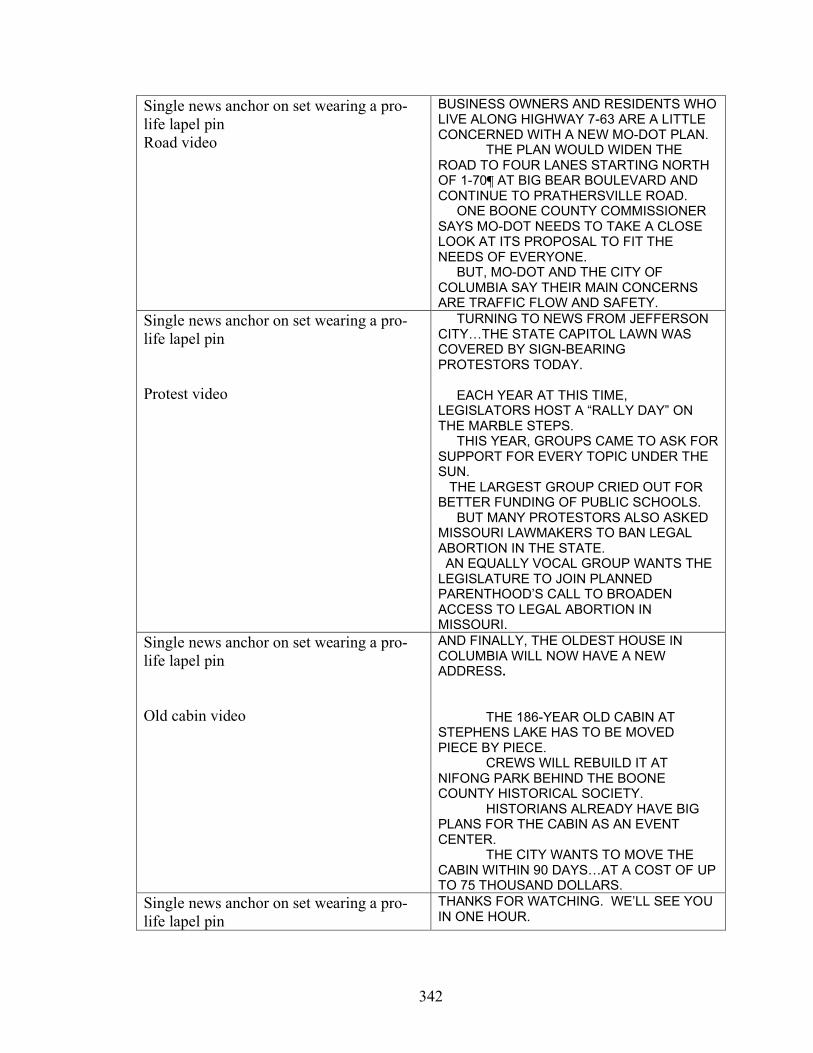
342
Single news anchor on set wearing a pro-life lapel pin Road video
BUSINESS OWNERS AND RESIDENTS WHO LIVE ALONG HIGHWAY 7-63 ARE A LITTLE CONCERNED WITH A NEW MO-DOT PLAN. THE PLAN WOULD WIDEN THE ROAD TO FOUR LANES STARTING NORTH OF 1-70¶ AT BIG BEAR BOULEVARD AND CONTINUE TO PRATHERSVILLE ROAD. ONE BOONE COUNTY COMMISSIONER SAYS MO-DOT NEEDS TO TAKE A CLOSE LOOK AT ITS PROPOSAL TO FIT THE NEEDS OF EVERYONE. BUT, MO-DOT AND THE CITY OF COLUMBIA SAY THEIR MAIN CONCERNS ARE TRAFFIC FLOW AND SAFETY.
Single news anchor on set wearing a pro-life lapel pin Protest video
TURNING TO NEWS FROM JEFFERSON CITY…THE STATE CAPITOL LAWN WAS COVERED BY SIGN-BEARING PROTESTORS TODAY. EACH YEAR AT THIS TIME, LEGISLATORS HOST A “RALLY DAY” ON THE MARBLE STEPS. THIS YEAR, GROUPS CAME TO ASK FOR SUPPORT FOR EVERY TOPIC UNDER THE SUN. THE LARGEST GROUP CRIED OUT FOR BETTER FUNDING OF PUBLIC SCHOOLS. BUT MANY PROTESTORS ALSO ASKED MISSOURI LAWMAKERS TO BAN LEGAL ABORTION IN THE STATE. AN EQUALLY VOCAL GROUP WANTS THE LEGISLATURE TO JOIN PLANNED PARENTHOOD’S CALL TO BROADEN ACCESS TO LEGAL ABORTION IN MISSOURI.
Single news anchor on set wearing a pro-life lapel pin Old cabin video
AND FINALLY, THE OLDEST HOUSE IN COLUMBIA WILL NOW HAVE A NEW ADDRESS. THE 186-YEAR OLD CABIN AT STEPHENS LAKE HAS TO BE MOVED PIECE BY PIECE. CREWS WILL REBUILD IT AT NIFONG PARK BEHIND THE BOONE COUNTY HISTORICAL SOCIETY. HISTORIANS ALREADY HAVE BIG PLANS FOR THE CABIN AS AN EVENT CENTER. THE CITY WANTS TO MOVE THE CABIN WITHIN 90 DAYS…AT A COST OF UP TO 75 THOUSAND DOLLARS.
Single news anchor on set wearing a pro-life lapel pin
THANKS FOR WATCHING. WE’LL SEE YOU IN ONE HOUR.
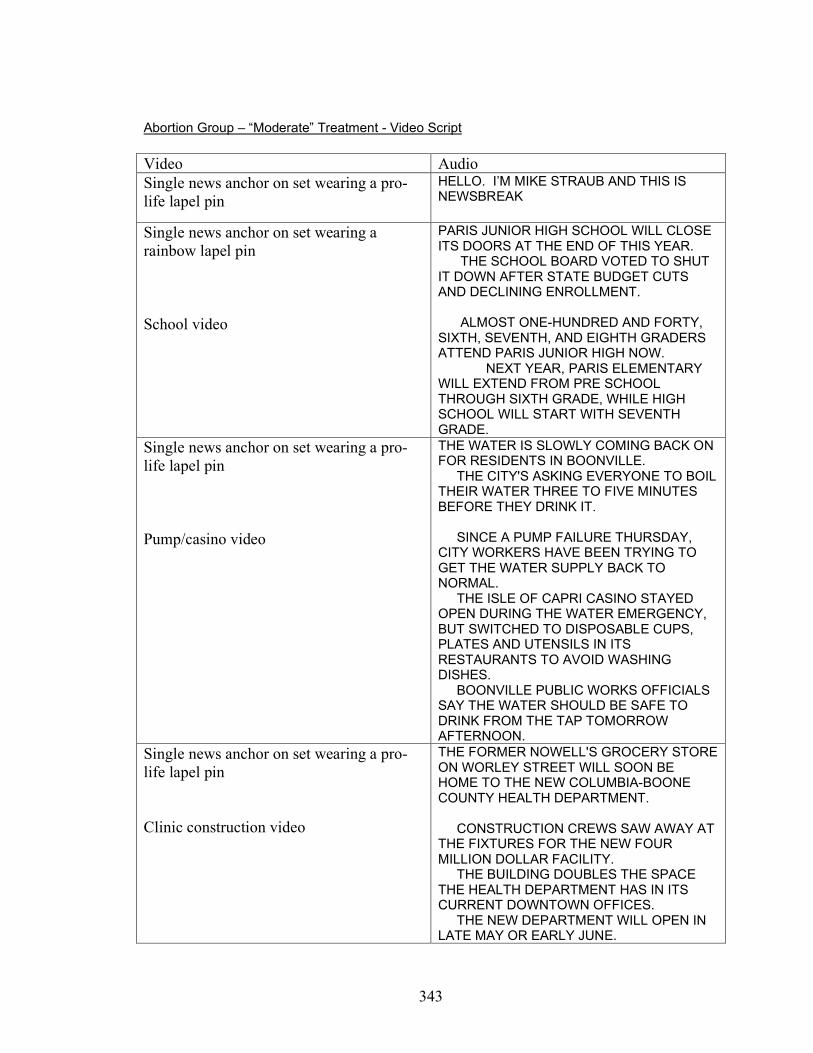
343
Abortion Group – “Moderate” Treatment - Video Script Video Audio Single news anchor on set wearing a pro-life lapel pin
HELLO. I’M MIKE STRAUB AND THIS IS NEWSBREAK
Single news anchor on set wearing a rainbow lapel pin School video
PARIS JUNIOR HIGH SCHOOL WILL CLOSE ITS DOORS AT THE END OF THIS YEAR. THE SCHOOL BOARD VOTED TO SHUT IT DOWN AFTER STATE BUDGET CUTS AND DECLINING ENROLLMENT. ALMOST ONE-HUNDRED AND FORTY, SIXTH, SEVENTH, AND EIGHTH GRADERS ATTEND PARIS JUNIOR HIGH NOW. NEXT YEAR, PARIS ELEMENTARY WILL EXTEND FROM PRE SCHOOL THROUGH SIXTH GRADE, WHILE HIGH SCHOOL WILL START WITH SEVENTH GRADE.
Single news anchor on set wearing a pro-life lapel pin Pump/casino video
THE WATER IS SLOWLY COMING BACK ON FOR RESIDENTS IN BOONVILLE. THE CITY'S ASKING EVERYONE TO BOIL THEIR WATER THREE TO FIVE MINUTES BEFORE THEY DRINK IT. SINCE A PUMP FAILURE THURSDAY, CITY WORKERS HAVE BEEN TRYING TO GET THE WATER SUPPLY BACK TO NORMAL. THE ISLE OF CAPRI CASINO STAYED OPEN DURING THE WATER EMERGENCY, BUT SWITCHED TO DISPOSABLE CUPS, PLATES AND UTENSILS IN ITS RESTAURANTS TO AVOID WASHING DISHES. BOONVILLE PUBLIC WORKS OFFICIALS SAY THE WATER SHOULD BE SAFE TO DRINK FROM THE TAP TOMORROW AFTERNOON.
Single news anchor on set wearing a pro-life lapel pin Clinic construction video
THE FORMER NOWELL'S GROCERY STORE ON WORLEY STREET WILL SOON BE HOME TO THE NEW COLUMBIA-BOONE COUNTY HEALTH DEPARTMENT. CONSTRUCTION CREWS SAW AWAY AT THE FIXTURES FOR THE NEW FOUR MILLION DOLLAR FACILITY. THE BUILDING DOUBLES THE SPACE THE HEALTH DEPARTMENT HAS IN ITS CURRENT DOWNTOWN OFFICES. THE NEW DEPARTMENT WILL OPEN IN LATE MAY OR EARLY JUNE.
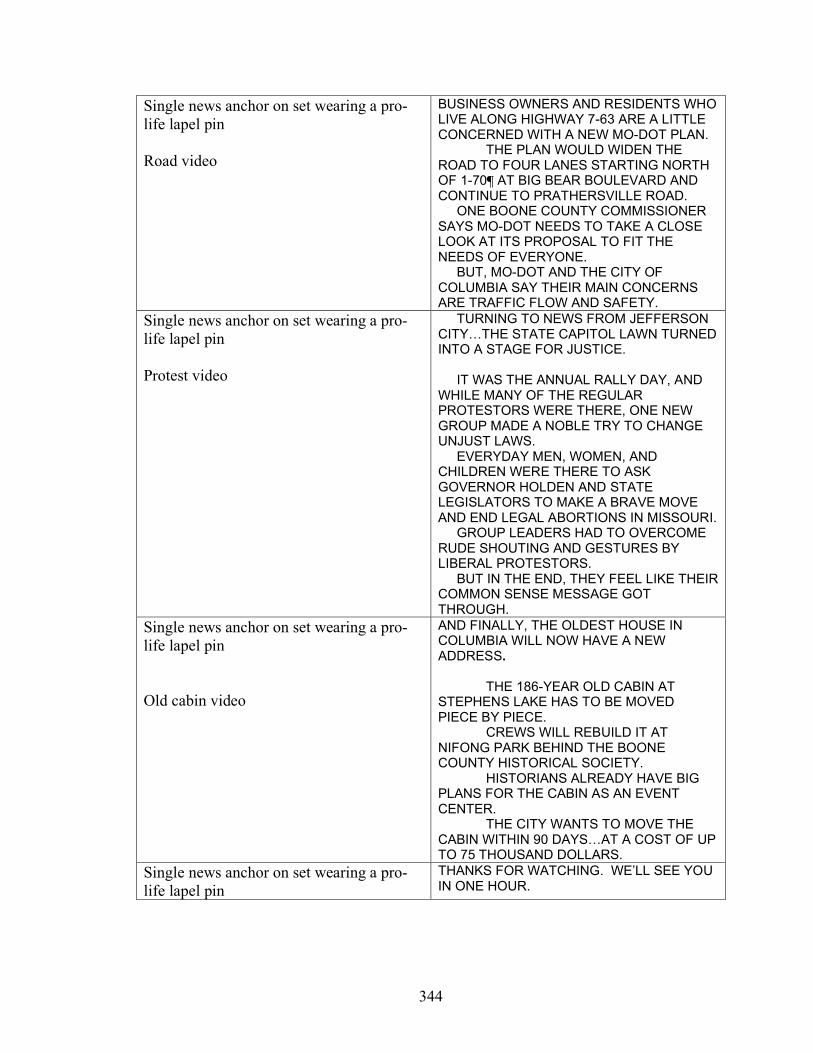
344
Single news anchor on set wearing a pro-life lapel pin Road video
BUSINESS OWNERS AND RESIDENTS WHO LIVE ALONG HIGHWAY 7-63 ARE A LITTLE CONCERNED WITH A NEW MO-DOT PLAN. THE PLAN WOULD WIDEN THE ROAD TO FOUR LANES STARTING NORTH OF 1-70¶ AT BIG BEAR BOULEVARD AND CONTINUE TO PRATHERSVILLE ROAD. ONE BOONE COUNTY COMMISSIONER SAYS MO-DOT NEEDS TO TAKE A CLOSE LOOK AT ITS PROPOSAL TO FIT THE NEEDS OF EVERYONE. BUT, MO-DOT AND THE CITY OF COLUMBIA SAY THEIR MAIN CONCERNS ARE TRAFFIC FLOW AND SAFETY.
Single news anchor on set wearing a pro-life lapel pin Protest video
TURNING TO NEWS FROM JEFFERSON CITY…THE STATE CAPITOL LAWN TURNED INTO A STAGE FOR JUSTICE. IT WAS THE ANNUAL RALLY DAY, AND WHILE MANY OF THE REGULAR PROTESTORS WERE THERE, ONE NEW GROUP MADE A NOBLE TRY TO CHANGE UNJUST LAWS. EVERYDAY MEN, WOMEN, AND CHILDREN WERE THERE TO ASK GOVERNOR HOLDEN AND STATE LEGISLATORS TO MAKE A BRAVE MOVE AND END LEGAL ABORTIONS IN MISSOURI. GROUP LEADERS HAD TO OVERCOME RUDE SHOUTING AND GESTURES BY LIBERAL PROTESTORS. BUT IN THE END, THEY FEEL LIKE THEIR COMMON SENSE MESSAGE GOT THROUGH.
Single news anchor on set wearing a pro-life lapel pin Old cabin video
AND FINALLY, THE OLDEST HOUSE IN COLUMBIA WILL NOW HAVE A NEW ADDRESS. THE 186-YEAR OLD CABIN AT STEPHENS LAKE HAS TO BE MOVED PIECE BY PIECE. CREWS WILL REBUILD IT AT NIFONG PARK BEHIND THE BOONE COUNTY HISTORICAL SOCIETY. HISTORIANS ALREADY HAVE BIG PLANS FOR THE CABIN AS AN EVENT CENTER. THE CITY WANTS TO MOVE THE CABIN WITHIN 90 DAYS…AT A COST OF UP TO 75 THOUSAND DOLLARS.
Single news anchor on set wearing a pro-life lapel pin
THANKS FOR WATCHING. WE’LL SEE YOU IN ONE HOUR.
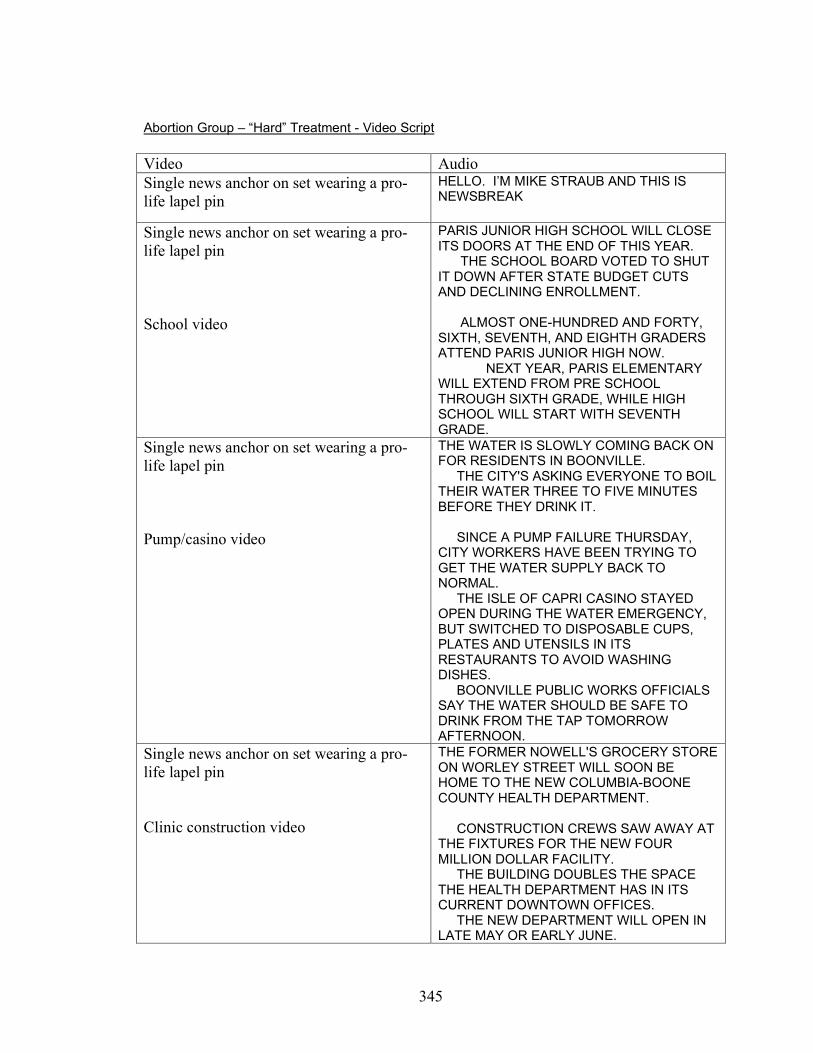
345
Abortion Group – “Hard” Treatment - Video Script Video Audio Single news anchor on set wearing a pro-life lapel pin
HELLO. I’M MIKE STRAUB AND THIS IS NEWSBREAK
Single news anchor on set wearing a pro-life lapel pin School video
PARIS JUNIOR HIGH SCHOOL WILL CLOSE ITS DOORS AT THE END OF THIS YEAR. THE SCHOOL BOARD VOTED TO SHUT IT DOWN AFTER STATE BUDGET CUTS AND DECLINING ENROLLMENT. ALMOST ONE-HUNDRED AND FORTY, SIXTH, SEVENTH, AND EIGHTH GRADERS ATTEND PARIS JUNIOR HIGH NOW. NEXT YEAR, PARIS ELEMENTARY WILL EXTEND FROM PRE SCHOOL THROUGH SIXTH GRADE, WHILE HIGH SCHOOL WILL START WITH SEVENTH GRADE.
Single news anchor on set wearing a pro-life lapel pin Pump/casino video
THE WATER IS SLOWLY COMING BACK ON FOR RESIDENTS IN BOONVILLE. THE CITY'S ASKING EVERYONE TO BOIL THEIR WATER THREE TO FIVE MINUTES BEFORE THEY DRINK IT. SINCE A PUMP FAILURE THURSDAY, CITY WORKERS HAVE BEEN TRYING TO GET THE WATER SUPPLY BACK TO NORMAL. THE ISLE OF CAPRI CASINO STAYED OPEN DURING THE WATER EMERGENCY, BUT SWITCHED TO DISPOSABLE CUPS, PLATES AND UTENSILS IN ITS RESTAURANTS TO AVOID WASHING DISHES. BOONVILLE PUBLIC WORKS OFFICIALS SAY THE WATER SHOULD BE SAFE TO DRINK FROM THE TAP TOMORROW AFTERNOON.
Single news anchor on set wearing a pro-life lapel pin Clinic construction video
THE FORMER NOWELL'S GROCERY STORE ON WORLEY STREET WILL SOON BE HOME TO THE NEW COLUMBIA-BOONE COUNTY HEALTH DEPARTMENT. CONSTRUCTION CREWS SAW AWAY AT THE FIXTURES FOR THE NEW FOUR MILLION DOLLAR FACILITY. THE BUILDING DOUBLES THE SPACE THE HEALTH DEPARTMENT HAS IN ITS CURRENT DOWNTOWN OFFICES. THE NEW DEPARTMENT WILL OPEN IN LATE MAY OR EARLY JUNE.
346
Single news anchor on set wearing a pro-life lapel pin Road video
BUSINESS OWNERS AND RESIDENTS WHO LIVE ALONG HIGHWAY 7-63 ARE A LITTLE CONCERNED WITH A NEW MO-DOT PLAN. THE PLAN WOULD WIDEN THE ROAD TO FOUR LANES STARTING NORTH OF 1-70¶ AT BIG BEAR BOULEVARD AND CONTINUE TO PRATHERSVILLE ROAD. ONE BOONE COUNTY COMMISSIONER SAYS MO-DOT NEEDS TO TAKE A CLOSE LOOK AT ITS PROPOSAL TO FIT THE NEEDS OF EVERYONE. BUT, MO-DOT AND THE CITY OF COLUMBIA SAY THEIR MAIN CONCERNS ARE TRAFFIC FLOW AND SAFETY.
Single news anchor on set wearing a pro-life lapel pin Protest video
TURNING TO NEWS FROM JEFFERSON CITY…AND A STORY I GOT TO BE INVOLVED IN PERSONALLY. I JOINED REGULAR PEOPLE FROM ALL OVER THE AREA WHO SHOWED UP AT THE ANNUAL CAPITOL RALLY DAY TO WORK TOWARD TRYING TO CHANGE SOME OF MISSOURI’S UNJUST LAWS THAT ALLOW LEGAL ABORTION. I WAS HONORED THE GROUP ASKED ME TO ASK AS EMCEE FOR ITS RALLY. MY FRIENDS THERE TELL ME THE FIGHT WON’T BE AN EASY ONE, THANKS TO A LOT OF PEOPLE ACROSS MISSOURI WHO DON’T SEE HOW WRONG IT IS TO MURDER UNBORN CHILDREN. BUT AFTER MEETING THESE PEOPLE AND HEARING THEIR COMMON SENSE MESSAGE, I’M OPTIMISTIC MISSOURI CAN DO THE RIGHT THING AND PASS THIS LEGISLATION.
Single news anchor on set wearing a pro-life lapel pin Old cabin video
AND FINALLY, THE OLDEST HOUSE IN COLUMBIA WILL NOW HAVE A NEW ADDRESS. THE 186-YEAR OLD CABIN AT STEPHENS LAKE HAS TO BE MOVED PIECE BY PIECE. CREWS WILL REBUILD IT AT NIFONG PARK BEHIND THE BOONE COUNTY HISTORICAL SOCIETY. HISTORIANS ALREADY HAVE BIG PLANS FOR THE CABIN AS AN EVENT CENTER. THE CITY WANTS TO MOVE THE CABIN WITHIN 90 DAYS…AT A COST OF UP TO 75 THOUSAND DOLLARS.
Single news anchor on set wearing a pro-life lapel pin
THANKS FOR WATCHING. I’LL BE BACK IN ONE HOUR. AND REMEMBER, LET YOUR REPRESENTATIVE KNOW YOU SUPPORT BANNING ABORTION IN MISSOURI.
347
Bibliography
Agnew, Spiro T. 1969. Speech in Des Moines, Iowa. November 13, 1969. <http://www.americanrhetoric.com/speeches/spiroagnew.htm> Alter, Jonathan. 1992. “Why the Old Media’s Losing Control” Newsweek
June 8, 1992, p. 45. Althaus, Scott L. 2003. “When News Norms Collide, Follow the Lead: New Evidence
for Press Independence” Political Communication 20:381-414. Althaus, Scott L. and David Tewksbury. 2002. “Agenda Setting and the “New” News:
Patterns of Issue Importance Among Readers of the Paper and Online Versions of the New York Times” Communication Research 29:180-207.
Altheide, David L. and Robert P. Snow. 1979. Media Logic. Beverly Hills:
Sage Publications, Inc. Altschull, J. Herbert. 1984. Agents of Power: The Role of the News Media in
Human Affairs. White Plains, NY: Longman. American Society of Newspaper Editors. 2003. “Numbers and Percentage of Minorities
by Race and Job Category” <http://www.asne.org/index.cfm?id=4456> Anderson, Norman. H. 1971. “Integration Theory and Attitude Change”
Psychological Review 78:171-206. Andreoli, Virginia and Stephen Worchel. 1978. “Effects of Media, Communicator,
and Message Position on Attitude Change.” Public Opinion Quarterly 42:59-70. Ansolabehere, Stephen, Roy Behr, and Shanto Iyengar. 1993. The Media Game:
American Politics in the Television Age. New York: Macmillan Publishing Company.
Aronson, Elliot and J. Merrill Carlsmith. 1968. “Experimentation in Social Psychology”
in Handbook of Social Psychology, Vol. II, Research Methods, Ed. By Gardner Lindzey and Elliott Aronson. Reading, MA: Addison-Wesley.
Bagdikian, Ben H. 1969. “The Press and Its Crisis of Identity” in Mass Media in a
Free Society. ed. Warren K. Agee. Lawrence, KS: University Press of Kansas. Ball-Rokeach, Sandra J. and Melvin L. DeFleur. 1976. “A Dependency Model of Mass
Media Effects,” Communication Research 3, pp. 3-21.
348
Ball-Rokeach, Sandra J. and Melvin DeFleur. 1976. “The Origins of Individual Media-System Dependency: A Sociological Framework” Communication Research 12: 485-510.
Balz, Dan. 1992. “In Medias Res: If You Can’t Beat ‘Em, Bypass ‘Em”
Washington Post National Weekly Edition May 25, 1992, p. 12 Banning, Stephen A. 1999. “’Truth is Our Ultimate Goal’: A Mid-19th Century Concern
for Journalism Ethics” American Journalism 16:17-39. Barnes, Deborah. 2001. “KOMU stand on ribbons” [three paragraphs]
October 6, 2001. Personal e-mail. Accessed: October 7, 2001. <[email protected]>.
Barron, Jerome A. 1967. “Access to the Media—A New First Amendment Right”
Harvard law Review 80:1641. Barron, Jerome A. 1973. Freedom of the Press for Whom? The Right of Access
to Mass Media. Bloomington, IN: Indiana University Press. Barron, Jerome A. and C. Thomas Dienes. 1979. Handbook of Free Speech and
Free Press. Boston, MA: Little, Brown and Company. Bartle, Matthew V. 2001. “Your Email” [seven paragraphs]
September 24, 2001. Personal e-mail. Accessed: September 24, 2001. <[email protected]>.
Bartle, Matthew V. 2001. “RE: Your Email” [five paragraphs] September 24, 2001. Personal e-mail. Accessed: September 24, 2001. <[email protected]>. Bartley, Robert L. 1972. “The Press: Adversary, Surrogate Sovereign, or Both?”
in Press, Politics, and Popular Government. ed. George F. Will. Washington: American Enterprise Institute for Public Policy Research.
Bates, Stephen. 1995. Realigning Journalism with Democracy: The Hutchins
Commission, Its Time, and Ours. Washington: The Annenberg Washington Program in Communications Policy Studies of Northwestern University.
Bauder, David. 2003. “War Ratings: Fox News Has the High Ground”
The Associated Press March 26, 2003 <http://www.nydailynews.com/entertainment/story/70057p-65200c.html>
Bearden, Carl. 2001. “Journalistic Ethics” [two paragraphs] September 25, 2001. Personal e-mail. Accessed: September 25, 2001. <[email protected]>.
349
Bearden, Carl. 2001. “RE: Your disturbing comments; from Seattle” [four paragraphs] September 27, 2001. Personal e-mail. Accessed: September 27, 2001. <[email protected]>. Behr, Roy L. and Shanto Iyengar. 1985. “Television News, Real World Cues, and
Changes in the Public Agenda” The Public Opinion Quarterly 49:38-57. Bennett, W. Lance. 1980. Public Opinion in American Politics. New York:
Harcourt Brace Jovanovich, Inc. Bennett, W. Lance. 1983 News: The Politics of Illusion. New York: Longman. Bennett, W. Lance. 1990. “Towards a Theory of Press-State Relations in the
United States,” Journal of Communication 40 (1990), pp. 103-25. Bennett, W. Lance. 2003. “An Introduction to Journalism Norms and Representation
in Politics” Political Communication 13:373-384. Berkowitz, Dan. 1992. “Who Sets the Media Agenda? The Ability of Policymakers to
Determine News Decisions” in Public Opinion, the Press, and Public Policy ed. J. David Kennamer. Westport, CT: Praeger.
Berkowitz, Leonard and Eunkyung Jo. 1994. “A Priming Effect Analysis of Media
Influences: An Update” in Media Effects: Advances in Theory and Research ed. J. Bryant and D. Zillman. Hillsdale, NJ: Erlbaum.
Bimber, Bruce. 2001. “Information and Political Engagement in America: The Search
for Effects of Information Technology at the Individual Level,” Political Research Quarterly (54), pp. 53-67.
Bishop, George F. 2005. The Illusion of Public Opinion: Fact and Artifact in American
Public Opinion Polls. Lanham, MD: Rowman & Littlefield Publishers, Inc. Blumer, Herbert and Philip M. Hauser. 1933. The Movies and Conduct.
New York: The Macmillan Co. Blumler, Jay G. and Katz, Elihu 1974. The Uses of Mass Communication:
Current Perspectives on Gratification Research. Beverly Hills, CA: Sage. Bollinger, Lee C. “Freedom of the Press and Public Access”
Michigan Law Review 75:1-33. Bowen, Lawrence, Keith Stamm, and Fiona Clark. 2000. “Television Reliance and
Political Malaise: A Contigency Analysis” Journal of Broadcasting & Electronic Media 44:1-15.
350
Bowling, Alan. 2001. “KOMU” [one paragraph] September 27, 2001. Personal e-mail. Accessed: September 27, 2001. <[email protected]>. Boyle, Thomas P. 2001. “Intermedia Agenda Setting in the 1996 Presidential Election”
Journalism & Mass Communication Quarterly 78:26-44. Bozell, L. Brent III. 2004. Weapons of Mass Distortion: The Coming Meltdown of the
Liberal Media. New York: Crown Forum. Bozell, L. Brent III and Brent H. Baker. 1990. And That’s the Way it Is(n’t):
A Reference Guide to Media Bias. Alexandria, VA: Media Research Center. Bradburn, Norman. M., Lance. J. Rips, and Steven K. Shevell. 1987. “Answering
autobiographical questions: The impact of memory and inference on surveys.” Science, 236, 157-161.
Bradburn, Norman M. and Seymour Sudman. 1988. Polls and Surveys:
Understanding What They Tell Us. San Francisco: Jossey-Bass. Bromley, Christine. 2001. “I agree” [four paragraphs] September 27, 2001. Personal e-mail. Accessed September 27, 2001. <[email protected]>. Buck, Ross. 1984. The Communication of Emotion. New York: Guilford Press. Burke, Kenneth. 1989. On Symbols and Society. Chicago: The University
of Chicago Press. Burkeman, Oliver. 2004. “Religious Right Relishes Chance to Push Agenda,”
The Guardian. November 5: A1. Cantril, Hadley. 1940. The Invasion from Mars: A Study in the Psychology of Panic.
Princeton, NJ: Princeton University Press. Carter, Roy E. and Peter Clarke. 1962. “Public Affairs Opinion Leadership Among
Educational Television Viewers” American Sociological Review 27:792-799. Chase, Stuart, 1938. The Tyranny of Words. New York. Harcourt, Brace & World, Inc. Chomsky, Noam and Edward Herman. 1988. Manufacturing Consent.
New York: Pantheon. Cirino, Robert. 1971. Don’t Blame the People: How the News Media use Bias,
Distortion and Censorship to Manipulate Public Opinion. New York:
351
Random House. Clancey, Maura and Michael P. Robinson. 1985. "General Election Coverage: Part I"
Public Opinion December-January 1985. Clarke, Peter and Eric Fredin. 1978. “Newspapers, Television, and Political Reasoning”
The Public Opinion Quarterly 42:143-160. Cohen, Bernard C. 1963. The Press and Foreign Policy. Princeton, NJ:
Princeton University Press. Cohen, Jeff and Norman Solomon. 1995. Through the Media Looking Glass:
Decoding Bias and Blather in the News. Monroe, ME: Common Courage Press. Conners, J. 1996. “Visual Symbols as Political Information Primes,” paper
presented to the Association for Education in Journalism and Mass Communication conference.
Cook, Fay Lomax, Tom R. Tyler, Edward G. Goetz, Margaret T. Gordon, David Protess,
Donna R. Leff, and Harvey L. Molotch. 1983. “Media and Agenda Setting: Effects on the Public, Interest Group Leaders, Policy Makers, and Policy” The Public Opinion Quarterly 47:16-35.
Cook, Thomas D. and Donald T. Campbell. 1979. Quasi-experimental Design:
Design and Analysis Issues for Field Settings. Chicago: Rand McNally. Corbett, Michael. 1991. American Public Opinion: Trends, Processes and Patterns.
New York: Longman. Craig, Barbara Hinkson and David M. O’Brien. 1993. Abortion and American Politics.
Chatham, NJ: Chatham House Publishers. Coulter, Ann. 2002. Slander. New York: Crown Publishers. Croteau, David, William Hoynes, and Kevin Carragee. 1996. “The Political Diversity of
Public Television: Polysemy, the Public Sphere, and the Conservative Critique of PBS” Journalism and Communication Monographs 157:1-55.
Cunningham, Linda Grist and Barbara A, Henry. 1989. The Changing Face of the
Newsroom. Washington: The American Society of Newspaper Editors. D’Alessio, Dave. 2003. “An Experimental Examination of Readers’ Perceptions of
Media Bias” Journalism & Mass Communication Quarterly 80:282-294. D’Alessio, Dave and Mike Allen. 2000. “Media Bias in Presidential Elections:
A Meta-Analysis” Journal of Communication 50:133-156.
352
Dale, Edgar. 1935. The Content of Motion Pictures. New York: The Macmillan Co. Danielian, Lucig H. and Benjamin I. Page. 1994. “The Heavenly Chorus: Interest Group
Voices on TV News” American Journal of Political Science 38:1056-1078. Davis, Dennis K. and John P. Robinson. 1986. “The Social Role of Television News:
Theoretical Perspectives” in The Main Source: Learning from Television News. ed. John P. Robinson and Mark R. Levy. Beverly Hills, CA: Sage.
Davis, Dennis K. and John P. Robinson. 1986. “The News Story Attributes and
Comprehension” in The Main Source: Learning from Television News. ed. John P. Robinson and Mark R. Levy. Beverly Hills, CA: Sage.
Davies, Duncan, Diana Bathurst, and Robin Bathurst. 1990. The Telling Image:
The Changing Balance between Pictures and Words in a Technology Age. Oxford: Clarendon Press.
Davison, W. Phillip. 1983. “The Third-Person Effect in Communication”
The Public Opinion Quarterly 47:1-15. Davison, W. Phillips and Frederick T.C. Yu. 1974. Mass Communication Research,
Major Issues and Future Directions. New York: Praeger. Dearing, James W. and Everett M. Rogers. 1996. Agenda-Setting.
Thousand Oaks, CA: Sage. Defense of Marriage Act. 1996. United States Code, Title 28, Chapter 115,
Section 1738C. DeFleur, Melvin L. and Sandra J. Ball Rokeach. 1982. Theories of
Mass Communication, 4th Ed. New York: Longman. “Denise.” 2001. “Patriotism” [one paragraph] September 27, 2001. Personal e-mail. Accessed: September 27, 2001. <[email protected]>. Dennis, Everette E. 1996. “Background Check—Why the Public Needs to Know More
About News People” in The American Journalist in the 1990s: U. S. News People at the End of an Era. David H. Weaver and G. Cleveland Wilhoit. Mahwah, NJ: Lawrence Erlbaum Associates.
Dennis, Everette E. 1996. “The News Media Are Not Biased” in Media Debates: Issues
in Mass Communication. Everette E. Dennis and John C. Merrill. White Plains, NY: Longman
353
Dennis, Everette E. 1997. “The Liberal Press” Liberal Reporters, Yes; Liberal Slant No!” The American Editor January/February 1997.
Dennis, Everette E. and John C. Merrill. 1996. Media Debates: Issues in
Mass Communication, 2nd Edition. White Plains, NY: Longman. deVaus, David A. 2001. Research Design in Social Research. London: Sage. Dimmick, John. 1974. “The Gatekeeper: An Uncertainty Theory”
Journalism Monographs, November, 1974. Domke, David, David P. Fan, Michael Fibison, Dhavan V, Shah, Steven S. Smith, and
Mark D. Watts. 1997. “News Media, Candidates and Issues, and Public Opinion in the 1996 Presidential Campaign” Journalism & Mass Communication Quarterly 74:718-737.
Dooley, Patricia L. 1997. Taking Their Political Place: Journalists and the Making of
an Occupation. Westport, CT: Greenwood Press. Dreier, Peter. 1982. “The Position of the Press in the U. S. Power Structure”
Social Problems 29:298-310. Druckman, James N. 2001. “On the Limits of Framing Effects: Who Can Frame?”
The Journal of Politics 63:1041-1066. Druckman, James N. and Kjersten R. Nelson. 2003. “Framing and Deliberation:
How Citizens’ Conversations Limit Elite Influences” American Journal of Political Science 47:729-745.
Dysinger, W. S. and Christian A. Ruckmick. 1933. The Emotional Responses of
Children to the Motion Picture Situation. New York: The Macmillan Co. Edelman, Murray. 1964. The Symbolic Uses of Politics. Urbana: University of
Illinois Press. Edelman, Murray. 1971. Politics as Symbolic Action. New York: Academic Press. Edelman, Murray. 1977. Political Language: Words that Succeed and Policies
That Fail. New York: Academic Press. Edwards, George C. III and B. Dan Wood. 1999. “Who Influences Whom?
The President, Congress, and the Media” The American Political Science Review 93:327-344.
Efron, Edith. 1971. The News Twisters. Los Angeles: Nash Publishing.
354
Elder, Charles D. and Roger W. Cobb. 1983. The Political Uses of Symbols. New York: Longman.
Entman, Robert M. 1993. “Towards Clarification of a Fractured Paradigm” Journal
of Communication 43:51-58. Entman, Robert M. 2003. “Cascading Activation: Contesting the White House’s
Frame After 9/11” Political Communication 20:415-432. Epstein, Edward Jay. 1973. News from Nowhere. New York: Random House. Epstein, Edward Jay. 1975. Between Fact and Fiction: The Problem of Journalism.
New York: Random House. Erskine, Hazel. 1970. “The Polls: Public Opinion of the News Media”
The Public Opinion Quarterly 34:630-643. Eveland, William P., Jr. 2001. “The Cognitive Mediation Model of Learning From
News” Communication Research 28:571-601. Eveland, William P., Jr. 2002. “News Information Processing as Mediator of the
Relationship between Motivations and Political Knowledge” Journalism & Mass Communication Quarterly 79:26-40.
Fallows, James. 1996. Breaking the News: How the Media Undermine
American Democracy. New York: Pantheon Books. Feldman, R. H. 1984. “The Influence of Communicator Characteristics on the Nutrition
Attitudes and Behavior of High School Students.” Journal of School Health 54:149-151.
Ferre’, John P. 1988. “The Dubious Heritage of Media Ethics: Cause-and-Effect
Criticism in the 1890s” American Journalism 5: 191-203. Ferree, Myra Marx, William Anthony Gamson, Jrgen Gerhards, and Dieter Rucht. 2002.
Shaping Abortion Discourse: Democracy and the Public Sphere in Germany and the United States. Cambridge: Cambridge University Press.
Fico, Frederick and Eric Freedman. 2001. “Setting the News Story Agenda: Candidates
and Commentators in News Coverage of a Governor’s Race” Journalism & Mass Communication Quarterly 78:437-449.
Firth, Raymond. 1973. Symbols: Public and Private. Ithaca: Cornell University Press. Fisher, Walter R. 1987. Human Communication as Narration: Toward a Philosophy
of Reason, Values and Action. Columbia: University of South Carolina Press.
355
Folz, David H. 1996. Survey Research for Public Administration.
Thousand Oaks, CA: Sage. The Freedom Forum. 1996. Poll of Washington Reporters. Fuller, Jack. 1996. News Values: Ideas for an Information Age. Chicago: University of
Chicago Press. Funkhouser, G. Ray and Malcolm E. McCombs. 1971. “The Rise and Fall of News
Diffusion” The Public Opinion Quarterly 35:107-113. Gallup, George Jr. and Jim Castelli. 1987. The American Catholic People: Their Beliefs,
Practices, and Values. Garden City, NY: Doubleday & Company. Galtung, Johan and Maria Holboe Ruge. 1965. “The Structure of Foreign News”
Journal of Peace Research 2:64-91. Gamson, William A. 1992. Talking Politics. New York: Cambridge University Press. Gamson, William A. and Modigliani, Andre. 1987. “The Changing Culture of
Affirmative Action” in Research in Political Sociology, Vol. 3. ed. Richard G. Braungart and Margaret M. Braungart. Greenwich, CT: JAI.
Gamson, William and Andre Modiglani. 1989. “Media Discourse and Public Opinion on
Nuclear Power,” American Journal of Sociology 95:1-37. Gans, Herbert J. 1979. “The Messages Behind the News” Columbia Journalism Review
Jan-Feb 1979, pp. 40-45. Gans, Herbert J. 1979. Deciding What’s News. New York: Pantheon. Gaziano, Cecilie. 1983. “The Knowledge Gap Hypothesis: An Analytical Review
of Effects” Communication Research 10:447-486. Georgetown Law Journal. 1973. Media and the First Amendment in a Free Society.
Amherst, MA: University of Massachusetts Press. Gitlow v. New York. 1925. 268 U. S. 652. Glasgow University Media Group. 1976. Bad News. London: Routledge. Gleason, Timothy W. 1990. The Watchdog Concept: The Press and the Courts
in Nineteenth-Century America. Ames, IA: Iowa State University Press. Golan, Guy and Wayne Wanta. 2001. “Second-Level Agenda Setting in the
356
New Hamsphire Primary: A Comparison of Coverage in Three Newspapers and Public Perceptions of Candidates” Journalism & Mass Communication Quarterly 78:247-259.
Goldberg, Bernard. 2002. Bias: A CBS Insider Exposes How the Media Distort
the News. Washington: Regnery Publishing. Gollin, Albert E. 1980. “Exploring the Liaison Between Polling and the Press”
The Public Opinion Quarterly 44:445-461. Gonzalez, Santiago Sanchez. 1992. The American Pattern of Freedom of the Press:
A Model to Follow? Cambridge, MA: Harvard University. Grabe, Maria Elizabeth, Shuhua Zhou, Annie Lang, and Paul David Bolls. 2000.
“Packaging Television News: The Effects of Tabloid on Information Processing and Evaluative Responses” Journal of Broadcasting & Electronic Media 44:581-598.
Graber, Doris A. 1971. “The Press as Opinion Resource During the 1968 Presidential
Campaign” The Public Opinion Quarterly 35:168-182. Graber, Doris A. 1986. “Press Freedom and the General Welfare”
Political Science Quarterly 101:257-275. Graber, Doris A. 1988. Processing the News: How People Tame the Information
Tide, 2nd. Ed. New York: Longman. Graber, Doris A. 1990. “Seeing is Remembering: How Visuals Contribute to Learning
from Television News” Journal of Communication 40:134-155. Gray, Jerry. 1996. “House Passes Bar to U. S. Sanction of Gay Marriage.”
The New York Times. July 13: 1. Greenberg, Bradley S. and Edwin B. Parker. 1965. The Kennedy Assasination and
the American Public: Social Communication in Crisis. Beverly Hills, CA: Sage. Groeling, Tim and Samuel Kernell. 1998. “Is Network News Coverage of the
President Biased?” The Journal of Politics 60:1063-1087. Groseclose, Tim, and Jeff Milyo. 2004. “A Measure of Media Bias” under review
at the Quarterly Journal of Economics. Gunther, Albert C. 1988. “Attitude Extremity and Trust in Media”
Journalism Quarterly 65:279-87. Gunther, Albert C. 1992. “Biased Press or Biased Public? Attitudes Toward Media
357
Coverage of Social Groups” The Public Opinion Quarterly 56:147-167. Gunther, Albert C. 1998. “The Persuasive Press Inference: Effects of Mass Media on
Perceived Public Opinion” Communication Research 25:486-504. Gurevitch, Michael, Tony Bennett, James Curran & Janet Woollacott, Ed. 1982.
Culture, Society and the Media. London: Methuen. Hallin, Daniel C. 1984. “The Media, the War in Vietnam, and Political Support:
A Critique of the Thesis of Oppositional Media” The Journal of Politics 46:2-24. Hanson, Christopher. 1999. “The Power of the Story: Narrative Analysis As a Tool for
Studying the News,” paper presented to the Association for Education in Journalism and Mass Communication conference.
Harwood, Richard. 1992. “The Waning Power of the Press” Presstime
August 1992, p. 25. Hatchen, William A. 2001. The Troubles of Journalism: A Critical Look at
What’s Right and Wrong With the Press, 2nd Edition. Mahwah, NJ: Lawrence Erlbaum Associates.
Helm, Charles J., Stanley Rothman, and S. Robert Lichter. 1988. “Is Opposition to
Nuclear Energy an Ideological Critique?” The American Political Science Review 82:943-952.
Henry, William A., III. 1981 “News as Entertainment: The Search for Dramatic Unity”
in What’s News: The Media in American Society ed. Elie Abel. San Francisco: Institute for Contemporary Studies.
Herman, Didi. 2000. “The Gay Agenda is the Devil’s Agenda: The Christian Right’s
Vision and the Role of the State” in The Politics of Gay Rights, ed. by Craig A. Rimmerman. Chicago: The University of Chicago Press.
Herman, Edward S. 1999. The Myth of the Liberal Media: An Edward Herman Reader.
New York: P. Lang. Hess, Stephen. 1981. The Washington Reporters. Washington: Brookings Institution. Hess, Stephen. 1992. “All the President’s Reporters: A New Survey of the White House
Press Corps” Presidential Studies Quarterly 22:311-321. Hindman, Douglas Blanks. 2004. “Media System Dependency and Public Support for
the Press and the President” Mass Communication & Society 7:29-42. Hoffman, Keith. 2001. “patriotism” [one paragraph]
358
September 27, 2001. Personal e-mail. Accessed: September 27, 2001. <[email protected]>. Hohulin, Martin “Bubs.” 2001. “memo you sent” [one paragraph] September 25, 2001. Personal e-mail. Accessed: September 25, 2001. <[email protected]>. Holaday, P. W. and George D. Stoddard. 1933. Getting Ideas From the Movies.
New York: The Macmillan Co. Hovland, Carl I. and Walter A. Weiss. 1951. “The Influence of Source Credibility
on Communication Effectiveness” Public Opinion Quarterly 15:633-650. Hyman, Herbert. 1959. Political Socialization: A Study in the Psychology of
Political Behavior. Glencoe: Free Press. Immerwahr, John, John Dobie, Leo Bogart, and Jamie Kalven. 1982. “Public Attitudes
Toward Freedom of the Press” The Public Opinion Quarterly 46:177-194. Iynegar, Shanto. 1987. “Television News and Citizen’s Explanations of
National Affairs” American Political Science Review 81:815-831. Iyengar, Shanto. 1991. Is Anyone Responsible? How Television Frames Political Issues.
Chicago: University of Chicago Press. Iyengar, Shanto and Donald R. Kinder. 1987. News That Matters: Television and
American Opinion. Chicago: The University of Chicago Press. Iyengar, Shanto, Mark D. Peters, and Donald R. Kinder. 1982. “Experimental
Demonstrations of the ‘Not-So-Minimal’ Consequences of Television News Programs” American Political Science Review 76:848-858.
Jacobs, Lawrence R. and Robert Y. Shapiro. 1994. “Issues, Candidate Image,
and Priming: The Use of Private Polls in Kennedy’s 1960 Presidential Campaign” The American Political Science Review 88:527-540.
Jacoby, Jacob, Wayne D. Hoyer, and David A. Sheluga. 1980. Miscomprehension
of Televised Communications. New York: The Educational Foundation of the American Association of Advertising Agencies.
Jaffe, Frederick S., Barbara L. Lindheim, and Philip R. Lee. 1981. Abortion Politics:
Private Morality and Public Policy. New York: McGraw-Hill. Jamieson, Kathleen Hall and Paul Waldman. 2003. The Press Effect:
Politicians, Journalists, and the Stories That Shape the Political World. Oxford: Oxford University Press.
359
Johnstone, John W. C., Edward Slawski, and William W. Bowman. 1976.
The News People: A Sociological Portrait of American Journalists and Their Work. Urbana, IL: University of Illinois Press.
Jung, Frank. 2001. “Flag flap” [one paragraph] September 27, 2001. Personal e-mail. Accessed September 27, 2001. <[email protected]>. Karsch, Robert F. 1956. The Missouri Citizen: History, Institutions and Constitution.
St. Louis: State Publishing Company. Katz, Elihu, and Paul Lazarsfeld. 1955. Personal Influence: The Part Played
by People in the Flow of Mass Communication. Glencoe, IL: Free Press. Keane, John. 1991. The Media and Democracy. Cambridge: Polity Press. Keane, John. 1992. “The Crisis of the Sovereign State” In Media, Crisis and
Democracy, ed. Marc Raboy and Bernard Dagenais. London: Sage. Kellner, Douglas. 1981. “Network Television and American Society: Introduction to
a Critical Theory of Television” Theory and Society 10:31-62. Kim, Sei-Hill, Dietram Scheufele, and James Shanahan. 2002. “Think About It
This Way: Attribute Agenda-Setting Function of the Press and the Public’s Evaluation of a Local Issue” Journalism & Mass Communication Quarterly 79:7-25.
Kimball, Penn T. and Samuel Lubell. 1960. “1960 High School Students Attitudes
Toward Journalism as a Career” Journalism Quarterly 37:413-422. King, Elliot and Michael Schudson. 1995. “The Press and the Illusion of Public
Opinion: The Strange Case of Ronald Reagan’s ‘Popularity’” in Public Opinion and the Communication of Consent. ed. Theodore L. Glasser and Charles T. Salmon. New York: The Guilford Press.
Kiousis, Spiro, Philemon Bantimaroudis, and Hyun Ban. 1999. “Candidate Image
Attributes: Experiments on the Substantive Dimension of Second Level Agenda Setting” Communication Research 26:414-428.
Klapper, Joseph T. 1960. The Effects of the Mass Media.
Glencoe, IL: The Free Press of Glencoe. Koch, Tom. 1990. The News as Myth: Fact and Context in Journalism.
Westport, CT: Greenwood Press.
360
Kohut, Andrew, ed. 2001. Public Opinion in a Year for the Books. Washington, DC: The Pew Research Center For he People and The Press.
Kraus, Sidney, Elaine El-Assal, and Melvin L. DeFleur. 1966. “Fear-Threat Appeals
in Mass Communication: An Apparent Contradiction” Speech Monographs 33:23-29.
Kristol, Irving. 1972. “Crisis for Journalism: The Missing Elite” in Press, Politics,
and Popular Government. ed. George F. Will. Washington: American Enterprise Institute for Public Policy Research.
Krosnick, Jon A. and Laura A. Brannon. 1993. “The Impact of the Gulf war on the
Ingredients of Presidential Evaluations: Multidimensional Effects of Political Involvement” The American Political Science Review 87:963-975.
Kuklinski, James H. and Lee Sigelman. 1992. “When Objectivity is Not Objective:
Network Television Coverage of U. S. Senators and the ‘Paradox of Objectivity’” The Journal of Politics 54:810-833.
Kull, Steven. 2003. Misperceptions, the Media and the War in Iraq. College Park, MD:
Program on International Policy Attitudes. Kurtz, Howard. 2005. “The Forecast: Overheated, Gusty and Increasingly Bloggy”
The Washington Post February 21, 2005. Kuypers, Jim A. 2002. Press Bias and Politics: How the Media Frame Controversial
Issues. Westport, CT: Praeger. La Russo, Dominic A. 1977. The Shadows of Communication: Nonverbal Dimensions.
Dubuque, IA: Kendall/Hunt Publishing Co. Lang, Annie, John E. Newhagen, and Byron Reeves. 1996. “TV News Images that
Induce Anger, Fear, and Disgust: Effects on Approach-Avoidance and Memory” Journal of Broadcasting & Electronic Media 42:265-276.
Lang, Kurt and Gladys Engel Lang. 1959. “The Mass Media and Voting” in American
Voting Behavior. ed. Eugene Burdick and Arthur J. Brodbeck. Glencoe, IL: Free Press.
Lasorsa, Dominic. 1989. “Real and Perceived Effects of ‘Amerika’”
Journalism Quarterly 66:373-378. Lasswell, Harold D. 1948. “The Structure and Function of Communication in Society”
In The Communication of Ideas, ed. Lyman Bryson. New York: Harper & Bros. Lasswell, Harold D., Daniel Lerner, and Ithiel de Sola Pool. 1970. “The Comparative
361
Study of Symbols: An Introduction,” in The Prestige Press: A Comparative Study of Political Symbols, ed. Ithiel de Sola Pool. Cambridge: The M.I.T. Press.
Law, Steve. 2004. “Hundreds of Same Sex Couples Make History in Multnomah,”
The Statesman Jounal. March 4, 2004: A1. Lazarsfeld, Paul, Bernard Berelson, and Hazel Gaudet. 1948. The People’s Choice.
New York: Columbia University Press. Lee, Martin A. and Norman Solomon. 1990. Unreliable Sources: A Guide to Detecting
Bias in the News Media. New York: Carol Publishing Group. Leff, Donna R., David L. Protess, and Stephen C. Brooks. 1986. “Crusading Journalism:
Changing Public Attitudes and Policy-Making Agendas” The Public Opinion Quarterly 3:300-315.
Leibling, A. J. 1961. The Press. New York: Ballantine Books. Lemmert, James B. 1981. Does Mass Communication Change Public Opinion
After All? Chicago: Nelson-Hall. Leshner, Glenn and Michael L. McKean. 1997. “Using TV News for Political
Information During an Off-Year Election: Effects on Political Knowledge and Cynicism” Journalism & Mass Communication Quarterly 74:69-83.
Lester, Marilyn. 1980. “Generating Newsworthiness: The Interpretive Construction of
Public Events” American Sociological Review 45:984-994. Leuthold, David A. 1994. Campaign Missouri 1992. Columbia, MO:
University of Missouri Press. Levin, David. 2001. “RE: FROM REP. DAVID LEVIN” [one paragraph] October 8, 2001. Personal e-mail. Accessed October 8, 2001. <[email protected]>. Levy, Leonard W. 1960. Legacy of Suppression: Freedom of Speech and Press in Early
American History. Cambridge, MA: Belknap Press of Harvard University Press. Lewin, Kurt. 1947. “Frontiers in Group Dynamics: 11 Channels of Group Life:
Social Planning and Action Research” Human Relations 1:145-146. Lichtenberg, Judith. 1987. “Foundations and Limits of Freedom of the Press”
Philosophy and Public Affairs 16:329-355. Lichter, S. Robert and Linda S. Richter. 2004. “Rating Ronald Reagan”
Media Monitor 18: May/June 2004.
362
Lichter, S. Robert and Stanley Rothman. 1981. “Media and Business Elites”
Public Opinion Oct./Nov. 1981. Lichter, S. Robert, Stanley Rothman, and Linda S. Richter. 1986. The Media Elite.
Bethesda, MD: Adler & Adler. Lieberman, Trudy. 2000. Slanting the Story: The Forces that Shape the News.
New York: The New Press. Liebes, Tamar. 2001. “Inside a News Item: A Dispute over Framing”
Political Communication 17:295-305. Lippmann, Walter. 1949. Public Opinion. New York: Free Press. Long, Norton E. 1958. “The Local Community as an Ecology of Games”
American Journal of Sociology 64:251-261. The Los Angeles Times. 1985. August 12, 1985. Lowery, Shearon and Melvin L. DeFleur. 1983. Milestones in Mass Communication
Research: Media Effects. New York: Longman. Lowry, Dennis T. and Jon A. Shidler. 1995. “The Sound Bites, the Biters, and
the Bitten: An Analysis of Network TV News Bias in Campaign ‘92” Journalism & Mass Communication Quarterly 72:33-44.
Luker, Kristin. 1984. Abortion and the Politics of Motherhood.
Berkeley: University of California Press. MacKuen, Michael. 1984. “Exposure to Information, Belief Integration, and Individual
Responsiveness to Agenda Change” The American Political Science Review 78:372-391.
Malhotra, Naresh K. 1999. Marketing Research: An Applied Orientation. 3rd Ed.
Upper Saddle River, NJ: Prentice-Hall Maraniss, David A. 1981. “Post Reporter’s Pulitzer Prize is Withdrawn”
Washington Post April 18, 1981, p. 1. Marsh, David and Joanna Chambers. 1981. Abortion Politics. London: Junction Books. Martin, Kingsley. 1947. The Press the Public Wants. London: Hogarth Press. Massachusetts Mercury. 1793. January 1, 1793, p. 1.
363
McCarthy, John D., Clark McPhail, and Jackie Smith. 1996. “Images of Protest: Dimensions of Selection Bias in Media Coverage of Washington Demonstrations, 1982 and 1991” American Sociological Review 61:478-499.
McChesney, Robert W. 2003. “The Problem of Journalism: A Political Economic
Contribution to an Explanation of the Crisis in Contemporary US Journalism” Journalism Studies 4:299-329.
McCombs, Maxwell. 1997. “Building Consensus: The News Media’s Agenda-Setting
Roles” Political Communication 14:433-443. McCombs, Maxwell E. and Donald L. Shaw. 1972. “The Agenda-Setting Function
of Mass Media” Public Opinion Quarterly 36:176-187. McGinnies, Elliott and Charles D. Ward. 1974. “Persuasibility as a Function of Source
Credibility and Locus of Control” Journal of Personality 42:360-371. McGraw, Kathleen M. and Christina Ling. 2003. “Media Priming of Presidential and
Group Evaluations” Political Communication 20:23-40. McLeod, Jack M. and Byron Reeves. 1980. “On the Nature of Media Effects” in
Television and Social Behavior: Beyond Violence and Children ed. Stephen B. Withey and Ronald P. Abeles. Hillsdale, NJ: Erlbaum.
McLeod, Jack M, Becker, Lee B. and Joseph E. Burns. 1974. “Another Look at the
Agenda-Setting Function of the Press” Communication Research 1:131-166. McManus, John. 1991. “How Objective is Local Television News?”
Mass Comm Review 17:21-30. McQuail, Denis. 1985. “Sociology of Mass Communication” Annual Review
of Sociology 11:93-111. McReynolds, Edwin C. 1962. Missouri: A History of the Crossroads State.
Norman, OK: University of Oklahoma Press. Mead, George Herbert. 1934. Mind, Self and Society. Chicago: University of
Chicago Press. Mendelsohn, Matthew. 1996. “The Media and Interpersonal Communications:
The Priming of Issues, Leaders, and Party Identification” The Journal of Politics 58:112-125.
Mermin, Jonathan. 1997. “Television News and American Intervention in Somalia:
The Myth of a Media-Driven Foreign Policy” Political Science Quarterly 112:385-403.
364
Merrill, John C. 1996. Existential Journalism. Ames, IA: Iowa State University Press. Merrill, John C. 1996. “The News Media Are Biased” in Media Debates: Issues in
Mass Communication. Everette E. Dennis and John C. Merrill. White Plains, NY: Longman.
Merrill, John Calhoun. 1974. The Imperative of Freedom: A Philosophy of
Journalistic Autonomy. Ontario: Saunders of Toronto, Ltd. Miller, Arthur H. 1974. “Political Issues and Trust in Government: 1964-1970”
The American Political Science Review 68:951-972. Miller, M. Mark, Julie L. Andsager, and Bonnie P. Riechert. 1998. “Framing the
Candidates in Presidential Primaries: Issues and Images in Press Releases and News Coverage” Journalism & Mass Communication Quarterly 75:312-324.
Mills, Judson and Elliott Aronson. 1965. “Opinion Change as a Function of the
Communicator’s Attractiveness and Desire to Influence.” Journal of Personality and Social Psychology 1:173-77.
Moles, Abraham. 1968. Information Theory and Esthetic Perception. Urbana:
University of Illinois Press. Mollenhoff, Clark R. 1968. “Life Line of Democracy” In The Press and the Public
Interest: The William Allen White Lectures. Washington: Public Affairs Press. Montgomery, Douglas C. 1984. Design and Analysis of Experiments. 2nd Ed.
New York: John Wiley & Sons. Morgan, David L. 2002. “Focus Group Interviewing.” In Handbook of
Interview Research. Jaber F. Gubrium and James A. Holstein, eds. Thousand Oaks, CA: Sage.
Moy, Patricia and Dietram A. Scheufele. 2000. “Media Effects on Political and
Social Trust” Journalism & mass Communication Quarterly 77:744-759. Mueller, Sarah Magill. 2001. “Ribbon Controversy” [seven paragraphs] September 28, 2001. Personal e-mail. Accessed: September 28, 2001. <[email protected]>. Mutz, Diana C. and Paul S. Martin. 2001. “Facilitating Communication across Political
Difference: The Role of Mass Media,” American Political Science Review 95 (2001), pp. 97-114.
365
National Conservative Foundation. 1986. “TV Networks and Human Rights” Newswatch August 1986.
National Conservative Foundation. 1986. “Reaganomics” Newswatch March 1987. NBC v. United States. 1943. 319 U. S. 190. Nelson, Thomas E., Rosalee A. Clawson, and Zoe M. Oxley. 1997. “Media Framing of
a Civil Liberties Conflict and Its Effect on Tolerance” The American Political Science Review 91:567-583.
Nelson, Thomas E. and Zoe M. Oxley. “Issue Framing Effects on Belief Importance
and Opinion” The Journal of Politics 61:1040-1067. Nelson, Thomas E., Zoe M. Oxley, and Rosalee A. Clawson. 1997. “Toward a
Psychology of Framing Effects” Political Behavior 19:221-246. Nelson, Thomas E. and Donald R. Kinder. 1996. “Issue Frames and Group-Centrism in
American Public Opinion” The Journal of Politics 58:1055-1078. New York Times. 1897. March 8, 1897, p. 3. Neuman, W. Russell. 1976. “Patterns of Recall Among Television Viewers”
The Public Opinion Quarterly 40:115-123. Neuwirth, Kurt and Edward Frederick. 2002. “Extending the Framework of Third-,
First-, and Second-Person Effects” Mass Communication & Society 2:113-140. Newcomb, Theodore M. 1953. “An Approach to the Study of Communicative Acts”
Psychological Review 60:393-404. Newhagen, John E. and Byron Reeves. 1992. “The Evening’s Bad News: Effects of
Compelling Negative Television News Images on Memory” Journal of Communication 42(2):25-41.
Nickel, James W. 2000. “Free Speech, Democratic Deliberation, and Valuing Types
of Speech” in Deliberation, Democracy, and the Media ed. Simone Chambers and Anne Costain. Lanham, MD: Rowman & Littlefield Publishers, Inc.
Niebuhr, Gustav. 1996. “Public Supports Political Role for Churches.”
The New York Times. June 25: A18, Nimmo, Dan. 1974. Popular Images of Politics. Englewood Cliffs, New Jersey:
Prentice-Hall. Nimmo, Dan and James E. Combs. 1983. Mediated Political Realities.
366
New York: Longman. Niven, David. 2003. “Objective Evidence on Media Bias: Newspaper Coverage of
Congressional Party Switchers” Journalism & Mass Communication Quarterly 80:311-326.
Noelle-Neumann, Elisabeth. 1984. The Spiral of Silence: Public Opinion—Our
Social Skin. Chicago: University of Chicago Press. O’Sullivan, Elizabethann and Gary R. Rassel. 1995. Research Methods for Public Administrators. 2nd Ed. White Plains, NY: Longman. Ognianova, Ekaterina and James W. Endersby. 1996. “Objectivity Revisited:
A Spatial Model of Political Ideology and Mass Communication,” Journalism and Mass Communication Monographs 159 (1996), pp. 1-36.
Osgood, Charles E. 1954. “Psycholinguistics; A Survey of Theory and Research
Problems: Report of the 1953 Summer Seminar Sponsored by the Committee on Linguistics and Psychology of the Social Science Research Council” ed. Charles E. Osgood. Baltimore: Waverly Press.
Oskamp, Stuart. 1977. Attitudes and Opinions. Englewood Cliffs, NJ: Prentice-Hall. Page, Benjamin I. and Robert Y. Shapiro. 1992. The Rational Public: Fifty Years of
Trends in America’s Policy Preferences. Chicago: University of Chicago Press. Page, Benjamin I., Robert Y. Shapiro, and Glenn R. Dempsey. 1984. “Television News
and Changes in Americans’ Policy Preferences” presented at the annual meeting of the Midwest Political Science Association, Chicago, IL.
Page, Benjamin I., Robert Y. Shapiro, and Glenn R. Dempsey. 1987. “What Moves
Public Opinion?” The American Political Science Review 81:23-44. Palmgreen, Philip and Peter Clarke. 1977. “Agenda-Setting with Local and
National Issues” Communication Research 4: 435-452. Pan, Zhongdang and Gerlad M. Kosicki. 1997. “Priming and Media Impact on the
Evaluations of the President’s Performance” Communication Research 24:3-30. Patterson, Thomas E. 1997. “The News Media” An Effective Political Actor?”
Political Communication 14:445-455. Patterson, Thomas E. and Robert D. McClure. 1976. The Unseeing Eye: The Myth of
Television Power in National Politics. New York: G. P. Putnam’s Sons.
367
Payne, George. 1940. History of Journalism in the United States.
New York: D. Appleton-Century Company. Perse, Elizabeth M. 1990. “Media Involvement and Local News Effects” Journal of
Broadcasting & Electronic Media 34:17-36. Peterson, Ruth C. and L. L. Thurstone. 1933. Motion Pictures and Social Attitudes
of Children. New York: The Macmillan Co. Pew Research Center. 2002. Pew Internet and American Life Project. Washington:
Pew Research Center. Pew Research Center. 2005. Trends 2005. Washington: Pew Research Center Ponder, Stephen. 1994. “Presidential Publicity and Executive Power: Woodrow Wilson
and the Centralizing of Government Information” American Journalism 11:257-269.
Pornpitakpan, Chanthika. 2004. “The Persuasiveness of Source Credibility:
A Critical Review of Five Decades’ Evidence.” Journal of Applied Social Psychology 34:243-81.
Potter, W. James. 1994. “Cultivation Theory and Research: A Methodological Critique”
Journalism Monographs 147. Iowa City, IA: The Association for Education in Journalism and Mass Communication.
Powe, Lucas A. Jr. 1987. American Broadcasting and the First Amendment.
Berkeley, CA: University of California Press. Price, Tewksbury, and Powers. 1997. “Switching Trains of Thought: The Impact of
News Frames on Readers’ Cognitive Responses” Communication Research 24:481-506.
Project for Excellence in Journalism. 2005. The State of the News Media 2005.
Accessed April 2, 2005. http://www.stateofthenewsmedia.org/2005/index.asp. Purgason, Chuck. 2001. Untitled E-mail [one paragraph] September 25, 2001. Personal e-mail. Accessed September 25, 2001. <[email protected]>. Putnam, Robert D. 1995. “Bowling Alone: America’s Declining Social Capital”
Journal of Democracy 6:65-78. Radio Television News Directors Association. Code of Ethics.
adopted September 14, 2000 at its convention in Minneapolis, Minnesota.
368
Radio Television News Directors Association. 2004. “Minorities Comprise 21.8 Percent
of Local Television News Staffs” <http://www.rtnda.org/news/2004/071404.shtml>
Radio Television News Directors Foundation. 2000. RTNDF Journalism Ethics and
Integrity Report. Accessed May 30, 2005. http://www.rtnda.org/research/judg.html.
Red Lion Broadcasting v. FCC. 1969. 395 U. S. 367. Reporters Without Borders. 2004. Third Annual Worldwide Press Freedom Index.
26 October, 2004. Accessed 2 February 2005. <http://www.rsf.org/article.php3?id_article=11715>
Rimmerman, Craig A. 2002. From Identity to Politics: The Lesbian and Gay Movement
in the United States. Philadelphia: Temple University Press. Rivers, Williams L. 1962. “The Correspondents After Twenty-Five Years”
Columbia Journalism Review 1:5. Roberts, Marilyn and Maxwell McCombs. 1994. “Agenda Setting and Political
Advertising: Origins of the News Agenda” Political Communication 11:249-262.
Roberts, Marilyn, Wayne Wanta, and Tzong-Horng (Dustin) Dzwo. 2002.
“Agenda Setting and Issue Salience Online” Communication Research 29:452-465.
Robinson, John P. and Mark R. Levy. 1986. The Main Source: Learning from
Television News. Beverly Hills: Sage. Robinson, Michael J. 1976. “Public Affairs Telelvision and the Growth of
Political Malaise: The Case of the ‘Selling of the Pentagon’” The American Political Science Review 70:409-431.
Robinson, Michael J., Maura Clancey, and Lisa Grand. 1983. “With Friends Like
These…” Public Opinion June/July 1983 Robinson, Michael J. and Andrew Kohut. 1988. “Believability and the Press”
The Public Opinion Quarterly 52:174-189. Roper Center for Public Opinion Research, University of Connecticut. 2002.
News Interest Index Poll. Published on-line at roperweb.ropercenter.uconn.edu. Roper Organization. 1977. Changing Public Attitudes Toward Television and Other
369
Mass Media: 1959-1976. New York: Television Information Office. Rosenthal, Robert and Ralph L. Rosnow. 1991. Essentials of Behavioral Research.
2nd Ed. New York: McGraw-Hill. Roston, Leo C. 1937. The Washington Correspondents. New York: Harcourt, Brace. Rothman, Stanley and Amy E. Black. 2001. “Media and Business Elites:
Still in Conflict?” Public Interest 143:72-86. Rothman, Stanley and S. Robert Lichter. 1987. “Elite Ideology and Risk Perception
in Nuclear Energy Policy” The American Political Science Review 81:343-404. Russo, Frank D. 1971. “A Study of Bias in TV Coverage of the Vietnam War:
1969 and 1970” The Public Opinion Quarterly 35:539-543 Rutenbeck, Jeffrey. 1993. “The Stagnation and Decline of Partisan Journalism in
Late Nineteenth-Century America: Changes in the New York World, 1860-76” American Journalism 10:38-60.
Sanders, Keith and L. Atwood. 1979. “Value Change Initiated by the Mass Media”
in Understanding Human Values: Individual and Societal. ed. Milton Rokeach. New York: Free Press.
Sapir, Edward. 1934. "Symbolism," Encyclopaedia of the Social Sciences.
eds. Edwin R. A. Seligman and Alvin Johnson. New York: Macmillan. Schaffner, Brian F., Matthew Streb, and Gerald Wright. 2001. “Teams Without
Uniforms: The Nonpartisan Ballot in State and Local Elections,” Political Research Quarterly (54), pp. 7-30.
Scheufele, Dietram A. 2000. “Agenda-Setting, Priming, and Framing Revisited:
Another Look at Cognitive Effects of Political Communication” Mass Communication & Society 3:297-316.
Schramm, Wilbur L. 1954. The Process and Effects of Mass Communication.
Urbana, IL: The University of Illinois Press. Schudson, Michael. 1995. The Power of News. Cambridge, MA:
Harvard University Press. Sears, David O. 1983. “The Persistence of Early Political Predispositions: The Roles
of Attitude Object and Life Stage” in Review of Personality and Social Psychology, Vol. 4, eds. Ladd Wheeler and Phillip Shaver. Beverly Hills: Sage.
370
Sears, David O. 1993. “Symbolic Politics: A Socio-Psychological Theory” in Explorations in Political Psychology, eds. Shanto Iyengar and William J. McGuire. Durham: Duke University Press.
Shannon, Claude and Warren Weaver. 1949. The Mathematical Theory
of Communication. Urbana, IL: The University of Illinois Press. Shaw, Donald R. and Shannon E. Martin. 1992. “The Function of Mass Media
Agenda Setting” Journalism Quarterly 69:902-920. Shaw, Eugene F. 1977. “The Interpersonal Agenda” in The Emergence of American
Political Issues: The Agenda-Setting Function of the Press. St. Paul, MN: West Publishing Co.
Shelley, Jonathan. 2002. “Legislature fiasco” [two paragraphs] April 7, 2002. Personal e-mail. Accessed April 7, 2002. <[email protected]>. Shoemaker, Pamela J., Martin Eichholz, Eunyi Kim, and Brenda Wrigley. 2001.
“Individual and Routine Forces in Gatekeeping” Journalism & Mass Communication Quarterly 78:233-246.
Siebert, Fred S., Theodore Peterson, and Wilbur Schramm. 1963. Four Theories
of the Press. Urbana, IL: University of Illinois Press. Siegel, Marjorie and Robert Carey. 1989. Critical Thinking: A Semiotic Perspective.
Bloomington: ERIC Clearinghouse. Sloan, Wm. David. 1987. “Party Press and the Freedom of the Press”
American Journalism 4: 82-96. Sloan, Wm. David. 1988. “Scurrility and the Party Press, 1789-1816”
American Journalism 5:97-112. Sloan, Wm. David and Thomas A. Schwartz. 1988. “Freedom of the Press, 1690-1801:
Libertarian or Limited?” American Journalism 5:159-177.
Smith, Anthony. 1978. The Politics of Information: Problems of Policy in Modern Media. London: The MacMillan Press, Ltd.
Smith, Craig Allen. 1990. Political Communication. San Diego:
Harcourt Brace Jovanovich. Smith, Herman. 1991. Strategies of Social Research. 3rd Ed. Fort Worth, TX:
Holt, Rinehart and Winston, Inc.
371
Smith, Ted J. III. 1988. The Vanishing Economy: Television Coverage of Economic Affairs 1982-1987. Washington, DC: Media Institute.
Society of Professional Journalists. SPJ Missions. Society of Professional Journalists. 1996. Code of Ethics. Adopted September 21, 1996
at the SPJ National Convention in Crystal City, Virginia. Sparks, Glenn G. 2002. Media Effects Research: A Basic Overview.
Stamford, CT: Wadsworth. Stamm, Keith and Ric Dube. 1994. “The Relationship of Attitudinal Components to
Trust in Media” Communication Research 21:105-123. Steele, Janet E. 1995. “Experts and the Operational Bias of Television News:
The Case of the Persian Gulf War” Journalism & Mass Communication Quarterly 72:799-812.
Stetson, Dorothy McBride. 2001. “U. S. Abortion Debates 1959-1998: The Women’s
Movement Holds On” in Abortion Politics, Women’s Movements, and the Democratic State. Dorothy McBride Stetson, ed. Oxford: Oxford University Press.
Strouse, James C. 1975. The Mass Media, Public Opinion, and Public Policy Analysis:
Linkage Exploration. Columbus, Ohio: Charles E. Merrill Publishing. Suellentrop, Chris. 2004. “The Show-Me state always picks right in the presidential
campaign. Will 2004 break its streak?” Slate. June 4, 2004. Accessed: January 8, 2005. http://www.slate.com/Default.aspx?id=2101779&
Sullivan, Denis G. and Roger D. Masters. 1993. “Nonverbal Behavior, Emotions, and
Democratic Leadership” in Reconsidering the Democratic Public eds. George E. Marcus and Russell L. Hanson. University Park, Pennsylvania: The Pennsylvania State University Press.
Sunstein, Cass R. 1993. Democracy and the Problem of Free Speech.
New York: Free Press. Sutter, Daniel. 2001. “Can the Media Be So Liberal? The Economics of Media Bias”
Cato Journal 20:431-451. Swan, Wallace. 1997. “Domestic Partners: The Legalization of Alternative Families,”
in Gay/Lesbian/Bisexual/Transgender Public Policy Issues: A Citizen’s and Administrator’s Guide to the New Cultural Struggle ed. by Wallace Swan. New York: The Harrington Park Press.
Tacq, Jacques. 1997. Multivariate Analysis Techniques in Social Science Research:
372
From Problem to Analysis. London: Sage. Tewksbury, David, Jennifer Jones, Matthew W. Peske, Ashlea Raymond, and
William Vig. 2000. “The Interaction of News and Advocate Frames: Manipulating Audience Perceptions of a Local Policy Issue” Journalism & Mass Communication Quarterly 77:804-829.
Thomas, Craig W. 1998. “Maintaining and Restoring Public Trust in Government
Agencies and Their Employees” Administration & Society 30:166-193. Tichenor, Phillip J., George A. Donahue, and Clarice N. Olien. 1970. “Mass Media
Flow and Differential Growth in Knowledge” The Public Opinion Quarterly 34:159-170.
Tiedge, James T., Arthur Silverblatt, Michael J. Havice, and Richard Rosenfeld.
“Discrepency Between Perceived First-Person and Perceived Third-Person Mass Media Effects” Journalism Quarterly 68:141154.
Tuchman, Gaye. 1978. Making News: A Study in the Construction of Reality.
New York: Free Press. Turque, Bill, Howard Fineman, and Clara Bingham. 1992. “Wiring Up the Age
of Technopolitics” Newsweek June 15, 1992, p. 25. U. S. Bureau of Census. 2003. American Community Survey.
Accessed January 9, 2005. http://www.census.gov/acs/www/ Products/Profiles/Single/2003/ACS/US.htm
U. S. Bureau of Census. 2003. American Community Survey-Missouri.
Accessed January 9, 2005. http://www.census.gov/acs/www/ Products/Profiles/Single/2003/ACS/Tabular/040/04000US291.htm
U. S. Electoral College. 2005. Historical Election Results. Accessed: January 8, 2005. http://www.archives.gov/federal_register/electoral_college/historical.html University of Missouri Board of Curators. 2001. “Resolution”
Resolution approved by curators. October 10, 2001. University of Missouri School of Journalism. 2001. “Resolution in Support of KOMU
News Policy Regarding On-Air Wearing of Flag Pins and Ribbons” Resolution approved by faculty. October 2, 2001.
Van Doren, Carl. 1941. Benjamin Franklin. New York: Garden City Publishing. Wagar, Kit. 2005. “Gov. Blunt looks to a smaller government” The Kansas City Star.
373
January 11, 2005. Waldman, Paul and James Devitt. 1998. “Newspaper Photographs and the 1996
Presidential Election: The Question of Bias” Journalism & Mass Communication Quarterly 75:302-311.
Wallace, Richard L. 2001. “MU Chancellor’s Statement on KOMU News Policy”
Statement released to news media and public. October 4, 2001. Wamsley Gary L. and Ricahrd A. Pride. 1972. “Television Network News: Rethinking
the Iceberg Problem” The Western Political Quarterly 25:434-450. Wanta, Wayne and Joe Foote. 1994. “The President-News Media Relationship:
A Time Series Analysis of Agenda-Setting” Journal of Broadcasting & Electronic Media 38:437-448.
Wanta, Wayne and Yu-Wei Hu. 1994 “The Effects of Credibility, Reliance, and
Exposure on Media Agenda-Setting: A Path Analysis Model” Journalism Quarterly 71:90-98.
Wanta, Wayne and Yi-Chen Wu. 1992. “Interpersonal Communication and the
Agenda-Setting Process” Journalism Quarterly 69:847-855. Watts, Mark D., David Domke, Dhavan V. Shah, and David P. Fan. 1999.
“Elite Cues and Media Bias in Presidential Campaigns: Explaining Public Perceptions of a Liberal Press” Communication Research 26:144-175.
Weaver, David. 1994. “Media Agenda Setting and Elections: Voter Involvement
or Alienation?” Political Communication 11:347-356. Weaver, David H. and G. Cleveland Wilhoit. 1986 The American Journalist:
A Portrait of U. S. News People and Their Work. Bloomington, IN: Indiana University Press.
Weaver, David H. and G. Cleveland Wilhoit. 1996. The American Journalist in the
1990s: U. S. News People at the End of an Era. Mahwah, NJ: Lawrence Erlbaum Associates.
West, Darrell M. 2001. The Rise and Fall of the Media Establishment.
Boston: Bedford/St. Martin’s. Westley, Bruce H. and Malcolm S. MacLean, Jr. 1957. “A Conceptual Model for
Communication Research” Journalism Quarterly 34:31-38. White, David M. 1950. “The Gatekeeper: A Case Study in Selection of News”
Journalism Quarterly 27:383-390.
374
Wiener, Norbert. 1948. Cybernetics. New York: John Wiley. Wilkins, Karin Gwinn. 2000. “The Role of the Media in Public Disengagement from
Political Life” Journal of Broadcasting & Electronic Media 44:569-580. Williams, Bruce A. and Michael X. Delli Carpini. 2000. “Unchained Reaction:
The Collapse of Media Gatekeeping and the Clinton-Lewinsky Scandal” Journalism 1:61-85.
Williams, Walter. 1905. The Journalist’s Creed. Woelfel, Stacey W. 1990. “A Turn to the Left? Political Attitude Change
through Journalism Education.” Master of Arts thesis. University of Missouri. Woelfel, Stacey W. 2001 “Patriotic Displays” [two paragraphs] September 17, 2001. Personal e-mail. <[email protected]>. Woelfel, Stacey W. 2001. “RE: Your Email” [two paragraphs] September 24, 2001. Personal e-mail. <[email protected]>. Woelfel, Stacey W. 2001. “RE: Your Email” [eight paragraphs] September 25, 2001. Personal e-mail. <[email protected]>. Wolfson, Lewis W. 1985. The Untapped Power of the Press. New York, NY:
Praeger Publishers. Woliver, Laura R. 1996. “Rhetoric and Symbols in American Abortion Politics”
in Abortion Politics: Public Policy in Cross-Cultural Perspective. Ed. By Marianne Githens and Dorothy McBride Stetson. New York: Routledge.
Woodward, Gary C. 1997. Perspective on American Political Media. Boston:
Allyn and Bacon. WorldNetDaily. 2004. DC Journalists Favor Kerry 12 to 1: N.Y. Times Informal Poll
Confirms Media Lean Left. August 3, 2004. Accessed February 12, 2005. <http://www.worldnetdaily.com/news/article.asp?ARTICLE_ID=39754>
Wortman, Tunis. 1800. Treatise, Concerning Political Enquiry, and the Liberty
of the Press. New York: George Forman. Yalof, David A. and Kenneth Dautrich. 2002. The First Amendment and the Media
in the Court of Public Opinion. Cambridge: Cambridge University Press. Yanovitzky, Itzhak. 2002. “Effects of News Coverage on Policy Attention and Actions:
A Closer Look Into the Media-Policy Connection” Communication Research 29:422-451.
375
Zhu, Jian-Hua. 1992. “Issue Competition and Attention Distraction: A Zero-Sum Theory of Agenda-Setting” Journalism Quarterly 69:825-836.
376
VITA
Stacey Woelfel earned a Bachelor of Journalism degree from the University of
Missouri School of Journalism in 1981. He worked at the NBC affiliate in Orlando,
Florida as a news photographer and assignment editor. In 1986, he joined the faculty of
the Missouri School of Journalism. He earned his Master of Arts degree from the
Department of Political Science in 1990.
In addition to teaching, Woelfel is the news director of KOMU-TV, the NBC
affiliate and teaching laboratory for the Missouri School of Journalism. He has won a
national Edward R. Murrow award for journalistic excellence, a Payne Award for ethics,
and a regional Emmy award for newsroom achievement.


