Embed Size (px)
Citation preview
Cancer Detection and Prevention 27 (2003) 37–46
Suppression of mammary gland tumorigenesis in diabetic rats
Claudia Cocca, MSca, Alicia Gutiérrez, MSca, Mariel Núñez, MSca, Máximo Croci, MDb,Gabriela Mart́ın, PhDa, Graciela Cricco, PhDa, Elena Rivera, PhDa, Rosa Bergoc, PhDa,∗
a Radioisotopes Laboratory, School of Pharmacy and Biochemistry, University of Buenos Aires, Jun´ın, Buenos Aires 956-1113, Argentinab Institute of Immunooncology Dr. EJV Crescenti, Buenos Aires, Argentina
Accepted 13 September 2002
Abstract
The aim of this study was to compare mammary gland tumorigenesis in diabetic and non-diabetic rats. Streptozotocin andN-nitroso-N-methylurea were used to induce diabetes and mammary tumors, respectively. A suppression of mammary carcinogenesis in diabetic rats wasshown by a longer latency period, a lower number of tumors per animal and a smaller final tumor volume. An 84% of the lesions developedin diabetic animals were benign tumors. Eighty day-old diabetic rats had significantly lower plasma levels of total-IGF-I and insulin versusnon-diabetic rats. We postulate that the decrease in the total IGF-I and insulin levels during the promotion phase of carcinogenesis in thismodel plays an important role in retarding the tumor development in diabetic animals and in favoring the development of benign mammarylesions.© 2002 International Society for Preventive Oncology. Published by Elsevier Science Ltd. All rights reserved.
Keywords:Mammary tumors; Multistep carcinogenesis; Rats; IGF-I; Insulin; Diabetes
1. Introduction
Mammary tumorigenesis is a complex and multisequen-tial process in which hormones, growth factors and otheroncogen products and proteins are involved[1–3]. The ma-jor contributor to the development and growth of tumors isthe deregulated cellular proliferation.
Clinical observation in patients bearing breast cancer andnon-insulin-dependent diabetes showed a longer survivaltime and a lower number of metastases and recurrencesthan their non-diabetics peers[4–6]. These patients weretreated with hypoglycemic drugs in association with tamox-ifen (TAM) as antitumoral agent[4].
Heuson and Legros[7] and Cohen and Hilf[8] hadreported the importance of glucose requirements for tu-mor growth in rats bearing mammary tumors inducedby 7,12-dimethylbenz(a)anthracene (DMBA). It is knownthat insulin, insulin-like growth factors (IGFs) and theircorresponding receptors (IGF-IR and IGF-IIR) play animportant role in stimulating growth and proliferation ofnormal and neoplastic mammary cells[9–12] and that TAMdown-regulates insulin-like growth factor type-I (IGF-I) ex-
∗ Corresponding author. Tel.:+54-11-4964-8277/4743-2857;fax: +54-11-4964-8202/4743-2857.E-mail addresses:[email protected], [email protected](R. Bergoc).
pression in plasma and tissues[13]. Plasma IGFs and theircorresponding binding proteins are modified in diabeticpatients[14–16] but these variations have not been studiedwhen both pathologies, diabetes and cancer, coexist. Patho-logical changes in cell growth and differentiation observedin diabetic tissue are dynamically governed at least in partby IGFs. Studies in diabetic patients have demonstratedabnormalities in the IGF system regulation[17,18].
Estrogens play a crucial role in mammary carcinogenesisacting through their specific receptor proteins (ER)[19,20],with the subsequent activation of genes related to cell prolif-eration as the proto-oncogen c-fos and c-jun [21]. Besides,the cellular proliferation antigen (PCNA) is a nuclear pro-tein related to cell cycle and its expression is involved incellular proliferation[22,23] and for this reason the PCNAexpression is used as a proliferation marker[22].
The neoplastic processes in diabetic patients and the be-havior of IGFs in such conditions have not been sufficientlyinvestigated and prompted us to develop an experimentalmodel in the rat to explore certain biological characteristicsof mammary neoplasia in diabetic animals. The objectiveof this paper was to study the mammary gland tumorigene-sis in diabetic versus non-diabetic rats. The comparisons in-cluded: (1) the endpoints of mammary tumor development;(2) the histopathology of developed tumors; and (3) the in-sulin and IGF-I levels in plasma of rats; (4) the c-fos andPCNA expression in palpable tumors.
0361-090X/02/$30.00 © 2002 International Society for Preventive Oncology. Published by Elsevier Science Ltd. All rights reserved.PII: S0361-090X(02)00130-7

38 C. Cocca et al. / Cancer Detection and Prevention 27 (2003) 37–46
2. Materials and methods
2.1. Reagents
N-nitroso-N-methylurea (NMU) was synthesized in ourlaboratory as described previously[24]. Streptozotocin(STZ) and citrate buffer pH 4.8 were purchased fromSigma (St. Louis, Missouri, USA); the reagents for IGF-Iwere purchased from Diagnostic Systems Laboratories Inc.(Texas, USA) and the one for insulin radioimmunoassay(RIA) from International CIS (France). A blood glucosemicromethod (Glucometer Gx, Ames SA, Argentina) wasused to determine glucose levels. Immunohistochemicalreagents utilized were: a mouse IgM monoclonal anti c-fosfrom Novocastra Laboratories (USA) and a mouse IgGmonoclonal anti-proliferative cell nuclear antigen (PCNA)from Dako Laboratories (USA); the second antibody forboth reactions was purchased from BioGenex Labora-tories SA (USA) (biotinylate anti-immunoglobuline andstreptavidine-peroxidase). The Tissue-Tek®OCT (optimalcutting temperature) compound utilized to facilitate thecutting of cryopreserved tumor pieces (10.24% polyvinylalcohol, 4.26% polyethylene glycol and 85.5% non-reactiveingredient) was purchased from Miles Inc., Elkart, USA.The diaminobenzidine tetrahydrochloride (DAB) tabletswere purchased from Sigma (St. Louis, Missouri, USA); ad-hesive for tumor samples was from Abbot, North Chicago,USA. Other reagents utilized were of analytical grade.
2.2. Animals
Female Sprague–Dawley rats from National University ofLa Plata, Division of Animal Production, Argentina, wererandomly separated into batches and housed in stainlesssteel cages with water and food ad libitum, temperature at22–23◦C, humidity at roughly 56% and 12 h light cycle. Inall the cases, the animals were maintained in the conditionsrecommended by the Guide for the Care and Use of Labo-ratory Animals, National Research Council[25].
2.3. Diabetes induction
On the second day of life, rats were injected ip with90 mg/kg STZ in 0.09 M citrate buffer pH 4.8, according toWeir et al. method[26]. At day 45 all rats were subjected toglucose tolerance test (GTT) as previously reported[27,28]and animals showing abnormal GTT were selected for dia-betic rat groups. In total, 20 normal and 20 diabetic femaleanimals were utilized. At day 200 of age all 20 diabetic ratswere again subjected to GTT.
2.4. Tumor induction
Four groups of ten rats each were used: (1) non-diabetic/NMU-treated group (three injections of NMU at 50, 80
and 110 days of age as previously described[24]); (2)non-diabetic/NMU-untreated group; (3) STZ (diabetic/NMU-treated group); and (4) STZ (diabetic/NMU-untreatedgroup). All NMU-treated rats were palpated three times aweek up to 150 days after first NMU injection to detectmammary tumors. All tumors were measured with a caliperto monitor their growth.
2.5. Parameters recorded
To evaluate mammary tumor development, the followingparameters were determined:Latency period(LP), as thenumber of days between the first NMU injection and theappearance of the first tumor in each rat;Tumor number perrat (n/r), as the average number of tumors developed perrat; Total tumor number, as the total number of tumors de-veloped per group;Tumor incidence(TI), as the percentageof rats that developed at least one tumor.Tumor volume wascalculated using the formula 4/3�r3; each value ofr wasthe average of half of the longest and the shortest tumordiameters.Tumor histologywas analyzed according to theclassification of rat mammary tumors defined by Russo andco-workers[29,30].
In all the animals two biochemical parameters were de-termined: total IGF-I (tIGF-I) and insulin plasma levels.Blood samples were obtained from the tail of rats andplasma from animals at 50, 80 and 110 days of age wasfrozen to measure the insulin and the IGF-I levels by ra-dioimmunoassay (RIA). The RIA tIGF-I determinationincluded an acid–ethanol extraction.
2.6. Histopathological studies
At day 150 after first NMU injection, mammary tumorsand pancreas from all animals were removed for microscopicexamination. Specimens of tumors and pancreas were fixedin 10% formaldehyde, embedded in paraffin and stainedwith hematoxylin-eosin (HE). Also, specimens from pan-creas were fixed in Bouin fixative solution, embedded inparaffin and stained with Gomori trichromic for the specificobservation of alpha and beta pancreatic cells[31]. Alphacells invariably were located in the peripheral regions of theLangerhans islets and stained purple red. In contrast, betacells that conformed the 80% of the cellular islet popula-tion were located centrally in the islets; these cells stainedin pink with Gomori technique. Serial sections of the wholepancreas of each rat were examined to evaluate the numberand extension of islets.
2.7. Immunohistochemical studies
2.7.1. c-fosSamples from five malignant tumors from non-diabetic/
NMU-treated and five benign tumors from STZ/NMU-treatedrats were immediately fixed in 3.7% formaldehyde prepared
C. Cocca et al. / Cancer Detection and Prevention 27 (2003) 37–46 39
in 0.01 M PBS, pH 7.4; then they were placed in sucrose0.6 M for 12 h, frozen and stored at−20◦C. After that thespecimens were included with optimal cutting temperaturecompound in the cryostat and sectioned in 5�m thick.Cryostat sections were collected onto poly-l-lysine tissueadhesive. Slides were then rinsed for 5 min in a PBS bathand dehydrated through passages in alcohol until 100%.Sections were then post-fixed in methanol/H2O2 for 30 minand subsequently rehydrated washing from alcohol 100%to distilled water for 5 min each, and with PBS (2× 5 min).The slides were then incubated at room temperature withnormal goat serum (30 min) and at 4◦C overnight in asealed humid chamber with monoclonal anti-fos antibody(dilution 1:20). Following this the slides were washed inPBS and incubated for 1 h with the second biotinylate anti-body in humid chamber, washed in PBS and covered withstreptavidine-peroxidase for 1 h at room temperature (di-lution 1:20). After washing with PBS (3× 5 min) signaldetection was carried out using DAB reagent. Then theslides were washed in distilled water (5× 2 min) and driedat 60◦C. Finally, slides were covered using non-aqueousmountant.
2.7.2. PCNASamples from five malignant tumors from non-diabetic/
NMU-treated rats and five benign tumors from STZ/NMU-treated rats were fixed for 24 h in 3.7% formaldehyde pre-pared in 0.01 M PBS, pH 7.4, and embedded in paraffin.Slices were cut with a microtome and then deparaffinedheating for 10 min at 60◦C, washed with xylene (30–40◦C)and rehydrated from alcohol 100% to distilled water (10 mineach). Then, slides were heated in a microwave oven(2 × 2 min), immersed in buffer citrate, pH 6.0. Further,slides were set at room temperature for 30 min and twicefor 10 min each time (2× 10 min) in PBS. The slides werethen incubated at room temperature with normal goat serum(30 min) and incubated at 4◦C overnight in a sealed humidchamber with primary antibody diluted with PBS and 4%normal serum (dilution 1:60). Following incubation withthe primary antibody the slides were washed with PBS(3× 10 min), incubated with the secondary biotinylate anti-body in humid chamber for 60 min (dilution 1:60), rinsed inPBS (3×10 min) and covered with streptavidine-peroxidasefor 1 h at room temperature (dilution 1:20). After bufferwashing (3× 5 min) signal detection was carried out us-ing DAB substrate kit; ten slides were washed in distilledwater (5× 2 min) and dried at 60◦C. Finally, slides werecoverslipped using non-aqueous mountant.
2.7.3. Statistical analysisStatistical significance of LP and n/r was processed by
Mann–Whitney test[32]. TI was compared byχ2 test[32].Mean±S.D. value of c-fosand PCNA expression was com-pared by Mann–Whitney test. Glucose tolerance curves andradioimmunoassay data were expressed by means± S.E.M.
and statistical significance was calculated by no balanced
Table 1Glucose-tolerance test in diabetic rats 45 days after STZ injection
Time (min) Glucose non-diabeticrats (mg/dl)
Glucose STZ-injectedrats (mg/dl)
0 79 ± 6 101± 930 255± 16 198± 2860 131± 21 226± 22
120 71± 16 165± 15
Mean ± S.D. serum glucose levels (mg/dl) of non-diabetic andSTZ-injected rats at 0, 30, 60 and 120 min after ip 2g/kg BW injectionof glucose, respectively (P < 0.001, two-way ANOVA and Tukey test,at 60 and 120 min).
two-way ANOVA and Tukey post-test[33]; this analysis wasperformed with SPSS 7.5 software.
3. Results
3.1. Diabetes induction
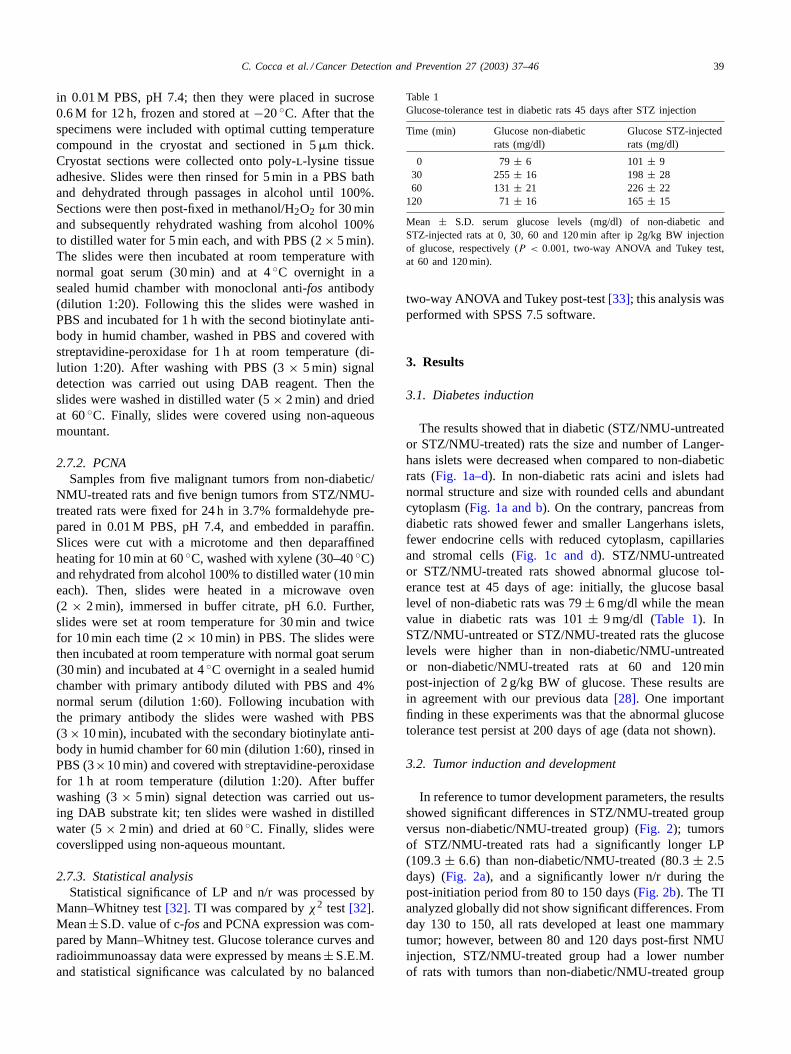
The results showed that in diabetic (STZ/NMU-untreatedor STZ/NMU-treated) rats the size and number of Langer-hans islets were decreased when compared to non-diabeticrats (Fig. 1a–d). In non-diabetic rats acini and islets hadnormal structure and size with rounded cells and abundantcytoplasm (Fig. 1a and b). On the contrary, pancreas fromdiabetic rats showed fewer and smaller Langerhans islets,fewer endocrine cells with reduced cytoplasm, capillariesand stromal cells (Fig. 1c and d). STZ/NMU-untreatedor STZ/NMU-treated rats showed abnormal glucose tol-erance test at 45 days of age: initially, the glucose basallevel of non-diabetic rats was 79± 6 mg/dl while the meanvalue in diabetic rats was 101± 9 mg/dl (Table 1). InSTZ/NMU-untreated or STZ/NMU-treated rats the glucoselevels were higher than in non-diabetic/NMU-untreatedor non-diabetic/NMU-treated rats at 60 and 120 minpost-injection of 2 g/kg BW of glucose. These results arein agreement with our previous data[28]. One importantfinding in these experiments was that the abnormal glucosetolerance test persist at 200 days of age (data not shown).
3.2. Tumor induction and development
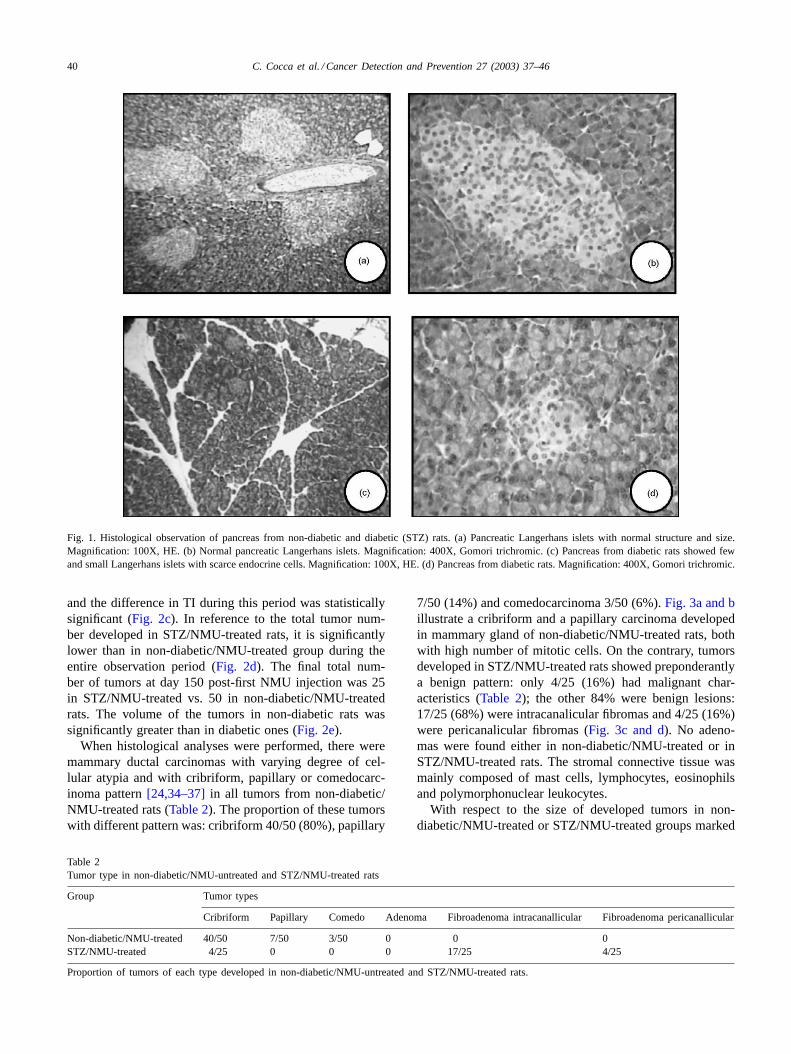
In reference to tumor development parameters, the resultsshowed significant differences in STZ/NMU-treated groupversus non-diabetic/NMU-treated group) (Fig. 2); tumorsof STZ/NMU-treated rats had a significantly longer LP(109.3 ± 6.6) than non-diabetic/NMU-treated (80.3 ± 2.5days) (Fig. 2a), and a significantly lower n/r during thepost-initiation period from 80 to 150 days (Fig. 2b). The TIanalyzed globally did not show significant differences. Fromday 130 to 150, all rats developed at least one mammarytumor; however, between 80 and 120 days post-first NMUinjection, STZ/NMU-treated group had a lower numberof rats with tumors than non-diabetic/NMU-treated group
40 C. Cocca et al. / Cancer Detection and Prevention 27 (2003) 37–46
Fig. 1. Histological observation of pancreas from non-diabetic and diabetic (STZ) rats. (a) Pancreatic Langerhans islets with normal structure andsize.Magnification: 100X, HE. (b) Normal pancreatic Langerhans islets. Magnification: 400X, Gomori trichromic. (c) Pancreas from diabetic rats showed fewand small Langerhans islets with scarce endocrine cells. Magnification: 100X, HE. (d) Pancreas from diabetic rats. Magnification: 400X, Gomori trichromic.
and the difference in TI during this period was statisticallysignificant (Fig. 2c). In reference to the total tumor num-ber developed in STZ/NMU-treated rats, it is significantlylower than in non-diabetic/NMU-treated group during theentire observation period (Fig. 2d). The final total num-ber of tumors at day 150 post-first NMU injection was 25in STZ/NMU-treated vs. 50 in non-diabetic/NMU-treatedrats. The volume of the tumors in non-diabetic rats wassignificantly greater than in diabetic ones (Fig. 2e).
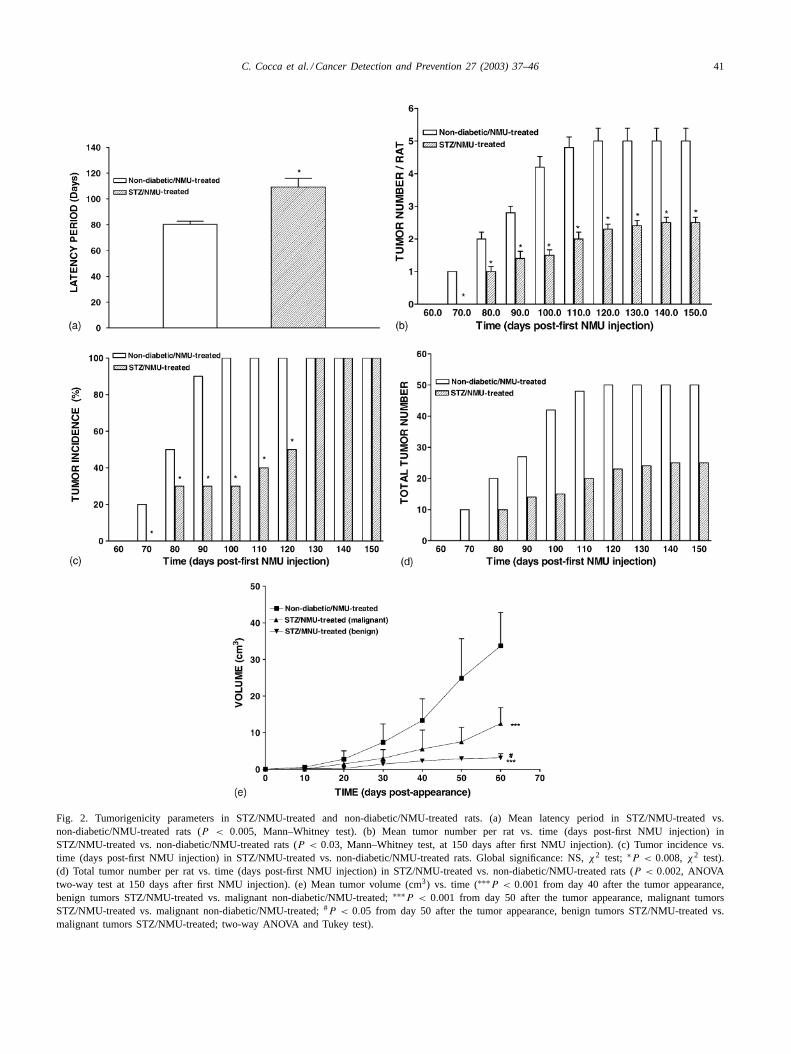
When histological analyses were performed, there weremammary ductal carcinomas with varying degree of cel-lular atypia and with cribriform, papillary or comedocarc-inoma pattern[24,34–37]in all tumors from non-diabetic/NMU-treated rats (Table 2). The proportion of these tumorswith different pattern was: cribriform 40/50 (80%), papillary
Table 2Tumor type in non-diabetic/NMU-untreated and STZ/NMU-treated rats
Group Tumor types
Cribriform Papillary Comedo Adenoma Fibroadenoma intracanallicular Fibroadenoma pericanallicular
Non-diabetic/NMU-treated 40/50 7/50 3/50 0 0 0STZ/NMU-treated 4/25 0 0 0 17/25 4/25
Proportion of tumors of each type developed in non-diabetic/NMU-untreated and STZ/NMU-treated rats.
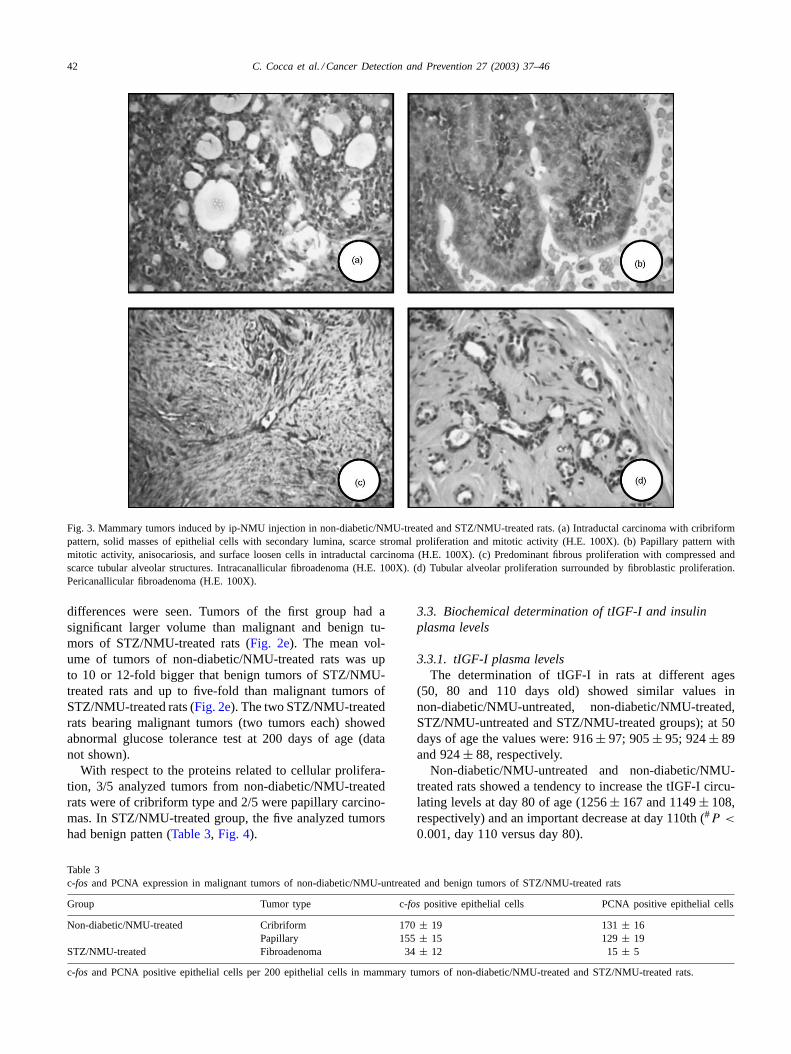
7/50 (14%) and comedocarcinoma 3/50 (6%).Fig. 3a and billustrate a cribriform and a papillary carcinoma developedin mammary gland of non-diabetic/NMU-treated rats, bothwith high number of mitotic cells. On the contrary, tumorsdeveloped in STZ/NMU-treated rats showed preponderantlya benign pattern: only 4/25 (16%) had malignant char-acteristics (Table 2); the other 84% were benign lesions:17/25 (68%) were intracanalicular fibromas and 4/25 (16%)were pericanalicular fibromas (Fig. 3c and d). No adeno-mas were found either in non-diabetic/NMU-treated or inSTZ/NMU-treated rats. The stromal connective tissue wasmainly composed of mast cells, lymphocytes, eosinophilsand polymorphonuclear leukocytes.
With respect to the size of developed tumors in non-diabetic/NMU-treated or STZ/NMU-treated groups marked
C. Cocca et al. / Cancer Detection and Prevention 27 (2003) 37–46 41
Fig. 2. Tumorigenicity parameters in STZ/NMU-treated and non-diabetic/NMU-treated rats. (a) Mean latency period in STZ/NMU-treated vs.non-diabetic/NMU-treated rats (P < 0.005, Mann–Whitney test). (b) Mean tumor number per rat vs. time (days post-first NMU injection) inSTZ/NMU-treated vs. non-diabetic/NMU-treated rats (P < 0.03, Mann–Whitney test, at 150 days after first NMU injection). (c) Tumor incidence vs.time (days post-first NMU injection) in STZ/NMU-treated vs. non-diabetic/NMU-treated rats. Global significance: NS,χ2 test; ∗P < 0.008, χ2 test).(d) Total tumor number per rat vs. time (days post-first NMU injection) in STZ/NMU-treated vs. non-diabetic/NMU-treated rats (P < 0.002, ANOVAtwo-way test at 150 days after first NMU injection). (e) Mean tumor volume (cm3) vs. time (∗∗∗P < 0.001 from day 40 after the tumor appearance,benign tumors STZ/NMU-treated vs. malignant non-diabetic/NMU-treated;∗∗∗P < 0.001 from day 50 after the tumor appearance, malignant tumorsSTZ/NMU-treated vs. malignant non-diabetic/NMU-treated;#P < 0.05 from day 50 after the tumor appearance, benign tumors STZ/NMU-treated vs.malignant tumors STZ/NMU-treated; two-way ANOVA and Tukey test).
42 C. Cocca et al. / Cancer Detection and Prevention 27 (2003) 37–46
Fig. 3. Mammary tumors induced by ip-NMU injection in non-diabetic/NMU-treated and STZ/NMU-treated rats. (a) Intraductal carcinoma with cribriformpattern, solid masses of epithelial cells with secondary lumina, scarce stromal proliferation and mitotic activity (H.E. 100X). (b) Papillary pattern withmitotic activity, anisocariosis, and surface loosen cells in intraductal carcinoma (H.E. 100X). (c) Predominant fibrous proliferation with compressed andscarce tubular alveolar structures. Intracanallicular fibroadenoma (H.E. 100X). (d) Tubular alveolar proliferation surrounded by fibroblastic proliferation.Pericanallicular fibroadenoma (H.E. 100X).
differences were seen. Tumors of the first group had asignificant larger volume than malignant and benign tu-mors of STZ/NMU-treated rats (Fig. 2e). The mean vol-ume of tumors of non-diabetic/NMU-treated rats was upto 10 or 12-fold bigger that benign tumors of STZ/NMU-treated rats and up to five-fold than malignant tumors ofSTZ/NMU-treated rats (Fig. 2e). The two STZ/NMU-treatedrats bearing malignant tumors (two tumors each) showedabnormal glucose tolerance test at 200 days of age (datanot shown).
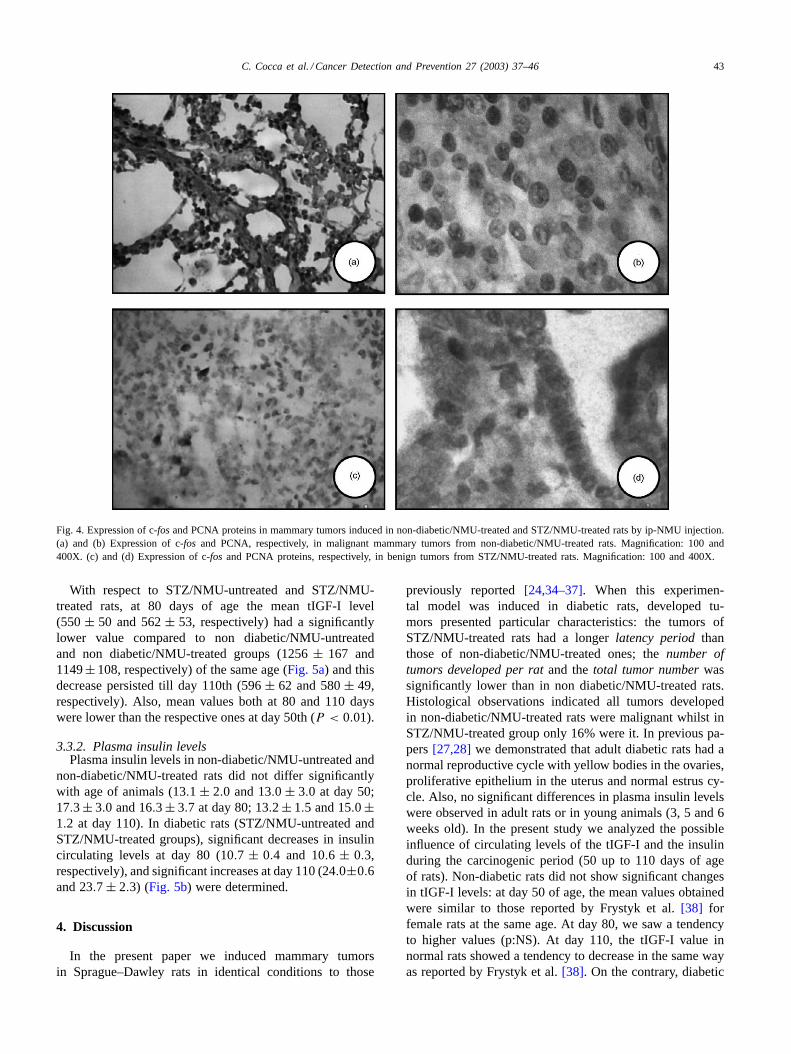
With respect to the proteins related to cellular prolifera-tion, 3/5 analyzed tumors from non-diabetic/NMU-treatedrats were of cribriform type and 2/5 were papillary carcino-mas. In STZ/NMU-treated group, the five analyzed tumorshad benign patten (Table 3, Fig. 4).
Table 3c-fos and PCNA expression in malignant tumors of non-diabetic/NMU-untreated and benign tumors of STZ/NMU-treated rats
Group Tumor type c-fos positive epithelial cells PCNA positive epithelial cells
Non-diabetic/NMU-treated Cribriform 170± 19 131± 16Papillary 155± 15 129± 19
STZ/NMU-treated Fibroadenoma 34± 12 15± 5
c-fos and PCNA positive epithelial cells per 200 epithelial cells in mammary tumors of non-diabetic/NMU-treated and STZ/NMU-treated rats.
3.3. Biochemical determination of tIGF-I and insulinplasma levels
3.3.1. tIGF-I plasma levelsThe determination of tIGF-I in rats at different ages
(50, 80 and 110 days old) showed similar values innon-diabetic/NMU-untreated, non-diabetic/NMU-treated,STZ/NMU-untreated and STZ/NMU-treated groups); at 50days of age the values were: 916± 97; 905± 95; 924± 89and 924± 88, respectively.
Non-diabetic/NMU-untreated and non-diabetic/NMU-treated rats showed a tendency to increase the tIGF-I circu-lating levels at day 80 of age (1256± 167 and 1149± 108,respectively) and an important decrease at day 110th (#P <
0.001, day 110 versus day 80).
C. Cocca et al. / Cancer Detection and Prevention 27 (2003) 37–46 43
Fig. 4. Expression of c-fosand PCNA proteins in mammary tumors induced in non-diabetic/NMU-treated and STZ/NMU-treated rats by ip-NMU injection.(a) and (b) Expression of c-fos and PCNA, respectively, in malignant mammary tumors from non-diabetic/NMU-treated rats. Magnification: 100 and400X. (c) and (d) Expression of c-fos and PCNA proteins, respectively, in benign tumors from STZ/NMU-treated rats. Magnification: 100 and 400X.
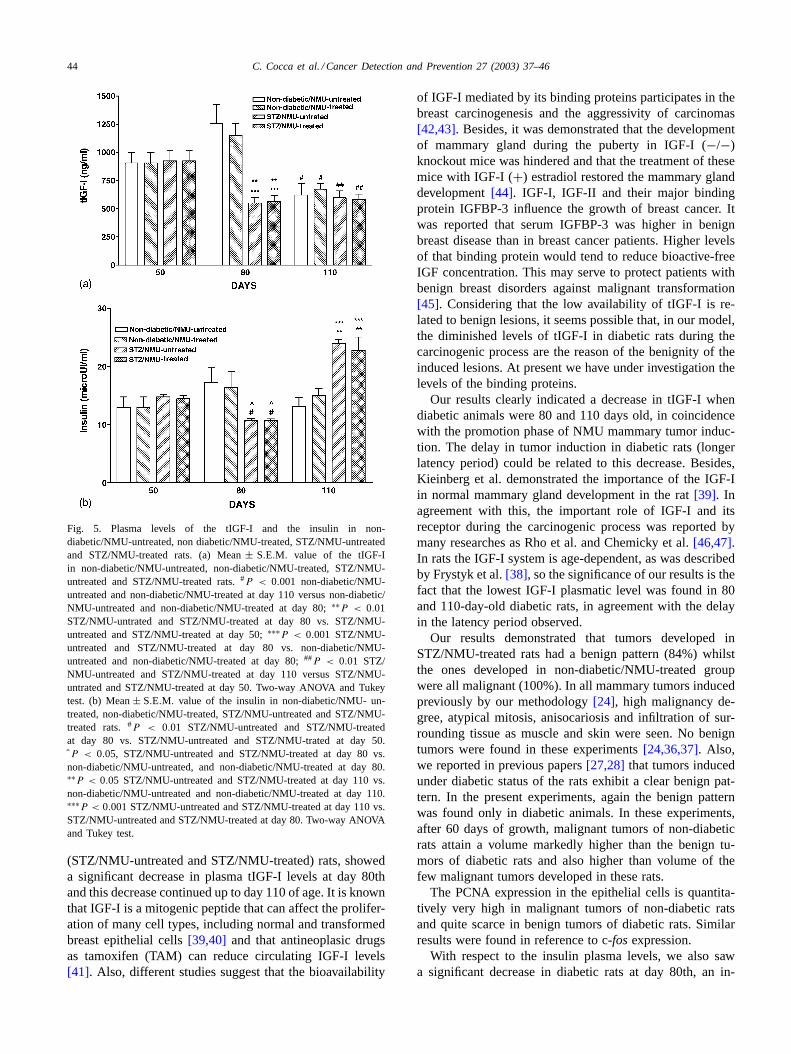
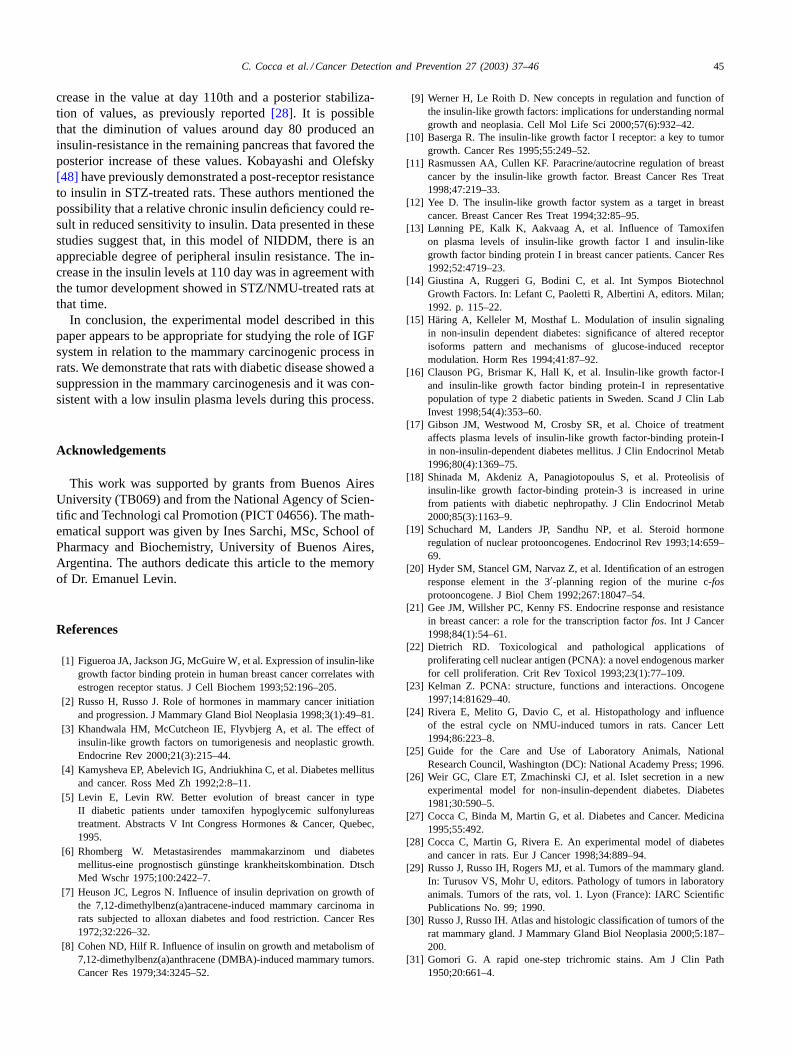
With respect to STZ/NMU-untreated and STZ/NMU-treated rats, at 80 days of age the mean tIGF-I level(550± 50 and 562± 53, respectively) had a significantlylower value compared to non diabetic/NMU-untreatedand non diabetic/NMU-treated groups (1256± 167 and1149± 108, respectively) of the same age (Fig. 5a) and thisdecrease persisted till day 110th (596± 62 and 580± 49,respectively). Also, mean values both at 80 and 110 dayswere lower than the respective ones at day 50th (P < 0.01).
3.3.2. Plasma insulin levelsPlasma insulin levels in non-diabetic/NMU-untreated and
non-diabetic/NMU-treated rats did not differ significantlywith age of animals (13.1 ± 2.0 and 13.0 ± 3.0 at day 50;17.3± 3.0 and 16.3± 3.7 at day 80; 13.2± 1.5 and 15.0±1.2 at day 110). In diabetic rats (STZ/NMU-untreated andSTZ/NMU-treated groups), significant decreases in insulincirculating levels at day 80 (10.7 ± 0.4 and 10.6 ± 0.3,respectively), and significant increases at day 110 (24.0±0.6and 23.7 ± 2.3) (Fig. 5b) were determined.
4. Discussion
In the present paper we induced mammary tumorsin Sprague–Dawley rats in identical conditions to those
previously reported[24,34–37]. When this experimen-tal model was induced in diabetic rats, developed tu-mors presented particular characteristics: the tumors ofSTZ/NMU-treated rats had a longerlatency periodthanthose of non-diabetic/NMU-treated ones; thenumber oftumors developed per ratand thetotal tumor numberwassignificantly lower than in non diabetic/NMU-treated rats.Histological observations indicated all tumors developedin non-diabetic/NMU-treated rats were malignant whilst inSTZ/NMU-treated group only 16% were it. In previous pa-pers[27,28] we demonstrated that adult diabetic rats had anormal reproductive cycle with yellow bodies in the ovaries,proliferative epithelium in the uterus and normal estrus cy-cle. Also, no significant differences in plasma insulin levelswere observed in adult rats or in young animals (3, 5 and 6weeks old). In the present study we analyzed the possibleinfluence of circulating levels of the tIGF-I and the insulinduring the carcinogenic period (50 up to 110 days of ageof rats). Non-diabetic rats did not show significant changesin tIGF-I levels: at day 50 of age, the mean values obtainedwere similar to those reported by Frystyk et al.[38] forfemale rats at the same age. At day 80, we saw a tendencyto higher values (p:NS). At day 110, the tIGF-I value innormal rats showed a tendency to decrease in the same wayas reported by Frystyk et al.[38]. On the contrary, diabetic
44 C. Cocca et al. / Cancer Detection and Prevention 27 (2003) 37–46
Fig. 5. Plasma levels of the tIGF-I and the insulin in non-diabetic/NMU-untreated, non diabetic/NMU-treated, STZ/NMU-untreatedand STZ/NMU-treated rats. (a) Mean± S.E.M. value of the tIGF-Iin non-diabetic/NMU-untreated, non-diabetic/NMU-treated, STZ/NMU-untreated and STZ/NMU-treated rats.#P < 0.001 non-diabetic/NMU-untreated and non-diabetic/NMU-treated at day 110 versus non-diabetic/NMU-untreated and non-diabetic/NMU-treated at day 80;∗∗P < 0.01STZ/NMU-untrated and STZ/NMU-treated at day 80 vs. STZ/NMU-untreated and STZ/NMU-treated at day 50;∗∗∗P < 0.001 STZ/NMU-untreated and STZ/NMU-treated at day 80 vs. non-diabetic/NMU-untreated and non-diabetic/NMU-treated at day 80;##P < 0.01 STZ/NMU-untreated and STZ/NMU-treated at day 110 versus STZ/NMU-untrated and STZ/NMU-treated at day 50. Two-way ANOVA and Tukeytest. (b) Mean± S.E.M. value of the insulin in non-diabetic/NMU- un-treated, non-diabetic/NMU-treated, STZ/NMU-untreated and STZ/NMU-treated rats.#P < 0.01 STZ/NMU-untreated and STZ/NMU-treatedat day 80 vs. STZ/NMU-untreated and STZ/NMU-trated at day 50.ˆP < 0.05, STZ/NMU-untreated and STZ/NMU-treated at day 80 vs.non-diabetic/NMU-untreated, and non-diabetic/NMU-treated at day 80.∗∗P < 0.05 STZ/NMU-untreated and STZ/NMU-treated at day 110 vs.non-diabetic/NMU-untreated and non-diabetic/NMU-treated at day 110.∗∗∗P < 0.001 STZ/NMU-untreated and STZ/NMU-treated at day 110 vs.STZ/NMU-untreated and STZ/NMU-treated at day 80. Two-way ANOVAand Tukey test.
(STZ/NMU-untreated and STZ/NMU-treated) rats, showeda significant decrease in plasma tIGF-I levels at day 80thand this decrease continued up to day 110 of age. It is knownthat IGF-I is a mitogenic peptide that can affect the prolifer-ation of many cell types, including normal and transformedbreast epithelial cells[39,40] and that antineoplasic drugsas tamoxifen (TAM) can reduce circulating IGF-I levels[41]. Also, different studies suggest that the bioavailability
of IGF-I mediated by its binding proteins participates in thebreast carcinogenesis and the aggressivity of carcinomas[42,43]. Besides, it was demonstrated that the developmentof mammary gland during the puberty in IGF-I (−/−)knockout mice was hindered and that the treatment of thesemice with IGF-I (+) estradiol restored the mammary glanddevelopment[44]. IGF-I, IGF-II and their major bindingprotein IGFBP-3 influence the growth of breast cancer. Itwas reported that serum IGFBP-3 was higher in benignbreast disease than in breast cancer patients. Higher levelsof that binding protein would tend to reduce bioactive-freeIGF concentration. This may serve to protect patients withbenign breast disorders against malignant transformation[45]. Considering that the low availability of tIGF-I is re-lated to benign lesions, it seems possible that, in our model,the diminished levels of tIGF-I in diabetic rats during thecarcinogenic process are the reason of the benignity of theinduced lesions. At present we have under investigation thelevels of the binding proteins.
Our results clearly indicated a decrease in tIGF-I whendiabetic animals were 80 and 110 days old, in coincidencewith the promotion phase of NMU mammary tumor induc-tion. The delay in tumor induction in diabetic rats (longerlatency period) could be related to this decrease. Besides,Kieinberg et al. demonstrated the importance of the IGF-Iin normal mammary gland development in the rat[39]. Inagreement with this, the important role of IGF-I and itsreceptor during the carcinogenic process was reported bymany researches as Rho et al. and Chemicky et al.[46,47].In rats the IGF-I system is age-dependent, as was describedby Frystyk et al.[38], so the significance of our results is thefact that the lowest IGF-I plasmatic level was found in 80and 110-day-old diabetic rats, in agreement with the delayin the latency period observed.
Our results demonstrated that tumors developed inSTZ/NMU-treated rats had a benign pattern (84%) whilstthe ones developed in non-diabetic/NMU-treated groupwere all malignant (100%). In all mammary tumors inducedpreviously by our methodology[24], high malignancy de-gree, atypical mitosis, anisocariosis and infiltration of sur-rounding tissue as muscle and skin were seen. No benigntumors were found in these experiments[24,36,37]. Also,we reported in previous papers[27,28] that tumors inducedunder diabetic status of the rats exhibit a clear benign pat-tern. In the present experiments, again the benign patternwas found only in diabetic animals. In these experiments,after 60 days of growth, malignant tumors of non-diabeticrats attain a volume markedly higher than the benign tu-mors of diabetic rats and also higher than volume of thefew malignant tumors developed in these rats.
The PCNA expression in the epithelial cells is quantita-tively very high in malignant tumors of non-diabetic ratsand quite scarce in benign tumors of diabetic rats. Similarresults were found in reference to c-fosexpression.
With respect to the insulin plasma levels, we also sawa significant decrease in diabetic rats at day 80th, an in-
C. Cocca et al. / Cancer Detection and Prevention 27 (2003) 37–46 45
crease in the value at day 110th and a posterior stabiliza-tion of values, as previously reported[28]. It is possiblethat the diminution of values around day 80 produced aninsulin-resistance in the remaining pancreas that favored theposterior increase of these values. Kobayashi and Olefsky[48] have previously demonstrated a post-receptor resistanceto insulin in STZ-treated rats. These authors mentioned thepossibility that a relative chronic insulin deficiency could re-sult in reduced sensitivity to insulin. Data presented in thesestudies suggest that, in this model of NIDDM, there is anappreciable degree of peripheral insulin resistance. The in-crease in the insulin levels at 110 day was in agreement withthe tumor development showed in STZ/NMU-treated rats atthat time.
In conclusion, the experimental model described in thispaper appears to be appropriate for studying the role of IGFsystem in relation to the mammary carcinogenic process inrats. We demonstrate that rats with diabetic disease showed asuppression in the mammary carcinogenesis and it was con-sistent with a low insulin plasma levels during this process.
Acknowledgements
This work was supported by grants from Buenos AiresUniversity (TB069) and from the National Agency of Scien-tific and Technologi cal Promotion (PICT 04656). The math-ematical support was given by Ines Sarchi, MSc, School ofPharmacy and Biochemistry, University of Buenos Aires,Argentina. The authors dedicate this article to the memoryof Dr. Emanuel Levin.
References
[1] Figueroa JA, Jackson JG, McGuire W, et al. Expression of insulin-likegrowth factor binding protein in human breast cancer correlates withestrogen receptor status. J Cell Biochem 1993;52:196–205.
[2] Russo H, Russo J. Role of hormones in mammary cancer initiationand progression. J Mammary Gland Biol Neoplasia 1998;3(1):49–81.
[3] Khandwala HM, McCutcheon IE, Flyvbjerg A, et al. The effect ofinsulin-like growth factors on tumorigenesis and neoplastic growth.Endocrine Rev 2000;21(3):215–44.
[4] Kamysheva EP, Abelevich IG, Andriukhina C, et al. Diabetes mellitusand cancer. Ross Med Zh 1992;2:8–11.
[5] Levin E, Levin RW. Better evolution of breast cancer in typeII diabetic patients under tamoxifen hypoglycemic sulfonylureastreatment. Abstracts V Int Congress Hormones & Cancer, Quebec,1995.
[6] Rhomberg W. Metastasirendes mammakarzinom und diabetesmellitus-eine prognostisch günstinge krankheitskombination. DtschMed Wschr 1975;100:2422–7.
[7] Heuson JC, Legros N. Influence of insulin deprivation on growth ofthe 7,12-dimethylbenz(a)antracene-induced mammary carcinoma inrats subjected to alloxan diabetes and food restriction. Cancer Res1972;32:226–32.
[8] Cohen ND, Hilf R. Influence of insulin on growth and metabolism of7,12-dimethylbenz(a)anthracene (DMBA)-induced mammary tumors.Cancer Res 1979;34:3245–52.
[9] Werner H, Le Roith D. New concepts in regulation and function ofthe insulin-like growth factors: implications for understanding normalgrowth and neoplasia. Cell Mol Life Sci 2000;57(6):932–42.
[10] Baserga R. The insulin-like growth factor I receptor: a key to tumorgrowth. Cancer Res 1995;55:249–52.
[11] Rasmussen AA, Cullen KF. Paracrine/autocrine regulation of breastcancer by the insulin-like growth factor. Breast Cancer Res Treat1998;47:219–33.
[12] Yee D. The insulin-like growth factor system as a target in breastcancer. Breast Cancer Res Treat 1994;32:85–95.
[13] Lønning PE, Kalk K, Aakvaag A, et al. Influence of Tamoxifenon plasma levels of insulin-like growth factor I and insulin-likegrowth factor binding protein I in breast cancer patients. Cancer Res1992;52:4719–23.
[14] Giustina A, Ruggeri G, Bodini C, et al. Int Sympos BiotechnolGrowth Factors. In: Lefant C, Paoletti R, Albertini A, editors. Milan;1992. p. 115–22.
[15] Häring A, Kelleler M, Mosthaf L. Modulation of insulin signalingin non-insulin dependent diabetes: significance of altered receptorisoforms pattern and mechanisms of glucose-induced receptormodulation. Horm Res 1994;41:87–92.
[16] Clauson PG, Brismar K, Hall K, et al. Insulin-like growth factor-Iand insulin-like growth factor binding protein-I in representativepopulation of type 2 diabetic patients in Sweden. Scand J Clin LabInvest 1998;54(4):353–60.
[17] Gibson JM, Westwood M, Crosby SR, et al. Choice of treatmentaffects plasma levels of insulin-like growth factor-binding protein-Iin non-insulin-dependent diabetes mellitus. J Clin Endocrinol Metab1996;80(4):1369–75.
[18] Shinada M, Akdeniz A, Panagiotopoulus S, et al. Proteolisis ofinsulin-like growth factor-binding protein-3 is increased in urinefrom patients with diabetic nephropathy. J Clin Endocrinol Metab2000;85(3):1163–9.
[19] Schuchard M, Landers JP, Sandhu NP, et al. Steroid hormoneregulation of nuclear protooncogenes. Endocrinol Rev 1993;14:659–69.
[20] Hyder SM, Stancel GM, Narvaz Z, et al. Identification of an estrogenresponse element in the 3′-planning region of the murine c-fosprotooncogene. J Biol Chem 1992;267:18047–54.
[21] Gee JM, Willsher PC, Kenny FS. Endocrine response and resistancein breast cancer: a role for the transcription factorfos. Int J Cancer1998;84(1):54–61.
[22] Dietrich RD. Toxicological and pathological applications ofproliferating cell nuclear antigen (PCNA): a novel endogenous markerfor cell proliferation. Crit Rev Toxicol 1993;23(1):77–109.
[23] Kelman Z. PCNA: structure, functions and interactions. Oncogene1997;14:81629–40.
[24] Rivera E, Melito G, Davio C, et al. Histopathology and influenceof the estral cycle on NMU-induced tumors in rats. Cancer Lett1994;86:223–8.
[25] Guide for the Care and Use of Laboratory Animals, NationalResearch Council, Washington (DC): National Academy Press; 1996.
[26] Weir GC, Clare ET, Zmachinski CJ, et al. Islet secretion in a newexperimental model for non-insulin-dependent diabetes. Diabetes1981;30:590–5.
[27] Cocca C, Binda M, Martin G, et al. Diabetes and Cancer. Medicina1995;55:492.
[28] Cocca C, Martin G, Rivera E. An experimental model of diabetesand cancer in rats. Eur J Cancer 1998;34:889–94.
[29] Russo J, Russo IH, Rogers MJ, et al. Tumors of the mammary gland.In: Turusov VS, Mohr U, editors. Pathology of tumors in laboratoryanimals. Tumors of the rats, vol. 1. Lyon (France): IARC ScientificPublications No. 99; 1990.
[30] Russo J, Russo IH. Atlas and histologic classification of tumors of therat mammary gland. J Mammary Gland Biol Neoplasia 2000;5:187–200.
[31] Gomori G. A rapid one-step trichromic stains. Am J Clin Path1950;20:661–4.
46 C. Cocca et al. / Cancer Detection and Prevention 27 (2003) 37–46
[32] Agresti A., Categorical data analysis. New York: Wiley; 1990.[33] Winer B, Brown D, Michels K. Statistical principles in experimental
design. New York: McGraw-Hill; 1991.[34] Martin G, Melito G, Rivera E, et al. Effect of tamoxifen on
intraperitonealN-nitroso-N-methylurea induced tumors. Cancer Lett1996;100:227–34.
[35] Martin G, Rivera E, Davio C, et al. Receptors characterization ofintraperitoneallyN-nitroso-N-methylurea-induced mammary tumorsin rats. Cancer Lett 1996;101:1–8.
[36] Martin G, Davio C, Rivera E, et al. Hormone dependence ofmammary tumors induced in rats by intraperitoneal NMU injection.Cancer Invest 1997;15(1):8–17.
[37] Martin G, Cricco G, Davio C, et al. Epidermal growth factor inNMU-induced mammary tumors in rats. Breast Cancer Res Treat1998;48:175–85.
[38] Frystyk J, Grømbok H, Skjaek C, et al. Development changes inserum levels of free and total insulin-like growth factor I (IGF-I),IGF-binding protein-1 and -3, and the acid-labile subunit in rats.Endocrinology 1998;139:4286–92.
[39] Kieinberg CL, Feldman W, Ruan W. IGF-I: an essential factor interminal end bud formation and ductal morphogenesis. J MammaryGland Biol Neoplasia 2000;5(1):7–17.
[40] Pollack M. Endocrine effects of IGF-I on normal and transformedbreast epithelial cells: potential relevance to strategies for breastcancer treatment and prevention. Breast Cancer Res Treat1998;47:209–17.
[41] Pollack M, Constantino J, Polychronakos C, et al. Effect of tamoxifenon serum insulin-like growth factor I levels in stage I breast cancerpatients. J Natl Cancer Inst 1990;82:1693–7.
[42] Hankinson SE, Willet WC, Colditz CA, et al. Circulatingconcentrations of insulin-like growth factor-I and risk of breastcancer. Lancet 1998;351(9113):1393–6.
[43] Peirat JP, Bonneterre J, Hecquet B, et al. Plasma insulin-like growthfactor-I (IGF-I) concentrations in human breast cancer. Eur J Cancer1993;29A:492–7.
[44] Basedovsky H, Normann S, Schardt M, et al. Endocrine host responseduring early and late phases of tumor development. Int J Cancer2000;86:446–57.
[45] Holdaway IM, Mason BH, Lethaby AE, et al. Serum levels ofinsulin-like growth factor binding protein-3 in benign and malignantbreast disease. Aus N Z J Surg1999;69(7):495–500.
[46] Rho O, Bol DK, You J, et al. Altered expression of insulin growthfactor I and its receptor during multistage carcinogenesis in mouseskin. Mol Carcinog 1996;17(2):62–9.
[47] Chemicky CL, Yi L, Tan H, et al. Treatment of human breast cancercells with antisense RNA to the type I insulin-like growth factorreceptor inhibit cell growth, suppressed tumorigenesis, alters themetastatic potential and prolongs survival in vivo. Cancer Gene Ther2000;7(3):384–95.
[48] Kobayashi M, Olefsky JM. Effect of streptozotocin-induced diabeteson insulin binding, glucose transport and intracelular glucosemetabolism in isolated rat adipocytes. Diabetes 1982;28:87–95.


