Embed Size (px)
Citation preview

Supplemental Information for:
Downregulation of Epithelial DUOX1 in Chronic Obstructive Pulmonary Disease
Contributes to Disease Pathogenesis
Caspar Schiffers, Cheryl van de Wetering, Robert A. Bauer, Aida Habibovic, Milena Hristova,
Christopher M. Dustin, Sara Lambrichts, Pamela M. Vacek, Emiel F.M. Wouters, Niki L.
Reynaert, Albert van der Vliet*
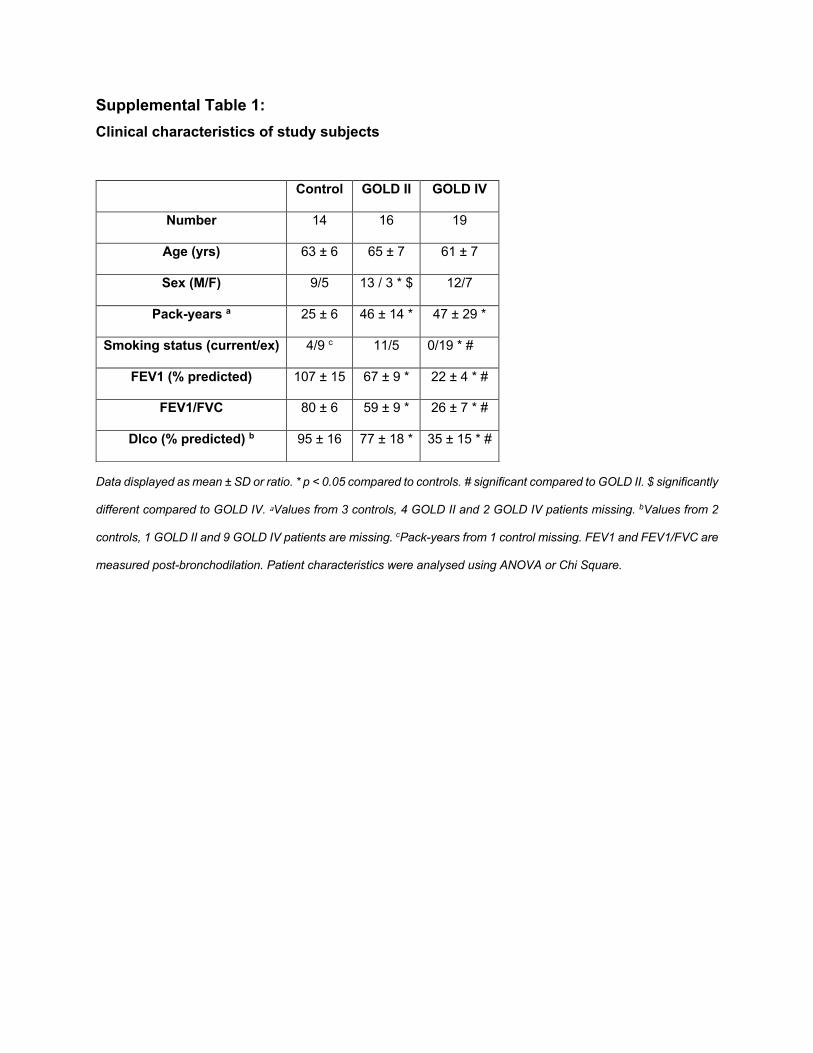
Supplemental Table 1: Clinical characteristics of study subjects
Data displayed as mean ± SD or ratio. * p < 0.05 compared to controls. # significant compared to GOLD II. $ significantly
different compared to GOLD IV. aValues from 3 controls, 4 GOLD II and 2 GOLD IV patients missing. bValues from 2
controls, 1 GOLD II and 9 GOLD IV patients are missing. cPack-years from 1 control missing. FEV1 and FEV1/FVC are
measured post-bronchodilation. Patient characteristics were analysed using ANOVA or Chi Square.
Control GOLD II GOLD IV
Number 14 16 19
Age (yrs) 63 ± 6 65 ± 7 61 ± 7
Sex (M/F) 9/5 13 / 3 * $ 12/7
Pack-years a 25 ± 6 46 ± 14 * 47 ± 29 *
Smoking status (current/ex) 4/9 c 11/5 0/19 * #
FEV1 (% predicted) 107 ± 15 67 ± 9 * 22 ± 4 * #
FEV1/FVC 80 ± 6 59 ± 9 * 26 ± 7 * #
Dlco (% predicted) b 95 ± 16 77 ± 18 * 35 ± 15 * #
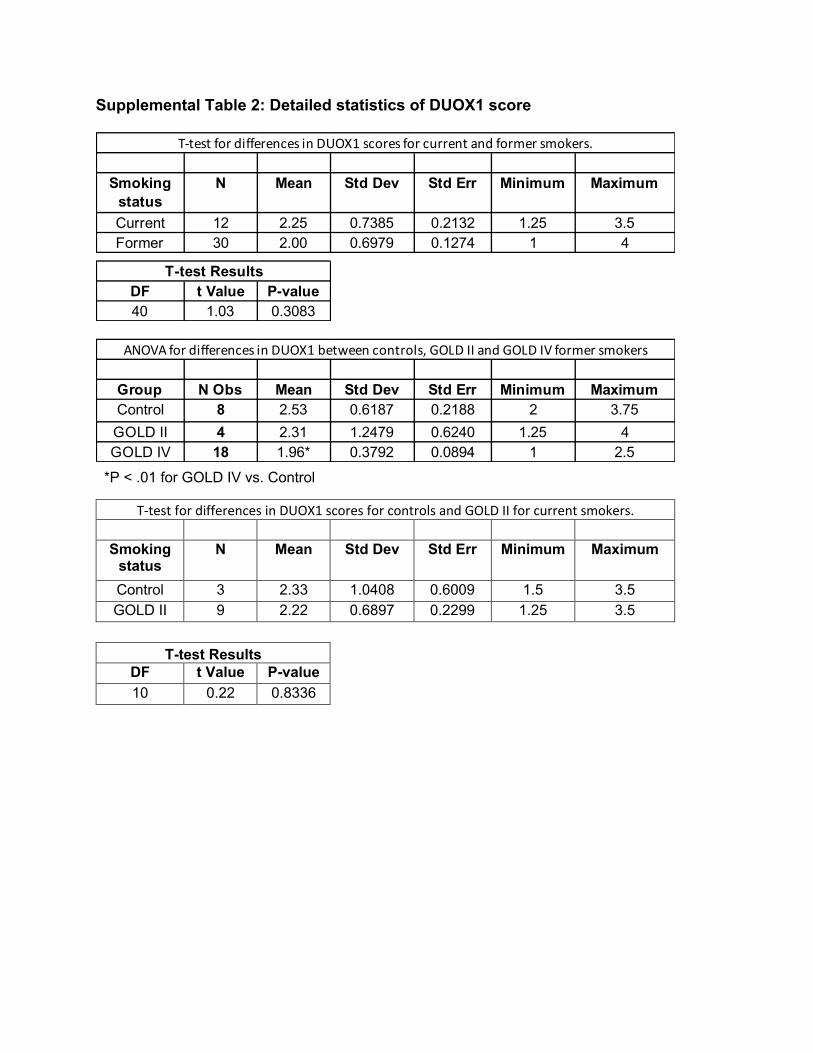
Supplemental Table 2: Detailed statistics of DUOX1 score
T-test for differences in DUOX1 scores for controls and GOLD II for current smokers.
Smoking status
N Mean Std Dev Std Err Minimum Maximum
Control 3 2.33 1.0408 0.6009 1.5 3.5 GOLD II 9 2.22 0.6897 0.2299 1.25 3.5
T-test Results
DF t Value P-value 10 0.22 0.8336
Smoking status
N Mean Std Dev Std Err Minimum Maximum
Current 12 2.25 0.7385 0.2132 1.25 3.5Former 30 2.00 0.6979 0.1274 1 4
T-test for differences in DUOX1 scores for current and former smokers.
DF t Value P-value40 1.03 0.3083
T-test Results
Group N Obs Mean Std Dev Std Err Minimum MaximumControl 8 2.53 0.6187 0.2188 2 3.75GOLD II 4 2.31 1.2479 0.6240 1.25 4GOLD IV 18 1.96* 0.3792 0.0894 1 2.5
ANOVA for differences in DUOX1 between controls, GOLD II and GOLD IV former smokers
*P < .01 for GOLD IV vs. Control
agebm
iFVC
Dlco
FEV1FEV1/FVC
Packyrsage
bmi
FVCD
lcoFEV1
FEV1/FVCPackyrs
n42
4243
3243
4335
4242
4332
4343
35rho
0.1940.206
0.3060.390
0.4520.511
-0.0830.204
0.2950.445
0.4760.467
0.479-0.065
p-value0.2191
0.19090.0456
0.02720.0024
0.00050.6353
0.19540.0575
0.00280.0059
0.00160.0012
0.7121
n42
4243
3243
4335
rho0.205
0.2360.362
0.4210.466
0.496-0.070
p-value0.1918
0.13210.0172
0.01630.0016
0.00070.6906
FVCD
lcoFEV1
FEV1/FVCFVC
Dlco
FEV1FEV1/FVC
Adjusted for smoking status
n42
3142
4242
3142
42rho
0.2810.412
0.4520.510
0.4280.490
0.4530.461
p-value0.0749
0.02360.003
0.00070.0052
0.0060.003
0.0024
Adjusted for pack yearsn
3525
3525
3525
3525
rho0.326
0.4250.491
0.5460.484
0.4960.474
0.451p-value
0.060.0385
0.00320.0008
0.00370.0136
0.00460.0075
Adjusted for agen
4232
4242
4232
4242
rho0.270
0.3690.405
0.4830.430
0.4680.438
0.445p-value
0.08810.0445
0.00850.0014
0.0050.0091
0.00420.0035
Adjusted for BMI
n42
3242
4242
3242
42rho
0.3330.295
0.4680.521
0.4760.375
0.4820.473
p-value0.0333
0.10680.002
0.00050.0016
0.03780.0014
0.0018
Pearson Correlation C
oefficients
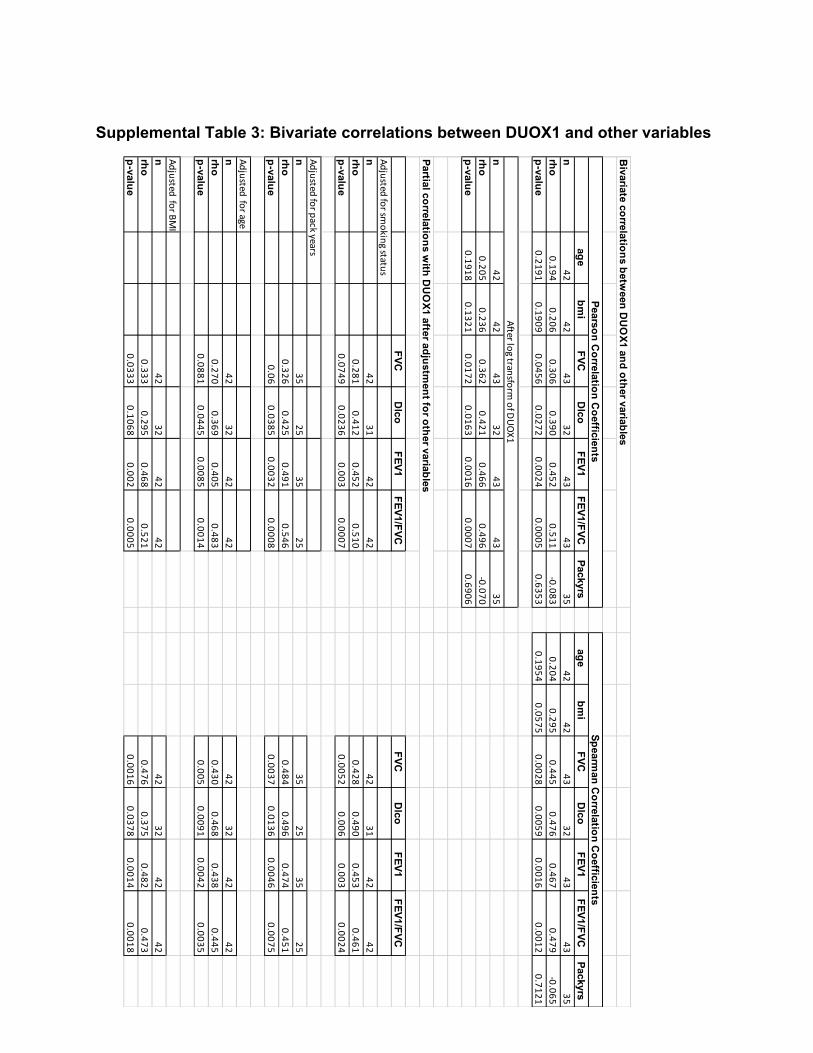
Bivariate correlations betw
een DU
OX1 and other variables
Partial correlations with D
UO
X1 after adjustment for other variables
Spearman C
orrelation Coefficients
After log transform of D
UO
X1
Supplemental Table 3: Bivariate correlations between DUOX1 and other variables

Supplemental Table 4: qPCR primers used in studies
Target gene Forward/
Reverse primer Primer sequence
DUOX1 (human) F TTCACGCAGCTCTGTGTCAA
R AGGGACAGATCATATCCTGGCT
RPL13A (human) F CCTGGAGGAGAAGAGGAAAGAGA
R TTGAGGACCTCTGTGTATTTGTCAA
Duox1 F ACCAGAACATTGCGATGTATGAG
R AGAAATGGACGGTATCCTGGA
Gapdh F CTGGAGAAACCTGCCAAGTA
R TGTTGCTGTAGCCGTATTCA
Col1a1 F CACCCTCAAGAGCCTGAGTC
R AGACGGCTGAGTAGGGAACA
Cxcl1 F GTG AAT CAA GAC ATA GTT AAC C
R GTG AAT CAA GAC ATA GTT AAC C
Il6 F AACGATGATGCACTTGCAGA
R GGAAATTGGGGTAGGAAGG
Areg F AAC GGT GTG GAG AAA AAT CC
R TTG TCC TCA GCT AGG CAA TG
Eln F TCCTGGAGCCACTCTTACAG
R CTCTCTCTCCCCAATTAGCC
Acta2 F CGCTGTCAGGAACCCTGAGA
R CGAAGCCGGCCTTACAGA
Mmp9 F CTCACTCACTGTGGTTGCTG
R TGGTTATCCTTCCTGGATCA
Mmp12 F TTTCTTCCATATGGCCAAGC
R GGTCAAAGACAGCTGCATCA
Il1b F GCCCATCCTCTGTGACTCAT
R AGGCCACAGGTATTTTGTCG
Il13 F CTACAGCTCCCTGGTTCTCT
R TTGCTCAGCTCCTCAATAAG
Tgfb F TGC TTT AGC TCC ACA GAG AA
R TGG TTG TAG AGG GCA AGG AC
Muc5ac F AGTCTCTCTCCGCTCCTCTCAAT R CAGCCGAGAGGAGGGTTTGATCT
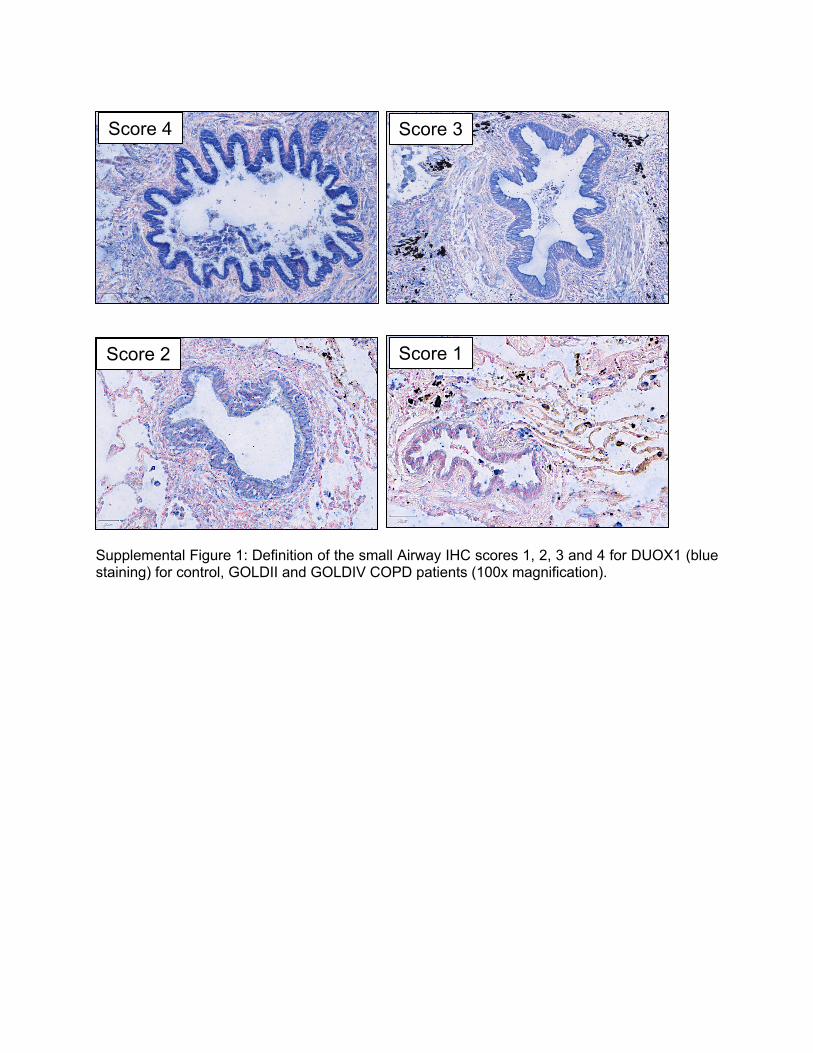
Supplemental Figure 1: Definition of the small Airway IHC scores 1, 2, 3 and 4 for DUOX1 (blue staining) for control, GOLDII and GOLDIV COPD patients (100x magnification).
Score 4 Score 3
Score 2 Score 1

0 1 10
30 0 1
10 30 Acr (μM)
E-cadherin
Vimentin
β-actin
WT Duox1-/-
Supplemental Figure 2: DUOX1 (protein and/or mRNA) expression is reduced in a mouse model of chronic acrolein exposure, in isolated mouse tracheal epithelial cells (mTEC) exposed to acrolein or TGF-β, and in primary bronchial epithelial cells (PBEC) exposed to cigarette smoke. Lung tissue Duox1 protein (A, n=4-5, with representative Western Blot) and mRNA (B, n=6-9) and C) BAL fluid TGF-β1 levels (n=6-9) in mice exposed to acrolein (5 ppm; 4 hrs/day, for 2 weeks) or air. C) Cultured mTECs from WT (and Duox1-/- mice in (D)) were exposed daily to acrolein (1 - 30 μM) or TGF-β (10 ng/ml) for 14 days and analyzed for Duox1 mRNA or D) E-cadherin and vimentin by Western blot. E) DUOX1 mRNA expression in isolated PBECs from non-COPD patients 24 hours after treatment with 1,2 or 4% cigarette smoke extract (CSE); Values from 2-3 different donors, as indicated by symbols. Data shown as mean ± SE. n=6-10; *: p < 0.05, by 1-way ANOVA, or 2-tailed unpaired t-test.
DUOX1
CTL 1% 2% 4%0.0
0.5
1.0
1.5
Rel
ativ
e m
RN
A ex
pres
sion
CSE
*
Donor 1Donor 2Donor 3
F
D
CTL 10 µM 30 µM TGF-β0.0
0.5
1.0
1.5
Rel
ativ
e m
RN
A ex
pres
sion
**
*
Duox1
Acr
E
Air ACR (5ppm)0.0
0.5
1.0
1.5Fo
ld c
hang
eDUOX1
*DUOX1
β-actin
Air ACR (5ppm)
A
B C
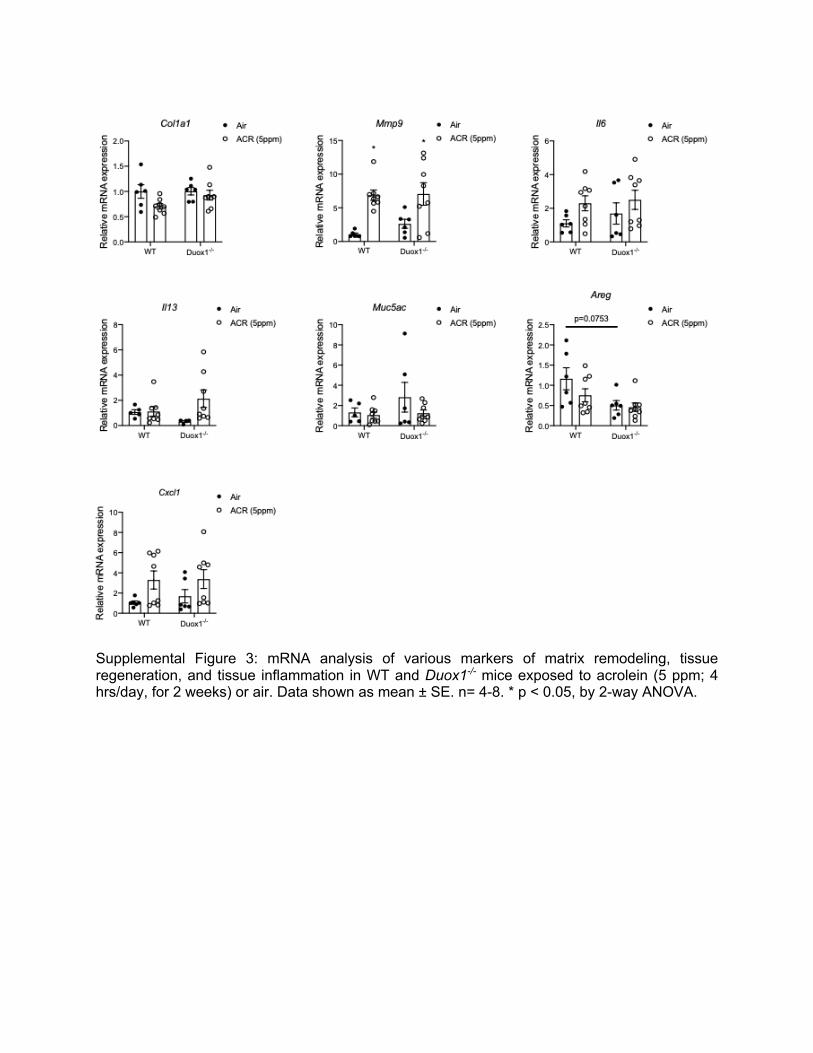
Supplemental Figure 3: mRNA analysis of various markers of matrix remodeling, tissue regeneration, and tissue inflammation in WT and Duox1-/- mice exposed to acrolein (5 ppm; 4 hrs/day, for 2 weeks) or air. Data shown as mean ± SE. n= 4-8. * p < 0.05, by 2-way ANOVA.
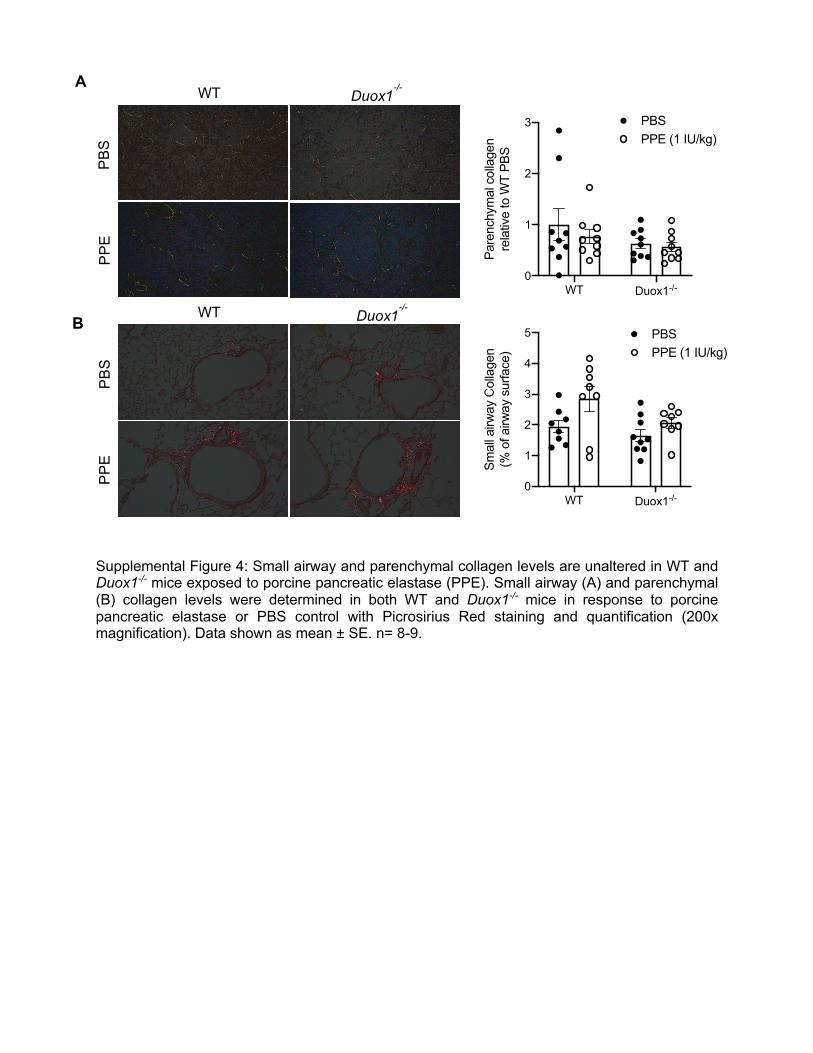
Supplemental Figure 4: Small airway and parenchymal collagen levels are unaltered in WT and Duox1-/- mice exposed to porcine pancreatic elastase (PPE). Small airway (A) and parenchymal (B) collagen levels were determined in both WT and Duox1-/- mice in response to porcine pancreatic elastase or PBS control with Picrosirius Red staining and quantification (200x magnification). Data shown as mean ± SE. n= 8-9.
Duox1-/-
WT PB
S PP
E
Duox1-/-
WT
PBS
PPE
WT Duox1-/-0
1
2
3
Par
ench
ymal
col
lage
n re
lativ
e to
WT
PB
S
PBSPPE (1 IU/kg)
WT Duox1-/-0
1
2
3
4
5
Sm
all a
irway
Col
lage
n (%
of a
irway
sur
face
)
PBSPPE (1 IU/kg)
A
B
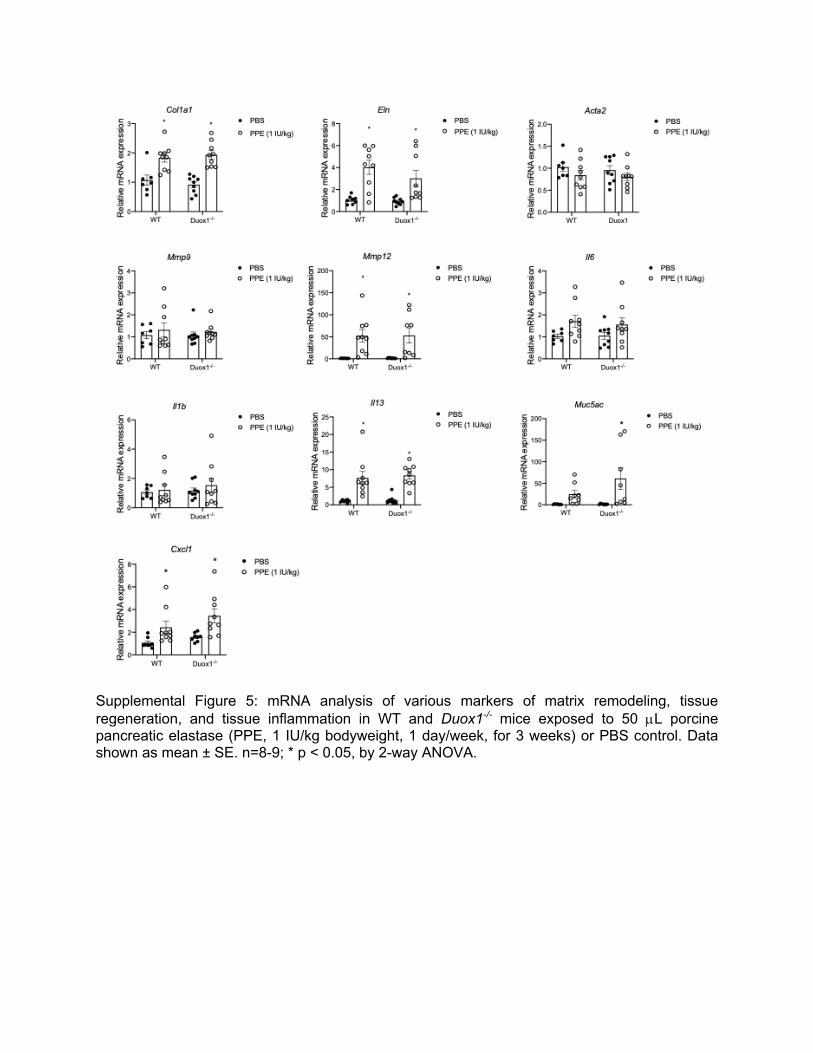
Supplemental Figure 5: mRNA analysis of various markers of matrix remodeling, tissue regeneration, and tissue inflammation in WT and Duox1-/- mice exposed to 50 µL porcine pancreatic elastase (PPE, 1 IU/kg bodyweight, 1 day/week, for 3 weeks) or PBS control. Data shown as mean ± SE. n=8-9; * p < 0.05, by 2-way ANOVA.
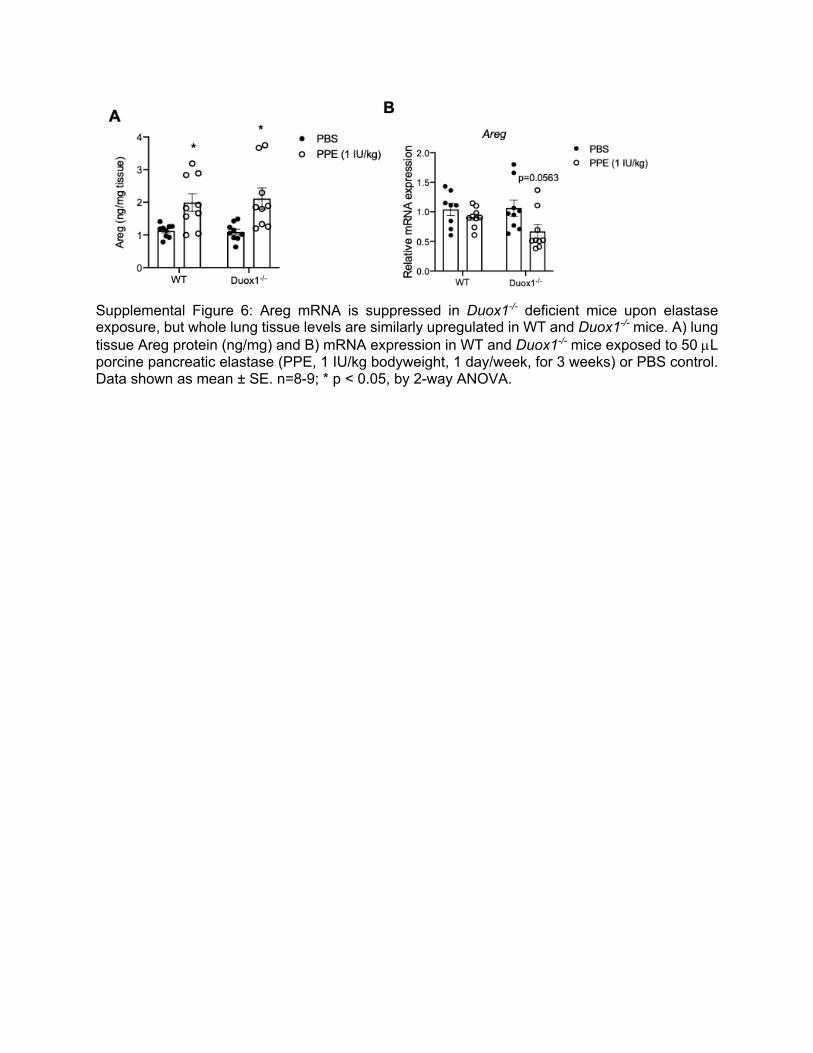
Supplemental Figure 6: Areg mRNA is suppressed in Duox1-/- deficient mice upon elastase exposure, but whole lung tissue levels are similarly upregulated in WT and Duox1-/- mice. A) lung tissue Areg protein (ng/mg) and B) mRNA expression in WT and Duox1-/- mice exposed to 50 µL porcine pancreatic elastase (PPE, 1 IU/kg bodyweight, 1 day/week, for 3 weeks) or PBS control. Data shown as mean ± SE. n=8-9; * p < 0.05, by 2-way ANOVA.
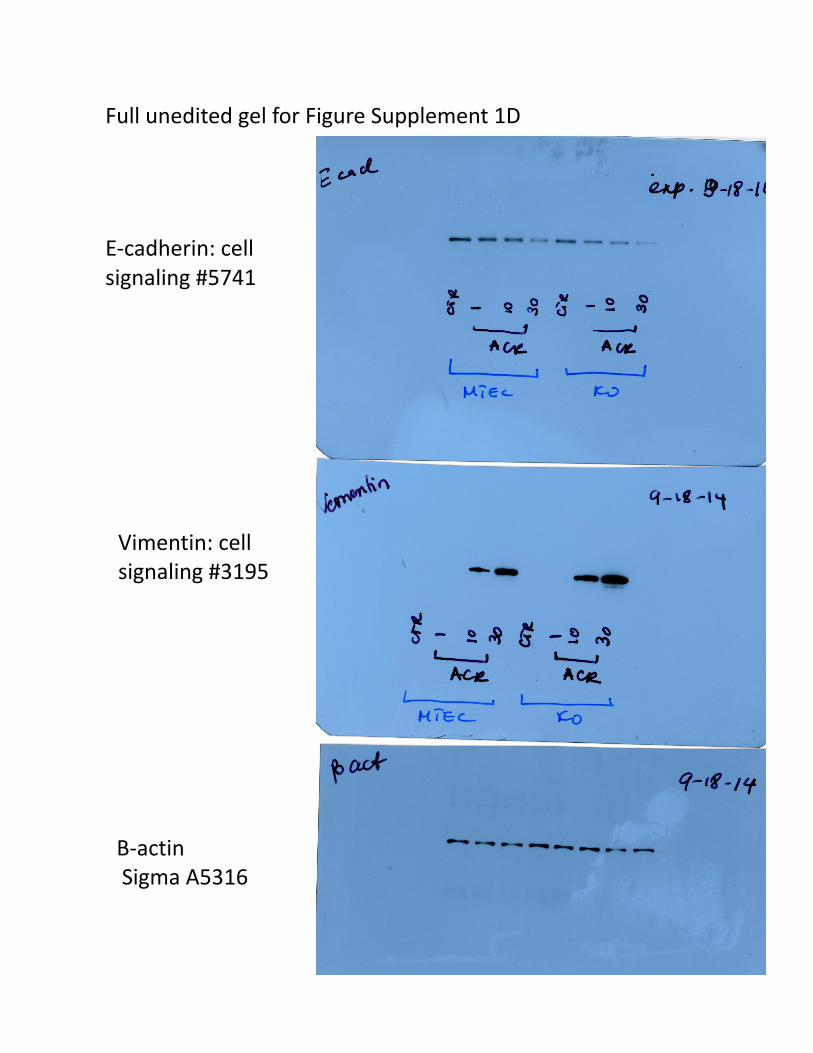
Full unedited gel for Figure Supplement 1D
E-cadherin: cell signaling #5741
Vimentin: cell signaling #3195
B-actin
Sigma A5316
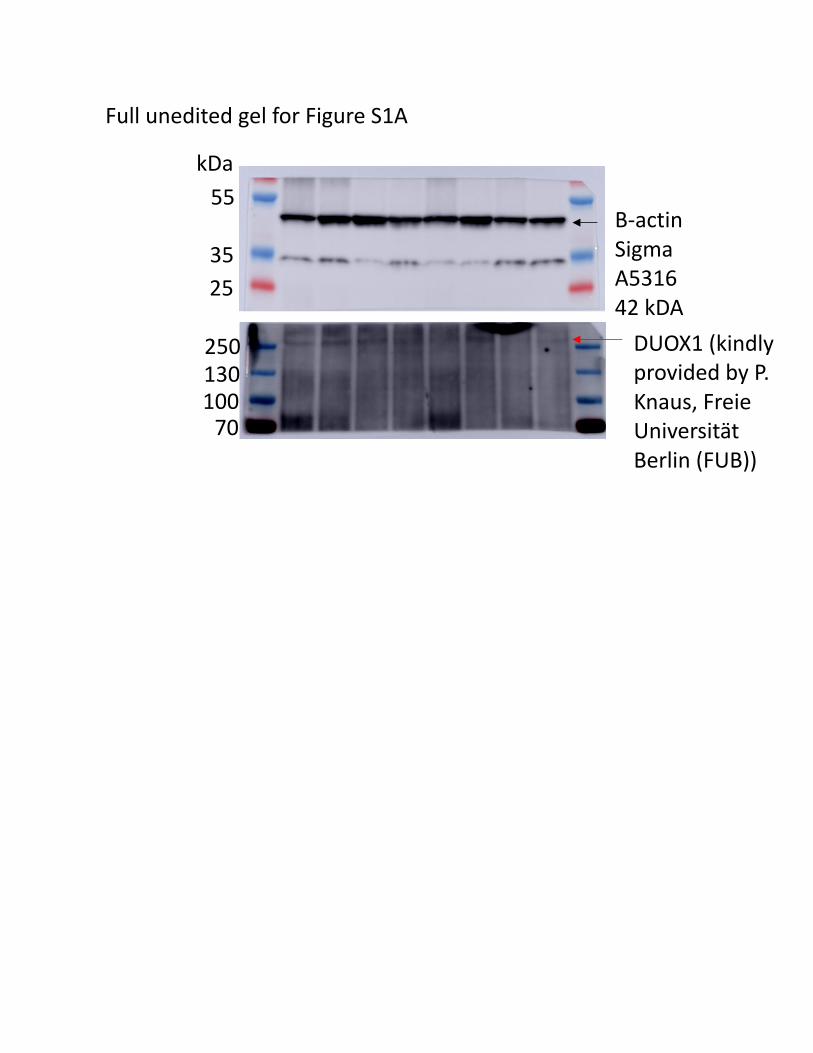
Full unedited gel for Figure S1A
B-actin Sigma
A5316
42 kDA 25
35
55
kDa
DUOX1 (kindly provided by P. Knaus, Freie Universität Berlin (FUB))
250
130
100
70


