Embed Size (px)
Citation preview
Suitability of enzymatic markers to assess the environmentalcondition of natural populations of Gambusia affinisand Daphnia magna—a case study
Inês Domingues & Cátia S. A. Santos & Nuno G. C. Ferreira &
Luísa Machado & Rhaul Oliveira & Abel Ferreira & Isabel Lopes &
Susana Loureiro & Amadeu M. V. M. Soares
Received: 26 June 2014 /Accepted: 12 March 2015# Springer International Publishing Switzerland 2015
Abstract In recent years, the use of biochemicalmarkers, especially in the assessment of toxic effectsand modes of action, under controlled laboratory condi-tions has increased. However, transposing their use to insitu monitoring or risk assessment evaluations has en-countered barriers, mainly related to the difficulty ininterpreting the meaning of biochemical variation. In thiswork, we aimed at understanding if biochemical markeractivities (cholinesterase, glutathione S-transferase andlactate dehydrogenase) can be used to monitor the healthstatus of natural populations of fish (Gambusia affinis)
and daphnids (Daphnia magna). For that, two ponds withdifferent water properties were chosen as study sites, andorganisms collected at four sampling periods along theyear. The pattern of biochemical marker responses wasnot the same in the two species, showing higher integrat-ed biochemical marker response values in the winter forG. affinis and in the autumn for D. magna, suggestingspecificities that must be taken into account in biomoni-toring programmes by including representative species ofseveral trophic levels. In the case of G. affinis, the differ-ences in key physicochemical parameters between thetwo ponds (especially dissolved oxygen levels) did notseem to affect biochemical marker levels as if organismswere already perfectly adapted to their environment. Ingeneral, seasonal variation of water quality seems to havean important role on biochemical marker responses.Several parameters above Environmental QualityStandards were identified such as dissolved oxygen(DO), ammonia, nitrites, sulphides and metals, but even-tual responses to these stressors could not be discriminat-ed from natural variation except for particular cases.
Keywords Environmental parameters . Chemicalstress . Biochemical markers .Daphnia magna .
Gambusia affinis
Introduction
In recent years, the use of biochemical markers inthe assessment of toxic effects and modes of action,
Environ Monit Assess (2015) 187:208 DOI 10.1007/s10661-015-4429-2
Nuno G. C. Ferreira holds a PhD degree, Universidade de Aveiro.
I. Domingues (*) : C. S. A. Santos :N. G. C. Ferreira :L. Machado :A. Ferreira : I. Lopes : S. Loureiro :A. M. V. M. SoaresDepartamento de Biologia & CESAM, Universidade deAveiro, Campus de Santiago, 3810-193 Aveiro, Portugale-mail: [email protected]
C. S. A. SantosDepartment of Biology, Terrestrial Ecology Unit, GhentUniversity, K.L. Ledeganckstraat 35, 9000 Ghent, Belgium
R. OliveiraLaboratório de Genética Toxicológica, Departamento deGenética e Morfologia, Instituto de Ciências Biológicas,Universidade de Brasília, Asa Norte, 70910-900 Brasília, DF,Brazil
A. M. V. M. SoaresPrograma de Pós-Graduação em Produção Vegetal,Universidade Federal do Tocantins, Campus de Gurupi. RuaBadejós, Zona Rural, Cx. Postal 66, 77402-970 Gurupi, TO,Brazil

under controlled laboratory conditions has in-creased. A biochemical marker, in a perspective ofenvironmental risk assessment, is any biological pa-rameter (a biochemical, physiological, genetic, im-munologic or histological measure) that responds tothe exposure to a toxicant indicating a deviation ofthe normal status of the organism, most of the timesundetectable at the individual level (Chambers et al.2002; Morgan et al. 1999). This concept, adoptedfrom medical toxicology, is based on the assumptionthat low concentrations of a toxicant will have aneffect at sub-individual level before observable ef-fects at higher levels of biological organization andthus providing an early sign of disturbance in theecosystem.
Biochemical markers can be generically classified inthree categories (WHO 2001): markers of exposurecorresponding to the result of an interaction between acontaminant and a target molecule or cell that is mea-sured; markers of effects, corresponding to an alterationin an organism that can be associated with a possiblehealth condition or disease andmarkers of susceptibility,indicating that the health of the system is especiallysensitive to the challenge of exposure to a xenobioticcompound (NRC 1987).
Biochemical markers have been successfully usedin the assessment of pesticides, metals and PAHeffects, and several organisms have been used asmodels, such as insects, crustacea, mollusks, fishesand amphibians (e.g. (Falfushinska et al. 2008;Sanchez and Porcher 2009; Coelho et al. 2011)).The use of biochemical markers in in situ monitor-ing or risk assessment evaluations has, however,encountered barriers, mainly related to the difficultyin interpreting the meaning of the biochemical var-iation. Biochemical markers are Bearly warnings^ asthey are the first to respond to environmental chang-es; furthermore, they are highly sensitive compara-tively to lethal endpoints and are able to integrate allfactors that influence, at a given moment, the phys-iology of the organism, including effects of avail-able contaminants, abiotic factors and the severalinteractions that may occur (Barata et al. 2007).This net of factors could never be qualified bychemical analysis; however, it is also a confoundingfactor when analysing and interpreting the biochem-ical marker responses. Abiotic parameters, such astemperature (T), dissolved oxygen (DO) concentra-tion or pH, may affect biochemical markers at a
level that can be considered normal or, on the con-trary, work as stressors affecting activities in such away that compromises organisms’ fitness or in-creases their susceptibility to stress (Adams 2000;Vidal et al. 2002; Cailleaud et al. 2007; Charronet al. 2013). The threshold, in terms of biochemicalvariation, between a fitness impairment or a naturalvariation is difficult to establish and constitutes ashortcoming for the unambiguous use of biochemi-cal markers as indicators of the biological effects ofcontamination in field situations. The use of a set ofbiochemical markers has been the procedure adoptedby researchers to overcome this problem and detectin situ effects of toxicants, because an integratedanalysis can lead to more robust conclusions.Cholinesterases (EC 3.1.1.8, ChE) are among themost used biochemical markers in lab and fieldassessments (Olsen et al. 2001) and are especiallyused to detect contamination by neurotoxic com-pounds such as organophosphorus and carbamatepesticides. Glutathione S-transferase (EC 2.5.1.18,GST) is a family of enzymes with a key role in thegeneral biotransformation of xenobiotic and endog-enous substances (Hyne and Maher 2003). It catal-yses the conjugation of reduced glutathione withcompounds having reactive electrophilic groups,generating less toxic and more hydrophilic mole-cules and is induced by compounds such asorganochloride pesticides, PAHs and PCBs(Cailleaud et al. 2007). Lactate dehydrogenase (EC1.1.1.27, LDH) is involved in the carbohydrate me-tabolism, catalysing the oxidation of lactate intopyruvate (Diamantino et al. 2001).
This work aimed at understanding if enzymaticbiochemical marker activities can be used to monitorthe health status of natural populations of fish(Gambusia affinis) and daphnids (Daphnia magna).For that, two ponds with different water propertieswere chosen as case study, and organisms werecollected at four sampling periods (representativeof the four seasons) along the year. To attain thismajor goal, three specific objectives were delineat-ed: (i) to assess biochemical marker variation amongponds and among seasons; (ii) to identify waterphysicochemical parameters acting as stress factors(based on thresholds already established in the leg-islation) and verify if biochemical markers respondspecifically to these stressors and finally (iii) toverify if the pattern of response varies between
208 Page 2 of 13 Environ Monit Assess (2015) 187:208

organisms belonging to different trophic levels (fishand crustaceans).
Materials and methods
Sampling sites
Two ponds located at the campus of the Universityof Aveiro, Portugal, were selected as study sites. Thenatural pond (NP) is a natural water body of approx-imately 3955 m2 receiving pluvial waters. The arti-ficial pond (AP) is a concrete tank with 5317 m2
whose waters are more prone to stagnation depend-ing essentially on rain as water supply. Both pondshave the features of a lentic ecosystem with theestablishment of organisms belonging to differenttrophic levels (Fig. 1).
The procedures described in the present paper respectnational and international safety regulations and ethicalprinciples for animal welfare.
Field procedure
Sampling
Adult individuals of the cladoceran species D. magnaand of the fish species G. affinis were collected in bothponds using a zooplankton and a hand net, respectively.Sampling comprised four episodes: summer (August2008), autumn (November 2008), winter (February2009) and spring (May 2009). In the laboratory, indi-vidual fish and pools of 15 daphnids were snap frozen inliquid nitrogen in microtubes and stored at −80 °C untilbiochemical marker analysis.
Determination of physicochemical parameters
At each sampling episode, water samples were col-lected for physicochemical characterization in thelaboratory. In the impossibility of immediate analy-sis, samples were frozen at −80 °C. Analyses wereperformed, using the Test Kit models from Hach, and
Fig. 1 Location of the study sites, in Aveiro, Portugal. Natural pond: 40° 37′ 57.4″N 8° 39′ 40.2″W; artificial pond: 40° 38′ 07.9″N 8° 39′33.4″ W
Environ Monit Assess (2015) 187:208 Page 3 of 13 208
the following parameters were determined: totalhardness (method 8226), alkalinity (method 8221),turbidity (method 8237), sulphides (method 8131),sulphates (method 8051), reactive phosphor (method8048), nitrites (method 8507), nitrates (method 8171)and ammonia (method 8038). Each parameter wasdetermined according to the methods described onthe Hach DR/2000 Spectrophotometer Handbook,and the measurements were made using a Hach DR/2000 Direct Reading Spectrophotometer.
Conductivity, pH, DO and T were measured in thefield at each sampling episode using portable meters (LF330, pH 330, OXI 330 and sets from WTW, Weilheim,Germany, respectively).
Element content of the water
For element analysis, water samples were acidified (pH<2) with nitric acid prior being frozen. The followingelements were analysed by inductively coupled plasmamass spectrometry (ICP-MS) at the certified CentralLaboratory of Analysis from the University of Aveiro(accreditation no. L0627-1): aluminium (Al), chromium(Cr), manganese (Mn), iron (Fe), cobalt (Co), nickel(Ni), copper (Cu), zinc (Zn), arsenic (As), mercury(Hg), cadmium (Cd) and lead (Pb).
Daphnia magna laboratory culture
As D. magna was only present at the AP, a lab culturewas taken as the control population. D. magna has beenreared in the Laboratory of Ecotoxicology atDepartment of Biology, University of Aveiro for morethan 10 years in American Society for Testing andMaterials (ASTM) hard water (ASTM 1980) enrichedwith an organic additive. The photoperiod is 16 h light/8 h dark and the T 20±1 °C. The culture media has atotal hardness of 175.41±5.53mg/LCaCO3, pH of 8.15±0.27 and a conductivity of 577.63±9.01 μS/cm.Medium was renewed three times per week, anddaphnids were fed daily with Chlorella vulgaris at aconcentration of 3.0×10⁵ cells/mL. Sampling forbiochemical marker analysis was done by pooling15 individuals (21 days old) originated from a thirdbrood in microtubes, which were then snap frozen inliquid nitrogen and stored at −80 °C until biochemicalmarker analysis.
Biochemical marker analyses
Post-mitochondrial supernatant
On the day of enzymatic analysis, samples weredefrosted on ice and adequate buffer solution added:Phosphate buffer (0.1 M, pH=7.4) was used for ChE,GST and CAT analysis, and Tris/NaCL buffer (0.1 M;pH=7.2) was used for LDH analysis. Amount of addedbuffer was 1.5 mL for fish replicates and 0.5 mL fordaphnid replicates. A minimum of eight replicates wasused per site. Each replicate was homogenized (using aYstral homogenizer) being kept in ice during the processand centrifuged at 10,000×g for 20 min (4 °C) in thecase of ChE or GST analyses and at 1700×g, 3 min(4 °C) in the case of LDH analyses. All the enzymaticassays were performed on the supernatant obtained.
Protein concentration
Protein concentration in the replicates was determinedin quadruplicate by the Bradford method (Bradford1976), at 595 nm, using γ-globulin as standard and thenadjusted to 0.5 mg/L of protein using the respectivebuffer to dilute. Final protein concentration was deter-mined again for confirmation.
Enzymatic analysis
Total ChE activity was determined at 414 nm accordingto the method of Ellman (Ellman et al. 1961), adapted tomicroplate (Guilhermino et al. 1996), using 0.05 mL ofhomogenate and 0.250 mL of the reaction solution(1 mL of 10 mM 5.50-dithiobis-2-nitrobenzoic acidsolution with sodium hydrogen carbonate, 0.2 mL of0.075 M acetylcholine solution and 30 mL of 0.1 Mphosphate buffer). Different ChE isoforms may be pres-ent in organisms. In this work, they will be genericallyreferred as ChE for both species studied although pre-vious work showed that in the case of Gambusia, thepredominant form is acetylcholinesterase (Nunes et al.2005) while in D. magna, both acetylcholinesterasesand pseudocholinesterases seem to co-exist(Diamantino et al. 2003).
GST activity was determined at 340 nm by the meth-od of Habig et al. (Habig et al. 1974), adapted to micro-plate (Frasco and Guilhermino 2002), using 0.1 mL ofhomogenate and 0.2 mL of the reaction mixture (10 mM
208 Page 4 of 13 Environ Monit Assess (2015) 187:208
reduced glutathione and 60 mM 1-chloro-2.4-dinitrobenzene).
LDH activity was determined at 340 nm by themethod of Vassault (Vassault 1983) adapted to micro-plate by Diamantino et al. (Diamantino et al. 2001),using 40 μL of homogenate, 250 μL of NADH(0.24 mM) and 40 μL of pyruvate (10 mM).
Enzymatic activities were determined in quadrupli-cate and expressed as nanomoles of substrate hydro-lysed per minute per milligram of protein. ALabsystem Multiskan EX microplate reader was usedfor all biochemical determinations.
Data processing
Statistical analysis
Sigma Stat 3.1 statistical package was used for statisticalanalyses (SPSS 2004). In the case of G. affinis, differ-ences in biochemical marker activities between ponds(natural vs artificial) and seasons were evaluated using atwo-way ANOVA followed by the Tukey test. In thecase of D. magna, differences in biochemical markeractivities between seasons were evaluated through one-way ANOVA fol lowed by the Tukey tes t .Transformation of data was done in the cases theKolmogorov-Smirnov normality test failed.
A redundancy analysis (RDA) was performed onendpoint datasets (as species data) including physico-chemical water parameters (as environmental data) fol-lowing the log-transformation of data.Multivariate anal-ysis was performed using CANOCO 4.5 (Ter Braak andSmilauer 2002).
Calculation of the integrated biochemical markerresponse
The integrated biochemical marker response is an indexwhich combines the responses of all biochemicalmarkers measured in the study. The calculation involvesa first step of data standardization which allows thedirect comparison of different biochemical marker re-sponses. Star plots are then used to represent the obtain-ed scores (standardized data) of a given biomarker atdifferent sampling episodes or the scores of all biochem-ical marker responses for a given sampling episode. Inthis later case, the area of the star plot is the integratedbiochemical marker response (IBR). The steps involvedin the calculation of scores and IBRs were performed as
described in Beliaeff and Burgeot (2002). IBR valueswere then divided by the number of biomarkers used (3)and consequently expressed as IBR/n, so that it can beused as a general biomarker index (as described inBroeg and Lehtonen (2006)). For the calculations ofthe scores, it has to be defined if a given biomarkerresponds to a situation of stress by increasing or de-creasing its activity. Thus, in this work, it was assumedthat an inhibition would occur in the case of ChE, and onthe contrary, GST and LDH would respond to stress byincreasing their activities.
Results
Physicochemical parameters and elements’ contentin the two ponds
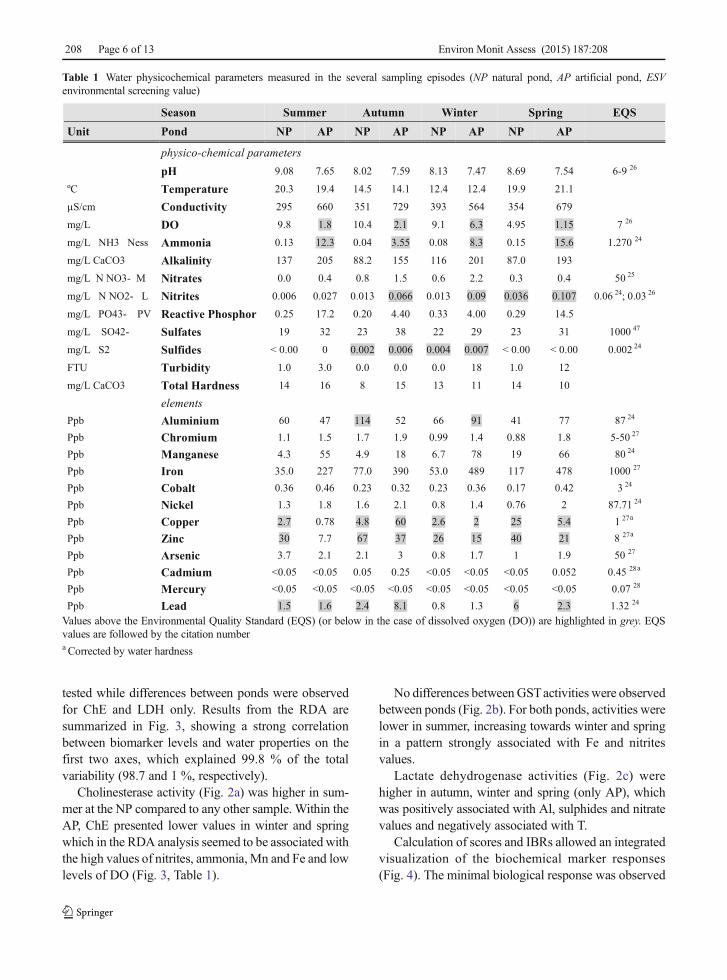
The artificial pond was characterized (especially inwarm seasons) by higher values of conductivity, ammo-nia, alkalinity, nitrates, nitrites, reactive phosphor, sul-phates and also the metals Mn and Fe while consistentlypresented lower values of pH, DO and Zn than thenatural pond. From these parameters, DO, ammoniaand nitrites are consistently above (or below in the caseof DO) the Environmental Quality Standards (EQS)established in the literature (EPA 1999; EuropeanCommission 2000; European Union 2006, 2008;UKTAG 2008), meaning that these factors can poten-tially behave as stress factors for aquatic life and that theecological fitness of the ecosystem can be threatened inthis lake (Table 1, highlighted values).
Regarding seasonality and for both ponds, parame-ters such as pH, T, ammonia and reactive phosphorreached higher values on summer and spring, whilesulphides, nitrates and Al reached higher values onwinter and autumn. Sulphides and Al are of specialconcern since they were above EQS values (Table 1).Metals such as Cr, Ni, Cu, Zi, and Pb showed anincrease in autumn; however, Cu, Zn and Pb were aboveEQS levels almost all the four seasons.
Gambusia affinis biochemical marker responses
Biochemical marker activities measured in G. affinisseemed to depend more on the season than on the pondexcept for some cases further to discuss (Fig. 2). Thetwo-way ANOVA performed (Table 2) indicated differ-ences between seasons for all biochemical markers
Environ Monit Assess (2015) 187:208 Page 5 of 13 208
tested while differences between ponds were observedfor ChE and LDH only. Results from the RDA aresummarized in Fig. 3, showing a strong correlationbetween biomarker levels and water properties on thefirst two axes, which explained 99.8 % of the totalvariability (98.7 and 1 %, respectively).
Cholinesterase activity (Fig. 2a) was higher in sum-mer at the NP compared to any other sample. Within theAP, ChE presented lower values in winter and springwhich in the RDA analysis seemed to be associated withthe high values of nitrites, ammonia, Mn and Fe and lowlevels of DO (Fig. 3, Table 1).
No differences betweenGSTactivities were observedbetween ponds (Fig. 2b). For both ponds, activities werelower in summer, increasing towards winter and springin a pattern strongly associated with Fe and nitritesvalues.
Lactate dehydrogenase activities (Fig. 2c) werehigher in autumn, winter and spring (only AP), whichwas positively associated with Al, sulphides and nitratevalues and negatively associated with T.
Calculation of scores and IBRs allowed an integratedvisualization of the biochemical marker responses(Fig. 4). The minimal biological response was observed
Table 1 Water physicochemical parameters measured in the several sampling episodes (NP natural pond, AP artificial pond, ESVenvironmental screening value)
Season Summer Autumn Winter Spring EQS
Unit Pond NP AP NP AP NP AP NP AP
physico-chemical parameterspH 9.08 7.65 8.02 7.59 8.13 7.47 8.69 7.54 6-9 26
ºC Temperature 20.3 19.4 14.5 14.1 12.4 12.4 19.9 21.1
µS/cm Conductivity 295 660 351 729 393 564 354 679
mg/L DO 9.8 1.8 10.4 2.1 9.1 6.3 4.95 1.15 7 26
mg/L NH3 Ness Ammonia 0.13 12.3 0.04 3.55 0.08 8.3 0.15 15.6 1.270 24
mg/L CaCO3 Alkalinity 137 205 88.2 155 116 201 87.0 193
mg/L N NO3- M Nitrates 0.0 0.4 0.8 1.5 0.6 2.2 0.3 0.4 50 25
mg/L N NO2- L Nitrites 0.006 0.027 0.013 0.066 0.013 0.09 0.036 0.107 0.06 24; 0.03 26
mg/L PO43- PV Reactive Phosphor 0.25 17.2 0.20 4.40 0.33 4.00 0.29 14.5
mg/L SO42- Sulfates 19 32 23 38 22 29 23 31 1000 47
mg/L S2 Sulfides < 0.00 0 0.002 0.006 0.004 0.007 < 0.00 < 0.00 0.002 24
FTU Turbidity 1.0 3.0 0.0 0.0 0.0 18 1.0 12
mg/L CaCO3 Total Hardness 14 16 8 15 13 11 14 10
elementsPpb Aluminium 60 47 114 52 66 91 41 77 87 24
Ppb Chromium 1.1 1.5 1.7 1.9 0.99 1.4 0.88 1.8 5-50 27
Ppb Manganese 4.3 55 4.9 18 6.7 78 19 66 80 24
Ppb Iron 35.0 227 77.0 390 53.0 489 117 478 1000 27
Ppb Cobalt 0.36 0.46 0.23 0.32 0.23 0.36 0.17 0.42 3 24
Ppb Nickel 1.3 1.8 1.6 2.1 0.8 1.4 0.76 2 87.71 24
Ppb Copper 2.7 0.78 4.8 60 2.6 2 25 5.4 1 27a
Ppb Zinc 30 7.7 67 37 26 15 40 21 8 27a
Ppb Arsenic 3.7 2.1 2.1 3 0.8 1.7 1 1.9 50 27
Ppb Cadmium <0.05 <0.05 0.05 0.25 <0.05 <0.05 <0.05 0.052 0.45 28a
Ppb Mercury <0.05 <0.05 <0.05 <0.05 <0.05 <0.05 <0.05 <0.05 0.07 28
Ppb Lead 1.5 1.6 2.4 8.1 0.8 1.3 6 2.3 1.32 24
Values above the Environmental Quality Standard (EQS) (or below in the case of dissolved oxygen (DO)) are highlighted in grey. EQSvalues are followed by the citation numbera Corrected by water hardness
208 Page 6 of 13 Environ Monit Assess (2015) 187:208

consistently for all biochemical markers in summer andthe maximal in the winter. This pattern of response wasvery similar between lakes, being howevermoremarkedin the AP. The IBR star plot confirms the same pattern(Fig. 4d).
Daphnia magna responses
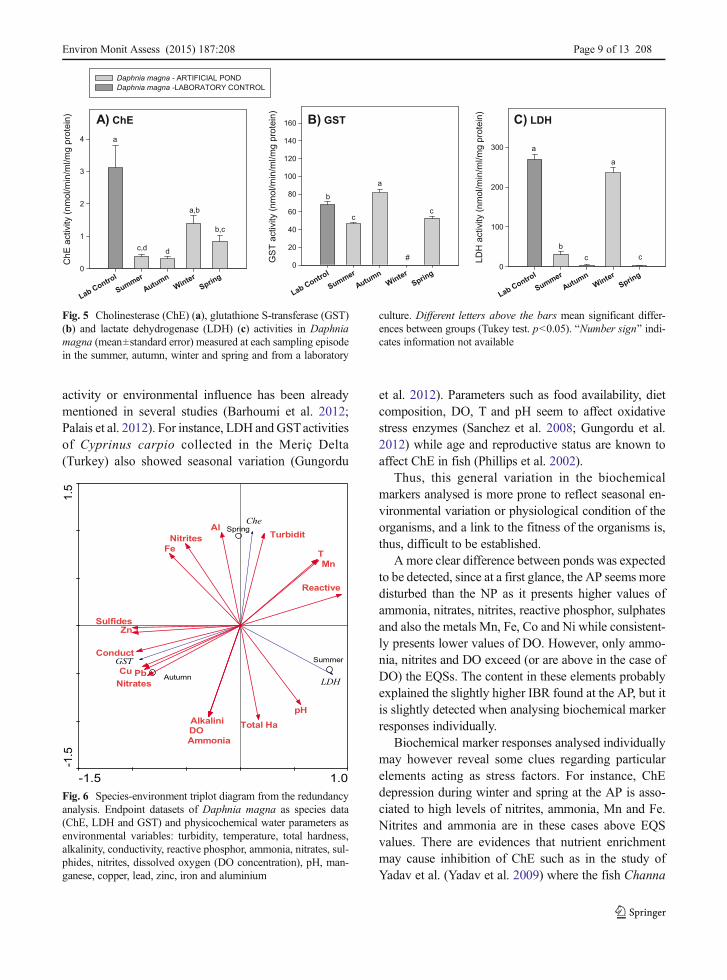
No daphnids were found in the NP; thus, results fromthe AP were compared with lab values as a referencecontrol (Fig. 5). The one-way ANOVA performed(Table 2) indicated differences between seasons for allbiochemical markers tested. The RDA (Fig. 6) couldonly be performed with data from summer, autumn andspring (due to lack of data for GST in the winter). Astrong correlation between biomarker levels and waterproperties on the first two axeswas observed, explaining100 % of the variability (81.6 and 18.4 %, respectively).
Cholinesterase activities (Fig. 5a) of daphnids collect-ed in the summer, autumn and spring were lower than theones from the lab control. In summer and spring, thisseemed to be associated with the low levels of DO andhigh levels of conductivity, T, reactive phosphorous andammonia while in autumn with the high levels of Cu, Znand Pb which are above EQS (Table 1). The high con-centrations of the metals Cu, Zn, Cd and Pb and As wasalso associated with the increased activity of GST in theautumn compared to values from lab culture (Fig. 5b andFig. 6); moreover, depression of GST activities in thesummer and spring seems to be associated with highertemperatures, reactive phosphorous and ammonia con-tents. LDH activity was higher in the lab control and inthe winter compared to the other seasons (Fig. 5c).
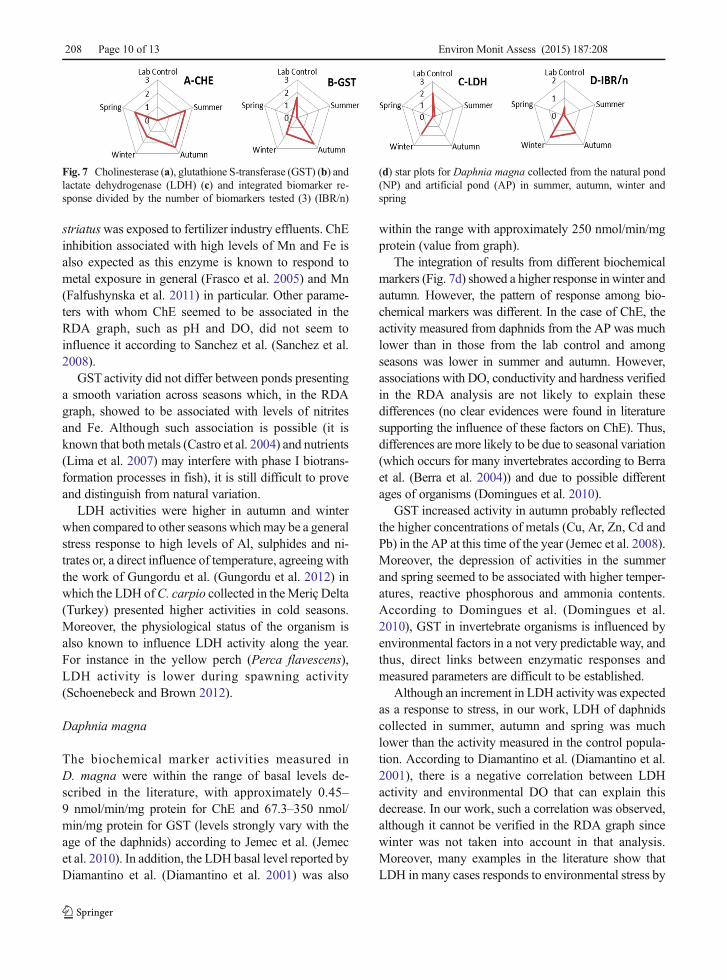
Due to missing data for GST in winter, star plotscould only be done for lab control, spring, summerand autumn (Fig. 7). The maximal biological responsewas observed in summer and autumn for AChE
A) ChE
summerAutumn
WinterSpring
ChE
act
ivity
(nm
ol/m
in/m
l/mg
prot
ein)
0
20
40
60
80
100
120
140
Gambusia affinis -NATURAL POND Gambusia affinis -ARTIFICIAL POND
B) GST
summerAutumn
WinterSpring
GST
act
ivity
(nm
ol/m
in/m
l/mg
prot
ein)
0
20
40
60
80
100
120
140 C) LDH
summerAutumn
WinterSpring
LDH
act
ivity
(nm
ol/m
in/m
l/mg
prot
ein)
0
200
400
600
800
1000
1200
1400
a
cc,d
d,e
b,c
b
d
b,c
e dc,d
b,c
a
aa,ba
b,cc
a
aa,b
c
aa
Fig. 2 Biomarker activities of Gambuzia affinis (mean±standard error) measured after each sampling episode. Different letters above thebars mean significant differences between groups (Tukey test, p<0.05)
Table 2 Analysis of variance of biomarker data for Gambuzia affinis and Daphnia magna from the natural and artificial ponds, during thesampling episodes (seasons)
Factors Two-way ANOVA of biomarker activities measured in G. affinis
ChE GST LDH
Season F3, 64=20.8; p<0.001 F3, 63=57.4; p<0.001 F3, 54=31.8; p<0.001
Pond F1, 64=125.5; p<0.001 F1, 63=3.2; p=0.079 F1, 54=9.01; p=0.004
Season × pond F3, 64=22.2; p<0.001 F3, 63=2.00; p=0.126 F3, 54=5.96; p=0.002
Factor One-way ANOVA of biomarker activities measured in D. magna
ChE (ln che) GST LDH (sqrt LDH)
Season F4, 35=22.1; p<0.001 F3, 28=34.0; p<0.001 F4, 36=378; p<0.001
ChE cholinesterase, GST glutathione S-transferase, LDH lactate dehydrogenase
Environ Monit Assess (2015) 187:208 Page 7 of 13 208

(Fig. 7a), in autumn for GST (Fig. 7b) and in the labsamples for LDH (Fig. 7c). Thus, each biomarker had aspecific pattern of response. IBR (Fig. 7d) showed thatthe response, when integrating all biochemical markersanalysed, was more intense in autumn.
Discussion
Gambusia affinis
The biochemical marker activities measured inG. affiniswere within the range of basal levels measured inGambusia holbrooki collected from reference sites in
the study of Castro et al. (Castro et al. 2004), of approx-imately 80, 40 and 300 nmol/min/mg protein for ChE,GST and LDH, respectively (values taken from graphs).
Biochemical markers measured in the two popula-tions of G. affinis showed to have a higher biologicalresponse in winter as indicated by the integrated bio-marker response (Fig. 4d), especially in the AP samples.However, this response did not seem to be associated toany particular chemical component present at that timeof the year but rather explained by natural seasonalenzymatic variation. Even elements that are aboveEQS such as sulphides, nitrites or some metallic ele-ments did not seem to sufficiently justify this winterresponse. Natural seasonal variation of enzymatic
0.10.1-
0.1
0.1
-
ChE
GST
LDH
SumNat
SumArt
AutNat
AutArt
WinNat
WinArt
SprNat
SprArt
Al
Mn
Fe
Cu
Zn
PbpH
T
Conduct
DO
Ammonia
Alkalini
Nitrates
Nitrites
Reactive
Sulfides
Turbidit
Total Ha
Fig. 3 Species-environmenttriplot diagram from theredundancy analysis. Endpointdatasets of Gambuzia affinis asspecies data (ChE, LDH andGST) and physicochemical waterparameters as environmentalvariables: turbidity, temperature,total hardness, alkalinity,conductivity, reactive phosphor,ammonia, nitrates, sulphides,nitrites, dissolved oxygen (DOconcentration), pH, manganese,copper, lead, zinc, iron andaluminium
Fig. 4 Cholinesterase (ChE) (a), glutathione S-transferase (GST)(b) and lactate dehydrogenase (LDH) (c) and integrated biomarkerresponse divided by the number of biomarkers tested (3) (IBR/n)
(d) star plots for Gambuzia affinis collected from the natural pond(NP) and artificial pond (AP) in summer, autumn, winter andspring
208 Page 8 of 13 Environ Monit Assess (2015) 187:208
activity or environmental influence has been alreadymentioned in several studies (Barhoumi et al. 2012;Palais et al. 2012). For instance, LDH andGSTactivitiesof Cyprinus carpio collected in the Meriç Delta(Turkey) also showed seasonal variation (Gungordu
et al. 2012). Parameters such as food availability, dietcomposition, DO, T and pH seem to affect oxidativestress enzymes (Sanchez et al. 2008; Gungordu et al.2012) while age and reproductive status are known toaffect ChE in fish (Phillips et al. 2002).
Thus, this general variation in the biochemicalmarkers analysed is more prone to reflect seasonal en-vironmental variation or physiological condition of theorganisms, and a link to the fitness of the organisms is,thus, difficult to be established.
A more clear difference between ponds was expectedto be detected, since at a first glance, the AP seems moredisturbed than the NP as it presents higher values ofammonia, nitrates, nitrites, reactive phosphor, sulphatesand also the metals Mn, Fe, Co and Ni while consistent-ly presents lower values of DO. However, only ammo-nia, nitrites and DO exceed (or are above in the case ofDO) the EQSs. The content in these elements probablyexplained the slightly higher IBR found at the AP, but itis slightly detected when analysing biochemical markerresponses individually.
Biochemical marker responses analysed individuallymay however reveal some clues regarding particularelements acting as stress factors. For instance, ChEdepression during winter and spring at the AP is asso-ciated to high levels of nitrites, ammonia, Mn and Fe.Nitrites and ammonia are in these cases above EQSvalues. There are evidences that nutrient enrichmentmay cause inhibition of ChE such as in the study ofYadav et al. (Yadav et al. 2009) where the fish Channa
A) ChE
Lab Control
SummerAutumn
WinterSpring
Ch
E a
ctivity (
nm
ol/m
in/m
l/m
g p
ro
tein
)
0
1
2
3
4
B) GST
Lab Control
SummerAutumn
WinterSpring
GS
T a
ctivity (
nm
ol/m
in/m
l/m
g p
ro
tein
)
0
20
40
60
80
100
120
140
160
Daphnia magna - ARTIFICIAL POND
Daphnia magna -LABORATORY CONTROL
C) LDH
Lab Control
SummerAutumn
WinterSpring
LD
H a
ctivity (
nm
ol/m
in/m
l/m
g p
ro
tein
)
0
100
200
300
b,c
a,b
c,d
a
d
a
c
c
b
#
a
b
c
a
c
Fig. 5 Cholinesterase (ChE) (a), glutathione S-transferase (GST)(b) and lactate dehydrogenase (LDH) (c) activities in Daphniamagna (mean±standard error) measured at each sampling episodein the summer, autumn, winter and spring and from a laboratory
culture. Different letters above the bars mean significant differ-ences between groups (Tukey test. p<0.05). BNumber sign^ indi-cates information not available
0.15.1-
5.1
5.1
-
Che
GST
LDH
Summer
Autumn
SpringAl
Mn
Fe
Cu
Zn
Pb
pH
T
Conduct
DOAmmonia
Alkalini
Nitrates
Nitrites
Reactive
Sulfides
Turbidit
Total Ha
Fig. 6 Species-environment triplot diagram from the redundancyanalysis. Endpoint datasets of Daphnia magna as species data(ChE, LDH and GST) and physicochemical water parameters asenvironmental variables: turbidity, temperature, total hardness,alkalinity, conductivity, reactive phosphor, ammonia, nitrates, sul-phides, nitrites, dissolved oxygen (DO concentration), pH, man-ganese, copper, lead, zinc, iron and aluminium
Environ Monit Assess (2015) 187:208 Page 9 of 13 208
striatuswas exposed to fertilizer industry effluents. ChEinhibition associated with high levels of Mn and Fe isalso expected as this enzyme is known to respond tometal exposure in general (Frasco et al. 2005) and Mn(Falfushynska et al. 2011) in particular. Other parame-ters with whom ChE seemed to be associated in theRDA graph, such as pH and DO, did not seem toinfluence it according to Sanchez et al. (Sanchez et al.2008).
GST activity did not differ between ponds presentinga smooth variation across seasons which, in the RDAgraph, showed to be associated with levels of nitritesand Fe. Although such association is possible (it isknown that bothmetals (Castro et al. 2004) and nutrients(Lima et al. 2007) may interfere with phase I biotrans-formation processes in fish), it is still difficult to proveand distinguish from natural variation.
LDH activities were higher in autumn and winterwhen compared to other seasons whichmay be a generalstress response to high levels of Al, sulphides and ni-trates or, a direct influence of temperature, agreeing withthe work of Gungordu et al. (Gungordu et al. 2012) inwhich the LDH ofC. carpio collected in theMeriç Delta(Turkey) presented higher activities in cold seasons.Moreover, the physiological status of the organism isalso known to influence LDH activity along the year.For instance in the yellow perch (Perca flavescens),LDH activity is lower during spawning activity(Schoenebeck and Brown 2012).
Daphnia magna
The biochemical marker activities measured inD. magna were within the range of basal levels de-scribed in the literature, with approximately 0.45–9 nmol/min/mg protein for ChE and 67.3–350 nmol/min/mg protein for GST (levels strongly vary with theage of the daphnids) according to Jemec et al. (Jemecet al. 2010). In addition, the LDH basal level reported byDiamantino et al. (Diamantino et al. 2001) was also
within the range with approximately 250 nmol/min/mgprotein (value from graph).
The integration of results from different biochemicalmarkers (Fig. 7d) showed a higher response in winter andautumn. However, the pattern of response among bio-chemical markers was different. In the case of ChE, theactivity measured from daphnids from the AP was muchlower than in those from the lab control and amongseasons was lower in summer and autumn. However,associations with DO, conductivity and hardness verifiedin the RDA analysis are not likely to explain thesedifferences (no clear evidences were found in literaturesupporting the influence of these factors on ChE). Thus,differences are more likely to be due to seasonal variation(which occurs for many invertebrates according to Berraet al. (Berra et al. 2004)) and due to possible differentages of organisms (Domingues et al. 2010).
GST increased activity in autumn probably reflectedthe higher concentrations of metals (Cu, Ar, Zn, Cd andPb) in the AP at this time of the year (Jemec et al. 2008).Moreover, the depression of activities in the summerand spring seemed to be associated with higher temper-atures, reactive phosphorous and ammonia contents.According to Domingues et al. (Domingues et al.2010), GST in invertebrate organisms is influenced byenvironmental factors in a not very predictable way, andthus, direct links between enzymatic responses andmeasured parameters are difficult to be established.
Although an increment in LDH activity was expectedas a response to stress, in our work, LDH of daphnidscollected in summer, autumn and spring was muchlower than the activity measured in the control popula-tion. According to Diamantino et al. (Diamantino et al.2001), there is a negative correlation between LDHactivity and environmental DO that can explain thisdecrease. In our work, such a correlation was observed,although it cannot be verified in the RDA graph sincewinter was not taken into account in that analysis.Moreover, many examples in the literature show thatLDH in many cases responds to environmental stress by
Fig. 7 Cholinesterase (a), glutathione S-transferase (GST) (b) andlactate dehydrogenase (LDH) (c) and integrated biomarker re-sponse divided by the number of biomarkers tested (3) (IBR/n)
(d) star plots for Daphnia magna collected from the natural pond(NP) and artificial pond (AP) in summer, autumn, winter andspring
208 Page 10 of 13 Environ Monit Assess (2015) 187:208

inhibiting and not inducing its activity (Coelho et al.2011; Barbosa et al. 2013).
For the AP, where a comparison of responses be-tween species can be done, it can be observed thatbiochemical markers were more responsive in winterforG. affinis and in autumn forD. magna. This suggeststhat biomonitoring programmes should contemplateanalyses of species belonging to different trophic levelsas different patterns of responses among species mayindicate different sensitivities and different risks associ-ated with the respective populations.
In this work, several stress factors were identified inboth ponds, including low levels of DO and ammonia(only in the AP) and nitrites, sulphides and metal ele-ments in both ponds. A clear response to these stressfactors was not possible to obtain by measuring ChE,GSTor LDH levels inG. affinis andD. magna collectedat the two sites. This happens because biochemicalmarkers, although able to respond to several types ofstress factors, are also related to natural environmentaltemporal and spatial variations being modulated bytemperature, food availability (Cailleaud et al. 2007)and physiological status of the organisms such as ageand reproductive status. This complex net of factorsmodulates biochemical marker basal levels, confound-ing the response to the identified stress factors. Thisinability to distinguish biochemical marker responsesto chemicals from responses to natural variability maycompromise their use in biomonitorization approaches(Kopecka and Pempkowiak 2008).
Besides natural variability, other factors not contem-plated in this study may be interfering with enzymaticresponses as it is the case of interactive effects betweenstress factors (chemical or environmental) that may alterthe expected toxicity (Ferreira et al. 2008; Ferreira et al.2010) and also the existence of other types of pollutantssuch as pesticides.
Besides the response to the parameters identified asstress factors (above EQS), a more clear response be-tween ponds was expected since they have very differ-ent water physicochemical properties especially in whatconcerns DO, ammonia, nitrites, reactive phosphorousand sulphates. Such differences were not reflected in theactivities of biomarkers measured suggesting that organ-isms are already well adapted to those environmentalconditions. To test the hypothesis that local organismsare physiologically adapted to the components (chemi-cal and environmental) identified, further work shouldinclude the deployment of laboratory organisms in both
sites or perform cross-transplant experiments to assessthe sensibilities at the two sites.
The IBR index was a useful tool especially in the caseof G. affinis where a difference between ponds could bedetected which was not very obvious by analysing bio-chemical markers individually. However, the mainshortcoming of this index is that the expected biomarkerbehaviour has to be predefined (induction or inhibition)while many times, particularly for LDH and GST, re-sponses to pollutants may be an inhibition, an inductionor both (bell-shape curve).
Conclusion
In this work, the levels of ChE, GST and LDH of naturalpopulations of G. affinis and D. magna were monitoredalong the year in two ponds with different physicochem-ical water properties. The pattern of biochemical markerresponses was not the same in the two species with higherIBR values in the winter for G. affinis and in the autumnfor D. magna, suggesting specificities that must be takeninto account in biomonitorization processes, by includingspecies representative of several trophic levels.
In the case of G. affinis, the differences verified inkey physicochemical parameters between the two ponds(especially DO levels) did not seem to affect biochem-ical marker levels as if organisms were already perfectlyadapted to their environment. On the other hand, sea-sonal variation of water quality and/or physiologicalstatus of the organisms may have an important role onbiochemical marker responses. Several parametersabove EQS were identified (e.g. DO, ammonia, nitrites,sulphides and metals), but eventual responses to thesestressors could not be discriminated from natural varia-tion. However, in particular cases, important associa-tions could be established as the one between inhibitionof ChE in winter and spring in G. affinis from the APand high levels of nitrites, ammonia, Mn and Fe; theinduction of GST activity in autumn in D. magna fromthe AP and high levels of metals and the decreased LDHactivity in summer, autumn and spring in D. magnafrom the AP and low DO levels.
Acknowledgments This study was supported by EuropeanFunds through COMPETE and National Funds through the Por-tuguese Science Foundation (FCT), within projects PEst-C/MAR/LA0017/2013 and ClimatoxFCOMP-01-0124-FEDER-027795(Ref. PTDC/AAG-GLO/4059/2012) and through a post-Doc grantto Inês Domingues (SFRH/BPD/90521/2012) and a PhD grant to
Environ Monit Assess (2015) 187:208 Page 11 of 13 208

Luísa Machado (SFRH/BD/43936/2008). Cátia Santos is a PhDfellow of the Special Research Fund (BOF) of Ghent University(Ref. B/13833/01-BOF13/DOC/034). A.M.V.M. Soares isBBolsista CAPES/BRASIL^, Project No. A058/2013. The authorsalso acknowledge the Ministry of Education and Ministry ofScience and Technology of Brazil through the program Sciencewithout Borders for the scholarship (BJT-A) provided to RhaulOliveira.
References
Adams, S. M. (2000). Assessing sources of stress to aquaticecosystems using integrated biomarkers. BiologicalResource Management: Connecting Science and Policy 17–29.
ASTM (1980). Standard practise for conducting acute toxicitytests with fishes, macroinvertebrates and amphibians. InE-729-80. American Standard for Testing and Materials,Philadelphia.
Barata, C., Damasio, J., Lopez, M. A., Kuster, M., de Alda,M. L., Barcelo, D., Riva, M. C., & Raldua, D. (2007).Combined use of biomarkers and in situ bioassays inDaphnia magna to monitor environmental hazards ofpesticides in the field. Environmental Toxicology andChemistry, 26, 370–379.
Barbosa, I., Lopes, S., Oliveira, R., Domingues, I., Soares, A., &Nogueira, A. (2013). Determination of 17α-methyltestosteronein freshwater samples of tilapia farming by high performanceliquid chromatography. American Journal of AnalyticalChemistry, 4, 207–211.
Barhoumi, S., Messaoudi, I., Gagne, F., & Kerkeni, A. (2012).Spatial and seasonal variability of some biomarkers inSalaria basilisca (Pisces: Blennidae): implication for bio-monitoring in Tunisian coasts. Ecological Indicators, 14,222–228.
Beliaeff, B., & Burgeot, T. (2002). Integrated biomarker response:a useful tool for ecological risk assessment. EnvironmentalToxicology and Chemistry, 21, 1316–1322.
Berra, E., Forcella, M., Giacchini, R., Marziali, L., Rossaro, B., &Parenti, P. (2004). Evaluation of enzyme biomarkers in fresh-water invertebrates from Taro and Ticino river, Italy. Annalesde Limnologie- International Journal of Limnology, 40(3),169–180.
Bradford, M. (1976). A rapid and sensitive method for the quan-tification of microgram quantities of protein utilizing theprinciple of protein dye-binding. Analytical Biochemistry,72, 248–254.
Broeg, K., & Lehtonen, K. (2006). Indices for the assessment ofenvironmental pollution of the Baltic Sea coasts: integratedassessment of a multi-biomarker approach.Marine PollutionBulletin, 53, 508–522.
Cailleaud, K., Maillet, G., Budzinski, H., Souissi, S., & Forget-Leray, J. (2007). Effects of salinity and temperature on theexpression of enzymatic biomarkers in Eurytemora affinis(Calanoida, Copepoda). Comparative Biochemistry andPhysiology. Part A, Molecular & Integrative Physiology,147, 841–849.
Castro, B. B., Sobral, O., Guilhermino, L., & Ribeiro, R. (2004).An in situ bioassay integrating individual and biochemicalresponses using small fish species. Ecotoxicology, 13, 667–681.
Chambers, J. E., Boone, J. S., Carr, R. L., Chambers, H. W., &Straus, D. L. (2002). Biomarkers as predictors in health andecological risk assessment. Human and Ecological RiskAssessment, 8, 165–176.
Charron, L., Geffard, O., Chaumot, A., Coulaud, R., Queau, H.,Geffard, A., & Dedourge-Geffard, O. (2013). Effect of waterquality and confounding factors on digestive enzyme activi-ties in Gammarus fossarum. Environmental Science andPollution Research, 20, 9044–9056.
Coelho, S., Oliveira, R., Pereira, S., Musso, C., Domingues, I.,Bhujel, R. C., Soares, A. M. V. M., & Nogueira, A. J. A.(2011). Assessing lethal and sub-lethal effects of trichlorfon ondifferent trophic levels. Aquatic Toxicology, 103, 191–198.
Diamantino, T. C., Almeida, E., Soares, A. M. V. M., &Guilhermino, L. (2001). Lactate dehydrogenase activity asan effect criterion in toxicity tests with Daphnia magnaStraus. Chemosphere, 45, 553–560.
Diamantino, T. C., Almeida, E., Soares, A. M. V. M., &Guilhermino, L. (2003). Characterization of cholinesteraseactivity from Daphnia magna Straus and their inhibition byzinc. Bulletin of Environmental Contamination andToxicology, 71, 219–225.
Domingues, I., Agra, A. R., Monaghan, K., Soares, A.M. V.M., &Nogueira, A. J. A. (2010). Cholinesterase and glutathione-S-transferase activities in freshwater invertebrates as bio-markers to assess pesticide contamination. EnvironmentalToxicology and Chemistry, 29, 5–18.
Ellman, G. L., Courtney, K. D., Andreas, V. J., & Featherstone, R.M. (1961). A new and rapid colorimetric determination ofacetylcholinesterase activi ty. Biochemistry andPharmacology, 7, 88–95.
EPA (1999). Ecological Screening Values (ESVs). In: Division ER(Ed.).
European Union (2006) Directive 2006/44/EC on the quality offresh waters needing protection or improvement in order tosupport fish life. In Council EPat (Ed.), Official Journal of theEuropean Union
European Union (2008) Directive 2008/105/EC on environmentalquality standards in the field of water policy, amending andsubsequently repealing Council Directives 82/176/EEC, 83/513/EEC, 84/156/EEC, 84/491/EEC, 86/280/EEC andamending Directive 2000/60/EC of the EuropeanParliament and of the Council. In: Council EPat (Ed.),Official Journal of the European Union.
European Commission (2000). ‘Nitrates’ Directive (91/676/EEC): Status and trends of aquatic environment andagricultural practice—development guide for MemberStates’ reports. In Environment D-Gf (Ed.), Office forOfficial Publications of the European Communities,Luxembourg.
Falfushinska, H., Loumbourdis, N., Romanchuk, L., & Stolyar, O.(2008). Validation of oxidative stress responses in two pop-ulations of frogs from Western Ukraine. Chemosphere, 73,1096–1101.
Falfushynska, H. I., Gnatyshyna, L. L., Stoliar, O. B., & Nam, Y.K. (2011). Various responses to copper and manganese ex-posure of Carassius auratus gibelio from two populations.
208 Page 12 of 13 Environ Monit Assess (2015) 187:208

Comparative Biochemistry and Physiology. C Toxicologyand Pharmacology, 154, 242–253.
Ferreira, A. L. G., Loureiro, S., & Soares, A. (2008). Toxicityprediction of binary combinations of cadmium, carbendazimand low dissolved oxygen on Daphnia magna. AquaticToxicology, 89, 28–39.
Ferreira, A. L. G., Serra, P., Soares, A. M. V. M., & Loureiro, S.(2010). The influence of natural stressors on the toxicity ofnickel to Daphnia magna. Environmental Science andPollution Research, 17, 1217–1229.
Frasco, M. F., & Guilhermino, L. (2002). Effects of dimethoateand beta-naphthoflavone on selected biomarkers of Poeciliareticulata. Fish Physiology and Biochemistry, 26, 149–156.
Frasco, M. F., Fournier, D., Carvalho, F., & Guilhermino, L.(2005). Do metals inhibit acetylcholinesterase (AChE)?Implementation of assay conditions for the use of AChEactivity as a biomarker of metal toxicity. Biomarkers, 10,360–375.
Guilhermino, L., Lopes, M. C., Carvalho, A. P., & Soares, A. M.V. M. (1996). Inhibition of acetylcholinesterase activity aseffect criterion in acute test with juvenile Daphnia magna.Chemosphere, 32, 727–738.
Gungordu, A., Erkmen, B., & Kolankaya, D. (2012). Evaluationof spatial and temporal changes in biomarker responses in thecommon carp (Cyprinus carpio L.) for biomonitoring theMeric Delta, Turkey. Environmental Toxicology andPharmacology, 33, 431–439.
Habig,W. H., Pabst,M. J., & Jakoby,W. B. (1974). Glutathione S-transferases—first enzymatic step on mercapturic acid for-mation. The Journal of Biological Chemistry, 249, 7130–7137.
Hyne, R. V., & Maher, W. A. (2003). Invertebrate biomarkers:links to toxicosis that predict population decline.Ecotoxicology and Environmental Safety, 54, 366–374.
Jemec, A., Tisler, T., Drobne, D., Sepcic, K., Jamnik, P., & Ros,M.(2008). Biochemical biomarkers in chronically metal-stressed daphnids. Comparative Biochemistry andPhysiology. C-Toxicology & Pharmacology, 147, 61–68.
Jemec, A., Drobne, D., Tisler, T., & Sepcic, K. (2010).Biochemical biomarkers in environmental studies—lessonslearnt from enzymes catalase, glutathione S-transferase andcholinesterase in two crustacean species. EnvironmentalScience and Pollution Research, 17, 571–581.
Kopecka, J., & Pempkowiak, J. (2008). Temporal and spatialvariations of selected biomarker activities in flounder(Platichthys flesus) collected in the Baltic proper.Ecotoxicology and Environmental Safety, 70, 379–391.
Lima, I., Moreira, S. M., Rendon-Von Osten, J., Soares, A. M. V.M., & Guilhermino, L. (2007). Biochemical responses of themarine mussel Mytilus galloprovincialis to petrochemicalenvironmental contamination along the North-western coastof Portugal. Chemosphere, 66, 1230–1242.
Morgan, A. J., Sturzenbaum, S. R., & Kille, P. (1999). A shortoverview of molecular biomarker strategies with particularregard to recent developments in earthworms. Pedobiologia,43, 574–584.
NRC. (1987). National Research Council Committee onBiological Markers. Biological markers in environmentalhealth research. Environmental Health Perspectives, 74, 3–9.
Nunes, B., Carvalho, F., & Guilhermino, L. (2005).Characterization and use of the total head soluble
cholinesterases from mosquitofish (Gambusia holbrooki)for screening of anticholinesterase activity. Journal ofEnzyme Inhibition and Medicinal Chemistry, 20, 369–376.
Olsen, T., Ellerbeck, L., Fisher, T., Callaghan, A., & Crane, M.(2001). Variability in acetylcholinesterase and glutathione S-transferase activities in Chironomus riparius meigen de-ployed in situ at uncontaminated field sites. EnvironmentalToxicology and Chemistry, 20, 1725–1732.
Palais, F., Dedourge-Geffard, O., Beaudon, A., Pain-Devin, S.,Trapp, J., Geffard, O., Noury, P., Gourlay-France, C., Uher,E., Mouneyrac, C., Biagianti-Risbourg, S., & Geffard, A.(2012). One-year monitoring of core biomarker and digestiveenzyme responses in transplanted zebra mussels (Dreissenapolymorpha). Ecotoxicology, 21, 888–905.
Phillips, T. A., Summerfelt, R. C., & Atchison, G. J. (2002).Environmental, biological, and methodological factors af-fecting cholinesterase activity in walleye (Stizostedionvitreum). Archives of Environmental Contamination andToxicology, 43, 75–80.
Sanchez, W., & Porcher, J. M. (2009). Fish biomarkers for envi-ronmental monitoring within the Water Framework Directiveof the European Union. Trends in Analytical Chemistry, 28,150–158.
Sanchez, W., Piccini, B., Ditche, J. M., & Porcher, J. M. (2008).Assessment of seasonal variability of biomarkers in three-spined stickleback (Gasterosteus aculeatus L.) from a lowcontaminated stream: Implication for environmental biomon-itoring. Environment International, 34, 791–798.
Schoenebeck, C. W., & Brown, M. L. (2012). Does anaerobicactivity differ seasonally or between sexesin yellow perchpopulations? Transactions of the American Fisheries Society,141, 199–203.
SPSS (2004) Sigma Stat for Windows (version 3.10). In Chicago:SPSS Inc.
Ter Braak C. J. F. , & Smilauer, P. (2002). CANOCO referencemanual and CanoDraw for Windows user's guide: Softwarefor Canonical Community Ordination (Version 4.5). InMicrocomputer Power. Ithaca
UKTAG (2008) Proposals for environmental quality standards forannex VIII substances. In Book Revised June 2008 (SR1 -2007). UK Technical Advisory Group on the WaterFramework Directive.
Vassault, A. (1983). Lactate Dehydrogenase. In H. O. Bergmeyer(Ed.), Methods of enzymatic analysis, enzymes:Oxirreductases transferases, Book III. New York:Academic Press.
Vidal, M. L., Basseres, A., & Narbonne, J. F. (2002). Influence oftemperature, pH, oxygenation, water-type and substrate onbiomarker responses in the freshwater clam Corbiculafluminea (Muller). Comparative Biochemistry andPhysiology. C-Toxicology & Pharmacology, 132, 93–104.
WorldHealth Organization (2001).Biomarkers in risk assessment:Validity and validation. Environmental Health Criteria 222.Geneva: World Health Organization. 238 pp [online].Available: http://www.inchem.org/documents/ehc/ehc/ehc222.htm.
Yadav, A., Gopesh, A., Pandey, R., Rai, D., & Sharma, B.(2009). Acetylcholinesterase: a potential biochemical in-dicator for biomonitoring of fertilizer industry effluenttoxicity in freshwater teleost, Channa striatus.Ecotoxicology, 18, 325–333.
Environ Monit Assess (2015) 187:208 Page 13 of 13 208


