Embed Size (px)
Citation preview
Andreia Filipa de Moura Fernandes
STUDIES ON SECONDARY SCINTILLATION FROM XENON ADMIXTURES WITH HELIUM
December 2020
PhD thesis in Physics Engineering, in the field of Instrumentation, performed under scientific guidance of Doutora Cristina Maria Bernardes Monteiro and Doutor Carlos Alberto de Oliveira Henriques, presented to the Physics Department of the Faculty of Sciences and Technology of the
University of Coimbra

UNIVERSIDADE DE COIMBRA
FACULDADE DE CIÊNCIAS E TECNOLOGIA
DEPARTAMENTO DE FÍSICA
STUDIES ON SECONDARY SCINTILLATION FROM
XENON ADMIXTURES WITH HELIUM
Andreia Filipa de Moura Fernandes
PhD thesis in Physics Engineering, in the field of Instrumentation, performed underscientific guidance of Doutora Cristina Maria Bernardes Monteiro and Doutor
Carlos Alberto de Oliveira Henriques, presented to the Physics Department of theFaculty of Sciences and Technology of the University of Coimbra
Coimbra, December 2020

Acknowledgements
I would like to express my deep gratitude to Doutora Cristina Monteiro,my research supervisor, for her patient guidance, enthusiastic encouragementand useful critiques of this work, as well as to Doutor Carlos Henriques, myresearch co-supervisor, for his valuable and constructive suggestions duringthe planning and development of this work, for his friendship, availability andpatience. His willingness to give his time so generously has been very muchappreciated.
I would also like to thank Professor Joaquim Santos, for his advice andassistance in keeping my progress, and for so generously teach me and helpme with the data analysis and the whole experimental campaign as well. Mygrateful thanks are also extended to Doutor Luís Fernandes who accompaniedme for a long time, for his support and availability.
My special thanks are extended to NEXT, specially to Professor Juan JoséGomez-Cadenas for the opportunity given so I could work on this projectand be part of the amazing team that NEXT Collaboration is. The assistanceprovided by Doutor Carlos Azevedo was greatly appreciated.
I would also like to extend my thanks to the technicians of GIANdepartment, Doutor Fernando Amaro, Doutora Elisabete Freitas for theirhelp in offering me the resources in running the program. I wish toacknowledge the help provided by Daniel Mano and Pedro Silva, I’m reallygrateful for their contribution, knowledge sharing and for making me feelpart of this team since the very first day.
I would like to offer my deep gratitude to Lieutenant Colonel Rui Rochafor allowing me some time to work on this project and mainly for not doubtme and my abilities to successfully fulfil my mission.
I am particularly grateful for the advice given by Rodrigo Cardoso andLieutenant João Ramos, who accompanied me and gave me the strength Ineeded in the most critical moments.
To Liliana Rebelo for her unconditional friendship, Mariana Jaloto, awonderful person, and 2nd Lieutenant Rita Amaral, the most amazing girlsI’ve met so far, who have been a great help in this whole journey. A sincereacknowledge to Diogo Bastos, Felipe Trenk, Manuel Garrido and 2nd
Lieutenant Fábio Simões, for their friendship and willingness for helpwhenever they could.
Finally, I wish to thank my parents, Teresa Fernandes and MessiasFernandes for their support and encouragement throughout this journey, foralways being present at their own way. And my brother Paulo Fernandes forinspiring me every single day and mainly for have not doubted me, allowingme to get here. I hope to make you all proud.
i

ii
Abstract
High Pressure Time Projection Chambers (HP-TPC) based on secondaryscintillation, also called electroluminescence (EL) signal amplification arebeing proposed for rare event detection, such as directional dark mattersearch, double electron capture and double beta decay detection. In the lastfew years, the Neutrino Experiment with a Xenon-based TPC (NEXT) hasbeen developing its technology, achieving an energy resolution < 1 % FWHMat the Qββ of the double beta decay of 136Xe, 2458 keV. The good energyresolution, the use of the event topology reconstruction for improvedbackground suppression and the possibility to scale up to larger masses arethe main strengths for the success of this experiment.
The discrimination of the rare event through its topological signature ofprimary ionisation trails is a major asset for this type of TPC when comparedto liquid or double phase TPCs. However, it is limited mainly by the highelectron diffusion in pure xenon. In order to overcome this limitation, somestudies have been performed with the addition of sub-percent concentrationsof molecular species to xenon in order to reduce the electron diffusion. Fromthe studied species, CH4 appears to be a good candidate, since it allows toachieve a good energy resolution, as well as a good electron cooling efficiency.Nevertheless, the continuity of studies with additives to be used with xenon,to decrease the electron diffusion, has a primordial importance for thisexperiment.
Recently, simulation studies have shown that helium can also be apotential candidate for reducing the electron diffusion in xenon-basedmixtures. Therefore, the use of helium as an additive to pure xenon has beenassessed, since its characteristics as a noble gas are a major advantage, e.g. interms of gas purification and, in opposition to xenon admixtures withmolecular additives, where the high quenching of xenon excited states anddissociative electron attachment induced by some molecular species will notoccur in helium. Therefore, the EL output of xenon-helium mixtures isexpected to be similar as that of pure xenon. Thus, the helium admixtureswith xenon might be an attractive solution to significantly reduce the electrondiffusion and improve the discrimination efficiency of these optical TPCs.
Experimental studies of the impact of helium addition to xenon on the gasEL yield and on the respective EL statistical fluctuations have not yet beencarried out, being, thus, of great importance to investigate these issues. In thiswork, the electroluminescence yield of Xe-He mixtures in the range of 0 to 30% helium is investigated. The impact of helium addition on the gas EL outputis demonstrated to be small and its impact on the EL statistical fluctuations hasbeen found to be negligible, within the experimental uncertainties.
iii
The EL yield is reduced by ~2%, 3%, 6% and 10% for 10%, 15%, 20% and30% of helium concentration, respectively, for a typical reduced electric fieldof 2.5 kV/cm/bar in the scintillation region. This decrease is lower than hadbeen anticipated by the most recent simulation data presented in theliterature. Furthermore, it was demonstrated that the energy resolutionremains unchanged, relative to that obtained in pure xenon. Nevertheless,there is a disadvantage with the TPC operation at higher pressures havingmore than 10-20 % helium concentrations, because the amount of xenonavailable as source of neutrinoless double beta decay will be reduced, incontrast to the addition of sub-percent levels of molecular additives, wherethe amount of xenon remains the same, an issue that will also be discussed inthe present work.
The present PhD project will have impact on the choice of the NEXT-100detector technology and, in addition, its relevance goes beyond NEXT, being ofrelevance to any HPXe optical TPC where the reduction of electron diffusion isof significant importance. Moreover, the present results are a main benchmarkfor the simulation tools to be applied to future optical TPCs based on Xe-Hemixtures.
Keywords: Gas Scintillation Proportional Counter, secondary scintillation,helium, Time Projection Chamber, electron diffusion, Xe scintillation, opticalHPXe TPC, Xe additives, Neutrinoless double beta decay, rare event detection.
iv
Resumo
As câmaras de projeção temporal de alta pressão (HP-TPC) baseadas emcintilação secundária, também chamada de sinal de amplificação poreletroluminescência (EL) têm sido propostas para deteção de eventos raros,tais como pesquisas sobre matéria negra direcional, decaimento por duplacaptura de eletrões, e deteção do decaimento beta duplo. Nos últimos anos, acolaboração NEXT (Neutrino Experiment with a Xenon TPC) tem vindo adesenvolver a sua tecnologia baseada num HP-TPC, tendo já atingido umaresolução em energia < 1 % FWHM para a energia, Qββ, do decaimento betaduplo do 136Xe, 2458 keV. A boa resolução em energia, a utilização dareconstrução topológica dos eventos para uma supressão de fundo e apossibilidade de escalar para grandes massas são os principais pontos fortespara o sucesso desta experiência.
A discriminação dos eventos raros através da sua assinatura topológica dorasto da ionização primária é um grande trunfo para este tipo de TPC, quandocomparado com TPCs de fase líquida ou dupla. Contudo, esta discriminaçãoestá limitada principalmente pela elevada difusão de eletrões em xénon puro.De forma a ultrapassar esta limitação, têm sido realizados alguns estudos comadição ao xénon de espécies moleculares com concentrações sub-percentuais,de forma a reduzir a difusão de eletrões. Das espécies moleculares estudadas,o CH4 parece ser um bom candidato, uma vez que permite a obtenção de umaboa resolução em energia, assim como uma boa eficiência no arrefecimento doseletrões. Não obstante, a continuação dos estudos com aditivos a ser usadoscom xénon para reduzir a difusão de eletrões tem uma importância primordialpara esta experiência.
Recentemente, estudos de simulação têm mostrado que o hélio pode serum potencial candidato para reduzir a difusão de eletrões em misturasbaseadas em xénon. Portanto, a utilização do hélio como aditivo ao xénonpuro tem vindo a ser avaliada, já que as suas características como gás nobresão uma grande vantagem, e.g. em termos de purificação do gás, e emoposição às misturas de xénon com aditivos moleculares, onde os efeitos deinibição dos estados excitados de xénon e perda de eletrões induzidos porespécies moleculares não vão ocorrer em hélio. Portanto, é expectável que oresultado de eletroluminescência das misturas de xénon-hélio seja semelhanteao do xénon puro. Por conseguinte, as misturas de hélio com xénon podemser uma solução atrativa para reduzir significativamente a difusão de eletrõese melhorar a eficiência de discriminação destas TPCs óticas.
Estudos experimentais do impacto da adição de hélio ao xénon norendimento de eletroluminescência do gás e nas respetivas flutuaçõesestatísticas da eletroluminescência ainda não foram realizados, sendo, desta
v
maneira, de grande importância para a investigação destas questões. Nestetrabalho, o rendimento de eletroluminescência de misturas de Xe-He éinvestigado para hélio em quantidades de 0 a 30 %. É demonstrado que oimpacto da adição de hélio no resultado da eletroluminescência no gás épequeno e o seu impacto nas flutuações estatísticas de eletroluminescência foiigualmente demonstrado ser insignificante, dentro das incertezasexperimentais.
O rendimento de eletroluminescência é reduzido em ~2%, 3%, 6% e 10%para concentrações de hélio de 10%, 15%, 20% e 30%, respetivamente, e paraum campo elétrico reduzido típico de 2.5 kV/cm/bar na região de cintilação.Esta diminuição é menor do que tinha sido antecipado pelos dados maisrecentes de simulações apresentados na literatura. Além disso, ficoudemonstrado que a resolução em energia se mantém inalterada, relativamenteàquela obtida em xénon puro. Não obstante, existe uma desvantagem com aoperação de uma HP-TPC contendo hélio em concentrações de 10-20 %,porque a quantidade de xénon disponível como fonte do decaimento betaduplo sem emissão de neutrinos vai ser menor, em contraste com a adição anível sub-percentual de aditivos moleculares, onde a quantidade de xénon semantém igual, um problema que também será discutido no presente trabalho.
O presente projeto de doutoramento terá impacto na escolha da tecnologiado detetor NEXT-100 e, além disso, a sua relevância vai além do NEXT, sendode relevância para qualquer TPC ótico de xénon de alta pressão, onde aredução da difusão de eletrões tem uma importância significativa. Alémdisso, os presentes resultados são uma marca de referência importante paraferramentas de simulação a ser aplicadas em futuras TPCs óticas baseadas emmisturas de Xe-He.
Keywords: Contador gasoso de cintilação proporcional, cintilaçãosecundária, hélio, Câmara de projeção temporal, difusão de eletrões,cintilação em xénon, TPC ótica de xénon a alta pressão, aditivos para Xe,decaimento beta duplo sem emissão de neutrinos, deteção de eventos raros.
vi
Contents
Acknowledgements i
Abstract iii
Resumo v
Nomenclature ix
1 Introduction 1
2 Neutrinoless double beta decay 92.1 Majorana neutrinos . . . . . . . . . . . . . . . . . . . . . . . . . . 92.2 Neutrinoless double beta decay . . . . . . . . . . . . . . . . . . . 92.3 Current experiments on double beta decay studies . . . . . . . . 10
3 The NEXT Experiment 153.1 The NEXT experiment roadmap . . . . . . . . . . . . . . . . . . . 15
3.1.1 The NEXT detector . . . . . . . . . . . . . . . . . . . . . . 163.1.2 Background . . . . . . . . . . . . . . . . . . . . . . . . . . 20
3.2 Topological signature . . . . . . . . . . . . . . . . . . . . . . . . . 223.2.1 Limitations in the tracking plane . . . . . . . . . . . . . . 24
3.3 Topology reconstruction . . . . . . . . . . . . . . . . . . . . . . . 243.3.1 NEXT prototypes results . . . . . . . . . . . . . . . . . . . 25
3.4 Electron diffusion . . . . . . . . . . . . . . . . . . . . . . . . . . . 273.5 Molecular additives . . . . . . . . . . . . . . . . . . . . . . . . . . 29
3.5.1 Scintillation with molecular additives . . . . . . . . . . . 303.5.2 Previous studies with molecular additives . . . . . . . . . 31
4 Electroluminescence in noble gases 374.1 Primary scintillation . . . . . . . . . . . . . . . . . . . . . . . . . 374.2 Secondary scintillation . . . . . . . . . . . . . . . . . . . . . . . . 38
4.2.1 Electroluminescence yield . . . . . . . . . . . . . . . . . . 394.3 Energy resolution . . . . . . . . . . . . . . . . . . . . . . . . . . . 40
5 Helium 455.1 Previous studies with helium . . . . . . . . . . . . . . . . . . . . 46
5.1.1 Diffusion . . . . . . . . . . . . . . . . . . . . . . . . . . . . 465.1.2 Drift velocity . . . . . . . . . . . . . . . . . . . . . . . . . . 505.1.3 Energy resolution . . . . . . . . . . . . . . . . . . . . . . . 505.1.4 Primary scintillation . . . . . . . . . . . . . . . . . . . . . 515.1.5 Electroluminescence yield . . . . . . . . . . . . . . . . . . 51
6 Experimental setup and methodology 53
vii
6.1 Experimental setup . . . . . . . . . . . . . . . . . . . . . . . . . . 536.1.1 Gas mixture system . . . . . . . . . . . . . . . . . . . . . . 55
6.2 Experimental methodology . . . . . . . . . . . . . . . . . . . . . 566.2.1 Gas mixing procedure . . . . . . . . . . . . . . . . . . . . 566.2.2 Data taking and analysis methodology . . . . . . . . . . . 576.2.3 Waveform analysis methodology . . . . . . . . . . . . . . 59
7 Experimental results: validation of the experimental methodologyand obtained results 637.1 GPSC performance with pure xenon filling . . . . . . . . . . . . 637.2 Intrinsic energy resolution . . . . . . . . . . . . . . . . . . . . . . 66
8 Experimental results: Xe-He mixtures 718.1 Electroluminescence yield . . . . . . . . . . . . . . . . . . . . . . 718.2 Energy resolution . . . . . . . . . . . . . . . . . . . . . . . . . . . 74
8.2.1 Intrinsic energy resolution . . . . . . . . . . . . . . . . . . 76
9 Drift velocity and longitudinal diffusion 799.1 Primary scintillation: x-rays . . . . . . . . . . . . . . . . . . . . . 809.2 Primary scintillation: alpha particles . . . . . . . . . . . . . . . . 829.3 Electric field . . . . . . . . . . . . . . . . . . . . . . . . . . . . . . 859.4 Electron transport theory . . . . . . . . . . . . . . . . . . . . . . . 869.5 Geometric efficiency . . . . . . . . . . . . . . . . . . . . . . . . . 879.6 Electronics and xenon scintillation . . . . . . . . . . . . . . . . . 879.7 Waveforms simulation . . . . . . . . . . . . . . . . . . . . . . . . 889.8 Results: electron drift time . . . . . . . . . . . . . . . . . . . . . . 899.9 Results: longitudinal electron cloud size . . . . . . . . . . . . . . 91
10 The relevance of helium contrasting with molecular mixtures 93
11 General conclusions 9711.1 Future work . . . . . . . . . . . . . . . . . . . . . . . . . . . . . . 99
List of Figures 103
Bibliography 107
viii
Nomenclature
ββ0ν Neutrinoless double beta decay
ββ2ν Standard neutrino mode of double beta decay
APD Avalanche Photodiode
CL Confidence level
CUORE Cryogenic Underground Observatory for Rare Events
DBD Double Beta Decay
EL Electroluminescence
ER Energy Resolution
EXO Enriched Xenon Observatory
F Fano factor
FWHM Full Width at Half Maximum
GPSC Gas Proportional Scintillation Counter
HPXe High Pressure Xenon
ITO Indium Tin Oxide
LAAPD Large Area Avalanche Photodiode
LN2 Liquid Nitrogen
LSC Laboratorio Subterráneo de Canfranc
LXe Liquid Xenon
MCA Multi-Channel Analyser
MIP Minimum Ionising Particle
NBrS Neutral Bremsstrahlung
NEW NEXT-White
NEXT Neutrino Experiment with a Xenon-based TPC
NIR Near Infra-red Region
PMT Photomultiplier Tube
ix

Qββ Energy released in the ββ decay
R-T Ramsauer–Townsend
RAS Radon Abatement System
ROI Region Of Interest
S1 Primary scintillation signal
S2 Secondary scintillation signal
SiPM Silicon Photomultiplier
SRIM Stopping and Range of Ions in Matter
TPC Time Projection Chamber
VUV Vacuum Ultra Violet
x
Chapter 1
Introduction
At present, whether we consider the Majorana or Dirac nature of DarkMatter and Neutrinos, they both hold a major importance for humanknowledge. Neutrinos can have a Majorana-type mass and be its ownantiparticle. If this statement is true, the neutrinoless double beta decay(ββ0ν) is allowed, since the two emitted anti-neutrinos can annihilate eachother and only two electrons are emitted. While the two-neutrino mode ofdouble beta decay (ββ2ν) has already been measured in several isotopes, theneutrinoless mode remains unobserved and holds important implicationsregarding the neutrinos nature. The unambiguous observation of this decaywould demonstrate leptonic number violation and prove the Majorana natureof neutrino, presenting a breakthrough for new physics, beyond the StandardModel.
Since the ββ0ν decay mode is very slow, when compared to other sourcesof background, as well as to the ββ2ν decay mode, the experimentalrequirement for the energy resolution achieved in the Time ProjectionChamber (TPC) is significantly stringent. Neutrinoless double beta decayevents are detected by the sum of the kinetic energies released by the twoelectrons, which is always the same and equal to the mass difference betweenthe original nucleus mass and the one created in the process (Qββ - the energyreleased in ββ decay). Due to the finite energy resolution of any detector,ββ0ν events are reconstructed within an energy range centred at Qββ,typically following a Gaussian distribution. However, there are otherprocesses occurring inside the detector that may fall in that energy range,contributing to the background and compromising the experiment sensitivity.This drawback can only be suppressed by means of good energy resolution,and additional experimental signatures that allow the signal distinctionagainst the background, mandatory for a good outcome.
In order to address these issues, xenon optical-TPCs based on thepromotion of secondary scintillation and its readout as a mean for theamplification of the primary ionisation signal resulting from the radiation
1
interaction are being developed for rare event detection, such as directionaldark matter [1–3] and double beta decay (DBD) detection [4, 5]. Many of theseexperiments involve operation in high pressure xenon (HPXe).
Xenon has no long-lived radioactive isotopes and is intrinsicallyradioactive clean. It has two natural occurring isotopes, namely: 134Xe and136Xe which can decay by ββ processes with Qββ equal to 825 keV and 2458keV, respectively [6]. A high Q-value is preferred, since the radioactivebackgrounds are less abundant for higher energies. Therefore, the highQ-value of 136Xe, its relatively high natural abundance and the relativelyinexpensive and simple enrichment process of this isotope [7], as well as thestraightforward scalability offered by xenon as target and, simultaneously,detector medium, make the 136Xe isotope a very suitable choice for the ββ0ν
studies. The scalability of xenon is an advantage for covering the entireinverted hierarchy, which will require ton-scale xenon masses in order toreach a sensitivity of about 15 meV for the effective Majorana mass of theelectron neutrino.
Taking into account that the energy resolution achieved in xenon is muchbetter in the gas phase than in liquid, xenon is characterised by a small Fanofactor (F - the ionisation fluctuations resulting from a given interaction eventhave a sub-Poissonian behaviour) [8], operation in HPXe is favoured relativeto liquid xenon (LXe). In addition, ββ0ν event detection in the gas phaseallows for discrimination of the rare event through its topological signature,as demonstrated for double electron capture and double beta decay detection[9–13], which is much more effective when compared to LXe-based TPCs dueto the reduced dimensions of the ionisation traces in LXe. A typical ββ0ν
event interaction results in a continuous trail of ionisations, produced by thetwo electrons emitted in opposite directions, with a Bragg peak appearing atboth ends of the ionisation trail. The determination of two Bragg peaks at theend of a single continuous ionisation trail is an effective tool for ββ0ν
discrimination against gamma-ray interactions, which result in ionisationtrails having only one Bragg peak at one of the ends, as a consequence of thephotoelectron or Compton electron emission resulting from the gamma-rayinteraction. Nevertheless, it is noted that the background due to ββ2ν eventscannot be discriminated by topology, being a low energy resolution the onlymean for reducing the background of these events.
As a detection medium, xenon provides primary signals of both primaryscintillation and ionisation [14], resulting from radiation interactions. Inoptical-TPCs the primary scintillation provides the t0 signal of the event, i.e.the start-of-event time-stamp, while the primary electrons produced along thetrail of the ionising particles are drifted towards a scintillation region by a
2
weak electric field (of the order of few tens of V/cm/bar). In the scintillationregion, the electrons are accelerated by a high electric field (of the order of fewkV/cm/bar). Upon crossing this region, each electron attains, from theelectric field, enough kinetic energy to excite but not ionise the gas atoms, byelectron impact, leading to high scintillation-output (electroluminescence -EL) ensuing the gas deexcitation processes, without charge avalancheformation.
The amplification of ionisation electron signals through xenonelectroluminescence allows the achievement of both higher detectorsignal-to-noise ratio [6, 7], due to the additional gain of the photosensor, andlower statistical fluctuations, when compared to charge avalanchemultiplication [8]. At 10 bar, the best energy resolution achieved with a 1 kgscale prototype based on Micromegas was extrapolated to around 3%-Fullwidth at half maximum (FWHM) at the xenon Qββ [15], while a 1 kg- and a 10kg-scale EL-based TPC achieved energy resolution values consistently below1%-FWHM [16, 17]. In addition, the EL readout by means of photosensorselectrically and mechanically decouples the amplification region from thereadout, providing a system that is more immune to electronic noise,radiofrequency pickup and high voltage inconveniences.
The x- and y-positions of the primary electrons arriving at the EL region aredetermined by reading out the EL with a 2D-pixelated plane of photosensorswhile, from the difference in time between the primary scintillation and the ELpulses, the z-position at which the primary electrons have been produced canbe determined.
EL yield values for xenon and argon have been measured for uniformelectric fields [18–21], as well as for electron avalanches produced in modernmicropatterned electron multipliers, e.g. GEM, THGEM, MHSP andMicromegas [15, 22, 23].
It is to be noted that the excellent energy resolution that can be obtainedwith the EL readout, e.g. needed for efficient background discrimination inββ0ν detection, is only reached for the EL produced in electric fields of valuesthat are below or near the onset of electron multiplication. The statisticalfluctuations in the EL produced at electric field values below the onset ofelectron multiplication are negligible, when compared to those associatedwith the primary ionisation formation, while the statistical fluctuations of theEL produced in electron avalanches are dominated by the much largervariance of the total number of electrons produced in the avalanches [24, 25].
The topological signature in HPXe TPCs based on EL was alreadydemonstrated [26–28], despite the large electron diffusion in pure xenonbeing an actual limitation, particularly for large drift distances. Diffusion
3
conceals the finer details of the ionisation trail, partially degrading theeffectiveness of the discrimination based on the topological signature [29].The pattern recognition of the primary ionisation trail for the 1 m drift scalebecomes more difficult to achieve, since the electron transverse diffusion maybe as high as 10 mm/
√m for the low electric fields used in the TPC by
Neutrino Experiment with a Xenon-based TPC (NEXT), i.e. a few tens ofV/cm/bar [29].
Overall, the TPC spatial resolution depends both on the charge spreadingthrough diffusion as electrons drift in the gas, as well as on the tracking planegranularity. Meaning that the longer the drift distances, the bigger thechallenges of diffusion with the arriving charge distribution size rising as thesquare root of the drift distance, for any specific gas or admixture. Sincedetectors are becoming larger in size, the diffusion effects become a hugeconcern.
Recent studies have demonstrated that the addition to pure xenon ofmolecular gases, like CO2, CH4 and CF4, in sub-percent concentration levels,reduces the electron diffusion down to ~2 mm/
√m, without jeopardising the
TPC’s performance in terms of EL yield and energy resolution, with CH4
found as the most suitable candidate [30–32].
On the other hand, it is necessary to take into account that standard xenonpurification through hot getters may not be suitable for the chosen molecularadditive, or else, the getters operating temperature may have to be lowered inorder to prevent molecular absorption, which may affect the gas cleaningefficiency. In addition, the cryogenic separation of the molecular additive hasto be made efficiently enough to prevent any loss of the expensive, enrichedxenon. In addition, CH4 also presents some degree of excimer-quenching[31, 32], which could limit the primary scintillation yield and, therefore, thecalibration for low energy events. While the aforementioned aspects are yet tobe studied in higher detail in real-size detectors, and may be certainlyovercome, the addition of a noble gas such as helium could offer analternative solution, free from those limitations [33, 34].
Therefore, helium, as a noble gas, is being considered as a potential choicefor additive and some studies on both electron drift parameters and EL yieldof Xe-He mixtures have been carried out [34]. Helium atoms have a muchlower mass, when compared to xenon atoms, which allows a more efficientcooling of electrons along the drift path. In addition, some advantagesinherent to the use of helium as an additive are the use of exactly the samepurification system as with pure xenon and it still brings the possibility toachieve a straightforward full xenon cryogenic recovery with liquid nitrogen(LN2). On the other hand, the use of such mixture will reduce the amount of
4
the source isotope in the detector because of the need for significantly higherhelium concentrations. Thus, the chosen helium concentration must be acompromise between an improvement of the background rejection factor anda reduction of the active mass needed to maximise sensitivity [34].
Simulation studies of electron drift parameters, as well as primary andsecondary scintillation yields of Xe-He mixtures have been carried outrecently [34]. The simulation results show that a transverse diffusion of 2.5mm/
√m is achievable for a helium concentration of 15 %, without jeopardise
the intrinsic energy resolution or the EL-yield.Furthermore, experimental studies for the electron drift parameters in
Xe-He mixtures were recently published by [35]. The impact of helium on theelectron diffusion was not as substantial as anticipated, especially in theregion corresponding to the Ramsauer minimum (around 10 V/cm/bar forpure xenon and 25 V/cm/bar for 15 % helium admixture) but remained inagreement with simulations outside that region. On the other hand, theimpact of the helium additive on the xenon EL yield had yet to be determinedexperimentally in order to understand the scope of the use of these mixturesin EL-TPCs.
In this document we present experimental studies on EL yield of xenonand helium mixtures with helium concentrations from 0 to 30 %, as well asthe impact of the helium addition on the TPC energy resolution and in theelectron drift velocity. In addition, the impact on the reduction of the TPCsensitivity to ββ0ν detection due to the reduction on the overall 136Xe massand a comparison with the necessary improvement achievable through theenhancement of the topological discrimination is discussed.
This R&D was the main goal of this PhD program.
The layout of this document is as follows.In chapter 2, a brief introduction to neutrinoless double beta decay is given,
as well as some current experiments upon the double beta decay.In chapter 3, the concept and objectives of the NEXT experiment are
described, together with the constraints and strengths of the technology forthe search of neutrinoless double beta decay. The results obtained withseveral prototypes already investigated are reported as well as the NEXT-100detector prospects. The main limitation on NEXT experiment, relative tosignal topology determination, is explained in detail. The results achievedwith the addition of molecular species to pure xenon are presented in the endof this chapter.
In chapter 4, the theory behind the electroluminescence is also explained.In chapter 5, the helium role as an additive in the improvement of gaseous
mixtures in a TCP is presented. The results on several parameters achieved on
5
previous studies on xenon-helium mixtures are described in this chapter.Chapter 6 presents the experimental setup and discusses the methodology
followed for the xenon-helium gas mixing, the data acquisition and thewaveform analysis as well.
In chapter 7 the results achieved for energy resolution andelectroluminescence yield with pure xenon are presented, as well as thevalidation for the whole methodology of data taking and associated analysis.
In chapter 8 the results for the energy resolution and theelectroluminescence yield are presented for the studied mixtures of heliumaddition to xenon.
Chapter 9 presents the constraints on the primary scintillation studies,either with x-rays or with alpha particles. The longitudinal diffusion and thedrift velocity studies are described and the obtained results are presented.
The chapter 10 is dedicated to the discussion of the relevance of xenon-helium mixtures, comparing the obtained results with those obtained for otherxenon mixtures with molecular species.
Finally, the chapter 11 is dedicated to the conclusions of these studies andthe prospects of future work.
My main contributions to the work presented in this thesis was as follows:The system assembly for the helium mixtures, including the real-time
monitoring possibility of the detector operation characteristics, e.g. pulseamplitude and energy resolution, starting with the pure xenon filling and itsrespective studies, then performing the helium addition for a specificconcentration and its respective studies, followed by a second mixture withanother helium concentration. This system allows the possibility of ensuringthe same operation conditions without the need for interruption on thevoltages applied to the detector electrodes, while keeping the total pressurewithout significant pressures changes in the detector. The assembly allowsthe xenon recovery and respective purification as well.
The whole experimental execution, data acquisition and respectiveanalysis, as well as the presentation and discussion of the results obtained tothe NEXT collaboration.
I still had the opportunity to take part on the experimental campaign inoperation and data acquisition, as well as in problem solving related with theNEXT-NEW TPC and its ancillary systems maintenance, at the LaboratórioSubterrâneo de Canfranc (LSC), Huesca, Spain.
A first huge and crucial challenge that was needed to overcome in this workwas the ability to demonstrate that the experimental system we have in GIANprovides reliable and repeatable results, since from the beginning our resultsdid not reproduce exactly what simulations had foreseen.
6
Another challenge was the measurement, in our setup, of otherparameters, such as the electron drift velocity in pure xenon and in thexenon-helium mixtures as well, in order to validate the performed analysis,so it could give some robustness and credibility to this work as well as to thefollowed methodology.
Another concern was the estimation of the experimental uncertaintiesassociated with the achieved results for both the electroluminescence yieldand energy resolution of the detector.
The core of this thesis resulted in one publication in a major journal of thefirst quartile:
Low-diffusion Xe-He gas mixtures for rare-event detection:Electroluminescence Yield, A. F. M. Fernandes, C. A. O. Henriques, R. D. P.Mano et al. (NEXT Collaboration), Journal of High Energy Physics 4(2020)034
7

8
Chapter 2
Neutrinoless double beta decay
2.1 Majorana neutrinos
Unlike other known fermions, neutrinos can actually be truly neutralparticles, meaning they are indistinguishable from their antiparticles.Therefore, the proof of Majorana-type mass neutrinos would imply that anew energy scale of physics characterises new dynamics behind the StandardModel and explains why neutrino masses are so much lighter than thecharged fermions [36, 37]. This could be a contribution to understandleptogenesis - the symmetry breaking mechanism, and the origin of mass as itcould be the origin of the matter-antimatter asymmetry observed in theUniverse. The existence of Majorana neutrinos would also imply that thequantum lepton number is not conserved [38–40].
In order to accomplish this major objective, there are two conditionsneeded to be proven experimentally: the violation of the lepton number andthe charge-parity violation in the lepton sector.
2.2 Neutrinoless double beta decay
One way to experimentally verify that neutrinos are their own antiparticleis the detection of neutrinoless double beta decay. This is a very slow processwhere a nucleous with Z protons decays into a nucleus with the same massnumber and Z + 2 protons, emitting two electrons which carry the total energyreleased in the process (Qββ). This process can only occur if the neutrinos arereally massive Majorana particles.
The standard two-neutrino mode consists in two simultaneous betadecays, A
Z X −→ AZ+2X + 2 e− + 2 ν, which has been observed in several isotopes
with typical half-lives in the range of 1018 - 1021 years [41], where twoneutrons transform into two protons plus two electrons and twoantineutrinos. Lepton number is therefore conserved because the electrons
9
and antineutrinos have opposite lepton number. However, if neutrinos wereMajorana particles, double-beta decay could occur without the emission ofantineutrinos, meaning the lepton number would change. In addition to otherfeatures, the measurement of the decay rate of ββ0ν would provide directinformation on the mass of neutrinos.
The detectors used to search for this decay are thought and designed inorder to measure the emitted radiation energy of a ββ0ν source. In a realdetector the ββ0ν events are reconstructed within an energy range centred atQββ, due its finite energy resolution, following a Gaussian distribution. Thereare other processes which are part of the intrinsic background occurring in thedetector that fall in the same energies region compromising the experimentsensitivity and can only be suppressed by a good energy resolution [42].
The underground operation of these detectors solves the problem ofcosmogenic origin backgrounds, however, the signal peak can easily beoverwhelmed by natural radioactivity emanating from the detector’smaterials and surroundings, which makes it essential that the chosenmaterials are radiopure [8].
The most important characteristics of an experiment like this one areoptimal energy resolution, in order to constrain the region of interest as muchas possible, and a good detector shielding as well, in order to get rid of thespurious events with almost the same energy as the Qββ. The topologicalinformation as experimental signature is a bonus to further provide improvedresults [43], by background rejection.
The addition of molecular gases to pure xenon is a solution to improve thespatial resolution, since it reduces the electron diffusion. Nonetheless, this willimply degradation of the scintillation parameters on the HPXe TPC projectedby the NEXT collaboration.
In addition to the energy resolution and background control, there areother factors that must be taken into consideration in a project like this, as thedetection efficiency and scalability to larger masses. The optimisation of theseparameters is most of the time conflicting, the reason why so many differentexperimental techniques have been proposed so far.
2.3 Current experiments on double beta decay
studies
Most of the experimental searches for ββ0ν have been dominated bygermanium calorimeters, mainly due its excellent energy resolution. Inparticular, for about a decade the best limit to the half-life of ββ0ν was the oneset by the Heidelberg-Moscow (HM) experiment: T0ν
12
(76Ge) ≥ 1.9 × 1025 years
10
at 90 % confidence level (CL) [44].
Some experiments have demonstrated new sensitivity levels to theneutrinoless double-beta decay, reporting new lower limits on the decay’shalf-life, all of which exceed years. Those experiments determine the decayhalf life by monitoring a large number of atoms for a given double-beta decayisotope and looking for a peak in the two-electron energy.
One of the most important features in sensitivity is exposure, the product ofthe active isotope amount and the measurement time. The ability to recognisethe electron peak inside the background is a major element in this search. Toovercome this obstacle, the experiments typically narrow the search to energiesin a small region of interest around the decay energy. Thus, the better theenergy resolution of a detector, the more false counts can be excluded [45].
Additional efforts are ongoing with different isotopes that use thin foils ina gaseous tracking detector (NEMO-3 [46] and SuperNEMO [47]), scintillatingbolometers (CUPID [48], LUCIFER [49], AMoRE [50]) and solid TPCs(COBRA) [51, 52], among others.
CUORE
The Cryogenic Underground Observatory for Rare Events (CUORE) [53,54] is a ton-scale cryogenic detector located at Laboratori Nazionali del GranSasso (LNGS) in Italy and uses cooled TeO2 crystals made of natural tellurium,34 % of which is the double-beta decay isotope 130Te. The experiment consistsof an array of 988 TeO2 crystals operating as cryogenic calorimeters [55–57](also called bolometers) at ∼ 10 mK temperature.
This experiment observed a background of (1.38 ± 0.07) × 10−2
counts/(keV kg yr) in the region of interest for the neutrinoless double betadecay [58]. With a total exposure of 372.5 kg yr a median exclusion sensitivityof 1.7 × 1025 was achieved. For a 90 % CL, a lower limit of 3.2 × 1025 yr on the130Te half-life was set. Assuming the Majorana neutrinos as the mediators inthe neutrinoless double beta decay, the effective Majorana mass will result onan upper limit of 75-350 meV [58].
The CUORE experiment has a very good energy resolution and scalabilityas well. Its complicated cryogenics, the background contamination, mainlynear the crystal surfaces, and signal readout are their main drawback.
SNO+
The SNO+ is a large multipurpose detector upgraded from the previousSudbury Neutrino Observatory (SNO), placed 2 km underground atSNOLAB in Sudbury, Canada [59]. It now performs an ultra-pure liquid
11
scintillator, using 130Te as detection medium with a high natural abundance ofββ source, with the great advantage to scale up to larger masses.
As a pure water Cherenkov detector, SNO+ has been taking data for morethan one year, while preparing for filling with scintillator. Then, the strategyis to load 3900 kg of tellurium in the detector volume, with a low backgroundlevel surrounded by a high optical coverage, to search for the neutrinolessdouble beta decay. All this commissioning is planned into three experimentalphases [60].
The SNO+ water phase was successfully completed. The next step will bethe pure scintillator phase, when the required achievement of high puritieswill be checked, and after that the tellurium loading will be performed [60].Therefore, in phase I, SNO+ has projected a sensitivity of T0ν
12
> 1.9 × 1026 for90 % CL, after 5 years of data taking [61], which corresponds to a limit of mββ <41-99 meV [61]. In a second phase is expected at least a T0ν
12
limit of 1027 years.
This could be achieved with increased 130Te loading [62]. Furthermore, in theabsence of signal, the expected limit is T 1
2> 1.9× 1028 years at 90 % confidence
level, for neutrinoless double beta decays [60].
KamLAND-Zen
The KamLAND-Zen experiment is a modification of KamLAND neutrinodetector (Kamioka Liquid Scintillator Anti-neutrino Detector) using its ultra-low background environment with xenon (enriched to 91 % in 136Xe) [63]. TheKamLAND-Zen 800 project was prepared with a cleaner container for xenonloaded liquid scintillator, with ∼ 750 kg of xenon. This container productionbegun in 2017 and its data acquisition was started in early 2019 [64]. The dataanalysis relative to 132.7 days brings a lower half-life limit of 4 × 1025 yearswith 90 % CL for the 0νββ, with a sensitivity of 8 × 1025 years [64].
In the future, the collaboration proposes a major detector upgrade, using1 ton of enriched xenon, aiming to improve its energy resolution, using highquantum efficiency PMTs. They predict it will improve the energy resolutiondown to < 2.5 % at the Q-value of the 136Xe decay. With these improvements,they hope to cover the inverted neutrino mass hierarchy down to 20 meV [65,66].
EXO-200
The EXO-200 (Enriched Xenon Observatory) is an upgraded detector usinga symmetric liquid xenon TPC with 150 kg of xenon enriched to 80.6 % in 136Xeas both source and detection medium.
From the full data set acquired before the upgrades, by applying it some
12
analysis improvements, the 0νββ half-life sensitivity achieved was to 1.8 ×1025 yr with 90 % confidence level, with no observed statistically significantevidence for 0νββ [67]. The data from individual phases I and II set lowerlimits of 1.0× 1025 and 4.4× 1025 yr at the 90 % CL, respectively, with a mediansensitivity of 2.9 × 1025 yr and 1.7 × 1025 yr, respectively [67].
Further operation of the upgraded detector is expected to improve the0νββ sensitivity, holding promise for the called nEXO (next EXO) [68], aton-scale TPC that will use enriched xenon in liquid state, designed to reach ahalf-life sensitivity in the order of ∼ 1028 years, with a Majorana neutrinomass sensitivity of 7 - 18 meV [67].
GERDA
The GERmanium Detector Array (GERDA) experiment uses germaniumdiodes enriched in 76Ge, in an active liquid argon shield. So far, a lowbackground index of 5.2 × 10⁻⁴ counts/(keV kg yr) was achieved in thesignal region, thus meeting the design goal to collect an exposure of 100 kg yrin a background-free regime [69]. However, the enrichment process ofgermanium is hard, since it is solid at room temperature, compromising theexperiment scalability to larger masses.
Joining the data from phases I and II, the limit on the half-life of ββ0ν decayin 76Ge is T 1
2> 1.4 × 1026 yr at 90 % CL, having obtained a mββ limit < 79 - 180
meV [69].
According to [70], in the second phase 20 kg were added, hoping to increasethe half-life sensitivity beyond 1026 years.
GERDA improved the sensitivity by one order of magnitude with respect toprevious 76Ge experiments [44], having relied on digital pulse-shape analysisfor the signals from HPGe, like Compton scatters, and single-site events thatmight be an indication for the neutrinoless double beta decay. Thus, it wasproved the feasibility of a background-free experiment based on 76Ge [69].
Majorana Demonstrator
The Majorana Demonstrator experiment consists on a low-backgroundmodular array of high-purity germanium detectors to search for neutrinolessdouble-beta decay of 76Ge to excited states in 76Se. This experiment is basedin germanium at ton-scale, complementing GERDA [71], being located at theSanford Underground Research Facility in Lead, South Dakota [72].
The experiment is now using 41.9 kg yr of isotopic exposure, havingreached half-life limits in the range of (0.75 - 4.0) × 1025 yr for each excitedstate decay of 76Ge, with 90 % CL [73].
13

Under the assumption of light neutrino exchange, upper limits on |mββ|of 3.2 - 7.7 eV were calculated [74, 75], applying nuclear matrix elementscalculated for ββ0ν to the 0+1 excited state.
14
Chapter 3
The NEXT Experiment
3.1 The NEXT experiment roadmap
The NEXT collaboration aims at the detection of neutrinoless double betadecay in xenon enriched with the isotope 136Xe [4] and, currently, operates thelargest HPXe optical-TPC at (10-15 bar), based on EL for ionisation signalamplification [76]. Its concept combines a very good energy resolution with atopological signature discrimination capability and a radioactive cleandetector.
The NEXT collaboration has already developed a R&D program with thespecific goal of proving the performance of its technology. This programresulted in the assembly and operation of three prototypes: NEXT-DBDM,NEXT-DEMO and NEXT-NEW. NEXT-DEMO was designed as a proof ofconcept and test-bed for the technology of the NEXT-100 detector.
The NEXT roadmap was designed in four stages:
i) Construction, commissioning and operation of NEXT-DEMO and NEXT-DBDM prototypes; demonstration of the HPXe technology deploying a massof natural xenon in the range of 1 kg. Both prototypes have demonstratedthe robustness of the technology of high pressure xenon gas time projectionchambers with electroluminescent amplification (HPXe-EL) for neutrinolessdouble beta decay searches with an excellent energy resolution.
ii) Background characterisation and measurement of the signal with theNEXT-White detector, deploying 10 kg of enriched xenon and operating at theLaboratorio Subterráneo de Canfranc (LSC); demonstration that energyresolutions below 1 % can be reached in large HPXe TPCs, as well asdemonstration of the topology discrimination efficiency and measurement ofthe ββ2ν decay half-life [28];
iii) Search for ββ0ν decays with the NEXT-100 detector, which deploys 100kg of enriched xenon;
iv) Search for decays with the NEXT detector, which will deploy masses
15
in the range of the ton scale and will introduce two additional handles: a) Amagnetic field, capable of further enhancing the topological signal of NEXT;and b) barium-tagging (a technique pioneered by the EXO experiment whichis also accessible to NEXT).
NEXT-White (NEW) allowed the validation of the background model withactual data, as well as a study of the evolution of the energy resolution withthe event’s energy. The resolution near Qββ was measured using a thoriumsource, which provides 2.6 MeV gammas. It is also intended to reconstructthe spectrum of ββ2ν, whose events are topologically identical to signal eventsββ0ν and can be also used in order to demonstrate with the recorded data andrespective results the real power of the topological signature [77].
The NEXT-100 detector will have a readout system for calorimetry andtracking different from the ones used in the prototypes and in order todistinguish signal from background, it will use energy resolution and eventtopology.
Given the imposed conditions of energy resolution and high backgroundrejection power for the observations of the two electrons, the technologybehind a HPXe TPC, to be used in NEXT-100, is exceptional and will be astarting point for the next generation of ton scale HPXe experiments [8].
3.1.1 The NEXT detector
The NEXT collaboration aims the construction and operation of theNEXT-100 detector at high pressure with gaseous xenon with a TimeProjection Chamber. This detector will be used to search for neutrinolessdouble beta decay events, using 100 kg of enriched xenon at 90 % in its 136Xeisotope. This experiment will be performed at the LSC [8].
NEXT-100 offers major advantages on the search of neutrinoless doublebeta decay, such as:
• Energy resolution with an intrinsic limit of ~0.3 % FWHM at Qββ and <1 % already demonstrated in NEXT-White;
• Tracking capabilities with the power to discriminate the topologicalsignature between the signal (two electrons) and background (singleelectrons);
• Homogeneous and fully active detector with the ability to make3-dimensional reconstructions, making possible to locate the events in afiducial region away from surfaces, where the background is higher;
• Scalability to larger masses, with the use of a noble gas suitable fordetection and with no intrinsic radioactivity (xenon).
16
In order to cover the inverse neutrino mass hierarchy, are requiredsensitivities to effective neutrino masses in the range of 20 meV, whichweren’t achieved yet for the ββ0ν experiments in operation. This sensitivitymust be improved by one order of magnitude in the effective neutrino mass,or two magnitude orders in the ββ0ν decay period. This requires the increaseof the one hundred factor of the exposure from the typical current generationvalues of experiments, which means to go from ~100 kg yr to ~1 ton per tenyears and decrease the residual backgrounds by a 100 factor (~0.1 events perton) [8].
Thus, a detector able to implement a large source mass of pure isotope at areasonable cost is needed. Until now, only xenon has demonstrated thiscapability [8]. Unlike almost any other ββ source, one ton of xenon can beacquired at a reasonable cost. In fact, one ton of enriched 136Xe already exists,combining the KamLAND-Zen, EXO and NEXT experiments. The HPXetechnology has the potential to provide the most sensitive detector at thisscale, by scaling the detector to a mass in the range of one ton and joiningadditional handles to further suppress the background [77, 78].
NEXT-100 concept
NEXT-100 is a high-pressure xenon electroluminescent Time ProjectionChamber with separated planes for energy measurement, withphotomultiplier tubes (PMTs) and for tracking, with silicon photomultipliers(SiPMs). It will operate in the Canfranc Underground Laboratory facilities, inthe Spanish Pyrenees.
On the side of the energy resolution, the Fano factor of gaseous xenon ismuch lower than the one of liquid xenon. Moreover, the electroluminescenceused to attain signal amplification, has very low fluctuations in gain.
The use of xenon at 10 bar brings the possibility to take advantage of theevent topological signature: a track of about 15 cm is left by two electronsreleased in the neutrinoless double beta decay, with almost constant energydeposition and two blobs of energy at the end of its tracks, caused by thestopping electron’s Bragg-peaks. This signature is a major advantage whichallows the background rejection [43].
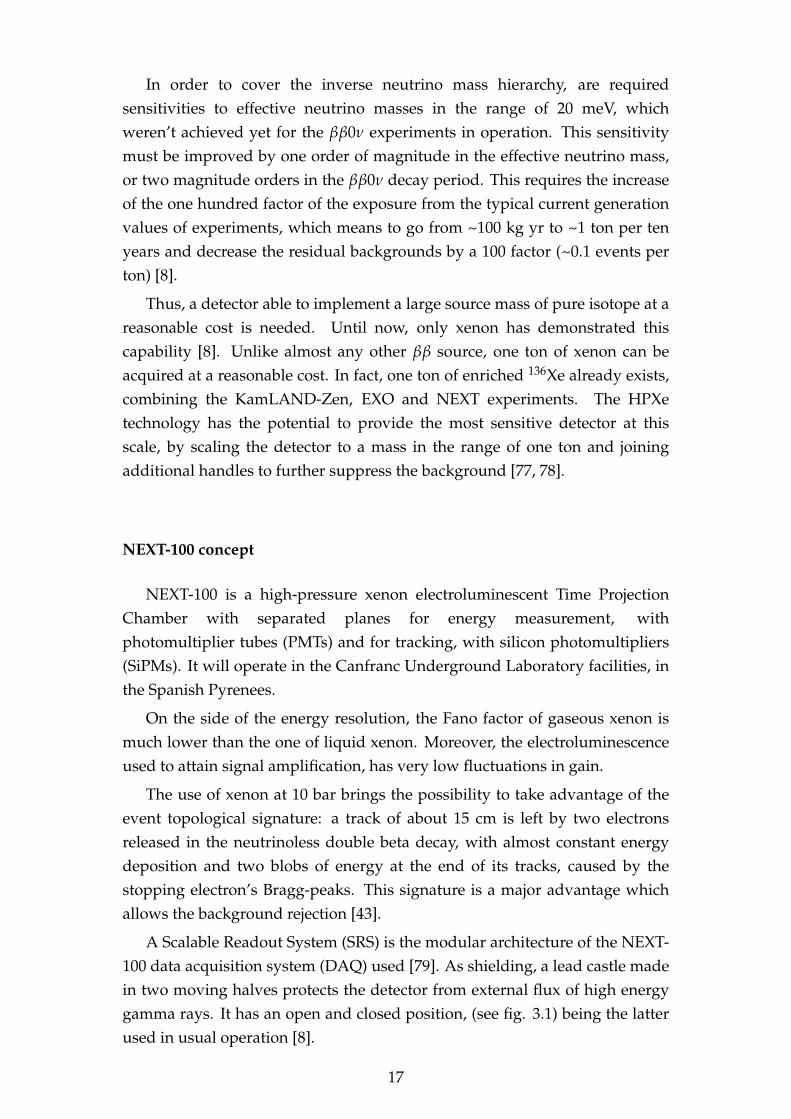
A Scalable Readout System (SRS) is the modular architecture of the NEXT-100 data acquisition system (DAQ) used [79]. As shielding, a lead castle madein two moving halves protects the detector from external flux of high energygamma rays. It has an open and closed position, (see fig. 3.1) being the latterused in usual operation [8].
17
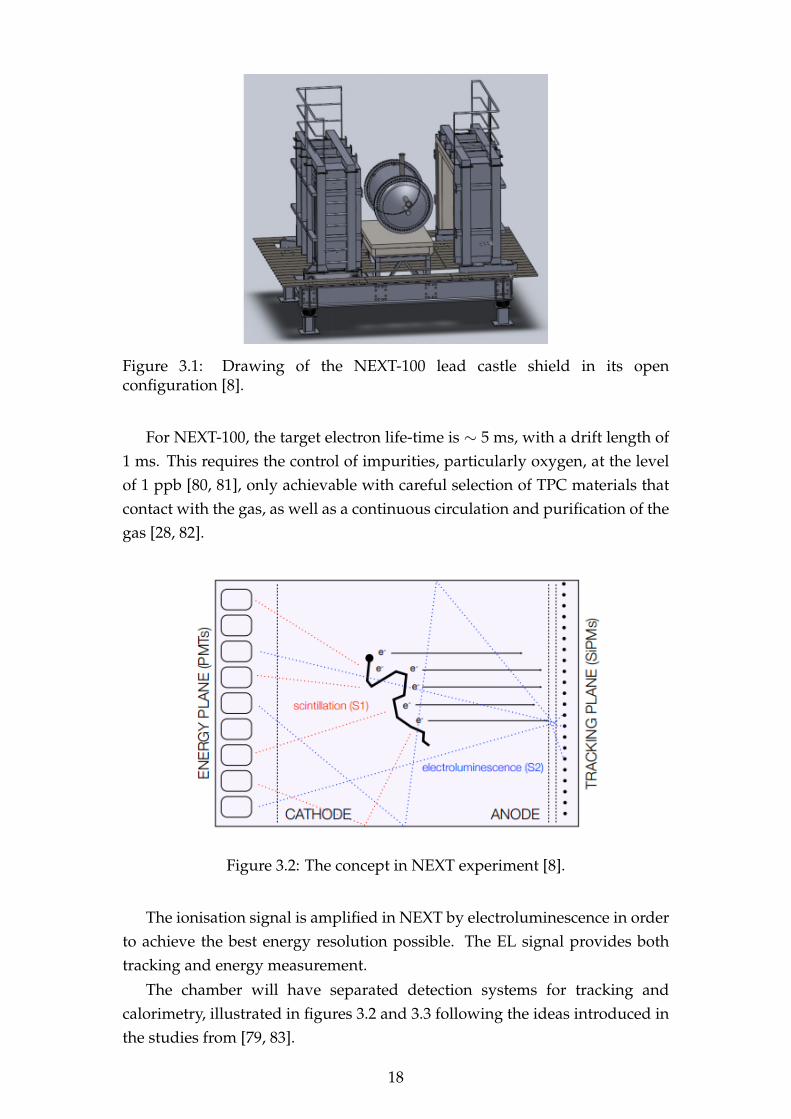
Figure 3.1: Drawing of the NEXT-100 lead castle shield in its openconfiguration [8].
For NEXT-100, the target electron life-time is ∼ 5 ms, with a drift length of1 ms. This requires the control of impurities, particularly oxygen, at the levelof 1 ppb [80, 81], only achievable with careful selection of TPC materials thatcontact with the gas, as well as a continuous circulation and purification of thegas [28, 82].
Figure 3.2: The concept in NEXT experiment [8].
The ionisation signal is amplified in NEXT by electroluminescence in orderto achieve the best energy resolution possible. The EL signal provides bothtracking and energy measurement.
The chamber will have separated detection systems for tracking andcalorimetry, illustrated in figures 3.2 and 3.3 following the ideas introduced inthe studies from [79, 83].
18
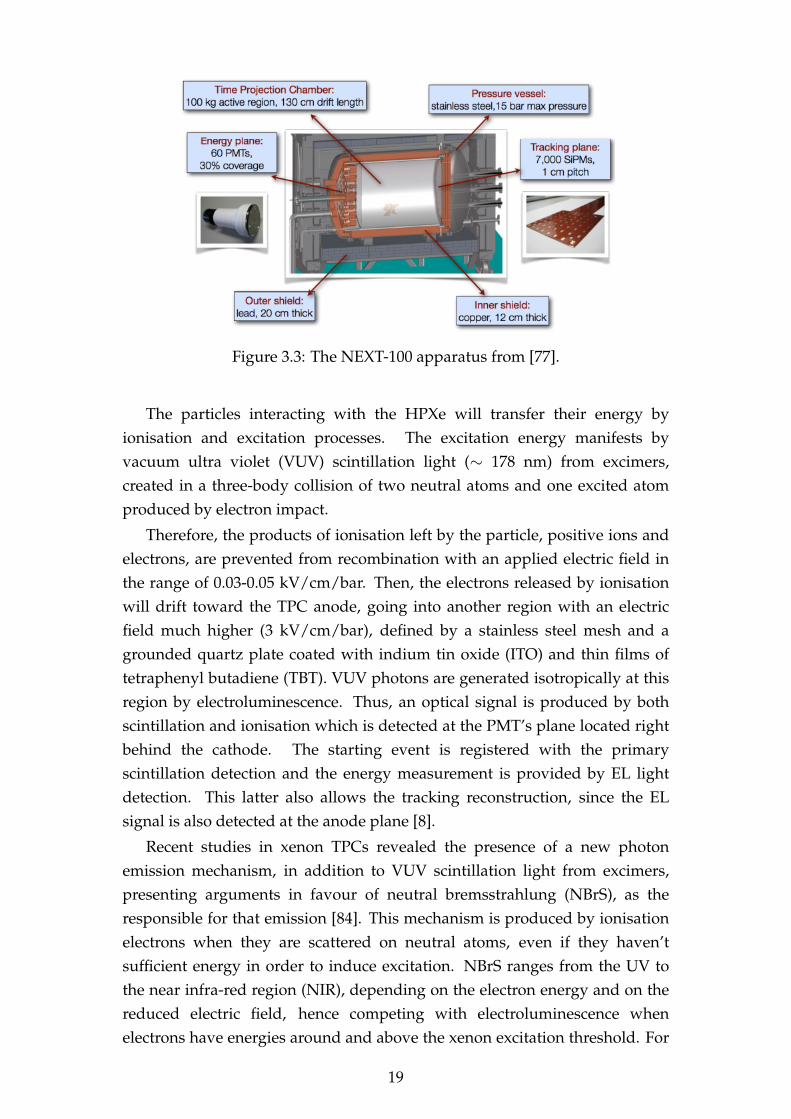
Figure 3.3: The NEXT-100 apparatus from [77].
The particles interacting with the HPXe will transfer their energy byionisation and excitation processes. The excitation energy manifests byvacuum ultra violet (VUV) scintillation light (∼ 178 nm) from excimers,created in a three-body collision of two neutral atoms and one excited atomproduced by electron impact.
Therefore, the products of ionisation left by the particle, positive ions andelectrons, are prevented from recombination with an applied electric field inthe range of 0.03-0.05 kV/cm/bar. Then, the electrons released by ionisationwill drift toward the TPC anode, going into another region with an electricfield much higher (3 kV/cm/bar), defined by a stainless steel mesh and agrounded quartz plate coated with indium tin oxide (ITO) and thin films oftetraphenyl butadiene (TBT). VUV photons are generated isotropically at thisregion by electroluminescence. Thus, an optical signal is produced by bothscintillation and ionisation which is detected at the PMT’s plane located rightbehind the cathode. The starting event is registered with the primaryscintillation detection and the energy measurement is provided by EL lightdetection. This latter also allows the tracking reconstruction, since the ELsignal is also detected at the anode plane [8].
Recent studies in xenon TPCs revealed the presence of a new photonemission mechanism, in addition to VUV scintillation light from excimers,presenting arguments in favour of neutral bremsstrahlung (NBrS), as theresponsible for that emission [84]. This mechanism is produced by ionisationelectrons when they are scattered on neutral atoms, even if they haven’tsufficient energy in order to induce excitation. NBrS ranges from the UV tothe near infra-red region (NIR), depending on the electron energy and on thereduced electric field, hence competing with electroluminescence whenelectrons have energies around and above the xenon excitation threshold. For
19
low electron energies, the NBrS intensity can be shown to be proportional tothe elastic electron-atom cross section [85], a universal interaction mechanismduring electron drift in gases.
In [84] is presented the first NBrS luminescence unambiguousidentification in xenon, supported by a predictive theoretical model of thislight-emission process. NBrS emission is intrinsically broadband and immuneto quenching mechanisms, unlike conventional excimer-based EL emission.Since it does not create additional electrons nor ions, NBrS is expected to befree from ion feedback or ageing issues. Hence, it is seemingly of relevance ina range of reduced electric field values employed for secondary scintillation,extending from 1 kV/cm/bar to typical drift fields of 100 V/cm/bar,arguably down to the thermal limit (around E/p = 10 V/cm/bar in purexenon, at room temperature). Nevertheless, the NBrS contribution to the ELscintillation is less than 1 %, for nominal EL-field values above 1 kV/cm/bar,i.e., it is insufficient to modify the calorimetric response of xenon TPCs.Similarly, for typical drift fields below 50 V/cm/bar, the NBrS emission fallsbelow the sensitivity range of conventional photomultipliers (PMTs) [84].
3.1.2 Background
In order to predict the background events that may be misidentified assignal, a background model was created, where both the possible sources ofradioactive contaminants and their activity in the detector materials havebeen descried by simulation [8].
Thus, the detector radio-purity evaluation and the detector simulationmake the base of this background model.
With this model is possible to determine the sensitivity to domeasurements of the ββ2ν mode in NEW, as well as the search of ββ0ν inNEXT-100. Backgrounds from material’s natural radioactivity and withcosmogenic origin justify the reason why the choice of radiopure materialsand the underground operation are a must. Therefore, an extra background(B) rejection, better detector efficiency (ε) and larger exposure (M.t) areadditional experimental features in order to improve the detector sensitivity[41]. This relation is summarised as:
T12∝ a.ε
√M.t
∆E.B(3.1)
In order to evaluate all the main backgrounds that can mask the ββ0ν signal,coming from the materials to be used in NEXT-100 construction, a detailedsimulation of the detector performance has been implemented in NEXUS, theGeant4-based simulation program used in NEXT experiment. The accuracy of
20
this model will be validated and improved by NEW operation and its results[78].
Backgrounds from ambient sources can be further reduced throughcombination of particle identification and fiducial cuts [26].
The expected background rate is at most 4 × 10⁻⁴ counts/keV/kg/yr,meaning 1 event per year for 100 kg of xenon. The expected sensivity is 6 ×1025 years to the ββ0ν decay process within 5 years running [86].
Radioactive contaminants
The decay of 214Bi into 214Po emits de-excitation gammas with energiesbeyond 2.3 MeV, and the gamma line at 2447 keV, with 1.57 % intensity is tooclose to the Q-factor of 136Xe.
There is also the decay of 208Tl into 208Pb where de-excitation photons of2614 keV and 100 % intensity are emitted. The Compton edge of this gammais under the Qββ, at 2382 keV, but the scattered gamma can still interact andproduce another electron tracks close enough to the initial Compton electron,being reconstructed as single objects in the energy region of interest (ROI).
The photoelectric electrons are produced upward the ROI, but they canlose its energy by bremsstrahlung effects and populate the window (in case ofemitted photons escape out from the detector). In this situation single-trackevents cannot be produced by pair-creation events.
Radon
The radioactive isotopes 222Rn and 220 Rn, from the 238U and 232Th chains,may decay into 214Bi and 208Tl, respectively. The Radon suffers an alpha decayinto polonium and produces positive ions which are drifted to the cathode bythe TPC electric field. In this way, there will be contamination of 214Bi and 208Tldeposited in the cathode surface.
Radon is a potential background for double beta decay experiments, so, thefull control of radon is the key for low background [17]. An inner lead castlewas installed in 2018 in order to provide further shielding against externalbackgrounds. Furthermore, a radon abatement system (RAS) by ATEKO A.S.has been flushing radon-free air into the air volume enclosed by the lead castle[87]. From recent analysis, it was verified that the 222Rn content in the flushedair is 4-5 orders of magnitude lower, when compared to the air environment inNEXT-NEW [88]. Such a reduction allows the detector operation in a virtuallyairborne-Rn-free environment [87].
21
Cosmic rays and rock backgrounds
The main reason why double beta decay experiments are performedunderground is the production of high energy photons produced by cosmicparticles, which also may activate materials. The detector is placed at a depthfor which the only surviving cosmic ray particles are muons, although, theirinteractions with the rock produces neutrons and electromagnetic showers.The rock itself also acts as an intense source of neutrons and 208Tl and 214Bibackgrounds [8].
The shielding reduces considerably the mentioned backgrounds as well asthe residual muon and neutron background are not significant for theexperiment, having into account the topological capabilities of NEXT [8].
3.2 Topological signature
Electrons moving through gaseous xenon at a pressure of 10 bar (thepressure used in the studies related in the present work) lose their energy atan approximately fixed rate, during the travelled path length. At the end ofthe trajectory the rise in 1/v2, with v the speed of the particle, caused by theloss of energy, which leads to a significant energy deposition in a compactregion (where multiple scattering occurs in a short distance), usually referredas ’blob’. More than 20 % of the event energy is splitted between both blobsdue to the Bragg-like peaks in the dE/dx of the stopping electrons [26, 77].
The neutrinoless double beta decay signal involves two electrons whoseenergy sum to Qββ ~2.45 MeV. Although the good energy resolution isenough to discriminate such events from the more abundant ββ2ν, there stillare backgrounds originated by high energy gammas which convert in the gasthrough Compton, photoelectric and pair production processes, emitted fromthe decay of 208Tl and 214Bi whose signals are single electrons with energysimilar to Qββ, whose tracks have just one blob of energy at one extreme[26, 89].
Thus, a topology with two electrons with a common vertex and a singlecontinuous trajectory with a blob at each end is the searched signal event(depicted in figure 3.4 left) which is discriminated from the backgroundsdescribed before, whose signal has a single electron track with only one blob(depicted in figure 3.4 right).
22
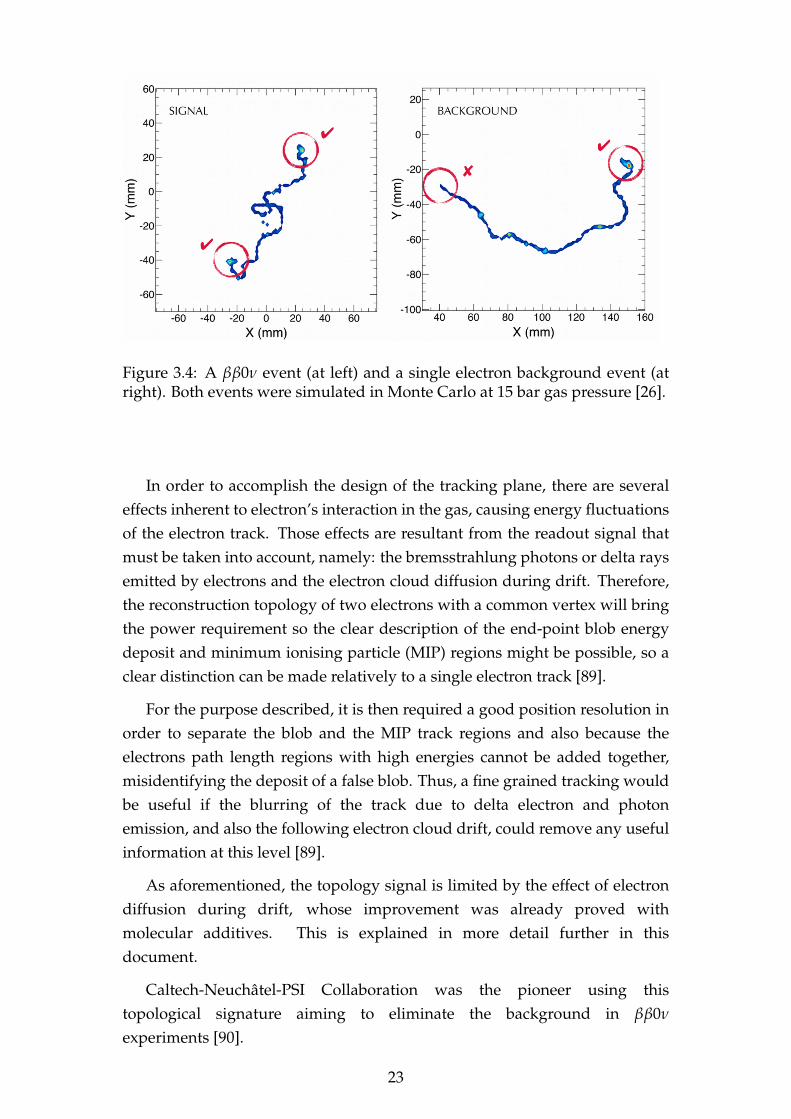
Figure 3.4: A ββ0ν event (at left) and a single electron background event (atright). Both events were simulated in Monte Carlo at 15 bar gas pressure [26].
In order to accomplish the design of the tracking plane, there are severaleffects inherent to electron’s interaction in the gas, causing energy fluctuationsof the electron track. Those effects are resultant from the readout signal thatmust be taken into account, namely: the bremsstrahlung photons or delta raysemitted by electrons and the electron cloud diffusion during drift. Therefore,the reconstruction topology of two electrons with a common vertex will bringthe power requirement so the clear description of the end-point blob energydeposit and minimum ionising particle (MIP) regions might be possible, so aclear distinction can be made relatively to a single electron track [89].
For the purpose described, it is then required a good position resolution inorder to separate the blob and the MIP track regions and also because theelectrons path length regions with high energies cannot be added together,misidentifying the deposit of a false blob. Thus, a fine grained tracking wouldbe useful if the blurring of the track due to delta electron and photonemission, and also the following electron cloud drift, could remove any usefulinformation at this level [89].
As aforementioned, the topology signal is limited by the effect of electrondiffusion during drift, whose improvement was already proved withmolecular additives. This is explained in more detail further in thisdocument.
Caltech-Neuchâtel-PSI Collaboration was the pioneer using thistopological signature aiming to eliminate the background in ββ0ν
experiments [90].
23
3.2.1 Limitations in the tracking plane
There are physical and instrumental limitations which could limit thespatial resolution of a gaseous detector. With regard to instrumentalconstraints, the pitch of SiPMs sensors used in NEXT as tracking plane limitsthe transverse resolution. This problem could be solved by adding moreSiPMs to the tracking plane, decreasing the sensor’s pitch. In NEXT detector,having 1 mm2 SIPM with 1 cm pitch, the spatial resolution is 3.5 mm and canstill be reduced with the use of reconstruction algorithms [29].
Furthermore, the longitudinal resolution is dependent on the timingbetween the initial event provided by the primary scintillation signal (S1) andthe arrival time of the primary electrons to the electroluminescence regionprovided by the secondary scintillation signal (S2).
When electrons get into the EL region, each one will produce light during atime given by the ratio between the EL region gap size and the drift velocity. InNEXT-100 this time is 3 µs for a reduced electric field of 3.5 kV/cm/bar at theEL region, leading to a longitudinal resolution of 1-1.5 mm [29]. These resultscan still be improved by reducing the EL region gap, but for the dimensions ofthe NEXT-100 detector this would not be easy to accomplish.
3.3 Topology reconstruction
The reconstructed electron tracks show a random walk through the gasand a clear end-point with higher energy deposition. Thus, the possibility toreconstruct the event topology is a major advantage of the NEXT design.
The readout plane must be a few millimetres away from EL productionregion, for which blurring would be in the order of 1 cm, considering theexpected transverse diffusion of 10 mm/
√m. Furthermore, a pitch of 1 cm
was described at [79] as the best compromise in order to prove a gooddiscrimination between the two blobs with a reasonable number of channelsat 10-15 bar pressure of pure xenon. These results justified the pitch used atNEXT-DEMO and NEXT-NEW tracking planes [89].
In previous publications, the event topology reconstruction wasperformed by dividing the z-dimension in time slices and for each slice wasreconstructed a single xy point. A width slice of 4 µs was used, as it is thetime needed so an electron cross the EL gap and gives enough information inorder to achieve a reliable xy reconstruction. The xy position of a slice wasreconstructed by means of the medium position with higher scintillationsignal recorded by SiPMs weighted with their collected integrated charge. Forthe same time interval, the energy associated with this position is thenrecorded [8].
24
The drift velocity of electrons and the time relative position of S1 and S2signals were used to unambiguously define the z position. In order toreconstruct the xy position of a charge deposit was used the barycentremethod, indicated as optimal by Monte Carlo studies, since it uses the signalsfrom ∼ 20 SiPMs with greatest charge.
Reconstruction of tracks in an electroluminescent TPC is complicated notonly due the diffusion of the charge cloud during drift, but also by thereadout nature. Scintillation light is produced over the whole width of the ELgap (5 mm in NEXT-DEMO) spreading the signal from a single electron overa time inversely proportional to the drift velocity within the gap (~2 µs).Additionally, the EL light is produced isotropically and, therefore, the signalproduced by an electron going through the gap is expected to arrive at thetracking plane (~7.5 mm behind the anode) over the area defined by theintersection of the plane with the sphere of light [26].
In a previous paper [12], the NEXT collaboration demonstrated that apoint-like deposition of charge due to the absorption of a Kα X-ray isexpected to be detected over a transverse region which can be parameterisedas a two dimensional Gaussian with a standard deviation of ~8 mm where thespread due to EL light production is the dominant effect with subdominantcontributions from the charge transverse diffusion. Longitudinally, theexpected spread has a noticeable dependence on the drift distance since thediffusion dominates. Kα events are expected to have widths in z withstandard deviations between 0.5 mm, for very short drifts, and 1.7 mm at thedrift field settings used. In order to optimise the tracks reconstruction, thesevalues must be taken into account by dividing the signal information intoappropriate time slices and using charge information from clustered SiPMchannels [26].
3.3.1 NEXT prototypes results
The NEXT Collaboration demonstrated the topological signature power inan EL xenon-based TPC using NEXT-DEMO prototype [26]. This prototypehas been running since 2011 using several radiation sources with differentcharacteristics.
The best energy resolution obtained in NEXT-DEMO, extrapolated to Qββ,was 0.8 % FWHM, improving on the target defined in the paper TDR -Technical Design Report [91] of 1% FWHM at Qββ with only basic correctionsto the detected signals. The NEXT-DEMO has been providing perfect highvoltage operation and a great stability against sparks. The gas system withhot getters has demonstrated to be leak-proof with continuous gasre-circulation and purification, measuring electron lifetimes up to tens of
25
milliseconds, demonstrating the getters efficiency, by removing theelectronegative impurities from the gas when this is re-circulated [92]. Thetracking plane with SiPMs was used to improve the results from [92] and itwas observed a significantly increasing in the fiducial region size as itallowed a better understanding of events’ topology. In those studies an highgas quality was also demonstrated and an electron lifetime of 10 ms wasmeasured [89].
Latter, with the calculation of a corrected weighted sum of the observedenergy resulted in a 22Na photopeak, an energy resolution of 1.62 % wasobtained, which extrapolated to Qββ becomes ∼ 0.63 % [12]. These valuesrepresent a slight improvement on previously published results [89].
There are two main effects affecting the energy resolution which werecorrected during the data analysis. One effect is related with the electrontrapping along the drift region, producing losses of ionisation electrons,reducing the electroluminescent light. The other effect is related with thePMTs, since there is a radial dependence of the EL light collection in the PMTplane, i.e. the detected number of photons (by the PMT plane) decreases withincreasing the event radial position [43].
The reconstruction methods have been presented in [26]. Monte Carlo wasfound to reproduce the topological features in data to a high degree ofaccuracy for the track lengths and for the high energy blob candidate shownfor data and Monte Carlo. The algorithm capabilities of topological signatureand background rejection have demonstrated the adequate performance forthe proposed NEXT-100 experiment, with an expected reduction of one orderof magnitude in background [26]. It was measured a signal efficiency of 66.7± 0.9 (stat) ± 0.3 (fit) % for a background acceptance of 24.3 ± 1.4 (stat) %[26], which is in agreement with the Monte Carlo simulations. This study wasparticularly limited by the small size of the NEXT DEMO detector, where theevent selection gave priority to less extended events, with a more difficultreconstruction.
Next-White is the NEXT-100 detector’s first stage, working since 2016.Several calibration and background run measurements were performed withdepleted xenon, and it was demonstrated the capability to achive an energyresolution of ∼ 1 % FWHM at the xenon Qββ [13, 93], which can still beimproved, according to the published results at lower energies [12, 16]. In2019 started the first run with xenon enriched in the isotope 136, aiming themeasurement of the two neutrino double beta decay spectrum. The signaltopological discrimination from its background has been explored with NEW.A signal efficiency of 71.6 ± 1.5stat ± 0.3sys% was achieved for a backgroundacceptance of 20.6 ± 0.4stat ± 0.3sys % [94]. This result is an improvement to
26
the one reported in [26], thanks to the larger detector dimensions, as well as abetter track reconstruction [94].
Several electron transport properties were studied with NEW, namely, thedrift velocity, longitudinal and transverse diffusion. For the first time, allthose parameter were measured simultaneously and with the sameexperimental setup. The agreement achieved is a proof that the use ofpressure scaling for the diffusion parameters can be trusted for operatingpressures up to ∼ 10 bar [95], suggesting that the dimers’ role and higherorder xenon clusters in electron transport will still be minor for higherpressures. The longitudinal diffusion measured in the NEXT-Whitecalibration campaign was 318.9 ± 1.8stat ± 20.1sys µm/
√cm, while the
transverse diffusion value is 1279 ± 3stat ± 40sys µm/√
cm [95]. The minimum10 bar aiming pressure for the upcoming runs implies a longitudinal diffusionof 267.3 ± 1.5stat ± 16.9sys µm/
√cm and a transverse diffusion of 1072 ± 3stat
± 34sys µm/√
cm [95]. All these values are compatible with the designrequirements and expectations for the NEXT-100 detector [8, 79, 91].
The internal Radon-induced background assumptions were validated in[88] for the data collected with the NEXT-White detector, whereas a firstmeasurement was actually used to validate the Monte Carlo model for thatinclusive background model [87]. The expected background in a 200 keVwindow around the Qββ with 136Xe is 0.75 ± 0.12stat ± 0.02syst in 37.9 days[87], achieved through the information on the events’ topology. Thistopological selection allows a reduction in background of 16.8 ± 2.2, with theanode region being the main contribution for the remaining events [87].Concerning the NEXT-100 design and installation, aiming the best achievablebackground levels, those data identified the anode region, i.e., the trackingplane, as the main area to be improved in upcoming works [87]. The use of aradon abatement system shown the negligibly of the backgroundscontribution, coming from airborne 222Rn to ββ0ν [87].
3.4 Electron diffusion
Concerning the physical limitations, in a detector with a drift distance ofone meter, the diffusion of the electrons in pure xenon will contribute with aneffect of the order of ~10 mm to the transverse resolution and ~4-5 mm to thelongitudinal resolution, whereas the finer details of the track are lost, and byconsequence the topological signature of the events will have a weaker effect.The physical nature of electron diffusion in pure xenon is the biggest concernfor the spatial resolution and this is of the utmost importance for the two blobstopology identification [29].
27
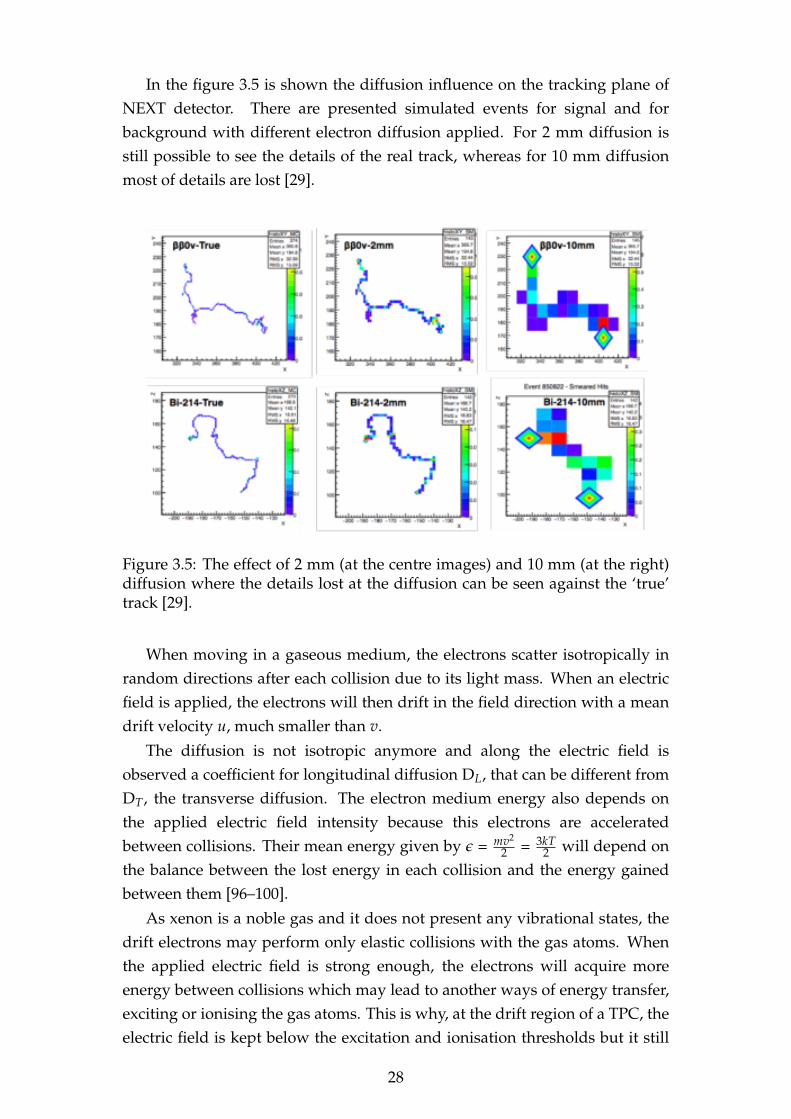
In the figure 3.5 is shown the diffusion influence on the tracking plane ofNEXT detector. There are presented simulated events for signal and forbackground with different electron diffusion applied. For 2 mm diffusion isstill possible to see the details of the real track, whereas for 10 mm diffusionmost of details are lost [29].
Figure 3.5: The effect of 2 mm (at the centre images) and 10 mm (at the right)diffusion where the details lost at the diffusion can be seen against the ‘true’track [29].
When moving in a gaseous medium, the electrons scatter isotropically inrandom directions after each collision due to its light mass. When an electricfield is applied, the electrons will then drift in the field direction with a meandrift velocity u, much smaller than v.
The diffusion is not isotropic anymore and along the electric field isobserved a coefficient for longitudinal diffusion DL, that can be different fromDT, the transverse diffusion. The electron medium energy also depends onthe applied electric field intensity because this electrons are acceleratedbetween collisions. Their mean energy given by ε = mv2
2 = 3kT2 will depend on
the balance between the lost energy in each collision and the energy gainedbetween them [96–100].
As xenon is a noble gas and it does not present any vibrational states, thedrift electrons may perform only elastic collisions with the gas atoms. Whenthe applied electric field is strong enough, the electrons will acquire moreenergy between collisions which may lead to another ways of energy transfer,exciting or ionising the gas atoms. This is why, at the drift region of a TPC, theelectric field is kept below the excitation and ionisation thresholds but it still
28
has to be high enough in order to prevent ion recombination. In NEXT theapplied E/p is smaller than 0.1 kV/cm/bar.
The possibility of event discrimination based on the topological signatureof the ionisation trail depends on the progress achieved for the large electrondiffusion in xenon due to the low electron drift velocity. The diffusion makesit difficult to describe in detail the ionisation trail for the drift distances in theNEXT detector and the discrimination based on the events topologicalsignature loses effectiveness [27]. Due to interference effects, a deepminimum exists in the electron–atom elastic cross-section for collisions ofelectrons with argon, krypton, and xenon (but not for neon nor helium),known as the Ramsauer–Townsend (R-T) minimum. For xenon, the R–Tminimum occurs near 1 eV. This quantum mechanical effect also has asubstantial impact on electron transport, leading to rapidly varying diffusioncharacteristics in the eV range. The diffusion depends on both electric fieldand electron temperature [83].
3.5 Molecular additives
In elastic collisions with xenon atoms, the loss of energy of electrons isextremely inefficient because they are much lighter than the atoms and theiraverage kinetic energy remains high, which increases the diffusion, especiallyat the range of the electric fields of interest. For molecular gases, even at lowkinetic energies, new freedom degrees are created and available for energytransfer. This rises the idea of adding molecular gases to pure xenon, in orderto allow the drift electrons to lose more energy between collisions.
The electron diffusion may be efficiently reduced, even with minuteconcentrations of molecular additives because the electron energydistribution may become mildly non-thermal, tending to build up around theenergy of the first vibrational levels of molecular additives (usually ~0.1 eV),demonstrated by simulation for CO2, CF4 and CH4. These concentrations arebelow the sub-percent level, which implies a precise gas monitoringequipment [29].
Therefore, the addition of molecular gases to pure xenon is a solution toimprove the spatial resolution in gaseous TPCs. Nonetheless, this will implythe scintillation parameters degradation of the HPXe TPC projected by theNEXT collaboration.
In order to be used in NEXT, a suitable gas mixture should previously fillsome key requirements: from what concerns the primary and secondaryscintillation, it should have low quenching, high transparency to VUV lightand low electron attachment; in the drift region, for low electric fields, the
29
mixture needs to have low charge recombination and a high efficiencyelectron cooling in order to reduce the electron diffusion. Those molecularspecies also need not to be reactive with the detector materials, easy to handle(not to be toxic nor explosive) and its mixture with xenon should be easy topurify and also be compatible with the use of getters.
It is known from previous studies that molecular additives, even at lowconcentrations, degrade the energy resolution and amplification performanceof EL detectors. When the electron probability to collide with moleculesbecomes significant it means that the electrons may lose energy forvibrational or rotational excitations and they won’t be able to produceelectroluminescence. Studies with argon may be consulted in [101, 102] andrelated studies in [103–105].
3.5.1 Scintillation with molecular additives
The performance of scintillation processes could be affected by theaddition of molecular species. In the NEXT experiment, the primaryscintillation is used as trigger, so it has to be noticeable after gas molecularaddition and the secondary scintillation needs to be strong enough, since itprovides information about the event energy and its fluctuations should be aslow as possible after adding molecular species to the gas.
The most relevant parameters for NEXT which could be affected by theaddition of molecular species are the energy resolution and theelectroluminescence yield.
Although the electrons cooling in mixtures is efficient due to vibrationalexcitations with molecules of the gas, for the same electric field, the energy ofelectrons is lower for gas mixtures, and by consequence the number of xenonexcitations will be lower, reducing also the EL yield (NEL).
Molecular additives may be electronegative, providing the occurrence ofattachment, and the NEL is reduced, so the fluctuations in its value may bebigger. It is necessary that the electrons reach a well defined energy range tobecome attached and, for the studied molecular additives, the probability ofthis to happen in the EL gap is bigger than under the effect of the drift electricfield. Anyway, for the large drift region of NEXT, this mechanism might reducethe number of primary electrons.
The quenching effects may also contribute for the reduction of NEL inmixtures because the excited atoms, which are produced in the secondaryscintillation process can be deactivated by two or three body collisions withthe molecular additive inhibiting the formation of scintillation emitting xenondimers. The probability of quenching mechanisms may vary with theabsolute pressure of the gas.
30
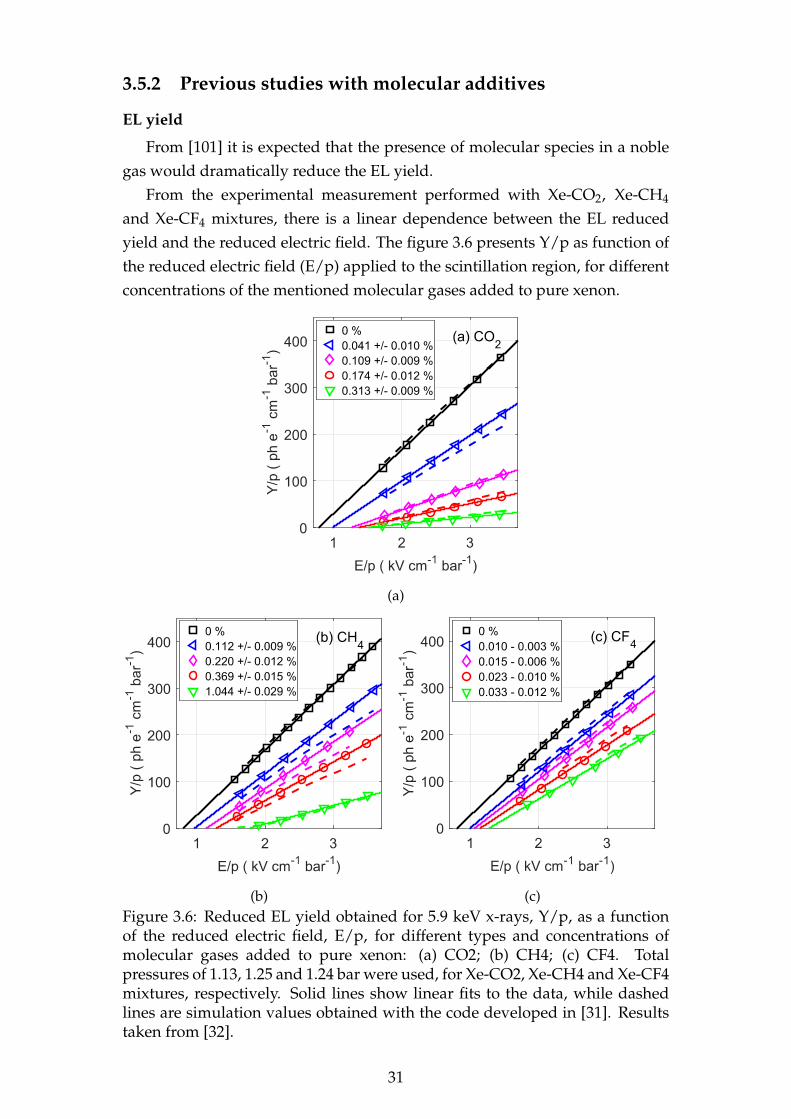
3.5.2 Previous studies with molecular additives
EL yield
From [101] it is expected that the presence of molecular species in a noblegas would dramatically reduce the EL yield.
From the experimental measurement performed with Xe-CO2, Xe-CH4
and Xe-CF4 mixtures, there is a linear dependence between the EL reducedyield and the reduced electric field. The figure 3.6 presents Y/p as function ofthe reduced electric field (E/p) applied to the scintillation region, for differentconcentrations of the mentioned molecular gases added to pure xenon.
(a)
(b) (c)Figure 3.6: Reduced EL yield obtained for 5.9 keV x-rays, Y/p, as a functionof the reduced electric field, E/p, for different types and concentrations ofmolecular gases added to pure xenon: (a) CO2; (b) CH4; (c) CF4. Totalpressures of 1.13, 1.25 and 1.24 bar were used, for Xe-CO2, Xe-CH4 and Xe-CF4mixtures, respectively. Solid lines show linear fits to the data, while dashedlines are simulation values obtained with the code developed in [31]. Resultstaken from [32].
31
The EL yield decreases as the additive concentration increases for all threeadditives, for the same E/p value.
As an example, it was observed that for a reduced electric field of 2.5kV/cm/bar in the TPC there is a 50 % drop in EL, compared to pure xenonresults, for concentrations of 0.05 % CO2, 0.3 % CH4 and 0.02 % CF4.
However, the EL reduction may be acceptable for specific concentrationsof each additive in cases where the energy resolution is not compromised andthe secondary scintillation is large enough. For those concentrations, the ELthreshold increases with the increase of additive concentration in gas and theslope of EL reduced yield decreases. For concentration values up to 0.1 % forCO2, 0.4 % for CH4 and 0.02 % for CF4, the reduction of the EL yield and itsrespective statistical fluctuations are still acceptable, being the electroncooling efficiently reduced almost to the thermal limit for theseconcentrations. This behaviour in the secondary scintillation thresholdreveals the efficiency of electron cooling until concentration values of 0.1 %for CO2, 0.4 % for CH4 and 0.02 % for CF4. Those results have then proventhat there is a possible compromise between electron cooling and excimerquenching [32].
Energy resolution
It were performed Magboltz simulations for xenon at 10 bar for differentconcentrations of CO2, CH4 and CF4, whose elementary cross-sections are wellknown. For those simulations both transverse and longitudinal diffusion werestudied, as it were the drift velocity and the effects on the amount of lightproduced in the EL region and the energy resolution for different electric fields[29]. These molecules are highly transparent to xenon scintillation, except CO2,for which, at the concentrations studied, the transparency for 1 m length canbe as low as 50 % [29].
In figure 3.7, the energy resolution extrapolated for the NEXT-100 TPC foran EL field of 2.5 kV/cm/bar is plotted as a function of 3D diffusion, definedas the characteristic size of the electron diffusion ellipsoid, 3
√xyz after 1 m
drift through the TPC, D3d = 3√
DL × D2T (mm/
√m), for the three additives at
several concentrations. This diffusion was obtained from Magboltzsimulations for a drift field of 20 V/cm/bar by [106]. The shadowed areasrepresent the error intervals from experimental measurements. The energyresolution (ER) uncertainty is also affected by the error bars of Q-factor (seebelow), as well as systematic errors in Xe-CO2 and Xe-CF4 performedmixtures. There is still a possible overestimation of Q-factor in theattachment-inducing mixtures, as suggested by the results in this same work[106].
32
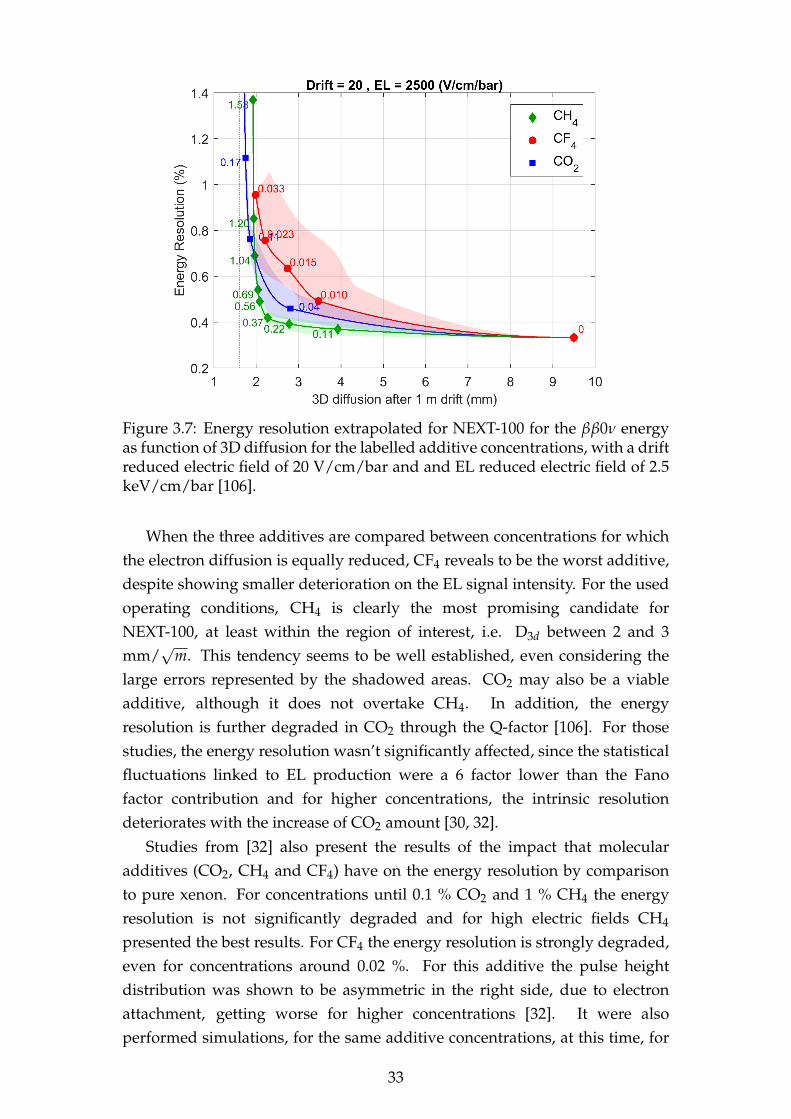
Figure 3.7: Energy resolution extrapolated for NEXT-100 for the ββ0ν energyas function of 3D diffusion for the labelled additive concentrations, with a driftreduced electric field of 20 V/cm/bar and and EL reduced electric field of 2.5keV/cm/bar [106].
When the three additives are compared between concentrations for whichthe electron diffusion is equally reduced, CF4 reveals to be the worst additive,despite showing smaller deterioration on the EL signal intensity. For the usedoperating conditions, CH4 is clearly the most promising candidate forNEXT-100, at least within the region of interest, i.e. D3d between 2 and 3mm/
√m. This tendency seems to be well established, even considering the
large errors represented by the shadowed areas. CO2 may also be a viableadditive, although it does not overtake CH4. In addition, the energyresolution is further degraded in CO2 through the Q-factor [106]. For thosestudies, the energy resolution wasn’t significantly affected, since the statisticalfluctuations linked to EL production were a 6 factor lower than the Fanofactor contribution and for higher concentrations, the intrinsic resolutiondeteriorates with the increase of CO2 amount [30, 32].
Studies from [32] also present the results of the impact that molecularadditives (CO2, CH4 and CF4) have on the energy resolution by comparisonto pure xenon. For concentrations until 0.1 % CO2 and 1 % CH4 the energyresolution is not significantly degraded and for high electric fields CH4
presented the best results. For CF4 the energy resolution is strongly degraded,even for concentrations around 0.02 %. For this additive the pulse heightdistribution was shown to be asymmetric in the right side, due to electronattachment, getting worse for higher concentrations [32]. It were alsoperformed simulations, for the same additive concentrations, at this time, for
33

the operation conditions of NEXT-100 TPC [31]. The best compromisebetween energy resolution and electron diffusion is 2.75 mm/
√m for the
concentrations of additives of 0.04 % CO2, 0.2 % CH4 and 0.015 % CF4.
Nevertheless, it was found that for a long time operation of CO2 mixtures,these molecules reveal to be unstable due to the absorption in getters, leadingto CO formation. This is a major problem for the use in a large chamber andfor long time operations. For CH4 and CF4 the getters temperature has to bereduced in order to prevent the break and absorption of this molecules. Thiscould be a drawback since it may jeopardise the gettering efficiency of the gasin the TPC [32].
For CO2 also were achieved good energy resolution values but itsperformance is affected by the low transparency and by the long terminstability. For CF4, although the low quenching effect, the electronattachment affects the energy resolution. The energy resolution is better forCH4, even having shown high quenching effects, becoming the bestmolecular candidate to be used in NEXT-100 TPC so far.
The latter will be the first additive to be studied in NEXT-DEMO detector.The simulations revealed that both Q-factor and PMT signal fluctuations canbe kept at the level of Fano factor for 10 bar and at the concentrationmentioned above in order to remain the diffusion at 2.75 mm/
√m.
Concerning the primary scintillation yields, it is expected a reduction of a 5-10factor for the same concentrations [31].
Q-factor
Regarding the production of scintillation, these fluctuations are described
by J = σ2EL
NEL, the fluctuations in the number of EL photons produced per primary
electron, described as the ratio between the variance in the number of emittedphotons per primary electron, and the variance considering that the processis described by the Poisson model, i.e., the average number of photons perprimary electron. This J parameter can also be described by Q = J/NEL in theliterature.
The fluctuations related with the productions of scintillation, J, are muchsmaller than those related with the generation of primary charges, F, in purexenon, being the number of produced photons per primary electron high.Therefore, the energy resolution is, in most of the cases, explained by thefluctuations in the primary electron cloud arrangement and the fluctuationsrelated to the photon detection system.
The higher Nep (i.e., average number of primary charges produced inAPD, by number of photons), proportional to NEL (i.e., average number of ELphotons produced by primary electron) and Ne (i.e., average number of
34
primary electrons produced by x-ray), the lower will the energy resolution be.This is the reason why strong electric fields are preferred, since more photonsper primary electron are produced. Still, the J fluctuations become biggerabove the charge multiplication threshold.
The relative variance in the number of EL photons produced per primaryelectron in the EL region (Q) was calculated by [32], varying the reducedelectric field in the region of interest, for all three additives. For pure xenon, Qis negligible and its value increases with the amount of molecular additive.
For CO2, Q has revealed not to be strongly dependent on the reducedelectric field, keeping under the Fano factor up to concentrations of 0.1 %. Itwas expected that the Q-factor had decreased with the rise of EL electric fieldand this did not happened for CO2, whose effect is probably due todissociative electron attachment with the additive molecules [32].
For CH4 there is a clear dependence of Q with the reduced electric field(E/p) and for concentrations below 1 %, the Q-factor becomes negligible (<0.05) for E/p values above 2.5 kV/cm/bar. This explains the good resultsobtained for energy resolution with CH4 from figure 3.7. For CF4, Q becomeshigher than Fano factor for concentrations as low as 0.01 %, increasingabruptly with increasing concentrations [32].
35

36
Chapter 4
Electroluminescence in noble gases
There are two signals of major interest to study in the NEXT TPC, namely,the primary scintillation and the secondary scintillation. The first is producedby highly energetic charges while interacting with xenon atoms and is used inorder to establish the start-of-event trigger, whereas the second is produced inthe electroluminescence region by electrons, providing information on theevent energy. Therefore, fluctuations in this latter signal are a factor tominimise as much as possible.
4.1 Primary scintillation
In pure xenon, the primary scintillation is produced while the primaryelectron cloud is being formed, following the absorption of radiation and thethermalisation of the resulting ionisation electrons.
When energetic charged particles cross a volume of gaseous xenon, itsatoms can be ionised or excited by those particles producing a widedistribution of xenon excited states that quickly will end up on both thelowest metastable state (3P2) and the resonant state (3P1) [97]. For pressuresabove tens of mbar, the main process around which the excited atoms willdepopulate is through three-body collisions with ground state xenon atoms,creating excimers [107], as described by:
Xe∗ + 2Xe→ Xe∗∗2 + Xe (4.1)
with Xe∗ the excited state of a xenon atom and Xe∗∗2 the created excimer.Howsoever, for pressures above 400 mbar, the excimers quickly loose theirhighly vibrational energy through collisions with ground state atoms, asstated by [108], then:
Xe∗∗2 + Xe→ Xe∗2 + Xe (4.2)
In turn, the lowest vibrational states will decay and emit a scintillation photon
37
[109]:Xe∗2 → 2Xe + hν (4.3)
being hν the scintillation photon. These photons will form a vacuumultraviolet continuum, the so-called second continuum, centred at 172 nm,with a FWHM of 14 nm [108].
Thus, a sufficiently high electric field (E/p > 6 V/cm/bar) is applied in theTPC drift region [110], in order to avoid recombination of electrons.Nevertheless, for particles experiencing high energy loss per unit of pathlength, electron-ion recombination still could occur. Going further, this is aprocess consisting in the formation of a molecular ion (Xe+2 ) in three bodycollisions and the consequent electron thermalisation through elasticcollisions, excitation or ionisation, leading to dissociative recombination:
Xe+2 + e→ Xe∗∗ + Xe (4.4)
Then, when the relaxation of the resultant highly excited atom takes place,giving rise to a xenon atom on its excited state and heat release, the reactionspreviously mentioned can also occur, leading into a VUV photon emission inthe xenon second continuum [111]. Nevertheless, the recombination isexpected to be minimal in the NEXT experiment due to low ionisation chargedensity generated in the beta emission.
The signal amplitude of primary scintillation is very low and, thus, it ishard to distinguish from the noise background. Nevertheless, the detectionof primary scintillation is the most convenient way to obtain the t0 needed toplace an event properly in a three-dimensional space in a TPC [83], as referredin chapter 3.
The average energies needed to produce a VUV photon, ws, and anelectron pair, wi, are both used to quantify the primary scintillation andionisation yields. A wi value of 22 ± 1 eV, using x-rays, gammas or electrons,was reported by [112–114], whereas the ws value reported in the literature isin the range of 34-111 eV [14, 31, 92, 115], with the lower values having beenobtained with alpha particles and the higher values using x-rays. This is atendency that is still not fully understood.
4.2 Secondary scintillation
The electric field applied to the drift region is also used to drive theelectrons to the EL amplification region. The secondary scintillation happenswhen the thermalized free electrons acquire enough kinetic energy betweencollisions with the atoms, in order to cause excitation of the atoms, through
38

inelastic collisions. Since these are low energy electrons, xenon ispredominantly excited in the lowest metastable, 3P2, and resonant, 3P1, states.Thus, the aforementioned de-excitation processes involved in the primaryscintillation will happen here as well. Finally, the VUV photon emission in thexenon second continuum (~172 nm) promoted by the low energy electronimpact when accelerated under an external electric field is the so-calledelectroluminescence or secondary scintillation. Despite the photon emissionalso happening in the 829-885 nm range [116], the VUV continuum is oneorder of magnitude more intense than the near infrared one, although most ofthe photosensors are not even sensitive in this range.
As the lost energy in elastic collisions is really small, theelectroluminescence process is very effective, since the energy acquired by theelectrons from the electric field is efficiently spent exciting the xenon atoms(~95 % efficiency), and, afterwords, producing VUV photons in thede-excitation processes. References [20, 102] refer to excitation efficiencies of~95 % and photon production efficienies of ~80 %, for an applied E/p valueof 4 kV/cm/bar. Nonetheless, this efficiency is decreased for lower appliedelectric fields (< 2 kV/cm/bar). The scintillation threshold for which theelectrons have no longer enough energy to excite the xenon atoms occursaround E/p < 0.76 kV/cm/bar [18].
More detailed information on the xenon electroluminescence, as well asanother noble gases can be found in the following theoretical and experimentalstudies [14, 20, 24, 102, 108, 117, 118].
4.2.1 Electroluminescence yield
The reduced electroluminescence yield (Y/p) is defined as the averagenumber of VUV photons emitted per primary electron and per unit of driftlength of electrons in the scintillation region, divided by the gas pressure. Thereduced electric field (E/p) is the ratio between the electric field intensity andthe gas pressure.
EL yield can be represented as a function of the applied electric field (E).Nonetheless, this relation depends on the gas atomic density (N, i.e. thenumber of atoms per unit of volume) due to the increase in energy that istransferred to the electrons by the electric field between their collisions, as itsmean free path becomes longer with decreasing pressure or gas density. Thus,both parameters are usually normalised to the number of atoms per volumeunit, N. Therefore, the relation between the reduced yield (Y/N) and thereduced electric field (E/N) is valid for any macroscopic conditions of the gasphase. For convenience, this normalisation is sometimes performed to the gaspressure, p, instead. Nevertheless, in such cases, the gas temperature is a
39
parameter to be considered as well, since N depends on both temperature andpressure.
Between the excitation and ionisation thresholds, the Y/p as a function ofE/p is nearly linear, since the amount of energy gained by the electron isdirectly proportional to the electric field. For low electric fields, a deviationfrom the linear trend arises due to a reduction of EL efficiency with E/p thatis sharper for values below E/p ∼ 2 kV/cm/bar. For E/p values above theionisation threshold, the electroluminescence yield has an exponential growthwith the increase on the reduced electric field, following the exponentialgrowth on the number of free electrons available for EL production. Thelinear trend was already measured experimentally in pure xenon and wasdescribed by [18] as:
Yp
(photonselectron−1cm−1bar−1
)= 140
Ep(kVcm−1bar−1)− 116 (4.5)
The scintillation threshold was reported to be ~0.76 kV/cm/bar and theionisation threshold ~4.6 kV/cm/bar [18].
4.3 Energy resolution
The energy resolution is the main key to delimit the intrinsic backgroundin the TPC, the events from the double-beta decay with neutrino emission andthe events from natural radiation origin entering the region of interest [26].
The energy measurement is provided by electroluminescence detection,i.e., the process of secondary light emission, which was demonstrated to be avery good option to embrace in order to achieve excellent energy resolution[119]. Furthermore, this technique provides large signals with negligibleelectronic noise, being an optimum amplification technique for an experimentof this nature, with very low event rates and high background levels [14].
The energy resolution of an EL-based detector like the gas proportionalscintillation counter (GPSC) readout by a Large Area Avalanche Photodiode(LAAPD) used in this work is determined by the statistical fluctuations in theprimary ionisation processes, in the production of EL scintillation and in thephotosensor. Since these contributions are statistically independent, thevariance of the total energy resolution can be obtained by summing thevariances of the above contributions.
When x-rays with energy Ex are absorbed in xenon, an average number ofprimary electrons (Ne) is produced:
Ne =Ex
w(4.6)
40
where w is the mean energy required to produce a primary electron in xenon,with w ∼ 22.4 eV [120, 121].
As the primary electrons traverse the GPSC scintillation region, theyproduce an average number of scintillation photons per electron, NEL. Afraction of these scintillation photons will strike the active area of thephotosensor, releasing an average number of primary charges inside thephotosensor (Npe).
The output signal of avalanche photodiodes can be affected by severalfluctuation sources: statistical fluctuations associated with the number ofelectron-hole pairs created in silicon, Npe, and with the avalanche process;gain non-uniformity in the Avalanche photodiode (APD) detection volume;and the dark noise of the diode-preamplifier system. The non-uniformitycontribution to the statistical fluctuations is negligible for light detection,since the whole area of the LAAPD is irradiated and the final pulse resultsfrom an average response to the full amount of photons interacting in thephotosensor. For the GPSC and LAAPD operation conditions used in thiswork, the dark noise contribution is also expected to be negligible, whencompared to the remaining contributions [122]. Accordingly, the variance ofthe LAAPD output signal (σ2
S) is dominated by the fluctuations incharge-carrier creation and in avalanche multiplication [123, 124]:
σ2S = σ2
Npe+ Npe
σ2G
G2 (4.7)
where G and σ2G are the LAAPD gain and respective variance. For light pulse
detection, fluctuations on the number of primary electrons are described byPoisson statistics, as follows σ2
Npe= Npe. Hence, equation 4.7 can be simplified
into:σ2
S = Npe f (4.8)
with f being defined as the excess noise factor, f = 1 + σ2G/G2. Since the
multiplication process in the LAAPD results in electron avalanche fluctuations,f is higher than 1, depending on the LAAPD gain. In ref. [124], a f value ofapproximately 2 was estimated for a 16mm-diameter LAAPD operated at again of 150, being these the same specifications of our LAAPD.
Considering the aforementioned approximations, the energy resolution canbe given by [24, 120]:
RE = 2√
2ln2
√√√√ σ2e
N2e
+1
Ne
(σ2
EL
N2EL
)+
σ2pe
N2pe
+1
Npe
(σ2
G
G2
)(4.9)
with the first term related with fluctuations in the number of primary
41
electrons produced per x-ray interaction (Ne), the second term is related tofluctuations in the number of EL photons, NEL, produced per primaryelectron and the last two terms are related to the main fluctuation sources inthe photosensor, i.e. in the number of photoelectrons produced in the LAAPDby EL per x-ray interaction in the gas and in the number of collected electronsin the APD anode per photoelectron produced in the LAAPD (the APD gain,G).
The fluctuations in Ne and in NEL are not purely statistical, leading to arelative variance lower than that expected from the Poisson statistics. The Fanofactor, F, and the J parameter are defined as the relative variance of Ne and NEL,respectively. Thus, the above equation can be written as
RE = 2√
2ln2
√√√√ FNe
+1
Ne
(J
NEL
)+
σ2pe
N2pe
+1
Npe
(σ2
G
G2
)(4.10)
Within the reduced electric field region of interest of NEXT (1.5-3.5kV/cm/bar), the second term in equation 4.10 is expected to be negligible,since NEL > 100 and J F, both in pure xenon and xenon-helium mixtures[34]. Therefore, the expression for the energy resolution can be simplified into:
RE = 2.355
√F
Ne+
fNpe
(4.11)
If the reflections of scintillation photons on the GPSC materials and LAAPDwindow are neglected, Npe can be computed as follows:
Npe = NeNELQeΩ4π
(4.12)
with Ω being the solid angle subtended by the photosensor active area, andQe is the photosensor effective quantum efficiency. For the dimensions of ourdetector and photosensor, the average Ω/4π along the EL gap (0.8 cm) is 0.23,which includes the anode grid optical transparency. The effective quantumefficiency (i.e. including the window transmission and intrinsic quantumefficiency) of our LAAPD for the xenon second continuum scintillation isapproximately 1.05 according to the manufacturer [125]. The quantumefficiency is higher than 100% in this photosensor because VUV photons haveenough energy to produce more than 1 electron-hole pair.
The first term in equation 4.11 does not depend on the detector readouttechnology, hence being often defined as the detector intrinsic energyresolution (Rint):
Rint = 2.355
√FwEx
(4.13)
42
On the other hand, the second term depends on both the photosensor and thenumber of produced EL photons, with the latter being directly proportionalto the reduced electric field, as demonstrated in equation 4.5. If both sides ofequation 4.11 are squared, and the definition of intrinsic energy resolution isused, a simple linear relation can be obtained:
R2E = R2
int +2.3552w f
Exa1
NEL(4.14)
where 1/NEL and R2E are the dependent and the independent variables,
respectively and a is a constant equal to QeΩ4π . Therefore, by measuring the
overall energy resolution for different reduced electric fields applied in theEL region, R2
E can be plotted as a function of 1/A, whereas A is the LAAPDsignal amplitude, being directly proportional to NEL. In this way, according toequation 4.14, the detector intrinsic energy resolution, Rint, and consequently,the Fano factor, F, can be estimated from the y-interception of a straight linefitted to data, i.e. at the limit of infinite light yield. This method has beensuccessfully exploited in GPSCs, and is similar to the one used in the presentwork [24, 126].
43

44
Chapter 5
Helium
Helium used as an additive in xenon presents the potential to improve thedesired topological signature in HPXe TPCs. It is intended to achieve acompromise in order to have enough helium, so it allows the electrondiffusion reduction, and the smallest possible amount of helium, so itbecomes possible to avoid additional pressure, without loose the sourceisotope inside the TPC, in order to attain a good sensitivity.
The choice of helium as an additive brings several advantages, such as theeasiness to handle, and it is free of light quenching effects (i.e. the lightsuppression in the scintillation yield with xenon). As a noble gas it is freefrom vibrational and rotational states, as well as dissociation, by comparisonwith molecular additives. The scintillation yield is not significantly affected,since there are no energy losses to those vibrational and rotational states andthe drift velocity can be twice higher than in pure xenon as well. Althoughhaving a minimum impact, it is still positive, in the data acquisition process.
In the drift region, the primary electrons attain a static equilibrium whiledrifting in a noble gas and the energy gained from the electric field is inbalance with the energy lost in elastic collision with the gas atoms. Thus, thehelium may be a mechanism to significantly reduce the electron clouddiffusion caused by pure xenon, allowing the electrons to cool downefficiently, due to its very small mass, when compared to xenon [29].
Moreover, for the concentrations in study, at ~2 bar for a total of 10-15 bar,helium is a convenient way to detect leaks in the system, since it will easilyescape in the case of existing microleaks, thus, with the detection of helium itis possible to prevent xenon losses as well. Furthermore, as a noble gas, thehelium is chemically inert and uses the same purification system as xenon,being easily separated from each other. This allows the xenon recovery afterthe mixture procedure, simply by cooling, using liquid nitrogen, once theboiling temperature for helium is 4.22 K, xenon has a fusion temperature at161.4 K and the liquid nitrogen has its ebullition point at 77 K.
45

The use of photomultipliers, in its turn, in a detector with helium fillingmight be a problem, since the helium can permeate through the PMT anddamage it. Although, this can be avoided by shielding the PMT in vacuumwith a sapphire window, which is impermeable to helium. Anotheralternative is the use of SiPMs instead of PMTs, which also simplifies themechanical design.
5.1 Previous studies with helium
5.1.1 Diffusion
It has been noted that the addition of small concentrations of helium,namely 10-15 %, to high-pressure xenon may reduce the transverse electrondiffusion from 10.5 mm/
√m in pure xenon down to 2.5 mm/
√m, while
imposing only a relatively small effect on longitudinal diffusion remainingaround 4 mm/
√m [34].
Transverse diffusion
The electron energies under the typical drift fields operated in TPCs arefar from the excitation levels of the noble gas atoms, which implies thatelectron–atom collisions are elastic. Thus, by using a classical kinematiccalculation of two body collisions, an accurate estimate for the momentumtransfer is allowed, whereas the momentum transfer efficiency depends ontwo bodies mass ratio.
It is expected the total energy loss of electrons remains approximatelyconstant as the cross section at very low energies becomes larger for xenonthan for helium atoms, due to its larger mass. However, the existence of theRamsauer minimum [127] for xenon cross section, depicted in the figure 5.1a,is balanced with the addition of helium, neutralising the difference in atoms’mass, thus making the overall cooling of xenon-helium mixtures to be moreeffective in that region.
Therefore, the transverse diffusion is the dominating factor in the global3D diffusion, which can be reduced in the presence of additives, being weaklyaffected by the electric field. The transverse diffusion coefficient is shown infig 5.1b as a function of helium concentration, performed by simulation in [34].
From simulation studies, a transverse diffusion of 2.5 mm/√
m ispredicted for 15 % helium in xenon, using a field range of 300-500 V/cm. Thisparameter is weakly affected by the electric field, unlike the longitudinaldiffusion discussed forward. This is an improvement with respect to purexenon, whose transverse diffusion is 10.5 mm/
√m. Thus, it is believed that
46

for a drift distance of 1 meter, the addition of 10-15 % successfully reduces thetransverse diffusion effects [34].
(a) (b)
Figure 5.1: Left: Cross section of electron-xenon and electron-helium asfunction of electron energy [128]. Right: Transverse diffusion coefficient asfunction of helium concentration in xenon-helium admixtures [34].
MagBoltz simulations [129] verified that the Wannier relation is expected tobe applied in the region of interest, 20-50 V/cm-bar for xenon-helium mixtures.
(a) (b)
Figure 5.2: Left: Dependence of the reduced transverse diffusion coefficienton helium concentration predicted with Magboltz simulations. The linerepresents the value from the simulation and the shaded region is the errorin the simulation. Right: Extrapolated transverse diffusion in pure xenon,compared to experimental data from NEXT-NEW TPC [35].
Figure 5.2a presents the results for the transverse diffusion from Magboltzfor these admixtures with 10-15 % helium, while the results presented by [35]from the extrapolated transverse diffusion values, assuming the Wannier
47
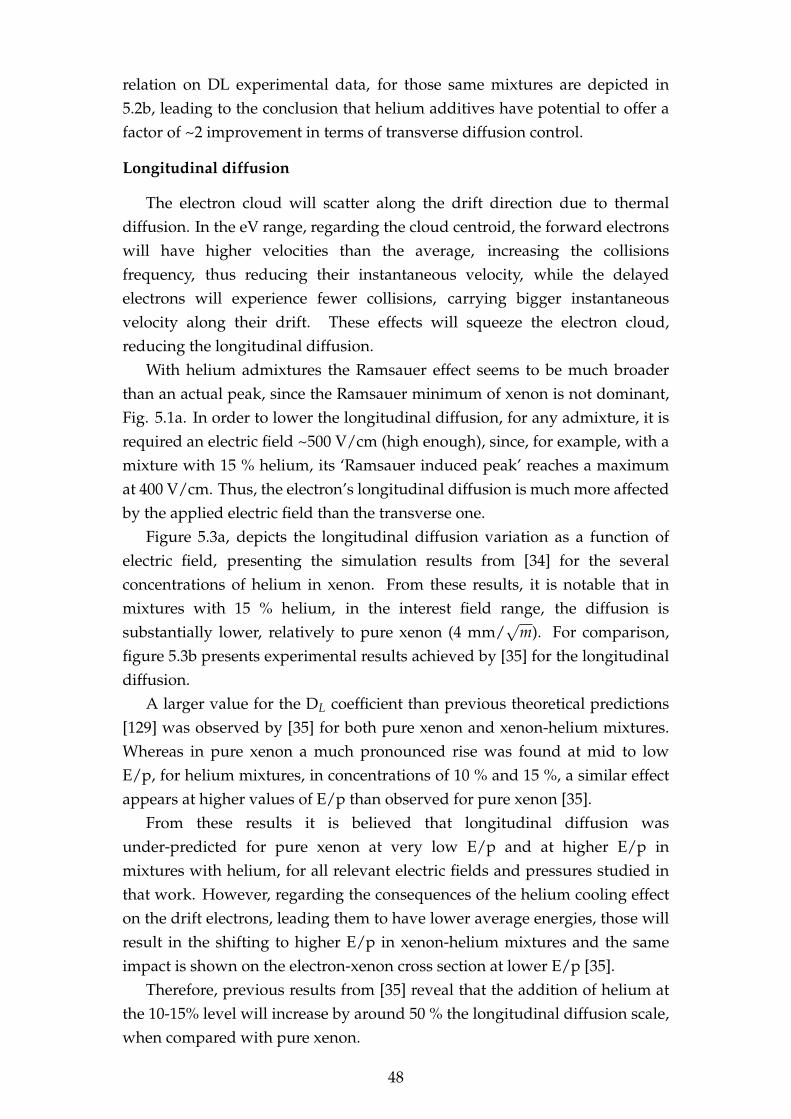
relation on DL experimental data, for those same mixtures are depicted in5.2b, leading to the conclusion that helium additives have potential to offer afactor of ~2 improvement in terms of transverse diffusion control.
Longitudinal diffusion
The electron cloud will scatter along the drift direction due to thermaldiffusion. In the eV range, regarding the cloud centroid, the forward electronswill have higher velocities than the average, increasing the collisionsfrequency, thus reducing their instantaneous velocity, while the delayedelectrons will experience fewer collisions, carrying bigger instantaneousvelocity along their drift. These effects will squeeze the electron cloud,reducing the longitudinal diffusion.
With helium admixtures the Ramsauer effect seems to be much broaderthan an actual peak, since the Ramsauer minimum of xenon is not dominant,Fig. 5.1a. In order to lower the longitudinal diffusion, for any admixture, it isrequired an electric field ~500 V/cm (high enough), since, for example, with amixture with 15 % helium, its ‘Ramsauer induced peak’ reaches a maximumat 400 V/cm. Thus, the electron’s longitudinal diffusion is much more affectedby the applied electric field than the transverse one.
Figure 5.3a, depicts the longitudinal diffusion variation as a function ofelectric field, presenting the simulation results from [34] for the severalconcentrations of helium in xenon. From these results, it is notable that inmixtures with 15 % helium, in the interest field range, the diffusion issubstantially lower, relatively to pure xenon (4 mm/
√m). For comparison,
figure 5.3b presents experimental results achieved by [35] for the longitudinaldiffusion.
A larger value for the DL coefficient than previous theoretical predictions[129] was observed by [35] for both pure xenon and xenon-helium mixtures.Whereas in pure xenon a much pronounced rise was found at mid to lowE/p, for helium mixtures, in concentrations of 10 % and 15 %, a similar effectappears at higher values of E/p than observed for pure xenon [35].
From these results it is believed that longitudinal diffusion wasunder-predicted for pure xenon at very low E/p and at higher E/p inmixtures with helium, for all relevant electric fields and pressures studied inthat work. However, regarding the consequences of the helium cooling effecton the drift electrons, leading them to have lower average energies, those willresult in the shifting to higher E/p in xenon-helium mixtures and the sameimpact is shown on the electron-xenon cross section at lower E/p [35].
Therefore, previous results from [35] reveal that the addition of helium atthe 10-15% level will increase by around 50 % the longitudinal diffusion scale,when compared with pure xenon.
48
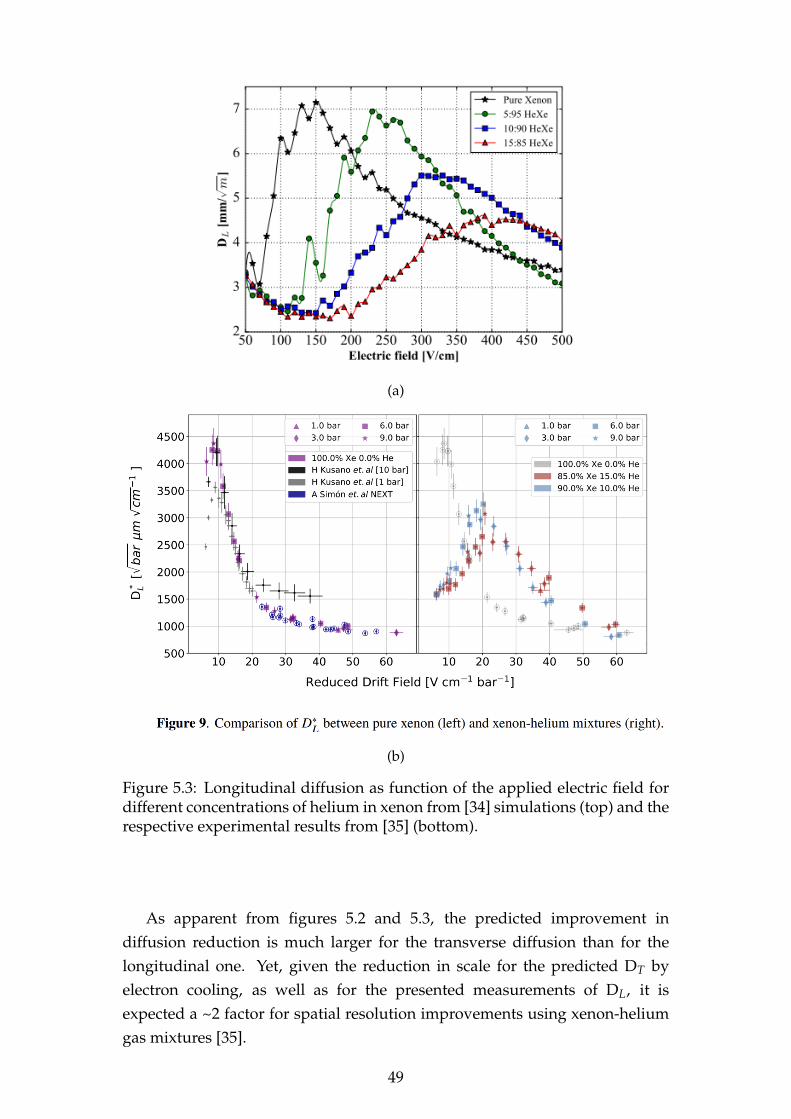
(a)
(b)
Figure 5.3: Longitudinal diffusion as function of the applied electric field fordifferent concentrations of helium in xenon from [34] simulations (top) and therespective experimental results from [35] (bottom).
As apparent from figures 5.2 and 5.3, the predicted improvement indiffusion reduction is much larger for the transverse diffusion than for thelongitudinal one. Yet, given the reduction in scale for the predicted DT byelectron cooling, as well as for the presented measurements of DL, it isexpected a ~2 factor for spatial resolution improvements using xenon-heliumgas mixtures [35].
49
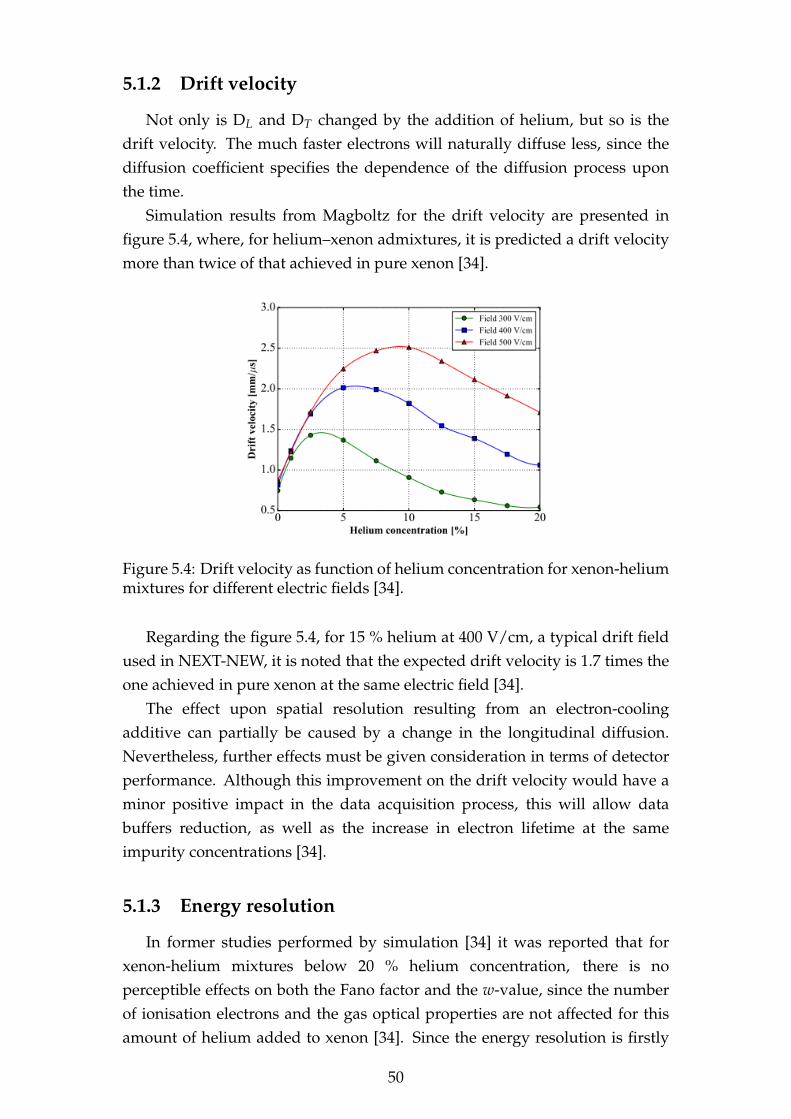
5.1.2 Drift velocity
Not only is DL and DT changed by the addition of helium, but so is thedrift velocity. The much faster electrons will naturally diffuse less, since thediffusion coefficient specifies the dependence of the diffusion process uponthe time.
Simulation results from Magboltz for the drift velocity are presented infigure 5.4, where, for helium–xenon admixtures, it is predicted a drift velocitymore than twice of that achieved in pure xenon [34].
Figure 5.4: Drift velocity as function of helium concentration for xenon-heliummixtures for different electric fields [34].
Regarding the figure 5.4, for 15 % helium at 400 V/cm, a typical drift fieldused in NEXT-NEW, it is noted that the expected drift velocity is 1.7 times theone achieved in pure xenon at the same electric field [34].
The effect upon spatial resolution resulting from an electron-coolingadditive can partially be caused by a change in the longitudinal diffusion.Nevertheless, further effects must be given consideration in terms of detectorperformance. Although this improvement on the drift velocity would have aminor positive impact in the data acquisition process, this will allow databuffers reduction, as well as the increase in electron lifetime at the sameimpurity concentrations [34].
5.1.3 Energy resolution
In former studies performed by simulation [34] it was reported that forxenon-helium mixtures below 20 % helium concentration, there is noperceptible effects on both the Fano factor and the w-value, since the numberof ionisation electrons and the gas optical properties are not affected for thisamount of helium added to xenon [34]. Since the energy resolution is firstly
50
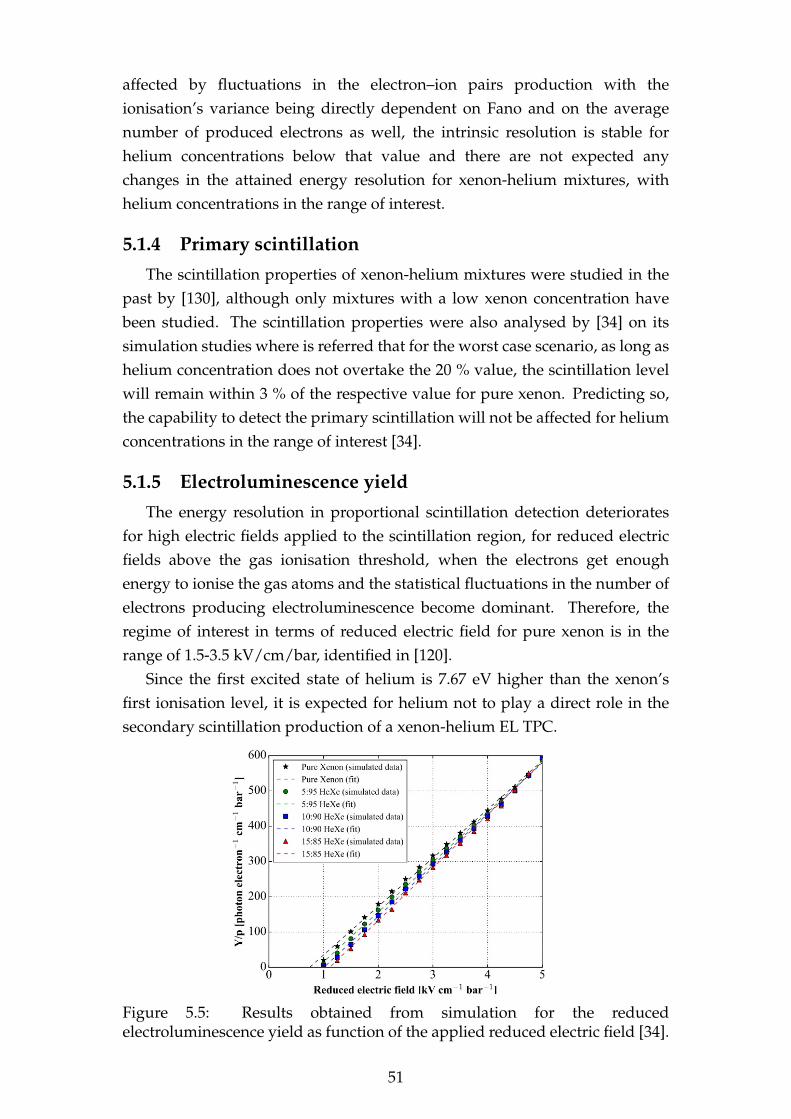
affected by fluctuations in the electron–ion pairs production with theionisation’s variance being directly dependent on Fano and on the averagenumber of produced electrons as well, the intrinsic resolution is stable forhelium concentrations below that value and there are not expected anychanges in the attained energy resolution for xenon-helium mixtures, withhelium concentrations in the range of interest.
5.1.4 Primary scintillationThe scintillation properties of xenon-helium mixtures were studied in the
past by [130], although only mixtures with a low xenon concentration havebeen studied. The scintillation properties were also analysed by [34] on itssimulation studies where is referred that for the worst case scenario, as long ashelium concentration does not overtake the 20 % value, the scintillation levelwill remain within 3 % of the respective value for pure xenon. Predicting so,the capability to detect the primary scintillation will not be affected for heliumconcentrations in the range of interest [34].
5.1.5 Electroluminescence yieldThe energy resolution in proportional scintillation detection deteriorates
for high electric fields applied to the scintillation region, for reduced electricfields above the gas ionisation threshold, when the electrons get enoughenergy to ionise the gas atoms and the statistical fluctuations in the number ofelectrons producing electroluminescence become dominant. Therefore, theregime of interest in terms of reduced electric field for pure xenon is in therange of 1.5-3.5 kV/cm/bar, identified in [120].
Since the first excited state of helium is 7.67 eV higher than the xenon’sfirst ionisation level, it is expected for helium not to play a direct role in thesecondary scintillation production of a xenon-helium EL TPC.
Figure 5.5: Results obtained from simulation for the reducedelectroluminescence yield as function of the applied reduced electric field [34].
51
The idea that the EL yield for helium mixtures with xenon is notsignificantly affected with helium addition, relatively to EL yield obtained forpure xenon, was corroborated in the simulation results presented by [34], Fig.5.5. The slight shift of EL threshold toward higher electric fields with heliumaddition is explained by helium’s residual cooling effect. This shift can beovercome by increasing the voltage applied to the EL gap.
52
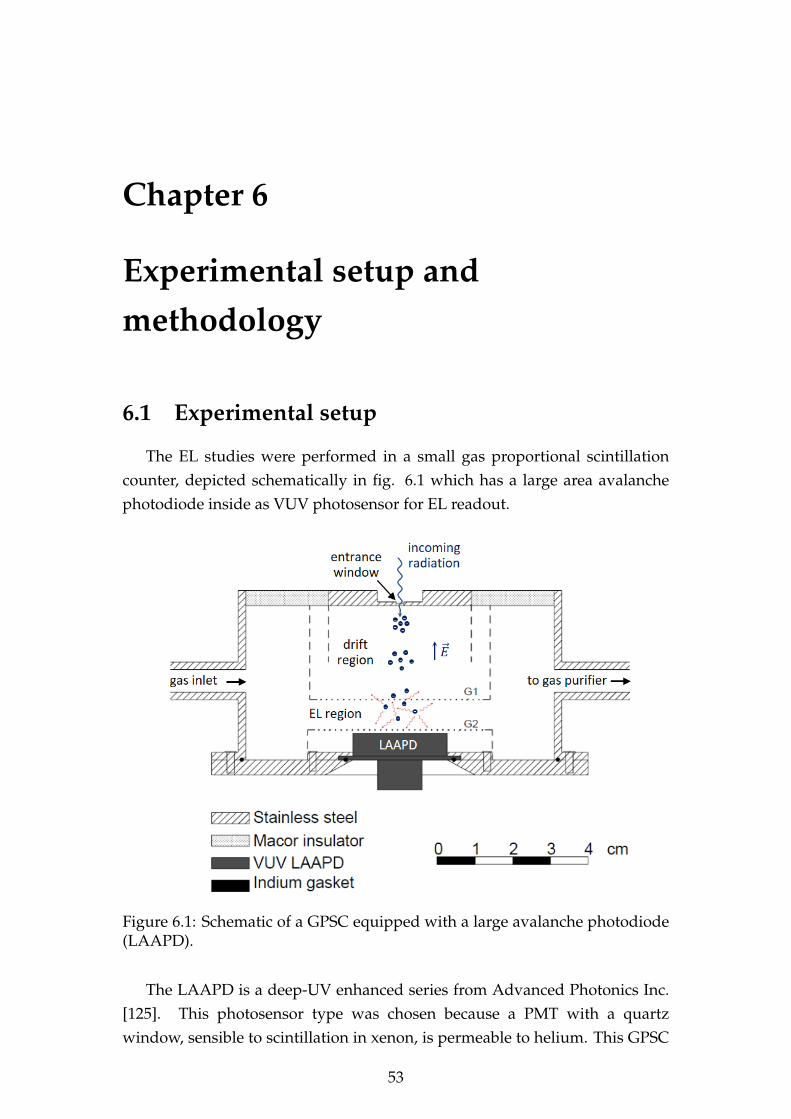
Chapter 6
Experimental setup andmethodology
6.1 Experimental setup
The EL studies were performed in a small gas proportional scintillationcounter, depicted schematically in fig. 6.1 which has a large area avalanchephotodiode inside as VUV photosensor for EL readout.
Figure 6.1: Schematic of a GPSC equipped with a large avalanche photodiode(LAAPD).
The LAAPD is a deep-UV enhanced series from Advanced Photonics Inc.[125]. This photosensor type was chosen because a PMT with a quartzwindow, sensible to scintillation in xenon, is permeable to helium. This GPSC
53

was already used for several studies using pure xenon and pure argon filling[126, 131].
The GPSC enclosure is a stainless-steel cylinder with a diameter of 10 cmand 5 cm in height. This is a standard uniform EL field type GPSC with anabsorption (drift) region of 2.5 cm and a scintillation (EL) region 0.8 cm deep.It was filled at pressures around 1.2 bar, being the gas continuously purifiedthrough St707 SAES getters, that were kept at 150º C, and circulating byconvection. The gas purifying system is a U-tubing connected to the GPSC,closing the gas inlet and outlet with a valve in each tip of the vertical armenclosing the getters - a schematic diagram is presented in figure 6.2. The fullsystem was rigorously vacuum tested for leaks.
The grids G1 and G2, which delimit the scintillation region, are made ofstainless steel wire, with 80 µm in diameter and a 900 µm spacing, delimitingthe scintillation region. The detector’s radiation window is made ofaluminized Melinex with a diameter of 2 mm and a thickness of 6 µm. Theholders of both radiation window and grid G1 are isolated with a Macorpiece. A low vapour pressure epoxy was used to vacuum-seal the Macorpiece, the radiation window and holder, as well as the voltage feedthrough ofG1. On its turn, the LAAPD, placed just below G2, was vacuum-sealed withan indium ring compressed between the detector’s stainless steel body andthe photodiode enclosure.
Both the radiation window and its focusing electrode were operated atnegative voltage, as well as the grid G1 and its respective holder. The LAAPDenclosure, its holder and mesh G2 were kept at ground potential. Thus, theelectric field in the scintillation region is set by G1’s voltage, whereas in thedrift region the electric field is set by the voltage difference between the GPSCradiation window and the grid G1.
The LAAPD used in this setup is a windowless UV-enhanced and has anactive diameter of 16 mm, from API. A maximum operation voltage of 1840 Vwas used, corresponding to a gain of approximately 150 and a dark currentbetween 200-500 nA [125]. The LAAPD characteristics to xenon VUV ELdetection is described in detail in [132].
In order to irradiate the GPSC along its axis, a 1 mm collimated 5.9 keVx-ray beam was used, emitted from a 55Fe radioactive source being the 6.4keV Mn x-ray line (kβ) efficiently absorbed by a chromium foil, 15 µm thick.Thus, it will be easier to determine the energy resolution, since there is only a5.9 keV full absorption peak in the region of interest. The signals extractedfrom LAAPD were fed through a low noise 1.0 V/pC charge sensitivepre-amplifier, Canberra 2006, which extracts the signal from the photosensor.These signals are conducted to a Hewlett Packard 5582A linear amplifier with
54

2 µs shaping time constant, being pulse height analysed with a NucleusPCA-II multi channel analyser (MCA) with 1024 channels, i.e., the MCA isused to construct a histogram of pulse heights, known as pulse-heightdistribution.
6.1.1 Gas mixture system
The gas mixture system was envisaged to accommodate two differentvolumes with well established volume ratios, both connected to the GPSCthrough vacuum valves, figure 6.2. Both volumes were used to store theintended amount of helium in order to be able to perform the studies of twoconsecutive xenon-helium mixtures with different helium content, followingthe detector characterisation with pure xenon, without any change in theGPSC operation conditions, namely the LAAPD bias, while the mixture isbeing made. The mixture was made simply by opening the respective valveof the given volume, connecting the helium storage volume to the GPSCvolume.
Figure 6.2: Experimental setup layout
The whole system was pumped down to a pressure of about 2.0×10⁻⁶ mbarfor several hours. This is a standard procedure before adding any gas into thesystem. The proper amount of helium was stored in the volumes 1 and 2, bothat well defined pressures, previously calculated, in order to achieve the desiredxenon-helium concentrations. The xenon gas purity was 4.8 grade from Messerand helium was of grade 5.0.
55
6.2 Experimental methodology
6.2.1 Gas mixing procedure
After filling the two helium volumes, the GPSC and the tubings were filledwith pure xenon. In each run, the data acquisition for the pure xenon andthe two xenon-helium mixtures were performed 24 hours after the xenon wasbeing circulating in the getters, allowing the system temperature to stabiliseand the xenon to purify.
The LAAPD was previously polarised before each series of data taking setand was left to stabilise for a few hours, until its dark current and, therefore,its gain were stabilised around a given value. During the helium mixingprocess, in order to obtain a given xenon-helium mixture concentration, theLAAPD leak current and the GPSC response to the 5.9 keV x-rays wascontinuously monitored, i.e. the centroid and energy resolution of the totalabsorption peak were monitored while the LAAPD bias and the detectorapplied voltages were kept constant, without being turned off. This allowedus to know when the gas mixing process was concluded and the systemstability was again reached. For the monitoring purpose, during the gasmixing process, values of 0.45 kV/cm/bar and 3 kV/cm/bar, were chosen forthe drift and scintillation reduced electric fields, respectively, in the GPSCwhile a biasing voltage of 1840 V was applied to the LAAPD.
Therefore, in a single run, the GPSC EL output and the energy resolutiondependence on the reduced electric field in the scintillation region werestudied for pure xenon and for two different helium concentrations withoutthe need to switch off the GSPC and LAAPD bias voltages. This method wasadopted in order to minimise the influence of external factors and so avoidchanges in the operation conditions. This procedure was repeated severaltimes, being the helium concentration values chosen arbitrarily, in order toverify the results coherence and repeatability, as well as to validate them andevaluate any possible fluctuations in the data.
It is worth to mention the fact that all admixtures end up with a specifictotal pressure inside the detector, which is different from mixture to mixturedue to the fact that the admixtures were performed by adding a specifichelium volume to the total volume. Nevertheless, the initial helium pressuresinside the two volumes were set taking also into account this issue and it waspossible to keep all the studied pure xenon and xenon-helium gas mixturefillings within a 18 % variation, around an average pressure of 1.14 bar. Arelative uncertainty below 4 % in the helium concentration results occurredfrom both the pressure gauge precision and the uncertainty in the volumesratio.
56
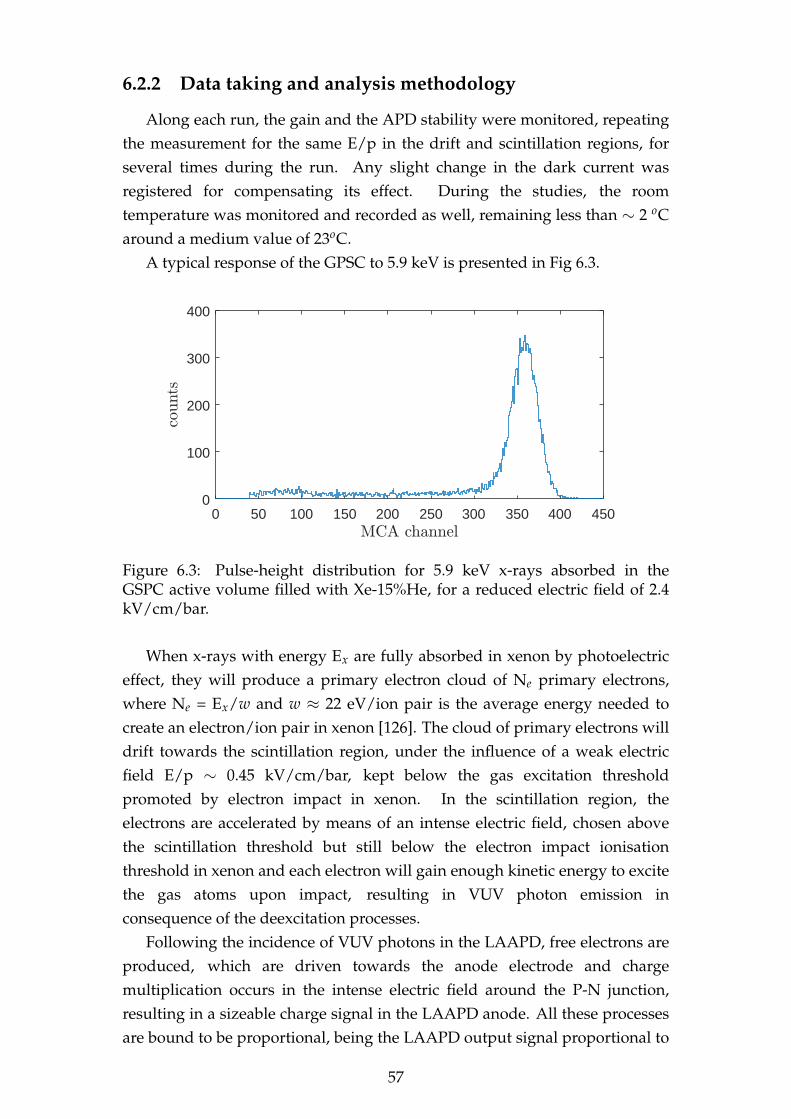
6.2.2 Data taking and analysis methodology
Along each run, the gain and the APD stability were monitored, repeatingthe measurement for the same E/p in the drift and scintillation regions, forseveral times during the run. Any slight change in the dark current wasregistered for compensating its effect. During the studies, the roomtemperature was monitored and recorded as well, remaining less than ∼ 2 oCaround a medium value of 23oC.
A typical response of the GPSC to 5.9 keV is presented in Fig 6.3.
0 50 100 150 200 250 300 350 400 4500
100
200
300
400
Figure 6.3: Pulse-height distribution for 5.9 keV x-rays absorbed in theGSPC active volume filled with Xe-15%He, for a reduced electric field of 2.4kV/cm/bar.
When x-rays with energy Ex are fully absorbed in xenon by photoelectriceffect, they will produce a primary electron cloud of Ne primary electrons,where Ne = Ex/w and w ≈ 22 eV/ion pair is the average energy needed tocreate an electron/ion pair in xenon [126]. The cloud of primary electrons willdrift towards the scintillation region, under the influence of a weak electricfield E/p ∼ 0.45 kV/cm/bar, kept below the gas excitation thresholdpromoted by electron impact in xenon. In the scintillation region, theelectrons are accelerated by means of an intense electric field, chosen abovethe scintillation threshold but still below the electron impact ionisationthreshold in xenon and each electron will gain enough kinetic energy to excitethe gas atoms upon impact, resulting in VUV photon emission inconsequence of the deexcitation processes.
Following the incidence of VUV photons in the LAAPD, free electrons areproduced, which are driven towards the anode electrode and chargemultiplication occurs in the intense electric field around the P-N junction,resulting in a sizeable charge signal in the LAAPD anode. All these processesare bound to be proportional, being the LAAPD output signal proportional to
57
the initial number of primary electrons and, thus, to the energy deposited inxenon by radiation interaction.
The number of scintillation photons per primary electron is large [126] (forthe E/p range used in the present studies) and the statistical fluctuationsrelated with light amplification process is negligibly small, when compared tothat associated with the primary electron cloud formation. As a result, theenergy resolution of a GPSC approaches the theoretical limit determined bythe Fano factor and w-value in xenon, provided a low noise high-sensitivityphotosensor to measure the VUV scintillation light.
The primary scintillation produced by x-ray interaction is more than 3orders of magnitude lower than the EL output [14], therefore being within theelectronic noise.
In order to measure both amplitude and energy resolution of the producedsignals, the full absorption peaks were fitted to Gaussian functions,overlapping to a linear background, and then both FWHM and centroid weredetermined, being the centroid taken as pulse amplitude. The full absorptionpeak’s position (centroid) and its relative FWHM were studied for pure xenonand for each xenon-helium mixture studied in this work, as a function of thereduced electric field in the scintillation region.
Since the main objective of the present work was to study the variation ofthe EL yield and GPSC energy resolution of xenon-helium mixtures relativeto pure xenon, the EL yield was measured only with relative values. Eachrun, the reduced EL yield absolute values, Y/p, were determined bynormalising the pulse amplitude measured for pure xenon at E/p of ~2.0kV/cm/bar to the respective absolute value obtained in simulation data [34].The calculated normalisation constant was then used to normalise theremaining centroid values obtained for the different E/p for pure xenon andfor the xenon-helium mixtures studied in the same run. This methodology, byperforming in each run the study of EL yield for pure xenon allows to obtainabsolute values for the EL yield of the different xenon runs, independently ofthe LAAPD operating conditions, e.g. temperature, dark current and gain,and therefore obtain results that are comparable to each other.
Despite the operating conditions have kept stabilised along each run, slightchanges in the LAAPD dark current could happen, since each run took somehours of duration. In order to correct for the possible slight changes in gain dueto the variations in the leak current in LAAPD, independent studies have beenmade in order to determine how the leak current changes affects the LAAPDgain. This was made by fine tuning the LAAPD bias voltage in order to obtainthe observed changes in the LAAPD dark current, measuring the respectivepulse amplitude variations, i.e. the variations in the 5.9 keV peak centroid
58
position.In addition, before each data taking set, some measurements were taken
for the same applied reduced electric field, while the leak current wasn’t stillstabilised. These measurements allowed us to have more data in order tounderstand how the gain would change in function of the leak current.Plotting the centroid channel data as function of the leak current, it was clearthat there was a linear dependence of the centroid channel variation with theleak current, decreasing the gain with increasing leak current. For each nAvariation in the leak current there was a 0.32 % variation in the gain value.There were no observed modifications to this behaviour along the whole datataken campaign. These applied corrections were correspondent at the level ofless than 5 % of the respective value. Thus, it is a certainty that all data iscorrespondent to exactly the same operation conditions and comparable toeach other.
6.2.3 Waveform analysis methodology
In the reported work the standard method was used, with the photosensoroutput connected to a pre-amplifier, followed by a linear amplifier and aMulti-Channel Analyser for pulse-height analysis. This setup doesn’t allowthe preservation of the photosensor signal temporal information (for instancethe drift time information), which is crucial to understand the underlyingdynamics related with the drift electrons as well as the scintillationproduction, like the drift velocity.
For that, we used a digital oscilloscope, WaveRunner 610Zi from Lecroywith 50 Ω DC coupling (used to match the cable impedance in order to avoidwave reflections). In this way, it becomes possible to access the signalamplitude as a function of the time. With the LAAPD low gain, the recordedwaveforms, taken directly on its output, have a high noise level, makingdifficult to trigger the events in the oscilloscope. The solution that was usedin order to overcome this problem was to connect the LAAPD to apre-amplifier and then to a linear amplifier with a 50 ns shaping time, insteadthe 2 µs used as shaping constant for the EL yield measurements. In its turn,the amplifier is connected to the oscilloscope. In this way, the output signalcoming from the linear amplifier is similar to the waveforms at the LAAPDoutput, with just an additional distortion in the order of 50 ns.
The oscilloscope trigger was set on the rising edge with a thresholdslightly higher than the baseline electronic noise, being the data recorded inthe oscilloscope memory. In order to achieve good statistics, the maximummemory is used for each performed run, corresponding to 105 files, each onewith a single waveform and the size of data is needed to be firstly reduced for
59

performance proposes. Accordingly, it was performed a reduction in memorysize of 20 times, by averaging every 20 successive sampled points, reducing inthis way the high frequency noise, even though degrading the time resolutionof waveforms from 0.1 ns to 2 ns, still enough for the following analysis.
A typical waveform obtained with 5.9 keV x-rays is shown in the figure 6.4.
Figure 6.4: Typical waveform obtained with 5.9 keV x-rays.
Figure 6.5: Example of a rejected waveform that significantly deviates in timefrom the trigger instant.
The waveforms that were not correctly sampled or correspond tobackground events were rejected through the use of an algorithm. Thisalgorithm rejects all waveforms with sharp negative spikes and saturatedsignals, since they are mainly produced by high frequency interferences andhigh energy cosmic rays, respectively. Waveforms whose secondaryscintillation signal is too short (e.g. single photon pulses) or too long, with atime > 5 µs (e.g., double event waveforms) are also rejected, being thisduration measured between the 50%-rising edge and the 50%-falling edgewith respect to the pulse height. Figure 6.5 illustrates one example of arejected waveform due to its excessive secondary scintillation pulse duration.
60
This rejection method is decisive when detailed information about thewaveform shape is required.
A second algorithm was used to align all recorded waveforms in time,based on the secondary scintillation 50%-rising edge with respect to the pulseheight, corresponding approximately to the time when the electron cloudcentroid reaches G1. This procedure is required to reduce the jitter introducedby the fixed threshold oscilloscope trigger.
61

62
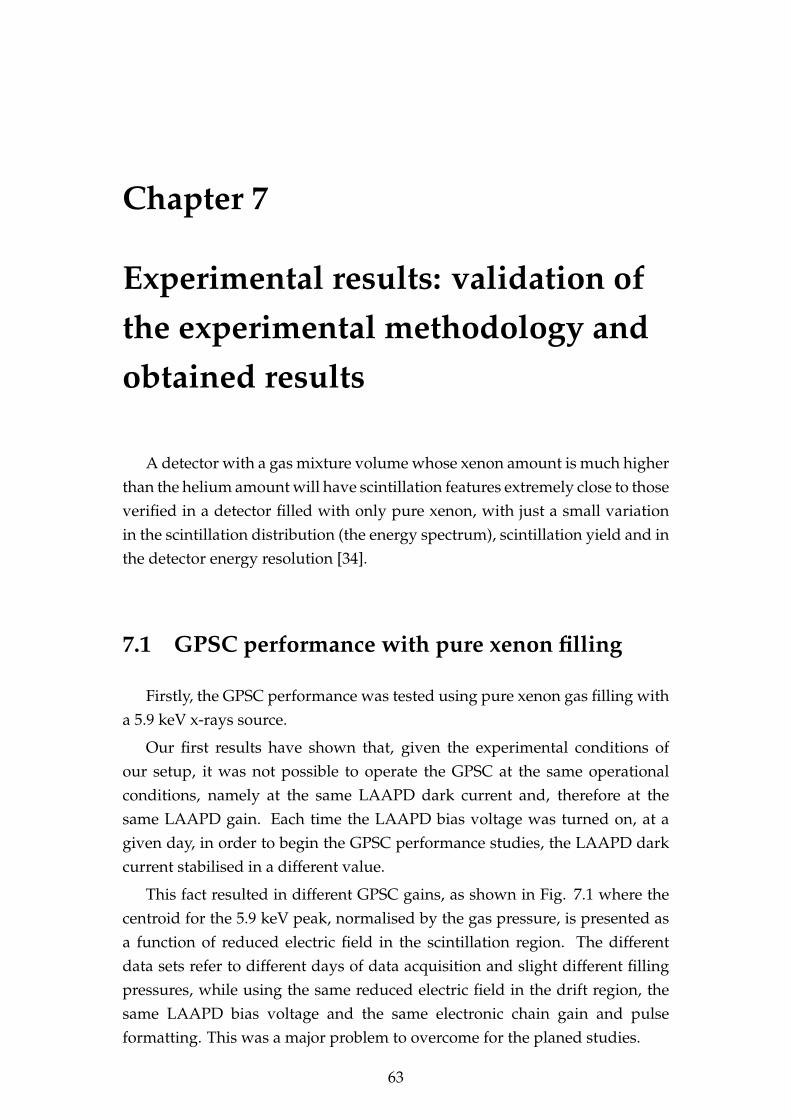
Chapter 7
Experimental results: validation ofthe experimental methodology andobtained results
A detector with a gas mixture volume whose xenon amount is much higherthan the helium amount will have scintillation features extremely close to thoseverified in a detector filled with only pure xenon, with just a small variationin the scintillation distribution (the energy spectrum), scintillation yield and inthe detector energy resolution [34].
7.1 GPSC performance with pure xenon filling
Firstly, the GPSC performance was tested using pure xenon gas filling witha 5.9 keV x-rays source.
Our first results have shown that, given the experimental conditions ofour setup, it was not possible to operate the GPSC at the same operationalconditions, namely at the same LAAPD dark current and, therefore at thesame LAAPD gain. Each time the LAAPD bias voltage was turned on, at agiven day, in order to begin the GPSC performance studies, the LAAPD darkcurrent stabilised in a different value.
This fact resulted in different GPSC gains, as shown in Fig. 7.1 where thecentroid for the 5.9 keV peak, normalised by the gas pressure, is presented asa function of reduced electric field in the scintillation region. The differentdata sets refer to different days of data acquisition and slight different fillingpressures, while using the same reduced electric field in the drift region, thesame LAAPD bias voltage and the same electronic chain gain and pulseformatting. This was a major problem to overcome for the planed studies.
63
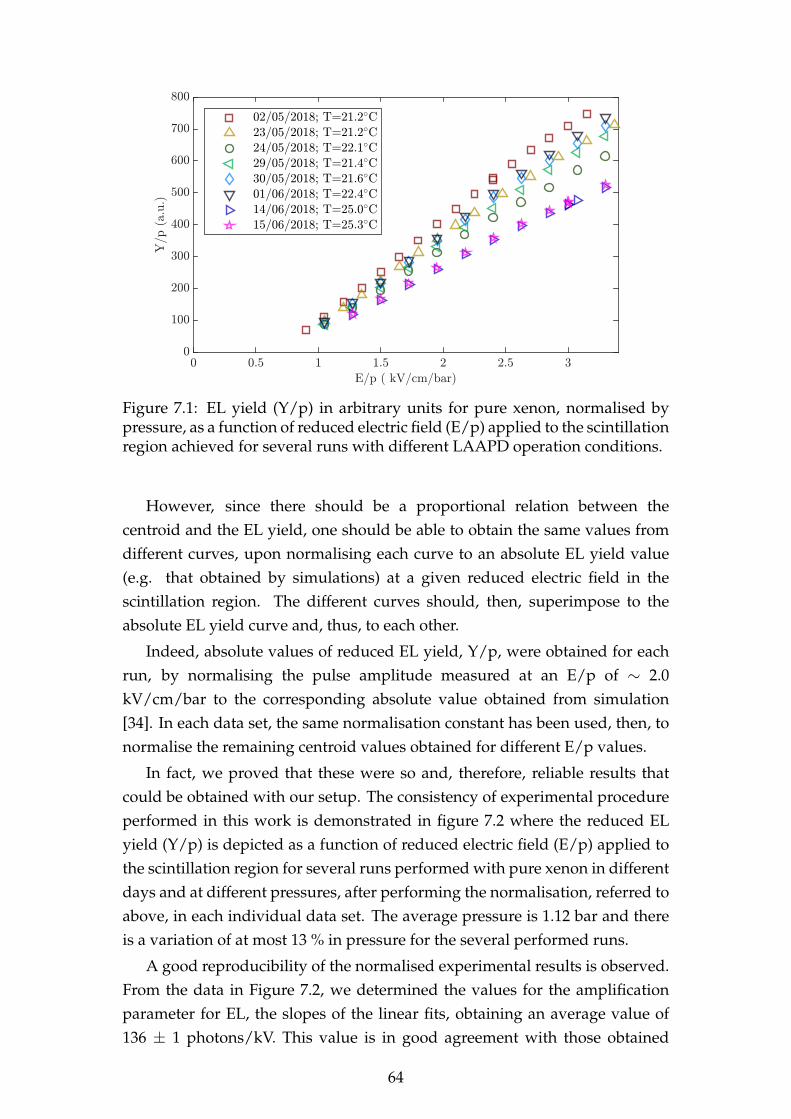
Figure 7.1: EL yield (Y/p) in arbitrary units for pure xenon, normalised bypressure, as a function of reduced electric field (E/p) applied to the scintillationregion achieved for several runs with different LAAPD operation conditions.
However, since there should be a proportional relation between thecentroid and the EL yield, one should be able to obtain the same values fromdifferent curves, upon normalising each curve to an absolute EL yield value(e.g. that obtained by simulations) at a given reduced electric field in thescintillation region. The different curves should, then, superimpose to theabsolute EL yield curve and, thus, to each other.
Indeed, absolute values of reduced EL yield, Y/p, were obtained for eachrun, by normalising the pulse amplitude measured at an E/p of ∼ 2.0kV/cm/bar to the corresponding absolute value obtained from simulation[34]. In each data set, the same normalisation constant has been used, then, tonormalise the remaining centroid values obtained for different E/p values.
In fact, we proved that these were so and, therefore, reliable results thatcould be obtained with our setup. The consistency of experimental procedureperformed in this work is demonstrated in figure 7.2 where the reduced ELyield (Y/p) is depicted as a function of reduced electric field (E/p) applied tothe scintillation region for several runs performed with pure xenon in differentdays and at different pressures, after performing the normalisation, referred toabove, in each individual data set. The average pressure is 1.12 bar and thereis a variation of at most 13 % in pressure for the several performed runs.
A good reproducibility of the normalised experimental results is observed.From the data in Figure 7.2, we determined the values for the amplificationparameter for EL, the slopes of the linear fits, obtaining an average value of136 ± 1 photons/kV. This value is in good agreement with those obtained
64
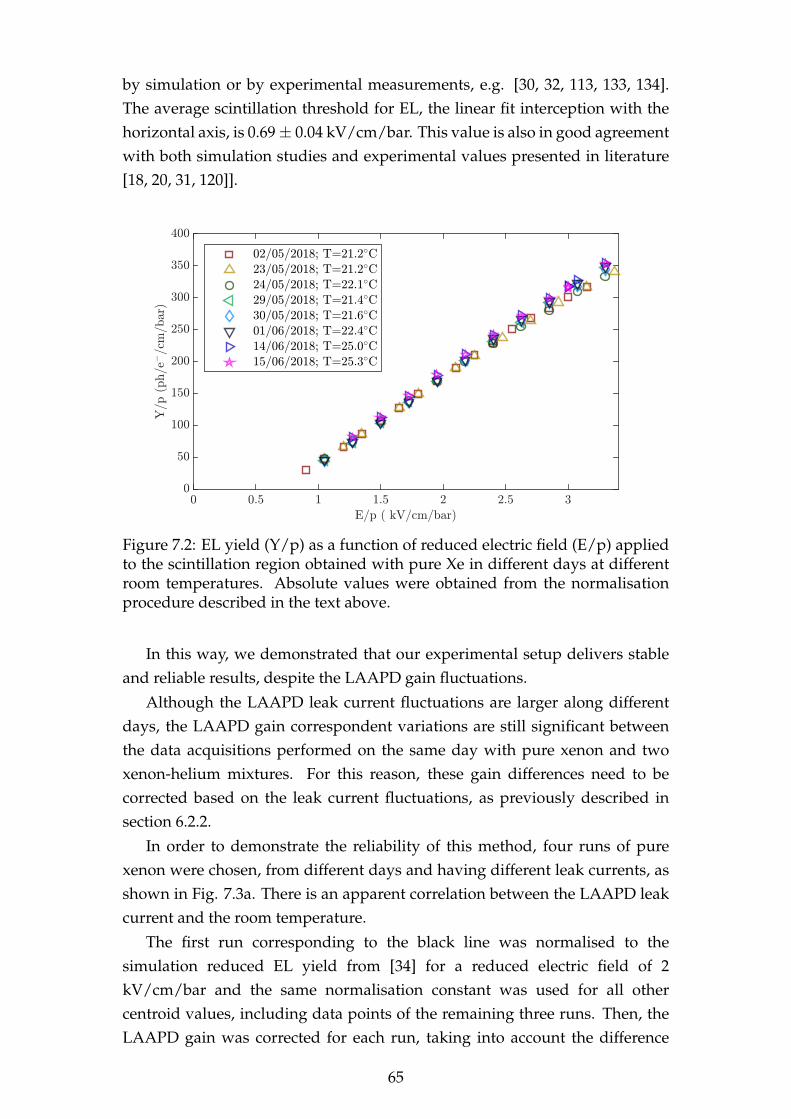
by simulation or by experimental measurements, e.g. [30, 32, 113, 133, 134].The average scintillation threshold for EL, the linear fit interception with thehorizontal axis, is 0.69± 0.04 kV/cm/bar. This value is also in good agreementwith both simulation studies and experimental values presented in literature[18, 20, 31, 120]].
Figure 7.2: EL yield (Y/p) as a function of reduced electric field (E/p) appliedto the scintillation region obtained with pure Xe in different days at differentroom temperatures. Absolute values were obtained from the normalisationprocedure described in the text above.
In this way, we demonstrated that our experimental setup delivers stableand reliable results, despite the LAAPD gain fluctuations.
Although the LAAPD leak current fluctuations are larger along differentdays, the LAAPD gain correspondent variations are still significant betweenthe data acquisitions performed on the same day with pure xenon and twoxenon-helium mixtures. For this reason, these gain differences need to becorrected based on the leak current fluctuations, as previously described insection 6.2.2.
In order to demonstrate the reliability of this method, four runs of purexenon were chosen, from different days and having different leak currents, asshown in Fig. 7.3a. There is an apparent correlation between the LAAPD leakcurrent and the room temperature.
The first run corresponding to the black line was normalised to thesimulation reduced EL yield from [34] for a reduced electric field of 2kV/cm/bar and the same normalisation constant was used for all othercentroid values, including data points of the remaining three runs. Then, theLAAPD gain was corrected for each run, taking into account the difference
65
between the respective leak current and the one for the reference line, inblack.
The result of this procedure is shown in figure 7.3b, where the correcteddata superimpose with that of the reference curve, only with a maximumdeviation of 10 %. All the electroluminescence yield values obtained withxenon-helium mixtures in the present work were corrected in this way,having the pure xenon run performed a few hours earlier, as reference.
(a) (b)
Figure 7.3: Reduced EL yield (Y/p) for pure xenon as a function of reducedelectric field (E/p) applied to the scintillation region obtained from differentdays (with different room temperatures and leak currents). a) Data withoutleak current correction. b) The same curves with data corrected for leakcurrent.
In this way, the present methodology used for correction of the LAAPDgain fluctuations, as well as for obtaining absolute EL yield values issuccessfully validated, being notable the experimental results reproducibility.
7.2 Intrinsic energy resolution
The energy resolution achieved with this GPSC for pure xenon must becompared with the results presented in the literature, already well establishedfor xenon, so that both methodology and the detector’s performance heredeveloped can then be validated. This is important because if there was anyproblem with the gas purification or yet the detector’s design was notsuitable for the present studies, its performance wouldn’t be at the best.
The study is performed with a single 5.9 keV x-ray line, whose energyspectrum was depicted in figure 6.3, presented in the previous chapter. Asaforementioned, the full absorption peak has a Gaussian-like shape and theenergy resolution for the detector in use is estimated from the relative FWHM
66
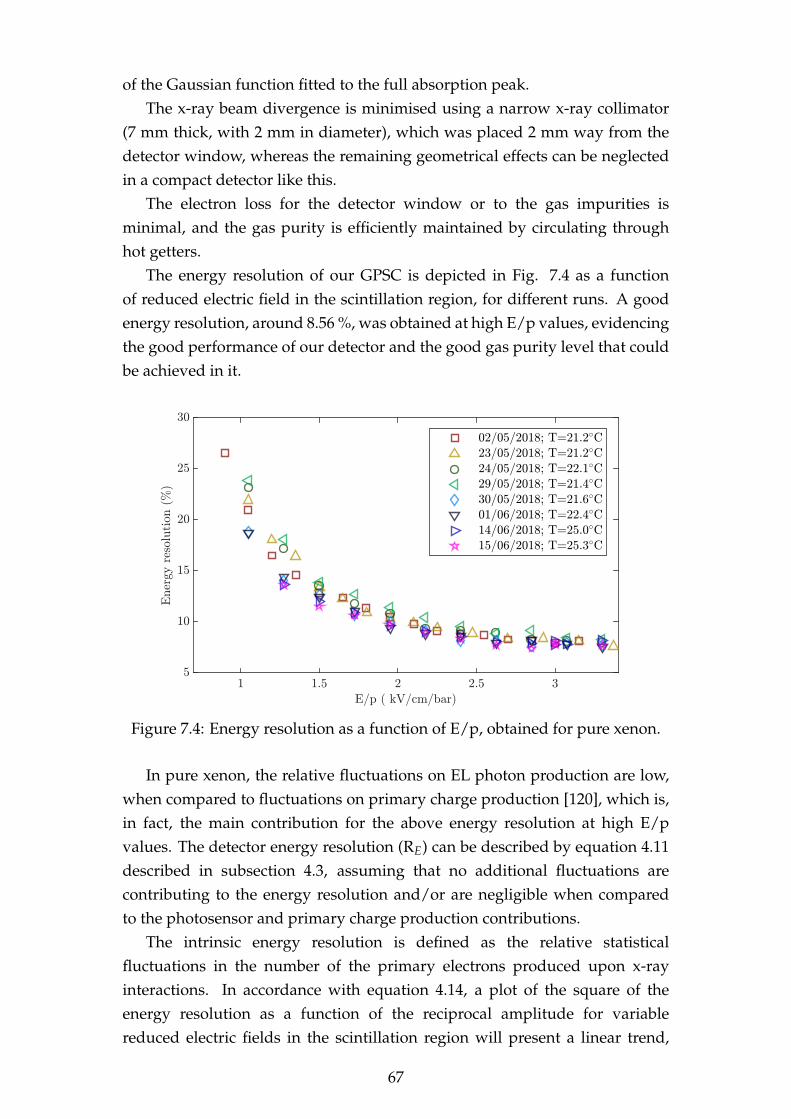
of the Gaussian function fitted to the full absorption peak.The x-ray beam divergence is minimised using a narrow x-ray collimator
(7 mm thick, with 2 mm in diameter), which was placed 2 mm way from thedetector window, whereas the remaining geometrical effects can be neglectedin a compact detector like this.
The electron loss for the detector window or to the gas impurities isminimal, and the gas purity is efficiently maintained by circulating throughhot getters.
The energy resolution of our GPSC is depicted in Fig. 7.4 as a functionof reduced electric field in the scintillation region, for different runs. A goodenergy resolution, around 8.56 %, was obtained at high E/p values, evidencingthe good performance of our detector and the good gas purity level that couldbe achieved in it.
Figure 7.4: Energy resolution as a function of E/p, obtained for pure xenon.
In pure xenon, the relative fluctuations on EL photon production are low,when compared to fluctuations on primary charge production [120], which is,in fact, the main contribution for the above energy resolution at high E/pvalues. The detector energy resolution (RE) can be described by equation 4.11described in subsection 4.3, assuming that no additional fluctuations arecontributing to the energy resolution and/or are negligible when comparedto the photosensor and primary charge production contributions.
The intrinsic energy resolution is defined as the relative statisticalfluctuations in the number of the primary electrons produced upon x-rayinteractions. In accordance with equation 4.14, a plot of the square of theenergy resolution as a function of the reciprocal amplitude for variablereduced electric fields in the scintillation region will present a linear trend,
67
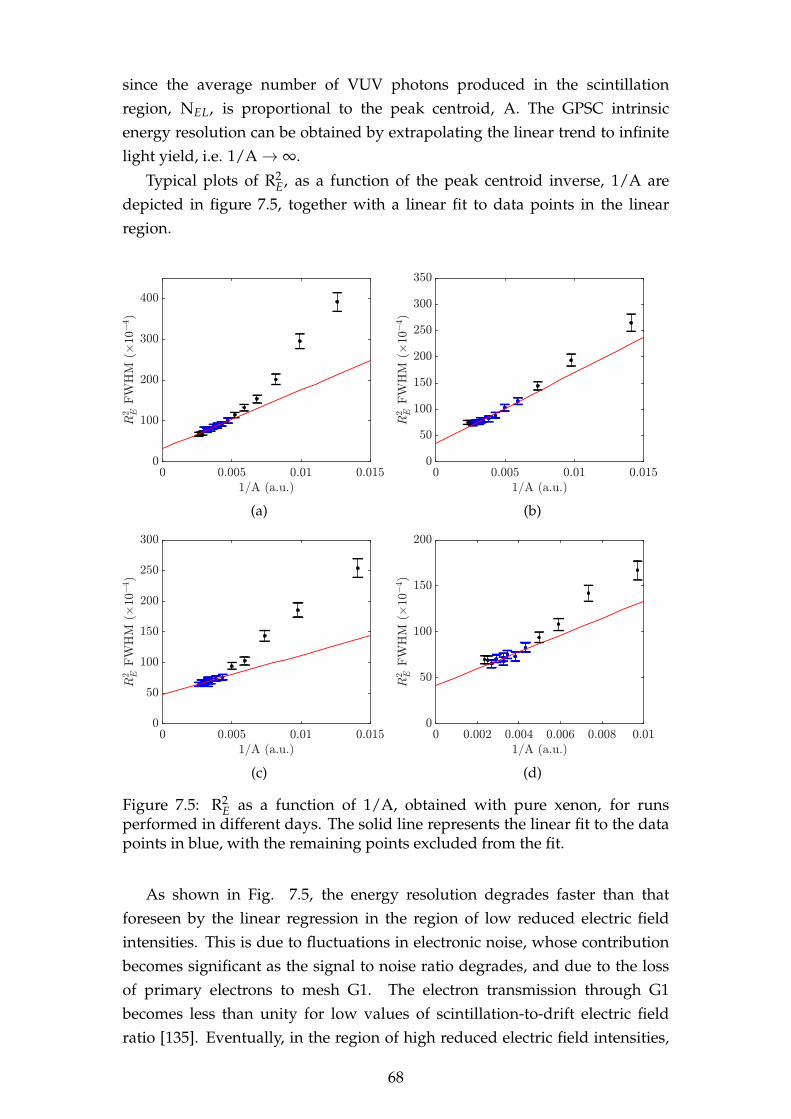
since the average number of VUV photons produced in the scintillationregion, NEL, is proportional to the peak centroid, A. The GPSC intrinsicenergy resolution can be obtained by extrapolating the linear trend to infinitelight yield, i.e. 1/A→ ∞.
Typical plots of R2E, as a function of the peak centroid inverse, 1/A are
depicted in figure 7.5, together with a linear fit to data points in the linearregion.
(a) (b)
(c) (d)
Figure 7.5: R2E as a function of 1/A, obtained with pure xenon, for runs
performed in different days. The solid line represents the linear fit to the datapoints in blue, with the remaining points excluded from the fit.
As shown in Fig. 7.5, the energy resolution degrades faster than thatforeseen by the linear regression in the region of low reduced electric fieldintensities. This is due to fluctuations in electronic noise, whose contributionbecomes significant as the signal to noise ratio degrades, and due to the lossof primary electrons to mesh G1. The electron transmission through G1becomes less than unity for low values of scintillation-to-drift electric fieldratio [135]. Eventually, in the region of high reduced electric field intensities,
68
the energy resolution also degrades, departing from the linear trend, due toadditional fluctuations introduced by electron multiplication, above the gasionisation threshold, and/or by the onset of micro-discharges due toinsufficient electric insulation. A similar deviation from this linearity can bealso observed in other GPSC studies [133].
The error in 1/A is not represented due to the low statistical uncertainty inthe Gaussian centroid, whereas the error in R2
E corresponds to 6 %.Thus, after performing several data-sets, the average intrinsic energy
resolution estimated from the y-interception of the fitted lines, is (6.0 ± 0.2) %.The error was estimated by considering two contributions: The first is relatedwith the uncertainty in the choice of the most suitable fit interval and wasestimated by varying slightly the linear fit region taking into account severaldata points, the other contribution is related with the statistical errorassociated with the fit parameters.
The Fano factor (F) is defined as the relative variance on the number ofelectrons produced during interaction, thus: F = σ2
e /Ne and is a characteristicof the gas. As aforementioned, the Fano factor can be estimated from theintrinsic energy resolution, according to eq. 4.13.
For the used 5.9 keV x-rays, the average number of electrons in xenon perx-ray interaction with the gas, Ne is 269 electrons, assuming an average energyw of 21.9 eV required in order to produce an ion-electron pair [114]. Therefore,using the equation 4.13, the calculated Fano factor was 0.18 ± 0.04. This Fanofactor agrees with other results found in literature [30, 113, 114], showing therobustness of the analysis performed.
There is still additional systematic errors affecting the energy resolutionwhich also may depend on the electric field variation, since it does not onlyaffects the number of photons detected by the photosensor. Another factorsmay also affect the energy resolution, such as the electron loss to G1 mesh;electron attachment induced by impurities, which depends on the electronmean energy and on the number of collisions; the recombination of primarycharges; geometrical effects that may depend on electron velocity andelectron diffusion; the power supply stability or sparks occurring at high biasvoltages. These field-dependent effects may also modify the linear trendslope, but they are expected to be negligible or have a small impact in theenergy resolution for the reduced electric field region of interest.
69

70
Chapter 8
Experimental results: Xe-Hemixtures
Understanding the impact of helium on xenon scintillation is the mainmotivation for the present work. Therefore, the experimental results obtainedfor electroluminescence yield and for detector’s energy resolution aresummarised in this chapter, being these two the most relevant parameters forthe NEXT experiment.
8.1 Electroluminescence yield
Several mixtures were performed for each helium concentration to bestudied in the present work, namely, three for 15 % helium, two for 20 %helium, and one either for 10 % as for 30 %. However, for this latter it weretaken two measuring series with seven days apart from each other.
The detector response function, consisting in a Gaussian function summedto a linear function, is fitted to the 5.9 keV full absorption peak of MCA pulseheight distribution. The relative Y/p is obtained from the Gaussian centroiddivided by the working pressure for the several E/p values. The Y/pvariation with E/p obtained for each run is then fitted by a straight line, sinceY/p as a function of E/p is known to be approximately linear [18]. This fittingline is used to extrapolate the relative Y/p at a specific E/p value of 2kV/cm/bar. The absolute pure xenon Y/p at the same E/p value fromsimulation in ref [34] is used to compute the normalisation constant, which isapplied to all experimental relative Y/p values taken in the same run, as wellas in the mixture runs performed on the same day. In addition, Y/p valuesobtained with xenon-helium mixtures were corrected for the LAAPD leakcurrent, having as reference the pure xenon Y/p values obtained on the sameday.
Figure 8.1 presents experimental EL yields obtained for all xenon-heliumadmixtures and pure xenon as function of the reduced electric field applied tothe scintillation region.
71
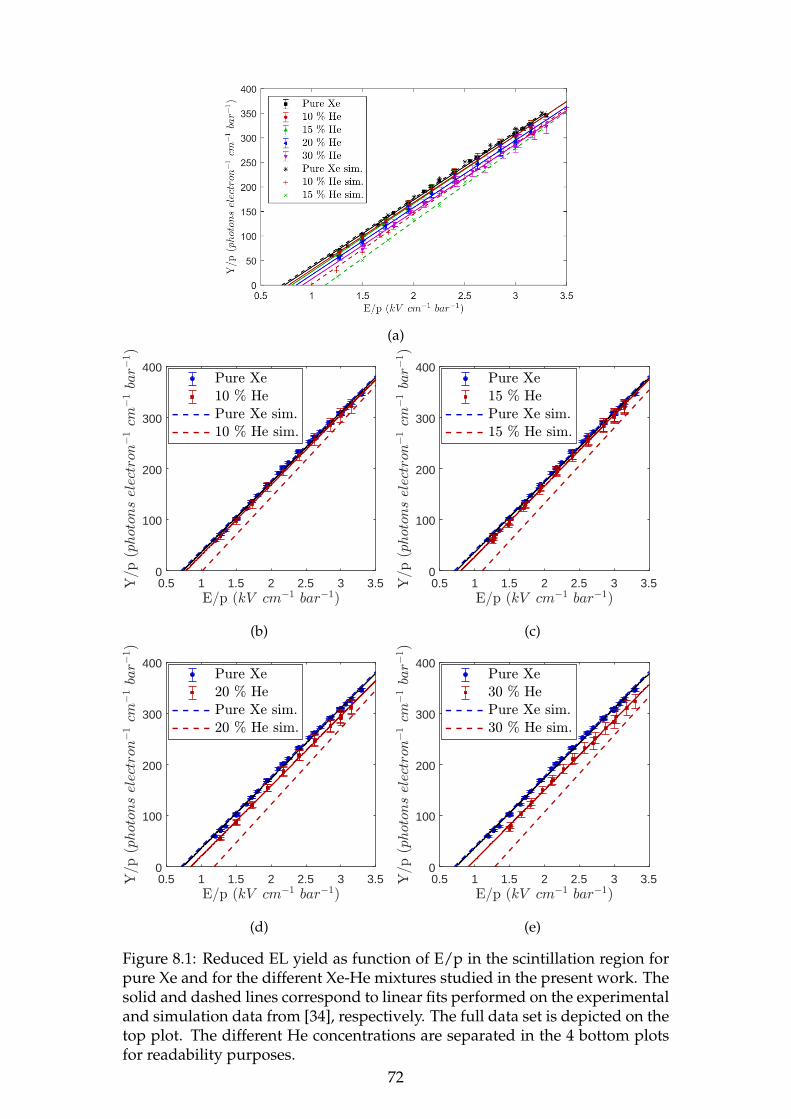
(a)
0.5 1 1.5 2 2.5 3 3.50
100
200
300
400
(b)
0.5 1 1.5 2 2.5 3 3.50
100
200
300
400
(c)
0.5 1 1.5 2 2.5 3 3.50
100
200
300
400
(d)
0.5 1 1.5 2 2.5 3 3.50
100
200
300
400
(e)
Figure 8.1: Reduced EL yield as function of E/p in the scintillation region forpure Xe and for the different Xe-He mixtures studied in the present work. Thesolid and dashed lines correspond to linear fits performed on the experimentaland simulation data from [34], respectively. The full data set is depicted on thetop plot. The different He concentrations are separated in the 4 bottom plotsfor readability purposes.
72
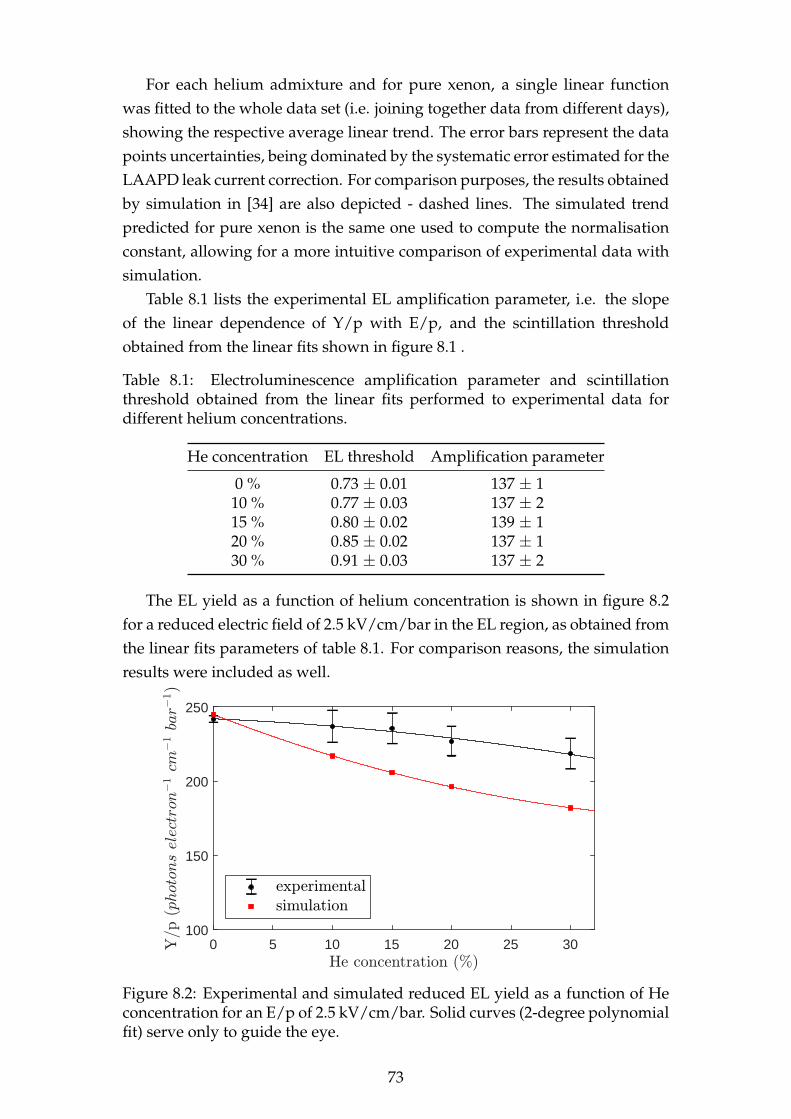
For each helium admixture and for pure xenon, a single linear functionwas fitted to the whole data set (i.e. joining together data from different days),showing the respective average linear trend. The error bars represent the datapoints uncertainties, being dominated by the systematic error estimated for theLAAPD leak current correction. For comparison purposes, the results obtainedby simulation in [34] are also depicted - dashed lines. The simulated trendpredicted for pure xenon is the same one used to compute the normalisationconstant, allowing for a more intuitive comparison of experimental data withsimulation.
Table 8.1 lists the experimental EL amplification parameter, i.e. the slopeof the linear dependence of Y/p with E/p, and the scintillation thresholdobtained from the linear fits shown in figure 8.1 .
Table 8.1: Electroluminescence amplification parameter and scintillationthreshold obtained from the linear fits performed to experimental data fordifferent helium concentrations.
He concentration EL threshold Amplification parameter
0 % 0.73 ± 0.01 137 ± 110 % 0.77 ± 0.03 137 ± 215 % 0.80 ± 0.02 139 ± 120 % 0.85 ± 0.02 137 ± 130 % 0.91 ± 0.03 137 ± 2
The EL yield as a function of helium concentration is shown in figure 8.2for a reduced electric field of 2.5 kV/cm/bar in the EL region, as obtained fromthe linear fits parameters of table 8.1. For comparison reasons, the simulationresults were included as well.
0 5 10 15 20 25 30100
150
200
250
Figure 8.2: Experimental and simulated reduced EL yield as a function of Heconcentration for an E/p of 2.5 kV/cm/bar. Solid curves (2-degree polynomialfit) serve only to guide the eye.
73
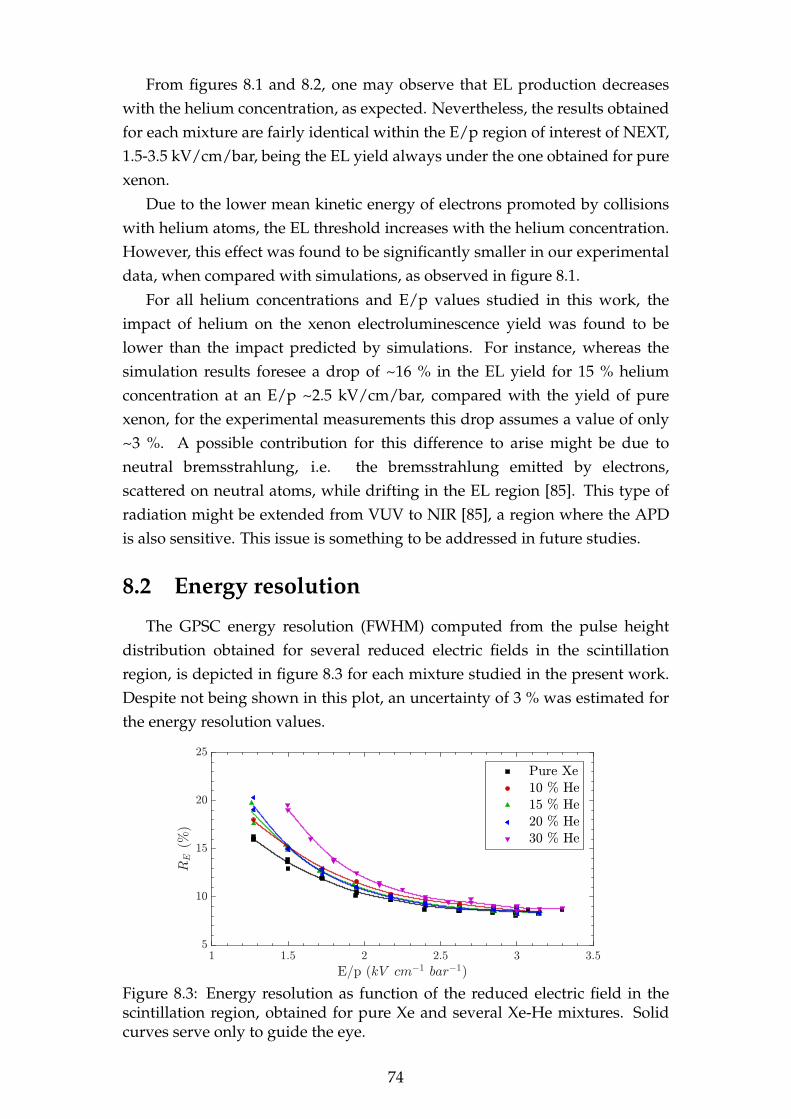
From figures 8.1 and 8.2, one may observe that EL production decreaseswith the helium concentration, as expected. Nevertheless, the results obtainedfor each mixture are fairly identical within the E/p region of interest of NEXT,1.5-3.5 kV/cm/bar, being the EL yield always under the one obtained for purexenon.
Due to the lower mean kinetic energy of electrons promoted by collisionswith helium atoms, the EL threshold increases with the helium concentration.However, this effect was found to be significantly smaller in our experimentaldata, when compared with simulations, as observed in figure 8.1.
For all helium concentrations and E/p values studied in this work, theimpact of helium on the xenon electroluminescence yield was found to belower than the impact predicted by simulations. For instance, whereas thesimulation results foresee a drop of ~16 % in the EL yield for 15 % heliumconcentration at an E/p ~2.5 kV/cm/bar, compared with the yield of purexenon, for the experimental measurements this drop assumes a value of only~3 %. A possible contribution for this difference to arise might be due toneutral bremsstrahlung, i.e. the bremsstrahlung emitted by electrons,scattered on neutral atoms, while drifting in the EL region [85]. This type ofradiation might be extended from VUV to NIR [85], a region where the APDis also sensitive. This issue is something to be addressed in future studies.
8.2 Energy resolution
The GPSC energy resolution (FWHM) computed from the pulse heightdistribution obtained for several reduced electric fields in the scintillationregion, is depicted in figure 8.3 for each mixture studied in the present work.Despite not being shown in this plot, an uncertainty of 3 % was estimated forthe energy resolution values.
Figure 8.3: Energy resolution as function of the reduced electric field in thescintillation region, obtained for pure Xe and several Xe-He mixtures. Solidcurves serve only to guide the eye.
74

Due to the experimental methodology used to prepare xenon-heliummixtures, the data acquisition with pure xenon was always performed at ahigher pressure than the two xenon-helium mixtures studied in the respectivesame day. The distance travelled by electrons between collisions is shorter, ashigher is the total pressure, resulting in more xenon atom excitations for thesame E/p value and, consequently, the more scintillation photons are beingproduced. Therefore, different gas pressures will lead to different energyresolution values, since the relative fluctuations on the photosensor signaldecrease with the number of collected photons (as demonstrated by equation4.11). For this reason, the helium impact on the detector energy resolutioncannot be directly evaluated from figure 8.3, since the operation pressureswere considerably different, in some cases more than 25%.
According to equation 4.10 the GPSC energy resolution depends mainlyon fluctuations in the primary charge production and in the LAAPD signal aswell. The LAAPD contribution (Rph) to the overall energy resolution is directlyproportional to the inverse of the square root number of produced photons(Rph ∝ 1/
√NEL), with NEL being linearly dependent on the gas pressure, as
previously explained. Therefore, knowing the contribution of fluctuations inprimary charge production (as obtained in section 7.2), and assuming that thisdoes not dependent on the gas pressure or mixture concentration, the energyresolution values of figure 8.3 can be corrected for the pressure differences,by scaling the LAAPD contribution with the pressure (the corrected Rph being
equal to Rph
√Pre f√P
).Figure 8.4 depicts the energy resolution corrected by the total gas pressure
as a function of the reduced electric field, being assumed a reference pressure(Pre f ) of 1.14 bar, which corresponds to the average pressure over the full set ofacquisitions.
Figure 8.4: Energy resolution as function of E/p in the scintillation region,obtained for pure Xe and for the several Xe-He mixtures, with the values ofeach run corrected for the total pressure.
75
Taking into account that the Fano factor is not expected to change withinthe range of the studied concentrations, as foreseen in the simulation studiesfrom [34], the noticed difference in the corrected data from figure 8.4 is onlydue to the lower number of produced scintillation photons as higher is thehelium concentration. The energy resolution is only deteriorated for lowelectric fields, where the LAAPD contribution is dominant, while it is kept thesame as in pure xenon, within the experimental uncertainties, for higherelectric fields, where fluctuations related to Fano factor are dominant, giventhe large number of collected EL photons in the LAAPD.
8.2.1 Intrinsic energy resolution
The energy resolution obtained in mixtures is limited by the w-valuecorrespondent to pure helium, around 46 eV. Hence, from the simulationsstudies [34] the intrinsic energy resolution of xenon-helium mixtures isexpected to remain stable as long as the helium concentration is kept below20%.
Figure 8.5 depicts the square of energy resolution as function of thecentroid inverse (of the 5.9 keV peak) for helium concentrations of 10 %, 15 %,20 % and 30 %. A linear function is fitted to the data points, excluding thosewith the highest and lowest amplitudes that depart from the linear trend.This is the same behaviour observed before in standard GPSCs. Due to thelow statistical uncertainty in the Gaussian centroid, the error in 1/A is notpresented, whereas the error in R2
E is correspondent to 6 %.
Table 8.2 summarises the average intrinsic energy resolution and Fanofactor obtained for the several studied helium concentrations, obtained fromthe fit lines y-interception shown in 8.5.
Table 8.2: Intrinsic energy resolution and Fano factor obtained from linear fitsin the experimental data for the mixtures performed.
He concentration Rint Fano factor
10 % 5.8 ± 0.5 0.17 ± 0.0415 % 6.0 ± 0.3 0.18 ± 0.0420 % 6.1 ± 0.3 0.18 ± 0.0430 % 5.9 ± 0.5 0.17 ± 0.04
As observed, the impact of helium on the detector intrinsic energyresolution is negligible, at least within our experimental uncertainties. Thisresult agrees with theoretical expectations from [34], where the Fano factorwas found to be roughly constant for helium concentrations up to 30 %. TheFano factor values shown in table 8.2 are also similar to the ones
76
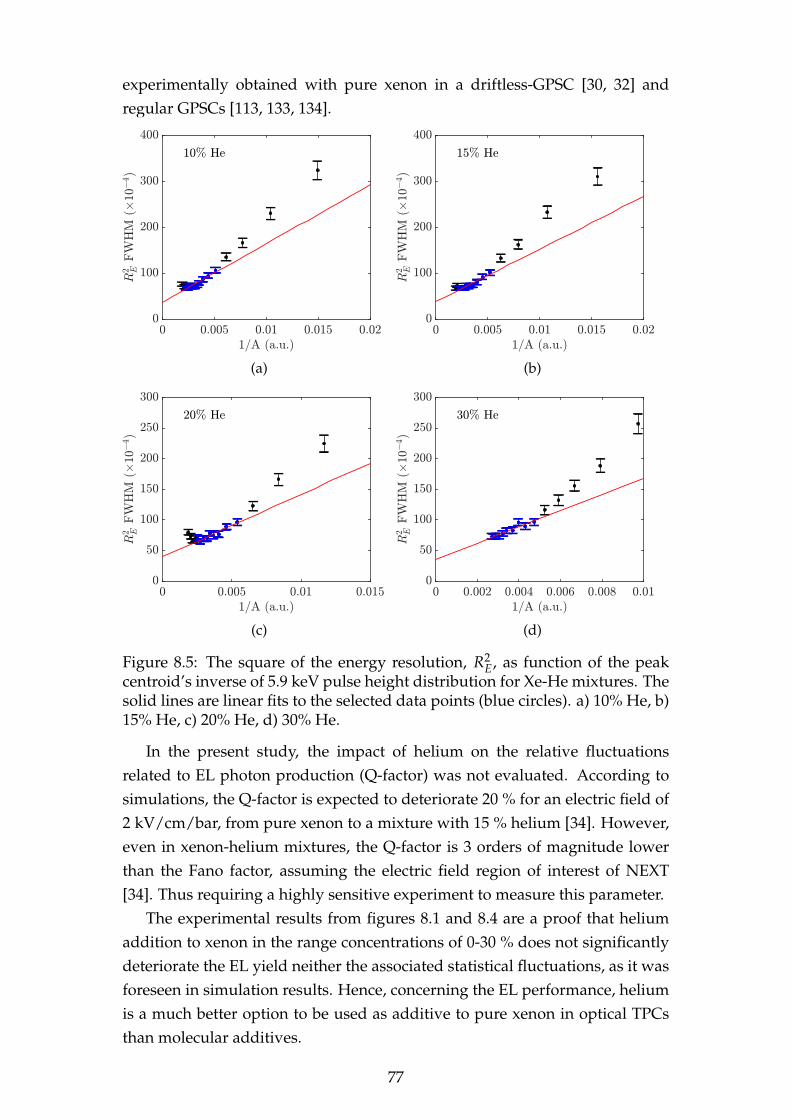
experimentally obtained with pure xenon in a driftless-GPSC [30, 32] andregular GPSCs [113, 133, 134].
(a) (b)
(c) (d)
Figure 8.5: The square of the energy resolution, R2E, as function of the peak
centroid’s inverse of 5.9 keV pulse height distribution for Xe-He mixtures. Thesolid lines are linear fits to the selected data points (blue circles). a) 10% He, b)15% He, c) 20% He, d) 30% He.
In the present study, the impact of helium on the relative fluctuationsrelated to EL photon production (Q-factor) was not evaluated. According tosimulations, the Q-factor is expected to deteriorate 20 % for an electric field of2 kV/cm/bar, from pure xenon to a mixture with 15 % helium [34]. However,even in xenon-helium mixtures, the Q-factor is 3 orders of magnitude lowerthan the Fano factor, assuming the electric field region of interest of NEXT[34]. Thus requiring a highly sensitive experiment to measure this parameter.
The experimental results from figures 8.1 and 8.4 are a proof that heliumaddition to xenon in the range concentrations of 0-30 % does not significantlydeteriorate the EL yield neither the associated statistical fluctuations, as it wasforeseen in simulation results. Hence, concerning the EL performance, heliumis a much better option to be used as additive to pure xenon in optical TPCsthan molecular additives.
77

78
Chapter 9
Drift velocity and longitudinaldiffusion
The main advantage of doping the NEXT detector’s xenon filling withhelium is the electron diffusion reduction, hence improving the TPC positionresolution. The electron drift velocity enhancement is also beneficial, despitenot being critical in a rare event experiment such as NEXT. Therefore,measuring these parameters experimentally is also relevant to fullyunderstand the viability of xenon-helium mixtures in the NEXT context.
The transverse diffusion cannot be measured using a regular GPSC, due tothe lack of a position sensitive readout. Nonetheless, the electron driftvelocity and the longitudinal diffusion can be evaluated using thephotosensor signal over time. In order to understand the helium impact onboth parameters under the GPSC operation conditions, a Magboltzsimulation was carried out for pure xenon and for a xenon-helium mixturewith 30 % of helium concentration.
Figure 9.1 shows the simulated electron drift velocity, as well as thelongitudinal electron diffusion (in units of length per squared root driftedpath length) for a wide range of reduced electric fields [136]. As observed, forthe typical drift reduced electric field (i.e., below 0.7 kV/cm/bar), the driftvelocity is more than twice higher with the addition of helium, whereas thelongitudinal diffusion is reduced by about 40 %.
The significant impact of helium, expected on these two electron driftparameters, for the relatively high helium concentration of 30 %, is a goodmotivation to use our GPSC, and therefore, to study the electron drift velocityand the longitudinal diffusion as well.
In a recent research, the electron drift velocity and the longitudinaldiffusion were measured for several reduced electric fields, for pure xenonand xenon-helium mixtures with helium concentrations up to 15 %, atpressures in the range of 1-9 bar [35]. The electron drift velocity and
79
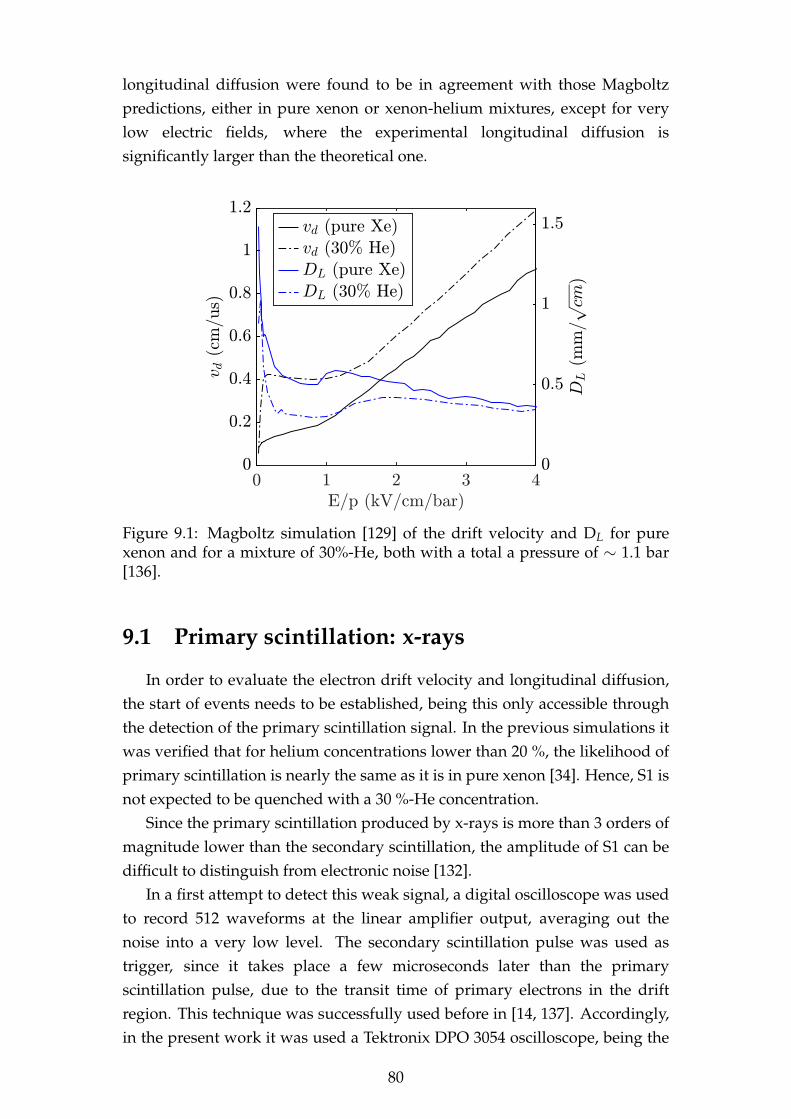
longitudinal diffusion were found to be in agreement with those Magboltzpredictions, either in pure xenon or xenon-helium mixtures, except for verylow electric fields, where the experimental longitudinal diffusion issignificantly larger than the theoretical one.
Figure 9.1: Magboltz simulation [129] of the drift velocity and DL for purexenon and for a mixture of 30%-He, both with a total a pressure of ∼ 1.1 bar[136].
9.1 Primary scintillation: x-rays
In order to evaluate the electron drift velocity and longitudinal diffusion,the start of events needs to be established, being this only accessible throughthe detection of the primary scintillation signal. In the previous simulations itwas verified that for helium concentrations lower than 20 %, the likelihood ofprimary scintillation is nearly the same as it is in pure xenon [34]. Hence, S1 isnot expected to be quenched with a 30 %-He concentration.
Since the primary scintillation produced by x-rays is more than 3 orders ofmagnitude lower than the secondary scintillation, the amplitude of S1 can bedifficult to distinguish from electronic noise [132].
In a first attempt to detect this weak signal, a digital oscilloscope was usedto record 512 waveforms at the linear amplifier output, averaging out thenoise into a very low level. The secondary scintillation pulse was used astrigger, since it takes place a few microseconds later than the primaryscintillation pulse, due to the transit time of primary electrons in the driftregion. This technique was successfully used before in [14, 137]. Accordingly,in the present work it was used a Tektronix DPO 3054 oscilloscope, being the
80
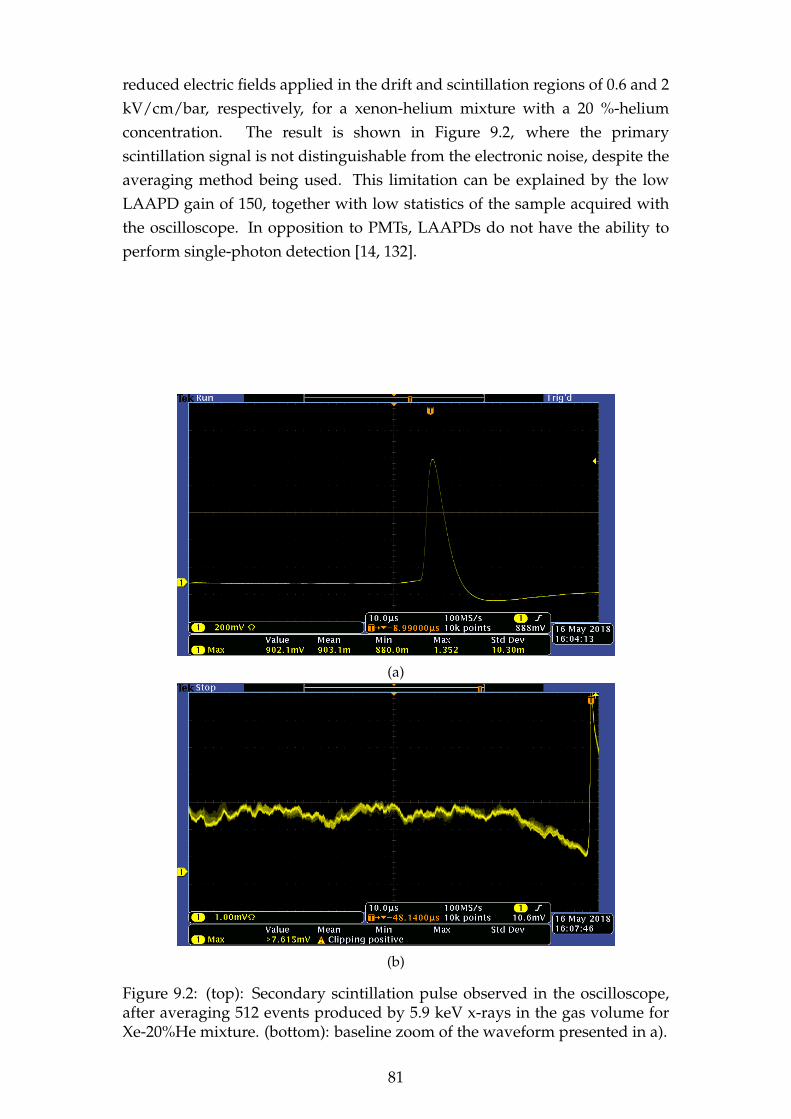
reduced electric fields applied in the drift and scintillation regions of 0.6 and 2kV/cm/bar, respectively, for a xenon-helium mixture with a 20 %-heliumconcentration. The result is shown in Figure 9.2, where the primaryscintillation signal is not distinguishable from the electronic noise, despite theaveraging method being used. This limitation can be explained by the lowLAAPD gain of 150, together with low statistics of the sample acquired withthe oscilloscope. In opposition to PMTs, LAAPDs do not have the ability toperform single-photon detection [14, 132].
(a)
(b)
Figure 9.2: (top): Secondary scintillation pulse observed in the oscilloscope,after averaging 512 events produced by 5.9 keV x-rays in the gas volume forXe-20%He mixture. (bottom): baseline zoom of the waveform presented in a).
81
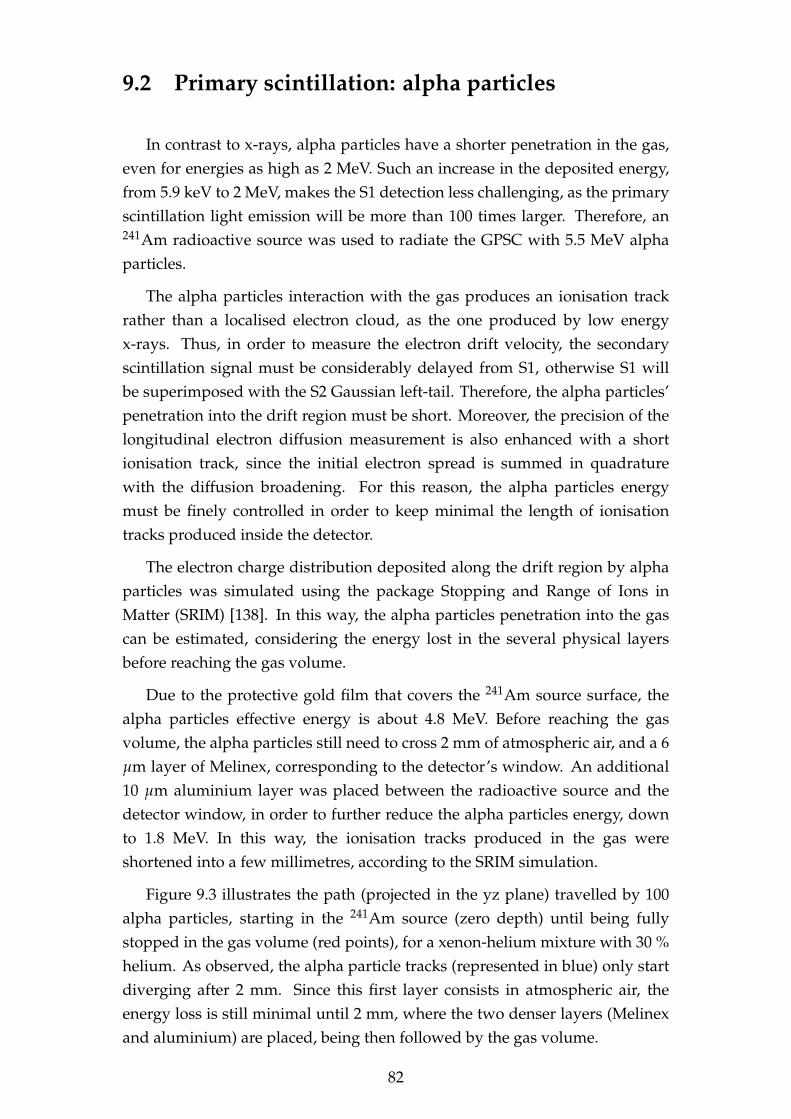
9.2 Primary scintillation: alpha particles
In contrast to x-rays, alpha particles have a shorter penetration in the gas,even for energies as high as 2 MeV. Such an increase in the deposited energy,from 5.9 keV to 2 MeV, makes the S1 detection less challenging, as the primaryscintillation light emission will be more than 100 times larger. Therefore, an241Am radioactive source was used to radiate the GPSC with 5.5 MeV alphaparticles.
The alpha particles interaction with the gas produces an ionisation trackrather than a localised electron cloud, as the one produced by low energyx-rays. Thus, in order to measure the electron drift velocity, the secondaryscintillation signal must be considerably delayed from S1, otherwise S1 willbe superimposed with the S2 Gaussian left-tail. Therefore, the alpha particles’penetration into the drift region must be short. Moreover, the precision of thelongitudinal electron diffusion measurement is also enhanced with a shortionisation track, since the initial electron spread is summed in quadraturewith the diffusion broadening. For this reason, the alpha particles energymust be finely controlled in order to keep minimal the length of ionisationtracks produced inside the detector.
The electron charge distribution deposited along the drift region by alphaparticles was simulated using the package Stopping and Range of Ions inMatter (SRIM) [138]. In this way, the alpha particles penetration into the gascan be estimated, considering the energy lost in the several physical layersbefore reaching the gas volume.
Due to the protective gold film that covers the 241Am source surface, thealpha particles effective energy is about 4.8 MeV. Before reaching the gasvolume, the alpha particles still need to cross 2 mm of atmospheric air, and a 6µm layer of Melinex, corresponding to the detector’s window. An additional10 µm aluminium layer was placed between the radioactive source and thedetector window, in order to further reduce the alpha particles energy, downto 1.8 MeV. In this way, the ionisation tracks produced in the gas wereshortened into a few millimetres, according to the SRIM simulation.
Figure 9.3 illustrates the path (projected in the yz plane) travelled by 100alpha particles, starting in the 241Am source (zero depth) until being fullystopped in the gas volume (red points), for a xenon-helium mixture with 30 %helium. As observed, the alpha particle tracks (represented in blue) only startdiverging after 2 mm. Since this first layer consists in atmospheric air, theenergy loss is still minimal until 2 mm, where the two denser layers (Melinexand aluminium) are placed, being then followed by the gas volume.
82
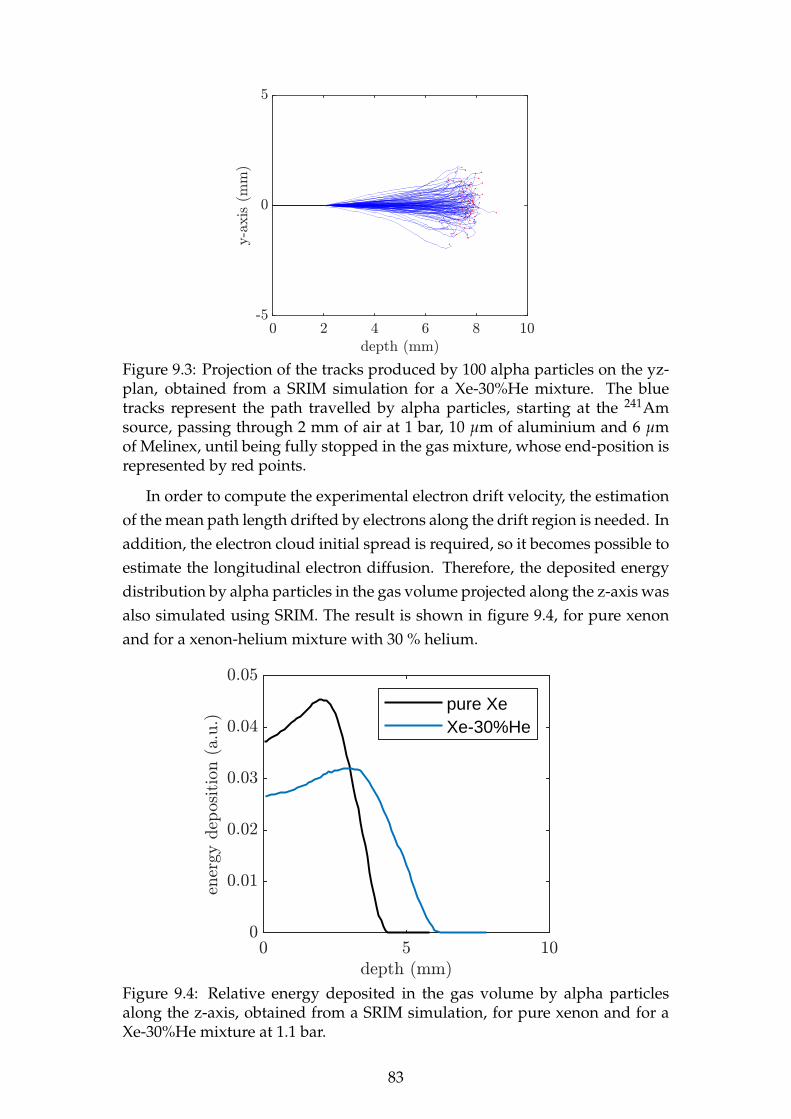
Figure 9.3: Projection of the tracks produced by 100 alpha particles on the yz-plan, obtained from a SRIM simulation for a Xe-30%He mixture. The bluetracks represent the path travelled by alpha particles, starting at the 241Amsource, passing through 2 mm of air at 1 bar, 10 µm of aluminium and 6 µmof Melinex, until being fully stopped in the gas mixture, whose end-position isrepresented by red points.
In order to compute the experimental electron drift velocity, the estimationof the mean path length drifted by electrons along the drift region is needed. Inaddition, the electron cloud initial spread is required, so it becomes possible toestimate the longitudinal electron diffusion. Therefore, the deposited energydistribution by alpha particles in the gas volume projected along the z-axis wasalso simulated using SRIM. The result is shown in figure 9.4, for pure xenonand for a xenon-helium mixture with 30 % helium.
pure XeXe-30%He
Figure 9.4: Relative energy deposited in the gas volume by alpha particlesalong the z-axis, obtained from a SRIM simulation, for pure xenon and for aXe-30%He mixture at 1.1 bar.
83
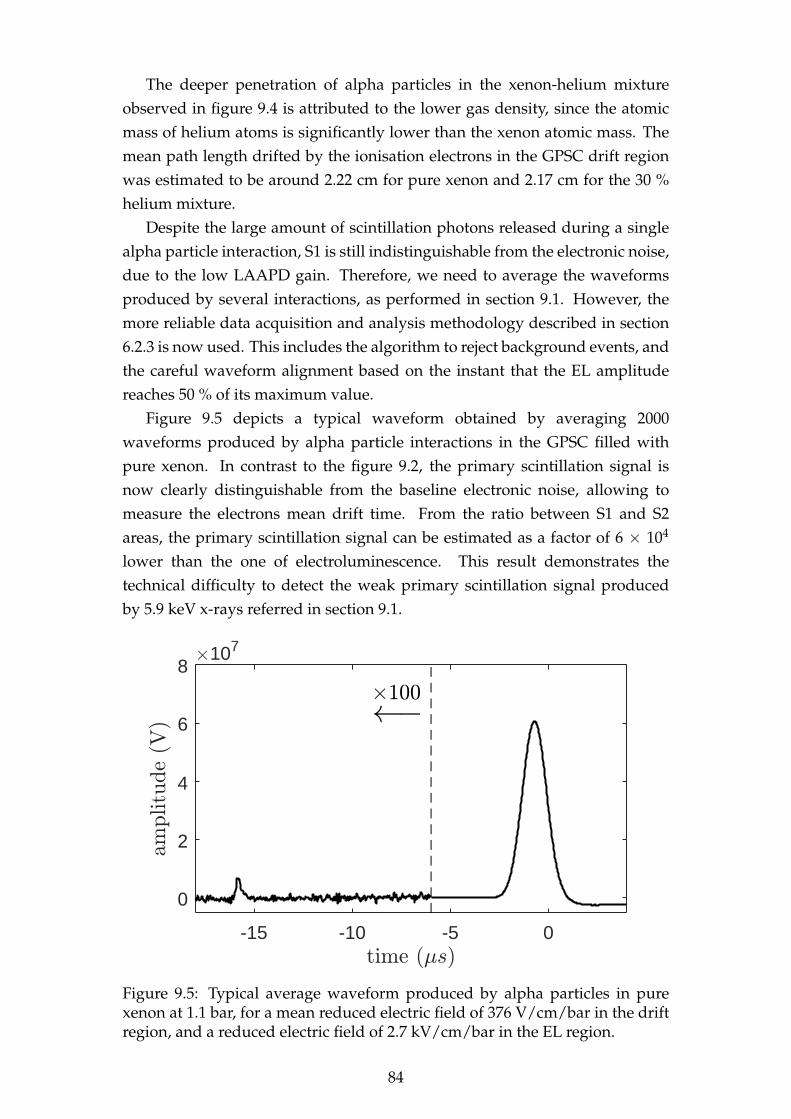
The deeper penetration of alpha particles in the xenon-helium mixtureobserved in figure 9.4 is attributed to the lower gas density, since the atomicmass of helium atoms is significantly lower than the xenon atomic mass. Themean path length drifted by the ionisation electrons in the GPSC drift regionwas estimated to be around 2.22 cm for pure xenon and 2.17 cm for the 30 %helium mixture.
Despite the large amount of scintillation photons released during a singlealpha particle interaction, S1 is still indistinguishable from the electronic noise,due to the low LAAPD gain. Therefore, we need to average the waveformsproduced by several interactions, as performed in section 9.1. However, themore reliable data acquisition and analysis methodology described in section6.2.3 is now used. This includes the algorithm to reject background events, andthe careful waveform alignment based on the instant that the EL amplitudereaches 50 % of its maximum value.
Figure 9.5 depicts a typical waveform obtained by averaging 2000waveforms produced by alpha particle interactions in the GPSC filled withpure xenon. In contrast to the figure 9.2, the primary scintillation signal isnow clearly distinguishable from the baseline electronic noise, allowing tomeasure the electrons mean drift time. From the ratio between S1 and S2areas, the primary scintillation signal can be estimated as a factor of 6 × 10⁴
lower than the one of electroluminescence. This result demonstrates thetechnical difficulty to detect the weak primary scintillation signal producedby 5.9 keV x-rays referred in section 9.1.
-15 -10 -5 0
0
2
4
6
8107
Figure 9.5: Typical average waveform produced by alpha particles in purexenon at 1.1 bar, for a mean reduced electric field of 376 V/cm/bar in the driftregion, and a reduced electric field of 2.7 kV/cm/bar in the EL region.
84
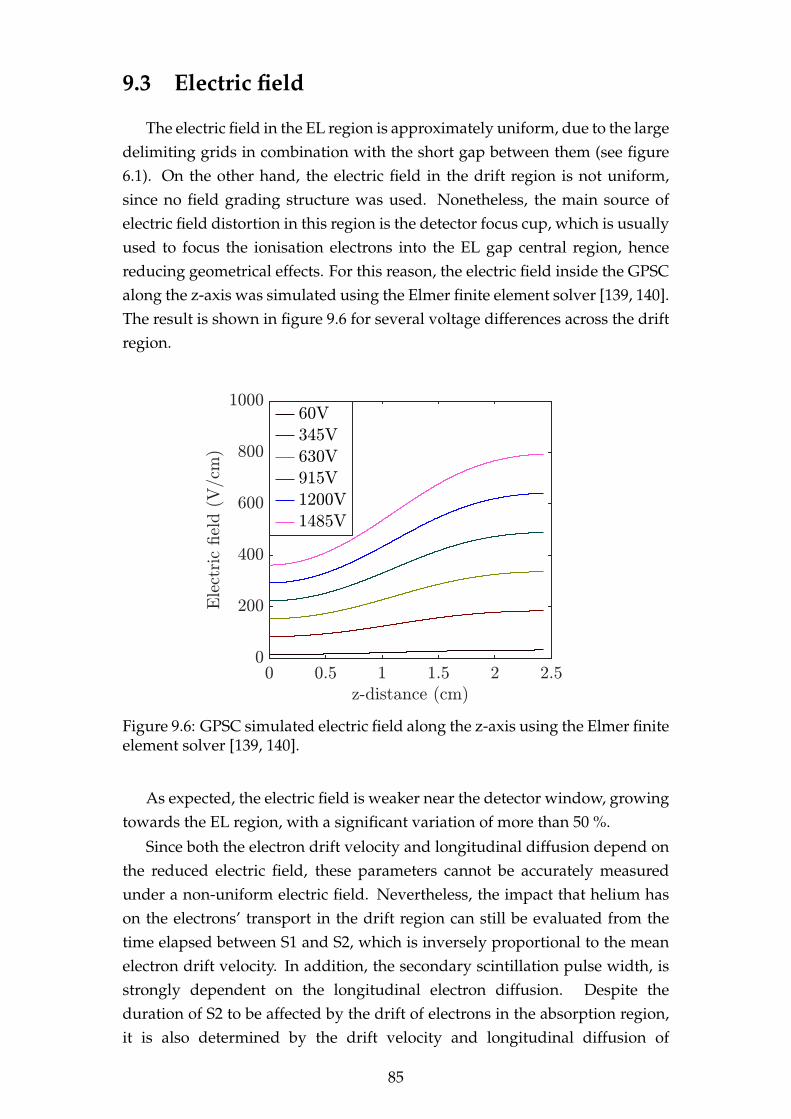
9.3 Electric field
The electric field in the EL region is approximately uniform, due to the largedelimiting grids in combination with the short gap between them (see figure6.1). On the other hand, the electric field in the drift region is not uniform,since no field grading structure was used. Nonetheless, the main source ofelectric field distortion in this region is the detector focus cup, which is usuallyused to focus the ionisation electrons into the EL gap central region, hencereducing geometrical effects. For this reason, the electric field inside the GPSCalong the z-axis was simulated using the Elmer finite element solver [139, 140].The result is shown in figure 9.6 for several voltage differences across the driftregion.
Figure 9.6: GPSC simulated electric field along the z-axis using the Elmer finiteelement solver [139, 140].
As expected, the electric field is weaker near the detector window, growingtowards the EL region, with a significant variation of more than 50 %.
Since both the electron drift velocity and longitudinal diffusion depend onthe reduced electric field, these parameters cannot be accurately measuredunder a non-uniform electric field. Nevertheless, the impact that helium hason the electrons’ transport in the drift region can still be evaluated from thetime elapsed between S1 and S2, which is inversely proportional to the meanelectron drift velocity. In addition, the secondary scintillation pulse width, isstrongly dependent on the longitudinal electron diffusion. Despite theduration of S2 to be affected by the drift of electrons in the absorption region,it is also determined by the drift velocity and longitudinal diffusion of
85
electrons inside the EL region. In order to minimise the electron transportcontribution occurring in the EL region, the time elapsed from S1 to S2 ismeasured between the centroid of S1 and the instant when S2 reaches 50 % ofits maximum amplitude (corresponding approximately to the time when thecentroid of the electron cloud reaches the EL region), while S2 duration ismeasured in the rising edge between 10 % and 90 % of the signal maximumamplitude.
These two measurements alone don’t allow to take quantitative conclusionsconcerning the fundamental electron drift parameters. Therefore, it is requireda GPSC waveforms simulation in order to understand the helium impact onboth the electron drift time and the secondary scintillation rise time. In thisway, the electric field gradient simulated for the drift region (figure 9.6) canbe used together with the theoretical electron drift velocity and longitudinaldiffusion (figure 9.1) to modulate the detector response, which can then becompared with the experimental results.
9.4 Electron transport theory
The first step for the GPSC waveform modulation consists in the electrondrift simulation in both absorption and EL regions, projected along the axisthat follows the electron drift direction. The hydrodynamic approximation ofBoltzmann equation can be used to describe the electron cloud evolution alongits drift [10]:
∂Ne
∂t+ vd
∂Ne
∂z′− D∗T
(∂2Ne
∂x′2+
∂2Ne
∂y′2
)− D∗L
∂2Ne
∂z′2= −ηvdNe (9.1)
where Ne represents the electrons density per unit of volume, D∗T is thetransverse diffusion coefficient, D∗L is the longitudinal diffusion coefficient, vd
is the drift velocity and η is the attachment coefficient. One should note thatD∗L and D∗T represented in equation 9.1 are in natural units, i.e. the quadraticelectron spread per unit of time (L2 T−1), while the DL values in figure 9.1 arerepresented in a more intuitive way, i.e. electron spread per root squareddrifted path length (L L−1/2 or L1/2). Consequently, the DL values shown infigure 9.1 need to be converted to the correct units in order to be used inequation 9.1, through D∗L = vdD2
L/2. Now, solving equation 9.1, one mayobtain the density of electrons:
Ne(x′, y′, z′, t) =e− (x′−x)2+(y′−z)2
4D∗T(t−t0) e− ((z′−z)+vd(t−t0))
2
4D∗L(t−t0)(4πD∗T(t− t0)
) (4πD∗L(t− t0)
)1/2 × nee−ηvd(t−t0) (9.2)
86
with (x’, y’, z’, t) being measurable variables, while (x, y, z, t) correspond tothe initial position and time of the ionisation cloud occurrence, containing ne
electrons.Neglecting the electron attachment, which is a good approximation for
pure xenon and for xenon-helium admixtures as well, and projecting theelectrons density, Ne along the drift direction i.e., on the z dimension, theequation 9.2 becomes simplified into a one-dimensional Gaussian functionwhose standard deviation is directly proportional to the square root of time (σ=√
2DL∆t) and the centroid is directly proportional to the time, i.e.,centroid = vd∆t. In this way, the evolution of the one-dimensional electroncloud can be easily simulated along the drift and EL regions, considering theinitial distribution along z obtained from SRIM simulation (figure 9.4).
9.5 Geometric efficiency
Since the solid angle subtended by the LAAPD and the electron cloudvaries along the EL gap, the waveform produced at the photosensor outputcannot be determined only with the electrons longitudinal distribution.Therefore, the solid angle was also taken into account for the waveformsimulation. Given the photosensor 16-mm diameter and the 8-mm EL gap,the geometrical efficiency is expected to be ∼ 15 % when the electron cloudenters into the EL region and 50 % when it reaches the anode. In addition tothe solid angle, the geometric efficiency evolution also depends on lightreflections in the detector materials and on the LAAPD window. However,these effects were not considered due to the complexity to accuratelymodulate VUV photon reflections on the several GPSC materials.
9.6 Electronics and xenon scintillation
The scintillation process in xenon is relatively fast, being dominated by thetriplet state with a life time of ∼ 100 ns [109, 141]. Nevertheless, the effectof the xenon excimer deexcitation can be easily modulated by modifying thesimulated waveform. For this purpose, a waveform numerical differentiationwith a time decay of 100 ns was performed.
Another significant source of waveform distortion comes from electronicsused at the LAAPD output. The first component in the signal processingchain is the pre-amplifier. This device decouples the LAAPD signal from thesupplied high voltage, which is required for its operation. In addition, thepre-amplifier stores, in a capacitor, the charge produced by the LAAPDduring each event detection, which is then discharged through a resistor.
87
Since the pre-amplifier discharge time constant used in this work is ∼ 50 µs, anumerical integration of the simulated waveform is performed with a 50 µsdecay constant.
The next amplification stage consists in a linear amplifier, which iscommonly used to mitigate the high probability of event overlapping due tothe slow discharge rate of the pre-amplifier capacitor. Therefore, the linearamplifier differentiates the input signal using a high-pass filter(capacitor-resistor), which is followed by a low pass filter (resistor-capacitor).Accordingly, the linear amplifier output can be modulated in approximationusing the differential equations 9.3 corresponding to the differentiation stage,and 9.4 corresponding to the integration stage, given by:
V0 + τdV0
dt= τ
dVi
dt(9.3)
V0 + τdV0
dt= Vi (9.4)
with V0 the output voltage and Vi the input voltage signal. As described in6.2.3, the linear-amplifier differentiation and integration time constants wereset to 50 ns, in order to preserve as much as possible the original LAAPDwaveform. Accordingly, τ is assumed to be 50 ns in equations 9.3 and 9.4,which are computed numerically for the modulated pre-amplifier output,that is in its turn obtained from the simulated GPSC waveform.
9.7 Waveforms simulation
The distribution of ionisation electrons produced during the interaction of5.9 keV x-rays with the gas at ∼1 bar ranges just a few tens of µm [121].Therefore, the electron cloud size when it reaches the EL region is dominatedby the electron diffusion.
However, the few mm long initial charge distribution produced by alphaparticles cannot be neglected. For this reason, the longitudinal chargedistribution simulated with SRIM, in section 9.2, is used as input for theelectron transport model described in section 9.4.
The electron drift velocity and longitudinal diffusion coefficientsinterpolated from the Magboltz values shown in figure 9.1 are also introducedin this model, considering the reduced electric fields established across the ELand absorption regions, where the latter is interpolated from the simulatedvalues shown in figure 9.6. The theoretical geometrical efficiency is usedtogether with the electron transport model to simulate the waveformproduced at the photosensor output, as described in section 9.5. Since the
88
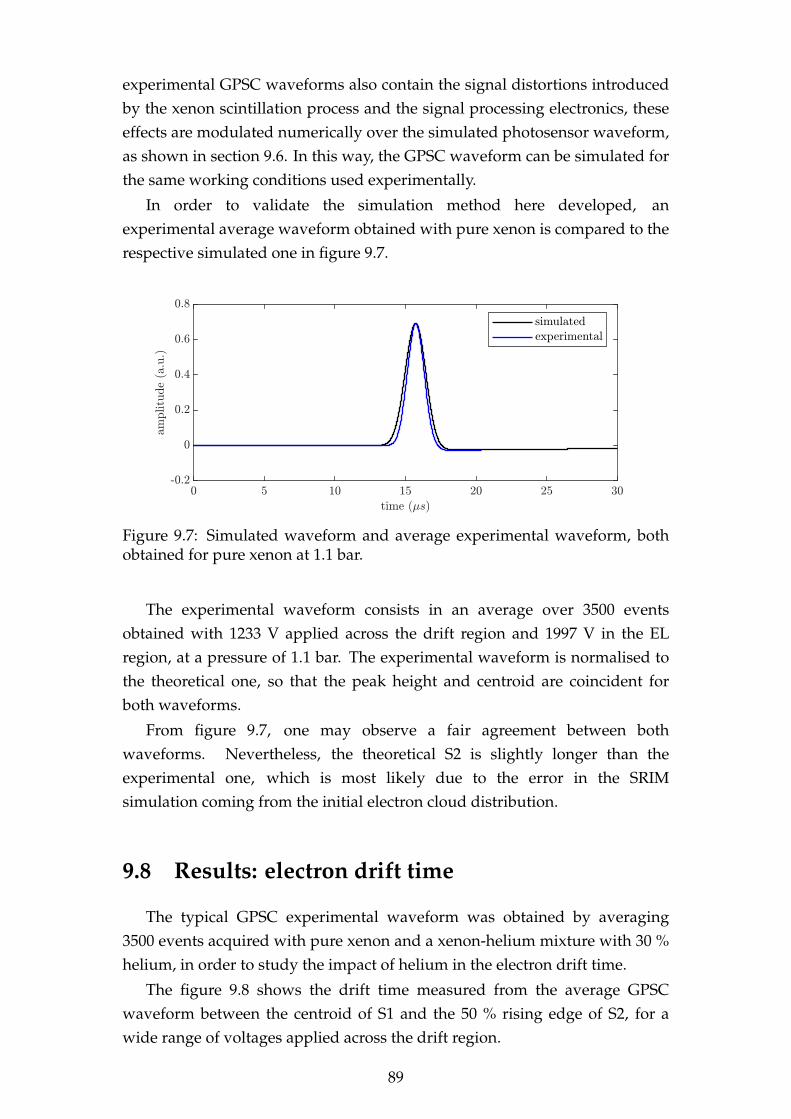
experimental GPSC waveforms also contain the signal distortions introducedby the xenon scintillation process and the signal processing electronics, theseeffects are modulated numerically over the simulated photosensor waveform,as shown in section 9.6. In this way, the GPSC waveform can be simulated forthe same working conditions used experimentally.
In order to validate the simulation method here developed, anexperimental average waveform obtained with pure xenon is compared to therespective simulated one in figure 9.7.
Figure 9.7: Simulated waveform and average experimental waveform, bothobtained for pure xenon at 1.1 bar.
The experimental waveform consists in an average over 3500 eventsobtained with 1233 V applied across the drift region and 1997 V in the ELregion, at a pressure of 1.1 bar. The experimental waveform is normalised tothe theoretical one, so that the peak height and centroid are coincident forboth waveforms.
From figure 9.7, one may observe a fair agreement between bothwaveforms. Nevertheless, the theoretical S2 is slightly longer than theexperimental one, which is most likely due to the error in the SRIMsimulation coming from the initial electron cloud distribution.
9.8 Results: electron drift time
The typical GPSC experimental waveform was obtained by averaging3500 events acquired with pure xenon and a xenon-helium mixture with 30 %helium, in order to study the impact of helium in the electron drift time.
The figure 9.8 shows the drift time measured from the average GPSCwaveform between the centroid of S1 and the 50 % rising edge of S2, for awide range of voltages applied across the drift region.
89
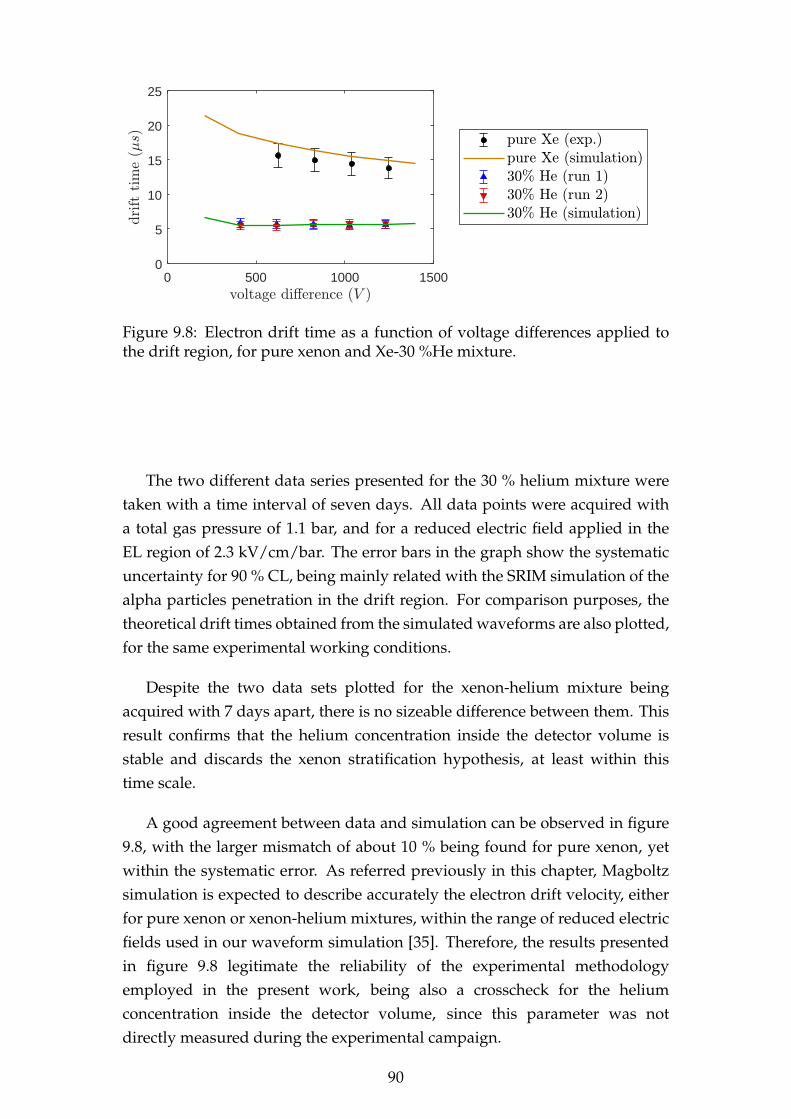
0 500 1000 15000
5
10
15
20
25
Figure 9.8: Electron drift time as a function of voltage differences applied tothe drift region, for pure xenon and Xe-30 %He mixture.
The two different data series presented for the 30 % helium mixture weretaken with a time interval of seven days. All data points were acquired witha total gas pressure of 1.1 bar, and for a reduced electric field applied in theEL region of 2.3 kV/cm/bar. The error bars in the graph show the systematicuncertainty for 90 % CL, being mainly related with the SRIM simulation of thealpha particles penetration in the drift region. For comparison purposes, thetheoretical drift times obtained from the simulated waveforms are also plotted,for the same experimental working conditions.
Despite the two data sets plotted for the xenon-helium mixture beingacquired with 7 days apart, there is no sizeable difference between them. Thisresult confirms that the helium concentration inside the detector volume isstable and discards the xenon stratification hypothesis, at least within thistime scale.
A good agreement between data and simulation can be observed in figure9.8, with the larger mismatch of about 10 % being found for pure xenon, yetwithin the systematic error. As referred previously in this chapter, Magboltzsimulation is expected to describe accurately the electron drift velocity, eitherfor pure xenon or xenon-helium mixtures, within the range of reduced electricfields used in our waveform simulation [35]. Therefore, the results presentedin figure 9.8 legitimate the reliability of the experimental methodologyemployed in the present work, being also a crosscheck for the heliumconcentration inside the detector volume, since this parameter was notdirectly measured during the experimental campaign.
90
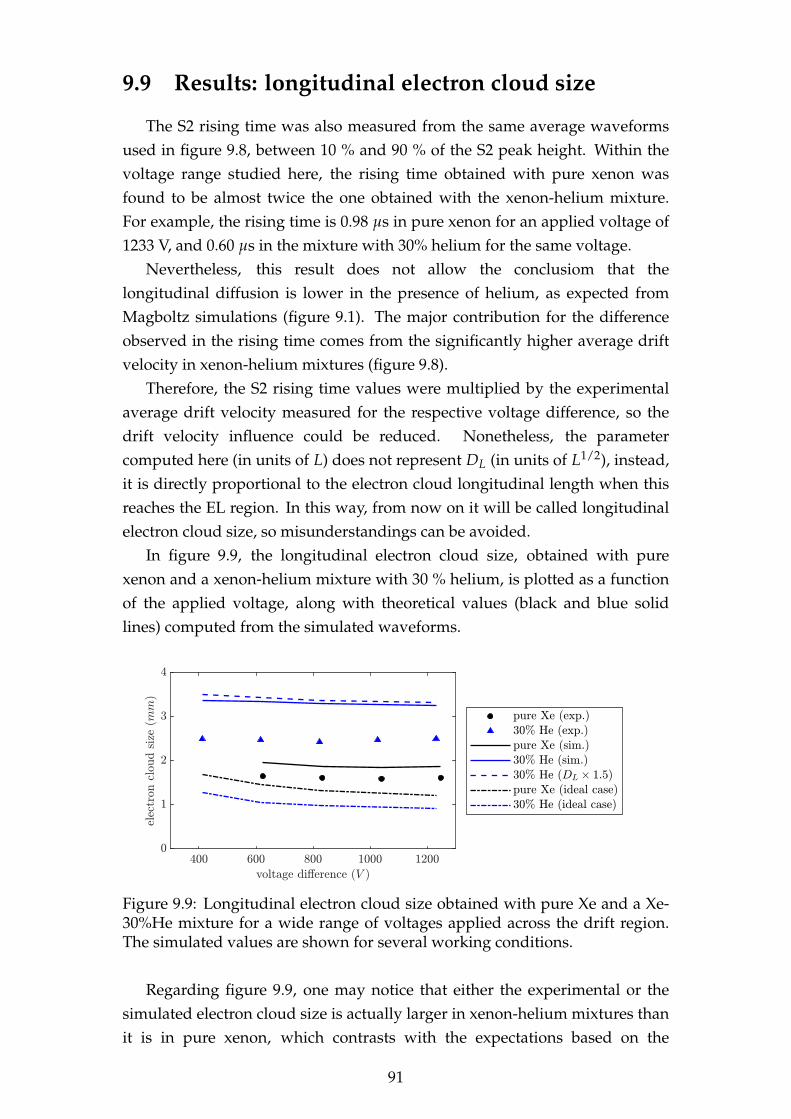
9.9 Results: longitudinal electron cloud size
The S2 rising time was also measured from the same average waveformsused in figure 9.8, between 10 % and 90 % of the S2 peak height. Within thevoltage range studied here, the rising time obtained with pure xenon wasfound to be almost twice the one obtained with the xenon-helium mixture.For example, the rising time is 0.98 µs in pure xenon for an applied voltage of1233 V, and 0.60 µs in the mixture with 30% helium for the same voltage.
Nevertheless, this result does not allow the conclusiom that thelongitudinal diffusion is lower in the presence of helium, as expected fromMagboltz simulations (figure 9.1). The major contribution for the differenceobserved in the rising time comes from the significantly higher average driftvelocity in xenon-helium mixtures (figure 9.8).
Therefore, the S2 rising time values were multiplied by the experimentalaverage drift velocity measured for the respective voltage difference, so thedrift velocity influence could be reduced. Nonetheless, the parametercomputed here (in units of L) does not represent DL (in units of L1/2), instead,it is directly proportional to the electron cloud longitudinal length when thisreaches the EL region. In this way, from now on it will be called longitudinalelectron cloud size, so misunderstandings can be avoided.
In figure 9.9, the longitudinal electron cloud size, obtained with purexenon and a xenon-helium mixture with 30 % helium, is plotted as a functionof the applied voltage, along with theoretical values (black and blue solidlines) computed from the simulated waveforms.
Figure 9.9: Longitudinal electron cloud size obtained with pure Xe and a Xe-30%He mixture for a wide range of voltages applied across the drift region.The simulated values are shown for several working conditions.
Regarding figure 9.9, one may notice that either the experimental or thesimulated electron cloud size is actually larger in xenon-helium mixtures thanit is in pure xenon, which contrasts with the expectations based on the
91
longitudinal electron diffusion values of figure 9.1. This apparentinconsistency is mostly attributed to the larger ionisation track produced byalpha particles in the mixture with helium, when compared with pure xenon(see figure 9.4). In addition to the real electron cloud size, the S2 rising timealso depends on variation of the solid angle subtended by LAAPD along theelectron drift. Therefore, the longitudinal electron diffusion contribution forthe electron cloud size values shown in figure 9.9 is minor. In order todemonstrate this effect, the electron cloud size was also simulated assuming alongitudinal electron diffusion 1.5 times higher. The result is shown in figure9.1 (dashed blue curve), showing that the effect of the significantly higherlongitudinal electron diffusion upon the electron cloud size value isnegligible.
In order to reach a better understanding on this issue, one may assumethe ideal case, that is a punctual initial electron cloud distribution producedat the same depth in xenon and in the gas mixture, and a small EL gap of1 mm. The simulation results considering the ideal case are also plotted infigure 9.9, for both pure xenon and the xenon-helium mixture. As expected,the electron cloud size is reduced in the presence of helium by a factor of ∼0.75, which is in agreement with the reduction of a factor of ∼ 0.58 (due tothe different units:
√0.58 ' 0.75) expected from the theoretical longitudinal
diffusion values (figure 9.1).From these observations, one may conclude that the present apparatus
and analysis methodology cannot be used to evaluate the electronlongitudinal diffusion, due to the large geometrical effects and the longionisation tracks produced by alpha particles. Even if these two effects wereproperly removed from the experimental values of S2 rising time, the errorsteaming from the SRIM and geometrical factor simulations would prevent usfrom detecting the subtle impact that the longitudinal diffusion has on the S2pulse shape.
In figure 9.9, a moderate mismatch between experimental data (bluetriangles and black circles) and the simulated curves (blue and black solidcurves) may still be observed, specially for the xenon-helium mixture. Apossible explanation for this inconsistency arises from the error on primarycharge distribution from SRIM simulation. This result reinforces the poorreliability of the present methodology and experimental conditions to be usedin order to evaluate the longitudinal electron diffusion.
92
Chapter 10
The relevance of helium contrastingwith molecular mixtures
Despite the impact of helium on xenon electroluminescence performancehave been found negligible in the present work, the helium addition in xenonresults in the reduction of the overall 136Xe mass which, per se, contributes tothe TPC sensitivity reduction to ββ0ν detection.
The sensitivity to mββ, the so-called effective Majorana mass of theelectron neutrino in experiments searching for 0νββ, i.e., the lower limit thatan experiment may achieve for mββ is given by [4]:
S(mββ) = k
√N
εMt(10.1)
where k is a constant, N is the average upper limit on the number ofobserved events expected in the experiment under the no-signal hypothesis, ε
is the signal detection efficiency, M is the source mass and t is themeasurement time.
When a dominant background like 2νββ is present, the average upper limitfor N is proportional to the square root of the mean number of backgroundevents, i.e. N ∝
√b. Besides, the number of background events is usually
proportional to the exposure, M t, and to the width of the energy window, ∆E,defined by the detector energy resolution: b = c · M · t · ∆E, where c is theexpected background rate. Therefore, the sensitivity becomes dependent on[4]:
S(mββ) ∝∆E
14
M14
(10.2)
Thus, a loss of mass in xenon due to the addition of a significant heliumamount will have consequences in the TPC sensitivity. Considering the3-dimensional diffusion coefficient, D3d, as a reference parameter, defined asthe characteristic size of the electron diffusion ellipsoid, 3
√xyz after 1 m drift
93

through the TPC, D3d = 3√
DL × D2T (mm/
√m) [32], an amount of 15 %
helium will be needed in order to reduce this 3D diffusion coefficient from~9.5 mm/
√m in pure xenon down to 2.65 mm/
√m, according to [34].
Since there is no degradation in the TPC resolution, according to thepresent studies, the consequent reduction of 136Xe mass in 15 % will thereforeresult in a TPC sensitivity degradation of ∼ 4.1 %. Nevertheless, although thereduction in the target mass imply a reduction effect on the sensitivity, theimprovement of the electron diffusion and, ultimately, on the topologicaldiscrimination efficiency to background, which is not considered in eq. 10.2,will enable a more sensitive search for ββ0ν. In addition, the resultingincrease in the electron drift velocity will have a positive reduction in electronattachment to impurities, which are non-trivially distributed throughout thedetector, and will add some space- and time-dependent fluctuations to thecharge yields as well as to charge loss.
The above mentioned sensitivity reduction needs to be compared with theresults achieved with CH4 addition to pure xenon in concentrations of 0.15 %CH4 which is required to reach the same 3D diffusion of 2.65 mm/
√m [32],
assuming that a similar background suppression can be achieved for bothtypes of low-diffusion mixtures. With the CH4 addition, it is considered thatthere is no variation in the 136Xe mass, and the energy resolution degradationmeasured in [32] leads to a ββ0ν sensitivity reduction of ~1 % and 3 %, for alight collection efficiency of 3 % and 0.5 %, respectively, yet considering anadditional 0.5 % constant contribution to the overall energy resolution in theNEXT TPC [13].
However, in an experiment like this, where the backgrounds subtractionhas a major importance, being dominated by the natural radioactivity fromthe TPC materials, such as 208Tl and 214Bi in the TPC components, as in NEXT-NEW [142], then the background counts will not depend upon the mass, M,being b = c · t · ∆E, and consequently:
S(mββ) ∝∆E
14
M12
(10.3)
Therefore, assuming the number of background events is not affected by thelower 136Xe mass in xenon-helium mixtures, the TPC sensitivity degradationwill be 8.5 % for Xe-15%He, to be compared with an impact on the TPCsensitivity of 1-3 %, estimated for CH4 mixtures of sub-percent concentration.
Therefore, a compromise has to be established, taking into account thisreduction in sensitivity, as well as the advantages of using helium as anadditive instead of molecular gases, and the gain in sensitivity due to a moreefficient topological discrimination.
94
Thus, other practical aspects such as the primary scintillation quenchinginduced by CH4, the long term purification and stability will need to beconsidered as well. These issues are to be investigated in larger TPCprototypes such as NEXT-DEMO and/or NEXT-NEW in subsequent R&Dprograms. A direct measurement of electron transverse diffusion is stillpending, as well as the pressure scaling assumption that the 1 barmeasurements can be extrapolated to 10 bar at the same E/p.
95

96
Chapter 11
General conclusions
In order to accomplish the tracking plane reconstruction, there are someinherent effects to the interaction of electrons which must be taken intoaccount, such as bremsstrahlung photons, delta rays emitted by electrons,and electron cloud diffusion during drift, among others. It is then required agood resolution in order to record a precise position.
The signal topology is limited by the electron diffusion effect during drift,which it is believed that could be improved with additives. Some studieshave been performed where the properties of the drift electrons in TPCs weremeasured, its diffusion, as it were the EL production effects and energyresolution as well.
Helium appears to be a better solution when compared to molecularadditives, since it is a noble gas, not suffering effects of vibrational androtational states, happening while using molecular species. The majorproblem while using molecular additives is the quenching effect, as well asattachment that drives to the reduction of S1 and S2, degrading the energyresolution. Nevertheless, those effects are not expected to happen withhelium. Thus, with the use of helium as an additive to pure xenon, thedetector performance in terms of electroluminescence is expected to be nearthe one obtained with pure xenon.
Thence, recently it were performed experimental studies where theelectron diffusion was studied, by [35], for xenon admixtures with helium.The longitudinal diffusion in xenon-helium mixtures is found to be largerthan anticipated in simulations by around 50 % and larger than in purexenon. Still suggesting that using helium as an additive will allow asubstantial improvement in the transverse diffusion reduction, thusremaining a promising prospect.
With this work is experimentally confirmed that the addition of helium topure xenon at concentration levels of 0-30% does not reduce the gas-mixtureelectroluminescence yield in a significant way. With a reduced electric field of
97
2.5 kV/cm/bar in the scintillation region, there was a reduction by ~2%, 3%,6% and 10% on the EL yield for 10%, 15%, 20% and 30% helium concentration,respectively. Moreover, no degradation was observed in the detector energyresolution with the helium addition to pure xenon.
Concerning electroluminescence threshold, values of 0.77 kV/cm/bar,0.80 kV/cm/bar, 0.85 kV/cm/bar and 0.91 kV/cm/bar were achieved for 10%, 15 %, 20 % and 30 % of helium, respectively. This threshold is slightlydegraded by increasing the helium amount, being this difference negligiblefor the studied concentrations.
Nevertheless, it is clearly noted that the impact of the helium addition onthe EL yield decrease is lower than that foreseen by recent simulationframework in the literature results. For reduced electric fields of 2.5-3.5kV/cm/bar the energy resolution results achieved for all xenon-heliummixtures were extremely positive, with values of 8.54 ± 0.2 %, 8.52 ± 0.2 %,8.46 ± 0.2 % and 8.93 ± 0.2 % for 10 %, 15 %, 20 % and 30 % helium,respectively, while for pure xenon the energy resolution obtained was 8.56 ±0.2 %. Therefore, these results prove, for the studied concentrations, that theaddition of helium to xenon does not significantly affect the energyresolution.
These results, combined with those obtained for the drift-diffusionproperties in the range of 1-10 bar by [35], reinforce the potential ofxenon-helium admixtures for ββ searches. Therefore, the present resultsreinforce the need for experimental studies of the electron transversediffusion in these mixtures.
The helium addition to xenon results in a correspondent loss of xenonmass in the TPC, which should be compared to the negligible impact on thexenon mass loss in admixtures with molecular additives. In order to reach anelectron diffusion value close to the thermal limit with molecular additives, itwould be needed only sub-percent concentrations, while with helium wouldbe necessary concentrations around 15-20%. This amount of helium wouldresult in a sensitivity degradation of ~4-6% in the TPC to mββ, in the case thatbackground is dominated by 2νββ decay. On the other hand, if thebackground is dominated by natural radioactivity of the TPC components,the degradation on the mββ sensitivity due to xenon mass reduction would be~8-12%. After all, these numbers may still be competitive in face of theadvantages related with the use of helium as an additive, replacing amolecular one. However, if the helium concentration should have to rise untillevels around 30 % in order to produce a significant reduction on electrondiffusion, then the respective reduction in the mββ sensitivity would be ~10 %and 20 % for the two above cases. Then, a careful evaluation of pros and cons
98
on the option presented in this work, namely in degradation of mββ
sensitivity due to lower ββ source mass versus improvement of backgrounddiscrimination in the TPC, should be taken into account.
The present results are an important benchmark for the simulation tools tobe applied to future optical TPCs based on xenon-helium mixtures. Summingup, the purposed goal of reducing the electron diffusion for EL TPCs withxenon filling might be possible to achieve with the use of helium, as analternative to molecular additives. Nevertheless, the amount of heliumneeded still have to be studied carefully, especially when high pressureoperation is needed, in comparison with molecular additives, where thesub-percent levels needed are negligible, not compromising the amount ofxenon available as source and detection medium.
The work presented in this thesis has its importance on several aspectsreferred as follows.
The experimental validation of the possibility to use xenon-heliummixtures with helium concentrations between 10 and 20 % without having asignificantly reduction on electroluminescence, not compromising thisparameter, then validating the use of xenon-helium mixtures as filling ofNEXT’s TPC.
The proof and showing that the experimental electroluminescence yieldpresents a lower variation than the one predicted by simulations, even forhelium concentrations above 20 %.
The ability to show that the helium addition to xenon, at least inconcentrations until 30 %, does not jeopardise the detector outcome in termsof its energy resolution.
11.1 Future work
For future work, following everything that has been done so far, someproposals are presented below.
The validation for the achieved conclusions in this work in a detector withbigger dimensions, such as NEXT-DEMO++, for pressures of 10-15 bar,measuring the longitudinal and transverse diffusion and evaluate anypossible electroluminescence dependence and its statistical fluctuations aswell, with the filling pressure. This work has already started.
To study the GPSC outcome with xenon-helium mixtures, with xenonconcentrations of 5 to 30 % to low energy x-rays. This would be a similarstudy to the one performed for neon-xenon mixtures. With neon being muchmore expensive than helium and once there are already available solid-state
99

VUV photosensors with high quality, helium might be a more affordablealternative, yet being more efficient in order to minimise the effect on the lossof electrons to the GPSC window on the detection of low energy x-rays,whose gas penetration is much smaller. However, it is bigger onxenon-helium mixtures that it would be on neon-xenon admixtures.
The study on the unconformity found on electroluminescenceexperimental results, related to results achieved by simulation, becomesnecessary, since those discrepancies need to be understood in order toperform forward simulations with high confidence level on the results for theelectroluminescence produced on NEXT TPCs.
The study of Neutral Bremsstrahlung in pure xenon, as well as in xenon-helium mixtures. This effect was hypothetically pointed as a possibility whichmight explain the observed discrepancy between experimental results and thesimulated ones, on the scintillation amount emitted by drift electrons in thescintillation region. The study on Neutral Bremsstrahlung emission is alreadyin course for pure xenon.
The effects of molecular additives on the electron drift along thelow-intensity electric field region (drift region), and on the primaryscintillation yield achieved in each mixture are still to be analysed, since thesestudies were not possible to be performed before with the driftless-GPSC.Thus, we already added a standard GPSC to the experimental setup used inthe studies with molecular additives, to be operated in parallel andsimultaneously with the driftless-GPSC. The former studies will then becomplemented with this analysis, as well as the time profile of EL pulses, inorder to look for the possibility to extract information on the longitudinaldiffusion and attachment. The comparison of attachment occurring in the1-cm thick scintillation region of the standard-GPSC and that of 2.5-cm thickregion in the driftless-GPSC will provide a deeper understanding of thiseffect. New additives are also being studied, in particular C2H6. Thismolecule belongs to the same family of CH4 and might be one of the potentialcandidates to be used in NEXT-100 detector, as already was assumed by theNEXT collaboration.
On the other hand, the determination of scintillation probability in thosemixtures will serve as a test to the simulation model that has been developedby the NEXT Collaboration. The EL yield predicted by this model in Xe-CH4
mixtures is lower than the one obtained experimentally and, fromexperimental results for Xe-C2H6 mixtures, it will be possible to understand ifthere is a problem in the model or else, if CH4 behaviour is an exception.
Following studies of Xe-CH4, Xe-CO2 and Xe-CF4 mixtures. These studieswill be performed in a standard-GPSC and in the driftless-GPSC, for
100
comparison. The time-profile of the pulses will be evaluated (in particular forthe Xe-CH4 and Xe-CO2 mixtures, for which such study has not yet beenperformed). The primary scintillation yield and possible quenching will bemeasured and the scintillation probability will be accessed.
Study of the gas pressure effect for the selected mixtures. These studieswill be performed using both the standard-GPSC and the driftless-GPSC,operated at pressures of 1.01, 1.33 and 2.0 bar. This study is important inorder to evaluate the methodology already followed to extrapolate the resultsobtained at 1 bar for the operation conditions of NEXT-100, namely 10 bar. Inaddition, it will be a test to the simulation model relative to quenching andattachment, contributing to the full understanding of those parametersbehaviour.
Detailed research of NEXT-DEMO prototype, filled with the selectedmixture, among the aforementioned possibilities, that has shown, in the firstphase, the more promising potential for NEXT. If necessary, additionalmixtures may also be tested in NEXT-DEMO detector. The parametersdescribed below must be fully understood, in a first stage, operating thedetector at a pressure of 1 to 5 bar, and, in a second stage, with pressuresbetween 5 and 10 bar, in order to understand the dependence of theseparameters on the gas pressure, such as the effect on the energy resolutionachieved in NEXT-DEMO, the effect on the primary scintillation yield, the gastransparency to xenon scintillation, the effect on electron attachment in thedrift region of the detector, and for drift distances up to 30 cm anddetermination of transverse and longitudinal diffusion coefficients as well.These activities already started at IFIC Laboratories, in University of Valencia(in collaboration with researchers from NEXT Collaboration).
101

102
List of Figures
3.1 Drawing of the NEXT-100 lead castle shield in its openconfiguration [8]. . . . . . . . . . . . . . . . . . . . . . . . . . . . 18
3.2 The concept in NEXT experiment [8]. . . . . . . . . . . . . . . . . 18
3.3 The NEXT-100 apparatus from [77]. . . . . . . . . . . . . . . . . . 19
3.4 A ββ0ν event (at left) and a single electron background event (atright). Both events were simulated in Monte Carlo at 15 bar gaspressure [26]. . . . . . . . . . . . . . . . . . . . . . . . . . . . . . . 23
3.5 The effect of 2 mm (at the centre images) and 10 mm (at theright) diffusion where the details lost at the diffusion can beseen against the ‘true’ track [29]. . . . . . . . . . . . . . . . . . . . 28
3.6 Reduced EL yield obtained for 5.9 keV x-rays, Y/p, as afunction of the reduced electric field, E/p, for different typesand concentrations of molecular gases added to pure xenon: (a)CO2; (b) CH4; (c) CF4. Total pressures of 1.13, 1.25 and 1.24 barwere used, for Xe-CO2, Xe-CH4 and Xe-CF4 mixtures,respectively. Solid lines show linear fits to the data, whiledashed lines are simulation values obtained with the codedeveloped in [31]. Results taken from [32]. . . . . . . . . . . . . . 31
3.7 Energy resolution extrapolated for NEXT-100 for the ββ0ν
energy as function of 3D diffusion for the labelled additiveconcentrations, with a drift reduced electric field of 20V/cm/bar and and EL reduced electric field of 2.5 keV/cm/bar[106]. . . . . . . . . . . . . . . . . . . . . . . . . . . . . . . . . . . 33
5.1 Left: Cross section of electron-xenon and electron-helium asfunction of electron energy [128]. Right: Transverse diffusioncoefficient as function of helium concentration in xenon-heliumadmixtures [34]. . . . . . . . . . . . . . . . . . . . . . . . . . . . . 47
103
5.2 Left: Dependence of the reduced transverse diffusioncoefficient on helium concentration predicted with Magboltzsimulations. The line represents the value from the simulationand the shaded region is the error in the simulation. Right:Extrapolated transverse diffusion in pure xenon, compared toexperimental data from NEXT-NEW TPC [35]. . . . . . . . . . . 47
5.3 Longitudinal diffusion as function of the applied electric fieldfor different concentrations of helium in xenon from [34]simulations (top) and the respective experimental results from[35] (bottom). . . . . . . . . . . . . . . . . . . . . . . . . . . . . . . 49
5.4 Drift velocity as function of helium concentration forxenon-helium mixtures for different electric fields [34]. . . . . . 50
5.5 Results obtained from simulation for the reducedelectroluminescence yield as function of the applied reducedelectric field [34]. . . . . . . . . . . . . . . . . . . . . . . . . . . . 51
6.1 Schematic of a GPSC equipped with a large avalanchephotodiode (LAAPD). . . . . . . . . . . . . . . . . . . . . . . . . 53
6.2 Experimental setup layout . . . . . . . . . . . . . . . . . . . . . . 55
6.3 Pulse-height distribution for 5.9 keV x-rays absorbed in theGSPC active volume filled with Xe-15%He, for a reducedelectric field of 2.4 kV/cm/bar. . . . . . . . . . . . . . . . . . . . 57
6.4 Typical waveform obtained with 5.9 keV x-rays. . . . . . . . . . 60
6.5 Example of a rejected waveform that significantly deviates intime from the trigger instant. . . . . . . . . . . . . . . . . . . . . 60
7.1 EL yield (Y/p) in arbitrary units for pure xenon, normalised bypressure, as a function of reduced electric field (E/p) applied tothe scintillation region achieved for several runs with differentLAAPD operation conditions. . . . . . . . . . . . . . . . . . . . . 64
7.2 EL yield (Y/p) as a function of reduced electric field (E/p)applied to the scintillation region obtained with pure Xe indifferent days at different room temperatures. Absolute valueswere obtained from the normalisation procedure described inthe text above. . . . . . . . . . . . . . . . . . . . . . . . . . . . . . 65
7.3 Reduced EL yield (Y/p) for pure xenon as a function of reducedelectric field (E/p) applied to the scintillation region obtainedfrom different days (with different room temperatures and leakcurrents). a) Data without leak current correction. b) The samecurves with data corrected for leak current. . . . . . . . . . . . . 66
7.4 Energy resolution as a function of E/p, obtained for pure xenon. 67
104
7.5 R2E as a function of 1/A, obtained with pure xenon, for runs
performed in different days. The solid line represents the linearfit to the data points in blue, with the remaining pointsexcluded from the fit. . . . . . . . . . . . . . . . . . . . . . . . . . 68
8.1 Reduced EL yield as function of E/p in the scintillation regionfor pure Xe and for the different Xe-He mixtures studied in thepresent work. The solid and dashed lines correspond to linearfits performed on the experimental and simulation data from[34], respectively. The full data set is depicted on the top plot.The different He concentrations are separated in the 4 bottomplots for readability purposes. . . . . . . . . . . . . . . . . . . . . 72
8.2 Experimental and simulated reduced EL yield as a function ofHe concentration for an E/p of 2.5 kV/cm/bar. Solid curves (2-degree polynomial fit) serve only to guide the eye. . . . . . . . . 73
8.3 Energy resolution as function of the reduced electric field in thescintillation region, obtained for pure Xe and several Xe-Hemixtures. Solid curves serve only to guide the eye. . . . . . . . . 74
8.4 Energy resolution as function of E/p in the scintillation region,obtained for pure Xe and for the several Xe-He mixtures, withthe values of each run corrected for the total pressure. . . . . . . 75
8.5 The square of the energy resolution, R2E, as function of the peak
centroid’s inverse of 5.9 keV pulse height distribution for Xe-Hemixtures. The solid lines are linear fits to the selected data points(blue circles). a) 10% He, b) 15% He, c) 20% He, d) 30% He. . . . 77
9.1 Magboltz simulation [129] of the drift velocity and DL for purexenon and for a mixture of 30%-He, both with a total a pressureof ∼ 1.1 bar [136]. . . . . . . . . . . . . . . . . . . . . . . . . . . . 80
9.2 (top): Secondary scintillation pulse observed in the oscilloscope,after averaging 512 events produced by 5.9 keV x-rays in the gasvolume for Xe-20%He mixture. (bottom): baseline zoom of thewaveform presented in a). . . . . . . . . . . . . . . . . . . . . . . 81
9.3 Projection of the tracks produced by 100 alpha particles on theyz-plan, obtained from a SRIM simulation for a Xe-30%Hemixture. The blue tracks represent the path travelled by alphaparticles, starting at the 241Am source, passing through 2 mm ofair at 1 bar, 10 µm of aluminium and 6 µm of Melinex, untilbeing fully stopped in the gas mixture, whose end-position isrepresented by red points. . . . . . . . . . . . . . . . . . . . . . . 83
105
9.4 Relative energy deposited in the gas volume by alpha particlesalong the z-axis, obtained from a SRIM simulation, for purexenon and for a Xe-30%He mixture at 1.1 bar. . . . . . . . . . . . 83
9.5 Typical average waveform produced by alpha particles in purexenon at 1.1 bar, for a mean reduced electric field of 376V/cm/bar in the drift region, and a reduced electric field of 2.7kV/cm/bar in the EL region. . . . . . . . . . . . . . . . . . . . . 84
9.6 GPSC simulated electric field along the z-axis using the Elmerfinite element solver [139, 140]. . . . . . . . . . . . . . . . . . . . 85
9.7 Simulated waveform and average experimental waveform, bothobtained for pure xenon at 1.1 bar. . . . . . . . . . . . . . . . . . 89
9.8 Electron drift time as a function of voltage differences applied tothe drift region, for pure xenon and Xe-30 %He mixture. . . . . . 90
9.9 Longitudinal electron cloud size obtained with pure Xe and aXe-30%He mixture for a wide range of voltages applied acrossthe drift region. The simulated values are shown for severalworking conditions. . . . . . . . . . . . . . . . . . . . . . . . . . . 91
106

Bibliography
[1] D. R. Nygren. Columnar recombination: a tool for nuclear recoildirectional sensitivity in a xenon-based direct detection WIMP search.J. Phys. Conf. Ser., 460:012006, 2013.
[2] G. Mohlabeng, K. Kong, J. Li, A. Para, and J. Yoo. Dark MatterDirectionality Revisited with a High Pressure Xenon Gas Detector. JHEP,07:092, 2015.
[3] N.S. Phan, R.J. Lauer, E.R. Lee, D. Loomba, J.A.J. Matthews, and E.H.Miller. GEM-based TPC with CCD Imaging for Directional Dark MatterDetection. Astropart. Phys., 84:82–96, 2016.
[4] NEXT Collaboration, J. Martín-Albo, et al. Sensitivity of NEXT-100 toNeutrinoless Double Beta Decay. JHEP, 05:159, 2016.
[5] K. Nakamura et al. AXEL—a high pressure xenon gas TPC forneutrinoless double beta decay search. Nucl. Instrum. Meth. A, 845:394–397, 2017.
[6] M. Redshaw, E. Wingfield, J. McDaniel, and E.G. Myers. Mass andDouble-Beta-Decay Q Value of 136Xe. Phys. Rev. Lett., 98:053003, 2007.
[7] NEXT Collaboration, J. Martín-Albo, and J.J. Gómez-Cadenas. Statusand physics potential of NEXT-100. J. Phys. Conf. Ser., 460:012010, 2013.
[8] NEXT Collaboration, J.J. Gomez-Cadenas, et al. Present status andfuture perspectives of the NEXT experiment. Adv. High Energy Phys.,2014:907067, 2014.
[9] Yu Gavrilyuk, A. Gangapshev, V. Kazalov, V. Kuzminov, S. Panasenko,S. Ratkevich, D. Tekueva, and S. Yakimenko. Results of In-DepthAnalysis of Data Obtained in the Experimental Search for 2K(2ν)-Capture in 78Kr. Physics of Particles and Nuclei, 49:540–546, 07 2018.
[10] D. Gonzalez-Diaz, F. Monrabal, and S. Murphy. Gaseous and dual-phasetime projection chambers for imaging rare processes. Nucl. Instrum.Meth. A, 878:200–255, 2018.
107
[11] NEXT Collaboration, Diego González-Díaz, et al. Accurate γ and MeV-electron track reconstruction with an ultra-low diffusion Xenon/TMATPC at 10 atm. Nucl. Instrum. Meth. A, 804:8–24, 2015.
[12] NEXT Collaboration, D. Lorca, et al. Characterisation of NEXT-DEMOusing xenon Kα X-rays. JINST, 9(10):P10007, 2014.
[13] J. Renner et al. Energy calibration of the NEXT-White detector with 1%resolution near Qββ of 136Xe. Journal of High Energy Physics, 10(10):230,Oct 2019.
[14] L.M.P. Fernandes, E.D.C. Freitas, M. Ball, J.J. Gomez-Cadenas, C.M.B.Monteiro, N. Yahlali, D. Nygren, and J.M.F.dos Santos. Primaryand secondary scintillation measurements in a xenon Gas ProportionalScintillation Counter. JINST, 5:P09006, 2010. [Erratum: JINST 5, A12001(2010)].
[15] C. Balan, E.D.C. Freitas, T. Papaevangelou, I. Giomataris, H.Natalda Luz, C.M.B. Monteiro, and J.M.F.dos Santos. Micromegas operation inhigh pressure xenon: Charge and scintillation readout. JINST, 6:P02006,2011.
[16] NEXT Collaboration, V. Alvarez, et al. Near-Intrinsic EnergyResolution for 30 to 662 keV Gamma Rays in a High Pressure XenonElectroluminescent TPC. Nucl. Instrum. Meth. A, 708:101–114, 2013.
[17] NEXT Collaboration, L. Serra, D. Lorca, J. Martin-Albo, M. Sorel, andJ.J. Gomez-Cadenas. Latest results of NEXT-DEMO, the prototype of theNEXT 100 double beta decay experiment. In 37th International Conferenceon High Energy Physics, 10 2014.
[18] C.M.B. Monteiro, L.M.P. Fernandes, J.A.M. Lopes, L.C.C. Coelho,J.F.C.A. Veloso, J.M.F. dos Santos, K. Giboni, and E. Aprile. Secondaryscintillation yield in pure xenon. Journal of Instrumentation, 05(5):05001,May 2007.
[19] C.M.B. Monteiro, J.A.M. Lopes, J.F.C.A. Veloso, and J.M.F. dos Santos.Secondary scintillation yield in pure argon. Physics Letters B, 668(3):167– 170, 2008.
[20] C.A.B. Oliveira et al. A simulation toolkit for electroluminescenceassessment in rare event experiments. Phys. Lett. B, 703:217–222, 2011.
[21] E.D.C. Freitas, C.M.B. Monteiro, M. Ball, J.J. Gomez-Cadenas, J.A.M.Lopes, T. Lux, F. Sanchez, and J.M.F. dos Santos. Secondary scintillation
108
yield in high-pressure xenon gas for neutrinoless double beta decay(0νββ) search. Phys. Lett. B, 684:205–210, 2010.
[22] C.M.B. Monteiro, A.S. Conceicao, F.D. Amaro, J.M. Maia, A.C.S.S.M.Bento, L.F.R. Ferreira, J.F.C.A. Veloso, J.M.F. dos Santos, A. Breskin, andR. Chechik. Secondary scintillation yield from gaseous micropatternelectron multipliers in direct dark matter detection. Phys. Lett. B,677:133–138, 2009.
[23] C.M.B. Monteiro, L.M.P. Fernandes, J.F.C.A. Veloso, C.A.B. Oliveira, andJ.M.F. dos Santos. Secondary scintillation yield from GEM and THGEMgaseous electron multipliers for direct dark matter search. Physics LettersB, 714(1):18–23, 2012.
[24] J. M. F. dos Santos, J. A. M. Lopes, J. F. C. A. Veloso, P. C. P. S. Simões, T. H.V. T. Dias, F. P. Santos, P. J. B. M. Rachinhas, L. F. Requicha Ferreira, andC. A. N. Conde. Development of portable gas proportional scintillationcounters for x-ray spectrometry. X-Ray Spectrometry, 30(6):373–381, 2001.
[25] C.M.B. Monteiro, L.M.P. Fernandes, J.F.C.A. Veloso, and J.M.F. dosSantos. Secondary scintillation readout from GEM and THGEM with alarge area avalanche photodiode. Journal of Instrumentation, 7(06):P06012,jun 2012.
[26] NEXT Collaboration, P. Ferrario, et al. First proof of topologicalsignature in the high pressure xenon gas TPC with electroluminescenceamplification for the NEXT experiment. JHEP, 01:104, 2016.
[27] NEXT Collaboration, J. Renner, et al. Background rejection in NEXTusing deep neural networks. JINST, 12(01):T01004, 2017.
[28] NEXT Collaboration, F. Monrabal, et al. The Next White (NEW) Detector.JINST, 13(12):P12010, 2018.
[29] C.D.R. Azevedo, L.M.P. Fernandes, E.D.C. Freitas, D. Gonzalez-Diaz,F. Monrabal, C.M.B. Monteiro, J. M. F. dos Santos, J.F.C.A. Veloso, andJ. J Gomez-Cadenas. An homeopathic cure to pure Xenon large diffusion.JINST, 11(02):C02007, 2016.
[30] NEXT Collaboration, C.A.O. Henriques, et al. Secondary scintillationyield of xenon with sub-percent levels of CO2 additive for rare-eventdetection. Phys. Lett. B, 773:663–671, 2017.
[31] C.D.R. Azevedo et al. Microscopic simulation of xenon-based opticalTPCs in the presence of molecular additives. Nucl. Instrum. Meth. A,877:157–172, 2018.
109
[32] NEXT Collaboration, C.A.O. Henriques, et al. Electroluminescence TPCsat the Thermal Diffusion Limit. JHEP, 01:027, 2019.
[33] R.C. Lanza, W. Rideout, F. Fahey, and R.E. Zimmerman. Gas Scintillatorsfor Imaging of Low Energy Isotopes. IEEE Transactions on Nuclear Science,34(1):406–409, 1987.
[34] R. Felkai et al. Helium–Xenon mixtures to improve the topologicalsignature in high pressure gas xenon TPCs. Nucl. Instrum. Meth. A,905:82–90, 2018.
[35] NEXT Collaboration, A.D. McDonald, et al. Electron Drift andLongitudinal Diffusion in High Pressure Xenon-Helium Gas Mixtures.JINST, 14(08):P08009, 2019.
[36] Particle Data Group Collaboration, J. Beringer, et al. Review of ParticlePhysics (RPP). Phys. Rev. D, 86:010001, 2012.
[37] M.C. Gonzalez-Garcia and Michele Maltoni. Phenomenology withMassive Neutrinos. Phys. Rept., 460:1–129, 2008.
[38] P. Hernandez. Neutrino physics. In 5th CERN - Latin American School ofHigh-Energy Physics, volume CERN-210-001, pages 229–278, 10 2010.
[39] M. Fukugita and T. Yanagida. Baryogenesis Without Grand Unification.Phys. Lett. B, 174:45–47, 1986.
[40] Sacha Davidson, Enrico Nardi, and Yosef Nir. Leptogenesis. Phys. Rept.,466:105–177, 2008.
[41] J.J. Gomez-Cadenas, J. Martin-Albo, M. Mezzetto, F. Monrabal, andM. Sorel. The Search for neutrinoless double beta decay. Riv. NuovoCim., 35(2):29–98, 2012.
[42] J.J. Gomez-Cadenas, J. Martin-Albo, M. Sorel, P. Ferrario, F. Monrabal,J. Munoz-Vidal, P. Novella, and A. Poves. Sense and sensitivity of doublebeta decay experiments. JCAP, 06:007, 2011.
[43] NEXT Collaboration and P. Ferrario. NEXT-DEMO: a prototype for theNEXT experiment. JINST, 7:C11013, 2012.
[44] H.V. Klapdor-Kleingrothaus et al. Latest results from the Heidelberg-Moscow double beta decay experiment. Eur. Phys. J. A, 12:147–154, 2001.
[45] J. Engel and P. Vogel. Viewpoint: The Hunt for No Neutrinos. PhysicalReview Letters, 11(30), 2018.
110
[46] NEMO-3 Collaboration, R. Arnold, et al. Results of the search forneutrinoless double-β decay in 100Mo with the NEMO-3 experiment.Phys. Rev. D, 92(7):072011, 2015.
[47] SuperNEMO Collaboration, R. Arnold, et al. Probing New PhysicsModels of Neutrinoless Double Beta Decay with SuperNEMO. Eur. Phys.J. C, 70:927–943, 2010.
[48] CUORE Collaboration, D.R. Artusa, et al. Exploring the NeutrinolessDouble Beta Decay in the Inverted Neutrino Hierarchy with BolometricDetectors. Eur. Phys. J. C, 74(10):3096, 2014.
[49] F. Bellini. The search for Majorana neutrinos with neutrinoless doublebeta decays: From CUORICINO to LUCIFER experiment. AIP ConferenceProceedings, 1498(1):237–245, 2012.
[50] N. D. Khanbekov. AMoRE: Collaboration for searches for theneutrinoless double-beta decay of the isotope of 100Mo with the aidof 40Ca100MoO4 as a cryogenic scintillation detector. Physics of AtomicNuclei, 76(9):1086–1089, 2013.
[51] K. Zuber. COBRA: Double beta decay searches using CdTe detectors.Phys. Lett. B, 519:1–7, 2001.
[52] COBRA Collaboration, T. Bloxham, et al. First results on double β-decaymodes of Cd, Te, and Zn Isotopes. Phys. Rev. C, 76:025501, 2007.
[53] C. Arnaboldi, F.T. Avignone III, J. Beeman, M. Barucci, et al. CUORE: acryogenic underground observatory for rare events. Nuclear Instrumentsand Methods in Physics Research Section A: Accelerators, Spectrometers,Detectors and Associated Equipment, 518(3):775 – 798, 2004.
[54] C. Brofferio, O. Cremonesi, and S. Dell’Oro. Neutrinoless Double BetaDecay Experiments With TeO2 Low-Temperature Detectors. Front. inPhys., 7:86, 2019.
[55] E. Fiorini and T.O. Niinikoski. Low Temperature Calorimetry for RareDecays. Nucl. Instrum. Meth. A, 224:83, 1984.
[56] C. Enss and Dan Mccammon. Physical Principles of Low TemperatureDetectors: Ultimate Performance Limits and Current DetectorCapabilities. Journal of Low Temperature Physics, 151:5–24, 04 2008.
[57] C. Arnaboldi et al. Production of high purity TeO2 single crystals for thestudy of neutrinoless double beta decay. J. Cryst. Growth, 312(20):2999–3008, 2010.
111

[58] CUORE Collaboration, D.Q. Adams, et al. Improved Limit onNeutrinoless Double-Beta Decay in 130Te with CUORE. Phys. Rev. Lett.,124(12):122501, 2020.
[59] SNO+ Collaboration, S. Andringa, et al. Current Status andFuture Prospects of the SNO+ Experiment. Adv. High Energy Phys.,2016:6194250, 2016.
[60] S. Andringa. SNO+ present status and prospects. Journal of Physics:Conference Series, 1137:012053, jan 2019.
[61] SNO+ Collaboration and V. Fischer. Search for neutrinoless double-betadecay with SNO+. In 13th Conference on the Intersections of Particle andNuclear Physics, 9 2018.
[62] SNO+ Collaboration and Josephine Paton. Neutrinoless Double BetaDecay in the SNO+ Experiment. In Prospects in Neutrino Physics, 3 2019.
[63] KamLAND-Zen Collaboration, A. Gando, et al. Measurement of thedouble-β decay half-life of 136Xe with the KamLAND-Zen experiment.Phys. Rev. C, 85:045504, 2012.
[64] KamLAND-Zen Collaboration and Yoshihito Gando. First results ofKamLAND-Zen 800. J. Phys. Conf. Ser., 1468(1):012142, 2020.
[65] KamLAND-Zen Collaboration, K. Asakura, et al. Results fromKamLAND-Zen. AIP Conf. Proc., 1666(1):170003, 2015.
[66] KamLAND-Zen Collaboration, A. Gando, et al. Limit on Neutrinolessββ Decay of 136Xe from the First Phase of KamLAND-Zen andComparison with the Positive Claim in 76Ge. Phys. Rev. Lett.,110(6):062502, 2013.
[67] EXO-200 Collaboration, J. B. Albert, G. Anton, I. Badhrees, et al.Search for Neutrinoless Double-Beta Decay with the Upgraded EXO-200Detector. Phys. Rev. Lett., 120:072701, Feb 2018.
[68] nEXO Collaboration, J.B. Albert, et al. Sensitivity and DiscoveryPotential of nEXO to Neutrinoless Double Beta Decay. Phys. Rev. C,97(6):065503, 2018.
[69] GERDA Collaboration, M. Agostini, et al. Final Results of GERDA onthe Search for Neutrinoless Double-β Decay. Submitted on 13 Sep 2020arXiv e-prints, 9 2020.
112
[70] GERDA Collaboration, M. Agostini, et al. Improved Limit onNeutrinoless Double-β Decay of 76Ge from GERDA Phase II. Phys. Rev.Lett., 120(13):132503, 2018.
[71] N. Abgrall et al. The MAJORANA DEMONSTRATOR NeutrinolessDouble-Beta Decay Experiment. Advances in High Energy Physics, 2014:1–18, 2014.
[72] Majorana Collaboration, S.I. Alvis, et al. A Search for NeutrinolessDouble-Beta Decay in 76Ge with 26 kg-yr of Exposure from theMAJORANA DEMONSTRATOR. Phys. Rev. C, 100(2):025501, 2019.
[73] I.J. Arnquist et al. The Majorana Demonstrator’s Search for Double-BetaDecay of 76Ge to Excited States of 76Se. Submitted on 13 Aug 2020 arXive-prints, 8 2020.
[74] J. Hyvärinen and J. Suhonen. Neutrinoless ββ decays to excited 0+ statesand the Majorana-neutrino mass. Phys. Rev. C, 93(6):1–15, 2016.
[75] J. Menendez, A. Poves, E. Caurier, and F. Nowacki. Disassembling thenuclear matrix elements of the neutrinoless ββ decay. Nuclear Physics A,818(3):139 – 151, 2009.
[76] Hao Qiao, Chunyu Lu, Xun Chen, Ke Han, Xiangdong Ji, and SiguangWang. Signal-background discrimination with convolutional neuralnetworks in the PandaX-III experiment using MC simulation. Sci. ChinaPhys. Mech. Astron., 61(10):101007, 2018.
[77] J.J. Gomez-Cadenas. The NEXT experiment. Nuclear and Particle PhysicsProceedings, 273-275:1732 – 1739, 2016. 37th International Conference onHigh Energy Physics (ICHEP).
[78] NEXT Collaboration, J.J. Gomez-Cadenas, J. Martin-Albo, andF. Monrabal. NEXT, high-pressure xenon gas experiments for ultimatesensitivity to Majorana neutrinos. JINST, 7:C11007, 2012.
[79] NEXT Collaboration, V. Alvarez, et al. The NEXT-100 experiment forneutrinoless double beta decay searches (Conceptual Design Report).arXiv e-prints, page arXiv:1106.3630, 6 2011.
[80] A. Herzenberg. Attachment of Slow Electrons to Oxygen Molecules. TheJournal of Chemical Physics, 51(11):4942–4950, 1969.
[81] M. Huk, P. Igo-Kemenes, and A. Wagner. Electron attachment tooxygen, water, and methanol, in various drift chambers gas mixtures.
113
Nuclear Instruments and Methods in Physics Research Section A: Accelerators,Spectrometers, Detectors and Associated Equipment, 267(1):107–119, 1988.
[82] NEXT Collaboration and Paola Ferrario. The NEXT double beta decayexperiment. PoS, EPS-HEP2017:105, 2017.
[83] D. Nygren. High pressure xenon gas electroluminescent TPC for 0ν
ββ decay search. Nuclear Instruments and Methods in Physics Research A,603(3):337–348, 2009.
[84] NEXT Collaboration, C.A.O. Henriques, et al. First evidence of neutralBremsstrahlung emission in xenon. Submitted to Phys. Rev. X, 2020.
[85] A. Buzulutskov, E. Shemyakina, A. Bondar, A. Dolgov, E. Frolov,V. Nosov, V. Oleynikov, L. Shekhtman, and A. Sokolov. Revealing neutralbremsstrahlung in two-phase argon electroluminescence. Astropart.Phys., 103:29–40, 2018.
[86] NEXT Collaboration and F. Monrabal. The NEXT experiment to searchfor the neutrinoless double beta decay of Xe-136. PoS, ICHEP2016:497,2017.
[87] NEXT Collaboration, P. Novella, et al. Radiogenic Backgrounds in theNEXT Double Beta Decay Experiment. JHEP, 10:051, 2019.
[88] NEXT Collaboration, P. Novella, et al. Measurement of radon-inducedbackgrounds in the NEXT double beta decay experiment. JHEP, 10:112,2018.
[89] NEXT Collaboration, V. Álvarez, et al. Operation and first results of theNEXT-DEMO prototype using a silicon photomultiplier tracking array.JINST, 8:P09011, 2013.
[90] R. Luscher et al. Search for ββ decay in Xe-136: New results from theGotthard experiment. Phys. Lett. B, 434:407–414, 1998.
[91] NEXT Collaboration, V. Alvarez, et al. NEXT-100 Technical DesignReport (TDR): Executive Summary. JINST, 7:T06001, 2012.
[92] V. Álvarez et al. Initial results of NEXT-DEMO, a large-scale prototype ofthe NEXT-100 experiment. Journal of Instrumentation, 8(4):P04002, April2013.
[93] NEXT Collaboration, J. Renner, et al. Initial results on energy resolutionof the NEXT-White detector. JINST, 13(10):P10020, 2018.
114

[94] NEXT Collaboration, P. Ferrario, et al. Demonstration of the eventidentification capabilities of the NEXT-White detector. JHEP, 10:052,2019.
[95] NEXT Collaboration, A. Simón, et al. Electron drift properties in highpressure gaseous xenon. JINST, 13(07):P07013, 2018.
[96] V. Palladino and B. Sadoulet. Application of Classical Theory ofElectrons in Gases to Drift Proportional Chambers. Nucl. Instrum. Meth.,128:323, 1975.
[97] L. G. H. Huxley and R. W. Crompton. Fundamental Principles of OpticalLithography. Wiley, New York, 1974.
[98] P. Segur, M. Yousfi, M. H. Kadri, and M. C. Bordage. A survey of thenumerical methods currently in use to describe the motion of an electronswarm in a weakly ionized gas. Transport Theory and Statistical Physics,15(6-7):705–757, 1986.
[99] Thomas Klikauer. Reflections on Phishing for Phools – The Economicsof Manipulation and Deception. tripleC: Communication, Capitalism &Critique., 14:260–264, 04 2016.
[100] R.E. Robson, M. Hildebrandt, and B. Schmidt. Electron transport theoryin gases: Must it be so difficult? Nucl. Instrum. Meth. A, 394:74–86, 1997.
[101] T. Takahashi, S. Himi, M. Suzuki, J. Ruan(Gen), and S. Kubota. Emissionspectra from Ar-Xe, Ar-Kr, Ar-N2, Ar-CH4, Ar-CO2 and Xe-N2 gasscintillation proportional counters. Nuclear Instruments and Methods inPhysics Research, 205(3):591 – 596, 1983.
[102] F. P. Santos, T. H. V. T. Dias, A. D. Stauffer, and C. A. N. Conde. Three-dimensional Monte Carlo calculation of the VUV electroluminescenceand other electron transport parameters in xenon. Journal of Physics D:Applied Physics, 27(1):42–48, jan 1994.
[103] Rob Veenhof. Choosing a gas mixture for the ALICE TPC. ALICE InternalNote, 2003.
[104] K. N. Pushkin, N. Hasebe, S. Kobayashi, C. Tezuka, M. Mimura,T. Hosojima, M. N. Kobayashi, T. Doke, M. Miyajima, T. Miyachi,E. Shibamura, S. E. Ulin, and V. V. Dmitrenko. Scintillation yield in highpressure xenon and xenon doped with methane. In IEEE SymposiumConference Record Nuclear Science 2004., volume 1, pages 550 – 553 Vol. 1,11 2004.
115
[105] L.G. Christophorou, D.L. McCorkle, D.V. Maxey, and J.G. Carter. Fastgas mixtures for gas-filled particle detectors. Nuclear Instruments andMethods, 163(1):141 – 149, 1979.
[106] C. A. O. Henriques. Studies of xenon mixtures with molecular additives forthe NEXT electroluminescence TPC. PhD thesis, University of Coimbra, 042019.
[107] Y. Tanaka, A. S. Jursa, and F. J. LeBlanc. Continuous Emission Spectra ofRare Gases in the Vacuum Ultraviolet Region. II. Neon and Helium. J.Opt. Soc. Am., 48(5):304–308, May 1955.
[108] M. Suzuki and S. Kubota. Mechanism of proportional scintillation inargon, krypton and xenon. Nuclear Instruments and Methods, 164(1):197 –199, 1979.
[109] J. W. Keto, R. E. Gleason, and G. K. Walters. Production Mechanismsand Radiative Lifetimes of Argon and Xenon Molecules Emitting in theUltraviolet. Phys. Rev. Lett., 33:1365–1368, Dec 1974.
[110] C.A.B. Oliveira, V. Gehman, A. Goldschmidt, D. Nygren, and J. Renner.Measurements of Charge and Light in Pure High Pressure Xe towardsthe Study of Xe+TMA Mixtures with Dark Matter DirectionalitySensitivity and Supra-intrinsic Energy Resolution for 0νββ DecaySearches. Physics Procedia, 61:742 – 749, 2015. 13th InternationalConference on Topics in Astroparticle and Underground Physics, TAUP2013.
[111] M. Suzuki, J. Ruan(Gen), and S. Kubota. Time dependence of therecombination luminescence from high-pressure argon, krypton andxenon excited by alpha particles. Nuclear Instruments and Methods inPhysics Research, 192(2):565 – 574, 1982.
[112] F.L.R. Vinagre and Carlos Conde. A technique for the absolutemeasurement of the w-value for X-rays in counting gases. NuclearInstruments and Methods in Physics Research Section A: Accelerators,Spectrometers, Detectors and Associated Equipment, 450:365–372, 08 2000.
[113] S.J.C. do Carmo, F.I.J.M. Borges, F. L. R. Vinagre, and C. Nieto Conde.Experimental Study of the w-Values and Fano Factors of Gaseous Xenonand Ar-Xe Mixtures for X-Rays. IEEE Transactions on Nuclear Science,55(5):2637–2642, 2008.
[114] T.H.V.T. Dias, J.M.F. dos Santos, P.J.B.M. Rachinhas, F.P. Santos, C.A.N.Conde, and A.D. Stauffer. Full-energy absorption of x-ray energies
116
near the Xe L- and K-photoionization thresholds in xenon gas detectors:Simulation and experimental results. Journal of Applied Physics,82(6):2742–2753, 1997.
[115] NEXT Collaboration, L. Serra, et al. An improved measurementof electron-ion recombination in high-pressure xenon gas. JINST,10(03):P03025, 2015.
[116] P. Lindblom and O. Solin. Atomic near-infrared noble gas scintillationsI: Optical spectra. Nuclear Instruments and Methods in Physics ResearchSection A: Accelerators, Spectrometers, Detectors and Associated Equipment,268(1):204 – 208, 1988.
[117] M. S. S. C. P. Leite. Radioluminescence of rare gases. Port. Phys, 11:53–73,1980.
[118] A. Policarpo. Light Production and Gaseous Detectors. Physica Scripta,23(4A):539–549, apr 1981.
[119] A. Bolotnikov and B. Ramsey. The spectroscopic properties of high-pressure xenon. Nuclear Instruments and Methods in Physics ResearchSection A: Accelerators, Spectrometers, Detectors and Associated Equipment,396(3):360 – 370, 1997.
[120] C.A.B. Oliveira, M. Sorel, J. Martin-Albo, J.J. Gomez-Cadenas, A.L.Ferreira, and J.F.C.A. Veloso. Energy Resolution studies for NEXT.JINST, 6:P05007, 2011.
[121] T. H. V. T. Dias, F. P. Santos, A. D. Stauffer, and C. A. N. Conde. MonteCarlo simulation of x-ray absorption and electron drift in gaseous xenon.Phys. Rev. A, 48:2887–2902, Oct 1993.
[122] M. Moszynski, M. Szawłowski, M. Kapusta, M. Balcerzyk, andD. Wolski. Large area avalanche photodiodes in X-rays and lightdetection. Nuclear Science, IEEE Transactions on, 1:1297 – 1302, 09 2000.
[123] Glenn F. Knoll. Radiation Detection and Measurement, 3rd ed. John Wileyand Sons, New York, 3rd edition edition, 2000.
[124] M. Moszynski, M. Szawłowski, M. Kapusta, and M. Balcerzyk. Largearea avalanche photodiodes in scintillation and X-rays detection. NuclearInstruments and Methods in Physics Research Section A: Accelerators,Spectrometers, Detectors and Associated Equipment, 485:504–521, 01 2000.
[125] Advanced Photonix Inc. Non-Cooled Large Area DUV SiliconAvalanche Photodiode, 2012.
117
[126] J. Matias-Lopes, J.M.F. Santos, R.E. Morgado, and C. Conde. A xenongas proportional scintillation counter with a UV - Sensitive large-area avalanche photodiode. In 2000 IEEE Nuclear Science Symposium.Conference Record (Cat. No.00CH37149), volume 1, pages 5/72 – 5/76vol.1, 02 2000.
[127] Stephen G. Kukolich. Demonstration of the Ramsauer-Townsend Effectin a Xenon Thyratron. American Journal of Physics, 36(8):701–703, 1968.
[128] P. Babington. Interactions of photons and electrons with atoms. Springer-Verlag Berlin Heidelberg, 17A:XII, 164, 2000.
[129] S. Biagi. Magboltz — transport of electrons in gas mixtures. http://
magboltz.web.cern.ch/magboltz/.
[130] k. Saito, S Sasaki, H Tawara, T. Sanami, and E. Shibamura. Study ofscintillation in helium mixed with xenon to develop thermal neutrondetectors. Nuclear Instruments and Methods in Physics Research Section A:Accelerators, Spectrometers, Detectors and Associated Equipment, 581(1):119– 122, 2007. VCI 2007.
[131] C. Monteiro, J. Matias-Lopes, P. C. Simões, J.M.F. Santos, and C Conde.An argon gas proportional scintillation counter with UV avalanchephotodiode scintillation readout. IEEE Trans Nucl. Sci., 1:5/67–5/71vol.1, 01 2000.
[132] L.M.P. Fernandes et al. Characterization of large area avalanchephotodiodes in X-ray and VUV-light detection. Journal of Instrumentation,08(8):08005, August 2007.
[133] D.F. Anderson, T.T. Hamilton, and R. Novick W.H.-M. Ku. A large areagas scintillation proportional counter. Nuclear Instruments and Methods,163(1):125–134, 1979.
[134] T.Z. Kowalski, A. Smith, and A. Peacock. Fano factor implicationsfrom gas scintillation proportional counter measurements. NuclearInstruments and Methods in Physics Research Section A: Accelerators,Spectrometers, Detectors and Associated Equipment, 279(3):567 – 572, 1989.
[135] F. I. G. M. Borges and C. A. N. Conde. Electron transport and gridtransmission in noble gas radiation detectors. in Proc. SASP’94, Eds. T.D. Mark, R. Schrittwiser, and D. Smitt. Intermoos, Austria: Institute für IonenPhysik, Universität Innsbruck, Mar., 20(24):436–437, 1994.
118

[136] C. Azevedo, C. A. O. Henriques, and Damien. Magboltz simulation ofthe drift velocity and DL for pure xenon and the mixture of Xe-He30%.Private Communication, 2019.
[137] S. do Carmo, F.I.G.M. Borges, F. Santos, T. Dias, and Carlos Conde.Absolute primary scintillation yield of gaseous xenon under low driftelectric fields for 5.9 keV X-rays. Journal of Instrumentation, 3:P07004, 072008.
[138] J. F. Ziegler, M. D. Ziegler, and J. P. Biersack. SRIM - The Stoppingand Range of Ions in Matter. Nuclear Instruments and Methods in PhysicsSection B: Beam Interactions with Materials and Atoms, 19th InternationalConference on Ion Beam Analysis, 268:1818, 2010.
[139] CSC Company. Elmer FEM solver. https://www.csc.fi/web/elmer.
[140] P. Silva. GPSC electric field simulation. Private Communication, 2019.
[141] E. Morikawa, R. Reininger, P. Gürtler, Saile V., and P. Laporte. Argon,krypton, and xenon excimer luminescence: From the dilute gas to thecondensed phase. J. Chem. Phys, 91(3):1469–1477, aug 1989.
[142] M. Nebot-Guinot, P. Ferrario, J. Martín-Albo, J. Muñoz Vidal, and J.J.Gómez-Cadenas. Backgrounds and sensitivity of the NEXT double betadecay experiment. Nuclear and Particle Physics Proceedings, 273-275:2612– 2614, 2016. 37th International Conference on High Energy Physics(ICHEP).
119


