Embed Size (px)
Citation preview

Studie en optimalisatie van gemagnetiseerde ICRF-ontladingenvoor wandconditionering in tokamaksen beoordeling van de toepasbaarheid op ITER
Study and Optimization of Magnetized ICRF Dischargesfor Tokamak Wall Conditioningand Assessment of the Applicability to ITER
Tom Wauters
Departement FysicaDepartementshoofd: prof. dr. ir. M. Van SchoorFaculteit Polytechniek
Academiejaar 2011 - 2012
Promotoren: prof. dr. ir. G. Van Oost, prof. dr. ir. M. Van SchoorProefschrift ingediend tot het behalen van de graden van Doctor in de Ingenieurswetenschappen: Toegepaste Natuurkunde (UGent) enDoctor in de Ingenieurswetenschappen (KMS)
Vakgroep Toegepaste FysicaVoorzitter: prof. dr. ir. C. LeysFaculteit Ingenieurswetenschappen en Architectuur

ISBN 978-90-8578-458-6NUR 926Wettelijk depot: D/2011/10.500/62

This work was carried out as a collaboration between the Institute for Mag-netic Fusion Research (IRFM, CEA Cadarache, France) and the Laboratory forPlasma Physics of the Royal Military Academy (LPP-ERM/KMS Brussels, Bel-gium). The work was supported by EURATOM and frames within the EuropeanFusion Development Agreement. The views and opinions expressed herein donot necessarily reflect those of the European Commission.
Copyright c©Tom Wauters (2011)

Members of the examining board
Prof. Guido Van Oost PromotorGhent University, Department of Applied PhysicsProf. Michael Van Schoor PromotorRoyal Military Academy of Belgium, Head Department of PhysicsDr. David Douai SupervisorCEA, Institute for Magnetic Fusion ResearchDr. Anatoli Lyssoivan SupervisorRoyal Military Academy of Belgium
Prof. Daniël De Zutter ChairmanGhent University, Former Dean of the Faculty of EngineeringProf. Christophe Leys SecretaryGhent University, Department of Applied PhysicsProf. Raymond KochRoyal Military Academy of BelgiumProf. Jean-Marie NoterdaemeGhent University, Department of Electrical Energy, Systems & AutomationDr. Volker PhilippsFZJ, Institute for Energy and Climate Research, Head of Plasma Wall Interac-tion groupDr. Michiya ShimadaITER Organization, Chief Scientific Officer of Fusion Science & TechnologyDepartment

Acknowledgements
First of all I would like to thank my supervisors David Douai1 and Ana-toli Lyssoivan2, with whom I’ve enjoyed working with. The progress thatI’ve made over the past three years is largely thanks to them. The effortsthey have dedicated to my work and my personal development deserve mygratitude and respect. I would also like to thank Prof. Van Oost3 andProf. Van Schoor2 for accepting the co-tutorship of this PhD, for establish-ing the collaboration between IRFM-CEA1 and LPP-ERM/KMS2, for theiravailability and for the constant interest they have shown in my work.
In the course of this PhD I had the opportunity to work in four Euro-pean research institutions. Approximately two years of the work are carriedout at IRFM-CEA1 and one year at IPP-Jülich4 with occasional visits toIPP-Garching5 and CCFE-Culham6. For these excellent collaborations Iwould like to thank specifically S. Brémond, A. Argouarch, J. Bucalossi,L. Colas, E. Gauthier, E. Joffrin, G. Lombard, P. Mollard, P. Monier-Garbet, B. Pégourié and the TORE SUPRA Team from IRFM-CEA1,R. Koch, S. Jachmich, E. Lerche, J. Ongena, M.K. Paul, D. Van Eester,M. Vervier and G. Van Wassenhove from LPP-ERM/KMS2, V. Philipps,M. Freisinger, A. Kreter, O. Marchuk, H. Reimer, G. Sergienko, S. Brezin-sek and the TEXTOR Team from IPP-Jülich4, V. Rohde, D. Wünderlich,V. Bobkov, J.-M. Noterdaeme, A. Scarabosio, W. Suttrop and the AS-DEX Upgrade Team from IPP-Garching5, V. Plyusnin from IST-Lisboa7,E. de la Cal from CIEMAT-Madrid8, T. Blackman, T. Coyne, M. Gra-ham, M. Maslov, M.-L. Mayoral, A. Miller and I. Monakhov from CCFE-Culham6, and P. Lamalle, F.C. Schüller, M. Shimada and R. Pitts fromITER9.
Cadarache, September 2011Tom Wauters
1IRFM-CEA, Association Euratom-CEA, St Paul lez Durance, France.2LPP-ERM/KMS, Association Euratom-Belgian State, Brussels, Belgium.3Ghent University, Department of Applied Physics, Ghent, Belgium4IEK-Plasmaphysik, FZ-Jülich, Euratom Association, Jülich, Germany.5Max-Planck Institut für Plasmaphysik, Euratom Association, Garching, Germany.6CCFE, Culham Science Centre, Abingdon, UK.7Centro de FNIST, Association Euratom-IST, Lisboa, Portugal.8Laboratorio Nacional de Fusión, Association Euratom-CIEMAT, Madrid, Spain.9ITER International Organization, St Paul lez Durance, France.


Table of Contents
Acknowledgements i
Nederlandse samenvatting xvii
English summary xxxi
1 Introduction 1-11.1 Energy for future generations . . . . . . . . . . . . . . . . . . 1-1
1.1.1 Prospects of nuclear fusion . . . . . . . . . . . . . . . 1-31.2 Controlled nuclear fusion . . . . . . . . . . . . . . . . . . . . 1-5
1.2.1 Nuclear energy . . . . . . . . . . . . . . . . . . . . . . 1-51.2.2 The fusion reaction . . . . . . . . . . . . . . . . . . . . 1-51.2.3 Fusion energy gain factor, Lawson criterion and triple
product . . . . . . . . . . . . . . . . . . . . . . . . . . 1-71.2.4 Plasma confinement and the tokamak configuration . 1-91.2.5 Plasma heating . . . . . . . . . . . . . . . . . . . . . . 1-11
1.2.5.1 Ohmic heating . . . . . . . . . . . . . . . . . 1-111.2.5.2 Neutral beam injection . . . . . . . . . . . . 1-121.2.5.3 Radio frequency heating . . . . . . . . . . . . 1-121.2.5.4 Heating by fusion reactions . . . . . . . . . . 1-12
1.2.6 Limiter and divertor configuration . . . . . . . . . . . 1-121.2.6.1 Limiter . . . . . . . . . . . . . . . . . . . . . 1-131.2.6.2 Divertor . . . . . . . . . . . . . . . . . . . . . 1-14
1.2.7 The European tokamaks TORE SUPRA, TEXTOR,ASDEX Upgrade and JET . . . . . . . . . . . . . . . 1-141.2.7.1 TORE SUPRA . . . . . . . . . . . . . . . . . 1-141.2.7.2 TEXTOR . . . . . . . . . . . . . . . . . . . . 1-151.2.7.3 JET . . . . . . . . . . . . . . . . . . . . . . . 1-161.2.7.4 ASDEX Upgrade . . . . . . . . . . . . . . . . 1-16
1.3 Fusion development and the ITER project . . . . . . . . . . . 1-161.3.1 The objective of ITER . . . . . . . . . . . . . . . . . . 1-181.3.2 The tokamak ITER . . . . . . . . . . . . . . . . . . . 1-19
1.3.2.1 The magnetic system . . . . . . . . . . . . . 1-191.3.2.2 Vacuum vessel . . . . . . . . . . . . . . . . . 1-191.3.2.3 The divertor . . . . . . . . . . . . . . . . . . 1-19

iv Table of Contents
1.3.2.4 The plasma facing components . . . . . . . . 1-201.3.2.5 The IC heating and current drive system . . 1-21
1.4 Plasma wall interaction . . . . . . . . . . . . . . . . . . . . . 1-211.4.1 Overview basic PWI processes . . . . . . . . . . . . . 1-21
1.4.1.1 Erosion . . . . . . . . . . . . . . . . . . . . . 1-221.4.1.2 Deposition and re-erosion . . . . . . . . . . . 1-231.4.1.3 Implantation and bulk trapping . . . . . . . 1-231.4.1.4 Surface adsorption . . . . . . . . . . . . . . . 1-241.4.1.5 Desorption . . . . . . . . . . . . . . . . . . . 1-24
1.4.2 Impurity desorption . . . . . . . . . . . . . . . . . . . 1-251.4.3 Hydrogen recycling . . . . . . . . . . . . . . . . . . . . 1-261.4.4 Tritium retention . . . . . . . . . . . . . . . . . . . . . 1-271.4.5 Dust formation . . . . . . . . . . . . . . . . . . . . . . 1-28
1.5 Wall conditioning . . . . . . . . . . . . . . . . . . . . . . . . . 1-291.5.1 Methods of wall conditioning . . . . . . . . . . . . . . 1-30
1.5.1.1 Baking . . . . . . . . . . . . . . . . . . . . . 1-301.5.1.2 Discharge cleaning in hydrogen and other re-
active gases . . . . . . . . . . . . . . . . . . . 1-301.5.1.3 Discharge cleaning in helium . . . . . . . . . 1-321.5.1.4 Metal film gettering . . . . . . . . . . . . . . 1-321.5.1.5 Plasma assisted deposition of thin films . . . 1-32
1.5.2 Discharge wall conditioning techniques . . . . . . . . . 1-331.5.2.1 Glow discharge conditioning . . . . . . . . . 1-341.5.2.2 Taylor cleaning discharges . . . . . . . . . . 1-351.5.2.3 Use of tokamak discharges for conditioning . 1-361.5.2.4 Ion cyclotron wall conditioning . . . . . . . . 1-361.5.2.5 Electron cyclotron wall conditioning . . . . . 1-371.5.2.6 Pulsed glow discharge conditioning . . . . . . 1-37
1.5.3 Wall conditioning in fully superconducting devices -ITER . . . . . . . . . . . . . . . . . . . . . . . . . . . 1-38
1.6 PhD overview . . . . . . . . . . . . . . . . . . . . . . . . . . . 1-39
2 Ion Cyclotron Wall Conditioning 2-12.1 Principle . . . . . . . . . . . . . . . . . . . . . . . . . . . . . . 2-12.2 State of the art and formulation of PhD objectives . . . . . . 2-3
2.2.1 Experimental results . . . . . . . . . . . . . . . . . . . 2-52.2.1.1 TORE SUPRA . . . . . . . . . . . . . . . . . 2-52.2.1.2 TEXTOR . . . . . . . . . . . . . . . . . . . . 2-62.2.1.3 ASDEX Upgrade . . . . . . . . . . . . . . . . 2-72.2.1.4 JET . . . . . . . . . . . . . . . . . . . . . . . 2-72.2.1.5 HT-7 . . . . . . . . . . . . . . . . . . . . . . 2-7
2.2.2 Formulation of experimental objectives . . . . . . . . . 2-82.2.3 Modeling of ICWC discharges . . . . . . . . . . . . . . 2-10
2.2.3.1 Wall conditioning efficiency . . . . . . . . . . 2-102.2.3.2 Steady state plasma parameters and wall flux2-11

Table of Contents v
2.2.3.3 Time dependent plasma parameters . . . . . 2-112.2.4 Formulation of modeling objectives . . . . . . . . . . . 2-12
2.3 RF physics aspects . . . . . . . . . . . . . . . . . . . . . . . . 2-132.3.1 RF systems in ICWC mode of operation . . . . . . . . 2-13
2.3.1.1 Important RF terms . . . . . . . . . . . . . . 2-142.3.1.2 Employed RF antennas in ICWC mode of
operation . . . . . . . . . . . . . . . . . . . . 2-152.3.1.3 Possible deleterious effects . . . . . . . . . . 2-17
2.3.2 From pre-wave ionization to plasma wave regime . . . 2-192.3.3 Antenna RF field components and absorption of RF
power . . . . . . . . . . . . . . . . . . . . . . . . . . . 2-202.3.4 Breakdown conditions . . . . . . . . . . . . . . . . . . 2-21
2.3.4.1 Dependency on RF field and frequency . . . 2-222.3.4.2 Dependency on pressure . . . . . . . . . . . . 2-25
2.3.5 Simulation of the initial breakdown phase . . . . . . . 2-262.3.5.1 Mean free path of electrons . . . . . . . . . . 2-262.3.5.2 Study of 1D electron distribution function
in the breakdown phase . . . . . . . . . . . . 2-262.3.6 Antenna coupling in ICWC mode of operation . . . . 2-32
2.3.6.1 Antenna kz spectrum . . . . . . . . . . . . . 2-332.3.6.2 Mode conversion scenarios . . . . . . . . . . 2-342.3.6.3 High harmonic scenarios . . . . . . . . . . . 2-35
2.4 Neutral cycle in vacuum vessel . . . . . . . . . . . . . . . . . 2-362.4.1 Vessel pressure evolution . . . . . . . . . . . . . . . . . 2-362.4.2 Pumping systems . . . . . . . . . . . . . . . . . . . . . 2-37
2.4.2.1 Turbomolecular pumps . . . . . . . . . . . . 2-382.4.2.2 Cryopumps . . . . . . . . . . . . . . . . . . . 2-382.4.2.3 Pumping systems on ITER . . . . . . . . . . 2-39
2.5 Characterization of wall flux . . . . . . . . . . . . . . . . . . . 2-40
3 ICRF plasma homogeneity and confinement properties 3-13.1 The magnetic field . . . . . . . . . . . . . . . . . . . . . . . . 3-23.2 Experimental observations on plasma homogeneity . . . . . . 3-4
3.2.1 Inhomogeneities in the plasma center . . . . . . . . . . 3-43.2.1.1 Vertical inhomogeneities . . . . . . . . . . . . 3-53.2.1.2 Radial inhomogeneities . . . . . . . . . . . . 3-8
3.2.2 Inhomogeneities at the edge of the plasma . . . . . . . 3-113.3 Confinement properties of toroidal magnetic field configurations3-13
3.3.1 Summary of confinement properties . . . . . . . . . . 3-153.3.2 Vertical drift . . . . . . . . . . . . . . . . . . . . . . . 3-153.3.3 Radial drift and outward plasma acceleration . . . . . 3-16
3.3.3.1 Radial drift . . . . . . . . . . . . . . . . . . . 3-163.3.3.2 Installation of steady state electric field . . . 3-183.3.3.3 Outward plasma acceleration and polariza-
tion drift . . . . . . . . . . . . . . . . . . . . 3-19

vi Table of Contents
3.3.4 Self consistent perpendicular electric field . . . . . . . 3-203.3.4.1 Total vertical current . . . . . . . . . . . . . 3-213.3.4.2 Self consistent electric field . . . . . . . . . . 3-21
3.3.5 Diffusion across the magnetic field . . . . . . . . . . . 3-233.3.6 Plasma confinement time . . . . . . . . . . . . . . . . 3-25
3.4 Conclusion . . . . . . . . . . . . . . . . . . . . . . . . . . . . 3-26
4 Assessment of the ICRF wall conditioning efficiency 4-14.1 H2 and H2/He-ICWC for isotopic exchange . . . . . . . . . . 4-2
4.1.1 Illustration and analysis of the isotopic exchange ef-ficiency on TORE SUPRA, TEXTOR, JET and AS-DEX Upgrade . . . . . . . . . . . . . . . . . . . . . . 4-24.1.1.1 TORE SUPRA . . . . . . . . . . . . . . . . . 4-24.1.1.2 TEXTOR . . . . . . . . . . . . . . . . . . . . 4-44.1.1.3 JET . . . . . . . . . . . . . . . . . . . . . . . 4-74.1.1.4 ASDEX Upgrade . . . . . . . . . . . . . . . . 4-10
4.1.2 Study of discharge gas retention . . . . . . . . . . . . 4-104.1.2.1 No long-term saturation of retention . . . . . 4-114.1.2.2 Retention by codeposition . . . . . . . . . . . 4-124.1.2.3 Retention due to energetic CX particles . . . 4-134.1.2.4 Recovery of retained particles by He-GDC . 4-15
4.1.3 Comparison with GDC . . . . . . . . . . . . . . . . . 4-164.1.3.1 Comparison of absolute removal rates . . . . 4-174.1.3.2 Particle recycling during GDC . . . . . . . . 4-184.1.3.3 Retention as a function of the reionization
probability . . . . . . . . . . . . . . . . . . . 4-194.1.3.4 Comparison GDC with optimized pulsed ICWC4-21
4.1.4 Pulsed ICWC . . . . . . . . . . . . . . . . . . . . . . . 4-224.1.5 Optimization of control parameters . . . . . . . . . . . 4-25
4.1.5.1 Efficiency as a function of power and pressure4-254.1.5.2 Efficiency as a function of magnetic fields . . 4-27
4.2 He-ICWC for fuel removal and recovery from disruptions . . . 4-284.2.1 Fuel removal . . . . . . . . . . . . . . . . . . . . . . . 4-284.2.2 Recovery from disruptions . . . . . . . . . . . . . . . . 4-304.2.3 Optimization of control parameters . . . . . . . . . . . 4-31
4.2.3.1 Efficiency as a function of the RF pulse length4-314.2.3.2 Efficiency as a function of the RF power . . 4-32
4.2.4 Comparison with other techniques . . . . . . . . . . . 4-324.2.5 Helium retention . . . . . . . . . . . . . . . . . . . . . 4-33
4.3 Removal of impurities and codeposited layers . . . . . . . . . 4-354.3.1 Carbon removal . . . . . . . . . . . . . . . . . . . . . . 4-354.3.2 Removal of marker gas: Argon . . . . . . . . . . . . . 4-384.3.3 Reduction of vessel oxygen content . . . . . . . . . . . 4-394.3.4 H2O removal on KSTAR . . . . . . . . . . . . . . . . . 4-41
4.4 Conclusion . . . . . . . . . . . . . . . . . . . . . . . . . . . . 4-42

Table of Contents vii
5 Kinetic Description of Hydrogen-Helium ICWC Plasmas 5-15.1 Model description . . . . . . . . . . . . . . . . . . . . . . . . . 5-1
5.1.1 Overview of the balance equations . . . . . . . . . . . 5-15.1.2 Elementary processes in hydrogen-helium plasmas . . 5-3
5.1.2.1 Inelastic electron impact reactions . . . . . . 5-35.1.2.2 Inelastic ion impact reactions . . . . . . . . . 5-65.1.2.3 Elastic processes . . . . . . . . . . . . . . . . 5-7
5.1.3 Particle residence times and edge conditions . . . . . . 5-105.1.3.1 Neutral wall fluxes . . . . . . . . . . . . . . . 5-105.1.3.2 Ion wall fluxes . . . . . . . . . . . . . . . . . 5-105.1.3.3 Electron losses . . . . . . . . . . . . . . . . . 5-115.1.3.4 Particle recycling . . . . . . . . . . . . . . . 5-12
5.1.4 Gas injection and active pumping . . . . . . . . . . . . 5-145.1.5 Coupled power . . . . . . . . . . . . . . . . . . . . . . 5-15
5.1.5.1 RF power coupling . . . . . . . . . . . . . . . 5-155.1.5.2 Breakdown phase and α-scaling . . . . . . . 5-16
5.1.6 Impurities . . . . . . . . . . . . . . . . . . . . . . . . . 5-175.2 Modeling results . . . . . . . . . . . . . . . . . . . . . . . . . 5-20
5.2.1 Discussion on elementary reactions . . . . . . . . . . . 5-205.2.2 Plasma characteristics as a function of the electron
temperature . . . . . . . . . . . . . . . . . . . . . . . . 5-225.2.2.1 Pure hydrogen plasma . . . . . . . . . . . . . 5-225.2.2.2 Pure helium plasma . . . . . . . . . . . . . . 5-225.2.2.3 Hydrogen-helium mixtures . . . . . . . . . . 5-23
5.2.3 Plasma characteristics as a function of the dischargepressure, coupled power and H2/He gas mixture . . . 5-245.2.3.1 TEXTOR H2-ICWC discharges . . . . . . . 5-245.2.3.2 TORE SUPRA He-ICWC discharges . . . . 5-275.2.3.3 TEXTOR H2/He-ICWC discharges . . . . . 5-28
5.2.4 Time dependent simulation of a TORE SUPRA H2-ICWC discharge . . . . . . . . . . . . . . . . . . . . . 5-30
5.3 Conclusion . . . . . . . . . . . . . . . . . . . . . . . . . . . . 5-32
6 Simulation of wall interaction 6-16.1 Model description . . . . . . . . . . . . . . . . . . . . . . . . . 6-2
6.1.1 Plasma description . . . . . . . . . . . . . . . . . . . . 6-26.1.2 Wall description . . . . . . . . . . . . . . . . . . . . . 6-3
6.1.2.1 Experimental facts . . . . . . . . . . . . . . . 6-36.1.2.2 Formulation of reservoir model . . . . . . . . 6-5
6.1.3 Diffusion in wall . . . . . . . . . . . . . . . . . . . . . 6-76.2 Summary of the model equations . . . . . . . . . . . . . . . . 6-8
6.2.1 Plasma equations . . . . . . . . . . . . . . . . . . . . . 6-86.2.1.1 Molecules in plasma . . . . . . . . . . . . . . 6-86.2.1.2 Atoms in plasma . . . . . . . . . . . . . . . . 6-96.2.1.3 Ions in plasma . . . . . . . . . . . . . . . . . 6-10

viii Table of Contents
6.2.2 Wall equations . . . . . . . . . . . . . . . . . . . . . . 6-106.2.2.1 Atoms in accessible reservoir . . . . . . . . . 6-106.2.2.2 Atoms in trapped reservoir . . . . . . . . . . 6-116.2.2.3 Atoms in overflow reservoir . . . . . . . . . . 6-116.2.2.4 Diffusing atoms . . . . . . . . . . . . . . . . 6-12
6.3 Simulation of TORE SUPRA discharges with plasma current 6-126.3.1 Long plasma discharges: TORE SUPRA 32298-32300 6-136.3.2 Natural plasma density . . . . . . . . . . . . . . . . . 6-14
6.4 Simulation of TORE SUPRA H2-ICWC discharges . . . . . . 6-166.4.1 Isotopic exchange experiment with pulsed discharges . 6-166.4.2 Optimization of TORE SUPRA pulsed H2-ICWC dis-
charges . . . . . . . . . . . . . . . . . . . . . . . . . . 6-176.4.2.1 Pulse length . . . . . . . . . . . . . . . . . . 6-186.4.2.2 Pumping time . . . . . . . . . . . . . . . . . 6-196.4.2.3 Pumping speed . . . . . . . . . . . . . . . . . 6-20
6.5 Discussion . . . . . . . . . . . . . . . . . . . . . . . . . . . . . 6-216.6 Conclusion . . . . . . . . . . . . . . . . . . . . . . . . . . . . 6-23
7 Extrapolation to ITER 7-17.1 ITER ICWC aims . . . . . . . . . . . . . . . . . . . . . . . . 7-17.2 Extrapolation of experimental results . . . . . . . . . . . . . . 7-2
7.2.1 General considerations . . . . . . . . . . . . . . . . . . 7-27.2.2 Discharge and wall flux homogeneity . . . . . . . . . . 7-3
7.2.2.1 Plasma homogeneity . . . . . . . . . . . . . . 7-37.2.2.2 Wall flux homogeneity . . . . . . . . . . . . . 7-5
7.2.3 He-ICWC . . . . . . . . . . . . . . . . . . . . . . . . . 7-67.2.4 D2-ICWC . . . . . . . . . . . . . . . . . . . . . . . . . 7-7
7.3 Implementing ICWC in the ITER operation cycles . . . . . . 7-8
8 Conclusion 8-1
References 9-1
A Schemes of tokamak main systems A-1A.1 TORE SUPRA . . . . . . . . . . . . . . . . . . . . . . . . . . A-1A.2 TEXTOR . . . . . . . . . . . . . . . . . . . . . . . . . . . . . A-3A.3 JET . . . . . . . . . . . . . . . . . . . . . . . . . . . . . . . . A-4A.4 ASDEX Upgrade . . . . . . . . . . . . . . . . . . . . . . . . . A-5
B ICWC diagnostics B-1B.1 Neutral gas diagnostics . . . . . . . . . . . . . . . . . . . . . . B-1
B.1.1 Pressure measurements . . . . . . . . . . . . . . . . . B-2B.1.2 Mass spectrometry . . . . . . . . . . . . . . . . . . . . B-3
B.1.2.1 Principle of quadrupole mass spectrometry . B-3B.1.2.2 Calibration of a quadrupole mass spectrometerB-6

Table of Contents ix
B.1.3 Other residual gas analysis systems . . . . . . . . . . . B-9B.1.3.1 Penning gauge spectroscopy . . . . . . . . . B-9B.1.3.2 Gas chromatography . . . . . . . . . . . . . . B-10
B.2 Plasma diagnostics . . . . . . . . . . . . . . . . . . . . . . . . B-11B.2.1 Interferometry . . . . . . . . . . . . . . . . . . . . . . B-11B.2.2 Reflectometry . . . . . . . . . . . . . . . . . . . . . . . B-12B.2.3 Electron cyclotron emission (ECE) . . . . . . . . . . . B-12B.2.4 Langmuir probes . . . . . . . . . . . . . . . . . . . . . B-12B.2.5 Retarding field analyzer . . . . . . . . . . . . . . . . . B-14B.2.6 Visual imaging . . . . . . . . . . . . . . . . . . . . . . B-15B.2.7 Spectroscopy . . . . . . . . . . . . . . . . . . . . . . . B-15B.2.8 Lithium beam spectroscopy . . . . . . . . . . . . . . . B-16B.2.9 Neutral particle analyser . . . . . . . . . . . . . . . . . B-16
C Appendix to chapter 5 C-1C.1 Benefits and limitations of a 0D approach . . . . . . . . . . . C-1
C.1.1 Homogeneity . . . . . . . . . . . . . . . . . . . . . . . C-1C.1.2 Fast particles . . . . . . . . . . . . . . . . . . . . . . . C-2C.1.3 Plasma breakdown phase . . . . . . . . . . . . . . . . C-4C.1.4 Wall conditioning efficiency . . . . . . . . . . . . . . . C-5
C.2 Figures reaction rates . . . . . . . . . . . . . . . . . . . . . . C-5C.3 Relation particle confinement and energy confinement . . . . C-14


List of Acronyms
0-9
0D Zero Dimensional1D One Dimensional
A
ALT Advanced Limiter Test (toroidal limiter on TEX-TOR)
Ar ArgonAUG ASDEX Upgrade (Axially Symmetric Divertor EX-
periment), Garching, Germany
B
B BoronBe Beryllium
C
C CarbonCCD Charge-Coupled DeviceCFC Carbon Fibre CompositesCS Central SolenoidCX Charge exchange

xii List of Acronyms
D
D DeuteriumD-IIID Doublet III-Divertor experiment, San Diego, USA
DC-GDC Direct Current GDCDCN Molecule used to produce laser light in the far
infraredDEMO Demonstration Fusion Power Plant
E
EAST Experimental Advanced Superconducting Toka-mak (also called HT-7U), Hefei, China
ECE Electron Cyclotron EmissionECR Electron Cyclotron ResonanceECRF Electron Cyclotron Range of FrequenciesECRH Electron Cyclotron Resonance HeatingECWC Electron Cyclotron Wall ConditioningEFDA European Fusion Development AgreementEM Electromagnetic
F
FS Faraday screenFW Fast Wave
G
GDC Glow Discharge Conditioning
H
H Hydrogen

List of Acronyms xiii
HCN Molecule used to produce laser light in the farinfrared
He HeliumHFS High Field SideHT-7 Hefei Tokamak-7, Hefei, China
I
IBW Ion Bernstein WaveICRF Ion Cyclotron Range of FrequenciesICRH Ion Cyclotron Resonance HeatingICWC Ion Cyclotron Wall ConditioningIO ITER OrganizationIR InfraredITER International Thermonuclear Experimental Reac-
tor, Cadarache, France
J
JAERI Japan Atomic Energy Research InstituteJET Joint European Torus, Culham, UKJFT-2 JAERI Fusion Torus-2, JapanJT-60SA JAERI Tokamak - 60 Super Advanced, Naka, Japan
JT-60U JAERI Tokamak - 60 Upgrade (Currently up-graded to JT-60SA), Naka, Japan
K
KSTAR Korea Superconducting Tokamak Advanced Re-search, Daejon, Korea
L
LCFS Last Closed Flux SurfaceLFS Low Field Side

xiv List of Acronyms
LH Lower Hybrid (heating)LHD Large Helical Device, Toki, Japan
M
MC Mode Conversion
N
N NitrogenNPA Neutral Particle Analyzer
O
O Oxygen
P
P-GDC Pulsed GDCPFC Plasma Facing ComponentsPL Pulse Length, RF discharge pulse lengthPSI Plasma Surface InteractionsPT Pumping Time, time between two RF discharge
pulsesPWI Plasma Wall Interactions
Q
QMS Quadrupole Mass Spectrometer
R
List of Acronyms xv
RC Radiative-collisionalRF Radio FrequencyRFA Retarding Field Analyzerrhs right hand sideRMS Root Mean Square
S
Si SiliciumSOL Scrape Off LayerSW Slow Wave
T
T TritiumTDC Taylor Discharge CleaningTEXTOR Tokamak Experiment for Technology Oriented Re-
search in the field of plasma wall interaction, Jülich,Germany
TF Toroidal FieldTOMAS TOroidal MAgnetic field System, Jülich, Germany
TORE SUPRA Superconducting tokamak, in operation since 1988in Cadarache, France
TRIAM-1M Tokamak of Research Institute for Applied Me-chanics, Kyushu University, Japan
V
VSWR Voltage Standing Wave Ratio
W
W TungstenW7-AS Wendelstein 7 - Advanced Stellarator (currently
upgrading to W7-X), Greifswald, Germany

xvi List of Acronyms
W7-X Wendelstein 7X, under construction, Greifswald,Germany

Nederlandse samenvatting–Summary in Dutch–
InleidingEnergie uit magnetische fusie is een veelbelovend alternatief voor huidigebroeikasgas-uitstotende energietechnologieën. Fusie is inherent veel vei-liger dan de energieproductie uit kernsplijting, en in tegenstelling tot degenoemde technologieën is de brandstof voor fusie overvloedig beschikbaar.Het ambitieuze wereldwijde ITER-project is momenteel het toonaangevendeonderwerp in het onderzoek naar magnetische fusie. Het doel van het projectis aantonen dat commerciele energieproductie uit fusie mogelijk is. ITERis namelijk ontworpen om vijf tot tien maal het ingangsvermogen te produ-ceren voor een duur van maximaal 1000 seconden. In geval van succes, zalhet ITER-project worden opgevolgd door een industrieel demonstratiereac-torproject: DEMO (anno 2030-2040).
Energie uit kernfusie wordt geproduceerd door het samensmelten vanlichte atoomkernen in zwaardere kernen. Deze samensmelting is het ge-volg van de nucleaire aantrekkingskracht en wordt bereikt door het zeerdicht bij elkaar brengen van positief geladen kernen, zodat de aantrek-kende kernkracht groter wordt dan de afstotende elektrostatische Coulomb-kracht. Om de Coulomb-barrière te overbruggen zijn er hoge energiën inde orde van miljoenen Kelvin vereist. Het huidige onderzoek naar fusie-energie baseert zich op de deuterium-tritium (D-T) reactie, beide isoto-pen van waterstof, waarbij een (niet radioactieve) heliumkern en een neu-tron geproduceerd worden met een gecombineerde energie van 17.6 MeV:D + T→ 4He (3.5 MeV) + n (14.1 MeV). Bij de vereiste temperaturen zul-len de deuterium en tritium ‘brandstof’-moleculen opgesplitst zijn in hunsamenstellende atomen. De atomen op hun beurt zullen worden geïoniseerd,hetgeen van brandstof een gas van geladen deeltjes maakt, namelijk eenplasma met positieve ionen (kernen) en negatieve elektronen. Het plasmavan een energie-efficiënte fusiereactor moet een voldoende aantal fusiereac-ties voortbrengen (1 GW fusie-energie is gelijk aan 3.5 ·1020 D-T reacties perseconde), en de vrijgekomen energie moet hoger zijn dan de externe energiedie nodig is om het plasma op te warmen. De toestand waarin het plasmazichzelf verwarmt door fusiereacties zodat externe verwarming kan worden

xviii Nederlandse Samenvatting
uitgeschakeld heet ‘ontsteking’. Het criterium om ontsteking te bekomenwordt uitgedrukt door het ‘drievoudige product’: neTτE ≥ 3·1021 m−3keVs,waarbij ne de plasma-elektron dichtheid is, T de plasma temperatuur en τEde energie-opsluitingstijd, een maat voor de snelheid waarmee het systeemenergie verliest aan zijn omgeving. Het magnetische fusieonderzoek richtzich op het benaderen van de ontstekingsconditie door het opsluiten vanhet plasma (ne = 1020 m−3) in een torusvormige fles gevormd door magne-tische velden hetgeen een hoge energie-opsluitingstijd (τE = 3 s) voorziet enhet plasma op zeer hoge temperatuur kan vasthouden (T = 10 keV ≈ 108 K).
De tokamak magnetische opsluitingsconfiguratie is reeds met succes ge-bruikt om fusiereacties te produceren en is op dit moment de methode diehet meest bestudeerd wordt. De magnetische configuratie van een tokamakbestaat uit schroefvormige magnetische veldlijnen die samen een torus be-schrijven bestaande uit concentrische magnetische oppervlakken. De toroi-dale veldcomponent van de configuratie wordt gegenereerd door een reekspoloïdale spoelen die de plasmatorus omhullen. Een eerste poloïdaal mag-netisch veldcomponent wordt geproduceerd door een intense axiale stroomin het torusvormige plasma zelf, opgewekt door inductie zoals in een trans-formator. Een tweede poloïdale veldcomponent, gebruikt om een stabielplasma evenwicht te verkrijgen en om de vorm van de magnetische opper-vlakken te optimaliseren, wordt geproduceerd door toroïdale spoelen. Deexperimenten die in dit proefschrift gepresenteerd worden zijn uitgevoerdop de Europese tokamaks TORE SUPRA (IRFM, CEA/Cadarache, Frank-rijk), TEXTOR (IPP-Jülich, Duitsland), ASDEX Upgrade (IPP-Garching,Duitsland) en JET (CCFE, Verenigd Koninkrijk), en kaderen in de voorbe-reiding van de ITER-tokamak ingebruikname.
Voor het opvangen en het onttrekken van de plasma-warmtebelastingop onvermijdelijke snijpunten van de buitenste magnetische veldlijnen ende wand zijn er speciale objecten geplaatst op de wand van bovenstaandetokamaks. In een limiter-tokamak (TORE SUPRA, TEXTOR) wordt derand van het opgesloten plasma (waar de magnetische oppervlakken geslotenzijn) bepaald door een toroidaal oppervlak dat het eerste vaste materiaalop-pervlak is die de veldlijnen onderschept, gezien vanuit het plasma-centrum.Een fusiereactor kan geen beroep doen op deze configuratie omdat de warm-tebelasting op dit begrenzend oppervlak en de productiesnelheid van onzui-verheden ontoelaatbaar hoog zou zijn. In de divertor configuratie (ASDEXUpgrade, JET), is het laatste gesloten magnetisch oppervlak uitsluitendbepaald door de magnetische veldlijnen zelf. De eerste vaste materiaalcom-ponent, de divertortarget, bevindt zich op enige afstand van het laatstegesloten magnetisch oppervlak, zodat onzuiverheden moeilijker tot in hetplasmacentrum kunnen doordringen. ITER is ontworpen met de divertorconfiguratie.
De prestatie van het centrale tokamakplasma is sterk afhankelijk vanzijn interactie met de plasmarand en met de plasma-blootgestelde compo-nenten (PFC’s). Fundamentele plasma-wandinteractieprocessen zoals erosie

Summary in Dutch xix
(sputteren en chemische erosie), implantatie, trapping, depositie, adsorptieen desorptie kunnen het vrijkomen van wandmateriaal veroorzaken en dusonzuiverheden introduceren in het plasma (desorptie van onzuiverheden),netto brandstof retentie of vrijgave door de wand veroorzaken (brandstofrecycling), en degradaties van de wandmaterialen induceren. Productie vanplasma-onzuiverheden dient te worden vermeden omdat dit het plasma af-koelt door straling, het plasma verdunt met als gevolg een vermindering vande fusie-energie, de stabiliteit van het plasma verlaagt, de totale energie-opsluitingstijd vermindert en verdere productie van onzuiverheden versnelt.Sterke brandstofvrijgave door de wanden dient te worden vermeden om-dat dit plasmaproductie en de controle van de plasmadichtheid onmogelijkkan maken. Hoge retentie van brandstof is ook problematisch omdat wordtgeschat dat door deze opname de administratieve toelaatbare grens toege-schreven aan de retentie van tritium in ITER, ingesteld op 640 g, kan wordenbereikt in minder dan één ITER-DT-exploitatie jaar. Om de ITER ‘levens-duur’ te verlengen dient de tritium inventarisopbouw, te wijten aan retentievan brandstof door implantatie en codepositie, dus beperkt te worden.
Om de beschreven plasmawandinteracties en de tritium inventarisop-bouw te controleren zijn er drie actoren: (1) optimale keuze van de wand-materialen, (2) optimale selectie van de tokamak magnetische configuratie,zoals divertor, limiters, en de exploitatieregimes en (3) de controle van destaat van de wandoppervlakken. Dit proefschrift richt zich op de derde ac-tor, namelijk wandconditionering. In de huidige tokamaks worden er eenreeks wandconditioneringstechnieken gebruikt om de wanden in de gewenstetoestand te brengen. De ITER-relevante technieken zijn (a) verwarming vande wandmaterialen (Baking) om thermische desorptie van deeltjes te indu-ceren. Baking is een efficiënte maar tijdrovende procedure (orde van da-gen). Om de tritiuminventaris in ITER te verminderen wordt de benodigdebaking-frequentie geschat op 2 tot 8 keer per jaar. (b) Glimontladingscon-ditionering (GDC), is een routine-conditioneringstechniek op vrijwel allefusie-apparaten. Het is aangetoond dat GDC inefficiënt is in aanwezig-heid van het toroïdaal magnetisch veld. In supergeleidende tokamaks zoalsITER, waar het toroïdale magnetisch veld steeds aanwezig zal zijn gedu-rende de operationele cycli (periodes van de orde van weken), zal de toe-passing van GDC dus beperkt zijn tot shut-down periodes. (c) Het gebruikvan tokamak plasma-ontladingen voor conditioneren (scannen van de se-paratrix en gecontroleerde plasmadisrupties), hetgeen apparte ontladingenzou kunnen vereisen aangezien de controle van de ontladingsbeëindiging inITER DT-plasma’s als subtiel en fragiel wordt beschouwd. (d) Ion-cyclotronwandconditionering (ICWC), het hoofdonderwerp van dit proefschrift, enmomenteel de meest belovende techniek om te worden ingezet op ITER tij-dens de operationele cycli (dus in aanwezigheid van het magnetisch veld).(e) Electron-cyclotron wandconditioneringsontladingen (ECWC), geprodu-ceerd in aanwezigheid van het toroïdale magnetische veld door het koppe-len van RF-golven in het elektron-cyclotron frequentiebereik, met behulp

xx Nederlandse Samenvatting
van de standaard tokamak elektron-cyclotron verwarmingssystemen. Detechniek blijkt minder efficiënt te zijn dan ICWC en GDC, en bovendienis de poloïdale ontladingshomogeniteit onvoldoende. (f) Gepulseerde gli-montladingsconditionering (P-GDC), waarbij de ontladingen geproduceerdworden door gebruik te maken van de conventionele GDC elektroden gekop-peld aan een hoge frequentie voedingsbron. Deze recente techniek vereistverdere onderzoeks- en ontwikkelingsinspanningen op meerdere machines,om de homogeniteit te optimaliseren, de efficiëntie te demonstreren, en detoepasbaarheid voor ITER te beoordelen.
De kwalificatie van wandconditioneringsontladingen toepasbaar in aan-wezigheid van het toroïdale magnetisch veld voor inter-shot conditioningen conditionering gedurende de nachten tijdens de ITER-operationale cy-cli, wordt beschouwd als een prioriteitsonderwerp in de voorbereiding vande expoitatie van ITER. De conditioneringsontladingen zijn noodzakelijkom de tritium-inventarisopbouw verminderen, om de vereiste lage brand-stofrecycling te voorzien tijdens de plasmaopstartfase en om onzuiverheden(en brandstof) te verwijderen na plasmadisrupties. Omdat ICWC met suc-ces getest is op verschillende tokamaks en gunstige kenmerken vertoont invergelijking met ECWC, is het opgenomen in de functionele projectvereis-ten. Dit proefschrift kadert in het R&D-programma rond ICWC dat alsdoel heeft de ICWC-techniek te consolideren en de toepasselijkheid ervanop ITER, en mogelijk andere toekomstige machines, te kwalificeren.
ICWC principeICWC, toegepast in aanwezigheid van het toroïdale magnetisch veld, maaktgebruik van vier voorname tokamaksystemen: de ICRF antennes om de con-ditioneringsontlading te initiëren en te ondersteunen, de gasinjectieventielenom het ontladingsgas te voorzien, de vacuümsystemen om gedesorbeerdedeeltjes van de wand uit de machine te pompen, en het poloïdaal magne-tisch veld-systeem om de ontladingshomogeniteit te optimaliseren. Daar-naast zijn er ook gas- en plasmadiagnostieken nodig om de plasmaontladingen de conditioneringsefficiëntie te diagnosticeren.
ICRF ontladingproductie kan worden onderverdeeld in de pre-golf faseen de plasmagolf fase. De ontladingsintiatiefase komt overeen met de pre-golffase. De plasmadichtheidsopbouw in de ontladingsintiatiefase is het ge-volg van botsingsionisatiereacties door elektronen versneld in het parallelelektrisch veld in nabijheid van de antennes. In de golffase breidt het elektro-magnetische veld zich uit in het vacuümvat waardoor meer ruimte-ionisatiemogelijk wordt. In deze fase wordt het RF-vermogen voornamelijk collisio-neel geabsorbeerd door elektronen. Antenne-operatiescenarios zijn geïden-tificeerd die de plasma-doorbreek tijd, de RF-vermogenkoppelingsefficiëntieen de plasmahomogeniteit verbeteren. Deze bestaan ofwel uit het verla-gen van de cut-off dichtheid voor snelle golf (FW) propagatie, namelijk de

Summary in Dutch xxi
werking dichtbij monopoolfasering van de antennestraps en/of werking bijhoge harmonische cyclotronnummers (bijv. bij sterk gereduceerde toroïdaalmagnetische veldwaarden), of zijn gebaseerd op mode-conversiescenario’svan de exponentieel dalende FW in de langzame golf of ion-Bernsteingolf inplasma’s met meerdere ionsoorten (hetgeen het geval is in ICWC plasma’s).Er werd geconcludeerd dat voor ICRF plasmaproductie, monopoolstrap-fasering van de ICRF antennes het optimale operatiescenario is.
De geproduceerde plasmas doelen op het creëren van een gecontroleerdeflux van deeltjes naar de wandoppervlakken om het verwijderen van onzui-verheden, de erosie van gecodepositioneerde lagen, de brandstofdesatura-tie van de wandopervlakken, of het veranderen van hun isotoopverhoudingte bewerkstelligen. Voor het ontladingsgas, gevoed via de injectieventie-len, kan men kiezen voor inerte (bijv. He) of reactieve gassen (bijv. H2,D2, O2), afhankelijk van het conditioneringsdoel. De deeltjes die intenti-oneel worden vrijgemaakt uit de wandoppervlakken dienen verwijderd teworden uit het vacuümvat. Hiervoor worden de standaard vacuümpompengebruikt die continu operationeel zijn om vereiste vacuümvoorwaarden tebieden. Om een hoog conditioneringsrendement mogelijk te maken dient devacuümpompsnelheid zo hoog mogelijk te zijn. De efficiëntie van de con-ditioneringstechniek voor het verwijderen van deeltjes uit de oppervlakkenen vervolgens deze deeltjes te verwijderen uit het vacuümvat, kan wordenbeoordeeld via verschillende diagnostische systemen waaronder de belang-rijkste de gasanalysesytemen zijn (bijv. drukmetingen, massaspectrometrie,...).
PhD doelstellingenDe experimentele doelstelling van dit proefschrift is de studie en de opti-malisatie van ICWC op meerdere tokamaks, TORE SUPRA, TEXTOR,ASDEX Upgrade en JET, hetgeen het testen van de conditioneringstech-niek toelaat onder meerdere condities (verschillende antennesystemen enbeschikbare frequenties, verschillende tokamakafmetingen, limiter- en diver-torconfiguraties, koolstof-PFC’s en wolfraam-PFC’s). Omdat waterstof enhelium voorlopig de meest geschikte conditioneringsgassen zijn voor ITER(bijv. O2-ontladingen zijn niet toegestaan tijdens de DT-fase) is het on-derzoek gelimiteerd tot waterstof en helium ICWC-ontladingen. ICWC-ontladingen zijn toroïdaal homogeen maar poloïdaal inhomogeen. De me-chanismen die deze inhomogeniteiten veroorzaken dienen bepaald te worden,en methoden om de poloïdale homogeniteit te verbeteren dienen gevondente worden. Ook de homogeniteit van de deeltjesflux naar de wand dientte worden beschouwd. Hiervoor moeten de belangrijkste fluxcomponentenworden gekarakteriseerd. Het effect van deze wandfluxcomponenten op deconditioneringsefficiëntie, en hun afhankelijkheden van de ontladingscontro-leparameters dienen onderzocht te worden. De studie van H2-ICWC (en

xxii Nederlandse Samenvatting
He/H2-ICWC) omvat het bestuderen van het vermogen van de techniekom de wand-isotoopverhouding te veranderen en gecodepositioneerde lagen(tritium verwijdering) te verwijderen. De studie van He-ICWC omvat hettesten van het vermogen van de techniek om de brandstofconcentratie inde wand te verminderen (desaturatie), evenals het aantonen van de opera-tionele effectiviteit van He-ICWC om de normale werking te herstellen natokamak-plasmadisrupties en om de basisdrukniveaus van onzuiverheden teverlagen. Voor zowel H2 als He-ICWC dient de conditioneringsefficiëntie-afhankelijkheid van de ontladings-controleparameters (druk, RF-vermogen,toroïdale en poloïdale magnetische veldsterktes, vacuümpompsnelheid, ...)te worden behandeld, evenals de evolutie in de tijd, en het voordeel vangepulste ontladingen ten opzichte van continue RF-ontladingen. De ICWCefficiëntie om onzuiverheden te verwijderen dient te worden onderzocht, ende algemene efficiëntie van ICWC dient te worden vergeleken met anderetechnieken (GDC, Taylor conditioneringsontladingen (TDC)). Ook dient erervaring te worden opgebouwd met betrekking tot de veilige werking vande ICRF antenne-installaties.
De ontwikkeling van modellen kunnen tot belangrijke inzichten leiden.Om het inzicht in ICWC te vergroten en om de bestaande modellen te ve-rifiëren, werden de volgende modelleringsdoelstellingen vooropgesteld. Eenbestaande 0D ICRF plasmacode voor atomaire waterstof dient te wordenopgewaardeerd naar een beschrijving voor moleculair waterstof en helium.De implementatie van moleculair waterstof is noodzakelijk door de lagetemperatuur van het plasma en de daarmee verband houdende onvolledigeionisatie van het neutrale gas. Het ontwikkelde model moet worden verge-leken met experimentele data van TORE SUPRA en TEXTOR, en moetde experimenten aanvullen met gegevens die niet gemeten kunnen worden.Het model dient de experimentele plasmadichtheden te reproduceren (debeschikbare elektron-temperatuursmetingen worden onbetrouwbaar geachtbij de typische lage temperaturen). Oorzaken van verschillen tussen hetmodel en experimenten dienen onderzocht te worden. Wanneer de plasma-dichtheden en hun afhankelijkheden van de ontladingscontroleparametersmet voldoende nauwkeurigheid gereproduceerd kunnen worden, kunnen debelangrijkste plasmaparameters en wandfluxen worden geïdentificeerd. Degemodelleerde wandfluxen dienen te worden vergeleken met experimenteledata. Om beter inzicht te verkrijgen in de plasma-wandinteractie (PWI),de ‘uit de machine gepompte’ fluxen, de wand-gedesorbeerde fluxen en dewand-bombarderende fluxen, dienen deze aan elkaar te worden gerelateerd.Om de experimentele isotoopuitwisselingsresultaten te interpreteren en omgeoptimaliseerde ontladingsscenario’s voor te kunnen stellen, dient er eenmodel te worden beoogd dat de 0D plasmacode voor waterstof koppelt meteen minimumbeschrijving van de plasma-wandinteractie.
Om de toepasbaarheid van ICWC op ITER te beoordelen dienen de ver-kregen resultaten tenslotte geëxtrapoleerd te worden naar ITER en dienenmogelijke implementaties van de techniek op ITER besproken te worden.

Summary in Dutch xxiii
OntladingshomogeniteitHet tot stand brengen van homogene RF-conditioneringsontlading is nood-zakelijk om te garanderen dat het maximum van het wandoppervlak effec-tief geconditioneerd wordt. Het is aangetoond dat de waargenomen radi-ale inhomogeniteiten kunnen worden verklaard in termen van RF-vermogenabsorptie-eigenschappen, en dat de verticale inhomogeniteiten te wijten zijnaan de opsluitingseigenschappen van de magnetische configuratie. Het iswaargenomen dat dicht bij de wanden, in regio’s waar de magnetische veld-lijnen worden gelimiteerd door wandstructuren zoals poloïdale begrenzers,de plasmadichtheid exponentieel afneemt, hetgeen het bestaan van een plas-marand in ICRF ontladingen aantoont. Als gevolg van deze rand zal de fluxvan geladen deeltjes, getransporteerd langs de magnetische veldlijnen, hetgrootst zijn op de eerste limiterende oppervlakken. Om een radiaal homo-gene RF ontlading te verkrijgen is een goede propagatie van de RF-golven,of minstens een grote verval lengte van het evanescente RF-veld vereist,zodat het plasma ook aan de sterke magnetische veldzijde (aan de cen-trale kolom van de torus) ondersteund wordt. Door het toepassen van eenklein verticaal magnetisch veld dat het plasma in de verticale richting uit-strekt, kan de verticale homogeniteit worden verbeterd. Uit experimentenop JET, momenteel de grootste tokamak, uitgevoerd met ITER-gelijkendeontladingscontroleparameters blijkt de haalbaarheid van het homogeen vul-len van de gehele vacuümvat met plasma: bij het opereren van de antennemet monopool strapfasering en bij de toepassing van een klein verticaalmagnetisch veld werd er felle recyclingstraling waargenomen, zowel in denabijheid van de centrale kolom aan de hoge magnetische veldkant en inhet divertorgebied.
ConditioneringsefficiëntieOm de efficiëntie van ICWC te bestuderen en te optimaliseren werden ex-perimenten uitgevoerd op TORE SUPRA, TEXTOR, JET en ASDEX Up-grade. (1) De isotopenuitwisselingsefficiëntie van H2 en H2/He-ontladingenis onderzocht, (2) het rendement voor wand-desaturatie en herstel van toka-mak operatie na plasmadisrupties met behulp van He-ontladingen is bestu-deerd, en (3) de efficiëntie van ICWC voor het verwijderen van onzuiverheidis geanalyseerd.
Waterstof-ICWC is in staat om de wandoppervlaktetoestand te verande-ren op korte tijdschaal (verwijdering van waterstofmonolagen binnen enkeleminuten), zowel op koolstof machines TORE SUPRA, TEXTOR en JETals op de wolfraam tokamak ASDEX Upgrade. Het verwijderen van de wan-disotopen kan gaan ten koste van een tot tien keer hogere ontladingsgasre-tentie. In isotoopuitwisselingsexperimenten is de ideale verhouding tussenretentie en recuperatie van deeltjes gelijk aan één. Er werd experimenteel

xxiv Nederlandse Samenvatting
aangetoond dat deze verhouding aanzienlijk kan worden verbeterd door hetoptimaliseren van de RF-duty cycle. De ideale verhouding van één werdbereikt zowel op TORE SUPRA als op TEXTOR.
De retentieoorzaken werden onderzocht: door de gecombineerde expe-rimentele resultaten inzake (i) het lange termijn retentiegedrag op TORESUPRA, (ii) retentie op de wolfraam machine ASDEX Upgrade, (iii) reten-tie als functie van aanwezigheid en afwezigheid van resonante IC-absorptie(hetgeen een energetische flux van CX deeltjes veroorzaakt) op TEXTOR,(iv) retentie in vergelijking met de totale energetische CX flux op JET,(v) recuperatie van wanddeeltjes door GDC, werd de hypothese gemaaktdat ICWC-ontladingen wandoppervlakgebieden bereikt die niet toeganke-lijk zijn door GDC. Ook het bestaan van een substantiële niet-resonanteionen-wandfluxcomponent met energieën boven de typische GDC-wandflux,waardoor de retentie in de diepere lagen mogelijk is, kan op dit momentniet worden uitgesloten. Beide punten dienen nader bestudeerd te worden.
Een uitgebreide vergelijking van de isotoopuitwisselingsefficiëntie vanICWC en GDC op TORE SUPRA en TEXTOR leerde dat de gemetenhoge retentie tijdens ICWC-ontladingen kan worden opgevat als een effectvan de hoge reionisatiewaarschijnlijkheid (voornamelijk als gevolg van dehogere elektronendichtheid in ICWC-ontladingen): de probabiliteit dat eenneutrale molecule wordt geïoniseerd of gedissocieerd in plaats van verwij-derd door de vacuümpompen. Dus de verwijderingsefficiëntie van wand-gedesorbeerd deeltjes door de vacuümpompen is minder efficiënt in ICWCdan in GDC. Dit maakt dat, zelfs als slechts een zeer klein deel van de wand-flux permanent in de wand blijft, de hoge wandfluxen tijdens ICWC en delage pompefficiëntie kan leiden tot een retentiesnelheid dat vergelijkbaar ismet de verwijderingssnelheid door de vacuümpompen. Omdat reionisatie ende wandfluxretentie enkel optreden tijdens een plasma-ontlading, en omdatwerd aangetoond dat het grootste deel van het wandgedesorbeerde gas ver-wijderd wordt na de RF puls, vermindert het gebruik van kortere RF-pulsen(∼ 1 s), met voldoende tijd tussen de pulsen zodat wandgedesorbeerde deel-tjes kunnen verwijderd worden door de pompen (∼ 20 s op TORE SUPRA),de retentie zonder de totale hoeveelheid verwijderde deeltjes ernstig te ver-lagen.
Het is aangetoond dat de efficienctie van waterstof-ICWC groter is bijhogere druk en bij het verhogen van het RF-vermogen. Het ideale RF-vermogen is echter het vermogen waarbij de ontladingen geproduceerd kun-nen worden op de meest betrouwbare wijze met betrekking tot de antenne-werking, en waarbij de ontlading het meest homogeen is. De energetischeCX-wandflux blijkt slechts een geringe invloed te hebben op de conditio-neringsefficiëntie. Terwijl de toroidale magnetische veldsterkte slechts eenbeperkt effect heeft op de conditioneringsefficiëntie (voor eenzelfde gekop-pelde vermogen), kan de ICWC conditioneringsefficiëntie worden verbeterddoor het aanbrengen van een klein verticaal magnetisch veld.

Summary in Dutch xxv
He-ICWC-ontladingen werden met succes toegepast op TORE SUPRAom de wand te desatureren van waterstofisotopen. Het verwijderen van hetgedesorbeerde waterstof door de vacuümpompen is het meest efficient nade RF-puls, waardoor het opnemen van voldoende tijd tussen twee RF-pulsen in de conditioneringsprocedure de efficiëntie vergroot. Verder ishet aangetoond dat de efficiëntie ook verhoogt bij het toepassen van ho-gere gekoppelde RF-vermogens. He-ICWC werd met succes toegepast opTORE SUPRA om de normale tokamakwerking te recupereren na tokamak-plasmadisrupties, en het is aangetoond dat He-ICWC minstens zo efficiëntis als de routinematig gebruikte TDC-techniek, zowel voor het verwijderenvan waterstof als voor het verwijderen van H2O. Deze beide feiten gevenaan dat de geoptimaliseerde He-ICWC ontladingen gebruikt kunnen wor-den voor inter-pulse conditionering tijdens de experimentele campagnes opTORE SUPRA.
Zowel op JET als op ASDEX upgrade werd geconstateerd dat in helium-bevattende ICWC-ontladingen, een aanzienlijke hoeveelheid van het geïnjec-teerde helium verloren ging in de wand. Op JET zijn hiervoor vermoedelijkde beryllium elementen op de ICRF antennes verantwoordelijk. Op AS-DEX Upgrade zijn heliumverliezen ook gekend voor He-GDC, en deze zijnte wijten aan de wolfraam PFC’s. Aangezien ITER als plasma-blootgesteldewandmaterialen wolfraam en beryllium zal gebruiken is het belangrijk omdit effect verder te onderzoeken in de toekomst, bijv. op JET, momenteel uit-gerust met een ITER-gelijkende wand. De pulscyclus-optimalisatiecriteriainzake de verhouding van de ontladingsgasretentie tot het aantal gerecu-pereerde wandgedesorbeerde deeltjes, gebruikt voor waterstof-ICWC, zouook kunnen aangewend worden voor He-ICWC. De ideale verhouding voorHe-ICWC, en bovendien voor elke He-gebaseerde conditioneringsontladingis gelijk aan ‘nul’. Ook voor het beperken van de redepositie van de wandge-desorbeerde deeltjes moet het beperken van de RF-pulslengte in He-ICWCoverwogen worden. In het geval dat de (eventuele) heliumretentie in beryl-lium en/of wolfraam PFC’s tijdens helium-conditioneringsontladingen on-aanvaardbaar blijkt voor de operatie van ITER, zullen conditioneringsont-ladingen in andere (edel-) gassen moeten worden ontwikkeld om helium-conditioneringsontladingen te vervangen.
Op JET werden relatief hoge snelheden voor het verwijderen van kool-stof waargenomen, maar het kon niet worden vastgesteld of de verwijderdekoolstof van gecodepositioneerde lagen afkomstig was. Ook de blootstellingvan koolstofstalen aan TEXTOR ICWC-plasmas kon geen uitsluitsel geveninzake erosie of afzetting van koolstof. De efficiëntie voor het verwijderenvan onzuiverheden wordt groter naarmate het gekoppelde RF-vermogen ver-groot, en het is bewezen dat er geen duidelijke invloed is van de aanwezigeenergetische CX-wandflux op de onzuiverheids-verwijderingsefficiëntie. Ex-perimenten met het markergas argon op TEXTOR illustreerden dat ICWCeen groot deel van het wandoppervlak dat geconditioneerd wordt door GDC

xxvi Nederlandse Samenvatting
bereikt. Tot slot werd geïllustreerd zowel op TEXTOR (H2-ICWC) als opTORE SUPRA (He-ICWC) dat ICWC het zuurstofgehalte in het vacuüm-vat kan verminderen. Of de verwijderingsefficiëntie voldoende is om detokamakwerking te garanderen kon niet getest worden in de loop van ditdoctoraat. Ter illustratie werd vermeld dat de supergeleidende tokamakKSTAR routinematig He-ICWC toepast voor inter-puls- en lunchtijdcondi-tionering, om de H2O-druk in het vacuümvat onder de operationele limiette houden.
0D model voor helium-waterstof ICWC-plasmasDe ontwikkeling van het 0D model voor helium-waterstof ICWC-plasma’s isgemotiveerd door de noodzaak om inzicht te verkrijgen in de ICRF plasmaparameters, de deeltjesfluxen naar de wand en de belangrijkste botsings-processen, hetgeen het fundamentele mechanisme is voor de opbouw vaneen plasma. Dit is van bijzonder belang, aangezien de meeste standaardtokamak-plasmadiagnostieken niet aangepast zijn om de typische lage tem-peraturen en lage dichtheden van RF-plasmas te diagnosticeren.
De 0D plasmabeschrijving is gebaseerd op de energie- en deeltjesbalans-vergelijkingen voor negen deeltjes soorten: H, H+, H2, H+
2 , H+3 , He, He+,
He2+ en e−. Het houdt rekening met (1) elementaire atomaire en molecu-laire botsingsprocessen, zoals excitatie, ionisatie, dissociatie, recombinatie,ladingsuitwisseling, enz. en elastische botsingen, (2) deeltjesverliezen tengevolge van de eindige afmetingen van het plasmavolume en de opsluitings-eigenschappen van de magnetische configuratie, en deeltjesrecycling, (3) gas-verwijdering door de vacuümpompen en gasinjectie, (4) RF-verwarming vanelektronen (en protonen) en (5) een kwalitatieve beschrijving van plasma-onzuiverheden.
Wanneer plasma-onzuiverheden worden opgenomen in de simulaties re-produceert het model de experimentele plasmadichtheidsafhankelijkheid vande druk en het gekoppelde RF vermogen, zowel voor waterstof-ontladingen(ne ≈ (1 − 5) · 1010 cm−3) als voor helium-ontladingen (ne ≈ (1 − 5) ·1011 cm−3). De gemodelleerde wandfluxen voor waterstof-ontladingen ko-men overeen met de experimentele schattingen: ∼ 1019 − 1020 /m2s voorH-atomen, en ∼ 1017 − 1018 /m2s voor H+-ionen. In het geval van heliumRF-ontladingen werd vastgesteld dat wandgedesorbeerde deeltjes een grotebijdrage leveren aan de wandflux. De belangrijkste wand-bombarderendeflux bestaat uit neutrale waterstofatomen. De helium- en waterstofionenfluxis van dezelfde grootte-orde, ookal is de partiele waterstofdruk, aanwezig alsgevolg van wanddesorptie, veel lager dan het heliumdruk.
Het gepresenteerde 0D ICWC-plasmamodel reproduceert de experimen-tele druk-, dichtheid- en gekoppelde RF-vermogen-temporele afhankelijkhe-den van een TORE SUPRA H2-ICWC ontlading vanaf de ontladingsiniti-atiefase tot aan de steady-state plasmafase, en geeft inzicht in de evolutie

Summary in Dutch xxvii
van de deeltjeswandfluxen en retentie. De wandinteractie, vertegenwoordigdin het model door een deeltjes-recyclingcoëfficiënt, heeft een grote invloedop de neutrale druk- en plasmadichtheid in H2-ICWC-ontladingen (in ge-val van een constante gasinjectie). Tijdens de plasmadoorbreekfase wordendeeltjes tijdelijk opgeslagen in de wand hetgeen zich manifesteert door eensterke drukval, terwijl tijdens de latere plasmafase een evenwichtsdruk ge-vormd wordt waar de permanente waterstofretentie ongeveer gelijk is aande gasinjectiesnelheid. Dit modelleringsresultaat bevestigt nogmaals dathet gebruik van kortere RF-pulsen in plaats van lange of continue ontla-dingen, voordelig is om retentie te beperken en de recuperatie van tijdelijkopgeslagen deeltjes te maximaliseren.
Simulatie van de wandinteractie in H2-ICWCEen minimumstructuur voor een 0D reservoirmodel van de TORE SUPRA(carbon) wand is opgesteld om meer inzicht te krijgen in de experimen-tele isotoopuitwisselingsdeeltjesbalansen. De gebruikte hypothese voor deopbouw van het model is dat hetzelfde model in staat moet zijn om hetwandgedrag te beschrijven tijdens zowel normale plasma’s als conditione-ringsprocedures. Het model bestaat uit een gereduceerd plasmamodel, ge-baseerd op het 0D model dat hierboven werd beschreven, gekoppeld aan dewandbeschrijving (via wandfluxen en de desorptiesnelheden). De wandbe-schrijving is gebaseerd op vier reservoirs: een toegankelijk reservoir waarinretentie, verwijdering en uitwisseling van deeltjes mogelijk is, een perma-nent reservoir waarin alleen retentie mogelijk is, een tijdelijk reservoir datdiffuserende deeltjes in de wand vertegenwoordigt en een extra reservoir dateffecten representeert die belangrijk worden wanneer de vullingsgraad vanhet toegankelijke reservoir hoog is.
Het is aangetoond dat door dezelfde wandparameters te gebruiken in hetmodel als die die vastgesteld zijn om de wandinteractie te beschrijven tij-dens lange TORE SUPRA tokamakontladingen, ook de H2, HD en D2 parti-ële drukken van ICWC isotoopuitwisselingsontladingen gesimuleerd kunnenworden. Het model bevestigt de experimenteel waargenomen sterke inter-actie met het typische toegankelijke waterstofreservoir in koolstof en toontaan dat de fractie van de wandflux dat verloren gaat in het permanentereservoir (permanente retentie) significant is. Bovendien illustreert het mo-del duidelijk dat de wandflux zowel uit geïnjecteerde waterstofisotopen alswandgedesorbeerde waterstofisotopen bestaat. Indien de RF-duty cyclusniet geoptimaliseerd wordt, zal dit recyclingproces maken dat een grootdeel van de gedesorbeerde wandisotopen verloren zullen gaan in het perma-nente reservoir. De opname in het model van de recuperatie van isotopenuit het permanente reservoir was niet noodzakelijk om de partiële drukkente reproduceren. Op dit moment is het niet duidelijk of de permanent op-geslagen deeltjes kunnen worden gerecupereerd, en dus of waterstof-ICWC

xxviii Nederlandse Samenvatting
effectief kan worden toegepast voor het verminderen van de tritium inven-tarisopbouw in ITER. Bijkomende experimenten zijn nodig om dit verderte bestuderen.
Het model werd gebruikt om de isotoopuitwisselingsefficiëntie als functievan de ontladingstiming (RF pulslengte en het interval tussen de opeenvol-gende RF-pulsen) en de vacuümpompsnelheid te bestuderen. Het was moge-lijk om met het wandmodel de ideale RF pulslengte en pompinterval tussenopeenvolgende pulsen te identificeren die samen toelaten om de maximumhoeveelheid van de wandgedesorbeerde deeltjes te kunnen recupereren uithet vacuümvat, terwijl de permanente retentie van het ontladingsgas en vanwandgedesorbeerde deeltjes geminimaliseerd wordt. De optimale tijdsduurtussen opeenvolgende RF-pulsen is afhankelijk van de wandparameters (ma-terialen) en de vacuümpompparameters. Voor het bereiken van hoge con-ditioneringsrendementen is het zeer belangrijk dat de vacuümpompsnelheidhoog is.
Extrapolatie naar ITEREr werd geconcludeerd dat ICWC een efficiënte wallconditioneringstech-niek is, geschikt om te worden toegepast op ITER tijdens de operationelecycli, dwz. wanneer het toroïdale magnetische veld aanwezig is, voor inter-pulsconditionering en conditionering gedurende de nachten. De conditione-ringsdoelen van He-ICWC voor ITER kunnen worden samengevat als: (a)recupereren van plasma start-up na disrupties, (b) desaturatie van de wan-den van waterstofisotopen om plasma start-up te kunnen garanderen, en(c) het verbeteren van de plasmaprestaties door onzuiverheden te verwijde-ren. He-ICWC dient derhalve te worden toegepast voor de start van eentokamak plasma, dus voor inter-pulsconditionering. De conditioneringsdoe-len van H2-ICWC (of D2-ICWC) zijn: (a) het veranderen van de wand-isotoopverhouding om de plasma-isotoopverhouding te kunnen controleren,(b) het verbeteren van de plasma prestaties door het verwijderen van onzui-verheid, en (c) het verwijderen van tritium. H2-ICWC kan worden toegepastvoor conditionering gedurende de nachten, gevolgd door He-ICWC om lagerecyclingwaarden in de daaropvolgende tokamakplasmas te verzekeren.
Geoptimaliseerde ontladingsscenario’s werden voorgesteld, geëxtrapo-leerd van geoptimaliseerde ontladingsresultaten op de huidige tokamaks. Opde huidige apparaten is een ideale ontladingshomogeniteit verkregen doorhet opereren van de antennes met monopoolfasering en door het toepassenvan een klein verticaal magnetisch veld van typisch 1− 1.5% van het toroi-dale magnetische veld. Een 435 s lange He-ICWC-procedure werd voorge-steld voor ITER inter-pulsconditionering. De procedure bestaat uit 15×2 sRF-pulsen, met inachtneming van drie karakteristieke vacuümpompingstij-den tussen twee opeenvolgende RF-pulsen, een heliumdruk van 2·10−4 mbaren een gekoppeld vermogen tussen 4 en 5 MW. De voorgestelde gepulseerde

Summary in Dutch xxix
procedure bewerkstelligt de optimale verwijdering van de wandgedesorbeerddeeltjes en limiteert de eventuele heliumretentie in de PFC’s. De procedureis in staat om 0.3 monolagen van waterstofisotopen uit de wand te verwij-deren. De benodigde helium-gasinjectie voor deze procedure komt overeenmet minder dan 1% van de cryopompcapaciteit. Ook voor H2 of D2-ICWCwerd een 435 s lange procedure voorgesteld (die natuurlijk moet wordenuitgebreid in geval van conditionering gedurende de nacht). De procedurebestaat uit 15 × 2 s RF pulsen, waar ook drie karakteristieke vacuümpom-pingstijden tussen twee opeenvolgende RF-pulsen in acht genomen zijn, eenwaterstofdruk van 2 · 10−4 mbar en een gekoppeld RF-vermogen tussen 1.5en 2 MW. Ook in het geval van waterstof-ICWC optimaliseert de voorge-stelde gepulseerde procedure het verwijderen van wandgedesorbeerd deeltjesen beperkt het de ontladingsgasretentie. Een dergelijke procedure zou tot1.7 monolagen waterstofisotopen kunnen verwijderen uit de wand, wat over-eenkomt met 68 mg tritium in het geval van een 50:50 D:T wandisotoopver-houding. Het is verwacht dat slechts een klein deel van deze tritiumatomenafkomstig zal zijn van gecodepositioneerde lagen.


English summary
IntroductionEnergy from magnetic fusion is a high potential alternative for presentgreenhouse gas emitting energy technologies. Fusion is acknowledged tobe inherently much safer than energy production from nuclear fission, andunlike for the latter technologies, the fuel for fusion is abundantly available.Currently the ambitious worldwide ITER project is the leading subject ofthe research to magnetic fusion. The objective of the project is to demon-strate that it is possible to produce commercial energy from fusion. ITERis designed to deliver five to ten times the power it consumes, for a durationof up to 1000 seconds. In case of success, the ITER project will be followedby an industrial demonstration reactor project: DEMO (anno 2030-2040).
Energy out of nuclear fusion is produced by merging light nuclei to-gether into heavier nuclei. This merging together is due to the attractivenuclear force and is achieved by bringing the positively charged nuclei veryclose to each other, so that the attractive nuclear force becomes larger thanthe repulsive electrostatic Coulomb force. To overcome the Coulomb barriersufficient particle energy, in the order of millions Kelvin is required. Today’sresearch on fusion energy is based on the D-T reaction, both isotopes of hy-drogen, producing a (not radioactive) helium nucleus and a neutron with acombined energy of 17.6 MeV: D + T→ 4He (3.5 MeV) + n (14.1 MeV). Atthe required temperatures, the deuterium and tritium ‘fuel’ molecules willbe broken into their constituent atoms. The atoms in turn will be ionizedturning the fuel into a plasma, containing charged particles: positive ions(nuclei) and negative electrons. The plasma of an energy efficient fusionreactor has to induce a sufficient number of fusion reactions (1 GW of fu-sion power equals 3.5 · 1020 D-T reactions/s), and the released energy hasto exceed the external energy required to heat up the fuel. The situationwhere the plasma heats itself by fusion reactions so that external heatingcan be switched off is called ignition. The criteria to reach ignition is givenby the triple product: neTτE ≥ 3 · 1021 m−3keVs, where ne is the plasmaelectron density, T the plasma temperature and τE the energy confinementtime, a measure of the rate at which the system loses energy to its environ-ment. Magnetic fusion research aims at approaching the ignition conditionby trapping the plasma (ne = 1020 m−3) in a torus-shaped bottle created

xxxii English summary
by magnetic fields providing a high energy confinement time (τE = 3 s) andmaintaining it at very high temperature (T = 10 keV ≈ 108 K).
The tokamak magnetic confinement configuration has been successfullyused to produce fusion reactions and is currently the path that is studied themost. The magnetic configuration of a tokamak consist of helicoidal mag-netic field lines forming torus shaped magnetic surfaces, drawn by the pathof the field lines. The toroidal field component is generated by a series of cur-rent coils encirculating the plasma poloidally. A first poloidal magnetic fieldcomponent is produced by an intense axial current flowing in the toroidalplasma itself, generated by induction like in a transformer. A second ad-ditional poloidal field component, employed to achieve plasma equilibriumand to optimize the shape of the magnetic surfaces, is produced by toroidalcurrent coils. The experiments presented in this manuscript are carried outon European tokamaks TORE SUPRA (IRFM, CEA/Cadarache, France),TEXTOR (IPP-Jülich, Germany), ASDEX Upgrade (IPP-Garching, Ger-many) and JET (CCFE, UK), and frame in the preparation of the ITERtokamak operation.
To receive and extract the heat load from the plasma via the inevitablewall intersection points of the outer magnetic field lines, dedicated compo-nents are placed in the chamber of the above tokamaks. In limiter tokamaks(TORE SUPRA, TEXTOR) a solid toroidal surface defines the edge of theconfined plasma (where the magnetic surfaces are closed) since it is the firstmaterial component intercepting the field lines with respect to the plasmacenter. A fusion reactor cannot rely on this configuration since the heatload on the limiter surface and the impurity production rate would be tooelevated. In the divertor configuration (ASDEX Upgrade, JET), the lastclosed magnetic surface is determined solely by the magnetic field lines.The first solid surface, the divertor target, interacting with the plasma is atsome distance from the last closed magnetic surface so that impurity pene-tration into the plasma center is reduced. ITER has adopted the divertorconfiguration.
The performance of the tokamak plasma center greatly depends on its in-teraction with the plasma edge close to the vessel walls, and with the plasmafacing components (PFC’s). Basic plasma surface interaction processes suchas erosion (sputtering and chemical erosion), implantation, trapping, depo-sition, adsorption and desorption may induce release of wall material andthus introduce impurities in the plasma (impurity desorption), cause netrelease or retention of fuel (fuel recycling), and induce degradation of wallmaterials. Release of impurities has to be avoided since it may cool downthe plasma by radiation, dilute the plasma fuel reducing the fusion power,lower the plasma stability and global energy confinement, and enhance thefurther production of impurities. Strong fueling by the vessel walls has tobe avoided since it may prevent discharge initiation and make density con-trol impossible. Retention of fuel is also problematic, since it is estimatedthat the administrative limit attributed to the tritium in-vessel inventory on

English summary xxxiii
ITER, set to 640 g, can be attained in less than 1 year of ITER exploitation.To extend the ITER operation period, the tritium inventory build-up due tofuel retention by implantation and codeposition, thus has to be mitigated.
To control the described surface interactions and the tritium inventorybuild-up there are three actors: (1) proper selection of wall materials, (2)proper selection of tokamak magnetic configuration, e.g. divertor, limiters,and operation regimes and (3) control the wall surface state. This ma-nuscript focuses on the third actor, namely wall conditioning. In presentdevices a set of wall conditioning techniques are used to set the wall surfacesin the desired state. The ITER relevant techniques are (a) heating of thewall materials (Baking) to induce thermal desorption of particles. Bakingis an efficient but lengthy procedure (order of days). To reduce the tritiuminventory on ITER, the estimated required bake frequency is around 2 to8 times a year. (b) Glow discharge cleaning (GDC), which is a routineconditioning technique on almost all fusion devices. GDC was shown tobe inefficient in presence of the toroidal magnetic field. In superconductingdevices like ITER, where the toroidal magnetic field in the vessel will bepresent during operation cycles (periods of the order of weeks), the opera-tion of GDC will thus be limited to machine shut-down periods. (c) The useof tokamak discharges for conditioning (separatrix scanning and controlleddisruptions), which might require dedicated tokamak discharges since thecontrol of the ramp down scenario (discharge ending) in ITER DT-plasmasis considered to be subtle and fragile. (d) Ion cyclotron wall conditioning(ICWC), which is the main topic of this PhD manuscript and currently themost promising technique to be employed on ITER during the operationcycles (in presence of magnetic field). (e) Electron cyclotron wall condi-tioning (ECWC) discharges, produced at nominal toroidal magnetic fieldby coupling RF waves in the electron cyclotron range of frequencies, usingthe standard tokamak electron cyclotron heating systems. The technique isfound to be less efficient than ICWC and GDC, and moreover the poloidaldischarge homogeneity is very poor. (f) Pulsed glow discharge condition-ing (P-GDC) discharges, produced by using conventional GDC electrodescoupled to a high frequency power supply. This recent technique requiresfurther study and development on multiple machines to optimize the homo-geneity, demonstrate its efficiency, and assess the applicability for ITER.
The qualification of wall conditioning discharges applicable in presence ofthe toroidal magnetic field for inter-shot and overnight conditioning duringITER operation cycles is considered a high priority task. The conditioningdischarges need to mitigate the tritium inventory build-up, to achieve therequired low recycling levels at plasma start-up and to reduce impurity (andfuel) levels after plasma disruptions. Since ICWC has been successfullytested on several devices and proved favorable characteristics compared toECWC, it has been included in the project functional requirements. ThisPhD work frames in the R&D program on ICWC, advancing to consolidatethe ICWC technique and to qualify it for application in ITER and possibly

xxxiv English summary
other future machines.
ICWC principleICWC, operated in presence of the toroidal magnetic field, makes use offour main tokamak systems: the ICRF antennas to initiate and sustain theconditioning discharge, the gas injection valves to provide the discharge gas,the machine pumps to remove the wall desorbed particles, and the poloidalmagnetic field system to optimize the discharge homogeneity. Additionallyneutral gas and plasma diagnostics are required to monitor the dischargeand the conditioning efficiency.
ICRF discharge production can be divided into the pre-wave stage andthe plasma wave stage. The initial breakdown phase corresponds to the pre-wave phase. The plasma density build-up in the initial breakdown phaseis due to collisional ionization by electrons accelerated in the near antennaparallel electric field. In the wave phase, the electromagnetic field expandsin the vessel volume causing further space ionization. In this phase theRF power is absorbed mainly collisionally by electrons. Antenna operationschemes are identified that improve the plasma breakdown time, the effi-ciency for RF power coupling to the plasma and the plasma homogeneity.These consist either of decreasing the cut-off density for fast wave (FW)propagation, namely operation at close to monopole strap phasing and/oroperation at high cyclotron harmonic numbers (e.g. at strongly reducedtoroidal magnetic field values), or rely on mode conversion scenarios of theevanescent FW into the slow wave or ion Bernstein wave in plasmas withmultiple ion species (which is the case in ICWC plasmas). It was concludedthat for ICRF plasma production, monopole strap phasing of the ICRFantennas is the optimal mode of operation.
Via the produced plasma one aims at creating a controlled flux of parti-cles to the wall surfaces provoking either liberation of impurities, erosion ofcodeposited layers, desaturation of the subsurface fuel reservoirs, or chang-ing their isotopic ratio. For the discharge gas, fed via the injection valves,one can choose inert (e.g. He) or reactive gases (e.g. H2, D2, O2), dependingon the conditioning purpose. The particles which are intentionally releasedfrom the wall surfaces need to be removed from the vacuum vessel. Forthis the standard machine pumps of the device are employed that are con-tinuously operational to provide the required vacuum conditions. To allowfor achieving high conditioning efficiencies it is important that the vacuumpumping speed is high. The efficiency of the conditioning technique for des-orbing particles from the surfaces and removing these particles from the vac-uum vessel, can be assessed via different diagnostic systems amongst whichthe most important are the neutral gas analyzers (e.g. pressure gauges, massspectrometry, ...).

English summary xxxv
PhD aimsThe experimental objectives of the PhD comprise the study and optimiza-tion of ICWC on multiple devices; TORE SUPRA, TEXTOR, ASDEXUpgrade and JET, which allows testing the conditioning discharge undermultiple conditions (different antenna systems and available frequencies,wide range of vessel sizes, limiter and divertor configurations, carbon PFCand tungsten PFC). Since hydrogen and helium are likely the most suitabledischarge conditioning gases for ITER (e.g. O2 discharge conditioning isnot allowed during the D-T phase), the research is limited to hydrogen andhelium ICWC discharges. Since the discharges are found to be toroidallyhomogeneous but poloidally inhomogeneous, the mechanisms that causethese inhomogeneities have to be determined, and methods to improve thepoloidal homogeneity have to be found. Also the homogeneity of the wallflux needs to be considered. For this the main wall bombarding species needto be characterized. The effect of the wall flux components on the condition-ing efficiency and their dependencies on the discharge control parametershave to be investigated. The study of H2- (and He/H2)-ICWC comprisesinvestigating the techniques ability to change the wall isotopic ratio and toremove codeposited layers (tritium removal). The study of He-ICWC needsto focus on the techniques ability to desaturate the wall surfaces from dis-charge fuel, as well as evidencing the operational effectiveness of He-ICWCto recover normal tokamak operation after plasma disruption events andto lower the vacuum base pressure levels of impurities. For both H2 andHe-ICWC, the dependency of the conditioning efficiency on the dischargecontrol parameters (pressure, RF power, toroidal and poloidal magneticfield strength, pumping speed, ...), its evolution in time, and the advantageof pulsed ICWC compared to continuous RF discharges has to be treated.The ICWC efficiency to remove impurities has to be investigated, and theoverall efficiency of ICWC has to be compared to other techniques (GDC,Taylor discharge cleaning (TDC)). Experience has to be gained with respectto safe operation of the ICRF antenna systems.
The development of models can lead to important insights. To increasethe understanding and to verify the existent models, the following model-ing objectives were defined. An existing 0D ICRF plasma code for atomichydrogen needs to be upgraded to include molecular hydrogen and helium.The implementation of molecular hydrogen is motivated by the low tem-perature of the plasma and the related incomplete ionization of the neutralgas. The developed model needs to be benchmarked to experimental data ofTORE SUPRA and TEXTOR, and needs to complement the experimentswith data that cannot be measured. The model has to reproduce the exper-imental plasma densities (the available electron temperature measurementsbeing unreliable at the typical low temperatures). Causes of discrepanciesbetween model and experiments need to be investigated. Once the plasmadensity and its dependencies on the discharge control parameters can be

xxxvi English summary
reproduced with sufficient accuracy, the main plasma and wall bombard-ing species can be identified. The deduced wall fluxes need be comparedwith experimental data. To better understand the plasma wall interaction(PWI), the out-pumped fluxes, wall desorbed fluxes and wall bombardingfluxes need to be related to each other. The model needs to allow proposingoptimizations of the discharge control parameters to increase the condition-ing efficiency. To interpret experimental isotopic exchange results and topropose optimized discharge scenarios for isotopic exchange, a final code,linking the 0D plasma code for hydrogen to a minimum description of theplasma wall interaction should be envisaged.
The obtained results need to be extrapolated to ITER, assessing theapplicability and proposing implementations of ICWC on ITER.
Discharge homogeneityAchieving homogeneous RF conditioning discharges is important to ensurethe effective conditioning of the maximum vessel wall area. It is found thatthe observed radial inhomogeneities can be explained in terms of RF powerabsorption properties, and that vertical inhomogeneities are due to the con-finement properties of the magnetic configuration. Close to the vessel walls,in regions where the magnetic field lines are limited by wall structures suchas poloidal limiters, the plasma density is observed to decrease exponen-tially, which evidences the existence of a plasma edge in ICRF discharges.Due to the existence of this edge plasma, the ion wall flux is concluded to belargest on the first limiting surfaces. In order to obtain a radially homoge-neous RF plasma in the vessel, proper wave propagation or at least a largedecay length of the evanescent RF field is required, allowing to sustain theplasma also at the high field side (at central column). By applying a smallvertical magnetic field that stretches the plasma in the vertical direction,the vertical homogeneity can be improved. Experiments on JET, the largestpresent device, set up in ITER like conditions evidenced the feasibility offilling the entire JET vacuum vessel with plasma: by operating the antennawith monopole strap phasing and on application of a small vertical field,bright recycling radiation was observed both at the central column on thehigh field side and in the divertor area.
Wall conditioning efficiencyTo study and optimize the efficiency of ICWC, experiments are conducted onTORE SUPRA, TEXTOR, JET and ASDEX Upgrade. Firstly the isotopicexchange efficiency of H2 and H2/He discharges was studied, and secondlythe efficiency for wall desaturation and recovery of normal tokamak oper-ation after disruptions using He discharges were studied. Finally also, theICWC efficiency for codeposited layer and impurity removal is discussed.

English summary xxxvii
Hydrogen ICWC is able to change the surface state within short timescales (removal of hydrogen monolayers within minutes), both on carbonmachines TORE SUPRA, TEXTOR and JET as on tungsten device ASDEXUpgrade. However the removal of wall isotopes can go at the price of anup to ten times higher retention of the discharge gas. In isotopic exchangeexperiments, the ideal ratio of retained over recovered particles equals one.It was shown experimentally that the ratio of retained over recovered atomscan be significantly improved by optimizing the RF duty cycle. The idealratio of one has been achieved both on TORE SUPRA and on TEXTOR.
The cause of the retention was investigated. From combined experimen-tal results on (i) long term retention behavior on TORE SUPRA, (ii) reten-tion on the tungsten device ASDEX Upgrade, (iii) retention as a functionof presence and absence of resonant IC absorption (which lies at the basis ofthe energetic CX flux to the wall) on TEXTOR, (iv) retention compared tototal energetic CX flux on JET, (v) recovery of retained particles by GDC,the hypothesis was made that ICWC discharges reach surface areas thatare not accessible by glow discharges. Also the existence of a substantialnon-resonant ion wall flux component with energies above the typical GDCflux, causing retention in deeper layers, can at this point not be excluded.Both points require further investigation.
An extensive comparison of the isotope exchange efficiencies of ICWCand GDC on TORE SUPRA and TEXTOR learned that the measured highretention during the ICWC discharges can be understood as an effect of thehigh reionization probability (mainly due to the higher electron density inICWC discharges): the probability that a neutral molecule will be ionizedor dissociated instead of removed by the machine pumps. Consequentlythe removal efficiency of wall desorbed species by the machine pumps is lessefficient in ICWC than in GDC. This makes that even if a very small fractionof the wall flux remains permanently retained, the high wall fluxes duringICWC and the low pumping efficiency, can lead to a retention rate that iscomparable to the removal rate by the machine pumps. Since reionizationand wall flux retention only occurs during the plasma discharge, and since itwas shown that most of the wall desorbed gas is recovered after the RF pulse,the use of shorter RF pulses (∼ 1 s) separated by sufficient time betweenpulses to recover the wall desorbed particles by the machine pumps (∼ 20 son TORE SUPRA) significantly reduces the retention, without severelylowering the total amount of removed particles.
It was found that the absolute removal efficiency of wall desorbed parti-cles is higher at higher pressures and on increasing power. Nevertheless it isconcluded that the ideal RF power is the power at which the discharge canbe established most reliably from point of view of antenna operation, andat which the discharge is most homogeneous. The evidenced energetic CXflux is found to have only a minor influence on the conditioning efficiency.Whereas the toroidal field strength has a limited effect on the conditioningefficiency (at fixed coupled power), the ICWC conditioning efficiency can

xxxviii English summary
be improved by applying a vertical magnetic field.
He-ICWC discharges were successfully applied on TORE SUPRA todesaturate the wall from hydrogenic particles. The hydrogen is mostly re-covered after the RF pulse which indicates that including pumping time inthe conditioning procedure increases the removal efficiency of wall desorbedparticles. Furthermore, the removal efficiency increases also on increasingthe RF coupled power. On TORE SUPRA, He-ICWC was successfully ap-plied to recover normal tokamak operation after plasma disruption events,and it is found that the removal efficiency of He-ICWC is at least as effi-cient as that of the routinely operated TDC technique, both for hydrogenremoval as for removal of H2O. These both facts indicate that the opti-mized He-ICWC discharges can be used for inter-pulse conditioning duringexperimental campaigns on TORE SUPRA.
Both on JET and ASDEX Upgrade was found that during helium con-taining ICWC discharges, a significant amount of the injected helium wasconsumed by the wall. On JET, the beryllium elements on the ICRF an-tennas are thought to be responsible for this. On ASDEX Upgrade, he-lium losses are also reported for He-GDC, and are due to the tungstenPFC’s. Since ITER will have as main plasma facing components tungstenand beryllium it is important to investigate this effect further in future,e.g. on JET which is presently equipped with an ITER like wall. The pulsecycle optimization criteria in terms of the ratio of retained discharge gasover recovered wall desorbed particles, used for hydrogen ICWC, might beadopted for He-ICWC as well. The ideal ratio for He-ICWC, and moreoverfor any He-based conditioning discharge, equals ‘zero’. Also for limiting theredeposition of wall desorbed particles limiting the RF pulse length in He-ICWC should be considered. In case the (eventual) helium retention rates inberyllium and/or tungsten PFC’s during helium discharge conditioning areunacceptable for ITER operation, conditioning discharges in other (noble)gases may need to be developed to substitute helium discharge conditioning.
Relatively high removal rates for carbon were recorded on JET, howeverit could not be determined whether the removed carbon stems from code-posited layers. Also the exposure of samples to TEXTOR ICWC plasmasto evidence carbon erosion or deposition remained inconclusive. It is foundthat the impurity removal efficiency improves on increasing the dischargepower, and additionally it was evidenced that there is no clear influenceof the measured energetic CX flux on the removal efficiency. Experimentswith the marker gas argon on TEXTOR illustrated that ICWC reaches alarge part of the wall area affected by GDC. Finally it was illustrated bothon TEXTOR (H2-ICWC) and TORE SUPRA (He-ICWC) that ICWC canreduce the oxygen content in the vacuum vessel. Whether this removal ef-ficiency is sufficient to ensure tokamak operation, could not be tested inthe course of this PhD. For illustration it was mentioned that the supercon-

English summary xxxix
ducting tokamak KSTAR routinely employs He-ICWC for inter-pulse andlunchtime conditioning, in order to keep the vessel H2O pressure below theoperational limit.
0D model for helium-hydrogen ICWC plasmasThe development of the 0D model for helium-hydrogen ICWC plasmas ismotivated by the need to obtain insight on ICRF plasma parameters, par-ticle fluxes to the walls and the main collisional processes, the latter beingthe fundamental mechanism for the build-up of a plasma. This is of partic-ular importance since most standard tokamak plasma diagnostics are notadapted to diagnose the typical low temperature and low density RF plas-mas.
The 0D plasma description is based on the energy and particle balanceequations for nine principal species: H, H+, H2, H+
2 , H+3 , He, He+, He++
and e−. It takes into account (1) elementary atomic and molecular collisionprocesses, such as excitation/radiation, ionization, dissociation, recombina-tion, charge exchange, etc. and elastic collisions, (2) particle losses due tothe finite dimensions of the plasma volume and confinement properties ofthe magnetic configuration, and particle recycling, (3) active pumping andgas injection, (4) RF heating of electrons (and protons) and (5) a qualitativedescription of plasma impurities.
On inclusion of plasma impurities the model reproduces experimentalplasma density dependencies on discharge pressure and coupled RF power,both for hydrogen RF discharges (ne ≈ (1 − 5) · 1010 cm−3) as for heliumdischarges (ne ≈ (1− 5) · 1011 cm−3). The modeled wall fluxes of hydrogendischarges are in the range of what is estimated experimentally: ∼ 1019 −1020 /m2s for H-atoms, and∼ 1017−1018 /m2s for H+-ions. In case of heliumRF discharges it is found that the wall desorbed particles contribute largelyto the wall flux. The main wall bombarding flux are hydrogen neutrals.The helium and hydrogen ion flux can be of the same order of magnitudeeven though the hydrogen neutral pressure, stemming from wall desorption,is generally much lower than the helium pressure.
The presented 0D ICWC plasma model allowed to reproduce experi-mental pressure, density and coupled power temporal dependencies of aTORE SUPRA H2-ICWC discharge from discharge initiation to steady stateplasma, and gives insight into the evolution of the particle wall fluxes andretention rates. The wall interaction, represented in the model by a parti-cle recycling coefficient, has a major influence on the neutral pressure andplasma density in H2-ICWC discharges (in case of constant gas injection).During the breakdown phase, particles are transiently stored in the wallcausing a steep pressure drop while during the plasma phase an equilibriumpressure is formed where the permanent hydrogen retention rate approxi-mately equals the gas injection rate. This modeling result reconfirms that
xl English summary
employing shorter RF pulses instead of long or continuous discharges is fa-vored to limit retention, while maximizing the recovery of transiently storedparticles.
Simulation of wall interaction in H2-ICWCA minimum structure for a 0D reservoir model of the TORE SUPRA (car-bon) wall was determined to obtain more insight in experimental isotopicexchange particle balances. The hypothesis used to build up the model isthat the same model structure should be able to describe the wall behaviorduring normal plasmas and conditioning procedures. The model consistsof a reduced plasma model based on the 0D model described above, cou-pled (via wall fluxes and wall release rates) to the wall description. The walldescription is based on four reservoirs: an accessible reservoir in which trap-ping, detrapping and exchange of particles is possible, a permanent reservoirin which only retention is possible, a transient reservoir representing diffus-ing particles in the wall and an additional reservoir accounting for effectsthat become important on high filling degrees of the accessible reservoir.
Using the same wall parameters as those determined to describe thewall interaction during long TORE SUPRA tokamak discharges, the modelallowed also to simulate the H2, HD and D2 partial pressures of ICWC iso-tope exchange discharges. The model confirms the experimental observedstrong interaction with the typical accessible hydrogen reservoir in carbonand shows that the fraction of the wall flux that enters into the perma-nent reservoir (permanent retention) is significant. Moreover, the modelillustrates clearly that the wall flux consists both of the injected hydrogenisotopes and the wall desorbed hydrogen isotopes. If not optimizing the RFduty cycle, this recycling process will make that a large part of the des-orbed wall isotopes will be retained in the permanent reservoir. Removalfrom the permanent reservoir was not required to be included in the modelto reproduce the partial pressures. At this point it is not clear whetherthe permanently stored particles can be retrieved, and thus whether hydro-gen ICWC can be effectively applied for mitigating the tritium inventorybuild-up in ITER. Additional experimentation will be required to study thisfurther.
The model is used to study the isotopic exchange efficiency as a functionof the discharge timing (RF pulse length and interval between subsequentRF pulses) and the machine pumping speed. It was possible from the wallmodel to identify the ideal RF pulse length and pumping time between sub-sequent pulses to maximize the amount of recovered particles from the wall,while minimizing firstly the retention of injected gas, and secondly the im-plantation of wall desorbed particles into the permanent retention reservoir.The optimal discharge timing depends on the wall parameters (materials)and discharge parameters, and additionally to allow for achieving high con-
English summary xli
ditioning efficiencies it is very important that the vacuum pumping speedis high.
Extrapolation to ITERIt was concluded that ICWC is an efficient conditioning technique, suitableto be applied on ITER during the operational cycles, i.e. when the toroidalmagnetic field is present, for inter-pulse and overnight conditioning. Theconditioning aims for He-ICWC on ITER are summarized as: (a) recoveringplasma start-up after disruptions, (b) desaturating the wall from hydrogenisotopes to ensure plasma start-up, and (c) improving the plasma perfor-mance by impurity removal. He-ICWC should consequently be applied be-fore the start of a tokamak plasma, thus for inter-pulse conditioning. Theconditioning aims for H2-ICWC (or D2-ICWC) are: (a) changing the wallisotopic ratio to control the plasma isotopic ratio, (b) improving the plasmaperformance by impurity removal, and (c) removing tritium. H2-ICWCcould thus be adopted for overnight conditioning, followed by He-ICWC toensure low recycling in the subsequent tokamak plasma.
Optimized discharge scenarios were proposed, extrapolated from opti-mized discharge results on present tokamaks. On present devices, ideal dis-charge homogeneity was obtained by operating the antennas in monopolephasing and by applying a small vertical magnetic field of typically 1−1.5%of the toroidal field. A 435 s long He-ICWC procedure is proposed for ITERinter-pulse conditioning. The procedure consists of 15 × 2 s RF pulses, re-specting three characteristic pumping times between two subsequent RFpulses, a helium pressure of 2·10−4 mbar and a coupled power of 4 to 5 MW.The proposed pulsed mode of operation allows optimal removal of wall des-orbed particles and will limit eventual helium retention in the PFC’s. Theprocedure is able to remove 0.3 monolayers of hydrogen isotopes from thefirst wall. The required helium gas injection for this procedure correspondsto less than 1% of the cryopump capacity. Similarly also a 435 s long H2or D2-ICWC procedure is proposed (which of course should be extended incase of overnight conditioning). The procedure consists of 15×2 s RF pulses,respecting also three characteristic pumping times between two subsequentRF pulses, a hydrogen pressure of 2 · 10−4 mbar and a coupled power of 1.5to 2 MW. Also for hydrogen ICWC, the proposed pulsed mode of opera-tion optimizes the removal of wall desorbed particles and limits dischargegas retention. Such a procedure would allow to remove 1.7 monolayers ofhydrogen isotopes from the first wall, corresponding to 68 mg of tritium incase of a 50:50 D:T wall isotopic ratio. It is expected that only a smallportion of these tritium atoms will stem from codeposited layers.


1Introduction
1.1 Energy for future generationsThe energy market has up until the present been dominated by fossil fuels:oil, gas and coal. The market share of renewable energy sources accountspresently only for 10% of the world marketed energy and also nuclear en-ergy provides only 5% [1]. Even though renewables and nuclear energy areexpected to have doubled their present capacity in 2035, it is not expectedthat the energy repartition will change much, since due to economic and de-mographic growths the world energy consumption will continue to increaseyear after year [1] (see Fig. 1.1). Taking into account the global fuel reserves(table 1.1) it is nevertheless clear that the energy landscape has to changesignificantly within this century. The time reserves for oil, which presentlyaccounts for 35% of the marketed energy, and gas, 25% of the present mar-keted energy, are estimated at respectively 30-40 years and 50-60 years [1].But this is not the only reason to question the present day energy mix. Thehuge emission of carbon dioxide due to energy production, 29.7 billion tonsin 2007 (≈ 1% of atmospheric CO2 concentration, 350 ppmv1), puts theworld energy consumption right in the center of the climate change debate.The past years a consensus is reached among scientists all over the world onthe relation between climate change, or global warming, and the emission ofgreenhouse gases, mainly in the form of carbon dioxide, resulting primarily
1ppmv = parts per million in volumetric units.

1-2 Introduction
Figure 1.1: World marketed energy use by fuel type, 1990-2035, in quadrillionBtu [1]. (Btu = British thermal unit, equal to about 1055 joules)
from the combustion of fossil fuels. To reduce the impact of our energyconsumption on the climate there is thus an urgent need to shift the energymix to carbon free or carbon neutral energy sources. Present well knowncarbon free energy sources are for example nuclear and renewable energysources.
Nuclear energy generation by fission is attracting new interest as coun-tries seek to cope with the increasing demand for electric power, alternativesto fossil fuels, and to increase the diversity of their energy supplies. On em-ployment of new generation breeder reactors, the fission fuel reserves couldbe extended to the order of thousands years. But still the considerable un-certainty associated with nuclear fission power remains. Issues that slowdown the expansion of fission power include:
• Plant safety concerns triggered by e.g. Three Mile Island (1979), Cher-nobyl (1986), Tokaimura (1999) [3] and very recently Fukushima (2011),
• Radioactive waste disposal,
• Rising construction costs and investment risk (e.g. Superphenix reac-
Table 1.1: Global fuel reserves expressed in years at the current rate of consump-tion [1, 2] (*Estimation for Uranium without employment of breeder technology)
Fuel Reserve Time Reserve (years)Liquids 1.4 · 1012 Barrels 30-40
Gas 6.6 · 1015 Cubic Feet 50-60Coal 9.1 · 1012 Tons 129
Uranium* 5.4 · 106 Tons 80

Chapter 1 1-3
tor in France [4] and the German-Belgian-Netherlands project SNR2
300 in Kalkar, Germany [5])
• Nuclear material proliferation concerns.
These considerations open the doors widely for renewable energy sourcessuch as photo-thermal and photovoltaic energy, wind turbines and bio-fuels.Although these will certainly continue increasing their market share, theircontribution to the final energy mix will in future remain limited due toscale problems [6]. This makes that the availability of energy resources fornext generations remains until now an unresolved question3.
The Copenhagen Accord4 to commit countries to collectively reducetheir greenhouse-gas emissions and so limiting the global temperature in-crease to 2C, and especially the failure to seal the agreement, neglecting thescientific rationales, shows clearly that it will be governments that will shapethe future of energy on the longer term5. Their investments in research andnew technologies, their stimulation of renewables and energy efficient in-dustries, and their ‘in-time acting’ are indispensable to ensure the smoothenergy mix transition required to guarantee energy supply continuity andglobal climate stability.
1.1.1 Prospects of nuclear fusionThe here presented manuscript frames in the world wide government sup-ported research and development efforts aiming at demonstrating the fea-sibility of producing commercial energy from fusion. The fusion projectis motivated by the advantageous features of fusion over existing energysources (summarized from [6,8]).
• The fuel for fusion is abundantly available. The long-term fuel securityof fusion exceeds by far that of fission power and fossil-fuel energy.
2SNR: Sodium cooled Fast Breeder nuclear reactor3Recently the intergovernmental panel on Climate Change published an assessment
on the potential contribution of renewable energy sources (RE) bio energy, direct solarenergy, geothermal energy, hydropower, ocean energy and wind energy, to the mitigationof climate change [7]. The majority of the 164 scenarios reviewed in the report showindeed an increase in the deployment of these RE sources by 2030, 2050. More thanhalf of the scenarios show a contribution from RE in excess of a 17% share of primaryenergy supply in 2030 rising to more than 27% in 2050 (compared to 12.9% in 2008).The scenarios with the highest RE shares reach approximately 43% in 2030 and 77% in2050.
4Result of the United Nations Climate Change Conference (COP15), December 2009.5The World Energy Outlook 2010 report of the International Energy Agency shows
that the commitment of the G-20 (Meeting of G-20 leaders in Pittsburgh, September2009) and APEC (Asia Pacific Economic Cooperation) to ”rationalize and phase out overthe medium term inefficient fossil-fuel subsidies that encourage wasteful consumption”has the potential to, at least partly, balance the disappointment at Copenhagen.

1-4 Introduction
• Fusion has a low environmental impact. Whereas fission stations pro-duce spent fuel with half-lives of thousands of years, the only radioac-tive wastes produced from a fusion station would be from the inter-mediate fuel, tritium, and any radioactivity generated in structuralmaterials. The radioactivity of tritium is short-lived, with a half-lifeof 12.34 years, and if chosen appropriately the structural materialshave a half-life of around 100 years.
• Fusion is inherently safer than fission in that it does not rely on acritical mass of fuel. This means that there are only small amountsof fuel in the reaction zone, making core meltdown-like accidents farless probable, and its consequences less severe.
• Fusion power stations would present no opportunity to cause wide-spread harm (no greater than a typical fossil-fueled station) owingto the intrinsic safety of the technology. Fusion in a tokamak relieson a continuous external supply of fuel and external heating, withoutwhich the process soon dies away.
• As with fission, fusion power stations would provide energy at a con-stant rate, making them suitable for baseload electricity supply.
• Fusion electricity will be similar to fission electricity in its cost struc-ture; a power station will require complex and expensive engineering,while fuel costs will be negligible in comparison.
• Fusion power stations would not produce fissile materials and make nouse of uranium and plutonium, the elements associated with nuclearweapons. This reduces proliferation concerns associated with theseelements, although in principle fusion is not completely free from pro-liferation risks [9–12].
In 1951 a first conceptual design of a fusion reactor, named stellarator6,was made at the Princeton University by Lyman Spitzer. Around the sametime the principle idea of a tokamak7 was invented by Soviet physicists,followed by an experimental research program at the Kurchatov Institutein Moscow led by Lev Artsimovich. In the 60 years that followed multipleexperimental devices have been built, designed with knowledge obtainedfrom the previous ones, eliminating their weaknesses. These research ef-forts are converging into the design of the first commercial fusion reactor.
6The name stellarator refers to the possibility of harnessing the power source of thesun, a stellar object.
7The word tokamak is a transliteration of the Russian word tokamak, an acronymof ” toroidalna kamera s aksial’nym magnitnym polem” (toroidal’naya kamera saksial’nym magnitnym polem) - toroidal chamber with axial magnetic field.

Chapter 1 1-5
Figure 1.2: Binding energy per nucleon in MeV: Fission of heavy particles andfusion of light particles can yield energy [13].
Currently the ambitious ITER project is the leading subject of the fusionefforts with as objective to deliver five to ten times the power it consumes,for a duration of up to 1000 seconds (see section 1.3). In case of success,the ITER project will be followed by an industrial demonstration reactorproject: DEMO (anno 2030-2040).
1.2 Controlled nuclear fusion1.2.1 Nuclear energyNuclear energy can be released by splitting the nuclei of atoms (fission) orby merging nuclei together (fusion). Fig. 1.2 shows the binding energy pernucleon for common isotopes as a function of the number of nucleons in thenucleus. The binding energy is the energy required to disassemble a wholeinto separate parts. The curve has a maximum around the iron group,which are the most tightly bound or stable isotopes. As the products ofnuclear reactions have different binding energies then their reactants, thereaction can be endothermic or exothermic. The fission of heavy particles(e.g. 235U) into lighter nuclei releases nuclear binding energy. Similarly, thefusion of light particles (e.g. from hydrogen to boron) into heavier nucleireleases energy.
1.2.2 The fusion reactionSince fusion reactions are induced in collisions between particles, the reac-tion cross section lies at the basis of the choice of the ideal fusion reaction.

1-6 Introduction
Figure 1.3: Cross sections for fusion reactions (1.1), (1.2), (1.3) and (1.4) as afunction of the particle energies.
Fig. 1.3 shows the cross sections for the following four possible candidatereactions as a function of the particle energy:
D + T −−→ 4He (3.5 MeV) + n (14.1 MeV) (1.1)
D + D 50%−−→ T (1.01 MeV) + p (3.02 MeV) (1.2)50%−−→ 3He (0.82 MeV) + n (2.45 MeV) (1.3)
D + 3He −−→ 4He (3.60 MeV) + p (14.7 MeV) (1.4)
The steep decrease in cross section for lower energies is due to the repul-sive electrostatic force between the positively charged nuclei. This Coulombbarrier must be overcome before the attractive nuclear force becomes suffi-ciently strong to achieve fusion, requiring reactant energies of the order ofmillions of Kelvin. Since energies above 100 keV (∼ 109 K) are considered tobe impractically high for a commercial reactor, today’s research on fusionenergy is based on the D-T reaction (eq. 1.1), which clearly has the largestreaction probability (cross section) below 100 keV.
The fusion fuel, deuterium and tritium, are both isotopes of hydrogen.Deuterium is a naturally occurring isotope and hence universally available,with an isotope abundance of 0.015%. The large mass ratio of the hydrogenisotopes makes their separation rather easy compared to for example theuranium enrichment process. Tritium occurs naturally in only negligibleamounts due to its radioactive half-life of 12.34 years. In a fusion powerplant the production (breeding) of tritium can be done on site using the

Chapter 1 1-7
following reaction:
n + 6Li→ T + 4He (1.5)
The reaction with lithium-68 (eq. 1.5), for which the reactant neutron issupplied by the D-T fusion reaction (eq. 1.1), is exothermic, providing evena small energy gain for the reactor. The supply of lithium is more limitedthan that of deuterium, but still large enough to supply the world’s energydemand for hundreds of years. To achieve tritium self-sufficiency, neutronmultipliers such as beryllium or lead need to be employed to produce neu-trons via (n,2n) reactions. The supply of presently foreseen neutron multi-pliers, especially beryllium, is limited and requires the further developmentof alternative sustainable solutions [14].
1.2.3 Fusion energy gain factor, Lawson criterion andtriple product
Intuitively an energy efficient fusion reactor has to induce a sufficient amountof fusion reactions (1 GW of fusion power equals 3.5 · 1020 D-T reactions/s),and the released energy has to exceed the energy required to heat up thereactants. The fusion energy gain factor, the Lawson criterion and the tripleproduct are criteria that formalize this requirement. To initiate fusion reac-tions in a reactor, external heating has to be used to heat up the fuel to therequired fusion temperatures. In this process all the molecular bonds willbe broken, rendering the fuel first into its constituent atoms, while furtherheating will lead to ionization, turning the fuel into a plasma, containingcharged particles: positive ions and negative electrons. When the plasma issufficiently hot so that fusion reactions become possible, the external heat-ing power, designated Pheat, can be lowered. A part of the total heatingpower will then come from the fraction of the fusion power contained in re-action products that remain in the plasma (namely the charged He2+ nucleiof 3.5 MeV, see further). This power may be designated fPfus. The powerthat leaves the plasma can in principle be used as energy source. The fu-sion energy gain factor is defined as the ratio of fusion power producedin a reactor to the power required to maintain the plasma in steady state:
Q = Pfus
Pheat(1.6)
Via the Q-factor we can define two important situations. The conditionof Q = 1 is referred to as break-even. It is somewhat arbitrary, but itdoes mean that a significant fraction (20%) of the heating power comes
8The natural abundance of 7Li/6Li is 0.924/0.076.

1-8 Introduction
from fusion. At conditions of ignition we have an infinite Q-factor whichcorresponds to a plasma that heats itself by fusion energy without externalinput. This is in fact not a necessary condition for a practical reactor buton the other hand, achieving Q = 20 requires conditions almost as good asthat required to achieve ignition.
A general measure for a fusion plasma to reach ignition is given by theLawson criterion and the triple product. The Lawson criterion is therequirement that the fusion heating exceeds the losses. It can be derivedfor the D-T reaction in the assumption that all the plasma species have thesame temperature, and that there are no ions present other than the fuelitself, which is a 50-50 mixture of D and T. In that case, the ion density isequal to the electron density (ne) and the energy density of both togetheris given by
W = 3nekBT (1.7)
where kB is the Boltzmann constant and T is the plasma temperature. Thevolume reaction rate kfus of fusion reactions is
kfus = nDnT〈σv〉 = 14n
2e〈σv〉 (1.8)
where σ is the collision cross section (given in Fig. 1.3), v is the relativecollision velocity, and 〈〉 denotes an average over the Maxwellian velocitydistribution at temperature T . The product of kfus with the energy releasedper reaction and available for heating, namely EHe2+ = 3.5 MeV (since theproduced neutron is not confined in the plasma, see next section), gives thenthe volume rate of heating by fusion. A confinement time τE is needed asa measure of the rate at which the system loses energy to its environment.Starting from the Lawson criterion,
(fPfus =) kfusEHe2+ ≥ Ploss = W
τE, (1.9)
a minimum value function is calculated for the product of ne and τE as afunction of the temperature T . For the D-T reaction, the minimum of theproduct occurs near T = 25 keV and is at least [15]
neτE ≥ 1.5 · 1020 m−3s. (1.10)
As the reaction rate 〈σv〉 varies proportional to T 2 in the temperature rangerelevant for a fusion reactor, the temperature dependency of the rhs of theabove equation can be approximately canceled out by multiplying both sideswith T . The resulting triple product provides a criterion for ignitionthat is especially useful for tokamaks because it is only a weak functionof density and temperature and therefore a good measure of the efficiency

Chapter 1 1-9
of the confinement scheme. For the D-T reaction, the ignition conditionbecomes [15]
neTτE ≥ 3 · 1021 m−3keVs, (1.11)
which for example would be reached by ne = 1020 m−3, T = 10 keV and τE =3 s. The precise value of this ignition condition in for example tokamaksdepends on the density and energy profiles.
1.2.4 Plasma confinement and the tokamak configura-tion
The triple product shows that high reactant temperatures, high reactantdensities and a good energy confinement are required to obtain a sufficientlyhighQ factor. Reaching these conditions appears to be a real challenge. Anytype of physical confinement like in fossil fuel or fission reactors cannot beused. First of all the materials would not withstand the high plasma tem-peratures, and secondly the energy confinement time τE of the plasma wouldbe too small. Evidently, a gravitational type of confinement that providesa sufficient plasma pressure to maintain ignition conditions like in stars9,is also not achievable in a reactor. Two paths are currently under studyto produce and control high triple product conditions. The first, known asinertial confinement, by raising a small volume (≈ 10 mg) of matter fora very short time (nano seconds) to very high density (≈ 1031 m−3) andtemperature (≈ 50 keV). In inertial confinement fusion one aims at ob-taining the greatest possible number of fusion reactions before the plasmadisperses. The second is trapping the plasma in a torus-shaped bottle cre-ated by magnetic fields, providing a magnetic pressure, and maintaining itat very high temperature. This is referred to as magnetic confinement(T ≈ 10 keV, ne ≈ 1020 m−3 and τE ≈ 10 s). The work presented in this ma-nuscript frames into the current research programs to magnetic confinementfusion.
Magnetic confinement relies on the fact that charged particles are af-fected by magnetic fields: any movement perpendicular to the field will bebent off by the Lorentz force, resulting in the spiraled charged particle tra-jectories along the magnetic field lines shown on Fig. 1.4, for a rectilinearmagnetic field. To avoid particle and energy losses along the field lines,the magnetic field can be closed off in a torus, creating the basis of thetokamak confinement scheme (see Fig. 1.5). The resulting toroidal mag-netic configuration significantly improves the energy confinement time, butappeared on its own not sufficient to attain the triple product conditions;
9In a star the plasma’s tendency of dispersing and consequently cooling down is bal-anced out by gravitational forces.

1-10 Introduction
Figure 1.4: Illustration of charged particle confinement by magnetic fields. Thetop and bottom figure give respectively the charged particle motion in absenceand presence of a rectilinear magnetic field, where in the latter case the degree offreedom is limited to one direction: namely along the field lines. [16]
since the toroidal magnetic field has inevitably a field gradient along itsmain radius R, there will be a drift of particles perpendicular to both thefield and the field gradient. This drift works in opposite directions for posi-tive and negatively charged particles creating a vertical electric field in thetorus, which in turn will cause a drift of particles to the low magnetic fieldside. To minimize the particle and energy leakage even more, a circularpoloidal magnetic field is added to the toroidal field, resulting in a heli-coidal magnetic configuration. The resulting helicoidal magnetic field lineswill form magnetic surfaces, drawn by the path of the magnetic field linesas indicated in Fig. 1.5 and 1.6, connecting the low field side magneticallyto the high field side, and likewise the top to the bottom, which compen-sates the particle drifts. In a tokamak the toroidal field is generated by aseries of magnets encirculating the plasma poloidally: the toroidal field coils(Fig. 1.5). The circular poloidal magnetic field is produced by an intenseaxial current flowing in the plasma itself, generated by induction like in atransformer. The first ‘transformer’ winding is the central solenoid (CS): acoil made up of horizontal layers placed in the center of the configuration.The secondary winding is the plasma itself. Additional poloidal field coilsare employed to achieve plasma equilibrium and to optimize the shape ofthe magnetic surfaces.
The tokamak magnetic confinement configuration has been successfullyused to produce fusion reactions [6], and is currently the path that has been

Chapter 1 1-11
Figure 1.5: Schematic of the tokamak field coils and magnetic field configuration[17]. The toroidal magnetic field is induced by the toroidal field coils, the poloidalfield coils add a first poloidal component to this field and the second poloidalcomponent is induced by the plasma current, which is in turn induced by varyingcurrents in the central solenoid.
studied the most. The helicoidal field configuration has also given birthto a second type of machine, namely the stellarator. Here the magneticconfiguration is entirely based on external currents, flowing in helicoidalcoils.
1.2.5 Plasma heatingIn present tokamak devices three heating methods are employed to bringthe plasma to the required high temperatures to achieve fusion reactions:ohmic heating, neutral injection and radio frequency heating.
1.2.5.1 Ohmic heating
In a tokamak the plasma is heated by the Joule effect via the current flowingin the plasma that is intended to complete the helicoidal magnetic field. Atlow temperature this heating is very strong but, because the resistance ofthe plasma varies with temperature as T−3/2, it is less efficient at high tem-peratures [15]. Ohmic heating alone it is not sufficient to drive the plasmaup to fusion conditions. The required current would be higher than themaximum physically achievable plasma current determined by the tokamakdimensions, toroidal magnetic field strength and the plasma safety factor.

1-12 Introduction
1.2.5.2 Neutral beam injection
To heat up the plasma to higher temperatures a beam of energetic neutralatoms (≈ 100 keV) can be injected into the plasma. These neutrals areproduced by neutralizing accelerated deuterium ions, and will penetrateinto the center plasma where they are ionized by collisions with plasmaparticles. The resulting ion, carrying most of the kinetic energy of theinjected neutral atom, is confined by the magnetic field and will transferits energy to the plasma through Coulomb collisions, causing the plasma toheat up.
1.2.5.3 Radio frequency heating
The plasma may absorb energy from electromagnetic waves at frequenciescharacteristic to the plasma. These waves are transmitted to the plasmaby antennas. When an electromagnetic wave propagates in the plasma,the electric field of the wave accelerates particles which then heat up theplasma via collisions. There are wide varieties of wave modes observedin fusion plasmas which allows many different heating scenarios via theinjection of electromagnetic waves. The choice of wave frequency definesthe type of particles and the area through which the wave will be absorbed.We separate the ion cyclotron range of frequencies (ICRF, 10-100 MHz), thelower hybrid frequencies (LH, 1-10 GHz) and the electron cyclotron rangeof frequencies (ECRF, 50-150 GHz).
1.2.5.4 Heating by fusion reactions
As already mentioned, a fourth heating mechanism comes up when thereare a great number of fusion reactions. The produced energetic and chargedhelium nuclei remain confined in the magnetic field and will contribute tothe plasma heating by collisions. The produced neutrons are not confined,and will deposit their energy mainly in the vessel walls.
1.2.6 Limiter and divertor configurationThe confinement of the tokamak magnetic configuration is limited to thefield lines that do not intersect with material components of the vessel walls[15, 18]. The inevitable wall intersection points of the outer field lines leadto the deposition of an enormous amount of energy (flux of the order ofMW/m2) due to the high plasma temperatures and the particle transportparallel to the field lines. In order to control these heat loads and to preventwall damage, dedicated components are placed in the chamber to receive

Chapter 1 1-13
Figure 1.6: Poloidal cross section of two tokamak plasma configurations. Left:limiter configuration with circular plasma (e.g. TORE SUPRA and TEXTOR).The last closed flux surface delimits the border between closed field lines andopen field lines. Right: divertor configuration with elongated plasma (e.g. JET,ASDEX Upgrade, ITER). The separatrix delimits the border between closed andopen field lines. At the X-point, created by divertor coil currents, negative withrespect to the plasma current, the poloidal magnetic field is zero (the magneticfield lines do not cross in this null point). [18]
and extract the heat load from the plasma. Two designs can be distinguished(Fig. 1.6): the limiter configuration and the divertor configuration.
1.2.6.1 Limiter
The limiter is a solid surface that defines the edge of the confined plasmasince it is the first material component intercepting the field lines with re-spect to the plasma center. We distinguish the complete poloidal limiter,acting as diaphragm to the toroidal magnetic field, the incomplete poloidallimiter known as rails or bumpers which are used for example to protectvulnerable wall elements like antennas etc., and the toroidal limiter, limitedin poloidal extent but complete in toroidal direction. In general the toroidallimiter defines the last closed flux surface (LCFS), delimiting the core re-gion where field lines are closed, to the plasma boundary or edge where thefield line are open and intercept the limiter. In this edge region, called thescrape-off layer (SOL), the plasma-wall interaction takes place (see section1.4). Limiters play an important role in tokamak operation: (1) localiz-ing the plasma surface interaction, (2) localizing particle recycling and (3)protecting wall from plasma when there are disruptions, runaway electrons,or other instabilities. The disadvantage of the limiter configuration is thatreleased neutral impurity atoms from the limiter surface can enter directlyinto the confined plasma. Examples of tokamaks employing the limiter

1-14 Introduction
configuration are TEXTOR and TORE SUPRA.
1.2.6.2 Divertor
In the divertor configuration, the LCFS is determined solely by the magneticfield lines so that the first solid surface, the divertor target, is at somedistance from the LCFS. Outside the separatrix, separating the open fromclosed flux surfaces, the plasma will flow toward the divertor targets inwhich vicinity its heat flux will cool down significantly by radiation (due tothe presence of recycled particles and seeded impurities). Eventual releasedimpurities from the target will be ionized and swept back with the plasmaflow to the target before they can reach the last closed flux surface, limitingthe impurity contamination of the central plasma. Examples of tokamaksequipped with a divertor are ASDEX Upgrade, JET and ITER (see further).
1.2.7 The European tokamaks TORE SUPRA, TEX-TOR, ASDEX Upgrade and JET
Throughout this manuscript, experimental results obtained on the tokamaksTORE SUPRA, TEXTOR, ASDEX Upgrade and JET are discussed. Herea short presentation of the devices is given, providing information relevantfor our analysis. Table 1.2 gives an overview of their main parameters, andFig. 1.8 illustrates a comparison of their plasma sizes.
1.2.7.1 TORE SUPRA
The tokamak TORE SUPRA is exploited by the Institute for Research onMagnetic Fusion (IRFM) inside CEA/Cadarache (France). The tokamakhas a circular plasma in limiter configuration. TORE SUPRA’s main fea-tures are its superconducting toroidal field system that enables the genera-tion of a permanent toroidal magnetic field, and its actively cooled plasmafacing components. These two features allow the study of plasmas withlong pulse duration. Fig. 1.7 shows the inner vacuum vessel with some im-portant parts numbered. The toroidal pumped CFC limiter on the bottomof the vessel can clearly be seen. It is actively cooled and capable of ex-tracting 15 MW of power transferred by the plasma particles. In the samematerial, TORE SUPRA is also equipped with six pairs of inner bumpers,private protection limiters on the ICRH antennas and the LH antennas,and a movable antenna protection limiter. The whole area is covered byinox panels to protect the machine from radiation. Among other heatingsystems (see table 1.2) TORE SUPRA is equipped with three double loopICRF antennas, each with two solid straps and tilted Faraday screen, ableto provide all together 10 − 12 MW of heating power for 30 s. The ICRH

Chapter 1 1-15
Figure 1.7: View inside the vacuum vessel of TORE SUPRA: 1. carbon limiter,2. inner bumper (6 pairs), 3. ICRH antenna with carbon protections, 4. LH an-tennas with carbon protections and 5. movable antenna protection limiter (LPA).
frequency range is 40− 70 MHz. A scheme of TORE SUPRA’s main vesselsystems is given in appendix A.
1.2.7.2 TEXTOR
The tokamak TEXTOR is exploited by the Institute of Energy and Cli-mate Research, Plasma Physics (IEK-4), inside the Jülich Forschungzen-trum (Germany). TEXTOR is a Tokamak Experiment for Technology Ori-ented Research in the field of plasma wall interaction. The tokamak hasa circular plasma in limiter configuration. It is equipped with a toroidalgraphite limiter (ALT-II), poloidal limiters at the top and the bottom ofthe vessel, and an inconel liner shell. To facilitate the investigation of plasmasurface interactions (PSI), two so-called limiter-locks have been developedand mounted at different toroidal sections on the bottom and the top ofthe vessel (see ‘Lim lock’ location on figure A.6 in appendix A.2) [19]. Thepositioning of material elements and diagnostic probes in these ports offersa wide range of possibilities for PSI research.
Among other heating systems (see table 1.2) TEXTOR is equipped withtwo double loop ICRF antennas, able to provide 2 MW of (generator) powereach. Antenna A1 has two poloidal straps, each consisting of three paralleltubes without faraday screen, and antenna A2 has two solid poloidal currentstraps with faraday screen. The ICRH frequency range is 25 − 38 MHz.Unlike for the A2 antenna, A1 can be switched from π-phasing to 0-phasing.A scheme of TEXTOR’s main vessel systems is given in appendix A.

1-16 Introduction
1.2.7.3 JET
The Joint European Torus (JET), Europe’s largest fusion device, is ex-ploited by the UK Fusion Association, inside Culham Centre for FusionEnergy, CCFE. As a joint venture, JET is collectively used by more than40 laboratories of EURATOM Associations for which the European FusionDevelopment Agreement (EFDA) provides the work platform [20]. JEThas a D-shaped plasma and is equipped with a pumped divertor. The mainplasma facing component is carbon (CFC). Among other heating systems(see table 1.2) JET is equipped with four ICRF antennas, each consistingof four poloidal straps, able to provide altogether 32 MW of power, in afrequency range of 23−57 MHz. On the ICRF antennas beryllium elementsare present, such as the beryllium Faraday screen of the ITER like ICRHantenna [21].
Recently the installation of an ITER like wall has been finalized on JET,replacing the CFC wall elements by beryllium, tungsten coated elements,and tungsten divertor strike points [22].
1.2.7.4 ASDEX Upgrade
The ASDEX Upgrade (AUG) tokamak (Axially Symmetric Divertor EX-periment), is exploited by the Max-Planck-Institute for Plasmaphysics inGarching (Germany) and went into operation at Garching in 1991. AS-DEX Upgrade is Germany’s largest fusion device at present, and is dedi-cated to investigating crucial problems in fusion research under reactor-likeconditions. The tokamak plasma has a D-shape in divertor configuration.Among other heating systems (see table 1.2), ASDEX Upgrade is equippedwith an ICRH system consisting of four generators of 2 MW each and fourdouble loop antennas. The generators, tunable in frequency from 30 to120 MHz, cover several heating scenarios over a wide range of magneticfields (BT = 1− 3.9 T) [23].
1.3 Fusion development and the ITER projectWith the ITER project, a global collaboration is formed to push forwardthe development of fusion. The seven members of the international projectare China, EU, India, Japan, Korea, Russia and USA [24]. The projectrepresents a large-scale scientific experiment that aims to demonstrate thefeasibility of producing commercial energy from fusion. The objective ofthe ITER project is to gain the knowledge necessary for the design of thenext-stage device: a demonstration fusion power plant (DEMO). In ITER,scientists will study plasmas under conditions similar to those expected in

Chapter 1 1-17
Table 1.2: Principle parameters of European tokamaks JET, TORE SUPRA(TS), ASDEX Upgrade (AUG) and TEXTOR, including a comparison with ITER:Major (R0) and minor radii (a/b), plasma (Vpl) and vessel volume (Vvel), toroidalmagnetic field strength (BT ), plasma current (Ip) available plasma heating sys-tems (P ), main plasma facing components, average pulse duration, and configu-ration.† possible to operate with tritium? field provided by superconducting magnets
Tokamak ITER† JET† TS AUG TEXTORR0 [m] 6.2 2.96 2.4 1.65 1.75a/b [m] 2/3.7 1.25/2.1 0.72 0.5/0.8 0.5Vpl [m3] 840 155 25 14 7Vvel [m3] 1400 185 50 41.56 17.4BT [T] 5.3? 3.45 4.5? 3.9 3Ip [MA] 15 7 1.7 2 0.8Pulse dur. [s] > 400 ∼ 10 30-300 < 10 ∼ 10PICRH [MW] 20 10 9 8 4PECRH [MW] 20 - 0.7 2 0.8PLH [MW] - 12 4 - -PNBI [MW] 33 25 - 20 3Main PFC Be & W C C W C
(+C) (+Be) (+C) CConfig. Div. Div. Lim. Div. Lim.
a future power plant. ITER will be the first fusion experiment to producenet power; it will also test key technologies, including heating, control,diagnostics, and remote maintenance. The ITER site is located in southof France (Cadarache), covering a total area of 180 hectares. The scientificbuildings and tokamak facilities are currently under construction. The firstplasma is expected to take place in November 2019.
Next to the ITER project, each member state has its own fusion researchframework. For Europe we distinguish the European Fusion DevelopmentAgreement (EFDA) which is an agreement between the European fusionresearch institutions and the European Commission to strengthen their co-ordination and collaboration, and to participate in collective activities [25].Its activities include coordination of physics and technology in EU labora-tories, the exploitation of the present world’s largest fusion experiment, theJoint European Torus (JET) in the UK, training and career development infusion and EU contributions to international collaborations. The Europeancontribution to ITER is the responsibility of the European Domestic Agencycalled Fusion for Energy, which is based in Barcelona. The European Do-mestic Agency serves as the link between the European Commission and the

1-18 Introduction
Figure 1.8: Comparison of the plasma sizes of TEXTOR, TORE SUPRA, AS-DEX Upgrade, JET and ITER. ITER will be significantly larger than the largestpresent device JET.
ITER Organization. All of the seven members of the international ITERproject have created Domestic Agencies to act as link between nationalgovernments and the ITER Organization.
It is important to mention that all research efforts by the constituentinstitutions of the above organizations aim to converge into the consolida-tion of fusion. Therefore every studied subject, whether it is of physical,technological or operational considerations, is encouraged to be ITER orDEMO-relevant. The presented work in this PhD manuscript handles oneof these subjects, but is of course not the only one.
1.3.1 The objective of ITERAs mentioned above the ITER project aims to test the feasibility of fusion.In detail, the objectives of ITER are to demonstrate that it is possible toproduce energy from the D-T reaction in a controllable manner, to confirmthe availability of the fundamental techniques required to operate a fusionreactor, and to test the resistivity of wall materials to reactor like conditions[26]. To achieve these objectives, ITER was designed to satisfy followingconditions [26]:
1. Maintaining fusion reactions for 400 s with the amplification factorQ ≥ 10.

Chapter 1 1-19
2. Achieving stable operation with Q ≥ 5.
The principal design parameters of ITER are summarized in table 1.2 incomparison with current tokamaks.
1.3.2 The tokamak ITER1.3.2.1 The magnetic system
The fully superconducting magnetic system [24] of ITER consists of 18toroidal field coils, 6 poloidal field coils, a central solenoid (CS) and a setof correction coils that magnetically confine, shape and control the plasmainside the vacuum vessel (Fig. 1.9, left). In order to achieve superconductiv-ity, all coils are cooled with supercritical helium to the temperature around4 K. To provide thermal protection for the superconducting systems, thecoils (and vacuum vessel) are enclosed within the cryostat. The toroidalfield coils, formed in D-shape, are designed to withstand 1000 chargingcycles from zero to full current during the whole ITER lifetime, and the su-perconducting material for both the central solenoid and the toroidal fieldcoils is chosen/developed to achieve operation at high magnetic field (13 T).
1.3.2.2 Vacuum vessel
The vacuum vessel [24] is a hermetically-sealed steel container inside thecryostat (Fig. 1.9, left) that houses the fusion reaction and acts as a firstsafety containment barrier. Fig. 1.9 (right) shows a poloidal cross-sectionalview of vacuum vessel. The toroidal vessel measures a little over 19 metersacross by 11 meters high, and weight in excess of 5000 tons. The vesselhas double steel walls, with cooling water flowing between them. The innersurfaces of the vessel are covered with blanket modules that will provideshielding from the high-energy neutrons produced by the fusion reactions.Some of the blanket modules will also be used at later stages to test materialsfor Tritium Breeding concepts.
1.3.2.3 The divertor
The ITER divertor [24] (Fig. 1.9, right) is located at the bottom of thevacuum vessel, and consists of 54 remotely-removable cassettes, each holdingthree plasma-facing components, or targets: the inner and the outer verticaltargets, and the dome. The targets are placed at the intersection of magneticfield lines where the high-energy plasma particles strike the components.The heat flux received by these components is extremely intense and requiresactive water cooling. Next to the high heat handling capabilities (divertor

1-20 Introduction
Figure 1.9: Left: Schematic of the ITER tokamak showing the doughnut-shapedvacuum vessel, the superconducting coils surrounding the vessel, the cryostat sur-rounding the vessel and coils (providing the thermal insulation for the supercon-ducting systems), and the ports through which diagnostics and heating deviceswill be inserted. Right: A cut-away of the ITER vacuum vessel showing theblanket modules attached to the inner wall and the divertor at the bottom.
target temperatures are estimated to reach 3000 C), the divertor is designedto efficiently remove the helium ash produced by fusion reactions.
1.3.2.4 The plasma facing components
The primary function of tokamak plasma facing components (PFC) is toprovide adequate protection of in-vessel structures, sufficient heat exhaustcapability and being compatible with the requirements of plasma purity [27].The PFC’s are chosen according to the following criteria:
1. To avoid high radiation in the plasma center, the blanket modules(680 m2, < 0.22 MW/m2) will consist of the low Z material beryllium.
2. For its low erosion and high melting point, the divertor will be madeof the high Z material tungsten.
3. For its tolerance with excess loads the strike points (6 − 8 m2, <10 MW/m2) of the divertor will in the first ITER operation stage bemade of high heat resistive carbon composites. This material presentsthe advantage of high thermal conductivity and it enables an easierlearning process for the first years of ITER operation. Then the sec-ond divertor set will be made of tungsten which has the advantage offeaturing a lower erosion rate and thus a longer lifetime.

Chapter 1 1-21
On ITER, long pulse high power operation, leading to significant mate-rial erosion, will be combined with severe restrictions on permitted plasmacore impurity concentrations. In addition, the walls will be subject to tran-sient energy loads on a scale unattainable in current devices [27]. Thismakes that the choice of wall materials, as well as the control of plasmawall interaction is an important and challenging research domain.
1.3.2.5 The IC heating and current drive system
Among other heating systems (20 MW of ECRH and 33 MW of NBI, see ta-ble 1.2), the ITER IC heating and current drive system is designed to couple20 MW of power to the plasma in the frequency range of 40 to 55 MHz [28].The IC system comprises two port plug antennas, consisting each of fourparallel poloidal arrays of six straps [28, 29]. The radiated power spectrumof the antenna is foreseen to be adjustable by control of the toroidal phasedifferences between antenna voltages or currents to any desired set of an-gles, and by control of the voltage or current ratios between columns ofstraps [28].
1.4 Plasma wall interactionPlasma wall interaction (PWI) is a key issue for steady state fusion devices.The understanding and the control of the strong and complex interactionbetween the plasma center, the edge and the wall, is an extensive researchdomain inside fusion research. In the following we will only give a basicoverview of the PWI processes and resulting effects like impurity release,fuel recycling, fuel retention and dust formation. The overview of the PWIprocesses is required to set the basis of the subject of this manuscript,which is wall conditioning. The overview of the resulting effects is requiredto motivate the utility of wall conditioning.
1.4.1 Overview basic PWI processesThe basic plasma surface interaction processes discussed here are erosion(via sputtering and chemical erosion), implantation, trapping, deposition,adsorption and desorption. These processes may induce release of wall ma-terial and thus introduce impurities in the plasma (impurity desorption),affect the hydrogenic particle balance (fuel recycling) [30], and induce degra-dation of wall materials as will be discussed further.

1-22 Introduction
Figure 1.10: Physical sputtering yields for normal incidence deuterium impacton various fusion relevant substrates as a function of the impact energy, andcomparison with the sputtering yield of C on W, illustrating the strong yielddependence on projectile mass. [31]
1.4.1.1 Erosion
Erosion of plasma facing components (PFC) happens via physical sput-tering, chemical sputtering and chemical erosion. It is an important phe-nomenon in fusion devices, determining for example the co-deposition ratethat results in fuel retention which will be discussed later in this section.
Sputtering is a momentum transfer process which releases atoms whenenergetic particles, hydrogen or impurities, ions or neutrals, strike solid sur-faces. An important contribution to sputtering comes from energetic neu-trals arising from resonant charge exchange between hot plasma-ions withcold neutrals. Once an energetic particle is incident on a solid surface, it willproduce a collision cascade among the lattice atoms. Sputtering takes placewhen this cascade results in imposing sufficient energy on a surface atom toexceed the surface binding energy, of the order of a few electron volts for fu-sion relevant materials [15]. One can further distinguish physical sputteringprocesses from chemical sputtering. Physical sputtering is a thresholdprocess with a yield that is strongly dependent on the target to projec-tile mass ratio, since momentum transfer improves rapidly as the incomingparticle mass approaches that of the target atoms [31]. Fig. 1.10 takenfrom [31] shows the physical sputtering yields for deuterium bombardmenton fusion relevant materials, illustrating its typical threshold behavior. Thefigure includes one particular ITER relevant case of carbon bombardmenton tungsten to demonstrate the dramatic increase in yield for higher massprojectiles. For reactive species, sputtering can continue below the physicalsputtering threshold energy, which is called then chemical sputtering.

Chapter 1 1-23
The threshold energy for chemical sputtering is extremely low and so it willnearly always occur whenever chemically reactive species interact. Finallychemical erosion by non energetic species, an important process after forexample sputtering, arcing and disruption events, contributes also to thedegradation of the surface material and to impurity desorption. Chemi-cal erosion by hydrogen and oxygen contributes strongly to the erosion ofcarbon materials, forming volatile hydrocarbons and carbon oxides [32].
The carbon erosion through chemical and physical sputtering on TEX-TOR, mostly stemming from the toroidal belt limiter, is estimated to be≈ 22 gC/h. The carbon and beryllium erosion on JET in the 1999-2001campaign was estimated to be respectively ≈ 32 gC/h and ≈ 1.4 gBe/h,and for the ASDEX-Upgrade 2002-2003 campaign the tungsten erosion wasestimated to be ≈ 1.4 gW/h [31].
1.4.1.2 Deposition and re-erosion
The eroded wall material is transported by the plasma flow in the SOL,and has a high possibility to be redeposited elsewhere on the wall surface.Repetition of the process of erosion and redeposition allows large amountsof material to migrate over the surface area. The extensive analysis in [31]shows that most of the eroded wall material, for which the erosion rateestimations are given above, is redeposited. Although material erosion, mi-gration and redeposition is of no operational significance in current shortpulse (< 10 s) tokamaks, it will be an important issue in ITER. Already onTORE SUPRA, there are clear indications of increasing operational limi-tations during the experimental campaigns due to presence of re-depositedlayers that affect the high power and long pulse performance [33].
In case the eroded material is chemically reactive with the fuel species,as is especially the case for carbon, but also for beryllium, large amountsof hydrogen can be stored in so called co-deposited layers: H/C concentra-tions of about 0.4 [34]. In most of the present day tokamaks with low Z
PFCs, long term fuel retention is dominated by co-deposition. In divertormachines, co-deposition occurs mainly on the inner divertor surfaces andshadowed areas of the outer divertor and limiters [31].
1.4.1.3 Implantation and bulk trapping
Co-deposition is not the only hydrogen retention mechanism. For instancefor high Z materials, implantation and bulk trapping is the dominant hy-drogen retention process. A study of Roth [34] summarizes the retentiondue to implantation and bulk trapping for fusion relevant materials: forberyllium at 300 K for an incident D-ion flux of 200 eV, the implantation

1-24 Introduction
will stop after reaching a local concentration in range of about 30 at%. Fora similar incident ion flux, CFC components show no saturation of the to-tal implanted amount of hydrogen as a function of fluence10. Instead, theretained amount increases close to a square root of the ion fluence dueto diffusion deep into the bulk of the material. In tungsten, deuterium ishighly mobile and is only retained in radiation damage sites or defects of thecrystal lattice. After saturating available traps, inward diffusion and sub-sequent trapping at deeper lattice defects increases the trapped inventory.The retention greatly depends on the crystalline structure of the substrate.The fuel retention properties of tungsten plasma facing materials may beenhanced due to radiation damage after high fluence n-irradiation.
1.4.1.4 Surface adsorption
Gases can be adsorbed on surfaces in a variety of states. In general, phy-sisorption, which is due to Van der Waal’s forces, has a low binding en-ergy of typically ≤ 0.5 eV, whereas chemisorption, involving the exchangeor sharing of electrons in a chemical bond, has binding energies of typi-cally several electron volts. On most surfaces there is a wide variety ofdifferent sites for adsorption due to imperfections, steps on the surfaceand multiple layers of adsorbed gas, leading to an almost continuous rangeof binding energies [35]. The presence of absorbed particles on the wallscan be significant. Under normal vacuum conditions a surface will be cov-ered by a layer of adsorbed gas coming from the surrounding atmosphere.An important example of such surface absorbed gas is oxygen, stemmingfrom air exposure during chamber venting (order of 100 monolayers), orwater in case of a water leak. A release of an atom surface coverage of1 monolayer, accounting for 2 · 1019 particles/m2, increases the plasma den-sity at least by ∼ 1019 particles/m3, which comes close to the order of thefusion plasma density itself. As the binding energies of adsorbed atoms ormolecules are much lower than the plasma temperature, the bindings canbe easily broken by impinging plasma species: for long TORE SUPRA dis-charges the ion fluency from the edge plasma to the wall is of the order of1022 D+/s ≈ 1.5 ·1020 D+/m2s, i.e. high compared to the monolayer density,with energies around ∼ 200 eV, i.e. 2 to 3 orders of magnitude higher thanthe binding energy [36].
1.4.1.5 Desorption
Besides material release due to sputtering and erosion we distinguish alsoother desorption processes as re-emission, thermal desorption, photon in-
10Fluence is the flux integrated over time.

Chapter 1 1-25
duced desorption and more exotic types like desorption due to evaporation,shock (disruptions), arcing and blistering [35,37]. Re-emission and thermaldesorption are of particular interest for our subject.
Physisorbed particles can be released by thermal desorption, for whichthe desorption rate will depend on the material temperature. For example,for a binding energy of Eb = 1 eV the time taken for surface depletionat 600 K is less than 1 second, whereas at 300 K the time taken wouldbe more than 10 hours. More tightly bound molecules or atoms (withEb = 2.5 eV) will not be released in any realistic time, even at temperaturesup to 700 K [35].
Diffusing particles in the material bulk will, as they reach the surfacebefore encountering a trapping site, be re-emitted into the plasma. Chem-ically active particles such as hydrogen require generally to recombine, forexample to hydrogen molecules or hydrocarbons, into volatile products thatcan be released from the wall surface. The characteristic time for particlerelease by this mechanism is defined by the diffusion coefficient D of theparticle in the material, surface recombination coefficient Kr and volumerecombination coefficient Γ. A description of diffusion and desorption iscomplex and needs to take into account, besides the above coefficients, theparticle deposition profile of the plasma wall fluxes into the material, aspatially resolved trapping site concentration and its availability [38,39]
1.4.2 Impurity desorptionAn important deleterious result of plasma wall interaction is due to therelease of impurities. Impurity accumulation in the plasma has multipleunfavorable effects from which it is clear that their release has to be re-duced11 [30]:
• Cooling of the plasma by radiation (Te ). There are two types ofprocesses involved. The first is the enhancement of bremsstrahlungbecause of the higher effective charge Zeff of the plasma on introduc-tion of charged plasma impurities [15]:
Zeff =∑j njZ
2j∑
j njZj(1.12)
with nj and Zj the ion density and its charge, and the sum over j rep-resents the sum over all present ions. The second is the enhancement
11In section 1.2.6 a beneficial effect of impurities is mentioned, namely the enhancedradiation in divertor area, reducing the heat load to the divertor strike points. However,to achieve this enhanced radiation one will not rely on the impurities eroded from theplasma facing components, but controlled amounts of impurities will be injected into thedivertor area.

1-26 Introduction
Figure 1.11: Radiation parameter R of various plasma impurities as a functionof Te. The radiated power Prad is given by Prad = Rneni where ne and ni are theelectron and impurity densities, respectively. [30]
of the characteristic radiation. The radiated power by line radiationand bremsstrahlung increases strongly with the atomic number Z (seeFig. 1.11, taken from [30]).
• Dilution of the plasma fuel reducing the fusion power (ni ),
• Lower plasma stability and global energy confinement (τE ) by in-creasing the effective charge of the plasma and thus the plasma resis-tivity [15],
η = ηsZeff , ηs = 2.8 · 10−8T−3/2e ohm m, with Te in keV, (1.13)
• Enhanced erosion of wall materials by sputtering due to multiply ion-ized impurities. As impurities enhance erosion of wall materials, theimpurity accumulation in the vessel is strongly non-linear.
1.4.3 Hydrogen recyclingUnder exposure to hydrogen plasmas the wall builds up a subsurface hydro-gen concentration. The plasma will continuously exchange hydrogen withthese so called hydrogen wall reservoirs, a non-negligible process known ashydrogen recycling. The characteristics of these hydrogen reservoirs dependstrongly on the wall materials, whether they are metallic surfaces, ceram-ics such as graphite or boron and silicon containing layers. Most of theinvolved processes saturate after certain hydrogen fluence. The hydrogenrecycling can vary from a state in which the wall strongly absorbs particles

Chapter 1 1-27
(wall pumping) to a state in which the plasma is almost completely fueledby hydrogen from the wall. In the latter case it is impossible to control thedensity of the plasma.
For metals the recycling flux is determined by the value of the recyclingconstant R = D/Kr where D is the hydrogen diffusivity in the bulk metaland Kr is the recombination rate constant for the recombination of hydro-gen atoms into hydrogen molecules at the surface. After a characteristicrecycling time τR = R/Qftw, 50% of the initially pumped hydrogen fluxis re-emitted back from the surface (Qftw is the impinging hydrogen fluxdensity) [30].
Hydrogen recycling in carbon devices is more complex. In steady statesituation the recycling coefficient can be written as R = Qsw/Qftw, whereQsw is the wall released flux density. Carbon plasma facing components canstore up to 0.4 H/C within the range of the impinging hydrogen particles(∼ 6 · 1022 D/m2 [40]). The importance of particle induced hydrogen des-orption from this accessible reservoir is a direct consequence of the largeamounts of hydrogen that can be stored in this reservoir. Additionally onTORE SUPRA, a transient storage of hydrogen is observed, accounting formaximum ∼ 5 · 1021 particles and saturating in the first 100− 150 s of longdischarges [41]. These particles are recovered at the end of the discharge.Next to these reservoirs, one distinguishes also a temporary reservoir repre-senting hydrogen that is sticking to the wall surface that can be released atthe start of a discharge, and a permanent reservoir representing co-depositedhydrogen and hydrogen implanted in deeper layers.
1.4.4 Tritium retentionThe administrative limit attributed to the tritium in-vessel inventory forITER is set to 640 g12 [42]. A study on the tritium inventory build-up,due to retention, in ITER has been conducted by Roth et al. [34], takinginto account T implantation in CFC, co-deposition of T with eroded C, Timplantation in Be, T co-deposition with Be and T implantation in W. Inthis study the limit was set to 700 g as a figure of merit. The result, sum-marized in Fig. 1.12, shows that, dependent on the choice of wall materials,the tritium inventory limit is reached in 500 full power ITER discharges(400 s burning duration, 50:50% of D:T, Q = 10, 15 MA) for the initial walldesign (CFC, W and Be), or, in case of a Be-W wall after 1400 to 4600discharges, which explains why for the active phase of ITER the CFC inthe divertor will be changed to tungsten. But even with this wall materialdesign, the limit of say 3000 shots, can be attained in less than 1 year of
12Limit imposed by safety considerations [34].

1-28 Introduction
Figure 1.12: Estimations of the tritium inventory build-up in ITER for differentwall materials: the initial material choice (magenta), all-C (blue), all-W (red), andthe present preferred option, namely a W divertor and Be first wall (black). Theassessment was performed assuming different particle fluxes to different divertorand wall areas. Divertor: 3 m2, 2 · 1024 (D + T)/m2s, 775 K; baffle: 47 m2, 2 ·1023 (D + T)/m2s, 500 K; and wall: 750 m2, 1−5 ·1020 (D + T)/m2s, 380−440 K.[34]
ITER exploitation, counting for 20 shots per day, 11 operation days per op-eration cycle, and 35 operation cycles per 2 years, according to [42]. In thisrespect, the daily tritium inventory build-up is estimated to be 3−9 gT/day(20 DT-discharges).
Unless schemes for tritium recovery, or to mitigate the tritium inventorybuild-up, are implemented, retention would pose serious restrictions on theITER operation lifetime. The ITER approach to manage the tritium in-ventory consists of a regime of controlled operations with a spectrum ofrecovery techniques called ‘good housekeeping’. These good housekeepingstrategies mentioned by Roth [34] are completely based on wall conditioningtechniques.
1.4.5 Dust formationTo complete the overview of on plasma wall interactions, the formation ofdust must be mentioned. Dust formation in future fusion reactors is at-tracting growing attention of researchers due to potentially crucial safetyand operational issues arising from its high mobility and reactivity [43].Furthermore, the amount of tritium stored in dust particles can be sig-nificant. Analysis after operation of the JET machine with the MKIIadivertor, showed that 10% of the deuterium and tritium introduced in themachine during this campaign can be stored in dust, flakes and deposits.

Chapter 1 1-29
The chemical composition of the flake/deposits (180 g) and dust (30 g) ma-terial consisted mostly of carbon (∼ 98%), with small amounts of berylliumand metals (∼ 1% each) [44].
Dust can be formed in fusion reactors by various plasma wall interac-tion processes damaging inner tokamak surfaces, or grow in relatively cold,impurity-rich plasma regions inside the tokamak [45]. The PWI productionmechanisms, strongly depending on the plasma facing materials, can besummarized as flaking of deposited layers, melting of surface layers, brittlewall surface destruction, hot spots and unipolar arcs [46]. The removal ofdust from the tokamak vacuum vessel in future machines is currently a fieldunder study. It considers a three stage process comprising material mo-bilization (unsticking materials from the surfaces including surface gaps),collection of the mobilized materials, and transport within the vessel for fi-nal removal [47], which is not evident to perform in a nuclear (T) and toxic(Be) environment.
1.5 Wall conditioningTo control the described surface interactions there are three actors: (1)proper selection of wall materials, (2) proper selection of tokamak magneticconfiguration, e.g. divertor, limiters, and operation regimes and (3) controlthe wall surface state. This manuscript focuses on the third actor, namelywall conditioning. In present devices a set of wall conditioning techniquesare used to set the wall surfaces in the desired state. Their main issues are:
1. controlling the generation of plasma impurities liberated from the wall,
2. controlling the recycling of hydrogenic fluxes,
In the good housekeeping approach of ITER there is a third importantmotivation for wall conditioning namely:
3. reducing the tritium inventory,
for which one will rely mostly on the removal of tritium-rich codepositedlayers. From tokamak operational point of view, the three wall conditioningaims translate into:
• recover after torus vents to ensure plasma start-up,
• recover after leaks to ensure plasma start-up,
• recover after disruptions to ensure plasma start-up,
• desaturate the wall from hydrogen isotopes to ensure plasma start-up,

1-30 Introduction
• change the wall isotopic ratio to control the plasma isotopic ratio,
• improve plasma performance by impurity removal or deposition ofcoatings
• extend tokamak operation license by removing tritium.
This section gives an overview of the current employed techniques and theiraims, and explains the need for a new technique in future fusion devices.
1.5.1 Methods of wall conditioning1.5.1.1 Baking
As mentioned in section 1.4.1.5, heating of wall material induces thermaldesorption of particles. The conditioning technique ‘baking’ is based on thiseffect: the wall surfaces are heated up to temperatures up to 500 K (TORESUPRA [48]), 500-700 K (TEXTOR [49, 50]), 470-510-620 K (respectivelyforeseen on ITER vessel, blanket and divertor cassettes [42]). Baking is alengthy procedure (order of days) and is in most tokamaks only employedafter machine venting and in-vessel interventions to remove absorbed oxygenand water. For example on TORE SUPRA baking is employed after ventingsand continues until the water pressure is below 10−4 Pa which can take upto 2 or 3 days. On ITER it is expected that tritium stored in co-depositedBe-layers can be reduced by 90% by baking up to 620 K [42]. To reducethe tritium inventory on ITER, the estimated required bake frequency isaround 2 to 8 times a year [42].
1.5.1.2 Discharge cleaning in hydrogen and other reactive gases
Hydrogen: Cleaning procedures using hydrogen plasmas are based onthe reduction of metal oxides by atomic hydrogen, the hydrogenation ofcarbonaceous deposits to form volatile species in order to deplete the con-tamination layers on the wall surfaces [30], and on the capability to alterthe hydrogenic isotopic ratio of the subsurface hydrogen concentration [51].
The reduction of metal oxides is generally represented by the followingreactions [52],
MO + H MOH (1.14)MOH + H → M + H2O (1.15)
from which it is clear that the cleaning rate will be proportional to the fluxdensity of hydrogen atoms to the wall surface. Also the removal and hydro-genation of carbonaceous deposits needs sufficient wall flux, but additionally

Chapter 1 1-31
Figure 1.13: Schematic of isotopic exchange by GDC. Hydrogen isotopes areliberated from the wall as energetic hydrogen particles break the bonds betweenhydrogens and wall material. The remaining vacant trapping sites will be filledby the hydrogen flux to the wall, which allows changing the wall isotopic ratio.
this bombarding wall flux requires sufficient energy to break carbon bondsvia chemical or physical sputtering (see Fig. 1.10, page 1-22). From this itis expected that the conditioning flux needs to consist of either energeticions, or energetic charge exchange neutrals.
In Isotopic Exchange the conditioning discharge is employed to changethe isotopic ratio of the subsurface hydrogen concentration. A schematic ofisotopic exchange mechanism is given in Fig. 1.13. Wall hydrogen isotopesare released as energetic hydrogen particles break the bonds between hydro-gens and wall material. The remaining vacant trapping sites will be filledby the hydrogen flux to the wall. The continuous external injection of hy-drogen into the discharge and the continuous removal of hydrogen moleculesby the machine pumps allows, after sufficient conditioning time to changeover the wall isotopic ratio.
Oxygen: Also other reactive gases are used for wall conditioning of whichthe most important is oxygen. Other examples are nitrogen and ammonia[53]. The use of pure O2 or He/O2 mixtures is efficient for the removal ofcarbon layers through the formation of CO and CO2 [52]. The concernedchemical reactions are
CHn + (1 + n
2 )O → CO + n
2 H2O (1.16)
CHn + (2 + n
2 )O → CO2 + n
2 H2O (1.17)
Although the technique is very efficient for the removal of carbon deposits,e.g. 5.2 g in 4 hours on TEXTOR (O2-GDC [54], see further) and thus fortritium removal, large amounts of injected oxygen will be retained on thewall surfaces, which might prohibit subsequent normal plasma start-up.

1-32 Introduction
Dedicated oxygen removal cleaning discharges are thus required afterward:on TEXTOR, restart was possible after a long D2 conditioning dischargefollowed by He conditioning and boronization [55]. Unfortunately oxidativeremoval techniques will not be allowed during the nuclear phase of ITER.Their use implies the production of large quantities of highly tritiated wa-ter (DTO), which is extremely corrosive and far beyond what the ITERTokamak Exhaust Processing plant can handle. Moreover, the use of largequantities of oxygen in the exhaust gas is excluded for safety reasons [42].
1.5.1.3 Discharge cleaning in helium
Cleaning discharges in helium are particularly interesting for the desatura-tion of the subsurface hydrogen concentration. The primary release mecha-nism in helium cleaning discharges is particle-induced desorption of hydro-gen by the energetic He-ions. As the hydrogen concentration in carbon canbe significant, helium cleaning is often used in devices with large graphitecoverage. Although helium does not intervene in chemical reactions, it isobserved that upon exposure to a helium cleaning discharge, CO and hy-drocarbon impurities are released from the carbon surfaces [30].
1.5.1.4 Metal film gettering
Metal film gettering makes use of the fact that large sticking probabilitiesare observed for various gaseous compounds on clean metal surfaces. Metal-lic tokamak wall surfaces, depleted from carbon and oxygen by dischargecleaning in hydrogen, show getter properties with respect to oxygen andcarbon. As such, the controlled evaporation of metals (titanium, chromium& beryllium) has been used to cover large surface areas with a clean film forgettering purposes, which yields very high effective pumping speeds [30].
1.5.1.5 Plasma assisted deposition of thin films
The deposition of low Z films containing carbon, boron or silicon (calledcarbonization, boronization and siliconization) is very effective in suppress-ing metal impurities and for oxygen gettering. In addition a strong wallpumping capability and low recycling conditions can be achieved. Conven-tionally, deposition of thin low Z films is carried out by glow discharges (seefurther). High quality homogeneous thin films of up to about 0.3µm thick-ness can be deposited onto the first wall by this technique [30, 56]. Fromdifferent experiments on plasma thin film deposition by RF discharges (seefurther) it is concluded that in most of the cases, the layer formation is inho-mogeneous and the films are limited in thickness and exhibit high hydrogen

Chapter 1 1-33
Figure 1.14: Schematic of discharge wall conditioning: the PWI processes initi-ated by the discharge aim at removing wall impurities, desaturating the walls fromfuel, etc. The wall desorbed particles are removed from the vessel by the machinepumps. The plasma, and thus also the wall flux, will contain both injected andwall desorbed particles. As will become clear further during this manuscript, bothdischarge gas retention and retrapping of wall desorbed particles will occur.
contents [56]. Recent studies show that thin film deposition by Pulsed-GDC (see further) appears also possible [57], although no information onthe homogeneity of the layer is available at this point.
Although positive plasma performances have been obtained with thehelp of this technique (see e.g. [49]), for long pulse operation (ITER: 400 s) itis less attractive since the deposited thin films on the plasma facing compo-nents can be completely eroded in a single discharge. Another disadvantageof the thin film deposition technique is related to tritium retention, sincetritiated low Z films could be build up on the entire vacuum vessel [56].
1.5.2 Discharge wall conditioning techniquesIn this section an overview is given of the presently employed tokamak dis-charge wall conditioning techniques. The techniques differ in the mannerthe plasma is produced, which has a direct influence on their specific clean-ing efficiency. The efficiency of each technique depends on whether theycan fulfill specific conditioning aims and at what speed the conditioningaim is attained. A simple schematic of conditioning discharges, valid forall techniques is given in Fig. 1.14. Every conditioning discharge requires athroughput of gas in the vacuum vessel. The gas is injected by the machineinjection valves, either continuous or in short puffs. The machine pumpingsystem evacuates the neutral gas that is present in the vessel, each withtheir characteristic pumping speed, which allows for the removal of walldesorbed particles. These wall desorbed particles arise from the interactionbetween the conditioning plasma and the wall surfaces. In the process ofwall cleaning, the conditioning plasma will consist of both injected gas and

1-34 Introduction
wall desorbed gas. As such, also the flux to the walls will consist not solelyof the injected gas, which can lead to redeposition, or implantation of walldesorbed species. Therefore it is important that the formed products havelow probability for being re-ionized or dissociated in the cleaning plasmaitself. This requires plasmas with low electron temperature and a low ion-ization fraction. At the same time high wall fluxes are required to obtainsufficient cleaning rates. An additional method to reduce losses of desorbedparticles to the wall are utilizing short discharge pulses with sufficient timebetween pulses to evacuate desorbed particles, as will be explained in laterchapters.
1.5.2.1 Glow discharge conditioning
Glow discharge cleaning (GDC) is a technique routinely used on almost allfusion devices. The principle of GDC is to produce energetic ions that im-pact on the wall and release impurities through physical and/or chemicalsputtering. The experimental arrangement for GDC of vacuum vessels in-volves one or more electrodes, depending on the size and geometry of thevessel, that are positioned within the vessel. This can be in port holes like onTEXTOR [58], on the inner wall close to ports like on TORE SUPRA [59],or on structures that can move into the vessel center like on KSTAR [60].The electrodes (anodes) are powered by an excitation source which pro-duces the glow discharge. The to be cleaned in-vessel structures, namelythe vessel wall, the limiters and the divertor, are set at ground potentialand serve as cathodes.
Although the temperature and density of glow discharges is generallylow (Te < 10 eV, ne ≈ 3 − 4 · 108 cm−3 [58]) the ions can have considerableenergy, up to 250− 300 eV, as they are accelerated in the sheath in front ofthe wall. For hydrogen-GDC, the main species striking the wall are H+
2 -ionsstemming from direct ionization of H2: Qftw ≈ 1 · 1020 /s = 2.9 · 1018 /m2s(TEXTOR), while also a contribution from neutral H-atoms is expected [58].
In TORE SUPRA, the glow discharge system consists of six anodeslocated in the upper part of the torus that are powered by a DC voltage.On TEXTOR the glow system consists of two electrodes separated by 180degrees in the toroidal direction. The anodes consist of a helical coil towhich a DC voltage is applied. On to the DC voltage a high frequencyvoltage (7 MHz) is superposed for igniting and sustaining the plasma [52].
Efficient operation of standard GDC requires the absence of magneticfields. Fig. 1.15 shows that even on application of a small toroidal field inthe order of 1 mT, the glow current in the toroidal device Tomas, measuredby metal probes (plates) installed at the torus bottom on three differenttoroidal locations (0, 90 and 180) becomes inhomogeneous due to the

Chapter 1 1-35
Figure 1.15: The local glow current (as a % of the total current to the chamberwall) measured on the Tomas device at 3 different toroidal positions (0, 90 and180 away from the glow antenna) [61].
preferred transport of charged particles along magnetic field lines. The cur-rent is given in percentage of the total discharge current to the chamberwall. On increasing the magnetic field to values higher than 4 mT the glowcurrent drops even to zero on two toroidal positions. For efficient condition-ing of the vessel walls the particle flux to the walls needs to be homogeneous,which requires a homogeneous plasma. Therefore, in future superconduct-ing devices like ITER, where the toroidal magnetic field in the vessel will bepresent for long periods, in the order of weeks, the operation of GDC will belimited to machine shut-down periods. As mentioned in section 1.3.2, thetotal number of TF coil shutdowns foreseen in the ITER magnetic systemdesign is 1000 times during the ITER lifetime [42] (20 years [62]).
1.5.2.2 Taylor cleaning discharges
Taylor discharge cleaning (TDC) using weakly ionized plasma by pulsingthe central solenoid was first developed by Taylor [63]. The characteristicsof TDC are low plasma current (< 30 kA) and low electron temperature(2 − 5 eV). The discharge, effectuated in presence of the nominal toroidalmagnetic field, is tested on many devices and found to be very effective.Since the technique does not require to ramp down and afterwards rampup the toroidal field, which can be time consuming (30 min.), it is routinelyused during experimental programs on the superconducting device TORESUPRA. On this device, the technique is mainly used to desaturate the walland to recover after disruptions, for which it uses helium as discharge gas.
TDC cannot be used on the future fully superconducting device ITERsince the superconducting central solenoid is not designed to withstand thepulsed voltage operation required for TDC. The risks involve heating up the

1-36 Introduction
conductors which may lead to the loss of their superconductivity. Secondly,the high loop-voltage consumption would require repetitive charging of thecentral solenoid which would take typically 100 s of charging for creating a1 s TDC-pulse [64].
1.5.2.3 Use of tokamak discharges for conditioning
Separatrix scanning: On ITER, during standard operation, the diver-tor plasma must be partially detached to satisfy the requirements of heathandling and helium exhaust simultaneously. To erode deposited layers ofthese H-mode plasmas, and so reduce tritium inventory, it is proposed touse low power L-mode hydrogen plasma and slowly scan the separatrix orlimiter plasma along the PFC surfaces [42].
Controlled disruptions: For tritium recovery from the ITER main wall,which has limited bake out temperatures, it is proposed to employ the pho-tonic flash from mitigated disruptions in the lower energy phase of dischargetermination. In this manner, due to the high stored energy in the plasma,the beryllium vessel may heat up to ≈ 1070 K [42], enhancing the ther-mal desorption of tritium. Experience in present devices has indicated thatthis method improves plasma performance, and may even provide desiredtransient wall pumping for density control in the following discharge [65].Although very appealing, this method is difficult to control since the rampdown scenario in ITER DT-plasmas requires a subtle and fragile scenarioin order to keep the plasma in H-mode [64].
1.5.2.4 Ion cyclotron wall conditioning
Ion cyclotron wall conditioning (ICWC), which is the main topic of this PhDmanuscript, is considered as a good candidate for inter-pulse and overnightconditioning on ITER: ICRF plasmas are fully compatible with the presenceof a high toroidal magnetic field. The conditioning plasma is sustained bycoupling RF power in the ion cyclotron range of frequencies, for which thestandard ICRF systems can be used (e.g. JET, ASDEX Upgrade, TORESUPRA, TEXTOR, W7-AS, LHD, KSTAR and HT-7). The tokamak EASTis equipped with a dedicated antenna for ICWC, and plans for the installa-tion of dedicated ICWC antennas on TORE SUPRA and Wendelstein 7-Xare ongoing. Chapter 2 of this manuscript will give an extensive overviewof the ICWC technique. Chapter 3 to 6 will discuss in more detail experi-mental results and modeling efforts on ICWC effectuated during this PhD,and chapter 7 discusses the application of ICWC on ITER.

Chapter 1 1-37
1.5.2.5 Electron cyclotron wall conditioning
Electron cyclotron wall conditioning (ECWC) discharges are produced atnominal toroidal magnetic field by coupling RF waves in the electron cy-clotron range of frequencies, using the standard tokamak ECRH system,at a gas pressure of typically 10−3 − 1 Pa [56]. ECR discharge cleaningwas first carried out on JFT-2 in 1980, by using the 2.45 GHz LH sys-tem and a magnetic field of 87.5 mT. Since then the technique is testedon many other devices, for example Alcator C-Mod, LHD, TRIAM-1M,TOMAS, JT-60U (1.7 GHz, 0.01 T) and HT-7 [57]. Also the TEXTORECRF system (110 GHz) was used for ECR discharge cleanings in helium(p = 3−6 ·10−2 Pa) at 1.65−2.28 T for an input power of PECRH = 200 kWresulting in a high density plasma (ne = 2.4 · 1018 m−3) [66]. Publishedstudies comprise ECR discharges in He, H2, D2, Ar, CH4 and CD4 in thepressure range between p = 10−4 and 6 · 10−2 Pa, for studies on reactiveand non-reactive cleaning, thin film deposition and removal of co-depositedlayers [57].
The technique is found to be less efficient than ICWC and GDC, andmoreover the poloidal homogeneity is very poor. The plasma is localizedoutwards of the resonance layer and shows a higher density on the microwavebeam trajectory [56]. In case of incomplete absorption of the ECRH-beamthe remaining beam power will be partially absorbed on the opposite vesselwall, which prevents continuous operation of the discharge, or would requireconstant sweeping of launching mirrors, which would make the dischargerisky and complex [64].
1.5.2.6 Pulsed glow discharge conditioning
Recently a new method, operable in presence of nominal toroidal mag-netic field, is demonstrated on superconducting tokamaks EAST and HT-7,named pulsed glow discharge cleaning (P-GDC) [57]. The discharges areproduced by using conventional GDC electrodes coupled to a high frequencypower supply: U = 2.0 kV, f ≈ 20− 100 kHz, I ≈ 10 A.
Preliminary results showed that plasma can be easily initiated in hy-drogen and helium, resulting in a glow, uniform in toroidal and poloidaldirection depending on the filling pressure. At high pressure (from 10−2 Pato a few Pa) the plasma is localized around electrodes, while on loweringthe pressure (10−3 Pa to 10−4 Pa) the plasma becomes more uniform espe-cially in toroidal direction but also in poloidal direction [57]. At the lowestpressure around 10−4 Pa the plasma is also uniform in poloidal direction.
The conditioning efficiency, from mass spectrometry measurements, issaid to be similar to that of normal DC-GDC (without magnetic field) [57]

1-38 Introduction
and ICWC [42]. The technique is possibly interesting for ITER operationsince it is compatible with the presence of a magnetic field and does notrequire to use expensive hardware, unlike for example the ICRF antennaoperation for ICWC, however it is not yet clear whether the planned ITERGDC system can be operated in P-GDC mode [42]. The recent techniqueP-GDC requires further study and development on multiple machines.
1.5.3 Wall conditioning in fully superconducting de-vices - ITER
A recent publication by Shimada [42] (proceedings and presentation slides)gives an overview of the foreseen wall conditioning interventions duringITER experimental campaigns. This paper is very instructive and deliversa good outline to illustrate the relevance of the subject of this manuscriptfor ITER.
During the foreseen ITER operational lifetime (20 years [62]) several ex-perimental campaigns (Operations Campaign) will be carried out, thatwill take about 2 years each [26, 67]. The first planned campaigns are theHydrogen-Helium Operations Campaign, the Deuterium Operations Cam-paign and the Deuterium-Tritium Operations Campaign. Each of theseexperimental campaigns will consist of about 35 operation cycles and 8months shutdown. The planned wall conditioning techniques during theshutdown periods are baking and GDC, before and after machine vents (2times a year), and Oxidative cleaning after the Hydrogen-Helium Opera-tions Campaign and before the Deuterium-Tritium Operations Campaign(but not during or after the DT-phase). The operation cycles will take 2weeks each, including 11 operation days during which the toroidal magneticfield will be continuously present in the vessel, followed by 3 maintenancedays without toroidal field during which GDC is possible. For the oper-ation days, for example in the Deuterium-Tritium Operations Campaign,one expects on average 20 shots per day, counting for 1 discharge every 30minutes at a machine availability of 60%, taking into account the time torecover machine operation after disruptions. The wall conditioning tech-niques foreseen to be employed during the operation days and for overnightconditioning require to operate in presence of magnetic field. As mentionedearlier, the presence of the magnetic field prevents the use of standard GDC.Candidates are thus
• separatrix scanning and controlled disruptions, for which probablydedicated tokamak shots are needed, and
• ICWC (and/or P-GDC), for inter-pulse (500 s) and overnight condi-tioning.

Chapter 1 1-39
Recently the qualification of inter-shot wall conditioning discharges be-came a high priority task for ITER [34] in order to mitigate the tritiuminventory build-up, to achieve the required low recycling levels at plasmastart-up and to reduce impurity levels after disruptions. Since ICWC hasbeen successfully tested on several devices and proved favorable character-istics compared to ECWC, it has been included in the project functionalrequirements [28,68]. Currently a strong R&D program with various exper-iments on different devices and modeling efforts is advancing to consolidateICWC and to qualify it for application in ITER and possibly other futuremachines. This PhD work is carried out in the frame of this ICWC-program.
As mentioned, the newly demonstrated technique P-GDC looks appeal-ing for ITER, and could be complementary to ICWC. However to fullyassess this technique for ITER more extensive tests on multiple machinesare required, and its competitiveness with ICWC has to be proven.
1.6 PhD overviewThis PhD manuscript is devoted to the study and optimization of the IonCyclotron Wall Conditioning (ICWC) technique. The ICWC plasmas arefully compatible with the presence of a high toroidal magnetic field, and havebeen successfully tested on several devices. The technique is considered forinter-pulse and overnight conditioning on ITER and is therefore included inthe project functional requirements [28,68] of ITER.
In chapter 2 a general overview on ICWC is given. The main ICWCelements will be introduced, followed by the state of the art of the researchon ICWC before the start of this PhD. From this review, the experimentaland modeling objectives of this PhD work will be formulated. In the secondpart of this chapter three important ICWC elements are presented in moredetail. A section is dedicated to the involved RF physics aspects which areof non negligible importance: the ICRF antennas both initiate and sustainthe ICWC discharge and thus, although the focus of this manuscript isput on the characterization of the plasma parameters and the assessmentand optimization of the conditioning efficiency, the RF aspects need tobe included in this manuscript. Hereafter, the neutral particle cycle inthe vacuum vessel will be discussed to provide the minimum technologicaland theoretical basis on this subject, namely on gas injection and particleremoval by the pumps, that will allow to understand how wall desorbedparticle removal is achieved and can be improved. Finally a short summaryof the evidenced ICWC wall bombarding flux is given, this flux doing theactual wall conditioning.
Chapter 3 treats the ICRF discharge homogeneity and the confinement

1-40 Introduction
properties of the employed magnetic field. In the first part we will discussexperimental facts on plasma homogeneity, and how experimental optimiza-tion led to its improvement. Where RF power absorption properties cannotexplain the inhomogeneities, it is expected that the confinement propertiesof the toroidal magnetic field lie at the basis of these inhomogeneities. Inthe second part of the chapter the confinement properties of a partiallyionized plasma in a toroidal magnetic field configuration with additionalsmall vertical component are discussed. The magnetic configuration usedin ICWC discharges was said to have insufficient confinement properties forensuring a high enough energy confinement time (see section 1.2.4). Wewill discuss eventual contributions of these confinement properties to theinhomogeneities of the plasma and the wall flux.
Chapter 4 gives an overview of experimental results on the efficiency ofICWC, obtained on TORE SUPRA, TEXTOR, JET and ASDEX Upgrade.The aims of the presented experiments are the assessment and optimizationof the conditioning efficiency and to provide information that allows anextrapolation to ITER. The chapter is divided into three parts. The firsttwo parts are separated according to the discharge gas/conditioning aim:firstly H2 and H2/He discharges for isotopic exchange, and secondly pure Hedischarges for wall desaturation and recovery of normal tokamak operationafter disruptions. In these parts, the ability of ICWC to change the surfacestate will be shown, the wall fluxes and corresponding PWI mechanismswill be characterized, and the particle desorption and retention rates willbe calculated. Also the efficiency dependencies on RF power, dischargepressure, magnetic fields, etc. will be treated. And in a final (third) part theefficiency of ICWC for impurity and codeposited layer removal is discussed.
In chapter 5 a 0D kinetic description of hydrogen-helium RF plasmas isoutlined. The model, describing the evolution of ICRF plasmas from dis-charge initiation to the (quasi) steady state plasma stage, is developed toobtain insight on ICRF plasma parameters, particle fluxes to the walls andthe main collisional processes. The chapter is divided into two parts wherefirst the implemented model equations are discussed in detail, and secondlythe modeling results are presented. The 0D plasma description, based onthe energy and particle balance equations for helium and hydrogen plasmaspecies, takes into account (1) elementary atomic and molecular collisionprocesses and elastic collisions, (2) particle losses to the walls and particlerecycling, (3) active pumping and gas injection, (4) RF heating of elec-trons (and protons) and (5) a qualitative description of plasma impurities.The modeling results section includes first a discussion on the implementedelementary reactions, and the description of the plasma parameters as afunction of the electron temperature. Hereafter the model is benchmarked

Chapter 1 1-41
against experimental results. Experimental plasma density dependencies ondischarge pressure and coupled RF power will be reproduced, both for hy-drogen RF discharges as for helium discharges. Modeled wall fluxes will becompared to experimentally estimated wall fluxes. Finally a TORE SUPRAhydrogen RF discharge will be modeled from discharge initiation to steadystate plasma. The particles flux to the wall, and the recycled flux duringthis discharge will be discussed.
Chapter 6 presents a minimum structure for a 0D reservoir model ofthe wall to investigate in deeper detail the ICWC plasma wall interactionduring isotopic exchange experiments. The hypothesis used to build up thewall model is that the same model structure should be able to describe thewall behavior during normal plasmas and conditioning procedures. The wallmodule is coupled to a 0D hydrogen-deuterium plasma description, basedon the model presented in chapter 5. In the first section of the chapter themodel is presented: the wall description is derived from experimental factsand the plasma description is summarized. In a second section the modelequations are given. The third section shows the capability of the modelto reproduce experimental facts of normal plasma discharges. In a fourthsection TORE SUPRA H2-ICWC discharges are modeled, and proposals forICWC optimization in terms of discharge timing are worked out. And finallya discussion is added comparing the developed phenomenological model toa recently published, physically more founded wall model.
Chapter 7 summarizes the findings of this PhD manuscript and extrapo-lates the results to the envisaged application of ICWC on ITER. Hereafter,in the last chapter a general conclusion is formulated.
Appendix A, at the end of this manuscript, contains schemes of the toka-maks TORE SUPRA, TEXTOR, ASDEX Upgrade and JET, illustratingthe locations of the RF antennas and the diagnostic systems. In appendixB, an overview of the employed diagnostics is given, where especially at-tention is paid to the neutral gas analysis systems (pressure gauges, massspectrometry, ...). And finally, appendix C provides an appendix to chapter5, including a discussion on the benefits and limitations of a 0D approach,the plots of the relevant collision rates that are included in the model anda further discussion on particle confinement and energy confinement.


2Ion Cyclotron Wall Conditioning
This chapter gives a general overview on Ion Cyclotron Wall Conditioning(ICWC), the subject of this PhD thesis. We will first explain the ICWCprinciple, introducing the main elements, followed by the state of the art ofthe research before the start of this PhD. From the latter section a ‘ToDo’list is distilled containing the items that will be treated throughout this PhDmanuscript. Then three of the presented ICWC elements will be discussedin more detail: a section on the involved RF physics aspects, a section onthe neutral particle cycle in the vacuum vessel (gas injection and particleremoval), and finally a summary of the particle wall flux.
2.1 PrincipleThe basic components of ICWC are designated in Fig. 2.1. It representsa toroidal vacuum vessel, with its characteristic wall materials, in presenceof the nominal magnetic field BT . This magnetic field is inhomogeneous inthe radial direction R due its toroidal configuration. To the toroidal field,a smaller poloidal magnetic field can be added (Bp BT ):
~B(R) = R0
RBT 1φ +Bp1p (2.1)
where BT is the magnetic field on axis, at the major radius R = R0. Aswas stated in the introduction, the presence of the toriodal magnetic fieldjustifies the use of ICWC, whereas in absence of the magnetic field standard

2-2 Ion Cyclotron Wall Conditioning
Figure 2.1: Schematic of ICWC showing the vacuum vessel with its wall mate-rials, the present toroidal magnetic field and the required tokamak systems: gasinjection valves, machine pumping systems and ICRF antennas. The condition-ing plasma is initiated and sustained by the ICRF antennas. The provoked PSIlead to the release of impurities, codeposited layers and/or fuel particles. Thesereleased particles are removed from the vacuum vessel by the vacuum pumps.
GDC might be preferred for conditioning purposes. In the figure the wallmaterials are indicated, which are of fundamental importance for the con-ditioning technique as they represent the ‘to be conditioned’ surfaces andmoreover determine the possible plasma surface interactions.
As shown on Fig. 2.1, next to the magnetic field systems, the operationof ICWC makes use of three other main tokamak systems: the ICRF an-tennas, the gas injection valves and the vacuum pumps. ICRH power inthe ion cyclotron range frequencies (ICRF) is used to both produce andsustain the discharge. Mostly one employs the standard ICRF heating sys-tems, although dedicated systems for ICRF conditioning are gaining moreinterest (e.g. EAST [69] and design projects on W7-X and TORE SUPRA).Resonant conditions where the applied RF frequency, ω, equals n (∈ N0)times the gyration frequency of ions around the magnetic field lines, ωci,can exist along the vessel main radius1 R:
ωci(R) = qB(R)mi
(2.2)
1When ω = ωci is located on-axis, it means that ω > ωci (conventional ICRF range)from axis towards the LFS (antenna side) and ω < ωci (Alfven wave range) from axistowards HFS.

Chapter 2 2-3
The presence of these resonances influences the RF power coupling efficiencyto the plasma and the discharge homogeneity. An overview of the involvedRF physics is given in section 2.3.
For the discharge gas, fed via the injection valves, one can choose inert(He, Ar) or reactive gases (H2, D2, O2, N2, ...), depending on the condition-ing purpose (wall desaturation, fuel removal, removal of codeposited layers,...). Via the produced plasma one aims at creating a controlled flux of parti-cles to the wall surfaces provoking either liberation of impurities, erosion ofcodeposited layers, desaturation of the subsurface fuel reservoirs, or chang-ing their isotopic ratio. The particles which are intensively released fromthe wall surfaces need to be removed from the vacuum vessel. For this oneemploys the standard machine pumps of the device that are continuouslyoperational to provide the required vacuum conditions. In section 2.4 theneutral gas cycle in the vacuum vessel is shortly reviewed, providing a keyelement to the wall conditioning efficiency.
The efficiency of the conditioning technique for desorbing particles fromthe surfaces and removing these particles from the vacuum vessel, can be as-sessed via different diagnostic systems amongst which the most importantare the neutral gas analyzers; namely mass spectrometry, Penning gaugespectroscopy and gas chromatography. For plasma and wall flux charac-terization one employs interferometry, neutral particle analyzers, Langmuirprobes, lithium beam spectroscopy, etc... The employed diagnostic systemsthroughout this manuscript are discussed in appendix B.
2.2 State of the art and formulation of PhDobjectives
In this section an overview is given of ICWC results that were publishedbefore the start of this PhD (2008). The progress on the subject achievedduring this PhD, supported by an international collaboration between Eu-ropean institutes; ERM/KMS Brussels (Be), IRFM CEA/Cadarache (Fr),IPP Jülich (De), IPP Garching (De) and CCFE Culham (GB), into whichthis PhD work frames, will be the subject of the next sections and chapters.The presented overview aims at acknowledging the scientists and institu-tions that have made progress on this subject, and setting the basis fromwhich the work in this manuscript starts. The emphasis in this section is puton experimental and modeling efforts, concentrating on plasma characteri-zation and conditioning efficiency. An overview of the RF-physics aspectsis included in section 2.3.
The discovery of ICWC is strongly related to the study of plasma ini-tiation methods for stellarators using ICRF power [70]. Consequently, the

2-4 Ion Cyclotron Wall Conditioning
first results on ICRF wall conditioning in fusion machines, published byNazarov et al. in 1987 [71], were obtained on the Uragan-3 torsatron. Theconditioning plasmas, with an electron density of ne = 1012 cm−3 and elec-tron temperature of Te = 10 eV, were produced at a hydrogen pressure of∼ 10−4 mbar, RF frequency of 5.4 MHz and magnetic field of 20 − 50 mT(ω ≈ 18ωci). Series of numerous (> 104) short pulses (50 ms) were appliedwith RF power less than 100 kW, at a repetition rate of 0.2 pulses/s. Sub-sequent to the cleaning of the metal wall surfaces, significantly improvedplasma parameters were obtained where separately a high plasma density,less impurities and more efficient heating of the plasma are mentioned.
In 1996 a review article on wall conditioning in fusion devices, and itsinfluence on plasma performance was published by Winter [30]. In thispaper the issue of wall conditioning for future superconducting machineswas clearly stated for the first time:
The long pulse lengths of the next generation of devices impliesthat superconducting magnets will be used. The magnetic fieldwill be maintained for long times to avoid cycling the coils. Thuswall conditioning techniques will have to be compatible with mag-netic fields. Glow discharges are not suited to these circum-stances. [J. Winter 1996]
Around the same period, ICRF plasma production applications werefor the first time performed on tokamaks, namely TEXTOR and TORESUPRA. The first ICRF plasma production studies, supported by 1-D/0-Dself-consistent modeling, were carried out on TEXTOR in 1994 and pub-lished in 1995 by Lyssoivan et al. [72]. The first ICRF wall conditioningexperiments were performed both on TORE SUPRA and TEXTOR andpublished respectively by de la Cal and Gauthier et al. [51,73], and Esser etal., also in 1997 [74]. Since then ICWC has been successfully tested in manyother devices such as HT-7 [75–78], W7-AS [79], ASDEX Upgrade [80–82],JET [80, 81] and LHD [83]. Also more recently the tokamak EAST andKSTAR [60] successfully employed ICWC.
In parallel to the experimental efforts there has also been considerableprogress on the physics aspects of ICWC. The first paper on the modeling ofRF plasma production in large scale tokamaks was published by Lyssoivanet al. [84] in 1992, followed up until now by numerous refinements by thesame author. Criteria allowing for the optimization of the RF conditioningefficiency were defined by de la Cal and Gauthier in 1997 [51], and werelater refined by the same authors in 2005 [56]. The first theoretical mod-eling efforts on deuterium ICRF discharges, predicting the main plasmaparameters and particle fluxes to the wall, were published by de la Cal in

Chapter 2 2-5
2006 [85].In the following 4 subsections we will present first an overview on the
obtained experimental results, where the focus is put on the wall condi-tioning efficiency and plasma characterization (section 2.2.1). This kind ofoverview has already been published by other authors [56, 64, 86], but re-mains necessary to be repeated here independently to set the basis of thepresented work. After this overview the experimental objectives of this PhDare presented in section 2.2.2. Similarly, in the third part (section 2.2.3) areview is given of the modeling efforts on ICWC, whereafter in section 2.2.4the modeling objectives of this PhD work are formulated.
2.2.1 Experimental results2.2.1.1 TORE SUPRA
The first ICWC discharges on TORE SUPRA [51, 73] in 1995-98, reportedvery positive wall conditioning results. The discharges were carried out indeuterium and helium at an RF frequency of 48 MHz and magnetic fieldof 3.8 T. A wide range of pressures (p = 2 · 10−1 − 10−3 Pa) and powers(PRF = 20−350 kW) are tested. The discharges were found to be toroidallyhomogeneous, but poloidally asymmetric, especially at higher pressures (>10−2 Pa). Both the electron density and temperature were found to increaseon increasing RF power. In helium, for the given power range and at fixedpressure of p = 10−1 Pa, the temperature ranged from Te ≈ 1.6−2.5 eV, anddensity from ne ≈ (1− 6) · 1011 cm−3. For deuterium plasmas the electrondensity was much lower: ne = (3 − 16) · 1010 cm−3 for an RF power rangeof PRF = 20 − 100 kW. During D2-ICWC a surface normalized total fluxof fast CX-atoms of FCX = 1017 m−2s−1 (H and D) was measured, withMaxwellian energies of 1 keV for hydrogen and 0.4 keV for deuterium, at anRF power of PRF = 100 kW and discharge pressure p = 10−2 Pa [73]. Thepresence of these particles was related to the resonant cyclotron absorptionof RF power by hydrogen (ω = ωc,H+) and deuterium (ω = 2ωc,D+) ions,and was considered to be a major asset of the RF discharges with respectto their conditioning capabilities.
The removal rate of HD from the vessel, estimated from mass spectrom-etry, was 1019 HD/s during a 30 s D2-ICWC discharge. In conclusion theICWC discharges are found to be efficient for isotopic exchange. The re-moval rate of impurities in the form of CD4, D2O and CO is around 50 to500 times lower than the removal rate of HD. These low removal rates areattributed to the well conditioned state of the vessel. During He-ICWC,high H2 removal rates were recorded, with a maximum of 7 · 10−2 Pam3/sand on average 10−2 Pam3/s ≈ 2 · 1019 H2/s.

2-6 Ion Cyclotron Wall Conditioning
The initial solely positive perspectives for ICWC following the experi-mental days in 1995 and January 1996 on TORE SUPRA were distortedwith the damaging of one of the RF capacitors in the antenna matchingcircuit. Conductive deposits were found on the capacitor ceramics whichlikely caused them to break due to thermal stress. Since the capacitors arewater cooled, the end of the experimental day was reported due to a waterleak in the vessel. In 1997 an optic system was installed on one RF antennathat allowed to detect the presence of plasma inside the antenna box, at thelevel of the capacitors. Subsequent RF discharges evidenced the presence ofplasma in sight of the optic fibers. In 1998 dedicated experiments were car-ried out for antenna coupling analysis [87]. The optic system is presentlynot operational anymore. Further details on RF physics and deleteriouseffects on the antennas will be discussed in section 2.3.
2.2.1.2 TEXTOR
The first TEXTOR ICWC discharges [74] were carried out in helium (p =10−3 − 10−1 Pa), with a magnetic field of BT = 2.25 T, RF frequency of32.5 MHz and an RF power range of PRF = 100 − 800 kW. Plasmas withdensity and temperature in the range of ne = 5 · 1010 − 3 · 1012 cm−3 andTe = 10−40 eV were obtained. The discharges were applied in series of fourshort 1 s pulses with 1 s between each pulse. The H2 removal decreased fromshot to shot with a maximum of 9 ·1019 H2/s, which is much larger than theTORE SUPRA He-ICWC efficiency, taken into account the tokamak wallsurface area. This is expectedly due the effectuated 10 minutes long H2-GDto load the TEXTOR wall with hydrogen that preceded the He-ICWC. Infive ICWC discharges one could remove 6.5 · 1020 H atoms, which is of theorder of one monolayer. Furthermore, also promising preliminary resultswere reported using the technique for thin Si-layer deposition.
ICWC experiments were later also successfully carried out in reactivegases on TEXTOR [55]. Several reactive gases (H2, D2, O2, N2, NH3) andtheir mixtures with helium were tried and preliminary results about theirefficiency to clean the wall from impurities and to release the retained fuelhave been obtained. An oxygen-helium mixture is found to be the most ef-fective scenario to remove carbon from the wall. The efficiency was mainlylimited by the maximum allowed pressure in the antenna box. ICWC indeuterium was found to be effective to remove hydrogen via HD formationand to remove CO. A helium-ammonia gas mixture was found to be ef-fective to remove deuterium and showed a better uniformity than ICWCin helium-hydrogen mixtures. Nitrogen-hydrogen and nitrogen-deuteriumgas mixtures were found to be ineffective for wall cleaning under the wallconditions in TEXTOR, due to strong nitrogen consumption by the wall.

Chapter 2 2-7
2.2.1.3 ASDEX Upgrade
On ASDEX Upgrade [81] He-ICWC discharges were initiated using 1 to 4ICRH antennas in π-phasing with an RF power of PRF = 3 − 120 kW perantenna, at a frequency of 30 MHz and magnetic field of BT = 1 − 2 T.The helium pressure ranged from p = (1 − 8) · 10−2 Pa. High-energeticfluxes of H (with energies up to 60 keV) and of D-atoms (up to 25 keV)were detected by a neutral particle analyzer (NPA). Line integrated densitymeasurements gave electron density values of ne,l ≤ 6 · 1011 m−2. Duringlater ASDEX Upgrade experiments, the removal of argon during He-ICWCdischarges was compared with He-GDC [88]. The maximum obtained argonremoval rates were on average 4.5 times higher in ICWC than in GDC. Theargon partial pressure peak occurring after the ICWC discharge initiationdecreases rapidly, as was also the case for the neutral pressure in the vessel.
2.2.1.4 JET
On JET [81], ICWC discharges were tested using pure helium and helium-hydrogen gas mixtures (80/20 He/H2, without feedback control). AntennaC was operated in π-phasing with an RF power of PRF = 130 − 245 kWat a frequency of 34 MHz and magnetic field of BT = 1.85 − 2.45 T. Theexperiments on JET were performed at lower gas pressure in the torus,ptot ≈ (1 − 8) · 10−3 Pa, due to technical constraints: the pressure triplevel of the antenna vacuum transmission line (VTL) is ∼ 1 · 10−2 Pa. Theplasma extended radially over the vessel center towards the HFS when agas mixture of helium and hydrogen was injected which was predicted inadvance by electron power deposition profile calculation using TOMCAT[89]. The electron temperature, estimated from line radiation in the VUVspectroscopy data, was in the range of Te = 2− 5 eV, inversely proportionalto the discharge pressure.
2.2.1.5 HT-7
On the superconducting HT-7 tokamak [75], RF conditioning dischargeswere firstly produced at low RF power of PRF = 8− 10 kW, at a frequencyof 22.5 MHz and a toroidal magnetic field of BT = 0.1 − 1.6 T, repeatingmultiple 300 ms RF pulses every 1 s for 30 to 60 minutes. On increasingthe toroidal magnetic field during the RF discharges it was observed thatthe plasma radiation, which was strongly peaked around the second ion cy-clotron resonance harmonic (ω = ωc,D+) in the center of the vessel, shiftedalong with the resonance layer to the LFS. Both D2 and He-ICWC weretested in a pressure range of p = 10−4 − 1 Pa. Compared to He-GDC,He-ICWC was found 10 times more efficient for hydrogen removal. A low

2-8 Ion Cyclotron Wall Conditioning
vacuum base pressure was achieved by 4 hours of He-ICWC, due to the ef-ficient removal of H2O, CO and CO2. In conclusion ICWC is said to be 3times more efficient than GDC or TDC. During the last 2006 HT-7 cam-paign (32 days of operation) the total ICRF conditioning time was 33 hours.Later, ICWC was also applied at higher powers, up to PRF = 50 kW [77].Because of its high efficiency compared to GDC, and its possibility to oper-ate in presence of the toroidal field, ICWC became a routine conditioningtechnique on HT-7.
On HT-7, ICWC is also successfully employed for thin film deposition (Band Si), and co-deposited layer removal. For the latter, O2-ICWC dischargeswith PRF = 40 kW (cycles of 1 s on, 2 s off) and pO2 = 9 ·10−2 Pa were used.The maximum removal rates of H, D and C atoms was 2.6 · 1022 atoms/h,7.8 · 1022 atoms/h and 1.5 · 1022 atoms/h which are promising results withrespect to long duration ICWC operation, and to co-deposited layer removal(however O2-ICWC cannot be used during the active phase of ITER). It cor-responds to a removal rate of co-deposited films of 317 nm/day (7.2 gC/day).Strong oxygen retention in the vessel (1.7 · 1022 O-atoms) after the oxygenconditioning discharges required the use of He-ICWC cleaning (removal of5.4 · 1021 O-atoms in 50 minutes) and ∼ 60 disruptive plasma start-up at-tempts to recover normal operation of the device. In later experiments onHT-7 it was found that D2-ICWC is about 5 to 10 times more efficient foroxygen removal [90] than He-ICWC.
2.2.2 Formulation of experimental objectivesFrom the given overview one can conclude that ICWC is a promising can-didate technique for inter-pulse and overnight conditioning on ITER, i.e. inpresence of the toroidal magnetic field. Ranges were set for the operationalparameters (RF power, RF frequency, antenna phasing, toroidal magneticfield, discharge pressure and discharge gas) and plasma parameters (electrondensity, electron energy and presence of fast particles). Further studies onICWC remain however required to fully consolidate the technique before itsoperation in ITER. Many principle ideas for further experimental studiescan be extracted from the given overview and are listed below. The workpresented in this manuscript, supported by the mentioned institutions andinvolved scientists, will attempt to cover these points at its best.
• Since hydrogen and helium are likely the most suitable discharge con-ditioning gases for ITER (e.g. O2 discharge conditioning is not allowedduring the D-T phase), it was decided to concentrate the research tohydrogen and helium ICWC discharges.
• The discharges are found to be toroidally homogeneous, but poloidally

Chapter 2 2-9
inhomogeneous. We will determine the mechanisms that cause theseinhomogeneities, and investigate how to improve the poloidal homo-geneity.
• Related to the previous point also the homogeneity of the wall fluxwill be considered. For this the main wall bombarding species will becharacterized. The effect of the fast CX component of the wall fluxon the conditioning efficiency, and the dependencies of the wall fluxon the discharge control parameters will be investigated.
• H2-ICWC and He/H2-ICWC:
– The ability of H2 and He/H2-ICWC to change to wall isotopicratio will be assessed.
– The dependency of this efficiency on the discharge control param-eters (pressure, RF power, toroidal and poloidal magnetic fieldstrength, pumping speed, ...), its evolution in time, and the ad-vantage of pulsed ICWC compared to continuous RF dischargeswill be treated.
– And the efficiency of H2-ICWC to remove impurities and code-posited layers (tritium removal) will be investigated.
• He-ICWC:
– The ability of He-ICWC to desaturate the wall surfaces fromdischarge fuel will be assessed.
– The dependency of this efficiency on the discharge control param-eters, its evolution in time and the advantage of pulsed ICWCcompared to continuous RF discharges will be treated.
– Also the efficiency of helium ICWC to remove impurities will beinvestigated.
– The operational effectiveness of the technique to recover normaltokamak operation after plasma disruption events and to lowerthe vacuum base pressure levels of impurities will be evidenced.
• The efficiency of ICWC will be tested on multiple devices; TORESUPRA, TEXTOR, ASDEX Upgrade and JET, which allows to testICWC under multiple conditions (different antenna systems and avail-able frequencies, wide range of vessel sizes, limiter and divertor con-figurations, carbon PCF and tungsten PFC).
• The conditioning efficiency of ICWC will be compared to other tech-niques (GDC, TDC).

2-10 Ion Cyclotron Wall Conditioning
• Recommendations will be made according to the gained experience toavoid deleterious effects on the antenna systems.
• An extrapolation of the experimental results to ITER will be pre-sented.
2.2.3 Modeling of ICWC discharges2.2.3.1 Wall conditioning efficiency
An important contribution to the parameterization of the wall conditioningefficiency of D2-ICWC was published by de la Cal [56]. The maximumconditioning efficiency is obtained when the maximum pumping rate for agiven atom or molecule ‘A’ is achieved. The presented model relates theout-pumped flux of A, Qp,A, to the machine pumping speed for the givenparticle, SA, the discharge pressure, ∼ nD2 , the plasma temperature, Te forelectrons and Ti for ions, and the relevant reaction rates.
The analysis starts from the consideration of the probability that a walldesorbed particle will be pumped out of the vessel. The characteristic pump-ing time in RF discharges, τS , is much larger than the cracking time bydissociation or ionization, τc, of a molecule:
τS = V
SA τc = 1
ne(kion,A + kdis,A) (2.3)
where V is the chamber volume, ne the electron density and kion,A andkdis,A the ionization and dissociation on electron impact reaction rates forthe wall desorbed particles. As such the pumping probability of a walldesorbed particle is found as
α = τ−1S
τ−1S + τ−1
c
≈ τcτS
= SA
V
1ne(kion,A + kdis,A) (2.4)
Via this probability, the out-pumped throughput of wall desorbed moleculeA, Qp,A, can be related to its wall desorbed flux, Qsw,A: Qp,A = αQsw,A.The latter wall desorbed flux is taken proportional to the wall bombardingflux Qftw via the yield YA: Qsw,A = YAQftw. This yield will depend firstlyon the energy of the bombarding specie, Tn,CX, but also on the wall charac-teristics. In the paper [56] the wall bombarding flux is said to consist mainlyof energetic neutrals that stem from energetic neutralized ions via chargeexchange reactions with D2 molecules. In this way the total wall bombard-ing flux can be estimated as Qftw = V nenD2kCX. As such the out-pumpedthroughput is described as:
Qp,A = YA(Tn,CX)SAnD2kCX(TD2 , Ti)kion,A(Te) + kdis,A(Te)
(2.5)

Chapter 2 2-11
where interestingly the out-pumped is apparently independent on the elec-tron density. From eq. (2.5) it can be concluded that the wall conditioningefficiency can be optimized by
• increasing the pumping speed SA,
• increasing the neutral pressure nD2 ,
• choosing proper plasma temperature (Te and Ti),
a conclusion which will remain standing after further analysis in this ma-nuscript, although the analysis will be refined.
2.2.3.2 Steady state plasma parameters and wall flux
A second important contribution, published by de la Cal [85], concerns acalculation of the plasma parameters for D2-RF discharges. From the pre-sented 0D model it was possible to obtain the steady state concentrationsof D, D+, D+
2 , D+3 , the electron density ne and the electron temperature Te.
The model takes into account 10 elementary hydrogen reactions, includingthe charge exchange reactions H+ + H2 and H+
2 + H2. It was found that theelectron temperature remains approximately constant around Te = 3 eV fora wide range of plasma densities (1010 − 1012 cm−3) and for a neutral pres-sure of 10−2 Pa. Furthermore, the electron density is proportional to theinjected RF power, for the typical low ionization degrees, and the repartitionof the ion fractions strongly depends on the neutral pressure. For a neutralpressure of 10−2 Pa the concentration of D+, D+
2 and D+3 relates approxi-
mately as 1011/1010/109 cm−3. In the paper of de la Cal [85] it is statedthat neutral D-atoms are the main wall bombarding species. These neu-trals stem from the neutralization of the principle ion specie D+ in chargeexchange collisions with neutral D2 molecules. Also in this case most of thefound conclusions remain standing.
2.2.3.3 Time dependent plasma parameters
At LPP-KMS/ERM (Brussels) a 0D model was developed to describe (ato-mic) hydrogen RF plasmas from discharge initiation to the establishmentof steady state plasma parameters [91]. The model solves time dependentlythe particle and energy balance equations for atomic hydrogen, hydrogenions and electrons, assuming Maxwellian energy distributions for all thespecies. The elementary collisions included in the equations are excitationand ionization on electron impact (from the ground state), recombinationof ions and electrons, and the charge exchange reaction between H and H+.

2-12 Ion Cyclotron Wall Conditioning
The model, describing the RF plasma production based on collisional ab-sorption of RF power by the electrons and electron collisional ionization,is able to reproduce experimental breakdown times of TEXTOR, JET andASDEX Upgrade as a function the discharge pressure (10−3 − 10−1 Pa).The predicted electron energies are in the range of what is predicted by dela Cal (Te = 3 eV) [85]. The plasma ions gain their energy via coulomb col-lisions with electrons and will have approximately the same energy. The ion(particle and energy) losses to the walls are calculated from the confinementproperties of the magnetic configuration. The predicted electron densities,using the coupled RF power, the discharge pressure and the magnetic fieldas model inputs, are one order of magnitude higher than the experimentaldata (TEXTOR). It is proposed that this discrepancy between the experi-mental and modeling data is due to the presence of plasma impurities.
2.2.4 Formulation of modeling objectivesThe above overview shows that important insights can be obtained from themodeling of ICWC discharges. The main physical mechanism governingthe plasma breakdown was identified (electron collisional ionization), themain ion specie was found (H+), the plasma density and energy could beestimated (1010 − 1012 cm−3, ∼ 3 eV), the main wall bombarding speciescould be deduced (H-atoms), and the discharge control parameters wererelated to the conditioning efficiency which learns us how to optimize theefficiency. To increase the understanding and to verify the presented models,the modeling efforts have to be continued. The modeling aims for this PhDwork are listed in the following points:
• A model similar to the first presented model will be developed, relat-ing the out-pumped fluxes, wall desorbed fluxes and wall bombardingfluxes to each other (chapter 4). The model allows to estimate themagnitude of the wall bombarding flux and to propose optimizationsof the discharge control parameters to increase the conditioning effi-ciency. The analysis will be done both for GDC and ICWC, illustrat-ing some important differences between the two techniques.
• The physics of the second and third model will be combined intoone code (chapter 5). For this the 0D code for atomic hydrogen willbe upgraded to molecular hydrogen, including its most important el-ementary collisions. The implementation of molecular hydrogen ismotivated by the low temperature of the plasma, resulting from theincomplete ionization of the neutral gas. The presence of molecularhydrogen will thus be considerable.

Chapter 2 2-13
• As helium is an important gas for discharge wall conditioning, thesame model will be developed for helium and helium-hydrogen plas-mas. For this the balance equations for neutral helium and heliumions are added to the molecular hydrogen code.
• A qualitative description of plasma impurities will be included in themodel by adding balance equations for atomic carbon and its ions.
• The developed model will be benchmarked to experimental data ofTORE SUPRA and TEXTOR, and will be used to complement theexperiments with data that can’t be measured accurately:
– The model has to reproduce the experimental plasma densities(the available electron temperature measurements being unreli-able at the typical low temperatures).
– Causes of discrepancies between model and experiments will beinvestigated.
– Once the plasma density and its dependencies on the dischargecontrol parameters can be reproduced with sufficient accuracy,the main plasma and wall bombarding species can be identified.
– The deduced wall fluxes will be compared with experimentaldata, which allows to gain confidence in both the experimentaldata and the modeling results.
• A final code will be developed, linking the 0D plasma code for hy-drogen to a minimum description of the plasma wall interaction. Themodel allows interpreting the experimental isotopic exchange resultsand to propose optimized discharge scenarios for isotopic exchange(chapter 6).
2.3 RF physics aspectsThe RF physics aspects of ICWC discharges (discharge initiation and sus-tainment) have been well described by Lyssoivan [66, 72, 80–82, 84, 86, 87,92–97]. Large part of this section will be based on his work. The aim ofthis RF section is giving an overview on ICRF plasma production, couplingproperties of ICRF power to the plasma, and eventual deleterious effects onantenna operation.
2.3.1 RF systems in ICWC mode of operationBelow we give an overview of important RF terms, the employed RF anten-nas on TORE SUPRA, TEXTOR, ASDEX Upgrade and JET, the ICWC

2-14 Ion Cyclotron Wall Conditioning
mode operation settings and possible deleterious effects on the antennas.
2.3.1.1 Important RF terms
The power for each antenna is delivered by RF generators (PG) via trans-mission lines. The power transmitted to the antenna (Ptr,Ant) equals theforward minus reflected power at the level of the antenna (resp. PF,Ant andPR,Ant), and is approximately equal to the generator power.
Ptr,Ant = PF,Ant − PR,Ant ≈ PG (2.6)
The RF power at the antenna can also be written as a function of thecomplex antenna voltage, strap current and impedance values (resp. VAnt,IAnt and ZAnt = RAnt + jXAnt):
Ptr,Ant = 12Re (VAntI
∗Ant) , I∗Ant = V ∗Ant
Z∗Ant, Ptr,Ant = 1
2V2AntRe
(1
Z∗Ant
)(2.7)
The real part of the impedance (resistance RAnt) consists of ohmic vacuumlosses and the actual plasma loading: RAnt = Rv.loss + Rpl. Usually, theimaginary part has an inductive nature (XAnt = ωLAnt) and is much largerthan the real part: XAnt RAnt. Taking these considerations into accountwe obtain:
Ptr,Ant = V 2Ant2 Re
(1
Rv.loss +Rpl + jXAnt
)(2.8)
= V 2Ant2 Re
(Rv.loss +Rpl − jXAnt
(Rv.loss +Rpl)2 +X2Ant
)(2.9)
= V 2Ant2
Rv.loss +Rpl
X2Ant
≈ PG (2.10)
From the latter equation (eq. 2.10) we can deduce the part of the powerthat is absorbed by the plasma:
Ppl = V 2Ant2
Rpl
X2Ant
(2.11)
The antenna coupling efficiency is defined as the fraction of the generatorpower that is coupled to the plasma, and can with eq. (2.10) and (2.11) bewritten as:
η = Ppl
PG= Rpl
Rv.loss +Rpl(2.12)
This allows to calculate the coupled power to the plasma by measuring thegenerator power (or forward minus reflected power at the antenna) and theantenna resistance.

Chapter 2 2-15
In RF plasmas as well as in fusion plasmas, the aim is to couple thehighest possible fraction of generator power to the plasma, firstly for powerefficiency (eq. 2.12), and secondly to decrease the voltage at the antenna sidefor safety aspects (eq. 2.10). The antenna coupling efficiency depends on theextent wherein the structure of the antenna radiated RF field matches tothe structure of the field of excited plasma waves. The poloidal loop-typeantennas used in our experiments (see Fig.2.2) are designed to efficientlyexcite the Fast Wave (FW) in plasmas. Therefore, these antennas willdemonstrate a good coupling efficiency in the ICWC mode of operation ifwe find scenarios with FW excitation in low density ICWC plasmas. As willbe shown later, these scenarios have been found.
Non-perfect matching of the antenna impedance to the transmission lineimpedance results in the partial reflection of RF power at the level of theantenna (PR,Ant), which will cause standing wave pattern formation alongthe transmission line. The power stored in these standing waves will bepartially dissipated in the transmission lines and the standing waves caneven provoke arcing inside the transmission lines2.
2.3.1.2 Employed RF antennas in ICWC mode of operation
Fig. 2.2 shows images of the TEXTOR, TORE SUPRA, ASDEX Upgradeand JET ICRF antennas. The TEXTOR, TORE SUPRA and ASDEX Up-grade antennas are of the double loop type: two parallel RF current strapsplaced into an antenna box. The JET ICRF A2 antenna consists of four cur-rent straps. The current straps can be fed either out of phase, e.g. π-phasing(dipole) which is commonly used for heating scenarios, or in phase (calledzero-phasing or monopole). To reduce the deleterious effects on Ez-fieldgeneration during dense plasma RF heating and the resulting impurity gen-eration, a Faraday screen (FS) consisting of multiple parallel rods is placedin front of the straps [99]. The antennas are generally placed on the LFS ofthe vacuum torus due to the technical difficulty of mounting an antenna andits transmission lines at the HFS. For each tokamak the toroidal locationsof the antennas are shown in appendix A on a toroidal cross section. Asdescribed in the introduction (1.2.7), TEXTOR is equipped with two ICRHantennas, TORE SUPRA has three water cooled ICRH antennas with ac-tively cooled antenna protection limiters [100], ASDEX Upgrade and JETare both equipped with four ICRH antennas.
2The most dangerous places for arcing generation are vicinities of the nodes in thestanding wave pattern, thus where the RF voltage is low. The low RF voltage range(0.5 − 2 keV) is the most efficient voltage-range for secondary electron emission (SEE)generation and subsequent RF multipactor breakdown. Also high-voltage breakdown invacuum or vacuum arcs are possible (see [98]).

2-16 Ion Cyclotron Wall Conditioning
Figure 2.2: Pictures of the employed ICRF antennas. From left to right: TEX-TOR T-Antenna (f = 25−38 MHz), TORE SUPRA Antenna (f = 40−70 MHz),ASDEX Upgrade Antenna (f = 23 − 120 MHz), JET A2 Antennas (f = 23 −57 MHz). The given frequency ranges are not continuous.
For the ICWC mode of operation in JET [101], special Voltage StandingWave ratio (VSW) cards were developed to provide better antenna match-ing, and the feedback control for the RF power was disabled. The allowedfrequency range is limited between 25 MHz and 28 MHz to keep the voltagenode away from the sensitive bellow area of the VTL. The maximum allowedpressure in the vacuum transmission lines (VTL) was set at 10−4 mbar andthe maximum transmission line voltage set at 20 kV. The ICRF antennasare switched on before any gas is injected and the employed antennas (mod-ule C and D) were monitored at all time with CCD cameras. The maximumnumber of RF tripping events was set to 10 trips per pulse and 100 tripsfor the whole experiment. On TORE SUPRA [102], the standard matchingcircuits and phase control are switched off during ICWC operation (whichrequires some manual re-cabling work), and the antenna matching points areset manually. The antenna protection system controls the ratio of reflectedpower to forward power, which in case of arcing events (too high ratio during10µs) cuts the RF power feeding temporally. After 20 subsequent triggersthe discharge will be interrupted. On ASDEX Upgrade [103], the ICRF

Chapter 2 2-17
antennas are operated in pairs, each pair having two generators. A phaseregulation between two generators from each antenna pair is required (incase 0-π/2 phasing is requested) which is active from ∼ 200 kW/generatorand higher. To allow power levels < 400 kW from one antenna pair, one ofthe two generators is typically disabled for ICWC experiments, and to allowfor monopole operation, only one strap per antenna is fed. The double stubmatching system is set at fixed positions before a discharge. Two kinds ofarc detection systems are available (Pfor/Prev), one main system at the levelof the combiner and splitter of ‘generators to antennas’ feeding line, and fourcomplementary systems at the level of both antennas and both generators.As on ASDEX Upgrade, on TEXTOR [104] no major changes in the an-tenna circuit configuration are required for the ICWC mode of operation.On TEXTOR each antenna is fed by its own generator, and equipped withan auto tuning system (matching is thus adapted during the discharge).As on other tokamaks the arcing protection system relies on Pfor/Prev. Asthe ratio Pfor/Prev changes on plasma breakdown, the protection systemssometimes triggers on plasma breakdown.
To reduce the RF voltage in the breakdown phase a power ramp upscenario can be employed. On TORE SUPRA, the antenna generator poweris ramped up linearly from 30 to 60 kW in the first 0.3 s, whereafter the fullpower is applied within a short ramp-up time (< 0.1 s). On TEXTOR,JET and ASDEX Upgrade, when employing multiple antennas breakdownis achieved with only one antenna, whereafter the second antenna couplesextra power to the present plasma.
It was shown experimentally that strap phasing close to monopole isbeneficial for plasma production. Breakdown is achieved faster, and theantenna voltage is strongly reduced after breakdown indicating a betterpower coupling (eq. 2.10), illustrated for the TORE SUPRA Q2 antenna onFig. 2.3 (left). This point will be further discussed in section 2.3.6. Furtheron we will also see that operation at higher pressures (> 0.1 Pa) is notrecommended in order to avoid spurious plasma formation in the antennabox, or at the level of the Faraday screen (section 2.3.4).
2.3.1.3 Possible deleterious effects
Fig. 2.4 shows images of the Q2 and Q5 TORE SUPRA antennas, takenrespectively after the 2008 and 2010 experimental campaigns. The antennas,both used in ICWC experiments, show strong carbon deposition on theantenna straps (∼ 100 nm), and a deposition or heating pattern on the FS.On the straps (but not the FS) also arcing traces are visible that appear toremove the deposited carbon. Since the other TORE SUPRA antennas didnot show any deposited carbon after these campaigns, the ICWC session is

2-18 Ion Cyclotron Wall Conditioning
Figure 2.3: Left: RF voltages for 2 ICWC discharges on TORE SUPRA (Q2antenna, 2008) resp. in π (blue) and 0-phasing (red), indicating plasma breakdownby steep voltage drop. 0-phasing has a shorter breakdown time and a bettercoupling efficiency. Right: RF voltage after breakdown as function of pressurefor 1995-1998 discharges (blue, mostly π-phasing) 2008 discharges (red, π and0-phasing).
Figure 2.4: Left: TORE SUPRA Q2 antenna and FS after the ICWC session in2008. Right: TORE SUPRA Q5 antenna before and after the ICWC session in2010. The antenna straps feature as a result of the ICWC sessions a clear carboncoating (∼ 100 nm). Also on the FS there are deposition or heating patternsvisible. Finally, shallow arcing traces that have removed the deposited layer arevisible on the straps. It is however not sure whether the latter is due to ICWC.
held responsible. Regarding the arcing spots, the RF engineers do howevernot exclude the possibility that they stem from subsequent experimentalsessions [102].
This serious issue of substantial carbon deposition is not fully under-stood. The Paschen curve like dependence of the antenna voltage on thedischarge pressure in TORE SUPRA (Fig. 2.3, right) might indicate thatan electrode is involved in the RF discharge [103]. The ASDEX UpgradeRF voltage does not show a pressure dependence at all, which in turn mightindicate an electrode less discharge. The carbon deposition could thus be

Chapter 2 2-19
due to the presence of plasma inside the antenna box. Experiences on TEX-TOR, JET and ASDEX Upgrade do not report similar problems. Importantdifferences between the TORE SUPRA RF discharges and the TEXTOR,JET and ASDEX Upgrade discharges are the higher RF voltage, the higherapplied RF frequency (see table 2.1), and the cooled antenna straps. In
Table 2.1: Antenna voltages during ICWC operation on TORE SUPRA, TEX-TOR, ASDEX Upgrade and JET, and applied RF frequencies. [101–104]
TORE SUPRA 15− 25 kV (0-phasing, after breakdown)up to 35 kV (π-phasing) 48 MHz
TEXTOR < 10 kV 29 MHzASDEX U. < 10 kV 30 & 36.5 MHzJET 10− 20 kV 25 MHz
section 2.3.4 it is shown that the possibility to initiate a plasma insidethe antenna box increases on increasing antenna frequency (however duringrecent TORE SUPRA ICWC experiments using 42 MHz the problem per-sisted). In section 1.4.1.5 we saw that the thermal desorption of adsorbedmolecules is less probable at low surface temperatures.
2.3.2 From pre-wave ionization to plasma wave regimeICRF plasma initiation in a toroidal magnetic field results from collisionalabsorption of RF energy, mainly by electrons [84, 87, 92–95]. The first ion-ization reactions are caused by the assumed background density of freeelectrons present in the neutral gas. On switching on the RF field, theseelectrons, moving freely along the magnetic field lines are accelerated in theEz-field, which is parallel to the magnetic field, obtaining as such sufficientenergy for ionization. Since electromagnetic waves in the typical ICRF band(∼ 10 − 100 MHz) do not propagate in vacuum in the present size fusiondevices, the vacuum RF parallel electric field Ez will exist only in the regionnear the antenna, from where it will be evanescent in toroidal and radialdirections. Consequently the initial ionization will occur predominantly atthe low field side in the vicinity of the RF antenna. This stage of the dis-charge will be discussed further in detail in the next sections. When theelectron multiplication is sufficiently high to compensate eventual electronlosses, a plasma density will build up. After this pre-wave local ioniza-tion phase, as soon as the plasma frequency, ωpe ≈ 8980√ne Hz, becomesof the order the applied RF frequency, ωpe ≥ ω (ne = 1012 − 1014 m−3),plasma waves can start to be excited and propagate in the torus volume.As the waves propagate, the electromagnetic field expands in the vesselvolume causing further space ionization. This regime is called the wave

2-20 Ion Cyclotron Wall Conditioning
phase of the plasma. In order to obtain a homogeneous RF plasma, properwave propagation scenarios or at least a large decay length of the evanes-cent RF field is required, allowing to sustain the plasma also at the highfield side. The standard ICRF antennas are designed for efficient heating ofdense (ne > 1019 m−3) target plasma via excitation of the FW. It is aimedto transport the RF energy by the FW to selected areas, remote from theantenna where FW energy should be absorbed. For this purpose, a highkz-spectrum is formed with π-phasing (180 degree phase between adjacentantenna straps). In low density plasmas ne ∼ 1016 − 1017 m−3, and stan-dard ICRF antenna operation, the FW will not excite/propagate. In section2.3.6 on antenna coupling in the ICWC mode of operation we will see thatthe antenna parallel wave vector kz spectrum is an important parameterdetermining both the cut off density for FW propagation and the decaylength of the evanescent RF field. Furthermore, proper wave propagation isexpected to occur also via mode conversion scenarios of the evanescent fastwave into the SW and ion Bernstein wave if ω > ωci or at the Afvén reso-nance if ω < ωci. Although the latter scenarios are very likely interplayingin plasma production, they are difficult to be confirmed experimentally, asshown further.
2.3.3 Antenna RF field components and absorption ofRF power
The absorption of the RF power by the particle populations, both in pre-wave as in wave phase, happens mostly non-resonant by random collisionsin the plasma, with only a minor resonant absorption contribution localizedaround the ion cyclotron resonance layers in the vessel. In this sectionthe EM-field components and their influence on the ions and electrons areconsidered. The acceleration of the plasma particles in the RF electric fieldis naturally due to the Lorentz force:
~FL = md~vdt = q( ~E + ~v × ~Bz) (2.13)
With ~v the particle velocity, ~Bz the toroidal magnetic field and ~E the ap-plied RF electric field. The electric field in the vessel will have a componentparallel to the magnetic field lines, Ez, and two components perpendicularto the magnetic field lines Ex and Ey which are often represented as twocircularly polarized components, E+ and E−, from which the left handed,E−, rotates in the same direction as the ion gyration. ICRF fusion plasmaion-heating scenarios mostly rely on the perpendicular E− component. Theparallel electric field contributes to electron heating scenarios via Landaudamping. The presence of the parallel field is very fortunate for ICRF

Chapter 2 2-21
plasma discharges. It is generated both electrostatically due to the RFvoltage difference between antenna strap and sidewalls, and electromagnet-ically due to an induced RF voltage by the oscillating magnetic flux betweenthe tilted FS bars [105]. The non-resonant acceleration of the electrons andthe resonant cyclotron acceleration of the ions is respectively due to theparallel component and the left handed component of the electric field. Forthe applied ion cyclotron range of frequencies, the electrons experience theelectric field as being quasi constant and will consequently not be able toobtain sufficient energy for ionization in the perpendicular electric field dueto the ~v× ~Bz term. On the other hand, the acceleration in the parallel elec-tric field is not restricted allowing the electrons to obtain energy beyondthe ionization potential. Ions, due to their lower mobility (higher mass),will not be able to cumulate enough energy for ion impact ionization in theparallel electric field. The latter may however be achieved with cyclotronabsorption of RF energy by ions in the perpendicular electric field. Its effi-ciency is strongly peaked around resonance layers, where the ion gyrationfrequency (eq. 2.2) or its harmonics equal the RF frequency, and resonantabsorption becomes possible. Ion cyclotron resonance layers in a toroidalmagnetic field correspond to cylindrical surfaces with radius correspondingto
Rnci = eRZimi
nBTω
(2.14)
with Zi and mi the ion charge and mass, BT the magnetic field at themajor radius R0, ω the angular RF frequency, and n the cyclotron harmonicnumber (n = 1, 2, ...), where n = 1 represents the fundamental resonance.Fig. 2.5 gives a representation of eq. (2.14) by plotting Af
nZiBT, with A the
mass number of the atom (or molecule), as a function of a normalized radiusR/R0. Resonant absorption is most efficient for the fundamental resonance(ω = ωci) where the ion gyration has a constant phase with respect to theleft handed E− field. The efficiency decreases with increasing cyclotronharmonic number n (ω = nωci).
2.3.4 Breakdown conditionsIn the following, two models will be presented that describe together thebreakdown conditions of RF plasmas as a function of the discharge param-eters: RF frequency, RF field strength and pressure. These models are themain employed tools in choosing the proper discharge parameters in RFdischarges and are of particular concern for antenna safety considerations.For the pre-wave stage it is expected that the magnitude of the toroidalmagnetic field has only a secondary importance, whereas it certainly playsa role in the wave stage of the discharge.

2-22 Ion Cyclotron Wall Conditioning
Figure 2.5: Plot of eq. (2.14), giving AfnZiBT
as a function of the normalizedradius R/R0, with A the mass number of the charged particle, Zi its charge, nthe cyclotron harmonic number, f the RF frequency and BT the magnetic field atthe major radius R0. E.g. the fundamental resonance layer of deuterium in caseof f = 25 MHz (JET), BT = 3.3 T will be located on axis ( Af
nZiBT= 15.15). The
second harmonic of helium is located at the same radius.
2.3.4.1 Dependency on RF field and frequency
To determine breakdown conditions as a function of the RF field and fre-quency, a model was developed by Carter and Lyssoivan et al. [84, 106]describing the electron motion due to the Lorentz force in the near antennaparallel electric field. Although the aim of the model is to provide criteriafor neutral gas breakdown, frictional forces due to electron collisions areneglected since the collision frequency νc is much below the oscillation fre-quency νc w. As a consequence the model does not describe the pressuredependency of breakdown. The Lorentz force exerted on the electrons iswritten as:
FL(z0 + z1) = medvedt = eEz(z0 + z1)cos(ωt) (2.15)
≈ eEz(z0)cos(ωt)− e2
4meω2d|Ez(z0)|2
dz (2.16)
The electron motion is divided into a fast oscillatory motion (around z0and represented by z1) due to force Ff (z0), namely the first term of therhs of eq. (2.16), to which a slower drift motion due to force Fs(z0), thesecond term of the rhs of eq. (2.16), is superimposed. The latter force,called the ponderomotive force, originates from a Taylor expansion of the

Chapter 2 2-23
Figure 2.6: Calculation of the ICRF breakdown zone for the TORE SUPRAantenna at different frequencies: (a) f = 48 MHz; (b) f = 57 MHz; (c) f =63 MHz, for constant RF voltage at the antenna current strap VRF = 12 kV. [107]
Lorentz force FL(z0 + z1) around z0, and represents an average force re-sulting from the oscillation in the inhomogeneous electric field distributionalong the magnetic field lines. The model assumes that the electron mul-tiplication reactions contributing to a build-up of electron density happenpredominantly in front of the antenna. The criterion for breakdown con-siders thus (i) the oscillation energy of the electrons in the near antennafield, and (ii) the residence time of these electrons in front of the antenna.From eq. (2.16) a lower value is calculated for the electric field, express-ing the requirement that the oscillation energy has to exceed the ionizationthreshold εi. Secondly an upper value for the ponderomotive force is set,expressing that this force has to be smaller than the oscillatory force toallow for electron multiplication before the electrons are expelled from theantenna region. Via these criteria and using the radial decay of the parallelelectric field Ez(δr) = Ez(0)exp(−kzδr), with Ez(0) the electric field at thestrap, δr the distance from the strap and kz the parallel wave vector, onecan determine the breakdown area along the radial direction:
ω
e
√2meεi ≤ Ez(r) ≤ 0.2me
eω2Lz (2.17)
where Lz = Ez/(dEz/dz) is the parallel length scale of the ponderomotivepotential. Eq. (2.17) is of particular importance since it allows to study theeffect of the RF frequency, for a known RF vacuum field, on the radial widthand position of the breakdown region. Fig. 2.6 shows the breakdown areain the vacuum RF field of the TORE SUPRA antennas for a strap voltageof 12 kV and three standard ICRF frequencies. For the lowest RF frequency(48 MHz) the breakdown zone is located outside the antenna box, at a safedistance from the FS. It can be concluded from the figure that for a givenantenna voltage, lowering the RF frequency moves the radial breakdownregion away from the antenna. A longer decay length of the evanescent

2-24 Ion Cyclotron Wall Conditioning
vacuum RF field will expand the breakdown region.A few remarks have to be made to this model. (1) The presented break-
down criterion considers only electron multiplication collisions in front ofthe antenna. As indicated by Schüller [64], electrons expelled by the pon-deromotive force can obtain substantial energy from the Ez-field so thationization is also possible along the torus where the vacuum field is zero.From his analysis it follows that electron multiplication along the torus canbe equally important as ionization in the near antenna RF field. This re-mark however does not render eq. (2.17) without purpose. All RF antennasare equipped with antenna protection limiters which will collect the elec-trons that are expelled at the level of the FS. The constraint of eq. (2.17)provides thus still the criteria for limiting the residence time of electronsin the RF field close to the FS and thus to avoid spurious plasma forma-tion in this area. An electron expelled from the antenna region, and notcollected by a limiter however will travel around the torus and enter backin the antenna region from the other side where it can, depending on itsvelocity phase compared to the electric field phase, be further accelerated ordecelerated. As such these electrons obey a chaotic movement around thetorus determined by their initial positions and velocities, the length of themagnetic field line along which they move, and the RF field. Radial regionswith too high ponderomotive force are thus not necessarily excluded fromthe presence of plasma.
(2) A second remark by Schüller [64] is related to the definition of theponderomotive potential. The applied Taylor expansion to the Lorentz forceis only valid in case the amplitude of the oscillation is small compared tothe characteristic length scale of the ponderomotive potential. The upperlimit that was put on the electric field in order to have breakdown in frontof the antenna, Fs ≤ Ff , is thus the limit of the validity of the model andin principle does not prevent ionization to take place, albeit either in frontof or away from the antenna.
(3) Independently of this there is a second argument that could lead toless tight constraints. The mean free path for collisions of the electrons,and thus for multiplication reactions is of the order of hundreds of electronoscillations, dependent on the neutral pressure. By choosing to exclude thiseffect from the constraint, eq. (2.17) features a safety margin.
(4) As is acknowledged by Lyssoivan, the near antenna parallel electricfield features a complex three-dimensional character. In the vertical direc-tion, the electrostatic EM field will vary from the antenna strap feedingpoints (max) to the grounded points. The shape of the EM field in thetoroidal direction, and thus the ponderomotive force, will depend on theantenna design (dimensions) and phasing. And this specific toroidal shape

Chapter 2 2-25
will vary in the radial direction. A consistent representation of the initialdischarge phase has in principle to take into account all these dimensional-ities, which is a very complicated task. In the presented model the verticalinhomogeneity is neglected. The toroidal inhomogeneity is included by in-cluding the ponderomotive force, and the radial inhomogeneity is includedonly by considering a radially decaying electric field. The scale length of theponderomotive force is considered radially constant. This is presently thebest approximation, although it is acknowledged to be incomplete. Espe-cially the fact that the separation of the Lorentz force into a fast oscillatoryand slow ponderomotive force can become invalid close to the antenna needsto be further investigated.
2.3.4.2 Dependency on pressure
The breakdown criterion (eq. 2.17) describes the dependency on RF fieldand frequency, but it does not describe the dependency on the neutral gaspressure. Driven by the fact that at pressures above 10−1 Pa the danger ofspurious plasma formation at the strap surface or inside the antenna-boxon TORE SUPRA is thought to increase, Schüller [64] proposed an exten-sion of the model, determining the maximum allowed pressure below whichplasma formation at the FS should not take place. Plasma formation can beexpected to take place when the residence time of the oscillating electrons infront of the antenna is longer than the characteristic time for ionization inthe electric field 1/νRF
i , with the collision frequency νRFi estimated as [64]:
νRFi = 1.78 · 107 E
∗z
f∗nH2 〈σion〉 [s−1] (2.18)
with E∗z the maximum electric field in front of the antenna in [kV/m], f∗the RF frequency in [MHz], nH2 the neutral hydrogen density which isof course proportional to the pressure and 〈σion〉 the time averaged crosssection over one oscillation. The latter cross section can be expressed as afunction of Ez/f since the oscillation energy amplitude is proportional to(Ez/f)2. In the calculation of the threshold pressure the worst case scenariois considered taking the maximum cross section σion = 6.6 ·10−20 m2, for anE∗z/f
∗ value of 0.25 kV/m/MHz. The residence time is estimated as τpdm ≈(Want + Lz)/vpdm with Want the antenna width and vpdm =
√2εpdm/me
the final ponderomotive drift velocity obtained by an electron oscillating inthe ponderomotive potential, with εpdm its corresponding final energy [64]:
εpdm = 1115(E∗zf∗
)2
[eV]. (2.19)

2-26 Ion Cyclotron Wall Conditioning
This leads to the following constraint on the pressure (in [Pa]):
pH2(Want + Lz) 1 Pa m (2.20)
which indeed indicates that one should avoid hydrogenic torus pressure val-ues in excess of ∼ 10−1 Pa [64].
The two presented models allow thus to set firstly the optimal RF fre-quency for a given antenna electric field distribution. This frequency shouldnot be too high to avoid plasma formation inside the antenna box or at thelevel of the Faraday screen. Secondly the maximum allowed working pres-sure can be estimated for the chosen E∗z/f
∗-value which again should notbe too high to avoid the same problem.
2.3.5 Simulation of the initial breakdown phaseTo obtain information on whether the plasma builds up mainly in front ofthe antenna, or whether the electron multiplication of expelled electronssignificantly contributes, further efforts to model the initial plasma phaseare carried out during this PhD. Although the analysis remained fruitlessat this point it is shortly presented here. As for the above models, it waschosen to consider a 1D situation along the toroidal magnetic field lines, fora toroidal inhomogeneous electric field distribution.
2.3.5.1 Mean free path of electrons
Fig. 2.7 shows the mean free path λ = (σinH2)−1 of a single electron asfunction of its energy, for direct ionization of H2 (cross section from [108]),for a neutral pressure of p = 10−3, 10−2 and 10−1 Pa. The mean free pathis strongly dependent on the electron energy. The minimum, around Te =45 eV for usual discharge pressures below pH2 = 2 · 10−2 Pa, is comparableto or larger than the torus circumference. Since the mean free path is muchlarger than the oscillation lengths of electrons in the near antenna electricfield it was chosen to firstly model the initial breakdown phase withoutcollisions.
2.3.5.2 Study of 1D electron distribution function in the break-down phase
Instead of studying particle time traces of a few individual electrons a morerobust approach was chosen. In an attempt to obtain a complete descriptionthe Vlasov equation is solved, giving the evolution of the electron velocityand spatial distribution function fe(~r,~v, t) in the torus during the initial

Chapter 2 2-27
Figure 2.7: Comparison of the electron mean free path for reaction e + H2 →e+H+
2 +e (cross section from [108]) as a function of the electron energy and neutralparticle density, with the toroidal circumference of ASDEX Upgrade, TEXTOR,TORE SUPRA, JET and ITER
breakdown phase:
∂
∂tfe(~r,~v, t) + ~v · ∇rfe(~r,~v, t)−
qeme
( ~E + ~v × ~B) · ∇vfe(~r,~v, t) = 0 (2.21)
The electron movement along the toroidal magnetic field lines in the parallelelectric field is a 1D problem, and thus the Vlasov equation simplifies to
∂
∂tfe(z, v, t) + v
∂
∂zfe(z, v, t)−
qeme
E(z, t) ∂∂vfe(z, v, t) = 0 (2.22)
As edge condition for fe(z, v, t), to account for the periodicity of the mag-netic field lines we set fe(−πR, v, t) = fe(πR, v, t), and the initial velocitydistribution function at t = 0, uniform along the torus (Te in eV) equals
fe(z, v, 0) = ( me
2πkbTe11600)3/2e−1/2mev2kbTe11600 . (2.23)
The electric field distribution is strongly simplified, taking only the electro-static electric field originating from the voltage difference between the strapand antenna box. As such, the electric field is taken equal to zero aroundthe torus and in front of each strap, and −E or +E for the gaps betweenthe antenna straps and antenna box. Fig. 2.8 shows the normalized electricfield distribution both for monopole and dipole strap phasing.
The numerical solution of eq. (2.22) requires the definition of a spatialgrid. In this grid one wants a strong spatial resolution in front of the antenna(e.g. one velocity distribution every millimeter, for a 1 m antenna regionequals 1000 points), and a less but still high enough resolution for the rest

2-28 Ion Cyclotron Wall Conditioning
Figure 2.8: Schematic of the electrostatic electric field between the straps andantenna box in monopole and dipole.
of the torus (one velocity distribution every centimeter, for a 2π(R0 + a) mtorus circumference equals > 1000 points). Implementing the equation inthis manner is complex since it needs to take into account different gridsresolutions, and connect in front of the antenna, zones with and withoutelectric field. Also the number of distribution functions over which onewould need to iterate is very high (> 2000). For these reasons, solving theequation via its spatial Fourier transform appeared more attractive.
The simplified electric field ‘blocks’ shown in Fig. 2.8 can easily be rep-resented as a sum of its Fourier components. The Fourier components of arectangular function
f(z) =
1 if z ∈ A = [z0 − h, z0 + h],0 if z /∈ A.
(2.24)
with z0 the center of the block and h its half width, are obtained from theFourier integral:∫ z0+h
z0−he−ikz dz =
[e−ikz
−ik
]z0+h
z0−h= e−ik(z0+h) − e−ik(z0−h)
−ik
= e−ikz0e−ikh − eikh
−ik= 2k
sin(kh)e−ikz0 (2.25)
For the TEXTOR antenna we superpose four electric field rectangles (h =0.065 m) with their centers at z0 = [−30,−10, 10, 30] cm. In 0-phasing thepolarity of the blocks are respectively [+1,−1,+1,−1] and for π-phasing wehave [+1,−1,−1,+1] (see Fig. 2.8). In case of 0-phasing the total spectrumwill thus be:
E(k) = 2k
sin(kh)(ei0.3k − ei0.1k + e−i0.1k − e−i0.3k)
= 4ik
sin(kh)(sin(0.3k)− sin(0.1k)) (2.26)

Chapter 2 2-29
Figure 2.9: Representation of eq. (2.26): E(k) as a function of n.
Figure 2.10: Fourier recomposition of near antenna electric field
which is represented in Fig. 2.9. As edge condition, to cope with the peri-odicity of the torus we must keep only the wave vectors that are multiplesof 1/(R0 + a):
kn = n
R0 + afor n ∈ ℵ0. (2.27)
With the inverse Fourier transform we recover the spatial distribution wherewe truncate the sum for the lowest reasonable value of n.
E(z) = 12π
∫ ∞−∞
E(k)eikz dk ≈ (R0 + a) 12π
∞∑n=−∞
E(kn)eiknz (2.28)
Where (R0 + a) accounts to correct the amplitude of E(z). The resultfor n = [−100 : 100], [−125 : 125] and [−150 : 150] is given in Fig. 2.10.The figure illustrates that the number of Fourier components (distributionfunctions) has to be higher than 2 × 125 + 1 to reproduce an electric fieldthat sufficiently resembles the original one3.
3In fact, we do not want the exact block function since in that case the previously

2-30 Ion Cyclotron Wall Conditioning
For the numerical implementation of the 1D Vlasov equation (eq. 2.22)we apply a Fourier transform in space:
∂
∂tfe(k, v, t) + ikvfe(k, v, t)−
∫qeme
E(z, t) ∂∂vfe(z, v, t)e−ikz dz = 0 (2.29)
which with∫E(z, t)g(z, v, t)e−ikz dz = R0 + a
2π
∫ ∑E(kn, t)eiknzg(z, v, t)e−ikz dz
= R0 + a
2π∑
E(kn, t)∫e−i(k−kn)zg(z, v, t) dz
= R0 + a
2π∑
E(kn, t)g(k − kn, v, t) (2.30)
results in
∂
∂tfe(km, v, t) = −ikmvfe(km, v, t)+
R0 + a
2πqeme
∑E(kn, t)
∂
∂vfe(km−kn, v, t)
Or if we truncate the number of distribution functions to m = [−150 : 150]
∂
∂tfe(km, v, t) = −ikmvfe(km, v, t)
+ R0 + a
2πqeme
150−m∑n=−150−m
E(kn, t)∂
∂vfe(km−n, v, t)(2.31)
To agree with the initial condition, the inverse Fourier transform of fe(k, v, t)at t = 0 needs to result in eq. (2.23):
fe(z, v, 0) = 12π∑
fe(kn, v, 0)eiknz (2.32)
from which we know that
fe(kn, v, 0) =
2πfe(z, v, 0) if n = 0,0 if n 6= 0
(2.33)
Eq. (2.31) can be solved explicitly or implicitly. The implicit solution re-quires the inversion of a large matrix, which could be done manually. How-ever the resulting code was too slow to obtain sufficient simulation time.For the explicit solution, the accuracy and calculation time were found tobe very sensitive to the chosen time step and velocity grid (vmin, vmax anddv). Only 7 RF periods could be simulated with the explicit scheme forwhich the calculation time took approximately 2 CPU days. On continuingthe calculation for further RF periods the result mostly becomes unstable

Chapter 2 2-31
Figure 2.11: Evolution of the electron distribution for the simplified TEXTORantenna electric field (and torus) dimensions in monopole phasing, with parallelelectric field amplitude of E0 = 3 kV/m, RF frequency f = 48 MHz, initial elec-tron energy distribution function of 0.5 eV, n = [−135 : 135] and velocity arrayv = [−8vo : 8vo] (length = 3001) with vo = eE0/2πfme, the oscillation veloc-ity amplitude in a homogeneous oscillating electric field with amplitude E0. Thetime instance for each plot is given as a function of the RF period, the x-axisrepresents the length scale along the magnetic field [-1 to 1 m], and the y-axis,the parallel velocity [−107 to 107 m/s]. (The ionization threshold velocity equalsvith = 2.2 · 106m/s)

2-32 Ion Cyclotron Wall Conditioning
due to repeatedly summing over the first derivatives of the spectral dis-tribution functions. Fig. 2.11 shows a simulation result for the TEXTORantenna (and torus dimensions) in monopole phasing, with parallel electricfield amplitude of E0 = 3 kV/m, RF frequency f = 48 MHz4, initial electronenergy distribution function of 0.5 eV, n = [−135 : 135] and velocity arrayv = [−8vo : 8vo] (length = 3001) with vo = eE0/2πfme, namely the os-cillation velocity amplitude in a homogeneous oscillating electric field withamplitude E0. The two top figures for t = 0.15T and t = 0.5T show thatthe electron distribution function in front of the antenna strap-box gapsshifts entirely in velocity space due to the electric force. These shifts occurperiodically and represent electrons that oscillate with the RF period in theelectric field in front of the antenna. The maximum obtained velocity aftert = 0.5T (ve ≈ 3 · 106 m/s) on the right top figure is sufficient for ionization(vith = 2.2 · 106m/s). Already after the first oscillation it is clearly visiblethat groups of electrons leave the electric field regions5. Electrons leaving atthe left side having a negative velocity will travel around the torus and enterthe antenna region again from the right side (in case of no collisions). Thesame happens for electrons leaving at the right side; they will go around thetorus and enter the antenna region from the left. Electrons leaving from thecentral two electric field regions move towards the center (z = 0), and willfinally reach the other electric field region where they will either undergoa net acceleration or deceleration, depending on the electric field polariza-tion. Some part of these electrons will be sent back to the center region, andone can imagine that again a part of these electrons will remain trappedin ‘resonant’ trajectories between two electric field regions. Depending onthe electric field distribution (strength and ponderomotive force), a certainelectron fraction will undergo a chaotic movement around the torus, beingaccelerated or decelerated every time they pass the antenna region. Al-though it was not possible to confirm this by the simulation it is expectedthat after some time an equilibrium periodically oscillating electron distri-bution will be formed around the torus that could be used to couple withcollisions and as such deliver a complete description of the breakdown phase.
2.3.6 Antenna coupling in ICWC mode of operationAs mentioned in section 2.3.2, the conventional antennas are designed fordense target plasma heating (ne 1018 m−3) through excitation of the FWwith high coupling efficiency (η > 0.9) [94]. ICWC-plasmas have generally
discussed ponderomotive force would be infinite at the edges of the electric field regions.4The RF frequency of f = 48 MHz is not available on TEXTOR.5The choice of initial antenna electric field polarization (+E(r)cos(ωt) or
−E(r)cos(ωt)) determines the direction of the electron groups.

Chapter 2 2-33
a lower density (ne ∼ 1016 − 1018 m−3) which results mostly in a poorcoupling (η0 ∼ 0.2−0.3) if standard ICRH heating settings are used. Duringthe many experimental sessions on different machines improvements on thecoupling efficiency were evidenced that allowed to increase the couplingefficiency 3 to 4 times. A recent publication of Lyssoivan [94] summarizesthese findings and shows that they can be explained in terms of (a) theantenna parallel wave vector (kz) spectrum and (b) wave mode conversions.
2.3.6.1 Antenna kz spectrum
The antenna kz spectrum depends strongly on the antenna strap phasing:for close to monopole phasing the spectrum is concentrated around longerwave lengths, for dipole phasing around shorter wave lengths. The radialdecay length (Evac
z (δr) ∝ e−δrkz ) of the vacuum parallel electric field whichis determined by the wave vector spectrum, will thus likewise depend onthe antenna phasing. In monopole phasing the field will thus extend furtherinto the vessel. The observed faster breakdown time in monopole phasingcompared to dipole phasing, shown in Fig. 2.3, is a first example that canbe related to the larger extension of the vacuum RF field. Secondly it wasobserved that also the coupling efficiency improves in case of low kz values.In case the FW wave remains non propagative, this is thought to be purelyrelated to the wider radial spreading of the vacuum RF field. However itis possible to obtain a regime wherein the FW becomes propagative, sincethe cut-off density for FW propagation is dependent on the parallel wavevector [105]:
ω2pi =
(k2zc
2
ω2 − 1)(
1 + ω
ωci
)ω2ci (2.34)
with ωpi the ion plasma frequency, dependent on the ion density, ω thewave frequency and ωci the ion cyclotron frequency. A change from dipoleto monopole phasing can change the cut-off density over a few orders ofmagnitude (from 1019 m−3 to 6 ·1016 m−3 [105], JET). Fig. 2.12 (left) showsthe coupling efficiency (left axis) as a function of the parallel wave vectorspectrum for the JET A2 antenna, and the FW cut-off density on the rightaxis. For lower kz values the coupling clearly increases, and in case ofmonopole phasing it is expected that the FW is even propagative, allowingfor homogeneous plasma formation in the radial direction.
Monopole phasing of the antennas is thus the ideal mode of operation forICWC. The further extension of the RF field in the vessel and the lower cut-off density for wave propagation in monopole phasing lead to better couplingefficiencies, lower RF voltages, a more homogeneous plasma distribution andshorter breakdown times than in dipole phasing.

2-34 Ion Cyclotron Wall Conditioning
Figure 2.12: Antenna coupling efficiency to ICWC plasmas (ne ∼ 3 · 1017 m−3).Left: Antenna coupling efficiency vs. kz-spectrum of the radiated RF power forstandard ICRF antennas [105], Right: Antenna coupling efficiency vs. ion cy-clotron harmonic number [94].
2.3.6.2 Mode conversion scenarios
On the other hand, it was observed that such homogeneous plasma distri-bution can also be obtained when operating the antennas in dipole phasing.In this case one needs to rely on mode conversion (MC) scenarios or dualfrequency operation, for which the experimental proof is shown in Fig. 2.13.Conversion of the FW to the SW or ion Bernstein wave (IBW) becomespossible in plasmas with multiple ion species (typically the case in ICWCplasmas), and is localized at mode conversion layers, between ion-ion hy-brid resonance layers and harmonic cyclotron resonance layers. The leftpicture, which is a top view CCD image of a pure helium RF plasma, thusin principle without MC, shows that the plasma is located at the low fieldside. On injecting hydrogen into the plasma MC becomes possible and theplasma extended further into the vessel (center picture). The fundamental
Figure 2.13: Top view CCD images of ICWC plasmas on ASDEX Upgrade:pure He ICWC plasma (left), H2/(He + H2) ≈ 0.3 gas mixture (center) and fordual frequency operation in the same gas mixture (right, 30 MHz and 36.5 MHz).Discharge parameters: BT = 2.4 T, p ≈ 4 · 10−2 Pa, PRF,coupled ≈ 50 kW

Chapter 2 2-35
Figure 2.14: CCD images (tangential view) of TEXTOR He/H2-ICWC dis-charges at resp. BT = 2.3 T (left) and BT = 0.23 T (right), both at the same gen-erator power (PRF,gen = 1×80 kW) and discharge pressure (Ptot = 5 ·10−4 mbar).
cyclotron resonance layer in these two cases is located close to the antenna(R = 2 m, 30 MHz). On adding a resonance layer, by changing the fre-quency of one of the antennas a second mode conversion can occur for thisresonance layer (R = 1.65 m, 36.5 MHz), which causes the further radialexpansion of the plasma as can be seen on the right picture. The proof isstrengthened by the confirmation of the observed radial plasma distributionwith the 1D full wave RF code TOMCAT [89] (see [97]). In chapter 5 wewill see that from atomic physics point of view, when keeping input powerand total pressure constant, the plasma parameters of a hydrogen-heliumplasma, can be significantly different from that of a pure helium plasma,which might also explain wider radial plasma extension. The further exten-sion on application of two RF frequencies can however not be explained interms of atomic physics only.
2.3.6.3 High harmonic scenarios
It is observed that ICWC operation at lower toroidal magnetic fields alsoincreases the coupling efficiency. Fig. 2.12 (right) shows the coupling effi-ciency as a function of the ion cyclotron harmonic number calculated usingthe on axis magnetic field. The coupling efficiency of discharges at the 8thcyclotron harmonic number is 1.6 times higher than at the fundamentalresonance. This is due to the strongly reduced cut-off density for FW ex-citation in case of high cyclotron harmonic (HCH) operation [87] (via theion cyclotron frequency the cut-off density is a function of the magneticfield, see eq. 2.34). In this case the FW can become propagative even withantenna high kz-spectrum (π-phasing) [87,92]. Besides the higher couplingefficiency, the presence of multiple resonance harmonics in the low BT case

2-36 Ion Cyclotron Wall Conditioning
allows also multiple mode conversions along the radius which can signifi-cantly improve the plasma homogeneity, due to a more homogeneous radialelectron power deposition profile. Both effects are clearly visible by visualimaging. Fig. 2.14 shows CCD images of two almost identical ICWC dis-charges on TEXTOR, the left one at high toroidal field, and the right atlow toroidal field.
2.4 Neutral cycle in vacuum vesselEvery discharge conditioning technique relies on the throughput of gas. Therequested discharge gas is injected via valves while the neutral gas mix-ture in the vessel is continuously removed by the machine vacuum systems,called vacuum pumps. During ICWC experiments on current tokamaks,the available gas injection and vacuum pumps of the machines are used intheir standard setup since changes in hardware are complex (or even notallowed). Nevertheless it is acknowledged that the efficiency of the condi-tioning technique strongly relies on the gas throughput, or more preciselyon the efficiency for removing the wall released gas. In devices under con-ception (ITER) one has thus to foresee efficient pumping systems. In thefollowing we give an overview of the involved gas dynamics, and the availablepumping systems.
2.4.1 Vessel pressure evolutionThe pressure p [Pa = 10−2mbar], density n = N/V [m−3] and temperatureT [K] of a gas are related by the very well known ideal gas law: pV = NkT .The total pressure in the vessel is the sum of the partial pressures of thedifferent components of the gas mixture p = pA + pB + ... in the vessel.The time evolution of the partial pressure of atom (or molecule) A can beexpressed by the following equation:
dpA
dt = Qsv,A
V+ Qsw,A
V− pASA(p)
V−∑ij
kijAnjpA (2.35)
The equation includes injection of A by the valves, Qsv,A [Pa.m3/s]6, releaseof A from the vessel walls, Qsw,A [Pa.m3/s], removal of A by the pumps,pASA(p) [Pa.m3/s], with SA the pumping speed of A [m3/s] which can be
6For completion we mention that injection flows are often given as a volume flowin ccm = cm−3/min. To obtain the flow in Pa.m3/s one has to know the pressureof the injection system. To express an amount of injected gas, or remaining gas inthe injection balloons often the unit [mbar.l] is used. To obtain the correct number ofinjected, outpumped or present particles one logically always needs to take into accountthe temperature of the considered gas.

Chapter 2 2-37
dependent on the pressure, and the last term represents losses of A due toelementary reactions in the plasma, where i labels the possible reactions(mainly ionization and dissociation) between plasma specie j and neutralgas A. The 0D character of eq. (2.35) is valid if the mean free path ofthe neutral molecules is large compared to the vessel dimensions. Thiscondition is mostly fulfilled for the applied ICWC plasma parameter range.Separately, the last term in eq. (2.35) accounting for the loss of particlesinto the plasma can become very high compared to the injection rate by thevalves and removal by the pumps. This will be discussed in detail chapter4 and chapter 5.
Eq. (2.35) is very important, as will become clear further in this ma-nuscript, since it allows to assess the removal efficiency of conditioningdischarges (pS). It is used to obtain accurate particle balances for thedischarges, or for example to predict the pressure in absence of plasmaand compare with experimental measurements in presence of plasma. Thepressure evolution in absence of plasma can be obtained numerically fromeq. (2.35):
pA(t2) = pA(t1) + ∆p(∆t)
= pA(t1) + Qs,A(t1)V
∆t− pA(t1)SA
V∆t
= Qs,A(t1)V
∆t+ pA(t1)exp(−SA
V∆t)
= Qs,A(t1)V
∆t+ pA(t1)exp(− ∆tτS,A
) (2.36)
where τS,A = V/SA is the characteristic pumping time of A. The pumpingspeed S of a gas can thus be found experimentally by the exponential decayof the pressure in the vessel, as shown on Fig. 2.15.
2.4.2 Pumping systemsThe employed pumping systems during conditioning discharges, required toremove wall desorbed particles from the vessel are connected to the vac-uum vessel via pumping ducts. For efficient removal of neutralized gas instandard tokamak discharges the ducts are connected to the vessel on mul-tiple locations along the toroidal limiter in limiter machines, and divertorin divertor machines. We distinguish two types of pumps, namely turbo-molecular pumps and cryopumps.

2-38 Ion Cyclotron Wall Conditioning
Figure 2.15: Exponential decay of the helium (baratron) pressure after endingthe continuous helium gas flow (t = 201 s), showing that the helium pumpingspeed of the TORE SUPRA turbo pumps is pressure independent over 2 ordersof magnitude, and can be described by a time constant τS,He.
2.4.2.1 Turbomolecular pumps
A turbomolecular pump [109] consists basically of multiple layers of fastrotating blades that will literally push the gas particles in a required flowdirection: the particles receive impulse on impact with the rapidly movingsurfaces. The pumps mostly require a vacuum pressure lower than a fewPascal to become efficient. The efficiency is inversely proportional to thesquare root of molecule mass (1/√mA), and requires that the rotor speedis larger than the speed of the molecules. On tokamaks TEXTOR, AS-DEX Upgrade and TORE SUPRA the turbomolecular pumps are able toefficiently remove light particles such as H2, D2 and He (τS < 10 s). TheJET turbopumps do not efficiently pump H2 (τS > 100 s) and the pumpingspeed for He is very low SHe = 5 m3/s (τS = 37 s). For most machines,the pumping speed is only weakly dependent on the pressure in the appliedrange of conditioning pressures.
2.4.2.2 Cryopumps
The working of a cryopump [110] is based on the physisorption of particleson cooled surfaces. In principle cryopumps can thus pump all gases includ-ing noble gases, if the temperature is sufficiently low. Cryopumps are onlyefficient above the gas specific saturation pressure. Fig. 2.16 shows satura-tion vapor pressures for cryocondensation as a function of the cryosurfacetemperature. The JET cryopanels for example, which are at 4.8 K, do notefficiently pump hydrogen below 10−5 mbar, and also helium is not efficientlypumped. Deuterium, having a much lower saturation pressure, is efficientlyadsorbed on the panel surfaces with high pumping speed SD2 = 115 m3/s

Chapter 2 2-39
Figure 2.16: Saturation pressure curves of common gases as a function of thecooled surface temperature [110].
(τS = 0.6 s). The total amount of molecules that can be accumulated onthe cryosurfaces with high pumping speed is limited. When this limit is at-tained, the panels can still continue accumulating more gas (cryosorption)but with a strongly reduced pumping speed. Furthermore, a concurrentpumping of gases can occur in case of gas mixtures by entrainment (cry-otrapping) of gas particles which are not condensible at the given tempera-tures and pressure conditions [111]. Due to the weak physical bondings thecryopanels can simply be regenerated on increasing the surface temperature.During regeneration, the content of the desorbed gas can be analyzed bygas chromatography (JET), which will be discussed in appendix B.
2.4.2.3 Pumping systems on ITER
The present ITER design is equipped with five cryopumps connected di-rectly to the vessel, and three cryopumps on a branched duct. The charcoalcoated cryopanels will be cooled to 4 K and are expected to efficiently pumphelium, and all hydrogen isotopes. Table 2.2 gives the estimated pumpingspeeds of a single torus cryopump for common gases. The pumping speed forhelium is expected to be S = 52 m3/s. The effective pumping speed of thepumps is due to the torus to pump connection conductivity properties how-ever lower, 44 m3/s for a direct pump and 31 m3/s for a branched pump. Themaximum attainable pumping time is thus τS = 1400 m3/313 m3/s = 4.5 s,which is slightly better than in current tokamak vacuum vessels. However

2-40 Ion Cyclotron Wall Conditioning
Table 2.2: Molecular pumping speeds S [m3/s] at 293 K for a single ITER toruscryopump.
He H2 D2 DT N2S [m3/s] 52 78 55 50 21
on ITER the cryopumps will not all be operated at the same time. Sincethe capacity of a cryopump is limited, ∼ 45 kPa.m3 for ITER pumps (He),the operation scenarios for the pumps require the inclusion of pump regen-eration time windows. The accumulated amount of gas per torus pump ina 400 s D/T discharge is of the order of 25 kPa.m3. It is therefore fore-seen that the pumps are operated in sequences so that at any given timefour out of eight pumps are operational. A pump that is operated duringone plasma discharge, will be regenerating during the subsequent discharge.The foreseen pumping time during plasma discharges and wall conditioningdischarges will thus be τS ≈ 9 s.
The required injection rate to obtain a typical ICWC pressure of 10−2 Paon ITER can be calculated from eq. (2.35): Qsv = pV/τ = 1.6 Pa.m3/s. A500 s wall conditioning discharge would give thus a minor contribution tothe total gas load to the pumps 0.8 kPa.m3 ≈ 0.2 kPa.m3/pump.
2.5 Characterization of wall fluxIn this section we will provide an overview of the characterized wall fluxduring ICWC discharges. Hydrogen ICWC:
• Neutral particles: In section 4.1.3 we will find that the wall flux inICWC discharges is of the order of ∼ 1019−1020 /m2s (TEXTOR andJET analysis). In chapter 5 on the 0D modeling of ICWC dischargeswe will find that this number corresponds to the flux of low energyneutral particles (T ≈ 3 − 5 eV), stemming predominantly from thedissociation of neutral hydrogen molecules. These low energy parti-cles can cause chemical erosion of surfaces. Since neutrals are notconstrained by the magnetic field the neutral flux can be consideredhomogeneous.
• Energetic neutral particles: In case of resonant absorption of RFpower, a flux of fast CX neutrals will occur. This wall flux can also beconsidered to be homogeneous. The fast CX flux measured on JET(see e.g. Fig. 4.7) is of the order of 1015− 1017 /m2s, with Maxwellianenergies of T = 1− 10 keV. These high energies are sufficient to reachdeeper surface layers and to cause physical sputtering. As will be

Chapter 2 2-41
shown in section 4.1.2, the contribution of the high energy CX flux tothe conditioning effect was found to be limited.
• Ions: On TEXTOR, the ion current on one of the ALT limiter bladeswas measured during H2-ICWC while biasing the surface to −300 V,resulting in an ion current of 1017 − 1018 /m2s. This number is con-firmed in chapter 5 on the 0D modeling of ICWC discharges. Theenergy of this wall flux is not known. It is expected that, as in thecase of GDC, sheath effects can increase the ion impact energy on thewall. Since ions are transported along the magnetic field lines, the ionflux is likely not homogeneous. The highest flux will be on limitingsurfaces (see section 3.1).
Helium ICWC:
• Ions: 0D modeling results for TORE SUPRA He-ICWC discharges,presented in chapter 5, showed that the helium ion wall flux is of theorder of 5 · 1016 − 5 · 1017 /m2s, and is an increasing function of thecoupled RF power. Similar as for the H2-ICWC ion wall flux, it isexpected that sheath effects can increase the ion impact energy, andthat the flux is likely not homogeneous due to ion transport alongthe magnetic field lines. The modeling results showed also that walldesorbed species can contribute largely to the wall flux: in case of a4.5% hydrogen content in the discharge neutral pressure, the hydrogenion wall flux is of the same order as the helium ion wall flux.
• Neutrals: The same 0D modeling results for TORE SUPRA He-ICWCdischarges, presented in chapter 5, showed that the neutral hydrogenatom flux stemming from wall desorbed hydrogen can be of the orderof 1018 − 1019 /m2s, thus larger than the ion fluxes.


3ICRF plasma homogeneity and
confinement properties
To ensure the ability of a discharge conditioning technique to effectivelyreach the whole wall area with a sufficient particle flux, the discharges arerequired to be homogeneous. In section 2.3 we saw that proper setting ofthe RF parameters is a first step to obtain homogeneous ICWC plasmas.However as will be shown in this chapter, some of the experimental find-ings on discharge homogeneity can not be explained in terms of RF powerabsorption properties.
In the first part of this chapter we will discuss experimental facts onplasma homogeneity, and how experimental optimization led to its improve-ment. In case when RF power absorption properties cannot explain the in-homogeneities, it is expected that the confinement properties of the toroidalmagnetic field lie at the basis of these inhomogeneities. Therefore, in thesecond part of this chapter the confinement properties of a partially ionizedplasma in a toroidal magnetic field configuration with additional small ver-tical component are discussed. In a final section of this chapter an equationfor the plasma confinement time is given, from which the charged particlefluxes to the wall can be estimated. The latter is additionally motivated bythe fact that in the 0D plasma model that will be discussed in chapter 5, theparticle confinement times are required to calculate the particle and energylosses to the walls. Furthermore to justify the relevancy of a 0D approachto study RF plasma parameters, a proper consideration of the homogeneity

3-2 ICRF plasma homogeneity and confinement properties
Figure 3.1: Simulated magnetic field lines resulting from a strong toroidal field(2 T), inhomogeneous in the radial direction, superimposed with a weaker homo-geneous poloidal field (50 mT). The blue line results from an applied radial field,and the red line from a vertical field. Both simulated lines pass through the centerof the vessel (R = R0, z = 0, TORE SUPRA dimensions). Left: top view of thevessel, right: side view of the vessel.
of the RF plasmas is needed.As an introduction to this chapter, we will start with a short summary
on the ICWC magnetic configuration.
3.1 The magnetic fieldThe ICWC magnetic configuration consists of a high toroidal magnetic fieldBφ(R), inhomogeneous in the radial direction, to which a smaller homoge-neous poloidal field (Bp = cst) is superimposed1:
~B(R) = R0
RBφ(R)1φ +Bp1z,R (3.1)
with R0 the major radius. For the poloidal field, mostly a constant verticalfield Bz is chosen since it was found experimentally that this field can im-prove the plasma homogeneity (see further). But also radial fields (BR) oreven time varying fields are possible. An illustration of the resulting fieldlines is given in Fig. 3.1. The figure shows two magnetic field lines passingthough the center (R = R0, z = 0) of the TORE SUPRA vacuum vessel, fora toroidal field of Bφ(R) = 2 T and respectively a radial (blue) and vertical(red) field of BR,z = 50 mT. In case of a homogeneous radial field, the fieldlines (blue) will describe a spiral in the horizontal plane, from the innerwall to the outer wall. In case of a vertical field, the field lines (red) willdescribe a helix with constant radius (the major radius in this example)from the bottom of the vessel to the top. As stated in the introduction,
1In this chapter the toroidal magnetic field BT is designated Bφ, the vertical field BVis designated Bz .

Chapter 3 3-3
Figure 3.2: Currents in two outer poloidal field coils, Dh and Db (see Fig. A.4for location), and forward minus reflected RF power for He-ICWC discharge. RFtripping events occurred with the same frequency as the applied poloidal fieldoscillation.
the poloidal field is generated by properly setting currents (∼ kA) in thepoloidal field coils, as is for example shown in Fig. A.5 in appendix A. Byapplying oscillating currents to the coils, the poloidal field will oscillate aswell. This allows to sweep the plasma over the wall surface, which is con-firmed by CCD camera images on both TEXTOR and TORE SUPRA. OnTORE SUPRA however it was observed that RF tripping events occurredwith the same frequency as the applied poloidal field oscillation (Fig. 3.2),making that this mode of operation is not recommended.
In tokamak plasmas with toroidal transform one speaks of the confinedplasma and the plasma edge. The last closed flux surface separates thesetwo areas (see section 1.2.6). In RF plasmas, in absence of the poloidaltransform, a similar effect can be found (Fig. 3.3). For a purely toroidalmagnetic field (top figure) all field lines in the plasma center are closed(red). The field lines at the ‘edge’ are limited by wall structures (green). Inpresence of a vertical field (bottom figure) one can distinguish long field lines(red), connecting the top half to the bottom half, and short ones (green) thatare limited by wall structures. In analogy with the SOL in tokamak plasmaswith rotational transform, the density is expected to decrease radially forlimited areas. The density profile in the RF plasma edge depends than in

3-4 ICRF plasma homogeneity and confinement properties
Figure 3.3: Schematic of the magnetic field lines (dashed lines) in the toroidalvessel (full lines), on a horizontal side view of the vessel. For a purely toroidalmagnetic field (top figure) all field lines in the plasma center are closed (red).The field lines at the ‘edge’ are limited by wall structures (green). Similarly Inpresence of a vertical field (bottom figure) one can distinguish long field lines(red), connecting the top half to the bottom half, and short ones (green) that arelimited by wall structures.
principle on a diffusion coefficient, and the decay length λ is given by [112]
λ =√D⊥Lccs
(3.2)
with D⊥ the transverse diffusion coefficient, Lc the connection length be-tween the limiters and cs the ion sound velocity. The approximate radialdensity profile in the edge is then
n(r) = n(0)exp(−r/λ). (3.3)
The cross field diffusion coefficient, in absence of a vertical field, could beestimated on TEXTOR via the radial plasma density decay length (λ) closeto the wall, shown below in Fig. 3.11.
3.2 Experimental observations on plasma ho-mogeneity
3.2.1 Inhomogeneities in the plasma centerDue to particle transport along the magnetic field lines, RF plasmas areconsidered homogeneous in the toroidal direction. An experiment was pro-posed on TORE SUPRA to evidence this by measuring the currents on thesix glow electrodes located at the top of the vessel (one in each Q-sector,see Fig. A.1) but unfortunately this experiment could not take place. In the

Chapter 3 3-5
poloidal plane RF plasmas are known to feature inhomogeneities for whichsufficient experimental data is available.
3.2.1.1 Vertical inhomogeneities
Experimental data shows a tendency of the plasma to be concentrated at thetop of the vessel, which is most pronounced at higher RF powers. Fig. 3.4shows an extreme example of an ASDEX Upgrade plasma where all fourRF antennas were employed (fRF,1−2 = 36.5 MHz and fRF,3−4 = 30 MHz),with a total generator power of PRF,gen = 400 kW and pressure of pHe ≈3 ·10−5 mbar. The foreseen helium pressure during this discharge was pHe =2 · 10−4 mbar, but due to the consumption of helium by the vessel walls thepressure during the discharge was much lower (see section 4.2.5). The highRF power, combined with relative low pressure and small ASDEX Upgradevacuum vessel volume, make that the ionization during this discharge isclose to complete. This is confirmed by the fact that the recorded densityby interferometry (ne ≈ 1018 m−2 for approximately 1 m viewing lines) isin agreement with the helium density derived from the neutral pressuremeasured in the divertor area (3 · 10−5 mbar ≈ 7.5 · 1017 m−3 at 300 K).The visible light image, obtained with a fast CCD camera and overlaid tothe ASDEX Upgrade inner wall reconstruction2, shows the strong poloidalinhomogeneity of the plasma. Almost no light is emitted from the lowervessel part, and seemingly even the lower part of the RF antenna area has alimited plasma density. Based on this result it is assumed that plasma driftsrather than RF power coupling properties lie at the origin of the verticalinhomogeneity.
On JET it was shown that on applying a small vertical field, the verticalhomogeneity can be improved, and that the divertor area can be reached.Fig. 3.5 shows CCD images of two identical RF discharges respectively with-out (left) and with (right) vertical field (Bz = 30 mT). On application ofthe vertical field more light, resulting from collisional processes of recycledneutral particles, is emitted from the divertor area on the bottom of thevessel. Furthermore the plasma is also clearly brighter at the high field sidewhich indicates that the vertical field also influences the radial homogeneity.Fig. 3.6 confirms both facts with help of interferometry data. The densityfrom horizontal HCN viewing lines 5 and 8 is clearly higher on applicationof a vertical field, and the densities from vertical viewing lines (1 and 4, re-spectively at high and low field side) approach each other on application ofa vertical field (see appendix A for the geometry of the HCN viewing lines).The fact that the plasma can be stretched in the vertical direction on ap-
2Thanks to dr. Tillman Lunt, IPP-Garching

3-6 ICRF plasma homogeneity and confinement properties
Figure 3.4: Fast CCD camera image of ASDEX Upgrade ICWC discharge 24852:fRF = 36.5+30 MHz, PRF,gen = 400 kW and p < 1.0 ·10−4 mbar. The visible lightimage shows the strong poloidal inhomogeneity of the plasma.
Figure 3.5: CCD image of JET ICWC discharges 79271 and 79273, respectivelywithout (left) and with (right) vertical magnetic field of Bz = 30 mT: fRF =25 MHz, PRF,coupled = 250 kW and p = 2.0 · 10−5 mbar. The visible light imageshows the overall improvement of the poloidal homogeneity on application of thevertical magnetic field.
plying a small vertical field can be understood from particle transport alongthe upwards spiraling magnetic field lines. Interpreting the improvement in

Chapter 3 3-7
Figure 3.6: JET discharge 79271 and 79273, respectively without (left) andwith (right) vertical magnetic field of Bz = 30 mT: fRF = 25 MHz, PRF,coupled =250 kW and p = 2.0 · 10−5 mbar. The HCN density data (KG1) shows an im-provement of the radial homogeneity on application of a small vertical magneticfield.
the radial direction is less straight forward since it probably results from asynergy of improvement of the vertical homogeneity and RF power couplingproperties. The possibility that the improvement of the radial homogeneitystems from the reduction of the radial outward plasma drift by the verticalmagnetic field is analyzed below, and is thought to be negligible.
The plasma extension in the vertical direction was also evidenced onTEXTOR by Li-beam Te and ne measurements. The diagnostic was locatedin the TEXTOR bottom limiter lock. Fig. 3.7 shows the measured electrontemperature, density and electron pressure (nekBTe) as a function of theapplied poloidal magnetic field (1 mT) oscillation (10 Hz). Although onlyfive measurement points per oscillation period could be obtained, the twomaxima per period in all quantities are located where the oscillating fieldis mainly vertical [113]3.
3During later TEXTOR experimental sessions using vertical fields and where evena systematic scan of Bz is effectuated, the Li-beam was either not operational or ifoperational, the data could unfortunately not be processed due to a missing characteristicradiation line.

3-8 ICRF plasma homogeneity and confinement properties
Figure 3.7: (a) Electron density, (b) electron temperature and (c) electron pres-sure measured by Li beam diagnostics conditionally averaged over two oscillationperiods of the radial magnetic field BR and vertical field Bz. [113]
3.2.1.2 Radial inhomogeneities
On TEXTOR a systematic scan of the vertical field was effectuated in hy-drogen discharges with fRF = 29 MHz, Bφ = 2.3 T, PRF,gen = 2×50 kW andp = 5.0 · 10−4 mbar (feedback pressure). The scan was done mainly to in-vestigate the wall conditioning effect as a function of the vertical field. Theradial density profile obtained from vertical interferometry lines is shownon Fig. 3.8 (left). It shows clearly that the radial homogeneity of the dis-charge is not a simple function of the vertical field. The electron densityin the center of the vessel is relatively high at Bz = 0 mT, and decreasesfirst to obtain a second maximum at Bz = 40 mT. This behavior is at thispoint not understood. Also two peaks are observed in the profiles, one atR = 1.95 m and one at R = 1.57 m while the fundamental resonance layerfor protons lies at R = 2.1 m. At this point there is no clear explanation forthese peaks, not in terms of Bz-field, nor in terms of RF coupling properties(the partial pressure ratio of H2, HD and D2 was 37/46/17). The peaks,or drop of density in the center, is not present for a vertical field of 40 mT.From visual inspection of CCD images it was also found that the plasmahomogeneity is optimal for this Bz-value. Although, as already mentioned,this data remains mainly uninterpreted, further experiments on TEXTORare carried out with the 40 mT vertical field value. The right plot in Fig. 3.8,shows for similar TEXTOR hydrogen discharges that the radial homogene-ity is also dependent on the RF power (PRF,gen = 2×100 kW) and dischargepressure (p = (1−5) ·10−4 mbar). On increasing the RF power, the density

Chapter 3 3-9
Figure 3.8: Radial density profile of TEXTOR hydrogen ICWC discharges(fRF = 29 MHz, Bφ = 2.3 T, 113192:113198). Left: profiles as a function of the ap-plied vertical magnetic field (PRF,gen = 2×50 kW and p = 5.0 ·10−5 mbar). Right:profiles as a function of the discharge pressure (Bz = 40 mT, PRF,gen = 2×100 kW,113240:113244).
at the HFS remains practically unchanged, while the density at the LFSincreases. The observed maximum on the LFS could be explained by thefact that the RF electric field is higher close to the antenna, located at theLFS. However on decreasing the pressure, the maximum shifts to the HFS.The latter could be due the improved wave propagation at higher density.
For helium ICWC discharges, the plasma density and temperature ap-pears to be systematically higher on the LFS than on the HFS. Similaras for hydrogen discharges the higher density and temperature at the LFSis thought to be due to the RF field distribution in the vessel for whichthe electric field strength is highest close to the antennas, located at theLFS. Fig. 3.9 shows electron density profiles from reflectometry for TORESUPRA He-ICWC discharges with pHe = 1.8 · 10−4 mbar, PRF,gen = 100,200 and 400 kW, Bφ = 3.8 T and Bz = 0 T. The TORE SUPRA reflectome-ter is located in the center toroidal plane (see Fig. A.1). The distance ofR = 3.12 m corresponds to the location of the antenna protection limiter(indicated on Fig. 1.7). The fundamental resonance layer for protons lies atR = 2.9 m while the hydrogen partial pressure in these discharges is aboutpH2 = 1 · 10−5 mbar. No density peak is observed around the resonancelayer. The obtained densities are in close agreement with interferometrydata.
Fig. 3.10 shows measured ECE temperature profiles (electron cyclotronradiation temperature, see appendix B.2.3) along the radius as a functionof the discharge time, for a JET He/D2 discharge (∼ 0.75 · 10−5/0.25 ·10−5 mbar) with PRF,coupled = 60 kW. The plasma temperature clearly

3-10 ICRF plasma homogeneity and confinement properties
Figure 3.9: Reflectometry electron density profiles for TORE SUPRA He-ICWCdischarges (pHe = 1.8 · 10−4 mbar, PRF,gen = 100, 200 and 400 kW, Bφ = 3.8 Tand Bz = 0 T). The plasma density decreases clearly from the LFS to the HFS.
Figure 3.10: ECE (KK3) temperature as function of radial position and timefor JET ICWC discharge 78579 (fRF = 25 MHz, PRF,coupled = 60 kW and p =1 · 10−5 mbar).
decreases from the LFS to the HFS. The fundamental resonance layer fordeuterium ions lies in the center of the vessel (R ≈ 3 m) which might explainthe apparent increase of density on the bottom of the figure. No temperaturemeasurements are obtained for R > 3.85 m at the LFS: the horizontal ECEviewing line is located about 13 cm above the vacuum vessel mid-plane [114],where the radial location of the antenna protection limiters (A2 antennas)corresponds to ∼ 3.88 m [115]. Similar as on JET, the ASDEX UpgradeECE data showed also a clear temperature peak along the radius. However,due to uncertainties on the mapping of the ECE profiles, the radial positionof the peak could not be determined.
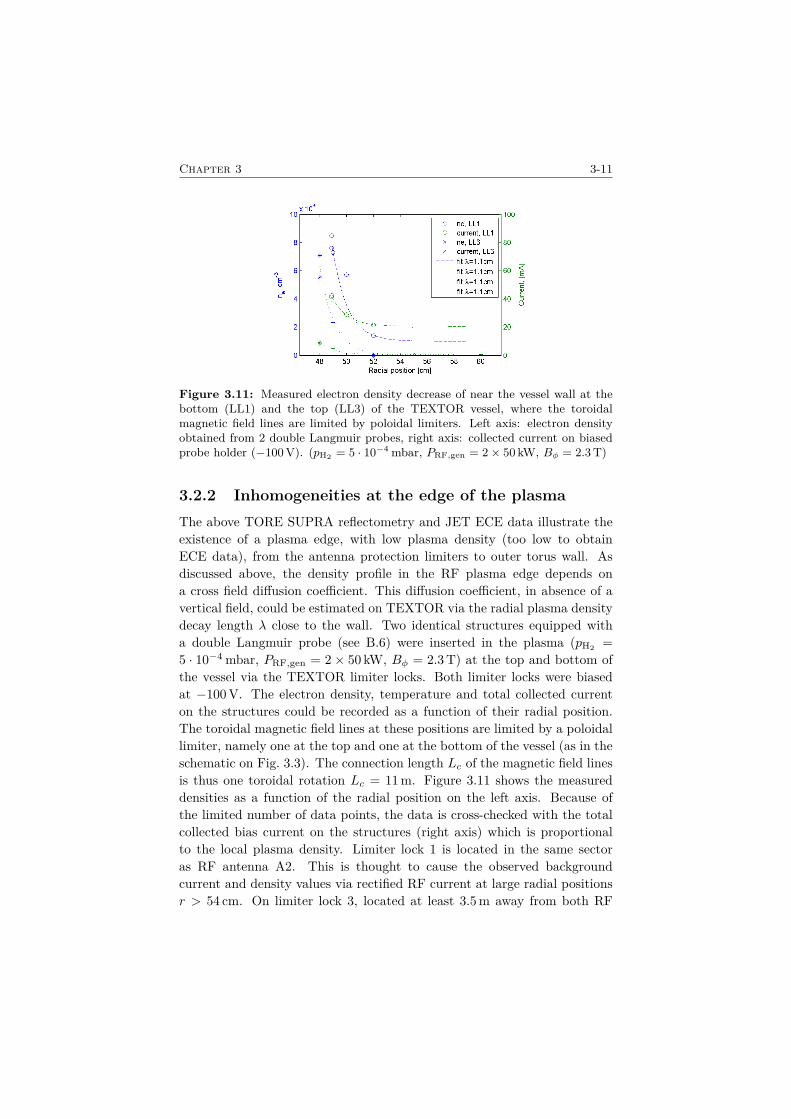
Chapter 3 3-11
Figure 3.11: Measured electron density decrease of near the vessel wall at thebottom (LL1) and the top (LL3) of the TEXTOR vessel, where the toroidalmagnetic field lines are limited by poloidal limiters. Left axis: electron densityobtained from 2 double Langmuir probes, right axis: collected current on biasedprobe holder (−100 V). (pH2 = 5 · 10−4 mbar, PRF,gen = 2× 50 kW, Bφ = 2.3 T)
3.2.2 Inhomogeneities at the edge of the plasmaThe above TORE SUPRA reflectometry and JET ECE data illustrate theexistence of a plasma edge, with low plasma density (too low to obtainECE data), from the antenna protection limiters to outer torus wall. Asdiscussed above, the density profile in the RF plasma edge depends ona cross field diffusion coefficient. This diffusion coefficient, in absence of avertical field, could be estimated on TEXTOR via the radial plasma densitydecay length λ close to the wall. Two identical structures equipped witha double Langmuir probe (see B.6) were inserted in the plasma (pH2 =5 · 10−4 mbar, PRF,gen = 2 × 50 kW, Bφ = 2.3 T) at the top and bottom ofthe vessel via the TEXTOR limiter locks. Both limiter locks were biasedat −100 V. The electron density, temperature and total collected currenton the structures could be recorded as a function of their radial position.The toroidal magnetic field lines at these positions are limited by a poloidallimiter, namely one at the top and one at the bottom of the vessel (as in theschematic on Fig. 3.3). The connection length Lc of the magnetic field linesis thus one toroidal rotation Lc = 11 m. Figure 3.11 shows the measureddensities as a function of the radial position on the left axis. Because ofthe limited number of data points, the data is cross-checked with the totalcollected bias current on the structures (right axis) which is proportionalto the local plasma density. Limiter lock 1 is located in the same sectoras RF antenna A2. This is thought to cause the observed backgroundcurrent and density values via rectified RF current at large radial positionsr > 54 cm. On limiter lock 3, located at least 3.5 m away from both RF

3-12 ICRF plasma homogeneity and confinement properties
Figure 3.12: Langmuir probe data for TORE SUPRA He-ICWC discharge45678: fRF = 48 MHz, PRF,gen = 300 kW and pHe = 1.8 · 10−4 mbar.
antenna A1 and A2, the background is not present. The four data sets canbe approximately fitted with a same exponential decay length of λ = 1.1 cm(dashed and dotted lines). From eq. (3.2) the cross field diffusion coefficientcan be measured, which results in Dmeas = 0.70± 0.1 m2/s. In section 3.3.5we will see that this value corresponds to Bohm diffusion.
On TORE SUPRA also clear indications for a plasma edge are foundat the top of the vessel. The radial plasma distribution could be measuredby a RFA (see section B.2.5), shown on Fig. 3.12. The signal, representingthe parallel ion flux along the field lines (red = ion side, blue = electronside, referring to the plasma current in ohmic discharges4), has a stablevalue for z < 0.8 m from where it starts to decrease to become zero atz > 0.84 m. The probe is located in a top port at R = 2.53 m. At thisposition, the region of long magnetic connections begins at approximatelyz ≈ 0.82 m which corresponds roughly to the location of the decay of thesignal (the uncertainty on the probe position is estimated to be 5 mm [116]).The limiting structure at this position are cooling tubes that protect theport from electron ripple losses. The red and blue signals are almost equalindicating the fact that there is no net plasma current in the RF discharges.
The observed decay of the plasma density close to the wall on TEXTOR,TORE SUPRA and JET is as mentioned due to the large parallel chargedparticle fluxes, and the intersection of the edge magnetic field lines by wallstructures. The JET wide angle infrared camera images (Fig. 3.13) showedthat these intersecting wall elements close to the plasma, such as the an-tenna limiters in the center of the picture and the inner poloidal bumperson the left side of the picture, heat up during RF discharges. From this itcan be concluded that these limiting surfaces receive a considerable fraction
4In TORE SUPRA the plasma current and B-field both point in the counter-clockwisedirection viewed from above.

Chapter 3 3-13
Figure 3.13: Wide angle IR camera (KL7) image of the 8 s He/D2 (90/10) JETICWC discharge 78579: PRF,gen = 200 − 350 kW and p = 1 · 10−5 mbar duringthe discharge. Particle transport along magnetic field lines caused heating of fieldline intersecting wall elements (brighter areas).
of the ion wall flux. To increase the wall conditioning efficiency it mightthus be interesting to adjust the poloidal field during a discharge to obtainoptimal surface coverage. For example, a positive vertical field will improvecleaning of one side of a limiter, while a negative allows to condition theother side (see Fig. 3.3). One has to keep in mind however the RF trips thatcan occur on applying an oscillatory poloidal field, illustrated in Fig. 3.2.Alternatively the vertical field can be adjusted between subsequent condi-tioning discharges.
3.3 Confinement properties of toroidal mag-netic field configurations
RF physics plays an important role on plasma homogeneity (see section2.3). To ensure a homogeneous plasma, proper wave propagation in thevessel is mandatory to sustain the plasma also at the high field side. In theprevious section we showed experimental facts on plasma homogeneities,and we indicated that not all of them can be explained purely in terms ofRF physics, such as the strong vertical inhomogeneity and the decrease ofplasma density close to the wall. It is expected that confinement propertiesof the toroidal magnetic field lie at the basis of this. In this section we

3-14 ICRF plasma homogeneity and confinement properties
will give an overview of the confinement properties, including plasma drifts,losses along the magnetic field lines and diffusion across the magnetic field.
To have an idea of the magnitude of the derived quantities, a valuewill be given for a standard set of plasma parameters. For these exampleswe consider a H2 discharge in TEXTOR (R0 = 1.75 m, a = 0.47 m) witha magnetic field of Bφ(R = R0) = 2.3 T. The plasma parameters arecalculated with the 0D model presented in chapter 5 (pH2 = 5.0 ·10−4 mbar,Pcoup = 100 kW, without including plasma impurities):
Te = 2.3 eV ne = 8.1 · 1011 cm−3 (3.4)TH+ = 1.3 eV nH+ = 8.1 · 1011 cm−3 (3.5)TH = 1.5 eV nH = 1.3 · 1012 cm−3 (3.6)TH2 = 0.9 eV nH2 = 6.2 · 1012 cm−3 (3.7)
with T the Maxwellian temperature and n the density. The reaction ratesof importance are (see reactions in table 5.1 on page 5-5, and reaction ratefigures in Appendix C.2)
kexc(H) = 1.3 · 10−9 cm3/s (3.8)kion(H) = 2.6 · 10−11 cm3/s (3.9)kexc(H2) = 2.6 · 10−9 cm3/s (3.10)kdis(H2) = 4.2 · 10−10 cm3/s (3.11)
kcx(H+ + H) = 8.9 · 10−9 cm3/s (3.12)kcx(H+ + H2) = 5.0 · 10−11 cm3/s (3.13)
from which we can deduce the collision frequency
νin = kcx(H+,H)nH + kcx(H+,H2)nH2
= 1.4 · 104 s−1 (3.14)νen = (kexc(H) + kion(H))nH + (kexc(H2) + kdis(H2))nH2
= 2.3 · 104 s−1 (3.15)
The thermal velocity of the ions is
vT =√kT
mi= 1.1 · 104 m/s, (3.16)
and the mean free path of the ions is λ = vT /νin = 0.75 m.At the end of this section we will formulate a general formula for the
charged particle confinement time as a function of the particle energies,densities and vertical magnetic field. To obtain this expression only thesteady state plasma is considered, as in [117]. However, the initial plasmaphase plays an important role as well and will be described based on [118]and additional results from [117].

Chapter 3 3-15
3.3.1 Summary of confinement propertiesThe confinement properties of the magnetic field given in eq. (3.1) canbe summarized as follows: in the vertical direction the plasma is subjectto ‘ ~B × ∇B’ drifts stemming from the field curvature and gradient. Thedrift velocities are equal in size for electrons and for ions but in oppositedirections: up for electrons and down for ions for standard clockwise Bφ-direction. Charge accumulation in the plasma edge due to the ‘ ~B × ∇B’drift induces an electric field causing an outward drift velocity [117] (‘ ~E ×~B’ drift). Both plasma drifts make that the plasma is inherently not inequilibrium. In a tokamak plasma the circular poloidal field componentis generated by the plasma current to tackle this problem. In current-freeICWC plasmas this poloidal component is absent.
The latter vertical electric field will be build up during the initial dis-charge phase by the ‘ ~B × ∇B’ drift current until a steady state value isreached. The changing vertical electric field in this initial phase will cause apolarization drift. As a result of the polarization drift the plasma moves asa whole to the top of the vessel in the initial discharge phase (for a clockwisetoroidal magnetic field). We will investigate the magnitude of all mentioneddrifts, and see whether they contribute to the plasma inhomogeneity.
On application of a poloidal magnetic field, an additional contributionto the particle wall flux will come from the transport of particles along thetitled field lines, which will be analyzed in below as well.
Furthermore, the charged particles will diffuse across the magnetic field,which will be discussed at the end of this chapter.
3.3.2 Vertical driftIt is known that ions and electrons drift in opposite directions in an inho-mogeneous magnetic field. Two mechanisms lie at the origin of this drift,namely the ‘ ~B × ∇B’ drift and the curvature drift of which the velocitiesare given respectively by eq. (3.17) and eq. (3.18):
~vD⊥,1 = mv2⊥
2Ze~B ×∇BB3 (3.17)
~vD⊥,2 =mv2‖
Ze
( ~B · ∇) ~B × ~B
B4 (3.18)
with Ze the charge of the particle. Eq. (3.18) can be simplified since weconsider Bφ Bz.
~vD⊥,2 ≈mv2‖
Ze
~B ×∇BB3 (3.19)

3-16 ICRF plasma homogeneity and confinement properties
which makes that both drifts can be referred to as ‘ ~B × ∇B’ drift. Thedirection of the drift velocity follows from
~B ×∇B = ~B × (− C
R2 )1R = ~B × (−BφR
)1R
= −BφBzR
1φ +B2φ
R1z = Bφ
R(Bφ1z −Bz 1φ) (3.20)
and is thus perpendicular to the total magnetic field and the radial direction.The total perpendicular drift velocity is given by
~v∇B = m
2Ze (v2⊥ + 2v2
‖)~B ×∇BB3 . (3.21)
In case the kinetic energy of the particles is equally distributed over thedegrees of freedom we have on the average m( 1
2v2⊥ + v2
‖) = 2kT [118]. Soeq. (3.21) simplifies to
~v∇B = 2kTZe
~B ×∇BB3 ≈ 2kT
ZeRBφ≈ 2kTZeRB
. (3.22)
From eq. (3.22) it is clear that this drift is inversely proportional to thestrength of the toroidal magnetic field Bφ. Thus for particle losses due tothe vertical drift counts ”the stronger the magnetic field, the better theconfinement”.
The total current density that can be attributed to this velocity in ahydrogen helium plasma is given by
~j∇B = 2k∑j
(njTj)~B ×∇BB3 , (3.23)
with j = e,H+,H+2 ,H
+3 ,He+,He2+, which for practical cases can be sim-
plified toj∇B = 2k
RB(neTe + nH+TH+ + nHe+THe+). (3.24)
To make the ions flow downwards and the electrons upwards, the mag-netic field should be negative in a right handed system (clockwise) (C < 0).For our reference plasma we have v∇B = 0.6 m/s, logically much smallerthan the thermal velocity, and j∇B = 0.2 A/m2. The perpendicular currentis about 3 to 4 orders of magnitude smaller than the measured parallel ionfluxes in ICWC, e.g. shown on Fig. 3.12 (for a helium plasma).
3.3.3 Radial drift and outward plasma acceleration3.3.3.1 Radial drift
In the macroscopic approach from Müller [117] the opposite drift directionsfor ions and electrons lead to a vertical electric field due to charge accumu-

Chapter 3 3-17
lation at the plasma boundaries. This electric field induces an ~E × ~B drift,directed outward to the LFS. The velocity of this drift can be described bythe general formula for a drift in a force field,
~vD =~F × ~B
ZeB2 =~E × ~B
B2 (3.25)
To estimate the velocity, the accumulated electric field E is required. Thisposes a problem because no direct measurements for TORE SUPRA andTEXTOR are available. A derivation for this field can be found in [117]and gives
Ez = me
qe
~νe/i‖ ~v∇B
sin2(θ)(3.26)
With ~νe/i‖ the parallel collision frequency for ions and electrons, and θ =
arctan(BzBφ ) the angle of the magnetic field. An experimental value for asmaller device is given in [119] and can be used as guide line.
Ez(0) ≈ 5Te(eV)a(m) (3.27)
For our reference plasma this gives Ez(0) = 24 V/m and a related drift ve-locity of vD = 10 m/s, which is about 10 times higher than the vertical drift.This is in contradiction to what is found below. In the further presentedanalysis we will derive these both formulas (3.26 and 3.27) independently,and we will show that the electric field and the related radial drift are likelynegligible.
It is clear that the vertical electric field in the vessel, which is formeddue to charge accumulation in the edge, can not increase infinitely. If theplasma is confined by conducting limiters or a conducting vacuum vessel,currents can flow in closed loops. Charge accumulation at the plasma edge,in principle negative at the top and positive at the bottom will thus belimited, and a quasi steady state situation will be formed. It is sometimesargued that the radial drift stemming from the electric field can be neglectedbecause of these short circuiting currents in the conducting chamber walls[119, 120]. Below we will have a closer look at this point. Although themagnitude of the current in the walls is difficult to estimate we will showthat the vertical electric field is very small.
As indicated by [117] it has been proposed since the 1960’s that a smallsuperimposed vertical magnetic field can allow the particles to generateadditional short circuiting currents in the plasma that limit the electricfield. In this manner the plasma might be confined for a significantly longertime than with a pure toroidal field, and the radial homogeneity might beimproved. We will discuss this point further below.

3-18 ICRF plasma homogeneity and confinement properties
Figure 3.14: Equivalent electric scheme for the formation of an accumulatedvertical electric field Ez in the vessel, due to the vertical plasma drift current(jz is the ‘ ~B × ∇B’ current source), short circuit currents in wall (via Rwall)and parallel to field lines (via Rpl). Polarization drifts can be described by anadditional capacitor ρ/B2.
3.3.3.2 Installation of steady state electric field
Before the installation of any quasi equilibrium, the electric field (Ez) willnot be constant. The changing electric field causes a vertical polarizationdrift [15],
~vp = − mj
ejB2ddt
( ~E × ~B)× ~B
B2 = mj
ejB2d ~Edt (3.28)
which is thus parallel to ~E. This drift velocity is in opposite direction forelectrons and ions, and much greater for the ions due to their mass. Thecurrent related to this is thus mostly an ion current
~jp = ρ
B2d ~Edt (3.29)
with ρ = njmj .The polarization current is opposite in direction to the ‘ ~B × ∇B’ cur-
rent and will thus intuitively slow down the installation of the steady stateelectric field. To illustrate this we look at the equivalent electric scheme ofthe plasma drift currents, the accumulated charges and the closing currentsin plasma and wall (Fig. 3.14). It consists of a current source (~j∇B) inparallel with a capacitor over which stands Ez, and two parallel resistorsrepresenting the connection of top and bottom via the field lines and thewall conductivity. In this scheme, for a constant ~j∇B , the electric field ap-proaches exponentially its steady state value. From the form of eq. (3.29)we see that the polarization current comes into this scheme as an additionalparallel capacitor which will thus slow down the establishing of the steadystate electric field5.
5Although this representation already gives an idea of what happens, the plasmamovement to top (vp) and low field side (vD,R) needs in principle to be taken intoaccount. Further analysis in this direction was published by Müller [117].

Chapter 3 3-19
3.3.3.3 Outward plasma acceleration and polarization drift
To obtain a value for the polarization drift, first the outward accelerationhas to be introduced. In the initial plasma phase in a pure toroidal mag-netic field it can be found that a force is acting on the plasma resultingin an outward acceleration [118]. This force can not be compensated bythe plasma and thus the plasma can not be in equilibrium. The value ob-tained hereafter for the initial upward polarization velocity of the plasma(∼ 0.6 m/s, upwards) might explain the experimental observation that theplasma density is generally higher at the top of the vessel.
1. Outward accelerationAn expression for the outward acceleration of the plasma based on theequation of motion of a volume element of the plasma is given in [118],
ρaR = −jzB −∂p
∂R(3.30)
with aR the outward acceleration, jz the local vertical current, B thelocal magnetic field and the kinetic pressure p = nik(Ti + ZTe). Theequation shows clearly the relation of the acceleration and the verticalcurrent. In terms of magnetic field, with the help of Maxwell equations(µ0jz = 1
R∂∂R (RBφ)) we have
ρaR = − B2
µ0R− ∂
∂R( B
2
2µ0+ p) (3.31)
with the magnetic pressure B2
2µ0. It follows that the outward accel-
eration is zero in case the magnetic field B in eq. (3.31) is exactlyequal to the vacuum magnetic field and when the plasma profile ishomogeneous. However, even a small variation of the local magneticfield, due to the diamagnetic effect, can cause huge accelerations. Vander Laan [118] showed that the outward acceleration of the plasma (incase the acceleration in the z direction is zero) equals to:
aR = B2vac −B2
µ0Rρ= 2pRρ≈ 2kmiR
(Ti + ZTe) (3.32)
with Bvac the vacuum magnetic field. The resulting expression aboveremains valid when superposing a small homogeneous vertical mag-netic field. A typical value for the outward acceleration for our ref-erence ICWC plasma parameters at R = R0 is aR = 3.9 · 108 m/s2
which is an enormous value, but one has to keep in mind that theformula (eq. 3.32) is only valid in the initial situation, where the out-ward velocity is smaller than the velocity of the gyrating particle. The

3-20 ICRF plasma homogeneity and confinement properties
required deviation of the local magnetic field to the vacuum magneticfield (diamagnetic effect) to obtain this acceleration is negligibly smallB2
vac−B2 = 1.2 · 10−6 T2. In an ICWC plasma the diamagnetic effectis as expected very small.
2. Polarization driftIn the previous section we already discussed the polarization drift. Inaddition to this we derive here a value for its magnitude.In the paper of Van der Laan [118] an expression of the total verticalcurrent is given in case of a purely toroidal field.
jz = j∇B −neZB
(mi + Zme)aR (3.33)
The first term is the normal ‘ ~B × ∇B’ drift found in eq. (3.24), thesecond term is the polarization drift current. The polarization drift ismuch smaller for the electrons than for the ions, whereas the ‘ ~B×∇B’drift velocity for both electrons and ions are equal. From eq. (3.24),(3.32) and (3.33) we see that the vertical current of the ‘ ~B × ∇B’drift is completely compensated by a polarization current of the ions,resulting in an overall movement of the plasma given by the ‘ ~B×∇B’drift velocity of the electrons (∼ 0.6 m/s).
vz = −2kTeeBR
(3.34)
Since we have chosen a ‘negative’ B this movement is directed to thetop of the vessel. Experimental observations showed that especially athigh power, the light emission of RF plasmas stems mostly from thetop of the vessel (e.g. CCD images ASDEX Upgrade, Fig. 3.4). Thismight be a consequence of this effect since the finite dimensions of thetorus will give rise to a steady state situation in the plasma profiles.
For the further analysis the outward acceleration will not be regardedand thus in case of purely toroidal field (Bz = 0) the vertical current istaken as
jz = j∇B . (3.35)
3.3.4 Self consistent perpendicular electric fieldTo get a value for the outward ‘ ~E× ~B’ drift we need to estimate the verticalelectric field. The electric field from eq. (3.26) is infinite for a pure toroidalfield, and the experimental scaling (eq. 3.27) is independent on the verticalfield and toroidal field. In the following we want thus to find a self consistent

Chapter 3 3-21
perpendicular electric field, determined by the perpendicular drift and theshort circuit current along the tilted magnetic field lines. The self consistentvertical electric field will depend on the total vertical current:
jz = SEz (3.36)
with S a conductance which might be dependent on θ. For the determina-tion of the self consistent vertical electric field we derive first an expressionfor the total vertical current.
3.3.4.1 Total vertical current
In the presence of a vertical magnetic field (Bz 6= 0) the ‘ ~B × ∇B’ driftremains perpendicular to the magnetic field and thus it is tilted with respectto 1z by an angle of θ = arctan(BzBφ ). The total vertical current will have anadditional component stemming from the short circuit current parallel to thefield lines. This component is proportional to the accumulated electric field.If we call Ez the electric field along the 1z direction we will thus have forthe perpendicular electric field E⊥ = Ezcos(θ), and for the parallel electricfield E‖ = Ezsin(θ). The relation between the two fields is E‖ = E⊥tan(θ).
The induced current along the field line by E‖ can be found via theLangevin equation for electrons (neglecting short circuit currents by ions):
medvedt = −eE − νinmeve, (3.37)
which leads to a steady state velocity of
ve =eE‖
νenme. (3.38)
The related current to this velocity is
j‖ = −eneve = −e2neE‖
νenme= −e
2neE⊥tan(θ)νenme
= −σE⊥tan(θ). (3.39)
with conductance σ = e2neνenme
[S/m]. The total current in the vertical direc-tion is then
jz = j∇Bcos(θ) + j‖sin(θ). (3.40)
with j∇B from eq. (3.24) and j‖ from eq. (3.39).
3.3.4.2 Self consistent electric field
As mentioned, the self consistent vertical electric field will depend on thetotal vertical current:
jz = SEz = j∇Bcos(θ) + j‖sin(θ). (3.41)

3-22 ICRF plasma homogeneity and confinement properties
With eq. (3.39) this becomes
SE⊥
cos(θ) = j∇Bcos(θ)− σE⊥sin(θ)tan(θ). (3.42)
S = j∇BE⊥
cos2(θ)− σsin2(θ) (3.43)
Fig. 3.14 showed that the system can be regarded as a current source in par-allel with a capacitor and two parallel resistors representing the connectionof top and bottom via the field lines and the wall conductivity. In steadystate, the vertical electric field is then simply the vertical component of the‘ ~B ×∇B’ drift multiplied with a resistivity. If we consider for the momentinfinite wall resistivity we obtain from eq. (3.39) and (3.40), with zero netvertical current in the steady state situation:
E⊥ = j∇Bσ
cos2(θ)sin2(θ)
(3.44)
orEz = j∇B
σ
cos(θ)sin2(θ)
(3.45)
Which is the same as we would find from eq. (3.43) taking S = 0. Whenwe fill in the full expression for σ we find:
E⊥ = j∇Bνenme
e2ne
cos2(θ)sin2(θ)
(3.46)
Where we find thus back eq. (3.26) from [117] but with an extra cos(θ)which is, due to the relatively small vertical magnetic field, approximatelyequal to one.
In case of a pure toroidal field (θ = 0) we see that E⊥ goes to infinity,which can be understood from the equivalent electric scheme with infinitewall resistivity. The wall resistivity is in reality of course finite. The totalconductivity to be used in previous equations is thus
σ = σwall + σplasma,‖ (3.47)
withσplasma,‖ = e2ne
νenme
sin2(θ)cos2(θ) . (3.48)
To estimate the steady state vertical electric field, the wall conductivityneeds to be estimated. Below we will use an intermediate value (σwall =103 S/m), considering the conductivity of graphite (σwall ≈ 1 S/m) andstainless steel which may be six orders of magnitude higher. Fig. 3.15 shows

Chapter 3 3-23
Figure 3.15: Vertical plasma conductivity σplasma ([S/m]) as a function of theparameter tan(θ) = Bz/Bφ.
the dependency of the plasma conductivity in the z-direction on the parame-ter tan(θ). It is clear that for practical cases of Bz the plasma conductivitywill always be below the conductivity of the wall elements (≈ 10%). Ifwe neglect the plasma conductivity, the self consistent electric field is in-dependent of the vertical magnetic field and behaves proportional to theexperimental scaling given above (eq. 3.27):
E⊥ = j∇Bσ∝ (Te + Ti)
RB(3.49)
which leads, unlike the experimental scaling [119], to a negligible low verticalelectric field (0.2 · 10−3 V/m). The radial drift from this field
~vD,R =~E⊥ × ~B
B2 = j∇BσB
1R (3.50)
will thus also be negligible compared to the vertical drift.From this analysis we can conclude that the radial inhomogeneity is not
due to drifts, but rather to inhomogeneous RF power absorption, whereasthe vertical plasma inhomogeneities are due to plasma drifts.
3.3.5 Diffusion across the magnetic fieldCharged particles diffuse across the toroidal magnetic field due to randomcollisions in the plasma (see Fig. 3.16). The diffusion coefficient is given by
D⊥ = ρc2νc
with ρc the average length of the step the particle takes on each collision,and νc its collision frequency. The step length can be considered to be the

3-24 ICRF plasma homogeneity and confinement properties
Figure 3.16: Illustration of collisional diffusion: charged particles in a magneticfield spiral around the ”guiding” field line. In a collision the guiding field lineis changed which results of diffusion of particles perpendicular to the magneticfield. [20]
gyration radius:
ρc =√mkbT
eBIn the well known Bohm scaling [15] the collision frequency is set equal tothe cyclotron frequency,
D⊥ = kbT
eBresulting in a diffusion coefficient valid for all charged plasma particles thatonly depends on the particle energy. Empirically Bohm found that a morecorrect value for the diffusion is lower:
DBohm = 116kbT
eB(3.51)
The particle confinement time related to Bohm diffusion is [85]:
τBohm = a2
2DBohm(3.52)
with a diffusion velocity of
vBohm = 2DBohm
a. (3.53)
Earlier in this chapter we found a value for the cross field diffusion coef-ficient from the decay of the plasma density in the plasma edge, measuredby Langmuir probes, which resulted in Dmeas = 0.70 ± 0.1 m2/s. Via theelectron temperature obtained in these same discharges from the two Lang-muir probes (Te ≈ 30 ± 10 eV, Fig. 3.17) and the toroidal magnetic fieldstrength (Bφ = 2.3 T) one obtains via eq. (3.51) a Bohm diffusion coeffi-cient of DBohm = 0.82±0.2 m2/s which thus experimentally confirms Bohmdiffusion in ICWC plasmas. The confinement time related to Bohm diffusionis for our reference plasma of the order of 0.2 s.

Chapter 3 3-25
Figure 3.17: Average electron temperatures measured by Langmuir probes forTEXTOR hydrogen ICWC discharges, as a function of the radial position.
3.3.6 Plasma confinement timeThe confinement time is found from (i) the outward velocity v, (ii) theapproximate average distance l the particles need to travel to reach thewalls of the toroidal chamber, and (iii) the particle mean free path in theplasma λ:
τ = l
vel/λ (3.54)
The wall flux of a charged particle population p is then found by dividingthe total amount of these charged particles by their confinement time
Qftw,p = npV
τp= npV vp
ae−a/λp (3.55)
which is thus weighted by the probability that the particles will travel adistance a without being lost by a collision (e−a/λp), with a the torus minorradius.
The charged particle confinement time of an ICWC (quasi steady state)plasma, depends on four terms: (1) losses due to vertical drifts, (2) losses dueto radial drifts, (3) losses due to diffusion of particles across the magneticfield and (4) losses of particles along the tilted magnetic field lines. In thischapter we derived velocities for the first three terms. The last term can beestimated via the vertical component of the average particle velocity alongthe field lines. The expression for the total charged particle confinementtime is then
τp = a
(vDz,p + vDR,p + vBohm,p)e−a/λp + vT,pBz/Bφe−aBφ/Bzλp(3.56)
where Bφ and Bz the toroidal and vertical field, λp the mean free path ofthe ion, vDz,p is the ‘ ~B × ∇B’ drift velocity, vDR,p is the radial outward

3-26 ICRF plasma homogeneity and confinement properties
Figure 3.18: Plasma confinement time as a function of the strength of thevertical field for two wall conductivity values: 1 S/m (∼ carbon) and 103 S/m,and our standard ICWC plasma parameters.
‘ ~E× ~B’ drift velocity, vBohm,p is the cross field diffusion velocity and vT,p thethermal velocity. The velocity vDz,p is given by eq. (3.22) where in principlea correction factor cos(θ) (≈ 1) should be taken into account, vDR,p can befound from eq. (3.50) and vBohm,p from eq. (3.53).
Fig. 3.18 shows the dependency of the plasma confinement time on thestrength of the vertical field for our standard ICWC plasma parameters.The curve is plotted for two wall conductivity values to show that the ra-dial drift has only a minor effect on plasma confinement. Only in case ofpoor wall conductivity, the vertical field improves the plasma confinementby decreasing the radial drift. From the figure we learn that the plasmaconfinement time remains unaffected over a wide range of vertical magneticfields. The vertical magnetic field can thus be safely applied to for examplevertically extend the plasma and to improve the conditioning efficiency.
3.4 ConclusionAchieving homogeneous RF conditioning discharges is important to ensurethe effective conditioning of the maximum vessel wall area. In this chapterwe presented firstly experimental facts on plasma inhomogeneities. It isconcluded that the observed radial inhomogeneities in the plasma center canbe explained in terms of RF power absorption properties: the higher electricfield strength at the LFS causes for example higher electron densities andtemperatures on the LFS. Vertical inhomogeneities of the plasma centercan however not be explained from RF power absorption properties. Itwas proposed that the confinement properties of the magnetic configurationare responsible for these vertical inhomogeneities. By applying a small

Chapter 3 3-27
vertical magnetic field that stretches the plasma in the vertical direction,the vertical homogeneity can be improved. Furthermore, the plasma densityis observed to decrease exponentially close to the vessel walls where themagnetic field lines are limited by wall structures. The exponential decreaseis characterized by Bohm diffusion. Due to the existence of this edge plasma,the ion wall flux will be largest on the first limiting surfaces.
In the second part of the chapter, the contribution of the confinementproperties of the ICWC magnetic configuration to the inhomogeneities wasanalyzed. The plasma is firstly subject to a vertical plasma drift due to thegradient and the curvature of the toroidal magnetic field. The drift veloc-ity is equal in size for ions and electrons, but works in opposite directions:upwards for electrons and downwards for ions (for clockwise toroidal mag-netic field). The resulting charge accumulation in the plasma edge inducesa vertical electric field that causes an outward radial plasma drift. Fromthe analysis it is expected that this outward drift velocity is very small,much smaller than the vertical drift velocity, confirming the conclusion thatradial plasma inhomogeneities are related to RF physics aspects. It wasalso investigated whether an applied vertical magnetic field can reduce theinduced vertical electric field by creating a short circuit current along thetilted magnetic field lines. This could reduce the radial plasma drift andthus improve the radial homogeneity. However, the latter short circuit cur-rent is estimated to be much smaller than the short circuit currents flowingin the vessel walls. Next to the above static drifts, the existence of a verticalpolarization drift during the plasma breakdown phase was introduced. Thepolarization drift velocity is proportional to the particle mass and affectsthus mostly the plasma ions, and the velocity is equal in size and directionas the vertical electron drift. As a consequence, during plasma breakdown,the plasma will move as a whole to the top of the vessel, explaining theobserved higher plasma densities at this location.
In the last part of this chapter, a formula is derived for the chargedparticle confinement time, taking into account charged particle drifts, dif-fusion and losses along the tilted magnetic field lines. It is found that forpartially ionized plasmas the confinement time is only weakly dependent onthe applied small vertical magnetic field.


4Assessment of the ICRF wall
conditioning efficiency
This chapter gives an overview of experimental results on the efficiency ofICWC, obtained on TORE SUPRA, TEXTOR, JET and ASDEX Upgradein the course of this PhD work. The aims of the presented experiments arethe assessment and optimization of the conditioning efficiency and to pro-vide information that allows an extrapolation to ITER (subject of chapter7). The conditioning aims for ICWC during the ITER operational cycles,namely when the toroidal magnetic field is present, are controlling the in-vessel impurity content, controlling the recycling of hydrogenic fluxes andreducing the tritium inventory (as part of the good household approachproposed by Roth et al. [34] to keep the in-vessel tritium level below theadministrative limit of 640 g). The chapter is divided into three large parts.The first two parts are separated according to the discharge gas/condition-ing aim: firstly H2 and H2/He discharges for isotopic exchange, and secondlypure He discharges for wall desaturation and recovery of normal tokamakoperation after disruptions. In these parts, the ability of ICWC to changethe surface state will be shown, the wall fluxes and corresponding PWImechanisms will be characterized, and the particle desorption and reten-tion rates will be calculated. Also the efficiency dependencies on RF power,discharge pressure, magnetic fields, etc. will be treated. In a final (third)part the efficiency of ICWC for impurity and codeposited layer removal isdiscussed.

4-2 Assessment of the ICRF wall conditioning efficiency
4.1 H2 and H2/He-ICWC for isotopic exchangeIn isotope exchange conditioning discharges one aims at exchanging hydro-gen isotopes stored in the close subsurface (0− 100 nm) by other hydrogenisotopes, which is required to control the plasma isotopic ratio of tokamakdischarges. Separately, isotopic exchange experiments allow to assess theability of a conditioning technique such as ICWC to change the wall surfacestate. The efficiency of an isotopic exchange technique can be expressedas the rate at which the technique can change the isotopic ratio of thewalls and the total induced extra retention it causes. These two pointswill be discussed in the first two parts of this section. In the third partthe results of ICWC are compared with isotope exchange experiments usingconventional glow discharges on the same machines with typically the samewall pre-treatment conditions. A separate section will be dedicated to themotivation for favoring short RF pulses (∼ 1 s) instead of continuous RFdischarges. In a last section the conditioning efficiency will be discussed asa function of the discharge parameters. We remind that an overview of thewall bombarding flux was given in section 2.5.
4.1.1 Illustration and analysis of the isotopic exchangeefficiency on TORE SUPRA, TEXTOR, JET andASDEX Upgrade
4.1.1.1 TORE SUPRA
A first illustration of the high isotopic exchange efficiency of ICWC wasachieved on TORE SUPRA. In the experiment the wall was preloaded withdeuterium by D2-GDC. After the glow, the wall isotopic ratio was measuredby NPA during a reference ohmic discharge (D2, Ip = 1 MA, R = 2.38 m)(blue curve on Fig. 4.1, left). At the end of the experimental day, consistingof 15 cumulated RF discharge minutes in helium-hydrogen mixtures (mul-tiple ∼ 60 s long RF pulses), followed by 3 cumulated minutes of ICWC inpure helium to desaturate the wall, the isotopic ratio had increased from 4to 40% (red curve on Fig. 4.1, left). This significant change shows clearlythe ability of ICWC to change the wall state, and has motivated furtherexperiments on TORE SUPRA itself, and on TEXTOR, JET and ASDEXUpgrade.
There are however two possible ways to change the isotopic ratio of thewall. The ideal way is to exchange every single deuterium particle by one hy-drogen particle. Another way is to store extra hydrogen into the deuteriumwall. Particle balance analysis allows to look at this more carefully. Via thepartial pressures, obtained from mass spectrometry (see appendix B), the

Chapter 4 4-3
Figure 4.1: Left: Change in the plasma isotopic ratio (approx. equal to wallisotopic ratio) measured by NPA during two reference ohmic shots (D2, Ip =1 MA, R = 2.38 m) resp. before and after 18 minutes of ICWC (15 minutes ofH2/He-ICWC and 3 minutes of He-ICWC, ∼ 60 s long RF pulses). Right: partialpressures (left axis) and coupled power (right axis) of a TORE SUPRA H2/He-ICWC discharge with feedback controlled injection of a hydrogen/helium mixture(30/70), PRF ≈ 50 kW and discharge length of 60 s (antenna Q2 2008).
gas injection signals and eq. (2.35) it is possible to calculate the amount ofremoved deuterium from the vessel (and thus from the wall) and the amountof hydrogen retained into the vessel (injected minus recovered by the ma-chine pumps). Fig. 4.1 (right) shows the partial pressures of a H2/He-ICWCdischarge with feedback controlled injection of a hydrogen/helium (30/70)gas mixture, PRF ≈ 50 kW and discharge length of 60 s (antenna Q2, 2008).The result of the particle balance for this discharge is summarized in table4.1. From this result one can conclude that the removal of deuterium from
Table 4.1: Particle balance for TORE SUPRA discharge 43463 (Fig. 4.1, right).H injected: Nsv,H, H retained: Nr,H = Nsv,H −Np,H, D recovered: Np,D
Deuterium loaded wall Nsv,H Nr,H Np,D Nr,H/Np,DH2/He-ICWC 3.2e21 2.3e21 1.4e20 16
the wall goes at the price of a 16 times higher retention of hydrogen. Thetotal particle balance for the ICWC discharges between the reference ohmicdischarges shown in Fig. 4.1 (left) evidenced a total removal of 4 · 1021 Datoms (∼ 2.5 monolayers), and a retention of 4 · 1022 H atoms. Ideally theratio between retention and recovery should be close to one, in order toavoid excessive wall loading during the conditioning discharge.
Throughout this section we will show that the problem of high retentionreoccurs on all four tokamaks, but that by simply adapting the RF dischargelength this ratio can be significantly optimized.
A comment must be made to the applied method of gas injection. The

4-4 Assessment of the ICRF wall conditioning efficiency
Figure 4.2: Ratio of retained H over recovered D and total amount of recovered Din 60 s long TORE SUPRA RF discharges (PRF ≈ 50 kW) with feedback controlledgas injection (ptot ≈ 5 · 10−4 mbar) as a function of the H2 concentration in thegas injection mixture.
gas injection consisted of a fixed H2/He mixture, controlled by a feedbackloop on the total pressure. For the discharge in Fig. 4.1 (right) this ratio was30/70. It is clear from the figure that the total hydrogenic partial pressureduring the discharge is less than 10% of the helium pressure. This can beunderstood from the significant hydrogen consumption by the walls, observ-able via the steep hydrogen pressure decrease after the discharge initiationat t = 5 s. The lost hydrogen will be partially compensated by helium in-jection (feedback, 30/70 H2/He mixture). An equilibrium helium pressureis reached about 4 s after the discharge initiation. If one wants to controlthe hydrogenic content of the discharge it is recommended to pre-programthe helium injection and put the feedback only on hydrogen as is done onTEXTOR (see further). Fig. 4.2 shows that on increasing the hydrogen con-centration in the injected gas mixture, the removal efficiency of D increases,and the ratio of injected hydrogen over removed deuterium comes closer toone. This motivated the choice for conditioning in pure gases during laterexperiments on TORE SUPRA, without any problems regarding dischargeinitiation or sustainment.
4.1.1.2 TEXTOR
Following to the TORE SUPRA results, also on TEXTOR multiple isotopeexchange experiments have been carried out. Fig. 4.3 (left) shows spec-troscopic measurements of the Hα and Dα emission lines in two ohmic dis-charges, respectively before (blue line) and after (green line) a H2/He-ICWCsession containing 26 nearly identical ICWC discharges (∼ 4 min. of cumu-lated discharge time, PRF,gen = 60−75 kW, fRF = 29 MHz, BT = 1.9−2.3 T,pulse length of 6−8 s, pHe = 2.9·10−4 mbar and ptot = 4·10−4−5·10−4 mbar).

Chapter 4 4-5
Figure 4.3: Left: Spectroscopic measurements of the Hα and Dα emission linesin two ohmic discharges, respectively before (blue line) and after (green line) aH2/He-ICWC session containing 26 nearly identical ICWC discharges (∼ 4 minof cumulated discharge time, PRF,gen = 60 − 75 kW, fRF = 29 MHz, BT = 1.9 −2.3 T, pulse length of 6 − 8 s, pHe = 2.9 · 10−4 mbar and ptot = 4 · 10−4 − 5 ·10−4 mbar). Right: Partial pressures of TEXTOR discharge 109079 (BT = 1.9 T,fRF = 29 MHz, pHe = 3.5 · 10−4 mbar and ptot = 5.0 · 10−4 mbar).
The D2-glow prior to the session makes that the hydrogen content is initiallylow (∼ 7%). At the end of the session the hydrogen content had increasedto ∼ 38%. Although the plasma isotopic ratio reflects the wall isotopic ratioit must be mentioned that the first ohmic discharge was carried out in deu-terium, while during the second one only hydrogen was injected. Whereasin the first discharge a minor amount of deuterium is injected at the start ofthe discharge, whereafter the plasma is completely fueled by the wall (due tothe preceding D2-GDC loading), the hydrogen discharge was entirely fueledby the wall. The presented isotopic ratios represent thus the wall isotopicratio. Nevertheless, for similar experiments in the future it is recommendedto measure the isotopic ratio by ohmic discharges in the wall loaded isotope(deuterium in this case due to the preceding D2-GDC), both before andafter the set of conditioning discharges.
The total particle balance for the ICWC session between the referenceohmic discharges shown in Fig. 4.3 (left) evidenced a total removal of 6.5 ·1021 D particles (∼ 9 monolayers), and retention of 1.9·1022 H particles. Theratio of retained hydrogen over recovered deuterium equals 2.9 and is thussignificantly better than the result of TORE SUPRA. This is attributedboth to the shorter discharge length, as will be explained further, and thehigher hydrogen pressure during the discharges. During these TEXTORdischarges the feedback control was set only on the hydrogen injection. Thehelium flow was continuously constant.
Analysis of the partial pressures (from mass spectrometry) allowed toestimate the deuterium wall release rate and to compare it to the deu-

4-6 Assessment of the ICRF wall conditioning efficiency
terium removal rate by the machine pumps. Fig. 4.3 (right) shows thehydrogen partial pressures of a 6 s He/H2-ICWC discharge in TEXTOR.This discharge is the fifth discharge after a wall preloading by D2-GDC,in a series of similar ICWC discharges where, as in the previous TEXTORexample, the helium injection flow was constant (pHe = 3.5 · 10−4 mbar)and the hydrogen injection was feedback controlled on the total pressure(ptot = 5.0 · 10−4 mbar). The coupled RF power was 50 kW at an RF fre-quency of 29 MHz and a toroidal magnetic field of BT = 1.92 T. The figureshows that during the RF discharge the H2 partial pressure is lower thanthat of HD and D2. Since the only source of deuterium in the vessel isthe wall, it is concluded that during this discharge the wall is acting asthe major particle source. The magnitude of this wall source follows fromthe balance equation for neutral molecules in the vessel in a 0D approach,which is valid in case the mean free path of the molecules is larger than thedimensions of the vessel (adapted from eq. 2.35):
dpH2
dt = Qsv,H2
V+ Qsw,H2
V− pH2S
V− (kd + ki)pH2ne (4.1)
Here pH2 is the partial pressure of H2 (mbar), Qsv,H2 and Qsw,H2 are theneutral gas sources, respectively the external injection and the wall release(mbar l/s), V is the volume of the vessel (l), S is the machine pumpingspeed (l/s, approx. equal for H2, HD and D2), ki and kd are the ionizationrate and dissociation rate (cm3/s, approx. equal for H2, HD and D2) andne is the electron density (cm3). The recombination rate, being very low,is omitted in eq. (4.1) which allows writing it in the same form for HDand D2. Also the direct loss at the wall of neutral H2 molecules, having atemperature in the range of the gas injection balloon (∼ 300 K) and wall(∼ 450 K) temperature, is neglected in eq. (4.1) as they are assumed to bemainly reflected on the wall surface. Knowing Qsv,H2 (= 4.3·1019 H2/s) fromthe gas injection valves (Qsv,HD = Qsv,D2 = 0), the wall sources Qsw,HD andQsw,D2 can be deduced from eq. (4.1) in a steady state approximation:
Qsw,D2 = (Qsv,H2 +Qsw,H2)pD2
pH2
, Qsw,HD = (Qsv,H2 +Qsw,H2)pHD
pH2
(4.2)
After the D2-GD prior to the ICWC session the isotopic ratio of the wall,D/(H + D), is close to one. From this it is expected that at the start of theICWC session Qsw,H2 is very small compared to Qsw,HD and Qsw,D2 , whichallows to derive a meaningful lower value estimate for the release rate ofHD and D2 in the form of:
Qsw,D2 ≥ Qsv,H2
pD2
pH2
, Qsw,HD ≥ Qsv,H2
pHD
pH2
(4.3)

Chapter 4 4-7
Applied to the considered discharge at t = 3 s this leads to Qsw,HD ≥ 3.3 ·1020 HD/s and Qsw,D2 ≥ 7.2 · 1020 D2/s, equal to Qsw,D ≥ 1.8 · 1021 D/s.The removal rate by the external pumps at this same time however givesQp,D = (2pD2 + pHD)S = 5.2 · 1018 D/s = 1.5 · 1017 D/m2s. The flux ofparticles released by the wall is thus at least 350 times higher than the fluxthat is actually removed from the vessel. The numbers are summarized intable 4.2. In section 4.1.3 we will compare the found numbers with values forstandard GDC and explain eventual differences in terms of the reionizationprobability in ICRF discharges and glow discharges.
Table 4.2: Rates for hydrogen injection (Qsv,H), deuterium wall release (Qsw,D)and deuterium removal by machine pumps (Qp,D).
Qsv,H Qsw,D Qp,D8.6 · 1019 H/s ≥ 1.8 · 1021 D/s 5.2 · 1018 D/s
The total particle balance for the TEXTOR discharge, including dis-charge phase and post discharge phase, giving the total amount of hydro-gen lost to the walls, Nr,H = Nsv,H − Np,H, and the total amount of deu-terium pumped out of the system, Np,D, results in Np,D = 2.3 · 1020 andNr,H = 4.5 · 1020, and thus Nr,H/Np,D ≈ 2 meaning that for each removedD-atom almost two H-atoms are retained into the wall. From the total par-ticle balances of both the TEXTOR and TORE SUPRA ICWC dischargeswe can conclude that the total recycling coefficient R of the particle flux tothe wall Qftw, defined as Qsw = RQftw, must be R < 1 during ICWC. Thisresult will be used in further analysis.
The JET isotopic exchange experiments presented in the next sectionconsist of D2-ICWC discharges performed on a H-loaded wall, instead ofthe above presented H2-discharges on a D-loaded wall. Fig. 4.4 shows par-ticle balances for respectively five subsequent He/H2-ICWC discharges pre-ceded by D2-GD wall preloading and four subsequent He/D2-ICWC dis-charges preceded by H2-GD wall preloading (BT = 1.9 T, fRF = 29 MHz,pHe = 3.5 · 10−4 mbar and ptot = 5.0 · 10−4 mbar). The figure illustrates thesymmetric removal and retention rates of H2-ICWC and D2-ICWC, whichcan be understood from the isotopic exchange schematic given in Fig. 1.13.
4.1.1.3 JET
The isotopic exchange experiments on JET are especially motivated by thepossibility to simulate D2-ICWC in ITER full field conditions. By operatingthe JET antennas at 25 MHz in presence of BT = 3.3 T, the resonance layerfor D+ ions is located on axis at r′/a = 0, i.e. above the divertor (r′/a is thenormalized radius: −1 ≥ r′/a ≥ 1, r′ is the radial distance to the plasma

4-8 Assessment of the ICRF wall conditioning efficiency
Figure 4.4: Particle balances for respectively 5 subsequent He/H2-ICWC dis-charges preceded by a D2-GDC wall preloading and 4 subsequent He/D2-ICWCdischarges preceded by a H2-GDC wall preloading illustrating the close to symmet-ric removal and retention rates (BT = 1.9 T, fRF = 29 MHz, pHe = 3.5 ·10−4 mbarand ptot = 5.0 · 10−4 mbar).
center: r′ = R − R0), as will be the case on ITER in full field conditions(BT = 5.3 T and using fRF = 40 MHz)1. As shown in chapter 3, the JETRF plasmas were reliably produced. Although the JET vessel dimensionsare significantly larger than those of TEXTOR, TORE SUPRA and ASDEXUpgrade, the plasma stretches over the whole vessel radius, clearly reachingthe central column and seemingly also the divertor area (Fig. 3.5).
On JET, the wall was preloaded by H2-GDC, after which eight nearlyidentical (previously optimized) D2-ICWC discharges were effectuated. Fig.4.5 (left) shows the change in isotopic ratio from discharge to discharge, mea-sured in two manners: first by an optical Penning gauge located in a ductconnected to the divertor, giving thus the isotopic ratio of the neutral gas inthe divertor, and secondly the plasma isotopic ratio obtained from spectro-scopical measurements from a vertical line of sight in the vessel midplane.Both measurements show an increase of the isotopic ratio, D/(D + H), by30 to 50% from the first to the last discharge, which reflects the changingwall state. The cumulated discharge time of the session was 8× 9 s = 72 s,with pre-programmed gas injection resulting in p ≈ 2 ·10−5 mbar during thedischarge and BV = 30 mT. Due to encountered difficulties in coupling theRF power to the plasma in the first discharges, the coupled power variedbetween 50 and 250 kW.
The total particle balance for these eight discharges, including discharge1In ITER, the use of ICWC during the inter-pulse period of nominal D:T plasma shots
implies that the toroidal field is fixed at 5.3 T. The possible RF frequencies on ITERrange from 40 to 55 MHz which means that the ICR layer for D+ ions will range from onaxis at r′/a = 0, above the divertor, to r′/a = −0.6.

Chapter 4 4-9
Figure 4.5: D2-ICWC discharges on JET (H loaded wall). Left: Evolu-tion of plasma (midplane spectroscopy) and neutral gas (Penning gauge spec-troscopy) isotopic ratio during 8 nearly identical subsequent D2-ICWC discharges(PRF,coup ≈ 50−250 kW, p ≈ 2 ·10−5 mbar). Right: Partial pressures and coupledpower of discharge 1/8.
and post discharge phase, is summarized in table 4.3. Within these lim-ited number of RF pulses it was possible to remove 1.8 · 1022 hydrogenparticles from the wall (= 1.2 · 1020 H/m2 ≈ 6 monolayers), which cor-responds to approximately 10% of the short term retention accessible byplasma operation [121]. This result is considered to be a great step forwardin demonstrating the applicability of ICWC on ITER for fuel removal. (Itdoes however not illustrate the capability of ICWC to remove tritium-richcodeposited layers. In chapter 6 this point will be further studied.)
Table 4.3: Particle balance for JET discharges 79321-79328: D retained: Nr,D,H recovered: Np,H
Hydrogen loaded wall, D2-ICWC Nr,D Np,H Nr,D/Np,HMass spectrometry & penning gauge 5.2e22 1.8e22 2.9
Gas chromatography 4.8e22 1.6e22 3
Fig. 4.5 (right) shows the partial pressures of the first ICWC discharge,obtained from mass spectrometry and Penning gauge spectroscopy. Thesame effect as on TEXTOR can be observed: although we inject D2 duringthe discharge, both the H2 and HD partial pressures are higher than theD2 partial pressure (pH2 ≈ 9 · 10−6 mbar, pHD ≈ 9 · 10−6 mbar and pD2 ≈1 ·10−6 mbar). From these partial pressures, again an estimation of the wallrelease rate can be made and compared to the removal rate by the pumps,summarized in table 4.4: also in the case of JET RF discharges, the wallremoval rate (Qsw,H = 1.8 ·1020 H/m2s) is at least 370 times larger than theremoval rate by the pumps2.
2This value is slightly overestimated since H2 is not as efficiently pumped as D2, as

4-10 Assessment of the ICRF wall conditioning efficiency
Table 4.4: Rates for deuterium injection (Qsv,D), hydrogen wall release (Qsw,H)and hydrogen removal by the machine pumps (Qp,H), for JET discharge 79321.
Qsv,D Qsw,H Qp,H2.0 · 1021 D/s ≥ 2.7 · 1022 H/s 7.3 · 1019 H/s
4.1.1.4 ASDEX Upgrade
From the results of the carbon machines TORE SUPRA, TEXTOR andJET, it can be concluded that one can remove significant amounts of hydro-gen isotopes from the wall with ICWC, at the price of a 2 to 3 times higherretention of the discharge gas. Later we will show that the ratio can be op-timized. During the active phase of ITER, there will be no carbon plasmafacing components. So it is important to assess the efficiency also on deviceswith ITER relevant wall materials, such as on the tungsten device ASDEXUpgrade. ICWC experiments on ASDEX Upgrade showed that within 14H2-ICWC discharges, 7.3 ·1021 D particles could be removed, correspondingapproximately to 12 monolayers. Most of the discharges contained two RFpulses with variable pulse lengths (50 ms to 10 s), PRF,gen = 100− 600 kW,fRF = 30 MHz in monopole phasing and dipole phasing, BT = 1.9 − 2.3 Tand continuous gas injection to obtain pH2 ≈ 2 · 10−4 mbar in absence ofplasma. Just as on the carbon machines, also on ASDEX Upgrade the ad-ditional retention of hydrogen into the walls was significant: 3.5 · 1022 H.It was shown that the retention on a tungsten machine can also be limitedby adapting the RF pulse length, without severely limiting the amount ofrecovered particles (see below, in section 4.1.4).
4.1.2 Study of discharge gas retentionIn this section we will attempt to identify the mechanisms that cause theobserved discharge gas retention observed on the four tokamaks. The fol-lowing retention mechanisms are proposed:
• retention in near surface layers
• retention in deeper layers
• retention by codeposition
• retention in remote areasexplained in section 2.4.2. Eq. 4.3 should thus more correctly be:
Qsw,H2 ≥ Qsv,D2pH2pD2
SH2 +(kd+ki)neVSD2 +(kd+ki)neV
which will only give a minor correction due to the high ionization probability of ICWCplasmas (see section 4.1.3.3).

Chapter 4 4-11
Figure 4.6: Partial pressures (left axis) and coupled power (right axis) of aTORE SUPRA H2/He-ICWC discharge with feedback controlled injection of ahydrogen/helium mixture (60/40), PRF,forw−refl ≈ 50 kW and discharge length of60 s (antenna Q2 2008).
A distinction is made between storage in near surface layers and storage intodeeper layers to take into account the interaction depth of the impingingparticle flux, characterized by the particle energy and wall material. A wallloading with D2-GDC (TD+ = 250 eV) is thought to saturate the first 5 to10 nm of carbon wall components. Unless by creating additional trappingsites, no extra retention is possible in this saturated layer; the retention inthe near surface layer is compensated by an equal release. The unsaturateddeeper layers (> 5 − 10 nm) can store extra hydrogen. To reach theselayers the particle energies need to be higher than that of glow discharges[36, 122]. The third point, retention by codeposition, is an important fuelretention mechanism in tokamak discharges, and can in principle also occurin conditioning discharges. By retention in remote areas one means theretention of hydrogen in areas, e.g. near surface layers, that are not reachedby GDC, and are thus not saturated during a GD wall preloading.
Although it was not possible to evidence the main retention mechanism,the following experimental observations clear up some important questions.
4.1.2.1 No long-term saturation of retention
Fig. 4.6 shows the partial pressure of a TORE SUPRA H2/He-ICWC dis-charge with similar setup as the discharge given in Fig. 4.1 (right): 60 slong ICRF discharge, BT = 3.8 T, fRF = 48 MHz, PRF,coup ≈ 30 kW, feed-back H2/He (60/40) injection at ptot = 4.0 · 10−4 mbar. At t = 65 s, thecumulated RF discharge time of the H2/He-ICWC session equaled 15 min.The total particle balance of this discharge, summarized in table 4.5, illus-trates that even after 15 minutes still more isotopes can be retained thanrecovered: in total 5.5 times more hydrogen is retained than deuterium re-

4-12 Assessment of the ICRF wall conditioning efficiency
covered. Also in the TEXTOR session of 26 nearly identical H2/He-ICWC
Table 4.5: Particle balance for TORE SUPRA discharge 43475. H injected:Nsv,H, H retained: Nr,H = Nsv,H −Np,H, D recovered: Np,D
Deuterium loaded wall Nsv,H Nr,H Np,D Nr,H/Np,DH2/He-ICWC 5.7e21 1.8e21 3.2e20 5.5
discharges mentioned above, no sign of long term wall saturation was ob-served. At the start of the session, right after the glow discharge almost allinjected hydrogen was lost to the walls. The retention decreased in the first∼ 10 discharges, and remained then constant in the subsequent discharges.The amount of recovered deuterium continued to decrease from shot to shot.The retention stabilized, but remained higher than the wall recovery: ∼ 2.5(15th discharge) to 3.5 (26th discharge).
For this reason it is expected that mechanisms such as retention in deeperlayers, retention by codeposition, and retention in remote areas, might playan important role in ICWC discharges3.
4.1.2.2 Retention by codeposition
Eroded wall materials (especially carbon in present devices) can be rede-posited elsewhere on the wall surface, taking large amounts of hydrogenwith it. In section 4.3, the carbon removal during ICWC will be discussed.As will be shown, it was not possible to determine whether the removedcarbon stems from codeposited layers, and whether a part of the erodedcarbon is redeposited on the wall. However, an indication that indeed cer-tain amounts of carbon are eroded and redeposited during ICWC was givenin Fig. 2.4. The TORE SUPRA antenna straps of the antenna used forICWC conditioning were covered by a thin deposited layer. Although notconfirmed by surface analysis, it is expected that the layer consist of de-posited carbon, and from the dark layer color it is expected that the layermust be at least 100 nm thick [123]. To have an idea of the involved ordersof magnitude we can assume a 100 nm thick layer, a 600 cm2 strap surfaceand an amorphous carbon mass density of 2 g/cm3, which leads to 12µg ofcarbon, or either 6 ·1020 C atoms. The generally accepted hydrogen concen-tration in amorphous carbon is 0.4 H/C resulting in a possible retention ofabout 2.5 · 1020 H atoms per strap, which is one order of magnitude belowthe total hydrogen retention given in table 4.5. This result makes codepo-sition a candidate for the retention mechanism on carbon devices TORESUPRA, TEXTOR and JET.
3Future experimentation on wall saturation during H2-ICWC, e.g. on TORE SUPRA,should envision cumulated RF discharge times larger than 15 minutes.

Chapter 4 4-13
Figure 4.7: Left: CX spectra of deuterium (blue) and hydrogen (green) in aJET D2-ICWC discharge, PRF,coup ≈ 240 kW, p ≈ 2 · 10−5 mbar. Right: Particlebalance for each of the JET D2-ICWC discharges shown in Fig. 4.5 as a functionof the coupled power, including the time integrated total fast CX neutral flux.
However, the high hydrogen retention was also observed on full tung-sten device ASDEX Upgrade. On ASDEX Upgrade the retention can notbe dominated by codeposition with carbon. Mechanisms other than code-position have to be considered on ASDEX Upgrade, and thus likely also onthe carbon devices.
4.1.2.3 Retention due to energetic CX particles
It is proposed that the extra retention might be due the high energy neu-tral particle flux stemming from the resonant absorption of RF power byions at the ion cyclotron resonance layers, followed by the neutralizationof these ions in charge exchange reactions (see reactions 17-24 in table 5.1on page 5-5). Fig. 4.7 (left) shows a typical time averaged fast particlespectrum measured along a radial line of sight by NPA (located in sector 3,see Fig. A.9), for a JET D2-ICWC discharge. The spectra are fitted by aMaxwellian distribution resulting in Maxwellian energies of TD = 16.7 keVfor deuterium and TH = 7.4 keV for hydrogen. These energies are sufficientto reach deeper surface layers, and thus cause extra retention. The fastparticle flux measured during the isotope exchange experiment on JET pre-sented in previous section, and from which the discharge in Fig. 4.7 (left)is the seventh discharge, ranged from 1015 to 1017 /m2s. These values arein agreement with the TORE SUPRA result (1017 /m2s) published in [73],and mentioned in section 2.2.1. Fig. 4.7 (right) compares the total fast par-ticle flux with the total retention and the total amount of recovered walldesorbed hydrogen for each of these discharges. The values are given as afunction of the coupled power. The total fast particle flux is obtained byassuming that the wall flux is isotropic, integrating the spectra over energy

4-14 Assessment of the ICRF wall conditioning efficiency
(E = [1 : 50] keV) and time (see section B.2.9). The deuterium fast particleflux increases with the coupled power, but even at maximum power, thetotal flux is 60 times lower than the measured deuterium retention. Thehigh observed retention is thus not solely due to the presence of the fastparticle flux. Additionally it is expected that the fast particle flux also hasa limited influence on the removal efficiency since the total amount of recov-ered hydrogen atoms is an order of magnitude higher than the fast particleflux.
The correctness of the above analysis depends on the validity of theassumption that the fast particle flux is isotrope. The NPA measurementlocation is a quarter of a toroidal length away from the closest RF antenna(module C). Presently no information is available on the toroidal homogene-ity of the fast ion population.
On TEXTOR the isotopic exchange efficiency was compared at high andlow toroidal magnetic field strength (BT = 2.3 T and BT = 0.23 T). Thepresence of the fast particle population depends on the efficiency of theresonant RF power absorption (fRF = 29 MHz). At BT = 2.3 T, the funda-mental H+-ion resonance is present in the vessel, and at BT = 0.23 T, onlyhigher harmonics are present (see Fig. 2.14). Since resonant RF absorptionis most efficient in presence of the fundamental resonance, and inefficientat high harmonics, only the high BT discharges will feature a fast parti-cle population. The presence of such a ‘warm’ population is detectable inDα/Hα spectra, respectively located around 6561.0 A/6562.8 A, as shown onFig. 4.8: ions undergoing charge exchange reactions will de-excite directlyafter being neutralized. The Doppler effect will make that the Hα spectrumof the fast population will appear as a broader Maxwellian distribution su-perimposed on the Hα spectrum of the thermal (lower energy) particles.Fig. 4.84 shows Dα/Hα spectra of two TEXTOR discharges, respectively athigh BT (red line) and low BT (black line), from a vertical channel of theCX-spectroscopy diagnostic, operated in a passive mode (without neutralbeam injection). The line of sight crosses the fundamental resonance layerat high BT , and the tenth harmonic at low BT . Except for broader Dα (left)and Hα (right) peaks at high BT due to the Zeeman effect, a signal increaseis visible at the right side of the Hα peak. This increase is thought to be dueto the fast population, although it is not understood why the Maxwelliandistribution (∼ 500 eV, determined by fitting a Maxwellian spectrum to thewarm spectrum component) is shifted to the higher wave lengths. The shiftindicates a downward velocity of the fast ions which is presently not un-derstood (the related velocity is too high to be attributed to the ‘ ~B ×∇B’drift). The particle balance for these both discharges, for which the cou-
4Thanks to Simon Freutel, IPP Juelich

Chapter 4 4-15
Figure 4.8: Dα and Hα spectra of 2 TEXTOR H2-ICWC discharges, respectivelyat high BT (red line) and low BT (black line), showing the presence of the resonantion population (at high BT ) by the signal increase on the rhs.
pled power is similar, is summarized in table 4.6. Both the discharge gas
Table 4.6: Particle balance for TEXTOR discharges 113213 and 113224. Hretained: Nr,H = Nsv,H −Np,H, D recovered: Np,D
Deuterium loaded wall Nr,H Np,D Nr,H/Np,DH2-ICWC BT = 2.3 T 6.4e20 3.5e20 1.8
H2-ICWC BT = 0.23 T 6.9e20 4.0e20 1.7
retention and the amount of recovered wall desorbed deuterium atoms aresimilar for the two toroidal field strengths. This confirms the JET result,and concludes that the fast ion population likely has only a minor influenceon the retention and removal rates.
4.1.2.4 Recovery of retained particles by He-GDC
To know whether the retained hydrogen can be recovered from the wall, aHe-GD was carried out on ASDEX Upgrade right after the ICWC sessionwhich was presented in section 4.1.1.4. During this H2-ICWC session 7.3 ·1021 D particles could be removed from the wall at the price of a retention of3.5 · 1022 H atoms. The extra retention due to the ICWC discharges is thus2.8 · 1022 atoms. Fig. 4.9 (left) shows the partial pressures of the heliumglow discharge, consisting of five pulses of about 10 s with 50 s betweeneach pulse. Fig. 4.9 (right) gives the amount of removed H and D atoms.The number decreases linearly from pulse to pulse and can be extrapolatedto become zero after the seventh pulse. The total amount of recoveredparticles, including the extrapolation, equals 4.0 ·1021 H atoms and another1.5 · 1021 D atoms. This means that ∼ 11% of the total retained H could

4-16 Assessment of the ICRF wall conditioning efficiency
Figure 4.9: Left: Partial pressures of a He-GD discharge consisting of 5 pulsesof about 10 s with 50 s between each pulse on ASDEX Upgrade. The GDC iseffectuated after a H2-ICWC session. Right: Particle balance for each pulse cycleincluding the linear extrapolation to higher pulse numbers.
be recovered by He-GDC. The retained hydrogen is thus partially storedin the typical near surface layers accessible by the GDC. Unfortunately,no further He-ICWC could be carried out to check whether ICWC couldremove the remaining hydrogen. At the start of the next experimental day,an additional 8.7 · 1020 H particles could be removed from the wall by D2-GDC (three pulses of 10 s).
Even though the H-quantity removed by GDC is of the same order ofmagnitude than that retained by ICWC, still a large fraction of the retainedhydrogen remains in the wall. This retention is, as concluded before, notdue to codeposition (tungsten wall) nor solely due to the fast particle fluxes(∼ 1015 /m2s, 2009 ASDEX Upgrade experiments). The most plausibleexplanation is that ICWC discharges reach areas that are not accessible byglow discharges. Also the existence of a substantial non resonant ion wallflux component with energies above the typical GDC flux can at this pointnot be excluded.
4.1.3 Comparison with GDCIn this section the presented results of ICWC are compared with isotopeexchange experiments using conventional glow discharges with typically thesame wall pre-treatment conditions, both on TORE SUPRA and on TEX-TOR (Fig. 4.10, resp. left and right figure). The walls were preloaded bya 30 min. D2-GD on TEXTOR, respectively H2-GD on TORE SUPRA,hereafter on both machines the gas injection was changed, proceeding withH2-GDC on TEXTOR and D2-GDC on TORE SUPRA. On TEXTORthe continuous constant gas injection resulted in a baratron pressure ofptot = 8.5 · 10−3 mbar. On TORE SUPRA the gas injection was feedback

Chapter 4 4-17
Figure 4.10: Isotopic exchange with conventional glow discharges. Left:gas injection changeover from H2-GDC to D2-GDC on TORE SUPRA. Right:changeover from D2-GDC to H2-GDC on TEXTOR.
controlled on the total pressure ptot = 3.5 · 10−3 mbar. The physics of GDCis well documented [52,58] (see section 1.5.2.1). The flux of particles to thewall consists mainly of ions Qftw ≈ 1 · 1020 /s = 2.9 · 1018 /m2s (TEXTOR)with ion energies of typically Ti ≈ 250 eV, obtained in the cathode fall infront of the walls. Also an additional conditioning contribution of neutralsis not excluded [58]. From the hydrogenic partial pressures after the gasinjection changeover it is clear that the wall isotopes are mainly released inthe form of HD molecules (green lines). Right after the change over, theHD pressure is higher than the discharge gas pressure, whereas the totalpressure remains approximately constant. The release of HD decreases intime, while the partial pressure of the discharge gas increases, showing thegradual change of the isotopic ratio of the wall. After 15 min. there is stillHD production (as in case of ICWC, see TORE SUPRA: Fig. 4.6). Thepressure peak right after the change over on the TEXTOR figure might bedue to the slow sampling rate of the mass spectrometer.
4.1.3.1 Comparison of absolute removal rates
The absolute removal rate of HD molecules 1 min. after the changeover onTEXTOR equals Qp,HD,GDC = 3.4 · 1019 HD/s = 9.7 · 1017 HD/m2s, whichis about six times higher than the removal rate of D during ICWC on TEX-TOR reported above, also taken at approx. 1 min. of accumulated RF timeafter the glow discharge (see discharge in Fig. 4.3). A similar comparisonbetween GDC and ICWC is done on TORE SUPRA, respectively 15 min.after the change over from H2-GDC to D2-GDC, and 15 min. of accumulatedRF time (t = 65 s in discharge shown in Fig. 4.6). The following removalrates were recorded: Qp,HD,GDC = 2.7 · 1019 HD/s = 3.8 · 1017 HD/m2s andQp,HD,ICWC = 5.3 · 1018 HD/s = 7.7 · 1016 HD/m2s. The removal rate of D

4-18 Assessment of the ICRF wall conditioning efficiency
Figure 4.11: D injection rate, the D and H removal rates, the D retention rateand total extra retention rate as a function of time for a standard D2-GDC onTORE SUPRA
for GDC is here about five times higher than for ICWC. The values of thiscomparison are summarized in table 4.7.
Table 4.7: Comparison of removal rates in ICWC and GDC during isotopicexchange experiments.
Time ICWC GDC∼ 1 min. 1.5 · 1017 m2s 9.7 · 1017 m2s TEXTOR15 min. 7.7 · 1016 m2s 3.8 · 1017 m2s TORE SUPRA
It might be expected that the higher removal rates for GDC comparedto ICWC are due to the approximately one order of magnitude higher neu-tral pressure in the analyzed GDC discharges than in the ICWC discharges,both in TEXTOR and TORE SUPRA. However, the different physical prop-erties of ICWC and GDC do not allow drawing a general dependency forthe pumping rates of wall desorbed species in conditioning discharges as afunction of discharge gas pressure. The last term in eq. (4.1) indicates thatthe source of particles in the plasma is not only a function of the pressure,but also of the electron density and the reaction rates. We will see furtherthat the electron density is an important factor, and in section 4.1.5 we willdiscuss the effect of the neutral pressure on the isotopic exchange efficiencyin H2-ICWC discharges.
4.1.3.2 Particle recycling during GDC
Fig. 4.11 shows the deuterium injection rate, the deuterium and hydrogenremoval rates by the pumps, the deuterium retention rate and total extraretention rate (deuterium injection minus deuterium and hydrogen removalrates) as a function of time, for the D2-GD on TORE SUPRA. After 1 hour

Chapter 4 4-19
of D2-GDC, the deuterium injection rate becomes approximately equal tothe deuterium removal rate. This indicates that from this time instance onthe deuterium consumption by the walls is limited and that the wall sur-faces become saturated with deuterium. Before this equilibrium situation,it seems that the retention rate of deuterium is slightly higher than theremoval rate of hydrogen and thus that the glow discharge also causes someextra retention. A similar result is obtained on TEXTOR, where the gasinjection was continuously constant. The neutral pressure in absence of theglow plasma approximately equaled the neutral pressure during the D2-GDright before the change over. The observations from TORE SUPRA andTEXTOR indicate that firstly the ionization degree in glow discharges isvery low, and also that the consumption of particles by the walls is limited.
Based on eq. (4.1) we can say that during GDC (a) Qsv ≈ pS, andconsequently that (b) Qsw/V ≈ (kd + ki)pne, on the condition that Qswand (kd + ki)pneV are not negligible compared to Qsv and pS. The latteris indeed the case: right after the change over the partial pressure of HD ishigher than the pressure of the injected gas; pH2 in case of TEXTOR and pD2
in case of TORE SUPRA. These HD molecules can only stem from plasmawall interaction, indicating that the ionization/dissociation rates, fluxes tothe wall (Qftw) and release rates from the wall (Qsw) are not negligiblecompared to the gas injection rate (Qsv). From point (a) it follows thatthe net loss of hydrogen isotopes to the wall during GDC is not significant.Similarly from point (b) it follows that the total recycling coefficient forGDC, RGDC, must be close to one.
4.1.3.3 Retention as a function of the reionization probability
For isotopic exchange with glow discharges it was concluded that the re-cycling coefficient of the wall flux is close to one and that extra storage ofparticles into a saturated wall (by GDC) is not significant. On the otherhand, during isotope exchange experiments with ICWC in case of saturatedwalls, still more particles can be retained into the wall.
An explanation of the found values (Qr,H,GDC ≈ Qp,D,GDC andNr,H,ICWC> Np,D,ICWC) can be sought in terms of the reionization probability f .Eq. (4.1) states that a molecule in the vessel will be either ionized or dis-sociated, or pumped by the machine pumps. The ionization probability,or equally the reionization probability of wall desorbed molecules, is heredefined as the probability that a molecule in the vessel gets ionized or disso-ciated. The reionization probability for the ICWC discharge on TEXTORdiscussed in the previous section (Fig. 4.3) can be estimated at first bycomparing the wall release rate of D, Qsw,D, with the removal rate of D,

4-20 Assessment of the ICRF wall conditioning efficiency
Qp,D:
fICWC = Qsw,D −Qp,D
Qsw,D(4.4)
Taking the estimated values for this shot (table 4.2) this results in fICWC =99.7%. Secondly, the reionization probability can also be estimated fromthe plasma parameters [56]:
fICWC = τ−1i
τ−1ex + τ−1
i(4.5)
Here τex is the characteristic time constant for the pumping speed (p =p0e−t/τex) and τi = [ne(kd + ki)]−1 [56] is the characteristic effective time
constant for dissociation (kd) and ionization (ki). With plasma parametersne = 1 · 1017 m3, measured by interferometry, Te = 3 eV, estimated fromthe 0D kinetic model for hydrogen plasmas (see chapter 5), and effectivereaction rates kd = 1.09 · 10−9 cm3/s and ki = 4.9 · 10−11 cm3/s, givenin Fig. C.3 and C.4, this results in fICWC = 99.8%, in good agreementwith the previously calculated value. In a similar way as for ICWC, areionization probability for GD plasmas can be estimated from typical GDplasma parameters (eq. 4.5): ne = 1014 m−3 and Te = 10 eV [58]. Thesignificantly lower density in GD plasmas directly leads to a much lowerreionization probability: fGDC = 86%. This value is an upper limit sincethe electron temperature, measured by Langmuir probes, is expected to beoverestimated. The reionization probability can be verified by using thepartial pressures in the same way as was done for ICWC. We first analyzeeq. (4.3) to find the hydrogen wall release rate shortly after the gas injectionchange over. For this equation (in the case of D2-conditioning) we needthe deuterium injection rate. Using pH2(t < 0) = 8.5 · 10−3 mbar we findQsv,H(t < 0) = Qsv,D(t > 0) = 8.8 · 1020 /s. We analyze the equation at thetime instance where the HD pressure is maximum: pHD = 4.4 · 10−3 mbar.The D2-pressure and H2-pressure at this time are pD2 = 2.2 ·10−3 mbar andpD2 = 3.2 · 10−3 mbar. This leads to Qsw,HD = 1.8 · 1021 /s and Qsw,H2 =1.3 · 1021 /s. The removal by the pumps equals Qp,HD = 2.3 · 1020 /s andQp,H2 = 1.7 · 1020 /s. Putting the values for Qsw,H and Qp,H into eq. (4.4)we obtain a comparable value of fGDC = 87%.
The high re-ionization probability in ICWC compared to GDC, mainlydue to the higher electron density, has a large influence on the retention ratesin both techniques. In the following an isotopic exchange experiment withconditioning discharges in H2 and a D-saturated wall is considered. Thereionization probability f relates then per definition the wall desorptionrate of D, Qsw,D, with the removal rate of D by the pumps via Qp,D =(1 − f)Qsw,D, since the only source of D is the wall. If the isotopic ratio

Chapter 4 4-21
of the wall D/(H + D) ≈ 1, then the desorption rate of D is also related tothe total flux of particles to the wall, Qftw, via the total recycling coefficientR5. The outpumped flux of D can thus be written as a function of the totalparticle flux to the wall:
Qp,D = (1− f)RQftw (4.6)
For the sake of comparison it is now assumed that the recycling coefficientfor ICWC is as in the case of GDC close to one, e.g. RICWC = RGDC =0.998. Using the estimated reionization probabilities and the measuredremoval rates of D, Qp,D, it is possible to estimate equally the requiredflux of particles to the walls, Qftw, with eq. (4.6), as well as the relatedtotal extra retention rate, Qer. The total extra retention rate is definedas Qer = (1 − R)Qftw and in principle disregards whether the incoming oroutgoing particle consists of D or H. The results of these estimations aresummarized in table 4.8. It is found that even if a small percentage of theflux of particles to the wall is permanently retained into the wall, in theconsidered example (1 − R) = 0.2%, the total retention rate during thedischarge can be of the same order as the removal rate by the pumps whenthe particle flux to the wall is high enough, as in the case of ICWC.
Table 4.8: Overview estimated values for reionization probability f , pumpingrate of D (Qp,D, s−1), total wall flux (Qftw, s−1) and total extra retention rate(Qer, s−1), for the analyzed ICWC and GDC discharges on TEXTOR.
f Qp,D Qftw Qer Qer/Qp,DGDC 0.86 3.4 · 1019 2 · 1020 4 · 1017 0.01
ICWC 0.998 5.2 · 1018 3 · 1021 6 · 1018 1.2
4.1.3.4 Comparison GDC with optimized pulsed ICWC
It was found that although the ratio of retained particles over recoveredparticles in ICWC discharges is larger than one, the recycling coefficientcan still be very close to one (R ≈ 1), which opens doors for eventual op-timization of the technique. Since reionization and wall flux retention onlyoccurs during the plasma discharge, it is proposed to use shorter RF pulses(∼ 1 s) separated by sufficient time between pulses to recover the wall des-orbed particles by the machine pumps. In the next section we will show thatthis significantly improves the ratio of implanted over recovered particles,without severely lowering the total amount of removed particles. Fig. 4.12
5In the model of de la Cal [56] presented in section 2.2.3, this coefficient was calledthe yield Y .

4-22 Assessment of the ICRF wall conditioning efficiency
Figure 4.12: Comparison of D2-GDC and H2-ICWC partial pressures on ASDEXUpgrade.
shows the partial pressures of such an optimized H2-ICWC discharge and aD2-GD on ASDEX Upgrade. The H2-ICWC discharge is the 11th dischargefrom the ICWC session mentioned in section 4.1.1, and contained two RFpulses of resp. 250 ms and 500 ms (at t = 0 s and t ≈ 6 s). The D2-GD iseffectuated after five He-GDC pulses. The HD partial pressures are of thesame order of magnitude in both conditioning procedures, and the H2 par-tial pressure of the D2-GD is approximately equal to the D2 partial pressureof the H2-RF discharge.
4.1.4 Pulsed ICWCIn the previous section we showed that neutral molecules in ICWC dis-charges have a large ionization probability f . The probability to evacuatewall desorbed molecules before they are ionized or dissociated (1−f) is thusvery low. To increase the removal efficiency it is proposed to simply includepumping time (PT, i.e. without plasma) in the ICWC procedure [56]. Anadditional advantage of applying multiple short pulses is that it results inless extra retention of discharge gas, since retention of the wall bombardingparticles only occurs during the RF discharge. In recent experiments it isshown that the ratio of retained over recovered hydrogenic particles canbe brought close to one by optimizing the duty cycle of the RF pulses, asillustrated on Fig. 4.13. The data points on this figure are taken from twosubsequent multi-pulse H2-ICWC discharges on TORE SUPRA where thewall was preloaded by D2-GDC. The H2 injection was continuous constantwith pH2 = 2.0 · 10−4 mbar. The RF power at the generator was 60 kW at afrequency of 48 MHz, and the toroidal magnetic field was respectively 3.8 Tand 3.2 T. Fig. 4.13 (left) shows that shorter RF pulses (e.g. 2 s RF + 38 sPT) limit the amount of retained H with respect to longer pulses (e.g. 5 sRF + 35 s PT and 10 s RF + 30 s PT) without severely lowering the amount

Chapter 4 4-23
Figure 4.13: Isotope exchange efficiency as function of pulse length taken fromtwo subsequent multi-pulse H2-ICWC discharges on TORE SUPRA, calculatedseparately for each duty cycle. Nsv,H, Np,H and Np,D are respectively the to-tal injected H, total pumped H and total pumped D over one duty cycle (40 s).Discharge parameters: constant H2 gas injection with pH2 = 2.0 · 10−4 mbar,PRF,generator = 60 kW, fRF = 48 MHz, pulse cycle t(PRF,on)/t(PRF,off) = x s/(40−x s), BT = 3.2− 3.8 T and wall preloading by D2-GDC.
of out-pumped deuterium. This can be understood as a combination of twoeffects: first, as already mentioned, because the particle flux to the wall andthus also the particle retention is only present during the RF pulse. Andsecondly, as indicated by the increase in gas pressure after the RF dischargeclearly visible in for example the TEXTOR discharge on Fig. 4.3 (right),the release of particles from the wall continues after the RF pulse, with acharacteristic time scale depending on the wall material and the physicalprocess (e.g. release dominated by thermal detrapping, diffusion, surfacerecombination, or their combinations [124], see also section 6.1.3). The fig-ure shows that a ratio of retained H over pumped D equal to one (as inGDC) was also achieved with ICWC, illustrating that the problem of highretention during ICWC can be overcome (Fig. 4.13, right).
Similar experiments have been carried out on TEXTOR (H2-ICWC dis-charges on D-preloaded wall, one RF pulse per discharge). Two sets ofdata points are given in Fig. 4.14. The RF power at the generator was2× 50 kW for set 1 and 2× 100 kW for set 2, at a frequency of 29 MHz andtoroidal magnetic field of 2.3 T. The H2 injection was feedback controlledto ptot = 5.0 · 10−4 mbar. Also on TEXTOR, the ideal ratio of retained Hover pumped D could be achieved with ICWC (Fig. 4.14, right) by limitingRF the pulse length. Additionally it was found that for a same dischargelength, retention is more important at high power. The amount of recoveredparticles is less sensitive to the discharge length, as was found on TORE

4-24 Assessment of the ICRF wall conditioning efficiency
Figure 4.14: Isotope exchange efficiency as function of pulse length taken fromtwo sets of H2-ICWC discharges on D-preloaded wall. Nsv,H, Np,H and Np,D arerespectively the total injected H, total pumped H and total pumped D for eachdischarge. The H2 injection was feedback controlled with pH2 = 5.0 · 10−4 mbar.The RF power at the generator was 2× 50 kW for set 1 and 2× 100 kW for set 2,at a frequency of 29 MHz and the toroidal magnetic field of 2.3 T.
SUPRA, nor to the discharge power.Also on tungsten machine ASDEX Upgrade it is advantageous to re-
duce the RF discharge length in order to optimize the conditioning effi-ciency. The motivation for applying shorter RF pulses instead of continu-ous RF discharges is clearly illustrated on Fig. 4.15, giving the H2 and HDpartial pressure time traces for four similar RF discharges with differentpulse lengths. The H2 injection was continuously constant (until t = 15 s)with pH2 = 2.5 · 10−4 mbar. The RF power at the generator was 300 kW(monopole phasing), at a frequency of 30 MHz and a toroidal magneticfield of 2.3 T. Since the gas injection was continuously constant, the gasconsumption by the walls is not compensated by extra injection, which isclearly visible from the H2 pressure drop on switching on the RF power.The longer the RF pulse, the deeper the pressure drop, until at t ≈ 1 s asteady state pressure level is formed. The HD partial pressure first startsto increase on switching on the RF power, which illustrates the strong wallinteraction, while for the longer RF pulses at t > 250 ms it decreases again.The latter is not due to depletion of the wall, but rather to the drop of thetotal pressure; for longer pulse lengths, the initial wall released HD will bereimplanted into the wall. The optimal pulse length in this figure is thepulse of 250 ms. For this pulse the maximum pHD is reached, whereafterthe discharge is stopped and the outgassed HD can be recovered from thevessel by the pumps. For shorter pulses the maximum is not reached, sothe HD removal efficiency will be lower. For longer pulses, the HD pressure

Chapter 4 4-25
Figure 4.15: Partial pressure time traces (pH2 and pHD) for 4 similar ASDEXUpgrade discharges with different pulse lengths. The H2 injection was continuousconstant with pH2 = 2.5 · 10−4 mbar. The RF power at the generator was 300 kW(monopole phasing), at a frequency of 30 MHz and the toroidal magnetic field of2.3 T.
will decrease again with the total pressure, which causes also a lower HDremoval efficiency by the pumps (pHDS).
An analysis, determining the ideal pulse cycle (RF pulse length andpumping time) for TORE SUPRA H2-ICWC discharges with pH2 = 1.75 ·10−4 mbar, PRF,gen = 60 kW is presented in chapter 6. In this section alsothe influence of the machine pumping speed on the conditioning efficiencywill be discussed.
4.1.5 Optimization of control parameters4.1.5.1 Efficiency as a function of power and pressure
Fig. 4.16 shows the conditioning efficiency of D2-ICWC on JET as a functionof the coupled power and discharge pressure (given as total injected deu-terium). The data points are taken from a series of five 9 s RF dischargesfrom which three had a similar coupled power (∼ 275 kW) and dischargepressures of resp. ptot ≈ 0.5 · 10−5 mbar, 2 · 10−5 mbar and 5 · 10−5 mbar,and three had a similar discharge pressure (ptot = 2 · 10−5 mbar) and cou-pled powers of resp. PRF,coup ≈ 125 kW, 190 kW and 275 kW. From theright top figure follows that the deuterium retention in the D2-ICWC dis-charges increases linearly with the amount of injected deuterium. This isdue to the simple fact that almost all injected gas is retained in the walls.In the previous section we saw that this retention can be limited by short-ening the pulse length. The same right top figure shows that the amount of

4-26 Assessment of the ICRF wall conditioning efficiency
Figure 4.16: Isotopic exchange efficiency of D2-ICWC on JET as a function ofthe coupled power and discharge pressure (given as total injected deuterium). Thedata points are taken from a series of 5 9 s RF discharges from which 3 had similarcoupled powers (∼ 275 kW) and discharge pressure of resp. ptot ≈ 0.5 · 10−5 mbar,2 · 10−5 mbar and 5 · 10−5 mbar, and 3 had similar discharge pressure (ptot =2 ·10−5 mbar) and coupled power of resp. PRF,coup ≈ 125 kW, 190 kW and 275 kW.
recovered hydrogen is less dependent on the discharge pressure. The rightbottom figure shows that the ratio of retained D over recovered H improvesby lowering the discharge pressure6. The left bottom figure shows that fora given pressure, the best retained D over recovered H ratio is achieved athigher coupled power.
The ‘long’ RF discharges on JET make that on Fig. 4.16 the effect ofdischarge power is not very much pronounced. The constant gas injectionmakes that the gas retention is more related to the discharge length insteadof the discharge power. In the previously discussed TEXTOR result given inFig. 4.14 the gas injection was feedback controlled. In this case, as alreadymentioned, the retention becomes a strong function of both the RF power(more power, more retention) and the discharge length (longer pulse, moreretention). As is the case for the pulse length, the efficiency for removalof particles is only weakly dependent on the coupled power. The optimalRF power has to be chosen as the power at which the RF discharge can beproduced most reliably (antenna operation), and at which the discharge ismost homogeneous.
Fig. 4.17 shows the particle balances for eight subsequent 500 ms long H2-ICWC pulses on TEXTOR (PRF,gen = 2×100 kW, fRF = 29 MHz and BT =2.3 T). The first four discharges are operated at higher feedback pressure
6On TORE SUPRA we saw earlier that this ratio improves on increasing the hydrogencontent of the feedback injected H2/He mixture (Fig. 4.2), which was due to the resultingsignificant increase of the total amount of recovered wall desorbed particles.

Chapter 4 4-27
Figure 4.17: Particle balance for 8 subsequent 500 ms long H2-ICWC pulses onTEXTOR. The H2 injection was feedback controlled with pH2 = 5.0 · 10−4 mbarfor the first 4 discharges and ptot = 1 · 10−4 mbar for the last. The RF power atthe generator was 2×100 kW, at a frequency of 29 MHz and the toroidal magneticfield of 2.3 T.
(ptot = 5·10−4 mbar), and the second four at lower feedback pressure (ptot =1 ·10−4 mbar). From discharge to discharge, at high pressure, less hydrogenis retained into the wall, and thus less hydrogen is required to reach the totalpressure of 5 · 10−4 mbar. This saturation effect makes also that less walldesorbed deuterium is re-implanted into the wall, which is visible by the factthat from discharge to discharge more deuterium is removed from the vessel.For the fourth discharge, the ratio of H retained over D removed equals 1.7,and it seems that the ratio can improve even more (saturation not complete).When switching to a lower total gas pressure, at first more hydrogen isrecovered from the vessel than injected. The ratio of H retained over Dremoved is thus negative. It increases in the subsequent shots, and becomesagain higher than one at the fourth discharge (1.2). It is concluded thatfor each combination of discharge pressure, coupled power, and dischargelength a specific steady state ratio of H retained over D removed will beattained. For the presented TEXTOR case it seems that for the givendischarge length and generator power the high pressure discharges performbetter than the low pressure ones. The total amount of removed deuteriumis higher and the ratio of H retained over D removed evolves in time to onethat is close to one.
4.1.5.2 Efficiency as a function of magnetic fields
The analysis of the wall conditioning efficiency as a function of the ap-plied toroidal and poloidal magnetic fields is a difficult matter since the

4-28 Assessment of the ICRF wall conditioning efficiency
improvement of the efficiency is generally small and masked by the con-stantly changing wall state. In section 4.1.2 we already mentioned that theimprovement in conditioning efficiency for high and low BT discharges onTEXTOR (when keeping the coupled RF power approx. constant) is onlysmall. So far it was not possible to show a clear effect of the radial loca-tion of the fundamental resonance layer on the conditioning efficiency. Itcan thus be concluded that the choice of the toroidal field is not crucial forthe conditioning efficiency, and should be determined by plasma productionconsiderations.
As discussed in chapter 3, the application of a poloidal magnetic field canimprove the poloidal discharge homogeneity so that distant areas, such asthe divertor region on JET, can be reached. On TEXTOR it was shown thatthe deuterium removal efficiency of H2-ICWC increases by 5% on applicationof a stationary vertical magnetic field (∼ 10 mT, last three discharges of theICWC session resulting in the isotopic ratio increase shown in Fig. 4.3,left). At the same time also the retention increased by 5%. This might beunderstood from the increasing or changing wall surface area that is reachedby the plasma wall flux, by tilting the magnetic field lines (see chapter 3).The magnectic field lines close to the wall surfaces are in present devicesmostly limited by dedicated wall structures (e.g. antenna protection limitersat LFS or inner bumpers at HFS). As charged particles are transportedalong field lines, tilting these field lines will slightly change the conditionedsurfaces. The ITER wall will be completely shaped [125], meaning thatthere won’t be any dedicated structures serving as poloidal limiters, exceptfor the wall itself. As already proposed in chapter 3, varying the sign ofthe poloidal field from a set of RF pulses to an other set (e.g. 10 pulsesat +BV,max and 10 pulses at −BV,max) might increase the conditioningefficiency.
4.2 He-ICWC for fuel removal and recoveryfrom disruptions
4.2.1 Fuel removalFig. 4.18 shows the H2 and HD partial pressure as a function of time forthree identical He-ICWC discharges on TORE SUPRA (15×2 s pulses with18 s between subsequent pulses, pHe = 2 ·10−4 mbar and PRF,gen = 150 kW).The discharges are effectuated after a H2-ICWC session, for which the wallwas preloaded by D2-GDC. After this session the walls were partially de-saturated by one non sustained ohmic breakdown and one ohmic discharges(natural density, Ip = 0.8 MA). On Fig. 4.18, a clear outgassing peak is vis-

Chapter 4 4-29
Figure 4.18: H2 and HD partial pressure as a function of time for 3 identicalsubsequent He-ICWC discharges on TORE SUPRA: 15 × 2 s pulses with 18 sbetween subsequent pulses, pHe = 2 · 10−4 mbar and PRF,gen = 150 kW
ible after every RF pulse, decreasing in height from pulse to pulse, which il-lustrates the progressing desaturation of the wall surfaces. Table 4.9 summa-rizes the total particle balances for each discharge. In total 9.1·1020 H atomscould be recovered from the wall in the three discharges (∼ 1 monolayer),which is about 5 to 10% of the short term retention accessible by plasma op-eration in TORE SUPRA, illustrating the effectiveness of He-ICWC7. Thethree subsequent ICWC discharges shown in 4.18, containing 45 RF pulsesin total, were carried out without any occurring problems with respect toRF antenna operation, illustrating that this optimized He-ICWC scenariois ready for routine operation on TORE SUPRA.
Unlike for hydrogen RF discharges, in case of He-ICWC on TORESUPRA, almost no helium is lost to the walls (< 5%, see table 4.18). Wewill show further-on that during He-ICWC discharges on JET and ASDEXUpgrade a significant part of the injected helium is retained in the walls.
Table 4.9: Particle balances for the TORE SUPRA He-ICWC discharges 45711-45713 shown in Fig. 4.18. He injected: Nsv,He, H recovered: Np,H
H+D wall Nsv,He % He retained Np,HHe-ICWC 45711 8.4e21 2.5 4.7e20He-ICWC 45712 8.3e21 3.2 3.1e20He-ICWC 45713 8.4e21 3.2 1.7e20
7The fact that the HD partial pressure is slightly higher than the H2 partial pressuremeans that the amount of recovered deuterium is of the same order as the amount ofrecovered hydrogen, which puts the total number of removed hydrogen isotopes on 10-20%of the short term retention. In case of a wall isotopic ratio of I = H/(H + D) = 0.5, oneexpects an identical partial pressure isotopic ratio: I = [pH2 +0.5pHD]/[pH2 +pHD+pH2 ],for which counts pH2 = pD2 and pHD = 2pH2 .

4-30 Assessment of the ICRF wall conditioning efficiency
Figure 4.19: Left: Ion gauge pressure as a function of time in TORE SUPRAduring recovery from disruption tests using He-ICWC (pHe ≈ 5 · 10−4 mbar,pRF,gen ≈ 60 kW). Right: Hydrogen partial pressure and D2O mass spectrom-etry signal for first recovery He-ICWC discharge.
4.2.2 Recovery from disruptionsAfter a tokamak plasma disruption event, the wall surfaces are often satu-rated with fuel and lots of impurities, produced as a result of the disruption,are present. After such an event it is generally difficult to restart a toka-mak plasma due to too high plasma fueling by the walls, and to additionalplasma cooling by impurities in the burn-through phase. To ensure toka-mak start-up, conditioning procedures are employed to desaturate the wallsand to remove the impurities (see section 1.5). In order to assess the effi-ciency of ICWC to recover to normal tokamak operation, two disruptionswere provoked on the outboard poloidal limiter during ohmic discharges(Ip = 1.2 MA) on TORE SUPRA. Both disruptions had a similar strength(dIp/dt = 360 MA/s). Fig. 4.19 (left) gives the total pressure in the vac-uum chamber illustrating the chronology of the experiment. After the firstdisruption, an attempt to initiate an ohmic plasma failed due to the satu-rated vessel walls. At t = 50 min., the walls are conditioned by He-ICWC(pHe ≈ 6.0 · 10−4 mbar). The pulsed He-ICWC discharge, consisting of ten2 s RF pulses with 8 s of PT between the subsequent pulses, allowed torecover to normal tokamak operation (ohmic at t = 62 min). The hydro-gen partial pressure and D2O mass spectrometry signal for the first six RFpulses is given in Fig. 4.19 (right). One can clearly see the outgassing peakafter each RF pulse, while during the pulse the hydrogen and D2O pressuredrop (particle consumption by wall). The after-shot partial pressure levelincreases in the first four pulses and starts to decrease from the fifth pulseon, illustrating the desaturation of the wall. To ensure that it was actuallythe He-ICWC discharge that successfully desaturated the walls, and not thefailed ohmic discharge (at t = 18 min.), a second disruption was provoked

Chapter 4 4-31
followed by He-ICWC. After this He-ICWC discharge, again it was possibleto initiate a plasma, indicated by the last pressure increase on the figure,at t = 95 min. During a later experimental campaign, a third test was suc-cessfully effectuated, putting the counter on 3/3. To gain more confidencein the ICWC technique, the number of tests should be increased in future.TORE SUPRA is the only (European) machine that can do this in a timeefficient manner: its superconducting toroidal field system allows applyingmultiple RF pulses in one single discharge.
The efficiency of the discussed He-ICWC discharge can be improved byincreasing the time in between pulses (e.g. 18 s PT instead of 8 s), so thatmore of the wall desorbed particles are removed by the pumps, to avoidre-implantation during the subsequent RF pulse.
4.2.3 Optimization of control parametersDedicated experiments have been carried out on TORE SUPRA to findthe optimal discharge control parameters that maximize the He-ICWC effi-ciency. Below the effect of the pulse length and RF power will be discussed.No conclusive data was obtained on the effect of the neutral helium pressure,nor on the applied vertical magnetic fields.
4.2.3.1 Efficiency as a function of the RF pulse length
Fig. 4.20 (left) shows the hydrogen removal efficiency of TORE SUPRAHe-ICWC pulses (PRF,gen = 250 kW, pHe = 1.8 · 10−4 mbar) as a functionof the pulse length, for a constant total pulse cycle of 40 s. The amountof removed hydrogen during one pulse cycle increases clearly on increasingpulse length. Continuous RF operation is however not advantageous sincemost of the hydrogen is recovered after the RF pulse, the hydrogen pressureduring the discharge being very low. To optimize the discharge it is thusimportant to find the optimal combination of pulse and pulse cycle length.From previous section on H2-ICWC we know that the re-implantation ofwall desorbed species increases on increasing pulse length. In chapter 5 onthe 0D modeling of ICWC discharges we will show that the contributionof wall desorbed hydrogen to the total wall flux in helium RF dischargesis significant. The H+ and He+ ion flux are comparable, and the neutralH-atom flux is one order of magnitude higher than the ion fluxes. Re-implantation of wall desorbed hydrogen will thus likely also be importantin He-ICWC discharges. It is therefore recommended to limit the dischargelength also in He-ICWC, e.g. 2 s, and to foresee sufficient time between twodischarge pulses, e.g. 18 s, as was successfully employed for the dischargesin Fig. 4.18.

4-32 Assessment of the ICRF wall conditioning efficiency
Figure 4.20: Hydrogen removal efficiency of TORE SUPRA He-ICWC dis-charges (pHe = 1.8 · 10mbar kW). Left: Efficiency per pulse as a function of thepulse length (constant total pulse cycle of 40 s and PRF,gen = 250 kW). Right:Efficiency per pulse as a function of the coupled power (2 s RF pulses and a totalpulse cycle of 10 s).
4.2.3.2 Efficiency as a function of the RF power
Fig. 4.20 (right) shows the hydrogen removal efficiency of TORE SUPRAHe-ICWC pulses (pHe = 1.8 ·10−4 mbar) as a function of the coupled power,for 2 s RF pulses and a total pulse cycle of 10 s. On increasing the power,the mount of removed hydrogen increases. It is expected that this is due toan enhanced particle wall flux at increased coupled power. On the right axisthe electron density is given as a function of the coupled power. In chapter5 these particular discharges will be modeled, reproducing the measureddensities as a function of the coupled power, and estimating the wall flux.From the model it is confirmed that the wall flux increases on increasingcoupled power. In the case of H2-ICWC we saw that the hydrogen implan-tation rate increased on increasing discharge power. As already mentioned,a large part of the wall flux during He-ICWC will consist of wall desorbedhydrogen, and thus it is expected that the re-implantation rate of wall des-orbed species also increases with the RF power. If one intends to use veryhigh powers for conditioning, the discharge length should thus be decreased.
4.2.4 Comparison with other techniquesThe routine conditioning technique for inter-pulse conditioning on TORESUPRA are the Taylor like ‘TORE SUPRA cleaning discharges’ (see sec-tion 1.5.2.2). The HD removal efficiency of these discharges (after disrup-tions) was previously compared with the efficiency of continuous He/H2-ICWC discharges (see [126]). The efficiencies of both techniques were foundto be comparable. Fig. 4.21 (top) shows a similar figure, comparing theHD removal efficiency of the optimized pulsed He-ICWC discharges dis-

Chapter 4 4-33
Figure 4.21: He, HD and H2O partial pressures measured during Taylor likehelium conditioning discharges (gray lines) and He-ICWC (blue and green lines)on TORE SUPRA.
cussed in section 4.2.1 (blue and green lines) to that of TDC discharges(gray lines). As mentioned, the He-ICWC discharges were preceded by aH2-ICWC session, one non sustained tokamak plasma, and one ohmic D2plasma. Most of the TDC discharges were preceded by a plasma disruption.Both techniques operated in pulsed mode, at about the same helium pres-sure (pHe ≈ 2 · 10−4 mbar). The HD removal efficiency of ICWC is initiallyabout five times higher than in the TDC discharges, and evolves during the45 subsequent RF pulses to a removal rate that is about two times the max-imum removal rate in the Taylor like discharges. Since TDC is successfullyused for inter-pulse conditioning on TORE SUPRA, this result in principleindicates that also He-ICWC can be used for inter-pulse conditioning, at anat least equal efficiency.
The bottom figure shows that also the impurity removal rates (H2O) arecomparable. We will discuss impurity removal in more detail in section 4.3.
4.2.5 Helium retentionDuring He/D2-ICWC discharges on JET and He/H2-ICWC discharges onASDEX Upgrade it was found that large amounts of helium were absorbedby the wall, as illustrated on Fig. 4.22. The red curve gives the expectedhelium pressure from the gas injection signals, the blue line is the measuredhelium partial pressure, and the green surface represents the amount ofhelium that went missing during the discharge. In the shown JET dischargethis surface represents 2.0 · 1020 helium particles or 80% of the injected

4-34 Assessment of the ICRF wall conditioning efficiency
Figure 4.22: Illustration of helium loss during He/D2-ICWC on JET (left) andHe/H2-ICWC on ASDEX Upgrade (right). Respectively the expected heliumpressure (red, from the gas injection signals), the measured helium partial pressure(blue), and the consequently missing helium (green surface) are given.
atoms. In the ASDEX Upgrade discharge, 3.2 · 1020 or 60% of the injectedatoms were lost to the walls. For the total experimental session on JETconsisting of 11 successive He-containing ICWC discharges, including theshown discharge, an average helium retention of 80% was found, good forabout 2 · 1021 He atoms in total. The He/D ratio8 from visible spectroscopyand VUV He lines measured in during D2 tokamak discharges right afterthe ICWC session was 4%. Before the RF session this ratio was practicallyzero (≤ 0.2%), confirming the significant absorption of helium by the wallsduring the ICWC session. In total four tokamak discharges and 2 hours ofD2-GDC reduced the ratio again below < 0.3%.
The cause of the helium retention it not well understood at this point.Similar strong helium losses were not observed on TORE SUPRA (seee.g. table 4.9), nor on TEXTOR, at any pressure or RF power. Since on JETthe retention was found to be significant at any RF power, it is concludedthat an explanation has to be sought in terms of the plasma facing compo-nents. As published in [127], the presence of beryllium in JET (on ICRFantennas) could explain the high helium retention on JET [128] and thehelium losses to tungsten walls have also been reported for He-GDC [129].Since ITER will have as main plasma facing components tungsten and beryl-lium, it is important to investigate this effect further in future. Conditioningin alternative inert gases could be envisaged if necessary, and if they do notfeature the same problem.
8Thanks to dr. A. Kreter, IPP Juelich

Chapter 4 4-35
4.3 Removal of impurities and codeposited lay-ers
In previous sections we analyzed the efficiency of H2 and He-ICWC for re-spectively isotopic exchange and wall desaturation. The removal rates ofhydrogenic species and the additional induced hydrogen or helium reten-tion could be accurately calculated thanks to the high partial pressures ofthe latter gases and the collected mass spectrometry and Penning gaugespectroscopy calibration data. An important question remains however tobe treated, namely whether ICWC is able to reduce the impurity contentin the vacuum vessel (to allow tokamak start-up and improve plasma per-formance), and whether it can remove codeposited layers together with thetherein stored hydrogen (tritium removal). This section gives an overviewof experimental results related to these two points.
4.3.1 Carbon removalAn accurate quantization of carbon removal by ICWC was obtained on JET.Gas chromatography analysis (see section B.1.3.2) of the pumped gas duringthe isotopic exchange experiment on JET, presented earlier in Fig. 4.5,evidenced a total of 4.1 · 1020 carbon atoms in the form of CH4 (98%),C2H4 (1.5%) and C2H6 (0.5%). This corresponds to 7.8 mg of carbon, or0.13 monolayers, in eight RF pulses of 9 s. Taking the JET erosion andredeposition rates mentioned in section 1.4.1, one would need 90 similarICWC pulses to remove the 90 mg of carbon, codeposited in an average10 s JET discharge. This extrapolation holds of course only if the removedcarbon stems from codeposited layers.
Fig. 4.23 (left) shows the impurity removal efficiency, represented by thetime integrated mass spectrometry signal (including discharge and post dis-charge), as a function of the averaged coupled power for He/D2-ICWC dis-charges on JET. The removal efficiency is clearly higher at higher dischargepowers. Although the injected gas mixture was changed from discharge todischarge, no clear dependency was found on the discharge gas, which islikely due to the fact that most of the gas is consumed by the walls duringthe discharge.
In section 4.1.2 we investigated whether the presence of fast CX neutralscould improve the hydrogen removal efficiency, which turned out not to bethe case. The same question can be posed for the impurity removal effi-ciency. Fig. 4.23 (right) gives estimated impurity partial pressures (mass 19for HDO or CHD3 and mass 20 for H2O and CD4, calibrated using mass 16with CH4), for the two TEXTOR discharges previously discussed in section

4-36 Assessment of the ICRF wall conditioning efficiency
Figure 4.23: Left: Integrated mass spectrometry signal (including dischargeand post discharge), as a function of the averaged coupled power for He/D2-ICWCdischarges on JET. Right: Estimated impurity partial pressures (mass 19 for HDOor CHD3 and mass 20 for H2O and CD4, calibrated using mass 16 with CH4), fortwo TEXTOR discharges operated respectively at BT = 2.3 T and BT = 0.23 T.
4.1.2 (Fig. 4.8), operated respectively at high and low toroidal magneticfield. The presence of energetic CX neutrals in the high BT discharge, dueto resonant ion heating at the fundamental resonance layer, has clearly nomajor effect on the impurity removal efficiency. The outgassing peaks, vis-ible on the partial pressures (t = 10 to 20 s), are 40% higher in the lowBT case than in the high BT discharge. This is thought to be due to thebetter homogeneity of the discharge in case multiple harmonic resonancesare present in the vessel. The idea that the fast CX neutrals might facilitatethe removal of codeposited layers is thus either not correct, or that it cannotbe shown from the partial pressures.
To test the ability of ICWC to erode codeposited layers, (deuterated-)carbon coated silicium samples were introduced into TEXTOR via the bot-tom limiter lock, during the previously presented isotopic exchange exper-iment consisting of 26 nearly identical He/H2-ICWC discharges (Fig. 4.3).The sample holder was mounted on the Langmuir probe holder, describedin section B.2.4 (dimensions: Fig. B.6). The plasma facing apertures of thesample holder (see photo: Fig. 4.24) are ∼ 2 mm smaller than the sampledimensions so that in the surface analysis after the ICWC session, the ex-posed sample area could be compared to the shadowed sample edge. Theanalysis9 showed no significant thickness variation between the exposed andshadowed parts, illustrating that no net erosion or deposition occurred dur-ing the experiments at the location of the probe holder. In the first 10 nmof the exposed area, a significant increase of the hydrogen and oxygen con-centration was observed (see Fig. 4.25). No clear decrease of the deuterium
9Thanks to dr. A. Litnovsky, IPP-Juelich

Chapter 4 4-37
Figure 4.24: Sample holder to study PSI in situ on TEXTOR. From left to right:opened sample holder, sample holder mounted on the Langmuir probe holder andsamples. The samples have to be placed on top of the springs, with the carboncoating facing the plasma.
Figure 4.25: Surface analysis of deuterated carbon coatings exposed to 26 nearlyidentical He/H2-ICWC discharges (see Fig. 4.3) on TEXTOR. Plasma exposedareas are compared to shadowed areas.
concentration could be seen. At larger depths the hydrogen and oxygenconcentrations are less pronounced and at a depth of 30 nm the hydrogenconcentration in the exposed area becomes equal to that of the non exposedarea. One can conclude that by exposure to He/H2-ICWC, mainly the first10 nm of the deuterated-carbon coating is affected. Whereas the evidencedsurface hydrogen concentration can be due to the H2-RF discharges, theoxygen concentration is possibly built up after taking the samples out ofthe vacuum environment. If the latter is true, the fact that no oxygen ismeasured in the non-exposed area means that ICWC induces trapping sitesfor oxygen (or H2O). In future, similar experiments should be carried out

4-38 Assessment of the ICRF wall conditioning efficiency
Figure 4.26: Left: H2 and Ar partial pressure illustrating the chronology of theAr removal experiment on TEXTOR. Right: Evolution of the Ar partial pressuresfor 5 subsequent H2-ICWC discharges: 5 s long RF pulses, PRF,gen = 2 × 50 kW,pH2 = 5 · 10−4 mbar.
where one firstly has to aim at putting the samples as close as possible tothe plasma. As we saw in chapter 3, the measured plasma densities at thislocation (Langmuir probe), are much lower than the evidenced plasma den-sities in the center of the vessel (interferometry), which reduces probablythe removal, retention and erosion rates. Secondly, the cumulated dischargetime has to be as high as possible10.
4.3.2 Removal of marker gas: ArgonTo compare the impurity removal efficiency of H2-ICWC to that of standardH2-GDC on TEXTOR, the TEXTOR wall was loaded with a marker gas,whereafter its removal efficiency by both techniques is recorded. For themarker gas argon was chosen. The advantage of argon is that it can beeasily identified with mass spectrometry and that its presence in the vessel,if not injected on purpose, is negligible. Fig. 4.26 (left) shows the chronologyof the experiment. A 15 min. Ar/H2-GD was effectuated (t = 10−25 min.),followed by seven H2-ICWC discharges (5 s long RF pulses, PRF,gen = 2 ×50 kW, pH2 = 5 · 10−4 mbar). Fig. 4.26 (right) gives the evolution of theargon partial pressures for five subsequent discharges. The argon releasedecreases from shot to shot, and most of the argon is recovered after the RFpulse. The total amount of argon removed in these discharges is 5.1 · 1018
(integration over 60 s starting from discharge initiation). The H2-GD atthe end of this test removed another 1.4 · 1019 argon atoms from the wall(partial pressure extrapolated by 10 min.), which allows to estimate the
10If one only wants to evidence erosion, long high power RF discharges are recom-mended, which will be at the price of high discharge gas retention. If the aims is toillustrate isotopic exchange, shorter RF pulses are recommended to limit the extra reten-tion.

Chapter 4 4-39
Figure 4.27: Mass spectrometer signals illustrating the chronology of the O2removal experiment by H2-ICWC on TEXTOR.
total amount of retained argon by the Ar/H2-GDC to 1.9 · 1019. The sevenICWC discharges could thus remove ∼ 25% of the introduced argon. To testwhether ICWC reaches the same wall areas as GDC, more ICWC dischargesshould have been effectuated until no argon is recovered, estimated at ∼ 15discharges. Any extra argon removed by a subsequent GDC stems fromareas that are not efficienctly reached by ICWC. The maximum recordedremoval rate during the discharges in Fig. 4.26 (right) equals Qp,ICWC =2.1 · 1016 /s (discharge 114733, t = 12 s). As the maximum argon partialpressure in the H2-GD is about 3 to 5 times higher than in H2-ICWC, themaximum removal rate of GDC will thus also be 3 to 5 times higher.
4.3.3 Reduction of vessel oxygen contentThe most common or relevant tokamak vacuum vessel impurities are oxygen,carbon oxides and water. As stated in section 1.4.2 these impurities arehighly radiative and can cause multiple unfavorable effects (e.g. hinderingtokamak plasma initiation or causing disruptions). A wall conditioningtechnique used for inter-pulse conditioning has thus to be able to reducethe general oxygen impurity content, e.i. ICWC which is envisaged for inter-pulse and overnight conditioning on ITER.
On TEXTOR a small amount of oxygen was introduced into the vessel.During this injection, the pumping ducts were closed so that most of theinjected gas is absorbed by the vessel walls (t = 15− 30 min. on Fig. 4.27),visible by the decreasing O2-pressure signal. The simultaneous CO pressureincrease stems both from wall desorption as from wall erosion by the injectedoxygen. After reopening the valves to the pumps (t = 30 min.) a stable O2,

4-40 Assessment of the ICRF wall conditioning efficiency
Figure 4.28: He and H2O partial pressure as a function of time for 3 identicalsubsequent He-ICWC discharges on TORE SUPRA: 15 × 2 s pulses with 18 sbetween subsequent pulses, pHe = 5 · 10−4 mbar and PRF,gen = 150 kW
H2O and CO pressure level is formed in the vessel. Already after the firstH2-ICWC discharge (t = 60 min.), the O2 pressure has decreased by 1 orderof magnitude. The mass 16 signal becomes higher than mass 32, meaningthat a significant amount of CH4 is produced. At t = 65 min. the Langmuirprobe holder in limiter lock 1 is inserted into the plasma. The openingof the port causes a small rise of all the masses. In the subsequent H2-ICWC discharges (t = 60−160 min., short 0.15−1 s pulses of 2×100 kW atgenerator, pH2 = 5 · 10−4 mbar) the partial pressures remain approximatelyat the same level. Only for the last three discharges at a reduced pressureof pH2 = 1 · 10−4 mbar the O2 level decreases by a factor 2 to 3. Duringthe 1.5 hours lunch break, the O2, H2O and CO pressures rise back totheir initial level. Already after the first H2-ICWC pulse following this1.5 hours period (t = 250 min., pulse of 0.5 s with 2× 100 kW at generator,pH2 = 1 · 10−4 mbar) all signals have dropped again. One can conclude thatICWC reduces the oxygen content of the in-vessel neutral gas, although it isnot very clear where the oxygen goes. Multiple options are possible, wherein the less ideal case, ICWC puts the oxygen back in the wall and in thebest case ICWC efficiently removes the oxygen from the vessel and vesselwalls. Careful quantization of the impurity partial pressures is required todistinguish both mechanisms. Unfortunately it was not possible to quantifythe amount of recovered oxygen after each discharge.
Fig. 4.28 shows the H2O partial pressure as a function of time fromthe previously presented optimized TORE SUPRA He-ICWC discharge(Fig. 4.18). The wall release of H2O is clearly visible after each RF pulse,and the outgassing peak decreases from pulse to pulse. The latter is likelydue to both the decreasing hydrogen content of the wall and the decreas-ing oxygen level. As was the case for TEXTOR, also on TORE SUPRA itwas not possible to estimate the total amount of recovered oxygen atoms in

Chapter 4 4-41
Figure 4.29: KSTAR [131]: Left: The pH2O time evolution after He-GDC,due to outgassing of the inboard graphite the H2O pressure increases to levels> 10−8 mbar at which tokamak plasma breakdown is prohibited. Right: ThepH2O time evolution for resp. 3 operational days without, and 3 with inter-pulseHe-ICWC.
these discharges.
4.3.4 H2O removal on KSTARThe presented results on carbon, O2 and H2O removal are mostly distilledfrom isotopic exchange experiments, where the walls were preloaded/cleanedby hours of GDC and the mass spectrometers were set up to record he-lium and hydrogenic species. Although the results show that it is possibleto remove carbon, O2 and H2O from the vessel with ICWC, the questionwhether the removal efficiency is sufficient to ensure tokamak operation,remains. Promising results on this subject were reported by the KSTAR-team [130]. KSTAR, being a fully superconducting tokamak, employs He-ICWC to bring the H2O partial pressure level below the operational limit.It is found that 30 min. of (lunch-time) He-ICWC is enough to reduce thewater level down to 5 · 10−9 mbar. Fig. 4.29 (left) shows the H2O pressureas a function of time after a He-GD on KSTAR. Due to outgassing of theinboard graphite, the H2O pressure increases slowly during the day to levels> 10−8 mbar at which tokamak plasma breakdown is prohibited [131]. Theright figure gives a similar H2O pressure evolution for respectively threeoperational days without, and three with inter-pulse He-ICWC. It can beclearly seen that inter-shot ICWC suppresses the increase of water levelcompletely. This results makes that inter-shot/lunch-time ICWC is essen-tial for KSTAR operation [130].

4-42 Assessment of the ICRF wall conditioning efficiency
4.4 ConclusionIn this chapter an overview was given of experimental results on the effi-ciency of ICWC, obtained on TORE SUPRA, TEXTOR, JET and ASDEXUpgrade. In the first part of the chapter the efficiency of H2 and H2/Hedischarges for isotopic exchange was analyzed. Hereafter the efficiency ofHe-ICWC for wall desaturation and recovery of normal tokamak operationafter disruptions was presented. And finally also the efficiency of ICWC forimpurity removal was discussed.
Isotopic exchange Table 4.10 gives an overview of the presented isotopicexchange results obtained on TORE SUPRA, TEXTOR, ASDEX Upgradeand JET (section 4.1.1), showing clearly that hydrogen ICWC is able tochange the surface state within short time scales, but that the removalof wall isotopes can go at the price of a up to 10 times higher retentionof the discharge gas. Studies to the causes of the high retention delivered
Table 4.10: Overview isotopic exchange results obtained on TORE SUPRA(TS), TEXTOR, ASDEX Upgrade (AUG) and JET (section 4.1.1). Change inisotopic ratio: IR-change, cumulated RF time:
∑PL’s, RF pulse lengths: PL,
removed amount of monolayers [m-l]: Np, ratio of retained over removed atoms:Np/Nr.
IR-change∑
PL’s PL Np Np/NrTS 4→ 40% 18 min. ∼ 60 s ∼ 2.5 m-l 10
TEXTOR 7→ 38% 3 min. 6− 8 s ∼ 9 m-l 2.6JET 30→ 50% 1.2 min. 9 s ∼ 6 m-l 2.9
AUG 0.85 min. 0.05− 10 s ∼ 12 m-l 4.8
important information but remained inconclusive. Firstly, no long-term sat-uration effects of the retention could be evidenced, even not after 15 min.of cumulated RF discharge time on TORE SUPRA. From this it was con-cluded that mechanisms such as retention in deeper layers, retention bycodeposition and retention in remote areas might play an important role inICWC discharges. From experiments on the tungsten machine ASDEX Up-grade, where the high retention rates were also observed, it was concludedthat mechanisms other than codeposition with carbon have to be consideredto explain the retention. By comparing the integrated total energetic CXatom flux on JET with the amount of retained isotopes it was concludedthat direct implantation of these energetic particles is not the determiningmechanism of the hydrogen retention. Additionally it was found that thefast CX atoms have also a limited contribution to the wall release. Bothfindings were confirmed by the particle balances for two TEXTOR isotopic

Chapter 4 4-43
exchange discharges, resp. with and without fast particle population (highand low BT ). On ASDEX upgrade it was found that 11% of the retainedhydrogen could be recovered by He-GDC illustrating that a significant partof the retained hydrogen is stored in layers accessible by GDC. As it wasconcluded that hydrogen retention is probably not due to codeposition, norsolely due to the fast particle fluxes, the remaining retained hydrogen (89%)must be stored differently. The hypothesis was made that ICWC dischargesreach surface areas that are not accessible by glow discharges. Also the ex-istence of a substantial non resonant ion wall flux component with energiesabove the typical GDC flux can at this point not be excluded. Both pointsrequire further investigation.
An extensive comparison of the isotope exchange efficiencies of ICWCand GDC on TORE SUPRA and TEXTOR learned that GDC can achieve5 to 10 times higher removal rates of wall desorbed species than ICWC,although the wall release rate of particles during ICWC is about 10 timeshigher than in GDC. Both points are due to the higher electron density ofICWC discharges compared to GDC, which makes the reionization proba-bility in ICWC discharges (∼ 99.8%) is much higher than in GDC (∼ 86%).Consequently the removal efficiency of wall desorbed species by the machinepumps is less efficient in ICWC than in GDC. It was found that also themeasured high retention during the ICWC discharges can be understood asan effect of the high reionization probability. Even if the fraction of the wallflux that will be permanently retained is identical in GDC and in ICWC(e.g. 0.2%), the 10 times higher wall fluxes and the lower pumping proba-bility in ICWC makes that the permanent retention rate in ICWC can beproblematic, whereas the extra retention in GDC is negligible.
It was shown experimentally that the ratio of retained over recoveredatoms can be significantly improved by optimizing the RF duty cycle. Sincereionization and wall flux retention only occurs during the plasma discharge,and since it was shown that most of the wall desorbed gas is recovered afterthe RF pulse, the use of shorter RF pulses (∼ 1 s) separated by sufficienttime between pulses to recover the wall desorbed particles by the machinepumps (∼ 20 s on TORE SUPRA) significantly reduces the retention, with-out severely lowering the total amount of removed particles. Ratios of 1have been achieved both on TORE SUPRA and on TEXTOR.
It was found that for H2/He-ICWC discharges the conditioning efficiencyimproves on increasing the hydrogen concentration in the injected gas mix-ture (Np increases and Np/Ner decreases) which motivated further isotopicexchange experiments in pure hydrogen. The absolute removal efficiency ofwall desorbed particles is higher at higher feedback pressures (TEXTOR:1 · 10−4 mbar vs. 5 · 10−4 mbar). The efficiency increases also on increasing

4-44 Assessment of the ICRF wall conditioning efficiency
the coupled RF power (although the pulse length has to be decreased athigher RF powers, since retention is more important at higher powers), butthe gain is limited. The ideal RF power is the power at which the dischargecan be established most reliably from point of view of antenna operation,and at which the discharge is most homogeneous. Whereas the toroidal fieldstrength has a limited effect on the conditioning efficiency (at fixed coupledpower), the ICWC conditioning efficiency can be improved by applying avertical magnetic field. As charged particles are transported along the mag-netic field lines, tilting the field lines can slightly increase or change theconditioned areas.
Wall desaturation He-ICWC discharges were successfully applied onTORE SUPRA to desaturate the wall from hydrogenic particles. In threedischarges consisting each of 15×2 s RF pulses with 18 s PT between pulses(pHe = 2 · 10−4 mbar and PRF,gen = 150 kW), 1 monolayer, or 5 to 10% ofthe short term retention accessible by plasma operation, could be removedillustrating the effectiveness of He-ICWC. The hydrogen is mostly recoveredafter the RF pulse. The removal efficiency is a clear function of the cou-pled power. For a same discharge length, the hydrogen removal efficiencyincreases with a factor two on increasing the coupled power form 50 kW to150 kW. It is expected that redeposition of wall desorbed particles is as inthe case of H2-ICWC also important in He-ICWC. Therefore, although itwas found that the amount of removed hydrogen from the wall improves onincreasing pulse length (scanned range: 1−10 s for constant total cycle timeof 40 s), it is recommended to also limit the RF pulse length in He-ICWC.
On TORE SUPRA, He-ICWC was successfully applied to recover normaltokamak operation after plasma disruption events (3/3 attempts successful).It is found that the removal efficiency of He-ICWC is at least as efficient asthat of the routinely operated TDC technique, both for hydrogen removalas for removal of H2O, indicating that the optimized He-ICWC dischargescan be used for inter-pulse conditioning during experimental campaigns onTORE SUPRA.
Both on JET and ASDEX Upgrade is was found that during heliumcontaining ICWC discharges, a significant amount of the injected heliumwas consumed by the wall, resp. 80% and 60%. The beryllium elementson the ICRF antennas are thought to be responsible for this on JET. Thehelium losses are also reported for He-GDC on ASDEX Upgrade. SinceITER will have as main plasma facing components tungsten and berylliumit is important to investigate this effect further in future.

Chapter 4 4-45
Impurity removal During the JET isotopic exchange experiments (in-cluded in table 4.10) 0.13 monolayers of carbon were removed from the ves-sel. This relatively high removal efficiency can however not be extrapolatedto the removal efficiency of codeposited layers since the carbon source is notknown. To evidence carbon erosion or deposition, samples were inserted inthe TEXTOR ICWC plasmas. However no traces of erosion or depositioncould be found on the plasma exposed areas. This might be due to thereduced plasma density at the location of the level sample holder, whichwas shadowed by a poloidal limiter. On JET it was found that the impurityremoval efficiency improves on increasing the discharge power, and finallyit was evidenced that there is no clear influence of the present energetic CXflux on the removal of impurities (TEXTOR experiments at high and lowBT ).
The removal efficiency of the marker gas argon was tested on TEXTOR.In only seven 5 s H2-ICWC pulses (PRF,gen = 2×50 kW, pH2 = 5·10−4 mbar),25% of the introduced argon by H2/Ar-GDC could be removed. This illus-trates that ICWC reaches a large part of the wall area affected by GDC.
Finally it was illustrated both on TEXTOR (H2-ICWC) and TORESUPRA (He-ICWC) that ICWC can reduce the oxygen content in the vac-uum vessel. Whether this removal efficiency is sufficient to ensure tokamakoperation could not be tested in the course of this PhD. For this ICWChas to be tested as routine conditioning technique during an experimentalcampaign. On TORE SUPRA this could be done in a time efficient mannerbecause of its superconducting toroidal field system. Promising results onthis subject were reported by the KSTAR-team [130]. The superconductingtokamak KSTAR employs He-ICWC routinely for inter-pulse and lunchtimeconditioning, in order to keep the vessel H2O pressure below the operationallimit.


5Kinetic Description of
Hydrogen-Helium ICWC Plasmas
In this chapter the 0D kinetic description of hydrogen-helium plasmas imple-mented in TOMATOR-0D (0D Transport Oriented model for MAgnetizedTOroidal Rf discharges) is outlined. The model is developed to describethe evolution of ICRF plasmas from discharge initiation to the steady stateplasma stage. It allows to study ICRF plasmas in a wide density range,up to ne = 1012 cm−3, and temperature range of Te = 1 − 100 eV. It givesinsight on ICRF plasma parameters, particle fluxes to the walls and maincollisional processes, the latter being the fundamental mechanism for thebuild-up of a plasma. This is of particular importance since most standardtokamak plasma diagnostics (see section B.2) are not adapted to diagnosethe low temperature and low density ICWC plasmas. Together with exper-imental data, the model can thus be used to obtain better understanding ofthe physics behind ICRF plasma production.
5.1 Model description5.1.1 Overview of the balance equationsTo describe numerically in a 0D approach the evolution of ICRF plasmaparameters in tokamaks and stellarators, a set of transport equations, pub-lished previously by Moiseenko and others [84, 91, 132, 133], was adopted.

5-2 Kinetic Description of Hydrogen-Helium ICWC Plasmas
The equations are derived from the standard continuity and heat balancefor simple plasmas, given by Braginskii [134], where all particle species areassumed to have a Maxwellian energy distribution. In the present modelthe transport equations are updated to include molecular hydrogen and he-lium, which is especially of importance for wall conditioning plasmas. The0D plasma description is based on the energy and particle balance equa-tions for nine species: H, H+, H2, H+
2 , H+3 , He, He+, He++ and e−. It
takes into account (1) elementary atomic and molecular collision processes,such as excitation/radiation, ionization, dissociation, recombination, chargeexchange, etc. and elastic collisions, (2) particle losses due to the finite di-mensions of the plasma volume and confinement properties of the magneticconfiguration, and particle recycling, (3) active pumping and gas injection,(4) RF heating of electrons (and protons) and (5) a qualitative descriptionof plasma impurities, as shown in eq. (5.1) and (5.2):
dnpdt =
∑j<k
∑i
εijkpkijknjnk −
npτp
+QS,p −QL,p (5.1)
32
dnpTpdt =
∑j<k
∑i
εijkpEijkpk
ijknjnk +
∑j
Ejpkelj njnp
−32npTpτE,p
+QSE,p −QLE,p + PRF,p (5.2)
where np and Tp are the population density and Maxwellian temperature,kijk is the reaction rate for reaction i between particles of population j andk, Eijkp the corresponding energy change for the involved populations andεijkp accounts the number of lost or gained particles for each population,τp and τE,p are the particle and energy confinement time, QS,p and QL,pare external particle sources and losses (gas injection, pumping and particlerecycling) with corresponding energy sources QSE,p and losses QLE,p, andfinally Ejp is the energy transfer from population j to p due to elasticcollisions, with kel
j the elastic collision reaction rate. Many efforts havebeen put in rendering the 0D description of the hydrogen-helium plasmasas complete as possible, so that the major actors of the conditioning plasmascan be uncovered from the modeling.
The implemented balance equations are thoroughly discussed in the fol-lowing subsections. For the sake of clarity we have chosen, instead of givingthe balance equations as a whole, to separate the different terms of theequations and regroup them according to their relevant physical process.In section 5.1.2 the included elementary collisions are listed with in section5.1.2.3 a description of the included elastic collision processes, in section5.1.3 the included particle confinement times and edge conditions (particle

Chapter 5 5-3
recycling) are outlined, in section 5.1.4 the balance equations for active gasthroughput during RF discharges are explained, in section 5.1.5 the termsfor the coupled RF power are introduced and finally in section 5.1.6 thebalance equation adaptations to include impurities are given. Throughoutthese sections comments will be given on the effect of the different processeson the modeling results. In section 5.2 an overview of modeling results aregiven, including the comparison with experimental data. And finally, a dis-cussion on the benefits and limitations of the 0D model approach is referredto the appendix: section C.1.
5.1.2 Elementary processes in hydrogen-helium plas-mas
In this section all the included atomic and molecular collisions that arerelevant for the model are described. For each reaction, a plot of the collisionrate can be found in appendix C.2, and the collision rate source, expressed in[cm3/s], will be given. The implemented inelastic processes are summarizedin table 5.1. The model does not treat excited states as separate species,but treats them implicitly. Since cross sections are mostly dependent onthe excited state of the involved particle, radiative-collisional (RC) models[135,136] are applied where possible to obtain effective rate coefficients1. Toobtain these effective rate coefficients the population density of the excitedstates were calculated for a range of combinations of electron density (ne)and temperature (Te), whereafter the cross sections of each excited stateare weighted by their population density.
5.1.2.1 Inelastic electron impact reactions
The general formula to determine the reaction rate in electron collisions isgiven by
k or 〈σv〉 =∫fe(ve)σ(ve)ve dve (5.3)
with ve the electron velocity, fe(ve) the normalized velocity distribution ofthe electrons and σ(ve) the velocity dependent cross section. Here the ionor neutral ‘heavy’ particle velocity is neglected with respect to the electronvelocity.
Electron collisions with H, H+ (Table 5.1, 1-3) The effective reactionrates for these collisions are calculated taking into account excited states ofthe hydrogen atom up to n = 5, where n is the principal quantum number.
1Atomic and CX processes via dr. O. Marchuk (IPP-Juelich), molecular hydrogenprocesses via dr. D. Wünderlich (IPP-Garching)

5-4 Kinetic Description of Hydrogen-Helium ICWC Plasmas
The excitation rate coefficients are based on K-matrix calculations [137]and all the values used were compared with recommended close-couplingcalculations [138]. The population of the hydrogen excited states n = 2and n = 3 was found less than 0.5% relative to the ground state at theelectron density of 1012 cm−3. For this reason only the atomic processesinvolving the ground state of the hydrogen atom are of major importancefor the present analysis.
Electron collisions with H2, H+2 and H+
3 (Table 5.1, 4-12) For elec-tron collisions with the hydrogen molecule (reaction 5, 6 and 8) effective ratecoefficient calculations were effectuated based on the Yacora model [135].The RC model for molecular hydrogen includes the ground state and elec-tronically excited states up to the principal quantum number n = 10. Theindividual electronic states are resolved up to n = 3 (e.g. d3Πu). For n > 3this is not the case. The ground state, all states in n = 2 and the statesGK1Σ+
g , I1Πg, e3Σ+u and d3Πu in n = 3 are vibrationally resolved. The
latter are the upper states of transitions in the visible wavelength range fre-quently used for diagnostic purposes. For additional reactions the reactionrates are taken from the Hydhel data file [108].
For excitation reaction (4), multiple final states are possible. The reac-tion rates for the most important reaction paths are given in the Hydheldata file [108] (plot of reaction rates on Fig. C.2). No effective cooling ratefor the electrons in collisions with H2 could be found. Although the differ-ent excited states of H2 are not included explicitly in the model, we includeeach of these separate reactions in the energy balance since their effect onthe energy balance was found to be important. It is realized that this is inprinciple not consistent because the excited particle remains in the groupof H2 and keeps thus contributing to the energy loss of the electrons viaexcitation.
The dissociative attachment reaction (formation of negative ions: e +H2−→H− + H) needs not to be included separately in the model since it isincluded in the collisional radiative model for H2 [135], hence the interestingstructure for the effective dissociation rate (reaction 5) at Tvib = 4500 Kand low electron temperature (Fig. C.3). The dissociative ionization of H+
2(e+H+
2 −→e+H++H++e) is not included since its reaction rate is negligiblecompared to other e + H+
2 reaction paths (k 10−10 cm3/s for Te < 5 eV)
Electron collisions with He, He+ and He++ (Table 5.1, 13-16) Theeffective reaction rates were obtained from the collisional radiative modelNOMAD [136], using the recommended set of atomic data [142]. For He-atoms the singlet and triplet states up to n = 4 (19 states) are considered

Chapter 5 5-5
Table 5.1: Summary of the included elementary inelastic processes in hydrogen-helium plasmas.
Reaction Refer. Fig.Electron collisions with H, H+
1.) Excit. e + H −→ e + H∗ see text C.12.) Ioniz. e + H −→ e + H+ + e see text C.13.) Recomb. e + H+ −→ H + hν see text C.1
Electron collisions with H2, H+2 and H+
34.) Excit. e + H2 −→ e + H∗2 [108] C.25.) Dissoc. e + H2 −→ e + H + H see text C.36.) Ioniz. e + H2 −→ e + H+
2 + e see text C.47.) Dis. ion. e + H2 −→ e + H+ + H + e [108] C.68.) Recomb. e + H+
2 −→ H2 + hν see text C.59.) Dissoc. e + H+
2 −→ e + H+ + H [108] C.610.) Dis. rec. e + H+
2 −→ H + H [108] C.611.) Dis. rec. e + H+
3 −→ H + H + H [108]e + H+
3 −→ H2 + H [108] C.612.) Dissoc. e + H+
3 −→ e + H+ + H + H [108] C.6Electron collisions with He, He+ and He2+
13.) Ioniz. e + He −→ e + He+ + e see text C.714.) Recomb. e + He+ −→ He + hν see text C.715.) Ioniz. e + He+ −→ e + He2+ + e see text C.716.) Recomb. e + He2+ −→ He+ + hν see text C.7
Ion impact reactions17.) Char. ex. H+ + H −→ H + H+ [139] C.918.) Char. ex. H+ + H2 −→ H + H+
2 [108] C.919.) Char. ex. H+
2 + H2 −→ H2 + H+2 [108] C.9
20.) Char. ex. He+ + H −→ He + H+ [139] C.921.) Char. ex. He+ + He −→ He + He+ [108] C.922.) Char. ex. He2+ + H −→ He+ + H+ [140] C.923.) Char. ex. He2+ + He −→ He+ + He+ [141] C.924.) Char. ex. He2+ + He −→ He + He2+ [108] C.925.) Form. H+
3 H+2 + H2 −→ H+
3 + H [108] C.1026.) Excit. H+ + H −→ H+ + H∗ [108] C.1027.) Excit. H+ + H2 −→ H+ + H∗2 [108] C.1028.) Ioniz. H+ + H −→ H+ + H+ + e [108] C.1029.) Ioniz. H+ + He −→ H+ + He+ + e [108] C.1030.) Dis. ion. He+ + H2 −→ He + H+ + H [108] C.10

5-6 Kinetic Description of Hydrogen-Helium ICWC Plasmas
independently and for He+-ions the calculations are extended up to thefirst n = 6 excited states. Electron energy losses for collisions with He,He+ (and He2+), including excitation, ionization and recombination, areimplemented as cooling rates (Fig. C.8), and are approximately independenton the electron density. From radiative collisional theory, the determinationof the correct cooling rate is a difficult matter due to existence of metastablehelium states 1s2s3S and 1s2s1S. The data, calculated based on [142],are in agreement with [143] (also given in the figure), at least for electronenergies higher than 4 eV. At lower electron energies the data of [143] isabout 10 times higher. To avoid rapid full ionization of the plasma at lowRF power and so to better match the experimental data, the [143] data wasused at lower energies (Te < 4 eV). The cooling rates are implemented inthe electron energy balance equation as
Ee = ...−∆EeHe ne nHe −∆EeHe+ ne nHe+ −∆EeHe2+ ne nHe2+ .(5.4)
The He-excitation and He+-excitation reactions, leading only to electronenergy losses are not numbered separately in table 5.1. Recombinationreaction (14) includes both radiative recombination and dielectric recombi-nation.
5.1.2.2 Inelastic ion impact reactions
The included inelastic ion impact reactions are listed in table 5.1 (17-30).The employed general formula to determine the reaction rate in (Maxwellian)particle collisions from the cross section is given by
k(T1, T2) =√
2π
(m∗
kT ∗
)3/2 ∫ ∞0
u3σ(u)e−m∗u2
2kT∗ du (5.5)
with T1 and T2 the Maxwellian temperatures of the interacting particles,u = |−→v1 − −→v2 | is the impact velocity and σ(u) the velocity dependent crosssection [144]. All reaction rates are calculated using the reduced energy T ∗and mass m∗ of the system defined as
T ∗ = T1m2 + T2m1
m1 +m2m∗ = m1m2
m1 +m2. (5.6)
Differences in ionization potential between the colliding particles, e.g. H andHe+, have influence on the cross section of the reaction, which is implicitlytaken into account in the calculation of the effective reaction rate. Thesedifferences are assumed not to interfere with the kinetic energy balance ofthe involved particles: the excited states of the particles are not consideredas separate species in this model and also the electrons are not involved inmost of the following reactions.

Chapter 5 5-7
Inelastic collisions between ions, for example the charge exchange reac-tion H+ + He+ −→ H + He++, can be neglected because of the repulsivecoulomb force. Charge exchange reactions that have no effect on particlebalances (reactions 17, 19, 21 and 24) are included since they are importantfor temperature equalization between ions and atoms or molecules.
Reactions (25-30) give only minor corrections to the final particle den-sities and temperatures and therefore can be switched off in the modelcalculation. The cross sections for these reactions are taken from the Hy-dhel data file [108]. The ionization on proton impact reactions (reaction28 and 29) are included in this document to show that they can safely beneglected in the model for reduced temperatures below 100 eV. For the exci-tation on proton impact reaction (26), only excitation from the ground stateis considered. The reaction rate is negligible for reduced temperatures ofT ∗ < 100 eV. The reaction rate for excitation reaction (27) is considerablyhigh at lower reduced temperatures T ∗ ≈ 1 eV (see Fig. C.10). The energyloss in each collision is however limited (≈ 0.1 eV).
5.1.2.3 Elastic processes
Elastic collisions have a direct effect on the energy balance of the involvedparticles. Indirectly also the particle densities will be affected due to theenergy dependent reaction rate coefficients. Since we require the model topredict the temperature and density of the plasma species in a self consistentmanner, both the elastic Coulomb collisions between the charged particlesand elastic neutral-neutral and ion-neutral collisions are included.
Coulomb collisions Energy transfers through Coulomb collisions be-tween the charged particles are based on the derivation of Sivukhin [145].Here the ‘binary-collision’ approximation is used in which the many bodyinteraction between plasma particles is reduced to an isolated and instan-taneous interaction between a pair of plasma particles. For the interactionpotential a Coulomb potential is used which is cut off at the Debye radius toaccount for the shielding of the localized charge by the plasma as a whole.The latter also allows to tackle divergences that appear in the calculationsfor the mean energy exchange rate, and can be found in the equations be-low as the Coulomb logarithm λ. In the book of Sivukhin first the meanenergy transfer per unit of time from one particle of a first group to allthe particles of a second particle group, having a Maxwellian energy dis-tribution, is considered. Secondly this energy transfer is averaged over theMaxwellian energy distribution of the first group. The resulting averagedenergy transfer Q12
c from population 1 to 2 is proportional to the differenceof the Maxwellian temperatures of the two groups and the Coulomb collision

5-8 Kinetic Description of Hydrogen-Helium ICWC Plasmas
frequency ν12. It is implemented into the energy balance as:
E1 = ...−Q12c = ...− 3/2(T1 − T2)ν12n1 (5.7)
with n1 and T1 the particle density and temperature of the first group. Thecollision frequency (eq. 5.8) depends on the particle density of the secondgroup n2, the temperature T and mass m of the involved particles, and theCoulomb logarithm (eq. 5.9):
ν12 = n283√
2π q4Z21Z
22
λ12
m1 m2 (T1/m1 + T2/m2)1.5 (5.8)
with q, m and T in Gaussian units;
λ12 = 23− log[Z1Z2(m1 +m2)m1 T2 +m2 T1
(Z2
1n1
T1+ Z2
2n2
T2
)0.5](5.9)
with Z the particle charge. For electrons the Coulomb logarithm simplifiesto
λe2 =
23− log(√ne Z T−3/2e ) if Te < 10 Z2 eV
24− log(√ne T−1e ) otherwise.
(5.10)
and the collision frequency to
νe2 = n283√
2π q4Z22
√meλe2
m2 T 1.52
(5.11)
The equivalent reaction rates, obtained by dividing the collision frequencyby n2 is given for electron-ion collisions on Fig. C.11 and for ion-ion collisionson Fig. C.12.
Elastic ion-neutral and neutral-neutral collisions The relevancy ofelastic ion-neutral and neutral-neutral collisions was already shown for fu-sion edge plasmas for temperatures below 10 eV [146–148], and can be il-lustrated by comparing elastic collisions with their mutually related chargeexchange collisions. The relation between the cross section for momen-tum transfer via elastic collisions σmt and charge exchange reactions σcxin homonuclear systems for the low energy region is approximately givenby σmt = 2.21σcx [149]. (The comparison of the energy dependent reac-tion rate figures for momentum transfer collisions (Fig. C.12) and chargeexchange collisions (Fig. C.9) leads to the same conclusion.) The reactionrates for elastic collisions are obtained via eq. (5.5), using cross sectionsfrom [150–152].
The determination of the average energy transfer in ion-neutral andneutral-neutral elastic collisions is a difficult matter. It depends on the

Chapter 5 5-9
interaction potential between the particles for which no simple general for-mula can be defined that is valid for all the elastic collisions that we needto consider in the model. In the references mentioned above multiple crosssections are listed for each reaction: the elastic (or total) cross section Qel,the momentum transfer (diffusion) cross section Qmt and the viscosity crosssection Qvis:
Qel = 2π∫ π
0
∂σel
∂Ω sin(θ)dΩ (5.12)
Qmt = 2π∫ π
0(1− cos(θ))∂σ
el
∂Ω sin(θ)dΩ (5.13)
Qvis = 2π∫ π
0(1− cos2(θ))∂σ
el
∂Ω sin(θ)dΩ (5.14)
where θ is the scattering angle, Ω the solid angle and ∂σel/∂Ω the differ-ential elastic cross section. Not to overestimate the importance of elasticcollisions, we decided for our model to use the momentum transfer crosssection. This cross section is weighted by a factor (1 − cos(θ)) which ac-counts for the fact that when the incident particle is deflected only by asmall angle, the momentum transfer is small, if the deflection is large, themomentum transfer is large as well. The resulting cross section is generallysmaller than the total cross section. The averaged energy transfer fromgroup 1 to 2, Q12
c , is taken similarly as for Coulomb collisions proportionalto the difference of the Maxwellian temperatures of the two groups, and isthus implemented into the energy balance as eq. (5.7).
The implemented collisions are given below. Their collision rates areplotted in Fig. C.13 as a function of the reduced temperature. Elasticcollisions between He and H2 are presently not included in the model.
31.) H++H [150]: For elastic collisions between H2++H, H3
++H and He++H we assume a similar interaction potential and thus approximatelyequal cross section.
32.) H++H2 [150]: The cross sections for elastic collisions between H2++H2
[152] and H3+ + H2 [150,152] are approximately equal to the cross sec-
tion of this reaction (within the error bar). In the model the same crosssection is used for these three reactions. Also for the reaction He+ +H2we assume a similar interaction potential and thus an approximatelyequal cross section.
33.) H+ + He and He+ + He [151]
34.) H + H2 [150]

5-10 Kinetic Description of Hydrogen-Helium ICWC Plasmas
35.) H + He: The cross section for this reaction is an average total crosssection for elastic collisions given in [150]. The momentum transfercross section could not be found.
5.1.3 Particle residence times and edge conditions5.1.3.1 Neutral wall fluxes
To estimate the flux of neutrals (H, H2, He) striking the walls, their meanfree path, thermal velocity and approximate average distance the particlesneed to travel to reach the walls of the toroidal chamber, are required. Forthe latter we take an approximate distance of 2 times the minor radiusa, accounting for the fact that for all lines of sight that have a toroidalcomponent the average distance is larger than a. The mean free path λn ofneutral particle ‘n’ is defined as
λn = vT,n/∑ij
kijn nj (5.15)
where vT,n =√
kbTn(K)mn
=√
eTn(eV)mn
is the thermal velocity and the sumgoes over the different species j in the plasma and over the possible reactionsi between neutral n and particle j. The wall flux, or neutral particle lossterm, is then estimated by defining their effective confinement time
τn = 2avT,n
e2a/λn (5.16)
which is in the 0D approach weighted by the probability that the particleswill travel a distance of 2a without undergoing a collision (e−2a/λn).
The general expressions for the particle and energy balance are
dnndt = ...− nn
τn(5.17)
dEndt = ...− En
τn(5.18)
where we thus consider that the particle confinement time equals the energyconfinement time (see appendix C.3).
5.1.3.2 Ion wall fluxes
The ion wall fluxes are constrained by the magnetic field and were thor-oughly discussed in chapter 3. The charged particle loss mechanisms aresummarized in the following general formula for the ion confinement time:
τp = a
(vDz,p + vDR,p + vBohm,p)e−a/λp + vT,pBz/Bφe−aBφ/Bzλp(5.19)

Chapter 5 5-11
Figure 5.1: Modeled influence of the ion confinement time on plasma parametersfor a partially ionized TEXTOR H2-RF discharge with pH2 = 5 · 10−4 mbar andPRF = 100 kW. Above confinement times of 0.01 s the influence on the plasmadensity is minor. Typical confinement times are ∼ 0.1 s for 3 eV ions.
where a is the minor radius, Bφ and Bz the toroidal and vertical field, λpthe mean free path of the ion, vDz,p is the ‘ ~B ×∇B’ drift velocity, vDR,p isthe radial outward ‘ ~E × ~B’ drift velocity, vBohm,p is the cross field diffusionvelocity and vT,p the thermal velocity. The expressions for the energy andparticle balances are similar as those for the neutrals.
Fig. 5.1 shows the modeled influence of the ion confinement time onTEXTOR plasma parameters. Both the density and temperature are plot-ted for the electrons, H+-ions and H-atoms in a H2-RF discharge withpH2 = 5 · 10−4 mbar and PRF = 100 kW. It is found that ion confinementtimes above 0.1 s have a minor influence on the plasma parameters. Forsmaller confinement times, the electron density will start to decrease lead-ing, in this example, to a 3 times lower electron density in case of τp = 1 ms.At the same time the electron temperature will increase. The typical valuesfor vertical drifts and Bohm diffusion found in chapter 3 make that for par-tially ionized plasmas, the ion confinement time has only a minor influenceon the plasma parameters. However in the plasma edge, the confinementtime is very low due to the unrestricted charged particles transport along the(limited) magnetic field lines, which might explain the high electron tem-peratures measured in the TEXTOR RF plasma edge by Langmuir probes(Fig. 3.17).
5.1.3.3 Electron losses
In the model the electron losses are set to account for charge neutrality inthe plasma. It is sometimes argued that electrons lose their energy fasterthan ions. To account for this, one should include an energy confinement

5-12 Kinetic Description of Hydrogen-Helium ICWC Plasmas
time that is smaller than the particle confinement time: τp,e ≈ χτE,e, withχ > 1. In the model we use χ = 3 based on [84, 91, 153]. When the neutralgas is partially ionized, e.g. 20%, a change of χ from 1 to 3 decreases theplasma density only by 0.5%.
ne = ...− nH+
τH+−nH+
2
τH+2
−nH+
3
τH+3
− nHe+
τHe+− 2nHe2+
τHe2+(5.20)
Ee = ...− χ32Te
(nH+
τH++nH+
2
τH+2
+nH+
3
τH+3
+ nHe+
τHe++ 2nHe2+
τHe2+
)(5.21)
5.1.3.4 Particle recycling
Neutrals, not affected by the magnetic field will be in constant interactionwith the vessel walls. Also charged particles, due to their collective drifts,diffusion across the magnetic field, and transport along the field lines willinteract with the walls. To describe the wall interaction in the model,the exchange of particles between wall and plasma is represented by therecycling coefficient R. From analysis of TEXTOR and TORE SUPRAmass spectroscopy data it is found that particle recycling in ICWC plasmascan be up to R ≥ 0.99 (see section 4.1.3 [154]). The recycling in the modelis assumed to be immediate. The particles that leave the plasma will beimmediately re-injected into the plasma (weighted by recycling coefficientR). To properly add particle recycling in the balance equations the mainPSI mechanisms have been considered. To ensure clear interpretations ofthe modeling results it was decided to simplify these source terms as muchas possible:
1. In an ICWC plasma the high recycling comes partly from reflection ofimpinging particles. The reflection probability depends on the type ofparticle, its energy and incident angle, and the target material. An ex-tensive overview of these dependencies is tabulated in [122]. A selectionis given in tables 5.2-5.5, with RN and RE respectively the particle andenergy reflection coefficient.Table 5.2: Particle and energy re-flection coefficient of H backscat-tered from C
E0 0 8510 RN 0.48 0.97eV RE 0.24 0.84
100 RN 0.28 0.99eV RE 0.12 0.94
Table 5.3: Particle and energy re-flection coefficient of He backscat-tered from C
E0 0 8510 RN 0.41 1.0eV RE 0.95 0.96
100 RN 0.15 1.0eV RE 0.33 0.98

Chapter 5 5-13
Table 5.4: Particle and energy re-flection coefficient of H backscat-tered from W
E0 0 8510 RN 0.76 0.98eV RE 0.56 0.92
100 RN 0.63 0.99eV RE 0.41 0.97
Table 5.5: Particle and energy re-flection coefficient of He backscat-tered from W
E0 0 8510 RN 0.81 1.0eV RE 0.60 0.99
100 RN 0.64 1.0eV RE 0.41 0.99
2. The wall surfaces in a tokamak contain large amounts of hydrogen. Onhigh hydrogen concentrations, the formation of neutral molecules by thecollision of low energy (plasma) hydrogen neutrals or ions with hydro-gen atoms weakly bounded on the wall surface can become dominant asexplained by Rutigliano [155]. The recombination probability is espe-cially high for incident particles with energies between 0.05 and 1.5 eV(60% at 500 K on graphite), and increases on decreasing wall tempera-ture. The geometrical probability for picking up a particle is not neg-ligible; for a homogeneous hydrogen atom wall flux of Φ = 1020 H/m2s(rH ≈ 0.1 nm) the whole wall area can be touched by the impingingparticles every 1/(Φπr2
H) = 0.3 s.
3. A third part of the recycling flux comes from the release of stored hydro-gen. Unlike reflection, desorption occurs with a time delay with respectto the particle impact. This time delay is determined by for examplethe penetration depth of the particle, the wall diffusion coefficient andbulk or surface recombination coefficient [38]. From the wall reservoirmodel (see chapter 6) we will learn that the characteristic time for par-ticle release is of the order of 1 − 3 s. This characteristic time is notincluded in the balance equations of the model. All particles that areabsorbed by the wall are in the model immediately released again asa neutral molecules (H2), or atoms (He). The energy of these releasedneutral particles part will generally have a Maxwell-Boltzmann velocitydistribution determined by the temperature of the wall materials [156].
The above considerations led to the determination of the implementededge conditions. In the balance equations for neutral He and H2 (THe, TH2 <
10 eV), the particle and energy reflection coefficient are set equal to one, inclose agreement with [122, 156]. (An energy reflection coefficient smallerthan one will lower the final gas temperature and set a minor variation inthe final plasma density.) Hydrogen atoms and ions in interaction with the

5-14 Kinetic Description of Hydrogen-Helium ICWC Plasmas
wall either pick up a bounded H-atom on the wall surface to form directlyH2 [155], or either penetrate into the wall to be desorbed later as H2. Alsothe helium ions are neutralized by the wall and released with an energyequal to the wall temperature. The ions H+
2 and H+3 , having generally very
low densities, are recycled as H2. The implemented edge conditions appearas source terms in particle (QS,p, eq. (5.1)) and energy (QSE,p, eq. (5.2))balance. The implemented source terms can be summarized by followingequations:
nH2 = ...+RH2
(12nH
τH+ 1
2nH+
τH++nH+
2
τH+2
+ 32nH+
3
τH+3
)(5.22)
EH2 = ...+RH2
32Twall
(12nH
τH+ 1
2nH+
τH++nH+
2
τH+2
+ 32nH+
3
τH+3
)(5.23)
nHe = ...+RHe
(nHe+
τHe++ nHe2+
τHe2+
)(5.24)
EHe = ...+RHe32Twall
(nHe+
τHe++ nHe2+
τHe2+
)(5.25)
5.1.4 Gas injection and active pumpingFor the injection of gas into the vessel we distinguish two regimes: feedbackand feed forward gas injection. Both regimes can be studied in the frame ofthe 0D model. In feedback gas injection, the injection is regulated to keepthe total pressure in the vessel constant. A pressure drop due to ionizationwill be compensated by extra injection of gas. Similarly, losses to wall(R < 1) will also be compensated by extra injection and, when the wallhas a net release rate, the gas injection rate will be lowered. In the feedforward gas injection scheme, the injection rate is pre-programmed. In thisregime, in the absence of a plasma, the removal rate by the pumps will beequal to the injection rate. Due to the pressure drop by ionization, theremoval rate by the pumps (∝ pS) will be lower. This effect, combined withthe constant injection will give rise to an accumulation of particles in thevessel. Eventual losses to the walls will not be compensated by extra gasinjection.
The model includes both the feed forward and feedback gas injectionoption, and can be ran with or without active gas throughput. Terms forthe removal rate of particles by the pumps and the injection rate appear inthe particle balance as (QS and QL in eq. (5.1))
nH2 = ...+QH2,valve − nH2SH2/Vpl (5.26)nHe = ...+QHe,valve − nHeSHe/Vpl (5.27)

Chapter 5 5-15
with Qvalve the gas injection rate [cm−3s−1], S the pumping speed [cm3s−1]and Vpl the vessel volume [cm3]. In feedback regime the source term Qvalveis changed proportional to the difference between set value and actual pres-sure. A gain factor is included representing the response time of the feedbackcontrol, τr.
QH2,valve(t) = nH2,set − nH2(t)τr
(5.28)
The same terms come back in the energy balance, included in QSE,p andQLE,p in eq. (5.2):
EH2 = ...+ 3/2QH2,valveTH2,valve − EH2SH2/Vpl (5.29)EHe = ...+ 3/2QHe,valveTHe,valve − EHeSHe/Vpl (5.30)
where Tvalve is the temperature of the injected gas [eV].
5.1.5 Coupled power5.1.5.1 RF power coupling
TOMCAT simulations show that the RF power coupled from the ICRFantenna to the RF plasma is absorbed mainly collisionally by electrons(typically x ≈ 75 − 90%) [157]. Most of the remaining fraction (1 − x) iscoupled to ions by collisional absorption. The electrons, accelerated by theparallel electric RF field, absorb RF power either due to collisional damping(collisions with neutrals and ions), which is the typical damping mechanismin low Te ICWC plasmas, or due to collision-free Landau damping which isless probable but still a possible damping mechanism, especially in warm(several tens eV) ICWC plasmas like in JET [127]. Non-resonant ions ab-sorb energy mostly non-directly via collisions with the electrons. Resonantions absorb energy directly from the RF field due to cyclotron absorption(collision free damping). The coupling of RF power PRF is included in themodel by adding a coupled power density PRF/Vpl to the energy balanceequations of the electrons (xPRF/Vpl) and protons ((1− x)PRF/Vpl):
dEedt = ...+ x
PRF
Vpl(5.31)
dEH+
dt = ...+ (1− x)PRF
Vpl(5.32)
where PRF is the power coupled to the plasma, x is the fraction of thispower which is coupled to the electrons and Vpl is the plasma volume.
Fig. 5.2 shows modeled plasma densities and Maxwellian energies for aTORE SUPRA hydrogen ICWC plasma, pH2 = 5 · 10−4 mbar and PRF =

5-16 Kinetic Description of Hydrogen-Helium ICWC Plasmas
Figure 5.2: Modeled plasma densities (top) and Maxwellian energies (bottom)for a TORE SUPRA hydrogen ICWC plasma, pH2 = 5 · 10−4 mbar, BT = 3.8 Tand PRF = 100 kW. The electron density decreases when the fraction of coupledpower to the electron decreases while the ion temperature increases.
100 kW. The figure shows clearly that the electron density decreases whenthe fraction of coupled power to the electron decreases. This can be under-stood from the fact that electron impact ionization reactions are much moreefficient than ionization on proton impact. Likewise the generally lower col-lisionality of the ions allow them to reach Maxwellian temperatures higherthan 10 eV on increasing coupled power fraction (1− x > 0.5). Higher ionenergies might increase the wall conditioning efficiency of RF discharges.In the present understanding of ICWC discharges it is stated that most ofthe ICRF power is coupled to the electrons. In further modeling results weassumed x = 1.
5.1.5.2 Breakdown phase and α-scaling
Before plasma breakdown, electrons will move quasi freely around the torus,accelerated and decelerated by the antenna electric field. The RF-powerthat is coupled in this situation is proportional to the electron density. Aftera certain degree of ionization the maximum RF power will be coupled. Tosimulate plasma breakdown with the 0D model the coupled power is likewiseset proportional to the electron density in the initial plasma phase. Thenominal RF power will only be partially coupled when the electron densityis low compared to the neutral density. For this the α-scaling, previouslyadopted by Moiseensko [132] and successfully used in the 0D model version

Chapter 5 5-17
Figure 5.3: Total electron cooling rate for electron collisions with H, He, C andO as a function of the electron temperature, Te ( [143] = [INDC1995])
for atomic hydrogen [91,95], was expanded for hydrogen-helium plasmas:
PRF,coup =PRF,maxfα/α if fα < α
PRF,max if fα ≥ α, (5.33)
where fα = nene + nH + nH2 + nHe
.
Above a degree of ionization represented by α, the total RF power will becoupled.
To compare modeled breakdown times with experimental data it is im-portant to define the breakdown moment mathematically. Several hypoth-esis exist [158]: it is considered that the transition from single ionizationevent to an avalanche (gas breakdown moment) is related to strongly de-veloped electron-ion collisions. Therefore the following definitions for gasbreakdown are formulated as the moment when (1) the electron energylosses between ionization reactions and electron-ion collisions become equalor (2) when the frequencies for these reactions become equal. In case ofthe simulation shown at the end of this chapter (Fig. 5.14), both definitionsresult in the same breakdown time.
5.1.6 ImpuritiesImpurities in wall conditioning plasmas, either liberated by plasma wallinteractions or from background neutral pressure in the vacuum vessel,strongly affect the plasma parameters. Fig. 5.3 shows electron cooling rateson neutral hydrogen, helium, carbon and oxygen as a function of the elec-tron temperature, for a plasma with an electron density of ne = 1011 cm−3,illustrating the importance of impurities. To obtain the actual energy loss

5-18 Kinetic Description of Hydrogen-Helium ICWC Plasmas
per unit density one has to multiply with the density of the involved atom.The electron cooling rate on carbon is two orders of magnitude higher thanthat of hydrogen, and almost three orders of magnitude than that of helium.The contributions of hydrogen and carbon to the total electron cooling ina low temperature hydrogen plasma (< 10 eV) with 1% carbon impuritiesare thus of the same order of magnitude. In conditioning plasmas on ma-chines with carbon facing components one expects mainly hydrocarbons,carbonoxides, and water as impurities. Not only neutral impurities playa role, also their ions. Table 5.6 gives ionization potentials of H2O, CH4and CO in comparison with the ionization potentials of H, H2 and He, il-lustrating that also the presence of impurity ions in hydrogen-helium wallconditioning plasmas can not be neglected.
Table 5.6: Ionization potentials for relevant hydrogen-helium wall conditioningplasma species [159].
C H2O H O11.26 eV 12.61 eV 13.60 eV 13.62 eV
CO CH4 H2 He14.01 eV 14.25 eV 15.37 eV 24.59 eV
A proper consideration of the plasma impurities requires including par-ticle and energy balance equations, containing elementary collisions, elasticcollisions, particle residence times, edge conditions and pumping of neutralmolecules, for all the relevant impurity species and their ions. To enable aqualitative analysis on the effect of impurities, the 0D model includes threeextra particle balance equations, one for atomic carbon and two for its ion-ized states C+ and C2+. The energy balance for the carbon species is notincluded. The electron energy balance is completed with cooling rates in-cluding excitation, ionization and recombination of carbon atoms and ions,in the same manner as was done for helium (eq. 5.4). Fig. C.14 showsthe implemented electron cooling rates on carbon atoms and ions, obtainedfrom [143]. Also electron-ion Coulomb collisions are included in the elec-tron energy balance equation. The electron particle balance is completedwith carbon ionization reactions, that contribute to the electron density.Fig. C.15 shows the implemented electron impact ionization rates for C andC+, obtained from [151]. The actual production rate for carbon ions is how-ever estimated to be lower than the given atomic carbon ionization rate. Inthe initial plasma phase, carbon will not be present as atoms, but rather asmolecules due to its chemical reactiveness. For this same reason the elec-tron cooling rate is estimated to be higher due to the existence of numerousmolecular excitational states and to molecule dissociation energies. Finally,

Chapter 5 5-19
Figure 5.4: CO and CH4 partial pressures from mass spectrometry for 4 subse-quent H2-ICWC discharges (RF pulse from 2 to 7 s) in TEXTOR with feedbackhydrogen pressure of pH2 = 5 · 10−4 mbar and PRF ∼ 60 kW.
the impurity ion confinement time is set to a constant value in accordancewith [85].
Modeling results show indeed that even small amounts of impurities canhave a large influence on the final electron density. For example a carbonimpurity content of 1% of the total hydrogen pressure in a TEXTOR dis-charge of pH2 = 5 ·10−4 mbar and PRF = 100 kW (Fig. 5.2, x = 1) decreasesthe final electron density at least by a factor 2. Impurity contents of 1% areeasily obtainable on TEXTOR. Fig. 5.4 shows CO and CH4 partial pressuresfor four subsequent H2-ICWC discharges in TEXTOR with feedback hydro-gen pressure of pH2 = 5 · 10−4 mbar and PRF ∼ 60 kW. According to themass spectrometry data, and in accordance to baratron pressure data, thereis a background CO pressure of approximately 4% of the feedback pressure.During the RF discharge (RF discharge initiation at 2 s, discharge endingat 7 s) the CH4 partial pressure increases to approximately 2% of the feed-back pressure. To be able to reproduce RF plasma parameters the plasmaimpurity content has to be known and their elementary collisions have tobe accurately described in the balance equations. Unfortunately it is oftendifficult to estimate the exact impurity content and even the elementarycollision data of molecules such as H2O, CH4 and CO is scarce. Never-theless in the next section on modeling results we will show that the 0Dmodel with carbon impurities is able to reproduce, at least qualitatively,the experimental data.
It is important to mention that ITER will not be a carbon machine.

5-20 Kinetic Description of Hydrogen-Helium ICWC Plasmas
Figure 5.5: Plasma parameters as a function of elementary collisions: a) den-sities, b) temperatures; 1) electron collisions only, 2) + electron-ion Coulombcollisions, 3) + ion-ion Coulomb collisions, 4) + charge exchange, 5) + elasticcollisions, 6) + additional heavy particle collisions.
5.2 Modeling results5.2.1 Discussion on elementary reactionsHere we illustrate for a typical TORE SUPRA hydrogen ICWC plasma(PRF = 100 kW, BT = 3.8 T, BV = 0 T, pH2 = 1.8 · 10−4 mbar, x = 1)the influence on the plasma parameters of the different groups of particlecollisions. The code was run six times with the same input values, whileadding on each run an elementary collision group:
1. Only electron impact reactions
2. + electron-ion Coulomb collisions
3. + ion-ion Coulomb collisions
4. + charge exchange
5. + elastic ion-neutral and neutral-neutral collisions
6. + additional heavy particle collisions
The summary of the plasma parameters is given in Fig. 5.5. In case onlyelectron collisions are considered (1) the equilibrium electron temperatureis ∼ 2 eV, the H-atom temperature is 3 eV as a result of the average energy

Chapter 5 5-21
obtained on the dissociation of H2 [160], the H+-ion temperature is approx-imately equal to TH due to the ionization of the atoms. All other particleswill have the background energy (0.035-0.1 eV) since no energy transport tothem is included in the first calculation. For this same reason the ionizationdegree is quite high (32%) since all the coupled RF power can be used forexcitation and ionization on electron impact.
On inclusion of electron-ion coulomb collisions (2) it is clear that theH+-ions have transferred their excess energy to the electrons leading toenergy equalization. The extra electron energy results in a slightly higherionization degree (ne increases by 15%).
On inclusion of ion-ion coulomb collisions (3) the H+2 -ions gain energy.
H+2 -ions have short lifetimes which makes that the energy equalization is not
complete. The transfer of energy to the H+2 -ions does not change the final
electron density or temperature much, due to their small concentration.On inclusion of charge exchange reactions (4) we see that the neutral H-
atom and H+-ion temperature approach each other. The higher ion temper-ature (TH+) increases simultaneously the electron temperature via Coulombcollisions. The concentration of H+
2 -ions increases significantly due to thecharge exchange reaction of H+ and H2, of which the reaction rate at theinvolved temperatures is higher than that of the ionization of H2 and H,and approximately equal to the dissociation of H2. This charge exchangereaction has as additional consequence that the ionization degree is clearlylower: the formation of H+-ions by ionization on electron impact, and theloss of H+-ions via charge exchange with H2-molecules are strongly com-peting processes. The formed H+
2 ions have as most important reactiondissociation into H+ and H, which will happen almost instantly due to itshigh reaction rate. Whereas in result (3) the H+-ion could be considered asa final state, on inclusion of CX reactions, a H+ ion will very likely producetwo H-atoms and one other H+-ion in the subsequent CX reaction with H2and dissociation of H+
2 . As a result, which can be seen in the graph, the neu-tral H density increases slightly. Finally, since neutral atoms have smallerconfinement times than ions, and as they will recombine to molecules at thevessel walls, the concentration of H2 increases also.
On inclusion of elastic ion-neutral and neutral-neutral collisions (5) wesee that all particle energies approach each other. Since we set the wallenergy reflection coefficient of H2 equal to one, the molecules are able toobtain energy in elastic collisions with H-atoms and H+-ions. In turn alsothe H+
2 -ions obtain extra kinetic energy, either directly by elastic collisions,or as a consequent of CX or ionization reactions. The energy changes makethe ionization degree decrease by 15%.

5-22 Kinetic Description of Hydrogen-Helium ICWC Plasmas
On inclusion of additional heavy particle collisions (6) we see as majorchange the presence of H+
3 -ions which are created by collision of H+2 and
H2.
5.2.2 Plasma characteristics as a function of the elec-tron temperature
Plots of plasma parameters as a function of the electron temperature areespecially interesting since they allow to understand, independently of thepressure and input power, the role of the electron temperature. In an equi-librium situation for pure gases, the plasma parameters can be brought backto the electron temperature. In case of gas mixtures, there will be a clearinfluence of the mixture on the plasma parameters, especially in the tem-perature range where the plasma is partially ionized. Below we will discussion fraction data for a pure hydrogen plasma, a pure helium plasma, and a50/50 H2/He plasma. The analysis is done for a perfectly confined plasma(τion = 1000 s).
5.2.2.1 Pure hydrogen plasma
Fig. 5.6 (left, full lines) gives the hydrogen ion fractions as a function ofthe electron temperature. To obtain sufficient ionization, the electron tem-perature needs to be above 2 eV. The transition from no ionization to fullionization happens completely in the electron temperature range of 2 to2.8 eV. Steady state electron temperatures between these values can keeppartially ionized plasmas. The presence of H+
2 and H+3 is important below
2.7 eV. In this example considering a perfectly confined plasma the H+3 den-
sity is almost equal to the electron density. In partially ionized plasmas thepresence of H atoms is significant (∼ 10% of ne). In fully ionized plasmas,the presence of H atoms is more important than H2 molecules, and boththeir concentrations decrease on increasing electron energy. The ratio of Hions and atoms is found to be in agreement with [161].
On taking into account the confinement properties of the plasma, the fullionization threshold temperature will shift to slightly higher values. Sinceions and atoms are recycled as neutral molecules, the presence of neutralsat high temperatures will be more important in the case of the real ionconfinement.
5.2.2.2 Pure helium plasma
Fig. 5.6 (right, full lines) gives the helium ion fractions as a function of theelectron temperature. From electron temperatures of 2.2 eV on, the plasmaattains a significant degree of ionization. The transition from no ionization

Chapter 5 5-23
Figure 5.6: Ion fractions as a function of the electron temperature (Te). Left:pure H2 plasma (full lines) and 50/50 He/H2 plasma (dashed, only electron den-sity). Right: Pure He plasma (full lines) and 50/50 He/H2 plasma (dashed).
to full ionization happens in the electron temperature range from 2 to 3 eV.Like for hydrogen, steady state electron temperatures between these twovalues can keep partially ionized plasmas. An ionization degree of 50% isobtained at an electron temperature of ≈ 2.4 eV. A second transition, fromthe single ionized state to double ionized state, happens in the electron tem-perature range of 4 to 10 eV where, as the electron temperature increases,the electron density increases likewise. A simultaneous presence of He andHe2+ appears negligible: the maximum simultaneous presence of both dou-ble ionized helium and neutral helium is at Te = 4.2 eV and will only make≈ 0.25% each of the He+ concentration. The modeled ion fractions arefound to be in agreement with [161].
Similar as for the hydrogen case, by taking into account the confinementproperties of the plasma, the full single ionization and double ionizationthreshold temperatures will shift to slightly higher values. Since ions arerecycled as neutrals, the presence of neutrals at high temperatures will bemore important when we take into account the real ion confinement.
5.2.2.3 Hydrogen-helium mixtures
On Fig. 5.6 also the electron density (resp. normalized to the initial hydrogenand helium density) and ion fractions (only for helium, right figure) for aneutral gas mixture of 50/50 H2/He (dashed line) is plotted as a function ofthe electron temperature. The increased electron density in the temperaturerange of 2.1 to 2.5 eV due to ionized helium results in additional ionizationof hydrogen. Consequently the full ionization state of hydrogen is reachedsomewhat earlier. On the other hand, the full ionization state of helium is

5-24 Kinetic Description of Hydrogen-Helium ICWC Plasmas
Figure 5.7: Modeled and experimental TEXTOR ICRF plasma densities as afunction of the coupled RF power to the electrons (feed back controlled pressures,BT = 2.3 T, BV = 0.04 T).
reached later than for a pure helium plasma.
5.2.3 Plasma characteristics as a function of the dis-charge pressure, coupled power and H2/He gasmixture
To benchmark the 0D model a comparison follows between model results,using experimental partial pressures and coupled RF power as model in-puts, with experimental electron density data obtained from interferometrymeasurements. Once the density is modeled, additional information on theparticle energies and principle wall bombarding particle fluxes can be ob-tained. We will discuss TEXTOR H2-ICWC discharge densities as functionof RF power and pressure, TORE SUPRA He-ICWC discharge densities asfunction of RF power and TEXTOR H2/He-ICWC discharge densities asfunction of the gas mixture.
5.2.3.1 TEXTOR H2-ICWC discharges
Fig. 5.7 shows modeled and experimental TEXTOR ICRF plasma densitiesas a function of the coupled RF power to the electrons. The plots containexperimental data for RF discharges with a toroidal magnetic field of BT =2.3 T and vertical field of BV = 0.04 T. The pressure during these dischargeswas feedback controlled at pH2 = 5 · 10−4 mbar or pH2 = 1 · 10−4 mbar. At apressure of pH2 = 5 ·10−4 mbar the measured electron density is of the orderof ne = 4 · 1010 cm−3 (PRF = 50 kW). For the same pressure and power,in absence of impurities, the 0D model predicts a ICWC plasma densityof ne = 2.5 · 1011 cm−3. To match the experimental data the impurity

Chapter 5 5-25
Figure 5.8: Modeled and experimental TEXTOR ICRF plasma densities as afunction of the coupled RF power per particle (PRF/pH2V ) (feed back controlledpressures, BT = 2.3 T, BV = 0.04 T).
content of the discharge was set to 1.5% for the high pressure case and7.5% for the 5 times lower feedback pressure case (same absolute impuritycontent). These high impurity concentrations are realistic on TEXTOR,considering the evidenced high background CO pressure and increasing CH4pressure during the discharge (Fig. 5.4). The figure shows clearly that thedensity increases with increasing power. For the high pressure case onecan recognize a linear trend, which could be reproduced by the 0D modelqualitatively. Fig. 5.8 contains the same density data plotted as functionof the power per particle, here defined as the coupled RF power divided bythe neutral pressure and the plasma volume. A second order polynomialfit shows an apparent tendency for the density as a function of the coupledpower per particle, which is independent of the discharge pressure. A similartendency could be reproduced with the 0D model in absence of impurities,however the predicted density in this case is too high. On inclusion ofimpurities the densities can be brought in the range of the experimentaldata, however the density dependency on the power per particle could notbe found back in this case, as is clear from the figure, which might indicatethat a more accurate description of the plasma impurities is required.
Fig. 5.9 shows the modeled neutral and ion fluxes to the wall as a functionof the coupled RF power, for both the high pressure case and low pressurecase. For the high pressure case the ion flux is negligible compared tothe neutral atom flux. On decreasing the feedback pressure to pH2 = 1 ·10−4 mbar, the neutral wall flux becomes comparable to the ion wall flux.The neutral flux has decreased due to the smaller mean free path of theneutrals (higher electron density), and the lower neutral hydrogen pressure.The ions on the other hand will have a larger mean free path, due to their

5-26 Kinetic Description of Hydrogen-Helium ICWC Plasmas
Figure 5.9: Modeled neutral and ion fluxes to the wall as a function of thecoupled RF power, for the TEXTOR H2-ICWC discharges given in Fig. 5.7.
lower collisionality in the low pressure plasma, which significantly increasesthe number of particles reaching the vessel walls via transport along themagnetic field lines. The predicted temperature of these ions is in caseof a partially ionized plasma around 2 to 3 eV. This temperature is notnecessarily the impact energy on the wall since sheath effects can increasethe energy significantly. The ion wall flux consists mainly of H+. Boththe neutral H and H+ flux increase close to linear with the coupled RFpower. When the plasma becomes fully ionized the neutral flux will dropto zero, while the ion flux will increase drastically. The energy of the wallbombarding neutrals is about 3 eV, equal to the assigned average energy tothe atoms on dissociation of hydrogen molecules. To obtain high ion fluxesto the wall one should aim at high RF powers, or low neutral gas pressures(high P/N , see JET result Fig. 4.16).
The modeled neutral flux is in the range of the neutral flux that waspredicted from partial H2, HD and D2 pressures, gas injection data andmachine pumping speeds on TEXTOR (see table 4.8). Also on TEXTORthe charged particle flux on a toroidal limiter blade, with a 0.5 m2 surface,was measured. For a grounded ALT limiter, the measured ion current was9.3 · 1017 ± 1.3 · 1017 /m2s in case of hydrogen feedback pressure pH2 =5 · 10−4 mbar and 16.5 · 1017 ± 0.5 · 1017 /m2s for pH2 = 1 · 10−4 mbar, bothfor a coupled RF power of PRF ≈ 100 kW. The predicted ion flux in thelow pressure case is too high by a factor 4, and the predicted ion flux in thehigh pressure case is one order of magnitude too low.
Fig. 5.10 shows the pumping probability (1 − f), with f the ionizationprobability, of neutral H2 as a function of the electron density. The ioniza-tion probability is the probability that a neutral molecule will be ionizedor dissociated instead of pumped out of the machine [85]. The evacuation

Chapter 5 5-27
Figure 5.10: Pumping probability (1 − f) of neutral H2 as a function of theelectron density for TEXTOR discharges.
of wall desorbed particles is very inefficient in a plasma with high ioniza-tion probability. From the figure it is clear that the pumping probabilityof H2 for typical ICWC plasma densities of order ne ≈ 1011 cm−3 is verylow, in the range of 0.1%. Experimentally these low values are confirmed(see section 4.1.1.2). To optimize the conditioning efficiency it is clear thata compromise has to be sought between the high wall fluxes on one side(neutrals: high power, high pressure; ions: high power, low pressure) andthe reionization probability on the other. An alternative solution is to op-erate the discharges in pulsed mode: ∼ 1 s discharges followed by sufficientpumping time (order of a few times the characteristic pumping time, seesection 4.1.4).
5.2.3.2 TORE SUPRA He-ICWC discharges
Fig. 5.11 shows both experimental and modeled helium plasma densities asa function of the coupled power for TORE SUPRA He-ICWC dischargesat pressure pHe = 1.8 · 10−4 mbar, BT = 3.8 T and BV = 0 T. The neu-tral hydrogen content during these discharges stemming from plasma wallinteraction is set constant to pH2 = 8 · 10−6 mbar (implemented in thecalculation as a feedback controlled particle source) in accordance with ex-perimental partial pressures. To match the experimental data a reasonableimpurity content of 0.35% is added to the neutral pressure (the impuritycontent during TORE SUPRA ICWC discharges is found to be much lowerthan on TEXTOR). A helium plasma has generally a higher plasma density(ne ≈ 4 · 1011 cm−3) than a hydrogen plasma (ne ≈ 4 · 1010 cm−3) for thesame coupled power at a given pressure. The density in He-plasmas is linearwith the coupled RF power. Fig. 5.12 shows the modeled particle fluxes tothe wall as a function of the coupled RF power. As in case of pure hydrogen

5-28 Kinetic Description of Hydrogen-Helium ICWC Plasmas
Figure 5.11: Experimental and modeled helium plasma densities as a functionof the coupled power for TORE SUPRA He-ICWC discharges at pressure pHe =1.8 ·10−4 mbar, pH2 = 8 ·10−6 mbar (stemming from wall interaction), BT = 3.8 Tand BV = 0 T.
Figure 5.12: Modeled particle fluxes to the wall as a function of the coupled RFpower, for the TORE SUPRA He-ICWC discharges given in Fig. 5.11.
discharges, also in helium RF discharges the fluxes increase with power andwith density (and also the conditioning efficiency as shown on Fig. 4.20).Interestingly it is found that the main wall bombarding species are neutralH-atoms. The He+-ion flux is approximately equal to the H+-ion flux. The0D model reveals thus clearly that in case of helium wall conditioning dis-charges, the wall released hydrogen particles will largely contribute to thewall bombarding flux. For the typical low temperature ICWC plasmas, thepresence and wall flux of double ionized He2+-ions is negligible.
5.2.3.3 TEXTOR H2/He-ICWC discharges
Fig. 5.13 shows the influence of the neutral gas mixture on the electrondensity for a series of TEXTOR discharges with constant helium injection

Chapter 5 5-29
Figure 5.13: Influence of the neutral gas mixture on the electron density for a se-ries of TEXTOR discharges with constant helium injection and feedback hydrogeninjection (ptot = 5 ·10−4 mbar). The RF coupling efficiency increases linearly withincreasing helium concentration. The plasma density shows a discontinuous in-crease around He/H2-concentrations ≈ 50/50 which is presently not reproduciblewith the 0D model.
and feedback hydrogen injection (ptot = 5 · 10−4 mbar). For a helium con-centration below 50% the electron density is as in previous examples lowerthan 1017 m−3 (HCN interferometer density, blue rectangles). On higher he-lium concentrations the electron density increases abruptly to values around(3.5 − 5.5) · 1017 m−3. On the right axis, the coupled power during thesedischarges is given. Except for two discharge with a helium concentrationof 50 − 55%, the coupled power (green dots) in the discharges increasesmonotonically with the helium concentration, although the RF generatorpower was kept constant for all discharges, which means that the RF cou-pling efficiency increases with increasing helium concentration. From RFphysics point of view one would expect that the coupling efficiency is firstlydependent on the electron density rather than on the gas mixture. Sincethe coupling efficiency doesn’t show the same discontinuity as the plasmadensity, it is expected that the increase of density is due to collisional pro-cesses. On the figure also modeled densities are given (blue triangles). Thedensities are modeled by adjusting the input coupled power proportional tothe gas mixture, according to the experimental coupled powers. The modelinput powers are given by the green rectangles. The hydrogen injection inthe modeling is like in the experiment controlled to keep the total pressureconstant, while the helium injection is kept continuously constant. In ac-cordance with previous TEXTOR example, the impurity concentration isset to 1.5% of the total pressure. It is clear from the figure that the model

5-30 Kinetic Description of Hydrogen-Helium ICWC Plasmas
Figure 5.14: TORE SUPRA H2-ICWC discharge (PRF,gen = 75 kW, pH2 =1.3 · 10−4 mbar). Right, top to bottom: exp. and modeled (red lines) hydrogenpressure, forward minus reflected power and coupled RF power, and plasma den-sity. Left: Modeled particle wall flux, sources (injection and wall recycled) andretention rate.
is able to reproduce the density in case of a hydrogen like plasma (heliumconcentration lower than 50%). However it does not reproduce the suddendensity increase observed on higher helium concentration. The non-perfectdescription of plasma impurities in the model is thought to lie at the originof this, but in this stage of the model also the influence of RF couplingproperties can’t be ruled out. It should therefore be envisaged to upgradethe 0D model to include a RF power coupling module based on full wavecode TOMCAT, which should preferentially be done in a 1D context.
5.2.4 Time dependent simulation of a TORE SUPRAH2-ICWC discharge
Fig. 5.14 (left) shows modeling results (red lines) for a TORE SUPRA H2-ICWC discharge with PRF,gen = 75 kW and pH2 = 1.3 · 10−4 mbar. Theemployed model inputs are the neutral gas injection rate (constant duringthe whole discharge), the impurity content (0.8% of the neutral pressure be-fore breakdown), the vessel volume and pumping speed, the wall recyclingcoefficient R and the maximum coupled RF power. The hydrogen pressure(baratron), coupled RF power and plasma density (averaged over five cen-tral vertical DCN interferometry lines, ∼ 1 m) are plotted separately. Twomain phases can be distinguished from the figure. During the breakdownphase (0 − 1.2 s), the neutral pressure remains unchanged and the plasmadensity is out of measurement range although the RF antenna is powered,until a sudden increase of the plasma density and RF coupling efficiency is

Chapter 5 5-31
noticeable together with a drop in pressure. Electron collisional processes,well described in the model, are the fundamental mechanism for the build-upof the ICRF plasma. The plasma breakdown moment is generally indicatedby a sudden drop in antenna voltage (not shown on the figure). During theplasma phase (> 1.2 s) the density remains practically unchanged aroundne = 1.3 · 1017 m−3. The electron, hydrogen atom and hydrogen ion tem-peratures during the steady state phase equal Te = 3.5 eV, TH = 3.7 eV andTH+ = 3.0 eV, respectively.
The hydrogen RF plasma was simulated using α = 0.044. The suddencoupled power increase during plasma breakdown obtained from the antennaresistance is reproduced by the 0D model. The simultaneous pressure dropis mainly due to the consumption of particles by the walls. Upon dischargeinitiation a transient storage of particles is observed, governed by a lowrecycling coefficient of R = 0.92. An equilibrium between the particle fluxto the wall and the wall release rate is reached rapidly, resulting in a muchhigher recycling coefficient during the plasma phase R = 0.984, which isabout 1% lower as found in section 4.1.3, table 4.8. The latter recyclingcoefficient is calculated from the modeling results by comparing the particlefluxes to the wall with the required hydrogen source (injection and wallrelease) to obtain the steady state pressure of pH2 ≈ 5 · 10−6 mbar after theplasma breakdown.
Fig. 5.14 (right) summarizes the particle fluxes to the walls (mainly Hand H+, resp. blue and green lines), the injection rate of hydrogen molecules(normalized to wall surface and number of atoms, red line), the removal rateof hydrogen molecules by the pumps (cyan line), and the retention rate ofhydrogen into the wall (purple line). Before plasma breakdown, the hydro-gen evacuation rate by the machine pumps equals the gas injection rate,leading to a stable vessel pressure of pH2 = 1.3 · 10−4 mbar. At the plasmabreakdown moment (t ≈ 1.2 s) the atomic hydrogen wall flux peaks to avalue of the order of ΦH ≈ 1020 /m2s, whereafter due to the decreasingpressure the atom flux decreases to ∼ 1.8 · 1019 /m2s. These modeled val-ues are in agreement with estimated total wall fluxes from particle balanceanalysis [154]. The ion wall flux is much lower, and behaves proportional tothe electron density. The steady state value during the plasma phase is ofthe order of QH+ ≈ 6.0 ·1017 /m2s, in agreement with ion currents collectedon the ALT limiter blades in TEXTOR during hydrogen ICWC discharges(see section 5.2.3.1). The retention at the start of the discharge accountsfor a total of ∼ 5 · 1019 particles. It is expected that a large part of theseparticles are transiently stored and are retrieved from the wall after the RFpulse, which causes the typical outgassing peak. The retention rate duringthe steady state plasma phase (t > 1.5 s) equals the injection rate minus the

5-32 Kinetic Description of Hydrogen-Helium ICWC Plasmas
removal rate by the pumps, and is approximately equal to the injection rateof particles into the vessel (∼ 2.9 ·1017 /m2s) due to the low pressure duringthis phase (pH2 ≈ 5 · 10−6 mbar). It is expected from the stable density andpressure time traces (Fig. 5.14) that these particles are permanently storedin the vessel, which corresponds for this ≈ 4 s RF discharge to a permanentretention of ∼ 8 · 1019 particles, which is of the same order as the valuesgiven on Fig. 4.13. ICWC isotope exchange experiments on both TEXTORand TORE SUPRA revealed indeed that the total amount of permanentlyretained particles increases on increasing RF pulse length.
From the modeled temporal pressure, density and coupled power depen-dencies shown in Fig. 5.14 it can be concluded that the wall interaction hasa major influence on the neutral hydrogenic pressure and plasma densityin case of constant injection. During the breakdown phase particles aretransiently stored in the wall causing a steep pressure drop while duringthe plasma phase an equilibrium pressure is formed where the permanenthydrogen retention rate is of the order of the gas injection rate. In chapter4 we saw already that in order to minimize retention it is recommended toemploy shorter RF pulses (1 ∼ 2 s), which at the same time maximizes therecovery of transiently stored particles.
5.3 ConclusionIn this chapter the 0D kinetic description of magnetized toroidal hydrogen-helium RF discharge was outlined. The model is developed to obtain in-sight on ICRF plasma parameters, particle fluxes to the walls and the maincollisional processes, the latter being the fundamental mechanism for thebuild-up of a plasma. This is of particular importance since most standardtokamak plasma diagnostics are not adapted to diagnose the typical lowtemperature and low density RF plasmas.
The 0D plasma description is based on the energy and particle balanceequations for nine principal species: H, H+, H2, H+
2 , H+3 , He, He+, He++
and e−. It takes into account (1) elementary atomic and molecular collisionprocesses, such as excitation/radiation, ionization, dissociation, recombina-tion, charge exchange, etc... and elastic collisions, (2) particle losses due tothe finite dimensions of the plasma volume and confinement properties ofthe magnetic configuration, and particle recycling, (3) active pumping andgas injection, (4) RF heating of electrons (and protons) and (5) a qualitativedescription of plasma impurities.
Many efforts have been put in rendering the 0D description of thehydrogen-helium plasmas as complete as possible. The 0D model predictshowever plasma densities that are 2 to 10 times higher than the experi-

Chapter 5 5-33
mental densities, obtained from interferometry measurements on TEXTORand TORE SUPRA. The main physical actors that can reduce the mod-eled densities were investigated. (1) Firstly on inclusion of small chargedparticle confinement times (< 1 ms), the plasma densities are found to besmaller by a factor 3 compared to a perfectly confined plasma. In the modelthe charged particle confinement times (∼ 0.1 s) are estimated from particledrifts in the magnetic field configuration, diffusion across the magnetic fieldand losses along the magnetic field lines. It was concluded from numeri-cal experiments that the confinement times play only a minor role on thefinal plasma parameters. (2) Secondly, in case a large fraction of the RFpower would be coupled to ions the plasma density decreases by a factorof 2 to 5 (50%-60% coupled to ions), while the ion temperature increases,which could be beneficial with respect to the wall conditioning efficiency ofthe RF discharges. However such large coupled power fractions are not inagreement with the present understanding of RF plasma production, mainlyobtained from the full wave code TOMCAT (typically ∼80-90% coupled toelectrons). (3) Finally it was found that on inclusion of limited amounts ofplasma impurities (∼0.1-1%) the plasma density can decrease by a factorof 2 to 10 times. Impurities have thus an important impact on the plasmaparameters. It is found from mass spectrometry that these small impurityconcentrations are in agreement with experiments, (e.g. CH4 and CO onTEXTOR). Unfortunately it is often difficult to estimate the exact impu-rity content of RF plasmas and the elementary collision data of moleculessuch as H2O, CH4 and CO is scarce. The effect of impurities on the plasmaparameters is simulated by including balance equations for C, C+ and C2+.
On inclusion of plasma impurities the model reproduces experimentalplasma density dependencies on discharge pressure and coupled RF power,both for hydrogen RF discharges (ne ≈ (1 − 5) · 1010 cm−3) as for heliumdischarges (ne ≈ (1− 5) · 1011 cm−3). The modeled wall fluxes of hydrogendischarges are in the range of what is estimated experimentally: ∼ 1019 −1020 /m2s for H-atoms, and ∼ 1017 − 1018 /m2s for H+-ions. In case ofhelium RF discharges it is found that the wall desorbed particles contributelargely to the wall flux. The main wall bombarding species are hydrogenneutrals. The helium and hydrogen ion flux are approximately of the sameorder of magnitude although the hydrogen neutral pressure, stemming fromwall desorption, is in accordance to mass spectrometry data less than 5%of the helium neutral pressure.
The sudden increase of plasma density on increasing the discharge he-lium concentration, while keeping the total pressure constant could notbe reproduced by the 0D model. Since the coupled power, and thus thecoupling efficiency does not show a similar discontinuity, it is nevertheless

5-34 Kinetic Description of Hydrogen-Helium ICWC Plasmas
expected that collisional processes lie at the basis of this effect. A futureupgrade of the 0D model to 1D, including a self consistent description of thecoupled RF power, and reconsideration of the inclusion of plasma impuritiesis required to evidence this.
The presented 0D ICWC plasma model allows to reproduce experi-mental pressure, density and coupled power temporal dependencies of aTORE SUPRA H2-ICWC discharge from discharge initiation to steady stateplasma, and gives insight into the particle wall fluxes and retention rates.The wall interaction, represented in the model by a particle recycling co-efficient, has a major influence on the neutral pressure and plasma densityin H2-ICWC discharges (in case of constant injection). During the break-down phase, particles are transiently stored in the wall causing a steep pres-sure drop while during the plasma phase an equilibrium pressure is formedwhere the permanent hydrogen retention rate approximately equals the gasinjection rate. Employing shorter RF pulses (1 ∼ 2 s) is favored to limitretention, while maximizing the recovery of transiently stored particles.

6Simulation of wall interaction
In chapter 4 we discussed the efficiency of ICWC for isotopic exchange. Wesaw that hydrogen ICWC is able to remove monolayers of wall isotopeswithin short time scales (∼ minutes), and that pulsed RF conditioning isrecommended to limit the observed retention during the conditioning proce-dure. The presented experimental particle balances delivered however onlyinformation on the overall wall conditioning efficiency. The purpose of thischapter is to investigate the evidenced efficiencies into deeper detail by de-termining a minimum structure for a 0D reservoir model of the wall. Thismodel, together with experimental data, could allow for a first physical in-terpretation of the observed conditioning effect, e.g. on the sources of theremoved wall isotopes and on the retention mechanisms during ICWC, andto propose improvements on wall conditioning efficiency. Determining thesources of the removed wall isotopes is of particular importance for evidenc-ing the hydrogen ICWC efficiency for tritium removal, and is required forassessing the applicability of ICWC for removing tritium-rich codepositedlayers on ITER.
The hypothesis used to build up the model is that the same modelstructure should be able to describe the wall behavior during normal plasmasand conditioning procedures. We will base the structure of the model onrobust experimental facts observed during normal plasmas. In a first sectionthe model will be presented, including a plasma description and a walldescription derived from experimental facts. In a second section the modelequations are given. The third section shows the capability of the model to

6-2 Simulation of wall interaction
reproduce the experimental facts in normal plasma discharges. In the finalsection, TORE SUPRA H2-ICWC discharges are modeled, and proposalsfor ICWC optimization in terms of discharge timing are worked out.
6.1 Model description6.1.1 Plasma descriptionThe plasma included in this plasma wall interaction simulation is based onthe 0D model presented in chapter 5. The plasma balance equations arevery much simplified and only the particle balances are retained. The neu-tral gas consists of a mixture of H2, HD and D2. The included elementarycollisions are dissociation of molecules, ionization of atomic hydrogen andrecombination of ions. At the start of the RF pulse we consider a highelectron temperature (Te > 10 eV), so that the electron density is builtup quickly, in accordance with 0D model results. When sufficient elec-tron density is attained (ne > 109 cm−3) the electron temperature reachesthe steady state value of Te ≈ 2 − 3 eV, and the density stabilizes aroundne ∼ 1010 − 1011 cm−3. The plasma confinement times are set to constantsteady state values, obtained from 0D model calculations. The resultingparticle fluxes to the wall from these confinement times are used as sourceterms in the balance equations of the wall description. The included plasmaparameters are:
• electron temperature: Te
• population of hydrogen ions in the plasma: N+H
• population of deuterium ions in the plasma: N+D
• population of hydrogen atoms in the plasma: NH
• population of deuterium atoms in the plasma: ND
• populations of neutral molecules in the plasma: NH2 , NHD and ND2
• plasma volume: Vpl
• molecule dissociation reaction rate: kdis(Te)
• atom ionization reaction rate: kion(Te)
• ion recombination reaction rate: krec(Te)
• atom confinement time: τp

Chapter 6 6-3
• ion confinement time: τi
• characteristic neutral molecule pumping time: τS
• neutral pressure of the injected gas: pH2
• discharge timing (number and length of pulses, and pumping timebetween pulses)
The electron density ne is calculated by the model ((N+H +N+
D )/Vpl) and theinjection rate of neutral gas is either continuously constant, calculated fromthe requested neutral pressure, or either feedback controlled to obtain aconstant electron density (to simulate the SOL in normal plasma operation,Te ≈ 100 eV, ne ≈ 4 · 1012 cm−3).
6.1.2 Wall descriptionThe wall description is based on robust experimental facts observed on thecarbon machine TORE SUPRA during standard tokamak discharges withplasma current. This is motivated by the fact that the wall properties areessentially the same in discharges with plasma current and in RF discharges.One PSI model should thus be able to explain the wall interaction in bothtypes of discharges. In this section we will first summarize the experimen-tal facts. Hereafter we will, based on these facts, propose a wall modelconsisting of communicating particle reservoirs.
6.1.2.1 Experimental facts
Permanent retention One observes a permanent retention even after5 hours of cumulated plasma time [40]. It is concluded that there existsan infinite reservoir N t which corresponds to atoms trapped in deposits inremote areas of the vacuum chamber or in deep pores of the CFC. At a firstapproximation, the particles entering this reservoir are definitely lost. OnITER, the tritium inventory build-up in similar infinite reservoirs is a severeproblem, as shown in section 1.4.4, and has to be mitigated by wall condi-tioning. At this point it is not certain that this reservoir can be emptiedduring conditioning procedures, although it is expected that it is at leastvery partially emptied due to the different geometries of such dischargeswith respect to normal plasmas. (This chapter aims at investigating thisinto deeper detail.)
Diffusive particles - transient retention One observes an equalityfor long discharges between the overshoot of retention at the beginning ofthe plasma and the post-discharge outgassing [36, 41, 162]. There exists a

6-4 Simulation of wall interaction
reservoir of diffusive particles, Nd, which are recovered at the end of theplasma. Since the outgassed amount of gas saturates for long discharges,the size of this reservoir is limited Nd,max ≈ 5 · 1021 H and D.
Accessible retention One observes a ‘natural’ plasma density which de-pends only on the plasma current and/or total power. In this case the wallfeatures a net release of particles. In the opposite case the wall continu-ously ‘pumps’ particles in which case the injected gas flux has to be highenough for maintaining the plasma density [41]. It is concluded that thereexists an accessible reservoir of trapped particles, Na, whose maximum sizeNa,max ≈ 1022 − 1023 depends on the power in the discharge (i.e. on theenergy of the ions impinging the wall). It is essentially this reservoir thatgoverns the exchange of particles between plasma and wall. In tokamakdischarges, both the gas injection flux and the release/pumping by the walldetermine whether the discharge density can be controlled:
• if the gas flux is not high enough and Na ≈ 0, one cannot sustain theplasma;
• if the gas flux is not high enough and Na 6= 0, the wall outgases;
• if the gas flux is too high and Na < Na,max, the wall pumps;
• if the gas flux is too high and Na ≈ Na,max, the wall flux will returninto the plasma, yielding a disruption by limit in density.
Slowly varying wall status During ‘wall saturation-desaturation’ ex-periments, several discharges (∼ 10) are required for modifying the wallstatus [163]. During a plasma discharge, the majority of the impinging ionflux recycles immediately without entering the wall. Typically, one has:
• proportion of the recycling flux for permanent retention in N t: ηt ∼0.1− 1%;
• proportion of the recycling flux in Na: ηa ∼ 1− 10%;
• proportion of the recycling flux immediately re-injected in the plasma:(1− ηa − ηt).
Diffusion into micro-voids In long plasma discharges the wall retentionfeatures a peak at the start of the discharge, representing the already men-tioned filling of the transient reservoir (see Fig. 6.4 on page 6-13), whereaftera slower decrease of the wall retention is observed, while at t ∼ 100 s a con-stant retention is attained [36]. It is acknowledged that a model with only

Chapter 6 6-5
Figure 6.1: Schematic representation of the included wall reservoirs.
one accessible reservoir is too limited to explain this effect. The carbonsubsurface representing the accessible reservoir consists of different types oftrapping sites. It is proposed that the time constant of 100 s originates fromthe diffusion of particles from macro-voids (accessible reservoir) into micro-voids in the CFC pores [36]. The latter effect becomes important when theconcentration of particles in the accessible reservoir is high. This can beinterpreted as an equivalent of enhanced diffusion deeper into the carbonlayers due to ‘elevated pressures’. Also, when the common trapping sitesare saturated the hydrogen can travel further through the carbon structurewhere it can be trapped in the second type of traps. In the model we willcall this reservoir the overflow reservoir.
6.1.2.2 Formulation of reservoir model
Based on the listed experimental facts the following wall model was pro-posed, represented in Fig. 6.1. It consists of four different reservoirs: anaccessible reservoir which is thus accessible for implantation, removal andexchange of particles, a permanent reservoir in which only storage is pos-sible (implantation or codeposition), a diffusive (transient) reservoir thatrepresents diffusing particles in the wall subsurface, and an overflow reser-voir to account for effects that occur when the particle concentration in theaccessible reservoir becomes large. The related wall variables are:
• population of accessible hydrogen atoms in the wall: NaH
• population of accessible deuterium atoms in the wall: NaD

6-6 Simulation of wall interaction
• isotopic ratio of the wall: IaH/(H+D) = NaH/(Na
H +NaD)
• maximum possible amount of atoms in the accessible reservoir: Na,max
(1022 − 1023)
• population of hydrogen atoms in the permanent reservoir: N tH
• population of deuterium atoms in the permanent reservoir: N tD
• population of hydrogen atoms in the overflow reservoir: N bH
• population of deuterium atoms in the overflow reservoir: N bD
• ‘transient’ population of diffusing hydrogen atoms: NdH
• ‘transient’ population of diffusing deuterium atoms: NdD
The included wall parameters are:
• proportion of recycling flux Φw(1) going into the accessible reservoir:ηa (typically from the order of 1 to 10%)
• proportion of recycling flux Φw going into the permanent reservoir: ηt(typically from the order of 0.1 to 1%)
• efficiency for an impinging particle to detrap a particle from the ac-cessible reservoir (which will then be accounted to the transient reser-voir): detrapping rate ρ. In the model we will use a geometric interpre-tation of the detrapping coefficient. The hydrogen trap concentrationin carbon is of the order of Ct = 4·1028 m−3, while the detrapping crosssection is of the order of σ = 8 ·10−21 m2 (for helium) [38]. For a typi-cal hydrogen penetration depth of into carbon of λ = 5 nm (∼ 100 eV),the line integrated trapping site density is 2·1020 m−2. In case we con-sider that only collisions with trapped hydrogen atoms are possible,the detrapping rate by an impinging particle equals ρ = σCtλ = 1.6.
• diffusion coefficient: D (∼ 7.5 · 10−19 m2/s [38])
• penetration depth for impinging particles: λ (normal impact on car-bon: ∼ 0.6 nm for 10 eV H-ions, ∼ 3.4 nm for 100 eV H-ions [122])
• characteristic diffusion time: τd (∼ 2 s, see further)
• efficiency for diffusion into micro-voids: α1The particle flux to the wall Φw was in previous chapters called Qftw.

Chapter 6 6-7
• efficiency for spontaneous detrapping: β, where we assume a similar‘pressure’ dependent effect as for diffusion into micro-voids. In casethe concentration of particles in the accessible reservoir is small, spon-taneous detrapping is only determined by thermal detrapping (notincluded in the model).
• characteristic residence time of particles in the overflow reservoir: τb
6.1.3 Diffusion in wallIn the model a simplification is introduced to describe the release of parti-cles from the transient reservoir into the vessel, that is acknowledged to bein disagreement with the present understanding that can be found in theliterature. It is known that the release rate of gas controlled by a diffu-sion process follows a t−n dependency [38, 124, 164]. The theoretical valuefor n varies from 1.5 for a pure diffusion process, to 0.5 for a diffusion-recombination controlled process [124]. Experimentally, for example afterJET low power ohmic cleaning discharges [164] values between 0.5 and 0.8are recorded. For TORE SUPRA, n ≈ 0.5 after He-GDC cleanings andn ≈ 0.7 after normal tokamak discharges [38]. To properly include thiseffect in the model, the original aim was to include a 1D diffusion descrip-tion for the transient reservoir. In the final version of the model the 1Ddiffusion module is replaced by a 0D description where the particle releaseis described by an exponential decay of the transient reservoir content. Theadvantage of this approach is that the code becomes much faster, whilethe final modeling results are not significantly influenced. The character-istic decay time employed in the model is chosen from calculated diffusionrelease rates, as illustrated on Fig. 6.2. In the calculation we assume thesimplest situation where the release of particles from the wall is controlledby diffusion alone. The figure shows calculated D2 release rates (blue) fora 5 s discharge and a constant arbitrary wall flux of 1021 D/s. The particlesare assumed to be deposited in the wall at a depth of λ = 1 nm and thediffusion coefficient equals D = 7.5 ·10−19 m2/s [38]. The left and right plotcontain the same data, given respectively in a logarithmic and linear scale.The release rate decreases rapidly right after the discharge, and after sometime the decrease becomes linear on the logarithmic plot, and thus followsa t−n dependency. The calculated release rate is found to be very sensitiveto the chosen particle deposition profile (λ). Information on the depositionprofile is however not available.
To both plots an approximate exponential (τd = 1.5 s, red) and t−n (n =1.6, green) fit is given. It is clear from the figure that the ‘exponential fit’-approach does not perfectly describe the actual release rate, especially for

6-8 Simulation of wall interaction
Figure 6.2: Calculated typical wall release rate governed by bulk diffusion (blueline), fitted exponential release rate (red line) and general accepted t−n depen-dency (green line). Right after the discharge pulse (t = 5 s) the exponential fitbest describes the desorption rate, whereafter it quickly evolves to the t−n fit.
t > 10 s. And when calculating the exponential release rate also during thedischarge, the result deviates even more from the actual rate. Neverthelessit was still chosen to adopt this approach in the model. This choice mightbe justified by the fact that the particle deposition profile in the wall is notknown, which makes that the completer 1D approach taking into accountdiffusion and eventually surface recombination is not necessarily correcter.
It is also clear from the figure that including the t−n fit in the model tosimulate the wall release is also not an option since the slope of release ratein the logarithmic plot becomes only linear about 10 s after the discharge.Furthermore this approach requires choosing an universal t = 0 s point,which is not possible when one intends to model multiple subsequent RFpulses.
6.2 Summary of the model equations6.2.1 Plasma equations6.2.1.1 Molecules in plasma
dNH2
dt = ΦH2 +OH2
Nd
2τd− γNH2nek
dis − NH2
τS+RH2
Φw
2 (1− ηa − ηt) (6.1)
dNHD
dt = 0 +OHDNd
2τd− γNHDnek
dis − NHD
τS+RHD
Φw
2 (1− ηa − ηt) (6.2)

Chapter 6 6-9
dND2
dt = ΦD2 +OD2
Nd
2τd− γND2nek
dis− ND2
τS+RD2
Φw
2 (1− ηa− ηt) (6.3)
The first term on the rhs is the injection flux of neutral hydrogen gas by thevalves (continuously constant), the second term on the rhs is the release ofmolecules from the walls, with the factors OH2 , OHD and OD2 representingthe probability that an outgassed hydrogen atom recombines to H2 or HD,and an outgassed deuterium atom to HD or D2:
OH2 = NdH
2
Nd2 OHD = 2NdHN
dD
Nd2 OD2 = NdD
2
Nd2 ,
with Nd = NdH +Nd
D, and τd the characteristic time for release of a diffusingparticle from the wall into the vessel. The third term represents the loss ofneutral molecules due to dissociation on electron impact, with
γ =
1, during RF pulse0, else,
ne the plasma electron density and kdis the dissociation reaction rate forhydrogen molecules. The fourth term represents the evacuation of neutralgas by the machine pumps with τS the characteristic pumping time. Thelast source term on the rhs represents particle surface recombination andreflection at the walls. The factors RH2 , RHD and RD2 are the probabilitythat a reflected hydrogen atom/ion recombines to H2 or HD, and a reflecteddeuterium atom/ion to HD or D2:
RH2 = ΦwH2
Φw2 RHD = 2ΦwHΦwDΦw2 RD2 = ΦwD
2
Φw2 ,
Φw is the total wall flux (neutrals and ions, H (ΦwH) and D (ΦwD)), ηa is theprobability that an impinging particle enters the accessible reservoir, andfinally ηt is the probability that an impinging particle is implanted in thepermanent reservoir.
6.2.1.2 Atoms in plasmadNH
dt = γ(2NH2 +NHD)nekdis +NH+nekrec − γNHnek
ion − NH
τH,D(6.4)
dND
dt = γ(2ND2 +NHD)nekdis +ND+nekrec − γNDnek
ion − ND
τH,D(6.5)
The first term on the rhs is the atom source following from molecule dissoci-ation, the second term is an atom source following from the recombinationof ions and electrons, with krec the recombination reaction rate for hydrogen

6-10 Simulation of wall interaction
ions. The third term represents the ionization of neutral atoms, with kion
the ionization reaction rate for hydrogen atoms. The last term contains theneutral particle confinement time τH,D, and represents as such the flux ofneutral particles to the walls.
6.2.1.3 Ions in plasmadNH+
dt = γNHnekion −NH+nek
rec − NH+
τH+,D+(6.6)
dND+
dt = γNDnekion −ND+nek
rec − ND+
τH+,D+(6.7)
The first term on the rhs is the ion source following from the ionization ofneutral atoms, the second term is a loss term following from the recombina-tion of ions and electrons. The last term contains the ion confinement timeτH+,D+ , and represents as such the flux of ions to the walls. The total fluxof particles Φw given in eq. (6.1-6.3) is thus
Φw = ΦwH + ΦwD = NH
τH,D+ NH+
τH+,D++ ND
τH,D+ ND+
τH+,D+
6.2.2 Wall equations6.2.2.1 Atoms in accessible reservoir
dNaH
dt = [1−Ψ(Na/Na,max)][ηaΦwH + N bHτb
]− ρIaH/(H+D)Na
Na,max ηaΦw
−(α+ β)Ψ(Na/Na,max)IaH/(H+D)Na (6.8)
dNaD
dt = [1−Ψ(Na/Na,max)][ηaΦwD + N bDτb
]− ρ(1− IaH/(H+D))Na
Na,max ηaΦw
−(α+ β)Ψ(Na/Na,max)(1− IaH/(H+D))Na (6.9)
The first term on the rhs represents the source of particles into the accessi-ble reservoir. It contains the plasma wall flux, with ηa the fraction of thisflux that enters the wall, and a source of particles released from the overflowreservoir that represents the temporarily trapping of particles in denser car-bon structures. The second term represents the particle induced detrappingof particles in the accessible reservoir, with ρ the detrapping rate (∼ crosssection), IH/(H+D) the isotopic ratio of the reservoir, and Na/Na,max thefilling degree of the reservoir (Na = Na
H +NaD). The third term represents
particle transfers into the overflow reservoir and spontaneous detrapping,which are both expected to become more important on higher filling de-gree, represented by Ψ. The latter effect is thus non linear. The value for

Chapter 6 6-11
Figure 6.3: The highly speculative function Ψ(Na/Na,max), to account for ob-served effects that are only important at high Na/Na,max-values.
Ψ needs to remain small for small and intermediate filling degrees, and toincrease steeply for higher filling degrees. It was chosen to employ the Fermifunction f(Na/Na,max):
Ψ(Na/Na,max) = 1− f(Na/Na,max) =exp(N
a/Na,max−µω )
1 + exp(Na/Na,max−µω )
(6.10)
with µ the value for which f(µ) = 0.5 and ω the width. An example of thisfunction with µ = 0.9 and ω = 0.04 is given in Fig. 6.3.
6.2.2.2 Atoms in trapped reservoir
dN tH
dt = ηtΦwH (6.11)
dN tD
dt = ηtΦwD (6.12)
The only source term for this reservoir is the fraction ηt of the wall flux thatwill be permanently retained. In the present model there is no loss termincluded for particles in this reservoir, in agreement with the experimentalfacts presented in section 6.1.2.1. Including removal out of this reservoirappeared also not necessary to model the experimental ICWC data (seefurther) meaning that the hydrogen removal rate out of the trapped reservoiris likely much lower than out of the other reservoirs.
6.2.2.3 Atoms in overflow reservoir
dN bH
dt = αΨ(Na/Na,max)IaH/(H+D)Na − N b
Hτb
(6.13)

6-12 Simulation of wall interaction
dN bD
dt = αΨ(Na/Na,max)(1− IaH/(H+D))Na − N bDτb
(6.14)
The first term on the rhs represents the transfer of particles from the acces-sible reservoir to the overflow reservoir, which becomes important in casethe filling factor of the transient reservoir is high, represented by Ψ. Thelast terms represents the fact that these particles are completely releasedwith slow time constant τb.
6.2.2.4 Diffusing atoms
dNdH
dt = ρIaH/(H+D)Na
Na,max ηaΦw + Ψ(Na/Na,max)[ηaΦwH + N bHτb
]
+βΨ(Na/Na,max)IaH/(H+D)Na − Nd
Hτd
(6.15)
dNdD
dt = ρ(1− IaH/(H+D))Na
Na,max ηaΦw + Ψ(Na/Na,max)[ηaΦwD + N bDτb
]
+βΨ(Na/Na,max)(1− IaH/(H+D))Na − NdDτd
(6.16)
The first term on the rhs is the particle source to the diffusing reservoirstemming from particle induced detrapping from the accessible reservoir.The second term represents the fact that free particles in the wall, eitherstemming from the wall flux or from the overflow reservoir, can not all betrapped in the accessible reservoir. A part, dependent on the filling degreeΨ, will enter the transient reservoir and thus diffuse back out of the wall.The third term accounts for spontaneous detrapping of particles, which ismore important in case the filling degree of the transient reservoir is high,again represented by Ψ. The last term is the flux of particles from the wallinto the vessel. On including a 1D diffusion module in the model the wholeequation can be conserved, while an additional calculation is required toaccount for the changing 1D particle profile in the subsurface. The lastterm of the rhs of eq. (6.15) and (6.16) needs to be replaced by the wallrelease rate obtained from the diffusion module.
6.3 Simulation of TORE SUPRA dischargeswith plasma current
In this section we will show the capability of the wall reservoir model to re-produce experimental observations during normal tokamak discharges. This

Chapter 6 6-13
Figure 6.4: Left: Wall retention rate calculated from particle balance during 3consecutive long discharges [36]. Right: Wall retention rate simulated by reservoirmodel.
is important to gain confidence in the reservoir model approach, althoughthere is no doubt that the balance equations can still be further optimized,for example by including more PSI physics or by limiting the number offree parameters. We will give two examples of modeling results. First the400 s long TORE SUPRA discharges 32298-32300, published in [36] will bediscussed, then we show the capability of the model to simulate naturaldensity.
6.3.1 Long plasma discharges: TORE SUPRA 32298-32300
Fig. 6.4 (left) shows experimental retention rates obtained from the particlebalance for three consecutive long TORE SUPRA discharges. On the figuretwo phases are separable. During the first phase (t = 0−100 s) the retentionrate decreases from 4 · 1020 D/s to 2 · 1020 D/s, whereafter in the secondphase the retention remains constant. The behavior is identical in eachshot and shows no sign of wall saturation. It was possible to reproduce thesedischarges with the reservoir model. Fig. 6.4 (right) shows the simulatedretention rate Φret, defined as the injection rate from the valves minus thetime derivative of the vessel total particle content (neutrals and ions).
Φret = 2ΦinjectedH2,D2
− ddt (2NH2 +2NHD+2ND2 +NH+ND+NH+ +ND+) (6.17)
In the simulation we included a typical SOL plasma (Te = 100 eV, ne =4 · 1018 m−3 [36] and Vpl = 12 m3). The gas injection (D2) was feedbackcontrolled on the electron density in the SOL. To reproduce the typicalion flux to the wall (∼ 1022 /m3s [36]), the ion confinement time is setto τH+,D+ = neVpl/1022 = 5 ms (the neutral confinement time is set to

6-14 Simulation of wall interaction
a large value, τH,D = 1 s). The confinement times mentioned here are the‘confinement time components’ representing the flux to the wall. The actualtypical residence time of a neutral atom in the plasma taking into accountthe rapid ionization process is of course much smaller. Since it is expectedthat the constant retention in the second discharge phase (t > 100 s) resultsfrom retention in the permanent reservoir, the fraction of the wall flux thatenters this reservoir is set to ηt = 2·1020/1022 = 0.02. Table 6.1 summarizesthe used discharge parameters. The peak in the retention at the start of
Table 6.1: Wall parameters for tokamak discharges
parameter valueNa,max 1023
NaD 7.5 · 1022
ηa 0.12ηt 0.02ρ 0.7α 1.5β 2.5τb 12.5 sτd 1.5 s
µ (Ψ) 1ω (Ψ) 0.04
the discharge results from the filling of the transient ‘diffusive’ reservoir(∼ 1.5 · 1021 D). The slow decrease in the first phase results from the fillingof the overflow reservoir (∼ 9.7 · 1021 D). At the end of the discharge, allthe particles from these two reservoirs are recovered from the wall. Thetotal additional retention of deuterium in the permanent reservoir is about6.4 · 1022 D. The total number of particles stored in the accessible reservoirremains stable around the initial value 7.5 · 1022 D.
When the model is ran taking into account a saturated hydrogen wall(IaH/(H+D) = 1) while the valves inject deuterium molecules, it is found thatthe isotopic ratio decreases from 1 to 0.64 in one 400 s discharge. After10 similar discharges the isotopic ratio has decreased to 0.27. This is inagreement with the experimental observation that multiple discharges arerequired to change the wall state. During the discharges the plasma isotopicratio is approximately equal to the wall isotopic ratio.
6.3.2 Natural plasma densityAs mentioned above, natural plasma density means that the plasma is com-pletely fueled by the wall. The discharge is still initiated by injected gas, but
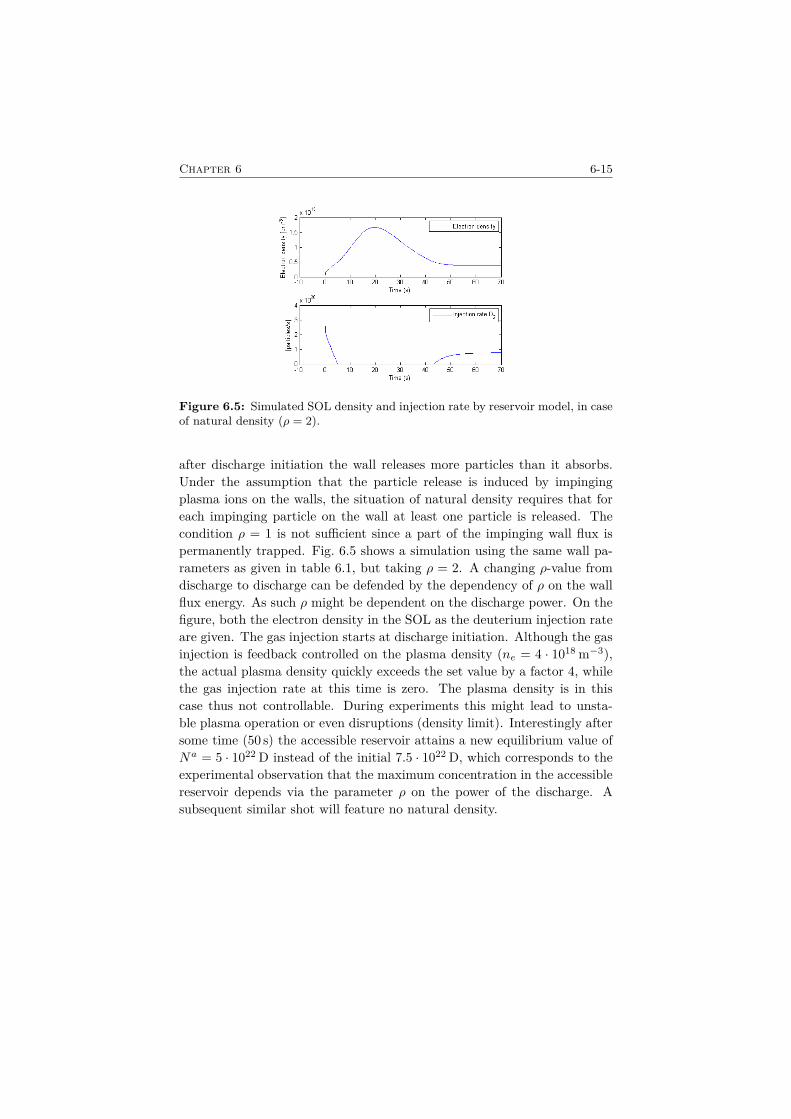
Chapter 6 6-15
Figure 6.5: Simulated SOL density and injection rate by reservoir model, in caseof natural density (ρ = 2).
after discharge initiation the wall releases more particles than it absorbs.Under the assumption that the particle release is induced by impingingplasma ions on the walls, the situation of natural density requires that foreach impinging particle on the wall at least one particle is released. Thecondition ρ = 1 is not sufficient since a part of the impinging wall flux ispermanently trapped. Fig. 6.5 shows a simulation using the same wall pa-rameters as given in table 6.1, but taking ρ = 2. A changing ρ-value fromdischarge to discharge can be defended by the dependency of ρ on the wallflux energy. As such ρ might be dependent on the discharge power. On thefigure, both the electron density in the SOL as the deuterium injection rateare given. The gas injection starts at discharge initiation. Although the gasinjection is feedback controlled on the plasma density (ne = 4 · 1018 m−3),the actual plasma density quickly exceeds the set value by a factor 4, whilethe gas injection rate at this time is zero. The plasma density is in thiscase thus not controllable. During experiments this might lead to unsta-ble plasma operation or even disruptions (density limit). Interestingly aftersome time (50 s) the accessible reservoir attains a new equilibrium value ofNa = 5 · 1022 D instead of the initial 7.5 · 1022 D, which corresponds to theexperimental observation that the maximum concentration in the accessiblereservoir depends via the parameter ρ on the power of the discharge. Asubsequent similar shot will feature no natural density.

6-16 Simulation of wall interaction
Figure 6.6: Experimental (red, from mass spectrometry) and modeled (blue)partial pressures (H2, HD and D2) for TORE SUPRA discharge 45707, consistingof 5 RF pulses (PRF = 60 kW) with different pulse lengths (5 s, 2 × 2 s, and2 × 10 s), starting at [t = 20, 60, 100, 140 and 180 s] and constant H2 injection(pH2 = 1.75 · 10−4 mbar)
6.4 Simulation of TORE SUPRA H2-ICWCdischarges
6.4.1 Isotopic exchange experiment with pulsed dis-charges
The model was used to simulate TORE SUPRA H2-ICWC discharges wherethe wall was preloaded with D2. Fig. 6.6 shows experimental (red) andmodeled (blue) partial pressures (H2, HD and D2) for discharge 45707,consisting of 5 RF pulses (PRF = 60 kW) with different pulse lengths (5 s, 2×2 s, and 2×10 s), starting at t = 20, 60, 100, 140 and 180 s, and constant H2injection (pH2 = 1.75 · 10−4 mbar). The choice for this particular dischargeis motivated by the fact that all discharge parameters are kept constantexcept for the changing discharge length from pulse to pulse. The figureshows that the partial pressure time traces can be accurately modeled, withminor deviations to the real pressure (from mass spectrometry) during thedischarge itself. Respecting the premise of the model, the wall parametersare identical as those used in the simulations above (table 6.1), except forηa = 0.0175 and ηt = 0.015, which might be explained by different wall flux

Chapter 6 6-17
characteristics (the ICWC wall flux consists mostly of low energy neutrals,see chapter 5). The initial accessible wall reservoir content was set equalto Na
H = 1.4 · 1022 and NaD = 1.6 · 1022. It is found that the modeled
partial pressures are not very sensitive to the absolute values of NaH and
NaD, as long as their ratio to the maximum value Na,max is kept constant.
In the simulation, the maximum value is set equal to Na,max = 4 · 1022,which is smaller than in normal discharges, motivated by the fact that thelikely lower flux energy might not efficiently condition deeper carbon layers,although no clear experimental proof is available for this (see chapter 4.1.2).
Table 6.2 gives the changes that were effectuated in each reservoir. Ac-cording to the developed reservoir model, ran with the mentioned dischargeand wall parameters, the removed deuterium from the wall stems from theaccessible reservoir. The removed deuterium from the accessible reservoir iscompletely replaced by hydrogen. Due to the continuous particle recycling,a part of the wall released deuterium is lost in the permanent reservoir.Additionally, also hydrogen is stored in the permanent reservoir. The totalparticle balance is found to be in close agreement with the experimentalone.
Table 6.2: Particle balance of TORE SUPRA H2-ICWC discharge 45707 sepa-rated in terms of accessible and permanent reservoir
hydrogen deuteriumaccessible 3.3 · 1020 −3.3 · 1020
permanent 6.2 · 1020 0.8 · 1020
total 9.5 · 1020 −2.5 · 1020
total exp. 9.1 · 1020 −2.1 · 1020
6.4.2 Optimization of TORE SUPRA pulsed H2-ICWCdischarges
The reservoir model allows to assess the effect of the discharge pulse lengthand pumping time on the conditioning efficiency of the TORE SUPRAH2-ICWC discharges, which will be shown below. A comparison of theseresults to other machines is not straightforward since the choice of the idealdischarge timing (see Fig. 6.7) depends on the outgassing rate of the wall(and thus of the wall materials), and on the device’s pumping speed. Thedependency on the pumping speed is very illustrative and will be shownbelow as well. Discharge optimization via the wall model with respect tothe pressure and RF power are at this point not carried out.

6-18 Simulation of wall interaction
Figure 6.7: Schematic of ICWC operation in pulsed mode. One pulse cycleconsists of the RF pulse length and the pumping time. Generally, right afterthe RF pulse during the pumping time, a typical partial pressure increase of walldesorbed particles can be observed.
Figure 6.8: Modeled amounts of retained hydrogen, recovered deuterium andpermanently stored deuterium as a function of the discharge pulse length for ten40 s pulse cycles.
6.4.2.1 Pulse length
Fig. 6.8 shows for the same wall and discharge parameters as in the ICWCsimulation above, and for a saturated deuterium wall, the amount of re-tained hydrogen (into the accessible and permanent reservoir), the amountof recovered deuterium and the amount of retained deuterium in the per-manent reservoir, as a function of the pulse length. Each plotted datapoint represents the effect of 10 subsequent RF pulses, including sufficientpumping time (150 s) after the last cycle to ensure complete recovery of theparticles from the overflow reservoir, the transient reservoir and the vessel.The total time of one pulse cycle (see Fig. 6.7) is kept constant to 40 s. Itis clear from the figure that on longer pulse lengths, while keeping the totalcycle period constant, the amount of retained particles increases. This istrue both for the injected hydrogen as for deuterium stemming from theaccessible reservoir and being transferred via the plasma to the permanent

Chapter 6 6-19
reservoir. The amount of deuterium released from the accessible reservoirand pumped out of the vessel increases first also on increasing pulse length,reaches a maximum at a pulse length of 20 s, and decreases again on apply-ing even longer pulses. The latter is explained by the fact that the pumpingprobability of a particle during the discharge is small. A wall desorbed par-ticle is thus very likely sent back to the wall, as was discussed into detailin chapter 4. In this continuous recycling process most of the particles endup in the permanent reservoir. The right figure shows the ratio of retainedhydrogen to recovered deuterium. The ratio is always higher than one, andin that respect thus contradicts the experimental result on Fig. 4.13 dis-cussed in section 4.1.4. It is explained by the choice of a fixed value forηa and ηt given in table 6.1. It is thus logically not possible to obtain abetter ratio than ηa/ηt ≈ 1.2. The shorter the pulse length, the better theratio. On the other hand, by employing very short pulses the amount ofrecovered deuterium remains limited (green line on left figure). The idealpulse length is 2 s long. For this length the amount of removed deuterium isabout one half of the maximum achievable amount (at 20 s), while both theimplantation of hydrogen (blue line on left figure), and the re-implantationof wall desorbed deuterium into the permanent reservoir (red line on leftfigure) remain limited.
6.4.2.2 Pumping time
Fig. 6.9 shows a similar analysis as above. Cases were ran for the sameplasma and wall parameters as above and again for a saturated deuteriumwall, to determine the amount of retained hydrogen (into the accessible andpermanent reservoir), the amount of recovered deuterium and the amountof retained deuterium in the permanent reservoir, as a function of the totalcycle period for each of the 2 s RF pulses (see Fig. 6.7). The length of thetotal conditioning procedure is kept constant to 420 s, including 20 s beforethe first pulse to build up the required gas pressure. In the simulationsufficient pumping time (150 s) after the last cycle is included. Each plotteddata point represents thus the effect of a 420 s conditioning procedure andthe number of 2 s RF pulses varies as a function of the requested pumpingtime. The figure shows clearly that, similar as the above analysis, the moreRF time that is included in the conditioning procedure, the more of theinjected hydrogen gas is retained into the wall (blue line left figure) andthe more of the recovered deuterium from the accessible reservoir will betransferred via the plasma into the permanent reservoir (red line left figure).The maximum amount of recovered deuterium (green line left figure) is ata cycle period of 7 s (2 s pulse + 5 s pumping time). The ratio of retainedhydrogen over recovered deuterium (blue line right figure) does not improve

6-20 Simulation of wall interaction
Figure 6.9: Modeled amounts of retained hydrogen, recovered deuterium andpermanently stored deuterium as a function of the pulse cycle length with 2 s longRF pulses and a total conditioning procedure length of 420 s.
further for larger cycle periods than 20 s. The amount of removed deuteriumfor this cycle is about one half of the maximum achievable value (7 s). Forshorter cycle periods the hydrogen retention and transfer of deuterium fromthe accessible to the permanent reservoir becomes too severe, and thus 2 sRF pulses every 20 s seems to be the ideal pulsed ICWC scenario, for theseplasma and wall parameters. The pumping time interval of 18 s correspondsto three times the characteristic removal time related to the pumping speed,3τS .
6.4.2.3 Pumping speed
The ideal scenario defined above was derived for a TORE SUPRA H2-ICWC discharge with neutral pressure of pH2 = 1.75 · 10−4 mbar (injectioncontinuously constant) and RF generator power of PRF = 60 kW. It is thuscharacteristic for these discharge parameters, the TORE SUPRA wall (out-gassing rate) and the TORE SUPRA pumping speed. Fig. 6.10 shows theinfluence of the pumping speed (characteristic time) on the conditioning ef-ficiency. Cases were ran for the same plasma and wall parameters as aboveand again for a saturated deuterium wall, to determine the amount of re-tained hydrogen (into the accessible and permanent reservoir), the amountof recovered deuterium and the amount of retained deuterium in the perma-nent reservoir. The total conditioning procedure is 420 s long with 2 s RFpulses every 20 s. As the pumping speed decreases (larger τ) the amountof retained hydrogen decreases as well (blue line left figure). This is dueto the lower required gas injection rate needed to obtain the pressure ofpH2 = 1.75 · 10−4 mbar when the pumping speed is lower. The amount ofrecovered deuterium decreases as well (green line left figure), while the ra-

Chapter 6 6-21
Figure 6.10: Modeled amounts of retained hydrogen, recovered deuterium andpermanently stored deuterium as a function of the pumping speed (representedby the characteristic pumping time constant τ = V/S) for 20 s long pulse cycleswith 2 s RF pulses and a total conditioning procedure length of 420 s.
tio of retained hydrogen over recovered deuterium increases (blue line rightfigure). The amount of deuterium stemming from the accessible reservoirand being retained in the permanent reservoir (red line left figure) is lowestfor large pumping speeds. In the extreme case of very slow pumping speed(τ = 40 s) the half of the removed deuterium from the accessible reservoiris permanently retained: ratio of recovered deuterium over retained deu-terium in the permanent reservoir equals one (green line right figure). Ahigh pumping speed is thus required so that all the released deuterium canbe removed from the vessel by the machine pumps between two subsequentRF pulses. The amount of deuterium that is not removed before the startof the next pulse, will become part of the wall flux during this discharge,with a large probability to be retained in the permanent reservoir.
6.5 DiscussionAlthough the presented model reproduces the experimental facts, both intokamak discharges as in RF discharges, the question may rise on how ro-bust the presented minimum structure of the reservoir model is. In this finalsection we will look for differences and similarities of the developed ratherphenomenological reservoir model with a physically more profound modeldescribing the hydrogen isotope inventory in porous materials, recently pre-sented in [165].
The latter model considers carbon based materials made of granulesand voids. The wall surface is represented by two sets of two layers, eachconsisting of internal surface layers surrounding the carbon bulk layers.The first set represents codeposited layers, while the second set represents

6-22 Simulation of wall interaction
the actual wall material. The four layers are resolved in one dimension,whereas in our model we considered a 0D representation. Compared toour model the two sets correspond respectively to the permanent reservoir(permanent storage in codeposited layers), and the accessible (surface) andoverflow (bulk) reservoir. Transport of particles inside a region is governedby diffusion. Diffusion is in our model only included in the ‘surface’ layerof the actual wall material (so not in the codeposited layers, nor in layerbulk), and additionally it was chosen to represent the residence time ofdiffusing particles inside the surface layer by an exponential factor, insteadof resolving the 1D diffusion equation explicitly. The trapping site density inall regions is in [165] pre-defined, and no dynamic trapping site productionis included in the model, nor in our model. A maximum trapping level inour model is however only included in the accessible reservoir (surface layerof the actual wall material).
For each layer specific physical mechanisms are included. These reac-tions are all thermally activated which is not the case in our model. (Themodel even includes a time dependent description of the wall temperature,which is also not the case in our model. It might be interesting to estimatethe wall heating during RF discharges, although the short and low energyRF pulses probably don’t significantly heat up the entire wall. Fig. 3.13(JET IR camera image) showed however that wall elements close to theplasma, intersecting the magnetic field lines, do heat up during RF dis-charges.) For the surface regions seven reactions are considered:
1. volume recombination: not included in our model
2. surface recombination: included in our model, and is assumed to bemuch faster than the diffusion of particles so that wall release is dom-inated by diffusion.
3. spontaneous desorption: included in our model and is as in [165] de-pendent on the filling rate. A dependency on the trapping site energyhowever is not included in our model.
4. trapping: the trapping of particles in the accessible reservoir and per-manent reservoir is included in our model. Only for the accessiblereservoir trapping is dependent on the filling rate.
5. detrapping: detrapping of particles is in our model only included forthe accessible reservoir and is also dependent on the filling rate, thetrapping site density (Na
max) and the detrapping cross section (via ρ).
6. inter-region transport between surface and bulk: see below

Chapter 6 6-23
7. inter-region transport between bulk and surface: see below
For the bulk regions three reactions are considered:
8. volume recombination: not included in our model
9. inter-region transport between surface and bulk: see below
10. inter-region transport between bulk and surface: see below
Inter-region transport (6 & 7, 9 & 10) is included only for the ‘actual wallmaterial’ (thus not for the permanent reservoir, corresponding to code-posited layers). Transport from the surface to the bulk in the ‘actual wallmaterial’ (thus from reservoir ‘a’ to ‘b’) is as in [165] also in our model de-pendent on the filling rate of the accessible reservoir. The bulk material inour model releases particles with a time constant (τb), for which no explicitphysical representation is found in the paper of [165]. There the exchangeof particles depends on the hydrogen concentration and the difference indiffusivity between the two regions.
The elements in the developed phenomenological model correspond fairlywell to the physically more profound model presented in [165], albeit inmuch simplified form. Ideas for model upgrades can be distilled from thislast section, were firstly a release of particles from the permanent reser-voir should be considered (additional dedicated experiments are probablyrequired). Secondly the exchange of particles between reservoir ‘a’ and ‘b’,which is presently dependent on the postulated phenomenological functionΨ should be reconsidered. Thirdly also the spontaneous desorption, in ourmodel likewise dependent on the filling rate expressed by Ψ should receivean equivalent physical process. Once this is achieved the model, or in afirst phase only for reservoir ‘a’ and the diffusing particle reservoir ‘d’, anupgrade to 1D might be interesting (for this the energy of the wall bom-barding species and the particle deposition profile into the wall has to beknown).
It must be kept in mind there will always be reasons to implement im-provements to these kinds of models. What counts is that what can belearned from the model, while taking into account its limitations.
6.6 ConclusionIn this chapter a minimum structure for a 0D reservoir model of the TORESUPRA (carbon) wall was determined to obtain more insight in experi-mental isotopic exchange particle balances. The hypothesis used to buildup the model is that the same model structure should be able to describe

6-24 Simulation of wall interaction
the wall behavior during normal plasmas and conditioning procedures. Themodel consists of a reduced plasma model based on the 0D model describedin chapter 5, coupled (via wall fluxes and wall release rates) to the walldescription. The wall description is based on four reservoirs: an accessiblereservoir in which trapping, detrapping and exchange of particles is possible,a permanent reservoir in which only retention is possible, a transient reser-voir representing diffusing particles in the wall and an additional reservoiraccounting for effects that become important on high filling degrees of theaccessible reservoir. The formulated balance equations are able to describethe time evolution of retention rates in long TORE SUPRA discharges, toreproduce the slow change-over of the wall isotopic ratio, to illustrate thedependency of the maximum concentration of accessible particles in the wallon discharge power and to simulate natural plasma density.
Using the same wall parameters, the model also allows to simulate theH2, HD and D2 partial pressures during ICWC isotope exchange discharges.It is found that there is a strong interaction with the typical accessible hy-drogen reservoir in carbon and that hydrogen removal from the permanentreservoir is not needed to be included in the model to reproduce the exper-imental ICWC data. At the same time, the fraction of the wall flux thatenters into the permanent reservoir and that is thus permanently lost inthe walls is significant (∼ 1.5%). Moreover, the model illustrates also thatthe wall flux consists both of injected hydrogen isotopes and wall desorbedhydrogen isotopes, stemming from the accessible reservoir. If not optimiz-ing the RF duty cycle, this recycling proces will make that a large part ofthe desorbed wall isotopes will be retained in the permanent reservoir. Atthis point it is not clear whether the permanently stored particles can beretrieved, and thus whether hydrogen ICWC can be effectively applied formitigating the tritium inventory build-up in ITER. Additional experimen-tation will be required to study this further.
The model is used to study the isotopic exchange efficiency as a functionof the discharge timing (RF pulse length and interval between subsequentRF pulses) and the machine pumping speed. It is possible from the wallmodel to identify the ideal RF pulse length and pumping time betweensubsequent pulses to maximize the amount of recovered particles from thewall, while minimizing firstly the retention of injected gas, and secondly theloss of wall desorbed particles into the permanent retention reservoir. Theoptimal discharge timing depends on the wall parameters (materials) anddischarge parameters, and additionally to allow for achieving high condi-tioning efficiencies it is very important that the vacuum pumping speed ishigh. For a TORE SUPRA H2-ICWC discharge with pH2 = 1.75·10−4 mbar,PRF,gen = 60 kW and pumping speed of τS = 6 s, the ideal discharge timing

Chapter 6 6-25
consists of 2 s RF pulses every 20 s, respecting a pumping time interval of3τS = 18 s.
In a final discussion the developed phenomenological model was com-pared to a recently presented physically more profounded model [165], fromwhich it is concluded that both models correspond fairly well, although ourmodel features a much more simplified wall representation. Principal ideasfor model expansions could be identified.


7Extrapolation to ITER
In this final chapter an assessment is made on the applicability and theimplementation of ICWC on ITER, based on what was learned from theprevious chapters. In the first section the envisaged wall conditioning aimsof helium and hydrogen ICWC for ITER are summarized. In the secondsection, the experimental results are extrapolated to ITER, treating thedischarge and wall flux homogeneity, and the extrapolated efficiencies ofboth helium and hydrogen ICWC. In the last section the implementation ofICWC into the ITER operation cycles is discussed.
7.1 ITER ICWC aimsIn section 1.5.3 the envisaged wall conditioning techniques for ITER weresummarized from [42]. It was concluded that ICWC is a good candidatetechnique to be applied on ITER during the two weeks long operationalcycles, i.e. when the toroidal magnetic field is present, for inter-pulse andovernight conditioning. The conditioning aims for ICWC during the opera-tional cycles cover the three main aims that were summarized in section 1.5,namely: controlling the in-vessel impurity content, controlling the recyclingof hydrogenic fluxes and reducing the tritium inventory. The given list ofaims from operational point of view is only slightly reduced: in accordanceto section 1.5, these conditioning aims can be regrouped according to thedischarge gas. The preferred conditioning gases are presently hydrogen (H2

7-2 Extrapolation to ITER
or D2) and helium (the use of oxygen to remove tritiated codeposited layersis not allowed due to the resulting formation of highly corrosive tritiatedwater [42]). The conditioning aims for He-ICWC are:
• recovering plasma start-up after disruptions,
• desaturating the wall from hydrogen isotopes to ensure plasma start-up, and
• improving the plasma performance by impurity removal,
which consequently should be applied before the start of a tokamak plasma,thus for inter-pulse conditioning. The conditioning aims for H2-ICWC (orD2-ICWC) are:
• changing the wall isotopic ratio to control the plasma isotopic ratio,
• improving the plasma performance by impurity removal, and
• removing tritium,
which could be adopted for overnight conditioning, followed by He-ICWCto ensure low recycling in the subsequent tokamak plasma.
7.2 Extrapolation of experimental results7.2.1 General considerationsThe presented experiments and modeling efforts in this manuscript are car-ried out to study and to optimize the efficiency of ICWC. From the anal-ysis it can be concluded that optimal ICWC discharges need to fulfill thefollowing intercorrelated points, which can vary according to the specificconditioning needs:
• optimal discharge control parameters (pressure, RF power, antennastrap phasing, poloidal magnetic field),
• optimal plasma parameters (homogeneous plasma, partially ionized),
• optimal particle fluxes to the wall (high homogeneous wall flux),
• optimal liberation of fuel or impurity particles and low retention ofdischarge gas (reduce RF pulse length),
• optimal removal of the outgassed particles by the vacuum pumps (fore-see pumping time and high pumping speed),

Chapter 7 7-3
Restrictions in the optimization of ICWC are given by
• the presence of the nominal toroidal magnetic field: either 5.3 T or2.65 T),
• the available RF frequencies: 40 to 55 MHz, and
• the reliable and safe operation of the RF antenna.
The presented experimental data was obtained on TORE SUPRA, TEX-TOR, ASDEX Upgrade and JET, and the modeling efforts have been con-centrated mostly on TORE SUPRA and TEXTOR. Limitations in extrap-olating the efficiency of ICWC to ITER are consequently given by
• machine size and shape,
• available fRF/BT values,
• limiter or divertor configuration, and
• most importantly the wall materials,
summarized for the concerned tokamaks in table 7.1. Regarding the lastpoint, future experimentation on the JET device with its recently finalizedITER-like wall can bring closing information on the conditioning efficiencyof ICWC.
Table 7.1: Comparison of the relevant machine parameters of ITER, JET, TORESUPRA, TEXTOR and ASDEX Upgrade (AUG) for the extrapolation of ICWCresults to ITER.
R (m) a (m) Shape Wall mat. f/BITER 6.2 2 D Be/W 7.5
JET 2.96 1.25 D Carbon 7.5TORE SUPRA 2.4 0.72 O Carbon 12.6
TEXTOR 1.75 0.47 O Carbon 15.1AUG 1.65 0.5 D Tungsten 12.5
7.2.2 Discharge and wall flux homogeneity7.2.2.1 Plasma homogeneity
The ICRF discharges were found to be toroidally homogeneous on presentmachines, and can be poloidally inhomogeneous. Vertical inhomogeneitiesstem from plasma drifts and are more severe at higher RF powers. Thevertical homogeneity can be improved by applying a small vertical magnetic

7-4 Extrapolation to ITER
field, which should be typically of the order of 1− 1.5% of the toroidal fieldstrength (40 mT on TEXTOR for BT = 2.3 T and 30 mT on JET for BT =3.3 T). Radial inhomogeneities stem from inhomogeneous RF absorption.The employed ICRF heating antennas are designed to couple RF power todense target plasma (> 1019 m−3) via excitation of the fast wave (FW).The antenna vacuum RF field is evanescent on present size devices andthe standard cut-off density for FW excitation is too high to obtain FWpropagation in the typically low density ICWC plasmas (1016 − 1018 m−3).However, antenna operation schemes were found that allow to excite the FWalso in low density ICWC plasmas [94] (see section 2.3). These consist eitherof decreasing the cut-off density for FW propagation, namely operationat close to monopole strap phasing, and/or operation at high cyclotronharmonic numbers (e.i. at strongly reduced toroidal magnetic field values),or rely either on mode conversion (MC) scenarios of the evanescent FW intothe slow wave or ion Bernstein wave in plasmas with multiple ion species(which is the case in ICWC plasmas). The JET D2-ICWC experiments,simulating the ITER full field situation (ITER: BT = 5.3 T, fRF = 40 MHz;JET: BT = 3.3 T, fRF = 25 MHz) with on axis location of the fundamentalD+-ICR layer, while operating the antenna with monopole antenna strapphasing, evidenced the feasibility of filling the entire JET vacuum vessel withplasma. On application of a small vertical field of 30 mT, bright recyclingradiation was observed both at the central column on the HFS and in thedivertor area.
The ITER plasma volume will be significantly larger than that of presentdevices (see table 7.1). The LFS torus circumference equals about 50 m andthe height of the tokamak chamber will be about 8 m, which might affect thetoroidal and vertical plasma homogeneity. The distance from the antennato the on axis resonance layer will be 2 m, i.e. ∼ 1 m longer than on JET, thepresent largest machine. This means that to ensure the presence of plasmaat the HFS, in case the operation is based on mode conversion schemes,RF power has to be transported to the antenna distant (> 2 m) conversionlayer [94], requiring the excited FW to have a very long toroidal wavelength.To improve the radial homogeneity via MC schemes, it is proposed based onTOMCAT code predictions to employ the dual frequency mode of operationat intermediate toroidal field1 to improve the radial homogeneity [94]. Alsoantenna operation with monopole strap phasing, shifting the wave spectrumto longer wavelengths and bringing the cut-off density for FW propagationcloser to the antenna surface in the typical ICWC plasma densities, looks
1Utilization of two ICRF antennas at resp. f = 40 MHz and 48 MHz, BT = 3.6 T andwith He/H2-mixture: the fundamental H+-ion resonance for f = 40 MHz is located atthe LFS (antenna side, r = 2.3 m), fundamental H+-ion resonance for f = 48 MHz islocated at r = 0.9 m from axis.

Chapter 7 7-5
very promising to ensure radial homogeneous ICWC plasmas on ITER.Recent papers of Lyssoivan [157, 166] propose that due to the large
ITER vacuum vessel dimensions, a vacuum cavity RF Eigen-mode canbe excited if the ICRF system is tuned to ITER torus Eigen-frequencies:fTM010 = 42.98 MHz, TM-mode with on-axis maximum for the Ez-field(parallel to magnetic field). As a result initial ionization and plasma break-down may occur simultaneously over the whole torus which could facilitatethe operation of the ITER antenna in the ICWC mode, and even make theoperation safer.
7.2.2.2 Wall flux homogeneity
Section 2.5 summarized the evidenced wall fluxes in hydrogen and he-lium ICWC discharges. Both in hydrogen ICRF discharges as in heliumICRF discharges the wall flux consists predominantly of low energy neutralhydrogen atoms (∼ 3 eV): 1019 − 1020 /m2s in hydrogen discharges, and1018 − 1019 /m2s in helium discharges, stemming from wall desorbed hy-drogen. The latter fluxes are considered homogeneous. The H+-ion flux inhydrogen ICRF discharges is estimated to be 1017−1018 /m2s, and the He+-ion flux in helium ICRF discharges is of the order of 5 · 1016− 5 · 1017 /m2s,with an equal important contribution of wall desorbed hydrogen. Due to iontransport along the magnetic field lines the latter ion fluxes are expected tobe received predominantly by limiting surfaces. At the top, HFS and LFSof the vessel of present devices, these limiting surfaces consist of poloidalstructures, employed to localize the plasma wall interaction and to protectthe plasma facing components from high plasma fluxes. On the bottom ofthe vessel either the toroidal belt limiter or the divertor receives the ionflux. An important difference between ITER and the present devices isthat the ITER first wall will be completely shaped [125]. This makes thatthe plasma edge behind the limiting surfaces, evidenced on TORE SUPRA,TEXTOR and JET, will be inexistent on ITER. A homogeneous ICWCdischarge on ITER will thus effectively reach the whole inner wall area, andthus condition the whole wall.
For present devices it was proposed to inverse the vertical magnetic fieldbetween two sets of RF pulses to increase the effective total conditionedsurface area. Although the ITER first wall is shaped, adopting this methodmight be beneficial for ITER as well. The application of an oscillatingpoloidal magnetic field is however not recommended (see section 3.1).

7-6 Extrapolation to ITER
7.2.3 He-ICWCOn TORE SUPRA, He-ICWC was successfully used to recover tokamakoperation after disruptions, and was found to be at least as efficient as thestandard applied Taylor like conditioning technique for removing hydrogenicspecies and H2O, indicating that the optimized He-ICWC discharges canbe effectively employed for inter-pulse conditioning. A 300 s long He-ICWCconditioning procedure (15× 2 s RF pulses with 18 s of pumping time (PT)between subsequent pulses, pHe = 2·10−4 mbar and PRF,gen = 150 kW) couldremove on average 3.2 · 1020 H-atoms from the first wall, or an equivalentof 0.3 monolayers (averaged over three subsequent procedures). Respectingthree characteristic pumping times between two subsequent RF pulses, therequired ITER pumping time can be estimated at 27 s (τS ≈ 9 s, see section2.4.2.3), expanding the conditioning procedure length to 435 s. The plasmadensity was estimated by the 0D model to be 7 · 1017 m−3 (chapter 5, in-cluding pH2 = 8 · 10−6 mbar during plasma and 0.35% of impurities), with aHe+-ion wall flux of ∼ 3 · 1017 /m2s. Producing a similar plasma density onITER requires a coupled power of 4 to 5 MW. The required gas injectionrate is estimated to be Qsv = 3.1 Pa.m3/s, which will cause a gas load ofQsv = 1.4 kPa.m3 to the cryopanels in case of continuous gas injection, orQsv = 0.34 kPa.m3 per pump, i.e. less than 1% of the pump capacity.
During He-ICWC experiments on ASDEX Upgrade and JET, 60 to 80%of the injected helium was retained in the wall, which is thought to bedue respectively to retention in tungsten and retention in beryllium. SinceITER will employ these materials for its main plasma facing components,this point needs to be further investigated in future, e.g. on JET which ispresently equipped with an ITER like wall. The pulse cycle optimizationcriteria in terms of the ratio of retained discharge gas over recovered walldesorbed particles, used for hydrogen ICWC, might be adopted for He-ICWC as well. The ideal ratio for He-ICWC, and moreover for any He-based conditioning discharge, equals ‘zero’. In case the (eventual) heliumretention rates in beryllium and/or tungsten PFC’s during helium dischargeconditioning are unacceptable for ITER operation, conditioning dischargesin other (noble) gases may need to be developed for the above mentionedaims.
The statement that the optimized TORE SUPRA He-ICWC dischargescould be used for routine operation is supported by encouraging resultsfrom KSTAR. On KSTAR He-ICWC is routinely operated for inter-pulseand lunchtime conditioning to suppress the H2O base pressure during theexperimental operation campaigns, providing the required conditions fortokamak operation.

Chapter 7 7-7
7.2.4 D2-ICWCIn chapter 4 we concluded that hydrogen-ICWC is able to change the wallsurface state within short time scales (∼ minutes), both on carbon ma-chines JET, TORE SUPRA and TEXTOR, and on the tungsten machineASDEX Upgrade. On JET (170 m2), 8× 9 s D2-ICWC pulses were able toremove in total 1.8 · 1022 H-atoms from the JET first wall (6 monolayers).This number corresponds on ITER (900 m2, wall isotopic ratio 50:50 D:T)to 4.8 · 1022 T-atoms, or 240 mgT, which is of the same order of magni-tude than the expected tritium retention in one 400 s (burning time) D-TITER discharge, estimated at 140−500 mgT/shot [42], illustrating the highisotopic exchange efficiency of D2-ICWC. From chapter 6 it was howeverconcluded that ICWC predominantly exchanges particles with the subsur-face hydrogen reservoirs that are responsible for the short term hydrogenretention in normal tokamak discharges. The removal of tritium-rich code-posited layers is expected to occur at much slower rates: 0.13 monolayers ofcarbon, possibly stemming from codeposited layers, were removed duringthese JET D2-ICWC discharges. The utility of D2-ICWC for inter-pulseconditioning to mitigate the expected in-vessel tritium inventory build-up,which is mainly due to storage by codeposition [34] is thus not clear atthis point. D2-ICWC for codeposited layer removal will likely require longconditioning procedures for which reason, in section 7.1, the technique wasproposed for overnight conditioning.
The high removal rate of wall desorbed atoms in the JET experimentswas achieved at the price of an important retention of discharge gas. Itis shown that this discharge gas retention can be minimized by applyingshorter RF pulses, which has only a minor influence on the total amount ofremoved wall desorbed atoms. On TORE SUPRA, the ideal ‘retained overremoved’-ratio of 1 was obtained by applying 2 s long RF pulses with pH2 =2 · 10−4 mbar and PRF,gen = 60 kW, where each pulse cycle removed about1.5 ·1020 of wall desorbed D-atoms from the vessel (0.11 monolayers). Whenextrapolating this number to a D2-ICWC procedure on ITER, e.g. 15× 2 sRF pulses with 27 s PT between subsequent pulses, an amount of 1.7 mono-layers of hydrogenic particles (68 mgT) can be removed from the first wallin this 435 s procedure.
The removal efficiency is found to increase on increasing coupled RFpower. However, on increasing the discharge power, the optimal dischargelength decreases (see section 4.1.4). In case of continuous gas injection,the ideal pulse length can be found experimentally as the time instancewhere the wall desorbed hydrogenic partial pressures reaches a maximum(see Fig. 4.15). The plasma density in hydrogen RF discharges is typicallyone order of magnitude lower than in helium RF discharges. Reproducing

7-8 Extrapolation to ITER
the TORE SUPRA hydrogen ICWC plasma density or the JET coupledpower on ITER requires a coupled power of 1.5 to 2 MW. In chapter 4 itwas concluded that the ideal coupled power is the (highest) power at whichthe plasma can be produced homogeneously, while assuring reliable and safeantenna operation.
7.3 Implementing ICWC in the ITER opera-tion cycles
As stated in section 2.1, ICWC makes use of several main tokamak systems:the RF antennas, the gas injection valves, the machine pumps, the poloidalmagnetic field system and the present toroidal magnetic field. Additionallyneutral gas and plasma diagnostics are required to monitor the dischargeand the conditioning efficiency: namely high resolution mass spectrome-try and Penning gauge spectroscopy to distinguish hydrogen, deuterium,tritium and helium partial pressures, and plasma diagnostics adapted to di-agnose low temperature (∼ eV) low density (1016 − 1018 m−3) plasmas (seeappendix B). The ICWC mode of operation of the tokamak systems needsto be preparable in a reliable and time efficient manner, the latter especiallyin case of inter-pulse conditioning: respecting the tight tokamak dischargefrequency of one D-T discharge every 30 minutes, maximum 20 minutes willbe available to prepare and perform an inter-pulse ICWC discharge, in-cluding the preparation of the subsequent tokamak discharge. It shouldtherefore be considered to automate the preparations, requiring a minimumof manual interventions, and to simplify the ICWC technique as much aspossible, employing the minimum of tokamak systems (only one ICRH an-tenna and no assistance of additional heating systems such as ECRH fordischarge homogenization, if possible).
In the ITER project requirements [68] it is stated that the IC heatingand current drive system should be capable of providing heating and cur-rent drive, and producing ICWC plasmas. This means that either the fullantenna, or a subset of strap arrays needs to be able to operate in monopolephasing, at a frequency of 40 MHz, coupling in the range of 1.5 to 5 MW ofICRH power to the plasma (coupling efficiency ≥ 0.5 [94]). Operating theantenna in ICWC mode requires furthermore that the strap phasing andantenna matching needs to be controllable at the typical low ICWC powers.The strap voltages in ICWC need to be high enough so that the vacuumparallel electric field in front of the antenna is sufficiently high for produc-ing an ionization cascade (order of 4 − 5 kV/m in hydrogen at 40 MHz).Deleterious effects such as the presence of plasma inside the antenna box,multipactoring and high voltage arcs need to be detectable at the typical

Chapter 7 7-9
low ICWC powers, and distinguishable from the actual ICRF plasma break-down. The foreseen RF pulse durations range from 0.25 to 5 s, dependingon the applied discharge power and discharge gas. Operation at torus pres-sures above 10−3 mbar has to be avoided for antenna safety considerations(see section 2.3.4.2), and of course, ICRF operation at ICWC pressures butin absence of the toroidal magnetic field has to be prohibited as well.
For the gas injection a continuously constant injection rate is preferable,using multiple injection valves equally divided over the torus wall. Theforeseen neutral gas pressures ranges from (1−5) ·10−4 mbar (in absence ofplasma). On JET, the gas injection was activated after the application ofthe RF power to limit the neutral gas pressure in the vacuum transmissionlines, limiting the risks for arcing generation. Due to the preferred multi-pulse ICWC procedures on ITER it is however not time efficient to awaitthe complete evacuation of the neutral gas before the application of a nextRF pulse. Partial suppression of the neutral pressure, by stopping the gasinjection at the end of each RF pulse, is however possible.
The foreseen cycling of the eight ITER torus cryopumps, ensuring theoperation of four cryopumps at all time, needs to be maintained also duringthe ICWC procedures. To obtain a high discharge conditioning efficiency,high pumping speeds are required. For an optimal removal efficiency theforeseen pumping time between two RF pulses needs to respect three char-acteristic pumping times (e.g. 3× 9 s)2.
A static vertical magnetic field of 1 − 1.5% of the toroidal magneticfield is recommended to improve the discharge homogeneity. On presentdevices, the inversion of the vertical magnetic field between two sets of RFpulses increases the effective plasma wetted area. The latter might also bebeneficial on ITER.
2The ITER pumping system is currently re-designed, featuring a lower pumping speed,which is disadvantageous with respect to the conditioning efficiency of discharge condi-tioning techniques. For an optimal conditioning efficiency, the pumping speed needs tobe high. The optimal duty cycle needs to be adapted to the final design.


8Conclusion
The discharge wall conditioning techniques foreseen to be employed duringthe two weeks long operational cycles of ITER require to operate in pres-ence of the toroidal magnetic field. The presence of the latter magnetic fieldprevents the use of standard glow discharge conditioning (GDC). Alterna-tive discharge conditioning methods are: the use of tokamak discharges forinter-pulse conditioning (separatrix scanning or controlled disruptions), andion cyclotron wall conditioning (ICWC) and/or pulsed glow discharge con-ditioning (P-GDC1) for inter-pulse and overnight conditioning. The qualifi-cation of wall conditioning discharges applicable in presence of the toroidalmagnetic field for inter-shot and overnight conditioning during ITER oper-ation cycles is considered a high priority task. The conditioning dischargesneed to mitigate the tritium inventory build-up, to achieve the required lowrecycling levels at plasma start-up and to reduce impurity (and fuel) levelsafter plasma disruptions. This manuscript focused on the study and opti-mization of the very promising ICWC technique and assessed its efficiencyand applicability to ITER.
The 1st chapter of this manuscript presented the general frame of thePhD subject, covering the motivation for developing magnetic fusion, thetokamak principle, a presentation of the European tokamaks TORE SUPRA,TEXTOR, ASDEX Upgrade and JET, the ITER project, the important in-fluence of plasma wall interaction on tokamak plasma performance, the
1The applicability of P-GDC on ITER still needs to be assessed.

8-2 Conclusion
resulting need for wall conditioning and the presently employed wall condi-tioning techniques. The first part of the 2nd chapter explained the principleof ICWC and summarized the state of the art before the start of this PhD,from which the aims of this PhD work were distilled. Hereafter the RFphysics aspects of ICWC, the neutral gas cycle in the vacuum vessel (gasinjection and vacuum pumps), and an overview of the during this manu-script evidenced plasma wall fluxes were presented. The main results of thisPhD were presented in chapters 3 to 6. The emphasis in these chapters isput on discharge characterization, and the study and optimization of theconditioning efficiency. The material of these chapters is obtained duringdedicated experiments on the mentioned four European tokamaks, and fromthe developed 0D plasma model and plasma wall interaction model. Finally,in the last chapter of this manuscript (chapter 7), an assessment was madeon the applicability and the implementation of ICWC on ITER, based onwhat was learned from the previous chapters.
The first part of this conclusive chapter gives a review of the obtainedresults, covering RF physics aspects, discharge and wall flux homogeneity,the wall conditioning efficiency, the modeling of hydrogen-helium plasmasand the simulation of the plasma wall interaction. The second part ofthis conclusive chapter represents the general conclusion of this manuscript,containing a review of the ICWC discharge and plasma parameters, and theenvisaged aims and obtainable efficiencies of ICWC on ITER.
Overview resultsRF physics aspectsThe RF physics aspects of ICWC were summarized in section 2.3, startingwith an overview of important RF terms, the employed ICRF antennas ofthe four tokamaks and the experienced deleterious effects on the TORESUPRA antennas, which remain presently not fully understood. ICRF dis-charge production (in the present-size fusion machines and frequency bandof 20 to 60 MHz) can be divided into the pre-wave stage, where the electronplasma frequency is smaller than the RF generator frequency (ωpe < ωRF),and the plasma wave stage (ωpe > ωRF). The initial breakdown phase cor-responds to the pre-wave phase. The plasma density build-up in the initialbreakdown phase is due to collisional ionization by electrons accelerated inthe near antenna parallel electric field. Two models were presented that de-scribe this phase. They provide criteria for obtaining plasma breakdown andto avoid spurious plasma formation inside the antenna box. The first model,developed by Dr. A. Lyssoivan, describes the plasma breakdown in front of

Conclusion 8-3
the antenna as a function of the toroidal geometry of the parallel electricfield, the electric field strength, and the RF frequency. For a given antennavoltage, lowering the RF frequencies moves the radial breakdown regionaway from the antenna. A longer decay length of the evanescent vacuumRF field expands the breakdown region. The second model, developed byProf. C. Schüller, takes into account electron multiplication reactions alongthe whole torus, and includes a breakdown dependency on the dischargepressure, providing a safety criteria on the maximum tolerable dischargepressure to avoid plasma formation at the level of the antenna Faradayscreen: pH2 < 10−1 Pa. The contribution of this PhD work to the descrip-tion of the initial breakdown phase consists of a numerical study of theevolution of the electron spatial energy distribution in the initial dischargephase. For this the Vlasov equation is solved for a 1D electron distribu-tion along a toroidal magnetic field line, and a 1D parallel RF electric fielddistribution, respecting the TEXTOR antenna and torus dimensions. Themodeling is carried out to obtain information on whether the plasma buildsup mainly in front of the antenna on present devices, or whether electronmultiplication along the torus significantly contributes. Only a limited num-ber of RF periods could be simulated due to divergence problems, renderingthe analysis fruitless at this point.
In the wave phase, the electromagnetic field expands in the vessel volumecausing further space ionization. In this phase the RF power is absorbedmainly collisionally by electrons. Antenna operation schemes were presentedthat improve the plasma breakdown time, the efficiency for RF power cou-pling to the plasma and the plasma homogeneity [94]. These consist eitherof decreasing the cut-off density for FW propagation, namely operation atclose to monopole strap phasing and/or operation at high cyclotron har-monic numbers (e.g. at strongly reduced toroidal magnetic field values), orrely on mode conversion scenarios of the evanescent FW into the slow waveand ion Bernstein wave in plasmas with multiple ion species (which is thecase in ICWC plasmas). It was concluded that for ICRF plasma produc-tion, monopole strap phasing of the ICRF antennas, is the optimal mode ofoperation.
Chapter 3: Discharge and wall flux homogeneityIn chapter 3 experimental facts on the discharge homogeneity were pre-sented and the contributions of the confinement properties of the ICWCmagnetic configuration to the inhomogeneities were analyzed. Achievinghomogeneous RF conditioning discharges is important to ensure the effec-tive conditioning of the maximum vessel wall area. It is found that theobserved radial inhomogeneities can be explained in terms of RF power

8-4 Conclusion
absorption properties, and that vertical inhomogeneities are due to the con-finement properties of the magnetic configuration. Close to the vessel walls,in regions where the magnetic field lines are limited by wall structures suchas poloidal limiters, the plasma density is observed to decrease exponen-tially, which evidences the existence of a plasma edge in ICRF discharges.The exponential decrease is characterized by Bohm diffusion. Due to theexistence of this edge plasma, the ion wall flux is concluded to be largeston the first limiting surfaces. On ITER the ion wall flux is expected to behomogeneous since no dedicated limiting structures will be present in thevessel, other than the shaped first wall itself.
In order to obtain a radially homogeneous RF plasma in the vessel,proper wave propagation or at least a large decay length of the evanescentRF field is required, allowing to sustain the plasma also at the HFS. It isproposed that the vertical inhomogeneity, showing systematically a higherdensity at the top of the vessel than at the bottom, is due to the combinedgradient and curvature drift of the electrons and the polarization drift ve-locity of the ions. A review of the plasma confinement properties showsthat due to these drifts, at discharge initiation the plasma moves as a wholeto the top of the vessel (for clockwise toroidal magnetic field). By apply-ing a small vertical magnetic field that stretches the plasma in the verticaldirection, the vertical homogeneity can be improved. During D2-ICWC ex-periments on JET, the largest present device, the ITER full field conditionswith on axis location of the fundamental D+-ICR layer could be simulated(ITER: BT = 5.3 T, fRF = 40 MHz; JET: BT = 3.3 T, fRF = 25 MHz),while operating the antenna in monopole antenna strap phasing. The ex-periments evidenced the feasibility of filling the entire JET vacuum vesselwith plasma. On application of a small vertical field of 30 mT, bright recy-cling radiation was observed both at the central column on the HFS and inthe divertor area.
A formula is derived for the charged particle confinement time, takinginto account charged particle drifts, diffusion and losses along the tiltedmagnetic field lines. It is found that for partially ionized plasmas the con-finement time is only weakly dependent on the applied small vertical mag-netic field.
Chapter 4: Wall conditioning efficiencyIn chapter 4 an overview was given of the experimental results on the effi-ciency of ICWC, obtained on TORE SUPRA, TEXTOR, JET and ASDEXUpgrade. Firstly the isotopic exchange efficiency of H2 and H2/He dis-charges was studied, and secondly the efficiency for wall desaturation andrecovery of normal tokamak operation after disruptions using helium dis-

Conclusion 8-5
charges was studied. In these experiments, the ability of ICWC to changethe surface state was shown, the wall fluxes were characterized, particledesorption and retention rates are calculated and the dependencies of theconditioning efficiency on RF power, discharge pressure, magnetic fields,etc. are treated. Finally also, the ICWC efficiency for impurity and code-posited layer removal is discussed.
It was shown that hydrogen ICWC is able to change the surface statewithin short time scales (removal of hydrogenic monolayers within minutes),both on carbon machines TORE SUPRA, TEXTOR and JET as on tung-sten device ASDEX Upgrade. The removal of wall isotopes can go at theprice of an up to 10 times higher retention of the discharge gas. It wasshown experimentally that the ratio of retained over recovered atoms canbe significantly lowered by optimizing the RF duty cycle. The ideal ratioof 1 is been achieved both on TORE SUPRA and on TEXTOR.
The cause of the retention was investigated. Firstly, no ‘long term’saturation effects of the retention could be evidenced. Even after 15 min.of cumulated RF discharge time on TORE SUPRA, still extra hydrogenstorage was observed. From this it was concluded that mechanisms such asretention in deeper layers, retention by codeposition and retention in remoteareas might play an important role in ICWC discharges. From experimentson the tungsten machine ASDEX Upgrade, where the high retention rateswere also observed, it was concluded that mechanisms other than code-position with carbon have to be considered to explain the retention. Bycomparing the integrated total energetic CX atom flux on JET with theamount of retained isotopes it was concluded that direct implantation ofthese energetic particles is not the determining mechanism of the hydrogenretention. Additionally it was found that the fast CX atoms have also a lim-ited contribution to the wall release. Both findings were confirmed by theparticle balances for two TEXTOR isotopic exchange discharges, resp. withand without fast particle population (high and low BT ). On ASDEX Up-grade it was found that 11% of the retained hydrogen could be recoveredby He-GDC illustrating that a significant part of the retained hydrogen isstored in layers accessible by GDC. As it was concluded that hydrogen reten-tion is probably not due to codeposition, nor solely due to the fast particlefluxes, the remaining retained hydrogen (89%) must be stored differently.The hypothesis was made that ICWC discharges reach surface areas thatare not accessible by glow discharges. Also the existence of a substantialnon-resonant ion wall flux component with energies above the typical GDCflux, causing retention in deeper layers, can at this point not be excluded.Both points require further investigation.
It was found that the measured high retention during the ICWC dis-

8-6 Conclusion
charges can be understood as an effect of the high reionization probability:the probability that a neutral molecule will be ionized or dissociated insteadof removed by the machine pumps. An extensive comparison of the isotopeexchange efficiencies of ICWC and GDC on TORE SUPRA and TEXTORlearned that GDC can achieve 5 to 10 times higher removal rates of walldesorbed species by the machine pumps than ICWC, although the wall re-lease rate of particles during ICWC is about 10 times higher than in GDC.These both points are due to the higher electron density of ICWC dischargescompared to GDC, which makes the reionization probability in ICWC dis-charges (∼ 99.8%) is much higher than in GDC (∼ 86%). Consequentlythe removal efficiency of wall desorbed species by the machine pumps is lessefficient in ICWC than in GDC. Even if the fraction of the wall flux thatwill be permanently retained is identical in GDC and in ICWC (e.g. 0.2%),the 10 times higher wall fluxes and the lower pumping probability in ICWCmakes that the permanent retention rate in ICWC can be problematic (ifnot optimizing the RF duty cycle), whereas the extra retention in GDC isnegligible.
Since reionization and wall flux retention only occurs during the plasmadischarge, and since it was shown that most of the wall desorbed gas isrecovered after the RF pulse, the use of shorter RF pulses (∼ 1 s) separatedby sufficient time between pulses to recover the wall desorbed particles bythe machine pumps (∼ 20 s on TORE SUPRA) significantly reduces theretention, without severely lowering the total amount of removed particles.
It was found that the absolute removal efficiency of wall desorbed parti-cles is higher at higher feedback pressures (TEXTOR: 1 · 10−4 mbar vs. 5 ·10−4 mbar). Regarding the RF power it was found that the efficiency in-creases on increasing power (although the pulse length has to be decreasedat higher RF powers, since retention is more important at higher powers),but that the gain is limited. The ideal RF power is the power at which thedischarge can be established most reliably from point of view of antennaoperation, and at which the discharge is most homogeneous. Whereas thetoroidal field strength has a limited effect on the conditioning efficiency (atfixed coupled power), the ICWC conditioning efficiency can be improvedby applying a vertical magnetic field. As charged particles are transportedalong the magnetic field lines, tilting the field lines can slightly increase orchange conditioned areas.
He-ICWC discharges were successfully applied on TORE SUPRA to de-saturate the wall from hydrogenic particles. In three discharges consistingeach of 15× 2 s RF pulses with 18 s PT between pulses (pHe = 2 · 10−4 mbarand PRF,gen = 200 kW), 1 monolayer, or 5 to 10% of the short term retentionaccessible by plasma operation, could be removed illustrating the effective-

Conclusion 8-7
ness of He-ICWC. The hydrogen is mostly recovered after the RF pulsewhich indicates that including pumping time in the conditioning procedureincreases the removal efficiency of wall desorbed particles. The removalefficiency is also a clear function of the coupled power: for a same dis-charge length, the hydrogen removal efficiency increases with a factor 2 onincreasing the coupled power form 50 kW to 150 kW. It is expected thatredeposition of wall desorbed particles is as in the case of H2-ICWC alsoimportant in He-ICWC. Therefore, although it was found that the amountof removed hydrogen from the wall improves on increasing pulse length, itis recommended to also limit the RF pulse length in He-ICWC.
On TORE SUPRA, He-ICWC was successfully applied to recover normaltokamak operation after plasma disruption events (3/3 attempts successful).It is found that the removal efficiency of He-ICWC is at least as efficient asthat of the routinely operated TDC technique, both for hydrogen removalas for removal of H2O, indicating that the optimized He-ICWC dischargescan be used for inter-pulse conditioning during experimental campaigns onTORE SUPRA.
Both on JET and ASDEX Upgrade is was found that during helium con-taining ICWC discharges, a significant amount of the injected helium wasconsumed by the wall, resp. 80% and 60%. The beryllium elements on theICRF antennas are thought to be responsible for this on JET. The heliumlosses are also reported for He-GDC on ASDEX Upgrade. Since ITER willhave as main plasma facing components tungsten and beryllium it is impor-tant to investigate this effect further in future, e.g. on JET which is presentlyequipped with an ITER like wall. The pulse cycle optimization criteria interms of the ratio of retained discharge gas over recovered wall desorbedparticles, used for hydrogen ICWC, might be adopted for He-ICWC as well.The ideal ratio for He-ICWC, and moreover for any He-based conditioningdischarge, equals ‘zero’. In case the (eventual) helium retention rates inberyllium and/or tungsten PFC’s during helium discharge conditioning areunacceptable for ITER operation, conditioning discharges in other (noble)gases may need to be developed to substitute helium discharge conditioning.
During JET D2-ICWC experiments (8 × 9 s long RF pulses) where thewall was preloaded by H2-GDC, 0.13 monolayers of carbon were removedfrom the vessel. This relatively high removal efficiency can however not beextrapolated to the removal efficiency of codeposited layers since the carbonsource is not known. The exposure of samples to TEXTOR ICWC plasmasto evidence carbon erosion or deposition remained inconclusive. On JET itwas found that the impurity removal efficiency improves on increasing thedischarge power, and finally it was evidenced that there is no clear influenceof the present energetic CX flux on the removal of impurities (TEXTOR

8-8 Conclusion
experiments at high and low BT ).The removal efficiency of the marker gas argon was tested on TEXTOR.
In only seven 5 s H2-ICWC pulses (PRF,gen = 2×50 kW, pH2 = 5·10−4 mbar),25% of the introduced argon by H2/Ar-GDC could be removed. This illus-trates that ICWC reaches a large part of the wall area affected by GDC.
Finally it was illustrated both on TEXTOR (H2-ICWC) and TORESUPRA (He-ICWC) that ICWC can reduce the oxygen content in the vac-uum vessel. Whether this removal efficiency is sufficient to ensure tokamakoperation could not be tested in the course of this PhD. For this ICWC hasto be tested as routine conditioning technique during experimental cam-paigns. Promising results on this subject were reported by the KSTAR-team [130]. The superconducting tokamak KSTAR employs He-ICWC rou-tinely for inter-pulse and lunchtime conditioning, in order to keep the vesselH2O pressure below the operational limit.
Chapter 5: 0D modeling of hydrogen-helium ICWC plas-masIn chapter 5 the 0D kinetic description of magnetized toroidal hydrogen-helium RF discharges was outlined. The model is developed to obtain in-sight on ICRF plasma parameters, particle fluxes to the walls and the maincollisional processes, the latter being the fundamental mechanism for thebuild-up of a plasma. This is of particular importance since most standardtokamak plasma diagnostics are not adapted to diagnose the typical lowtemperature and low density RF plasmas.
The 0D plasma description is based on the energy and particle balanceequations for nine principal species: H, H+, H2, H+
2 , H+3 , He, He+, He++
and e−. It takes into account (1) elementary atomic and molecular collisionprocesses, such as excitation/radiation, ionization, dissociation, recombina-tion, charge exchange, etc. and elastic collisions, (2) particle losses due tothe finite dimensions of the plasma volume and confinement properties ofthe magnetic configuration, and particle recycling, (3) active pumping andgas injection, (4) RF heating of electrons (and protons) and (5) a qualitativedescription of plasma impurities.
On inclusion of plasma impurities the model reproduces experimentalplasma density dependencies on discharge pressure and coupled RF power,both for hydrogen RF discharges (ne ≈ (1 − 5) · 1010 cm−3) as for heliumdischarges (ne ≈ (1− 5) · 1011 cm−3). The modeled wall fluxes of hydrogendischarges are in the range of what is estimated experimentally: ∼ 1019 −1020 /m2s for H-atoms, and∼ 1017−1018 /m2s for H+-ions. In case of heliumRF discharges it is found that the wall desorbed particles contribute largely

Conclusion 8-9
to the wall flux. The main wall bombarding flux are hydrogen neutrals.The helium and hydrogen ion flux are approximately of the same orderof magnitude although the hydrogen neutral pressure, stemming from walldesorption, is in accordance to mass spectrometry data less than 5% of thehelium neutral pressure.
The presented 0D ICWC plasma model allowed to reproduce experi-mental pressure, density and coupled power temporal dependencies of aTORE SUPRA H2-ICWC discharge from discharge initiation to steady stateplasma, and gave insight into the particle wall fluxes and retention rates.The wall interaction, represented in the model by a particle recycling coef-ficient, has a major influence on the neutral pressure and plasma density inH2-ICWC discharges (in case of constant injection). During the breakdownphase, particles are transiently stored in the wall causing a steep pressuredrop while during the plasma phase an equilibrium pressure is formed wherethe permanent hydrogen retention rate approximately equals the gas injec-tion rate. This modeling result reconfirms that employing shorter RF pulses(∼ 1 to 2 s) instead of long or continuous discharges is favored to limit re-tention, while maximizing the recovery of transiently stored particles.
It is estimated that a reconsideration of the inclusion of plasma impu-rities is required to reproduce the on TEXTOR evidenced sudden plasmadensity increase on increasing the discharge helium concentration in He/H2-ICWC discharges, while keeping the total pressure constant. Since thecoupled power, and thus the coupling efficiency does not show a similardiscontinuity it is expected that collisional processes lie at the basis of thiseffect. To better understand the role of the RF power coupling aspects onthis effect an upgrade of the 0D model to 1D, including a self consistentdescription of the coupled RF power is required.
Chapter 6: Modeling of the wall interactionIn chapter 6 a minimum structure for a 0D reservoir model of the TORESUPRA (carbon) wall was determined to obtain more insight in experi-mental isotopic exchange particle balances. The hypothesis used to buildup the model is that the same model structure should be able to describethe wall behavior during normal plasmas and conditioning procedures. Themodel consists of a reduced plasma model based on the 0D model describedabove, coupled (via wall fluxes and wall release rates) to the wall descrip-tion. The wall description is based on four reservoirs: an accessible reservoirin which trapping, detrapping and exchange of particles is possible, a per-manent reservoir in which only retention is possible, a transient reservoirrepresenting diffusing particles in the wall and an additional reservoir ac-counting for effects that become important on high filling degrees of the

8-10 Conclusion
accessible reservoir. The formulated balance equations are able to describethe time evolution of retention rates in long TORE SUPRA discharges, toreproduce the slow change-over of the wall isotopic ratio, to illustrate thedependency of the maximum concentration of accessible particles in the wallon discharge power and to simulate natural plasma density, i.e. a plasmathat is solely fueled by the wall.
Using the same wall parameters, the model also allows to simulate theH2, HD and D2 partial pressures during ICWC isotope exchange discharges.It is found that there is a strong interaction with the typical accessible hy-drogen reservoir in carbon and that hydrogen removal from the permanentreservoir is not needed to be included in the model to reproduce the exper-imental ICWC data. At the same time, the fraction of the wall flux thatenters into the permanent reservoir and that is thus permanently lost inthe walls is significant (∼ 1.5%). Moreover, the model illustrates also thatthe wall flux consists both of injected hydrogen isotopes and wall desorbedhydrogen isotopes, stemming from the accessible reservoir. If not optimiz-ing the RF duty cycle, this recycling process will make that a large part ofthe desorbed wall isotopes will be retained in the permanent reservoir. Atthis point it is not clear whether the permanently stored particles can beretrieved, and thus whether hydrogen ICWC can be effectively applied formitigating the tritium inventory build-up in ITER. Additional experimen-tation will be required to study this further.
The model is used to study the isotopic exchange efficiency as a functionof the discharge timing (RF pulse length and interval between subsequentRF pulses) and the machine pumping speed. It is possible from the wallmodel to identify the ideal RF pulse length and pumping time between sub-sequent pulses to maximize the amount of recovered particles from the wall,while minimizing firstly the retention of injected gas, and secondly the im-plantation of wall desorbed particles into the permanent retention reservoir.The optimal discharge timing depends on the wall parameters (materials)and discharge parameters, and additionally to allow for achieving high con-ditioning efficiencies it is very important that the vacuum pumping speed ishigh. For a TORE SUPRA H2-ICWC discharge with pH2 = 1.75·10−4 mbar,PRF,gen = 60 kW and pumping speed of τS = 6 s, the ideal discharge tim-ing consists of 2 s RF pulses every 20 s, i.e. respecting three characteristicpumping times (3τS) between 2 discharge pulses.

Conclusion 8-11
General conclusionICWC discharge and plasma parametersICWC, operated in presence of the toroidal magnetic field, makes use offour main tokamak systems: the ICRF antennas to initiate and sustain theconditioning discharge, the gas injection valves to provide the discharge gas,the machine pumps to remove the wall desorbed particles, and the poloidalmagnetic field system to optimize the discharge homogeneity. Additionallyneutral gas and plasma diagnostics are required to monitor the dischargeand the conditioning efficiency. The typical ICWC discharge pressures rangefrom 2 · 10−5 to 5 · 10−4 mbar, with applied ICRF powers between 50 and400 kW (on present devices), resulting in partially ionized low temperatureplasmas (Te = 3−5 eV) with densities in the order of ne ≈ (1−5)·1010 cm−3
for hydrogen RF discharges and ne ≈ (1 − 5) · 1011 cm−3 for helium dis-charges. The conditioning efficiency increases on increasing pressure andpower. Pressures higher than 10−3 mbar have to be avoided for antennasafety considerations. The ideal RF power is the power at which the dis-charge can be established most reliably from point of view of antenna oper-ation, and at which the discharge is most homogeneous. For an optimal ra-dial plasma homogeneity, antenna coupling efficiency and plasma breakdowntime, the antennas are operated in monopole phasing on present devices.The recommended vertical magnetic field to increase the vertical homogene-ity is of the order of 1 − 1.5% of the toroidal field. ICWC discharges areoperated preferably in pulsed mode, with RF pulse lengths of the order of∼ 1 s, dependent on the coupled RF power, and respecting three character-istic vacuum pumping times between subsequent pulses. This allows for anoptimal removal of wall desorbed particles between RF pulses, and limitsthe permanent retention of discharge gas and wall desorbed particles. Foran optimal removal efficiency, the pumping speed needs to be as high aspossible.
ICWC discharges (like other discharge conditioning discharges) are ini-tiated to produce a controlled flux of particles to the plasma facing compo-nents (PFC’s). The interaction between this flux and the wall surfaces aimsat removing impurities and fuel particles from the first wall (see furtherfor specific conditioning aims). In section 2.5 an overview of the character-ized wall flux during ICWC discharges was given, which we will repeat herebriefly. Hydrogen ICWC:
• Neutral particles: 1019 − 1020 /m2s (homogeneous over wall area),3− 5 eV (chemical erosion), stemming predominantly from the disso-ciation of neutral hydrogen molecules.

8-12 Conclusion
• Energetic neutral particles: 1015 − 1017 /m2s (also homogeneous),1−10 keV (physical sputtering), stemming from CX collisions betweenlow energy neutrals and high energy ions, produced by resonant ab-sorption of RF power at the resonance layers. The contribution of thisenergetic CX flux to the conditioning effect is limited.
• Ions: 1017−1018 /m2s consisting mainly of H+-ions, inhomogeneous onpresent devices: since ions are transported along the magnetic fieldlines, the highest flux will be on first limiting surfaces (due to theshaped ITER wall, the ion wall flux is expected to be homogeneouson ITER). The energy of the impinging ions is presently unknown(plasma ions of ∼ 3 eV which energy might increase due to sheatheffects).
Helium ICWC:
• Ions: 5 ·1016−5 ·1017 /m2s consisting mainly of He+-ions, the highestflux will be on limiting surfaces. An additional large ion flux contri-bution from wall desorbed hydrogen was evidenced.
• Neutrals: stemming from wall desorbed hydrogen, 1018 − 1019 /m2s,3− 5 eV.
Feasible conditioning aims of ICWC on ITERThe aims for conditioning techniques during the ITER operational cycles,namely when the toroidal magnetic field is present, are controlling the in-vessel impurity content, controlling the recycling of hydrogenic fluxes andreducing the tritium inventory (as part of the good household approachproposed by Roth et al. [34] to keep the in-vessel tritium level below theadministrative limit of 640 g).
The envisaged conditioning gases are presently hydrogen and helium.He-ICWC discharges are found to be efficient for desaturating the wallson TORE SUPRA, have been successfully employed to recover tokamakoperation after plasma disruption events on TORE SUPRA, are found tobe at least as efficient as the routinely employed TDC technique on TORESUPRA, and were mentioned to be efficient for reducing the H2O vacuumbase pressure in the KSTAR device. He-ICWC is concluded to be a highpotential candidate technique for inter-pulse conditioning on ITER. It isconcluded that from operational point of view the conditioning aims forHe-ICWC can be summarized as:
• recovering plasma start-up after disruptions,

Conclusion 8-13
• desaturating the wall from hydrogen isotopes to ensure plasma start-up, and
• improving the plasma performance by impurity removal.
Helium retention in beryllium and tungsten might however be severe, and re-quires further study (required for all helium based conditioning techniques).
H2-ICWC is shown to be able to change the surface state within shorttime scales (removal of hydrogenic monolayers within minutes), both oncarbon machines TORE SUPRA, TEXTOR and JET as on tungsten de-vice ASDEX Upgrade. Most of the removed hydrogen is thought to stemfrom the typical accessible wall surface reservoirs responsible for the shortterm retention during tokamak discharges. During JET D2-ICWC exper-iments (8 × 9 s long RF pulses) that were able to remove 6 monolayers ofhydrogen atoms from the wall, at the same time 0.13 monolayers of car-bon were removed from the vessel. This relatively high removal efficiencycould however not be extrapolated to the removal efficiency of codepositedlayers. It is nevertheless expected that the removal rate of codeposited lay-ers occurs at much lower speeds than the exchange of hydrogen isotopeswith the accessible surface reservoir. For significant removal of tritium-richcodeposited layers on ITER employing the optimized D2-ICWC technique,long conditioning procedures are likely required. The conditioning aims forH2-ICWC (or D2-ICWC) are:
• changing the wall isotopic ratio to control the plasma isotopic ratio,
• improving the plasma performance by impurity removal, and
• removing tritium, for which long procedures are required.
On ITER, hydrogen ICWC could thus be adopted for overnight condition-ing, followed by He-ICWC to ensure low recycling in the subsequent toka-mak plasma.
Application of ICWC on ITEROn ITER the ICWC mode of operation of the tokamak systems needs tobe preparable in a reliable and time efficient manner, with a minimum ofmanual interventions. A 435 s long He-ICWC procedure is proposed forITER inter-pulse conditioning, extrapolated from optimized discharge re-sults obtained on present tokamaks. The procedure consists of 15 × 2 sRF pulses, respecting three characteristic vacuum pumping times betweentwo subsequent RF pulses (3τS = 27 s), pHe = 2 · 10−4 mbar and a cou-pled power between 4 and 5 MW. The proposed pulsed mode of operation

8-14 Conclusion
allows optimal removal of wall desorbed particles and will limit eventualhelium retention in the PFC’s. Extrapolated from TORE SUPRA results,the procedure allows to remove 0.3 monolayers of hydrogen isotopes fromthe first wall. The required helium gas injection for this procedure corre-sponds to less than 1% of the cryopump capacity. Also a 435 s long H2or D2-ICWC procedure is proposed for ITER (that needs to be prolongedin case of overnight conditioning), extrapolated from optimized dischargeresults on present tokamaks. The procedure consists of 15× 2 s RF pulses,respecting three characteristic vacuum pumping times between two subse-quent RF pulses (3τS = 27 s), pH2/D2 = 2 · 10−4 mbar and a coupled powerbetween 1.5 and 2 MW. Also for hydrogen ICWC, the proposed pulsedmode of operation optimizes the removal of wall desorbed particles and lim-its discharge gas retention. Extrapolated from TORE SUPRA results, theprocedure allows to remove 1.7 monolayers of hydrogen isotopes from thefirst wall, corresponding to 68 mg of tritium in case of a 50:50 D:T wall iso-topic ratio. To ensure optimal discharge homogeneity for both conditioningprocedures, a vertical magnetic field is proposed of the order of 1− 1.5% ofthe toroidal field, and the expected ideal antenna strap phasing is monopolephasing.

References
[1] International Energy Outlook 2010. Electronic publication, U.S. En-ergy Information Administration, Office of Integrated Analysis andForecasting, U.S. Department of Energy, Washington, DC 20585, July2010.
[2] Supply of Uranium. Electronic publication, World Nuclear Associa-tion, 22a St James’s Square, London SW1Y 4JH, United Kingdom,December 2010.
[3] Three Mile Island, Chernobyl, and Tokaimura. Electronic publication.Website of the Health Physics Society.
[4] H. Nifenecker. Superphénix en chiffres. Electronic publication, ISNGrenoble, February 1998.
[5] W. Marth. The Story of the European Fast Reactor Cooperation. Tech-nical report, Kernforschungszentrum Karlsruhe GmbH, Postfach 3640,76021 Karlsruhe, 1993.
[6] J. Ongena and G. Van Oost. Energy for future centuries, Prospectsfor fusion power as a future energy source. Trans. Fus. Sci. Tech., 49,2006.
[7] O. Edenhofer et al. Summary for Policymakers, pages 1–25. Cam-bridge University Press, Cambridge, United Kingdom and New York(NY), USA, May 2011. In IPCC Special Report on RenewableEnergy Sources and Climate Change Mitigation [O. Edenhofer, R.Pichs-Madruga, Y. Sokona, K. Seyboth, P. Matschoss, S. Kadner, T.Zwickel, P. Eickemeier, G. Hansen, S. Schlömer, C. v. Stechow (eds)].
[8] W. Nuttall. Fusion as an Energy Source: Challenges and Opportuni-ties. Technical report, Institute of Physics, 76 Portland Place, LondonW1B 1NT, UK, September 2008.
[9] M. Vanderhaegen and G. Janssens-Maenhout. Considerations onsafety and proliferation-resistant aspects for the MSBR design. Nu-clear Engineering and Design, 240(3):482 – 488, 2010.

9-2 References
[10] M. Vanderhaegen, G. Janssens-Maenhout, P. Peerani, and A. Poucet.On the proliferation issues of a fusion fission fuel factory using amolten salt. Nuclear Engineering and Design, 240(10):2988 – 2993,2010. 4th International Topical Meeting on High Temperature ReactorTechnology (HTR 2008), with Regular Papers.
[11] H. A. Bethe. The fusion hybrid. Physics Today, 32(5):44–51, 1979.
[12] M. B. Kalinowski and L. Colschen. International Control of Tritium toPrevent Horizontal Proliferation and to Foster Nuclear Disarmament.Science & Global Security, 5:131–203, 1995.
[13] C. Nave. Fission and fusion can yield energy. Electronic publication,July 2011. HyperPhysics, Department of Physics and Astronomy,Georgia State University, Atlanta.
[14] A. Bradshaw, T. Hamacher, and U. Fischer. Is nuclear fu-sion a sustainable energy form? Fusion Eng. & Design, DOI:10.1016/j.fusengdes.2010.11.040:–, 2011.
[15] J. Wesson. Tokamaks. Oxford Science Publications, Clarenden Press,Oxford, 2nh edition edition, 1997.
[16] Electronic publication. FOM Institute for Plasma Physics, Rijnhuizen.
[17] Electronic publication. A website from the Institute of Physics, IOP.
[18] N. Fecorczak. Etude Expérimentale du Transport Turbulent au Bordd’un Plasma de Tokamak. PhD thesis, l’Université de Provence(France), Septembre 2010. Service Intégration Plasma Paroi, Insti-tut de Recherche pour la Fusion Magnétique, CEA Cadarache.
[19] B. Schweer et al. Limiter Lock Systems at TEXTOR: Flexible Toolsfor Plasma-Wall Investigation. Fus. Sci. Tech., 47:171 –181, 2005.
[20] Electronic publication. JET-EFDA website.
[21] F. Durodié et al. Main design features and challenges of the ITER-like ICRF antenna for JET. Fusion Eng. & Design, 74(1-4):223 –228, 2005. Proceedings of the 23rd Symposium of Fusion Technology- SOFT 23.
[22] J. Paméla et al. The JET Programme in Support of ITER. Techni-cal Report EFDA-JET-CP(06)04-19, EFDA, Culham Science Centre,Abingdon, Oxon, OX14 3DB, UK., September 2006. Preprint of Paperto be submitted for publication in Proceedings of the SOFT Confer-ence.

References 9-3
[23] J. Noterdaeme et al. First results of ion cyclotron resonance heatingon ASDEX upgrade. In AIP Confer. Series, volume 289, pages 12–23,October 1994. The tenth topical conference on radio frequency powerin plasmas.
[24] Electronic publication. ITER website.
[25] Electronic publication. EFDA website.
[26] M. Shimada et al. Chapter 1: Overview and summary. Nucl. Fusion,47(6):S1, 2007.
[27] R. Pitts et al. Physics basis and design of the ITER plasma-facingcomponents. J. Nucl. Mat., DOI: 10.1016/j.jnucmat.2011.01.114:–,2011.
[28] B. Beaumont. SRD-51 (ICH&CD) from doors. Technical report,ITER Organization, 13115, St. Paul-lez-Durance , France, October2009.
[29] A. Messiaen et al. Performance of the ITER ICRH system as ex-pected from TOPICA and ANTITER II modelling. Nucl. Fusion,50(2):025026, 2010.
[30] J. Winter. Wall conditioning in fusion devices and its influence onplasma performance. Plasma Phys. & Controlled Fusion, 38(9):1503,1996.
[31] R. A. Pitts et al. Material erosion and migration in tokamaks. PlasmaPhys. & Controlled Fusion, 47(12B):B303, 2005.
[32] A. Kirschner, V. Philipps, J. Winter, and U. Kögler. Simulation ofthe plasma-wall interaction in a tokamak with the Monte Carlo codeERO-TEXTOR. Nucl. Fusion, 40(5):989, 2000.
[33] A. Ekedahl et al. Operational limits during high power long pulseswith radiofrequency heating in Tore Supra. Nucl. Fusion, 49(9):095010,2009.
[34] J. Roth et al. Tritium inventory in ITER plasma-facing materialsand tritium removal procedures. Plasma Phys. & Controlled Fusion,50(10):103001, 2008.
[35] G. McCracken and P. Stott. Plasma-surface interactions in tokamaks.Nucl. Fusion, 19(7):889, 1979.
9-4 References
[36] E. Tsitrone, C. Brosset, J. Bucalossi, and et al. Deuterium retentionin Tore Supra long discharges. IAEA Conference Proceedings, 2004.Proceedings of 20th IAEA Fusion Energy Conference.
[37] J. Davis and A. Haasz. Reemission and thermal desorption of D0,D2 and CD4 from graphite. J. Nucl. Mat., 220-222:832 – 835, 1995.Plasma-Surface Interactions in Controlled Fusion Devices.
[38] C. Grisolia, L. Horton, and J. Ehrenberg. Modelling of hydrogen con-ditioning, retention and release in Tore Supra. J. Nucl. Mat., 220-222:516 – 520, 1995. Plasma-Surface Interactions in Controlled FusionDevices.
[39] K. Dimoff, C. Boucher, K. J. Parbhakar, and A. K. Vijh. Modelingof impurity release rates during wall conditioning of a vacuum vesselby electric discharge. Journal of Vacuum Science & Technology A:Vacuum, Surfaces, and Films, 6(5):2876–2882, 1988.
[40] B. Pégourié et al. Overview of the deuterium inventory campaign inTore Supra: Operational conditions and particle balance. J. Nucl.Mat., 390-391:550 – 555, 2009. Proceedings of the 18th InternationalConference on Plasma-Surface Interactions in Controlled Fusion De-vice, Proceedings of the 18th International Conference on Plasma-Surface Interactions in Controlled Fusion Device.
[41] B. Pégourié and T. S. TEAM. Particle balance and fuel retention inTORE SUPRA. Fus. Sci. Tech., 56:1334 – 1352, 2009.
[42] M. Shimada and R. A. Pitts. Wall conditioning on ITER. J. Nucl.Mat., DOI: 10.1016/j.jnucmat.2010.11.085:–, 2010.
[43] S.-H. Hong and et al. On the Spherical Dusts in Fusion Devices.IAEA Conference Proceedings, October 2010. Proceedings of 23thIAEA Fusion Energy Conference, Deajeon.
[44] A. Peacock et al. Dust and flakes in the JET MkIIa divertor, analysisand results. J. Nucl. Mat., 266-269:423 – 428, 1999.
[45] R. Smirnov et al. Modeling of dust impact on tokamak edge plasmas.J. Nucl. Mat., DOI: 10.1016/j.jnucmat.2011.01.004:–, 2011.
[46] J. Winter. Dust in fusion devices: a multi-faceted problem connectinghigh- and low-temperature plasma physics. Plasma Phys. & ControlledFusion, 46(12B):B583, 2004.

References 9-5
[47] S. Rosanvallon et al. Dust in ITER: Diagnostics and removal tech-niques. J. Nucl. Mat., 386-388:882 – 883, 2009. Fusion Reactor Materi-als, Proceedings of the Thirteenth International Conference on FusionReactor Materials.
[48] C. Grisolia. Conditionnement TS. Technical report, Association EUR-CEA / DRFC, TORE SUPRA, 1990. private communication.
[49] V. Philipps. Wall conditioning on TEXTOR. Fus. Sci. Tech., 47:119– 125, 2005.
[50] V. Philipps et al. Removal of redeposited layers and hydrogen releaseby oxygen ventilation of TEXTOR-94. J. Nucl. Mat., 266-269:386 –391, 1999.
[51] E. de la Cal and E. Gauthier. First-wall cleaning and isotope controlstudies by D2 ICRF conditioning in Tore Supra with a permanentmagnetic field. Plasma Phys. & Controlled Fusion, 39(7):1083, 1997.
[52] H. F. Dylla. Glow discharge techniques for conditioning high-vacuumsystems. Journal of Vacuum Science & Technology A: Vacuum, Sur-faces, and Films, 6(3):1276–1287, 1988.
[53] V. Philipps et al. Development of wall conditioning and tritium re-moval techniques in TEXTOR for ITER and future fusion devices.IAEA publication, FT/4-2Ra, 2008. Proceedings of the 22nd IAEAFusion Energy Conference.
[54] V. Philipps et al. Removal of carbon layers by oxygen glow dischargesin TEXTOR. J. Nucl. Mat., 363-365:929 – 932, 2007. Plasma-SurfaceInteractions-17.
[55] G. Sergienko et al. Ion cyclotron wall conditioning in reactive gaseson TEXTOR. J. Nucl. Mat., 390-391:979 – 982, 2009. Proceedings ofthe 18th International Conference on Plasma-Surface Interactions inControlled Fusion Device, Proceedings of the 18th International Con-ference on Plasma-Surface Interactions in Controlled Fusion Device.
[56] E. de la Cal and E. Gauthier. Review of radio frequency condition-ing discharges with magnetic fields in superconducting fusion reactors.Plasma Phys. & Controlled Fusion, 47(2):197, 2005.
[57] J. Li et al. Wall conditioning towards the utilization in ITER. J. Nucl.Mat., DOI: 10.1016/j.jnucmat.2010.10.048:–, 2010.

9-6 References
[58] H. Amemiya and et al. Analysis Of ICRF Plasma Production in LargeScale Tokamaks. Japanese Journal of Applied Physics, 26:1534–1543,1987.
[59] J. Bucalossi et al. The conditioning procedures in Tore Supra af-ter CIEL implementation. J. Nucl. Mat., 313-316:263 – 268, 2003.Plasma-Surface Interactions in Controlled Fusion Devices 15.
[60] S.-H. Hong, K.-P. Kim, and et al. Initial phase wall conditioning inKSTAR. IAEA Conference Proceedings, October 2010. Proceedingsof 23th IAEA Fusion Energy Conference, Deajeon.
[61] C. Schulz. Figure inhomogeneity of glow discharges in the presenceof magnetic fields. private communications, December 2009. Tomasresult in frame of PhD work of Christian Schulz.
[62] M. Merola et al. ITER plasma-facing components. Fusion Eng. &Design, 85(10-12):2312 – 2322, 2010. Proceedings of the Ninth Inter-national Symposium on Fusion Nuclear Technology.
[63] L. Oren and R. Taylor. Trapping and removal of oxygen in tokamaks.Nucl. Fusion, 17(6):1143, 1977.
[64] F. Schuller. Report on Applications of ICWC on ITER. TechnicalReport IO/2009/ADM-014, ITER - IO, 13115, St. Paul-lez-Durance ,France, November 2009. report version 3.
[65] D. Whyte and J. Davis. Tritium recovery in ITER by radiative plasmaterminations. J. Nucl. Mat., 337-339:560 – 564, 2005. PSI-16.
[66] A. Lyssoivan et al. ICRF/ECR plasma production for wall condi-tioning in TEXTOR-94. In AIP Confer. Series, volume 595, pages146–149, October 2001.
[67] M. Shimada. Wall conditioning on ITER. Poster presentation slideson the 19th International Conference on Plasma Surface interaction,May 2010.
[68] S. Chiocchio. Project requirements (PR). Technical report, ITEROrganization, 13115, St. Paul-lez-Durance , France, October 2009.
[69] X. Gao et al. ICRF wall conditioning and plasma performance onEAST. J. Nucl. Mat., 390-391:864 – 868, 2009. Proceedings of the18th International Conference on Plasma-Surface Interactions in Con-trolled Fusion Device, Proceedings of the 18th International Confer-ence on Plasma-Surface Interactions in Controlled Fusion Device.

References 9-7
[70] V. Bakaev et al. Currentless plasma production and heating in thetorsatron Uragan-3 by RF waves. Plasma Physics and ControlledNuclear Fusion Research, 2, 1984.
[71] N. Nazarov, V. Plyusnin, and et al. Use of plasma to clean the surfacesin the Uragon-3 torsatron. Sov. J. Plasma Phys., 13(12):871–873,1987.
[72] A. Lyssoivan et al. ICRF preionization and plasma production inTEXTOR. In Europhysics Conference Abstracts 19C, pages Part III,341, Bournemouth (UK), July 1995. 22nd European Physical SocietyConference on Controlled Fusion and Plasma Physics.
[73] E. Gauthier et al. Wall conditioning technique development in ToreSupra with permanent magnetic field by ICRF wave injection. J. Nucl.Mat., 241-243:553 – 558, 1997.
[74] H. Esser et al. ICRF wall conditioning at TEXTOR-94 in the presenceof a 2.25 T magnetic field. J. Nucl. Mat., 241-243:861 – 866, 1997.
[75] Z. Yan-ping et al. A New Wall Conditioning Technique Developedon the HT-7 Superconducting Tokamak with a Permanent MagneticField. Chinese Physics Letters, 14(12):916, 1997.
[76] J. Li et al. ICRF boronization - A new technique towards high effi-ciency wall coating for superconducting tokamak reactors. Nucl. Fu-sion, 39(8):973, 1999.
[77] J. Xie et al. RF wall conditioning - a new technique for future largesuperconducting tokamak. J. Nucl. Mat., 290-293:1155–1159, 2001.14th Int. Conf. on Plasma-Surface Interactions in Controlled FusionD evices.
[78] X. Gong et al. ICRF siliconization in HT-7 superconducting tokamak.J. Nucl. Mat., 290-293:1171 – 1175, 2001. 14th Int. Conf. on Plasma-Surface Interactions in Controlled Fusion D evices.
[79] R. Brakel, D. Hartmann, and P. Grigull. ICRF wall conditioning ex-periments in the W7-AS stellarator. J. Nucl. Mat., 290-293:1160–1164,2001. 14th Int. Conf. on Plasma-Surface Interactions in ControlledFusion Devices.
[80] A. Lyssoivan et al. Studies of ICRF Discharge Conditioning (ICRF-DC) on ASDEX Upgrade, JET and TEXTOR. AIP Conference Pro-ceedings, 787(1):445–448, 2005.

9-8 References
[81] A. Lyssoivan et al. Development of ICRF wall conditioning techniqueon divertor-type tokamaks ASDEX Upgrade and JET. J. Nucl. Mat.,337-339:456 – 460, 2005. PSI-16.
[82] A. Lyssoivan et al. New scenarios of ICRF wall conditioning in TEX-TOR and ASDEX Upgrade. J. Nucl. Mat., 363-365:1358 – 1363, 2007.Plasma-Surface Interactions-17.
[83] N. Ashikawa et al. Ion cyclotron conditioning with strong magneticfield in LHD. Fusion Eng. & Design, 81(23-24):2831–2836, 2006. Pro-ceedings of the Fifteenth International toki Conference on Fusion andAdvanced Technology - ITC-15 SI.
[84] A. Lyssoivan and et al. Analysis of ICRF plasma production in largescale tokamaks. Nucl. Fusion, 32:1361–1372, 1992.
[85] E. de la Cal. Theoretical modelling of deuterium ICRF wall condi-tioning discharges. Plasma Phys. & Controlled Fusion, 48(10):1455,2006.
[86] A. Lyssoivan. Development of ITER relevant ICRF wall conditioningtechnique on European tokamaks. In Probl. At. Sci. Tech., volume 1of Plasma Physics, pages 44–48, 2005. issue N010.
[87] A. Lyssoivan et al. ICRF Plasma Production in Tore Supra: Analysisof Antenna Coupling and Plasma Properties. In Europhysics Confer-ence Abstracts of the 26th EPS Conference on Controlled Fusion andPlasma Physics, Maastricht (The Netherlands) - 14/18 June 1999,volume 23J, pages 737–740, 1999.
[88] V. Rohde. Comparison of wall cleaning using HeGD and ICGD.Technical Report AUG shots 22612-22174, Max Planck Institut fürPlasmaphysik, Garching, Germany, March 2008. Internal report withunpublished data, Use of data for publication requires permission bythe author.
[89] D. V. Eester and R. Koch. A variational principle for studyingfast-wave mode conversion. Plasma Phys. & Controlled Fusion,40(11):1949, 1998.
[90] J. Hu, J. Li, and Y. Zhao. Oxygen removal with D2-ICR cleaningsafter oxidation experiment in HT-7. Fusion Eng. & Design, 82(2):133– 139, 2007.

References 9-9
[91] J. Buermans and T. Matthys. 0-D Transport Modeling of the RFPlasma Production in a Fusion Reactor. Master’s thesis, Royal Mili-tary Academy (Brussels), July 2006.
[92] A. Lyssoivan. ICRF plasma production and application to start-up andwall conditioning. Technical report, Laboratory for Plasma Physics -Royal Military Academy, 1000 Brussels, Belgium, October 1998. FinalReport on ITER Design Task D350.2, Laboratory Report nř 114.
[93] A. Lyssoivan. ICRF plasmas for fusion reactor applications. In Probl.At. Sci. Tech., volume 1 of Plasma Physics, pages 30–34, 2007. issueN013.
[94] A. Lyssoivan et al. ICRF physics aspects of wall conditioning withconventional antennas in large-size tokamaks. J. Nucl. Mat., DOI:10.1016/j.jnucmat.2010.11.059:–, 2010.
[95] A. Lyssoivan et al. ICRF Wall Conditioning: Present Statusand Developments for Future Superconducting Fusion Machines. InV. Bobkov & J.-M. Noterdaeme, editor, AIP Confer. Series, volume1187, pages 165–172, November 2009.
[96] A. Lyssoivan et al. Low Voltage Start-up Assisted by ICRF inTEXTOR-94. In Europhysics Conference Abstracts of the 24th EPSConference on Controlled Fusion and Plasma Physics, Berchtesgaden(Belgium) - June 1997, volume 21A, pages 1741–1744, 1997.
[97] A. Lyssoivan et al. Influence of toroidal and vertical magnetic fieldson Ion Cyclotron Wall Conditioning in tokamaks. J. Nucl. Mat., 390-391:907 – 910, 2009. Proceedings of the 18th International Conferenceon Plasma-Surface Interactions in Controlled Fusion Device, Proceed-ings of the 18th International Conference on Plasma-Surface Interac-tions in Controlled Fusion Device.
[98] V. Bobkov. Studies of high voltage breakdown phenomena on ICRF(Ion Cyclotron Range of Frequencies) antennas. PhD thesis, Technis-che Universität München (Germany), Fakultät für Physik, May 2003.
[99] M. A. Rothman, R. M. Sinclair, and S. Yoshikawa. ‘Non-resonant’coupling of R.F. power to a plasma. JNEC, 8(3):241, 1966.
[100] G. Agarici et al. Tore Supra ICRH antennas for long pulse operation.In Fusion Engineering, 1997. 17th IEEE/NPSS Symposium, volume 1,pages 429 –432 vol.1, October 1997.

9-10 References
[101] M. Graham. JET Ion Cyclotron Wall Conditioning. CCIC-09 Meet-ing, Cadarache, 09 July 2011, July 2011.
[102] A. Argouarch. Ion Cyclotron Wall Conditioning (ICWC) on ToreSupra, RF operation. CCIC-09 Meeting, Cadarache, 09 July 2011,July 2011.
[103] V. Bobkov. Operation of ICWC in ASDEX Upgrade. CCIC-09 Meet-ing, Cadarache, 09 July 2011, July 2011.
[104] M. Verviers. ICWC in TEXTOR. CCIC-09 Meeting, Cadarache, 09July 2011, July 2011.
[105] A. Lyssoivan. RF Aspects of Ion Cyclotron Wall Conditioning. CCIC-08 Meeting, Torino, 08 March 2011.
[106] M. Carter et al. Plasma production using radiofrequency fields near orbelow the ion cyclotron range of frequencies. Nucl. Fusion, 30(4):723,1990.
[107] A. Lyssoivan. ICWC in Tore Supra: Numerical Analysis and ScenarioProposal. private communications, November 2008. Calculation ofneutral gas RF breakdown zone for TS-CIEL ICRF antenna.
[108] D. Reiter. The data file HYDHEL: Atomic and Molecular Data forEIRENE. Technical report, Forschungszentrum Juelich GmbH, 52425Juelich, December 2002. Based upon: Janev, Langer, Evans, Post,Elementary Processes in Hydrogen-Helium Plasmas, Springer 1987.
[109] W. Umrath. Fundamentals of Vacuum Technology. Oerlikon LeyboldVacuum, Cologne, Germany, June 2007.
[110] C. Day. Basics and applications of cryopumps. CERN DocumentServer, page 34 p, 2007.
[111] T. Chou and H. Halama. Cryopumping of deuterium hydrogen and he-lium mixtures on smooth 4.2 K surfaces. Technical report, BrookhavenNational Laboratory, Upton, New York 11973, January 1977. Con-ference: 7. international Vac. congress and 3. international conferenceon solid surfaces, Vienna, Austria, 12 Sep 1977.
[112] B. Unterberg. Transport Processes in the Plasma Edge. Trans. Fus.Sci. Tech., 57, 2010. Number 2T, FUSTE8 (2) 1-504.
[113] R. Laengner et al. Electron density and temperature measurements inTEXTOR ion cyclotron wall conditioning plasmas by thermal Li beam

References 9-11
spectroscopy. J. Nucl. Mat., DOI: 10.1016/j.jnucmat.2011.01.133:–,2011.
[114] E. de la Luna et al. Electron cyclotron emission radiometer up-grade on the Joint European Torus (JET) tokamak. Rev. Sci. Instr.,75(10):3831–3833, 2004.
[115] I. Monakov, P. Jacquet, and M. Graham. private communications,July 2011. Culham Centre for Fusion Energy, Culham Science Centre,Abingdon, Oxfordshire, OX14 3DB, UK.
[116] J. Gunn. private communications, July 2011. Responsible diagnosti-cian RFA TORE SUPRA.
[117] S. Mueller et al. Effects of a vertical magnetic field on particle confine-ment in a magnetized plasma torus. Phys. Rev. Lett., 93(16), 2004.
[118] P. C. T. van der Laan. Drift of a plasma in a curved magnetic field.J. Nucl. Energy, C: Plasma Phys., Accelerators, Thermonucl. Res.,6(6):559, 1964.
[119] S. Nakao, K. Ogura, Y. Terumichi, and S. Tanaka. Particle loss froman electron cyclotron resonance discharge plasma in the WT-2 device.Phys. Lett. A, 96(8):405 – 408, 1983.
[120] A. Komori, N. Sato, and Y. Hatta. Drift motion of a plasma in acurved magnetic field with rotational transform. Journal of the Phys-ical Society of Japan, 47:990–997, September 1979.
[121] T. Loarer, J. Bucalossi, G. Matthew, and V. Philipps. Tritium particlebalance and retention during DT discharges in JET. J. Nucl. Mat.,337-339:624 – 628, 2005. PSI-16.
[122] W. Eckstein. Calculated Sputtering, Reflection and Range Values.Technical report, Max Planck Society - eDocument Server, Germany,2002.
[123] B. Pégourié. private communications, November 2010. IRFM, CEACadarache.
[124] V. Philipps and J. Ehrenberg. Analysis of outgassing after Joint Eu-ropean Torus discharges under beryllium first wall conditions. Jour-nal of Vacuum Science Technology A: Vacuum, Surfaces, and Films,11(2):437 –445, March 1993.
[125] R. Mitteau et al. A shaped First Wall for ITER. J. Nucl. Mat., DOI:10.1016/j.jnucmat.2010.10.070:–, 2010.

9-12 References
[126] D. Douai et al. Ion Cyclotron discharges for Tokamak wall condition-ing in presence of a magnetic field: recent experimental results on ToreSupra. In Europhysics Conference Abstracts of the 36th EPS Confer-ence on Controlled Fusion and Plasma Physics, Sofia, (Bulgaria) -July 2009, 2009.
[127] D. Douai et al. Recent results on Ion Cyclotron Wall Condi-tioning in mid and large size tokamaks. J. Nucl. Mat., DOI:10.1016/j.jnucmat.2010.11.083:–, 2010.
[128] K. Morishita, T. Inoue, and N. Yoshida. Microstructural evolution inberyllium by fusion-relevant low energy helium ion irradiation. Journalof Nuclear Materials, 266-269:997 – 1002, 1999.
[129] K. Schmid, T. Schwarz-Selinger, W. Jacob, R. Dux, and the ASDEXUpgrade Team. The implications of high- Z first-wall materials onnoble gas wall recycling. Nuclear Fusion, 47(8):984, 2007.
[130] S. Hong and et al. ICRF conditioning on KSTAR. In 12th ITPASOL’/Divertor Physics Meeting, Amsterdam, 2009. 5-8 May.
[131] K. Sungwoo et al. Long term behavior of water molecules and theirremoval by inter-shot Ion Cyclotron Wall Conditioning. J. Nucl. Mat.,2011. Under review.
[132] V. E. Moiseenko, A. I. Lysoivan, S. V. Kasilov, and V. V. Plyusnin.Dynamics of r.f. production of Stellarator plasmas in the ion cyclotronrange of frequency. Fusion Eng. & Design, 26(1-4):203 – 207, 1995.
[133] B. Lloyd, P. G. Carolan, and C. D. Warrick. ECRH-assisted start-upin ITER. Plasma Phys. & Controlled Fusion, 38(9):1627, 1996.
[134] S. I. Braginskii. Transport Processes in a Plasma. In M. A. Leonto-vivh, editor, Reviews of Plasma Physics 1, New York, 1965. Consul-tants Bureau.
[135] D. Wünderlich, S. Dietrich, and U. Fantz. Application of a collisionalradiative model to atomic hydrogen for diagnostic purposes. J. Quant.Spectrosc. Radiat. Transfer, 110(1-2):62 – 71, 2009.
[136] Y. V. Ralchenko and Y. Maron. Accelerated recombination due to res-onant deexcitation of metastable states. J. Quant. Spectrosc. Radiat.Transfer, 71(2-6):609 – 621, 2001.
[137] I. I. Sobelman, L. A. Vainshtein, and E. A. IUkov. Excitation of atomsand broadening of spectral lines / I.I. Sobelman, L.A. Vainshtein, E.A.Yukov. Springer-Verlag, Berlin ; New York :, 1981.

References 9-13
[138] I. Bray and Y. Ralchenko. CCC-database.http://atom.curtin.edu.au/CCC-WWW/.
[139] V. Shevelko et al. One-electron Capture and Target Ionization in He+-neutral-atom Collisions. Technical report, NIFS, December 2009.
[140] R. Janev and J. J. Smith. Recommended Cross Sections for Col-lision Processes of Hydrogen Ground-State and Excited Atoms withElectrons, Protons and Multiply Charged Atoms. Atomic and Plasma-Material Data for Fusion, a supplement to the journal Nuclear Fusion,4, 1993.
[141] M. B. Shah, P. McCallion, and H. B. Gilbody. Electron capture andionization in collisions of slow H + and He 2+ ions with helium. J.Phys. B-At. Mol., 22(19):3037, 1989.
[142] Y. Ralchenko et al. Electron-impact excitation and ionization crosssections for ground state and excited helium atoms. Atomic Data andNuclear Data Tables, 94(4):603–622, July 2008.
[143] R. Marchand, C. Illescas, X. Bonnin, and J. Botero. Radiative Lossesand Electron Cooling Rates of Hydrogen, Helium, Carbon and Oxy-gen. Technical report, International Nuclear Data Committee, IAEANuclear Data Section, Wagramerstrasse 5, 1400 Vienna, Austria, July1995.
[144] O. Marchuk et al. Recombination mechanisms in He-like argon spectrameasured in low-density plasmas. J. Phys. B-At. Mol., 40(23):4403,2007.
[145] D. V. Sivukhin. Coulomb Collisions in a Fully Ionized Plasma. InM. A. Leontovivh, editor, Reviews of Plasma Physics 4, New York,1966. Consultants Bureau.
[146] H. H. Abou-Gabal and G. A. Emmert. Helium transport in venteddivertors and limiters. Nucl. Fusion, 31:407–416, 1991.
[147] D. Reiter, P. Bachmann, and A. K. Prinja. Influence of Elastic Col-lisions on Neutral Gas Transport in Boundary Plasmas. Contrib.Plasma Phys., 32:261–267, 1992.
[148] P. Bachmann and D. Reiter. Kinetic Description of Elastic Processesin Hydrogen-Helium Plasmas. Contrib. Plasma Phys., 35:45–100,1995.

9-14 References
[149] R. K. Janev. Atomic and Molecular Processes in SOL/Divertor Plas-mas. Contrib. Plasma Phys., 38:307–318, 1998.
[150] R. K. Janev, editor. Atomic and Molecular Processes in Fusion EdgePlasmas, 1995.
[151] D. Reiter. The data file AMJUEL: Additional Atomic and Molecu-lar Data for EIRENE. Technical report, Forschungszentrum JuelichGmbH, 52425 Juelich, May 2010.
[152] A. V. Phelps. Cross Sections and Swarm Coefficients for H+, H2+,H3+, H, H2, and H- in H2 for Energies from 0.1 eV to 10 keV. J.Phys. Chem. Ref. Data, 19(3):653–675, 1990.
[153] A. Lyssoivan. Energy and Particle Balance Equations for RF Plasmasin Fusion Machines. Document for internal use, version 3, 2007.
[154] T. Wauters et al. Isotope exchange experiments on TEX-TOR and TORE SUPRA using Ion Cyclotron Wall Condition-ing and Glow Discharge Conditioning. J. Nucl. Mat., DOI:10.1016/j.jnucmat.2010.11.072, 2010.
[155] M. Rutigliano and M. Cacciatore. Isotope and Surface Temper-ature Effects for Hydrogen Recombination on a Graphite Surface.ChemPhysChem, 9(1):171 –181, 2008.
[156] E. Vietzke. Reflection and adsorption of deuterium atoms andmolecules on graphite. J. Nucl. Mat., 266:324–329, 1999.
[157] A. Lyssoivan et al. A study of RF power absorption mechanisms inJET ICWC plasmas. In Europhysics Conference Abstracts of the 38thEPS Conference on Controlled Fusion and Plasma Physics, Strasbourg(France) - June 2011, 2011.
[158] R. Papoular. The genesis of toroidal discharges. Nucl. Fusion,16(1):37, 1976.
[159] P. Linstrom and W. Mallard, editors. NIST Chemistry WebBook.National Institute of Standards and Technology, Gaithersburg MD,20899, USA, nist standard reference database number 69 edition,2011. récupérée 4 Mai 2011, http://webbook.nist.gov.
[160] R. K. Janev, W. D. Langer, D. E. Post, Jr., and K. Evans, Jr. Elemen-tary processes in hydrogen-helium plasmas: Cross sections and reac-tion rate coefficients, volume 4 of Atoms+Plasmas. Springer-Verlag,1987.

References 9-15
[161] M. Arnaud and R. Rothenflug. Ionic fraction data. Astronomy andAstrophysics Supplement Series, 60:425–457, 1985.
[162] T. Loarer et al. Gas balance and fuel retention in fusion devices. Nucl.Fusion, 47(9):1112, 2007.
[163] C. Grisolia, P. Ghendrih, B. Pégourié, and A. Grosman. Plasma wallparticle balance in Tore Supra. J. Nucl. Mat., 196-198:281 – 284,1992. Plasma-Surface Interactions in Controlled Fusion Devices, Pro-ceedings of the Tenth International Conference on Plasma-Surface In-teractions in Controlled Fusion Devices.
[164] P. Andrew et al. Experiments on the release of tritium from the firstwall of JET. Nucl. Fusion, 33(9):1389, 1993.
[165] C. Sang et al. Modeling of hydrogen reactive-diffusive transport and in-ventory in porous media with mixed materials deposited layers. In Eu-rophysics Conference Abstracts of the 38th EPS Conference on Con-trolled Fusion and Plasma Physics, Strasbourg (France) - 27 June/1July 2011, 2011.
[166] A. Lyssoivan. SIMULATION OF ITER ICWC SCENARIOS IN JET.In Probl. At. Sci. Tech., volume 16 of Plasma Physics, pages 46–50,2010. issue N06.
[167] A. Costley and D. Johnson, editors. Special issue on plasma diagnos-tics for magnetic fusion research, volume 53, No 2. Fus. Sci. Tech.,2nh edition edition, February 2008.
[168] P. H. Dawson. Quadrupole Mass Spectrometry and its Applications.Elsevier Scientific Publishing Company, 1976. ISBN 10: 0444413456/ 0-444-41345-6, ISBN 13: 9780444413451.
[169] R. Botter and G. Bouchoux. Spectrométrie de masse. Techniques del’ingénieur. Analyse et caractérisation, P3(P2615):P2615.1–P2615.39,1995. Paris, FRANCE (Revue).
[170] C. C. Klepper, D. L. Hillis, M. R. Wade, R. Maingi, and G. R. McKee.Application of a species-selective Penning gauge to the measurement ofneon and hydrogen-isotope partial pressures in the plasma boundary.Rev. Sci. Instr., 68(1):400–403, 1997.
[171] K. H. Finken, K. H. Dippel, W. Y. Baek, and A. Hardtke. Mea-surement of helium gas in a deuterium environment. Rev. Sci. Instr.,63(1):1–7, 1992.

9-16 References
[172] G. Sergienko. private communications, July 2009. Responsible diag-nostician.
[173] R. Lasser et al. The gas-chromatographic analysis system in the JETactive gas handling plant. Rev. Sci. Instr., 64:2449–2458, September1993.
[174] W. Suttrop. Electron Cyclotron Emission Plasma Diagnostics. Tech-nical report, Max-Planck-Institut für Plasmaphysik, D-85748 Garch-ing, April 2004. From Emanuele Poli, Für die Studenten der Univer-sität Ulm.
[175] R. L. Merlino. Understanding Langmuir probe current-voltage char-acteristics. Am. J. Phys., 75:1078–1085, December 2007.
[176] N. Hershkowitz, M. H. Cho, C. H. Nam, and T. Intrator. Langmuirprobe characteristics in RF glow discharges. Plasma Chemistry andPlasma Processing, 8:35–52, 1988. 10.1007/BF01016929.
[177] G. Sergienko. private communications, March 2011. Responsible di-agnostician.
[178] M. Kocan et al. On the reliability of scrape-off layer ion temper-ature measurements by retarding field analyzers. Rev. Sci. Instr.,79(7):073502, July 2008.
[179] R. A. Pitts. Retarding Field Energy Analysis for Ion TemperatureMeasurement in the Tokamak Edge. Contrib. Plasma Phys., 36:87–93, 1996.
[180] V. Moiseenko, Y. Stadnik, A. Lyssoivan, and D. M. SELF-CONSISTENT MODEL OF THE RF PLASMA PRODUCTION INSTELLARATOR. In Probl. At. Sci. Tech., volume 1 of PlasmaPhysics, pages 21–23, 2010. issue N06.
[181] T. Wauters et al. Ion Cyclotron Wall Conditioning Experiments onTore Supra in Presence of the Toroidal Magnetic Field. In V. Bobkovand J.-M. Noterdaeme, editors, AIP Confer. Series, volume 1187,pages 173–176. AIP, 2009.
[182] M. K. Paul. Plasma and antenna coupling characterization in ICRF-Wall Conditioning experiments. Plasma Phys. & Controlled Fusion,2010. Submitted.

ASchemes of tokamak main systems
A.1 TORE SUPRA
Figure A.1: TORE SUPRA: Toroidal cut

A-2 Schemes of tokamak main systems
Figure A.2: TORE SUPRA: Poloidalcut
Figure A.3: TORE SUPRA:DCN interferometry viewing linescut
Figure A.4: The poloidal fieldsystem on TORE SUPRA to in-duce (central solenoid: A) and con-trol (8 outer poloidal field coils:Bh, Bb, Dh, Db, Eh, Eb, Fh andFb) the equilibrium of the plasmacurrent, consisting of 9 copper coilsassociated with 9 power supplies.
Figure A.5: Illustration of the poloidalmagnetic field in TORE SUPRA calcu-lated by Biot-Savart law from currents(A.U.) in the outer poloidal field coils(poloidal location given by black dots).On properly selecting the currents ho-mogeneous vertical (red) or radial (blue)fields can be attained.

Appendix A A-3
A.2 TEXTOR
Figure A.6: TEXTOR: Toroidal cut
Figure A.7: TEXTOR:Poloidal cut
Figure A.8: TEXTOR: HCN interfer-ometry viewing lines

A-4 Schemes of tokamak main systems
A.3 JET
Figure A.9: JET: Toroidal cut
Figure A.10: JET: Poloidal cut, including HCN interferometry viewing lines

Appendix A A-5
A.4 ASDEX Upgrade
Figure A.11: ASDEX Upgrade: Toroidal cut
Figure A.12: ASDEX Upgrade: Poloidal cut. Left: present ASDEX Upgradewall configuration, right: the DCN interferometry viewing lines on the old wallconfiguration.


BICWC diagnostics
B.1 Neutral gas diagnosticsTokamak devices are equipped with a many measurement systems to exam-ine firstly the performance of the tokamak systems (magnetic field system,heating systems, monitoring wall elements, etc...) to control and ensure safeoperation, and secondly to study the properties of the produced plasma(plasma diagnostics). An extensive overview of these diagnostics can befound in [167]. Below we will give a brief summary of the diagnostic systemsthat are used during ICWC discharges. It includes the measurement toolsto analyze the neutral gas in the vessel (pressure and gas composition), andthe principle plasma diagnostics. Since present tokamaks are experimentalfacilities designed and exploited to support magnetic fusion research, theplasma diagnostic systems are designed to study high temperature (∼ keV)and high density (∼ 1019 m−3) plasmas. Conditioning discharges operateat much lower temperatures (∼ eV) and densities (ICWC: 1016− 1018 m−3)and therefore the standard diagnostics will be operated outside their nor-mal operation range. This brings along some inconveniences, of which thegravest is that the standard diagnostics can not be used or that the accu-racy of the measurements is very low. Often dedicated processing of theproduced raw data is required.

B-2 ICWC diagnostics
B.1.1 Pressure measurementsDevices to measure pressure below atmospheric pressure are usually referredto as vacuum gauges. We will shortly describe the three most employedsystems in tokamak vacuum vessels: baratron gauges, Penning gauges andPirani gauges. The gauges are not in direct contact with the plasma. Thefew gauges in the vacuum vessel itself are located in plasma shadowed areas(e.g. behind divertor plates) while most of the gauges are located along thevarious pumping ducts.
The baratron gauge relies on capacitance changes due to the pres-sure force exerted on a membrane of a plate capacitor. The advantage ofbaratron gauges over ionization and Pirani gauges is that the calibration isindependent of the gas. The accuracy dependents on the specific type of thebaratron gauge, but generally the measurement uncertainty rises stronglyfor pressure below 10−4 mbar [109]. Below these pressures one can rely onthe Penning gauge. The Penning gauge is an ionization vacuum gaugewith cold electrodes. The neutral gas entering the gauge is partly ionizedin the high electric field between 2 coaxially arranged electrodes (kV). Dueto a small magnetic field the electrons spiral around the central electrode toincrease the ionization probability. The current collected at the electrodesis proportional to the particle density, which is in turn proportional to thepressure. The upper pressure limit below which the proportionality of theion current is conserved is 10−2 mbar [109]. The pressure reading is depen-dent on the discharge gas via the ionization cross section. The gauges aremostly calibrated for nitrogen N2. Correction factors for other gases areoften given in the device documentation, but it is strongly recommendedto check them by a dedicated calibration. Table B.1 list typical conversionfactors for some gases of interest in this manuscript. Penning gauges are,
Table B.1: Nominal Penning pressure reading correction factors for commongases relative to the calibration gas N2 (pg = pN2/Rg).
He D2 H2 N2Rg 0.18 0.35 0.46 1
next to baratron gauges, used to monitor the vacuum vessel pressure andare in this matter of particular importance since their lower measurementlimit is orders below the limit for baratrons. Furthermore they are alsooften employed to monitor the neutral pressure in tokamak systems as forexample the pressure in the vacuum RF transmission lines of the JET ICRHantennas. The Pirani gauge is a thermal conductivity gauge measuringpressure via the electrical resistivity of a heated thin wire. The thermalconductivity of the neutral gas will cause a heat loss of the wire propor-

Appendix B B-3
Figure B.1: Schematic of a quadrupole mass spectrometer showing the ionsource, the quadrupole separation system and the ion detector [109].
tional to the neutral pressure in a range of 10−4 mbar to 10−1 mbar. Thecalibration of Pirani gauges is also gas dependent [109].
B.1.2 Mass spectrometryB.1.2.1 Principle of quadrupole mass spectrometry
The assessment of the wall conditioning efficiency of ICWC discharges inthis manuscript is mostly done by mass spectrometry. It allows to analyzequantitatively the composition of the neutral gas. In a mass spectrome-ter the neutral gas is ionized, whereafter the ion current is collected selec-tively according to the mass to charge ratio of the ions. Fig. B.1 shows aschematic of a quadrupole mass spectrometer where its three main sectionsare indicated: the ion source, the quadrupole separation system and theion detector [109]. In the ion source the incoming neutral gas is cracked(molecules) and ionized by impact of electrons, originating from a constantelectron source and having a constant energy distribution (∼ 100 V). Theprobability of these elementary collisions is proportional to the cross sectionof the reaction. To illustrate the operation of a quadrupole mass spectrom-eter, (and to illustrate its calibration in the next paragraph) we will use asexample the detection of deuterium gas. Table B.2 gives the cross sections
Table B.2: Relevant elementary reactions for mass spectrometry measurementsof deuterium, cross section taken from [160].
Reaction m/e cross section, σD2 + e− → D∗ + D+ + 2e− 2 σ2(100 eV) = 6 · 10−18 cm−2
D2 + e− → D+2 + 2e− 4 σ4(100 eV) = 1 · 10−16 cm−2
D2 + D+2 → D+
3 + D 5 σ6(∼ 1 eV) > 1 · 10−15 cm−2
for the relevant elementary reactions in case of deuterium, namely dissocia-

B-4 ICWC diagnostics
tive ionization of the deuterium molecule, direct ionization and productionof D+
3 . The latter reaction is a secondary reaction that does not involve elec-trons. Due to the small dimensions of the ion source and the low pressures,the electron flux can be considered constant over the interaction length be-tween electrons and neutrals. In this case the total number of producedD+ and D+
2 ions is proportional to the electron current Ie from the electronsource, the neutral particle density and the reaction cross section. We canthus write for the number of produced ions
ND+ ∝ IenD2σ2 (B.1)ND+
2∝ IenD2σ4 (B.2)
ND+3∝ nD+
2nD2σ6 ∝ Ien2
D2σ4σ6 (B.3)
where ND+ and ND+2
are linearly proportional to the deuterium pressure,and ND+
3to the square of the pressure. The presence of ND+
3at higher
pressures is not negligible. Whereas the electron impact reactions only takeplace in the small electron beam, the interaction area for producing ND+
3is
larger. We will compare these dependencies, obtained from table B.2, withmeasurements later in this section.
The produced ions are extracted from the ion source and sent in thedirection of the ion collector. In order the quantify the different ion fractionsat the ion detector the quadrupole section will separate the ions accordingto their mass to charge ratio. It consists of 4 parallel rods as shown inFig. B.1 to which a superposition of a constant and oscillating voltage isapplied: −φ0/2 to the rods in the xz-plane, and +φ0/2 to the rods in theyz-plane, with φ0 = U − V cos(ωt). The potential field in the xy-plane isthus given by
φ = φ0x2 − y2
2r20
(B.4)
with r0 the radius of the axial cylinder inside the rods. The equations ofmotion of the ions,
d2x
dt2 = − Zie
mir20
(U − V cos(ωt))x (B.5)
d2y
dt2 = Zie
mir20
(U − V cos(ωt))y (B.6)
with mi and Zi the ion mass and charge number, are of the form of theMathieu differential equation, describing the phenomenon of an oscillatorwith periodically varying frequency [168]. The trajectory of the ions thusdepends on the ion charge Z and mass unit M , the voltages U and V ,and the RF frequency ω. The solution of the Mathieu equation is either

Appendix B B-5
purely oscillatory, which means that an ion with certain M/Z-ratio has astable oscillatory trajectory through the quadrupole section, or either thesolution contains real exponential terms, due to which the ion will experiencean exponential increase of the oscillation amplitude. The latter results inan unstable trajectory, leading to the loss of the ion due to the finite xy-dimensions of the quadrupole section. One explains the operation of thequadrupole often as a band pass filter for ions in a certain M/Z rangedetermined by the RF voltage V [109,169]. The xz-plane provides a low passfilter, and likewise the yz-plane provides a high pass filter. The ratio U/Vsets the width of the accepted M/Z range, which should be set small enoughto avoid for example a current contribution from M/Z = 4 ions duringthe measurement of M/Z = 3. The resolution of the quadrupole is alsoimportant in this respect, and can be adjusted via the RF frequency, wherethe frequency has to be sufficiently high to impose several ion oscillationswhile the ion transverses the quadrupole length. A lower value for thefrequency is derived in [168].
The spectrometer quadrupole section mostly works at fixed frequency,and either effectuates continuous scans of the ratio of U/V to obtain M/Z-spectra (e.g. Fig. B.2), or will alternate several fixed U/V -values to collectthe ion current for a limited number of predefined M/Z-values (called peakmode). The ion collector at the final stage of the spectrometer collects theion current, in the simplest case by a Faraday cup [109]. The collector circuitincludes a variable current amplifier to allow for measurements ranging overmore than 6 orders of magnitude. In ‘fast’ mass spectrometers the signalmagnification needs to be set in advance. The fixed magnification allowsmeasurements in a range which is about 3 orders of magnitude. Theseranges are usually numbered according to their magnification:
Ran 0 : Im = 10−0IQMS, IQMS = [10−8 − 10−5]Ran 1 : Im = 10−1IQMS, IQMS = [10−9 − 10−6]Ran 2 : Im = 10−2IQMS, IQMS = [10−10 − 10−7] . . .
where IQMS is the measured signal and Im the correct(ed) ion current in-tensity. Slower mass spectrometers detect the required magnification auto-matically, and are therefore much slower. Each tokamak is equipped withthe latter type of slow mass spectrometers, often called machine mass spec-trometers, which are employed to monitor the gas content in the vacuumvessel during experimental programs. They continuously scan a wide rangeof M/Z values (1 to > 50) which takes about 30 s to a few minutes per scan.The machine mass spectrometers are important do determine the origin ofeventual leaks in the vacuum vessel (air, water), or to detect for examplethe release of metallic impurities from antennas surfaces.

B-6 ICWC diagnostics
Figure B.2: Example of a continuous mass spectrum for a gas mixture of H2,HD, D2 and He
B.1.2.2 Calibration of a quadrupole mass spectrometer
Utilization of the mass spectrometer in peak mode requires both the accu-rate determination of the U/V -values localizing the requested M/Z valuesalong the continuous M/Z spectrum, and the calibration of the measuredion current intensity to the neutral pressure of the gas. Fig. B.2 shows an ar-bitrary continuous mass spectrum for a typical conditioning gas mixture ofH2, HD, D2 and He. For illustration, the separate contributions to the mea-sured total ion current intensity for each gas are also given in dashed lines.These lines are often called the cracking patterns of the molecules. The peakmeasurement point for each mass to charge ratio has to be aligned with themaximum of the corresponding peak for optimal accuracy. The ratio ofthe measured peak values together with the calibrated cracking patternsof the gas components, allow to determine the gas composition. For thegiven gas mixture of 4 components one measures often 4 mass to chargeratios: 2, 3, 4 and 6. The measured intensities relate to the pressure thedifferent components as (the quadratic pressure dependencies are ignored,see further):
I2I3I4I6
=
a2 b2 c2 d2a3 b3 0 00 b4 c4 d40 0 c6 0
pH2
pHDpD2
pHe
(B.7)
The decomposition of the intensities into pressure requires thus the inver-sion of the calibration matrix. However this simple operation often leads toproblems. The coefficients in the 4x4 matrix can vary over 3 orders of mag-nitude, and separately the constituent partial pressures can also range overseveral orders of magnitude. The measurement accuracy and the accuracy ofthe calibration thus have to be extremely high if one wants to obtain partial

Appendix B B-7
Figure B.3: Example of quadrupole mass spectrometer calibration plots fordeuterium (TORE SUPRA, Q6B). The fits for the different mass to charge ratiosare: I2 = 2.23 · 10−7pD2 , I3 = 6.56 · 10−7pD2 , I4 = 3.31 · 10−5pD2 and I6 =7.4 · 10−8pD2 .
pressures from this method. For practical cases one will choose to stronglysimplify the matrix, with respect to the present gas mixture. Examples ofterms that can be neglected in case of He/H2 conditioning discharges toremove deuterium from the wall are colored gray in the matrix. For theanalysis in this manuscript most efforts were put in the correct decomposi-tion of the discussed H2, HD, D2 and He mixtures, but also measurementswere carried out for heavier molecules such as water, carbon oxides, carbonhydrates, etc,...
In the following we will briefly discuss a calibration example. Fig. B.3shows measured ion current intensities as a function of the neutral deu-terium pressure in the vessel. The background values on both the baratronpressure measurement as on the QMS measurements were subtracted to ob-tain nice calibration curves for this example. One needs to note that thesesubtracted offset values can originate from incorrect setting of the measure-ment zero value or from a real pressure in the vessel. In the latter case onemust take the background pressure into account in the mass spectromet-ric data analysis. A 10 point smoothing filter was applied to the baratrondata (sampling interval of 2 ms), and likewise a 3 point smoothing filter onthe sampled QMS data (sampling interval of 65 ms). The calibration fordeuterium is interesting in that it shows both the strength and the difficul-ties of mass spectrometry in one example. We will discus first the effectof the measurement ranges on the measurement accuracy, and secondly theobtained pressure dependencies.
Ranges: First of all we see that the data collected using different rangeslines up very nicely. In case of mass to charge ratio 2, from now on shortlycalled ‘mass 2’, the ideal range to measure the ion current intensity is ran

B-8 ICWC diagnostics
3 ∼ [10−11 − 10−8]. The large spread of mass 2 ran 0 data points aroundpressures of 2 · 10−3 Pa shows that the measurement accuracy decreases be-low the lower range limit. Additionally, the offset subtracted from mass 2ran 0 and 1 is larger than the signal itself (resp. 1.4 · 10−8 and 8.7 · 10−9).For mass spectrometric measurements it is thus important to measure inthe appropriate range so that the real signal intensity is larger than anybackground or uncertainty. Practically this means that the measured inten-sity minus the expected background intensity must not be lower than thelower limit of the measurement range. The effect of the upper range limitis clearly visible for mass 4. Ranges 2 and 3 saturate for higher intensi-ties than respectively 10−7 and 10−8. Logically one must avoid to measureabove the upper range limit. The ideal measurement range for mass 4 ina pressure range of [5 · 10−4 − 1 · 10−2 Pa] is ran 1 ∼ [10−9 − 10−6]. Thefigure of mass 6 shows another interesting effect. Ran 2 and 3 line up nicelyand in principle we would expect this for ran 4 as well. However it appearsthat the offset value for ran 4 is negative and that these negative values arerecorded as zeros. The slope of the linear fit of mass 6 ran 4 data at higherpressures (∼ 1 · 10−2 Pa) is identical to the ran 2 and 3 slopes.
Pressure dependencies: According to the relevant elementary collisions(table B.2) we would expect a linear dependency on the masses 2 and 4,and a quadratic dependency for mass 6, as shown in eq. (B.3). The lin-ear dependencies are found back for masses 2 and 4. However, the mass2 intensity is about 100 times weaker than mass 4, and not ∼ 17 times aswould be expected from the reaction cross sections. In these calibrationmeasurements, the correlation for mass 6 is in good approximation linearinstead of quadratic. This linear dependency means that the second step inthe two step reaction leading to formation of D+
3 does not depend on thepressure. The second step is thus clearly not the dissociative attachmentreaction given in table B.2. At this point there is no clear understanding ofthis effect, but it is expected that the slowly varying concentration of deu-terium atoms sticking on the spectrometer walls lies at its origin. The D+
3intensity is known to vary in time (which can be explained by the variationof the concentration of sticking atoms), and therefore it is recommendedto calibrate its intensity regularly. Experience learns that it is difficult torely on the mass 6 signal to quantify the D2 pressure, especially when thepressure is low (∼ 10−4 Pa). In this manuscript mass 6 is used to indicatethe presence of deuterium qualitatively, but it is not used for qualitativeanalyses.
Finally mass 3 should, according to the above, be zero. As can be clearlyseen on the figure, the linear dependency of mass 3 is not negligible, the

Appendix B B-9
intensity is even the double of that for mass 2. This signal for mass 3 canoriginate from several things, which we will list here to conclude this sectionon mass spectrometry:
• either the quadrupole U/V -ratio is not optimal causing a too widepassing M/Z band,
• either the quadrupole RF frequency is too low resulting in bad reso-lution,
• either the spectral location for measuring mass 3 is not correctly set;e.g. slightly shifted to the side of mass 4, (for example at mass 3.3) sothat a part of the peak tail of mass 4 ions is measured (see Fig. B.2),
• either the signal originates from HD molecules that can be formedinside the spectrometer itself from recombination of present deuteriumatoms and residual hydrogen sticking on the spectrometer walls. Thespectrometer can be cleaned from this residual gas by heating it up,inducing thermal desorption.
The above problems, if not too severe, can be overcome (the last if onecan assume that the sticking hydrogen concentration varies only slowly intime) by carrying out a good calibration of the measured mass signals fordifferent gases, and strongly simplifying the calibration matrix according tothe expected gas mixture.
B.1.3 Other residual gas analysis systemsB.1.3.1 Penning gauge spectroscopy
As already indicated in the section on mass spectrometry, experience learnsthat the quantization of low deuterium partial pressures (∼ 10−4 Pa) in ahelium environment (∼ 10−2 Pa) using mass spectrometry is not evident.Both helium and deuterium have their most important peak in the M/Z-spectrum at mass 4, more accurately at respectively 4.003 and 4.027. Toseparate the partial pressures of deuterium and helium one can employ thestandard Penning vacuum gauges described above and analyze the char-acteristic light emitted by the Penning discharge. This is called Penninggauge spectroscopy. Optic fibers are connected to the gauge, transportingdischarge light to a measurement bench. This allows to quantify the inten-sity of the emitted Balmer-α lines for hydrogen isotopes (Hα at 6562.8 A andDα at 6561.0 A) [170], and the helium singlet 3s-2p transition at 5016 A ortriplet 3d-2p transition at 5875 A [171]. The optic fibers can be connectedto a spectrometer, or as is mostly the case via an interferential optical fil-ter (∆λ ∼ 0.5 nm) to a photomultiplier and photodetector. The detected

B-10 ICWC diagnostics
characteristic light intensities are proportional to the partial pressure p, theelectron density ne and excitation rate kexc (de-excitation occurs immedi-ately after excitation):
IHe = a nepHekexcHe +b nepDk
excD (B.8)
ID = c nepDkexcD +d nepHek
excHe (B.9)
Penning gauge spectroscopy was used to decompose the partial pressuresduring JET ICWC experiments, and to obtain qualitative information onthe neutral gas content on ASDEX Upgrade. However care has to be takenin the data analysis. The equation above shows two important disadvanta-geous features. First of all, the light intensity is clearly dependent on theelectron density. In turn, the electron density is dependent on the total pres-sure. This makes that the Dα line intensity in case of a constant deuteriumpartial pressure can increase on adding a helium pressure. Although thisfact is in principle true, it is not be observed in measurements (e.g. [170]).Secondly the employed filters are not perfect. The grey factors in eq. (B.8-B.9) account for the concomitant contributions (b, d 6= 0). Finally, it is notpossible to determine with Penning gauge spectroscopy the origin of thehydrogen isotopes that emit the measured Hα and Dα lines. Mostly Hα
are Dα not measured separately due to the too wide filter band, and evenif they can be separated (e.g. by slightly tilting the filter and thus chang-ing its thickness and was done on JET [172]), additional measurements arerequired to relate the lines to H2, HD, D2, CH4, ... molecules. The measure-ment accuracy of Penning gauge spectroscopy is strongly dependent on theamount of light that can be guided to the measurement bench, the qualityof the employed filters, the characteristics of the photomultipliers and thesuppression of background light.
B.1.3.2 Gas chromatography
The residual gas analysis technique ‘gas chromatography’ is used duringICWC experiments on JET. During the regeneration of the cryopumps, theneutral gas adsorbed on the cryopanels is collected and passed through achromatography system. The employed gas-chromatograph consists of acompression/injection stage and two parallel analytical stages, one for thedetection of helium, hydrogen isotopes, oxygen, nitrogen, methane and car-bon monoxide by means of a thermal conductivity detector and one for thedetection of carbon monoxide, methane, carbon dioxide, and higher hydro-carbons by means of a flame ionization detector [173]. Gas chromatographywas used during the JET experimental session on ICWC. It enabled theindependent verification of the total number of removed wall desorbed par-ticles, obtained by mass spectrometry and Penning gauge spectroscopy.

Appendix B B-11
B.2 Plasma diagnosticsIn this section we will discuss the employed plasma diagnostics during ICWCexperiments on different tokamaks, namely interferometry, reflectometry,Langmuir probes and retarding field analyzers, spectroscopy, lithium beamspectroscopy and electron cyclotron emission. These measurement systems,which are installed on the tokamak devices, are as already mentioned de-signed to measure on high density and high temperature fusion plasmas.Obtaining data from low density and low temperature conditioning plas-mas was thus not always evident. One relied much on the extra efforts ofthe responsible diagnosticians.
B.2.1 InterferometryVia interferometry measurements one obtains the integrated electron den-sity along a line of sight. The interferometer measures the phase shift be-tween 2 electromagnetic waves from which 1 passes through the plasma,perpendicular to the magnetic field. The phase shift of the latter dependson the electron density profile along the line of sight [167]:
∆φ = − ω
2cnc
∫ne(r)dr (B.10)
where c is the speed of light and nc = ω2meε0/e2 is the critical density above
which the wave cannot propagate, with ω the wave frequency. One distin-guishes in this manuscript DCN and HCN interferometers according to theemployed lasers: respectively ∼ 195µm and 337µm. Furthermore one canuse homodyne detection of the phase shift by measuring the resulting lightintensity after mixing of the plasma and reference bundles, and heterodynedetection where one of the beams is slightly modulated in frequency and thephase shift is measured from the changes in beat frequency of the two mixedbundles. In most experimental setups, especially for measuring radial linesof sight, the laser beams pass two times through the plasma. For radiallines of sight, the laser beam is injected from the low field side, reflectedon a mirror at the high field side, and collected again on the low field side.The phase shift can be influenced by mechanical vibrations of the involvedsystems, or displacements of the mirrors due thermal effects.
Appendix A shows for tokamak TORE SUPRA, TEXTOR, ASDEXUpgrade and JET, the lines of sight of the installed interferometry systemson a poloidal plane, and the location of the diagnostic on the toroidal plane.

B-12 ICWC diagnostics
B.2.2 ReflectometryReflectometry is similar to interferometry. It employs the cut off densitync above which the wave is no longer propagative (f < 100 GHz), and thuswill be partially reflected, to obtain a 1D density profile of the plasma.The reflectometer will scan through a range of frequencies and detect thephase shift of the reflected wave. From this phase shift the location of thereflection point along the line of sight can be determined, to which the cutoff density can be assigned.
B.2.3 Electron cyclotron emission (ECE)Electrons gyrate around the magnetic field lines with cyclotron frequency
ωc = e
Bme
Because of this accelerated motion the electrons emit electromagnetic ra-diation with the same cyclotron frequency. The inhomogeneous toroidalmagnetic field in the vessel makes that each of the emitted frequencies isrelated to a specific radial position. In case the plasma is optically thick(it absorbs its own electron cyclotron emission) the plasma will radiate as ablack body, in which case the intensity is only related to the electron temper-ature. For tokamak plasmas with temperatures > 10 eV the Rayleigh-Jeansapproximation for black body radiators holds [174]:
IBB = ω2
4π2c3kTe
The lower detection limit, i.e. the lowest detectable electron temperature,is determined by the receiver noise level which appears in practice to be inthe range of ICWC conditioning plasma temperatures. Interesting resultswere obtained from ECE, however the responsible diagnosticians do nothave much confidence of the accuracy of their devices for ICWC plasmaparameters.
B.2.4 Langmuir probesA Langmuir probe consist of one or more electrodes inserted into a plasmato which a time-varying voltage, the sweeping voltage, is applied. By ana-lyzing the obtained I-V characteristic information can be obtained on thelocal density and temperature of electrons and ions, and on the plasma po-tential. All kinds of probe configurations exist. We will discuss here the twomost important, namely the single and double probe configuration. Fig. B.4

Appendix B B-13
Figure B.4: Left: Schematic of a single-probe circuit including the sweepingpower supply, the voltage measurement and the current measurement. Right:Schematic of a double probe circuit. Notice that the sweeping power supply andvoltage measurement float. Drawing based on [167].
Figure B.5: Ideal single and double probe I-V characteristic for a hydrogenplasma with Te = 20 eV, Ti = 20 eV, ne = 1016 m−3 and Vs = 50 V according toequation (B.11) and (B.12).
shows the electric scheme of a single and double probe where the measure-ment location for current and voltage are indicated. The ideal single probeI-V characteristic assuming Maxwellian populations is given by [167]:
Ipr = I+ − I−exp[e(Vpr − Vs)/kTe] (B.11)
where Ipr and Vpr are the probe current and voltage, Vs is the plasma po-tential, I+ = 0.5eneScs is the ion saturation current and I− = −0.25eneScethe electron saturation current, with cs = [k(Te + ZγiTi)/mi]1/2 the soundvelocity, ce = [8kTe/me]1/2 the thermal electron velocity, S the effectivecurrent collection area, ne the electron density, Te and Ti the Maxwellianelectron and ion temperature, mi the ion mass, Z the ion charge state andfinally γ ≈ 1.5 the ion adiabatic constant, which is a measure for the plasmacompressibility. Fig. B.5 shows the ideal probe characteristic for the singleprobe configuration in case of a hydrogen plasma with Te = Ti = 20 eV,ne = 1016 m−3 and Vs = 50 V; on the figure the ion and electron satura-tion current, and the plasma potential are indicated by dotted lines. It is

B-14 ICWC diagnostics
clear that the sweeping voltage amplitude has to be higher than the plasmapotential to be able to determine the electron saturation current. If thecomplete characteristic is obtained, one can derive the electron tempera-ture and density, the ion temperature and the plasma potential. However,the sharp knee at the plasma potential in the I-V characteristic and the flatelectron and ion saturation currents are ideal probe features that are rarelyseen in practice. The current can in reality continue to increase beyond thesaturation currents due to sheath expansion [175].
An alternative scheme for the single probe that allows obtaining theelectron temperature, electron density and ion temperature, independentlyfrom the plasma potential is the double probe configuration. In the dou-ble probe configuration the time-varying potential is applied between twoprobe electrodes. This has as additional advantage that the measured char-acteristic will be less affected by RF effects such as rectifier current in RFplasmas [176]. The double probe I-V characteristic assuming Maxwellianpopulations is given by [167]:
Ipr = I+tanh(eVpr/kTe) (B.12)
Fig. B.5 shows also the ideal probe characteristics for a double probe, forthe same plasma. Both at higher negative and positive voltages the currentis limited by the ion saturation current. The slope of the characteristic atVpr = 0 is inversely proportional to the electron energy. In case of highelectron temperatures larger sweeping voltage ranges will thus be required.
On TORE SUPRA, several attempts are carried out to employ the in-stalled Langmuir probes with limited success. On TEXTOR it was possibleto obtain values for plasma density, temperature and potential. The resultswere obtained with a dedicated double probe shown in Fig. B.6 powered bya sinusoidal sweeping voltage with a period of 20 ms and amplitude of 75 V.
B.2.5 Retarding field analyzerThe retarding field analyzer (RFA) belongs to the same family of elec-trostatic probe techniques as Langmuir probes. It is the most widely ac-cepted diagnostic for SOL Ti measurements [178], and is used during TORESUPRA ICWC experiments to determine the parallel ion flow (no values forTi could be retrieved). An RFA consists of a thin aperture aligned normalto the total magnetic field, a pair of retarding (= to which a voltage is ap-plied) grids and a collecting element [179]. The plasma ions are transmittedthrough the aperture into the analyzer where their parallel velocity distri-bution is analyzed by means of a retarding electric field applied to a grid.

Appendix B B-15
Figure B.6: Double Langmuir probe designed for ICWC plasma characterizationat TEXTOR [177] (Left: side view, right: top view): Plate diameter 10 cm, probeheight 3 mm, probe electrode height 3 mm and probe electrode diameter 1.96 mm.
The RFA probe on TORE SUPRA consists in fact of two a RFA analyzersrespectively collecting ions from both direction along the magnetic field,respectively the electron current side and ion current side [178].
B.2.6 Visual imagingThe vacuum vessels of all tokamaks are monitored by CCD cameras, record-ing 2D visual light images with sampling time in the order of 0.1 s. Thesemonitoring systems are of importance to evidence the presence of a plasmaduring experimental programs and to get a first idea on plasma perfor-mance by visual inspection. The light intensity and distribution can deliverinformation on instabilities such as RF trips or on plasma homogeneity. Ingeneral the intensity from ICWC plasmas is much lower than in regulartokamak plasmas, which can be solved by increasing the sensitivity of theacquisition system.
B.2.7 SpectroscopyPlasma spectroscopy, namely the detection and quantification of radia-tion emitted by plasma, can deliver important information on plasma con-tent and the electron temperature of the plasma. The employed spectro-scopic systems during ICWC discharges are mostly based on the emissionof Balmer-α lines of hydrogen isotopes, which can be used to evidence hy-drogen plasma breakdown, determine the isotopic ratio of the plasma (ifHα and Dα can be separated), to obtain information on plasma distribu-tion (if multiple lines of sight are available) and to quantify fast particleenergies from the broadening of the spectral line (if high resolution spectracan be obtained). For the latter one specifically employed lines of sight

B-16 ICWC diagnostics
of the charge exchange spectroscope without fast particle injection (TEX-TOR). Characteristic radiation of impurities are monitored to evidence thepresence of impurities, of which the most important is carbon (except forASDEX Upgrade which has solely tungsten plasma facing components).
The integral over the emitted spectrum for different lines of sight, rep-resenting the total radiated power along these lines of sight, is measureddirectly by bolometry on most tokamaks (although the integral is often notcomplete: e.g. 2 to 2000 A on TORE SUPRA). An Abel inversion of mul-tiple viewing lines (48 on TORE SUPRA) allows reconstructing a radiatedpower profile, which could give important information on plasma distribu-tion. However the total radiated power in ICWC discharges is too low toobtain an accurate reconstruction.
B.2.8 Lithium beam spectroscopyOn TEXTOR a beam spectroscopic system was set up to determine theelectron density and temperature via characteristic radiation emitted bythermal lithium atoms (LiI) [113]. A collisional radiative model for lithiumatoms was developed including spontaneous emission after excitation, elec-tron collisional excitation, de-excitation and ionization, where the electronenergy distribution is assumed to be Maxwellian. The parametric dependen-cies (ne, Te) for ratios of characteristic line intensities, I(610 nm)/I(670 nm)and I(460 nm)/I(610 nm), obtained from the model allowed to evaluate theelectron density and temperature in ICWC plasmas. Lithium beam spec-troscopy on TEXTOR provided valuable information allowing to evidencethe extension of the RF plasma towards the bottom of the vessel on appli-cation of a small vertical magnetic field [113] which will be discussed furtherin chapter 3.
B.2.9 Neutral particle analyserA neutral particle analyzer (NPA) will analyze the flux of neutral particlesto the wall. This flux originates from plasma ions undergoing charge ex-change reactions with neutral particles or recombination with electrons. InICWC plasmas also dissociation of neutral molecules or of molecular ionscontributes to the total neutral wall flux, however the energy of these neu-trals (∼ Franck Condon energy) is out of the measurement range of theinstalled NPA’s. The flux of hydrogen or deuterium atoms with energy (E)emerging from a unit volume of the plasma is given by [167]:
FH,D(E) = nH+,D+fH+,D+(n0 〈σv〉CX) (B.13)

Appendix B B-17
Figure B.7: Illustration of the mass and charge separation principle of a NPA.After reionization of the CX neutrals in the stripping cell, the ions enter into asemicircular region containing a magnetic and parallel electric field, both perpen-dicular to the initial ion path, making that the impact location on the detectorplane is both energy and mass resolved. [167]
with nH+,D+ the density of hydrogen and deuterium ions, fH+,D+ their dis-tribution function, n0 the density of neutral hydrogen isotopes and 〈σv〉CXthe rate coefficient for CX, where we neglect recombination. In the NPA theneutrals are ionized and separated according to their mass and charge by anelectric and magnetic field (see Fig. B.7). The detection plane resolves theion mass, in the figure, along the y-axis and the ion energy, via the gyrationradius of the ions in the magnetic field, along the z-axis.
The employed NPA’s in this manuscript resolve hydrogen and deuteriumfluxes for a limited number of energy values in the range of 0.5 to 50 keV anddeliver line integrated CX fluxes along a viewing line with certain solid angle.The Maxwellian temperature of the energetic particle flux can be derivedby fitting a Maxwellian distribution to the signals of the different energychannels. The measured data is given with unit [(dE dt m2 sr)−1]. To obtainthe total time resolved wall flux, assuming that the plasma parameters arehomogeneous and that the flux from each unit volume is isotrope, one hasto multiply by 4π to obtain the complete solid angle, divide by the lengthof the line of sight, multiply by the plasma volume and integrate over theenergy.
The energetic ions in ICWC plasmas are produced by resonant absorp-tion of RF power at the resonance layers. From this it is expected that theCX flux originates from the resonance layer as well, and thus the assumptionof homogeneous plasma parameters in the above is in principle not correct.Thus to obtain the total wall flux it is not correct to divide the data by thelength of the line of sight and multiplying with the plasma volume. One

B-18 ICWC diagnostics
has to divide by the width of the resonance layer δr, and multiply by thevolume of the resonance layer Vr = 4πricaδr, with ric the radial locationof the resonance layer and a the minor radius. This consideration will giveonly a small correction to the total flux, but on the other hand it makesthat the wall flux can not be assumed homogeneous. Due to the verticalresonance layers, the vertical fluxes will be more important than the fluxesin the horizontal plane.

CAppendix to chapter 5
C.1 Benefits and limitations of a 0D approachC.1.1 HomogeneityTo justify the relevancy of a 0D approach to study the plasma parametersin RF plasmas, a proper consideration of the homogeneity of RF plasmas isrequired. In chapter 3 this point was thoroughly discussed. In the toroidaldirection the plasma parameters are considered uniform [73, 92, 93]. In thepoloidal plane the measured densities appear to be systematically higher onthe low field side than on the high field side [127] and, dependent on thedischarge pressure and coupled RF power, is sometimes peaked along theradius. The poloidal inhomogeneity is thought to have two main causes.The vertical inhomogeneity is due to collective plasma drifts in the toroidalmagnetic field, and the radial inhomogeneity is due to inhomogeneous powerdeposition. TOMCAT [89] simulations show that in proper selected regimes,depending on the plasma composition and the choice of RF frequency andmagnetic field, the RF power is mainly coupled to the electrons and that thepower can be deposited over the whole radial extension of the vessel [97].
To describe self consistently the drifts and RF coupling properties ofthe plasma, a 2D model would be required. In case the model only needsto describe the RF power deposition profiles without detailing out verticalinhomogeneities, a 1D model along the radial dimension is sufficient. Re-cently Moiseenko [180] developed such a self consistent model for RF plasma

C-2 Appendix to chapter 5
production in stellarators. Whereas Moiseenko upgraded his original modelfor atomic hydrogen [132] to 1D, on our side we have upgraded the balanceequations to molecular hydrogen and helium. This complementary choiceis especially justified for the description of plasmas with low ionization de-gree, such as wall conditioning plasmas. The simple structure of a 0D codeallows to study within reasonable calculation times (2 min cpu time for 1s of plasma) a complete set of plasma species, including their most impor-tant elementary processes. The information on the plasma parameters andtheir relative concentrations as a function of the pressure, gas mixture andcoupled power can for example be used in an iteration with RF couplingcodes (e.g. TOMCAT) to complete our understanding on the power absorp-tion [93]. To conclude: in this stage of the development of the RF wallconditioning technique a 0D model including edge conditions at the wall issufficient. Later the elements of this 0D model can be used in an upgradeto a 1D code, using an RF-power deposition profile as input, or to a selfconsistent 1D code. For this matter a coupling with the TOMCAT code, orthe code of Moiseenko can be an option.
C.1.2 Fast particlesA limitation of the presented code is the absence of the population of fastions that are produced by resonant absorption of RF power at the IC res-onance layer [73]. Resonant absorption by ions is however a local effect1,unlike the coupling of RF power to the electrons which takes place over thewhole plasma volume. It is thus not straightforward to implement the pop-ulation in a 0D code. From neutral particle fluxes measured on JET [127]compared to TOMATOR-0D simulations (see chapter 4) it is found that thedensity of fast particles (Tfast ∼ 10 keV) is very low (nfast ≈ 10−4ne) andmight be safely neglected. (TOMCAT simulations show that also outsidethe IC layer power can be coupled to the ions by non-resonant ion-neutral,ion-ion and ion-electron collisional absorption. The latter will likely notgive rise to fast particles and is included in the model assuming the powerdeposition is homogeneous.) The local character of the resonant couplingcan in a 1D model easily be implemented by varying the coupled powerto the electrons and ions along the radial direction. A meaningful imple-mentation of the fast ion population around the resonance layer appearsnot to be straightforward in a 0D model. When keeping the assumptionof Maxwellian temperatures, it implies the addition of an extra particle
1More precisely: a local effect in radial direction and non-local in toroidal direction,depending on area of FW propagation. It means that IC absorption may happens every-where along the torus if FW reaches the ICR layer with high enough amplitude of RFfield.

Appendix C C-3
specie that represents the fast ions. This leads to two problems that, onintroducing sufficient simplifications, can be overcome. The first is relatedto the particles that interact with the fast ions, the second with sourceterms for the fast particle population. However it is decided not to includethe fast particle population since a study of related effects should be donepreferentially in a 1D context.
Nevertheless, the two mentioned ‘problems’ that need to be solved inthis respect are discussed here shortly to illustrate the interesting drivingmechanisms that could motivate a future model expansion to 1D. The firstis related to the particles that interact with the fast ions, the second withsource terms for the fast particle population. (1) For each particle thatinteracts with the fast ion population a specie, representing its local density,has to be added. The same is true for the resulting species. It is clear thatby definition the model will be no longer 0D. The model can regain its 0Dcharacter by drastically limiting the elementary processes of the fast ionpopulation. For example by regarding (a) the fact that in a H2 plasma, thefast H+ ions have as most probable interaction charge exchange with H forwhich the density distribution might be considered homogeneous and (b)the fact that the produced fast H neutrals are most probably lost to the wallsbefore they can collide with an other particle. The energy balance of the fastions can in this way be calculated self consistently; the coupling of power tothe fast ion population is balanced by charge exchange with neutrals. (2)In the calculation of the particle balance however we encounter the secondproblem: the population of fast ions needs a source term. The main H+-ion source is ionization of H-atoms and dissociative ionization of H2. In asimple approach, the produced ions could be divided into the fast and slowpopulation according to the ratio of their radial extent in the vessel. Thenagain this would appear too simple; if the only accounted loss mechanismis charge exchange, in which a fast ion is replaced by an other ion that alsomust be counted to the fast ion population due to its radial position, theion concentration in the resonance layer can only grow in this approach. Inthe limit this leads to the unphysical situation where the resonance layercontinuously milks the hydrogen from slow populations until there is nohydrogen left in the vessel, all will be in the resonance layer. This problemcould be solved in turn, by considering that the fast ions radially drift ordiffuse out of the resonance layer, or by including losses of fast particlesalong field lines on inclusion of a vertical magnetic field.
Experimentally, from NPA measurements, there is no clear evidence of acontinuous increase of the fast particle population. A study of the describedeffects, e.g. on the involved time scales, might however be interesting andshould be done preferentially in a 1D context. It is as such considered out

C-4 Appendix to chapter 5
of the scope of this 0D model.
C.1.3 Plasma breakdown phaseIn the 0D approach the total coupled RF power is normalized to the plasmavolume. This is meaningful only when the plasma density is uniform over thevessel and in the approximation that the RF power deposition is homoge-neous over the whole vessel volume. The first point is important to considerif the model needs to be used to study the breakdown of the plasma, namelythe build up of plasma from zero density to the steady state value. Accordingto the present understanding, and in present devices, the plasma breakdownoccurs in front of the antenna, in the near antenna electric field [94]. In theequilibrium state the plasma is sustained by excited waves. A completedescription of the breakdown should include the conversion from the firstregime to final: namely from ionization by accelerated electrons in the nearantenna electric field to a plasma extended over the whole vessel sustainedby excited waves as described in [95]. Even though the 0D model simpli-fies the involved RF-physics to a maximum (see section 5.1.5), it allows tosimulate plasma breakdown. The reason for this is that the plasma buildup is dominated by particle collisions, which are very well described in themodel. The 0D model describes the time evolution of the plasma parametersthrough the breakdown phase automatically if the electron coupled poweris enough to achieve ionization in the given volume. How power couplingand plasma breakdown is handled in the model is described in section 5.1.5.From wave theory it is known that on increasing plasma density differentwaves can be excited. The model is in principle also able to determine themoment at which wave propagation becomes possible (ω = ωpe), from thecalculated plasma density.
Experimentally the breakdown moment goes accompanied with a suddendrop in the antenna voltage and a sudden increase of the emitted H-alphalight [181]. The breakdown time is dependent on the strength of the nearantenna electric field, its shape (defined by the geometry and the numberof straps and their phasing), the RF frequency and the pressure in the ves-sel [81, 86]. The strength of the initial electric field is determined by theinitial antenna voltage, which is in turn dependent on the generator power.The final antenna voltage is determined by the generator power and thecoupling efficiency [182]. The 0D model can reproduce the dependency ofthe breakdown time on the pressure and power, but is not able to repro-duce the dependency on RF frequency and electric field. Efforts to includedependencies on RF frequency and electric field in the model have beencarried out, without satisfactory results at this point.
In the initial phase of the numerical simulation the coupled RF power

Appendix C C-5
is set proportional to the electron density, which might be expected to bea realistic assumption. By adapting the proportionality, the experimen-tal breakdown time can be reproduced. This point is further discussed insection 5.1.5.
C.1.4 Wall conditioning efficiencyWall conditioning aims at removing impurities, fuel particles or codepositedlayers from the plasma facing components. The efficiency of the wall con-ditioning techniques is measured by the rate Q at which it removes walldesorbed particles from the vessel. For the removal of the produced gas oneuses the machine pumps. The removal rate is proportional to their pump-ing speed S and the gas pressure Q = pS. A correct description of thewall conditioning effect requires the implementation of (1) gas injection andpumping by the machine pumps (see section 5.1.4), and (2) dynamics of theexchange of particles between plasma and wall. The first point is easy toimplement into the balance equations of the neutrals (H2 and He) by addinga term for the removal rate Q and an injection rate of gas into the vessel. Aswill be explained in section 5.1.3.4 the model can be run with or without thedynamic gas throughput. In relation to the second point, the model allowsto set a recycling coefficient representing the wall interaction leaving thepossibility to study the effect of wall recycling on the plasma (see modelingresult in section 5.2.4). Experimentally the recycling is found to be veryclose to 1 [154]. The exchange of particles between plasma and wall willdepend on the wall materials and particle flux properties like their energy,fluency, chemical activeness, etc... A complete mathematical description ofthe wall behavior is a complicated matter and requires a study on its own,as will be presented in the next chapter (6).
C.2 Figures reaction ratesThis subsection gathers the reaction rate figures for the collisional processesrelevant to hydrogen-helium conditioning discharges, presented in section5.1.2.

C-6
Appendix
tochapter
5
Figure C.1: Reaction rates (〈σv〉) for H excitation, H ioniza-tion and H+ recombination on electron impact as a functionof the electron temperature (Te).
Figure C.2: Reaction rates (〈σv〉) for H2 excitation on elec-tron impact as a function of the electron temperature (Te).

Appendix
CC
-7
Figure C.3: Reaction rates (〈σv〉) for H2 dissociation onelectron impact as a function of the electron temperature(Te), the H2 vibrational temperature (Tvib) and the electrondensity (ne).
Figure C.4: Reaction rates (〈σv〉) for H2 ionization on elec-tron impact as a function of the electron temperature (Te),the H2 vibrational temperature (Tvib) and the electron den-sity (ne).

C-8
Appendix
tochapter
5
Figure C.5: Reaction rates (〈σv〉) for electron-H+2 recombi-
nation as a function of the electron temperature (Te) and theelectron density (ne).
Figure C.6: Reaction rates (〈σv〉) for additional electronimpact reactions with H2, H+
2 and H+3 as a function of the
electron temperature (Te).

Appendix
CC
-9
Figure C.7: Reaction rates (〈σv〉) for He and He+ ionizationand He+ and He2+ recombination on electron impact as afunction of the electron temperature (Te).
Figure C.8: Total cooling rate of the electrons for colli-sions with He, He+ and He+2 as a function of the electrontemperature (Te) and the electron density (ne). ( [143] =[INDC1995])

C-10
Appendix
tochapter
5
Figure C.9: Charge exchange reaction rates (〈σv〉) as a func-tion of the reduced temperature (T ∗) of the involved particles.
Figure C.10: Additional heavy particle collision reactionrates (〈σv〉) as a function of the reduced temperature (T ∗) ofthe involved particles.

Appendix
CC
-11
Figure C.11: Reaction rates (〈σv〉) for electron-ionCoulomb collisions as a function of the electron temperature(Te) and density (ne).
Figure C.12: Reaction rates (〈σv〉) for ion-ion Coulombcollisions as a function of the reduced temperature (T ∗) anddensity (n) of the involved particles.

C-12
Appendix
tochapter
5
Figure C.13: Elastic collision rates (〈σv〉) as a function ofthe reduced temperature (T ∗) of the involved particles.
Figure C.14: Total cooling rate of the electrons for collisionswith C, C+, C2+, C3+ and C4+, as a function of the electrontemperature (Te) and the electron density (ne). ( [143] =[INDC1995])

Appendix
CC
-13
Figure C.15: Reaction rates (〈σv〉) for C and C+ ionizationon electron impact as a function of the electron temperature(Te). [151]

C-14 Appendix to chapter 5
C.3 Relation particle confinement and energyconfinement
The confinement time of a particle can be expressed as a function of thedimensions of the vessel and the particle velocity towards the vessel walls.This velocity will depend on the considered physical mechanism, discussedinto detail in chapter 3. In the 0D model we consider for each specie aMaxwellian velocity distribution. Particles from the high energy tail of thedistribution generally have a smaller confinement time than lower energyparticles. These particles will thus be lost faster than less energetic ones,which will in turn affect the particle velocity distribution, and likewise theaverage energy of the distribution. As was done for the reaction rates, itis possible to obtain effective confinement times by taking into account theparticle velocity distribution. Using effective confinement times instead ofconfinement times where the energy distribution is not specifically takeninto account, appeared not to significantly influence the modeling results.An additional complication results from the weighting of the wall flux by theenergy dependent mean free path of the particles, which appeared e.g. im-portant to describe correctly the neutral wall flux in section 5.9. Thereforeit was chosen not to include the effective confinement times in the finalmodel. And also for the same reason it was chosen to use the same confine-ment time for the particle and energy confinement time. Nevertheless, if wedisregard the dependency on the mean free path for the moment, it is easyto calculate the effective confinement times. We will have a closer look tothis in the following short analysis: the effective particle confinement timeand energy confinement time for the vertical ‘ ~B ×∇B’ drift of the ions inthe magnetic field, the radial ‘ ~E× ~B’ drift and the losses along the magneticfield lines are calculated.
With τ(v) the velocity dependent particle confinement time we can writethe change of the velocity distribution as:
df(~v)dt = −f(~v)
τ(v) (C.1)
For a singly charged particle, the confinement time related to the vertical‘ ~B ×∇B’ drift is defined as (τ = a/v with a the minor radius):
τ(v) = qaR0BT2kBT
= 32qaR0BTmv2 (C.2)
with R0 the major radius, q, m, T and v the particle charge, mass, temper-ature (K) and velocity, BT the toroidal magnetic field, kB the Boltzmann

Appendix C C-15
constant, and⟨1/2mv2⟩ = 3/2kBT . We obtain
df(~v)dt = −
(m
2πkBT
)3/2 23
mv2
qaR0BTe− mv2
2kBT (C.3)
with T the Maxwellian temperature. The following integrals gives respec-tively the time evolution of the total number of particles and the timeevolution of the total energy:∫ ∞
−∞
df(~v)dt d3~v = dN
dt (C.4)
∫ ∞−∞
12mv
2 df(~v)dt d3~v = dE
dt (C.5)
Using equation (C.3) and the integral identities∫ ∞0
x2ne−ax2dx = (2n)!
n!22n+1
√π
a2n+1 ,
∫ ∞0
x2n+1e−ax2dx = n!
2a2n+1
where a > 0 and n = 0, 1, 2, ..., we find
dNdt = − 2kBT
aR0qBT= − 1
τ(T ) (C.6)
dEdt = −5
2kBT
aR0qBTkBT = −5
6
32kBT
τ(T ) (C.7)
For the vertical drift we can express the effective particle confinement timeof the Maxwellian distribution as the confinement time of their Maxwelliantemperature. As the particles from the energetic tail are lost more rapidly,eq. (C.7) shows that the Maxwellian temperature decreases in time.
In case of the outward radial ‘ ~E × ~B’ drift, where the drift velocitydoes not depend on the energy of the charged particles, the drift doesn’tcause a change in energy distribution. For losses along the magnetic fieldlines the confinement time of a particle will be inversely proportional to itsparallel velocity v‖. A similar integration as for the vertical drift leads toan effective confinement time inversely proportional to the thermal velocity:τp(T ) ∝
√π/2v−1
T . The effect on the Maxwellian energy is more pronouncedτE(T ) ∝ 6
√π/2 v−1
T .


