Embed Size (px)
Citation preview

StruxureWare™Power Monitoring Expert 8.0Design Guide
7EN42-0109-0005/2015


Safety informationImportant information
Read these instructions carefully and look at the equipment to become familiar withthe device before trying to install, operate, service or maintain it. The following specialmessages may appear throughout this bulletin or on the equipment to warn ofpotential hazards or to call attention to information that clarifies or simplifies aprocedure.
The addition of either symbol to a "Danger" or "Warning" safety labelindicates that an electrical hazard exists which will result in personalinjury if the instructions are not followed.This is the safety alert symbol. It is used to alert you to potential personalinjury hazards. Obey all safety messages that follow this symbol to avoidpossible injury or death.
DANGERDANGER indicates a hazardous situation which, if not avoided, will result in death orserious injury.
WARNINGWARNING indicates a hazardous situation which, if not avoided, could result in death orserious injury.
CAUTIONCAUTION indicates a hazardous situation which, if not avoided, could result inminor ormoderate injury.
NOTICENOTICE is used to address practices not related to physical injury.
Please noteElectrical equipment should be installed, operated, serviced andmaintained only by qualifiedpersonnel. No responsibility is assumed by Schneider Electric for any consequences arisingout of the use of this material.
A qualified person is one who has skills and knowledge related to the construction, installation,and operation of electrical equipment and has received safety training to recognize and avoidthe hazards involved.
© 2015 Schneider Electric. All rights reserved. CONTROLLED DISTRIBUTION Page 3 of 52
StruxureWare Power Monitoring Expert SystemDesignGuide Safety information

Safety precautionsDuring installation or use of this software, pay attention to all safety messages that occur in thesoftware and that are included in the documentation. The following safety messages apply tothis software in its entirety.
WARNINGUNINTENDED EQUIPMENT OPERATION• Do not use the software for critical control or protection applications where human orequipment safety relies on the operation of the control action.
• Do not use the software to control time-critical functions because communication delayscan occur between the time a control is initiated and when that action is applied.
• Do not use the software to control remote equipment without securing it with anauthorized access level, and without including a status object to provide feedback aboutthe status of the control operation.
Failure to follow these instructions can result in death or serious injury.
WARNINGINACCURATE DATA RESULTS• Do not incorrectly configure the software, as this can lead to inaccurate reports and/ordata results.
• Do not base your maintenance or service actions solely onmessages and informationdisplayed by the software.
• Do not rely solely on softwaremessages and reports to determine if the system isfunctioning correctly or meeting all applicable standards and requirements.
• Consider the implications of unanticipated transmission delays or failures ofcommunications links.
Failure to follow these instructions can result in death, serious injury, equipmentdamage, or permanent loss of data.
Page 4 of 52 CONTROLLED DISTRIBUTION © 2015 Schneider Electric. All rights reserved.
Safety precautions StruxureWare Power Monitoring Expert SystemDesignGuide

Contents
Safety information 3Safety precautions 4Introduction 7Power Monitoring Expert Architecture 8Client Types 8Engineering Client 8WebClient 9
Architecture Types 10Standalone vs. Distributed 10Standalone Architecture 10Distributed Architecture 11
Server Types 12Standalone / Primary Server 12Database Server 12Secondary Server 13
Recommended PowerMonitoring Expert Systems 14Systems Up To 250 Devices 14Systems Up To 2500 Devices 15Basic Systems 15Advanced Systems 16Which is More Important: CPU or RAM? 17Supported Operating Systems and SQL Server Editions 17
Hard Drive Considerations 18Hard Drive Space for Software Components 19Hard Drive Contention 20Hard Drive Groups 20Hard Drives and RAID 20Recommended Hard Drive Configurations 20
Database Considerations 22SQL Server Express vs. Standard/Enterprise 22Databases in PowerMonitoring Expert 22DatabaseGrowth Calculations 23Hard Drive Space Requirements 27
Advanced Architectures 29Virtual Environments 29SQL Server Clustering 29Server Redundancy 30
Communication Network Design 31Devices in the Network 31Supported Protocols 31Ethernet Devices 31Serial Devices 31
Design a New Communication Network 31
StruxureWare Power Monitoring Expert SystemDesignGuide
© 2015 Schneider Electric. All rights reserved. CONTROLLED DISTRIBUTION Page 5 of 52

StruxureWare Power Monitoring Expert SystemDesignGuide
Page 6 of 52 CONTROLLED DISTRIBUTION © 2015 Schneider Electric. All rights reserved.
PowerMonitoring Expert Performance 32Daisy Chain Calculator 32Assess PowerMonitoring Expert Performance 33
Improve an Existing Communication Network 35What Settings Can Improve Performance? 35
Applications and System Integration 36Virtual ION Processor (VIP) 36EWS 1.1 36Export Data from PowerMonitoring Expert 36PowerMonitoring Expert andOPC DA v2.05A 36
Appendix A: Distributed Power Monitoring Expert Architectures 37Distributed Architecture Examples 37Standalone Architecture with Secondary Server 37Distributed Database Architecture 37Distributed Database Architecture with Secondary Server 38
Engineering Clients 38Recommended Engineering Client 38
Database Servers 38Recommended Database Server 38
Secondary Servers 38When is a Secondary Server Needed? 39Recommended Secondary Server 40
Appendix B: Power Monitoring Expert Components 42Windows Services 43
Appendix C: Performance Tuning 45How toMeasure the Utilization of a Daisy Chain? 45Registry Settings 45Scheduled Log Upload 46
Glossary 49

IntroductionThis Design Guide provides an overview of items to consider when designing aStruxureWare™PowerMonitoring Expert system. Most of the information in this documentapplies to the Segment editions of PowerMonitoring Expert, however you should consult therespective Design Guides when deploying those editions.
© 2015 Schneider Electric. All rights reserved. CONTROLLED DISTRIBUTION Page 7 of 52

Power Monitoring Expert Architecture StruxureWare Power Monitoring Expert SystemDesignGuide
Page 8 of 52 CONTROLLED DISTRIBUTION © 2015 Schneider Electric. All rights reserved.
Power Monitoring Expert ArchitectureThis section describes the different server, client, and architecture types that can be usedwhen setting up PowerMonitoring Expert on your network.
Client TypesThe PowerMonitoring Expert system contains two different types of client interfaces:
l TheWebClient is any computer on the network that provides access to energy dash-boards, real-time trends and tables, reports, alarms, and custom graphical rep-resentations of the powermonitoring system.
l The Engineering Client is the administrator interface that is used tomanage, build, main-tain, and customize the powermonitoring system.
NoteTheminimum display resolution for PowerMonitoring Expert software is 1024 x 768.
Engineering ClientAn Engineering Client workstation provides administrators and power users access to thePowerMonitoring Expert graphical user interface as well as design and system configurationcomponents (Management Console, Vista, Designer). You can use these components to:
l Manage communications to devices.
l Design custom user diagrams to represent the powermonitoring system.
l Develop system-level applications.
The Engineering Client is a thick client that is installed on themain PowerMonitoring Expertserver, but it can also be installed on additional client computers where a user will administerthe system. The following tools are included with the Engineering Client:
Application DescriptionManagement Console Manage communications to devicesand open system configuration tools.Vista Design, manage, andmonitor the power monitoring system.Designer Develop system-level applications.
See "Engineering Clients" on page 38 for the recommended hardware specifications.
Web ClientTheWebClient is any computer on the network that is most commonly used in day-to-daypowermanagement tasks. TheWebClient is a thin client that connects to the PowerMonitoring Expert server viaWeb browser, through which you access theWeb Applicationscomponent of the PowerMonitoring Expert system. The applications within this componentdisplay real-time and historical information, and alarms.
For performance reasons, it is recommended that you access theWeb Applicationscomponent from aWebClient rather than from the PowerMonitoring Expert server so thatyou are not using the server's CPU andmemory resources. The PowerMonitoring ExpertInstaller creates a shortcut on the server that you can use to access theWeb Applicationscomponent if required.
The following applications are included in theWeb Applications component.
Application DescriptionDashboards Displayshistorical energydata in an easily viewable dashboard.
Diagrams Custom graphical representation of the power monitoring system(designed in Vista).
Tables Real-time data from the system displayed in a table format.
Trends Displays real-time and historical data in a graphical format to assist withthemonitoring of current system conditions.
AlarmsAlarmmanagement portal to view and acknowledge both active andhistorical alarms. Alarmsare configured through the AlarmConfiguration application.
Reports Generate energy, power quality, and generic system reports, based ondata logged by the power meters.
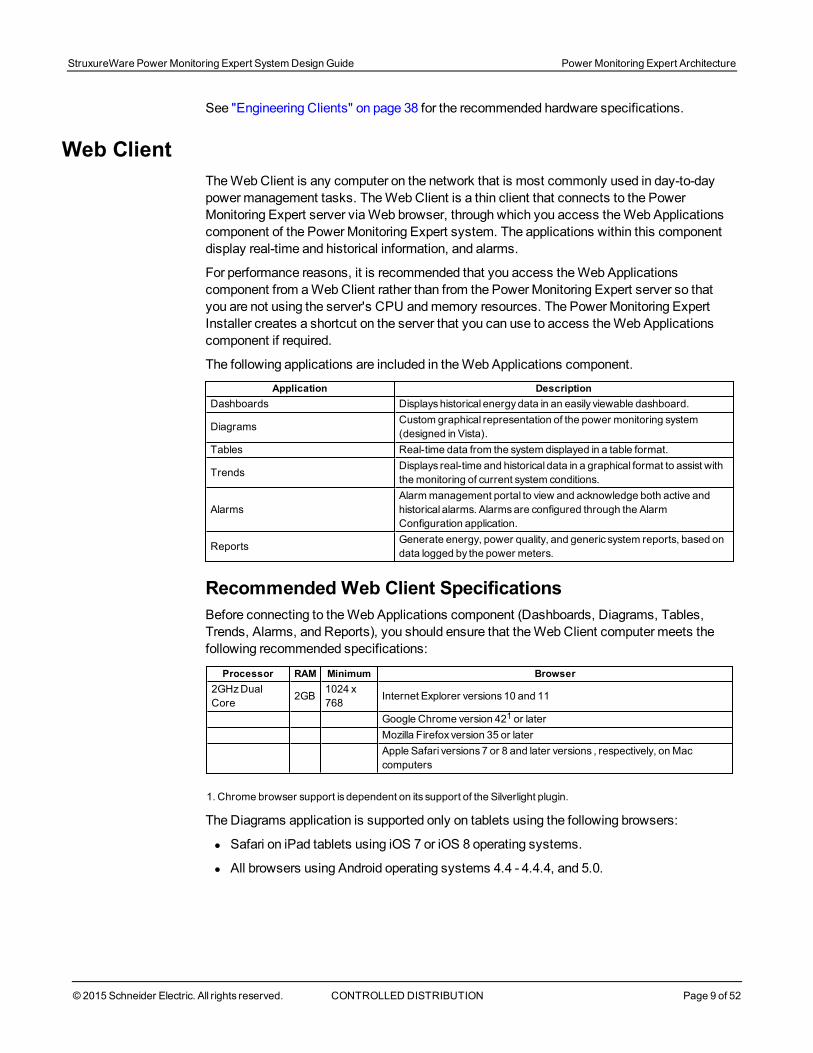
Recommended Web Client SpecificationsBefore connecting to theWeb Applications component (Dashboards, Diagrams, Tables,Trends, Alarms, and Reports), you should ensure that theWebClient computer meets thefollowing recommended specifications:
Processor RAM Minimum Browser2GHzDualCore 2GB 1024 x
768 Internet Explorer versions10 and 11
Google Chrome version 421 or laterMozilla Firefox version 35 or laterApple Safari versions7 or 8 and later versions , respectively, onMaccomputers
1. Chrome browser support is dependent on its support of the Silverlight plugin.
The Diagrams application is supported only on tablets using the following browsers:
l Safari on iPad tablets using iOS 7 or iOS 8 operating systems.
l All browsers using Android operating systems 4.4 - 4.4.4, and 5.0.
StruxureWare Power Monitoring Expert SystemDesignGuide Power Monitoring Expert Architecture
© 2015 Schneider Electric. All rights reserved. CONTROLLED DISTRIBUTION Page 9 of 52

Power Monitoring Expert Architecture StruxureWare Power Monitoring Expert SystemDesignGuide
Page 10 of 52 CONTROLLED DISTRIBUTION © 2015 Schneider Electric. All rights reserved.
NoteThe user is prompted to install Microsoft Silverlight 4.0 or later if it has not already beeninstalled on the computer.
Architecture TypesA PowerMonitoring Expert system contains many components, but it can only be installed inone of twomethods:
l Standalone installation
l Distributed Database installation (optional, based on specific customer requirementsfor SQL Server)
The difference between the two architectures is based on where the SQL Server databaseengine is installed.
NoteA distributed architecture does not provide any performance gains over a standalonearchitecture andmay, in fact, result in lower performance. It is recommended that you usethe Standalone Server installation unless a customer's IT environment requires a differentsystem configuration.
Standalone vs. DistributedThe standalone architecture is the preferred andmost common installationmethod in usebecause it is lower in cost (only one server required) and easier to commission. In somecases, however, the distributed architecturemay be required due to local IT policy, such as:
l Not installing SQL Server with another application on the same server.
l Meeting SQL Server redundancy requirements with SQLClustering or other third-partytools.
l Following specific rules for databasemanagement (for example, SQL jobs, back-ups,data security, and so on).
Standalone ArchitectureThemost common type of PowerMonitoring Expert architecture is called "standalone" whereone computer hosts:
l Power Monitoring Expert software (that is, configuration files, communication ser-vices, Web Applications, Virtual ION Processor, SQL Server connection, and so on).
l Microsoft SQL Server to host the historical databases for logged data.

Unlike other software packages (for example, SCADA) all custom application logic, I/Omanagement, alarm management, reports, and device communication for PowerMonitoringExpert perform optimally when installed on a single server.
Distributed ArchitectureA distributed architecture has system components installed across multiple computers.PowerMonitoring Expert supports the ability to distribute either aDatabase server oradditional communication servers calledSecondary servers. However, these distributedsystems should only be used if the standalone architecture is not possible.
See "Distributed PowerMonitoring Expert Architectures" on page 37 for examples ofdistributed architectures.
Distributed DatabaseIf the standalone architecture is not possible due to specific customer requirements, it ispossible to distribute the database to another server. This is called a “distributed database”installation, where two computers work together to create the PowerMonitoring Expertenvironment:
l Primary server hosts the PowerMonitoring Expert software.
l Database server hosts the SQL Server databases.
The distributed database architecture is less common than the standalone architecture.
NoteThere is no performance improvement by using the distributed database architecture overthe standalone architecture.
StruxureWare Power Monitoring Expert SystemDesignGuide Power Monitoring Expert Architecture
© 2015 Schneider Electric. All rights reserved. CONTROLLED DISTRIBUTION Page 11 of 52
Power Monitoring Expert Architecture StruxureWare Power Monitoring Expert SystemDesignGuide
Page 12 of 52 CONTROLLED DISTRIBUTION © 2015 Schneider Electric. All rights reserved.
Distributed Web ServerDistributedWeb Servers are not supported by PowerMonitoring Expert.
Server TypesIn a standalone architecture there is only one server: theStandalone / Primary server.
In a distributed architecture there are two servers: thePrimary server andDatabase server.
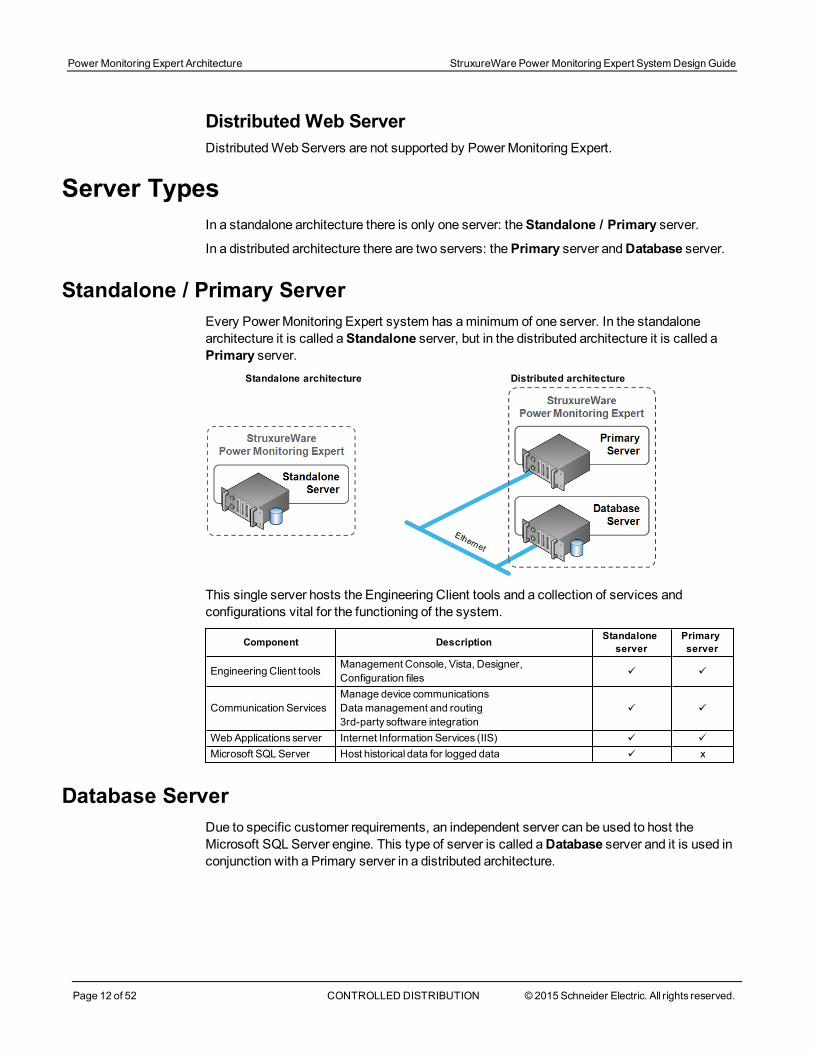
Standalone / Primary ServerEvery PowerMonitoring Expert system has aminimum of one server. In the standalonearchitecture it is called aStandalone server, but in the distributed architecture it is called aPrimary server.
Standalone architecture Distributed architecture
This single server hosts the Engineering Client tools and a collection of services andconfigurations vital for the functioning of the system.
Component Description Standaloneserver
Primaryserver
Engineering Client tools Management Console, Vista, Designer,Configuration files ü ü
Communication ServicesManage device communicationsDatamanagement and routing3rd-party software integration
ü ü
WebApplications server Internet Information Services (IIS) ü ü
Microsoft SQL Server Host historical data for logged data ü x
Database ServerDue to specific customer requirements, an independent server can be used to host theMicrosoft SQL Server engine. This type of server is called aDatabase server and it is used inconjunction with a Primary server in a distributed architecture.

The Database server contains the following components:
Component DescriptionCommunication Services Datamanagement and routingMicrosoft SQL Server Host historical data for logged data
See "Database Servers" on page 38 for more information about Database servers in adistributed architecture.
Secondary ServerIn extremely rare circumstances for very large systems, additional communication serverscan be installed as part of either a standalone or distributed architecture. These servers areknown as Secondary servers.
See "When is a Secondary Server Needed?" on page 39 to calculate if a Secondary server isrequired. It is recommended that you contact your Schneider Electric representative if yourequire a Secondary Server installation.
NoteIn 2012, about 0.3% of new system deployments required a Secondary server.
StruxureWare Power Monitoring Expert SystemDesignGuide Power Monitoring Expert Architecture
© 2015 Schneider Electric. All rights reserved. CONTROLLED DISTRIBUTION Page 13 of 52

Power Monitoring Expert Architecture StruxureWare Power Monitoring Expert SystemDesignGuide
Page 14 of 52 CONTROLLED DISTRIBUTION © 2015 Schneider Electric. All rights reserved.
Recommended Power Monitoring Expert SystemsPowerMonitoring Expert can vary in size from just a few devices with limited logging tothousands of devices with extensive logging and custom applications. The following systemspecifications are sufficient for themajority of customers, but can be adjusted if needed.
Systems Up To 250 DevicesSystem1 Devices Users Server Recommendations Years of Logging2 OPC
TagsVIPTags3
B1 ≤ 50 ≤ 5
Computer Type: DesktopOS: Windows8.1 (64-bit)SQL: 2014 ExpressCPU: IntelCore i3 (2 core), or betterRAM: 2+GBHDD: 500+GB
~4 years (10GB) 1000 250
B2 ≤ 100 ≤ 5
Computer Type: DesktopOS: Windows8.1 (64-bit)SQL: 2014 ExpressCPU: IntelCore i3 (2 core), or betterRAM: 4+GBHDD: 500+GB
~2 years (10GB) 1000 250
B3 ≤ 100 ≤ 5
Computer Type: DesktopOS: Windows8.1 (64-bit)SQL: 2012 Standard SP1CPU: IntelCore i3 (2 core), or betterRAM: 4+GBHDD: 500+GB
~6 years (30GB) 1000 250
A1 ≤ 100 ≤ 15
Computer Type: WorkstationOS: Windows8.1 (64-bit)SQL: 2012 Standard SP1CPU: Intel Xeon E56xx (4 core), or betterRAM: 8+GBHDD: x2 500+GB
<6 years (30GB)4 5000 1500
B4 ≤ 250 ≤ 10
Computer Type: WorkstationOS: WindowsServer 2012 R2SQL: 2014 StandardCPU: Intel Xeon E56xx (4 core), or betterRAM: 8+GBHDD: x2 500+GB
~2.5 years (30GB) 5000 1000
A2 ≤ 250 ≤ 20
Computer Type: ServerOS: WindowsServer 2012 R2SQL: 2014 StandardCPU: Intel Xeon E56xx (4 core), or betterRAM: 16+GBHDD: x4 300+GB
<2.5 years (30GB)4 10000 3000
1Basic or Advanced system (for example, B3 denotes the third of the basic systems in a larger order of magnitude).2Years of data in the database is calculated based on a 10GBdatabase for SQL Server Expressand 30GB (orlarger) for SQL Server Standard edition.3VIP “tags” aremeasurements used for alarming and/or logging.4Based on the following devicemix: 10%advanced; 20% intermediate; 70%basic/entry.It is recommended that you calculate the ION_Data size and number of years of logging using the DBGrowthCalculator tool.

Systems Up To 2500 DevicesSystem1 Devices Users Server Recommendations Years of Logging2 OPC
TagsVIPTags3
B5 ≤ 600 ≤ 10
Computer Type: WorkstationOS: WindowsServer 2012 R2SQL: 2014 StandardCPU: Intel Xeon E56xx (4 core), or betterRAM: 16+GBHDD: x6 300+GB
~1 year (30GB) 5000 1000
A3 ≤ 600 ≤ 35
Computer Type: ServerOS: WindowsServer 2012 R2SQL: 2014 StandardCPU: x2 Intel Xeon E56xx (4 core), or betterRAM: 24+GBHDD: x6 300+GB
<1 year (30GB)4 30000 10000
B6 ≤ 2500 ≤ 10
Computer Type: ServerOS: WindowsServer 2012 R2SQL: 2014 StandardCPU: x2 Intel Xeon E56xx (4 core), or betterRAM: 24+GBHDD: x5 300+GB
x1 1.5+TB
~2 years (200GB) 10000 2500
A4 ≤ 2500 ≤ 50
Computer Type: ServerOS: WindowsServer 2012 R2SQL: 2014 StandardCPU: x2 Intel Xeon E5-2xxx (6 core), or betterRAM: 32+GBHDD: x6 300+GB
x2 1.5 TB
<2 years (200GB) 4 50000
15000(SeeNotes1and 2)
1.The need for using the VIP for PC alarming configuration is no longer required. Use the AlarmConfiguration application to configure alarms.2. Contact your RegionalCompetencyCenter for larger systems.
Basic SystemsThemajority of PowerMonitoring Expert systems are basic systems with out-of-the boxfunctionality andmeets most customer needs. A basic system presumes the following:
l Factory default device logging
l No high-speed (that is, faster than 15minutes) logging
l No custom applications
A basic system contains amixture of advanced and basic powermeters. These basicsystems use the following devices:
l 70% Entry/Basic Meters
l 20% Intermediate Meters/Trip Units/Relays
l 10% Advanced/Utility Meters
These systems do not include large numbers of BCPM or EM4800 device types. In caseswhere these device types are installed, use the Advanced version of that system.
StruxureWare Power Monitoring Expert SystemDesignGuide Power Monitoring Expert Architecture
© 2015 Schneider Electric. All rights reserved. CONTROLLED DISTRIBUTION Page 15 of 52

Power Monitoring Expert Architecture StruxureWare Power Monitoring Expert SystemDesignGuide
Page 16 of 52 CONTROLLED DISTRIBUTION © 2015 Schneider Electric. All rights reserved.
Small Basic System ExampleA small basic system uses System B1 above. The following table summarizes additionalsystem usage and other details.
Server Requirements Quantity DetailsNumber of Devices 50 x35 PM1200
x10 PM8000x5 ION7650
Hard Drive(465GBavailable) 80GB93GB12GB50GB235 GB
WindowsOS20%Free hard drive spacePower Monitoring Expert and SQL ServerION_Data and its backupsTotal Usage
Large Basic System ExampleA large basic system uses System B6 above. The following table summarizes additionalsystem usage and other details. See "Recommended Hard Drive Configurations" on page 20for information about hard drive groups.
Server Requirements Quantity Details
Number of Devices 2500x2200 PM3200x200 PM8000x100 ION7650
Hard Drive Group 0(279GBavailable)
100GB56GB12GB168 GB
WindowsOS20%Free hard drive spacePower Monitoring Expert and SQL ServerTotal Usage
Hard Drive Group 1(279GBavailable)
56200256 GB
20%Free hard drive spaceSQL Server tempDBTotal Usage
Hard Drive Group 2(279GBavailable)
56200256 GB
20%Free hard drive spaceION_Data .mdfTotal Usage
Hard Drive Group 3(1397GBavailable)
2792006001079 GB
20%Free hard drive spaceION_Data .ldfION_Data backupsTotal Usage
Advanced SystemsAn advanced systemmay be required tomeet specific customer needs that cannot bemetwith a basic out-of-the box system. An advanced systemmight include one or more of thefollowing:
l Custom applications in the VIP.
l Non-default logging (shorter than 15minute intervals).
l High concurrent system usage with report generation.
l OPC server with thousands of tags.
l High number of concurrent users accessing the system.
l Mixture of different device types, including advanced PQmeters.
Which is More Important: CPU or RAM?They are both important for different reasons. The CPU plays a critical role for executingPowerMonitoring Expert operations. It is especially important when using a large number oftranslated devices. On the other hand, RAM is very important for SQL Server. SQL Server isamemory intensive program which requires more RAM for running reports, logging a largenumber of measurements, and other database-intensive operations. During deployment, it isimportant to cap SQLmemory because the SQL Server can use all available RAM, whichmay impact the performance of other operations.
Supported Operating Systems and SQL Server EditionsThe following information summarizes the 32-bit and 64-bit versions of Microsoft Windowsoperating systems and SQL Server editions that support PowerMonitoring Expertinstallations.
Windows operating systemsYou can install PowerMonitoring Expert software on servers using any of the followingWindows operating systems.
NotePowerMonitoring Expert software can be installed on servers in a domain environment,however it cannot be installed on domain controllers. If PowerMonitoring Expert softwareis installed on a server that is subsequently changed to a domain controller, the softwareceases to function correctly.
l Windows 7 Professional/Enterprise, SP1
l Windows 8.1 Professional/Enterprise
l Windows Server 2008 R2 Standard/Enterprise, SP1
l Windows Server 2012 Standard, SP1
l Windows Server 2012 R2 Standard
SQL Server editionsIf no supported SQL Server version is detected during the installation of PowerMonitoringExpert on a Standalone Server, then SQL Server 2014 Express is installed.
If a supported edition of SQL Server Express is already installed but not configured with adatabase instance for use with PowerMonitoring Expert, the installer adds the requireddatabase instance. Otherwise, one of the following SQL Server editions needs to be installedprior to installing PowerMonitoring Expert software. (See the "Installing SQL Server" topic intheStruxureWare PowerMonitoring Expert Installation Guide for more information.)
Note that supported 32-bit and 64-bit SQL Server editions can only be installed on supported32-bit and 64-bit Windows operating systems, respectively. For example, a 32-bit SQLServer edition is not supported on a 64-bit Windows operating system.
StruxureWare Power Monitoring Expert SystemDesignGuide Power Monitoring Expert Architecture
© 2015 Schneider Electric. All rights reserved. CONTROLLED DISTRIBUTION Page 17 of 52

Power Monitoring Expert Architecture StruxureWare Power Monitoring Expert SystemDesignGuide
Page 18 of 52 CONTROLLED DISTRIBUTION © 2015 Schneider Electric. All rights reserved.
SQL Server Editions Standalone Server Distributed Database ServerSQLServer 2008 R2 Express, SP3 Yes NoSQLServer 2012 Express, SP2 Yes NoSQLServer 2014 Express, SP1 Yes NoSQLServer 2008 R2 Standard/Enterprise, SP3 Yes Yes 1
SQLServer 2012Standard/Enterprise/Business Intelligence, SP2 Yes Yes 2
SQLServer 2014Standard/Enterprise/Business Intelligence, SP1 Yes Yes 2
1Supported for a distributed database server configuration onWindowsServer 2008 R2 Standard/EnterpriseSP1.2Supported for a distributed database server configuration onWindowsServer 2012 Standard SP1, and onWindowsServer 2012 R2 Standard.
See theStruxureWare PowerMonitoring Expert Installation Guide (7EN02-0358) for moreinformation.
32-bit versus 64-bit Operating SystemsIt is recommended that you use a 64-bit operating system for any size PowerMonitoringExpert system. The gain in using a 64-bit operating system comes from the betterperformance of software that works with PowerMonitoring Expert. For example, a SQLServer 64-bit edition can perform much faster than a SQL Server 32-bit edition.
In addition, 32-bit operating systems are limited to just 4 GB of RAM, whereas 64-bitoperating systems are not restricted to the same extent.
NotePowerMonitoring Expert is a 32-bit software package. However, 64-bit operatingsystems support 32-bit software.
Windows 8.1 versus Windows Server 2012 R2It is also recommended that Microsoft Windows Server operating systems be used, for twoimportant reasons:
l Windows Server has the ability to utilize server-class hardware, whichmeans being ableto runmore CPUs and to addmore RAM as needed. Windows 8.1 Pro-fessional/Enterprise is limited to two physical CPUs.
l Windows Server offers better performance for running PowerMonitoring Expert services.
Hard Drive ConsiderationsThe hard disk drives (HDD) in the PowerMonitoring Expert server are critical to the operationof the software. The configuration of the hard drives and distribution of software componentscan have a significant effect on the performance of the server.
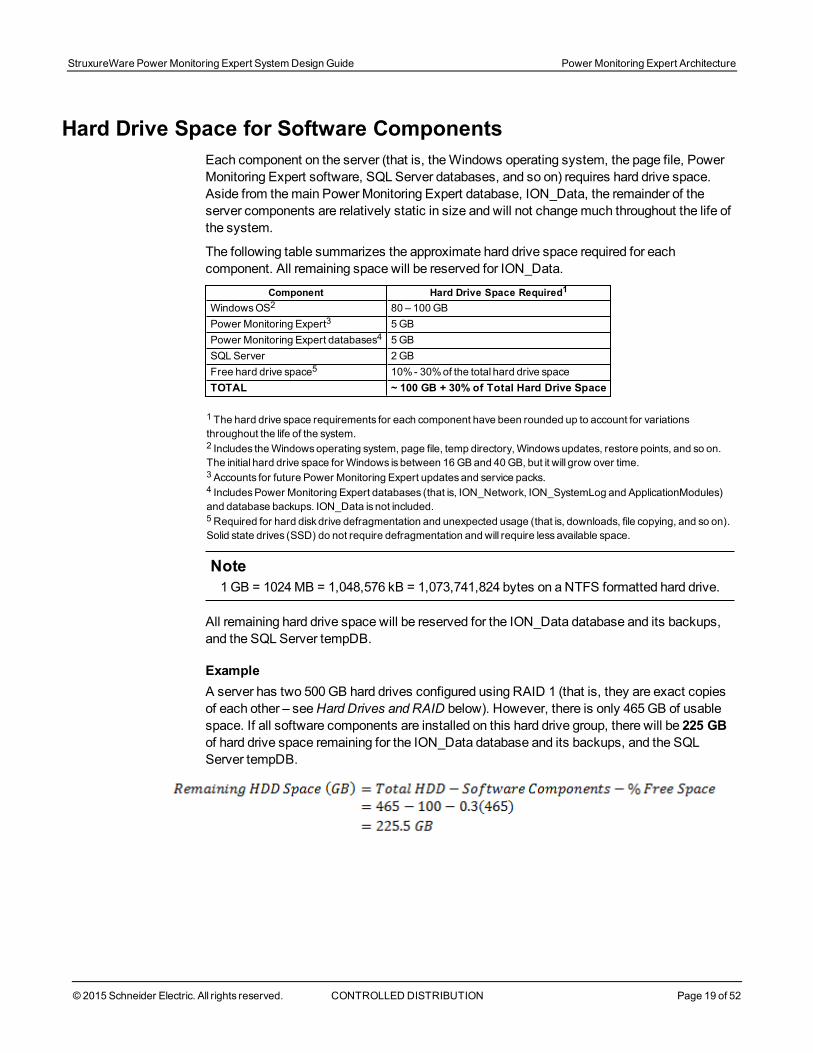
Hard Drive Space for Software ComponentsEach component on the server (that is, theWindows operating system, the page file, PowerMonitoring Expert software, SQL Server databases, and so on) requires hard drive space.Aside from themain PowerMonitoring Expert database, ION_Data, the remainder of theserver components are relatively static in size and will not changemuch throughout the life ofthe system.
The following table summarizes the approximate hard drive space required for eachcomponent. All remaining space will be reserved for ION_Data.
Component Hard Drive Space Required1
WindowsOS2 80 – 100GBPower Monitoring Expert3 5GBPower Monitoring Expert databases4 5GBSQLServer 2 GBFree hard drive space5 10%- 30%of the total hard drive spaceTOTAL ~ 100 GB + 30% of Total Hard Drive Space
1 The hard drive space requirements for each component have been rounded up to account for variationsthroughout the life of the system.2 Includes theWindowsoperating system, page file, temp directory,Windowsupdates, restore points, and so on.The initial hard drive space for Windows is between 16GBand 40GB, but it will grow over time.3Accounts for future Power Monitoring Expert updatesand service packs.4 IncludesPower Monitoring Expert databases (that is, ION_Network, ION_SystemLog and ApplicationModules)and database backups. ION_Data is not included.5Required for hard disk drive defragmentation and unexpected usage (that is, downloads, file copying, and so on).Solid state drives (SSD) do not require defragmentation and will require lessavailable space.
Note1GB = 1024MB = 1,048,576 kB = 1,073,741,824 bytes on a NTFS formatted hard drive.
All remaining hard drive space will be reserved for the ION_Data database and its backups,and the SQL Server tempDB.
ExampleA server has two 500GB hard drives configured using RAID 1 (that is, they are exact copiesof each other – seeHard Drives and RAID below). However, there is only 465GB of usablespace. If all software components are installed on this hard drive group, there will be 225 GBof hard drive space remaining for the ION_Data database and its backups, and the SQLServer tempDB.
StruxureWare Power Monitoring Expert SystemDesignGuide Power Monitoring Expert Architecture
© 2015 Schneider Electric. All rights reserved. CONTROLLED DISTRIBUTION Page 19 of 52

Power Monitoring Expert Architecture StruxureWare Power Monitoring Expert SystemDesignGuide
Page 20 of 52 CONTROLLED DISTRIBUTION © 2015 Schneider Electric. All rights reserved.
Hard Drive ContentionHard drive contention is a term used when the hard drives cannot keep up with the read andwrite operations from the operating system or an application. Essentially, the hard drivesbecome a bottleneck, causing the entire server to slow down even if the processors (CPU)andmemory (RAM) are performing as effectively as possible. Two examples of this are:
l SQLServer read and write operations to the database (.mdf) and transaction log (.ldf).
l Operating system read and write operations to the pagefile.
Hard Drive GroupsFor a basic system, a single hard drive (or hard drive group with RAID 1) is sufficient to installthe operating system, PowerMonitoring Expert software and SQL Server without causingany hard drive contention.
For improved hard drive and system performance, it is recommended (if possible) that youseparatemajor components onto different hard drive groups.
Hard Drives and RAIDIn addition to separating the software components onto different hard drive groups, RAID 1can be used to add simple redundancy in case of an inoperable hard drive. RAID 1 is whereone hard drive is a fully-mirrored clone of a second hard drive. If either hard drive stopsoperating, no data is lost and a new hard drive can be inserted to become the new clone.
It is possible to use other RAID configurations (that is RAID 0, RAID 5, and so on), but theyare not addressed in this document.
Recommended Hard Drive ConfigurationsIt is important to plan for system growth by having a chassis that will hold additional harddrives. The cost of the larger hard drive chassis is oftenminimal. Throughout the life of thesystem, additional hard drives can be added so that the software components can bemovedas the system grows.
The following tables provide recommended standalone server configuration options for dataredundancy (using RAID 1) and reduced hard drive contention. Other configurations are alsopossible.

Option 1 (2x Hard Drives)The following configuration is sufficient for most applications.
ComponentGroup 0
HDD1 + HDD2OS1 ü
tempDB2 ü
MDF3 ü
LDF4 ü
Backups5 ü
1 Includes theOperating System, page file, Power Monitoring Expert and anyother applications.2SQLServer temporary system database.3SQLServer main databases.4SQLServer transaction log files.5Power Monitoring Expert database backups.
Option 2 (4x Hard Drives)The following configuration is sufficient for most applications.
ComponentGroup 0 Group 1
HDD1 + HDD2 HDD3 + HDD4OS1 ü
tempDB2 ü
MDF3 ü
LDF4 ü
Backups5 ü
Option 3a (6x Hard Drives)The following configuration is for data redundancy, but hard drive contention is notconsidered.
ComponentGroup 0 Group 1 Group 2
HDD1 + HDD2 HDD3 + HDD4 HDD5 + HDD6OS1 ü
tempDB2 ü
MDF3 ü
LDF4 ü
Backups5 ü
Option 3b (6x Hard Drives)The following configuration is for reduced drive contention and data redundancy for theoperating system andmain database file.
ComponentGroup 0 Group 1 Group 2 Group 3
HDD1 + HDD2 HDD3 HDD4 + HDD5 HDD6OS1 ü
tempDB2 ü
MDF3 ü
LDF4 ü
Backups5 ü
StruxureWare Power Monitoring Expert SystemDesignGuide Power Monitoring Expert Architecture
© 2015 Schneider Electric. All rights reserved. CONTROLLED DISTRIBUTION Page 21 of 52

Power Monitoring Expert Architecture StruxureWare Power Monitoring Expert SystemDesignGuide
Page 22 of 52 CONTROLLED DISTRIBUTION © 2015 Schneider Electric. All rights reserved.
Option 4 (8x Hard Drives)The following configuration is for minimized drive contention with data redundancy for allcomponents.
Component Group 0 Group 1 Group 2 Group 3HDD1 + HDD2 HDD3 + HDD4 HDD5 + HDD6 HDD7 + HDD8
OS1 ü
tempDB2 ü
MDF3 ü
LDF4 ü
Backups5 ü
Database Considerations
SQL Server Express vs. Standard/EnterprisePowerMonitoring Expert can install SQL Server Express 2014 to host the databases if noother SQL Server edition is already installed. SQL Server Express is the free version ofMicrosoft’s SQL Server and is suitable for most users. However, there are some limitations inits capabilities:
l Maximum size of 10 GB per database (.mdf). Transaction logs (.ldf) are excluded fromthis limit.
l NoSQLServer Agent service.
l Limited to lesser of 1 socket or 4 cores.
l Limited to use amaximum of 1 GB of the total system RAM.
ExamplePowerMonitoring Expert is installed with SQL Express on a single powerful server with twophysical quad core CPUs and 24GB of RAM. SQL Server Express only uses one of the quadcore CPUs and just 1 GB of RAM.
This server is far too large for SQL Server Express and does not provide any databaseperformance gains.
Databases in Power Monitoring ExpertPowerMonitoring Expert uses four databases to store device communication parameters,system configuration settings, and logged historical data.
Database Description
ApplicationModules Containsall of the configuration data for the Dashboards, Trends, and Tablesapplicationsin theWeb Applications component.
ION_Data Contains the logged historical data, events, and waveforms from devices.ION_Network Containsdevice communication information and generalPower Monitoring Expert settings.ION_SystemLog ContainsPower Monitoring Expert events that occur during the operation of the software.

Only the historical data database, ION_Data, is considered when calculating hard drivespace requirements and growth. The other databases are relatively static in size and shouldnot exceed 5GB in size under normal operation (includes database backups).
Database Growth CalculationsThe ION_Datamain database (.mdf) size and growth is dependent on what is stored in thedatabase and can be estimated by three primary types of measurements in the devicesand/or software:
l Factory default measurement logging.
l Power Quality (PQ) events.
l Custommeasurement logging.
Each factory or custom loggedmeasurement in the database uses approximately 75 bytesfor each record, which also accounts for indexing and other factors. From this value it ispossible to estimate the daily growth rate (kB) based on the device type, the number ofloggedmeasurements, and the logging frequency (typically 15minutes) for the factory defaultdevices.
Recording PQ events and waveform captures are event driven, so it is impossible to predictthe exact frequency of these records and how they affect database growth.
In addition, the database occasionally grows by 10% to create room for additionalmeasurements. This growth operation can occur at any time and should be accounted for indatabase size calculations.
These periodic database growth operations in larger systems (that is, +100GB databaseswith +10GB growth operations) can have a severe impact on server and database operation.Therefore, it is recommended that you pre-allocate the hard drive space for the databaseduring the initial commissioning phase of the system. For example, if you calculate that adatabase will grow to 500GB over 5 years, it is recommended that you pre-allocate the harddrive space to avoid the effects of the periodic growth operations.
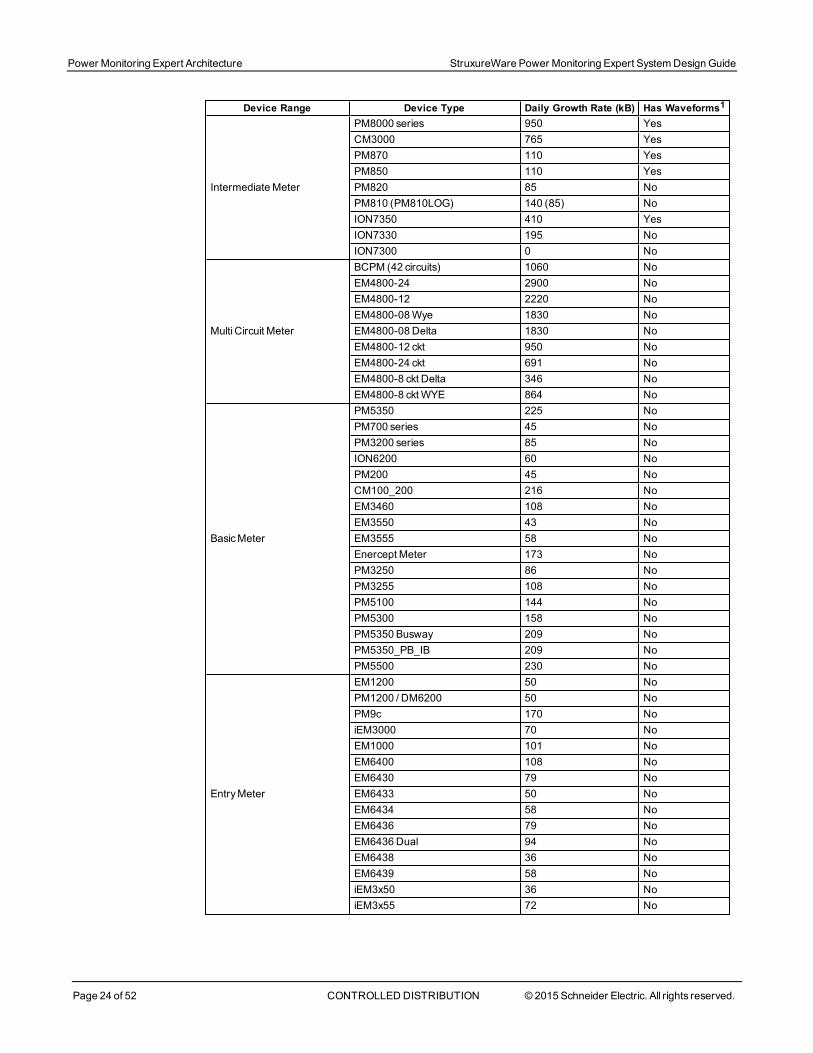
Device Range Device Type Daily Growth Rate (kB) Has Waveforms1
UtilityMeter
ION8800A (with IEC 61000-4-302) 560 (745) YesION8800B 560 (680) NoION8800C 30 NoION8650A (with IEC 61000-4-302) 525 (710) YesION8650B (with IEC 61000-4-302) 525 (645) YesION8650C 30 NoION8600A 525 YesION8600B 525 YesION8600C 30 No
AdvancedMeterION7650 (with IEC 61000-4-302) 565 (780) YesION7550 545 YesCM4000 series 800 Yes
StruxureWare Power Monitoring Expert SystemDesignGuide Power Monitoring Expert Architecture
© 2015 Schneider Electric. All rights reserved. CONTROLLED DISTRIBUTION Page 23 of 52
Power Monitoring Expert Architecture StruxureWare Power Monitoring Expert SystemDesignGuide
Page 24 of 52 CONTROLLED DISTRIBUTION © 2015 Schneider Electric. All rights reserved.
Device Range Device Type Daily Growth Rate (kB) Has Waveforms1
IntermediateMeter
PM8000 series 950 YesCM3000 765 YesPM870 110 YesPM850 110 YesPM820 85 NoPM810 (PM810LOG) 140 (85) NoION7350 410 YesION7330 195 NoION7300 0 No
Multi Circuit Meter
BCPM (42 circuits) 1060 NoEM4800-24 2900 NoEM4800-12 2220 NoEM4800-08Wye 1830 NoEM4800-08 Delta 1830 NoEM4800-12 ckt 950 NoEM4800-24 ckt 691 NoEM4800-8 ckt Delta 346 NoEM4800-8 cktWYE 864 No
BasicMeter
PM5350 225 NoPM700 series 45 NoPM3200 series 85 NoION6200 60 NoPM200 45 NoCM100_200 216 NoEM3460 108 NoEM3550 43 NoEM3555 58 NoEnercept Meter 173 NoPM3250 86 NoPM3255 108 NoPM5100 144 NoPM5300 158 NoPM5350 Busway 209 NoPM5350_PB_IB 209 NoPM5500 230 No
EntryMeter
EM1200 50 NoPM1200 / DM6200 50 NoPM9c 170 NoiEM3000 70 NoEM1000 101 NoEM6400 108 NoEM6430 79 NoEM6433 50 NoEM6434 58 NoEM6436 79 NoEM6436Dual 94 NoEM6438 36 NoEM6439 58 NoiEM3x50 36 NoiEM3x55 72 No

Device Range Device Type Daily Growth Rate (kB) Has Waveforms1
Circuit Breaker Trip Units
MicrologicH 350 YesMicrologicA, E, and P 70 / 295 / 350 NoMicrologicCompact NSXAand E 170 NoMicrologicA IFE_IFM 65 NoMicrologicE IFE_IFM 302 NoMicrologicH IFE_IFM 353 NoMicrologicP IFE_IFM 353 No
Protective relays
Sepam series 80 565 YesSepam series 48 and 40 270 YesSepam series 20 50 YesSepam series 10 40 NoEnersure BCPM/iBCPM 1814 No
DemandController EM7000 29 No
Motor ControllerAltivar 61 43 NoTesysT 108 No
Power QualityMeter VarlogicNRC 12 50 No
Sequence of Event RecorderSER2408 0 NoSER3200 0 No
SwitchboardMonitoringActi 9 Smartlink 0 NoActi 9 SmartlinkEthernet 0 No
1Deviceswith waveformscontribute approximately 10%- 20%to the total size of the database.See below for details.2 Includes IEC 61000-4-30 (10minute and 2 hour logging). IEC 61000-4-30 3 second loggingmust be enabledmanually and contribute 14.4MBof logsper day. EN50160 (weekly logging) contributesapproximately 2 kB perday.
These numbers may change with any meter logging configurations and should only be usedas an estimated baseline. Use the DatabaseGrowth Estimation Tool to calculate theestimation.
Factory Default Measurement LoggingFor a system where the devices only log factory default measurements, the database sizecan be calculated based on the number of each device type in the system.
ExampleA PowerMonitoring Expert system contains devices with the factory default measurementlogging enabled with PQ frameworks. The estimated annual growth rate for the ION_Data.mdf is 11.84 GB.
DeviceType
Daily Growth Rate(kB)
Number ofDevices
Total Daily Growth(MB)
Total Annual Growth(GB)
ION7650 780 10 7.62 2.72PM8000 950 20 19.00 6.94PM3200 85 70 5.81 2.07TOTAL - 100 32.43 MB 11.84 GB
StruxureWare Power Monitoring Expert SystemDesignGuide Power Monitoring Expert Architecture
© 2015 Schneider Electric. All rights reserved. CONTROLLED DISTRIBUTION Page 25 of 52

Power Monitoring Expert Architecture StruxureWare Power Monitoring Expert SystemDesignGuide
Page 26 of 52 CONTROLLED DISTRIBUTION © 2015 Schneider Electric. All rights reserved.
Power Quality EventsIf there are devices in the network that have waveform logging and PQ detection enabled,they usually account for approximately 10% to 20% of the total database size. Thisestimation is based on observing hundreds of customer databases, but will vary dependingon the frequency of PQ events in the electrical network and the specific configuration of thePQ enabled powermeters.
In addition to the basic measurement logging, PQ events can be included in the estimate toget a better understanding of the possible range of database growth.
NOTICELOSS OF DATADo not incorrectly configure PQ powermeters, otherwise excessive database growth anddecreased system performance can occur.
Failure to follow these instructions can result in corrupt databases and anunusable system.
ExampleA PowerMonitoring Expert system contains twelve ION7650s enabled to record waveformsfor PQ events. In an average system, this could contribute approximately 10% to the totaldatabase size.
Therefore, the new estimated annual growth rate for the ION_Data .mdf is 14.32 GB.
Custom Logging ProfilesIn addition to the factory default logging profiles for the devices, database size estimates caninclude custommeasurement logging:
l In the devices
l In the Virtual ION Processor (VIP)
Accurate database size estimates should take into consideration the logging frequency foreachmeasurement (that is, 1 minute logging, 15minute logging, and so on). A single custommeasurement that is logged every 15minutes contributes approximately 2.5 MB towards theannual database growth.
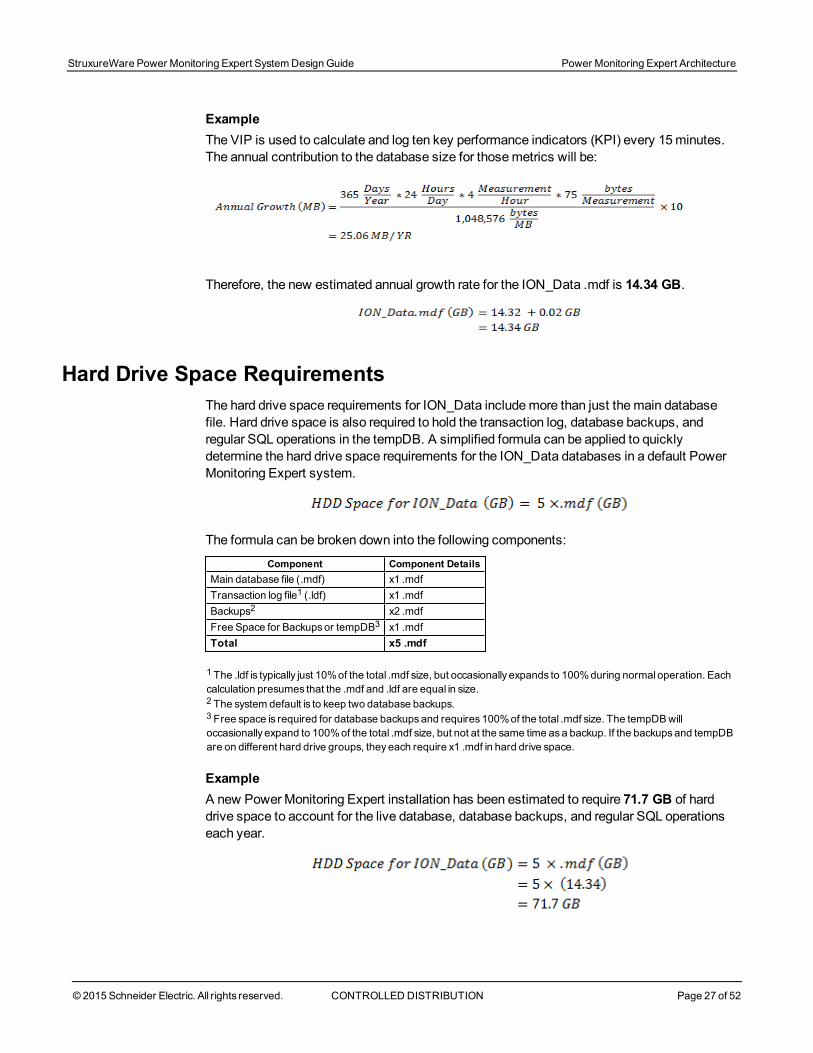
ExampleThe VIP is used to calculate and log ten key performance indicators (KPI) every 15minutes.The annual contribution to the database size for thosemetrics will be:
Therefore, the new estimated annual growth rate for the ION_Data .mdf is 14.34 GB.
Hard Drive Space RequirementsThe hard drive space requirements for ION_Data includemore than just themain databasefile. Hard drive space is also required to hold the transaction log, database backups, andregular SQL operations in the tempDB. A simplified formula can be applied to quicklydetermine the hard drive space requirements for the ION_Data databases in a default PowerMonitoring Expert system.
The formula can be broken down into the following components:
Component Component DetailsMain database file (.mdf) x1 .mdfTransaction log file1 (.ldf) x1 .mdfBackups2 x2 .mdfFree Space for Backupsor tempDB3 x1 .mdfTotal x5 .mdf
1 The .ldf is typically just 10%of the total .mdf size, but occasionally expands to 100%during normal operation. Eachcalculation presumes that the .mdf and .ldf are equal in size.2 The system default is to keep two database backups.3 Free space is required for database backupsand requires100%of the total .mdf size. The tempDBwilloccasionally expand to 100%of the total .mdf size, but not at the same time asa backup. If the backupsand tempDBare on different hard drive groups, theyeach require x1 .mdf in hard drive space.
ExampleA new PowerMonitoring Expert installation has been estimated to require 71.7 GB of harddrive space to account for the live database, database backups, and regular SQL operationseach year.
StruxureWare Power Monitoring Expert SystemDesignGuide Power Monitoring Expert Architecture
© 2015 Schneider Electric. All rights reserved. CONTROLLED DISTRIBUTION Page 27 of 52
Power Monitoring Expert Architecture StruxureWare Power Monitoring Expert SystemDesignGuide
Page 28 of 52 CONTROLLED DISTRIBUTION © 2015 Schneider Electric. All rights reserved.
Hard Drive Space for Database BackupsA backup is a copy of a live database (for example, ION_Data, ION_Network andApplicationModules) and is used to recover the live database if it becomes corrupt (resultingfrommanual database editing, unexpected server shutdown, an inoperable hard drive, and soon).
By default, the system automatically backs up the databases on a daily (ION_Network) orweekly (ION_Data and ApplicationModules) basis, and keeps two backups of eachdatabase in themain installation folder:
...\Schneider Electric\PowerMonitoring Expert\config\cfg\DBBackups
If there is limited hard drive space available for the live database, it is recommended that youchange the folder location of the database backups to a different hard drive group.
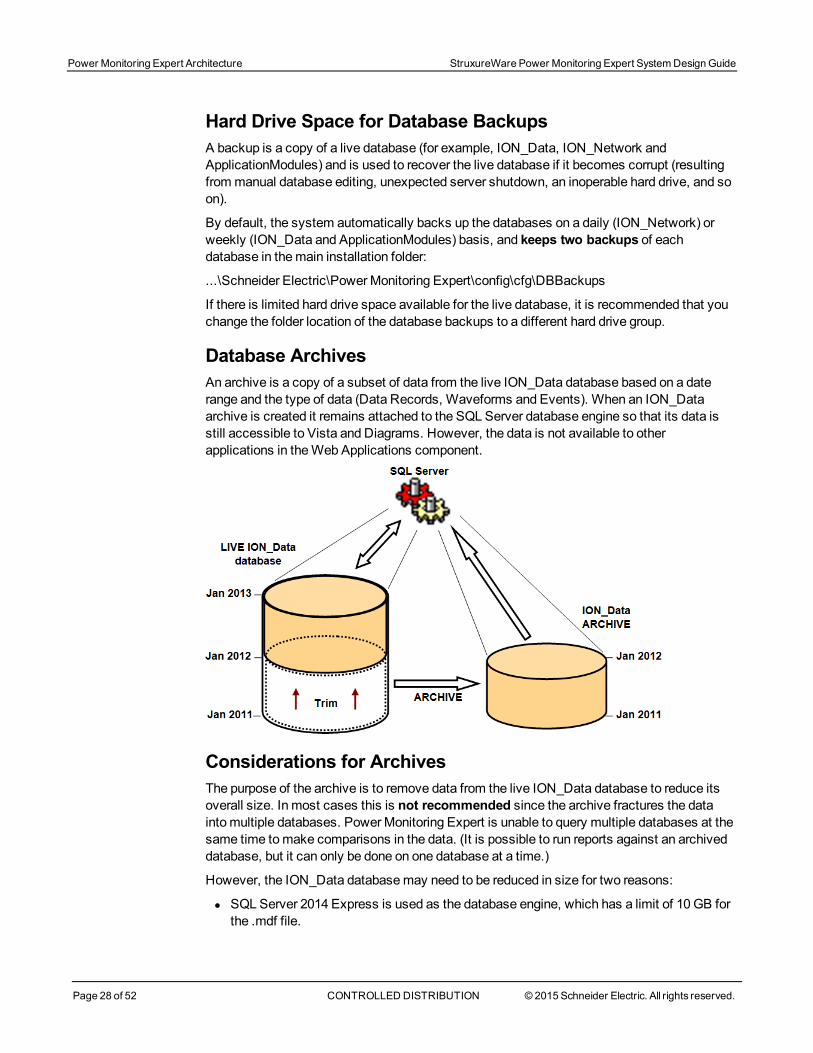
Database ArchivesAn archive is a copy of a subset of data from the live ION_Data database based on a daterange and the type of data (Data Records, Waveforms and Events). When an ION_Dataarchive is created it remains attached to the SQL Server database engine so that its data isstill accessible to Vista and Diagrams. However, the data is not available to otherapplications in theWeb Applications component.
Considerations for ArchivesThe purpose of the archive is to remove data from the live ION_Data database to reduce itsoverall size. In most cases this is not recommended since the archive fractures the datainto multiple databases. PowerMonitoring Expert is unable to query multiple databases at thesame time tomake comparisons in the data. (It is possible to run reports against an archiveddatabase, but it can only be done on one database at a time.)
However, the ION_Data databasemay need to be reduced in size for two reasons:
l SQLServer 2014 Express is used as the database engine, which has a limit of 10 GB forthe .mdf file.

l SQLServer (Standard or Enterprise edition) is used as the database engine and the ION_Data database has become so large that query performance (in Vista for example) is notacceptable to the PowerMonitoring Expert system users. It is also important to ensurethat the ION_Data database is trimmedwell within the hard drive size, as it can affectthe operation of PowerMonitoring Expert.
Advanced Architectures
Virtual EnvironmentsPowerMonitoring Expert can be installed in supported virtual environments that haveequivalent performance to a recommended physical computer (described in "RecommendedPowerMonitoring Expert Systems" on page 14).
The FLEXnet License Administrator software, which is used tomanage StruxureWare PowerMonitoring Expert licenses, supports virtual machine licensing for the following hypervisors:
l VMware ESX 4.1/ESXi 4.1 and 5.1
l Microsoft Hyper-V
l Citrix XenServer 6.0
l VMwareWorkstation 8.
Consider thesemain points for the virtual environment:
l The combination of Windows operating system and SQL Server edition.
l The processor (CPU) performance andmemory (RAM). The CPU and RAMmust be ded-icated to the virtual machine containing PowerMonitoring Expert so that the performanceis as expected. If no other virtual machines in the same environment take resources fromthe PowerMonitoring Expert system, then performancemay degrade.
l The hard drive group configuration and space.
Physical ports (that is, serial COM, modems, and USB) are not recommended in a virtualenvironment.
See thePowerMonitoring Expert 8.0 Installation Guide for more information.
SQL Server ClusteringClustering allows one physical server to automatically take over the tasks andresponsibilities of another physical server that is no longer in operation. More specifically,clustering refers to a group of two or more servers (generally called nodes) that work togetherand represent themselves as a single virtual server to a network. When a client connects toclustered SQL Servers, it appears that there is only a single SQL Server. Using clusteringhelps ensure that applications that are running have little or no downtime when a nodebecomes non-operational.
PowerMonitoring Expert software can function in a clustered environment. Note that it is onlythe Database Server component that is deployed in the clustered environment. The PrimaryServer must reside in a non-clustered environment.
StruxureWare Power Monitoring Expert SystemDesignGuide Power Monitoring Expert Architecture
© 2015 Schneider Electric. All rights reserved. CONTROLLED DISTRIBUTION Page 29 of 52

Power Monitoring Expert Architecture StruxureWare Power Monitoring Expert SystemDesignGuide
Page 30 of 52 CONTROLLED DISTRIBUTION © 2015 Schneider Electric. All rights reserved.
Schneider Electric representatives and certified partners should refer to RESL207774Installing PowerMonitoring 7.0 on a SQL 2008 R2Cluster in the Schneider ElectricKnowledge Base for additional information.
Server RedundancyPowerMonitoring Expert supports redundancy via Stratus Everrun® Enterprise. It supportsbeing set up in a Fault Tolerant (FT) configuration. The licensing for PowerMonitoring Expertsupports the failover scenario.
Contact Stratus for more details on the setup and licensing required for Everrun Enterprise:
http://www.stratus.com/solutions/software/everrun-enterprise-express/

Communication Network DesignDevices in the Network
The PowerMonitoring Expert system is used to communicate primarily with the followingdevices:
l Power and energy monitoring devices.
l Protection relays and trip units.
l Programmable Logic Controllers (PLCs).
l WAGES devices via PLC I/O.
Many devices have an Ethernet port for direct connection to PowerMonitoring Expert via thenetwork, but low cost devices only have a serial port (typically RS-485). These serial devicesrequire an intermediate converter or gateway (for example, Com 'X 200, EGX100, EGX300,ION7650, ION8800, PM8000, and so on) to establish a network connection with PowerMonitoring Expert.
Supported ProtocolsPowerMonitoring Expert supports the following protocols to communicate to devices andgateways:
l Modbus™TCP
l Modbus RTU (via Ethernet gateway)
l ION™
Formore information about these protocols, see the "Glossary" on page 49.
Ethernet DevicesFollow commonly recommended practices for Ethernet design when connecting Ethernetdevices to the network.
Serial DevicesFollow commonly recommended practices for RS-485 serial daisy chain wiring according tothe device installation guides.
Design a New Communication NetworkA tool has been designed that helps estimate communication utilization for serial daisychains. This tool can be used for both new system design and for optimizing existing PowerMonitoring Expert systems for existing serial daisy chains.
See the "Daisy Chain Calculator" on page 32 for more information about tuning serial daisychain performance.
StruxureWare Power Monitoring Expert SystemDesignGuide Communication NetworkDesign
© 2015 Schneider Electric. All rights reserved. CONTROLLED DISTRIBUTION Page 31 of 52
Communication NetworkDesign StruxureWare Power Monitoring Expert SystemDesignGuide
Page 32 of 52 CONTROLLED DISTRIBUTION © 2015 Schneider Electric. All rights reserved.
Power Monitoring Expert PerformanceThe performance of PowerMonitoring Expert is dynamic and directly related to how the userinteracts with the system: does the user actively monitor real-time data and expect onesecond updates, or do they want historical data and alarm conditions to be downloadedquickly from devices after an event occurs? There are two types of transactions to devicesthat consume network bandwidth:
l Real-time data requests through PowerMonitoring Expert tools (for example, OPCServer, Vista, Designer, and so on).
l Periodic polling and uploading of new data logs, events, and waveform records. This ismanaged by the ION Log Inserter Service and can be scheduled by device type orinstance.
The system and daisy chain should be tuned to give improved performance as required by theuser.
Daisy Chain CalculatorThe Daisy Chain Calculator is available for use by Schneider Electric representatives andcertified partners. Customers should contact their local representative for additionalinformation.
The daisy chain calculator provides Basic and Advanced usage options:
l Basic
This selection assumes that you are using default device/driver configurations, that UIusage is light, and that Log Inserter polling is in a 60-second to 90-second range.
l Advanced
This selection assumes that non-default device/driver configurations (additionalmeasurements) are being used, that Log Inserter polling is at 30 seconds or morefrequently, that VIPs are heavily polling devices, that software-based alarming is inplace, and that other polling is taking place to expose device data to OPC or EWS.
(Note that the text in the following image has been repositioned for illustration purposes only.)

Assess Power Monitoring Expert PerformanceThere are two operating conditions that PowerMonitoring Expert experiences whencommunicating with devices in the network:
l System start-up (when first connecting to devices in Management Console).
l Steady-state (during normal operation of the software).
During system start-up it is normal for the software to perform slowly as it communicates todevices in the network and downloads the available historic logs. Depending on how long thedevice has been in service there could be over amonth of historic logs, PQ events, andwaveforms to download. This behaviour is particularly noticeable on long daisy chains thatincludemeters with a high quantity of on-board logged data.
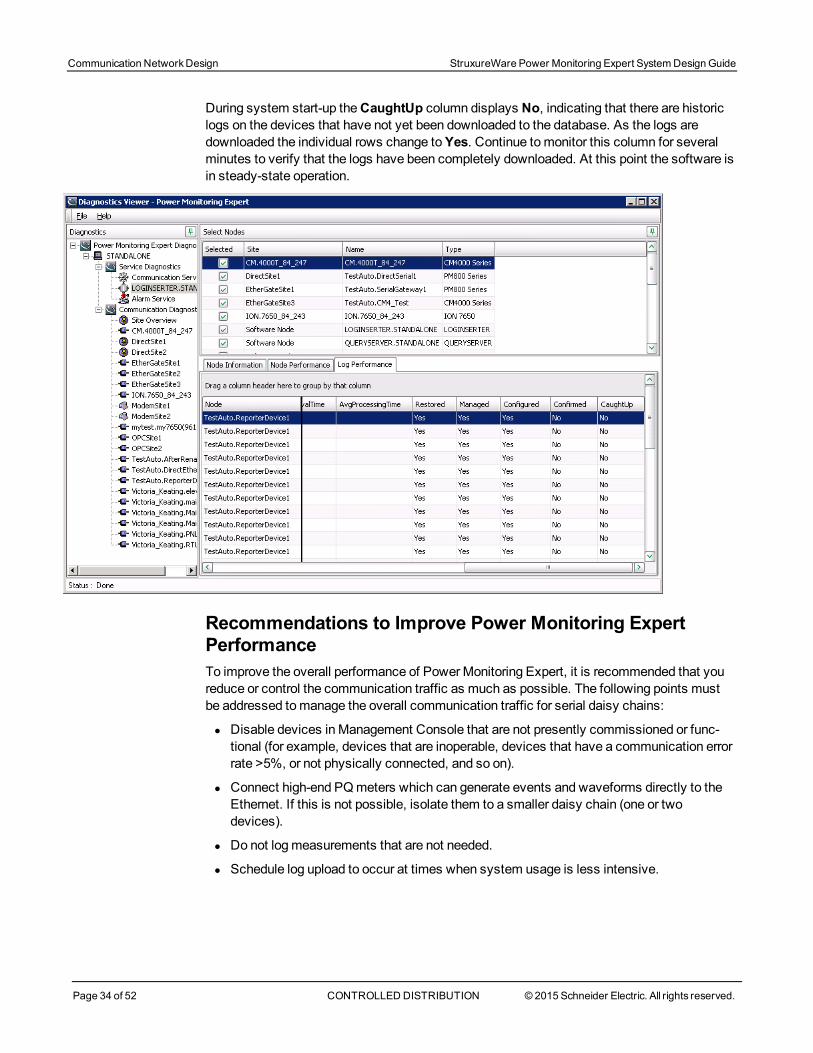
Once the system has downloaded the available logs from devices, the performance of PowerMonitoring Expert can bemeasured and, if necessary, appropriate action can be taken toimprove it. The Diagnostics Viewer in Management Console should be used to determinewhen the historic logs have been downloaded from devices.
1. In Diagnostics Viewer, expandService Diagnostics and clickLOGINSERTER.<server_name>.
2. Select the available devices in theSelect Nodes list.
3. Select the Log Performance tab to display the status of the historic logs in the devices.
4. Scroll to the right to show theCaughtUp column.
StruxureWare Power Monitoring Expert SystemDesignGuide Communication NetworkDesign
© 2015 Schneider Electric. All rights reserved. CONTROLLED DISTRIBUTION Page 33 of 52
Communication NetworkDesign StruxureWare Power Monitoring Expert SystemDesignGuide
Page 34 of 52 CONTROLLED DISTRIBUTION © 2015 Schneider Electric. All rights reserved.
During system start-up theCaughtUp column displays No, indicating that there are historiclogs on the devices that have not yet been downloaded to the database. As the logs aredownloaded the individual rows change toYes. Continue tomonitor this column for severalminutes to verify that the logs have been completely downloaded. At this point the software isin steady-state operation.
Recommendations to Improve Power Monitoring ExpertPerformanceTo improve the overall performance of PowerMonitoring Expert, it is recommended that youreduce or control the communication traffic as much as possible. The following points mustbe addressed tomanage the overall communication traffic for serial daisy chains:
l Disable devices in Management Console that are not presently commissioned or func-tional (for example, devices that are inoperable, devices that have a communication errorrate >5%, or not physically connected, and so on).
l Connect high-end PQmeters which can generate events and waveforms directly to theEthernet. If this is not possible, isolate them to a smaller daisy chain (one or twodevices).
l Do not logmeasurements that are not needed.
l Schedule log upload to occur at times when system usage is less intensive.
Improve an Existing Communication NetworkIn many cases, the devices and communication network are installed and wired long beforethe software is even specified. For sites where the communication network is already wired,some adjustments and tests can be performed by the software tomake improvements or tomake recommendations with minimal re-wiring.
The Daisy Chain Calculator tool (see "Daisy Chain Calculator" on page 32) can be used todetermine how to tune PowerMonitoring Expert for improved performance.
What Settings Can Improve Performance?Due to network architectural limitations, it may not be possible to reduce the number of thedevices on a daisy chain. In cases like these, consider the following to help improveperformance:
l TheConnectedThreadPoolSize is a registry key that should be equal to or greater thanthe number of sites plus EGX devices in Management Console.
l The Log Inserter can be configured using LogAcquisitionControl.xml, such that logsare uploaded on a scheduled basis, rather than constantly whenever new logs are detec-ted. Real-time performance is better when the Log Inserter is not uploading logs.
l The LI_PollingPeriod_s is a registry key that controls how often the Log Inserterchecks for logs from devices.
l The transmit delay for gateways inManagement Console (for example, an EGX100 site)can be reduced from the default of 50ms to 0ms in some cases. Check the% error rate inDiagnostics Viewer to help ensure that problems have not been introduced. Note thatsome devices, CM2000 in particular, should not have the transmit delay set lower than50ms to avoid overloading the device and potentially resulting in bad logged data.
l Real-time data clients (for example, Vista, Diagrams, Tables, OPC, VIP, and Trends)polling periods can be adjusted.
See "Performance Tuning" on page 45 for details about these settings.
StruxureWare Power Monitoring Expert SystemDesignGuide Communication NetworkDesign
© 2015 Schneider Electric. All rights reserved. CONTROLLED DISTRIBUTION Page 35 of 52
Applicationsand System Integration StruxureWare Power Monitoring Expert SystemDesignGuide
Page 36 of 52 CONTROLLED DISTRIBUTION © 2015 Schneider Electric. All rights reserved.
Applications and System IntegrationVirtual ION Processor (VIP)
The Virtual ION Processor (VIP) is aWindows service that operates on the PowerMonitoringExpert server (and Secondary server), providing coordinated data collection, data processing,and control functions for groups of devices. The VIP is capable of collecting and processingdata from several powermonitoring devices, analyzing the information, and performingcontrol functions using a wide selection of ION modules.
Multiple VIPs can be created tomanage server load and improve system performance. EachVIP has a global polling period for real-time data, which can be tuned based on the VIP’sapplication. In addition, a single application can be split across multiple VIPs if it is very large.
NoteA single VIP is sufficient for most basic systems.
The size of the VIP can be determined by the size of the VIP files (that is, the vip.cfg andvip.bak) that reside in the following location:
...\Schneider Electric\PowerMonitoring Expert\config\cfg\vip\
Each file should be nomore than 2MB (that is, approximately 350 loaded ArithmeticModules). The number of VIP instances on the server is limited by the power of the CPU andnot the software.
EWS 1.1EWS is a set of Schneider Electric corporate web services that facilitates data exchangebetween software applications. PowerMonitoring Expert is an EWS v1.1 server that is ableto share real-time, historical, and alarm data with StruxureWare software and other third-partysoftware applications.
Export Data from Power Monitoring Expert
Power Monitoring Expert and OPC DA v2.05AOPC is a set of open standards for connectivity and interoperability between industrialautomation and the enterprise system. OPC is not a native protocol for Schneider Electricdevices; however, PowerMonitoring Expert can act as a translator and host metering data asanOPC server as well as anOPC client.
When acting as anOPC server, PowerMonitoring Expert translates ION data into OPC data,for exporting and viewing in other third-party OPC client systems. The PowerMonitoringExpert OPC client, on the other hand, takes OPC standardizedmeasurements from third-party systems and translates them into a data format that PowerMonitoring Expert can use.
For additional information regarding the configuration and operation of the OPC servercomponent of PowerMonitoring Expert, see theStruxureWare PowerMonitoring Expert 8.0User Guide.
Appendix A: Distributed Power MonitoringExpert Architectures
A distributed system is one that has components of PowerMonitoring Expert installed onmultiple computers.
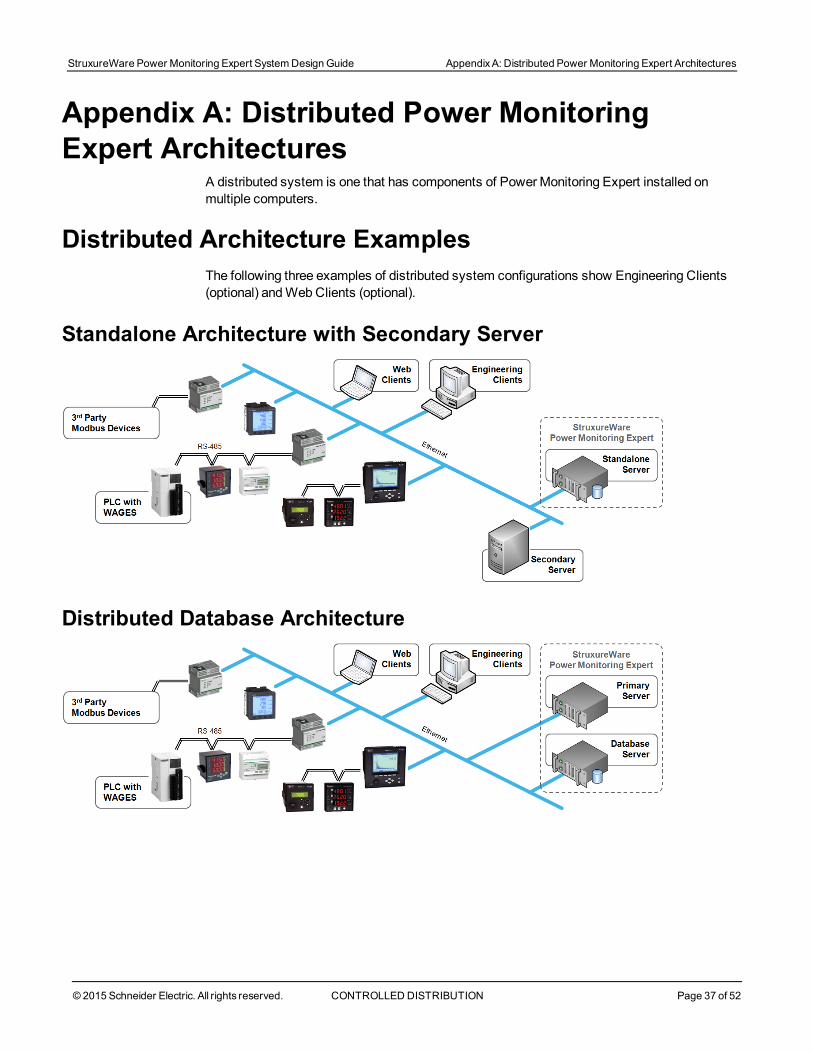
Distributed Architecture ExamplesThe following three examples of distributed system configurations show Engineering Clients(optional) andWebClients (optional).
Standalone Architecture with Secondary Server
Distributed Database Architecture
StruxureWare Power Monitoring Expert SystemDesignGuide AppendixA: Distributed Power Monitoring Expert Architectures
© 2015 Schneider Electric. All rights reserved. CONTROLLED DISTRIBUTION Page 37 of 52

AppendixA: Distributed Power Monitoring Expert Architectures StruxureWare Power Monitoring Expert SystemDesignGuide
Page 38 of 52 CONTROLLED DISTRIBUTION © 2015 Schneider Electric. All rights reserved.
Distributed Database Architecture with Secondary Server
Engineering ClientsAn Engineering Client can be installed in addition to the Primary server to allow anadministrator or power user to access the system (for example, to connect to new devices, toedit Vista diagrams, to program the VIP, and so on).
Recommended Engineering ClientServer Recommendations
OS: Windows8.1CPU: IntelCore i3 (2 core), or betterRAM: 2+GBHDD Space: 2GB for software installation
Database ServersIn some cases, a Database server may be required due to local IT policy. It is recommendedthat both the operating system and SQL Server are 64-bit since it greatly improves SQLServer performance.
Recommended Database ServerRefer to "Recommended PowerMonitoring Expert Systems" on page 14 to determine theappropriate database server size. The database server should have the same specificationas the primary server.
Secondary ServersIn very rare cases (less than 1%), Secondary servers are used to reduce the ION SiteServerload on the Primary Server. However, there is only ever one ION RealTime Data service,which runs on the Primary Server. A Secondary server contains the following components:

Component Description
Engineering Client tools Management Console, Vista, DesignerConfiguration files
Communication ServicesManage device communicationsDatamanagement and routing3rd-party software integration
When is a Secondary Server Needed?A simple formula is used to determine when a Secondary server might be needed: multiplytheDevice Type Weight by the number of devices in the system. If the result is greater than100%, then a secondary server is required.
Device Range Device Type Device Type Weight (%)
UtilityMeterION8800 0.10ION8650 0.10ION8600 0.10
AdvancedMeterION7650 0.10ION7550 0.10CM4000/CM3000 Series 0.15
IntermediateMeterPM8000 0.10PM800 Series 0.06ION7300 Series 0.06
BasicMeter
PM5350 0.05PM700 Series 0.03PM3200 Series 0.03ION6200 0.03PM200 0.03CM100_200 0.04EM3500 Series 0.03Enercept Meter 0.04PM5100 0.04PM5300 0.05PM5350 Busway 0.05PM5500 0.06
EntryMeter
EM1200 0.03PM1200 / DM6200 0.03PM9c 0.04iEM3000 0.03EM1000 0.03EM6400 Series 0.03
Multi Circuit MeterBCPM (42 circuits) 0.20BCM42 0.04EM4800 Series 0.10
Circuit Breaker Trip Units
MicrologicA 0.05MicrologicE, P and H 0.07MicrologicCompact NSXAand E 0.06MicrologicA IFE_IFM 0.05MicrologicE IFE_IFM 0.07MicrologicP IFE_IFM 0.07MicrologicH IFE_IFM 0.07
StruxureWare Power Monitoring Expert SystemDesignGuide AppendixA: Distributed Power Monitoring Expert Architectures
© 2015 Schneider Electric. All rights reserved. CONTROLLED DISTRIBUTION Page 39 of 52

AppendixA: Distributed Power Monitoring Expert Architectures StruxureWare Power Monitoring Expert SystemDesignGuide
Page 40 of 52 CONTROLLED DISTRIBUTION © 2015 Schneider Electric. All rights reserved.
Device Range Device Type Device Type Weight (%)
Protective Relays
SepamSeries 80 0.08SepamSeries 48 and 40 0.07SepamSeries 20 0.06SepamSeries 10 0.05Enersure BCPM/iBCPM 0.20
DemandController EM7000 Series 0.03
Motor ControllerAltivar 61 0.03TesysT 0.03
Power QualityMeter VarlogicNRC 12 0.03Sequence of EventRecorder
SER2408 0.10SER3200 0.10
SwitchboardmonitoringActi 9 Smartlink 0.02Acti 9 SmartlinkEthernet 0.02
CustomModbus2Real-time only 0.02Real-time with PC-logging (16 registers) 0.03
1 These device weights presume that PC-logging hasbeen enabled for up to 16measurements.2CustomModbusdevice driversmust be created in theModbusDevice Importer.
ExamplesSystem 1 System 2 System 3
DeviceType
DeviceWeight (%)
Num. ofDevices
TotalUsage (%)
Num. ofDevices
TotalUsage (%)
Num. ofDevices
TotalUsage (%)
ION7650 0.10 100 10 100 10 50 5PM820 0.06 200 12 200 12 100 6PM3200 0.03 700 21 2200 66 3000 90TOTAL 1000 43 % 2500 88 % 3150 101 %
In the first two systems, the total device weight is 43% and 88% respectively; therefore aSecondary server is not required. In the third system, the total device weight is 101 %;therefore a Secondary servermay be required.
System 4 System 5Device Type Device Weight (%) Num. of Devices Total Usage (%) Num. of Devices Total Usage (%)CM4000 0.15 100 15 100 15BCPM 0.20 200 40 200 40BCM42 0.04 700 28 2200 88TOTAL 1000 83 % 2500 143 %
For the fourth system, the total device weight is 83%; therefore a Secondary server is still notrequired. The fifth system will require a Secondary server.
If your system exceeds 100%, contact your Regional Competency Center to discussspecific needs to determine if a Secondary Server is required.
Recommended Secondary ServerThe following server specification is typical for a Secondary server. If a Secondary Server isrequired, contact your Regional Competency Center to discuss specific needs.

Server Recommendations
Computer Type: ServerOS: Windows Server 2012 R2CPU: Intel Xeon E56xx (4 core), or betterRAM: 8+ GBHDD: x2 300+ GB
StruxureWare Power Monitoring Expert SystemDesignGuide AppendixA: Distributed Power Monitoring Expert Architectures
© 2015 Schneider Electric. All rights reserved. CONTROLLED DISTRIBUTION Page 41 of 52

AppendixB: Power Monitoring Expert Components StruxureWare Power Monitoring Expert SystemDesignGuide
Page 42 of 52 CONTROLLED DISTRIBUTION © 2015 Schneider Electric. All rights reserved.
Appendix B: Power Monitoring ExpertComponents
This section shows the different components of the PowerMonitoring Expert system,including databases, windows services, and web applications.
The diagram above illustrates much of the PowerMonitoring Expert architecture, but thefollowing internal connections are not shown:
l Diagrams (which is logically in “Web Applications”) has a connection indirectly to QueryServer and Real-time services.
l Vista/Designer on the primary server has a connection to Network Router (netman).
Additional communication notes:
l Designer uses VSIN only, Vista uses both, VSIN (comm to designer) and .Net Remoting(communication to ION Services).
l Platform components typically use netman (Network Router) to route ION-relatedrequests except for stand-alone Engineering Clients, where no netman service is runninglocally.
l VIP uses .NET remoting to subscribe to real-time data from ION Services (Real-TimeData Service).
l Vista uses .NET remoting to subscribe to real-time data and VSIN for everything else(including historical requests to Query Server).

NoteVSIN is a proprietary application-layer protocol (ION) that runs on TCP/IP.
Windows ServicesMany of PowerMonitoring Expert’s core components run as Windows Services. This allowsPowerMonitoring Expert to continuemonitoring your powermanagement system when nousers are logged on. As these components play a critical role in the operation of PowerMonitoring Expert, it is important to understand what they do.
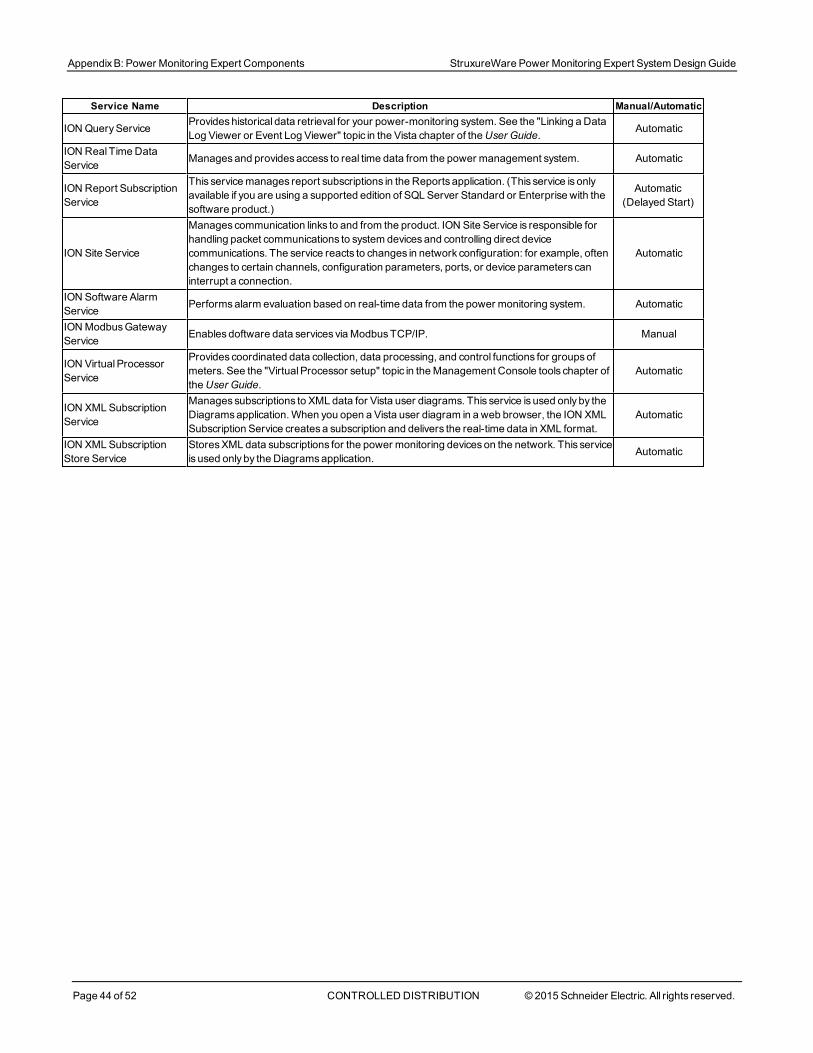
The following table summarizes the PowerMonitoring Expert services:
NoteION Network Router Service has many dependent PowerMonitoring Expert services. Forexample, the ION Virtual Processor, ION Log Inserter Service, and ION Site Servicecannot start and operate without the ION Network Router Service running.
Service Name Description Manual/AutomaticApplicationModulesAlarmServiceHost Hosts alarm servicesused by theWeb Applications component. Manual
ApplicationModulesCoreServicesHost Hosts commonweb servicesused by theWeb Applications component. Automatic
ApplicationModulesDataServicesHost
Hostsweb services that provide low-level access to system data for theWeb Applicationscomponent Automatic
ApplicationModulesProviderEngineHost Hostsweb services that provide data processing for theWeb Applications component. Automatic
ION Alert MonitorChecks the computer’s communicationsports continuously for high priority events occurringat remotemodem sites.When this happens, Alert Monitor initiates a communicationsconnection to the remotemodem site.
Manual
ION Component IdentifierService
Locates local and remote product components. Although this service is configured asManual, the service startswhen a client attempts to connect to it. Manual
ION ConnectionManagement Service
Determines the connection statusof sites and devices in the system, and handlesallocationof resources such asmodems. This servicemanages the state of site and device connectivityfor the system. In order to establish themost appropriate state for the system, eachconnection and disconnection request is evaluated against the overall state of the systemand availability of communications channels.
Manual
ION EventWatcherService
Monitors system events for conditions specified in EventWatcher Manager. See the "EventWatcher Manager" topic in theManagement Console tools chapter of theStruxureWarePower Monitoring Expert 8.0 User Guide.
Automatic
ION Log Inserter ServiceProvideshistorical data collection and storage for your power-monitoring system. See the"Log Inserter" topic in the DatabaseManager andWindowsTaskScheduler chapter of theUser Guide.
Automatic
IONManaged CircuitService
This service is used to create individual real-time and historical data sources for multi-circuitmeters Automatic
ION NetworkRouterService
Routesall ION requests between the software components, such as client workstationsandthe Log Inserter. The service dynamically detects changes to the network configuration,including the addition of new servers; it can also recognize new software nodes, such asVista, that are added to an existing server.
Automatic
ION OPC Data AccessServer
Managesand is responsible for supplying OPC data to client applications. Although thisservice is configured asManual, the service startswhen anOPC client attempts to connect toit.
Manual
ION PQDIF ExporterService
Translatesdata from the product's databases to PQDIF file format andmanages scheduledPQDIF exports. Manual
StruxureWare Power Monitoring Expert SystemDesignGuide AppendixB: Power Monitoring Expert Components
© 2015 Schneider Electric. All rights reserved. CONTROLLED DISTRIBUTION Page 43 of 52
AppendixB: Power Monitoring Expert Components StruxureWare Power Monitoring Expert SystemDesignGuide
Page 44 of 52 CONTROLLED DISTRIBUTION © 2015 Schneider Electric. All rights reserved.
Service Name Description Manual/Automatic
ION QueryService Provideshistorical data retrieval for your power-monitoring system. See the "Linking a DataLog Viewer or Event Log Viewer" topic in the Vista chapter of theUser Guide. Automatic
ION Real TimeDataService Managesand providesaccess to real time data from the power management system. Automatic
ION Report SubscriptionService
This servicemanages report subscriptions in the Reports application. (This service is onlyavailable if you are using a supported edition of SQL Server Standard or Enterprise with thesoftware product.)
Automatic(Delayed Start)
ION Site Service
Manages communication links to and from the product. ION Site Service is responsible forhandling packet communications to system devicesand controlling direct devicecommunications. The service reacts to changes in network configuration: for example, oftenchanges to certain channels, configuration parameters, ports, or device parameters caninterrupt a connection.
Automatic
ION Software AlarmService Performsalarm evaluation based on real-time data from the power monitoring system. Automatic
IONModbusGatewayService Enablesdoftware data services viaModbusTCP/IP. Manual
ION VirtualProcessorService
Provides coordinated data collection, data processing, and control functions for groupsofmeters. See the "VirtualProcessor setup" topic in theManagement Console tools chapter oftheUser Guide.
Automatic
ION XMLSubscriptionService
Manages subscriptions to XML data for Vista user diagrams. This service is used only by theDiagramsapplication.When you open a Vista user diagram in a web browser, the ION XMLSubscription Service createsa subscription and delivers the real-time data in XML format.
Automatic
ION XMLSubscriptionStore Service
StoresXML data subscriptions for the power monitoring deviceson the network. This serviceis used only by the Diagramsapplication. Automatic

Appendix C: Performance TuningPowerMonitoring Expert is installed with a number of factory default settings that should beacceptable for most installations. However, the needs of individual systems can be differentfrom one another and there are several parameters that can be used to fine-tune PowerMonitoring Expert (for example, real-time or historic polling periods).
How to Measure the Utilization of a Daisy Chain?If the performance is still poor after making the improvements suggested above, the softwarecanmeasure how saturated the daisy chains are. This indicates how saturated/utilized agiven daisy chain is based on how the customer uses the system (that is, the customermayprefer real-time data over historical data).
1. In Management Console, ensure that all of the devices on the daisy chain to be testedare enabled.
2. Apply the desired test load to the devices on the daisy chain (for example VIP, Vista,OPC, Diagrams, Tables, or Log Inserter).
3. In the Diagnostics Viewer, expandCommunications Diagnostics and select the site ofthe associated daisy chain.
4. Select theCommunication Status tab.
5. Right-click theCommunication Status pane and select Reset.
6. Let the system gather metrics. For real-time data loads, a few minutes is usually enough.For logging, it is better to leave it for an hour or more, depending on logging intervals.
7. Make note of the value in the Time Util (%) column. A value at or near 100% indicatesthat the daisy chain is saturated andmay not be providing responses as quickly as allrequesting clients are configured tomeet. For example, this couldmean that instead of 5second updates in Vista, youmay see it as 6 or more seconds depending on how sat-urated the site is.
NoteIf the communication% error rate is >0%, further investigationmay be required.
See theStruxureWare PowerMonitoring Expert 8.0 User Guide (7EN02-0357) for moreinformation about the Diagnostics Viewer.
Registry SettingsThe registry keys itemized below can be used tomake adjustments to PowerMonitoringExpert’s performance. These keys should be located under HKEY_LOCAL_MACHINE\SOFTWARE\Schneider Electric\StruxureWare PowerMonitoring Expert in theregistry. If the impact of the change is not well understood, then consider an alternate fix orconsult Technical Support for guidance.
StruxureWare Power Monitoring Expert SystemDesignGuide AppendixC: Performance Tuning
© 2015 Schneider Electric. All rights reserved. CONTROLLED DISTRIBUTION Page 45 of 52

AppendixC: Performance Tuning StruxureWare Power Monitoring Expert SystemDesignGuide
Page 46 of 52 CONTROLLED DISTRIBUTION © 2015 Schneider Electric. All rights reserved.
NOTICEIRREVERSIBLE OPERATING SYSTEM DAMAGE OR DATA CORRUPTION• Do not modify system registry keys without sufficient knowledge or experience in theseprocedures.
• Beforemaking any changes, back up your system registry in a network folder or otherremote location.
• Obtain assistance from knowledgeable and qualified personnel.
Failure to follow these instructions can result in irreparable damage to yourcomputer's operating system and all existing data.
ConnectedThreadPoolSize (DWORD; default 200): The number of sites ION SiteServerservice sends requests to simultaneously. Ideally, this value is equal to or greater than thenumber of sites in the system (that is, serial sites, Ethernet gateway sites, and Ethernetdevices) up to amaximum of 400.
LI_PollingPeriod_s (DWORD; default 30): Theminimum time (in seconds) between pollsfor a historic log position of a given log. This is a global setting used to adjust the amount ofLog Inserter driven communication traffic for the entire system.
LI_MaxPollingPeriod_s (DWORD; default 60): This is themaximum value that LI_PollingPeriod_s can be set to. If you increase LI_PollingPeriod_s beyond 60, you also need toincrease this setting.
IONServicesCachePollingRate (DWORD; default 10): This is amultiplier that controls howoften the software checks the ION Real TimeData Service cache for real-time data updates.This reduces jitter to 10% of the polling period. Jitter, in this context, means inconsistency ofdata “age” by the time the user or processing component (for example, the VIP) “sees” thenew value. Increase this value if there are long polling periods and you wish tominimize jitter.
NoteOther performance tuning settings may be available. Contact a Technical Supportrepresentative to look at your specific needs.
Scheduled Log UploadPowerMonitoring Expert 8.0 introduces an xml file called LogAcquisitionControl.xml thatcan be used to control how and when the Log Inserter uploads logged data. It is possible todefine which device logs are uploaded on a per-device basis. and when they are uploaded. Byreducing Log Inserter-generated communications traffic, real-time performance can beimproved.
This control is achieved by editing the .xml file. The file includes examples of required syntaxand possible configurations. Note that this feature is for advanced users only.
LogAcquisitionControl.xml is located in the \config\cfg\logsrv folder in PowerMonitoringExpert.
To begin, open the control file LogAcquisitionControl.xml. It specifies:
l Which device types or device instances you want to exclude from the device polling list.Excluding a device from the polling list has the same effect as disabling it in

Management Console as far as Log Inserter is concerned. If a device is disabled in thisfile, the Log Inserter will no longer check it for current log position counters or otherdevice properties that Log Inserter usually cares about (aggregate setup counter, devicetype, and serial number).
l It is possible to exclude specific recorders from specific devices from the polling IONrequest.
l Polling intervals can be set for any device type or device instance. They can also be setto change based on a schedule. The schedules used by this feature are defined using theTOU Editor tool that is available from the Toolsmenu inManagement Console.
StruxureWare Power Monitoring Expert SystemDesignGuide AppendixC: Performance Tuning
© 2015 Schneider Electric. All rights reserved. CONTROLLED DISTRIBUTION Page 47 of 52

AppendixC: Performance Tuning StruxureWare Power Monitoring Expert SystemDesignGuide
Page 48 of 52 CONTROLLED DISTRIBUTION © 2015 Schneider Electric. All rights reserved.

GlossaryEthernet devicesAn Ethernet device is a type of device that can directly connect to an Ethernet network (asdefined by IEEE 802.3). Ethernet devices typically have an 8P8C modular connector(commonly called RJ-45) and can usually transmit data at either 10 (10BASE-T), 100(100BASE-TX) or 1000 (1000BASE-T) Mbits/s, depending on what both the device andnetwork supports.
Serial devicesA serial device sends data on a communications cable one bit at a time, making it slower thanan Ethernet device. Serial devices with RS-485 can communicate over long distances inelectromagnetically noisy environments, making them ideal in industrial and commercialapplications.
The following diagram shows RS-485 2-wire slave devices connected to an EGX master (onthe left).
ConvertersA converter (for example, EtherGate) is a device that enables an RS-485 chain of serialdevices to communicate with an Ethernet network. They change the physical network fromserial RS-485 to Ethernet, but do not change the communication protocol.
GatewaysA gateway (for example, EGX, PM8ECC, or Modbus Gateway) is a type of device thatenables an RS-485 daisy chain of serial devices to communicate with an Ethernet network.They change both the physical network from serial RS-485 to Ethernet and thecommunication protocol.
Example:
StruxureWare Power Monitoring Expert SystemDesignGuide Glossary
© 2015 Schneider Electric. All rights reserved. CONTROLLED DISTRIBUTION Page 49 of 52
Glossary StruxureWare Power Monitoring Expert SystemDesignGuide
Page 50 of 52 CONTROLLED DISTRIBUTION © 2015 Schneider Electric. All rights reserved.
An EGX100 allows a serial RS-485 daisy chain of Modbus devices (usingModbus RTUprotocol) to communicate via Ethernet to a PowerMonitoring Expert server (usingModbusTCP).
RS-232 StandardRS-232 is a common physical communications network, allowing the connection of twodevices using a cable no longer than 15m (50 ft). To connect to more than one device, thisphysical standardmust be converted to RS-485.
RS-485 StandardRS-485, as defined by the Telecommunications Industry Association/Electronic IndustriesAlliance (TIA/EIA), is a common standard that defines the electrical characteristics of theserial devices, but does not specify or recommend any communication protocol (for example,Modbus). RS-485 supports amulti-drop network, where a single driver (that is, a ModbusMaster) can communicate tomultiple receivers (that is, Modbus Slaves) in a single line,without "T" or "star" connections.
Modbus RTUA serial communication protocol developed by Modicon™ (now Schneider Electric) in 1979.Modbus is an open protocol and commonly accepted across the industry. It is a simple androbust protocol that allows for the communication of field devices to supervisory monitoring orcontrol software.
Modbus TCPA variant of theMODBUS family of simple, vendor-neutral communication protocols intendedfor supervision and control of automation equipment. Specifically, it covers the use ofMODBUS messaging in an "Intranet" or "Internet" environment using the TCP/IP protocols.Themost common use of the protocols at this time are for Ethernet attachment of PLCs, I/Omodules, and "gateways" to other simple field buses or I/O networks. Connected overEthernet port 502; it does not require a checksum calculation as lower layers already providechecksum evaluation. Modbus TCP/IP specification was developed in 1999 combining aubiquitous physical network (Ethernet) with a universal networking standard (TCP/IP) and avendor-neutral data representation. Modbus TCP/IP uses theModbus instruction set andwraps TCP/IP around it.
IONStands for “Integrated Object Network” and is a proprietary communication protocoldeveloped by PowerMeasurement Ltd. (now Schneider Electric) for use between PowerMonitoring Expert and PowerLogic™ ION powermeters. The ION protocol allows for real-time communication, historical data logging, waveform data, and custom frameworkprogramming. The packet structure of ION is the same for both serial communication (RS-232, RS-485) and Ethernet, making it very versatile.


StruxureWare™PowerMonitoring Expert 8.0Design Guide
Schneider Electric35 Rue JosephMonier92500 RueilMalmaison – Francewww.schneider-electric.com
ION,Modbus, Modicon, PowerLogic,StruxureWare and Schneider Electric are eithertrademarksor registered trademarksof Schneider Electric in France, the USAandother countries. Other trademarksused are the property of their respective owners.
7EN42-0109-00 05/2015© 2015 Schneider Electric. All RightsReserved.


