Embed Size (px)
Citation preview
Structure
Article
Structural Dynamics of Light-Driven Proton PumpsMagnus Andersson,1,5 Erik Malmerberg,2,5 Sebastian Westenhoff,2 Gergely Katona,2 Marco Cammarata,3
Annemarie B. Wohri,1 Linda C. Johansson,2 Friederike Ewald,3 Mattias Eklund,4 Michael Wulff,3 Jan Davidsson,4
and Richard Neutze2,*1Department of Chemical and Biological Engineering, Chalmers University of Technology, Box 462, SE-40530 Goteborg, Sweden2Department of Chemistry, Biochemistry and Biophysics, University of Gothenburg, Box 462, SE-40530 Goteborg, Sweden3European Synchrotron Radiation Facility, BP 220, Grenoble Cedex 38043, France4Department of Photochemistry and Molecular Science, Uppsala University, Box 523, SE-75120 Uppsala, Sweden5These authors contributed equally to this work*Correspondence: [email protected]
DOI 10.1016/j.str.2009.07.007
SUMMARY
Bacteriorhodopsin and proteorhodopsin are simpleheptahelical proton pumps containing a retinal chro-mophore covalently bound to helix G via a protonatedSchiff base. Following the absorption of a photon,all-trans retinal is isomerized to a 13-cis conforma-tion, initiating a sequence of conformational changesdriving vectorial proton transport. In this study weapply time-resolved wide-angle X-ray scattering tovisualize in real time the helical motions associatedwith proton pumping by bacteriorhodopsin and pro-teorhodopsin. Our results establish that three con-formational states are required to describe their pho-tocycles. Significant motions of the cytoplasmic halfof helix F and the extracellular half of helix C areobserved prior to the primary proton transfer event,which increase in amplitude following proton trans-fer. These results both simplify the structural descrip-tion to emerge from intermediate trapping studies ofbacteriorhodopsin and reveal shared dynamical prin-ciples for proton pumping.
INTRODUCTION
Although it has long been known that bacteriorhodopsin (Oester-
helt and Stoeckenius, 1971) functions as a light driven proton
pump in certain halophilic archaea, it was not until the discovery
of the bacterial homolog proteorhodopsin in seawater (Beja
et al., 2000) that the pervasive role of bacterial rhodopsins in
supplying energy to marine ecosystems was appreciated (Beja
et al., 2000, 2001). Subsequent studies have established that
light has a positive effect on growth for proteorhodopsin-con-
taining marine bacteria (Gomez-Consarnau et al., 2007) and
genetically diverse proteorhodopsin-containing bacteria are
distributed throughout the world’s oceans (Beja et al., 2001).
Moreover, rhodopsin family members also transport ions (Kolbe
et al., 2000), serve as light gated channels (Nagel et al., 2002),
and harvest the information content of light through animal vision
(Palczewski et al., 2000) and archaeal phototaxis (Royant et al.,
2001). This genetic and functional diversity implies that nature
has utilized common structural and functional principles to fulfill
diverse functions across all kingdoms of life.
Structure 17, 1265–12
Bacteriorhodopsin is the best characterized of the rhodopsins.
Its remarkable stability has made it a work-horse for under-
standing the fundamental ingredients of proton pumping in
bioenergetics as well as providing a robust prototype for vali-
dating new biophysical approaches. Combined spectroscopic
and mutational studies (Haupts et al., 1999) have identified the
key residues involved in proton pumping (see Figure S1A avail-
able online) and early insight into the structure of bacteriorho-
dopsin was provided by electron diffraction (Henderson et al.,
1990; Henderson and Unwin, 1975). Following the advent of
membrane protein crystallization in lipidic cubic phases (Landau
and Rosenbusch, 1996), X-ray structures of bacteriorhodopsin
below 2.0 A resolution were soon reported (Belrhali et al.,
1999; Luecke et al., 1999b). These crystals facilitated 3D inter-
mediate trapping studies performed by illuminating crystals at
low temperature (Edman et al., 1999; Royant et al., 2000) or
during thawing (Luecke et al., 1999a, 2000; Sass et al., 2000),
with X-ray diffraction data collected at cryogenic temperatures.
In combination with an electron diffraction structure of a bacte-
riorhodopsin triple mutant believed to mimic a late photocycle
conformation (Subramaniam and Henderson, 2000), a consistent
high-resolution structural picture of its mechanism of vectorial
proton transport by bacteriorhodopsin emerged (Kuhlbrandt,
2000; Neutze et al., 2002).
Despite the intuitive understanding that resulted from these
first intermediate trapping studies, this structural mechanism
has not been without controversy. First and foremost, there are
now three reported structures pertaining to the bacteriorho-
dopsin K intermediate (Edman et al., 1999; Matsui et al., 2002;
Schobert et al., 2002), five of the L intermediate (Edman et al.,
2004; Kouyama et al., 2004; Lanyi and Schobert, 2003, 2007;
Royant et al., 2000), eight of the M intermediate (Facciotti
et al., 2001; Lanyi and Schobert, 2002, 2006; Luecke et al.,
1999a, 2000; Sass et al., 2000; Schobert et al., 2003; Takeda
et al., 2004), one of the N intermediate (Schobert et al., 2003),
as well as resting-state mutant analogs of the M (Subramaniam
and Henderson, 2000) and O (Rouhani et al., 2001) intermedi-
ates. Significant movements of the cytoplasmic portions of
helices F and G and an extracellular movement of helix C are
the most reproducible conformational changes observed in
these studies (Table 1). Nevertheless, there is little agreement
regarding the magnitude of these movements and different
structures can differ significantly in detail (Hirai and Subrama-
niam, 2009). Moreover, although several structures show similar
rearrangements of the extended network of water mediated
75, September 9, 2009 ª2009 Elsevier Ltd All rights reserved 1265
Structure
Structural Dynamics of Light-Driven Proton Pumps
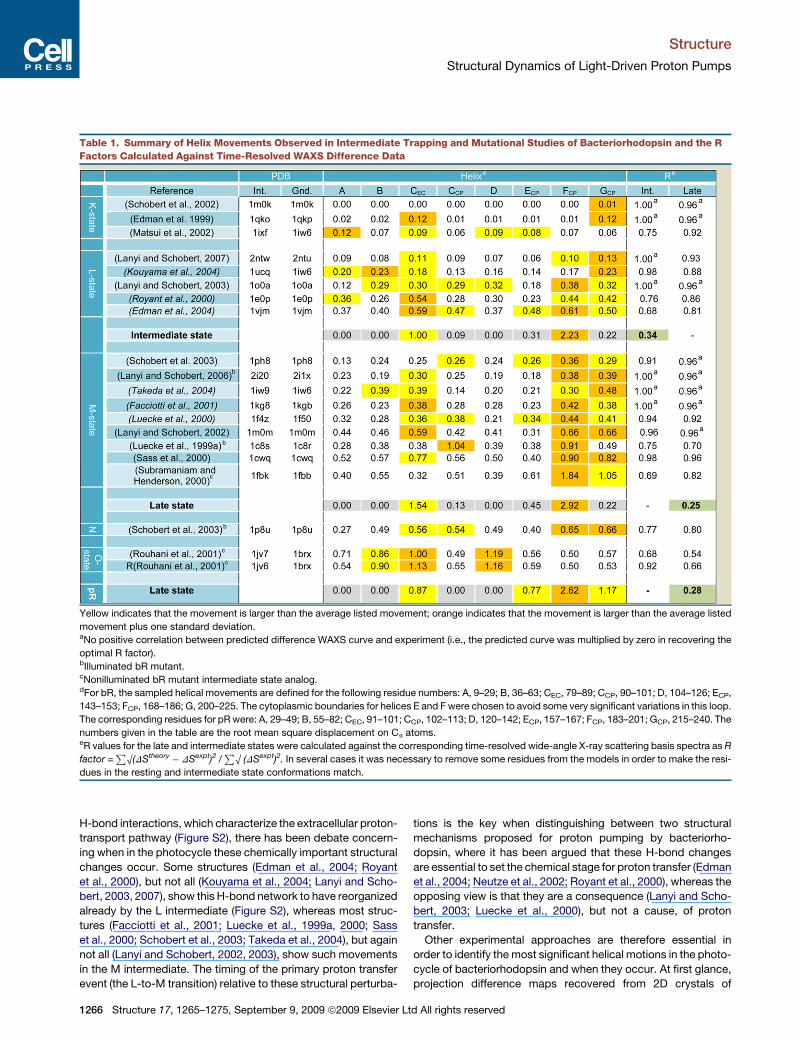
Table 1. Summary of Helix Movements Observed in Intermediate Trapping and Mutational Studies of Bacteriorhodopsin and the R
Factors Calculated Against Time-Resolved WAXS Difference Data
Yellow indicates that the movement is larger than the average listed movement; orange indicates that the movement is larger than the average listed
movement plus one standard deviation.aNo positive correlation between predicted difference WAXS curve and experiment (i.e., the predicted curve was multiplied by zero in recovering the
optimal R factor).bIlluminated bR mutant.cNonilluminated bR mutant intermediate state analog.dFor bR, the sampled helical movements are defined for the following residue numbers: A, 9–29; B, 36–63; CEC, 79–89; CCP, 90–101; D, 104–126; ECP,
143–153; FCP, 168–186; G, 200–225. The cytoplasmic boundaries for helices E and F were chosen to avoid some very significant variations in this loop.
The corresponding residues for pR were: A, 29–49; B, 55–82; CEC, 91–101; CCP, 102–113; D, 120–142; ECP, 157–167; FCP, 183–201; GCP, 215–240. The
numbers given in the table are the root mean square displacement on Ca atoms.eR values for the late and intermediate states were calculated against the corresponding time-resolved wide-angle X-ray scattering basis spectra as R
factor =P
O(DStheory� DSexpt)2 /P
O (DSexpt)2. In several cases it was necessary to remove some residues from the models in order to make the resi-
dues in the resting and intermediate state conformations match.
H-bond interactions, which characterize the extracellular proton-
transport pathway (Figure S2), there has been debate concern-
ing when in the photocycle these chemically important structural
changes occur. Some structures (Edman et al., 2004; Royant
et al., 2000), but not all (Kouyama et al., 2004; Lanyi and Scho-
bert, 2003, 2007), show this H-bond network to have reorganized
already by the L intermediate (Figure S2), whereas most struc-
tures (Facciotti et al., 2001; Luecke et al., 1999a, 2000; Sass
et al., 2000; Schobert et al., 2003; Takeda et al., 2004), but again
not all (Lanyi and Schobert, 2002, 2003), show such movements
in the M intermediate. The timing of the primary proton transfer
event (the L-to-M transition) relative to these structural perturba-
1266 Structure 17, 1265–1275, September 9, 2009 ª2009 Elsevier Lt
tions is the key when distinguishing between two structural
mechanisms proposed for proton pumping by bacteriorho-
dopsin, where it has been argued that these H-bond changes
are essential to set the chemical stage for proton transfer (Edman
et al., 2004; Neutze et al., 2002; Royant et al., 2000), whereas the
opposing view is that they are a consequence (Lanyi and Scho-
bert, 2003; Luecke et al., 2000), but not a cause, of proton
transfer.
Other experimental approaches are therefore essential in
order to identify the most significant helical motions in the photo-
cycle of bacteriorhodopsin and when they occur. At first glance,
projection difference maps recovered from 2D crystals of
d All rights reserved
Structure
Structural Dynamics of Light-Driven Proton Pumps
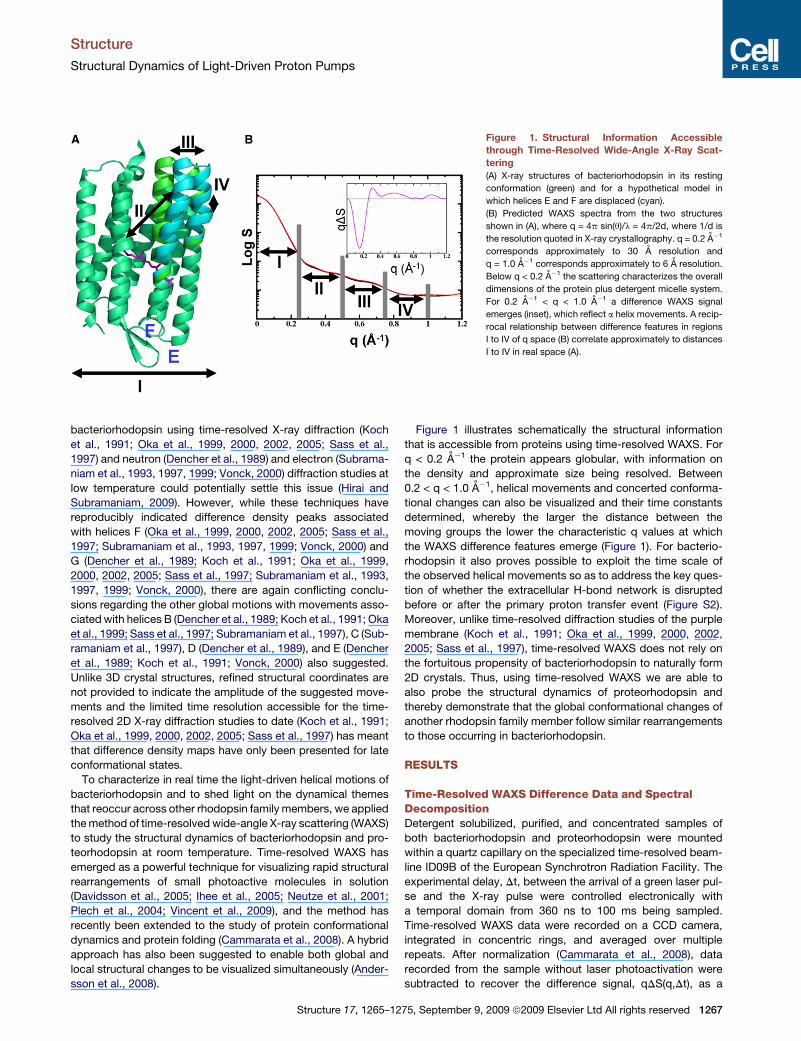
Figure 1. Structural Information Accessible
through Time-Resolved Wide-Angle X-Ray Scat-
tering
(A) X-ray structures of bacteriorhodopsin in its resting
conformation (green) and for a hypothetical model in
which helices E and F are displaced (cyan).
(B) Predicted WAXS spectra from the two structures
shown in (A), where q = 4p sin(q)/l = 4p/2d, where 1/d is
the resolution quoted in X-ray crystallography. q = 0.2 A�1
corresponds approximately to 30 A resolution and
q = 1.0 A�1 corresponds approximately to 6 A resolution.
Below q < 0.2 A�1 the scattering characterizes the overall
dimensions of the protein plus detergent micelle system.
For 0.2 A�1 < q < 1.0 A�1 a difference WAXS signal
emerges (inset), which reflect a helix movements. A recip-
rocal relationship between difference features in regions
I to IV of q space (B) correlate approximately to distances
I to IV in real space (A).
bacteriorhodopsin using time-resolved X-ray diffraction (Koch
et al., 1991; Oka et al., 1999, 2000, 2002, 2005; Sass et al.,
1997) and neutron (Dencher et al., 1989) and electron (Subrama-
niam et al., 1993, 1997, 1999; Vonck, 2000) diffraction studies at
low temperature could potentially settle this issue (Hirai and
Subramaniam, 2009). However, while these techniques have
reproducibly indicated difference density peaks associated
with helices F (Oka et al., 1999, 2000, 2002, 2005; Sass et al.,
1997; Subramaniam et al., 1993, 1997, 1999; Vonck, 2000) and
G (Dencher et al., 1989; Koch et al., 1991; Oka et al., 1999,
2000, 2002, 2005; Sass et al., 1997; Subramaniam et al., 1993,
1997, 1999; Vonck, 2000), there are again conflicting conclu-
sions regarding the other global motions with movements asso-
ciated with helices B (Dencher et al., 1989; Koch et al., 1991; Oka
et al., 1999; Sass et al., 1997; Subramaniam et al., 1997), C (Sub-
ramaniam et al., 1997), D (Dencher et al., 1989), and E (Dencher
et al., 1989; Koch et al., 1991; Vonck, 2000) also suggested.
Unlike 3D crystal structures, refined structural coordinates are
not provided to indicate the amplitude of the suggested move-
ments and the limited time resolution accessible for the time-
resolved 2D X-ray diffraction studies to date (Koch et al., 1991;
Oka et al., 1999, 2000, 2002, 2005; Sass et al., 1997) has meant
that difference density maps have only been presented for late
conformational states.
To characterize in real time the light-driven helical motions of
bacteriorhodopsin and to shed light on the dynamical themes
that reoccur across other rhodopsin family members, we applied
the method of time-resolved wide-angle X-ray scattering (WAXS)
to study the structural dynamics of bacteriorhodopsin and pro-
teorhodopsin at room temperature. Time-resolved WAXS has
emerged as a powerful technique for visualizing rapid structural
rearrangements of small photoactive molecules in solution
(Davidsson et al., 2005; Ihee et al., 2005; Neutze et al., 2001;
Plech et al., 2004; Vincent et al., 2009), and the method has
recently been extended to the study of protein conformational
dynamics and protein folding (Cammarata et al., 2008). A hybrid
approach has also been suggested to enable both global and
local structural changes to be visualized simultaneously (Ander-
sson et al., 2008).
Structure 17, 1265–12
Figure 1 illustrates schematically the structural information
that is accessible from proteins using time-resolved WAXS. For
q < 0.2 A�1 the protein appears globular, with information on
the density and approximate size being resolved. Between
0.2 < q < 1.0 A�1, helical movements and concerted conforma-
tional changes can also be visualized and their time constants
determined, whereby the larger the distance between the
moving groups the lower the characteristic q values at which
the WAXS difference features emerge (Figure 1). For bacterio-
rhodopsin it also proves possible to exploit the time scale of
the observed helical movements so as to address the key ques-
tion of whether the extracellular H-bond network is disrupted
before or after the primary proton transfer event (Figure S2).
Moreover, unlike time-resolved diffraction studies of the purple
membrane (Koch et al., 1991; Oka et al., 1999, 2000, 2002,
2005; Sass et al., 1997), time-resolved WAXS does not rely on
the fortuitous propensity of bacteriorhodopsin to naturally form
2D crystals. Thus, using time-resolved WAXS we are able to
also probe the structural dynamics of proteorhodopsin and
thereby demonstrate that the global conformational changes of
another rhodopsin family member follow similar rearrangements
to those occurring in bacteriorhodopsin.
RESULTS
Time-Resolved WAXS Difference Data and SpectralDecompositionDetergent solubilized, purified, and concentrated samples of
both bacteriorhodopsin and proteorhodopsin were mounted
within a quartz capillary on the specialized time-resolved beam-
line ID09B of the European Synchrotron Radiation Facility. The
experimental delay, Dt, between the arrival of a green laser pul-
se and the X-ray pulse were controlled electronically with
a temporal domain from 360 ns to 100 ms being sampled.
Time-resolved WAXS data were recorded on a CCD camera,
integrated in concentric rings, and averaged over multiple
repeats. After normalization (Cammarata et al., 2008), data
recorded from the sample without laser photoactivation were
subtracted to recover the difference signal, qDS(q,Dt), as a
75, September 9, 2009 ª2009 Elsevier Ltd All rights reserved 1267
Structure
Structural Dynamics of Light-Driven Proton Pumps
function of the given time delay. These difference WAXS data,
which contain information on structural changes within the
protein, also include the solvent response to heating (Georgiou
et al., 2006), which was removed as described previously (Cam-
marata et al., 2008) (Supplemental Experimental Procedures and
Figure S3).
Figures 2A and 2B show representative time-resolved differ-
ence WAXS data recorded from both proteins. As with time-
resolved WAXS studies of small molecules in solution (Davids-
son et al., 2005; Ihee et al., 2005; Neutze et al., 2001; Plech
et al., 2004) and hemoglobin (Cammarata et al., 2008), oscilla-
tions appear in the difference data that correlate directly with
protein conformational changes. Although the difference
WAXS data are similar for both proteins, there are marked differ-
ences in the positions, amplitudes, and time scales of the major
features. Spectral decompositions, using three components
(early, intermediate, and late), were performed to characterize
the time scales and basis spectra associated with the observed
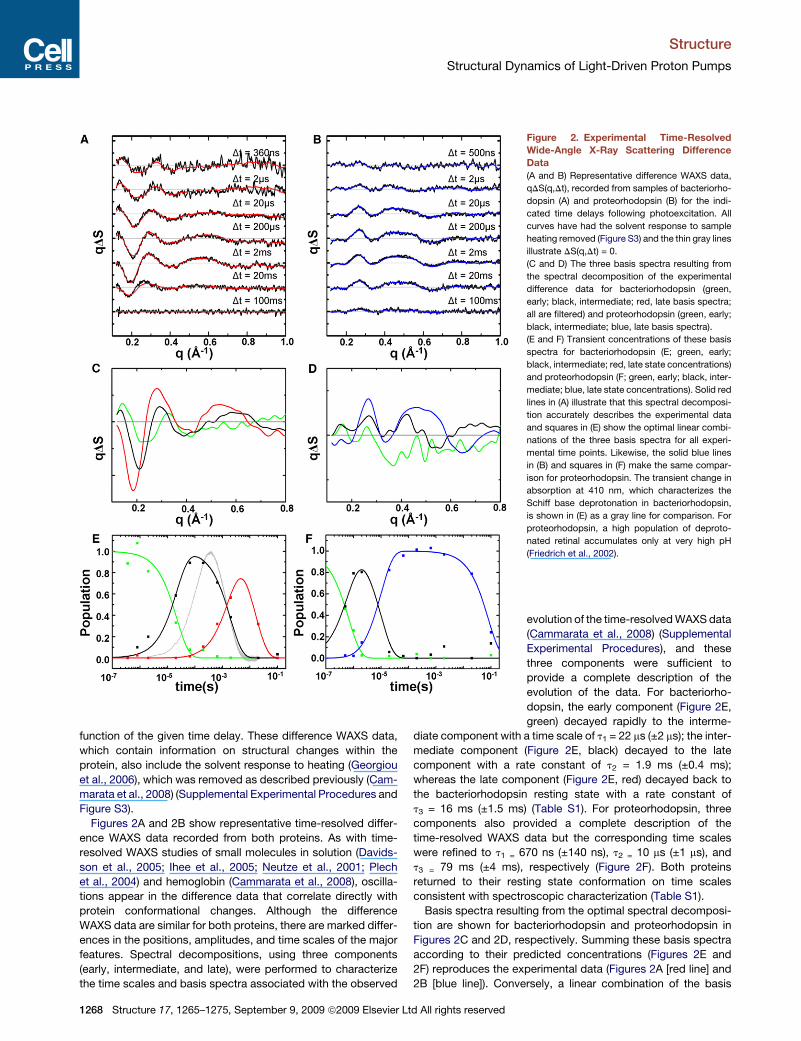
Figure 2. Experimental Time-Resolved
Wide-Angle X-Ray Scattering Difference
Data
(A and B) Representative difference WAXS data,
qDS(q,Dt), recorded from samples of bacteriorho-
dopsin (A) and proteorhodopsin (B) for the indi-
cated time delays following photoexcitation. All
curves have had the solvent response to sample
heating removed (Figure S3) and the thin gray lines
illustrate DS(q,Dt) = 0.
(C and D) The three basis spectra resulting from
the spectral decomposition of the experimental
difference data for bacteriorhodopsin (green,
early; black, intermediate; red, late basis spectra;
all are filtered) and proteorhodopsin (green, early;
black, intermediate; blue, late basis spectra).
(E and F) Transient concentrations of these basis
spectra for bacteriorhodopsin (E; green, early;
black, intermediate; red, late state concentrations)
and proteorhodopsin (F; green, early; black, inter-
mediate; blue, late state concentrations). Solid red
lines in (A) illustrate that this spectral decomposi-
tion accurately describes the experimental data
and squares in (E) show the optimal linear combi-
nations of the three basis spectra for all experi-
mental time points. Likewise, the solid blue lines
in (B) and squares in (F) make the same compar-
ison for proteorhodopsin. The transient change in
absorption at 410 nm, which characterizes the
Schiff base deprotonation in bacteriorhodopsin,
is shown in (E) as a gray line for comparison. For
proteorhodopsin, a high population of deproto-
nated retinal accumulates only at very high pH
(Friedrich et al., 2002).
evolution of the time-resolved WAXS data
(Cammarata et al., 2008) (Supplemental
Experimental Procedures), and these
three components were sufficient to
provide a complete description of the
evolution of the data. For bacteriorho-
dopsin, the early component (Figure 2E,
green) decayed rapidly to the interme-
diate component with a time scale of t1 = 22 ms (±2 ms); the inter-
mediate component (Figure 2E, black) decayed to the late
component with a rate constant of t2 = 1.9 ms (±0.4 ms);
whereas the late component (Figure 2E, red) decayed back to
the bacteriorhodopsin resting state with a rate constant of
t3 = 16 ms (±1.5 ms) (Table S1). For proteorhodopsin, three
components also provided a complete description of the
time-resolved WAXS data but the corresponding time scales
were refined to t1 = 670 ns (±140 ns), t2 = 10 ms (±1 ms), and
t3 = 79 ms (±4 ms), respectively (Figure 2F). Both proteins
returned to their resting state conformation on time scales
consistent with spectroscopic characterization (Table S1).
Basis spectra resulting from the optimal spectral decomposi-
tion are shown for bacteriorhodopsin and proteorhodopsin in
Figures 2C and 2D, respectively. Summing these basis spectra
according to their predicted concentrations (Figures 2E and
2F) reproduces the experimental data (Figures 2A [red line] and
2B [blue line]). Conversely, a linear combination of the basis
1268 Structure 17, 1265–1275, September 9, 2009 ª2009 Elsevier Ltd All rights reserved
Structure
Structural Dynamics of Light-Driven Proton Pumps
spectra optimized against all experimental data (Figures 2E and
2F, colored squares) reliably reproduce the concentrations pre-
dicted for the transient species (Figures 2E and 2F, colored
lines). The extent to which this linear combination reproduces
the predicted transient concentrations is a key indicator that
the three component spectral decomposition is a valid descrip-
tion of the data.
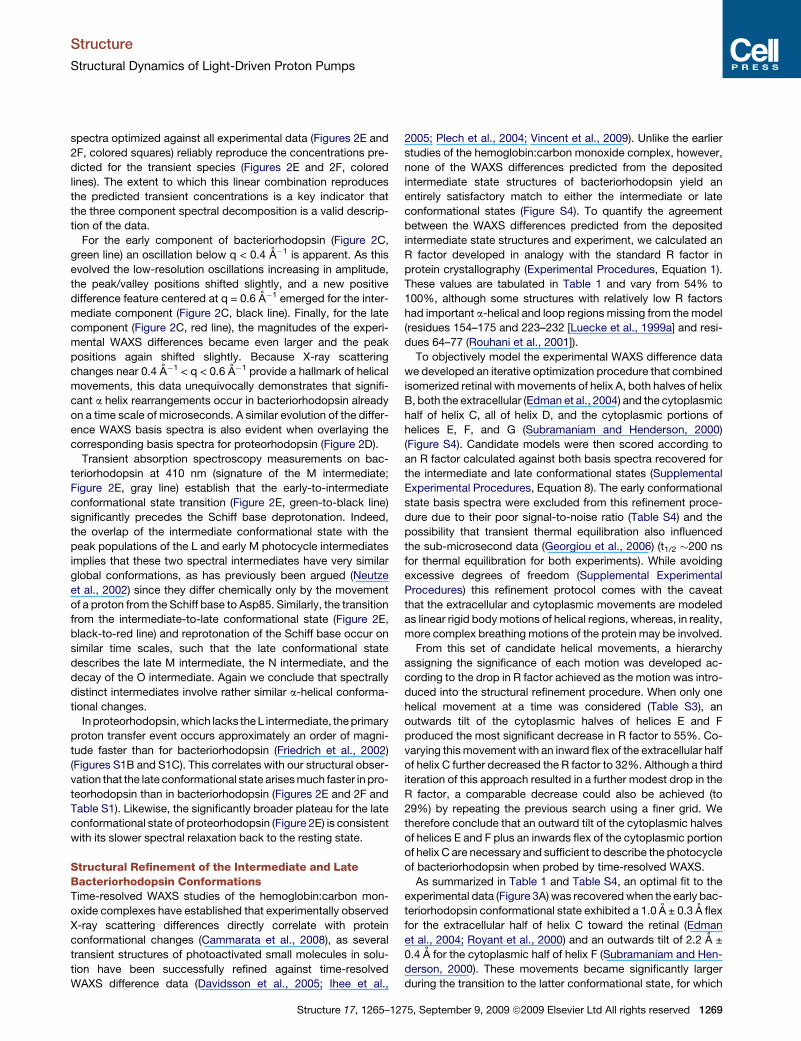
For the early component of bacteriorhodopsin (Figure 2C,
green line) an oscillation below q < 0.4 A�1 is apparent. As this
evolved the low-resolution oscillations increasing in amplitude,
the peak/valley positions shifted slightly, and a new positive
difference feature centered at q = 0.6 A�1 emerged for the inter-
mediate component (Figure 2C, black line). Finally, for the late
component (Figure 2C, red line), the magnitudes of the experi-
mental WAXS differences became even larger and the peak
positions again shifted slightly. Because X-ray scattering
changes near 0.4 A�1 < q < 0.6 A�1 provide a hallmark of helical
movements, this data unequivocally demonstrates that signifi-
cant a helix rearrangements occur in bacteriorhodopsin already
on a time scale of microseconds. A similar evolution of the differ-
ence WAXS basis spectra is also evident when overlaying the
corresponding basis spectra for proteorhodopsin (Figure 2D).
Transient absorption spectroscopy measurements on bac-
teriorhodopsin at 410 nm (signature of the M intermediate;
Figure 2E, gray line) establish that the early-to-intermediate
conformational state transition (Figure 2E, green-to-black line)
significantly precedes the Schiff base deprotonation. Indeed,
the overlap of the intermediate conformational state with the
peak populations of the L and early M photocycle intermediates
implies that these two spectral intermediates have very similar
global conformations, as has previously been argued (Neutze
et al., 2002) since they differ chemically only by the movement
of a proton from the Schiff base to Asp85. Similarly, the transition
from the intermediate-to-late conformational state (Figure 2E,
black-to-red line) and reprotonation of the Schiff base occur on
similar time scales, such that the late conformational state
describes the late M intermediate, the N intermediate, and the
decay of the O intermediate. Again we conclude that spectrally
distinct intermediates involve rather similar a-helical conforma-
tional changes.
In proteorhodopsin, which lacks the L intermediate, the primary
proton transfer event occurs approximately an order of magni-
tude faster than for bacteriorhodopsin (Friedrich et al., 2002)
(Figures S1B and S1C). This correlates with our structural obser-
vation that the late conformational state arises much faster in pro-
teorhodopsin than in bacteriorhodopsin (Figures 2E and 2F and
Table S1). Likewise, the significantly broader plateau for the late
conformational state of proteorhodopsin (Figure 2E) is consistent
with its slower spectral relaxation back to the resting state.
Structural Refinement of the Intermediate and LateBacteriorhodopsin ConformationsTime-resolved WAXS studies of the hemoglobin:carbon mon-
oxide complexes have established that experimentally observed
X-ray scattering differences directly correlate with protein
conformational changes (Cammarata et al., 2008), as several
transient structures of photoactivated small molecules in solu-
tion have been successfully refined against time-resolved
WAXS difference data (Davidsson et al., 2005; Ihee et al.,
Structure 17, 1265–12
2005; Plech et al., 2004; Vincent et al., 2009). Unlike the earlier
studies of the hemoglobin:carbon monoxide complex, however,
none of the WAXS differences predicted from the deposited
intermediate state structures of bacteriorhodopsin yield an
entirely satisfactory match to either the intermediate or late
conformational states (Figure S4). To quantify the agreement
between the WAXS differences predicted from the deposited
intermediate state structures and experiment, we calculated an
R factor developed in analogy with the standard R factor in
protein crystallography (Experimental Procedures, Equation 1).
These values are tabulated in Table 1 and vary from 54% to
100%, although some structures with relatively low R factors
had important a-helical and loop regions missing from the model
(residues 154–175 and 223–232 [Luecke et al., 1999a] and resi-
dues 64–77 (Rouhani et al., 2001]).
To objectively model the experimental WAXS difference data
we developed an iterative optimization procedure that combined
isomerized retinal with movements of helix A, both halves of helix
B, both the extracellular (Edman et al., 2004) and the cytoplasmic
half of helix C, all of helix D, and the cytoplasmic portions of
helices E, F, and G (Subramaniam and Henderson, 2000)
(Figure S4). Candidate models were then scored according to
an R factor calculated against both basis spectra recovered for
the intermediate and late conformational states (Supplemental
Experimental Procedures, Equation 8). The early conformational
state basis spectra were excluded from this refinement proce-
dure due to their poor signal-to-noise ratio (Table S4) and the
possibility that transient thermal equilibration also influenced
the sub-microsecond data (Georgiou et al., 2006) (t1/2 �200 ns
for thermal equilibration for both experiments). While avoiding
excessive degrees of freedom (Supplemental Experimental
Procedures) this refinement protocol comes with the caveat
that the extracellular and cytoplasmic movements are modeled
as linear rigid body motions of helical regions, whereas, in reality,
more complex breathing motions of the protein may be involved.
From this set of candidate helical movements, a hierarchy
assigning the significance of each motion was developed ac-
cording to the drop in R factor achieved as the motion was intro-
duced into the structural refinement procedure. When only one
helical movement at a time was considered (Table S3), an
outwards tilt of the cytoplasmic halves of helices E and F
produced the most significant decrease in R factor to 55%. Co-
varying this movement with an inward flex of the extracellular half
of helix C further decreased the R factor to 32%. Although a third
iteration of this approach resulted in a further modest drop in the
R factor, a comparable decrease could also be achieved (to
29%) by repeating the previous search using a finer grid. We
therefore conclude that an outward tilt of the cytoplasmic halves
of helices E and F plus an inwards flex of the cytoplasmic portion
of helix C are necessary and sufficient to describe the photocycle
of bacteriorhodopsin when probed by time-resolved WAXS.
As summarized in Table 1 and Table S4, an optimal fit to the
experimental data (Figure 3A) was recovered when the early bac-
teriorhodopsin conformational state exhibited a 1.0 A ± 0.3 A flex
for the extracellular half of helix C toward the retinal (Edman
et al., 2004; Royant et al., 2000) and an outwards tilt of 2.2 A ±
0.4 A for the cytoplasmic half of helix F (Subramaniam and Hen-
derson, 2000). These movements became significantly larger
during the transition to the latter conformational state, for which
75, September 9, 2009 ª2009 Elsevier Ltd All rights reserved 1269
Structure
Structural Dynamics of Light-Driven Proton Pumps
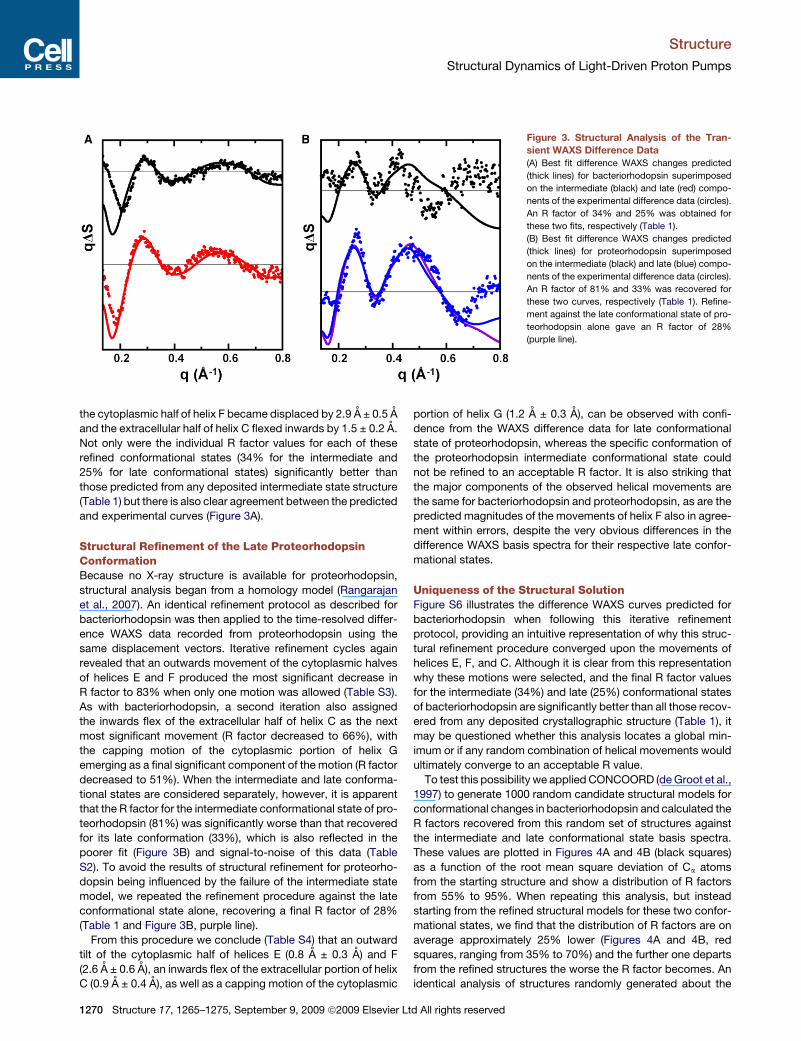
Figure 3. Structural Analysis of the Tran-
sient WAXS Difference Data
(A) Best fit difference WAXS changes predicted
(thick lines) for bacteriorhodopsin superimposed
on the intermediate (black) and late (red) compo-
nents of the experimental difference data (circles).
An R factor of 34% and 25% was obtained for
these two fits, respectively (Table 1).
(B) Best fit difference WAXS changes predicted
(thick lines) for proteorhodopsin superimposed
on the intermediate (black) and late (blue) compo-
nents of the experimental difference data (circles).
An R factor of 81% and 33% was recovered for
these two curves, respectively (Table 1). Refine-
ment against the late conformational state of pro-
teorhodopsin alone gave an R factor of 28%
(purple line).
the cytoplasmic half of helix F became displaced by 2.9 A ± 0.5 A
and the extracellular half of helix C flexed inwards by 1.5 ± 0.2 A.
Not only were the individual R factor values for each of these
refined conformational states (34% for the intermediate and
25% for late conformational states) significantly better than
those predicted from any deposited intermediate state structure
(Table 1) but there is also clear agreement between the predicted
and experimental curves (Figure 3A).
Structural Refinement of the Late ProteorhodopsinConformationBecause no X-ray structure is available for proteorhodopsin,
structural analysis began from a homology model (Rangarajan
et al., 2007). An identical refinement protocol as described for
bacteriorhodopsin was then applied to the time-resolved differ-
ence WAXS data recorded from proteorhodopsin using the
same displacement vectors. Iterative refinement cycles again
revealed that an outwards movement of the cytoplasmic halves
of helices E and F produced the most significant decrease in
R factor to 83% when only one motion was allowed (Table S3).
As with bacteriorhodopsin, a second iteration also assigned
the inwards flex of the extracellular half of helix C as the next
most significant movement (R factor decreased to 66%), with
the capping motion of the cytoplasmic portion of helix G
emerging as a final significant component of the motion (R factor
decreased to 51%). When the intermediate and late conforma-
tional states are considered separately, however, it is apparent
that the R factor for the intermediate conformational state of pro-
teorhodopsin (81%) was significantly worse than that recovered
for its late conformation (33%), which is also reflected in the
poorer fit (Figure 3B) and signal-to-noise of this data (Table
S2). To avoid the results of structural refinement for proteorho-
dopsin being influenced by the failure of the intermediate state
model, we repeated the refinement procedure against the late
conformational state alone, recovering a final R factor of 28%
(Table 1 and Figure 3B, purple line).
From this procedure we conclude (Table S4) that an outward
tilt of the cytoplasmic half of helices E (0.8 A ± 0.3 A) and F
(2.6 A ± 0.6 A), an inwards flex of the extracellular portion of helix
C (0.9 A ± 0.4 A), as well as a capping motion of the cytoplasmic
1270 Structure 17, 1265–1275, September 9, 2009 ª2009 Elsevier L
portion of helix G (1.2 A ± 0.3 A), can be observed with confi-
dence from the WAXS difference data for late conformational
state of proteorhodopsin, whereas the specific conformation of
the proteorhodopsin intermediate conformational state could
not be refined to an acceptable R factor. It is also striking that
the major components of the observed helical movements are
the same for bacteriorhodopsin and proteorhodopsin, as are the
predicted magnitudes of the movements of helix F also in agree-
ment within errors, despite the very obvious differences in the
difference WAXS basis spectra for their respective late confor-
mational states.
Uniqueness of the Structural SolutionFigure S6 illustrates the difference WAXS curves predicted for
bacteriorhodopsin when following this iterative refinement
protocol, providing an intuitive representation of why this struc-
tural refinement procedure converged upon the movements of
helices E, F, and C. Although it is clear from this representation
why these motions were selected, and the final R factor values
for the intermediate (34%) and late (25%) conformational states
of bacteriorhodopsin are significantly better than all those recov-
ered from any deposited crystallographic structure (Table 1), it
may be questioned whether this analysis locates a global min-
imum or if any random combination of helical movements would
ultimately converge to an acceptable R value.
To test this possibility we applied CONCOORD (de Groot et al.,
1997) to generate 1000 random candidate structural models for
conformational changes in bacteriorhodopsin and calculated the
R factors recovered from this random set of structures against
the intermediate and late conformational state basis spectra.
These values are plotted in Figures 4A and 4B (black squares)
as a function of the root mean square deviation of Ca atoms
from the starting structure and show a distribution of R factors
from 55% to 95%. When repeating this analysis, but instead
starting from the refined structural models for these two confor-
mational states, we find that the distribution of R factors are on
average approximately 25% lower (Figures 4A and 4B, red
squares, ranging from 35% to 70%) and the further one departs
from the refined structures the worse the R factor becomes. An
identical analysis of structures randomly generated about the
td All rights reserved

Structure
Structural Dynamics of Light-Driven Proton Pumps
Figure 4. Analysis of R Factor Distributions from Randomly Gener-
ated Structures
(A) R factor values determined against the bacteriorhodopsin intermediate
conformational state basis spectrum when 1000 random structures are gener-
Structure 17, 1265–1
proteorhodopsin resting conformation and its refined late con-
formational state yielded a similar conclusion (Figure 4C). In
that case, however, no random structures generated from the
resting state conformation gave an R factor lower than 89%.
Thus we conclude that the refinement procedure developed
here reliably converges toward a global minimum.
Application of Time-Resolved WAXS to Other SystemsFrom these results on bacteriorhodopsin and proteorhodopsin,
as well as previous work on hemoglobin:carbon monoxide
complexes (Cammarata et al., 2008), it is of value to consider
the extent to which time-resolved WAXS may be applied to other
membrane protein systems such as transporters, pumps, and
gated channels for which conformational changes are believed
to occur. Because most systems are not naturally photoactive,
other triggering protocols will need to be developed such as
microfluidics stopped flow devices or the use of caged
compounds (Giovannardi et al., 1998). Although it should be
straightforward to extract basis spectra and refine the rate
constants associated with transient conformational changes,
a more significant challenge will be the structural interpretation
of WAXS difference data when there is little knowledge regarding
specific conformational changes. Computational tools such as
course grain models (Stumpff-Kane et al., 2008; Tozzini, 2005),
molecular dynamics simulations and normal mode analysis
(Stumpff-Kane et al., 2008), and the geometric sampling of
protein conformational transitions (Seeliger et al., 2007) could
all be implemented in connection with structural refinement
and converge upon transient protein conformations with a
minimum number of additional chemical assumptions.
DISCUSSION
Figure 5 overviews the mechanistic picture to emerge from these
time-resolved WAXS studies of bacteriorhodopsin at room
temperature. As is apparent from Table 1, the light-induced con-
formational changes are appreciably larger at room temperature
when the protein is not constrained by a 3D crystal lattice. More
significantly, however, is that the primary proton transfer event
from the Schiff base to Asp85 does not mark a boundary sepa-
rating two distinctly different types of motion. Rather, the inward
collapse of the extracellular half of the proton transport channel
(Royant et al., 2000) and the opening of the cytoplasmic half
(Subramaniam and Henderson, 2000) arise as two aspects of
the same basic motion, with the primary proton transfer event
marking a threshold after which the magnitudes of these
ated starting from the bacteriorhodopsin resting state structure (black) and
starting from the refined intermediate state structure (red). Rmsd values repre-
sent the average root mean square deviation of Ca atoms for each random
structure relative to the starting model.
(B) A similar R factor distribution for 1000 random structures as shown in (A),
but calculated against the bacteriorhodopsin late conformational state basis
spectrum and starting from the bacteriorhodopsin resting state (black) and
refined late conformational state model (red).
(C) A similar R factor distribution as shown in (A) and (B), but calculated against
the proteorhodopsin late conformational state basis spectrum and starting
from the resting (black) and late (red) conformational states of proteorhodopsin
when generating random structures.
Dashed lines indicate the final R-factor achieved during structural refinement.
275, September 9, 2009 ª2009 Elsevier Ltd All rights reserved 1271
Structure
Structural Dynamics of Light-Driven Proton Pumps
motions grow approximately 50%. From the different time scales
associated with the intermediate and late conformational states
of bacteriorhodopsin (Figure 2E) we conclude that a significant
energy barrier exists that can only be traversed following Schiff
base deprotonation. This picture both simplifies the description
of the protein conformational dynamics and supports intuition,
since all protein motions derive from a steric clash with photoiso-
merized retinal. As the Schiff base deprotonates the retinal
straightens (Subramaniam and Henderson, 2000) and an elec-
trostatic attraction between the positively charged Schiff base
to the negatively charged Asp85 is lost. Both effects allow the
retinal to be displaced further toward the cytoplasm and conse-
quently drive larger protein movements.
In the resting state of bacteriorhodopsin, the extracellular half
of the protein is held rigid by a complex network of water-medi-
ated H-bond interactions (Belrhali et al., 1999) primarily connect-
ing helices C and G (Figure S2). As found in intermediate trapping
studies (Edman et al., 2004; Royant et al., 2000), a conforma-
tional flex of the extracellular half of helix C toward the proton
pumping channel cannot occur unless this extended H-bond
network is disrupted (Figure S2). Using time-resolved WAXS
we observe that a significant inwards flex of helix C toward the
proton pumping channel occurs prior to the Schiff base deproto-
nation event. Accordingly, a major rearrangement of water mole-
cules must already have happened on this time scale, which both
allows helix C to flex and changes the local chemical environ-
ment of the Schiff base and Asp85, such that the pKa of the
Schiff base drops and that of Asp85 increases. These dynamical
changes in H-bond interactions thus set the stage for sponta-
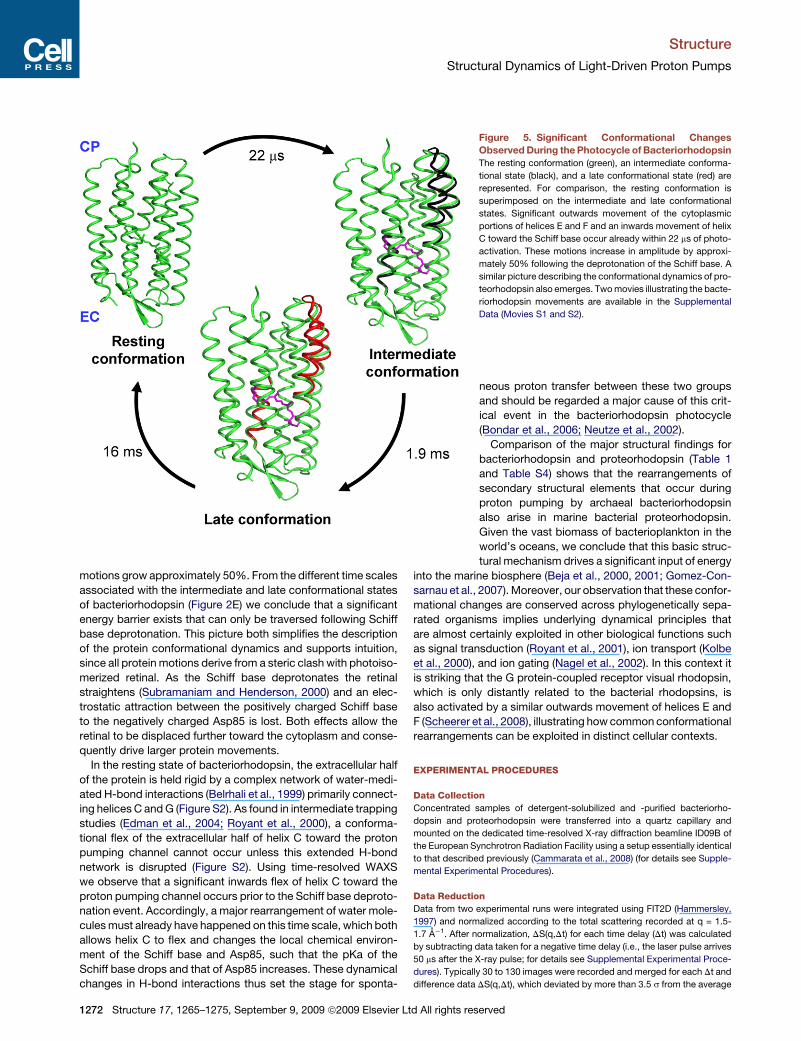
Figure 5. Significant Conformational Changes
Observed During the Photocycle of Bacteriorhodopsin
The resting conformation (green), an intermediate conforma-
tional state (black), and a late conformational state (red) are
represented. For comparison, the resting conformation is
superimposed on the intermediate and late conformational
states. Significant outwards movement of the cytoplasmic
portions of helices E and F and an inwards movement of helix
C toward the Schiff base occur already within 22 ms of photo-
activation. These motions increase in amplitude by approxi-
mately 50% following the deprotonation of the Schiff base. A
similar picture describing the conformational dynamics of pro-
teorhodopsin also emerges. Two movies illustrating the bacte-
riorhodopsin movements are available in the Supplemental
Data (Movies S1 and S2).
neous proton transfer between these two groups
and should be regarded a major cause of this crit-
ical event in the bacteriorhodopsin photocycle
(Bondar et al., 2006; Neutze et al., 2002).
Comparison of the major structural findings for
bacteriorhodopsin and proteorhodopsin (Table 1
and Table S4) shows that the rearrangements of
secondary structural elements that occur during
proton pumping by archaeal bacteriorhodopsin
also arise in marine bacterial proteorhodopsin.
Given the vast biomass of bacterioplankton in the
world’s oceans, we conclude that this basic struc-
tural mechanism drives a significant input of energy
into the marine biosphere (Beja et al., 2000, 2001; Gomez-Con-
sarnau et al., 2007). Moreover, our observation that these confor-
mational changes are conserved across phylogenetically sepa-
rated organisms implies underlying dynamical principles that
are almost certainly exploited in other biological functions such
as signal transduction (Royant et al., 2001), ion transport (Kolbe
et al., 2000), and ion gating (Nagel et al., 2002). In this context it
is striking that the G protein-coupled receptor visual rhodopsin,
which is only distantly related to the bacterial rhodopsins, is
also activated by a similar outwards movement of helices E and
F (Scheerer et al., 2008), illustrating how common conformational
rearrangements can be exploited in distinct cellular contexts.
EXPERIMENTAL PROCEDURES
Data Collection
Concentrated samples of detergent-solubilized and -purified bacteriorho-
dopsin and proteorhodopsin were transferred into a quartz capillary and
mounted on the dedicated time-resolved X-ray diffraction beamline ID09B of
the European Synchrotron Radiation Facility using a setup essentially identical
to that described previously (Cammarata et al., 2008) (for details see Supple-
mental Experimental Procedures).
Data Reduction
Data from two experimental runs were integrated using FIT2D (Hammersley,
1997) and normalized according to the total scattering recorded at q = 1.5-
1.7 A�1. After normalization, DS(q,Dt) for each time delay (Dt) was calculated
by subtracting data taken for a negative time delay (i.e., the laser pulse arrives
50 ms after the X-ray pulse; for details see Supplemental Experimental Proce-
dures). Typically 30 to 130 images were recorded and merged for each Dt and
difference data DS(q,Dt), which deviated by more than 3.5 s from the average
1272 Structure 17, 1265–1275, September 9, 2009 ª2009 Elsevier Ltd All rights reserved
Structure
Structural Dynamics of Light-Driven Proton Pumps
DS(q,Dt), were rejected (typically 15% of the data). For each of the averaged
data sets the solvent response to sample heating was then removed
(Figure S3) and representative data are shown in Figures 1A and 1B. Basis
spectra for the early and late states (Figure 2) were extracted by spectral
decomposition assuming a simple sequential photocycle model with three
transients called the early, intermediate, and late conformational states (for
details see Supplemental Experimental Procedures).
Structural Modeling
An R factor was defined as follows to analyze the agreement between the
difference WAXS curves predicted from structural models and the experi-
mental difference WAXS data:
R� factor =X
O�
DStheory � DSexpt�2
=X
O�DSexpt
�2(1)
where DSexpt represents a specific difference WAXS basis spectra recovered
from spectral decomposition of the experimental data and DStheory represents
the difference WAXS curve predicted from a given structural model. An overall
scaling factor plus a small constant offset (which allows for uncertainty in the
temperature correction) were included as free variables to optimize when
recovering the R factor values given in Table 1.
For structural refinement, this R factor was modified slightly to allow the
simultaneous optimization of two structural models against the basis spectra
(DSexpt) recovered for the intermediate and late conformational states (Supple-
mental Experimental Procedures, Equation 8). The deposited 1.9 A structure of
bacteriorhodopsin (Belrhali et al., 1999) and a slightly modified homology
model of proteorhodopsin (Rangarajan et al., 2007) (shifted in sequence by
one Ca atom position in helix F toward the cytoplasm so as to place Trp197
above the C20 retinal methyl group) were used as starting points for structural
analysis. Structural refinement of a candidate set of helical movements was
then performed against the intermediate and late state basis spectra (Figure 3)
as described in the text (see also Supplemental Experimental Procedures)
using CRYSOL to predict the X-ray scattering curves (Svergun et al., 1995).
In this analysis, the membrane protein models were placed within a hydro-
phobic membrane bilayer and a B factor term was introduced to account for
the high level of disorder of this bilayer (see Supplemental Experimental Proce-
dures for more details). Uncertainties in the magnitudes of the refined helical
movements (Table S3) were estimated from the standard deviations of the
50 best solutions (of 46,656 possible combinations).
Nonlinearity in the predicted X-ray scattering curves with the amplitude of
the helical movements (Figure S7) enabled this structural refinement to
proceed without the need to first specify the photoexcited populations (deter-
mined afterwards as 35% ± 10% for bacteriorhodopisin and 20% ± 7% for
proteorhodopsin; see Supplemental Experimental Procedures). The difference
X-ray scattering data at low resolution could be better modeled by incorpo-
rating a dynamic response of the surrounding membrane (micelle), such as
a slight change in density in response to protein conformational changes
(Figure S8). These low resolution considerations, however, had no influence
on the results of structural refinement.
SUPPLEMENTAL DATA
Supplemental data include Supplemental Experimental Procedures, eight
figures, five tables, and two movies and can be found with this article online
at http://www.cell.com/structure/supplemental/S0969-2126(09)00290-1.
ACKNOWLEDGMENTS
We thank Robert Birge for providing coordinates for a model of proteorhodop-
sin developed from homology with bacteriorhodopsin. We are indebted
to Philip Anfinrud and Friedrich Schotte for the design of the field-program-
mable gate array-based timing system used in these experiments. We
acknowledge financial support from the Swedish Science Research Council
(VR), the Swedish Strategic Research Foundation, the Human Frontier Science
Program, the European Commission Marie Currie Postdoctoral Fellowship
Programme, and the Chalmers Bioscience Programme. The authors declare
no competing financial interests.
Structure 17, 1265–12
Received: May 19, 2009
Revised: July 7, 2009
Accepted: July 9, 2009
Published: September 8, 2009
REFERENCES
Andersson, M., Vincent, J., van der Spoel, D., Davidsson, J., and Neutze, R.
(2008). A proposed time-resolved X-ray scattering approach to track local
and global conformational changes in membrane transport proteins. Structure
16, 21–28.
Beja, O., Aravind, L., Koonin, E.V., Suzuki, M.T., Hadd, A., Nguyen, L.P., Jova-
novich, S.B., Gates, C.M., Feldman, R.A., Spudich, J.L., et al. (2000). Bacterial
rhodopsin: evidence for a new type of phototrophy in the sea. Science 289,
1902–1906.
Beja, O., Spudich, E.N., Spudich, J.L., Leclerc, M., and DeLong, E.F. (2001).
Proteorhodopsin phototrophy in the ocean. Nature 411, 786–789.
Belrhali, H., Nollert, P., Royant, A., Menzel, C., Rosenbusch, J.P., Landau,
E.M., and Pebay-Peyroula, E. (1999). Protein, lipid and water organization in
bacteriorhodopsin crystals: a molecular view of the purple membrane at
1.9 A resolution. Structure 7, 909–917.
Bondar, A.-N., Smith, J.C., and Fischer, S. (2006). Structural and energetic
determinants of primary proton transfer in bacteriorhodopsin. Photochem.
Photobiol. Sci. 5, 547–552.
Cammarata, M., Levantino, M., Schotte, F., Anfinrud, P.A., Ewald, F., Choi, J.,
Cupane, A., Wulff, M., and Ihee, H. (2008). Tracking the structural dynamics of
proteins in solution using time-resolved wide-angle X-ray scattering. Nat.
Methods 5, 881–886.
Davidsson, J., Poulsen, J., Cammarata, M., Georgiou, P., Wouts, R., Katona,
G., Jacobson, F., Plech, A., Wulff, M., Nyman, G., and Neutze, R. (2005). Struc-
tural determination of a transient isomer of CH2I2 by picosecond X-ray diffrac-
tion. Phys. Rev. Lett. 94, 245503.
de Groot, B.L., van Aalten, D.M., Scheek, R.M., Amadei, A., Vriend, G., and
Berendsen, H.J. (1997). Prediction of protein conformational freedom from
distance constraints. Proteins 29, 240–251.
Dencher, N.A., Dresselhaus, D., Zaccai, G., and Buldt, G. (1989). Structural
changes in bacteriorhodopsin during proton translocation revealed by neutron
diffraction. Proc. Natl. Acad. Sci. USA 86, 7876–7879.
Edman, K., Nollert, P., Royant, A., Belrhali, H., Pebay-Peyroula, E., Hajdu, J.,
Neutze, R., and Landau, E.M. (1999). High-resolution X-ray structure of an
early intermediate in the bacteriorhodopsin photocycle. Nature 401, 822–826.
Edman, K., Royant, A., Larsson, G., Jacobson, F., Taylor, T., van der Spoel, D.,
Landau, E.M., Pebay-Peyroula, E., and Neutze, R. (2004). Deformation of helix
C in the low temperature L-intermediate of bacteriorhodopsin. J. Biol. Chem.
279, 2147–2158.
Facciotti, M.T., Rouhani, S., Burkard, F.T., Betancourt, F.M., Downing, K.H.,
Rose, R.B., McDermott, G., and Glaeser, R.M. (2001). Structure of an early
intermediate in the M-state phase of the bacteriorhodopsin photocycle.
Biophys. J. 81, 3442–3455.
Friedrich, T., Geibel, S., Kalmbach, R., Chizhov, I., Ataka, K., Heberle, J., En-
gelhard, M., and Bamberg, E. (2002). Proteorhodopsin is a light-driven proton
pump with variable vectoriality. J. Mol. Biol. 321, 821–838.
Georgiou, P., Vincent, J., Andersson, M., Wohri, A.B., Gourdon, P., Poulsen,
J., Davidsson, J., and Neutze, R. (2006). Picosecond calorimetry: time-
resolved x-ray diffraction studies of liquid CH2Cl2. J. Phys. Chem. 124,
234507.
Giovannardi, S., Lando, L., and Peres, A. (1998). Flash photolysis of caged
compounds: casting light on physiological processes. News Physiol. Sci. 13,
251–255.
Gomez-Consarnau, L., Gonzalez, J.M., Coll-Llado, M., Gourdon, P., Pascher,
T., Neutze, R., Pedros-Alio, C., and Pinhassi, J. (2007). Light stimulates growth
of proteorhodopsin-containing marine Flavobacteria. Nature 445, 210–213.
Hammersley, A.P. (1997). FIT2D: An Introduction and Overview. ESRF In-
ternal Report, http://www.esrf.eu/computing/scientific/FIT2D/FIT2D_INTRO/
fit2d.html.
75, September 9, 2009 ª2009 Elsevier Ltd All rights reserved 1273
Structure
Structural Dynamics of Light-Driven Proton Pumps
Haupts, U., Tittor, J., and Oesterhelt, D. (1999). Closing in on bacteriorho-
dopsin: progress in understanding the molecule. Annu. Rev. Biophys. Biomol.
Struct. 28, 367–399.
Henderson, R., and Unwin, P.N. (1975). Three-dimensional model of purple
membrane obtained by electron microscopy. Nature 257, 28–32.
Henderson, R., Baldwin, J.M., Ceska, T.A., Zemlin, F., Beckmann, E., and
Downing, K.H. (1990). Model for the structure of bacteriorhodopsin based
on high-resolution electron cryo-microscopy. J. Mol. Biol. 213, 899–929.
Hirai, T., and Subramaniam, S. (2009). Protein conformational changes in the
bacteriorhodopsin photocycle: comparison of findings from electron and
X-ray crystallographic analyses. PLoS ONE 4, e5769.
Ihee, H., Lorenc, M., Kim, T.K., Kong, Q.Y., Cammarata, M., Lee, J.H., Bratos,
S., and Wulff, M. (2005). Ultrafast x-ray diffraction of transient molecular struc-
tures in solution. Science 309, 1223–1227.
Koch, M.H., Dencher, N.A., Oesterhelt, D., Plohn, H.J., Rapp, G., and Buldt, G.
(1991). Time-resolved X-ray diffraction study of structural changes associated
with the photocycle of bacteriorhodopsin. EMBO J. 10, 521–526.
Kolbe, M., Besir, H., Essen, L.O., and Oesterhelt, D. (2000). Structure of the
light-driven chloride pump halorhodopsin at 1.8 A resolution. Science 288,
1390–1396.
Kouyama, T., Nishikawa, T., Tokuhisa, T., and Okumura, H. (2004). Crystal
structure of the L intermediate of bacteriorhodopsin: evidence for vertical
translocation of a water molecule during the proton pumping cycle. J. Mol.
Biol. 335, 531–546.
Kuhlbrandt, W. (2000). Bacteriorhodopsin—the movie. Nature 406, 569–570.
Landau, E.M., and Rosenbusch, J.P. (1996). Lipidic cubic phases: a novel
concept for the crystallization of membrane proteins. Proc. Natl. Acad. Sci.
USA 93, 14532–14535.
Lanyi, J., and Schobert, B. (2002). Crystallographic structure of the retinal and
the protein after deprotonation of the Schiff base: the switch in the bacteriorho-
dopsin photocycle. J. Mol. Biol. 321, 727–737.
Lanyi, J.K., and Schobert, B. (2003). Mechanism of proton transport in bacte-
riorhodopsin from crystallographic structures of the K, L, M1, M2, and M20
intermediates of the photocycle. J. Mol. Biol. 328, 439–450.
Lanyi, J.K., and Schobert, B. (2006). Propagating structural perturbation inside
bacteriorhodopsin: crystal structures of the M state and the D96A and T46V
mutants. Biochemistry 45, 12003–12010.
Lanyi, J.K., and Schobert, B. (2007). Structural changes in the L photointer-
mediate of bacteriorhodopsin. J. Mol. Biol. 365, 1379–1392.
Luecke, H., Schobert, B., Richter, H.T., Cartailler, J.P., and Lanyi, J.K. (1999a).
Structural changes in bacteriorhodopsin during ion transport at 2 angstrom
resolution. Science 286, 255–261.
Luecke, H., Schobert, B., Richter, H.T., Cartailler, J.P., and Lanyi, J.K. (1999b).
Structure of bacteriorhodopsin at 1.55 A resolution. J. Mol. Biol. 291, 899–911.
Luecke, H., Schobert, B., Cartailler, J.P., Richter, H.T., Rosengarth, A., Nee-
dleman, R., and Lanyi, J.K. (2000). Coupling photoisomerization of retinal to
directional transport in bacteriorhodopsin. J. Mol. Biol. 300, 1237–1255.
Matsui, Y., Sakai, K., Murakami, M., Shiro, Y., Adachi, S., Okumura, H., and
Kouyama, T. (2002). Specific damage induced by X-ray radiation and struc-
tural changes in the primary photoreaction of bacteriorhodopsin. J. Mol.
Biol. 324, 469–481.
Nagel, G., Ollig, D., Fuhrmann, M., Kateriya, S., Musti, A.M., Bamberg, E., and
Hegemann, P. (2002). Channelrhodopsin-1: a light-gated proton channel in
green algae. Science 296, 2395–2398.
Neutze, R., Wouts, R., Techert, S., Davidsson, J., Kocsis, M., Kirrander, A.,
Schotte, F., and Wulff, M. (2001). Visualizing photochemical dynamics in solu-
tion through picosecond x-ray scattering. Phys. Rev. Lett. 87, 195508.
Neutze, R., Pebay-Peyroula, E., Edman, K., Royant, A., Navarro, J., and
Landau, E.M. (2002). Bacteriorhodopsin: a high-resolution structural view of
vectorial proton transport. Biochim. Biophys. Acta 1565, 144–167.
Oesterhelt, D., and Stoeckenius, W. (1971). Rhodopsin-like protein from the
purple membrane of Halobacterium halobium. Nat. New Biol. 233, 149–152.
1274 Structure 17, 1265–1275, September 9, 2009 ª2009 Elsevier L
Oka, T., Kamikubo, H., Tokunaga, F., Lanyi, J.K., Needleman, R., and Kataoka,
M. (1999). Conformational change of helix G in the bacteriorhodopsin photo-
cycle: investigation with heavy atom labeling and x-ray diffraction. Biophys.
J. 76, 1018–1023.
Oka, T., Yagi, N., Fujisawa, T., Kamikubo, H., Tokunaga, F., and Kataoka, M.
(2000). Time-resolved x-ray diffraction reveals multiple conformations in the
M-N transition of the bacteriorhodopsin photocycle. Proc. Natl. Acad. Sci.
USA 97, 14278–14282.
Oka, T., Yagi, N., Tokunaga, F., and Kataoka, M. (2002). Time-resolved X-ray
diffraction reveals movement of F helix of D96N bacteriorhodopsin during
M-MN transition at neutral pH. Biophys. J. 82, 2610–2616.
Oka, T., Inoue,K.,Kataoka,M., and Yagi, N. (2005). Structural transition ofbacte-
riorhodopsin is preceded by deprotonation of Schiff base: microsecond time-
resolved x-ray diffraction study of purple membrane. Biophys. J. 88, 436–442.
Palczewski, K., Kumasaka, T., Hori, T., Behnke, C.A., Motoshima, H., Fox,
B.A., Le Trong, I., Teller, D.C., Okada, T., Stenkamp, R.E., et al. (2000). Crystal
structure of rhodopsin: A G protein-coupled receptor. Science 289, 739–745.
Plech, A., Wulff, M., Bratos, S., Mirloup, F., Vuilleumier, R., Schotte, F., and
Anfinrud, P.A. (2004). Visualizing chemical reactions in solution by picosecond
x-ray diffraction. Phys. Rev. Lett. 92, 125505.
Rangarajan, R., Galan, J.F., Whited, G., and Birge, R.R. (2007). Mechanism of
spectral tuning in green-absorbing proteorhodopsin. Biochemistry 46, 12679–
12686.
Rouhani, S., Cartailler, J.P., Facciotti, M.T., Walian, P., Needleman, R., Lanyi,
J.K., Glaeser, R.M., and Luecke, H. (2001). Crystal structure of the D85S
mutant of bacteriorhodopsin: model of an O-like photocycle intermediate.
J. Mol. Biol. 313, 615–628.
Royant, A., Edman, K., Ursby, T., Pebay-Peyroula, E., Landau, E.M., and Neu-
tze, R. (2000). Helix deformation is coupled to vectorial proton transport in the
photocycle of bacteriorhodopsin. Nature 406, 645–648.
Royant, A., Nollert, P., Edman, K., Neutze, R., Landau, E.M., Pebay-Peyroula,
E., and Navarro, J. (2001). X-ray structure of sensory rhodopsin II at 2.1-A reso-
lution. Proc. Natl. Acad. Sci. USA 98, 10131–10136.
Sass, H.J., Schachowa, I.W., Rapp, G., Koch, M.H., Oesterhelt, D., Dencher,
N.A., and Buldt, G. (1997). The tertiary structural changes in bacteriorhodopsin
occur between M states: X-ray diffraction and Fourier transform infrared spec-
troscopy. EMBO J. 16, 1484–1491.
Sass, H.J., Buldt, G., Gessenich, R., Hehn, D., Neff, D., Schlesinger, R.,
Berendzen, J., and Ormos, P. (2000). Structural alterations for proton translo-
cation in the M state of wild-type bacteriorhodopsin. Nature 406, 649–653.
Scheerer, P., Park, J.H., Hildebrand, P.W., Kim, Y.J., Krauss, N., Choe, H.W.,
Hofmann, K.P., and Ernst, O.P. (2008). Crystal structure of opsin in its
G-protein-interacting conformation. Nature 455, 497–502.
Schobert, B., Cupp-Vickery, J., Hornak, V., Smith, S., and Lanyi, J. (2002).
Crystallographic structure of the K intermediate of bacteriorhodopsin: conser-
vation of free energy after photoisomerization of the retinal. J. Mol. Biol. 321,
715–726.
Schobert, B., Brown, L.S., and Lanyi, J.K. (2003). Crystallographic structures
of the M and N intermediates of bacteriorhodopsin: assembly of a
hydrogen-bonded chain of water molecules between Asp-96 and the retinal
Schiff base. J. Mol. Biol. 330, 553–570.
Seeliger, D., Haas, J., and de Groot, B.L. (2007). Geometry-based sampling of
conformational transitions in proteins. Structure 15, 1482–1492.
Stumpff-Kane, A.W., Maksimiak, K., Lee, M.S., and Feig, M. (2008). Sampling
of near-native protein conformations during protein structure refinement using
a coarse-grained model, normal modes, and molecular dynamics simulations.
Proteins 70, 1345–1356.
Subramaniam, S., and Henderson, R. (2000). Molecular mechanism of vecto-
rial proton translocation by bacteriorhodopsin. Nature 406, 653–657.
Subramaniam, S., Gerstein, M., Oesterhelt, D., and Henderson, R. (1993).
Electron diffraction analysis of structural changes in the photocycle of bacte-
riorhodopsin. EMBO J. 12, 1–8.
Subramaniam, S., Faruqi, A.R., Oesterhelt, D., and Henderson, R. (1997).
Electron diffraction studies of light-induced conformational changes in the
td All rights reserved

Structure
Structural Dynamics of Light-Driven Proton Pumps
Leu-93 –> Ala bacteriorhodopsin mutant. Proc. Natl. Acad. Sci. USA 94, 1767–
1772.
Subramaniam, S., Lindahl, M., Bullough, P., Faruqi, A.R., Tittor, J., Oesterhelt,
D., Brown, L., Lanyi, J., and Henderson, R. (1999). Protein conformational
changes in the bacteriorhodopsin photocycle. J. Mol. Biol. 287, 145–161.
Svergun, D., Barberato, C., and Koch, M.H.J. (1995). CRYSOL - a Program to
Evaluate X-ray Solution Scattering of Biological Macromolecules from Atomic
Coordinates. J. Appl. Crystallogr. 28, 768–773.
Takeda, K., Matsui, Y., Kamiya, N., Adachi, S., Okumura, H., and Kouyama, T.
(2004). Crystal structure of the M intermediate of bacteriorhodopsin: allosteric
Structure 17, 1265–12
structural changes mediated by sliding movement of a transmembrane helix.
J. Mol. Biol. 341, 1023–1037.
Tozzini, V. (2005). Coarse-grained models for proteins. Curr. Opin. Struct. Biol.
15, 144–150.
Vincent, J., Andersson, M., Eklund, M., Wohri, A.B., Odelius, M., Malmerberg,
E., Kong, Q., Wulff, M., Neutze, R., and Davidsson, J. (2009). Solvent depen-
dent structural perturbations of chemical reaction intermediates visualized
by time-resolved x-ray diffraction. J. Chem. Phys. 130, 154502.
Vonck, J. (2000). Structure of the bacteriorhodopsin mutant F219L N interme-
diate revealed by electron crystallography. EMBO J. 19, 2152–2160.
75, September 9, 2009 ª2009 Elsevier Ltd All rights reserved 1275


