Embed Size (px)
Citation preview

Strategic management practices of Sri Lankan commercial banks
HASALAKA EDIRISINGHE
BSc (Colombo University, Sri Lanka)
MBA (Deakin University, Melbourne, Australia) This thesis is submitted to the fulfilment of the requirements for the degree of Doctor of Business Administration Australian Graduate school of Entrepreneurship, Swinburne University of Technology, Australia.
2008

Declaration This thesis contains no material which has been accepted at any other
University for the award of a degree, and to the best of my knowledge and
belief, the thesis contains no material previously published or written by
another person or persons , except where due reference is made.
_________________________
Hasalaka Edirisinghe
AGSE Swinburne University of Technology Melbourne, Australia (March 2008)
i

Acknowledgements
The completion of this thesis was greatly assisted by a number of people, to whom I am
very grateful. Firstly, I would like to thanks Professor Chris Christodoulou for the
enthusiasm and trust he showed toward both myself and this project. His advice and
guidance were much appreciated throughout my research project and also during the
preparation of this thesis. You were a terrific supervisor. Thank you.
I would also like to thank my second supervisor Professor Chris Selvarajah for his
assistance throughout my research project.
A special mention of appreciation must go to all the senior bank executives who willingly
participated in this research study. Without your help this study might not have been
completed.
Finally, I must thank my father E.M.Jayasinghe and my mother Sumana Edirisinghe, for
their encouragement and assistance during my many years of study. You both have worked
really hard to provide me a good education. I love you and will be forever grateful.
ii

TABLE OF CONTENTS DECLARATION i ACKNOWLEDGEMENTS ii LIST OF ABBREVIATIONS xvi LIST OF TABLES xvii LIST OF FIGURES xxvi ABSTRACT xxxii PART ONE INTRODUCTION AND 1 BACKGROUND AND LITERATURE REVIEW Chapter 1 Introduction 2 1.1 Introduction 2 1.2 Background to the research 2
1.3 Research objectives 4
1.4 Research process 5 1.5 Structure of the thesis 7
1.6 Significance of the Research 9
Chapter 2 Background on Sri Lanka and the banking 11
industry in Sri Lanka 2.1 Introduction 11
2.2 Background on Sri Lanka 11
2.3 Financial sector in Sri Lanka 12
2.3.1 Central Bank of Sri Lanka 13
2.3.2 Supervision of Banks 14
2.3.3 Licensed commercial Banks (LCB) 15
2.3.4 Challenges faced by the Commercial banking sector 16
2.3.5 Risks being a Bank in Sri Lanka 17
2.4 Macro economic environment of Sri Lankan commercial 19 banks
2.5 Chapter Summary 20
iii

Chapter 3 Literature review 22 3.1 Introduction 22
3.2 The history of strategy 22
3.3 The definition of strategy 23
3.4 The evolution of strategic management 26
3.5 Strategy Levels 29
3.6 Strategic Management process 30
3.7 The Environment 32
3.7.1 External environment 33
3.7.1.1 General Environment 34
3.7.1.1.1 Political and legal environment 34
3.7.1.1.2 Demography 35
3.7.1.1.3 Socio-cultural 35
3.7.1.1.4 Economic 36
3.7.1.1.5 Technological 36
3.7.1.1.6 Global 37
3.7.1.2 Industry environment 37
3.7.1.2.1 Threat of entry 39
3.7.1.2.2 The threat of substitutes 40
3.7.1.2.3 Bargaining power of suppliers 40
3.7.1.2.4 Bargaining power of buyers 41
3.7.1.2.5 Rivalry among the existing competitors 41
3.7.1.3 Competitor analysis 42
3.7.2 Internal environment 43
3.7.2.1 Organizational structure 44
3.7.2.2 Organizational Ownership 46
3.7.2.3 Organizational Size 47
3.7.2.4 Organizational culture 48
3.7.2.4.1 Sub cultures 51
3.7.2.5 Management style 51
3.7.2.6 Stakeholder expectations 53
3.7.2.7 Resource base view of the company 56
iv

3.8 Strategic planning 58
3.8.1 Vision and Mission statements 60
3.8.2 Objectives and Goals 61
3.8.3 Analytical tools and techniques 62
3.9 Strategic thinking 65
3.10 Corporate level strategies 67
3.10.1 Diversification strategies 68
3.10.2 International strategy 71
3.10.3 Acquisitions and merger strategies 73
3.10.4 Research and development strategies 74
3.10.5 Turnaround strategies 75
3.10.6 Divestiture strategy 76
3.11 Chapter Summary 77 PART TWO THEORETICAL FRAMEWORK AND 79 METHODOLOGY Chapter 4 Theoretical framework and research questions 80 4.1 Introduction 80
4.2 Theoretical framework 80
4.3 Research questions 83
4.4 Summary 83 Chapter 5 Methodology 85 5.1 Introduction 85
5.2 Population definition 85
5.3 Survey Approach 85
5.3.1 Primary data 85
5.3.2 Secondary data 86
5.4 Instrument development 86
5.4.1 Pre-test of the questionnaire and the final questionnaire 87
5.5 Data collection procedure 88
5.5.1 Introductory letter and the letter of consent 89
5.5.2 Interview process 89
v

5.6 Response rate 90
5.7 Data analysis 90
5.8 Framework for analysis 91
5.9 Chapter Summary 93
PART THREE DATA ANALYSIS 94 Chapter 6 Characteristics of sample companies 95 6.1 Introduction 95
6.2 Industry participation 95
6.3 Respondent aspects 96
6.4 Ownership Aspects 97
6.5 Size aspects 97
6.6 Planning system aspects 100
6.7 Characteristics of the sample companies by 101 ownership, planning and size aspects
6.8 Chapter Summary 102 Chapter 7 Company structure, company 103
ownership and company size 7.1 Introduction 103
7.2 Organizational Structure 103
7.2.1 Organizational structure 104
7.2.2 Organizational levels 104
7.2.3 Number of units at corporate level 105
7.2.4 Highest positions at corporate level 105
7.2.5 Organizational units at second level 106
7.2.6 Highest positions at second level 106
7.2.7 Highest positions at third level 107
7.2.8 Second management level units 108
7.2.9 The lowest level of profit centre 108
7.2.10 Structural types 109
7.2.11 Structural changes in last five years 109
7.2.12 Important structural changes made 110 (during last five years)
vi

7.2.13 Main reasons for the structural changes 111
7.2.14 Applicability of the current organization structure 112 for the next five years
7.2.15 Major structural changes expected by the bank for the 113 next five years
7.3 Ownership 114
7.3.1 Changes in company ownership 116 (during last five years)
7.3.2 The main reasons for the changes in your 117 company’s ownership
7.3.3 The major factors that supported the above 117 ownership changes
7.3.4 Successful rate of the ownership changes 118
7.3.5 Strategic importance of the ownership changes 119
7.3.6 Expected ownership changes in next five years 119
7.4 Size of the Banks 120
7.4.1 Bank satisfaction on company performance 120 compared to their size
7.4.2 The main barriers faced by the banks to 121 enhance their bank size
7.5 Chapter Summary 122 Chapter 8 Organizational culture, management style and 124
stakeholder expectations 8.1 Introduction 124
8.2 Organizational culture 124
8.2.1 The importance of the management of the 124 organizational culture
8.2.2 Top management satisfaction with the current 125 organizational culture
8.2.3 The groups who influenced the company culture 125 (over the last five years)
8.2.4 The major characteristics of company culture 126
8.2.5 Most important actions on company culture 128
8.2.6 The nature of the cultural changes 130
8.2.7 The main reasons for the cultural changes 130
8.2.8 Major cultural changes made by the banks 132
vii

8.2.9 The major factors which supported the 134 cultural changes
8.2.10 Major factors which made cultural 136 changes difficult
8.2.11 The banks that experienced problems when 138 implementing cultural changes
8.2.12 Success of the company’s culture changes 139
8.2.13 Expected cultural changes by the commercial banks 140
8.2.14 Presence of sub cultures 141
8.2.15 The major reasons for development of sub cultures 142
8.2.16 Top management perception about the sub cultures 142
8.2.17 Top management preferences on company culture 143
8.2.18 The influence of company culture on 143 company strategies
8.3 Management style 144
8.3.1 Key characteristics of management style 144
8.3.2 The groups who influenced the management style 145
8.3.3 The effect of management style on follower’s 146 performance and job satisfaction
8.3.4 The influence of management style on 147 company performance
8.3.5 The influence of management style on 148 company strategies
8.3.6 The problems faced by the banks in their current 148 management style (over the last five years)
8.3.7 The major problems faced by the banks in their 149 current management style
8.3.8 The power distance between managers and 150 subordinates
8.3.9 Internal politics 150
8.3.10 Top management perception about the 151 internal politics
8.4 Stakeholder expectations 152
8.4.1 Major Stakeholder groups of the banks 152
8.4.2 Stakeholder expectations of the Sri Lankan banks 153
8.4.3 The level of top management interests aligned with 154 the overall stakeholders’ interests
viii

8.4.4 Company action on stakeholder groups 154
8.4.5 Stakeholder expectation influence on 155 company strategies
8.5. Current resources of the commercial banks 156
8.5.1 Major capabilities of the commercial banks 157
8.5.2 The capabilities which are crucial to the 159 success of the business
8.6 Chapter summary 160
Chapter 9 External environment 164 9.1 Introduction 164
9.2. Demand environments 164
9.3 Competitive environment 167
9.4 Competition and market share 169
9.5 Company customers 171
9.5.1 Company dependence on its major 100 customers 173
9.5.2 The percentage of banks revenues from their 100 174 largest customers
9.6 Company competitors 175
9.6.1 Competitors influence on company strategies 177
9.7 Company business and the government 178
9.8 Company suppliers (Sources of funds) 180
9.9 Company’s business sector 184
9.10 Political and legal environments 185
9.10.1 Current government’s involvement on 188 bank’s operations
9.10.2 Impact of Sri Lankan laws and regulations 189 on bank’s operations
9.11 Impact of Sri Lankan economy on banks operations 191
9.12 Impact of Sri Lankan social/cultural environments on 193 banks operations
9.13 The impact of technology available in Sri Lanka 194 on banks operations
9.14 Chapter Summary 195
ix

Chapter 10 Mission, vision and long term goals at corporate 199 and second levels
10.1 Introduction 199
10.2 Company mission statement 199
10.2.1 Stated elements in the mission statement 199
10.2.2 Influential groups on banks mission statements 200
10.2.3 Appropriateness of mission statements for the next 203 five years
10.3 Vision statement 204
10.3.1 Influential groups on formulating banks current vision 205 statement
10.4 Corporate long term goals 206
10.5 Second level long term goals 216
10.6 Chapter summary 221 Chapter 11 Planning and planning systems 224
11.1 Introduction 224
11.2 Planning systems 224
11.2.1 Relationship between plans 225
11.3 Corporate plans 225
11.3.1 Update and progress review of corporate plan 225
11.3.2 Effort spent on the types of planning activities 225
11.3.3 Forecast development 227
11.3.4 Major headings of corporate plan 232
11.3.5 Access to corporate plan 233
11.3.6 Computer models/systems to support 234
corporate planning
11.3.7 Corporate planning department 236
11.4 Second level planning 240
11.4.1 Major headings of second level long term plans 241
11.4.2 Computer models/system to support second 242
level planning
11.5 Third level and fourth level long term business plans 243
11.6 Contingency planning 243
x

11.7 Various functions of corporate planning 244
11.8 Nature of the banks planning process 247
11.9 Planning process and external analysis 250
11.10 Coordination issues involved in the banks 254 planning process
11.11 Personal involvement in the corporate 257 planning process
11.11.1 Roles of various personnel in the 258 planning process
11.12 Major problems of current planning process 261
11.13 Expected changes in the strategic management 261 approach
11.14 Importance of informal planning 262
11.15 Planning effectiveness 263
11.16 Contribution of formal planning 263
11.17 The extent that the banks strategically managed 264
11.18 Chapter summary 264
Chapter 12 Strategic thinking capabilities 268 12.1 Introduction 268
12.2 Employee participation and risk taking behaviour 268
12. 3 Systems perspective 269
12.4 Strategic intent 270
12.5 Thinking in time 271
12.6 Intelligent opportunism 272
12.7 Classification for strategic thinkers 273
12. 8 Chapter summary 274
Chapter 13 Analytical tools/ techniques, corporate strategies 277 and the management of quality
13.1 Introduction 277
13.2 Analytical tools and techniques which influence bank’s 277 strategies
13.2.1 Environment and resource analysis techniques 277 (over the last five years)
xi

13.2.2 Planning techniques (over the last five years) 278
13.2.3 Environment and resource analysis techniques 279 (over the next five years)
13.2.4 Planning techniques (over the next five years) 281
13.3 Benchmarking 282
13.3.1 Benchmark groups 282
13.3.2 Major dimensions of banks benchmark process 283
13.4 Resource allocation decisions 284
13.4.1 The importance of criteria in evaluating expenditure 285 proposals
13.5 Corporate strategies 287
13.5.1 Product/market growth strategies 288
13.5.1.1 Company’s strategies concerning new products 290 and service introductions
13.5.1.2 Organizational responsibility for new products 291 and markets
13.5.2 Research and development strategies 292
13.5.2.1 Support staff for R& D strategies 293
13.5.3 International strategies 294
13.5.4 Acquisition strategies 298
13.5.5 Divestiture strategies 300
13.5.6 Merger strategies 302
13.5.7 Turnaround strategies 304
13.6 Management of quality 306
13.6.1 Strategic approaches towards the quality in banks 307
13.6.2 Personnel responsible for addressing the major 308 strategic quality issues
13.6.3 The extent that the employees are involved 309 in the quality approach
13.6.4 Total quality management strategies 310
13.7 Chapter Summary 312
xii

PART FOUR COMPARISONS WITH 315 PREVIOUS STUDIES AND THE MAJOR RESEARCH FINDINGS
Chapter 14 Comparison with previous studies 316 14.1 Introduction 316
14.2 Background of the previous studies 316
14.3 Formalized strategic planning 317
14. 3.1 Relationship between plans 317
14.3.2 Corporate planning effort 318
14.3.3 Corporate planning effort spent on Forecasting 319
14.3.4 Use of computer models/systems 320
14.3.5 Nature of corporate planning 321
14.4 Chapter summary 325
Chapter 15 Major research findings and further 328 research directions
15.1 Introduction 328
15.2 Major Research findings of the research 328
15.2.1 Research question 1 328
15.2.1.1 Respondents characteristics 329
15.2.1.2 Vision and mission statements 329
15.2.1.3 Long term goals at corporate and second level 330
15.2.1.4 Corporate strategies and processes 331
15.2.2 Research question 2 332
15.2.2.1 Organizational structure 332
15.2.2.2 Ownership 333
15.2.2.3 Size 333
15.2.2.4 Organizational Culture 333
15.2.2.5 Management style 334
15.2.2.6 Stakeholder’s expectation 335
15.2.2.7 Resources, capabilities and key success factors 335
xiii

15.2.3 Research question 3 336
15.2.3.1 Demand environment 336
15.2.3.2 Competitive environment 336
15.2.3.3 Industrial factors 337
15.2.3.3.1 Competition and market share 337
15.2.3.3.2 Major customers 337
15.2.3.3.3 Company suppliers 337
15.2.3.3.4 New entrants 338
15.2.3.4 General environmental factors 338
15.2.3.4.1 Political and legal factors 338
15.2.3.4.2 Economic factors 338
15.2.3.4.3 Social cultural factors 339
15.2.3.4.4 Technology factors 339
15.2.4.1 Research question 4 part1 339
15.2.4.1.1 Strategic planning at corporate level 339
15.2.4.1.2 Strategic planning at second level 342
15.2.4.1.3 Contingency planning 342
15.2.4.1.4 Third level and fourth level planning 342
15.2.4.2 Research question 4 part 2 343
15.2.5 Research question 5 344
15.2.5.1 Company structure 344
15.2.5.2 Organizational culture and management style 344
15.2.5.3 Mission and Vision statements 345
15.2.5.4 Long term goals 346
15.2.5.5 Planning and planning systems 347
15.2.5.6 Corporate strategy and processes 350
15.2.5.7 Management of quality 351
15.2.6 Research question 6 351
15.3 The unique features associated with different 352 categories of banks
15.3.1 Government banks 352
15.3.2 Locally owned banks 354
15.3.3 Foreign owned banks 357
15.3.4 Large banks 359
xiv

15.3.5 Medium sized banks 362
15.3.6 Small sized banks 364
15.4 The unique features associated with strategic 366 management practices in Sri Lankan banks
15.5 Significance of the study 367
15.5.1 Contribution to theory 367
15.5.2 Contribution to practice 368
15.5.3 Contribution to the methodology 368
15.6 Limitations of the study 368
15.7 Future directions 369
15.8 Chapter Summary 369
References 370
Appendix 1: Research questionnaire 389
Appendix 2: Introductory letter and letter of consent 495
xv

LIST OF ABBREVIATIONS & And % Percentage П Mean/Average etc et cetera F Foreign owned G Government owned L Large banks LO Locally owned banks M Medium sized banks N Number S Small sized banks T Total CBSL Central Bank of Sri Lanka FSP Formalized strategic planning MST Moderate strategic thinkers MSBU Multiple strategic business units NFSP Non formalized strategic planning NPL Non performing loans SLSM Sri Lanka stock market SSBU Single strategic business units SST Strong strategic thinkers WST Weak strategic thinkers
xvi

LIST OF TABLES Table 2.1: Core functions of the Central Bank 14 Table 2.2: Financial indicators of the LCB’s 16 Table 2.3: Economy Growth prospects 20 Table 3.1: Mintzberg’s ten schools for strategy 26 Table 3.2: The evolution of the research about leadership 52 Table 3.3: Core arguments for stakeholder responsibility 55
and its practical implications
Table 3.4: Checklist for the PEST analysis 62 Table 3.5: Firm capabilities and diversification strategies 70 for different country resource environments Table 6.1: Banks that participated in this study 95 Table 6.2: Respondents job titles 96 Table 6.3: Description of the three categorize in 97 ownership aspects Table 6.4: Ownership characteristics of the participating 97 companies in terms of ownership aspects Table 6.5: Of these size measures, is one of these 99 considered most important? Table 6.6: Most important size measures of the 99 participating bank Table 6.7: Classification for size aspects 100 Table 6.8: Participating banks in terms of size aspects 100 Table 6.9: Does your company have a formalized 101 strategic planning system at the corporate level? Table 6.10: Characteristics of the sample companies 101 by ownership, planning and size aspects Table 7.1: Could you please provide us with an 103 organization chart of your company?
xvii

LIST OF TABLES (CONTINUED) Table 7.2: Organizational structure 104 Table 7.3: Organizational levels 105 Table 7.4: Number of units at corporate level 105 Table 7.5: Highest positions at corporate level 106 Table 7.6: Organizational units at second level 106 Table 7.7: Highest positions at the second level 107 Table 7.8: Highest positions at the second level 107 Table 7.9: Are the second management level units 108 defined as profit centres? Table 7.10: The lowest level of profit centre 108 Table 7.11: Structural type 109 Table 7.12: Organizational structure changed during last five years 110
Table 7.13: Year of structural change 110 Table 7.14: Important structural changes made 111 (during last five years) Table 7.15: The main reasons for the structural changes 112 Table 7.16: Applicability of the current organizational structure 113 Table 7.17: Major structural changes expected by the 114 banks for the next five years Table 7.18: Bank sell its shares in SLSM 115 Table 7.19: Shareholder pattern of the commercial banks 115
listed under SLSM Table 7.20: Company sell its shares in overseas stock market 115 Table 7.21: Changes in company ownership (during last five years) 116 Table 7.22: The main reasons for the changes in your company’s ownership 117
Table 7.23: The major factors that supported the above ownership changes 118
Table 7.24: Changes in company ownership (For the next five years) 120
xviii

LIST OF TABLES (CONTINUED) Table 7.25: Do you think you need to enhance the size 121 of your bank to gain more profits? Table 7.26: The main barriers that you have to enhance your bank’s size 122 Table 8.1: The major characteristics of company culture 127 Table 8.2: The banks which changed their company cultures 130 (over the last five years) Table 8.3: The nature of the cultural changes 130 Table 8.4:The main reasons for the company culture changes 131 Table 8.5: Major cultural changes made by the banks 133 (over the last five years) Table 8.6: The major factors which supported the cultural changes 135 Table 8.7: Major factors which made cultural changes difficult 136 Table 8.8: The banks which experienced the problems when 138 implementing cultural changes Table 8.9: The problems experience by the banks 138 when implemented cultural changes Table 8.10: Do you expect any major changes in your 140 company’s culture in the next five years? Table 8.11: Expected major culture changes by the Sri Lankan 141 commercial banks Table 8.12: Do you have sub cultures in your company? 141 Table 8.13: The major reasons for development of sub cultures 142 Table 8.14: Do you think development of subcultures weaken 143 or undermine the organization? Table 8.15: Preferred types of company cultures 143 Table 8.16: Key characteristics of management style 145 Table 8.17: The banks which are having significant problems 148 with its current management style
xix

LIST OF TABLES (CONTINUED) Table 8.18: The major problems faced by the banks 149 in their current management style Table 8.19: Major Stakeholder groups 152 Table 8.20: Stakeholder expectations 153 Table 8.21: Current recourses of the commercial banks 157 Table 8.22: Major capabilities of the commercial banks 158 Table 8.23: The capabilities which are crucial to the success 160 of the business in the Sri Lankan banking sector Table 9.1: Predictability of bank’s revenues/sales 165 (during last five years) Table 9.2: Predictability of bank’s revenues/sales 165 (for the next five years) Table 9.3: Market growth rates of the banks sales/revenues 166 (last five years) Table 9.4: Market growth rates of the banks sales/revenues 166 (next five years) Table 9.5: Competitive environment 167 (During last five years) Table 9.6: Predictability of the banks competitor environments 168 (last five years) Table 9.7: Predictability of the banks competitor environments 169 (next five years) Table 9.8: Most important markets 170 (during last five years) Table 9.9: Most important markets 171 (during next five years) Table 9.10: Major customer groups 172 (last five years)
xx

LIST OF TABLES (CONTINUED) Table 9.11: Major customer groups for the next five years 173 Table 9.12: The percentages of average banks revenues 175 from their 100 largest customers in terms of ownership and size aspects Table 9.13: Banks major competitors 176 (for the last five years) Table 9.14: Banks major competitors 177 (for the next five years) Table 9.15: Government regulations on banks businesses 178 Table 9.16: Changes expected by the banks 179 in the government regulations Table 9.17: Major sources of funds (last five years) 180 Table 9.18: Major sources of funds (next five years) 181 Table 9.19: Main categories which banks major sources 183 of funds felt into (last five years) Table 9.20: Main categories which banks major sources 183 of funds felt into (next five years) Table 9.21: Possible new entrants to the banking industry 184 Table 9.22: Current impacts of the Sri Lankan government 187 policies on bank’s operations
Table 9.23: Current government’s involvement on bank’s operations 189 Table 9.24: Current impacts of the Sri Lankan laws 191 and regulations on bank’s operations Table 9.25: Current impact of the Sri Lankan 192 economy on bank’s operations Table 9.26: Current impacts of the Sri Lankan 194 social cultural environment on bank’s operations
xxi

LIST OF TABLES (CONTINUED) Table 9.27: Current impacts of the available technology 195 in Sri Lanka on bank’s operations Table 10.1: Does your banks have a mission statement? 199 Table 10.2: Stated elements in mission statement 200 Table 10.3: Changes made by the banks 202 Table 10.4: Average years that the banks will 204 continue their current mission statements Table 10.5: Characteristics of vision statement 205 Table 10.6: Average years that the banks will continue 206 their current vision statements Table 10.7: Does your bank has corporate long term goals 207 Table 10.8: Quantitative long term goals 207 Table 10.9: Does your bank has qualitative goals? 208 Table 10.10: Qualitative long term goals 208 Table 10.11: Processes of formulating banks long-term goals 210 Table 10.12: Have your corporate level goals changed 212 in the last five years Table 10.13: Major changes made by the banks 213 Table 10.14: Banks continuation periods of the current goals 214
Table 10.15: Does your banks have second level long term goals 216 Table 10.16: Units of measurements 217 Table 10.17: Banks processes for formulating 219 second level long term goals
xxii

LIST OF TABLES (CONTINUED) Table 11.1: The banks which had planning systems at corporate level 224 Table 11.2: Banks which had a planning system at second level 224 Table 11.3: Relationship between the plans 225 Table 11.4: Update of corporate plans 226 Table 11.5: Frequency of reviewing the progress of corporate plans 226 Table 11.6: Banks which purchased external forecasts 229 Table11.7: Major headings of corporate long range plan 232 Table 11.8: Organizational personnel who have access to banks corporate 233
plan Table 11.9: The models and systems used by the banks for 235 their corporate planning Table 11.10: Banks which had a corporate planning department 237 Table 11.11: Document used by the corporate planning department 240 Table 11.12: Does your bank has second level long term plans? 240 Table 11.13: Major headings of second level long term plans 241 Table 11.14: Organizational levels that has contingency planning 244 Table 11.15: Banks expected changes in the strategic management 262 approaches in the next five years Table 12.1: Classification for the strategic thinkers 273 Table 12.2: Categorized strategic thinking capabilities of size 274 and ownership aspects Table 12.3: Overall strategic thinking capabilities of the banks 275 Table 13.1: Three major dimensions of banks benchmarking process 284 Table 13.2: Supporting staff of R& D strategies 293 Table 13.3: Percentage of revenue allocations 294
xxiii

LIST OF TABLES (CONTINUED) Table 13.4: Does your company have international operations? 294 Table 13.5: Bank’s revenues take place outside Sri Lanka 295 Table 13.6: Three major business types of overseas revenues 295 Table 13.7: Three most important overseas markets of the banks 296 (Over the last five years) Table 13.8: Major reasons overseas markets were chosen 296 Table 13.9: Three most important overseas markets of the banks 297 (Over the next five years) Table 13.10: Did your bank make any significant acquisitions 299 during last five year? Table 13.11: Banks which divested, liquated or eliminated any 300 important operations Table 13.12: Banks which merge with other companies 302 Table 13.13: Has your company made any significant turnarounds 304 in the last five years? Table 13.14: Strategic approach towards quality in the banks 307 Table 13.15: Personals responsible for addressing the major 308 strategic quality issues Table 14.1: Population and the sample size of the current and previous 316
studies Table 14.2: Percentages of formal and non formal planners 317
Table 14.3: Relationship between corporate and short term plans 318
Table 14.4: Corporate planning effort spent on different planning activities 319
Table 14.5: Corporate plan effort spent in forecasting areas 319
Table 14.6: Forecast transmission from corporate to second level 320
Table 14.7: The models and systems used by the companies for 321 their corporate planning
xxiv

LIST OF TABLES (CONTINUED)
Table 14.8: Nature of corporate planning process 322
Table 14.9: Corporate planning co-ordination with other planning 322
Table 14.10: Various functions of the corporate planning 323
Table 14.11: Corporate Planning effort put on external analysis 324
Table 14.12: Quality of information received from various departments 325 for corporate planning
xxv

LIST OF FIGURES Figure 1.1: Research process 6
Figure 2.1: Geography of Sri Lanka 11
Figure 3.1: Generic Perspectives on strategy 24
Figure 3.2: The strategy making Pyramid 30 Figure 3.3: Elements of strategic management 32
Figure 3.4: Elements of industry structure 39
Figure 3.5: Components of competitor analysis 43
Figure 3.6: The reciprocal influence view of strategy and 50 environment as moderated by organizational culture Figure 3.7: Stakeholder categories 56
Figure 3.8: Relationship between company resources 58 and core competencies Figure 3.9: The BCG matrix 65
Figure 3.10: The elements of strategic thinking 67
Figure 4.1: Theoretical Framework (strategic management processes) 82 Figure 5.1: Framework for analysis 92 Figure 6.1: Size measures 98 Figure 7.1: Successful rate of ownership change (over the last five years) 118
Figure 7.2: Strategic importance of the ownership changes 119 (Over the last five years)
Figure 7.3: Bank satisfaction level on company performance 120 compared to their size Figure 8.1: Importance of the management of company culture 124 Figure 8.2: Top management satisfaction with the 125 current organizational culture Figure 8.3: The groups who influenced the culture 126 (over the last five years) Figure 8.4: Most important actions on company culture 128
xxvi

LIST OF FIGURES (CONTINUED)
Figure 8.5: Success of the company’s culture changes 139 Figure 8.6: The influence of company culture on company strategies 144 Figure 8.7: The groups who influenced the management style 146 Figure 8.8: The effect of management style on 147 follower’s performance and job satisfaction Figure 8.9: The influence of management style on company performance 147
Figure 8.10: The influence of management style on company strategies 148 Figure 8.11: The power distance between managers and subordinates 150 Figure 8.12: The level of internal politics in Sri Lankan commercial banks 151 Figure 8.13: Top management perception about the internal politics 151
Figure 8.14: The level of top management interests 154 aligned with the overall stakeholders’ interests Figure 8.15: Company action on stakeholder groups 155 Figure 8.16: Influence of stakeholder expectations on company strategies 155 Figure 9.1: Company dependence on its major 100 customers 174 Figure 9.2: Competitors influence on company strategies 178 Figure 9.3: Satisfaction levels of the banks on government regulations 179 Figure 9.4: Dependency levels of the banks on their major sources of funds 182 Figure 9.5: Difficulty of entry into banking businesses 185 Figure 9.6: The extent government policies impact on banks operations 186
Figure 9.7: Government involvements in banks operations 188
Figure 9.8: Impact of Sri Lankan laws and regulations on bank’s operations 190 Figure 9.9: The impact of the Sri Lankan economy on bank’s 192 operations
xxvii

LIST OF FIGURES (CONTINUED)
Figure 9.10: The impact of Sri Lankan social/cultural 193 environment on bank’s operations Figure 9.11: The impact of technology available in 194 Sri Lanka on bank’s operations Figure 10.1: Influential groups on formulating banks 201 current mission statement Figure 10.2: Major factors that influenced the changes in banks 202
mission statements Figure 10.3: Appropriateness of mission statements for the next five years 203 Figure 10.4: Influential groups on formulating banks current vision 206
statements
Figure 10.5: Groups influence on the formulation of banks long-term goals 209
Figure 10.6: Important roles of corporate long term goals 212
Figure 10.7: Factors influenced the changes of banks corporate level goals 214
Figure 10.8: Banks achievement of their corporate goals 215 (during last five years)
Figure 10.9: Major reasons for banks achievements 216
Figure 10.10: The groups who influenced the formulation of second 218
level long term goals
Figure 10.11: Major roles of the second level long term goals 220
Figure 10.12: Quality of the second level long term goals 220 Figure 11.1: Effort spent on the types of planning activities 227 Figure 11.2: Effort expended by corporate 228 planning in forecast development Figure 11.3: Transmission of forecasts from corporate 230 level to second level
Figure 11.4: Impact on the corporate planning if external forecasts 231
purchased were not available
xxviii

LIST OF FIGURES (CONTINUED) Figure 11.5: Difficulty faced by the second level units 231 to obtain information they currently receive from the corporate planning Figure 11.6: Added value of the corporate plan over 234 the second level plans Figure 11.7: Use of computer models/systems to support 235 corporate planning Figure 11.8: The usefulness of computer models/systems 236 for corporate planning Figure 11.9: The extent that line personnel were rotated 237 through the corporate planning department Figure 11.10: Extent of chief corporate planner attend meetings 238 Figure 11.11: The authority of the corporate planning department 238 Figure 11.12: The performance of the corporate planning group 239 Figure 11.13: The extent annual budgets for the second level units 242 were integrated with the long term plans of these units Figure 11.14: Use of computer models/system to support 242 second level planning Figure 11.15: Usefulness of computer models/systems 243 Figure 11.16: Various functions of corporate planning 245 Figure 11.17: Nature of the banks planning process 248
Figure 11.18: Planning process and external analysis 251 Figure 11.19: Coordination issues involved in the banks planning process 255 Figure 11.20: CEO’s personal involvement in the corporate 257 planning process Figure 11.21: Board of director’s involvement in the corporate 257 planning process
xxix

LIST OF FIGURES (CONTINUED)
Figure 11.22: How supportive the board of directors regarding 258 corporate planning activities Figure 11.23: Roles of various personnel in the planning process 259 Figure 11.24: Importance of informal planning 262 Figure 11.25: Planning effectiveness of the banks 263 Figure 11.26: Contribution of formal planning 263 Figure 11.27: The extent that the banks strategically managed 264 Figure 12.1: Employee’s participation and their risk taking behaviors 269 Figure 12.2: The relationship of the interdependencies included in the 270
banks value creation process Figure 12.3: Strategic intent 271 Figure 12.4: Banks thinking in time 272 Figure 12.5: Intelligent opportunism 273 Figure 13.1: The influence of environment and resource analysis techniques 278 (over the last five years) Figure 13.2: The influence of Planning techniques (over the last five years) 279 Figure 13.3: The influence of environment and resource analysis techniques 280 (over the next five years) Figure 13.4: The influence of Planning techniques (over the next five years) 281 Figure 13.5: Influence of benchmarking on banks strategies 282 (over the last five years) Figure 13.6: Benchmark groups and the level of benchmarking 283 Figure 13.7: The importance of the long-term resource allocation decisions 285 Figure 13.8: The importance of criteria in evaluating expenditure proposals 286 Figure 13.9: Formalization of corporate strategies 287
xxx

LIST OF FIGURES (CONTINUED) Figure 13.10: The explicit part of banks corporate strategies 288 Figure 13.11: Product/market growth strategies 289 Figure 13.12: Company’s strategies concerning new products and service 290 introductions Figure 13.13: Organizational responsibility for new products and markets 291 Figure 13.14: Research and development strategies 292 Figure 13.15: Global orientation and the international strategies 298 Figure 13.16: Acquisition strategies 299 Figure 13.17: Acquisition strategies (next five years) 300 Figure 13.18: Major reasons for divestitures strategies 301 Figure 13.19: Future roles of divestiture strategies 302 Figure 13.20: Major aims of mergers 303 Figure 13.21: Future roles of merger strategies 304 Figure 13.22: Turnaround strategies 305 Figure 13.23: Future roles of turnaround strategies 305 Figure 13.24: The importance of management of quality 306 Figure 13.25: The extent that the management of quality 306 addressed as a strategic issue Figure 13.26: The extent that the employees are involved in 309 the quality approach Figure 13.27: Total quality management strategies 310
xxxi

ABSTRACT Strategic management addresses the question of why some organizations succeed and
others fail. While the field of strategic management has developed rapidly, no one has
attempted to investigate the strategic management practices of a particular industry in Sri
Lanka. Hence, this research aims to explore the strategic management practices of the Sri
Lankan commercial banks and to provide original knowledge about the strategic
management practices of a particular industry in a developing country.
Licensed commercial banks dominate the financial sector in Sri Lanka and as at 31st
December 2005 there were 22 commercial banks operating in Sri Lanka. The Banking
sector has shown a significant expansion during the last five years. Despite the significant
expansion, the banking industry in Sri Lanka is currently going through a period of rapid
change due to new products and services being introduced by the banking industry as a
result of globalization and the adoption of new technologies. Therefore, an exploration of
the current strategic management practices of the Sri Lankan commercial banks will be
extremely important for every commercial bank in the Sri Lankan banking industry.
The prominent authors in the field of strategic management fall in to two main categories in
the way they look at strategy, namely the “strategic planning” or the “strategic thinking”
approach. This study aims to investigate both the strategic planning and the strategic
thinking capabilities of the Sri Lankan commercial banks. However, the major priority of
this research is to investigate the strategic planning practices which are currently playing a
major role in the strategic management practices of the Sri Lankan commercial banks.
Because of the exploratory nature of the study research objectives were stated instead of
research hypotheses. The large number of variables that were expected to be investigated in
this study, together with no prior knowledge about how the variables would behave in the
Sri Lankan banking industry meant that this study was developed around key research
questions. The theoretical framework for this study is based predominately on previous
research studies but was adapted to the Sri Lankan banking industry and in accord with the
major research questions of this research study.
xxxii

Except for one commercial bank all the commercial banks in Sri Lanka participated in this
study, a response rate of 95.5%. The primary data was collected through personal
interviews using a questionnaire with senior executives who were responsible for their
corporate planning. The respondents were categorized according to ownership, size, and
planning system aspects.
Except for one bank all the banks had a formalized strategic planning system at their
corporate level. Thus, whether it is a large, medium or small sized bank strategic planning
systems played a major role in these banks strategic management processes. However, the
top management of most of these banks were also aware of the importance of having strong
strategic thinking capabilities. It would appear that the banks preferred to have formalized
strategic planning systems and also seek to develop strategic thinking capabilities.
Overall banks spent most of their strategic planning effort on action planning or operational
planning for the next 1 to 3 years. Most of the effort spent on forecast development was in
the areas of domestic economy, laws and regulations for the financial services sector,
industry level demand, and competitive analysis and in these areas the forecasts were
transmitted to a reasonably high degree from corporate level to second level. The
responsibilities for a number of strategic analyses were decentralized to the operations,
marketing and second level managers to some degree but the corporate level was mainly
responsible for competitive, supplier, customer, political, social and cultural analyses
whereas operations people were mainly responsible for technological analyses.
The medium sized, large, locally owned and government owned banks were identified as
being moderate strategic thinkers whereas the small sized and foreign owned banks were
identified as being weak strategic thinkers. There were no strong strategic thinkers
identified amongst the banks. Strategic thinking capabilities such as strategic intent and
intelligent opportunism were identified as low in most banks. Thus, there is much room to
improve the strategic thinking capabilities of Sri Lankan commercial banks.
Corporate strategies such as mergers, acquisitions, and divestitures did not play a major
role in most banks corporate planning during the last five years and are also not expected to
play a significant role in the next five years. However, a reasonable number of banks had
executed turnaround strategies during the last five years. Benchmarking has also played a
xxxiii

reasonably high role in these banks during the last five years. The management of quality is
also considered as important and is being addressed as a strategic issue to a great extent.
There are number of significant contributions from of this research study. First, this study
has identified and discussed the overall strategic management characteristics of Sri Lankan
commercial banks and their expected changes to their strategic management practices in
the next five years. This will also help corporate level managers in Sri Lankan commercial
banks to compare their strategic management practices with other banks. Secondly, the
theoretical framework developed for this study provides the foundation for other research
studies to potentially investigate the strategic management practices of other industries in
Sri Lanka. Finally, the database developed in this study will help other researchers who
plan to do further research into Sri Lankan commercial banks.
xxxiv

PART ONE INTRODUCTION AND BACKGROUND TO THE RESEARCH AND LITERATURE REVIEW Chapter 1: Introduction Chapter 2: Background on Sri Lanka and the banking industry in Sri Lanka Chapter 3: Literature review
1

Chapter 1: Introduction 1.1 Introduction This chapter will discuss the background to the research, research objectives, research
process, structure of the thesis, and the significance of the research.
1.2 Background to the research
The development of the field of strategic management within the last two decades has
been dramatic (Hoskisson, Hitt, Wan & Yiu 1999) and it grows larger every day.
Because of the nature of the strategy it does not contain universal truths that can be
documented through scientific theorems and proofs (Chinowsky & Byrd 2001).
According to Anand & Singh (1997) a significant amount of the empirical studies in
strategy were concerned about the scope of the firm and its performance implications.
However, strategic management generally addresses the question of why some
organizations succeed or fail, and it covers the causes for company’s success or failure
(Porter 1991). While the field of strategic management developing rapidly, no one has
attempted to investigate the strategic management practices of a particular industry in
Sri Lanka. This research aims to explore the strategic management practices of the Sri
Lankan commercial banks and therefore, it will provide insight knowledge about the
strategic management practices of a particular industry in a developing country.
Licensed commercial banks dominate the financial sector in Sri Lanka and as at 31st
December 2005 there were 22 commercial banks operating in Sri Lanka (Central Bank
2005a). The Banking sector has shown a significant expansion during the first half of
2007 and that includes an increase in assets, loans and deposits by 203 billions rupees
which was a 9.5% increase compared to the previous year (Central Bank 2007). Despite
the significant expansion, the banking industry in Sri Lanka is currently going through a
period of rapid change due to new products and services introduced by banking industry
as a result of globalization and the adoption of new technologies. Therefore, exploring
the current strategic management practices of the Sri Lankan commercial banks will be
extremely important for every bank in the Sri Lankan banking industry.
2

Since no organization has unlimited resources, strategists must decide which alternative
strategies benefit the firm most (Fred 1997).Thus, a strategy “reflects managerial
choices among alternatives and signals organizational commitment to particular
products, markets, competitive approaches, and ways of operating the enterprise”
(Thompson & Strickland 2003, p10). Furthermore, different organizations in different
environments are likely to emphasize different aspects of the strategic management
process (Johnson & Scholes 1999). Therefore, investigating the strategic management
practices in Sri Lankan commercial banks, which no one has attempted earlier, is simply
not an easy task.
The major argument in the field of strategic management during last three decades was
whether the strategic management process must be a planning or a thinking process.
Wilson (1998) identifies that, during last three decades strategic planning has been an
on again and off again affair for most companies, even though the need for strategic
thinking has increased rather than decreased. The data from the studies conducted by
Christodoulou (1984), Bonn (1996) showed that in Australian large companies strategic
planning plays a major role however, it has undergone substantial changes since the
early 1980s (Bonn & Christodoulou 1996). Taylor (1997) asserts that strategic planning
is back but, with changes like Mintzberg would have wanted such as less bureaucracy,
more emphasis on implementation and innovation, and fewer staff planners etc.
Therefore, despite its criticism strategic planning still plays a major role in firms.
Collis & Montgomery (1995) assert that because of global competition and
technological changes the markets move faster and faster and that strategic planning is
too static and too slow to adopt the new strategies which match to environmental
changes. Mintzberg (1994) thinks strategic planners should not create strategies but,
they can supply data to help managers think strategically. Mintzberg (1994) further
believes strategic thinking as a synthesizing process, that involves intuition and
creativity, whose outcome is “an integrated perspective of the enterprise”. Simpson
(1998) claims strategic planning is a waste of time because of number of reasons such
as it focuses more attention on the market than on competition, set aggressive top-down
targets instead of developing bottom up financial forecasts etc.
3

Liedtka (1998) asserts “it is individual who think strategically not organizations and in
order to think strategically individuals require a supporting context to manage the
strategic conversations that occur within it and therefore, strategic planning systems can
play an important role in this process”. Thus, companies can have formalized strategic
planning systems and they also can encourage the strategic thinking capabilities inside
their organizations. This study aims to investigate both the strategic planning and the
strategic thinking capabilities of the Sri Lankan commercial banks. However, the major
priority of this research is to investigate the strategic planning practices which are
currently playing a major role in strategic management practices of the Sri Lankan
commercial banks. Christodoulou (1984), Bonn (1996), Nimmanphatcharin (2002),
Kakanamveetil (2004), and Angkasuvana (2005) questionnaires will be redeveloped and
redesigned so as to investigate the Sri Lankan commercial banks strategic planning
practices, and Liedtka’s (1998) elements of strategic thinking model will be used to
analyze their strategic thinking capabilities. Research objectives will be developed
instead of research hypotheses because of the exploratory nature of this research study.
1.3 Research objectives
This research study seeks to explore the strategic management practices of the Sri
Lankan commercial banks and all the major areas of the banks strategic management
activities will be covered. The major objectives of this research are given below.
• To develop a theoretical framework to explore the strategic management
practices in Sri Lankan commercial banks based predominately on the research
conducted by Christodoulou (1984), Bonn (1996), Nut-tapon (2002),
Kakanamveetil (2004), and Angkasuvana (2005).
• To investigate the current strategic management practices of the Sri Lankan
commercial banks and to also identify the future (for the next five years)
strategic management practices that the commercial banks in Sri Lanka expect to
adopt to compete with the other banks in the Sri Lankan banking industry.
• To identify the major internal and external factors that can affect the banks
strategic management practices. The internal environmental factors will include
factors such as ownership, size, planning systems, organizational culture,
4

management style, stakeholder expectations and key capabilities etc. and the
external factors will include factors such as demand environment, suppliers,
political, economic, social, and technological environments etc.
• To investigate the strategic management practices by investigating the banks
strategic planning and strategic thinking capabilities.
• To compare the strategic management practices of Sri Lankan commercial banks
with the studies done in other countries so as to find out the differences of the
strategic management practices between the commercial banks in Sri Lanka and
the companies in other countries.
• To create a data base that will helpful for the future researchers who are willing
to do more research into the Sri Lankan commercial banks.
1.4 Research process
Figure 1.1 illustrates the research process of this research study which aims to explore
the strategic management practices of the Sri Lankan commercial banks. As at 31st
December 2005 there were 22 commercial banks doing business in Sri Lanka and all
those banks were selected as the population for this study. The first step of this research
is to study the banking industry in Sri Lanka and find out the external environmental
factors that can affect their practices. Then a literature review about the field of strategic
management will be undertaken and the literature review will identify the important
concepts and the issues in the field of strategic management important for this study.
Then the theoretical framework will be developed to address the major research
questions and it will be mainly based on the previous research conducted by
Christodoulou (1984), Bonn (1996), Nimmanphatcharin (2002), Kakanamveetil (2004),
and Angkasuvana (2005). Development of the questionnaire will be the next step and
the primary data will be collected through the personal interviews with the senior
executives who are responsible for their (banks) corporate planning. SPSS software will
be used for the primary data analysis and the interpretation of the data will be the next
step. The major research findings of this study will be compared with the major research
findings of the research carried out in other countries. Then the unique features of the
strategic management practices by ownership and size aspects and the unique features
of the strategic management practices in Sri Lankan commercial banks will be
5

summarized. Finally, limitations and the possible directions for future research will be
mentioned.
Figure 1.1 Research process
Study the Sri Lankan banking industry in Sri Lanka and find out the external factors that affect the Strategic management practices of the commercial banks
Literature Review and development of theoretical framework
Development of questionnaire
Data analysis and data interpretation
Compare the major research finding of the research with other research studies and summarize the unique features of the strategic management practices by ownership and size aspects and also identify the unique features of the strategic management practices in Sri Lankan commercial banks.
Identify the limitations of the research and several directions for future research.
Secondary data Primary Data
Conduct personal interviews
6

1.5 Structure of the thesis
This thesis contains 15 chapters and a brief description of each chapter is given below.
Chapter1 Chapter1 will explain the background to the research, research objectives, research
process and the significance of the research study.
Chapter 2
Chapter 2 will discuss the financial sector in Sri Lanka, especially the Central Bank and
the commercial banks of Sri Lanka and highlight the major external environmental
factors that can affect the strategic management practices of the Sri Lankan Commercial
Banks.
Chapter 3
Chapter 3 will provide a literature review of the field of strategic management and
discuss the major relevant theories which are important for the study of Strategic
management practices of Sri Lankan Commercial Banks.
Chapter 4
Chapter 4 will provide the theoretical framework developed for this research study
which is based predominately on the research studies conducted by Christodoulou
(1984), Bonn (1996), Nimmanphatcharin (2002), Kakanamveetil (2004), and
Angkasuvana (2005).
Chapter 5
Chapter 5 will explain the methodology adopted for this study under the major headings
of population definition, survey approach, instrument development, pre test of the
questionnaire, data collection procedure, data analysis and the framework for data
analysis.
7

Chapter 6
Chapter 6 will investigate the major characteristics of the sample companies such as
industry participation, respondent aspects, size aspects, ownership aspects and planning
system aspects.
Chapter 7
Chapter 7 will investigate 3 major internal environmental characteristics of the Sri
Lankan commercial banks more thoroughly and those characteristics will be the
company structure, company size and company ownership.
Chapter 8
Chapter 8 will analyze the organizational culture, management style and stakeholder
expectations of the Sri Lankan commercial banks and perceive whether there are any
significant differences either by ownership, or size aspects.
Chapter 9
Chapter 9 will analyze the external environments of the Sri Lankan commercial banks
and those external environmental dimensions include the demand environment, market
competition, market share, company competitors and customers, company business and
government policies, major sources of funds and banks political, economic, social,
technological, legal environments etc. Any significant difference of the external
environmental dimensions either by size or ownership aspects will be highlighted.
Chapter 10
Chapter 10 will discuss the mission, vision and the corporate level and second level
long term goals of the Sri Lankan commercial banks and find out if there are any
significant differences either by size or ownership aspects.
Chapter 11
Chapter 11 will investigate the planning and planning systems at corporate level and
second level of the Sri Lankan commercial banks and highlight the significant
differences either by size, ownership aspects.
8

Chapter 12
Chapter 12 will investigate the strategic thinking capabilities of the Sri Lankan
commercial banks and highlight the significant differences either by size, ownership
aspects
Chapter 13
Chapter 13 will analyze the analytical tools and techniques which are used to develop
the banks strategies, corporate strategies and the management of quality of the Sri
Lankan commercial banks. Any significant differences by ownership, size aspects also
will be highlighted.
Chapter 14
This chapter will compare the major research findings of this research study with the
major research findings of other research studies carried out in other countries namely
Australia, India, and Thailand. The differences of the strategic management practices
between the countries will be highlighted.
Chapter 15
This chapter will discuss the major research findings of this research in terms of 6 major
research questions. This chapter also summarizes the unique features of the strategic
management practices by ownership and size aspects and the unique features of the
strategic management practices in Sri Lankan commercial banks. At the end of the
chapter the significance of the research and the limitations of the research will be stated.
1.6 Significance of the Research
Firstly, most of the concepts and theories in the domain of strategic management have
been developed in western countries but, this research study is specially designed to
explore the strategic management practices in Sri Lankan commercial banks and
therefore, this research will provide insight knowledge about strategic management
practices of a particular industry in a developing country.
9

Secondly, this study identifies the importance of strategic thinking capabilities in the
banks strategic management process which was lacking in the previous studies of
Christodoulou (1984), Bonn (1996), Nimmanphatcharin (2002), Kakanamveetil (2004),
and Angkasuvana (2005).
Finally, the major research findings of this study will provide the opportunity for the
individual banks to compare and assess their strategic management practices with other
banks in the Sri Lankan banking industry. That will help the individual banks to identify
the shortcomings and strengths of their strategic management practices.
10

Chapter 2: Background on Sri Lanka and the banking industry in Sri Lanka
2.1 Introduction This chapter will provide background on Sri Lanka and the banking industry of Sri
Lanka. Furthermore, the major external environmental factors that can affect the
strategic management practices of Sri Lankan commercial banks will be discussed.
2.2 Background on Sri Lanka Sri Lanka is an island situated in the Indian Ocean to the east of the southern tip of the
Indian subcontinent which is separated by the Palk Strait, a strip of shallow water 18
miles across its narrowest point. It has a total area of 66,000 squire kilometres and a
population of 20.7 millions. The capital of Sri Lanka is Sri Jayawardanepura Kotte and
the major cities with higher population are Colombo, Gampaha, Kurunegala, Kandy,
Kaluthara, and Ratnapura respectively. The geography of Sri Lanka is shown in figure
2.1.
Figure 2.1 Geography of Sri Lanka
Sri Lanka
11

The origins of Sinhalese are from the north Indian Aryans who came to the island in
500 BC. The other significant ethnic group the Tamils is from Dravidian origin.
Buddhism arrived to the country in 300 BC and provided the foundation to develop a
greater civilization around the cities of Anuradhapura and then Polonnaruwa. All the
kings who governed the country during these eras gave Buddhism a higher priority.
Buddhists- Sinhalese civilization in Sri Lanka came under attack during the colonial
eras of the Portuguese, the Dutch and the British. Sri Lankan politics since
independence from the British has been strongly democratic and all the governments
have been elected democratically.
74% of the Sri Lankan population is Buddhist Sinhalese, 13% Tamils, and 7% Muslims.
The official languages of Sri Lanka are Sinhala, Tamil and English. Sri Lanka is
struggling with a civil war since 1983, and the fights are still occurring in the northern
part of the country between the government forces and the LTTE (a guerilla
organization who fights for a part of the country). About 65,000 people have been killed
but they could not find a permanent solution to end the crisis permanently. The civil war
has caused a major setback to the development of the country. The ceasefire signed by
the government and the LTTE in 2002 gave the opportunity for the all citizens in the
country to enjoy the benefits of a peaceful environment but, unfortunately it has come to
an end in 2005.
Sri Lanka has a high level of literacy (93%) and a life expectancy of 73 years despite its
low income per capita. Sri Lanka is a developing country and its services sector
produces 55% of the GDP. The fastest growing sector which is manufacturing is
dominated by the garment industry, while the agricultural sector produces 18% of the
GDP and more than one of the third of the workforce is involved in the agricultural
sector.
2.3 Financial sector in Sri Lanka
The financial sector in Sri Lanka consists of financial institutions such as licensed
commercial banks, licensed specialized banks, registered finance companies, primary
dealers, the employee’s provident fund, insurance companies and financial markets
12

such as the foreign exchange market, the money and capital market, other informal
financial markets and the financial infrastructure consisting of the legal framework
underlying the financial system and the payment and settlement system (Central Bank
2005a). Even though there are so many financial institutions, the financial sector in Sri
Lanka is dominated by the licensed commercial banks and the licensed specialized
commercial banks which have 57% of the total assets and 94% of the total deposit
liabilities. The Central Bank of Sri Lanka is responsible for the smooth functioning of
the financial sector.
2.3.1 Central Bank of Sri Lanka
The Central Bank of Sri Lanka was established in 1949 by the monetary act and it
started operations on the 28th August 1950. The objectives of Central Bank was
amended by the monetary law act in 2002 and the newly established core objectives of
the Central Bank are maintaining economic and price stability, and maintaining
financial system stability (Central Bank 2005b). A higher degree of autonomy has been
given to the Central Bank to achieve their objectives and it closely works with the
Ministry of Finance when making policy decisions.
To safeguard price stability, the Central Bank needs to introduce and implement policies
to control imports and exports. Price stability of the country directly influences the
inflation rate and when price stability is high there is usually a low inflation rate for the
country. When the inflation remains low consumers and producers can make their
decisions more confidently and this is usually the basis for long term economic growth
for the country (Central Bank 2005a).
The Central Bank of Sri Lanka (2005a) defined financial system stability as “the
effective functioning of the financial system which create a favorable environment for
depositors, encourages efficient financial intermediation and the effective functioning of
markets and hence promotes investment and economic growth”. Central Bank also
recognized that lack of financial system ability increases bank failures. The core
functions of the Central Bank of Sri Lanka are listed in Table 2.1.
13

Table 2.1 Core functions of the Central Bank
Core functions of the Central Bank
Conduct of monetary policy Conduct of exchange rate policy Management of the official foreign reserves of Sri Lanka Issue and distribution of currency. The central bank has the exclusive right to issue banknotes and coins that are legal tender in Sri Lanka. Licensing, regulation and supervision of banks, finance companies and primary dealers in government securities. Provision of clearing and settlement facilities to financial institutions (commercial banks and primary dealers) holding settlement accounts with the Central Bank. Acting as the economic advisor, banker and fiscal agent of the government.
Source: Objectives, functions and organization, Central Bank 2005
2.3.2 Supervision of Banks
The Central Bank is responsible for the regulating and supervising of banks in the Sri
Lankan financial system to safeguard the depositors and investors. According to the
Banking Act and Monetary Law act, the Central Bank is the licensing authority for
banks and it issues two types of licenses, for the commercial banks and specialized
banks. Only commercial banks are able to maintain current accounts and the specialized
banks can maintain only savings accounts. The supervisory functions of Central Bank
include the issue orders on the licensing, operations and closure of banks, the prudential
requirements relating to banks, the resolution of weak banks and the enforcement of
regulatory actions (Central Bank 2005b).
14

2.3.3 Licensed commercial Banks (LCB)
Licensed commercial banks (LCB) have been the most important financial institutions
in Sri Lankan financial sector in terms of assets and the magnitude of financial services
provided. LCB accounted 46% of the total financial sector assets and 81% of the
banking systems assets (Central Bank 2005a). According to financial stability review of
the Central Bank of Sri Lanka (2006), there were six large commercial banks in the Sri
Lankan banking industry which in total have 81% of the total licensed commercial
banks assets. These six banks include 2 government owned banks and 4 locally owned
banks.
Table 2.2 shows the financial indicators of the LCB from 2001-2006. It is worth
mentioning that most of the LCB’s credits distributed to the trading, consumption,
housing and property development sectors respectively. The volume of LCB’s non
performing loans (NPL) and NPL ratios have reduced during last few years and that can
be highlighted as a major development in the banking industry. Return on asset ratio
increased 0.8 to 1.8 from 2002 to 2006. However, banks liquidity ratio has gone down
from 30.9% to 23.9% during the period of 2002-2006. During the period of 2002 and
2003 Sri Lanka’s commercial banks overall return on equity and liquidity ratios were
higher and that is mainly due to the economic growth reported by the Sri Lanka’s
financial sector because of the cease fire agreement between the government and the
LTTE. Thus, it is worth noting that the war between the government and LTTE has a
major influence on the country’s economy.
15

Table 2.2 Financial indicators of the LCB’s
Micro Prudential Indicators of the Banking Sector
2001 2002 2003 2004 2005 2006
Licensed Commercial Banks
1. Capital Adequacy Ratio - Tier I Capital Ratio (%)
7.8 9.3 8.9 9.3 12.2 10.5
2. Capital Adequacy Ratio - Total Capital Ratio (%)
8.6 10.3 10.3 10.3 12.8 11.7
3. Gross NPA as a % of Total Loans & Advances
15.3 14.5 12.5 8.9 6.8 5.4
4. Net NPA as a % of Capital Funds 134.7 93.7 52.3 29.8 16.5 12.6 5. Sectoral Credit Distribution (%) Trading 40.5 37.7 36.8 35.7 32.6 29.1 Financial 3.2 3.3 4.2 4.8 5.2 6.1 Agriculture 4.7 4.7 4.5 3.8 4.3 3.9 Industry 10.5 11.6 10.9 10.0 9.7 8.8 Tourism 1.3 1.4 1.4 1.3 1.5 1.5 Housing & Property Development 14.0 14.1 14.0 14.3 14.4 16.2 Consumption 11.6 12.5 14.1 16.3 17.3 19.4 Others 14.2 14.7 14.0 13.7 15.0 15.0 6. Return on Assets (%) 0.8 1.1 1.4 1.4 1.7 1.8 7. Return on Equity (%) 15.5 20.5 21.1 18.3 16.8 18.5 8. Liquidity Ratio, % (DBU) 30.9 33.2 26.1 26.3 24.2 23.9 9. Net Open Position (NOP), % of Capital Funds
5.4 3.1 (5.6) 2.8 0.01 0.01
Source: Financial system stability Report 2006, Central Bank of Sri Lanka
2.3.4 Challenges faced by the Commercial banking sector
Piyasena & Corera (2006) identify that Sri Lankan capital markets are underdeveloped
and that they have not posed serious competition to the banking sector hence
commercial banks were able to maintain a high percentage of assets in the financial
sector. According to Ahamed (2006) Sri Lankan financial markets have somewhat
lagged behind the rest of their regional counterparts. Madurapperuma (2006)
categorizes 24 banking functions that the commercial banks in Sri Lanka currently are
performing such as financial intermediation, diversification of credit risk, asset stripping
etc., and points that banking industry is not dying but, other financial institutions and
16

instruments such as merchant and investments banks, insurance companies, leasing
companies, unit trusts, portfolio fund managers are trying to replace banks. However,
Madurapperuma (2006) concludes that mindset and the habits of the people in Sri Lanka
had led to an existence of a dominant banking system and it will take some time to
replace it by other financial institutions and by other instruments. Abeyaratna (2005)
mentions non-banking organizations involved in taking deposits have been growing
both in terms of numbers as well as volume, and claims that it is a potential threat for
the commercial banks which depend on retail deposits to mobilize funding for their
growing asset portfolios. Thus, we can expect more developments in financial markets
in Sri Lanka in the near future which directly influence the percentage of total assets
owned by the commercial banks. Hence, banks will need to deliver higher returns for
their shareholders in order to keep them with the banks in the future and to achieve that
goal banks will need to use their assets more efficiently to get maximum returns.
Perera (2006) asserts that commercial banks in Sri Lanka have to deal with an
increasing pace of change in the competitive environment within which they operate
and he proposes four key elements for the banks to adopt to successfully face those
changes such as risk management, technology, service excellence, and relationship
management. Kumara (2006) claims that despite the technology spread in the field of
banking, Sri Lankan people preferred the service with a human touch rather internet
banking and this highlight the importance of branch banking with higher technology.
Therefore, banks need to open branches through out the island to gain more customers
as most of the consumers of Sri Lankan commercial banks preferred not to use internet
banking facilities but, like to visit branches for their needs.
2.3.5 Risks being a Bank in Sri Lanka
Madurapperuma (2005) recognizes three broad categories of risks that the commercial
banks can face such as credit risk, market risk and operational risk. Credit risk is the
risk of loss due to a debtor’s non-payment of a loan or other line of credit and this might
be the most significant risk that a bank can face. Market risk comes from the changes in
the market prices such as exchange rates, interest rates, and equity and commodity
prices. Operational risk can be defined as the risk of loss resulting from failed internal
17

processes, people and systems or from external events. Banks have to take risk when
they do business and those risks leads to gains or losses. Madurapperuma (2005),
Parekh & Jayasinghe (2006) identifies the importance of capital adequacy and asset
quality to deal with these risks.
The credit growth rate remained at 21% at the end of year 2006 and it has been at a high
level during the recent past (Central Bank 2006). The growth of credit was due to higher
credits demanded from consumption and housing and construction industries. The
volume of non performing loans (NPL) and the ratio of NPL to total loans in the past
few years have reduced but, there has been a slight increase in last few months in the
year of 2006. Commercial Banks reported having higher provision covers for their NPL
and it was reported that government banks have a provision cover of 80% of the NPL
(Central Bank 2006). Thus, the Central Bank thinks there is no credit risk for the Sri
Lankan commercial banks in the short term but is planning to introduce policies to
restrict the execution rights of banks for the loans of above Rs. 5 million as a solution to
reduce the credit risk of the banks.
The banking industry is highly dependent on interest income and therefore, fluctuations
in interest rates heavily influence the banks success or failure (Central Bank 2006).
Inflation influences the interest rates and Central Bank allows banks to increase their
interest rates for deposits and lending’s gradually in response to the inflation rates. It
was reported that the banking sector in Sri Lanka have not been adversely affected by
the fluctuations in interest rates and banks continue to maintain their high profits further
(Central Bank 2006).
In addition to operational risks which can occur due to human errors and system failures
the Central Bank of Sri Lanka identified two other kinds of operational risks which can
heavily influence the banking industry in Sri Lanka (Central Bank 2006). First risk is
the concentration of shareholder power of large and medium sized locally owned banks.
There is a trend to acquire banks significant shareholdings through indirect ways and
create a monopoly in the banking industry by one or very few businessmen and that can
adversely affect the performance of the entire banking industry in Sri Lanka. To address
this issue Central Bank has introduced a new share ownership policy for banks which
allows a maximum shareholder limit at 15% while retaining the threshold limit at 10%
18

and shareholdings exceeding 15% need to get the approval from the Monetary Board
only for special situations (Central Bank 2006). The second kind of risk involves the
large financial firms which have banks as part of their company. Large number of cross
shareholdings, common directors and inter group transactions which lead to abuse of
power can adversely affect the banking system in Sri Lanka (Central Bank 2006).
2.4 Macro economic environment of Sri Lankan commercial banks
The global economy growth rate in the year 2005 and 2006 were 4.9% and 5.1%
respectively and it was expected to grow 4.9% in the year 2007 (see table 2.3).
Therefore, global financial market conditions remain positive for the Sri Lankan
financial system and all the major export markets are expected to grow steadily in the
year 2007 and also major import markets such as India, China and South Korea are
expected to grow more rapidly. However, Central Bank of Sri Lanka identified some
risks that can influence the Sri Lankan financial system negatively in the longer term.
The significant increases in oil and metal prices in the world market can cause higher
inflation in developing countries like Sri Lanka and higher inflation can negatively
affect the performance of the Sri Lankan banking industry. Current account deficit in
USA is also considered as a risk because it may lead to a reduction in USA’s imports
and the USA is a major export market of Sri Lanka. Despite those risks, the Central
Bank of Sri Lanka expecting a growth rate of 7.5-8.5 % for the year 2007 (Central Bank
2006). Thus, the macro economic picture for the next year is expected to be positive for
the Sri Lankan financial sector.
19

Table 2.3 Economy Growth prospects
Region and country 2005 2006 2007
World Advanced Economies USA Euro Area Japan Emerging Market and developing countries Developing Asia China India
4.9 2.6 3.2 1.3 2.6 7.4 9.0 10.2 8.5
5.1 3.1 3.4 2.4 2.7 7.3 8.7 10.0 8.3
4.9 2.7 2.9 2.0 2.1 7.2 8.6 10.0 7.3
Source: World Economic Outlook 2006 (Adopted from Financial system stability review, Central Bank,
2006)
2.5 Chapter Summary
Sri Lanka is an island situated in the Indian Ocean with a population of 20.7 millions.
The capital of Sri Lanka is Sri Jayawardanepura Kotte and the higher population cities
are Colombo, Gampaha, Kurunegala, Kandy, Kaluthara and Ratnapura. 74% of the Sri
Lankan population is Sinhala Buddhists followed by 13% Tamils and 7% Muslims. The
official languages are Sinhala, Tamil and English. Around 65,000 people have been
killed due to the war with LTTE, a guerilla organization who is fighting for part of the
country since 1982. Despite the low income per capita Sri Lanka has a high level of
literacy (93%) with a life expectancy of 73 years.
Sri Lankan commercial banks (LCB’s) dominate the financial sector in Sri Lanka, and
the Central Bank of Sri Lanka is responsible for regulating and supervising banks in the
Sri Lankan financial sector to safeguard the depositors and investors. LCB accounted
for 46% of the total financial sector assets and 81% of the banking system’s assets. The
Central Bank identified 6 large banks which have 81% of the total LCB’s assets and
those 6 banks include 2 government owned banks and 4 locally owned banks. During
the period of 2002-2003 the Sri Lankan banking sector reported improvements in the
financial performance figures such as liquidity ratios, return on equity and return on
assets and that was mainly due to the higher economic growth achieved by Sri Lankan
20

economy since the government’s ceasefire agreement with the LTTE. Thus, the
war/peace situation in Sri Lanka has a great influence on the country’s economy.
It was found that the capital markets in Sri Lanka are underdeveloped and have not
posed serious competition for the banking sector yet. The mind set and the habits of
people led to the existence of a dominant banking system in Sri Lanka and it probably
will take some time for part of it to be replaced by other financial institutions and
instruments. However, in the near future it will be more competitive for the LCBs as
other financial institutions and instruments develop rapidly. Thus, banks will have to
deliver higher returns to their shareholders to keep them with the banks in the future and
they will also have to use their assets more efficiently to increase their returns. Despite
the expected competition from the other financial markets banks need to open more
branches to attract more customers because it is widely believed that most of the
customers of Sri Lankan banks preferred to have a service with a human touch rather
using internet banking facilities.
Credit risk, market risk and operational risk can be identified as the three major risks
currently facing the banking industry in Sri Lanka and according to the Central Bank all
these kinds of risks are at a manageable level. The world economy and the global
business environments remain favorable for businesses in the 2007. However, an
increase in oil prices and an increased current account deficit in USA can negatively
affect the Sri Lankan financial sector in the longer term but, even with those negative
effects the Central Bank of Sri Lanka is expecting the economy to grow 7.5%-8.5% in
the year 2007.
The next chapter will discuss the literature review of this study.
21

Chapter 3: Literature Review 3.1 Introduction
This chapter will discuss the literature in the field of strategic management. The
literature review will start by analyzing the history of strategy, and the definitions for
strategy. Then the evolution of the field of strategic management will be discussed.
The literature review will also identify the analysis of external and internal
environmental factors that affect company’s strategic management practices. External
environment will be discussed under three major categories namely the general,
industry and competitor environments. The major internal environmental factors that
will be discussed in this chapter include the factors such as structure, ownership, size,
organizational culture, management style, stakeholder expectations, resources,
capabilities and core competencies of the companies. Then the literature review will
focus on two views of strategic management namely strategic planning and strategic
thinking. Under the strategic planning approach, vision and mission, objectives and
goals, and analytical tools and techniques which are used for strategic planning will
be discussed. The concept of strategic thinking will be discussed under the elements
of Liedtka’s (1998) strategic thinking model. Finally, the literature review will discuss
the major corporate strategies that a company can adopt and these include
diversification, international, acquisitions and mergers, research and development,
turnaround, and divestiture strategies.
3.2 The history of strategy The history of strategy and strategic management goes back to 500 BC. It is believed
that many concepts of strategy have come from Chinese military history and many
concepts about strategy were written in “The Art of War” which was originally
written in the 6th century BC by Sun Tzu (Hubbard 2000). He highlights the
importance of quick responses to changing environments and asserts planning works
only in controlled areas but, not properly in changing battlefields. Although the
concept of strategy goes back to Chinese military history its application to the
22

business world is relatively recent. According to Hubbard (2000) as an academic
discipline, the first books in the field are considered to be the 1965 Learned,
Christensen, Andrews and Guth’s book developed for teaching business policy at the
Harvard Business School and Ansoff’s book on corporate planning published in the
same year. The major objective in the model of strategy in both books was to match
the internal resources and capabilities of the organization (organization’s strengths
and weaknesses) with the demands of the environment (its opportunities and threats).
According to these two books strategy totally belongs to the chief executive officer
(CEO) who had to assess the company’s position and to decide which strategy to
implement (Hubbard 2000).
3.3 The definition of strategy
According to Meyer & Wit (1999), the only way of understanding the philosophy of
strategy is to understand the diversity of the definitions of strategy given by the many
outstanding thinkers in the field of strategy and also to conclude that there is no
simple answer to the question of what is “strategy”.
Whittington (1993) proposes four basic approaches to strategy namely classical,
processual, systemic and evolutionary. These four approaches differ fundamentally
according to the outcomes of strategy and the processes by which it is made. The
vertical axis of figure 3.1 measures the degree to which strategy either produces profit
maximizing or pluralist motives. The horizontal line measures whether strategies are
deliberate or emerge by experience.
In the classical perspective, strategy is perceived as a rational process which includes
deliberate calculation and analysis. Classical theorists believe that the environment
can be changed and therefore, rational analysis and objective decision making
determine the organization’s long term success or failure (Whittington 1993). Their
ultimate goal is to maximize the competitive advantage of the company.
In the evolutionary perspective, rational planning is often seen as irrelevant.
Environment is too unpredictable for evolutionary theorists and therefore, they expect
23

markets to secure profit maximization rather than relying on rational planning
methods. All managers can do is make sure that they fit as efficiently as possible to
the environmental demands of the day (Whittington 1993).
Figure 3.1 Generic Perspectives on strategy
Outcome Profit-Maximising
Pluralist
Processual Systemic
Evolutionary Classical
Process Deliberate
Emergent
Source:Whittington 1993, P.3
Processual theorists believe rational plans can be changed over the time due to
environmental changes and the differences of individuals who create and implement
those plans. Therefore, strategies emerge with much confusion and in small steps. For
processual theorists, both the organization and markets are often sticky messy
phenomena and the best advice is “not to strive after the unattainable ideal of rational
fluid action, but to accept and work with the world as it is” (Whittington 1993, p23).
Systemic strategists accept the importance of the rational planning to act effectively in
response to environmental changes and they reject the notion of rational planners as
perfect profit maximizers. According to systemic perspective, strategies can be
changed due to the managers’ cultural and social backgrounds. As a result different
organizational structures and goals can be created and therefore, firms differ
according to the social and economic systems in which they are embedded
(Whittington 1993).
24

Similarly, Mintzberg et al (1998) proposes five P’s for the strategy and views strategy
as plan, pattern, ploy, position or perspective. Strategy as “plan” describes strategy as
a direction, a guide or course of action into the future, a path to get from here to there
and therefore, strategies are intended and made prior to the actions. “Pattern”
perspective views strategy as consistent behaviour over time and therefore, the pattern
view is looking at its past behaviour while the plan view is looking at the future.
Companies can develop strategies for the future and they also can identify the pattern
of their strategies in the past. Thus, the plan view has the intended strategy and the
pattern view has the realized strategies. Mintzberg’s view of strategy as a ploy
represents a specific plan to outwit an opponent or competitor. For example a
company may threaten to expand plant capacity to discourage a competitor from
building a new plant and thus, the company’s strategy was the threat, not the
expansion (Mintzberg & Quinn, 1996). Mintzberg view of strategy as position
believes “Strategy is the creation of a unique and valuable position, involving a
different set of activities” (Mintzberg et al, 1998, P 13) and strategy as perspective
viewers consider the company’s fundamental way of doing things. The perspective
view “looks inside the organization, indeed, inside the heads of the strategists, but it
also looks up-to the grand vision of the enterprise” (Mintzberg et al 1998, P14).
In addition to the above five definitions of strategy, Mintzberg et al (1998) proposes
ten schools of strategy such as design, planning, positioning, entrepreneurial,
cognitive, learning, power, cultural, environmental and configuration. These ten
schools have different views about the strategy (See table 3.1) and the relationships
between them are varied according to the development of strategy.
25

Table 3.1: Mintzberg’s ten schools for strategy
Strategy School Concept The Design School Strategy Formation as a process of
conception The Planning School Strategy Formation as a formal process The Positioning School Strategy Formation as an analytical
process The Entrepreneurial School Strategy Formation as a visionary process The Cognitive School Strategy Formation as a mental process The Learning School Strategy Formation as an emergent
process The Power School Strategy Formation as a process of
negotiation The Cultural School Strategy Formation as a collective
process The Environmental School Strategy Formation as a reactive process The Configuration School Strategy Formation as a process of
transformation
Source: Mintzberg et al 1998, p5 3.4 The evolution of strategic management
Once we come to the conclusion that the definitions of strategy can be varied
according to its formation process and purposes of the business, it is worth noting that
the study of strategic management is simply not an easy task. However, Hussy (1998)
mentions that a historical perspective in strategic management explains some of the
conflicting views of strategic management and shows how the subject has developed
as organizations tried to find better ways of developing strategies for the future and,
how environmental changes led to new concepts of strategy making being sought.
Prior to the 1920s, most business decisions were relatively short term in focus and
less entrepreneurial (Bourgeois 1996). With the beginning of the modern companies
such as General Motors, Dupont in the 1920s, companies tended to focus on long-
term plans and financial planning played a major role among senior managers. “The
methods typically involved translating sales forecast into production schedules,
estimating the costs associated with the planned volume, and deriving the profit
forecasts” (Bourgeois 1996, P4) and this approach was based on the assumptions that
the environment was stable and that sales projections could be made.
26

In 1965 Igor Ansoff published his first book titled “corporate strategy” when most of
the companies were using long range planning (Hussey 1998). In the late 1960s
companies in the United States underwent many changes such as massive
multinational mergers and acquisitions to avoid anti trust laws, which discouraged
high market shares in any particular industry (Hubbard 2000). As a result BCG
developed a 2×2 market growth/relative market share matrix and developed the
concept of the experience curve (Hubbard 2000). In late 1960s and early 1970s
companies had to cope with higher inflation due to high oil prices and they had to
introduce cost control methods. During this period the major purpose of the
companies was survival rather long term planning. Therefore, in late 1960’s long term
planning was replaced by corporate planning. Corporate planning addressed the
company’s long term and short-term goals, scope and growth directions. Ansoff (1965
p94) highlights the importance of corporate planning by stating “Firm need a well
defined scope and growth direction, that objectives alone do not meet this need, and
that additional decision rules are required if the firm is to have orderly and profitable
growth”.
In 1980s Porter’s model of competitive analysis and his set of generic strategies and
the concept of value chain dominated the area of strategic management. Porter (1980)
introduced the model of five competitive forces in a company’s environment that
influence competition such as threat of new entrants, bargaining power of firm’s
suppliers and customers, threats of substitute’s products and intensity of rivalry
among competing firms. Porter (1980) further claims that these forces may explain
why firms adopt a particular strategy. In his book (1985) titled “Competitive
Advantage”, Porter asserts two basic types of competitive advantage a company can
have namely low cost or differentiation and proposes three kinds of generic strategies
that can be adopted to gain competitive advantage such as cost leadership,
differentiation, and focus. Porter (1985, p16) further argues that companies which fail
to adopt one of these strategies are “stuck in the middle” (P.16). Furthermore, Porter
(1985) introduced the value chain model as a basic tool to systematically examine all
the activities a firm performs and claims how they interact is necessary for analyzing
the sources of competitive advantage.
27

While Porter’s work dominated in the field of strategic management in 1980s
Japanese companies competed against the United States companies by adopting Total
Quality Management (TQM) principles which concentrate more on efficiency and
effectiveness of operations than unique strategies (Hubbard 2000). Therefore,
companies in United States understood that there was more to strategy than industry
analysis and positioning the firm against competitors. In the early 1990’s the field of
strategic management was attracted to the Prahalad & Hamel’s (1990) concept of
building “core competencies” to achieve sustainable competitive advantage. Prahalad
& Hamel (1990) define the core competences as “the collective learning in the
organization, especially how to coordinate diverse production skills and integrate
multiple streams of technologies”. Prahalad & Hamel (1990) further highlighted the
importance of having core competencies as well as the external environmental factors
and the positioning of the company in a market.
Both the industry analysis and the resource based view analysis only provide static
analysis of the organization’s current position and do not concentrate much on the
future external environmental trends (Hubbard 2000). Globalization and technological
developments which took place in the late 1980’s led to changing business
environments for the companies in the globe and companies had to react to these rapid
environmental changes.
Mintzberg (1987) always a big fan of organizational learning asserts that all strategy
making walks on two feet namely deliberate and emergent, and deliberate strategy
focuses on control while emergent strategy focuses on learning. Mintzberg praises the
value of emergent strategy because it opens the door for strategic learning of the
company and it also acknowledges the organization’s capacity to experiment
(Mintzberg et al 1998, p189). Nonaka and Takeuchi (1995) define organizational
learning as knowledge creation and propose four modes of knowledge conversions in
a company. The major purpose of organizational learning is to successfully face
future environmental changes and therefore, most of the strategists view of the
strategic management process is as a thinking process rather than a planning process
(Mintzberg 1987).
28

Thus, in 1990’s prominent authors in the strategic management literature field fall in
to two main categories in the way they look at strategy, namely the “strategic
planning” and the “strategic thinking” approaches. However, Heracleous (1998)
identifies the number of different ways that the various authors use the terms of
strategic planning and strategic thinking. According to Heracleous (1998) for some
authors “strategic thinking and strategic planning are two different thinking modes
which can use at the different stages of strategic management process (eg Mintzberg),
for some authors strategic thinking is not so much creative as analytical (eg Porter),
for some authors strategic planning has remained an analytical activity but the
organizational practices surrounding it have been transformed, and for some the real
purpose of analytical tools of strategic planning is to facilitate strategic thinking, and
for others strategic planning is useless and should be scrapped in favour of strategic
thinking. Liedtka (1998) highlights the importance of strategic planning systems for a
company to provide a supportive context for the employees to think strategically.
Thus, it is worth noting that companies can have strategic planning systems and also
encourage the strategic thinking capabilities within it.
Given that there is no exact definition of the strategic management with prominent
strategists arguing their own perspectives on strategic management, this literature
review will now focus on strategy levels, and the major elements of strategic
management.
3.5 Strategy Levels
Johnson & Scholes (1999) identify three levels of strategy in a large company namely
corporate level, business level and operational level strategy. Similarly, Thompson &
Strickland (2003) divide companies into two categories namely diversified and single
business companies and propose four strategy levels for diversified companies (see
Figure 3.2) namely corporate, business, functional and operational levels while
proposing three levels of strategies for the single business companies such as
business, functional and operating level strategies. According to Johnson & Scholes
(1999 P11), corporate strategy is “concerned with the overall purpose and scope of the
29

organization to meet the expectations of owners or major stakeholders and add value
to the different parts of the enterprise”. Business level strategy is to compete
successfully in a particular market (Johnson & Scholes 1999), and functional level
strategies are for each specific functional unit within a business such as marketing,
finance, and production etc., and operational level strategies to manage the basic
operation units in the functional areas such as plants and sales (Thompson &
Strickland 2003).
Figure 3.2 The strategy making Pyramid
A diversified company
Corporate Level Strategies (Responsibility of corporate level managers)
Business Level Strategies (Responsibility of business-level general managers Functional level strategies (Responsibility of heads of major functional activities Activities within a business unit or division)
Operational level strategies (Responsibility of plant, managers, geographic unit managers, and lower level supervisors)
Source: Thompson & Strickland (2003) Strategic Management: Concepts and Cases p52
3.6 Strategic Management process
Johnson & Scholes (1999) developed a model for strategic management which
consists of strategic analysis, strategic choice and strategy implementation. Similarly,
Thompson & Strickland (2003) identified five major tasks of strategic management
that include developing a strategic vision and business mission, setting objectives,
crafting a strategy to achieve the objectives, implementing and executing the strategy,
evaluating performance. Figure 3.3 shows the model developed by Johnson & Scholes
(1999) to explain the strategic management process. According to Johnson & Scholes
30

(1999) strategic analysis is concerned about the strategic position of the company in
terms of its external and internal environments and stakeholder expectations. Analysis
of external environment includes the company’s operating political, economic, social,
technological, legal environments and the main purpose of that is to find out the
opportunities and threats that exist in the operating environment. Similarly, internal
environmental analysis is concerned with the company’s resources and competences
which can identify its strengths and weaknesses. The other part of the strategic
analysis includes the analyses of the stakeholder expectations and the company’s
major purposes.
Strategic choice includes identifying the bases of strategic choice, generating strategic
options and evaluating and selecting of strategic options. Johnson & Scholes (1999)
highlight that identifying the bases of strategic choices means identifying the
company’s strategic mission and intent which provides the overall ambition of the
company and also how the company seeks to compete at the SBU level. Generation of
strategic options seeks to find out what strategic development direction best matches
the company’s main objectives. Evaluating and selecting of strategic options includes
an assessment of the suitability of the strategy and that may be an evaluation of the fit
between company’s resource capability and operating environment or the
development of company’s resource capability to create more opportunities for the
company (Johnson & Scholes 1999).
Strategy implementation involves the process of translating strategy into
organizational action through organizational structure and design, resource planning
and the management of strategic change (Johnson & Scholes 1999). The major
questions needed to be addressed by the company under the strategy implementation
are the questions such as what should the company structure and design be, what are
the key tasks that need to be carried out, and what sort of systems are needed to
monitor progress etc.
31

Figure 3.3 Elements of strategic management
Strategic analysis
Strategic choice
Strategy implementation
The environment
Expectations & Purpose
Bases of strategic choice
Organization structure and design
Strategy evaluation and selection
Resource allocation and control
Managing strategic change
Strategic options
Resources, competences, and capability
Source: Johnson & Scholes (1999) exploring corporate strategy p24
3.7 The Environment
The success of a business in a company mostly depends on the match between its
operating environment and the company and therefore, understanding the
environment is important for every company. Viljoen (1996, p185) asserts that “one
of the primary tasks of the strategist is the management of the interface between the
organization and its external environment”. Several studies (eg. Lanyon & Abdalla
1997, John, Bruce & Fred 1982, Ronald 2003) also highlight the importance of
environmental analysis for strategic planning. According to Johnson & Scholes
(1999) environmental analysis is important for managers because of three reasons.
First, managers face difficulties when trying to understand the environment because
32

the environments consist of so many different influences. Secondly, is the uncertainty
of the future that is being created by fast growing technological changes and the speed
of global communication. Finally, managers are human beings that can make errors
and therefore, the need to reduce the complexity of the environment by the use of
environmental analysis methods.
Kendra (2004, p40) defines “environmental scanning as internal communication of
external information about issues that may potentially influence an organization’s
decision making process”. Thus, the entire environment can be divided into two major
categories namely the external and the internal environments. Analysis of external
environment helps organization to understand their external environment and Hitt,
Ireland & Hoskisson (2005) note that when the firm’s understanding of the external
environment is matched with knowledge about its internal environment it helps to
form the company’s strategic intent, strategic mission and also to create strategies.
3.7.1 External environment
External environmental scanning is to identify and evaluate trends and events beyond
the control of the organization (Fred 1997). It helps the organization to identify the
opportunities and the threats that exist in the environment. Several research studies
such as Maier, Rainer & Snyder (1997), Rivers, Fottler & Parker (2005), Haque,
Khatibi & Karim (2006) recognize the importance of analyzing the external
environmental factors that can affect the organization. Hitt et al (2005) identify the
war on Iraq, the strength of separate economies at different times, and the emergence
of new technologies as three major examples of external environmental factors that
affect most of the companies in USA.
Hitt et al (2005) divide the external environment into three major categories namely
the general, industry, and competitor environments. The general environment has a
number of dimensions such as political/legal, technological, socio cultural, global,
demographic which represent the broader society that can influence an industry and
the firms within it. The industry environment is the set of factors that directly
influence the organization and its competitive actions such as the threat of new
33

entrants, the power of suppliers, the threat of product substitutes, and the rivalry
among the competitors. Competitor analysis is about the collecting and interpreting
information about the company’s competitors. Hitt et al (2005) assert that the analysis
of general environment focuses on the future, and the analysis of the industry
environment focuses on the factors and conditions that influence the company’s
profitability within its industry while analysis on competitor environment focuses on
predicting the dynamics of competitor’s actions, responses and intentions.
3.7.1.1 General Environment
The general environment consists of the factors that can affect the company
dramatically and normally, the company has less ability to predict them and to control
them (Dess, Lumpkin & Eisner 2006). Dess et al (2006) & Hitt et al (2005) divides
the general environment into six major dimensions such as demographic,
sociocultural, political/legal, technological, economic, and global. Most of the studies
use PEST analysis to analyze the general environment which represents political,
economical, sociocultural, and technological factors that can affect the firms
businesses. Johnson & Scholes (1999) claim that the major questions need to be asked
when doing a PEST analysis are what environmental factors are affecting the
company?, which of these are the most important at the present and in the next few
years?. The following paragraphs will discuss the six dimensions of the general
environment identified by Dess et al (2006) & Hitt et al (2005).
3.7.1.1.1 Political and legal environment
A number of studies such as Quer & Claver (2007), Heinrich (2007), and Narjoko
(2007) highlight the influence of political factors that can affect the firm’s strategic
position while studies of Thomas (2004), Foster (2005), and Demil & Bensedrine
(2005) investigate the influences of legal systems of a country for the firm’s
businesses. Hitt et al (2005) assert that despite the International Monetary Fund (IMF)
push for countries to liberate trade barriers, the political and legal policies towards
international business differ significantly from country to country. Thus, it is
advisable for a company to analyze and understand its political and legal environment
and the possible future changes in the policies of the government. Johnson & Scholes
34

(1999) identify that monopolies legislation, environmental protection laws, taxation
policy, foreign trade regulations, employment law, and government stability are the
most important factors that need to be identified by a firm when analyzing its political
and legal environments.
3.7.1.1.2 Demography
Demographic factors are the easiest element to analyze in the general environment
(Dess et al 2006). Studies conducted by Bakshi & Zhiwu (1994), Shiclds (2005), and
D’souza, Taghian & Khosla (2007) found that it was important to understand the
demographic factors so as to perform well in the business environment. Hitt et al
(2005) state that the major segments which need to be analyzed in demography are
population size, age structure, geographic distribution, ethnic mix, income distribution
etc. China and India have large markets due to their high populations and as a result
we can see large companies trying to move their businesses into those two countries
and this illustrates how population size can affect the company strategies. The number
of elderly people in USA is rapidly growing and therefore, new markets will emerge
in future to satisfy their needs such as retirement villages, restaurants, and hospitals
(Hubbard 2000). Grete & Seyan (2005) study found that even though the retailers in
UK show more interest in targeting the young people, the mature consumers will
become more important for the fashion industry in the UK in the next decade because
of their increasing population
3.7.1.1.3 Socio-cultural
The socio-cultural segment is concerned with the society’s attitudes and cultural
values (Hitt et al, 2005) and social concerns can have immediate effect on the
activities of an organization (Viljoen, 1996). For example people now trying to quit
from smoking and also trying to have balanced diets as a result of their increased
education about healthy activities. This trend has affected the tobacco business
companies and the food manufacturers. Hubbard (2000) asserts that sociocultural
trends are difficult to capture, because change is almost invisible but claims that
companies need to understand the new attitudes and trends of people to be successful
in the future. The developments in single dating agencies and the establishment of
35

super markets that provide longer shopping hours for the customers are two examples
of companies responding by identifying people’s sociocultural attitudes.
3.7.1.1.4 Economic
Study of the economic environment is important for every company because
customers consumption patterns are largely influenced by the economic trends such as
disposable income, inflation rate, interest rates etc.(Viljoen, 1996). Studies conducted
by Lindani (1996) and Peter (2004) found the influence of macro economic indicators
for organization businesses. Government’s fiscal policy and monetary policy
determine the country’s general economic conditions. Thus, economic conditions in
the general environment link with the political and legal factors.
3.7.1.1.5 Technological
Hubbard (2000) claims that most organizations were affected by major technological
changes. Dess et al (2006) support that notion by identifying innovation which helps
to create new industries and alters the boundaries of existing industries. Charlene &
Carolyn (2003) argues that when the technology of an industry changes, the firm’s
approach to sourcing new technology plays a major role in building the capabilities
needed to build new technical outputs. Thus analysis about the technological
environment becomes vital for most companies.
Thomas & Anne (1996) found that by only adopting information technology (IT) has
not produced a sustainable competitive advantage for companies, but some companies
gained a competitive advantage by using IT to leverage intangible, complementary
human and business resources such as flexible culture, supplier relationships,
planning- IT integration etc. Similarly, findings of Michael & Ravipreet (2003) study
concluded that organizational learning plays a significant role in mediating the effects
of IT on company’s performances.
The study of Shaker & Jeffrey (1993) found that technology policies of firms can vary
widely according to their different business strategies and John (1987) sees
technological innovation of a company as a useful tool for the corporate strategy.
36

Thus, there must be a link between technology and the company’s business and
corporate strategies.
3.7.1.1.6 Global
According to Hitt et al (2005, p 49) the global dimension of the general environment
includes “new global markets, existing markets that are changing, important
international political events, and critical cultural and institutional characteristics of
global markets”. Marc (2002) identifies that new market opportunities, competitive
threats, and diffusion of business models associated with globalization were the main
reasons for restructuring of firms during last decade. The results of the study of Orly
(2005) suggests that firms whose managements pay more attention to their external
environment are more likely to develop global strategies to expand but, managements
who concentrate more on internal environments are less likely to be global. Harry and
Denise (2000) found that internal driving forces to become global include owner-
manager knowledge and competencies, and the skills of their work force and the
external driving forces that cause globalization include willingness and ability of
owner-managers to participate in global networks, gather specific marketing
information, and have access to relevant channels of distribution.
Different companies use different global strategies when they do business globally.
The study of Johny & George (1993) found that Japanese companies have more
global strategies than American companies and as a result the Japanese companies
perform more favorably than the American companies globally.
3.7.1.2 Industry environment
An industry is a group of firms producing products that are close substitutes (Hitt et al
2005, p52) and compared to general environment industry environment has a more
direct effect on company’s competitiveness. Company’s competitiveness depends on
the nature of the industry that the company is doing their businesses. Porter (2004)
sees the competition as the core to firm’s success or failure and highlights the
importance of having a competitive strategy to successfully position against the forces
37

that determine industry competition. According to Porter (1980, p.3) “industry
structure has a strong influence in determining the competitive rules of the game as
well as the strategies potentially available to the firm”. Thus, the analysis of industry
environment is important to every company.
Porter (2004) states that whether it is domestic or international, or whether they
produce a product or service, the competition is embodied in five competitive forces
namely the entry of new competitors, the threat of substitutes, the bargaining power of
suppliers, and the rivalry among the existing competitors. Figure 3.4 shows Porters
five forces that affect competition among companies. The collective strength of those
five forces determines the ability of company’s profits over their competitors. The
strongest competitive force or forces determine the profitability of an organization
and therefore, companies need think about the impacts of those forces for the
company, before formulating the strategies (Porter 1979).
38

Figure 3.4 Elements of industry structure
Power of suppliers
Bargaining Industry competitors Intensity of rivalry
Bargaining
Substitutes
Power of buyers
Threat of substitutes
Determinants of substitutes threats Relative price performance of substitutes Switching costs Buyer propensity to substitute
Determinants of buyer power Buyer concentration- - versus firm- -concentration Buyer Volume Buyer information Price sensitivity Price/total purchases Product differences Brand identity Buyer profits
Buyers Suppliers
New entrants
Rivalry determinants Industry growth Fixed/costs/value added Intermittent overcapacity Product differences Brand identity Switching costs Concentration and balance Informational complexity Diversity of competitors Corporate stakes Exit barriers
Entry Barriers Economics of scale Brand identity Switching costs Capital requirements Access to distribution Absolute cost advantage Government policy Expected retaliation
Threat of new entrants
Determinants of supplier powerDifferentiation of inputs Switching costs of suppliers - -and firms in the industry Presence of substitute inputs Supplier concentration Importance of volume to supplier Cost relative to total purchase in - – the industry
Source: Minntzberg et al (1998) Strategy Safari, p 101
3.7.1.2.1 Threat of entry
New entrants to an industry influence the market share of existing companies and also
the substantial resources available for them. The seriousness of threat of entry
depends on the present barriers to entry and the reaction from the existing competitors
that the entrants can expect. Porter (1979) identifies that if the barriers to entry are
high and if the newcomers can expect sharp retaliation from the existing competitors
in a market then the existing companies will not pose a serious threat for the new
entrants. Furthermore, Porter (1979) proposes six sources of barriers to entry namely
39

economies of scale, product differentiation, capital requirements, cost advantages
independent of size, access to distribution channels and government policies.
3.7.1.2.2 The threat of substitutes
Companies doing business in one industry are more likely to have stronger
competition when their products and services are good substitutes. Porter (1979,
p142) asserts that “substitutes products that deserve the most attention strategically
are those that (a) are subject to trends improving their price performance trade-off
with the industry’s product, or (b) are produced by industries earning high profits”.
Thompson and Strickland (2003) proposes three factors that determine the substitute’s
strong competitive pressures for their competitors such as whether attractively priced
substitutes are available, whether buyers view the substitutes as being satisfactory in
terms of quality, performance, and other relevant attributes, and whether buyers can
switch to substitutes easily. Johnson & Scholes (1999, p120) proposes four different
forms of threat of substitution.
• Product to product substitutes: for example fax for the postal service and e-
mail for the fax
• Substitution of need by a new product or service rendering an existence
product or service superfluous: for example, if more precise casting means that
engine blocks are cast to a finer specification, then demand for cutting tools
may be reduced.
• Generic substitution occurs where products or services compete for need: for
example furniture manufacturers and retailers compete for available household
expenditure
• Doing without can also be thought of as a substitute: for example tobacco
industry
3.7.1.2.3 Bargaining power of suppliers
Suppliers can exercise their bargaining power with the companies in an industry by
threatening to increase prices or reduce the quality of purchased goods and services.
40

Thus, powerful suppliers can influence company’s profitability by increasing the
prices of their inputs to the company (Porter 1980). Porter (1980) further identifies
that powerful suppliers can be created through the situations when it is dominated by
a few companies and is more concentrated than the industry it sells to, it is not obliged
to contend with other substitute products for sale to the industry, the industry is not an
important customer of the supplier group, and the suppliers product is an important
input to the buyer’s business etc. Furthermore, Porter (1980) recognized labor as a
major supplier for the companies and further mentions that scarce, highly skilled
employees can bargain away significant amount of company’s profits.
3.7.1.2.4 Bargaining power of buyers
Like suppliers, buyers also can force down prices, demand higher quality or more
service, and play competitors off against each other at the expense of industry profits
(Porter 1979). Buyers bargaining power will be more powerful when it is
concentrated or purchases large volumes relative to seller sales, the product it
purchases from the industry represent a significant fraction of the buyer’s costs or
purchases, the product it purchases from the industry are standard or undifferentiated,
and it earns low profits etc (Porter 1980).
3.7.1.2.5 Rivalry among the existing competitors
According to Thompson and Strickland (2003) rivalry between the existing
competitors is the strongest force among the Porter’s five forces that creates
competition among the companies in an industry. Price competition, product
introduction and advertising slugfests are some of the tactics companies can use to
counter the rivalry among the existing competitors. Porter (1979) highlights a number
of factors that increase the rivalry among the competitors in an industry such as
numerous and equally balanced competitors, slow industry growth, high fixed or
storage costs, lack of differentiation or switching costs, capacity augmented in large
increments, diverse competitors etc. According to Porter (1980) the extent of
competitive rivalry among the companies can be changed due to changes in industry
growth because of the industry maturity.
41

3.7.1.3 Competitor analysis
In addition to general and industry environments analysis, competitor analysis is the
other part of the external environment analysis of an organization. Increased rivalry
between companies leads companies to pay more attention to competitor analysis. Hitt
et al (2005, p63) identifies four major questions that the companies need to find
answers to when they do a competitor analysis such as,
• What drives the competitor, as shown by its future objectives?
• What the competitor is doing and can do, as revealed by its current strategy?
• What the competitor believes about the industry, as shown by its assumptions?
• What the competitor’s capabilities are, as shown by its strengths and
weaknesses?
Furthermore, Hitt et al (2005, p64) highlights the importance of companies having
competitor intelligence which “is the set of data and information the firm gathers to
better understand and better anticipate competitors objectives, strategies, assumptions,
and capabilities” for an effective competitor analysis. The major components of a
competitor analysis are shown in the figure 3.5.
42

Figure 3.5 Components of competitor analysis
Future Objectives How do our goals compare with our competitors goals? Where will emphasis be placed in the future? What is the attitude toward risk?
Assumptions Do we assume the future will be volatile? Are we operating under a status quo? What assumptions do our competitors hold about the industry and themselves?
Capabilities What are our strengths and weaknesses? How do we rate compared to our competitors?
Response What will our competitors do in the future? Where do we hold an advantage over our competitors? How will this change our relationship with our competitors?
Current strategy How are we currently competing? Does this strategy support changes in the competitive structure?
Source: Hitt et al, 2005, p64
3.7.2 Internal environment
In this section, the internal environmental factors that can affect the strategic
management practices of companies will be discussed and these factors include the
organizational structure, company ownership, company size, organizational culture,
management style, stakeholder expectation, and the company resources, capabilities,
competencies and core competencies.
43

3.7.2.1 Organizational structure
Organizational structure is considered by many to be the anatomy of the organization
and the idea of structure as a framework “focuses on the differentiation of positions,
formulation of rules and procedures, and prescriptions of authority (Ivancevich 1997,
p669). Chandler (1962, p14) defines structure “as the design of organization through
which the enterprise is administered” and mentions design has two aspects first, the
lines of authority and communication between the different administrative offices and
officers and second, the information and data that flow through these lines of
communication and authority. Ivancevich (1997) further asserts that through the
design of the structure, management establishes expectations for what individuals and
groups will do to achieve the organization’s purposes. Therefore, the structure of an
organization provides differentiation and integration of work undertaken by the
employees of the company.
Robbins (1987) identifies three major components of a company structure namely the
complexity, formalization and centralization. Complexity refers to the degree of
differentiation that exists within an organization, formalization refers to the degree to
which jobs within the organization are standardized, and centralization refers to the
degree to which decision making is concentrated at a single point in the organization.
Robbins (1987) also found that centralization and complexity of structure are having
an inverse relationship. Thus, the decentralized structures were associated with high
complexity.
Johnson & Scholes (1999) proposes four kinds of structures that a company can adopt
namely simple, functional, multidivisional and matrix structures. Simple structures are
better for the companies which have an owner with very small number of
subordinates and simple structures can apply only to small sized companies.
Functional structures divide into organizational units based on the separate functions
they perform such as production, finance and marketing. Daft (2001) highlights a
number of strengths of functional structures such as allowing economies of scale
within the functional departments, enabling in depth knowledge and skill
development and to accomplish functional goals. Weaknesses include slow response
44

time to environmental changes which may cause decisions to pile on top, and lead to
poor horizontal coordination among departments and result in less innovation etc
(Daft 2001).
Multidivisional structures sub divide into organizational units on the basis of
products, services and geographical areas. In multidivisional structures divisions can
be created as single business units (SBU’s). SBU is “a unit of a firm which has the
responsibility for developing the firm’s strategic position in one or more SBA’s” and
SBA (strategic business area) is “a distinct segment of the environment in which the
firm does business” (Ansoff & McDonnell 1990, p50). The multidivisional structures
are best suited to fast changes in unstable environments that involve high coordination
across functions, allows units to adopt different products and clients and usually best
in large companies with several products (Daft 2001). The weaknesses of this
structure is the loss of economies of scale in functional departments, poor
coordination across product lines, and the difficulties to integrate and standardize
across product lines (Daft 2001, p100).
In a matrix structure teams consists of individuals borrowed from functional managers
by account or product managers and therefore, individuals report to two bosses
(Palmer & Hardy 2000). The strengths of matrix structure are it achieves coordination
necessary to meet dual demands, flexible sharing of human resources across products,
suited to complex decisions and frequent changes in unstable environments (Daft
2001). The weaknesses are it causes participants to experience dual authority which
can be frustrating and confusing, time consuming due to frequent meetings and
conflict resolutions sessions and will require great effort to maintain power balance
(Daft 2001). The structural contingency framework argues that environment is a
major factor that decides which structural type is going to be optimal such as
functional structures in stable environment, divisionalized structures in diversified
environments and matrix structures in unstable and turbulent environments etc
(Palmer & Hardy 2000).
Several research studies found a significant positive relationship between strategy and
structure (Chandler 1962, Grinyer, Ardekani & Al-Bazzar 1980, Rumelt (1974) and
Channon 1975). Rumelt (1974) and Channon (1975) found a significant positive
45

relationship between the fit of strategy and structure with performance while Grinyer,
Ardekani & Al-Bazzar (1980) found only a very small (not significant) positive
relationship. Thus, the research findings about the fit between strategy structure and
performance were ambiguous.
The debate over structural fit with strategy still remains in the strategic management
literature. Chandler (1962) in his research concludes that structure follows strategy
and the importance of a fit between strategy and structure to be succeeded. However,
Palmer & Hardy (2000) question the traditional idea of a fit between strategy and
structure and assert managers appear more likely to succeed, by finding the right fit of
structural components for a particular situation but, being aware of the fluidity of the
processes that make up technology, environment, strategy and structure and by
developing skills to manage those processes more effectively. Palmer & Hardy (2000)
idea was supported by Ghoshal & Bartlett (1995,p96) and claim that companies need
to have purpose-process-people policies instead of strategy structure systems to shape
the behaviors of people and create an environment that enables them to take initiative,
to co-operate, and to learn.
3.7.2.2 Organizational Ownership
The standard assumption in economics and strategic management is that the owners of
the companies want to maximize their economic profits or shareholder value
(Thomsen & Pedersen 2000). Agency theory demonstrates that top managers, acting
as agents of stockholders, can take action that may not be consistent with the interest
of owners (Li & Simerly 1998). Managers may have other interests such as high
compensation, low effort levels, expense preference etc. which differ to their owners’
interests and therefore, the relationship between managers and owners can differ in
firms.
A number of researchers attempted to find the effects of ownership structure (equity
structure) on company performance but, failed to identify which ownership structures
significantly affect company performances. However, Short (1994) finds support for
the hypothesis that owner controlled firms have higher profitability measures than the
46

manager controlled firms but, the results were often statistically insignificant (Short
1994).
Several research studies focus on the ownership concentration of companies and its
effects for the companies. Ownership concentration measures the power of
shareholders to influence the managers (Thomsen & Pedersen 2000). The research of
Gedajlovic & Shapiro (1998) finds that country effects exist in the ownership
concentration-profitability relationship due to institutional differences across
countries. Similarly Ramaswamy, Li & Veliyath (2002) claim that the ownership
behaviors differed according to different countries and therefore, the relationship
between ownership and corporate governance may have differences. Li & Simerly
(1998) link the ownership-performance relationship with the environment and find
that increased insider ownership leads to better returns under conditions of greater
environmental dynamism. Furthermore, the research of Peng (2004) finds that
outsider directors do make a difference in firm performance especially in sales growth
but, only a little impact on financial performances such as return on equity.
In other research regarding the relationship between company ownership and
company corporate strategies, Wright, Kroll, Lado & Van (2002) argue that risk
increasing corporate strategies may initially be emphasized but, risk reducing
strategies may subsequently be emphasized as managers expand their stock
ownership. Similarly, Denis, Denis & Sarin (1999), Lang & Stulz (1994) and Loderer
& Martin (1996) asserts that when the companies have a higher ownership incentives
companies are less likely to adopt risk reducing strategies such as diversification
strategies because owners prime goal is to maximize the profitability.
3.7.2.3 Organizational Size
Size is a major element of organization and therefore, several researchers focus on
company size with other aspects of the company such as size with structure
(Mintzberg, Lampel, Quinn & Ghoshal 2003, Johnson & Scholes 1999), size with
corporate culture (Hitt, Hoskisson & Harrison 1991), size with innovation
(Hammonds 2002), size with economies of scale (Lewis, Morkel & Hubbard 1993),
47

size with company’s strategic response (Clemens, Bamford & Douglas 2007) size
with decision making process (Kubicek 2006) and size with company performance
(Clayton & Arnold 1987) etc.
Researchers in the business field still debate how the company size should be
measured. Robbins (1987) claims that over 80 percent of research studies were using
the number of employees as a size measure. However, Robbins (1987) identifies some
criticisms about the number of employees as a size measure because it comprises full
time and part time employees and also some big companies can have a small number
of employees due to their high level of efficiency. Despite the criticisms Robbins
(1987) rated number of employees as a good measure because it was highly related to
other size measures such as total of assets etc.
Argenti (1980) views size as a critical strategic consideration for the company and
asserts that when a company grows it has to face three kind of major problems such as
lack of flexibility, adoption of formal procedures for management, and increase of
social responsibility.
According to Lewis, Morkel & Hubbard (1993) larger companies have the potential to
operate at lower unit costs than their smaller counterparts and therefore are in a good
position to gain competitive advantage. Mintzberg & Quinn (1996) asserts larger
organizations have more formalized behaviors, and also the more elaborate its
structure, that is the more specialized its jobs and units then the more developed will
be its administrative components. According to Hammonds (2002) large companies
cannot innovate easily. Thus, the research findings about the firm size and its strategic
success are ambiguous.
3.7.2.4 Organizational culture
Organization culture is a complex and deep aspect of organization that can strongly
affect the members of an organization (Champoux 2003). Schein (1985) defines
organizational culture as “a pattern of basic assumptions-invented, discovered, or
developed by a given group as it learns to cope with the problems of external
adaptations and internal integration that has worked well enough to be considered
48

valid and therefore, to be taught to new members as the correct way to perceive, think
and feel in relation to those problems”. Schein (1985) and Champoux (2003) identify
three dimensions of organizational culture such as the artifacts and creations, values,
and basic assumptions. Artifacts include sounds, architecture, language, products, and
ceremonies of an organization. Values tell organization members what they do in
various situations and basic assumptions tell organization members how to perceive,
think about and feel about work, performance goals, human relationships and the
performance of colleagues. According to Champoux (2003) artifacts of the culture
have the highest and basic assumptions have the lowest level of visibility for the
employees.
Barney (1986) in his research found that firms that have valuable, rare, and
imperfectly imitable cultures can be a source of sustainable competitive advantage for
the firm. The research of Carmeli & Ashler (2004) found a positive relationship
between organizational performance and organizational culture and Bate (1996)
asserts that companies need to think culturally about the strategy and strategically
about the culture. The study of Scroggins (2006) highlights the importance of the
culture when implementing successful strategies. Thus, company strategy, company
performance have a close link with company culture.
Figure 3.6 shows a simplified relationship between the environment, strategy and
organizational culture. According to the figure 3.6 the perceptions of the top
management of the company about the environment (strategy formulation) is
influenced by the initial values and practices of company’s members (organizational
culture). Similarly, strategic responses taken by top management to changing
environmental factors are also influenced by the organizational culture (Vecchio et al
1996). Thus, strategists need to consider their organizational culture when they
formulate and implement strategies.
49

Figure 3.6: The reciprocal influence view of strategy and environment as moderated by organizational culture.
Environment Top management team
C U L T U R E
Strategic response
Perceptual Process
Source: Vecchio, Hearn & Southey 1996, p702
Similarly, Kotter & Heskett (1992, p11) studies conclude the relationship between
corporate culture and company performance:
• Corporate culture can have a significant impact on a firm’s long term
economic performance
• Corporate culture will probably be an even more important factor in
determining the success or failure of firms in the next decade
• Corporate culture that inhibit strong long term financial performance are not
rare, they develop easily, even in firms that are full of reasonable and
intelligent people
• Although tough to change, corporate cultures can be made more performance
enhancing
Changing environmental conditions pressure the companies to change their cultures to
adopt new strategies to successfully respond to those changes. Stace & Dunphy
(1994) recognized powerful pressures that forced the organizations to change their
organizational cultures such as new technology, more demanding customers,
increased productivity, increased quality, increased responsiveness, increased product
differentiation and continuous innovation. Hellriegel et al (1998, p554) proposes a
number of requirements that a company needs to fulfill when they change their
organizational cultures such as:
• Understanding the old culture first to understand from where the changes must
start,
• Providing support for employees and teams who have ideas for better culture,
50

• Finding the most effective subculture in the organization,
• Not attacking culture head-on but, finding way to help employees and teams to
do their jobs more effectively,
• Treating the vision of a new culture as a guiding principle for change,
• Recognize that significant organization wide cultural change takes 5-10 years,
• Living the new culture because actions speak louder than words.
3.7.2.4.1 Sub cultures
Organizational cultures can be divided into different sub cultures and there are
number of reasons for developing sub cultures in an organization. Champoux (2003)
identifies three major reasons for developing sub cultures in an organization such as
different occupational groups, different social backgrounds and workforce diversity
and the global environment of an organization. Different occupational groups include
finance, accounting, manufacturing etc. and different social backgrounds include the
different income level families and people groups who have a variety of values and
view points. Workforce diversity includes the different people who come from
different races, religions, ages, sex etc. It is believed that companies with strong
cultures have a lesser amount of subcultures than companies with weak cultures.
3.7.2.5 Management style
During last four decades considerable strides have been taken to understand what
leadership is (Fiedler 1996), and Nysted (1997) clearly states how research about
leadership changes over time (see table 3.2).
51

Table 3.2 The evolution of the research about leadership
From beginning of this century-1940 The major assumption was that leaders possessed
universal characteristics that made them into
leaders and centered on the identification of traits
associated with great leadership
From 1940-1960 Focused on what leaders did rather than who the
successful leaders are
From 1960-1980 Focused on the view that effectiveness of
leadership depends on interaction between
leadership style and situation
In 1980’s Focused on charismatic, transformational, and
visionary leadership behavior, attribute
importance, both explicitly, to personality traits.
Source: Nysted (1997) Who should rule? Does personality matter?
Poulin & Hackman (2001) state the success of two firms in similar industry can be
varied and the two central explanations of such firm level differences in performance
was leadership and strategy. Hambrick (1987) conclude that the strategic success of
the firm mainly depend on the fit between the firm’s competitive environment and top
management team’s aptitudes, skills and knowledge base. Thus, leaders’ behaviors
have a major influence on company success.
Managers can adopt different styles to influence their subordinates and finally to
reach the company goals. Fiedler’s contingency model in leadership literature
explains why a managers may be an effective leader in one situation and ineffective in
another (Waddell, Devine, Jones & George 2007). According to Fiedler’s model
leadership style can be varied from relationship oriented to task oriented leaders.
Similarly, Robert House (House’s path goal theory) identifies four kinds of leadership
styles that can motivate subordinates such as directive (focus on getting the job done),
supportive (focus on subordinates), participative (give subordinates a say in decision
making) and achievement oriented (motivate subordinates to perform at the highest
level) behaviors (Wadel et al 2007). House’s Path goal theory further claims that
directive behaviors work when subordinates are having difficulties to complete tasks,
52

supportive behaviors work when subordinates are experiencing high level of stress,
participative behaviors work when subordinates support of a decision is required and
achievement oriented behaviors work when subordinates need to achieve higher level
or goals (Waddell, Devine, Jones & George 2007 p206).
Rapid changes in economic conditions in the globe and technological developments
have caused organizations to seek to increase their productivity by increasing their
management effectiveness. A number of research studies highlights the importance of
continuous leadership training (eg.Collins 2001, Sarri, Johnson, Mclaughlin &
Zimmerle 1988, and Collins & Holton 2004) to increasing management effectiveness
of companies. Sarri, Johnson, Mclaughlin & Zimmerle (1988) find that most US
companies expect stable or increase management training and education in the next
five years and the main reasons were the need to update managers on changing
concepts/skills and an increased company emphasis on management training and
education. According to Collins (2001) leadership development is truly effective only
when it adds value to the entire organizational system at all of the core levels namely
the organizational, group and individual levels.
3.7.2.6 Stakeholder expectations
Johnson & Scholes (1999, p213) define stakeholders as “those individuals or groups
who depend on the organization to fulfill their own goals and on whom, in return, the
organization depends”. According to Nix, Whitehead & Blair (1990) the concept of
organizational stakeholders is becoming increasingly important for organizations and
now stakeholder management is becoming an important approach for formulating and
implementing organizational strategies. Mitchell, Agle & Wood (1997) claim that an
“organization is an environmentally dependent coalition of divergent interest” and
according to Ackermann & Eden (2003) understanding the stakeholders and the
amount of power they have will help the organization to plan their future.
O’Shannassy (2003) identifies the roles of internal and external stakeholders in the
modern strategic management process which involves not only the strategic planning
but also the strategic thinking. Berman, Wick, Kotha & Jones (1999) find that firms
53

which address stakeholder concerns have enhanced financial performance. Harrison,
Bosse & Phillops (2007) by linking stakeholder theory and resource base theory show
why firms that identify the needs of a broad group of stakeholders properly may enjoy
a competitive advantage that is not available to other firms. Therefore, the
stakeholders of a company can have a great influence on the company’s success or
failure and it is the management’s duty to identify them properly.
Goodstein & Wicks (2007) identify five core arguments for how stakeholder
responsibilities influence company and also its broad implications for the companies
(see table 3.3). Morsing & Schultz (2006) analyze how corporate social responsibility
communication (CSR) effects stakeholders and propose a number of strategies for
CSR communication in order to better conceptualize how managers inform, engage
with and involve important stakeholders. Those strategies include improving
stakeholder information strategy to keep the general public better informed, and using
formal press releases such as annual reports and websites rather than advertisements
etc. Thus, CSR communication will help the companies to identify the changing
trends of stockholder’s expectations.
54

Table 3.3: Core arguments for stakeholder responsibility and its practical implications
Core stakeholder responsibility arguments Practical implications
Stakeholder responsibility provides a powerful
re-orientation in how to think about business
ethics
Firms and stakeholders share in the responsibility
for creating and sustaining an ethical business
context
Stakeholder responsibility is useful in helping
explain moral failures in corporations, assigning
blame to various stakeholders.
Stakeholder opportunism and/or indifference can
be an important determinant of unethical business
behavior
Stakeholder responsibility may prompt new
thinking about how to create organizations where
moral failures are rare.
Firms and stakeholders can work together to
create regimes of responsibility that limit moral
failures and promote ethical behavior
Stakeholder responsibility can be a vehicle that
aids our thinking about how we create
organizations that are noted for excellence and
outstanding performance
Business success depends on developing firm and
stakeholder relationships that foster both
responsiveness and responsibility.
Stakeholder responsibility gives us a language to
determine how we can conceptualize and work
through novel business challenges.
Firms can look to stakeholders as mutual partners
in striving for responsible business excellence.
Source: Goodstein & Wicks (2007) Corporate and Stakeholder Responsibility: Making Business Ethics A Two-Way Conversation
Savage, Nix, Whitehead & Blair (1990) identify four types of stakeholders that a
company have and propose four types of strategies that the company can adopt
against them (see the figure 3.7). The four types of stakeholders include supportive,
marginal, non supportive and mixed blessing stakeholders and the strategies they can
adopt for each category are involve, monitor, defend and collaborate respectively.
Savage et al (1990) also assert that managers must use an overarching strategy to
change relationships with stakeholders from less favorable to favorable categories.
55

Figure 3.7 Stakeholder categories
Mixed Blessing Strategy: collaborate
Supportive Strategy: Involve
Non Supportive
Strategy: Defend
Marginal
Strategy: Monitor
High Low
Stakeholder’s potential for threat to organization
High
Low
Stakeholders potential for cooperation with organization
Source: Savage, Nix, Whitehead & Blair (1990) Strategies for assessing and managing organizational stakeholders
3.7.2.7 Resource base view of the company (Resources, capabilities, competencies and core competencies)
The resource based view of the firm is one of the most widely accepted theoretical
perspectives in the strategic management field (Newbert 2007). In the resource based
view, a company is understood to be a bundle of assets and capabilities (Hafeez,
Zhang & Malak 2002) and these assets and capabilities are known as strategic
resources which can provide a competitive advantage for the company (Grant 1991).
The concept of organizational capability has attracted a lot of interest primarily in the
field of strategic management (Schreyogg & Kliesch-Eberl 2007). The study of
Molina, Pino & Rodriguez (2004) found a positive relationship between industry,
management capabilities and the firm’s competitiveness.
When the Porter’s market structural analysis expanded in the field of strategic
management in 1980’s, Prahalad & Hamel’s view of competencies and core
competencies spread in the field of strategic management as a counter view (Hubbard
2000). According to Clark (2000) core competency approach to strategy making is
one of many contributions within resource based view of the firm.
56

Prahalad & Hamel (1990) define core competencies as “the collective learning in the
organization, especially how to coordinate diverse production skills and integrate
multiple streams of technologies” and proposes three kinds of tests to identify them
namely they provide potential access to a wide variety of markets, must make a
significant contribution to the end product and must be difficult for competitors to
imitate.
It is worth noting that a company cannot develop core competencies without
managing their resources, capabilities, and or the competencies strategically. Figure
3.8 shows the Hafeez, Zhang & Malak (2002) proposed structured methodology for
identifying core competencies of a firm. Resources can be defined as anything
tangible or intangible owned by the firm and firm’s resources consist of physical
assets (location buildings), intellectual assets (brand name, reputation etc.) and
cultural assets (working ethics, empowerment etc.). Capabilities are the abilities to
make use of resources to perform some task or activity and competencies are valuable
capabilities in terms of “enabling the firm to deliver a fundamental customer benefit
(Hafeez et al 2002). The results of Clark (2000) find a number of organizational
factors can affect the ability to create core competencies such as organizational
culture, size, structure, stage of development and strategic focus of the organization.
57

Figure 3.8 Relationship between company resources and core competencies
Low Value High
Not Unique Uniqueness Very Unique
Core competencies
Competence Key Capabilitie
Firm capability Design R & D Purchasing Production Marketing Management etc.
Firm Resources Physical Assets Intellectual Asset Cultural Assets
Low Collectiveness High
Low Strategic Flexibility High
Source: Hafeez, Zhang & Malak (2002) Core Competence for sustainable competitive advantage: A structural methodology for identifying core competence
3.8 Strategic planning As discussed earlier, most of the concepts in strategic and corporate planning were
developed in the USA. Many of these concepts have been extensively adopted by
companies in different national environments (Capon, Farley & Hubert 1987). The
study of Capon, Christodoulou, Farley & Hubert (1986) highlights the significant
differences in the strategic planning practices of the Australian and the USA large
manufacturing companies. It is clear that the concepts in corporate and strategic
planning have been used by the companies in different national environments in
differing ways to achieve their organizational goals.
At the end of 1970s and early 1980s strategic planning suffered a downturn in
popularity (Glaister & Falshaw 1999) and came under heavy attack from management
scholars (Grant 2003). The major critique of the strategic planning was its low
performances in unstable environment (Mintzberg 1994 a, Mintzberg 1994 b, Quinn
58

1980). However, some research studies found that strategic planning was positively
associated with unstable environments (eg. Eisenhardt 1989, Grant 2003, Miller &
Cardinal 1994, Ansoff 1991, and Armstrong 1982). Thus, research findings about the
relationship between strategic planning and unstable environments are ambiguous.
Ansoff (1991) one of the prominent scholars in strategic planning criticises the
Mintzberg’s notion of “strategic planning can work only in stable environments” and
asserts that strategic planning generally produces better alignments and performances
than does trial and error learning. Furthermore, Miller & Cardinal (1994) conclude
that strategic planning and performance has a positive relationship and claims that the
results of Mintzberg (1990) and Greenley (1986) which shows planning does not
benefit performance appear to have been incorrect because of the methodological
errors in their research studies.
According to Mintzberg design school, strategy formulation must be a deliberate
behaviour of conscious thought and responsibility of that control and conscious must
rest with the chief executive officer (Mintzberg et al 1998). Thus, only the top
managers of an organization were involved with strategic planning. That was the
situation in strategic planning in 1960’s but, several studies highlight the changes that
occurred in strategic planning systems during last two decades. According to Bonn &
Christodoulou (1999) the substantial changes in company’s strategic planning systems
include increased flexibility of planning systems, decentralized strategic planning to
divisions or business units, moving the planning responsibility from staff personnel to
line managers, and changing the role of corporate planning departments. According to
Grant (2003) companies adopted multiple scenario planning for their strategic
planning practices to respond to the rapid changes in the environments quickly and to
also establish vision and mission statements which have a strategic intent. Thus,
current strategic planning practices in organizations are better equipped than the
strategic planning practices in 1960s.
Pearce, Freeman & Robbinson (1987a) define strategic planning as the process of
determining the mission, major objectives, strategies, and policies that govern the
acquisition and collaboration of resourses to achieve organizational goals”. O’Regan
& Ghobadian (2007) claim strategic planning must include written plans, which cover
59

more than year of activity, have awareness of alternative strategic options, encompass
shorter plans for major functional areas, identify future resource requirements,
encompass procedures for ongoing monitoring and modification, and include
environmental scanning data. Glaister & Falshaw (1999) identify the importance of
the link between long range strategic goals with both mid range and operational plans
for an effective strategic planning system. Steiner (1979, p34) assert “there is no
single planning model for organizations and the formal strategic planning systems
must be designed to fit the unique characteristics of each company”. Lorange &
Vancil (1977) identify three levels of an organization that strategic planning usually
involves namely corporate, business and functional levels.
3.8.1 Vision and Mission statements
Thomson & Strickland (2003) declare that effective strategy making starts with the
formation of a strategic vision which describe where the organization wants to go in
future. Corporate vision outlines the desired future at which the company hopes to
arrive (Wit & Meyer 1998) and David (1997) defines mission statement as a
“enduring statements of purpose that distinguish one business from other similar
firms”. Thompson & Strickland (2003 p32) proposes three major tasks that managers
complete in forming a strategic vision namely:
• Coming up with a mission statement that defines what business the company
is presently in and conveys the essence of “who we are, what we do, and
where we are now”.
• Using the mission statement as a basis for deciding on a long-term course,
making choices about “where we are going”, and charting a strategic path for
the company to pursue.
• Communicating the strategic vision in clear, exciting terms that arouse
organization wide commitment.
According to Wit & Meyer (1998) corporate mission plays three important roles for a
business organization namely:
• Direction: The corporate mission points the organization in a certain direction,
by defining the boundaries within which strategic choices and action must
take.
60

• Legitimization: The corporate mission can convey to all stakeholders inside
and outside the company that the organization is pursuing valuable activities
in a proper way.
• Motivation: The corporate mission can go a step further than legitimization, by
actually inspiring individuals to work together in a particular way.
Furthermore, several authors highlight important factors that a company must
consider when they create mission statements such as the importance of getting the
inputs from the bottom up (D’Orleans 2007), it must not be too far from the current
situation of the company (Campbell 1997), and the need to change their mission with
the environmental and products changes (Johnson 2007).
3.8.2 Objectives and Goals
Organizational goal setting is vital for every organization because it is the first step
that develops a road map for organizational activity and guidance for establishing the
metrics to measure company progress (Ransom & Lober 1999). Lorange & Vancil
(1977, p5) differentiate company’s objectives and goals by mentioning “an objective
is an aspiration to be worked toward in the future and a goal is an achievement to be
attained at some future date”. Thus, objectives come before the goals and Lorange &
Vancil (1977, p5-6) further elaborates the difference between objectives and goals in
terms of four dimensions.
• Time Frame: An objective is timeless and goal is temporal and time phased
and intended to be superseded by subsequent goals.
• Specificity: Objectives are stated in broad, general terms, dealing with matters
of image, style, and self-perception; goals are much more specific, stated in
terms of particular result that will be accomplished by a specified date.
• Focus: Objectives are usually stated in terms of some relevant environment
which is external to the organization; goals are more internally focused and
carry important implications about how the resources of the organization shall
be utilized in the future.
• Measurement: Quantified objectives are stated in relative terms and quantified
goals are expressed in absolute terms.
61

Several research studies identify the importance of setting objectives and goals in
corporate planning (eg Armstrong 1982, Bourgeois 1980). Furthermore, the study of
Roth & Ricks (1993) find firm’s nationality and internationalization do not effect the
firm’s goals configuration.
3.8.3 Analytical tools and techniques
A number of analytical tools and techniques that are used in the strategic planning
will be briefly discussed below.
SWOT analysis: SWOT represents the internal strengths and weaknesses of a
company and its opportunities and threats that exist in the external environments
(Farjoun 2001). Even though strategic management has grown in different directions
most of the strategic management text books continue to use SWOT model as their
centrepiece (Mintzberg et al 1998).
PEST analysis: PEST analysis can use to analyse the political/legal, economic, social
and technological factors in the macro environment that can affect the company and
also to identify which of those are more important for the company (Johnson &
Scholes 1999).Table 3.4 provides a simple checklist for PEST analysis.
Table 3.4: Checklist for the PEST analysis
Political/legal Monopolies legislation Environmental protection lows Taxation policy Foreign trade regulations Employment law Government stability
Economic Factors Business cycles GNP trends Interest rates Money supply Inflation Unemployment
Socio- cultural factors Population demographics Income distribution Social mobility Lifestyle change Attitude to work and leisure Consumerism
Technological Government spending on research Government and industry focus on technological effort New discoveries/development Speed of technology transfer Rates of obsolescence
Source: Johnson & Scholes (1999) p105
62

Five forces analysis: Five forces analysis is used to analyse company’s industry
environment. According to Porter (1980) industry structure has a strong influence in
determining the strategies potentially available for a company. Porter (2004) identifies
the five major forces as suppliers, buyers, competitors, new entrants, and substitutes
that control an industry. Thus, the results of Porter’s five forces analysis help the
company to adopt the most suitable strategies to position themselves well against their
competitors in an industry.
Key success factors analysis: Key success factors can be used as a description of the
major skills and resources required to perform successfully in a given market and
knowledge about key success factors is of practical managerial relevance (Bisp,
Sorensen & Grunert 1998). Thus identifying the key success factors in an industry is
important for every company.
Product life cycle analysis: Life cycle assessment techniques are a powerful tool to
calculate environmental impacts on firms products, systems and resource
consumption (Bhander, Hauschild & McAloone 2003, Mont & Bleischwitz 2007,
Berkhout 1996).With life cycle assessments products and services managers need to
identify which stage the product or service remains in (eg. introductory, growth,
maturity or decline) and to develop strategies according to the stage. For example if
the product is at introductory stage then company needs to implement more marketing
strategies to create awareness.
Portfolio analysis and strategy: The purpose of portfolio analysis is to analyse the
opportunities that exist outside of the company’s current scope and come to a decision
whether the firm must change the scope of its portfolio through diversification or
internationalization, or both (Ansoff 1965). When the opportunity arises, strategy can
be used to determine whether the opportunity fits with the firm’s strategic intent and if
it does not fit then the opportunity can be rejected.
ETOP & SAP analysis: Environmental threat and opportunity profile (ETOP) help
the managers to identify the threats and opportunities in the environmental sectors that
affect the company’s strategy such as from socioeconomic, technological, competitor,
supplier, and government environments etc. By doing a ETOP analysis managers can
63

identify the most critical sectors of the environment and focus intensively on their
potential impact on the strategy of the firm as a whole (Glueck & Jauch 1984).
Strategic advantage profile (SAP) analysis help the managers to identify the more
critical areas in the firm, which have a relationship to the strategic posture of the firm
in the future such as marketing, R & D operations, corporate resources, and finance
etc (Glueck & Jauch 1984).
The BCG matrix: BCG matrix was developed by Boston Consulting Group and it
can be used to compare company’s strategic business areas (Ansoff & McDonnell
1990). Figure 3.9 shows the BCG matrix. The vertical dimension of the matrix
represents the company’s volume growth and the horizontal dimension represents the
market share in relation to the share of the leading competitor. The BCG diagram
suggests how the company must take the future decisions regarding their strategic
business areas as follows:
• The star should be cherished and reinforced.
• The dogs should probably be divested, unless there are compelling reasons for
keeping them.
• The cash cows should be made to control (severely) their investments and send
excess cash to the headquarters.
• The wildcats need to be analysed to see whether the investment necessary to
convert them into stars is worthwhile (Ansoff & McDonnell 1990 p67).
Thus, BCG matrix is important for a company because it proposes decisions on the
desirable market share positions and allocations of strategic funds among the strategic
business areas (Ansoff & McDonnell 1990).
64

Figure 3.9 The BCG matrix
Stars
Wildcats
Cash cows
Dogs
High Volume Growth Low
High Low Market share as function of leading competitor
Source: Ansoff & McDonnell (1990) Implanting strategic management p67
McKinsey 7-S framework: In 1980 McKinsey consultancy company encouraged
managers to think about the interrelationship between 7 key variables that affect the
company’s effectiveness. Thus McKinsey 7-S framework focuses on the 7 variables
that affect the company effectiveness namely strategy, structure, systems, staff, super
ordinate goals, skills, and style of the company.
3.9 Strategic thinking
The concept of strategy making process being purely deliberate or purely emergent
lay in the two ends of a horizontal axis and where one end means no learning and
other end means no control (Mintzberg et al 1998). The scholars who think strategy
formulation as a strategic thinking process usually believe that strategy formulation is
based on an emergent strategy. Minztberg (1994) asserts strategic thinking is about
“synthesis that involves intuition and creativity that the outcome is an integrated
perspective of the organization, a not too precisely articulated vision of direction”.
Senders (1998) highlight the importance of strategic thinking over the strategic
planning by claiming:
• The business world is not mechanistic, and so mechanistic approaches to
strategic planning will not succeed
• Organizations are regularly impacted by unexpected sudden change, often
driven by events out side the company’s normal sphere of interest.
65

• Organizations are part of much larger systems, and need to be aware of both
the existence of this system and its interactions with it
Liedtka (1998) captured five essential discrete but, inter related elements in strategic
thinking process. Figure 3.10 shows the elements of Liedtka’s (1998) strategic
thinking model namely systems perspective, intent focused, thinking in time,
hypothesis driven, and intelligent opportunism.
A systems perspective considers a strategic thinker has a mental model about how the
world works and this include understanding of both the external & internal context of
the organization (Liedtka 1998). The dimensions of the external context of the
organization dominated the field of strategy for many years (eg Porter’s industry
analysis). But, not much focus was given to the internal dimensions that comprise the
organization. Even though the fit between corporate, business, and functional level
was considered more important, according to Liedtka (1998) fit with the fourth level
(the personal) may be the most critical for a company. Thus, strategic thinkers must
think about the multiple relationships between corporate, business, and functional
strategies with each other, to the external context, and to the personal choices he or
she makes on daily basis (Liedtka 1998).
Liedtka (1998) thinks strategic thinking is intent driven. Hamel and Prahalad (1989)
define strategic intent as “creating an obsession with winning al all levels of the
organization and then sustained that obsession over the 10-20 year quest for global
leadership”. Hamel and Prahalad (1989) further claim that strategic intent captures
the essence of winning, sets a target that deserves personal effort and commitment,
and implies a sizable stretch for an organization. Hence, strategic thinking is about
shaping and reshaping of intent (Liedtka 1998).
In addition to the intent driven focus there must be room for intelligent opportunism at
lower levels to capture the emergent strategies that might better suit the changing
environments (Liedtka 1998). This will provide opportunity for the lower level
employees to adjust to the changing environments without relying on the top
management foresight.
66

Thinking in time considers the importance of understanding the organization’s past
and current memory to create future. This includes “choosing and using appropriate
analogies from its own and others histories, and for recognizing patterns in these
events” (Liedtka 1998).
Finally, strategic thinking recognizes it as a hypothesis driven process that deals with
hypothesis generating and testing as central activities. Hypothesis generation question
asks the creative question what if….? and hypothesis testing follows with the critical
question if … then…? (Liedtka 1998) and this kind of experimentation provides the
background for the organization to continue their learning.
Figure 3.10 The elements of strategic thinking
Strategic thinking
System perspective
Intent focused Thinking in Time
Intelligent Opportunism
Hypothesis Driven
Source: Liedtka J.M. 1998 Strategic Thinking: Can it be taught?
3.10 Corporate level strategies
Corporate strategy defines “the scope of the firm’s operations and how the
management allocates or deploy its resources to make the whole firm a vital,
competitive enterprise” (Lewis et al 1993, p193) and corporate level will be
“concerned primarily with strategic resource flows to and from the various businesses
and providing a strategy for improving the quality of the portfolio” (Lorange 1980,
p18). The following chapters will discuss the major corporate strategies that are
available for a company to achieve their overall company goals. These corporate
67

strategies include diversification, internationalization, mergers and acquisitions,
R&D, turnarounds, and divestitures.
3.10.1 Diversification strategies
Over the last three decades the topic of corporate diversification has been a central
topic in the strategic management (Bowen & Wiersema 2005). Firms may diversify
into new product or foreign markets when they feel that the home markets are
maturing or when they want to reduce their overall risk exposure (Wan 2005).
According to Palich, Cardinal & Miller (2000) the results of studies conducted about
the link between diversification and company performance were ambiguous and
disagreements still remain how and when diversification can be used to build long-run
competitive advantage. These inconsistencies in the past research findings led to an
increase in research into the field of diversification.
Davis & Devinney (1997) identify two types of diversifications namely the related
diversification which diversify into similar lines of business or markets, and unrelated
diversification which diversify into unrelated lines of businesses. Finance theory
explains how the related diversification performs better than unrelated diversification
(because unrelated diversification is more similar to portfolio diversification that can
be done by the investors more cheaply in financial markets) and this is supported by
the study of Rumelt (1982). According to Davis & Devinney (1997), even though
unrelated diversification is negatively associated with company performance, it does
two primary things for the company namely it replaces the external market with an
internal system and it provides diversification benefits such as bankruptcy avoidance
for the company (by reducing the risk of investment).
Ansoff (1988) gives three major reasons for the question of why firms diversify.
Firms diversify when their objectives can no longer be gained from the current
portfolio, when their retained cash exceeds the total expansion needs of the present
portfolio and when the diversification opportunities promise greater profitability than
expansion opportunities.
68

Wiersema & Bowen (2008) developed a theoretical framework to understand how
industry globalization, foreign competition, and product diversification can influence
firm’s international diversification. The study of Wiersema & Bowen (2008) found
that industry globalization and foreign competition in the domestic market have a
positive relationship with the firm’s international diversification but the product
diversification has a negative relationship with the firm’s international diversification.
Hoskisson & Turk (1990) argue diversification provide two advantages for the
managers that the shareholders do not enjoy; increased compensation for managers
and reduced employee risk. Hoskisson & Turk (1990) view is associated with agency
theory and therefore, agency theory argues that diversification reduces the firm
profitability at the expense of manager’s benefits. By considering the conceptual point
of view, Geringer, Tallman & Oslen (2000) find that increasing levels of
diversification must have positive effects on performance due to economies of scope
and scale, market power effects, risk reduction effects, and learning effects. The
positive association between diversification and company performance is supported
by several research studies such as Geringer, Beamish & Dacosta (1988) in
multinational companies, and Rumelt (1982) in US companies. The research of
Palich, Cardinal & Miller (2000) find that performance increases when the company
shift from single business strategy to related diversification but, performance
decreases when firms change from related diversifications to unrelated diversification.
Thus, the findings of the link between diversification and performance have shown
mixed results during last few decades.
Hoskisson, Hitt, Johnson & Moesel (1993) measures the construct validity of an
entropy (an objective) approach to measurement of diversification strategy and the
results found that a strong convergent, discriminant and criterion-related validity for
the entropy measure of diversification. Convergent validity associates with the
Rumelt (1982) subjective measure of diversification, discriminant validity associates
with the size, debt and R & D intensity, and criterion related validity associates with
accounting and market based performance. The results of structural equations
modelling show a strong standardized validity coefficient with a diversification factor
representing 0.87 for the entropy and 0.94 for Rumelt’s measures. Thus, Hoskisson,
69

Hitt, Johnson & Moesel (1993) study recommends to use diversification factor with
both the entropy and Rumlet’s subjective measures for maximum accuracy.
By considering the resource based view and institutional economies, Wan (2005)
provides a conceptual framework to examine the multifaceted relationships linking
firm capabilities and corporate diversification across dissimilar country resource
environments (see table 3.5). Thus, companies need to choose the appropriate firm
capabilities (market capability and non market capability) and corporate
diversification strategy (product diversification and international diversification) to be
successful in their markets.
Table 3.5: Firm capabilities and diversification strategies for different country resource environments Country resource environment
Firm capabilities Performance implications of corporate diversification strategy
Developed economies In developed economies, firms are more likely to emphasise developing market capabilities than non market capabilities.
Product diversification will be negatively related to firm performance and international diversification will be positively related to firm performance.
Emerging economies In emerging economies, firms are more likely to emphasize developing non market capabilities than market capabilities.
In emerging economies, product diversification will be positively related to firm performance and international diversification will be negatively related to firm performance.
Institution-driven high growth emerging economies
In institution-driven high growth emerging economies, firms are more likely to emphasize developing (1) internal market capabilities than political capabilities and (2) production capabilities than innovation capabilities.
In institution driven-driven high growth emerging economies, (1) gradual decrease in product diversification will improve firm performance and (2) international diversification will be negatively related to firm performance
Factor-driven high growth emerging economies
In factor-driven high growth emerging economies, firms are more likely to emphasize developing (1) innovation capabilities than production capabilities and (2) political capabilities than internal market capabilities.
In factor-driven high growth emerging economies, (1) product diversification will be positively related to firm performance and (2)gradual increase in international diversification will be improve firm performance.
Source: Wan (2005): Country resource environments, form capabilities and corporate diversification strategies.
70

3.10.2 International strategy
The most profound business phenomenon of the 20th century was the
internationalization of companies (Hitt, Bierman, Uhlenbruck & Shimizu 2006).
Geographical expansion is one of the ways firms can grow and by leveraging
resources in different markets, firms can capitalize on market imperfections and gain
higher returns on their resources (Lu & Beamish 2001). Hitt, Hoskisson & Kim
(1997) define internationalization as “bringing new foreign operations within the
boundaries of a firm rather than using arm’s length market transactions”, and
international diversification as “expansion across the borders of global regions and
countries into different geographic locations, or markets”. Internationalisation of a
firm can be seen in a number of different ways such as in international joint ventures,
in licensing agreements, in international advertising campaigns, in international trade,
exhibitions and multitude of other events and actions etc (Johanson & Vahlne 1990).
The process theory of internationalization and the theory of the growth of the firm
consider internationalization as an incremental process and argue that the companies
need to start international entries when the firm is relatively older and the firm has
enough managerial experience about the foreign market (Erikkson, Johanson,
Majkgard & Sharna 1997, Johanson & Vahlne 1990). However, the study of
Sapienza, Autio, George & Zahra (2006) found that the effects of internationalisation
on firm’s age, managerial experience, and resource fungibility are moderate and
therefore, concluded internationalization as a potential strategic choice for the young
companies who seek growth. Thus, the research findings about when is the best time
for the internationalization of a firm are inconclusive.
Several researchers attempt to find the relationship between internationalization and
company performance. The research of Brewer (1981) finds that there is no
significant difference in risk adjusted performance between multinational companies
and US national companies in US. The study conducted by Denis, Denis & Yost
(2002) by using 44,288 companies between the years of 1984 and 1997 find a
negative relationship between performance and global diversification. However, the
research studies of Delios & Beamish (1999) and Lu & Beamish (2001) reported a
71

positive relationship between internationalization and company performance. The
results of the study of Lu & Beamish (2004) conclude that high and low levels of
internationalization and the extent of geographic diversification were negatively
associated with firm performance. Lu & Beamish (2004) further find that moderate
levels of internationalization and greater geographic diversity were accompanied by
higher performance.
Lynch (2006) asserts that the international expansion involves both benefits as well as
costs, and the companies with international expansion believe that the benefits
outweigh the costs. Lu & Beamish (2004) categorise the benefits that a company can
gain through international diversification into two categories such as exploration and
exploitation. Exploitation benefits include economies of scale and scope, reduced
costs and increased revenues by increasing a firm’s market power over its suppliers,
distributors and customers, and lower costs due to arbitrage of differences in inputs
and output markets. Exploration benefits include enhanced knowledge base,
capabilities, and competitiveness as a result of firm’s subsidiaries in host countries
(Lu & Beamish 2004). The costs of international expansion include the need to
acquire foreign market knowledge, the early administrative costs of developing an
international operation, the later costs of the complexity, the governance of
international operations, and the legal, cultural, and other barriers that exist in the
foreign market (Lynch 2006).
Other researchers focused on the modes of foreign market entries from several
perspectives. Madhok (1997) looks at entry modes from a transaction cost and
organizational capability perspective. Transaction cost perspective in
internationalization is mainly concerned about the minimising of transaction cost and
also the conditions underlying market failure (Rugman 1986), and organizational
capability perspective is mainly concerned about the historical dimensions of firm’s
critical activities that can gain competitive advantage for the company (Madhok
1997). The study of Madhok (1997) concludes that organizational capability
perspective is more helpful for the companies to decide their entry mode than the
transaction cost perspectives of internationalization. The research of Zahra, Ireland &
Hitt (2000) find that foreign start-ups and acquisitions increase the speed of
72

technological learning and the lower level of ownership entry modes have negative
effects on the speed of technological learning.
3.10.3 Acquisitions and merger strategies
Mergers and acquisitions continue to be a popular growth strategy during 1980’s and
1990s (Lubatkin & Michael 1988, Richey, Kiessling, Tokman & Dalela2007). Even
in 2004, global mergers and acquisitions were worth 1.95 trillion USD and that was a
41% growth from 2003 (Richey et al 2007). The main reasons for an increased
number of mergers and acquisitions were competition, deregulation, market
liberalization, technological change, globalization of world economies, and
availability of capital for the companies (Schweiger & Very 2001, Romanek 2002).
Mergers and acquisitions have a unique potential to transform firms and to contribute
to corporate renewal (Salama, Holland & Vinten 2003) and the substantial changes
that a company can have due to mergers and acquisitions include changes in the
company size, scope of operations, and level of involvement by market participants
(Lipson & Mortal 2007). According to Salama, Holland & Vinten (2003) mergers and
acquisitions help companies to renew their market position at a speed that cannot be
achieved through internal developments.
A merger is a combination of two companies in which only one company can survive
and the merged company goes out of existence, and an acquisition typically refers to
one company (the buyer) which purchases the assets or shares of the seller or other
assets of value to the seller (Romanek 2002). Value creation is the most important
objective in acquisition (Salama, Holland & Vinten 2003) as well as the merger
(Lubatkin & O’Neill 1988) processes.
A company can merge with or acquire firms which are in a related industry (similar
industry or product line) or in an unrelated industry. By studying 343 mergers and
acquisitions, the study of Richey et al (2007) indicate that most of the companies
prefer to make mergers and acquisitions related to their industry. Bergh (1997) asserts
that companies making unrelated acquisitions can have financial synergy, governance
efficiency, managerialism, and coinsurance. However, Bergh (1997) further claims
73

that a high portion of unrelated acquisitions are divested shortly after their purchase
and it bring losses to the acquiring company.
Several research studies focus on the relationship between company performance and
value creation with the acquisitions and mergers. After studying long term
performance of 69 mergers in Tokyo stock exchange from 1969 to 1999, the study of
Kruse, Park, Park & Suzuki (2007) finds a high correlation between the pre merger
and post merger performance. Kruse, Park, Park & Suzuki (2007) also found that
those improvements in performance are greatest among the diversifying mergers and
moreover, the merger companies operating in different industries had significantly
greater performance. According to Lubatkin & O’Neill (1988) even related mergers
theoretically offer the greatest potential for value creation, in practice this great
potential was not easily obtained. In contrast to Lubatkin & O’Neill (1988) the
research of Cummins and Xie (2007) find that mergers and acquisitions in US
property liability insurance industry during the period of 1994-2003 were value
enhancing. The results of Anand & Singh (1997) point out consolidation oriented
acquisitions outperform diversification oriented acquisitions in the decline phase of
their industries in terms of both the stock market based and operating performance
measures. Thus, the research findings about the relationship between mergers and
acquisitions with the company performance and value creation were inconclusive.
3.10.4 Research and development strategies
The spending on company’s R & D activities in the companies has been increased
during recent years (Scinta 2007). According to Tirpak, Miller, Schwartz & Kashdan
(2006) “research and development activities has a large impact on a company’s ability
to execute its business and technology strategy”. Ikoma (2005) asserts that the
ultimate goals of R & D are the evolution, strengthening, and expansion of the
company’s core capabilities which were needed to cultivate new businesses. The
study of Tubbs (2007) finds a positive relationship between R & D activities and
company business performance. Scinta (2007), Cassiman & Veugelers (2006), and
Blau (2007) explained the importance of R & D was to create innovation within a
74

company. Thus, it is worth noting that R & D strategies seek to create innovation in
the company and finally, to lift the company financial performance.
Chiang (2006) identifies the relationship between product life cycle of the high tech
products and the R & D activities of the firm. According to Chiang (2006), much of
the R & D precedes a product’s introduction before any income was generated. In the
introduction and growth stages, R & D effort is dedicated to product enhancement,
fixing problems, and resolving conflicts with newly developed equipment or software.
Chiang (2006) further asserts that only little R & D is needed at the maturity stage
because most of the problems were fixed at the earlier stages and products features
have been enhanced to a satisfactory level.
Cossiman & Veugelers (2006) highlighted the importance of having external
knowledge in addition to companies internal R & D. Firms can gain external
knowledge from licensing, R & D outsourcing, company acquisition, or the hiring of
qualified researchers with relevant knowledge. The results of Cassiman & Veugelers
(2006) further found that internal R & D and external knowledge acquisitions are
complementary activities that lead to increase company’s innovation.
3.10.5 Turnaround strategies
In 1970s research was initiated to investigate how firms reverse threatening
performance declines and this research considered firm performance declines as a
strategic decision problem to be solved by a turnaround strategy (Barker & Duhaime
1997). Furman & McGahan (2002) define turnaround as a “change in business
segment profitability from lowest quintile among all businesses in a specific year to
the highest quintile among all the businesses in any subsequent year”. Rasheed (2005)
sees the number of factors that influence the turnaround strategy of a firm in two
perspectives namely external and internal. External perspective includes the firm’s
competitive environment and the maturity of the industry and internal perspective
includes financial deterioration and management failures.
75

There are a number of turnaround strategic options available for firms. The study of
Frost & Joson (1998) proposes change of management, business process re-
engineering, asset sale, strategic alliances, service improvements, cost reduction as
turnaround strategies for the electric utilities in New Zealand and Philippines.
Similarly, Rasheed (2005) identifies growth and retrenchment as turnaround strategies
for the small sized companies.
3.10.6 Divestiture strategy
Capron, Mitchell & Swaminathan (2001) define asset divestiture as the “partial or
complete sale or disposal of physical and organizational assets, shut down of
facilities, and reduction of work forces of target or acquirer businesses”. According to
Capron, Mitchell & Swaminathan (2001) asset divestiture is a logical consequence of
a process in which firms often use acquisitions to reconfigure the structure of
resources within firms.
Unsuccessful acquisitions can lead to divestitures (Bergh 1997) and the choice to
organize a transaction as an alliance instead of as a divestiture is similar to the choice
between an alliance and an acquisition (Villalonga & Mcgahan 2005). Villalonga &
Mcgahan (2005) further explain that by stating “when two companies agree to transfer
rights for operating a business, the choice between an acquisition and an alliance for
one of the firms amounts to a choice between a divestiture and an alliance for the firm
on the other side of the transaction”.
The study of Duhaime & Grant (2006) finds that in large diversified companies,
corporate divestment decisions were mainly influenced by their business unit’s
strengths, its relationship to other units in its firm and its parent firm’s financial
position compared to its competitors. According to Bergh (1997) unrelated
acquisitions led to significant amount of divestments during last two decades.
However, Bergh (1997) further claims that confirm that most of the unrelated
acquisitions that were divested could have been avoided if the companies properly
understood their motives for the acquisitions.
76
3.11 Chapter Summary This chapter has discussed the literature review for this research study and it has come
to number of conclusions. First it demonstrates that the only way of understanding the
philosophy of strategy is to understand the diversity of definitions given by so many
outstanding thinkers in the field of strategic management. Then the literature review
came to the conclusion that the definition for the strategy can be changed according to
the formation process of the strategy and the purposes of the business. Then the
literature asserts that study of the evolution of the field of strategic management helps
to understand some of the conflicting views in the field of strategic management.
There were four levels of strategy identified in a diversified company namely
corporate, business, functional, and operational .Strategic management process were
divided in to three major parts such as strategic analysis, strategic choice, and strategy
implementation. Strategic analysis includes the environment, expectations and
purpose, resources, competencies and capabilities of the company. Strategic choice
includes bases of strategic choice, strategic options, and strategy evaluation and
selection. Strategy implementation includes organization structure and design,
managing strategic change, and resource allocation and control.
The environment of the company falls into two categories namely the internal and
external environments. External environment consists of three major environments
namely the general, industry, and competitor environments. General environment is
divided into six major dimensions namely demographic, sociocultural, political/legal,
technological, economic, and global environments. There were five competitive
forces that affect the competition in an industry namely entry of new competitors, the
threat of substitutes, the bargaining power of suppliers, the bargaining power of
buyers, and the rivalry among the existing competitors. Competitor environment
consists of the competitor’s actions and increased rivalry between companies leads
companies to pay more attention to competitor analysis. The internal environment of a
company consists of dimensions such as company structure, ownership, size, culture,
management style, stakeholder expectations, company resources, capabilities,
competencies, and core competencies.
77

In 1990’s prominent authors in the strategic management field fell into two categories
in the way they look at strategy namely strategic thinking and strategic planning.
Strategic planners think of the strategy management process as a planning process
while the scholars who support the strategic thinking think of strategic management as
a learning process. The major criticism of strategic planning of the 1960s was it does
not work in changing environments. However, it was found that strategic planning has
gone through substantial changes during last two decades to respond well to changing
environments. A number of scholars have found that strategic planning still has a
major role in large companies. Under the strategic planning framework, the vision and
mission, goals and objectives and the major analytical tools and techniques that are
used for strategic planning have been described. Liedtka (1998) proposes five discrete
but, inter related elements for the strategic thinking viewpoint such as system
perspective, intent focused, intelligent opportunism, thinking in time, and hypothesis
driven. The scholars who support strategic thinking believe strategic thinking work
better in changing environments than strategic planning.
The literature review also demonstrates the different ways that the various authors in
the strategic management use the terms of strategic thinking and strategic planning.
One of the way is strategic planning can provide a supportive context for the
employees to think strategically. Thus, organizations can have strategic planning
systems and also encourage the employees to create strategic thinking within the
organization.
Finally, the major corporate strategies that were discussed in the literature review
include diversification, internationalization, acquisitions and mergers, R & D,
turnarounds, and divestitures strategies.
The next chapter will present the theoretical framework and research questions of this
study.
78

PART TWO
THEORETICAL FRAMEWORK AND METHODOLOGY Chapter 4: Theoretical framework and research questions Chapter 5: Methodology
79

Chapter 4: Theoretical framework and research questions 4.1 Introduction The previous chapter presented the theoretical foundation for this research and it
described the history and evolution of the field of strategic management and its major
relevant issues which are important for this research study. This chapter aims to develop
a theoretical framework to explore the strategic management practices of the Sri Lankan
commercial banks and it will cover all the major features of banks strategic
management activities. The theoretical frame work is based predominately on the
previous studies conducted by Christodoulou (1984), Bonn (1996), Nimmanphatcharin
(2002), Kakanamveetil (2004), and Angkasuvana (2005) but, adapted to the Sri Lankan
banking industry and in accord with the major research questions of this study. The
major research questions of the study will also be stated in this chapter.
4.2 Theoretical framework
Previous research has investigated the strategic management practices of large
organizations such as Christodoulou (1984), Bonn (1996) for Australian manufacturing
companies, Nimmanphatcharin (2002) for Thai financial companies, Kakanamveetil
(2004) for Indian manufacturing companies, and Angkasuvana (2005) for Thai hotel
companies. But no one has attempted to investigate the strategic management practices
of Sri Lankan commercial banks previously and therefore, this research aims to explore
the strategic management practices in Sri Lankan commercial banks. The theoretical
framework developed for this study is based predominately on the previous research
conducted by Christodoulou (1984), Bonn (1996), Nimmanphatcharin (2002),
Kakanamveetil (2004), and Angkasuvana (2005) but, adapted to the Sri Lankan banking
industry and in accord with the major research questions of this research study. The
theoretical framework for this study is shown in the figure 4.1 and the key features of
the theoretical framework are described:
80

1. Banks environment categorized into two major environments namely the
internal environment and the external environment.
2. Major variables of internal environment include company structure, company
size, company ownership, organizational culture, management styles,
stakeholder expectations, key capabilities and the key success factors of the
commercial banks.
3. Major variables of the external environment include the demand and competitive
environments, company customers and competitors, company suppliers and
business sector, political, legal, economic, social and technological
environments.
4. Analytical tools and techniques which are used to scan the banks environments
include PEST, five forces, SWOT, key success factors, product life cycles,
BCG, total quality management etc.
5. Investigating strategic management practices in Sri Lankan Commercial Banks
includes investigating both the strategic planning and strategic thinking
capabilities of the banks.
6. This framework recognizes the importance of vision and mission statements, and
establishing long term goals at the corporate and second levels.
7. The corporate strategies investigated include product and market growth,
research and development, international, acquisitions, divestitures, mergers, and
turnaround strategies.
8. This framework identifies the three major steps in the strategy development
process namely strategy formulation, strategy implementation and strategy
evaluation.
The theoretical framework developed for this study was designed to explore the
strategic management practices in Sri Lankan commercial banks and will be used as a
guide for this research study.
81

Figure 4.1 Theoretical Framework (strategic management processes)
Vision and
Mission statement
Internal environment
External environment
Key opportunities, threats, streangths and weaknesses
Establish Long-term goals
Strategic planning and its extended strategic thinking capabilities
Company strategies
Establish policies Long term resource allocation
Establish procedures
Measure & evaluate performance
Environmental Scaning
Environmental Scaning
Analysing Tools & Techniques
Analysing Tools & Technique
Strategy Evaluation
Strategy Implementation
Strategy Formulation
Feed
back
82

4.3 Research questions There were two major reasons to develop major research questions instead of research
hypothesis. First, this research plans to investigate a large number of variables that can
affect the strategic management practices in Sri Lankan commercial banks and
therefore, it is hard to develop hypotheses for all these variables. The other reason is
without any prior research it is difficult to develop hypotheses for the variables because
it is hard to imagine how these variables behave in the banking environment of Sri
Lanka. The literature review and the major research objectives of this research study led
to the development of six major research questions namely:
1. What are the overall strategic management characteristics of Sri Lankan
commercial banks?
2. What are the internal environmental factors which influence the strategic
management practices of Sri Lankan commercial banks?
3. What are the external environmental factors which influenced the strategic
management practices of Sri Lankan commercial banks?
4. What are the strategic planning practices (of formal planning companies) and
strategic thinking capabilities of the Sri Lankan commercial banks?
5. Do the strategic management practices of the banks differ due to ownership,
size and planning system aspects?
6. Without a formalised strategic planning system, how do the commercial banks
strategically manage their banks? 4.4 Summary The theoretical framework developed for this study is designed to explore the strategic
management practices of Sri Lankan commercial banks and it will be used as a guide
for this entire research study. The theoretical framework of this study recognizes the
importance of vision and mission statements; establishment of long term goals,
environmental variables, two theoretical views of strategic management namely the
strategic planning and the strategic thinking capabilities, and three stages of strategic
management process namely strategy formulation, strategy implementation and strategy
83

evaluation. Finally, six major research questions were established for this research
study.
The next chapter will explain the methodology adapted for this research study.
84

Chapter 5: Methodology
5.1 Introduction
The previous chapter discussed the theoretical framework and the major research
questions developed for this study and this chapter will explain the methodology
adopted for it. The methodology will be explained under the major headings of
population definition, survey approach, instrument development, pre test of
questionnaire, final questionnaire, data collection procedure, data analysis and the
framework for data analysis of the entire research study.
5.2 Population definition
The Sri Lankan financial system has a Central bank, licensed commercial banks,
licensed specialised banks, registered finance companies, primary dealers, leasing
establishments, merchant banks, savings and loan associations, contractual savings
institutions, and individual money lenders. Even though there are large numbers of
institutions in the financial system of Sri Lanka, the licensed commercial banks
dominate the financial industry of Sri Lanka. For this reason, this research chose all the
commercial banks as the population for this study. As at 31st December 2005, there
were twenty two commercial banks operating in Sri Lanka and among those 22 banks 2
were government owned, 9 were locally owned and 11 were foreign owned banks.
5.3 Survey Approach
5.3.1 Primary data
Researchers have a number of options to collect their primary data such as personal
interviews, self administered surveys, telephone surveys, mail, the internet and other
means of distributing self administered questionnaires etc. The size of the sample and
85

its geographical diffusion has a high impact on researcher’s decision about how
respondents are to be contacted and the required information to be collected (Gill 2002).
If the research objectives require an extremely lengthy questionnaire, personal interview
may be the only alternative and that can take longer to administer perhaps an hour and a
half (William 2003). Because of the length of the research questionnaire, this research
chose the personal interview approach as the main primary data collection method. Two
other major reasons also influenced for this decision. Firstly, personal interviews
increase the possibility of collecting confidential data through face to face interviews
rather than mail surveys. Secondly, personal interviews increase the chance the
respondents will answer all the questions in the questionnaire rather than mail surveys.
When considering the previous studies of a similar nature, Nimmanphatcharin (2002)
and Angkasuvana (2005) reported a higher response rate by choosing personal
interviews as their primary data collection method than the Kakanamveetil (2004) study
which adopted the mail survey method. Therefore, this research chose the personal
interview as the most appropriate method to collect primary data from the Sri Lankan
commercial banks. All the interviews will be conducted by the same researcher to avoid
any possible differences in the recording process.
5.3.2 Secondary data
Secondary data mainly gathered from the published annual reports and the journals of
the Central Bank of Sri Lanka. In addition to that annual reports of commercial banks,
articles written about the commercial banks and the banking industry of Sri Lanka,
internet web sites of commercial banks of Sri Lanka and other published papers
regarding the commercial banks and the banking industry of Sri Lanka on internet web
sites were used as secondary information for this research study.
5.4 Instrument development
In previous research, Christodoulou (1984), Bonn (1996), Nimmanphatcharin (2002),
and Angkasuvana (2005) used questionnaires as their survey instruments and similarly,
a questionnaire has been developed for this research study. The newly developed
86

questionnaire is mainly based on the questions developed in Christodoulou (1984),
Bonn (1996), Nimmanphatcharin (2002), Kakanamveetil (2004) and Angkasuvana
(2005) studies but, redeveloped for the Sri Lankan banking industry and the major
research questions of the study. New variables such as stakeholder expectations, sub
cultures, internal politics, banks capabilities and key success factors have been added to
the research questionnaire to explore the strategic management practices of Sri Lankan
commercial banks more thoroughly. In addition elements of Liedtka’s strategic thinking
model (1998) were included to investigate the strategic thinking capabilities. The
questionnaire developed for this study will be used to conduct personal interviews with
the senior executives who are responsible for corporate planning of their commercial
banks.
The questionnaire consists of both the open ended and closed ended questions with open
ended questions designed to capture the responses when the range of responses is not
known. The questionnaire of this study consists of 280 questions and 19% of the
questions were open ended questions. The questionnaire was designed to fulfil the
following requirements.
1. Avoid complexity of language
2. Avoid leading and loaded questions
3. Minimise the ambiguity of the questionnaire
4. Avoid double-barrelled items and burdensome questions in the questionnaire
5. To provide data meaningful for analysis and interpretation
5.4.1 Pre-test of the questionnaire and the final questionnaire
The questionnaire designed for this study was pre tested with 2 persons, one was a
retired DGM at a private commercial bank who had more than 20 years experience in
corporate planning and the other person was a respondent of a government owned bank
who lectures in strategic management at the Open University of Colombo. The pre-test
concluded that,
1. The questions were clear, short and easy to understand
2. The format was clear and logical
87

3. The questionnaire had high credibility
4. The questionnaire could be completed within 2 hours
5. The questionnaire can be used with out doing any amendments
The final questionnaire consists of three major parts (Appendix 1). Part 1 includes the
assessment of internal and external environments and part 2 includes the assessment of
the company’s mission and vision statements, long term objectives and strategic
planning and it’s extended strategic thinking capabilities. Part 3 consists of the
assessment of analytical tools/techniques which are used for corporate planning,
corporate level strategies and the management of quality of the company.
5.5 Data collection procedure
All the 22 commercial banks of the Sri Lankan banking industry were set as the
population for this study and those 22 commercial banks include government owned,
locally owned and foreign owned banks. Because of the smaller number of banks in the
population, this study had to design its data collection process very carefully to
encourage the banks to participate in this research. The main reason for that was
rejection of the offer by one bank will reduce the response rate of the whole study by
4.5%. The previous studies conducted by Nimmanphatcharin (2002), Kakanamveetil
(2004) and Angkasuvana (2005) reported a lower level of response rate from the foreign
owned companies than the locally owned companies. Thus, a major priority was given
to encourage foreign owned banks to participate in this research so as to keep the
response rate at a higher level for the whole study.
The first task of the data collection procedure was to establish a good network of people
who have access to senior management levels in the Sri Lankan commercial banks.
Long distance calls and emails were used to create the network and the researcher’s 5
years experience in the banking industry in Sri Lanka helped to find out the important
persons in the industry. Once the researcher found the senior executives who were
responsible for their corporate planning then the introductory letters were sent to the
respondent banks about the study. It is worth noting that finding senior executives
88

through personal contacts was the only way to reach them rather sending introductory
letters to the respondent banks.
5.5.1 Introductory letter and the letter of consent
In the introductory letter (Appendix 2) the reasons for conducting the research, the
importance of participating in this kind of research for the banks and also for the
banking industry, the primary data collection method, and the requirements to be a
respondent of the research were clearly mentioned. To satisfy the university
requirements a letter of consent (Appendix 2) also was attached to the introductory
letter to get the permission to enter into the premises of the bank where the personal
interviews were to be held. The researcher of this study arrived in Sri Lanka on 15th of
February 2006 to collect the primary data through personal interviews with the senior
executives who are responsible for Banks corporate planning and he had to stay three
months to complete the primary data collection.
5.5.2 Interview process
Before arriving in Sri Lanka, the researcher of the study had approached 8 banks
through personal contacts and all 8 banks had promised to participate in the study.
Those 8 banks included 6 locally owned and 2 foreign owned banks. After arriving in
Sri Lanka, the researcher had to expand his personal network to find senior executives
of the other 14 banks. First, the personal interviews of the eight promised banks were
conducted while approaching the other 14 banks. It took another 3 weeks to approach
all the other 14 banks through personal contacts. Research questionnaires were handed
over to the respondents before conducting the personal interviews (usually 3-4 days
before) with them. The main purpose of that was to provide an opportunity for the
respondents to familiarize themselves with the questions that were going to be asked in
the personal interviews.
Only one foreign owned bank refused to participate in this study and the given reason
for the refusal was their senior management decision not to provide internal information
for any kind of research study conducted by an outsider. Within 3 months the researcher
89

of this study was able to complete 19 personal interviews. To complete one interview
the researcher usually had to spend one and half to two hours with each respondent.
Most of the time researcher had to meet each respondent three to four times to
complete the whole interview and the reason for that was the inability to spend 2 hours
straightaway with the researcher due to busy time schedule of the senior executives.
Two interviews had to be conducted over the phone due to unavailability of the
promised respondents of two foreign owned banks during the researcher’s stay in Sri
Lanka. Those interviews were conducted over the phone when the researcher returned
to Melbourne.
5.6 Response rate
Except for one foreign owned bank all the other banks have participated in this research
study. Locally and government owned banks represented a 100% response rate while
foreign owned banks represented 90.9%. Thus, the response rate of all the banks for this
study was 95.5%.
5.7 Data analysis
The research questionnaire consisted of both quantitative and qualitative research
questions and therefore, to analyse the primary data both the quantitative and qualitative
data analysis methods were adopted. The qualitative data analysis methods were used to
analyse the data that consists of descriptions of events and the quantitative analysis
methods were used to analyse the data that consists of numerical figures.
Both the descriptive and inferential statistical methods were used in this study. The
descriptive analyses include calculating averages, frequency distribution, and
percentage distributions etc. The inferential statistics were used to generalize the sample
results to the population and these include Cramer’s V and its statistical significant
value P when it is less than 0.05.
The SPSS data analysing software was used to do all the data analyses and also to create
the data base of the primary data to satisfy one of the major objectives of this research.
90

5.8 Framework for analysis
The theoretical framework and the major research questions that were described in
chapter 4 put the foundation for development of a framework for the data analysis of the
entire research. The framework for data analysis explains how the sample was analysed
to answer the major research questions, and it will also identify the major analysis steps
for the entire research study. The framework developed for the data analysis is shown in
figure 5.1 and it consists of six major parts.
1. Categorize the sample companies according to size, ownership and planning
system aspects.
2. Analysis of the elements of internal environment such as size, ownership,
organizational culture, management style (also power distance and internal
politics), stakeholder expectation, capabilities, and key success factors.
3. Analysis of the external environment which consist of demand environment,
competitive environment, and general environment.
4. Analysis of the company’s mission and vision, long term goals at corporate level
and second level.
5. Analysis of strategic management practices by analysing the strategic planning
and strategic thinking capabilities.
6. Analysis of banks strategies, tools and techniques that are used to develop
strategies and the management of quality.
When analysing the data of the entire research according to the above mentioned six
major steps, significant differences of the variables either by size, ownership or
planning system aspects will be highlighted. To consider the size aspects, all the sample
companies were divided into three categories namely large, medium and small.
Similarly, ownership aspects of the sample companies were divided into three
categories namely government owned, locally owned, and foreign owned companies.
Planning system aspects were concerned with the companies who have a formalized
strategic planning system (FSP) and the companies who have a non formalized strategic
planning system (NFSP).
91

Figure 5.1 Framework for analysis
Mission & Vision
Long term goals at corporate and second level
Planning practices at FSP banks
Planning practices at NFSP banks
Strategic thinking capabilities
Strategies and processes
Organizational Culture
Management style, Power and internal politics
Stake holder expectations
Capabilities, Key success factors
External environment
Competitive environment
Size
Ownership
Planning system
Large
Medium
Small
Government owned
Locally owned
Foreign owned
FSP companies
NFSP companies
General environment
92

5.9 Chapter Summary
All the 22 commercial banks in the Sri Lankan banking industry were chosen as the
population for this research study. Except for one foreign owned bank all the other
banks participated in this research study and therefore, the response rate of the whole
study was 95.5%. Because of the length of the research questionnaire personal
interviews were used as the main primary data collection method. Secondary data was
mainly collected from the Central bank of Sri Lanka, and the web sites and annual
reports of Sri Lankan commercial banks. A research questionnaire was used to conduct
all the interviews and the research questionnaire was mainly based on the questionnaires
used by the previous research studies of Christodoulou (1984), Nimmanphatcharin
(2002), Kakanamveetil (2004), Angkasuvana (2005) but, redeveloped for the Sri
Lankan banking industry and the major research questions of the study. Establishment
of personal contacts with the senior executives was more vital than sending introductory
letters to gain participation from the responding banks. Once the researcher contacted
the respondents through personal contacts then the introductory letter was sent to them.
In the introductory letter the importance of participating in this kind of research study,
primary data collection method, interview duration, and the requirements to be a
respondent of the research were clearly mentioned.
Both the quantitative and qualitative analysis methods were used to analyse the primary
data. This includes descriptive and interferential statistical analysis methods. Both the
univariate and bivariate statistics were used to find out the results of one variable and
two variables respectively. The SPSS data analysis software was used to do all the data
analysis of this research and also to create the data base for the research study.
The next chapter will explain the characteristics of the sample companies.
93

PART THREE
DATA ANALYSIS Chapter 6 : Characteristics of sample companies Chapter 7 : Company structure, company ownership and company size Chapter 8 : Organizational culture, management style and stakeholder expectations Chapter 9 : External environment Chapter 10: Mission, vision and long term goals at corporate and second levels Chapter 11: Planning and planning systems Chapter 12: Strategic thinking capabilities Chapter 13: Analytical tools/ techniques, corporate strategies and the management of quality
94

Chapter 6: Characteristics of sample companies 6.1 Introduction This chapter will discuss the major characteristics of the sample companies such as the
industry participation, respondents’ aspects, ownership aspects, size aspects and
planning system aspects and all the sample companies will be categorised according to
the size, ownership and planning system aspects. The major considerations for the
categorizations of sample companies in terms of size, ownership and planning system
aspect will be discussed. A summary of the major findings of the characteristics of the
sample companies will be provided at the end of the chapter.
6.2 Industry participation As at 31st December 2005, there were 22 commercial banks operating in Sri Lanka and
all the banks were invited to participate in this study. Except for one foreign owned
bank, all the other banks participated in this study. Therefore, the participation rate for
this study was 95.45%. Table 6.1 reveals the names of the commercial banks which
participated in this study.
Table 6.1: Banks that participated in this study
Bank Name Number of branches Domestic banks People’s Bank (Government owned) 324 Bank of Ceylon (Government owned) 304 NDB Ltd 24 Hatton National Bank 140 Commercial Bank 114 Sampath Bank 85 Pan Asia Bank 20 Seylan Bank 102 Nations trust Bank 27 DFCC Vardhana 14 Union Bank of Colombo 11
Total No: of Banks: 11 Total No: of branches 1165
95

Table 6.1: Banks that participated in this study (continued) Foreign Bank Branches Number of branches
HSBC 11 MCB 3 State Bank of India 2 Indian Overseas Bank 2 Indian bank 1 Union Bank of Pakistan 1 Habib Bank 2 Deutsche bank Ag 1 Citibank 1 Public Bank Berhad 1
Total No: of Banks: 10 Total No: of branches 25 {Standard chartered bank which has 14 branches in Sri Lanka did not participate in this study} 6.3 Respondent aspects The major concern about the respondents was to find a person who was responsible for
corporate planning in their banks. All of the twenty one banks which participated in this
study nominated a person who was responsible for their corporate planning and the
respondent’s job titles are shown in the table 6.2.
Table 6.2: Respondents job titles Position No: of participants Chief Executive Officer (CEO) 1 Deputy General Manager (DGM) 1 Director –Research & development 1 Director –Training 1 Assistant General Manager (AGM) 1 Financial controller 2 Head of finance & planning 3 Head of finance 1 Assistant vice president 1 Head of treasury 1 Head of audit 1 Head of department 2 Senior Manager 2 Manager –Finance & planning 1 Assistant Manager –Finance & planning 1 Strategic Planning Unit 1 Total 21
96

6.4 Ownership Aspects On the basis of ownership, all the participating banks were divided into three categories
namely, Sri Lankan government banks, locally owned banks and foreign owned banks.
The major considerations for this classification was who owns more than fifty percent
of the total shares and table 6.3 further explains the three categories in ownership
aspects. Table 6.3: Description of the three categorise in ownership aspects Government owned banks: Sri Lankan government holding more than 50 percent of the total shares Locally owned banks : Sri Lankan companies and Sri Lankans holding more than 50 percent of the
total shares Foreign owned banks : Foreign companies and foreigners holding more than 50 percent of the total
shares Table 6.4 shows the industry participation for this study in terms of ownership aspects.
All the government owned banks and the locally owned banks participated in this study
and therefore, both the government and locally owned banks reported a 100%
participation rate. Except for one foreign owned bank all the other foreign bank’s
branches participated in this study and hence, the participation percentage of foreign
owned banks was 90.90%. Thus, the participation percentage of all the commercial
banks in the Sri Lankan banking sector for this study was 95.45%. More analysis about
the ownership aspects will be discussed in chapter 7.
Table 6.4: Ownership characteristics of the participating companies in terms of ownership aspects Banks Industry
(N) Participants
(N) Participation rate
(N) Government owned banks 2 2 100.0 Locally owned banks 9 9 100.0 Foreign owned bank’s branches 11 10 90.90 Total 22 21 95.45
97

6.5 Size aspects
Several questions were included in the questionnaire to capture the size measures of the
Sri Lankan commercial banks . Figure 6.1 shows the calculated means of the responses
received from the participating banks about their size measures. Profitability, asset base
and revenue had higher means than the other size measures and only four banks
considered their deposit base as a major measurement of their bank size.
Figure 6.1: Size measures Not at all To a great extent 1 2 3 4 5 П=3.85 N=21 Size is measured by revenue •_______•________•________•_______• П=4.0 N=21 Size is measured by assets •_______•________•________•_______• П=2.85 N=21 Size is measured by number of employees •_______•________•________•_______• П=4.09 N=21 Size is measured by the profitability •_______•________•________•_______• П=3.66 N=21 Size is measured by the customer base •_______•________•________•_______• П=3.14 N=21 Size is measured by the number of branches •_______•________•________•_______• П=4.25 N=4 Deposit base •_______•________•________•_______•
18 of the total of 21 banks identified they had a most important measure to determine
their bank size and only 3 banks reported not having an important measurement to
determine their banks size (refer table 6.5).
98

Table 6.5: Of these size measures, is one of these considered most important? Is one of these size measures considered most important?
Frequency Percent
Yes 18 85.7 No 3 14.3
Total 21 100.0
Table 6.6 reveals the most important size measures of the participating banks. 7 banks
considered asset base as their most important size measure and, 5 and 3 banks
mentioned profitability and revenue as their most important size measures respectively.
These findings suggest that there was no clear measure adopted by the Sri Lankan
banking sector to determine its size. Central Bank of Sri Lanka identified six large
important banks, which together represented 81 percent of the commercial banking
sector assets (Central Bank 2006). These banks comprised the two government owned
banks and the four large domestic private commercial banks. However, the Central
Bank did not mention the way they categorized these banks as large banks.
Table 6.6: Most important size measures of the participating bank
Size measure
Frequency Percent Valid Percent Cumulative Percent
Revenue 3 14.3 16.7 16.7 Assets 7 33.3 38.9 55.6 Profitability 5 23.8 27.8 83.3 Customer base 1 4.8 5.6 88.9 Number of branches 1 4.8 5.6 94.4 Deposit base 1 4.8 5.6 100.0 Total 18 85.7 100.0
Data of all the size measures of all the participating banks were available for this study
and therefore, this study had a number of options to categorize banks by size. As most
number of banks reported assets as their most important measure of size, this study also
adopted asset base as the most appropriate measure to determine bank size because
profitability can be negative and it depends on company performances. Table 6.7
describes the classification of the size measures that were adopted for this study.
99

Table 6.7: Classification for size aspects Size aspects Asset range (Sri Lankan rupees/millions) Large > 100,000 Medium, 50,000- 100,000 Small 0-50,000 According to the classification identified in table 6.7, all the participating banks were
divided into three categories namely large, medium and small sized banks and the
categorised banks in terms of size aspects are shown in the table 6.8.
Table 6.8: Participating banks in terms of size aspects
Bank Name Assets (As at 31st of December 2005) Size
(Sri Lankan rupees/millions) Category Domestic banks
People’s Bank >100,000 Large
Bank of Ceylon >100,000 Large NDB Ltd 50,000- 100,000 Medium Hatton National Bank > 100,000 Large Commercial Bank > 100,000 Large Sampath Bank 50,000- 100,000 Medium
Pan Asia Bank 0-50,000 Small Seylan Bank > 100,000 Large
Nations trust Bank 0-50,000 Small DFCC Vardhana 0-50,000 Small Union Bank of Colombo 0-50,000 Small
Foreign Bank Branches HSBC 50,000- 100,000 Medium
MCB 0-50,000 Small State Bank of India 0-50,000 Small
Indian Overseas Bank 0-50,000 Small Indian Bank 0-50,000 Small Union Bank of Pakistan 0-50,000 Small Habib Bank 0-50,000 Small Deutsche bank Ag 0-50,000 Small Citibank 0-50,000 Small Public Bank Berhad 0-50,000 Small
6.6 Planning system aspects By considering the planning system aspects, all the participating banks were divided
into two categories such as the banks who had a formalized strategic planning system
(FSP) and the banks who did not have a formalized strategic planning system (NFSP).
100

When the question was asked about the formalised strategic planning systems, the
responses of the participants confirmed that the sample companies in this study consist
of 20 FSP banks and one NFSP bank. Table 6.9 shows the responses received in this
study about the participants planning systems in terms of ownership aspects and the
only bank who had a NFSP system was a government owned bank.
Table 6.9: Does your company have a formalized strategic planning system at the corporate level?
Strategic Formalized Planning
Ownership aspects Yes No Total Government owned 1 1 2Locally owned
9 - 9
Foreign owned 10 - 10Total 20 1 21
6.7 Characteristics of the sample companies by ownership, planning and size aspects
Table 6.10 shows the characteristics of the participating companies in terms of size,
ownership and planning system aspects. Among the 21 banks participating in this study,
5 were large, 3 were medium and 13 were small sized banks. 12 of the 13 foreign
owned banks were small sized banks and only one foreign owned bank was included in
the medium size category. 5 large banks consisted of two government and three locally
owned banks.
Table 6.10: Characteristics of the sample companies by ownership, planning and size aspects
Size aspects
Planning system aspects Ownership aspects
L (%) M (%) S (%) FSP (%) NFSP (%) Government owned
2 40.0 - - - - 1 5.0 1 100
Locally owned
3 60.0 2 66.7 4 30.8 9 45.0 - -
Foreign owned
- - 1 33.3 9 69.2 10 50.0 - -
101

6.8 Chapter Summary As at 31st December 2005 there were 22 commercial banks operating in Sri Lanka and
all the banks were invited to participate in this study. Except for one foreign owned
bank all the other banks participated in this study and therefore, this study reported an
overall participation rate of 95.45%. All the respondents were the persons who are
responsible for the corporate planning in their organizations. By considering the
ownership aspects all the participating banks were categorised as either government
owned, locally owned or foreign owned and the major consideration for this
classification was who owns more than 50% of total shares of the bank. The results
found that sample of the participating banks for this study consists of 2 governments
owned, 9 locally owned and 10 foreign owned banks. Even though the different banks
used different measure to determine their size, this study uses the asset base as the
major measurement to determine the bank size. By considering the asset base of the
participating banks, this study categorize all the banks as large, medium or small sized
banks and the results found that the sample banks of this study consist of 5 large, 3
medium and 13 small sized banks. When considering the planning system aspects only
one government owned bank did not have a FSP system at their corporate level and all
the other banks reported having a FSP system.
The next chapter will analyse the company structure, company ownership and company
size of the commercial banks.
102

Chapter 7: Company structure, company ownership and company size 7.1 Introduction
This chapter will investigate the three major internal environmental characteristics of
the Sri Lankan commercial banks, these being the company structure, the company size
and the company ownership. Throughout the course of this chapter the results for every
question asked in the questionnaire regarding the structure, ownership and the size, will
be provided in summary format. In addition to the analysis in chapter 6 about the
ownership and size aspects, this chapter aims to analyse those variables more
thoroughly. At the end of this chapter a summary will be provided based on the major
findings of the company structure, ownership and size.
7.2 Organizational Structure
Several questions were designed to capture the important features of the organizational
structures of the Sri Lankan commercial banks. Firstly, this study has requested a chart
of an organizational structure from all the participating banks and only two banks
agreed to provide their charts. All the other banks preferred to describe their structures
rather than providing their organizational charts. Table 7.1 reveals the details of the
banks that agreed to provide charts of their organizational structures for this study.
Table 7.1 Could you please provide us with an organization chart of your company?
Total Ownership aspects Size aspects
Response
N (%) G (%) LO (%) F (%) L (%) M (%) S (%)
Yes 2 9.5 1 50.0 - - 1 10.0 1 20 - - 1 7.7
No 19 90.5 1 50.0 9 100.0 9 90.0 4 80.0 3 100.0 12 92.3
Size: Cramer’s V 0.219 P=0.606 Ownership: Cramer’s V=0.476, P=0.093 Planing system: Cramer’s V=0.689, P=0.002
103

7.2.1 Organizational structure
All the company structures were divided into three categories namely structures which
have single strategic business units (SSBU), structures which have multiple strategic
business units (MSBU), and structures which have a mix of single and multiple strategic
business units. Table 7.2 shows the structural types of the participating banks in terms
of size and ownership aspects. It was found that 52.4%, 28.65, and 19.0% had MSBU,
SSBU, and mix of MSBU and SSBU structures respectively. All the large and the
medium sized banks had MSBU structures and only three small banks reported having
MSBU and, most of the small banks reported having SSBU structures. The higher
number of products and services of large and medium sized banks over the small banks
probably led them to adopt MSBU structures. Similarly, all the government owned
banks and 88.9% of the locally owned banks reported having MSBU structures and the
main reason for that finding is also probably the higher number of products and services
of government and locally owned banks over the foreign owned banks. There were
significant differences in the company structures both by size and ownership aspects
but, results found that ownership aspects were more significant than the size aspects for
the company structures in the Sri Lankan banking sector.
Table 7.2 Organizational structure
Total Ownership aspects Size aspects Company structure N (%) G (%) LO (%) F (%) L (%) M (%) S (%)
Single business units
6 28.6 - - - - 6 60.0 - - - - 6 46.2
Multiple business units
11 52.4 2 100.0 8 88.9 1 10.0 5 100.0 3 100.0 3 23.1
Mix of multiple & single business units
4 19.0 - - 1 11.1 3 30.0 - - - - 4 30.8
Size Cramer’s V=0.529 P=0.019, Ownership Cramer’s V=0.587, P=0.006, 7.2.2 Organizational levels Table 7.3 shows the organizational levels of the participating commercial banks. All the
commercial banks had first and second levels and 71.4% of the banks had a third level
and only 9.5% of the banks had a fourth level. All the banks recognized their first level
as the corporate level. A third level was found in all the large and medium sized banks
104

and also in 53% of the small banks. When considering the ownership aspects, all the
government and locally owned banks had a third level and only the government owned
banks had a fourth level. The results found that there were statistically significant
differences in the third level and fourth level by ownership aspects. Surprisingly, size
aspects were not associated with the number of organizational levels.
Table 7.3 Organizational levels
Total Ownership aspects Size aspects Level N (%) G (%) LO (%) F (%) C Sig L (%) M (%) S (%) C Sig
Corporate 21 100 2 100 9 100.0 10 100 n.a n.s 5 100 3 100 13 100 n.a n.a
Second 21 100 2 100 9 100.0 10 100 n.a n.s 5 100 3 100 13 100 n.a n.s
Third 15 71.4 2 100 9 100.0 4 40.0 .633 * 5 100 3 100 7 53.8 496 n.s
Fourth 2 9.5 2 100 - - - - 1.00 *** 2 40.0 - - - - .580 n.s
Note that: *=p < 0.05, **= p<0.01, ***=p<0.001 7.2.3 Number of units at corporate level Table 7.4 displays the number of units at corporate level in Sri Lankan commercial
banks. Only one medium sized locally owned bank had 12 units in their corporate level
and all the other banks considered their corporate level as one unit. Table 7.4 Number of units at corporate level
Total Ownership aspects Size aspects
Number of units
N (%) G (%) LO (%) F (%) L (%) M (%) S (%) 1 unit
20
95.2
2
100
8
88.9
10
100
5
100
2
66.7
13
100
12 units
1
4.8
-
-
1
11.1
-
-
-
-
1
33.3
-
-
7.2.4 Highest positions at corporate level In 18 of the 21 banks, a CEO (chief executive officer) or a GM (general manager)
headed their corporate levels. The other three banks corporate levels were headed by a
DGM (deputy general manager), an AGM (assistant general manager) and a head of the
105

corporate planning respectively (see table 7.5). There were no significant differences in
the highest positions at the corporate level either by size or ownership aspects.
Table 7.5: Highest positions at corporate level
Total Ownership aspects Size aspects Title N % G (%) LO (%) F (%) L (%) M (%) S (%)
CEO/GM 18 85.7 2 100 9 100 7 70.0 5 100 3 100 10 76.9
DGM 1 4.8 - - - - 1 10.0 - - - - 1 7.7
AGM 1 4.8 - - - - 1 10.0 - - - - 1 7.7
Head of the corporate planning
1 4.8 - - - - 1 10.0 - - - - 1 7.7
Ownership: Cramer’s V=.303 P=0.697 Size: Cramer’s V=0.226 p=.905 7.2.5 Organizational units at second level Table 7.6 shows the organizational units at second level. 52.4% of the banks recognize
their second level as a business level while 19.0% as a operational and 14.3% as a
functional level. Only three banks considered their second level also as a corporate
level. The banks which considered their second level as operational and functional level
were small sized banks.
Table 7.6: Organizational units at second level
Total Ownership aspects Size aspects Unit N (%) G (%) LO (%) F (%) L (%) M (%) S (%)
Corporate 3 14.3 1 50.0 1 11.1 1 10.0 1 20.0 1 33.3 1 7.7
Business 11 52.4 1 50.0 7 77.8 3 30.0 4 80.0 2 66.7 5 38.5
Operational 4 19.0 - - - - 4 40.0 - - - - 4 30.8
Functional 3 14.3 - - 1 11.1 2 20.0 - - - - 3 23.1
7.2.6 Highest positions at second level Table 7.7 reveals the highest positions at second level in participant banks. The highest
number of banks reported the highest position at their second level was DGM following
the positions of senior manager and manager. Highest positions of SDGM (senior
deputy general manager) and DGM were in the large banks while most of the small
banks reported having a DGM. Highest positions such as manager, operational officer,
and head of the business were only seen in the foreign owned banks and there were no
106

significant differences in the positions of second level either by size or ownership
aspects.
Table 7.7: Highest positions at the second level
Total Ownership aspects Size aspects Job Title N % G % LO % F % L % M % S %
SDGM 2 9.5 1 50.0 1 11.1 - - 2 40.0 - - - -
DGM 7 33.3 1 50.0 5 55.6 1 10.0 3 60.0 - - 4 30.8
Manager 3 14.3 - - - - 3 30.0 - - - - 3 23.1
Vice president
2 9.5 - - 1 11.1 1 10.0 - - 1 33.3 1 7.7
Senior Manager
4 19.0 - - 2 22.2 2 20.0 - - 1 33.3 3 23.1
Operational officer
1 4.8 - - - - 1 10.0 - - - - 1 7.7
Head of the business units
2 9.5 - - - - 2 20.0 - - 1 33.3 1 7.7
7.2.7 Highest positions at third level
Table 7.8 displays the highest positions at third level of the Sri Lankan banking
industry. Branch manager was the highest position at third level in most of the banks
following the positions of AGM and manager. There were no significant differences
found in the highest positions at third level either by size or ownership aspects.
Table 7.8: Highest positions at the second level
Total Ownership aspects Size aspects Job Title N % G % LO % F % L % M % S %
CEO 1 6.7 - - - - 1 25.0 - - - - 1 14.3
DGM 1 6.7 1 50.0 - - - - 1 20.0 - - - -
AGM 3 20.0 1 50.0 2 22.2 - - 3 60.0 - - - -
Manager 3 20.0 - - 1 11.1 2 50.0 1 20.0 - - 2 28.6
Asst. Vice president
1 6.7 - - 1 11.1 - - - - 1 33.3 - -
Br Manager 6 40.0 - - 5 55.6 1 25.0 - - 2 66.7 4 57.1
107

7.2.8 Second management level units Table 7.9 shows the details of the second management level units. 90.5% of the second
management level units were defined as profit centres and there were no significant
differences found in the second management level units in terms of profit centres either
by ownership or size aspects.
Table 7.9: Are the second management level units defined as profit centres?
Total Ownership aspects Size aspects Response N % G % LO % F % L % M % S %
Yes 19 90.5 2 100 8 88.9 9 90.0 5 100 3 100 11 84.6
No 2 9.5 - - 1 11.1 1 10.0 - - - - 2 15.4
Ownership Cramer’s V=0.107 P=0.887, Size Cramer’s V=0.255 P=0.507 7.2.9The lowest level of profit centre When the question was asked about the lowest level of profit centre, 17 banks (81% of
the total banks) responded the operational level was their lowest level of profit centre.
The details of the responses received about the lowest level of profits in terms of
ownership and size aspects are shown in the table 7.10. Results also found that there
were no significant differences in the lowest level of profit centre either by size or
ownership aspects. Table 7.10: The lowest level of profit centre
Total Ownership aspects Size aspects Level N % G % LO % F % L % M % S %
Second level 1 4.8 - - 1 11.1 - - - - 1 33.3 - -
Operational level
17 81.0 2 100 7 77.8 8 80.0 5 100 2 66.7 10 76.9
Upper level 1 4.8 - - - - 1 10.0 - - - - 1 7.7
Functional level
2 9.5 - - 1 11.1 1 10.0 - - - - 2 15.4
Ownership Cramer’s V=0.256 P=0.839, Size Cramer’s V= 0.441 P=0.226
108

7.2.10 Structural types Table 7.11 reveals the structural types of the Sri Lankan commercial banks. The results
found that 14 of the total of 21 banks had a hybrid form of centralized and decentralized
structures, whilst six and one bank reported having centralized and decentralized
structures respectively. Five of the six banks which have centralized structures were
small sized banks. Results of the table 7.11 demonstrate that when the size becomes
bigger structural type tend to have a hybrid form of centralized and decentralized
structures. It is worth noting that even the large banks did not have fully decentralized
structures and their banks operations were centralized to a great extent. It was also
found that there were no statistically significant differences in the structural type either
by size or ownership aspects.
Table 7.11: Structural type
Total Ownership aspects Size aspects Structural type N % G % LO % F % L % M % S %
Centralized structure 6 28.6 - - 3 33.3 3 30.0 - - 1 33.3 5 38.5
Decentralized structure 1 4.8 - - - - 1 10.0 - - - - 1 7.7
Hybrid form of centralized
& decentralized structure
14 66.7 2 100 6 66.7 6 60.0 5 100 2 66.7 7 53.8
Ownership: Cramer’s V=0.226 P=0.708 Size: Cramer’s V=0.295 P=0.453 7.2.11 Structural changes in last five years Nine banks had changed their organizational structures during last five years and those
nine banks included both the government owned banks, four Sri Lankan owned banks
and, three foreign owned banks. Table 7.12 shows the details of 9 banks which had
changed their structures in terms of size and ownership aspects. There were no
significant differences in the banks which changed their structures either by size or
ownership aspects.
109

Table 7.12: Organizational structure changed during last five years
Total Ownership aspects Size aspects Response N % G % LO % F % L % M % S %
Yes 9 42.9 2 100 4 44.4 3 30.0 3 60.0 2 66.7 4 30.8
No 12 57.1 - - 5 55.6 7 70.0 2 40.0 1 33.3 9 69.2
Ownership: Cramer’s V=0.399 P=0.187 Size: Cramer’s V= 0.314 P=0.355
Table 7.13 details the years in which the structural changes took place in the banks
which changed their organizational structures. It was found that 4 banks changed their
structures in 2002 while 3 and 2 banks in 2005 and 2004 respectively. Table 7.13: Year of structural change
Total Ownership aspects Size aspects Year N % G % LO % F % L % M % S %
2005 3 33.3 - - 2 50.0 1 33.3 1 33.3 2 100 - -
2004 2 22.2 - - 1 25.0 1 33.3 - - - - 2 50.0
2002 4 44.4 2 100 1 25.0 1 33.3 2 66.7 - - 2 50.0
Total 9 100 2 100 4 100 3 100 2 100 4 100 4 100
Ownership: Cramer’s V=0.437 P=0.487, Size: Cramer’s V=0.656 P=0.101 7.2.12 Important structural changes made (during last five years) Table 7.14 describes the important structural changes made by the Sri Lankan
commercial banks during the last five years. The highest numbers of reported structural
changes made by the banks were the introduction of new positions, introduction of new
procedures and policies, establishment of new profit centres, and new areas of activities
respectively. Introduction of new positions was associated with the size aspects and that
was mostly seen in the small sized banks. It is worth noting that most of the structural
changes were due to the growth of the banks and the banking industry in Sri Lanka. The
results also found that ownership aspect was not associated with any structural changes.
110

Table 7.14: Important structural changes made (during the last five years)
Total Ownership aspects Size aspects
Changes made
N % G % LO % F % C Sig L % M % S % C Sig Establishment of new profit centres
2 22.2 1 50.0 1 25.0 - - .443 n.s 1 33.3 - - 1 25.0 .299 n.s
Organized the business units under heads/DGMs
1 11.1 1 50.0 - - - - .661 n.s 1 33.3 - - - - .500 n.s
Structural changes at corporate level positions
1 11.1 1 50.0 - - - - .661 n.s 1 33.3 - - - - .500 n.s
Appointment of chief financial officer above the DGM
1 11.1 1 50.0 - - - - .661 n.s 1 33.3 - - - - .500 n.s
Combining two structures into one
1 11.1 - - 1 25.0 - - .395 n.s - - 1 50.0 - - .661 n.s
Harmonizing the HR function
1 11.1 - - 1 25.0 - - .395 n.s - - 1 50.0 - - .661 n.s
Appointment of a single CEO
1 11.1 - - 1 25.0 - - .395 n.s - - 1 50.0 - - .661 n.s
Opening of new departments
1 11.1 - - 1 25.0 - - .395 n.s - - 1 50.0 - - .661 n.s
Introduction of new position
5 55.6 - - 3 75.0 2 66.7 .602 n.s 1 33.3 - - 4 100 .837 *
Decentralization of operations
1 11.1 - - - - 1 33.3 .500 n.s - - - - 1 25.0 .395 n.s
Linked all branches
1 11.1 - - - - 1 33.3 .500 n.s - - - - 1 25.0 .395 n.s
Created a centralized operation unit
1 11.1 - - - - 1 33.3 .500 n.s - - 1 50.0 - - .661 n.s
Create market product development units
1 11.1 - - - - 1 33.3 .500 n.s - - 1 50.0 - - .661 n.s
Introduction of new procedures and policies
3 33.3 - - 2 50.0 1 33.3 .408 n.s 1 33.3 - - 2 50.0 .408 n.s
New products and branches
1 11.1 - - 1 25.0 - - .395 n.s - - - - 1 25.0 .395 n.s
New areas of activities
2 22.2 - - 1 25.0 1 33.3 .299 n.s - - - - 2 50.0 .598 n.s
Redesigning the job definitions
1 11.1 - - - - 1 33.3 .500 n.s - - - - 1 25.0 .395 n.s
Note that: T (N) = 9, *=p < 0.05, **= p<0.01, ***=p<0.001 7.2.13 Main reasons for the structural changes Table 7.15 summarises the main reasons for the above mentioned structural changes.
The most common reasons for the structural changes were to improve efficiency, a
change of CEO/GM, to expand the business, and the rapid growth of the bank and the
111

banking industry in Sri Lanka respectively. The reason of “improve efficiency” was
associated with ownership aspect and that reason was reported from both the
government owned banks. Thus, efficiency was a major concern in both the government
owned banks during last five years. Results also found that there were no significant
differences in the reasons for structural changes by size aspects. Table 7.15: The main reasons for the structural changes
Total Ownership aspects Size aspects
Main reason N % G % LO % F % C Sig L % M % S % C Sig
To improve efficiency
3 33.3 2 100 - - 1 33.3 .816 * 2 66.7 - - 1 25.0 .540 n.s
To empower the mangers
1 11.1 1 50.0 - - - - .661 n.s 1 33.3 - - - - .500 n.s
Merger with another company
1 11.1 - - 1 25.0 - - .395 n.s - - 1 50.0 - - .661 n.s
Change of CEO/GM
3 33.3 - - 2 50.0 1 33.3 .408 n.s 1 33.3 - - 2 50.0 .408 n.s
To expand the business
2 22.2 - - - - 2 66.7 .756 n.s - - - - 2 50.0 .598 n.s
Rapid growth of the bank and the banking industry in Sri Lanka
2 22.2 - - - - 2 66.7 .756 n.s - - 1 50.0 1 25.0 .443 n.s
To take the bank ahead
1 11.1 - - 1 25.0 - - .395 n.s - - - - 1 25.0 .395 n.s
To make the bank profit
1 11.1 - - 1 25.0 - - .395 n.s - - - - 1 25.0 .395 n.s
Economy in the country
1 11.1 - - - - 1 33.3 .500 n.s - - - - 1 25.0 .395 n.s
Note that: Total (N) = 9 7.2.14 Applicability of the current organization structure for the next five years
When the question was asked about the applicability of the current organization
structure for the next five years, 14 of the total of 21 banks mentioned that their current
structures would need to be changed in the next five years. However, 7 banks, which
include 3 locally and 4 foreign owned banks, mentioned that their current structures will
still be applicable for the next five years. The results of table 7.16 show that there were
112

no significant differences with the applicability of the current bank structures for the
next five years either by size or ownership aspects.
Table 7.16: Applicability of the current organizational structure
Total Ownership aspects Size aspects Response N % G % LO % F % L % M % S %
Yes 7 33.3 - - 3 33.3 4 40.0 2 40.0 1 33.3 4 30.8 No 14 66.7 2 100 6 66.7 6 60.O 3 60.0 2 66.7 9 69.2 Ownership: Cramer’s V=.239 P=0549 Size: Cramer’s V= .081 P=.933 7.2.15 Major structural changes expected by the banks for the next five years Table 7.17 reveals the major structural changes expected by the Sri Lankan banking
sector for the next five years. 12 of the total of 14 banks mentioned that their structures
needed to be adjusted according to the business and the competitive environments. New
positions, new branches, introduction of new business units were the other reported
changes which they expected to be completed in the next five years. These expected
changes suggest an expected industry growth within the banking industry in Sri Lanka.
It was found that higher proportion of small banks is expecting to introduce new
positions, open new branches and, also to expand their size within the next five years.
The results in the table show that there were no significant differences in the expected
structural changes either by size or ownership aspects.
113

Table 7.17: Major structural changes expected by the banks for the next five years
Note that: Total (N): 14
Total Ownership aspects
Size aspects Structural change
N % G % LO % F % C Sig L % M % S % C Sig Depending on the business and competitive environment it needs to be adjusted
12 85.7 2 100 6 100 4 66.7 .471 n.s 3 100 2 100 7 77.8 .304 n.s
New positions
7 50.0 - - 3 50.0 4 66.7 .436 n.s - - 1 50.0 6 66.7 .535 n.s
New branches
5 35.7 - - 4 66.7 1 16.7 .571 n.s - - 1 50.0 4 44.4 .391 n.s
Expand the operational level
2 14.3 - - 1 16.7 1 16.7 .167 n.s - - - - 2 22.2 .304 n.s
Innovations
1 7.1 - - - - 1 16.7 .320 n.s - - - - 1 11.1 .207 n.s
Introduction of money market operations
1 7.1 - - - - 1 16.7 .320 n.s - - - - 1 11.1 .207 n.s
Introduction of new products and markets
1 7.1 - - - - 1 16.7 .320 n.s - - - - 1 11.1 .207 n.s
Introduction of high technology for the banking operations
1 7.1 - - 1 16.7 - - .320 n.s 1 33.3 - - - - .531 n.s
Introduction of new business units
3 21.4 - - 2 33.3 1 16.7 .284 n.s 1 33.3 1 50.0 1 11.1 .358 n.s
Expand the size
3 21.4 - - 2 33.3 1 16.7 .284 n.s - - - - 3 33.3 .389 n.s
Introduction of credit cards and personal loans
1 7.1 - - - - 1 16.7 .320 n.s - - - - 1 11.1 .207 n.s
7.3 Ownership
Several questions were included in the questionnaire to thoroughly analyse the
ownership aspects of the Sri Lankan commercial banks. Firstly, this study examined the
banks which were listed on the Sri Lankan stock market (SLSM). When the question
was asked about the selling shares in SLSM, the responses in terms of size and
ownership aspects are shown in the table 7.18. Participants confirmed that only six
114

banks were listed under SLSM and it was reported that all of those six banks were
locally owned banks. The results also found that there were significant differences in the
banks which listed under SLSM either by size or ownership aspects, and ownership
aspects had a higher influence over the size aspects.
Table 7.18 Bank sell its shares in SLSM
Total Ownership aspects Size aspects Response N % G % LO % F % L % M % S %
Yes 6 28.6 - - 6 66.7 - - 3 60.0 2 66.7 1 7.7 No 15 71.4 2 100 3 33.3 10 100 2 40.0 1 33.3 12 92.3 Ownership: Cramer’s V=.730 P=.004 Size: Cramer’s V=.591 P= .026
Table 7.19 shows the pattern of the shareholding of the locally owned banks which
listed under SLSM in terms of size aspects. Among those six banks, there were four
widely held and two subsidiaries of Sri Lankan company’s banks. There were no
significant differences in the pattern of the share holding by size aspects.
Table 7.19: Shareholder pattern of the commercial banks listed under SLSM
Total Size aspects Shareholder pattern
N % L % M % S %
Widely held 4 66.7 1 33.3 2 100 1 100
Subsidiary of Sri Lankan companies
2 33.3 2 66.7 - - - -
Size: Cramer’s V=.707 P=.223
Table 7.20 reveals the banks which sell their shares in overseas stock markets. 50% of
the foreign owned banks were selling their shares overseas and it was reported that none
of the government and locally owned banks were selling shares in the overseas stock
markets. The results also found that only ownership aspects were related to selling
shares in overseas markets.
115

Table 7.20: Company sell its shares in overseas stock market Response Total Ownership aspects Size aspects N % G % LO % F % L % M % S % Yes 5 23.8 - - - - 5 50.0 - - 1 33.3 4 30.8No 16 76.2 2 100 9 100 5 50.0 5 100 2 66.7 9 69.2 Size: Cramer’s V=0.373 p=0.357 Ownership: Cramer’s V=0.586 P=0.027 7.3.1 Changes in company ownership (during last five years)
Table 7.21 displays the major ownership changes that occurred during last five years. 17
of the 21 banks reported no changes to their ownership while four banks made changes
to their ownership. Those four banks include 3 locally owned banks and one foreign
owned bank. The major changes in ownership among those four banks include two
mergers and one transfer of ownership and one change of major shareholders. It was
found that among the four banks which made changes to their ownership three were
small sized banks. According to Central Bank of Sri Lanka, a company can acquire a
maximum of up to 10% of the total shares of a bank. Therefore, the Central Bank
restrictions on takeovers would be the main reason for small number of reported changes
in ownership in Sri Lankan banking sector. There were no statistically significant
differences in the ownership changes either by size or ownership aspects.
Table 7.21: Changes in company ownership (during last five years)
Total Ownership aspects Size aspects Ownership change N % G % LO % F % L % M % S % No change 17 81.0 2 100 6 66.7 9 90.0 5 100 2 66.7 10 76.9 Merge with another company
2 9.5 - - 2 22.2 - - - - 1 33.3 1 7.7
Transfer of ownership- limited liability
1 4.8 - - - - 1 10.0 - - - - 1 7.7
Changed major shareholders
1 4.8 - - 1 11.1 - - - - - - 1 7.7
Size: Cramer’s V=.303 P=.695 Ownership: Cramer’s V=.362 P=.479
116

7.3.2 The main reasons for the changes in your company’s ownership Table 7.22 reveals the major reasons for the ownership changes of the above mentioned
four banks. Capital requirement was a major reason for two small banks and all the
other major reasons stated in the table 7.22 were reported by one bank each.
Table 7.22: The main reasons for the changes in your company’s ownership
Total Ownership aspects Size aspects Main reason N % G % LO % F % L % M % S %
Shares changed hands to make capital gains
1 25.0 - - 1 33.3 - - - - 1 100 - -
Capital requirements
2 50.0 - - 2 66.7 - - - - - - 2 66.7
Company not listed in the share market
1 25.0 - - 1 33.3 - - - - - - 1 33.3
Enhancing Shareholder value
1 25.0 - - - - 1 100 - - - - 1 33.3
Unsatisfactory performance of the bank (big losses)
1 25.0 - - 1 33.3 - - - - - - 1 33.3
Note that: T (N) =4
7.3.3 The major factors that supported the above ownership changes
The major factors that supported the above ownership changes for the four banks are
given in the table 7.23. Good earning potential of the bank and the Central Bank capital
requirements were the most reported factors by the banks.
117

Table 7.23: The major factors that supported the above ownership changes
Total Ownership aspects Size aspects Major factor N % G % LO % F % L % M % S %
Good earning potential of the bank
2 50.0 - - 1 33.3 1 100 - - 1 100 1 33.3
Satisfactory past performance
1 25.0 - - 1 33.3 - - - - 1 100 - -
Appreciation of share value
1 25.0 - - 1 33.3 - - - - 1 100 - -
Central Bank intervention to find capital
1 25.0 - - 1 33.3 - - - - - - 1 33.3
Bank’s unsatisfactory performance
1 25.0 - - 1 33.3 - - - - - - 1 33.3
Central Bank capital requirement
2 50.0 - - 2 66.7 - - - - - - 2 66.7
Note that: T (N) = 4
7.3.4 Successful rate of the ownership changes
All the banks that changed their ownership mentioned that they did not face any
problems when they changed ownership. The successful rate of ownership changes are
summarised in figure 7.1. Overall, all the four banks think their ownership changes
were successful. However, the small banks reported a higher success rate than the
medium sized banks. Similarly, foreign owned bank had a higher success rate than the
three locally owned banks.
Figure 7.1: Successful rate of ownership change (over the last five years) Unsuccessful Very Unsuccessful Very
Successful Successful ownership aspects Size aspects 1 2 3 4 5 1 2 3 4 5 ПT=3.75 ПT=3.75
•_____•______•______•_____• •_____•______•______•_____• ПLO=3.7 ПF=4.0 ПM=3.0 ПS=4.0
N=3 N=1 N=1 N=3 Government Local Foreign Large Medium Small
118

7.3.5 Strategic importance of the ownership changes Overall, banks think their ownership changes strategically helped their companies to a
reasonably high extent. However, it was found that ownership changes in small banks
helped them strategically to a greater extent than the medium sized bank. Similarly,
foreign owned bank reported a higher strategically importance of their ownership
changes than the 3 locally owned banks.
Figure 7.2: Strategic importance of the ownership changes (over the last five years)
Unsuccessful Very Unsuccessful Very
Successful Successful ownership aspects Size aspects 1 2 3 4 5 1 2 3 4 5 ПT=3.75 ПT=3.75
•_____•______•______•_____• •_____•______•______•_____• ПLO=3.7 ПF=4.0 ПM=3.0 ПS=4.0
N=3 N=1 N=1 N=3 Government Local Foreign Large Medium Small
7.3.6 Expected ownership changes in next five years
When the question was asked about the expected ownership changes in the next five
years, 19 of the 21 commercial banks state that they do not want to change their
ownership (refer table 7.24). However, there were two foreign owned banks which are
expecting to change their ownership, and these include one Indian government owned
bank which is planning to sell 40% of its shares to the Indian stock market and another
foreign owned bank which is planning to change their large share owners. It also found
that none of the government and locally owned commercial banks want to make any
changes to their ownership for the next five years. There were no significant differences
in the expected ownership changes either by ownership or size aspects.
119

Table 7.24: Changes in company ownership (For the next five years)
Total Ownership aspects Size aspects Ownership change N % G % LO % F % L % M % S % No change 19 90.5 2 100 8 88.9 9 90.0 5 100.0 2 66.7 12 92.3 Changes in large ownership
1 4.8 - - 1 11.1 - - - - 1 33.3 - -
Planning to sell 40% overseas market
1 4.8 - - - - 1 10.0 - - - - 1 7.7
Size: Cramer’s V=0.404 P=0.144 Ownership: Cramer’s V=0.242 P=0.653 7.4 Size of the Banks
7.4.1 Bank satisfaction on company performance compared to their size
When the question was asked about the satisfaction of the banks performance compared
to their size, this study received mix responses from the participating banks and the
means of the satisfaction rates in terms of size and ownership aspects are shown in
figure 7.3. Medium sized banks reported a higher satisfaction rate than the large and
small sized banks. Similarly, government banks reported the lowest level of satisfaction
compared with locally owned and foreign owned banks. Even for government owned
banks who have reported the highest profits than any other bank in Sri Lanka, their
lower levels of performance satisfaction suggests the need for them to further increase
profits.
Figure 7.3: Bank satisfaction level on company performance compared to their size
Dissatisfied Very Dissatisfied Very
satisfied satisfied ownership aspects Size aspects 1 2 3 4 5 1 2 3 4 5 ПT=3.62 ПT=3.62 •_____•______•______•_____• •_____•______•______•_____• * ПG=3.5 ПF=3.6 ПLO=3.7 ПL=3.6 ПS=3.4 ПM=4.7 N=2 N=10 N=9 N=5 N=13 N=3
Note that: *=p < 0.05, **= p<0.01, ***=p<0.001 Government Local Foreign Large Medium Small
120

17 of the 21 banks believe they need to enhance the size of their banks to gain more
profits and the details of those banks in terms of size and ownership and aspects are
shown in the table 7.25. It is worth noting that 90.0% of the foreign banks think they
need to enhance their size to gain more profits. Currently foreign banks operate only in
Colombo and this trend will change if foreign banks decide to expand their size by
opening new branches in outstations. No significant differences were found in the need
for banks to enhance the size by size and ownership aspects.
Table 7.25: Do you think you need to enhance the size of your bank to gain more profits?
Total Ownership aspects Size aspects Response N % G % LO % F % L % M % S %
Yes 17 81 1 50.0 7 77.8 9 90.0 3 60.0 3 100 11 84.6 No 4 19 1 50.0 2 22.2 1 10.0 2 40.0 - - 2 15.4
Size: Cramer’s V=.327 P=.326 Ownership: Cramer’s V= .295 P=.400
7.4.2 The main barriers faced by the banks to enhance their bank size
Table 7.26 summarises the main barriers that the banks faced to enhance their size.
Capital requirements, government policies, lack of managerial and employee skills were
the most reported barriers to enhance their size respectively. Results found that lack of
technology was associated with the ownership aspects and reported from one
government and two foreign owned banks. Surprisingly, only two banks considered
ethnic war in Sri Lanka as a barrier to enhance their banks size. There were no
significant differences in the barriers to enhance the bank size by size aspects.
121

Table 7.26: The main barriers that you have to enhance your bank’s size
Total Ownership aspects
Size aspects Response
N % G % LO % F % C Sig L % M % S % C Sig Government policies
7 41.2 1 100 2 28.6 4 44.6 .337 n.s 1 33.3 1 33.3 5 45.5 .118 n.s
Capital requirements
8 47.1 1 100 3 42.9 4 44.9 .266 n.s 2 66.7 1 33.3 5 45.5 .203 n.s
Lack of managerial and employee skills
6 35.3 1 100 3 42.9 2 22.2 .397 n.s 2 66.7 1 33.3 3 27.3 .308 n.s
Lack of technology
3 17.6 1 100 - - 2 22.2 .609 * 1 33.3 - - 2 18.2 .260 n.s
Head office credit policies
1 5.9 - - - - 1 11.1 .236 n.s - - - - 1 9.1 .185 n.s
RBI approval
1 5.9 - - - - 1 11.1 .236 n.s - - - - 1 9.1 .185 n.s
Unstable economy due to war
2 11.8 - - 2 28.6 - - .436 n.s 1 33.3 1 33.3 - - .494 n.s
No barriers 1 5.9 - - 1 14.3 - - .299 n.s - - 1 33.3 - - .540 n.s Note that: Total (N)= 17, *=p < 0.05, **= p<0.01, ***=p<0.001
7.5 Chapter Summary
This chapter has discussed the primary data analysis of banks structure, ownership and
size more thoroughly and highlighted the significant differences either by size, and
ownership aspects. Planning system aspects were ignored due to there been only one
respondent in the NFSP category.
Company structure
More than half of the banks had multiple business units’ structures and those banks
included all the large and medium sized banks and 3 small sized banks. Surprisingly
results found that ownership aspects were more associated with the organizational
structures than the size aspect. Only government owned banks reported having a fourth
level and for 17 of the total of 21 banks the lowest level of profit centre was the
operational level. 14 banks reported having a hybrid form of centralized and
decentralized structures while 6 and 1 banks reported having centralized and
122

decentralized structures respectively. Only 9 banks had changed their organizational
structures during last five years and most of the structural changes were due to the
growth of the banks and the banking industry in Sri Lanka. It was found that one of the
reasons for both the government owned banks structural changes was to improve their
efficiency and therefore, lack of efficiency was a major concern in both the government
banks during last five years. Only 7 banks think their current structures applicable for
the next five years and the other 14 banks think that they need to change their structures
in the next five years. It was found that the banks which expected to change their
organizational structure during next five years did so due to their expected bank growth
and the industry growth in Sri Lanka.
Ownership
Only 6 of the 21 banks were selling shares in Sri Lankan stock market and all of these
banks were locally owned banks. Among the six banks which were selling shares in
SLSM, 4 were widely held and 2 were subsidiary of Sri Lankan companies. Only four
banks had changed their ownership during last five years and those changes included 2
mergers, 1 transfer of ownership and 1 change of major shareholders. It was found that
all the ownership changes were successful and strategically helped their banks. It was
also found that 19 of the 21 banks were not planning to do any kind of ownership
changes for their companies during next five years.
Size
Overall, banks were satisfied with their company performances compared to their size
but, government banks reported the lowest level of satisfaction compared to the locally
and foreign owned banks. Therefore, we can assume that government banks are wanting
to improve company performance in the next five years. 17 of the 21 banks think they
need to enhance their size to gain more profits. Most banks reported the major barriers
to enhance their size were capital requirements, government policies and the lack of
managerial and employee skills.
The next chapter will analyse the organizational culture, management style and
stakeholder expectations of the Sri Lankan commercial banks.
123

124
Chapter 8: Organizational culture, management style and stakeholder expectations
8.1 Introduction This chapter will investigate the organizational culture, management styles and
stakeholder expectations of the participating Sri Lankan commercial banks and also
report whether there are any significant differences either by ownership or size aspects.
Planning system aspects will be ignored due to lack of respondents in the NFSP
category.
8.2 Organizational culture 8.2.1 The importance of the management of the organizational culture
All the participating banks considered that the management of their organizational
culture is important and the calculated means in this study in terms of size and
ownership aspects are given in the figure 8.1. Medium sized banks reported a higher
level of importance than the large and small sized banks. Similarly, government owned
banks reported a higher level of importance than the locally and foreign owned banks.
The results also found that there were no significant differences in the importance of the
management of culture either by size or ownership aspects.
Figure 8.1: Importance of the management of company culture Not at all Very Not at all Very Important important important important Ownership aspects Size aspects 1 2 3 4 5 1 2 3 4 5 •_______•________•________•_______• •_______•________•________•_______• ПT=4.33 ПT=4.33 ПG=5.0 ПF=4.2 ПLO=4.3 ПL4.4 ПM=5.0 ПS=4.1 N=2 N=10 N=9 N=5 N=3 N=13 Ownership: Cramer’s V=0.368 P=0.223 Size: Cramer’s V=0.367 P=0.226 Government Local Foreign Large Medium Small

125
8.2.2 Top management satisfaction with the current organizational culture
When asked about the satisfaction level with the current organizational cultures, this
study received mix responses from the participating banks and the results are shown in
figure 8.2. Overall, the banks’ satisfaction level was at 3.62 and but, medium sized
banks had a higher level of satisfaction rate than the large and small sized banks.
Government banks reported the lowest level of satisfaction compared to locally and
foreign owned banks. These findings suggest that the top management of number of
banks are expecting more developments from their organizational cultures. There were
no significant differences in the satisfaction level with the current organizational
cultures either by size or ownership aspects.
Figure 8.2: Top management satisfaction with the current organizational culture Dissatisfied Very Dissatisfied Very Satisfied satisfied Ownership aspects Size aspects 1 2 3 4 5 1 2 3 4 5 •_______•________•________•_______• •_______•________•________•_______• ПT=3.62 ПT=3.62 ПG=3.0 ПF=3.6 ПLO=3.8 ПL=3.6 ПM=4.0 ПS=3.5 N=2 N=10 N=9 N=5 N=3 N=13 Ownership: Cramer’s V=0.399 P=0.351 Size: Cramer’s V=0.381 P=0.413 Government Local Foreign Large Medium Small
8.2.3The groups who influenced the company culture (over the last five years)
Company CEO and the corporate level management had the most influence on company
culture in Sri Lankan commercial banks (see figure 8.3). Second level management and
the other lower levels of management also had a reasonable influence on company
cultures. Overall, the government influence on banks cultures remained at a very low
level but, government influence on the government banks remained at a high level.
Trade unions had a high influence on cultures in one government and one locally owned
banks. Results also found that ownership aspects were associated with “Sri Lankan
government” and this was due to a higher influence on government banks. There were
no significant differences in the groups which influenced the company culture by size
aspects.

126
Figure 8.3: The groups who influenced the culture (over the last five years) No influence Very great No influence Very great influence influence
Ownership aspects Size aspects 1 2 3 4 5 1 2 3 4 5
Corporate level management •_______•________•________•_______• •_______•________•________•_______• (N=21, ПT=4.0) ПG=4.0 ПLO=4.0 ПF=4.0 ПL=4.0 ПM=4.0 ПS=4.0
Chief executive officer •_______•________•________•_______• •_______•________•________•_______•
(N=21, ПT=4.3) ПG=4.0 ПLO=4.2 ПF=4.4 ПL=4.4 ПM=4.3 ПS=4.2
Outside members of the •_______•________•________•_______• •_______•________•________•_______•
board of directors (N=21, ПT=2.4) ПG=3.0 ПLO=2.7 ПF=2.1 ПL=2.4 ПM=2.0 ПS=2.5
Second level line managers •_______•________•________•_______• •_______•________•________•_______•
(N=21, ПT=3.3) ПG=2.5 ПLO=3.6 ПF=3.2 ПL=3.2 ПM=3.7 ПS=3.2
Sri Lankan government •_______•________•________•_______• * •_______•________•________•_______•
(N=21, ПT=1.8) ПG=3.5 ПLO=1.6 ПF=1.8 ПL=2.8 ПM=1.3 ПS=1.6
Other lower levels of •_______•________•________•_______• •_______•________•________•_______•
Management (N=21, ПT=2.9) ПG=2.5 П LO=3.1 ПF=2.9 ПL=3.0 ПM=3.3 ПS=2.8
Trade unions •_______•________•________•_______• •_______•________•________•_______•
(N=2 ПT=4.0) ПG=4.0 ПLO=4.0 ПL=4.0 ПM=4.0
Note that: *=p < 0.05, **= p<0.01, ***=p<0.001 Government Local Foreign Large Medium Small
8.2.4 The major characteristics of company culture
Table 8.1 summarizes the major characteristics of the organizational cultures in the Sri
Lankan commercial banks. Loyalty, team spirit and commitment were the major
characteristics reported by the highest number of banks. Concentrate more on self
development along with the development of organization, influence on country politics,
reacting nature and slow adaptation to the culture, and informal groups prefer their
values, norms beliefs contribute to the culture were all associated with ownership
aspects namely a government owned bank. Diversity is associated with the size aspects
and was reported in a medium sized bank. Results also found that ownership aspects
were more associated with characteristics of company cultures than the size aspects.

127
Table 8.1: The major characteristics of company culture
Total Ownership aspects Size aspect
Changes made
N % G % LO % F % C Sig L % M % S % C Sig Commitment 16 76.2 1 50.0 7 77.8 8 80.0 .201 n.s 3 60.0 2 66.7 11 84.6 .256 n.s Loyalty 19 90.5 2 100 9 100 8 80.0 .349 n.s 5 100 2 66.7 12 92.3 .340 n.s Team spirit 17 81.0 1 50.0 7 77.8 9 90.0 .295 n.s 3 60.0 3 100 11 84.6 .326 n.s Concentrate more on self development along with the development of organization
1 4.8 1 50.0 - - - - .689 ** 1 20.0 - - - - .400 n.s
Influence on country politics
1 4.8 1 50.0 - - - - .689 ** 1 20.0 - - - - .400 n.s
Reacting nature and slow adaptation to the culture
1 4.8 1 50.0 - - - - .689 ** 1 20.0 - - - - .400 n.s
Informal group prefer their values, norms beliefs contribute to the culture
1 4.8 1 50.0 - - - - .689 ** 1 20.0 - - - - .400 n.s
Mutual respect
2 9.5 - - - - 2 20.0 .340 n.s - - 1 33.3 1 7.7 .349 n.s
Diversity 1 4.8 - - - - 1 10.0 .235 n.s - - 1 33.3 - - .548 * Multicultural 1 4.8 - - - - 1 10.0 .235 n.s - - - - 1 7.7 .175 n.s Spirit of giving best To the customer and to the organization
2 9.5 - - 1 11.1 1 10.0 .107 n.s - - - - 2 15.4 .255 n.s
Less rigid 1 4.8 - - 1 11.1 - - .258 n.s 1 20.0 - - - - .400 n.s Flexible 2 9.5 - - 2 22.2 - - .375 n.s 2 40.0 - - - - .580 n.s Overall knowledge
6 28.6 - - 4 44.4 2 20.0 .329 n.s 2 40.0 1 33.3 3 23.1 .161 n.s
More than 20 years of experience
1 4.8 - - - - 1 10.0 .235 n.s - - - - 1 7.7 .175 n.s
Corporative 2 9.5 - - - - 2 20.0 .340 n.s - - - - 2 15.4 .255 n.s Conservative 1 4.8 - - 1 11.1 - - .258 n.s 1 20.0 - - - - .400 n.s Blend of government and private sector
1 4.8 - - 1 11.1 - - .258 n.s 1 20.0 - - - - .400 n.s
Young staff 2 9.5 - - 2 22.2 - - .375 n.s 1 20.0 1 33.3 - - .435 n.s Very transparent
1 4.8 - - 1 11.1 - - .258 n.s - - - - 1 7.7 .175 n.s
Approachable 1 4.8 - - 1 11.1 - - .258 n.s - - - - 1 7.7 .175 n.s

128
Table 8.1: The major characteristics of company culture (continued)
Note that: *=p < 0.05, **= p<0.01, ***=p<0.001 8.2.5 Most important actions on company culture The most important actions on company culture in the banks were to encourage
communication and co-operation between different departments followed by the
encouraging team work rather than individual contributions (see figure 8.4).
Development of new ideas and communicating the bank’s mission, goals and strategies
to the employees were also reported as important. The encouragement of team work
rather than individual work was less important in government banks than the foreign
owned and locally owned banks and this was a significant difference by ownership
aspects. The results also found that there were no significant differences in the action on
company cultures by size aspects.
Figure 8.4 Most important actions on company culture
Strongly Strongly Strongly Strongly disagree agree disagree agree
ownership aspects Size aspects 1 2 3 4 5 1 2 3 4 5 1.Our company encourages •_______•________•________•_______• •_______•________•________•_______• the development and ПG=3.0 ПLO= 4.1 ПF=3.5 ПL=3.6 ПM=4.3 ПS=3.6 implementation of new ideas N=2 N=9 N=10 N=5 N=3 N=13 (ПT=3.7) 2.Our company encourages •_______•________•________•_______• •_______•________•________•_______•
communication and co-operation ПG=3.5 ПLO=4.1 ПF=4.2 ПL=3.8 ПM=4.0 ПS=4.2 between different departments N=2 N=9 N=10 N=5 N=3 N=13 (ПT=4.1) Government Local Foreign Large Medium Small
Total Ownership aspects
Size aspect Changes made
N % G % LO % F % C Sig L % M % S % C Sig Reacting market practices
1 4.8 - - 1 11.1 - - .258 n.s - - - - 1 7.7 .175 n.s
Parent’s company influence
1 4.8 - - - - 1 10.0 .235 n.s - - - - 1 7.7 .175 n.s
Very motivated
1 4.8 - - - - 1 10.0 .235 n.s - - - - 1 7.7 .175 n.s

129
Figure 8.4 Most important actions on company culture (continued)
Strongly Strongly Strongly Strongly disagree agree disagree agree ownership aspects Size aspects 1 2 3 4 5 1 2 3 4 5 3.Our company encourages an •_______•________•________•_______• •_______•________•________•_______•
open discussion of conflicts ПG=3.0 ПF=3.6 ПLO=3.5 ПL=3.0 ПM=3.7 ПS=3.7 and differences N=2 N=10 N=9 N=5 N=3 N=13 (ПT=3.5) 4.Our company encourages •_______•________•________•_______• •_______•________•________•_______• participative Decision- making ПG=3.0 ПF=3.3 ПLO=3.7 ПL=3.4 ПM=3.7 ПS=3.4 processes in and between N=2 N=10 N=9 N=5 N=3 N=13 organizational levels (ПT=3.4) 5.Our company encourages •_______•________•________•_______• •_______•________•________•_______•
informal conversation Between ПG=3.6 ПF=2.9 ПLO=3.3 ПL=3.6 ПM=3.3 ПS=2.9 senior and subordinate personnel N=2 N=10 N=9 N=3 N=3 N=13 (ПT=3.1) * 6.Our company encourages •_______•________•________•_______• •_______•________•________•_______•
teamwork rather than individual ПG=2.5 ПF=3.9 ПLO=4.0 ПL=3.4 ПM=4.0 ПS=3.9 contributions N=2 N=10 N=9 N=5 N=3 N=13 (ПT=3.8) 7.In our company the emphasis is •_______•________•________•_______• •_______•________•________•_______• on getting thing done, even if ПG=3.0 ПF=2.1 ПLO=1.8 ПL=2.2 ПM=2.7 ПS=1.8 this means disregarding N=2 N=10 N=9 N=5 N=3 N=13 formal procedures (ПT=2.0)
8.In our company our mission, •_______•________•________•_______• •_______•________•________•_______• strategy and goals are widely ПG=4.0 ПF=3.6 ПLO=3.7 ПL=3.8 ПM=3.7 ПS=3.6 communicated to the employees N=2 N=10 N=9 N=5 N=3 N=13 (ПT=3.7) 9.In our company managers provide •_______•________•________•_______• •_______•________•________•_______• a great deal of support to their ПG=3.5 ПF=3.5 ПLO=3.7 ПL=3.8 ПM=3.3 ПS=3.6 subordinates N=2 N=10 N=9 N=5 N=3 N=13 (ПT=3.6) 10.In our company people are •_______•________•________•_______• •_______•________•________•_______• rewarded in Proportion to the ПG=2.5 ПLO=3.6 ПF=3.2 ПL=3.2 ПM=3.7 ПS=3.2 excellence of their performance N=2 N=9 N=10 N=5 N=3 N=13 (ПT=3.3)
Note that: *=p < 0.05, **= p<0.01, ***=p<0.001 Government Local Foreign Large Medium Small 13 of the total of 21 banks made major attempts to change their organizational culture
during the last five years. This included the two government owned banks, 66.7% of the
local banks and 50% of the foreign owned banks. The results of the table 8.2 also found
that there were no significant differences in the top management attempts to change
their culture either by size or ownership aspects.

130
Table 8.2 The banks which changed their company cultures (over the last five years)
Total Ownership aspects Size aspects Response N % G % LO % F % L % M % S %
Yes 13 61.9 2 100 6 66.7 5 50.0 3 60.0 2 66.7 8 61.5 No 8 38.1 - - 3 33.3 5 50.0 2 40.0 1 33.3 5 38.5 Size aspects: Cramer’s V=.042 Ownership aspects: Cramer’s V=.302
8.2.6 The nature of the cultural changes
9 of the 13 banks categorized their cultural changes as incremental changes, whilst 4
banks identified their cultural changes as both incremental and revolutionary (see table
8.3). All the large and medium sized banks that changed their culture had incremental
changes and 4 small sized banks had both incremental and revolutionary changes. It is
worth noting that most of the revolutionary and incremental changes happened in the
foreign owned banks. But, the results found that there were no statistically significant
differences in the nature of the cultural changes either by size or ownership aspects.
Table 8.3 The nature of the cultural changes
8.2.7 The main reasons for the cultural changes Table 8.4 summarizes the major reasons given by the banks for their cultural changes.
The highest number of banks reported the main reasons for cultural changes were to be
competitive in the market, customer orientation, the development took place in the
banking sector, and survival of the company. It is worth noting that most of the cultural
changes were due to the growth and the expansion of the banks and the banking
Total Ownership aspects
Size aspect
Changes made
N % G % LO % F % C Sig L % M % S % C Sig Incremental changes
9 69.2 2 100 5 83.3 2 40.0 .516 n.s 3 100 2 100 4 50.0 .433 n.s
Revolutionary changes
- - - - - - - - - - - - - - - - - -
Both incremental and revolutionary changes
4 30.8 - - 1 16.7 3 60.0 .516 n.s - - - - 4 50.0 .527 n.s

131
industry in Sri Lanka and, only 3 banks reported having cultural changes due to the
survival of their company. There were no significant differences in the main reasons for
the cultural changes either by size or ownership aspects.
Table 8.4 The main reasons for the company culture changes
Total Ownership aspects Size aspects
Response
N % G % LO % F % C Sig L % M % S % C Sig In order to improve the financial viability in the market
1 7.7 1 50.0 - - - - .677 n.s 1 33.3 - - - - .527 n.s
To be competitive in the market
3 23.1 1 50.0 2 33.3 - - .453 n.s 2 66.7 - - 1 12.5 .576 n.s
Decline of market share of the organization
2 15.4 1 50.0 - - 1 20.0 .481 n.s 1 33.3 - - 1 12.5 .298 n.s
Migration to modern IT systems
1 7.7 1 50.0 - - - - .677 n.s 1 33.3 - - - - .527 n.s
M OU and the government’s signal for the importance of performance
1 7.7 1 50.0 - - - - .677 n.s 1 33.3 - - - - .527 n.s
In order to harmonize two different cultures that existed before the merger
1 7.7 - - 1 16.7 - - .312 n.s - - 1 50.0 - - .677 n.s
Not having job descriptions
1 7.7 - - - - 1 20.0 .365 n.s - - - - 1 12.5 .228 n.s
Need for decentralization of the powers
1 7.7 - - - - 1 20.0 .365 n.s - - - - 1 12.5 .228 n.s
Diversity of the human resources of the bank
1 7.7 - - - - 1 20.0 .365 n.s - - 1 50.0 - - .677 n.s
Emphasis on mutual respect & team work
1 7.7 - - - - 1 20.0 .365 n.s - - 1 50.0 - - .677 n.s
The belief of head office that the Sri Lankan banking system is too risky
1 7.7 - - - - 1 20.0 .365 n.s - - - - 1 12.5 .228 n.s
Customer orientation
3 23.1 - - 3 50.0 - - .592 n.s 1 33.3 - - 2 25.0 .247 n.s

132
Table 8.4 The main reasons for the company culture changes (continued)
Total Ownership aspects Size aspects
Response
N % G % LO % F % C Sig L % M % S % C Sig Opening of new branches
2 15.4 - - 2 33.3 - - .461 n.s - - - - 2 25.0 .337 n.s
To enhance the morale of the staff
1 7.7 - - 1 16.7 - - .312 n.s 1 33.3 - - - - .527 n.s
Staff are required from different banks
1 7.7 - - 1 16.7 - - .312 n.s - - - - 1 12.5 .228 n.s
Had a different culture
1 7.7 - - 1 16.7 - - .312 n.s - - - - 1 12.5 .228 n.s
Survival of the company
3 23.1 - - 1 16.7 2 40.0 .345 n.s - - - - 3 37.5 .433 n.s
Development took place in the banking sector
3 23.1 - - 1 16.7 2 40.0 .345 n.s - - - - 3 37.5 .433 n.s
Environmental changes in the banking sector
2 15.4 - - - - 2 40.0 .539 n.s - - - - 2 25.0 .337 n.s
Growth of the bank
2 15.4 - - - - 2 40.0 .539 n.s - - - - 2 25.0 .337 n.s
Unsatisfactory performance of the bank
1 7.7 - - 1 16.7 - - .312 n.s - - - - 1 12.5 .228 n.s
Note that: Total (N) = 13
8.2.8 Major cultural changes made by the banks
Table 8.5 summarizes the major cultural changes made by the banks during last five
years. Change of values to core customers, introduction of new tasks and job
descriptions, and recruitment of new staff were the most reported major cultural
changes respectively. Introduction of new tasks and job descriptions were associated
with the ownership aspects and, were seen in foreign owned banks. There were no
significant differences in the cultural changes by size aspects.

133
Table 8.5 Major cultural changes made by the banks over the last five years
Total Ownership aspects Size aspects Cultural change N % G % LO % F % C Sig L % M % S % C Sig
Goal oriented action
1 7.7 1 50.0 - - - - .527 n.s 1 33.3 - - - - .677 n.s
Planning 1 7.7 1 50.0 - - - - .677 n.s 1 33.3 - - - - .527 n.s
Evaluation with financial achievements / ratios
2 15.4 1 50.0 1 16.7 - - .461 n.s 1 33.3 - - 1 12.5 .298 n.s
Performance management / evaluation
1 7.7 1 50.0 - - - - .677 n.s 1 33.3 - - - - .527 n.s
Change of values to core customers
3 23.1 1 50.0 1 16.7 1 20.0 .275 n.s 1 33.3 - - 2 25.0 .247 n.s
Induction of business sense and change of attitude
1 7.7 1 50.0 - - 1 20.0 .481 n.s 1 33.3 - - 1 12.5 .298 n.s
Address people by the first name
1 7.7 - - 1 16.7 - - .312 n.s - - 1 50.0 - - .677 n.s
Open door policy of managers and supervisors
1 7.7 - - 1 16.7 - - .312 n.s - - 1 50.0 - - .677 n.s
Acceptance of younger people at management grade
1 7.7 - - 1 16.7 - - .312 n.s - - 1 50.0 - - .677 n.s
Changed the CEO/GM
1 7.7 - - - - 1 20.0 .365 n.s - - - - 1 12.5 .228 n.s
Introduction of new tasks
3 23.1 - - - - 3 60.0 .693 * - - - - 3 37.5 .433 n.s
Introduction of job descriptions
3 23.1 - - - - 3 60.0 .693 * - - - - 3 37.5 .433 n.s
Emphasis on team work
1 7.7 - - - - 1 20.0 .365 n.s - - 1 50.0 - - .677 n.s
Diversity respecting
1 7.7 - - - - 1 20.0 .365 n.s - - 1 50.0 - - .677 n.s
Open communications and exchange of views
1 7.7 - - - - 1 20.0 .365 n.s - - 1 50.0 - - .365 n.s
Cut down the staff to work with the minimum capacity
1 7.7 - - - - 1 20.0 .365 n.s - - - - 1 12.5 .228 n.s
Change the policies and procedures of company
1 7.7 - - - - 1 20.0 .365 n.s - - - - 1 12.5 .228 n.s
Recruitment of new staff
3 23.1 - - 2 33.3 1 20.0 .275 n.s - - - - 3 37.5 .433 n.s

134
Table 8.5 Major cultural changes made by the banks over the last five years (continued)
Total Ownership aspects Size aspects Cultural change N % G % LO % F % C Sig L % M % S % C Sig
New uniforms to the staff
1 7.7 - - 1 16.7 - - .312 n.s - - - - 1 12.5 .225 n.s
Dialog between staff & management
1 7.7 - - 1 16.7 - - .312 n.s 1 33.3 - - - - .527 n.s
Marketing orientation
1 7.7 - - 1 16.7 - - .312 n.s 1 33.3 - - - - .527 n.s
Bring the team spirit
1 7.7 - - 1 16.7 - - .312 n.s - - - - 1 12.5 .228 n.s
Changed of senior management
1 7.7 - - 1 16.7 - - .312 n.s - - - - 1 12.5 .228 n.s
Recruited senior managers from various other banks in Sri Lanka
1 7.7 - - 1 16.7 - - .312 n.s - - - - 1 12.5 .228 n.s
Concerned about cost efficiency of the bank
1 7.7 - - 1 16.7 - - .312 n.s - - - - 1 12.5 .228 n.s
Note that: Total (N) = 13, *=p < 0.05, **= p<0.01, ***=p<0.001 8.2.9 The major factors which supported the cultural changes
The major factors that supported the above mentioned cultural changes are summarized
in the table 8.6. Introduction of new products by the Sri Lankan banking sector, growth
of the bank, low profitability and the economic changes were the major factors that
supported the cultural changes in most banks respectively. Low profitability, economic
changes, introduction of new products by the banking sector were associated with
ownership aspects and mostly seen in foreign owned banks. Surprisingly, the size
aspects were not associated with any factor.

135
Table 8.6 The major factors which supported the cultural changes
Total Ownership aspects Size aspects Major factor N % G % LO % F % C Sig L % M % S % C Sig
Govt support
1 7.7 1 50.0 - - - - .677 n.s 1 33.3 - - - - .527 n.s
Commitment of corporate management and the board
2 15.4 1 50.0 1 16.7 - - .461 n.s 1 33.3 1 50.0 - - .557 n.s
Trade union’s support
1 7.7 1 50.0 - - - - .677 n.s 1 33.3 - - - - .527 n.s
External forces (competitors, owners)
1 7.7 1 50.0 - - - - .677 n.s 1 33.3 - - - - .527 n.s
Induction of network banking
1 7.7 1 50.0 - - - - .677 n.s 1 33.3 - - - - .527 n.s
Recruitment of new employees with professional background
1 7.7 1 50.0 - - - - .677 n.s 1 33.3 - - - - .527 n.s
Appointment of consultants to key areas to inject new culture
1 7.7 1 50.0 - - - - .677 n.s 1 33.3 - - - - .527 n.s
Acceptance of change by majority of staff
1 7.7 - - 1 16.7 - - .312 n.s - - 1 50.0 - - .677 n.s
Unsatisfactory performances of the bank
2 15.4 - - 1 16.7 1 20.0 .187 n.s - - - - 2 25.0 .337 n.s
Low profitability
3 23.1 - - - - 3 60.0 .693 * - - - - 3 37.5 .433 n.s
Opening of new branches
1 7.7 - - 1 16.7 - - .312 n.s - - - - 1 12.5 .228 n.s
Appreciation of effort
1 7.7 - - 1 16.7 - - .312 n.s 1 33.3 - - - - .527 n.s
Rewards 1 7.7 - - 1 16.7 - - .312 n.s
1 33.3 - - - - .527 n.s
Manage to recruit young staff
1 7.7 - - 1 16.7 - - .312 n.s - - - - 1 12.5 .228 n.s
Let the staff by example
1 7.7 - - 1 16.7 - - .312 n.s - - - - 1 12.5 .228 n.s
Introduction of new Products by the banking sector in Sri Lanka
5 38.5 - - 1 16.7 4 80.0 .685 * - - 1 50.0 4 50.0 .433 n.s

136
Table 8.6 The major factors which supported the cultural changes (continued)
Total Ownership aspects Size aspects Major Factor N % G % LO % F % C Sig L % M % S % C Sig
Economic changes
3
23.1 - - - - 3 60.0 .693 * - - 1 50.0 2 25.0 .365 n.s
Growth of the bank
4
30.8 - - 1 16.7 3 60.0 .516 n.s - - 1 50.0 3 37.5 .377 n.s
To meet capital requirements of central bank
1
7.7 - - 1 16.7 - - .312 n.s - - - - 1 12.5 .228 n.s
The change of main shareholders
1 7.7 - - 1 16.7 - - .312 n.s - - - - 1 12.5 .228 n.s
Note that: Total (N) = 13, *=p < 0.05, **= p<0.01, ***=p<0.001
8.2.10 Major factors which made cultural changes difficult Table 8.7 shows the major factors which made the cultural changes difficult. 6 of the 13
banks who had cultural changes mentioned that they did not have any factors which
made their cultural changes difficult. Influence of trade unions and informal groups
negatively affected in 2 government owned banks and it was associated with ownership
aspects rather than the size aspects. Small banks reported difficulties were long term
planning, high expenses, huge turn overs of staff, low profitability, capital requirements,
lack of skills etc.
Table 8.7 Major factors which made cultural changes difficult
Total Ownership aspects Size aspects Major factor N % G % LO % F % C Sig L % M % S % C Sig
Influence of trade unions and informal groups
2 15.4 2 100 - - - - 1.00 ** 2 66.7 - - - - .778 *
Age structure of the staff
1 7.7 1 50.0 - - - - .677 n.s 1 33.3 - - - - .527 n.s
Lack of commitment from the leadership
1 7.7 1 50.0 - - - - .677 n.s 1 33.3 - - - - .527 n.s
Mechanistic organizational structure
1 7.7 1 50.0 - - - - .677 n.s 1 33.3 - - - - .527 n.s
Barriers in bottom to top communication
1 7.7 1 50.0 - - - - .677 n.s 1 33.3 - - - - .527 n.s

137
Table 8.7 Major factors which made cultural changes difficult (continued)
Total Ownership aspects Size aspects Major factor N % G % LO % F % C Sig L % M % S % C Sig
Lack of a link between performance and rewarding
1 7.7 1 50.0 - - - - .677 n.s 1 33.3 - - - - .527 n.s
Major share of free riders in work force
1 7.7 1 50.0 - - - - .677 n.s 1 33.3 - - - - .527 n.s
Previous structure of the bank
1 7.7 - - 1 16.7 - - .312 n.s - - 1 50.0 - - .677 n.s
Large number of employees who had been with the other bank
1 7.7 - - 1 16.7 - - .312 n.s - - 1 50.0 - - .677 n.s
Different views of two organizational cultures
1 7.7 - - 1 16.7 - - .312 n.s - - 1 50.0 - - .677 n.s
Long term planning
1 7.7 - - - - 1 20.0 .365 n.s - - - - 1 12.5 .228 n.s
High expenses
1 7.7 - - - - 1 20.0 .365 n.s - - - - 1 12.5 .228 n.s
Huge turnovers of staff
1 7.7 - - - - 1 20.0 .365 n.s - - - - 1 12.5 .228 n.s
Low profitability
1 7.7 - - - - 1 20.0 .330 n.s - - - - 1 12.5 .238 n.s
Decrease staff moral
1 7.7 - - - - 1 20.0 .365 n.s - - - - 1 12.5 .228 n.s
Capital requirements
1 7.7 - - - - 1 20.0 .365 n.s - - - - 1 12.5 .228 n.s
Lack of skills
1 7.7 - - - - 1 20.0 .365 n.s - - - - 1 12.5 .228 n.s
Monitoring authority of central bank
1 7.7 - - - - 1 20.0 .365 n.s - - - - 1 12.5 .228 n.s
There were no major factors which made these changes difficult
6 46.2 - - 4 66.7 2 40.0 .465 n.s 1 33.3 1 50.0 4 50.0 .141 n.s
Note that: Total (N) =13, *=p < 0.05, **= p<0.01, ***=p<0.001

138
8.2.11 The banks that experienced problems when implementing cultural changes
9 of the total of 13 banks mentioned that they did not experience any problems when
implementing cultural changes in their banks. Only four banks reported having
problems and this included both the government owned banks, one foreign owned bank
and one locally owned bank (see table 8.8).
Table 8.8 The banks which experienced the problems when implementing cultural changes
Total Ownership aspects Size aspects Response N % G % LO % F % L % M % S %
Yes 4 30.8 2 100 1 16.7 1 20.0 2 66.7 1 50.0 1 12.5
No 9 69.2 - - 5 83.3 4 80.0 1 33.3 1 50.0 7 87.5
Table 8.9 summarizes the difficulties faced by the banks when implementing their
cultural changes. Both the government owned banks struggled to get the required trade
union support. Decrease in staff morale was experienced by a foreign owned bank and
resistance to change employee’s role and location was experienced by a locally owned
medium sized bank.
Table 8.9 The problems experience by the banks when implemented cultural changes
Total Ownership aspects Size aspects The
problem N % G % LO % F % C Sig L % M % S % C Sig
Obtaining required TU’s support
2 50.0 2 100 - - - - 1.00 n.s 2 100 - - - - 1.00 n.s
Change the attitude of staff
1 25.0 1 50.0 - - - - .577 n.s 1 50.0 - - - - .577 n.s
Age structure and qualification of the staff
1 25.0 1 50.0 - - - - .577 n.s 1 50.0 - - - - .577 n.s

139
Table 8.9 The problems experience by the banks when implemented cultural changes (Continued)
Total Ownership aspects Size aspects The
problem N % G % LO % F % C Sig L % M % S % C Sig
Barriers in language (poor English)
1 25.0 1 50.0 - - - - .577 n.s 1 50.0 - - - - .577 n.s
Resistance to change in roles, location
1 25.0 - - 1 100 - - 1.00 n.s - - 1 100 - - 1.00 n.s
Staff morale has decreased
1 25.0 - - - - 1 100 1.00 n.s - - - - 1 100 1.00 n.s
Note that: Total (N) = 4 8.2.12 Success of the company’s culture changes
The average success of the banks cultural changes was 3.53 and overall, the banks who
made cultural changes think that their changes have been successful (see figure 8.5).
However, small banks had a lower level of success than the medium and large banks.
Similarly, locally owned banks reported a higher success rate than the government and
foreign owned banks but these were not significant differences either by size or
ownership aspects.
Figure 8.5 Success of the company’s culture changes Un successful Very Un successful Very successful successful Ownership aspects Size aspects 1 2 3 4 5 1 2 3 4 5 ПT=3.53 ПT=3.53 •_______•________•________•_______• •_______•________•________•_______• ПG=3.5 ПF=3.4 ПLO=3.7 ПL=3.7 ПM=4.0 ПS=3.4 N=2 N=5 N=6 N=3 N=2 N=8 Ownership: Cramer’s V=.355 P=.513 Size: Cramer’s V=.314 P=.634
Government Local Foreign Large Medium Small

140
8.2.13 Expected cultural changes by the commercial banks
9 of the total of 21 banks were expecting to introduce new changes to their company
culture in the next five years (see table 8.10). Those nine banks include the two
government owned banks, two locally owned and five foreign owned banks. There were
no statistically significant differences in the banks which were planning to introduce
changes for their company cultures in the next five years either by size or ownership
aspects.
Table 8.10 Do you expect any major changes in your company’s culture in the next five years?
Total Ownership aspects Size aspects Response
N % G % LO % F % L % M % S %
Yes 9 42.9 2 100 2 22.2 5 50.0 2 40.0 1 33.3 6 46.2
No 12 57.1 - - 7 77.8 5 50.0 3 60.0 2 66.7 7 53.8
Size: Cramer’s V=.178 P=.728, Ownership: Cramer’s V=.394 P=.212 Table 8.11 shows the expected major cultural changes of the Sri Lankan commercial
banks for the next five years. The most expected major cultural changes in the next five
years were new positions at corporate and operational level, new staff recruitments and
changes to the bank hierarchy respectively. Changes to the bank hierarchy were
associated with ownership aspect and were reported from the two government owned
banks, and also from a locally owned bank. It was also found that need to change
culture to attract the best talent in the market was associated with size aspects and have
been seen in a medium sized bank.

141
Table 8.11 Expected major culture changes by the Sri Lankan commercial banks
Total Ownership aspects Size aspects Expected
change N % G % LO % F % C Sig L % M % S % C Sig
Introduction of performance evaluation & reward system
1 11.1 1 50.0 - - - - .661 n.s 1 50.0 - - - - .661 n.s
Changes to the bank hierarchy
3 33.3 2 100 1 50.0 - - .866 * 2 100 - - 1 16.7 .764 n.s
New positions at corporate and operational level
6 66.7 1 50.0 2 100 3 60.0 .387 n.s 1 50.0 - - 5 83.3 .577 n.s
New staff recruitments
6 66.7 1 50.0 2 100 3 60.0 .387 n.s 1 50.0 - - 5 83.3 .577 n.s
Need to change the culture to attract the best talent in the market
1 11.1 - - - - 1 20.0 .316 n.s - - 1 100 - - 1.00 *
Administrative changes
2 22.2 - - - - 2 40.0 .478 n.s - - - - 2 33.3 .378 n.s
Note that: Total (N) = 9, *=p < 0.05, **= p<0.01, ***=p<0.001 8.2.14 Presence of sub cultures
Surprisingly, only 8 banks identified that their cultures had subcultures. These 8 banks
included all the large banks, two medium sized and 1 small sized banks (see table 8.12).
It was found that 92.3% of the small sized banks did not have sub cultures in their
banks. There were significant differences in the presence of sub cultures either by size
or ownership aspects but, the size aspects were more associated with the sub cultures
than the ownership aspects.
Table 8.12 Do you have sub cultures in your company?
Total Ownership aspects Size aspects Response N % G % LO % F % L % M % S %
Yes 8 38.1 2 100 5 55.6 1 7.7 5 100 2 66.7 1 7.7 No 13 61.9 - - 4 44.4 9 90.0 - - 1 33.3 12 92.3 Size: Cramer’s V=.824 P=.001, Ownership: Cramer’s V=.608 P=.021,

142
8.2.15 The major reasons for development of sub cultures
Table 8.13 displays the major reasons for the development of sub cultures. Working
within a department, presence of different societies, geographical distribution of
operations, trade unions and connected mechanisms were the main reasons respectively.
It was found that trade unions and connected mechanisms was a major reason for the
creation of sub cultures in two government owned banks. Working within a department
was associated with ownership aspects and was seen in locally owned banks. Working
culture of Sri Lanka was associated with ownership and size aspects and was seen in a
foreign owned small sized bank. Thus, there were significant differences found in the
major reasons for the development of sub cultures both by size or ownership aspects.
Table 8.13: The major reasons for development of sub cultures
Total Ownership aspects Size aspects Reason N % G % LO % F % C Sig L % M % S % C Sig
Traditionally used systems 1 12.5 1 50.0 - - - - .655 n.s 1 20.0 - - - - .293 n.s
Trade unions and connected mechanisms
3 37.5 2 100 1 20.0 - - .757 n.s 3 60.0 - - - - .600 n.s
Presence of different societies
4 50 1 50.0 3 60.0 - - .387 n.s 3 60.0 1 50.0 - - .387 n.s
Geographical distributions of operations
3 37.5 1 50.0 2 40.0 - - .306 n.s 3 60.0 - - - - .600 n.s
Working within a department
5 62.5 - - 5 100 - - 1.00 * 3 60.0 2 100 - - .600 n.s
Working culture of Sri Lanka
1 12.5 - - - - 1 100 1.00 * - - - - 1 100 1.00 *
Note that: Total (N) = 8, *=p < 0.05, **= p<0.01, ***=p<0.001
8.2.16 Top management perception about the sub cultures 15 of the total of 21 banks think the presence of sub cultures weaken or undermine their
organization. Thus, 15 banks preferred to have one culture in their banks. There were no
significant differences in the top management perception about the sub cultures either
by size or ownership aspects (see table 8.14).

143
Table 8.14 Do you think development of subcultures weaken or undermine the organization?
Total Ownership aspects Size aspects Response
N % G % LO % F % L % M % S %
Yes 15 71.4 2 100 6 66.7 7 70.0 3 60.0 3 100 9 69.2
No 6 28.6 - - 3 33.3 3 30.0 2 40.0 - - 4 30.8
Ownership aspects: Cramer’s v=.208 p=.634 Size aspects: Cramer’s V=.272 P=.461
8.2.17 Top management preferences on company culture
17 of the total of 21 banks preferred to have a flexible culture and only 4 banks
preferred to have a strong culture. The 17 banks who wanted to have a flexible culture
include one government owned bank, 8 locally owned banks and 8 foreign owned banks
(see table 8.15). There were no significant differences in the top management
preferences of organizational cultures either by size or ownership aspects.
Table 8.15 Preferred types of company cultures
Total Ownership aspects Size aspects Type N % G % LO % F % L % M % S %
Strong culture
4 19 1 50.0 1 11.1 2 20.0 1 20.0 1 33.3 2 15.4
Flexible culture
17 81 1 50.0 8 88.9 8 80.0 4 80.0 2 66.7 11 84.6
Size aspects: Cramer’s V=0.277 P=0.446 Ownership aspects: Cramer’s V=0.156 P= 0.774 8.2.18 The influence of company culture on company strategies Figure 8.6 shows the influence of company culture on company strategies. The
results found that the cultures in every bank had an influence on their company
strategies. Government owned banks reported a greater influence on company
strategies than locally and foreign owned banks. Similarly, medium and large
banks’ cultures had a greater influence on their strategies than the small sized
banks. The results found that there were significant differences in the influence of
culture on company strategies by ownership aspects but, not by size aspects.

144
Figure 8.6: The influence of company culture on company strategies
No Very great No Very great influence influence influence influence
Ownership aspects Size aspects
1 2 3 4 5 1 2 3 4 5 ПT=3.8 ** ПT=3.8 •_______•________•________•_______• •_______•________•________•_______• ПG=5.0 ПF=3.5 ПLO=3.9 ПL=4.2 ПM=4.3 ПS=3.5
N=2 N=10 N=9 N=5 N=3 N=13
Ownership: Cramer’s V=.636 P=.009 Size: Cramer’s V=.415 P=.300 Note that: *=p < 0.05, **= p<0.01, ***=p<0.001 Government Local Foreign Large Medium Small 8.3 Management style 8.3.1 Key characteristics of management style Table 8.16 summarises the key management styles of the banks. Top to bottom
approach, bureaucratic, and participatory decision making were the most reported
key characteristics in their management styles respectively. Individual
performance rather than group performance, power motives rather than
achievement motives were associated with ownership aspects and were seen in a
government owned bank. Surprisingly, one foreign owned bank had autocratic
characteristics in their management style. There were no significant differences in
the management styles by size aspects.

145
Table 8.16 Key characteristics of management style
Total Ownership aspects Size aspects Characteristic N % G % LO % F % C Sig L % M % S % C Sig
Bureaucratic 19 90.5 2 100 8 88.9 9 90.0 .107 n.s 5 100 3 100 11 84.6 .255 n.s Top to bottom approach
21 100 2 100 9 100 10 100 n.a n.a 5 100 3 100 13 100 n.a n.a
Individual performance rather than group performance
1 4.8 1 50.0 - - - - .689 ** 1 20.0 - - - - .400 n.s
Power motives rather than achievement motives
1 4.8 1 50.0 - - - - .689 ** 1 20.0 - - - - .400 n.s
Participatory 13 61.9 - - 6 66.7 7 70.0 .415 n.s 2 40.0 3 100 8 61.5 .369 n.s Autocratic 1 4.8 - - - - 1 10.0 .235 n.s - - - - 1 7.7 .175 n.s Collective 2 9.5 - - 1 11.1 1 10.0 .107 n.s 1 20.0 - - 1 7.7 .219 n.s Decisions are made by a committee
1 4.8 - - - - 1 10.0 .235 n.s - - - - 1 7.7 .175 n.s
Collective decisions by the board of directors
1 4.8 - - 1 11.1 - - .258 n.s 1 20.0 - - - - .400 n.s
People friendly 1 4.8 - - 1 11.1 - - .258 n.s 1 20.0 - - - - .400 n.s
Honest, sincere transparent culture
1 4.8 - - 1 11.1 - - .258 n.s - - - - 1 7.7 .175 n.s
Note that: *=p < 0.05, **= p<0.01, ***=p<0.001
8.3.2 The groups who influenced the management style
Corporate level management had the most influence on company management style,
followed by second level management and other lower levels of management (see figure
8.7). It was found that trade unions had a reasonable level of influence in the two
government owned banks. Outside members of the board of directors and corporate
planning department had very little influence. One foreign owned bank reported that
their chairman of the head office has a great influence on their company’s management
style. Corporate management in locally owned banks had a greater influence on their
management styles than the government and foreign owned banks and this was a
significant difference.

146
Figure 8.7 The groups who influenced the management style
No Very great No Very great influence influence influence influence
Ownership aspects Size aspects
1 2 3 4 5 1 2 3 4 5 ПT=4.0 * ПT=4.0 Corporate level •_______•________•________•_______• •_______•________•________•_______• management ПG=4.0 ПLO=4.1 ПF=3.9 ПL=4.0 ПM=4.0 ПS=4.0 (ПT=4.0) N=2 N=9 N=10 N=5 N=3 N=13 Outside members of •_______•________•________•_______• •_______•________•________•_______• the board of directors ПG=2.5 ПLO=2.6 ПF=1.6 ПL=2.2 ПM=1.7 ПS=2.1 (ПT=2.1) N=2 N=9 N=10 N=5 N=3 N=13
Second level line •_______•________•________•_______• •_______•________•________•_______• managers ПG=3.0 ПLO=3.2 ПF=3.2 ПL=3.0 ПM=3.0 ПS=3.3 (ПT=3.2) N=2 N=9 N=10 N=5 N=3 N=13
Corporate planning •_______•________•________•_______• •_______•________•________•_______• department ПLO=2.3 ПL=1.5 ПM=2.5 ПS=2.7 (ПT=2.3) N=7 N=2 N=2 N=3
Other lower levels •_______•________•________•_______• •_______•________•________•_______• of management ПG=3.0 ПF=2.7 ПLO=3.0 ПL=3.2 ПM=3.0 ПS=2.7 (ПT=2.9) N=2 N=10 N=9 N=5 N=3 N=13
Trade unions •_______•________•________•_______• •_______•________•________•_______• (ПT=3.0) ПG=3.0 ПL=3.0 N=2 N=2 Chairman of the •_______•________•________•_______• •_______•________•________•_______• head office ПF=4.0 ПS=4.0 (ПT=4.0) N=1 N=1 Note that: *=p < 0.05, **= p<0.01, ***=p<0.001 Government Local Foreign Large Medium Small 8.3.3 The effect of management style on follower’s performance and job satisfaction
Top managements of all the banks believed that the management style has an influence
on the follower’s performance and job satisfaction. Figure 8.8 shows the means of the
responses received in terms of size and ownership aspects. Government bank’s
management styles had a greater effect on follower’s performance and job satisfaction
than the foreign and locally owned banks. Similarly, medium size banks reported a
higher effect than the small and large banks. Significant differences were found by
ownership aspects but not by size aspects.

147
Figure 8.8 The effect of management style on follower’s performance and job satisfaction
Not at all To a great Not at all To a great extent extent Ownership aspects Size aspects
1 2 3 4 5 1 2 3 4 5 ПT=3.6 * ПT=3.6 •_______•________•________•_______• •_______•________•________•_______• ПG=4.5 ПF=3.7 ПLO=3.3 ПL=3.6 ПS=3.5 ПM=4.0 N=2 N=10 N=9 N=5 N=13 N=3 Ownership: Cramer’s V=0.560 P=0.011 Size: Cramer’s V=0.413, P=0.127 Note that: *=p < 0.05, **= p<0.01, ***=p<0.001 Government Local Foreign Large Medium Small
8.3.4 The influence of management style on company performance
Figure 8.9 shows to what extent management style has an influence on company
performances. It was found that management styles had a greater influence on company
performances in government owned banks than the locally and foreign owned banks.
Similarly, large banks reported a greater level of influence than the medium and small
sized banks. There were no significant differences found in the influence level of
management styles on company performance either by size or ownership aspects.
Figure 8.9 The influence of management style on company performance
Not at all To a great Not at all To a great extent extent Ownership aspects Size aspects
1 2 3 4 5 1 2 3 4 5 ПT=3.8 ПT=3.8 •_______•________•________•_______• •_______•________•________•_______• ПG=4.5 ПF=3.8 ПLO=3.7 ПL=4.0 ПS=3.8 ПM=3.7 N=2 N=10 N=9 N=5 N=13 N=3 Ownership aspects: Cramer’s V=0.346 P=0.284 Size aspects: Cramer’s V=0.162 P=0.895 Government Local Foreign Large Medium Small

148
8.3.5 The influence of management style on company strategies
Overall, the banks management style had an influence on the company strategies (see
figure 8.10). However, the medium sized banks management styles had a greater level
of influence on their company strategies than the large and small sized banks and
similarly, government owned banks reported a greater influence than the locally and
foreign owned banks. There were no significant differences in the influence level of
management style on company strategies either by size or ownership aspects.
Figure 8.10 The influence of management style on company strategies
Not at all To a great Not at all To a great extent extent Ownership aspects Size aspects
1 2 3 4 5 1 2 3 4 5 ПT=3.7 ПT=3.7 •_______•________•________•_______• •_______•________•________•_______• ПG=4.0 ПF=3.8 ПLO=3.6 ПL=3.8 ПS=3.6 ПM=4.0 N=2 N=10 N=9 N=5 N=13 N=3 Ownership: Cramer’s V=0.252 P=0.615 Size: Cramer’s V=0.309 P=0.404 Government Local Foreign Large Medium Small
8.3.6 The problems faced by the banks in their current management style (over the last five years) Four of the total of twenty one banks mentioned that they had significant problems with
their current management style over the last five years (see table 8.17). These four
banks included the two government owned banks and two foreign owned banks. There
were significant differences in the banks which were having problems in their key
management style on the basis of ownership aspects.
Table 8.17: The banks which are having significant problems with its current management style
Total Ownership aspects Size aspects Response N % G % LO % F % L % M % S %
Yes 4 19.0 2 100 - - 2 20.0 2 40.0 - - 2 15.4 No 17 81.0 - - 9 100 8 80.0 3 60.0 3 100 11 84.6 Size: Cramer’s V=0.327 P=0.326 Ownership: Cramer’s V=0.711 P=0.005

149
8.3.7 The major problems faced by the banks in their current management style
Table 8.18 summarises the major problems faced by the above mentioned four banks in
their current management style. Too much listening to trade union’s views was reported
from a government owned bank and, problems such as decreasing of profitability, high
turnovers of staff and dissatisfaction of the employees were reported from foreign
owned banks.
Table 8.18: The major problems faced by the banks in their current management style
Total Ownership aspects Size aspects Response
N % G % LO % F % C Sig L % M % S % C Sig
Too much listening to TU’s views
1 25.0 1 50.0 - - - - .577 n.s 1 50.0 - - - - .577 n.s
Lack of strategic planning
1 25.0 1 50.0 - - - - .577 n.s 1 50.0 - - - - .577 n.s
Inequity on policy decisions
1 25.0 1 50.0 - - - - .577 n.s 1 50.0 - - - - .577 n.s
Poor practice and use of modern management techniques
1 25.0 1 50.0 - - - - .577 n.s 1 50.0 - - - - .577 n.s
Low concentrations on human aspects
1 25.0 1 50.0 - - - - .577 n.s 1 50.0 - - - - .577 n.s
Non existence of clear management style
1 25.0 1 50.0 - - - - .577 n.s 1 50.0 - - - - .577 n.s
Decreasing of profitability
1 25.0 - - - - 1 50.0 .577 n.s - - 1 100 - - .577 n.s
High turnovers of staff
1 25.0 - - - - 1 50.0 .577 n.s - - 1 50.0 - - .577 n.s
Dissatisfaction of the employees
1 25.0 - - - - 1 50.0 .577 n.s - - 1 10.0 - - .577 n.s
Note that: Total (N) =4

150
8.3.8 The power distance between managers and subordinates
The means of the power distance between managers and their subordinates are shown in
figure 8.11. It was found that government owned banks had a higher power distance
between managers and their subordinates than the foreign and locally owned banks.
Similarly, large banks had a higher power distance than the small and medium sized
banks. Overall, the gap between managers and their subordinates in terms of power
remained at a reasonably high level. The results also found that there were no
statistically significant differences in the power distance between managers and
subordinates either by size or ownership aspects.
Figure 8.11: The power distance between managers and subordinates
Low High Low High Ownership aspects Size aspects
1 2 3 4 5 1 2 3 4 5 ПT=3.2 ПT=3.2 •_______•________•________•_______• •_______•________•________•_______• ПG=4.0 ПF=3.4 ПLO=2.9 ПL=3.4 ПS=3.3 ПM=2.7 N=2 N=10 N=9 N=5 N=13 N=3 Ownership: Cramer’s V=0.547 P=0.050 Size: Cramer’s V=0.288 P=0.747 Government Local Foreign Large Medium Small 8.3.9 Internal politics
Government banks had a higher level of internal politics than the locally and foreign
owned banks (see figure 8.12). Similarly, large banks reported a higher level of internal
politics than the small and medium sized banks. Overall the levels of internal politics in
Sri Lankan commercial banks remained at a low level, but were seen in every bank. The
results also found that there were no significant differences in the internal politics either
by size or ownership aspects.

151
Figure 8.12: The level of internal politics in Sri Lankan commercial banks
Not at all To a great Not at all To a great
extent extent Ownership aspects Size aspects
1 2 3 4 5 1 2 3 4 5 ПT=2.6 ПT=2.6 •_______•________•________•_______• •_______•________•________•_______• ПG=4.5 ПLO=2.4 ПF=2.4 ПL=3.6 ПS=2.2 ПM=2.7 N=2 N=9 N=10 N=5 N=13 N=3 Ownership: Cramer’s V=0.586 P=0.071 Size: Cramer’s V=0.527 P=0.167 Government Local Foreign Large Medium Small
8.3.10 Top management perception about the internal politics
Figure 8.13 shows the top management’s perception about the internal (organizational)
politics. Overall, the top managements of banks think that the internal politics is bad
because political behaviour is undertaken for personal gains rather than for
organizational gains.
Figure 8.13: Top management perception about the internal politics
Disagree Strongly Disagree Strongly
agree agree
Ownership aspects Size aspects 1 2 3 4 5 1 2 3 4 5 Organizational politics is bad •_______•________•________•_______• •_______•________•________•_______•
because that political behaviour ПG=4.5 ПLO=4.0 ПF=4.2 ПL=4.2 ПM=3.7 ПS=4.2 is undertaken for personal rather N=2 N=9 N=10 N=5 N=3 N=13 than organizational gain (ПT=4.1) Organizational politic is good •_______•________•________•_______• •_______•________•________•_______•
because it achieves positive ПG=2.5 ПLO=2.0 ПF=1.8 ПL=2.0 ПM=2.3 ПS=1.8 outcomes for organization that N=2 N=9 N=10 N=5 N=3 N=13 can not be achieved through formal measures (ПT=1.9) Organizational politics is neither •_______•________•________•_______• •_______•________•________•_______• good nor bad but rather is ПG=2.0 ПLO=2.3 ПF=2.2 ПL=2.4 ПM=2.3 ПS=2.1 neutral (ПT=2.2) N=2 N=9 N=10 N=5 N=3 N=13 Organizational politics is good •_______•________•________•_______• •_______•________•________•_______• but too much politics can be ПG=2.5 ПLO=2.8 ПF=2.7 ПL=2.2 ПM=4.0 ПS=2.6 bad (ПT=2.7) N=2 N=9 N=10 N=5 N=3 N=13 Government Local Foreign Large Medium Small

152
8.4 Stakeholder expectations
8.4.1 Major Stakeholder groups of the banks Table 8.19 summarises the major stakeholder groups of the sample banks. Depositors
and other customers, employees, Sri Lankan community and Sri Lankan government
were the most reported major stakeholder groups in Sri Lankan commercial banks
respectively. Groups such as cooperatives, Strategic enterprise management agency
were associated with ownership aspects and were stakeholders in a government owned
bank. One medium sized bank categorized their top management as one of the major
stakeholder group and that was associated with size aspects. Shareholders of the
company were associated with ownership aspects, and were stakeholders in 8 locally
and 3 foreign owned banks.
Table 8.19: Major Stakeholder groups
Total Ownership aspects Size aspects Stakeholder
group N % G % LO % F % C Sig L % M % S % C Sig
Depositors and other customers
21 100 2 100 9 100 10 100 n.a n.a 5 100 3 100 13 100 n.a n.a
Sri Lankan govement
18 85.7 2 100 9 100 7 70.0 .428 n.s 5 100 3 100 10 76.9 .320 n.s
Cooperatives 5 23.8 2 100 - - 3 30.0 .670 ** 2 40.0 1 33.3 2 15.4 .256 n.s
Strategic enterprise management agency
1 4.8 1 50.0 - - - - .689 ** 1 20.0 - - - - .400 n.s
Employees 21 100 2 100 9 100 10 100 n.a n.a 5 100 3 100 13 100 n.a n.a
Sri Lankan community
19 90.5 2 100 8 88.9 9 90.0 .107 n.s 5 100 2 66.7 12 92.3 .490 n.s
Shareholders of the company
11 52.4 - - 8 88.9 3 30.0 .655 * 3 60.0 2 66.7 6 46.2 .164 n.s
Directors 2 9.5 - - 1 11.1 1 10.0 .107 n.s - - 1 33.3 1 7.7 .349 n.s
Top Management
1 4.8 - - 1 11.1 - - .258 n.s - - 1 33.3 - - .548 *
Shareholders of the parent bank
3 14.3 - - - - 3 30.0 .428 n.s - - 1 33.3 2 15.4 .287 n.s
Chairman of the bank
1 4.8 - - - - 1 10.0 .235 n.s - - - - 1 7.7 .175 n.s
Overseas head office
3 14.3 - - - - 3 30.0 .428 n.s - - - - 3 23.1 .320 n.s
Individual share companies
1 4.8 - - 1 11.1 - - .258 n.s - - - - 1 7.7 .175 n.s
Note that: *=p < 0.05, **= p<0.01, ***=p<0.001

153
8.4.2 Stakeholder expectations of the Sri Lankan banks Table 8.20 summarises the expectations of the major stakeholder groups. Excellent
service, time lines, higher interest benefits, career opportunities, job security, rewards,
good working conditions, return on equity, financial support, revenue through taxes
were the most reported stakeholder expectations respectively. Assisting government
development programmes, funding, and provision of employment opportunities were
associated with the ownership aspects and were seen in a government owned banks. It
was found that ownership aspects were associated with more stakeholder expectations
than the size aspects.
Table 8.20 Stakeholder expectations
Note that: *=p < 0.05, **= p<0.01, ***=p<0.001
Total Ownership aspects Size aspects Expectation N % G % LO % F % C Sig L % M % S % C Sig
Excellent service, time lines,higher interests benefits
21 100 2 100 9 100 10 100 n.a n.a 5 100 3 100 13 100 n.a n.a
Assisting government development programmes, funding, provision of employment opportunities
2 9.5 2 100 _ _ - - 1.00 *** 2 40.0 - - - - .580 *
Financial support 18 85.7 2 100 8 88.9 8 80.0 .179 n.s 5 100 2 66.7 11 84.6 .287 n.s
Viable financial organization
1 4.8 1 50.0 - - - - .689 ** 1 20.0 - - - - .400 n.s
Career opportunities, job security, rewards, good working conditions
21 100 2 10.0 9 100 10 100 n.a n.a 5 100 3 100 13 100 n.a n.a
Assistance to develop the country & economy
5 23.8 2 100 - - 3 30.0 .670 ** 2 40.0 1 33.3 2 15.4 .256 n.s
Return on equity 19 90.5 - - 1 11.1 - - .258 n.s 3 60.0 3 100 13 100 .580 *
Good management
1 4.8 - - 1 11.1 - - .258 n.s - - 1 33.3 - - .548 *
Revenues through taxes
17 81 - - 9 100 8 80.0 .711 ** 3 60.0 3 100 11 84.6 .327 n.s
More profits and to be in the top 25 leading banks in the world
1 4.8 - - - - 1 10.0 .235 n.s - - - - 1 7.7 .175 n.s

154
8.4.3 The level of top management interests aligned with the overall stakeholders’ interests
Figure 8.14 shows to what extent top management interests were aligned with the
overall stakeholder expectations of the sample companies. It was found that overall,
banks top management interests were aligned with the overall stakeholder expectations
to a reasonable extent but, not to a great extent. Government banks reported a higher
level of alignment with the top management interests and their stakeholder interests
than the locally owned and foreign owned banks, and similarly, large banks reported a
higher level of alignment than the medium and small sized banks. Results also found
that there were no statistically significant differences either by size or ownership
aspects.
Figure 8.14: The level of top management interests aligned with the overall stakeholders’ interests
Not at all To a great Not at all To a great
extent extent Ownership aspects ПT=3.6 Size aspects ПT=3.6
1 2 3 4 5 1 2 3 4 5 •_______•________•________•_______• •_______•________•________•_______•
ПG=4.5 ПLO=3.6 ПF=3.4 ПL=3.8 ПM=3.7 ПS=3.5 N=2 N=9 N=10 N=5 N=3 N=13
Ownership: Cramer’s V=0.377 P=0.427 Size: Cramer’s V=0.251 P=0.853
Government Local Foreign Large Medium Small
8.4.4 Company action on stakeholder groups
Figure 8.15 shows how the company action on stakeholders varies in terms of
ownership and size aspects. The banks agreed on the statement that “our top
management team decides how much stakeholder interests we must take into account”.
Most of the banks did not agree with the statement that “we are trying to meet the
minimum obligations of stakeholders”. However, banks agreed that “when we are
giving priorities for the stakeholders we consider the level of power they have”.
.

155
Figure 8.15: Company action on stakeholder groups
Disagree Strongly Disagree Strongly
agree agree Ownership aspects Size aspects
1 2 3 4 5 1 2 3 4 5 ПT=3.3 ПT=3.3 When we are giving priorities •_______•________•________•_______• •_______•________•________•_______•
for stakeholder’s we consider ПG=4.0 ПF=3.4 ПLO=3.1 ПL=3.6 ПM=2.7 ПS=3.4 the level of power they have N=2 N=10 N=9 N=5 N=3 N=13
We are trying to meet minimum •_______•________•________•_______• •_______•________•________•_______• obligations of stakeholders ПG=1.5 ПF=2.2 ПLO=2.3 ПL=2.0 ПM=2.0 ПS=2.3 N=2 N=10 N=9 N=5 N=3 N=13 Our top management team •_______•________•________•_______• •_______•________•________•_______• decides how much stakeholder ПG=3.5 ПF=3.6 ПLO=3.9 ПL=3.8 ПM=3.7 ПS=3.7 interests we must take into N=2 N=10 N=9 N=5 N=3 N=13 account Government Local Foreign Large Medium Small
8.4.5 Stakeholder expectation influence on company strategies
Figure 8.16 displays to what extent stakeholder expectations influenced the company
strategies. Results found that stakeholder expectations had an influence on company
strategies but, not to a great extent. The influence of stakeholder expectations on
company strategies in government banks was greater than for locally and foreign owned
banks. Similarly, medium sized banks had a greater influence over small and large
banks. There were no statistically significant differences in the influence of stakeholder
expectations on company strategies either by size or ownership aspects.
Figure 8.16: influence of stakeholder expectations on company strategies
Not at all To a great Not at all To a great
extent extent Ownership aspects Size aspects
1 2 3 4 5 1 2 3 4 5 ПT=3.6 ПT=3.6 •_______•________•________•_______• •_______•________•________•_______•
ПG=4.0 ПLO=3.4 ПF=3.6 ПL=3.8 ПM=4.0 ПS=3.4 N=2 N=9 N=10 N=5 N=3 N=13 Ownership: Cramer’s V=0.288 P=0.481 Size: Cramer’s V=0.461 P=0.063
Government Local Foreign Large Medium Small

156
8.5. Current resources of the commercial banks
Table 8.21 summarises the current resources of the Sri Lankan commercial banks in
terms of physical, intellectual and cultural assets. All the banks recognized their location
and buildings as physical assets. Computer systems were more associated with size
aspects and were in the large and medium sized banks. ATM networks were more
associated with the ownership aspects and were in all the government banks and in 7
locally owned banks. It is worth mentioning that computer systems and ATM networks
were only in one foreign owned bank and that the other foreign owned banks had not
expanded enough to start an ATM network within the country.
Most banks reported intellectual assets were their professional skills of the staff, brand
name, reputation and the brand name of their parent bank. Government owned banks
considered their state ownership as an intellectual asset and it was more associated with
the ownership aspects than the size aspects. History of the bank was associated with the
size aspects and was seen in the 4 large banks and in two small banks (foreign owned).
Most of the foreign owned banks think the brand name of the parent company as an
intellectual asset and similarly, most of locally owned banks considered their brand
name as an intellectual asset. It was found that both the brand name and brand name of
the parent bank are associated with the ownership aspects.
Implementation of professional banking and the brand image of a local bank were the
two most reported cultural assets of the banks. Strong commitment of some fraction of
staff was seen in a government owned bank and it was associated with the ownership
aspects. Six foreign owned banks believed the implementation of international banking
facilities as a cultural asset and, all the locally and government owned banks considered
their brand image of a local bank as a cultural asset. The results also found that
ownership aspects were associated with more resources than the size aspects.

157
Table 8.21: Current resources of the commercial banks
Total Ownership aspects Size aspects
N % G % LO % F % C Sig L % M % S % C Sig
Physical assets Location 21 100 2 100 9 100 10 100 n.a n.a 5 100 3 100 13 100 n.a n.a Buildings 21 100 2 100 9 100 10 100 n.a n.a 5 100 3 100 13 100 n.a n.a Computer systems
6 28.6 2 100 3 33.3 1 10.0 .569 * 4 80.0 2 66.7 - - .811 **
ATM network 10 47.6 2 100 7 77.8 1 10.0 .729 ** 5 100 2 66.7 3 23.1 .657 * Intellectual assets State ownership 2 9.5 2 100 - - - - 1.00 *** 2 40.0 - - - - .580 * Professional skills of the staff
17 81 2 100 9 100 6 60.0 .509 n.s 5 100 3 100 9 69.2 .381 n.s
History of the bank
6 28.6 2 100 2 22.2 2 20.0 .514 n.s 4 80.0 - - 2 15.4 .647 *
Reputation 11 52.4 - - 6 66.7 5 50.0 .375 n.s 3 60.0 3 100 5 38.5 .428 n.s Brand name 12 57.1 - - 9 100 3 30.0 .769 ** 3 60.0 3 100 6 46.2 .372 n.s Brand of the parent bank
9 42.9 - - 1 11.1 8 80.0 .718 ** - - 1 33.3 8 61.5 .522 n.s
Cultural assets Strong commitment of some fraction of the staff
1 4.8 1 50.0 - - - - .689 ** 1 20.0 - - - - .400 n.s
Implementation of professional banking
20 95.2 2 100 9 100 9 90.0 .235 n.s 5 100 3 100 12 92.3 .175 n.s
Strong culture developed over the years
3 14.3 1 50.0 2 22.2 - - .448 n.s 2 40.0 1 33.3 - - .524 n.s
Religion bank 2 9.5 - - - - 2 20.0 .340 n.s - - - - 2 15.4 .255 n.s Implementing International banking facilities
6 28.6 - - - - 6 60.0 .663 * - - 1 33.3 5 38.5 .356 n.s
Brand image of a local bank
11 52.4 2 100 9 100 - - 1.00 *** 5 100 2 66.7 4 30.8 .587 *
Note that: *=p < 0.05, **= p<0.01, ***=p<0.001
8.5.1 Major capabilities of the commercial banks
Table 8.22 displays the major capabilities of the banks. Professional staff, up to date
technology, service excellence, and brand image were the most reported capabilities
respectively. Capabilities such as outreach, state ownership were seen in government
owned banks and were associated with the ownership aspects. Service excellence was
seen in 90% of the foreign owned and 56% of the locally owned banks and it was
associated with the ownership aspects. Capabilities such as product innovation and
young staff were associated with the size aspects and were identified by two medium
sized banks. Capabilities such as up to date technology, professional staff and service
excellence were mostly seen in foreign owned banks and capabilities such as up to date

158
technology, professional staff and brand image were seen in the majority of the locally
owned banks. Results also found that there were significant differences in the
capabilities both by size or ownership aspects.
Table 8.22: Major capabilities of the commercial banks
Total Ownership aspects Size aspects Response N % G % LO % F % C Sig L % M % S % C Sig
Outreach
1 4.8 1 50.0 - - - - .689 ** 1 100 - - - - .400 n.s
Commitment
5 23.8 1 50.0 3 33.3 1 10.0 .328 n.s 1 20.0 1 33.3 3 23.1 .096 n.s
Brand image
12 57.1 2 100 6 66.7 4 40.0 .380 n.s 5 100 2 66.7 5 38.5 .522 n.s
State ownership
1 4.8 1 50.0 - - - - .689 ** 1 20.0 - - - - .400 n.s
Island wide branch
network
4 19 1 50.0 3 33.3 - - .477 n.s 3 60.0 1 33.3 - - .651 *
Strong asset base
3 14.6 1 50.0 1 11.1 1 10.0 .331 n.s 2 40.0 - - 1 7.7 .418 n.s
Up-to-date
technology
17 81 1 50.0 7 77.8 9 90.0 .295 n.s 3 60.0 2 66.7 12 92.3 .372 n.s
Professional staff
19 90.5 1 50.0 9 100 9 90.0 .476 n.s 4 80.0 3 100 12 92.3 .219 n.s
Expertise in development and commercial banking
2 9.5 - - 2 22.2 - - .375 n.s 1 20.0 1 33.3 - - .435 n.s
Product innovations
1 4.8 - - - - 1 10.0 .235 n.s - - 1 33.3 - - .548 *
Service excellency
14 66.7 - - 5 55.6 9 90.0 .575 * 2 40.0 2 66.7 10 76.9 .325 n.s
Global reach 3 14.3 - - - - 3 30.0 .428 n.s - - 1 33.3 2 15.4 .287 n.s
Strong balance sheet
3 14.3 - - 2 22.2 1 10.0 .212 n.s 2 40.0 1 33.3 - - .524 n.s
More than 100 years
of history
1 4.8 - - 1 11.1 - - .258 n.s 1 20.0 - - - - .400 n.s
High credit rating
1 4.8 - - 1 11.1 - - .258 n.s 1 20.0 - - - - .400 n.s
Young staff
1 4.8 - - 1 11.1 - - .258 n.s - - 1 33.3 - - .548 *
Strong asset base of the head office
4 19.0 - - - - 4 40.0 .509 n.s - - - - 4 30.8 .381 n.s
Business network
3 14.3 - - 3 33.3 - - .471 n.s 1 20.0 - - 2 15.4 .175 n.s
Vast experience of the CEO
1 4.8 - - 1 11.1 - - .258 n.s - - - - 1 7.7 .175 n.s

159
Table 8.22: Major capabilities of the commercial banks (continued)
Total Ownership aspects Size aspects Response N % G % LO % F % C Sig L % M % S % C Sig
High calibre senior
management
2 9.5 - - 2 22.2 - - .375 n.s - - - - 2 15.4 .255 n.s
One stop shop concept
1 4.8 - - 1 11.1 - - .258 n.s - - - - 1 7.7 .175 n.s
Finance
conglomerate
1 4.8 - - 1 11.1 - - .258 n.s - - - - 1 7.7 .175 n.s
Centralized
operational system
2 9.5 - - 2 22.2 - - .375 n.s - - - - 2 15.4 .255 n.s
Note that: *=p < 0.05, **= p<0.01, ***=p<0.001
8.5.2 The capabilities which are crucial to the success of the business
The capabilities which are crucial to the success of the business in the banking industry
(key success factors) are shown in table 8.23. Up to date technology, professionalism of
the staff, service excellence and brand image were the most reported capabilities that
were crucial to success in the industry. Results also found that there were statistically
significant differences in the key success factors such as brand image and branch
networks by size aspects and the key success factors such as outreach and service
excellence by ownership aspects.

160
Table 8.23: The capabilities which are crucial to the success of the business in the Sri Lankan banking sector
Total Ownership aspects Size aspects N % G % LO % F % C Sig L % M % S % C Sig
Outreach
1 4.8 1 50.0 - - - - .689 ** 1 20.0 - - - - .400 n.s
Brand image
10 47.6 2 100 4 44.4 4 40.0 .343 n.s 5 100 1 33.3 4 30.8 .587 *
Branch network
4 19 1 50.0 3 33.3 - - .477 n.s 3 60.0 1 33.3 - - .651 *
Professionalism of the staff
17 81 1 50.0 8 88.8 8 80.0 .277 n.s 4 80.0 2 66.7 11 84.6 .156 n.s
Up to date technology
16 76.2 1 50.0 6 66.7 9 90.0 .328 n.s 3 60.0 1 33.3 12 92.3 .517 n.s
Service excellence
15 71.4 - - 6 66.7 9 90.0 .569 * 2 40.0 2 66.7 11 84.6 .412 n.s
Strong balance sheet
2 9.5 - - 1 11.1 1 10.0 .107 n.s 1 20.0 1 33.3 - - .435 n.s
High credit rating
1 4.8 - - 1 11.1 - - .258 n.s 1 20.0 - - - - .400 n.s
Business understanding
2 9.5 - - 2 22.2 - - .375 n.s - - - - 2 15.4 .255 n.s
Low costs of funds
1 4.8 - - 1 11.1 - - .258 n.s - - - - 1 7.7 1.75 n.s
Responsiveness to client’s requirements
1 4.8 - - 1 11.1 - - .258 n.s - - - - 1 7.7 1.75 n.s
Note that: *=p < 0.05, **= p<0.01, ***=p<0.001 8.6 Chapter summary This chapter discussed the primary data analysis of organizational culture, management
style and the stakeholder expectations of the participating Sri Lankan commercial banks
and highlighted the significant differences either by size or ownership aspects.
Organizational culture
All the banks considered the management of culture as important. Chief executive
officer and the corporate level management were the most influential groups on
company culture in Sri Lankan commercial banks. It was found that the major
characteristics of most banks culture were loyalty, team spirit and commitment

161
respectively. Ownership aspects were associated with more cultural characteristics of
the banks than the size aspects.
Encourage communication and co-operation between different departments, and
encourage team work rather than individual work were the most important actions on
company culture. Only 13 banks changed their company culture during the last five
years and 9 banks categorized those changes as incremental while the other 4 banks
categorized those changes as both the incremental and revolutionary changes. The main
reasons for their cultural changes were to be competitive in the market, customer
orientation and the developments which took place in the banking sector etc. The major
cultural changes made by most banks were the change of values to core customers,
introduction of job descriptions, introduction of new tasks and recruitment of new staff.
Introduction of new products by the banking sector in Sri Lanka, growth of the bank,
economic changes and the low profitability were the major factors that supported the
cultural changes in most banks respectively.
Only 4 banks experienced problems when implementing their cultural changes and it
was found that both the government owned banks struggled to get the required trade
union support for their cultural changes. 9 of the 21 banks think their company culture
needs to be changed during next five years. 8 of the 21 banks reported having sub
cultures in their banks and those banks included all the large banks 2 medium and 1
small sized banks and results found that it was more associated with the size aspects
than the ownership aspects. 15 of the 21 banks top management think the presence of
sub cultures weaken or undermine their organization and 17 of the 21 banks preferred to
have a flexible culture for their organization. It was also found that organizational
culture had an influence on banks company strategies whereas the government banks
reported a greater influence on their strategies and the foreign owned banks reported a
lower level of influence on their strategies.
Management style
Top to bottom approach, bureaucratic, and participatory decision making were the most
reported key management styles in the banks and corporate level management was the
most influential group on their management style. It was found that management style

162
had an influence on follower’s performance and job satisfaction and also had a high
effect on company performances. Results also found that management style had an
influence on banks strategies to a high extent. Only four banks were having significant
problems with their current management style and those four banks included the two
government banks and another two foreign owned banks. Problems such as too much
listening to trade union views, lack of strategic planning, inequity on policy decision
were seen in government banks and problems such as high turn overs of staff,
decreasing profitability and dissatisfaction of the employees were seen in the foreign
owned banks. It was found that the power distance between managers and their
subordinates remained at a reasonably high level and not surprisingly government banks
reported a higher power distance than the locally and foreign owned banks. Overall, the
level of internal politics in Sri Lankan commercial banks remained at a low level but,
internal politics were seen in every bank. Government owned banks reported a higher
level of internal politics in their banks than the locally and foreign owned banks. It was
also found that overall banks think organizational politics are bad because that political
behaviour is undertaken for personal rather than organizational gain.
Stakeholder expectations and key success factors
Depositors and other customers, employees, Sri Lankan community, Sri Lankan
government and shareholders were the most reported major stakeholders of the banks
and most reported major stakeholder’s expectations were excellent service, time lines,
higher interest benefits; career opportunities, job security, rewards, good working
conditions; return on equity; financial support; revenue through taxes respectively. It
was found that top management interests in commercial banks were aligned with
stakeholder expectations to a reasonable extent but, not to a great extent. It was also
found that when giving priorities for the stakeholders banks consider the level of power
they have and then top management decides how much stakeholder interests they must
take into account. Stakeholder expectations had an influence on banks strategies to a
high level.
The banks major physical assets were their location, buildings, computer systems and
ATM net works and intellectual assets were professional skills of the staff, reputation,
brand name etc. Most banks considered implementation of professional banking, brand

163
image of a local bank, and implementing international facilities as their cultural assets.
Professional staff, up to date technology, service excellence, brand image were the most
reported major capabilities of banks and the major capabilities that were crucial to the
success of the business in the banking industry (key success factors) in most were up to
date technology, professionalism of the staff, service excellence, and brand image etc.
The next chapter will analyse the external environments of the Sri Lankan commercial
banks.

Chapter 9 External environment 9.1 Introduction This chapter will investigate the external environment of the Sri Lankan commercial
banks by examining their demand environment, market competition, market share,
company customers, company competitors, company business and the government
policies which impact the banking sector, major sources of funds, company business
sector, and bank’s political, social, economic and technological environments. When
examining the above mentioned elements in the external environment of the Sri Lankan
commercial banks, this chapter will also try to find the statistically significant
differences of these elements either by size or ownership aspects. Planning system
aspects will be ignored due to only one respondent in the NFSP category.
9.2. Demand environments Except for one foreign owned bank all the other participants agreed to make comments
about their demand environments. The responses about the predictability of demand
environments of the banks are shown in the table 9.1. Over the last five years bank
revenues fell into the demand environments which were 25% highly predictable, 31%
predictable, 14% fairly predictable, 22% unpredictable and 9% highly unpredictable.
The results in table 9.1 demonstrate that during last five years large and medium sized
banks revenues fell in to the demand environments which were highly predictable and
predictable more than for the small banks. These findings suggest the stability of the
large and the medium sized banks was greater than for the small banks during last five
years. The results also found statistically significant differences in the predictability of
the revenues/sales of the banks by size aspects but not by the ownership aspects.
164

Table 9.1 Predictability of bank’s revenues/sales (during last five years)
Total Ownership aspects Size aspects Predictability % G LO F C Sig L M S C Sig
Highly predictable
25.0 27.0 23.0 26.0 .299 n.s 26.0 23.0 25.0 .471 n.s
Predictable 31.0 30.0 32.0 29.0 .554 n.s 30.0 52.0 26.0 .847 * Fairly predictable
14.0 20.0 11.0 15.0 .471 n.s 15.0 12.0 14.0 .386 n.s
Unpredictable 22.0 12.0 25.0 21.0 .670 n.s 21.0 9.0 25.0 .610 n.s Highly unpredictable
9.0 10.0 9.0 9.0 .593 n.s 8.0 4.0 11.0 .681 *
Note that: T(N)=20, L(N)=5, M(N)=3, S(N)=12, G(N)=2, SLC (N)=9, F(N)=9, *=p<0.05, **=p<.01, ***=p<0.001 Over the next five years banks are expecting that their revenues will fall in to the
demand environments which are 23% highly predictable, 31% predictable, 16% fairly
predictable, 21% unpredictable and 11% highly unpredictable (see table 9.2). Therefore,
banks can not see any major changes in the demand environments for the next five
years. The results also found that there were no significant differences in the demand
environments for the next five years either by size or ownership aspects.
Table 9.2 Predictability of bank’s revenues/sales (for the next five years)
Total Ownership aspects Size aspects Predictability % G LO F C Sig L M S C Sig
Highly predictable
23.0 17.0 19.0 28.0 .672 n.s 19.0 22.0 25.0 .505 n.s
Predictable 31.0 35.0 32.0 31.0 .560 n.s 31.0 50.0 27.0 .662 n.s Fairly predictable
16.0 17.0 11.0 21.0 .486 n.s 14.0 12.0 17.0 .254 n.s
Unpredictable 21.0 12.0 27.0 18.0 .577 n.s 24.0 12.0 23.0 .436 n.s Highly unpredictable
11.0 17.0 11.0 9.0 .577 n.s 12.0 5.0 12.0 .616 n.s
Note that: T(N)=20, L(N)=5, M(N)=3, S(N)=12, G(N)=2, SLC (N)=9, F(N)=9 Table 9.3 reveals the market growth rates of the markets in which banks sales/revenues
fell during last five years. Over the last five years, overall 9% of the total revenues came
from the markets which have a growth rate of over 20% while 26%, 37%, 18%, and 8%
of the banks revenues came from the markets which had growth rates of 0-20%, 5-10%,
0-5%, and from declining markets respectively. It is worth noting that government
owned banks revenues felt into the higher growth markets than the locally and foreign
owned banks and similarly, medium sized banks revenues felt into the higher growth
markets than for the large and small sized banks. There were significant differences
165

found in the banks sales/revenues that felt into markets that had over 20% market
growth rate by ownership aspects.
Table 9.3 Market growth rates of the banks sales/revenues (last five years)
Total Ownership aspects Size aspects Market growth rate % G LO F C Sig L M S C Sig
Over 20% per year 9.0 12.0 9.0 9.0 .658 * 10.0 12.0 9.0 .465 n.s 10-20% per year 26.0 32.0 27.0 23.0 .782 n.s 26.0 28.0 25.0 .752 n.s 5-10% per year 37.0 45.0 40.0 34.0 .764 n.s 42.0 43.0 34.0 .714 n.s 0-5% per year 18.0 5.0 17.0 23.0 .726 n.s 16.0 12.0 21.0 .619 n.s Declining market 8.0 5.0 8.0 9.0 .262 n.s 6.0 5.0 10.0 .448 n.s Note that: T(N)=20, L(N)=5, M(N)=3, S(N)=12, G(N)=2, SLC (N)=9, F(N)=9, *=p<0.05, **=p<.01, ***=p<0.001
For the next five years Sri Lankan banks expect that 15% of the total revenues from
over 20% market growth environments while 30%, 31%, 17% and 6% of the total
revenues from the 10-20%, 5-10%, 0-5% market growth environments, and declining
market respectively (see table 9.4). Thus, banks expect more revenues from over 20%
and 10-20% growth markets for the next five years than the past five years. Overall,
there is a slight reduction in banks revenues from the 0-5% growth markets and
declining markets for the next five years. Government banks expect 60% of their
revenues from over 20% and 10-20% growth markets while locally and foreign owned
banks expects 42% and 45% respectively. Ownership aspects were associated with the
market growth rate over 20% and size aspects were associated with the market growth
rate 0-5%.
Table 9.4 Market growth rates of the banks sales/revenues (next five years)
Total Ownership aspects Size aspects Market growth rate % G LO F C Sig L M S C Sig
Over 20% per year 15.0 10.0 14.0 17.0 .580 * 12.0 15.0 16.0 .516 n.s 10-20% per year 30.0 50.0 28.0 28.0 .741 n.s 34.0 27.0 30.0 .713 n.s 5-10% per year 31.0 22.0 36.0 28.0 .616 n.s 33.0 40.0 28.0 .640 n.s 0-5% per year 17.0 10.0 16.0 21.0 .582 n.s 14.0 13.0 20.0 .767 ** Declining market 6.0 7.0 6.0 7.0 .310 n.s 7.0 5.0 6.0 .283 n.s Note that: T(N)=20, L(N)=5, M(N)=3, S(N)=12, G(N)=2, SLC (N)=9, F(N)=9, *=p<0.05, **=p<.01, ***=p<0.001
166

9.3 Competitive environment Table 9.5 reveals what percentage of banks sales/revenues were in given competitive
environments during last five years. The three competitive environments include the
environments which have 1-2 major competitors, 3-7 major competitors and, more than
the 7 major competitors. Only 4 banks reported being market leaders in the
environments which have 1-2 major competitors and their average revenue in those
markets was 19% of their total revenue. In 5 banks 12% of their total revenues came
from 1-2 major competitor environments but not as the market leaders. Most of the
banks operated in the environments which have more than 7 major competitors and their
average revenues from those environments were 48% of total revenues (not as the
market leaders). 13 and 7 banks were reported being the leaders in the markets which
have 3-7 and more than 7 major competitors respectively. Results also found that size
and ownership aspects were not associated with any competitive environment.
Table 9.5 Competitive environment during the last five years 1 TO 2 Major competitors
Total Ownership aspects Size aspects G LO F L M S
% N
(%) N (%) N (%) N C Sig
(%) N (%) N (%) N C Sig
You are the market leader
19.0 4 15.0 1 17.0 2 25.0 1 1.00 n.s 10.0 2 30.0 1 25.0 1 1.00 n.s
You are not the market leader
12.0 5 12.0 2 12.0 2 10.0 1 .707 n.s 10.0 3 20.0 1 10.0 1 .816 n.s
3 to 7 major competitors % N G % LO % F % C Sig L % M % S % C SigYou are the market leader
19.0 13 25.0 2 16.0 5 19.0 6 .632 n.s 20.0 5 17.0 3 19.0 5 .506 n.s
You are not the market leader
29.0 18 20.0 1 22.0 8 37.0 9 .506 n.s 20.0 4 20.0 3 35.0 11 .449 n.s
167

Table 9.5 Competitive environment during the last five years (continued)
Total Ownership aspects Size aspects G LO F L M S
% N
(%) N (%) N (%) N C Sig
(%) N (%) N (%) N C Sig
More than 7 major competitors % N G % SLC % F % C Sig L % M % S % C SigYou are the market leader
22.0 7 25.0 1 20.0 5 30.0 1 .837 n.s 24.0 4 20.0 3 - - .565 n.s
You are not the market leader
48.0 19 32.0 2 51.0 9 49.0 8 .754 n.s 31.0 5 27.0 3 62.0 11 .729 n.s
Table 9.6 shows the banks’ revenues which were into categories in which their major
competitors’ actions were highly predictable, predictable, fairly predictable,
unpredictable and highly unpredictable. Banks average revenues of 24%, 31%, 16%,
21%, 8% fell into environments which their competitors actions were highly predictable,
predictable, fairly predictable, unpredictable, and highly unpredictable respectively. It
was found that locally owned banks sales revenues fell into more unpredictable
competitor environments than the government and foreign owned banks.
Table 9.6 Predictability of the banks competitor environments (last five years)
Ownership aspects Size aspects Total G LO F L M S
Predictability
% N % N % N % N C Sig
% N % N % N C Sig
Highly predictable
24.0 20 25.0 2 22.0 9 25.0 9 .436 n.s 25.0 5 23.0 3 23.0 12 .466 n.s
Predictable 31.0 20 40.0 2 28.0 9 33.0 9 .519 n.s 30.0 5 47.0 3 28.0 12 .652 n.s
Fairly predictable
16.0 20 17.0 2 14.0 9 17.0 9 .403 n.s 16.0 5 15.0 3 16.0 12 .258 n.s
Unpredictable 21.0 20 12.0 2 26.0 9 18.0 9 .571 n.s 20.0 5 12.0 3 24.0 12 .674 n.s
Highly unpredictable
8.0 19 5.0 2 10.0 9 7.0 8 .560 n.s 9.0 5 5.0 2 9.0 12 .548 n.s
168

For the next five years banks predict that their revenues will fall into environments in
which their competitor’s actions are 23% highly predictable, 29% predictable, 16%
fairly predictable, 21% unpredictable, and 11% highly unpredictable. Therefore, banks
do not expect any significant changes in the predictability of competitive environments
for the next five years when compared with last five years.
Table 9.7 Predictability of the banks competitor environments (next five years)
Ownership aspects Size aspects Total G LO F L M S
Predictability
% N % N % N % N C Sig
% N % N % N C Sig
Highly predictable
23.0 20 17.0 2 22.0 9 26.0 9 .398 n.s 21.0 5 22.0 3 25.0 12 .340 n.s
Predictable 29.0 20 32.0 2 27.0 9 31.0 9 .822 * 26.0 5 42.0 3 27.0 12 .734 n.s
Fairly predictable
16.0 20 15.0 2 13.0 9 19.0 9 .628 n.s 14.0 5 12.0 3 18.0 12 .449 n.s
Unpredictable 21.0 20 20.0 2 24.0 9 17.0 9 .655 n.s 24.0 5 17.0 3 20.0 12 .548 n.s
Highly unpredictable
11.0 20 15.0 2 13.0 9 7.0 9 .837 ** 15.0 5 8.0 3 10.0 12 .564 n.s
Note that: *=p<0.05, **=p<.01, ***=p<0.001
9.4 Competition and market share
Table 9.8 shows the most important markets of the Sri Lankan commercial banks.
Customer deposits, corporate, and retail were the most important markets for a high
number of banks. Development project loans and credit cards were associated with size
aspects and were associated with medium sized banks. Pawning was associated with
ownership aspects and it was a most important market for a government owned bank.
Results also found that government owned banks had a market share of more than 20%
from their most important markets while other banks had a market share of 10-20%.
169

Table 9.8 Most important markets (during last five years)
Total Ownership aspects
Size aspects
Market
N % G % LO % F % C Sig L % M % S % C Sig Development project loans
1 4.8 - - 1 11.1 - - .258 n.s - - 1 33.3 - - .548 *
Pawning 1 4.8 1 50.0 - - - - .689 ** 1 20.0 - - - - .400 n.s
Customer deposits
4 19.0 1 50.0 3 33.3 - - .477 n.s 1 20.0 1 33.3 2 15.4 .156 n.s
Loan and advances
1 4.8 - - - - 1 10.0 .175 n.s - - - - 1 7.7 .175 n.s
Retail (small and medium enterprises)
2 9.5 - - 1 11.1 1 10.0 .107 n.s 1 20.0 - - 1 7.7 .219 n.s
Trade and imports
1 4.8 - - - - 1 10.0 .235 n.s - - - - 1 7.7 .175 n.s
Credit cards 1 4.8 - - - - 1 10.0 .235 n.s - - 1 33.3 - - .548 *
Corporate 3 14.3 - - 1 11.1 2 20.0 .179 n.s - - - - 3 23.1 .320 n.s
Retail 3 14.3 - - 2 22.2 1 10.0 .212 n.s 2 40.0 - - 1 7.7 .418 n.s
Treasury 1 4.8 - - - - 1 10.0 .235 n.s - - - - 1 7.7 .175 n.s
Imports and exports
1 4.8 - - - - 1 10.0 .235 n.s - - - - 1 7.7 .175 n.s
Service level oriented Sri Lankan upper middle class
1 4.8 - - 1 11.1 - - .258 n.s - - - - 1 7.7 .175 n.s
Trade & finance
1 4.8 - - - - 1 10.0 .235 n.s - - - - 1 7.7 .175 n.s
Note that: *=p<0.05, **=p<.01, ***=p<0.001 Table 9.9 shows the banks expected most important markets for the next five years.
Retail, deposits and corporate will be the most important markets for a high number of
Sri Lankan commercial banks within the next five years respectively. It was found that
development project loans and credit cards were most important markets for two
medium sized banks and therefore, those markets were associated with size aspects. It
was also found that government owned banks expected to keep their market share above
20% in their most important markets in the next five years while other banks expected to
keep their market share of 10% - 20%.
170

Table 9.9 Most important markets (during next five years)
Total Ownership aspects
Size aspects
Market
N % G % LO % F % C Sig L % M % S % C Sig Consumer banking
1 4.8 - - - - 1 10.0 .235 n.s - - - - 1 7.7 .175 n.s
Development project loans
1 4.8 - - 1 11.1 - - .258 n.s - - 1 33.3 - - .548 *
Pawing 1 4.8 1 50.0 - - - - .689 n.s 1 20.0 - - - - .400 .186
Deposits 4 19.0 1 50.0 3 33.3 - - .477 n.s 1 20.0 1 33.3 2 15.4 .156 n.s
Loan and advances
1 4.8 - - - - 1 10.0 .235 n.s - - - - 1 7.7 .175 n.s
Credit cards 1 4.8 - - - - 1 10.0 .235 n.s - - 1 33.3 - - .548 *
Corporate 3 14.3 - - 1 11.1 2 20.0 .179 n.s - - - - 3 23.1 .320 n.s
Retail 5 23.8 - - 4 44.4 1 10.0 .425 n.s 3 60.0 - - 2 15.4 .491 n.s
Treasury 1 4.8 - - - - 1 10.0 .235 n.s - - - - 1 7.7 .175 n.s
Imports & exports
2 9.5 - - - - 2 20.0 .340 n.s - - - - 2 15.4 .255 n.s
Trade & Finance
1 4.8 - - - - 1 10.0 .235 n.s - - - - 1 7.7 .175 n.s
Note that: *=p<0.05, **=p<.01, ***=p<0.001 9.5 Company customers Table 9.10 displays the major customer groups of the Sri Lankan commercial banks.
Over the last five years the major customer groups for a high number of banks were
manufacturing, export, wholesale and retail trade, and service sector respectively. All the
large banks considered manufacturing, wholesale and retail business as their major
customer groups while all the medium sized banks considered manufacturing, export and
wholesale and retail businesses as their major customer groups. Most of the foreign
owned company’s major customer groups were the export sector, manufacturing sector,
wholesale and retail trade sector respectively. A high number of locally owned banks
reported manufacturing, export, and wholesale and retail trade as their major customer
groups.
Agricultural sector was more associated with the ownership aspects and was a major
customer group for the 2 government owned and 2 locally owned banks. Even though
Sri Lanka is an agricultural country, only 4 banks considered agricultural sector as one
of their major customer group and therefore, this finding confirms the lack of
contribution from the banking sector to the agricultural sector in Sri Lanka. All the small
171

sized and foreign owned banks considered export as their major customer group and it
was associated with ownership and size aspects.
Table 9.10 Major customer groups (last five years)
Total Ownership aspects
Size aspects
Customer group
N % G % LO % F % C Sig L % M % S % C Sig Agriculture 4 20.0 2 100 2 22.2 - - .717 ** 3 60.0 1 33.3 - - .645 *
Manufacturing 18 90.0 2 100 8 88.9 8 88.9 .111 n.s 5 100 3 100 10 83.3 .272 n.s
Construction 3 15.0 - - 2 22.2 1 11.1 .203 n.s 1 20.0 - - 2 16.7 .181 n.s
Real estate business
2 10.0 - - - - 2 22.2 .369 n.s - - - - 2 16.7 .272 n.s
Property business
1 5.0 - - - - 1 11.1 .254 n.s - - - - 1 8.3 .187 n.s
Export 17 85.0 - - 8 88.9 9 100 .807 ** 2 40.0 3 100 12 100 .728 **
Wholesale and retail trade
17 85.0 2 100 8 88.9 7 77.8 .203 n.s 5 100 3 100 9 75 .343 n.s
Public utilities 2 10.0 1 50.0 - - 1 11.1 .478 n.s 1 20.0 - - 1 8.3 .215 n.s
Service 11 55.0 2 100 4 44.4 5 55.6 .320 n.s 3 60.0 1 33.3 7 58.3 .183 n.s
Personal consumption
8 40.0 1 50.0 3 33.3 4 44.4 .127 n.s 1 20.0 2 66.7 5 41.7 .295 n..s
Leasing business
7 35.0 - - 4 44.1 3 33.3 .268 n.s 2 40.0 2 66.7 3 25 .309 n.s
Trade & finance
3 15.0 - - 3 33.3 - - .464 n.s 1 20.0 - - 2 16.7 .181 n.s
Mining 1 5.0 - - - - 1 11.1 .254 n.s - - - - 1 8.3 .187 n.s
Commercial 1 5.0 - - 1 11.1 - - .254 n.s - - - - 1 8.3 .187 n.s
Garments 1 5.0 - - - - 1 11.1 .254 n.s - - - - 1 8.3 .187 n.s
Financial institutions
1 5.0 - - - - 1 11.1 .254 n.s - - - - 1 8.3 .187 n.s
Transport 1 5.0 - - 1 11.1 - - .254 n.s - - - - 1 8.3 .187 n.s
Note that: Total (N)=20, *=p<0.05, **=p<.01, ***=p<0.001
The banks’ expected major customer groups for the next five years are shown in table
9.11. It is reported that the major customer groups for the next five years for a high
number of banks will be the export, manufacturing and the wholesale and retail trade
sectors respectively. Except for a few banks, overall most of the banks were not planning
to change their major customer groups for the next five years. The changes of banks
major customer group caused slight increases in service, export, construction and
personal consumption sectors and also a slight decrease in manufacturing sector. It was
also found that agriculture and export business sectors were associated with size aspects
and only agriculture sector was associated with ownership aspects.
172

Table 9.11 Major customer groups for the next five years
Total Ownership aspects Size aspects Customer group N % G % LO % F % C Sig L % M % S % C Sig Agriculture 4 20.0 2 100 2 22.2 - - .717 ** 3 60.0 1 33.3 - - .645 *
Manufacturing 17 85.0 2 100 8 88.9 7 35.0 .203 n.s 5 100 3 100 9 75.0 .343 n.s
Construction 4 20.0 - - 2 22.2 2 22.2 .167 n.s 1 20.0 - - 3 25.0 .217 n.s
Real estate business
3 15.0 - - - - 3 33.3 .464 n.s - - - - 3 25.0 .343 n.s
Property business
1 5.0 - - - - 1 11.1 .254 n.s - - - - 1 8.3 .187 n.s
Export business
18 90.0 1 50.0 8 88.9 9 100 .478 n.s 3 60.0 3 100 12 100 .577 *
Wholesale and retail trade
17 85.0 2 100 9 100 6 66.7 .464 n.s 5 100 3 100 9 75.00 .343 n.s
Service 12 60.0 2 100 4 44.4 6 66.7 .347 n.s 3 60.0 1 33.3 8 66.7 .236 n.s
Personal consumption
9 45.0 1 50.0 4 44.4 4 44.4 .034 n.s 2 40.0 2 66.7 5 41.7 .183 n.s
Leasing business
7 35.0 - - 4 44.4 3 33.3 .268 n.s 2 40.0 2 66.7 3 25.0 .309 n.s
Mining 1 5.0 - - - - 1 11.1 .254 n.s - - - - 1 8.3 .187 n.s
Commercial 2 10.0 - - 2 22.2 - - .369 n.s - - - - 2 16.7 .272 n.s
Garments 1 5.0 - - - - 1 11.1 .254 n.s - - - - 1 8.3 .187 n.s
Financial institutions
1 5.0 - - - - 1 11.1 .254 n.s - - - - 1 8.3 .187 n.s
Transport 1 5.0 - - 1 11.1 - - .254 n.s - - - - 1 8.3 .187 n.s
Note that: Total (N) = 20, *=p<0.05, **=p<.01, ***=p<0.001 9.5.1 Company dependence on its major 100 customers
When the question was asked about the company dependence on its 100 major
customers, the means in terms of size, ownership and planning system aspects are
shown in the figure 9.1. The average dependency level of all the banks remained at 3.4
on the given scale for the last five years and 3.3 for the next five years. Thus, banks are
predicting a slight decrease in their dependency level in the next five years. It is worth
noting that overall banks were not very dependent on their 100 major customers, and
also they are expecting to reduce the dependency level further more in the next five
years.
Medium sized banks reported the lowest dependency level on their 100 major customers
compared with the large and small banks, both for the last and coming five years.
Similarly, Government owned banks reported the highest dependency level compared
with locally and foreign owned banks. The results also found that there were no
173

significant differences in the company dependency level either by size or ownership
aspects. Figure 9.1 Company dependence on its major 100 customers Not Very Not Very Dependent Dependent Dependent Dependent Ownership aspects Size aspects 1 2 3 4 5 1 2 3 4 5 Over the last five years •_____•______•______•_____• •_____•______•______•_____• (ПT=3.4, N=21) ПG=4.0 ПLO=3.1 ПF=3.5 ПL=3.4 ПM=2.7 ПS=3.5 N=2 N=9 N=10 N=5 N=3 N=13 Over the next five years •_____•______•______•_____• •_____•______•______•_____• (ПT=3.3, N=21) ПG=3.5 ПLO=3.2 ПF=3.4 ПL=3.4 ПM=2.7 ПS=3.5 N=2 N=9 N=10 N=5 N=3 N=13 Over the last five years- Ownership: Cramer’s V=0.328 P=0.608 Size: Cramer’s V=0.332 P=0.593 Over the next five years- Ownership: Cramer’s V=0.137 P=0.939 Size: Cramer’s V=0.331 P=0.332 Government Local Foreign Large Medium Small 9.5.2 The percentage of banks revenues from their 100 largest customers Table 9.12 reveals the average percentage of banks revenues from their 100 largest
customers. Government owned banks had the lowest percentage of revenue from their
100 largest customers which was 30% compared to locally and foreign owned banks. It
is interesting to mention that even the government banks reported the lowest percentage
of revenues from their 100 largest customers they considered that they are more
dependent on their 100 biggest customers than the other locally and foreign owned
banks. Not surprisingly, small banks reported the highest average percentage of
revenues from their 100 largest customers than the medium and large banks. There were
no statistically significant differences in the percentage of banks revenues from their
100 largest customers either by size or ownership aspects.
174

Table 9.12 The percentages of average banks revenues from their 100 largest customers in terms of ownership and size aspects Ownership aspects (N) The percentage of
average banks revenues from 100 largest customers
Government owned 2 30.0 Locally owned 9 46.7 Foreign owned 10 52.5 Size aspects Large 5 41.0 Medium 3 43.3 Small 13 51.5 Ownership: Cramer’s V=0.700 P=0.301 Size: Cramer’s V=0.732 P=0.210 9.6 Company competitors Table 9.13 shows the major competitors of the Sri Lankan commercial banks for the last
five years. Local commercial banks, foreign owned banks and the government owned
banks were the three major competitors for the Sri Lankan commercial banks. All the
commercial banks considered local banks as their major competitors while 20 and 18
banks considered foreign owned and government owned banks as their competitors
respectively. Therefore, it is worth mentioning that most of the commercial banks think
of the government banks as their major competitors. In addition to the commercial
banks, leasing companies and credit finance companies were the other two major
competitors in the industry. Only two banks considered the foreign exchange black
market as one of their major competitors. Results also found that leasing companies
were more associated with the size aspects than the ownership aspects and was a major
competitor for all the medium sized banks and 80% of the large banks.
175

Table 9.13 Banks major competitors (for the last five years)
Total Ownership aspects Size aspects Major competitor N % G % LO % F % C Sig L % M % S % C SigGovernment banks
18 85.7 2 100 8 88.9 8 80.0 .179 n.s 5 100 3 100 10 76.9 .320 n.s
Foreign Banks
20 95.2 2 100 8 88.9 10 100 .258 n.s 5 100 3 100 12 92.3 .175 n.s
Local commercial banks
21 100 2 100 9 100 10 100 n.a n.a 5 100 3 100 13 100 n.a n.a
Leasing companies
8 38.1 2 100 5 55.6 1 10.0 .608 * 4 80.0 3 100 1 7.7 .808 **
Credit finance companies
5 23.8 - - 2 22.2 3 30.0 .201 n.s - - 2 66.7 3 23.1 .468 n.s
Foreign exchange black market
2 9.5 1 50.0 - - 1 10.0 .476 n.s 1 20.0 - - 1 7.7 .219 n.s
Note that: *=p<0.05, **=p<.01, ***=p<0.001
For the next five years banks do not expect any new type of major competitors and table
9.14 shows the expected major competitors. Even the type of competitors remain the
same, whereas a higher number of banks expect leasing companies and the credit finance
companies as their major competitor groups for the next five years than the previous five
years. This may because of the expectation of a higher number of banks will get
involved in the leasing businesses sector in next five years. Competitors like leasing
companies was associated with the size aspects and, all the large and medium banks and
38.5% of the small banks think leasing companies will be a major competitor for the
next five years. Foreign exchange black market is associated with ownership aspects and
only one government owned bank thinks of it as a major competitor.
176

Table 9.14 Banks major competitors (for the next five years)
Note that: *=p<0.05, **=p<.01, ***=p<0.001 9.6.1 Competitors influence on company strategies Figure 9.2 examines to what extent the competitors have an influence on the banks
strategies. Over the last five years the average influence of major competitors on
company strategies was reported as 3.5 on the given scale and banks also expect the
figure will increase further to 3.8 in the next five years. Large banks had a higher
influence from major competitors on their company strategies than the medium and
small sized banks and similarly, government owned banks had a higher influence from
their major competitors on their company strategies than the locally and foreign owned
banks. All the banks felt that their major competitors influence on their company
strategies will increase in the next five years. Therefore, the banking industry in Sri
Lanka is expecting a higher level of competition among the banks in the next five years.
However, the level of influence of the major competitors on company strategies can be
categorized as moderate and not to a very great extent. There were no statistically
significant differences in the major competitor’s influence on their company strategies
either by size or ownership aspects.
Total Ownership aspects Size aspects Competitor group N % G % LO % F % C Sig L % M % S % C SigGovernment banks
16 76.2 2 100 6 66.7 8 80.0 .235 n.s 3 60.0 3 100 10 76.9 .281 n.s
Foreign Banks
21 100 2 100 9 100 10 100 na na 5 100 3 100 13 100 na na
Local commercial banks
21 100 2 100 9 100 10 100 na na 5 100 3 100 13 100 na na
Insurance companies
1 4.8 - - - - 1 10.0 .235 n.s - - - - 1 7.7 .175 n.s
Leasing companies
13 61.9 2 100 7 77.8 4 40.0 .449 n.s 5 100 3 100 5 38.5 .615 *
Credit finance companies
6 28.6 - - 2 22.2 4 40.0 .278 n.s - - 2 66.7 4 30.8 .445 n.s
Foreign exchange black market
1 4.8 1 50.0 - - - - .689 ** 1 20.0 - - - - .400 n.s
177

Figure 9.2 Competitors influence on company strategies No Very No Very influence great influence great influence influence Ownership aspects Size aspects 1 2 3 4 5 1 2 3 4 5 Over the last five years •_____•______•______•_____• •_____•______•______•_____•
ПG=4.0 ПF=3.4 ПLO=3.4 ПL=3.6 ПM=3.3 ПS=3.5 (ПT=3.5) N=2 N=10 N=9 N=5 N=3 N=13 Over the •_____•______•______•_____• •_____•______•______•_____• next five years
ПG=4.5 ПLO=3.7 ПF=3.7 ПL=4.0 ПM=3.7 ПS=3.7 (ПT=3.8) N=2 N=9 N=10 N=5 N=3 N=13 Over the last five years- Ownership: Cramer’s V=0.343 P=0.291 Size: Cramer’s V=0.164 P=0.754 Over the next five years- Ownership: Cramer’s V=0.357 P=0.253 Size: Cramer’s V=0.180 P=0.852 Government Local Foreign Large Medium Small 9.7 Company business and the government Overall, the banks’ revenues has been in the businesses which were 49.0% highly
government regulated, 28.0% somewhat government regulated and 23.0% not at all
government regulated over the last five years (see table 9.15). It was reported that large
banks were more in highly government regulated environments than the medium and
small sized banks and similarly, foreign owned banks were in highly regulated
businesses more than the government and locally owned banks. There were no
statistically significant differences in the government regulation of businesses either by
size or ownership aspects.
Table 9.15 Government regulations on banks businesses
Total Ownership aspects Size aspects % N G % LO % F % C Sig L % M % S % C Sig
Highly government regulated
49.0 21 2 45.0 9 46.2 10 52.0 .650 n.s 5 57.0 3 27.0 13 50.8 .654 n.s
Somewhat government regulated
28.0 21 2 30.0 9 26.6 10 29.0 .543 n.s 5 24.0 3 28.0 13 29.6 .684 n.s
Not at all government regulated
23.0 21 2 25.0 9 27.2 9 18.9 .475 n.s 5 19.0 3 45.0 12 19.6 .552 n.s
178

Participating banks predict that there will be a 19% increase, 65% no change, and 15%
decrease in their current business environments regulated by the Sri Lankan government
(see table 9.16). Therefore, it is worth noting that banks expect not only more regulation
but also deregulation in some business environments. Government banks expected that
government regulations on their business environments will be decreased by 35% but,
locally and foreign owned banks think that will reduce by only 14% and 15.6 %
respectively.
Table 9.16 Changes expected by the banks in the government regulations
Total Ownership aspects Size aspects Response % N G % LO % F % C Sig L % M % S % C Sig
Increase 19.0 21 2 25.0 9 17.8 10 19.5 .524 n.s 5 16.0 3 13.3 13 21.0 .621 n.s
No change
65.0 21 2 40.0 9 69.4 10 66.5 .660 n.s 5 64.0 3 75.0 13 63.5 .677 n.s
Decrease 15.0 21 2 35.0 9 14.0 9 15.6 .699 * 5 20.0 3 11.7 12 15.0 .544 n.s
Note that: *=p<0.05, **=p<.01, ***=p<0.001
Figure 9.3 shows the banks satisfaction level with the government’s rules and
regulations on the banking industry. The average satisfaction level of banks remained at
3.0 and government owned banks reported the highest satisfaction compared to locally
and foreign owned banks. Foreign banks reported the lowest level of satisfaction level
on government rules and regulations. Similarly, small banks had the lowest level of
satisfaction over large and medium sized banks. Results also found that there were no
significant differences in the satisfaction level of banks on government rules and
regulations either by size or ownership aspects.
Figure 9.3 Satisfaction levels of the banks on government regulations Dissatisfied Very Dissatisfied Very
satisfied satisfied Ownership aspects Size aspects
1 2 3 4 5 1 2 3 4 5
ПT=3.0 ПT=3.0 •_____•______•______•_____• •_____•______•______•_____•
N=2 N=9 N=5 N=3 ПG=4.0 ПLO=3.0 ПL=3.4 ПM=3.7
ПF=2.9 ПS=2.8
N=10 N=13
Ownership: Cramer’s V=0.368 p=0.224 Size: Cramer’s V=0.375 P=0.206 Government Local Foreign Large Medium Small
179

9.8 Company suppliers (Sources of funds) Table 9.17 reveals the major sources of funds and the average percentages of the total
funds of the participating banks. Government and domestic customers provided 30% and
65% of average total funds to the government banks and only one government bank
received 10% of their total funds from foreign organizations. It was reported that major
sources of funds in most of the banks were the domestic customers in Sri Lanka.
Domestic customers funded large, medium and small banks 70%, 65%, and 46.7%
respectively. The average of 45% of the foreign banks total funds came from their
overseas head offices and seven locally owned banks received 42.1% of their total funds
from the domestic organizations. Results also found that size aspects were more
associated with the major sources of funds than the ownership aspects.
Table 9.17 Major sources of funds (last five years)
Total Ownership aspects Size aspects Response N % G % LO % F % C Sig L % M % S % C Sig
Funds from government
2 30.0 2 30.0 - - - - 1.00 *** 2 30.0 - - - - .577 *
Funds from foreign organizations
4 12.5 1 10.0 3 13.3 - - .582 * 2 7.5 2 17.5 - - .585 *
Funds from domestic organizations
8 38.1 - - 7 42.1 1 10.0 .585 n.s 2 27.5 1 30.0 5 44.0 .492 n.s
Funds from domestic customers
20 55.2 2 65.0 9 58.3 9 50.0 .577 n.s 5 70.0 3 65.0 12 46.7 .777 n.s
Funds from investments in domestic financial market
4 16.2 - - 3 11.7 1 30.0 .363 n.s 1 15.0 2 10.0 1 30.0 .633 *
Funds from investment in overseas financial market
2 27.5 - - 1 50.0 1 50.0 .248 n.s 1 50.0 - - 1 50.0 .307 n.s
Funds from overseas head office
8 45.0 - - - - 8 45.0 .638 n.s - - 1 20.0 7 48.6 .556 n.s
Note that: *=p<0.05, **=p<.01, ***=p<0.001
180

Table 9.18 displays the major sources of funds of the banks for the next five years.
Overall, banks are expecting more funds from the domestic customers in the next five
years than the previous five years. It was found that foreign banks are also expecting to
slightly reduce their average funds from their overseas head offices in the next five
years. Results also found that there were significant differences in the major sources of
funds such as funds from government by size and ownership aspects and funds from
investments in domestic financial markets by size aspects.
Table 9.18 Major sources of funds (next five years)
Total Ownership aspects Size aspects N % G % LO % F % C Sig L % M % S % C Sig
Funds from government
2 20.0 2 20.0 - - - - 1.00 *** 2 20.0 - - - - .577 *
Funds from foreign organizations
4 7.5 1 10.0 3 6.7 - - .431 n.s 2 7.5 2 7.5 - - .456 n.s
Funds from domestic organizations
8 31.2 - - 7 33.6 1 15.0 .585 n.s 2 22.5 1 30.0 5 35.0 .487 n.s
Funds from domestic customers
20 62.2 2 75.0 9 67.2 9 54.4 .748 n.s 5 75.0 3 76.7 12 53.3 .785 n.s
Funds from investments in domestic financial market
4 15.0 - - 3 10.0 1 30.0 .363 n.s 1 15.0 2 7.5 1 30.0 .633 *
Funds from investment in overseas financial market
2 22.5 - - 1 10.0 1 35.0 .248 n.s 1 10.0 1 35.0 - - .307 n.s
Funds from overseas head office
8 41.2 - - - - 8 41.2 .638 n.s - - 1 10.0 7 45.7 .556 n.s
Note that: *=p<0.05, **=p<.01, ***=p<0.001
Figure 9.4 shows the dependency levels of the banks on their major sources of funds.
Small banks had the highest dependency level in relation to their major sources of funds
over the last five years and surprisingly, large banks expected the highest level of
dependence over small and medium sized banks for the next five years. Similarly,
government owned banks reported the highest level of dependence rather than the
foreign and locally owned banks, both for the last and coming five years. Overall, banks
181

showed a higher level of dependency on their major sources of funds during last five
years and they are expecting a slight reduction in it in the next five years. There were no
significant differences found in the dependency levels of banks on their major sources
of funds either by size or ownership aspects.
Figure 9.4: Dependency levels of the banks on their major sources of funds Not at all Very Not at all Very dependent dependent dependent dependent Ownership aspects Size aspects 1 2 3 4 5 1 2 3 4 5 Over the last five years •_____•______•______•_____• •_____•______•______•_____• ПG=4.5 ПLO=3.7 ПF=4.2 ПL=4.0 ПM=3.7 ПS=4.1 (ПT=4.0, N=21) N=2 N=9 N=10 N=5 N=3 N=13 Over the next five years ПG=4.5 ПLO=3.7 ПF=4.0 ПL=4.0 ПM=3.7 ПS=3.9
•_____•______•______•_____• •_____•______•______•_____• (ПT=3.9, N=21) N=2 N=9 N=10 N=5 N=3 N=13
Over the last five years- Ownership: Cramer’s V=0.424 P=0.109 Size: Cramer’s V=0.217 P=0.739 Over the next five years- Ownership: Cramer’s V=0.319 P=0.371 Size: Cramer’s V=0.131 P=0.949 Government Local Foreign Large Medium Small
Table 9.19 reveals the categories which banks major sources of funds fell into during
last five years. It was reported that none of the banks had severe availability problems in
their major sources of funds during last five years. Medium sized banks had 88.3% of
their banks with no availability problems when compared with large and small sized
banks 83.0% and 83.4% respectively. Only three banks were having significant
availability problems in their major sources of funds and these three banks included two
locally and one foreign owned banks. There were no significant differences found in the
categories that the banks major sources of funds felt during last five years either by size
or ownership aspects.
182

Table 9.19 Main categories which banks major sources of funds felt into (last five years)
Total Ownership aspects Size aspects Main category N % G % LO % F % C Sig L % M % S % C Sig No availability problems
21 84.0 2 70.0 9 82.2 10 88.5 .563 n.s 5 83.0 3 88.3 13 83.4 .539 n.s
Some availability problems
16 19.4 2 30.0 8 18.1 6 17.5 .731 n.s 4 20.0 2 17.5 10 19.5 .569 n.s
Significant availability problems
3 8.3 - - 2 7.5 1 10.0 .200 n.s 1 5.0 - - 2 10.0 .328 n.s
Severe availability problems
- - - - - - - - n.a n.a - - - - - - n.a n.a
Table 9.20 shows the banks expected categories where their major sources of funds will
fall into in the next five years. Average percentages of all the large, medium and small
sized banks in the category of no availability problems have increased up to 79.0%,
93.3%, and 86.9% respectively. However, government owned banks expected 10%
reduction in the category of no availability problems in their major sources of funds for
the next five years. It was also found that one government bank expected to have 20%
significant availability problems in their major sources of funds while one locally owned
banks expected to have 5%.
Table 9.20 Main categories which banks major sources of funds felt into (next five years)
Total Ownership aspects Size aspects Main category N % G % LO % F % C Sig L % M % S % C Sig No availability problems
21 86.0 2 60.0 9 87.2 10 90.0 .723 n.s 5 79.0 3 93.3 13 86.9 .516 n.s
Some availability problems
16 16.9 2 30.0 8 13.7 6 16.7 .686 n.s 4 21.2 2 10.0 10 16.5 .516 n.s
Significant availability problems
2 12.5 1 20.0 1 5.0 - - .519 n.s 1 20.0 - - 1 5.0 .305 n.s
Severe availability problems
- - - - - - - - n.a n.a - - - - - - n.a n.a
Note that: *=p<0.05, **=p<.01, ***=p<0.001
183

9.9 Company’s business sector When the question was asked about major new possible entrants into the Sri Lankan
banking industry, all the responses received in this study are shown in the table 9.21.
Most of the banks reported possible new entrants as Indian banks with the back office in
India, Islamic banks, private local banks and the non banking corporate lending
institutions. One government owned bank thinks capital market institutions and non
banking corporate lending institutions would be new entrants and two large and two
medium sized banks think non banking financial institutions would be a new entrant in
to the banking sector in Sri Lanka and these were significant differences by ownership
and size aspects.
Table 9.21 Possible new entrants to the banking industry
Total Ownership aspects Size aspects New entrant N % G % LO % F % C Sig L % M % S % C Sig Private local banks
8 38.1 1 50.0 3 33.3 4 40.0 .103 n.s 2 40.0 2 66.7 4 30.8 .253 n.s
Corporative banks
5 23.8 1 50.0 - - 4 40.0 .489 n.s 1 20.0 1 33.3 3 23.1 .096 n.s
Foreign banks (except India and Pakistan)
4 19.0 1 50.0 1 11.1 2 20.0 .277 n.s 2 40.0 - - 2 15.4 .327 n.s
Indian banks with back office in India
18 85.7 1 50.0 9 100 8 80.0 .428 n.s 4 80.0 3 100 11 84.6 .175 n.s
Islamic banks
8 38.1 - - 3 33.3 5 50.0 .302 n.s 1 20.0 2 66.7 5 38.5 .287 n.s
Non banking corporate lending institutions
8 38.1 1 50.0 6 66.7 1 10.0 .560 * 3 60.0 1 33.3 4 30.8 .253 n.s
Capital market institutions
1 4.8 1 50.0 - - - - .689 ** 1 20.0 - - - - .400 n.s
Non banking financial institutions
4 19.0 1 50.0 2 22.2 1 10.0 .298 n.s 2 40.0 2 66.7 - - .651 *
Note that: *=p<0.05, **=p<.01, ***=p<0.001
184

When the question was asked about how difficult it is to enter into the Sri Lankan
banking industry, this study received mix reactions from the banks. Government banks
think it is a bit difficult to enter into the banking industry while foreign and local banks
think it is not too difficult to enter and therefore, there were significant differences found
in the ownership aspects. Overall, the banks considered it is not difficult to enter into the
banking industry.
Figure 9.5 Difficulty of entry into banking businesses Easy to Difficult Easy to Difficult Enter to enter enter enter Ownership aspects Size aspects 1 2 3 4 5 1 2 3 4 5 ПT=2.7 ** ПT=2.7 How difficult is entry •_____•______•______•_____• •_____•______•______•_____• into your company’s ПG=4.0 ПF=2.7 ПLO=2.4 ПL=3.2 ПM=2.7 ПS=2.5 business sector N=2 N=9 N=10 N=5 N=3 N=13 Note that: *=p<0.05, **=p<.01, ***=p<0.001 Government Local Foreign Large Medium Small
9.10 Political and legal environments
Figure 9.6 shows to what extent the Sri Lankan government policies have impacted on
the banks operations over the last five years, at present and in the next five years.
Overall, during the last five years government policies have had an impact on banks
operations to a reasonable extent (3.6 on the given scale) and it has gone up slightly to
3.8 at present and is expected to increase further to 3.9 on the given scale during the
next five years. Therefore, banks are expecting a slight increase in the impact of the
government policies on their operations. It is worth highlighting that the small banks
perception over the large and medium sized banks and, also foreign banks perception
over government and locally owned banks that their operations have been more
impacted due to government policies. However, results found that only ownership
aspect was a significant difference at present.
185

Figure 9.6: The extent government policies impact on banks operations No Severe No Severe impact impact impact impact Ownership aspects Size aspects 1 2 3 4 5 1 2 3 4 5 Over the last five years •_____•______•______•_____• •_____•______•______•_____• ПG=3.5 ПF=4.1 ПLO=3.1 ПL=3.2 ПM=3.3 ПS=3.8 (ПT=3.6) N=2 N=10 N=9 N=5 N=3 N=13 At present •_____•______•______•_____• * •_____•______•______•_____• (ПT=3.8) ПG=4.0 ПF=4.2 ПLO=3.3 ПL=3.4 ПM=3.3 ПS=4.1 N=2 N=10 N=9 N=5 N=3 N=13 Over the next five years •_____•______•______•_____• •_____•______•______•_____• (ПT=3.9) ПG=4.0 ПF=4.1 ПLO=3.8 ПL3.8 ПM=3.3 ПS=4.1
N=2 N=10 N=9 N=5 N=3 N=13 Note that: *=p<0.05, **=p<.01, ***=p<0.001 Government Local Foreign Large Medium Small
Table 9.22 reveals the current impacts of the Sri Lankan government policies on the
banks operations. Capital requirements, increase of taxes in financial services, interest
rate controls, and CBSL regulations with government policies were the most common
policies that impacted on banks current operations. Government policies such as
Assisting government programmes/ organizations, fiscal policies of government, CBSL
regulations with government policies, economic development policies were associated
with ownership aspects and all have impacted on the government banks. On sight and
off sight examination reported by six foreign owned banks and this impact was
associated with ownership aspects. It was also found that ownership aspects were more
associated with the government policies that impacted the banks operation than the size
aspects.
186

Table 9.22: Current impacts of the Sri Lankan government policies on bank’s operations
Total Ownership aspects Size aspects Impact N % G % LO % F % C Sig L % M % S % C Sig
Capital requirements
21 100 2 100 9 100 10 100 n.a n.a 5 100 3 100 13 100 n.a n.a
Monetary contacts
2 9.5 1 50.0 1 11.1 - - .482 n.s 1 20.0 1 33.3 - - .435 n.s
Assisting government programmes/ organizations
2 9.5 2 100 - - - - 1.00 *** 2 40.0 - - - - .580 *
Fiscal policies of government
6 28.6 2 100 3 33.3 1 10.0 .569 * 3 60.0 - - 3 23.1 .426 n.s
CBSL regulations with government policies
10 47.6 2 100 6 66.7 2 20.0 .559 * 5 100 1 33.3 4 30.8 .587 *
Economic development policies
2 9.5 2 100 - - - - 1.00 *** 2 40.0 - - - - .580 *
Re-introduce of stamp duty from 01/04/2006
3 14.3 - - 1 11.1 2 20.0 .179 n.s - - 1 33.3 2 15.4 .287 n.s
Increase of taxes in financial services
15 71.4 - - 7 77.8 8 80.0 .514 n.s 2 40.0 3 100 10 76.9 .426 n.s
On sight and off sight examinations
6 28.6 - - - - 6 60.0 .663 * - - - - 6 46.2 .496 n.s
Internal controls
1 4.8 - - - - 1 10.0 .235 n.s - - - - 1 7.7 .175 n.s
Interest rate controls
12 57.1 - - 6 66.7 6 60.0 .380 n.s 3 60.0 1 33.3 8 61.5 .197 n.s
Money lending policy
5 23.8 - - 1 11.1 4 40.0 .370 n.s - - - - 5 38.5 .439 n.s
Note that: *=p<0.05, **=p<.01, ***=p<0.001
Figure 9.7 shows to what extent the government is involved in the banks’ operations in
the Sri Lankan commercial banks. Not surprisingly, the government banks reported a
higher involvement by the government on their bank operations than the locally and
foreign owned banks. Foreign owned banks think government involvement in their
operations is to a reasonable extent and locally owned banks considered it as minimal. It
was also found that government owned banks expect a reduction in the government
187

involvement on their banks operations in the next five years while locally and foreign
owned banks are expecting an increase.
Large banks reported a higher involvement of the government in their operations over
the small and medium sized banks and that maybe due to the higher involvement in both
the government owned banks (considered as large banks). Results also found that there
were significant differences in the government involvement over the last five years by
ownership aspects.
Figure 9.7 Government involvements in banks operations
No very high No very high
Involvement involvement Involvement involvement Ownership aspects Size aspects 1 2 3 4 5 1 2 3 4 5 Over the last five years •_____•______•______•_____• * •_____•______•______•_____• (ПT=2.6, N=21) ПG=4.0 ПF=2.8 ПLO=2.0 ПL=2.8 ПM=1.7 ПS=2.7 N=2 N=10 N=9 N=5 N=3 N=13 At present •_____•______•______•_____• •_____•______•______•_____• (ПT=2.7, N=21) ПG=4.0 ПF=2.8 ПLO=2.2 ПL=3.0 ПM=2.0 ПS=2.7 N=2 N=10 N=9 N=5 N=3 N=13 Over the next five years •_____•______•______•_____• •_____•______•______•_____• (ПT=2.8, N=21) ПG=3.5 ПF=3.0 ПLO=2.4 ПL=3.0 ПM=2.0 ПS=2.9 N=2 N=10 N=9 N=5 N=3 N=13 Note that: *=p<0.05, **=p<.01, ***=p<0.001 Government Local Foreign Large Medium Small
9.10.1 Current government’s involvement on bank’s operations
Table 9.23 reveals the current government’s involvement on banks operations. Banking
act and the monetary policy were reported by the highest number of banks as
government involvement on their banks operations and those factors seem to be common
in banking industries in all countries. Government involvement on appointment of board
of directors, sometimes on recovery issues, only for restricting issues were associated
with the ownership aspects and only seen in the government banks. Discouraging the
recruitment of foreign employees and central bank approval when appointing the
country head were reported as government involvement in their banks operations by four
and three foreign banks respectively. There were significant differences for government
involvement such as only for restricting processes, sometimes on recovery issues, and
188

appointment of board of directors and these were associated with ownership aspects
rather than size aspects.
Table 9.23 Current government’s involvement on bank’s operations
Total Ownership aspects Size aspects Government involvement N % G % LO % F % C Sig L % M % S % C Sig Only for restricting processes
2 9.5 2 100 - - - - 1.00 *** 2 40.0 - - - - .580 *
Sometimes on recovery issues
2 9.5 2 100 - - - - 1.00 *** 2 40.0 - - - - .580 *
Appointment of board of directors
2 9.5 2 100 - - - - 1.00 *** 2 40.0 - - - - .580 *
Central bank approval when appointing the country head
3 14.3 - - - - 3 30.0 .428 n.s - - - - 3 23.1 .320 n.s
Discouraging the recruitment of foreign employees
4 19.0 - - - - 4 40.0 .509 n.s - - - - 4 30.8 .381 n.s
Banking act 21 100 2 100 9 100 10 100 n.a n.a 5 100 3 100 13 100 n.a n.a
Monetary policy
21 100 2 100 9 100 10 100 n.a n.a 5 100 3 100 13 100 n.a n.a
Note that: *=p<0.05, **=p<.01, ***=p<0.001
9.10.2 Impact of Sri Lankan laws and regulations on bank’s operations
Figure 9.8 shows the impact level of Sri Lankan laws and regulations on banks
operations during the given three periods. Overall, during the last five years banks
reported a reasonably high level of impact of Sri Lankan laws and regulations on their
operations and they think it is higher at present than in the last five years and will
increase further in the next five years. However, the expected increase was at a low
magnitude. There were significant differences found in the impact level of Sri Lankan
laws and regulations by ownership aspects (over the last five years, at present and over
the next five years). Similarly, there were significant differences found in the impact
level of Sri Lankan laws and regulations at present by size aspects.
189

Figure 9.8 Impact of Sri Lankan laws and regulations on bank’s operations No Severe No Severe
impact impact impact impact Ownership aspects Size aspects
1 2 3 4 5 1 2 3 4 5 Over the last five years •_____•______•______•_____• * •_____•______•______•_____• (ПT=3.9 N=21) ПG=4.5 ПLO=3.9 ПF=3.9 ПL=4.2 ПM=3.7 ПS=3.9 N=2 N=9 N=10 N=5 N=3 N=13 At present •_____•______•______•_____• * •_____•______•______•_____• * (ПT=4.0 N=21) ПG=4.5 ПLO=3.9 ПF=4.0 ПL=4.2 ПM=3.7 ПS=4.0 N=2 N=9 N=10 N=5 N=3 N=13 Over the next five years •_____•______•______•_____•* •_____•______•______•_____• (ПT=4.1 N=21) ПG=4.0 ПF=4.1 ПLO=4.3 ПL=4.4 ПM=4.0 ПS=4.1
N=2 N=10 N=9 N=5 N=3 N=13 Note that: *=p<0.05, **=p<.01, ***=p<0.001 Government Local Foreign Large Medium Small
Table 9.24 reveals the current impacts of the Sri Lankan laws and regulations on banks
operations. Capital requirement was reported by all the banks as the major impact on
their operations and other major impacts include single borrowing limit, government
audit requirements, for recovery matters and CBSL regulations respectively. Single
borrowing limit was a major impact on 84.6% of the small sized banks and it was
associated with size aspects. It was also found that ownership aspects were associated
with more impacts than the size aspects.
190

Table 9.24 Current impacts of the Sri Lankan laws and regulations on bank’s operations
Total Ownership aspects Size aspects Current impact N % G % LO % F % C Sig L % M % S % C Sig For recovery matters
9 42.9 2 100 5 55.6 2 20.0 .507 n.s 4 80.0 2 66.7 3 23.1 .516 n.s
Staff promotions & fundamental issues
1 4.8 1 50.0 - - - - .689 ** 1 20.0 - - - - .400 n.s
BIS standards
1 4.8 1 50.0 - - - - .689 ** 1 20.0 - - - - .400 n.s
CBSL regulations
9 42.9 - - 9 100 - - 1.00 *** 3 60.0 2 66.7 4 30.8 .314 n.s
Government audit requirement
11 52.4 1 50.0 5 55.6 5 50.0 .055 n.s 3 60.0 2 66.7 4 30.8 .314 n.s
Ownership to be public quoted, Maximum shareholding for a party capped at 10% of shares
6 28.6 - - 6 66.7 - - .730 ** 2 40.0 1 33.3 3 23.1 .161 n.s
Directors to be “fit and proper” individuals
6 28.6 - - 6 66.7 - - .730 ** 2 40.0 1 33.3 3 23.1 .161 n.s
Single borrowing limit
14 66.7 - - 6 66.7 8 80.0 .478 n.s 1 20.0 2 66.7 11 84.6 .568 *
Lack of laws to protect investors
3 14.3 - - - - 3 30.0 .428 n.s - - - - 3 23.1 .320 n.s
Capital requirements
21 100 2 100 9 100 10 100 n.a n.a 5 100 3 100 13 100 n.a n.a
Note that: *=p<0.05, **=p<.01, ***=p<0.001
9.11 Impact of Sri Lankan economy on banks operations
Figure 9.9 displays the level of impact that the Sri Lankan economy has on the bank’s
operations. It was found that overall, the Sri Lankan economy had an impact on the
banks’ operations to a high extent during last five years and at present and the banks
expect a slight increase in the impact over the next five years. There were significant
differences found in the level of impact during the last five years by ownership aspects.
191

Figure 9.9 The impact of the Sri Lankan economy on bank’s operations
No Severe No Severe impact impact impact impact
Ownership aspects Size aspects 1 2 3 4 5 1 2 3 4 5 Over the last five years •_____•______•______•_____•* •_____•______•______•_____• (ПT=3.9 N=21) ПG=4.5 ПLO=3.8 ПF=3.8 ПL=4.0 ПM=4.0 ПS=3.8 N=2 N=9 N=10 N=5 N=3 N=13 At present •_____•______•______•_____• •_____•______•______•_____• (ПT=3.9 N=21) ПG=4.0 ПLO=4.0 ПF=3.9 ПL=4.0 ПM=4.0 ПS=3.9 N=2 N=9 N=10 N=5 N=3 N=13 Over the next five years •_____•______•______•_____• •_____•______•______•_____• (ПT=4.1 N=21) ПG=4.0 ПLO=4.4 ПF=3.9 ПL=4.4 ПM=4.3 ПS=4.0
N=2 N=9 N=10 N=5 N=3 N=13 Note that: *=p<0.05, **=p<.01, ***=p<0.001 Government Local Foreign Large Medium Small
Table 9.25 describes the current impacts of the Sri Lankan economy on the banks
operations. Profitability, low investment opportunities due to political uncertainty and
deposit mobilization were the most reported impacts of the Sri Lankan economy on their
operations respectively. Two medium sized banks mentioned low consumption pattern
as an impact and it was associated with size aspects. There were no significant
differences found in the impacts of the Sri Lankan economy on banks operations by
ownership aspects.
Table 9.25 Current impact of the Sri Lankan economy on bank’s operations
Total Ownership aspects Size aspects Response N % G % LO % F % C Sig L % M % S % C Sig
Low investment opportunities due to political uncertainty
21 100 2 100 9 100 10 100 n.a n.a 5 100 3 100 13 100 n.a n.a
Deposit mobilization
14 66.7 2 100 7 77.8 5 50.0 .362 n.s 4 80.0 1 33.3 9 69.2 .304 n.s
Profitability 21 100 2 100 9 100 10 100 n.a n.a 5 100 3 100 13 100 n.a n.a
Branch expansion
6 28.6 2 100 2 22.2 2 20.0 .514 n.s 3 60.0 1 33.3 2 15.4 .412 n.s
Low consumption pattern
2 9.5 - - 1 11.1 1 10.0 .107 n.s - - 2 66.7 - - .795 **
Low rates of borrowings
4 19.0 - - 1 11.1 3 30.0 .277 n.s - - - - 4 30.8 .381 n.s
Note that: *=p<0.05, **=p<.01, ***=p<0.001
192
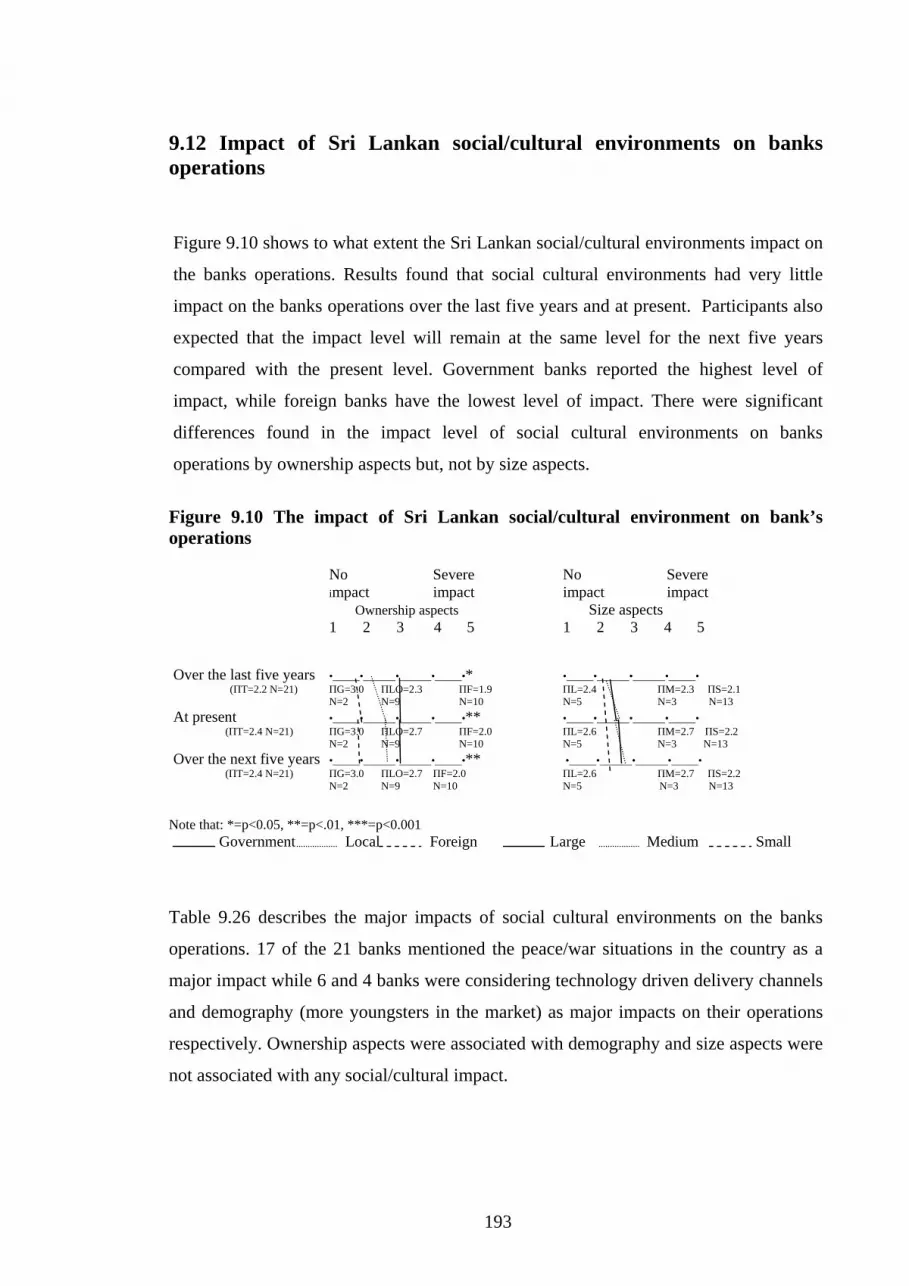
9.12 Impact of Sri Lankan social/cultural environments on banks operations
Figure 9.10 shows to what extent the Sri Lankan social/cultural environments impact on
the banks operations. Results found that social cultural environments had very little
impact on the banks operations over the last five years and at present. Participants also
expected that the impact level will remain at the same level for the next five years
compared with the present level. Government banks reported the highest level of
impact, while foreign banks have the lowest level of impact. There were significant
differences found in the impact level of social cultural environments on banks
operations by ownership aspects but, not by size aspects.
Figure 9.10 The impact of Sri Lankan social/cultural environment on bank’s operations
No Severe No Severe
impact impact impact impact Ownership aspects Size aspects
1 2 3 4 5 1 2 3 4 5 Over the last five years •_____•______•______•_____•* •_____•______•______•_____• (ПT=2.2 N=21) ПG=3.0 ПLO=2.3 ПF=1.9 ПL=2.4 ПM=2.3 ПS=2.1 N=2 N=9 N=10 N=5 N=3 N=13 At present •_____•______•______•_____•** •_____•______•______•_____• (ПT=2.4 N=21) ПG=3.0 ПLO=2.7 ПF=2.0 ПL=2.6 ПM=2.7 ПS=2.2 N=2 N=9 N=10 N=5 N=3 N=13 Over the next five years •_____•______•______•_____•** •_____•______•______•_____• (ПT=2.4 N=21) ПG=3.0 ПLO=2.7 ПF=2.0 ПL=2.6 ПM=2.7 ПS=2.2
N=2 N=9 N=10 N=5 N=3 N=13 Note that: *=p<0.05, **=p<.01, ***=p<0.001 Government Local Foreign Large Medium Small
Table 9.26 describes the major impacts of social cultural environments on the banks
operations. 17 of the 21 banks mentioned the peace/war situations in the country as a
major impact while 6 and 4 banks were considering technology driven delivery channels
and demography (more youngsters in the market) as major impacts on their operations
respectively. Ownership aspects were associated with demography and size aspects were
not associated with any social/cultural impact.
193

Table 9.26: Current impacts of the Sri Lankan social cultural environment on bank’s operations
Total Ownership aspects Size aspects N % G % LO % F % C Sig L % M % S % C Sig
Especially peace/war situation in the country
17 81.0 2 100 8 66.7 9 90.0 .323 n.s 4 80.0 3 100 10 76.9 .201 n.s
Demography(more youngsters in the market)
4 19.0 - - 4 44.4 - - .560 * 1 20.0 2 66.7 1 7.7 .512 n.s
Technology driven delivery channels
6 28.6 - - 5 55.6 1 10.0 .521 n.s 1 20.0 2 66.7 3 23.1 .345 n.s
Note that: *=p<0.05, **=p<.01, ***=p<0.001 9.13 The impact of technology available in Sri Lanka on banks operations
Figure 9.11 explains to what extent technology available in Sri Lanka impacted on the
banks operations .It was found that technology had a high effect on the banks operations
during the last five years and at present and banks also expected that the impact level
will increase further over the next five years. Large and medium sized banks had a
higher impact of technology than the small banks and similarly, locally and government
owned banks reported a higher impact of technology than the foreign owned banks.
There were significant differences found in the impact of technology over the last five
years and at present by ownership aspects.
Figure 9.11: The impact of technology available in Sri Lanka on bank’s operations
No Severe No Severe impact impact impact impact Ownership aspects Size aspects
1 2 3 4 5 1 2 3 4 5 Over the last five years •_____•______•______•_____•* •_____•______•______•_____• (ПT=3.4 N=21) ПG=4.5 ПLO=3.2 ПF=3.3 ПL=3.6 ПM=3.7 ПS=3.2 N=2 N=9 N=10 N=5 N=3 N=13 At present •_____•______•______•_____•* •_____•______•______•_____• (ПT=3.9 N=21) ПG=4.5 ПLO=3.9 ПF=3.8 ПL=4.0 ПM=4.0 ПS=3.8 N=2 N=9 N=10 N=5 N=3 N=13 Over the next five years •_____•______•______•_____• •_____•______•______•_____• (ПT=4.4 N=21) ПG=4.5 ПLO=4.8 ПF=4.0 ПL=4.6 ПM=4.7 ПS=4.2
N=2 N=9 N=10 N=5 N=3 N=13 Note that: *=p<0.05, **=p<.01, ***=p<0.001 Government Local Foreign Large Medium Small
194

Table 9.27 reveals the current impacts of the available technology in Sri Lanka on the
banks operations. Technology had an impact on new products, customer services,
network banking and link with global networks such as Cirrus and Maestro in the
highest number of banks. Office automation, network banking reported from the
government banks and link with global network such as Cirrus and Maestro were
reported from the locally owned banks and these were significant differences by
ownership aspects.
Table 9.27: Current impacts of the available technology in Sri Lanka on bank’s operations
Total Ownership aspects Size aspects N % G % LO % F % C Sig L % M % S % C Sig
New products
20 95.2 2 100 9 100 9 90.0 .235 n.s 5 100 3 100 12 92.3 .175 n.s
Customer services
20 95.2 2 100 9 100 9 90.0 .235 n.s 5 100 3 100 12 92.3 .175 n.s
Planning & management
4 19.0 1 50.0 1 11.1 2 20.0 .277 n.s 2 40.0 - - 2 15.4 .327 n.s
Network banking
10 47.6 2 100 6 66.7 2 20.0 .559 * 4 80.0 3 100 3 23.1 .638 *
Office automation
1 4.8 1 50.0 - - - - .689 ** 1 20.0 - - - - .400 n.s
Centralized operation
2 9.5 1 50.0 1 11.1 - - .482 n.s 1 20.0 - - 1 7.7 .219 n.s
Link with global network such as Cirrus and Maestro
5 23.8 - - 5 55.6 - - .645 * 2 40.0 1 33.3 2 15.4 .256 n.s
Note that: *=p<0.05, **=p<.01, ***=p<0.001
9.14 Chapter Summary
The demand environments of the banks were fairly predictable up to 70% during last
five years and banks expected that it will not change during next five years. It was also
found that overall, 90% of the banks revenues felt into markets that were growing and
banks expected that their 93% of the revenues will fall into growing environment in the
next five years. Only four banks reported them as the market leaders in the markets
where there were 1-2 major competitors and 19% of the total revenues came from those
markets.13 banks reported them as the market leaders in the markets where there were
195

3-7 major competitors and 19% of the total revenues came from those markets.
Similarly, 7 banks reported them as market leaders in markets where there were more
than 7 major competitors and 22% of the total revenues came from those markets. It
was also found that banks competitor environments were fairly predictable up to 71%
and banks expected that it will reduce to 68% in the next five years.
Customer deposits, corporate and retail were the most reported most important markets
respectively. It was found that size and ownership aspects were associated with some of
the most important markets. For the next five years most important markets for most
banks will be retail, deposits and corporate respectively. The major customer group for
most banks during last five years were manufacturing, export, wholesale and retail trade
and service sector respectively. Most of the foreign and locally owned banks major
customer groups were export, manufacturing, and wholesale and retail trade. Even
though Sri Lanka is an agricultural country, it was found that only 4 banks considered
agricultural sector as their most important customer group and these four banks
included two government owned banks and two locally owned banks. It was also found
that export, manufacturing, and wholesale and retail will be the most important
customer groups for most banks in the next five years. Overall, banks dependence on
their major 100 customers remained reasonably high over the last five years but, banks
expecting a slight reduction during next five years (3.4 Vs 3.3 on the given scale).
The major competitors of the Sri Lankan commercial banks during last five years were
local commercial banks, foreign owned banks and the government owned banks. Most
of the commercial banks think government banks as their major competitor. It was also
found that 8 banks (including all the medium sized banks and 80% of the large banks)
considered leasing companies as a major competitor for the last five years but, 13 banks
considered leasing companies as a major competitor for the next five years. Thus, we
can expect that more banks will get into leasing businesses in the next five years. It was
also found that competitors influence on company strategies remained reasonably high
during last five years and banks expected a slightl increase in the next five years.
Overall, Banks were in the businesses that were 49% highly government regulated, 28%
somewhat government regulated and 23% not at all government regulated. It was found
196

that banks were overall reasonably satisfy with the government regulations but not to a
great extent.
Domestic customers were the major source of funds for most banks during the last five
years. It was found that domestic customers funded 65%, 58.3% and 50% for
government banks, local banks and foreign banks respectively. Eight of the foreign
owned banks received 45% of their total funds from their overseas head offices and the
two government owned banks received 30.0% of their total funds from the Sri Lankan
government. It was also found that banks are expecting to find more funds from the
domestic customers in the next five years. Banks dependency level of their major
sources of funds remained relatively high during last five years and banks are expecting
a slight reduction in the next five years (4.0 vs 3.9). Overall, for banks 84.0% of the
total funds felt into category that was no availability problems. 16 banks reported that
19.4% of the total funds had some availability problems and only 3 banks reported that
8.3% of the total funds had significant availability problems during last five years. In
the next five years banks expect that 86.0% of the total funds will not have any
availability problems and only two banks 12.5% of the total funds expect to have
significant availability problems.
Most reported new possible entrants to Sri Lankan banking industry were Indian banks
with the back office in India, Islamic banks, private local banks and non banking
corporate lending institutions. It was found that overall, banks think entry into Sri
Lankan banking industry is not difficult.
Most reported current impacts of government policies were capital requirements,
increase taxes in financial services, and interest rate controls. It was found that the
impact of the government policies on banks operations over the last five years was
reasonably high and it has increased slightly at present and is expected to further
increase slightly in the next five years. Overall, the government involvements on banks
operations were relatively low but, in government banks it was remained reasonably
high. Banking act and monetary policy were the most reported government
involvements on banks operations and these involvements seem to be common in
banking industries in every country. The impact of Sri Lankan laws and regulations on
banks operations remained reasonably high in the last five years and it has increased
197

slightly at present and is expected to further increase slightly in the next five years. It
was found that most reported impacts of laws and regulations were capital requirements,
single borrowing limit, government audit requirements, CBSL regulations, and for
recovery matters respectively.
The impact of Sri Lankan economy on banks operations remained relatively high during
last five years and is expected to increase slightly in the next five years. Profitability,
low investment opportunities due to political uncertainty and deposit mobilization were
the most reported impacts of Sri Lankan economy on banks operations. Impacts of
social cultural environments on banks operations were less over the last five years, then
at present and also in the next five years. 17 banks reported Peace/war situation in the
country as an impact of social/cultural environments on banks operations. The impacts
of technology on banks operations were relatively low during last five years but,
relatively high at present and expected to further increase in the next five years. Most
reported impacts of technology on banks operations were new products, customer
service, and network banking.
The next chapter will analyse the mission, vision, and long term goals at corporate and
second levels of the commercial banks.
198

Chapter 10 Mission, vision and long term goals at corporate and second levels
10.1 Introduction This chapter will discuss the mission, vision, long term goals at the corporate and
second levels of the participating commercial banks. The significant differences either
by ownership or size aspects will be highlighted. Planning system aspects will be
ignored due to lack of respondents in the NFSP category.
10.2 Company mission statement
When the question was asked about having a mission statement, except for one locally
owned bank all the other banks reported having a mission statement. Table 10.1 shows
the banks which had a mission statement in terms of ownership and size aspects. There
were significant differences in the banks which had mission statements by size aspects
but, not by ownership aspects.
Table 10.1 Does your banks have a mission statement?
Total Ownership aspects Size aspects
Response
N (%) G (%) LO (%) F (%) L (%) M (%) S (%)
Yes
20 95.2 2 100 8 88.9 10 100 5 100 2 66.7 13 100
No
1 4.8 - - 1 11.1 - - - - 1 33.3 - -
Size: Cramer’s V=0.548 P=.043 Ownership: Cramer’s V=0.258 P=0.497
10.2.1 Stated elements in the mission statement
All the foreign owned banks did not develop a separate mission statement for the Sri
Lankan banking environment and they mentioned that only their head offices have
mission statements. Therefore, this research will not concentrate on foreign banks
mission statements and only concentrate on government and locally owned banks. The
elements included in the government and locally owned banks mission statements are
199

shown in the table 10.2 in terms of the size aspects. A large number of banks reported
elements in their mission statements were employees, customers, and banks financial
services respectively. Service excellence was reported from 1 medium and 3 small
banks and it was associated with size aspects.
Table 10.2 Stated elements in the mission statement
Total Size aspects Levels N (%) L (%) M (%) S (%) C Sig
Customers 6 60.0 3 60.0 - - 3 75.0 .433 n.s
Owners 2 20.0 2 40.0 - - - - .500 n.s
employees 7 70.0 3 60.0 - - 4 100 .655 n.s
Society 3 30.0 2 40.0 - - 1 25.0 .267 n.s
To be dominant in the financial sector
1 10.0 - - 1 100 - - 1.00 **
Shareholders 2 20.0 - - 1 100 1 25.0 .729 n.s
Service excellence
4 40.0 - - 1 100 3 75.0 .829 *
Stakeholder expectations
2 20.0 1 20.0 - - 1 25.0 .177 n.s
Technology 3 30.0 1 33.3 - - 2 50.0 .378 n.s
Financial services
4 40.0 2 40.0 - - 2 50.0 .289 n.s
Financial goals
1 10.0 - - - - 1 25.0 .408 n.s
Note that: N (T) =10, *=p<0.05, **=p<.01, ***=p<0.001
10.2.2 Influential groups on banks mission statements
Figure 10.1 displays the level of influence of different groups on formulating the banks
present mission statements. Results found that corporate level management had the
most influence on formulating banks current mission statement followed by chief
executive officer and outside members of the board of directors. In large and small sized
banks corporate level management, CEO’s, and outside members of the board of
director’s influence were higher than the medium sized banks. There were statistically
significant differences found in the influence level of corporate level management,
CEO, outside members of the board of directors, and second level line managers by size
aspects.
200

Figure 10.1: Influential groups on formulating banks current mission statement No Very great
influence Influence Size aspects 1 2 3 4 5
Corporate level management •_______•________•________•_______• * (ПT=4.1, N=10) ПL=4.2 ПM=3.0 ПS=4.2 N=5 N=1 N=4 Chief executive officer •_______•________•________•_______• ** (ПT=3.9, N=10) ПL=4.0 ПM=3.0 ПS=4.0 N=5 N=1 N=4 Outside members of the board •_______•________•________•_______• ** of directors ПL=2.8 ПM=1..0 ПS=3.2 (ПT=2.8, N=10) N=5 N=1 N=4 Second level line managers •_______•________•________•_______• * (ПT=2.6, N=10) ПL=2.2 ПM=3.0 ПS=3.0 N=5 N=1 N=4 Corporate planning department •_______•________•________•_______• (ПT=2.7, N=6) ПL=2.7 ПM=3.0 ПS=2.5 N=3 N=1 N=2 Sri Lankan government •_______•________•________•_______• (ПT=1.2, N=10) ПL=1.2 ПM=1.0 ПS=1.2 N=5 N=1 N=4 Other lower levels of •_______•________•________•_______• management ПL=2.0 ПM=3.0 ПS=2.5 (ПT=2.3, N=10) N=5 N=1 N=4
Note that: *=p<0.05, **=p<.01, ***=p<0.001 Large Medium Small
8 of the 10 of government and locally owned banks did change their mission statements
during last five years and table 10.3 shows the changes made by those 8 banks. It was
found that 7 of the 8 banks stated the mission more specifically, 3 banks expanded their
mission and one bank completely changed their mission statements. There were no
significant differences in the banks which changed their mission statements by size
aspects.
201

Table 10.3 Changes made by the banks
Total Size aspects Changes made N (%) L (%) M (%) S (%) C Sig
Mission was stated more specifically
7 87.5 4 100 1 100 2 66.7 .488 n.s
Mission statement was expanded
3 37.5 2 50.0 - - 1 33.3 .333 n.s
Mission was completely changed
1 12.5 - - - - 1 33.3 .488 n.s
Note that: Total (N) = 8
Figure 10.2 displays the major factors that influence the changes in banks mission
statements during last five years. It was found that strategic considerations had the
highest influence for changes of banks mission statements followed by banks newly
developed capabilities, and economic and technological factors. There were significant
differences according to size aspects found in the factors such as mission changed
because of top management teams, economic factors, social factors, and technological.
Figure 10.2: Major factors that influenced the changes in banks mission statements
No Very great influence influence Size aspects
1 2 3 4 5
Mission changed because of new •_______•________•________•_______• * chief executive officer(ПT=2.0, N=8) ПL=2.0 ПM=1.0 ПS=2.3 N=4 N=1 N=3 Mission changed because owner •_______•________•________•_______• or main shareholders changed (ПT=2.0, N=8) ПL=2.0 ПM=1.0 ПS=2.3 N=4 N=1 N=3 Mission changed because of top •_______•________•________•_______• * management teams changed (ПT=2.1, N=8) ПL=2.0 ПM=1.0 ПS=2.7 N=4 N=1 N=3 Mission changed because of joint •_______•________•________•_______• venture with other organizations (ПT=1.6, N=8) ПL=2.0 ПM=1.0 ПS=1.3 N=4 N=1 N=3 Mission changed because of merger •_______•________•________•_______• with other organizations (ПT=2.0, N=8) ПL=1.7 ПM=5.0 ПS=1.3 N=4 N=1 N=3 Mission changed because of Sri Lankan •_______•________•________•_______• politics (ПT=1.6, N=8) ПL=2.0 ПM=1.0 ПS=1.3 N=4 N=1 N=3 Mission changed because of economic •_______•________•________•_______• * factors (ПT=2.4, N=8) ПL=2.0 ПM=1.0 ПS=3.3 N=4 N=1 N=3
202

Figure 10.2: Major factors that influence the changes in banks mission statements (continued)
No Very great influence influence Size aspects
1 2 3 4 5 Mission changed because of social •_______•________•________•_______• * factors (ПT=2.1, N=8) ПL=2.0 ПM=1.0 ПS=2.7 N=4 N=1 N=3 Mission changed because of •_______•________•________•_______• * technological factors (ПT=2.3, N=8) ПL=2.0 ПM=1.0 ПS=3.3 N=4 N=1 N=3 Mission changed because of law and •_______•________•________•_______• regulations (ПT=1.7, N=8) ПL=1.7 ПM=1.0 ПS=2.0 N=4 N=1 N=3 Mission changed because company •_______•________•________•_______• developed new capabilities(ПT=2.7, N=8) ПL=2.0 ПM=5.0 ПS=3.0 N=4 N=1 N=3 Mission changed because of strategic •_______•________•________•_______• considerations (ПT=4.2, N=8) ПL=4.0 ПM=5.0 ПS=4.3 N=4 N=1 N=3 Mission changed as new plans •_______•________•________•_______• introduced ПL=4.0 (ПT=4.0, N=1) N=1
Note that: *=p<0.05, **=p<.01, ***=p<0.001 Large Medium Small
10.2.3 Appropriateness of mission statements for the next five years
The appropriateness of mission statements of government and locally owned banks for
the next five years are shown in figure 10.3. It was found that large banks reported
having the lowest level of appropriateness than the medium and small sized banks.
There were no significant differences in the appropriateness of mission statements for
the next five years by size aspects.
Figure 10.3 Appropriateness of mission statements for the next five years
Not Very Appropriate Appropriate
Size aspects 1 2 3 4 5 •_______•________•________•_______• ПT=3.8, N=10 ПL=3.6 ПM=4.0 ПS=4.0 N=5 N=1 N=4
Cramer’s V=0.500 P=0.287 Large Medium Small
203

Table 10.4 shows the average years that the banks will continue to follow their current
mission statements. Results found that large, medium and small sized banks expected to
continue their current mission statements for an average of 2.8, 10.0, and 3.0 years
respectively. One medium sized bank expected to follow their mission statement for the
next 10 years and there were no statistically significant differences for the average years
that the banks expected to continue their mission statements by size aspects.
Table 10.4: Average years that the banks will continue their current mission statements
Size aspects Average years N Large banks 2.8 5
Medium banks 10.0 1 Small banks 3.0 4
Total 3.8 10 Size aspects: Cramer’s V=0.859 P=0.064 10.3 Vision statement
When the question was asked about having a vision statement, all the banks reported
having a vision statement. Table 10.5 shows the major characteristics of the vision
statements of government and locally owned banks in terms of size aspects. It was
found that 5 of the 11 banks vision was to be the best bank of the people in Sri Lanka
and 3 banks vision was to dominate the financial sector in Sri Lanka. There were no
significant differences in the characteristics of the vision statements by size aspects.
204

Table 10.5 Characteristics of vision statement
Total Size aspects Major factor
N (%) L (%) M (%) S (%) C Sig
To be the best bank of the people
5
45.5
3
60.0
-
-
2
50.0
.440
n.s
Have an international presence in the future
1
9.1
1
20.0
-
-
-
-
.440
n.s
Dominate the financial sector in Sri Lanka
3
27.3
2
40.0
1
50.0
-
-
.470
n.s
Provide exceptional banking services
1
9.1
-
-
-
-
1
25.0
.418
n.s
To be the premium retail focused Sri Lankan bank
1
9.1
-
-
-
-
1
25.0
.418
n.s
To be a world class Sri Lankan bank
1
9.1
-
-
1
50.0
-
-
.671
n.s
10.3.1 Influential groups on formulating banks current vision statement
Figure 10.4 shows the influential groups on formulating banks current vision
statements. Corporate level management had the most influence on formulating banks
vision followed by the CEO, and outside members of the board of directors
respectively. Second level management and corporate planning department also had a
lower influence on formulating banks vision. There were significant differences found
in the influence level of corporate planning department and other lower levels of
managements by size aspects.
205

Figure 10.4: Influential groups on formulating banks current vision statement No influence Very great influence
Size aspects 1 2 3 4 5 Founders of the company •_______•________•________•_______• (ПT=2.3, N=11) ПL=2.4 ПM=2.0 ПS=2.2 N=5 N=2 N=4 Corporate level management •_______•________•________•_______• (ПT=4.4, N=11) ПL=4.4 ПM=4.0 ПS=4.5 N=5 N=2 N=4 Chief executive officer •_______•________•________•_______• (ПT=4.2, N=11) ПL=4.2 ПM=3.5 ПS=4.5 N=5 N=2 N=4 Outside members of the board •_______•________•________•_______• of directors (ПT=2.9, N=11) ПL=3.0 ПM=1.5 ПS=3.5 N=5 N=2 N=4 Second level line managers •_______•________•________•_______• (ПT=2.6, N=11) ПL=2.4 ПM=3.0 ПS=2.7 N=5 N=2 N=4 Corporate planning department •_______•________•________•_______• * (ПT=2.7, N=7) ПL=2.0 ПM=3.0 ПS=3.0 N=2 N=2 N=3 Sri Lankan government •_______•________•________•_______• (ПT=1.5, N=11) ПL=1.8 ПM=1.0 ПS=1.2 N=5 N=2 N=4 Other lower levels of management •_______•________•________•_______• * (ПT=2.4, N=11) N=5 N=2 N=4
ПL=2.0 ПM=3.0 ПS=2.5 Note that: *=p<0.05, **=p<.01, ***=p<0.001 Large Medium Small
Table 10.6 shows the average years that the banks will continue their current vision
statements. Medium sized banks reported the highest average of 6.5 years followed by
small and large banks. There were no significant differences found in the average years
by size aspects.
Table 10.6: Average years that the banks will continue their current vision statements Size aspects Average years N Large banks 2.8 5 Medium banks 6.5 2 Small banks 3.0 4 Total 3.5 11 Size aspects: Cramer’s V=0.707 P=0.202 10.4 Corporate long term goals 19 of the total of 21 banks had corporate long terms goals and only two small sized
banks reported not having their long term corporate goals (see table 10.7). There were
206

no significant differences in the banks which had corporate long terms goals either by
size or ownership aspects.
Table 10.7 Does your bank has corporate long term goals
Total Ownership aspects Size aspects Response N % G % LO % F % L % M % S %
Yes 19 90.5 2 100 8 88.9 9 90.0 5 100 3 100 11 84.6 No 2 9.5 - - 1 11.1 1 10.0 - - - - 2 15.4 Ownership: Cramer’s V=.107 P=.887 Size: Cramer’s V=.255 P=.507 All the 19 banks which had long term corporate goals reported having quantitative goals
and table 10.8 shows the major quantitative goals of the banks in terms of size and
ownership aspects. It was found that goals such as return, profit, income, cash flow,
deposits were goals for all the banks. Stock market goals and dividend maintenance
were associated with ownership aspects and were goals in locally owned banks.
Similarly, loans and staffing were associated with ownership aspects and were goals in
government owned bank and market share was associated with size aspects and were
goals in large and medium sized banks.
Table 10.8 Quantitative long term goals
Total Ownership aspects Size aspects Quantitative goal N % G % LO % F % C Sig L % M % S % C Sig
Return goals
19 100 2 100 8 100 9 100 n.a n.a 5 100 3 100 11 100 n.a n.a
Stock market goals
5 26.3 - - 5 62.5 - - .701 ** 3 60.0 1 33.3 1 9.1 .497 n.s
Number of new branches per year
3 15.8 - - 2 25.0 1 11.1 .233 n.s - - 1 33.3 2 18.2 .297 n.s
Profits, income, cash flow
19 100 2 100 8 100 9 100 n.a n.a 5 100 3 100 11 100 n.a n.a
Dividend maintenance
5 26.3 - - 5 62.5 - - .701 ** 3 60.0 1 33.3 1 9.1 .497 n.s
Financial ratio controls
18 94.7 2 100 8 100 8 88.9 .248 n.s 5 100 3 100 10 90.9 .201 n.s
Deposits 19 100 2 100 8 100 9 100 n.a n.a 5 100 3 100 11 100 n.a n.a
Loans 1 5.3 1 50.0 - - - - .687 * 1 20.0 - - - - .394 n.s
207

Table 10.8 Quantitative long term goals (continued)
Total Ownership aspects Size aspects Quantitative goal N % G % LO % F % C Sig L % M % S % C Sig
NPL 19 100 2 100 8 100 9 100 n.a n.a 5 100 3 100 11 100 n.a n.a
Staffing 1 5.3 1 50.0 - - - - .687 * 1 20.0 - - - - .394 n.s
Market
share
4 21.1 1 50.0 3 37.5 - - .498 n.s 3 60.0 1 33.3 - - .639 *
Note that: Total (N) =19, *=p<0.05, **=p<.01, ***=p<0.001
Among the 19 banks which had long term goals, except for one foreign owned small
sized bank all the other 18 banks reported having qualitative goals with no statistically
significant differences either by size or ownership aspects (see table 10.9).
Table 10.9 Does your bank has qualitative goals?
Total Ownership aspects Size aspects Response N % G % LO % F % L % M % S %
Yes 18 94.7 2 100 8 100 8 88.9 5 100 3 100 10 90.9
No 1 5.3 - - - - 1 11.1 - - - - 1 9.1
Ownership: Cramer’s V=.248 P=.556 Size: Cramer’s V=.201 P=.681
Table 10.10 shows the qualitative long term goals of the participating banks. Customer
focus, focus on market segments and leadership in quality and service were the most
reported qualitative goals. Societal goals were associated with the ownership aspects
and were goals in the two government owned banks, 6 locally owned and 1 foreign
owned bank. It is also found that most of the foreign owned banks did not have societal
goals.
Table 10.10 Qualitative long term goals
Total Ownership aspects Size aspects Long term goal N % G % LO % F % C Sig L % M % S % C Sig
Technological leadership and advantage
4 22.2 - - 1 12.5 3 37.5 .341 .n.s - - - - 4 40.0 .478 n.s
Leadership in quality and service
14 77.8 2 100 6 75 6 75.0 .189 n.s 5 100 3 100 6 60.0 .478 n.s
Maintain acceptable financial posture/ control cost
9 50.0 2 100 3 37.5 4 50.0 .373 n.s 3 60.0 1 33.3 5 50.0 .172 n.s
208

Table 10.10 Qualitative long term goals (continued)
Total Ownership aspects Size aspects Long term goal N % G % LO % F % C Sig L % M % S % C Sig
Leadership in reputation and image
10 55.6 2 100 4 50.0 4 50.0 .316 n.s 4 80.0 2 66.7 4 40.0 .361 n.s
Focus on market segment
15 83.3 1 50.0 7 87.5 7 87.5 .316 n.s 4 80.0 2 66.7 9 90.0 .231 n.s
Customer focus
16 88.9 1 50.0 7 87.5 8 100 .476 n.s 4 80.0 2 66.7 10 100 .418 n.s
Societal goals
9 50.0 2 100 6 75.0 1 12.5 .687 * 4 80.0 2 66.7 3 30.0 .455 n.s
Note that: Total (N) = 18, *=p<0.05, **=p<.01, ***=p<0.001
Figure 10.5 displays the major groups which influence the banks current long term
goals. The chief executive officer and the corporate level management had the most
influence on banks long term goals. Six banks which had a corporate planning
department reported that their corporate planning department also had a high influence
on their long term goals. It was found that the influence of outside board of directors in
foreign owned banks were very low compared to government and locally owned banks
and the Central Bank had a higher influence on the goals of government banks than the
locally and foreign owned banks. Both the outside members of the board of directors
and Central Banks were associated with ownership aspects.
Figure 10.5: Groups influence on the formulation of banks long-term goals
No Very great No Very great
influence influence influence influence Ownership aspects Size aspects 1 2 3 4 5 1 2 3 4 5 Corporate level management •_______•________•________•________• •_______•________•________•_______• (ПT=4.3, N=19) ПG=4.5 ПLO=4.2 ПF=4.2 ПL=4.2 ПM=4.0 ПS=4.4 N=2 N=8 N=9 N=5 N=3 N=11 Chief executive officer •_______•________•________•________• •_______•________•________•_______• (ПT=4.3, N=19) ПG=4.5 ПLO=4.1 ПF=4.4 ПL=4.2 ПM=4.0 ПS=4.6 N=2 N=8 N=9 N=5 N=3 N=11 * Outside members of the •_______•________•________•________• •_______•________•________•_______• board directors ПG=3.0 ПLO=3.1 ПF=2.1 ПL=3.2 ПM=2.7 ПS=2.4 (ПT=2.6, N=19) N=2 N=8 N=9 N=5 N=3 N=11 Second level line managers •_______•________•________•________• •_______•________•________•_______• (ПT=3.0, N=19) ПG=3.0 ПLO=3.0 ПF=3.0 ПL=3.0 ПM=3.0 ПS=3.0 N=2 N=8 N=9 N=5 N=3 N=11
209

Figure 10.5: Groups influence on the formulation of banks long-term goals (continued)
No Very great No Very great influence influence influence influence Ownership aspects Size aspects 1 2 3 4 5 1 2 3 4 5 Corporate planning department •_______•________•________•________• •_______•________•________•_______• (ПT=3.7, N=6) ПLO=3.7 ПL=3.5 ПM=3.5 ПS=4.0 N=6 N=2 N=2 N=2 * Central bank of Sri Lanka •_______•________•________•________• •_______•________•________•_______• (ПT=2.0, N=19) ПG=3.5 ПLO=1.6 ПF=2.0 ПL=2.4 ПM=1.7 ПS=1.9 N=2 N=8 N=9 N=5 N=3 N=11
Note that: *=p<0.05, **=p<.01, ***=p<0.001 Government Local Foreign Large Medium Small
Table 10.11 shows the processes of formulating banks long term goals. In 6 of the 19
banks long term corporate goals were created through a negotiation process between the
CEO and the corporate level management and those 6 banks included 3 locally and 3
foreign owned banks. It was found that in 5 banks long term corporate goals were
created through a negotiation process between the corporate level, board of directors
and second level management and in 2 foreign owned banks corporate long terms goals
were created through a negotiation process between corporate management, CEO
overseas and the country manager.
Table 10.11 Processes of formulating banks long-term goals
Total Ownership aspects Size aspects Response N % G % LO % F % L % M % S %
Formulated for the company by the chief executive officer
1 5.3 - - - - 1 11.1 - - - - 1 9.1
Formulated for the company by the board of directors
1 5.3 - - 1 12.5 - - 1 20.0 - - - -
Aggregation of the goals developed by second level management
1 5.3 1 50.0 - - - - 1 20.0 - - - -
Negotiation process between the corporate level/board of directors group and second level management
5 26.3 1 50.0 4 50.0 - - 2 40.0 1 33.3 2 18.2
210

Table 10.11 Processes of formulating banks long-term goals (continued)
Total Ownership aspects Size aspects Response N % G % LO % F % L % M % S %
Negotiation process between the chief executive officer and corporate level management
6 31.6 - - 3 37.5 3 33.3 1 20.0 2 66.7 3 27.3
GM of the Sri Lankan branch within the limits given by the overseas head office
1 5.3 - - - - 1 11.1 - - - - 1 9.1
Negotiation process between country manager and committee members given the limits by the overseas head office
1 5.3 - - - - 1 11.1 - - - - 1 9.1
Negotiation process between corporate management, CEO overseas and country manager
2 10.5 - - - - 2 22.2 - - - - 2 18.2
Negotiation process between head of the corporate planning and the senior management
1 5.3 - - - - 1 11.1 - - - - 1 9.1
Note that: Total (N) = 19, Ownership: Cramer’s V=0.757 P=0.151, Size: Cramer’s V=0.564 P=0.737
Figure 10.6 reveals to what extent banks corporate goals serve an important role in each
of the following areas. The most important roles of banks corporate long term goals
were to evaluate their past performance, monitor current performance and provide
challenge and motivation. The results also found that there were no significant
differences in the importance of the roles of banks corporate long term goals either by
size or ownership aspects.
211

Figure 10.6: Important roles of corporate long term goals Not Very Not Very important important important important Ownership aspects Size aspects
1 2 3 4 5 1 2 3 4 5 Evaluation of its past performance •_______•________•________•________• •_______•________•________•_______• ПT=4.2, N=19 ПG=4.0 ПLO=4.4 ПF=4.1 ПL=4.2 ПM=4.3 ПS=4.2 N=2 N=8 N=9 N=5 N=3 N=11 Communication to external public •_______•________•________•________• •_______•________•________•_______• ПT=2.4, N=19 ПG=3.0 ПLO=2.5 ПF=2.2 ПL=2.4 ПM=2.7 ПS=2.4 N=2 N=8 N=9 N=5 N=3 N=11 Evaluation of second level objectives •_______•________•________•________• •_______•________•________•_______• ПT=3.6, N=19 ПG=3.0 ПLO=3.7 ПF=3.7 ПL=3.6 ПM=3.3 ПS=3.7 N=2 N=8 N=9 N=5 N=3 N=11 Evaluation of other lower levels objectives •_______•________•________•________• •_______•________•________•_______• ПT=3.5, N=19 ПG=3.0 ПLO=3.7 ПF=3.4 ПL=3.4 ПM=3.3 ПS=3.6 N=2 N=8 N=9 N=5 N=3 N=11 Monitor current performance •_______•________•________•________• •_______•________•________•_______• ПT=4.2, N=19 ПG=4.0 ПLO=4.2 ПF=4.2 ПL=4.2 ПM=4.0 ПS=4.3 N=2 N=8 N=9 N=5 N=3 N=11 Activate contingencies •_______•________•________•________• •_______•________•________•_______• ПT=3.6, N=19 ПG=3.0 ПLO=3.5 ПF=3.8 ПL=3.4 ПM=3.0 ПS=3.8 N=2 N=8 N=9 N=5 N=3 N=11 Provide challenge and motivation •_______•________•________•________• •_______•________•________•_______• ПT=3.8, N=19 ПG=3.5 ПLO=4.1 ПF=3.7 ПL=4.0 ПM=4.0 ПS=3.7 N=2 N=8 N=9 N=5 N=3 N=11 Note that: *=p<0.05, **=p<.01, ***=p<0.001 Government Local Foreign Large Medium Small
Table 10.12 reveals the banks which changed their corporate long term goals during the
last five years. The 14 banks which had changed their corporate long term goals include
the two government owned banks, 6 locally owned and 6 foreign owned banks. There
were no significant differences in the banks which changed their goals either by size or
ownership aspects.
Table 10.12 Have your corporate level goals changed in the last five years?
Total Ownership aspects Size aspects Response N % G % LO % F % L % M % S %
Yes 14 73.7 2 100 6 75.0 6 66.7 5 100 2 66.7 7 63.6
No 5 26.3 - - 2 25.0 3 33.3 - - 1 33.3 4 36.4 Ownership: Cramer’s V=.224 P=.622 Size: Cramer’s V=.358 P=.296
Table 10.13 describes the major changes made by the participating banks in their
corporate long term goals. It was found that 13 banks had updated or upgraded their
goals while 7 and 4 banks instituted new goals and focused on philosophy respectively.
212

There were significant differences found in the major changes such as upgrade or
update goals, and formalization or explicitness of goals by size aspects.
Table 10.13 Major changes made by the banks
Total Ownership aspects Size aspects Major change N % G % LO % F % C Sig L % M % S % C Sig
Focus on philosophy
4 28.6 1 50.0 2 33.3 1 16.7 .258 n.s 2 40.0 1 50.0 1 14.3 .324 n.s
Upgrade or update of goals
13 92.9 2 100 5 83.3 6 100 .320 n.s 5 100 1 50.0 7 100 .679 *
Change of financial factors
3 21.4 1 50.0 - - 2 33.3 .471 n.s 1 20.0 - - 2 28.6 .234 n.s
Formalization or explicitness of goals
1 7.1 - - 1 16.7 - - .320 n.s - - 1 50.0 - - .679 *
General qualitative additions
2 14.3 1 50.0 - - 1 16.7 .471 n.s 1 20.0 - - 1 14.3 .183 n.s
Instituted new goals
7 50 1 50.0 4 66.7 2 33.3 .309 n.s 3 60.0 2 100 2 28.6 .499 n.s
Note that: Total (N) = 14, *=p<0.05, **=p<.01, ***=p<0.001
Figure 10.7 reveals the factors that influenced the changes of banks long term corporate
level goals. Overall, changes in economic environments and technological
breakthroughs had the most influence on banks long term corporate goals. However,
unsatisfactory performance had a greater influence on government banks. It was also
found that changes in ownership and unsatisfactory performance were associated with
ownership aspects.
213

Figure 10.7 Factors influenced the changes of banks corporate level goals
No Very great No Very great Influence influence Influence influence
Ownership aspects Size aspects
1 2 3 4 5 1 2 3 4 5
Changes in ownership •_______•________•________•________•* •_______•________•________•_______• (ПT=1.2 N=14) ПG=2.5 ПLO=1.0 ПF=1.0 ПL=1.6 ПM=1.0 ПS=1.0 N=2 N=6 N=6 N=5 N=2 N=7 Changes in top management •_______•________•________•________• •_______•________•________•_______• (ПT=1.9 N=14) ПG=3.0 ПLO=1.3 ПF=2.2 ПL=2.0 ПM=1.5 ПS=2.0 N=2 N=6 N=6 N=5 N=2 N=7 Unsatisfactory performance •_______•________•________•________• * •_______•________•________•_______• (ПT=2.3 N=14) ПG=4.0 ПLO=1.7 ПF=2.3 ПL=2.4 ПM=2.0 ПS=2.3 N=2 N=6 N=6 N=5 N=2 N=7 Technological breakthroughs •_______•________•________•________• •_______•________•________•_______• (ПT=3.4 N=14) ПG=3.5 ПLO=3.5 ПF=3.3 ПL=3.6 ПM=3.5 ПS=3.3 N=2 N=6 N=6 N=5 N=2 N=7 Changes in economic environment •_______•________•________•________• •_______•________•________•_______• (ПT=3.9 N=14) ПG=4.0 ПLO=4.0 ПF=3.8 ПL=4.0 ПM=4.0 ПS=3.9 N=2 N=6 N=6 N=5 N=2 N=7 Changes in government policies •_______•________•________•________• •_______•________•________•_______• (ПT=2.8 N=14) ПG=4.0 ПLO=2.7 ПF=2.5 ПL=3.0 ПM=4.0 ПS=2.3 N=2 N=6 N=6 N=5 N=2 N=7
Note that: *=p<0.05, **=p<.01, ***=p<0.001 Government Local Foreign Large Medium Small
Table 10.14 describes the number of years which the banks expected to continue their
current long term corporate goals. It was found that 6 banks each expected to continue
their current long term goals for 2, 3, 5 years and only one bank expected to continue
their current long term goals for only another year.
Table 10.14 Banks continuation periods of the current goals
Total Ownership aspects Size aspects Period N % G % LO % F % L % M % S %
One year
1 5.3 - - 1 12.5 - - - - - - 1 9.1
Two years
6 31.6 2 100 1 12.5 3 33.3 2 40.0 1 33.3 3 27.3
Three years
6 31.6 - - 2 25.0 4 44.4 1 20.0 1 33.3 4 36.4
Four years
6 31.6 - - 4 50.0 2 22.2 2 40.0 1 33.3 3 27.3
214

Figure 10.8 shows the banks achievement of their corporate long term goals. It was
found that except for 2 foreign owned banks all the other banks met or exceeded their
corporate long term goals during the last five years. Overall, locally owned banks and
medium sized banks reported the highest level of goal achievement. There were no
significant differences in the goal achievement levels either by size or ownership
aspects.
Figure 10.8 Banks achievement of their corporate goals (during last five years) Failed to Met Exceeded Failed to Met Exceeded achieve goals goals achieve goals goals goals goals Ownership aspects Size aspects
1 2 3 4 5 1 2 3 4 5 ПT=3.2 N=19 ПT=3.2 N=19 •_______•________•________•_______• •_______•________•________•_______• ПG=3.0 ПLO=3.2 ПF=3.1 ПL=3.2 ПM=3.3 ПS=3.1 N=2 N=8 N=9 N=5 N=3 N=11 Ownership: Cramer’s V=0.326 P=0.402 Size: Cramer’s V=0.227 P=0.745 Government Local Foreign Large Medium Small
Figure 10.9 shows the major reasons for banks achievement of their corporate long term
goals. Overall, appropriateness of goals and managerial competence were the major
reasons for the achievements of corporate goals for most banks during the last five
years. However, reasons such as use of high technology, inappropriate corporate policy,
and opening of new branches were reported from 3 small sized banks as the major
reasons for their achievements. Competition was associated with ownership aspects and
was a major reason for government owned banks goal achievement rather than the
locally and foreign owned banks. It was also found that size aspects were not associated
with any reasons.
215

Figure 10.9 Major reasons for banks achievements
. Not at all Very Not at all Very important important important important Ownership aspects Size aspects 1 2 3 4 5 1 2 3 4 5 Appropriateness of goals •_______•________•________•________• •_______•________•________•_______• (ПT=3.5, N=19) ПG=3.0 ПLO=3.7 ПF=3.4 ПL=3.4 ПM=3.7 ПS=3.5 N=2 N=8 N=9 N=5 N=3 N=11 Managerial competence •_______•________•________•________• •_______•________•________•_______• (ПT=3.5, N=19) ПG=3.5 ПLO=3.9 ПF=3.2 ПL=3.8 ПM=4.0 ПS=3.3 N=2 N=8 N=9 N=5 N=3 N=11 Competition •_______•________•________•________• * •_______•________•________•_______• (ПT=3.2, N=19) ПG=4.0 ПLO=3.1 ПF=3.1 ПL=3.6 ПM=3.0 ПS=3.1 N=2 N=8 N=9 N=5 N=3 N=11 Economic environment •_______•________•________•________• •_______•________•________•_______• (ПT=3.4, N=19) ПG=3.5 ПLO=3.2 ПF=3.4 ПL=3.4 ПM=3.0 ПS=3.5 N=2 N=8 N=9 N=5 N=3 N=11 Technological change •_______•________•________•________• •_______•________•________•_______• (ПT=3.4, N=19) ПG=3.0 ПLO=3.6 ПF=3.2 ПL=3.0 ПM=4.0 ПS=3.4 N=2 N=8 N=9 N=5 N=3 N=11 Use of high technology •_______•________•________•________• •_______•________•________•_______• (ПT=5.0, N=1) ПF=5.0 ПS=5.0 N=1 N= 1 Inappropriate corporate policy •_______•________•________•________• •_______•________•________•_______• in head office ПF=4.0 ПS=4.0 (ПT=4.0, N=1) N=1 N=1 Opening of new branches •_______•________•________•________• •_______•________•________•_______• (ПT=5.0, N=1) ПF=1.0 ПS=5.0 N=1 N=1 Note that: *=p<0.05, **=p<.01, ***=p<0.001 Government Local Foreign Large Medium Small
10.5 Second level long term goals Table 10.15 reveals the banks which had second level corporate long term goals in
terms of size and ownership aspects. 8 of the 21 banks had second level long term goals
and these 8 banks included 4 large, 2 medium and 2 small sized banks. Second level
long term goals were associated with the size aspects and are more likely in the large
and medium sized banks than the small sized banks.
Table 10.15 Does your banks have second level long term goals
Total Ownership aspects Size aspects Response N % G % LO % F % L % M % S %
Yes 8 38.1 2 100 4 44.4 2 20.0 4 80.0 2 66.7 2 15.4
No 13 61.9 - - 5 55.6 8 80.0 1 20.0 1 33.3 11 84.6
Ownership: Cramer’s V=.478 P=.091 Size: Cramer’s V=.602 P=.022
216

7 of the 8 banks mentioned that all second level operating units have the same goals
with respect to units of measurement and only one medium sized locally owned bank
reported having different units of measurements. The main reasons for having different
units of measurements in that bank were the type of work done by departments were
different, hence the methodology of measurements were differ. Table 10.16 displays the
major units of measurements for the second level long term goals. Sales growth and
profits were the most reported units of measurements respectively and it was also found
that return ratios and cash flows were associated with ownership aspects and more
likely in the locally and foreign owned banks.
Table 10.16 Units of measurements
Total Ownership aspects Size aspects Measurement N % G % LO % F % C Sig L % M % S % C Sig
Return on investment, return on assets, return on capital
5 71.4 - - 3 100 2 100 1.00 * 2 50.0 1 100 2 100 .548 n.s
Profits 6 85.7 2 100 2 66.7 2 100 .471 n.s 3 75.0 1 100 2 100 .354 n.s
Cash flow 5 71.4 - - 3 100 2 100 1.00 * 2 50.0 1 100 2 100 .548 n.s
Sales growth 7 100 2 100 3 100 2 100 n.a n.a 4 100 1 100 2 100 n.a n.a
Return on sales
5 71.4 1 50.0 2 66.7 2 100 .428 n.s 2 50.0 1 100 2 100 .548 n.s
Productivity Measurements
1 14.3 1 50.0 - - - - 1.00 n.s 1 25.0 - - - - .500 n.s
Note that: Total (N)=7, *=p<0.05, **=p<. 01, ***=p<0.001 Figure 10.10 shows the groups which influence the formation of banks long term
second level goals. Corporate level management had the highest influence on second
level long term goals followed by the chief executive officer and second level line
managers. There were no significant differences in the groups which influence the
banks second level long term goals either by size or ownership aspects.
217

Figure 10.10 The groups who influenced the formulation of second level long term goals
No Very great No Very great Influence influence influence influence
Ownership aspects Size aspects
1 2 3 4 5 1 2 3 4 5 Corporate level management •_______•________•________•________• •_______•________•________•_______• ПT=3.7, N=8 ПG=4.0 ПLO=3.5 ПF=4.0 ПL=4.0 ПM=3.0 ПS=4.0 N=2 N=4 N=2 N=4 N=2 N=2 Chief executive officer •_______•________•________•________• •_______•________•________•_______• ПT=3.6, N=8 ПG=3.5 ПLO=3.5 ПF=4.0 ПL=3.7 ПM=3.0 ПS=4.0 N=2 N=4 N=2 N=4 N=2 N=2 Outside members of the board of directors •_______•________•________•________• •_______•________•________•_______• ПT=2.1, N=8 ПG=2.5 ПLO=2.5 ПF=1.0 ПL=2.5 ПM=2.5 ПS=1.0 N=2 N=4 N=2 N=4 N=2 N=2
Corporate planning department •_______•________•________•________• •_______•________•________•_______• ПT=3.5, N=4 ПLO=3.5 ПL=3.5 ПM=3.5 N=4 N=2 N=2 Second level line managers •_______•________•________•________• •_______•________•________•_______• ПT=3.6, N=8 ПG=4.0 ПLO=3.7 ПF=3.0 ПL=3.7 ПM=4.0 ПS=3.0 N=2 N=4 N=2 N=4 N=2 N=2 Other lower levels of managers •_______•________•________•________• •_______•________•________•_______• ПT=3.1, N=8 ПG=3.5 ПLO=3.0 ПF=3.0 ПL=3.0 ПM=3.5 ПS=3.0 N=2 N=4 N=2 N=4 N=2 N=2 Government Local Foreign Large Medium Small Table 10.17 reveals the banks processes for formulating their second level long term
goals. In 4 of the 8 banks second level goals were created through a negotiation process
between the corporate level and the second level management, and in 2 banks it was a
result of aggregation of the goals developed by third level management. There were no
significant differences in the bank’s processes for formulating second level long-term
goals either by size or ownership aspects.
218

Table 10.17 Banks processes for formulating second level long term goals
Total Ownership aspects Size aspects Process N % G % LO % F % C Sig L % M % S % C Sig
Aggregation of the goals developed by third level management
2 25.0 1 50.0 1 25.0 - - .513 n.s 1 25.0 1 50.0 - - .408 n.s
Negotiation process between the corporate level/ and second level management
4 50.0 1 50.0 3 75.0 - - .612 n.s 3 75.0 1 50.0 - - .612 n.s
Negotiation process between country head, corporate level management and the second level management
1 12.5 - - - - 1 50.0 .655 n.s - - - - 1 50.0 .655 n.s
Formulated by the second Level management and the country manager
1 12.5 - - - - 1 50.0 .655 n.s - - - - 1 50.0 .655 n.s
Note that: Total (N) = 8
Figure 10.11 shows the major roles of the banks second level long term goals. Overall,
the most important roles of the second level long term goals were to evaluate business
unit performances, and use as a major influence on final corporate plan of the banks.
The banks considered their second level goals important as rationing devices for capital
and other resources and also as a basis for formally determining an incentive portion of
managerial compensation. There were no statistically significant differences in the
importance of the roles of the second level long term goals either by size or ownership
aspects.
219

Figure 10.11 Major roles of the second level long term goals Not Very Not Very Important important Important important Ownership aspects Size aspects 1 2 3 4 5 1 2 3 4 5 As a major influence on final •_______•________•________•________• •_______•________•________•_______• corporate goals (ПT=3.6, N=8) ПG=4.0 ПLO=3.5 ПF=3.5 ПL=3.7 ПM=3.5 ПS=3.5 N=2 N=4 N=2 N=4 N=2 N=2 As rationing devices for capital and •_______•________•________•________• •_______•________•________•_______• other resources (ПT=3.1, N=8) ПG=2.5 ПLO=3.2 ПF=3.5 ПL=3.0 ПM=3.0 ПS=3.5 N=2 N=4 N=2 N=4 N=2 N=2 As standards to evaluate business •_______•________•________•________• •_______•________•________•_______• unit performance ПT=4.0, N=8 ПG=4.0 ПLO=4.0 ПF=4.0 ПL=4.0 ПM=4.0 ПS=4.0 N=2 N=4 N=2 N=4 N=2 N=2 As a basis for formally determining an •_______•________•________•________• •_______•________•________•_______• incentive portion of managerial ПG=3.5 ПLO=3.2 ПF=2.5 ПL=3.5 ПM=3.0 ПS=2.5 compensation (ПT=3.1, N=8) N=2 N=4 N=2 N=4 N=2 N=2 Government Local Foreign Large Medium Small
Figure 10.12 displays the quality of the banks second level long term goals in terms of
size and ownership aspects. Locally and foreign owned banks reported having higher
quality second level long term goals than the government owned banks and similarly,
medium and small sized banks reported having higher quality second level long term
goals than the large banks. There were no significant differences in the quality of the
second level long term goals either by size or ownership aspects.
Figure 10.12 Quality of the second level long term goals
Very poor Very good Very poor Very good Ownership aspects Size aspects
1 2 3 4 5 1 2 3 4 5 ПT=3.8 ПT=3.8 •_______•________•________•_______• •_______•________•________•_______• ПG=3.5 ПLO=4.0 ПF=4.0 ПL=3.7 ПM=4.0 ПS=4.0 N=2 N=4 N=2 N=4 N=2 N=2 Ownership: Cramer’s V=0.655 P=0.180 Size: Cramer’s V=0.378 P=0.565 Government Local Foreign Large Medium Small
220

10.6 Chapter summary This chapter has analysed the mission and vision statements and the long term goals at
the corporate and second levels of the sample banks.
20 of the total of 21 banks reported having mission statements for their banks and only
one medium sized locally owned bank did not have a mission statement. It was found
that foreign owned banks did not develop mission statements for the Sri Lankan
banking sector and they just follow their head office mission statements. Thus, this
study only concentrates on locally and government owned banks mission statements.
High number of banks reported major elements in their mission statements were
employees, customers, financial services and service excellence respectively. It was
found that corporate level management had the most influence on formulating banks
current mission statements followed by the chief executive officer and outside members
of the board of directors with significant differences by size aspects. 8 of the 10
government and locally owned banks had changed their mission during last five years
and it was found that 7 banks stated their mission more specifically, 3 banks expanded
their mission and one bank completely changed their mission statement. It was also
found that overall, banks changed their mission because of strategic considerations and
newly developed capabilities. Large banks reported the lowest level of appropriateness
of their mission statements for the next five years than the medium and small sized
banks. It was also found that overall banks were expecting to follow their mission
statement for the next 3.8 years.
All the banks reported having a vision statement for their banks. Major characteristics
of vision in most banks were to be the best bank of the people, and dominate the
financial sector in Sri Lanka respectively. Corporate level management had the most
influence on formulating banks vision followed by the CEO, and outside members of
the board of directors. Overall, banks were expected to follow their current vision for
the next 3.5 years.
19 of the total of 21 banks had corporate long term goals and only 2 small banks
reported not having long term corporate goals. All the 19 banks had quantitative long
221

term corporate goals such as return, profit, income, cash flow and deposits. 18 of the 19
banks had qualitative goals and the most reported qualitative goals were customer focus,
focus on market segments, leadership in quality and service respectively. It was found
that chief executive officer and corporate level management had the most influence on
banks corporate long term goals. In government and locally owned banks the influence
of outside members of the board of directors on corporate long term goals was greater
than the foreign owned banks.
In 6 of the 19 banks corporate long term goals were developed through a negotiation
process between the CEO and the corporate level management and in 5 banks it was a
negotiation process between the corporate level, board of directors, and second level
management. Most important roles of corporate long term goals were evaluation of its
past performance, monitor current performance and provide challenge and motivation
respectively. It was found that 14 banks had changed their corporate long term goals
during last five years and these banks included 2 government owned, 6 locally owned
and 6 foreign owned banks. The major changes made by those 14 banks were upgrade
or update of goals, instituted new goals respectively. The major factors that influenced
the corporate goals were changes in the economy, and technological breakthroughs. It
was also found that except for 2 foreign owned banks all the other banks met or
exceeded their corporate long term goals during last five years. It was also found that
overall, the major reasons for those achievements were appropriateness of goals and
managerial competence.
Only 8 banks had second level long term goals and these were 2 government owned, 4
locally owned and 2 foreign owned banks. Seven of the eight banks mentioned that all
second level operating units have the same goals with respect to units of measurement.
Sales growth and profits were the most reported units of measurements of banks second
level long term goals. Corporate level management had the highest influence followed
by CEO and second level line management on their second level goals. In most banks
their second level long term goals were developed through a negotiation process
between the corporate level and second level management. It was found that overall, the
most important roles of the second level long term goals were to evaluate business unit
performances and use as a major influence on final corporate plan of the banks. Overall,
banks reported that they were satisfied with the quality of their second level long term
222

goals. However, locally and foreign owned banks reported having higher quality second
level long term goals than the government banks but it was not a significant difference.
The next chapter will investigate the planning and planning systems at the corporate and
the second levels of the banks which had a formalized strategic planning system.
223

Chapter 11 Planning and planning systems
11.1 Introduction
This chapter will investigate the planning and planning systems at the corporate and the
second levels of the banks which had a formalized strategic planning system. The
significant differences either by size or ownership aspects will also be highlighted.
11.2 Planning systems
Table 11.1 shows the banks which had formalized strategic planning system at their
corporate level. It was found that 20 of the total of 21 banks had a formalized strategic
planning system at their corporate level and only one government owned bank reported
not having a formalized planning system at their corporate level.
Table 11.1 the banks which had planning systems at corporate level
Total Ownership aspects Size aspects Response N % G % LO % F % L % M % S %
Yes 20 95.2 1 50.0 9 100 10 100 4 80.0 3 100 12 100
No 1 4.8 1 50.0 - - - - 1 20.0 - - - -
Ownership: Cramer’s V=0.689 P=0.007 Size: Cramer’s V=0.400 P=0.186
Table 11.2 shows the banks which had a formalized strategic planning system at the
second level. Only four banks reported having a formalized planning system at the
second level and those banks included one government and three locally owned banks.
It was found that size aspects were associated with the banks which had a formalized
planning system at second level with second level planning only in large and medium
sized banks.
Table 11.2 Banks which had a planning system at second level
Total Ownership aspects Size aspects Response N % G % LO % F % L % M % S %
Yes 4 19.0 1 50.0 3 33.3 - - 2 40.0 2 66.7 - -
No 17 81.0 1 50.0 6 66.7 10 100 3 60.0 1 33.3 13 100
Ownership: Cramer’s V=0.477 P=0.091 Size: Cramer’s V=0.651 P=0.012
224

11.2.1 Relationship between plans
Table 11.3 reveals the relationship between the longer term and shorter term plans of
the banks. It was found that in 18 of the total of 21 banks longer term plans were
prepared first and shorter term plans then fitted into long term plans. In one locally
owned large bank short term and long term plans were prepared simultaneously and,
one locally owned small bank prepared short term plans for 1-3 years. There were no
significant differences in the relationship between the long term and short term plans
either by size or ownership aspects. It was also found that most of the banks developed
their first formal corporate long term plans in the 1980’s and a few banks in the 1990’s
(with the opening of their banks) and one bank in the 1950’s.
Table 11.3 Relationship between the plans
Total Ownership aspects Size aspects Relationship N % G % LO % F % L % M % S %
Longer term plan prepared first, shorter term plan then fitted into long term plan
18 90.0 1 100 7 77.8 10 100 3 75.0 3 100 12 92.3
Short term and long term plans prepared simultaneously
1 5.0 - - 1 11.1 - - 1 25.0 - - - -
Prepared short term plans one to three years
1 5.0 - - 1 11.1 - - - - - - 1 7.7
Ownership: Cramer’s V=0.261 P=0.606 Size: Cramer’s V=0.342 P=0.322
11.3 Corporate plans
11.3.1 Update and progress review of corporate plan
Table 11.4 shows how often corporate plans are updated by the banks. 10 of the 20
banks updated their corporate plans every year and 4 banks reported updating their
corporate plans every six months. Banks which update their corporate plans every six
months included 1 government and 3 foreign owned banks and were associated with the
ownership aspects.
225

Table 11.4 Update of corporate plans
Total Ownership aspects Size aspects Period N % G % LO % F % C Sig L % M % S % C Sig
Six monthly
4 20.0 1 100 - - 3 30.0 .586 * 1 25.0 - - 3 23.1 .211 n.s
Every year
10 50.0 - - 4 44.4 6 60.0 .275 n.s 1 25.0 3 100 6 46.2 .451 n.s
Every 1-2 years
2 10.0 - - 2 22.2 - - .369 n.s 1 25.0 - - 1 7.7 .266 n.s
Every 3 years
2 10.0 - - 2 22.2 - - .369 n.s - - - - 2 15.4 .245 n.s
Every 5 years
2 10.0 - - 1 11.1 1 10.0 .079 n.s 1 25.0 - - 1 7.7 .266 n.s
Note that: *=p<0.05, **=p<.01, ***=p<0.001 Table 11.5 reveals the frequencies of reviewing the progress of the banks corporate
plans. It was found that 7, 7, 4 and 2 banks review the progress of their corporate plans
monthly, quarterly, six monthly and every year respectively. There were significant
differences in the banks which reviewed their progress of corporate plans quarterly by
ownership aspects in that 6 locally owned and 1 foreign owned bank reviewed progress
of the corporate plan quarterly.
Table 11.5 Frequency of reviewing the progress of corporate plans
Total Ownership aspects Size aspects Frequency N % G % LO % F % C Sig L % M % S % C Sig
Monthly 7 35.0 - - 2 22.2 5 50.0 .33 n.s - - 2 66.7 5 38.5 .421 n.s
Quarterly 7 35.0 - - 6 66.7 1 10.0 .602 * 3 75.0 1 33.3 3 23.1 .426 n.s
Six monthly
4 20.0 1 100 1 11.1 2 20.0 .471 n.s 1 25.0 - - 3 23.1 .211 n.s
Every year
2 10.0 - - - - 2 20.0 .333 n.s - - - - 2 15.4 .245 n.s
Note that: *=p<0.05, **=p<.01, ***=p<0.001 11.3.2 Effort spent on the types of planning activities Figure 11.1 shows the degree of effort spent on the planning activities by the banks. It
was found that most effort was spent on action planning or operational planning for the
next 1 to 3 years followed by short term emergency planning and formalized
contingency planning. Overall banks did not concentrate on “what the company wants
to be in the next 10 to 20 years” planning and divestitures and banks spent a small
degree of effort on activities such as international expansions and acquisitions. Results
226

also found that government banks spent a higher degree of effort on contingency
planning than the locally and foreign owned banks and as a result contingency planning
was associated with ownership aspects.
Figure 11.1 Effort spent on the types of planning activities
No effort High degree No effort High degree of effort of effort Ownership aspects Size aspects 1 2 3 4 5 1 2 3 4 5 Short term emergency planning •_______•________•________•________• •_______•________•________•_______• (ПT=3.7, N=20) ПG=4.0 ПLO=3.7 ПF=3.7 ПL=3.2 ПM=3.7 ПS=3.8 N=1 N=9 N=10 N=4 N=3 N=13 Action planning or operational planning •_______•________•________•________• •_______•________•________•_______• for the next 1 to 3 years ПG=3.0 ПLO=4.0 ПF=3.9 ПL=3.7 ПM=3.3 ПS=4.1 (ПT=3.9, N=20) N=1 N=9 N=10 N=4 N=3 N=13 Formalized contingency planning •_______•________•________•________•*** •_______•________•________•_______• (ПT=3.7, N=20) ПG=5.0 ПLO=3.6 ПF=3.8 ПL=3.7 ПM=4.0 ПS=3.7 N=1 N=9 N=10 N=4 N=3 N=13 Long-term planning for the next 5 to 10 years •_______•________•________•________• •_______•________•________•_______• (ПT=2.6, N=20) ПG=3.0 ПLO=2.7 ПF=2.6 ПL=3.0 ПM=3.0 ПS=2.5 N=1 N=9 N=10 N=4 N=3 N=13 “What the company wants to be in the next •_______•________•________•________• •_______•________•________•_______• 10-20years” planning (ПT=2.0, N=20) ПG=2.0 ПLO=2.4 ПF=1.7 ПL=2.5 ПM=3.0 ПS=1.7 N=1 N=9 N=10 N=4 N=3 N=13 Acquisitions •_______•________•________•________• •_______•________•________•_______• (ПT=2.1, N=20) ПG=1.0 ПLO=2.3 ПF=2.1 ПL=2.0 ПM=2.7 ПS=2.1 N=1 N=9 N=10 N=4 N=3 N=13 Divestitures •_______•________•________•________• •_______•________•________•_______• (ПT=2.0, N=20) ПG=1.0 ПLO=2.3 ПF=1.9 ПL=2.0 ПM=2.7 ПS=1.9 N=1 N=9 N=10 N=4 N=3 N=13 International expansion •_______•________•________•________• •_______•________•________•_______• (ПT=2.4, N=20) ПG=1.0 ПLO=2.6 ПF=2.3 ПL=2.7 ПM=2.7 ПS=2.2 N=1 N=9 N=10 N=4 N=3 N=13
Note that: *=p<0.05, **=p<.01, ***=p<0.001 Government Local Foreign Large Medium Small
11.3.3 Forecast development
Figure 11.2 displays the effort which was expended by corporate planning on forecast
development. It was found that overall, banks spent a high degree of effort on forecast
development in areas of competitive analysis, laws and regulations for financial
services, industry level demand, and domestic economy respectively. Government
banks spent a higher degree of effort to develop forecasts in the areas of social and or
cultural than the locally and foreign owned banks and it was more associated with
ownership aspects than the size aspects. Similarly, locally owned banks spent more
227

effort to develop forecasts of industry level demand than the foreign and government
owned banks and this was a significant difference.
Figure 11.2 Effort expended by corporate planning in forecast development
No effort High degree No effort High degree of effort of effort Ownership aspects Size aspects 1 2 3 4 5 1 2 3 4 5 Domestic economy •_______•________•________•________• •_______•________•________•_______• (ПT=4.0, N=20) ПG=4.0 ПLO=4.1 ПF=4.0 ПL=4.2 ПM=4.0 ПS=4.0 N=1 N=9 N=10 N=4 N=3 N=13 Foreign economies •_______•________•________•________• •_______•________•________•_______• (ПT=3.0, N=20) ПG=3.0 ПLO=2.8 ПF=3.3 ПL=3.2 ПM=2.7 ПS=3.1 N=1 N=9 N=10 N=4 N=3 N=13 Technological •_______•________•________•________• •_______•________•________•_______• (ПT=3.9, N=20) ПG=4.0 ПLO=3.9 ПF=3.9 ПL=3.5 ПM=4.0 ПS=4.0 N=1 N=9 N=10 N=4 N=3 N=13 Sri Lankan politics •_______•________•________•________• •_______•________•________•_______• (ПT=2.7, N=20) ПG=4.0 ПLO=2.6 ПF=2.8 ПL=2.7 ПM=2.7 ПS=2.8 N=1 N=9 N=10 N=4 N=3 N=13 Laws and regulations for •_______•________•________•________• •_______•________•________•_______• financial services sector ПG=4.0 ПLO=4.1 ПF=4.1 ПL=4.0 ПM=4.0 ПS=4.2 (ПT=4.1, N=20) N=1 N=9 N=10 N=4 N=3 N=13 Social and /or cultural •_______•________•________•________• •_______•________•________•_______• (ПT=2.5, N=20) ПG=4.0 ПLO=2.9 ПF=2.1 ** ПL=3.2 ПM=2.7 ПS=2.3 * N=1 N=9 N=10 N=4 N=3 N=13 Financial markets •_______•________•________•________• •_______•________•________•_______• (ПT=3.8, N=20) ПG=4.0 ПLO=4.0 ПF=3.6 ПL=4.2 ПM=4.0 ПS=3.6 N=1 N=9 N=10 N=4 N=3 N=13 Human resources •_______•________•________•________• •_______•________•________•_______• (ПT=3.7, N=20) ПG=4.0 ПLO=4.0 ПF=3.5 ПL=4.2 ПM=3.7 ПS=3.6 N=1 N=9 N=10 N=4 N=3 N=13 Industry level demand •_______•________•________•________• •_______•________•________•_______• (ПT=4.0, N=20) ПG=3.0 ПLO=4.2 ПF=4.0 * ПL=4.0 ПM=4.3 ПS=4.0 N=1 N=9 N=10 N=4 N=3 N=13 Competitive analysis •_______•________•________•________• •_______•________•________•_______• (ПT=4.2, N=20) ПG=4.0 ПLO=4.4 ПF=4.0 ПL=4.2 ПM=4.7 ПS=4.1 N=1 N=9 N=10 N=4 N=3 N=13 Suppliers requirements •_______•________•________•________• •_______•________•________•_______• (Sources of fund) ПG=3.0 ПLO=4.0 ПF=3.9 ПL=3.5 ПM=3.7 ПS=4.1 (ПT=3.9, N=20) N=1 N=9 N=10 N=4 N=3 N=13
Note that: *=p<0.05, **=p<.01, ***=p<0.001 Government Local Foreign Large Medium Small Table 11.6 shows the number of banks which purchased external forecasts. It was found
that highest number of banks purchased external forecasts in the areas of laws and
regulations for financial services sector and technology. It is worth noting that forecast
228

developments of industry level demand and supplier requirements were done by all the
banks by themselves without purchasing any external forecasts.
Table 11.6 Banks which purchased external forecasts
Total Ownership aspects Size aspects External Forecast N % G % LO % F % C Sig L % M % S % C Sig
Domestic economy
6 30.0 1 100 3 33.3 2 20 .378 n.s 3 75.0 - - 3 23.1 .522 n.s
Foreign economies
2 10.0 - - - - 2 20.0 .333 n.s - - - - 2 15.4 .245 n.s
Technological 14 70.0 - - 8 88.9 6 60.0 .466 n.s 3 75.0 2 66.7 9 69.2 .058 n.s
Sri Lankan politics
- - - - - - - - - - - - - - - - - -
Laws and regulations for financial services sector
15 75.0 1 100 6 66.7 8 80.0 .200 n.s 4 100 1 33.3 10 76.9 .455 n.s
Social and / or cultural
- - - - - - - - - - - - - - - - - -
Financial markets
2 10.0 - - 1 11.1 1 10.0 .079 n.s - - 1 33.3 1 7.7 .342 n.s
Human resources
3 15.0 1 100 2 22.2 - - .624 * 1 25.0 1 33.3 1 7.7 .287 n.s
Industry level demand
- - - - - - - - - - - - - - - - - -
Competitive analysis
2 10.0 1 100 1 11.1 - - .711 ** 1 25 1 33.3 - - .461 n.s
Suppliers requirements
- - - - - - - - - - - - - - - - - -
Figure 11.3 displays the transmission of forecasts which were developed or purchased
by corporate planning, from corporate level to the second level by the banks. Overall,
the higher degrees of forecast transmission were for domestic economy, technological,
laws and regulations for financial services, and human resources. Except for supplier
requirements government banks had a higher level of transmission in all the other areas
shown in figure 11.3 than the other banks. The level of transmission of forecasts in
social and or cultural area was relatively higher in government owned banks than the
locally and foreign owned banks and therefore, it was associated with ownership
aspects. Similarly, medium sized banks transmitted supplier requirements forecasts
more to the second level than the large and small sized banks and this was a significant
difference.
229

Figure 11.3 Transmission of forecasts from corporate level to second level
Never Regular Never Regular transmitted transmitted transmitted transmitted
Ownership aspects Size aspects 1 2 3 4 5 1 2 3 4 5
Domestic economy •_______•________•________•________• •_______•________•________•_______• (ПT=3.9, N=20) ПG=4.0 ПLO=4.0 ПF=3.9 ПL=4.0 ПM=4.0 ПS=3.9 N=1 N=9 N=10 N=4 N=3 N=13 Foreign economies •_______•________•________•________• •_______•________•________•_______• (ПT=2.7, N=20) ПG=3.0 ПLO=2.4 ПF=3.0 ПL=2.5 ПM=2.7 ПS=2.8 N=1 N=9 N=10 N=4 N=3 N=13 Technological •_______•________•________•________• •_______•________•________•_______• (ПT=3.9, N=20) ПG=4.0 ПLO=4.0 ПF=3.8 ПL=3.7 ПM=4.3 ПS=3.8 N=1 N=9 N=10 N=4 N=3 N=13 Sri Lankan politics •_______•________•________•________• •_______•________•________•_______• (ПT=2.6, N=20) ПG=3.0 ПLO=2.6 ПF=2.6 ПL=2.2 ПM=3.0 ПS=2.6 N=1 N=9 N=10 N=4 N=3 N=13 Laws and regulations for •_______•________•________•________• •_______•________•________•_______• financial services sector ПG=4.0 ПLO=3.9 ПF=3.7 ПL=3.5 ПM=4.3 ПS=3.8 (ПT=3.8, N=20) N=1 N=9 N=10 N=4 N=3 N=13 * Social and/ or cultural •_______•________•________•________• •_______•________•________•_______• (ПT=2.7, N=20) ПG=4.0 ПLO=2.7 ПF=2.6 ПL=2.7 ПM=3.0 ПS=2.6 N=1 N=9 N=10 N=4 N=3 N=13 Financial markets •_______•________•________•________• •_______•________•________•_______• (ПT=3.4, N=20) ПG=4.0 ПLO=3.4 ПF=3.3 ПL=3.2 ПM=3.7 ПS=3.4 N=1 N=9 N=10 N=4 N=3 N=13 Human resources •_______•________•________•________• •_______•________•________•_______• (ПT=3.8, N=20) ПG=4.0 ПLO=3.8 ПF=3.8 ПL=3.7 ПM=4.0 ПS=3.8 N=1 N=9 N=10 N=4 N=3 N=13 Industry level demand •_______•________•________•________• •_______•________•________•_______• (ПT=3.5, N=20) ПG=4.0 ПLO=3.4 ПF=3.6 ПL=3.7 ПM=3.3 ПS=3.5 N=1 N=9 N=10 N=4 N=3 N=13 Competitive analysis •_______•________•________•________• •_______•________•________•_______• (ПT=3.6, N=20) ПG=4.0 ПLO=3.7 ПF=3.6 ПL=3.5 ПM=4.3 ПS=3.5 N=1 N=9 N=10 N=4 N=3 N=13 Suppliers requirements (sources of fund) •_______•________•________•________• •_______•________•________•______ • ** _(ПT=3.1, N=20) ПG=3.0 ПLO=3.0 ПF=3.2 ПL=2.5 ПM=3.7 ПS=3.2 N=1 N=9 N=10 N=4 N=3 N=13
Note that: *=p<0.05, **=p<.01, ***=p<0.001 Government Local Foreign Large Medium Small Figure 11.4 shows the impact on banks corporate planning if the external forecasts
purchased by corporate planning were not available. Overall, banks did not report a
severe impact on quality of corporate planning, second level planning and other lower
level planning efforts. However, government banks reported that they would have a
higher impact on the quality of their corporate, second level, and other lower levels
planning efforts than the locally and foreign owned banks but this was not statistically
significant.
230

Figure 11.4 Impact on the corporate planning if external forecasts purchased were not available No Severe No Severe impact impact impact impact Ownership aspects Size aspects 1 2 3 4 5 1 2 3 4 5 Quality of corporate planning effort •_______•________•________•________• •_______•________•________•_______• (ПT=2.9, N=20) ПG=4.0 ПLO=2.8 ПF=3.0 ПL=2.7 ПM=3.3 ПS=2.9 N=1 N=9 N=10 N=4 N=3 N=13 Quality of second level planning effort •_______•________•________•________• •_______•________•________•_______• (ПT=2.7, N=20) ПG=3.0 ПLO=2.6 ПF=2.8 ПL=2.5 ПM=3.0 ПS=2.7 N=1 N=9 N=10 N=4 N=3 N=13 Quality of other lower levels planning effort •_______•________•________•________• •_______•________•________•_______• (ПT=2.6, N=20) ПG=3.0 ПLO=2.4 ПF=2.7 ПL=2.5 ПM=2.7 ПS=2.6 N=1 N=9 N=10 N=4 N=3 N=13
Large Medium Small Government Local Foreign
Figure 11.5 reveals the difficulty faced by the second level units to obtain the
information they currently receive from the corporate planning in terms of ownership
and size aspects. It was found that government banks second level units reported it
would be more difficult than the locally and foreign owned banks and similarly,
medium sized banks second level claimed it would be more difficult than the large and
small sized banks. Overall, there were no significant differences found either by size or
ownership aspects. Figure 11.5 Difficulty faced by the second level units to obtain information they currently receive from the corporate planning Not Very Not Very difficult difficult difficult difficult Ownership aspects Size aspects
1 2 3 4 5 1 2 3 4 5 ПT=2.4 ПT=2.4 •_______•________•________•_______• •_______•________•________•_______• ПG=3.0 ПLO=2.4 ПF=2.4 ПL=2.5 ПM=2.7 ПS=2.4 N=1 N=9 N=10 N=4 N=3 N=13 Ownership: Cramer’s V=0.299 P=0.465 Size: Cramer’s V=0.422 P=0.130 Government Local Foreign Large Medium Small
231

11.3.4 Major headings of corporate plan Table 11.7 shows the major headings of corporate long range plans of the participating
banks. Headings such as goals and objectives, corporate strategies, deposit
mobilizations, implementation and monitoring and feedbacks were included in the
corporate plans of all the banks. Policies and procedures, and customer demand were
seen in 17 of the 20 banks and associated with size aspects. Vision and mission were
associated with ownership aspects and were headings in most of the locally owned
banks rather than the foreign owned banks. Action plan and the customer analysis were
reported from 15 and 18 banks respectively and were associated with the ownership
aspects and were headings in all the locally owned banks. Table11.7 Major headings of corporate long range plan
Total Ownership aspects Size aspects Major heading N % G % LO % F % C Sig L % M % S % C Sig
Vision 11 55.0 1 100 8 88.9 2 20.0 .708 ** 4 100 2 66.7 5 38.5 .494 n.s
Mission 13 65.0 1 100 9 100 3 30.0 .734 ** 4 100 3 100 6 46.2 .538 n.s
Objective 20 100 1 100 9 100 10 100 n.a n.a 4 100 3 100 13 100 n.a n.a
Goals 20 100 1 100 9 100 10 100 n.a n.a 4 100 3 100 13 100 n.a n.a
Competitive analysis
19 95.0 1 100 9 100 9 90.0 .229 n.s 4 100 3 100 12 92.3 .168 n.s
Action plans 15 75.0 1 100 9 100 5 50.0 .577 * 4 100 3 100 8 61.5 .424 n.s
Customer analyses
18 90.0 - - 9 100 9 90.0 .707 ** 3 75.0 3 100 12 92.3 .266 n.s
Political environment
2 10.0 - - 1 11.1 1 10.0 .079 n.s 1 25.0 - - 1 7.7 .266 n.s
Shareholder requirements in overseas head office
1 5.0 - - - - 1 10.0 .229 n.s - - - - 1 7.7 .168 n.s.-
Corporate strategies
20 100 1 100 9 100 10 100 n.a n.a 4 100 3 100 13 100 n.a n.a
Environmental analyses
19 95.0 1 100 9 100 9 90.0 .229 n.s 4 100 3 100 12 92.3 .168 n.s
Policies and procedures
17 85.0 1 100 8 88.9 8 80.0 .155 n.s 4 100 1 33.3 12 92.3 .614 *
Customer demand
17 85.0 1 100 7 77.8 9 90.0 .192 n.s 4 100 1 33.3 12 92.3 .614 *
Deposit mobilizations
20 100 1 100 9 100 10 100 n.a n.s 4 100 3 100 13 100 n.a n.a
Implementation and monitoring
20 100 1 100 9 100 10 100 n.a n.s 4 100 3 100 13 100 n.a n.a
Feedbacks 20 100 1 100 9 100 10 100 n.a n.s 4 100 3 100 13 100 n.a n.a
Note that: *=p<0.05, **=p<.01, ***=p<0.001
232

11.3.5 Access to corporate plan
Table 11.8 reveals the organizational personnel of the participating banks who had
access to their current corporate plan. It was found that in 15 of the total of 20 banks,
only senior management had the access to their current corporate plan. In 4 banks
second level and up, and in 2 banks operating managers and head of department and
above had the access to their corporate plan. There were no significant differences in the
personnel groups which had the access to banks corporate plans either by size or
ownership aspects.
Table 11.8 Organizational personnel who have access to banks corporate plan
Total Ownership aspects Size aspects Organizational personal N % G % LO % F % C Sig L % M % S % C Sig
Second level and up
4 20.0 1 100 - - 3 30.0 .586 * 1 25.0 - - 3 23.1 .211 n.s
Third level and up
- - - - - - - - - - - - - - - - - -
Senior management only
15 75.0 - - 8 88.9 7 70.0 .451 n.s 3 75.0 3 100 9 69.2 .248 n.s
Operating managers
1 5.0 - - - - 1 10.0 .229 n.s - - - - 1 7.7 .168 n.s
Head of department and above
1 5.0 - - 1 11.1 - - .254 n.s - - - - 1 7.7 .168 n.s
Figure 11.6 displays the areas in corporate plan which added value over the second level
plans in the participating banks. It was found that overall, financial and sources and uses
of funds had the highest added values over the second level plans. Areas such as
research and development and operations were found to have statistically significant
differences by ownership aspects with the government owned bank having higher added
value than the locally and foreign owned banks. It was also found that size aspects were
not associated with any of the areas.
233

Figure 11.6 Added value of the corporate plan over the second level plans
No Major No Major added added added added Value value value value
Ownership aspects Size aspects 1 2 3 4 5 1 2 3 4 5
Financial •_______•________•________•________• •_______•________•________•_______• (ПT=3.9, N=20) ПG=4.0 ПLO=4.0 ПF=3.9 ПL=3.7 ПM=4.3 ПS=3.9 N=1 N=9 N=10 N=4 N=3 N=13 Human resources •_______•________•________•________• •_______•________•________•_______• (ПT=2.9, N=20) ПG=4.0 ПLO=2.8 ПF=3.0 ПL=3.0 ПM=2.7 ПS=3.0 N=1 N=9 N=10 N=4 N=3 N=13 ** Research and development •_______•________•________•________• •_______•________•________•_______• (ПT=2.2, N=20) ПG=4.0 ПLO=2.2 ПF=2.1 ПL=2.7 ПM=2.7 ПS=2.0 N=1 N=9 N=10 N=4 N=3 N=13 Markets •_______•________•________•________• •_______•________•________•_______• (ПT=3.3, N=20) ПG=4.0 ПLO=3.6 ПF=3.0 ПL=4.0 ПM=3.7 ПS=3.0 N=1 N=9 N=10 N=4 N=3 N=13 Technology •_______•________•________•________• •_______•________•________•_______• (ПT=2.9, N=20) ПG=4.0 ПLO=3.0 ПF=2.8 ПL=3.2 ПM=3.0 ПS=2.8 N=1 N=9 N=10 N=4 N=3 N=13 ** Operations •_______•________•________•________• •_______•________•________•_______• (ПT=3.2, N=20) ПG=5.0 ПLO=3.2 ПF=3.1 ПL=3.7 ПM=3.0 ПS=3.2 N=1 N=9 N=10 N=4 N=3 N=13 Sources and uses of funds •_______•________•________•________• •_______•________•________•_______• (ПT=3.9, N=20) ПG=4.0 ПLO=4.2 ПF=3.6 ПL=4.2 ПM=4.3 ПS=3.7 N=1 N=9 N=10 N=4 N=3 N=13 Organization structure •_______•________•________•________• •_______•________•________•_______• (ПT=2.9, N=20) ПG=3.0 ПLO=3.2 ПF=2.7 ПL=3.0 ПM=3.3 ПS=2.8 N=1 N=9 N=10 N=4 N=3 N=13 Competitive analysis •_______•________•________•________• •_______•________•________•_______• (ПT=3.6, N=20) ПG=3.0 ПLO=3.8 ПF=3.5 ПL=3.5 ПM=4.0 ПS=3.6 N=1 N=9 N=10 N=4 N=3 N=13
Note that: *=p<0.05, **=p<.01, ***=p<0.001 Government Local Foreign Large Medium Small
11.3.6 Computer models/systems to support corporate planning
Figure 11.7 shows to what extent participating banks used computer models/systems to
support their corporate planning. Overall, banks did not have an extensive use of
computer models/systems for their corporate planning. The government bank reported
the least level of use of computer models/systems and similarly, large banks reported
the least level of use of computer models/systems for their corporate planning. There
were no significant differences in the use of computer models/system either by size or
ownership aspects.
234

Figure 11.7 Use of computer models/systems to support corporate planning No use Extensive No use Extensive use use Ownership aspects Size aspects
1 2 3 4 5 1 2 3 4 5 (ПT=2.8) (ПT=2.8) •_______•________•________•_______• •_______•________•________•_______• ПG=2.0 ПLO=2.9 ПF=2.9 ПL=2.5 ПM=3.3 ПS=2.8 N=1 N=9 N=10 N=4 N=3 N=13 Ownership aspects: Cramer’s V=0.448 P=0.090 Size aspects: Cramer’s V=0.318 P=0.400 Government Local Foreign Large Medium Small
Table 11.9 reveals the models and systems used by the banks for their corporate
planning. It was found that 18 of the total of 20 banks used forecasting and financial
models and strategic decision support systems for their corporate planning activities.
However, none of the government banks used financial models and only one foreign
owned bank reported using planning models for their corporate planning and these were
significant differences by ownership aspects.
Table 11.9 The models and systems used by the banks for their corporate planning
Total Ownership aspects Size aspects Models N % G % LO % F % C Sig L % M % S % C Sig
Forecasting models
18 90.0 1 100 7 77.8 10 100 .369 n.s 3 75.0 3 100 12 92.3 .266 n.s
Financial models
18 90.0 - - 8 88.9 10 100 .711 ** 3 75.0 3 100 12 92.3 .266 n.s
Econometric models
- - - - - - - - - - - - - - - - - -
Planning models
9 45.0 1 100 7 77.8 1 10.0 .710 ** 3 75.0 1 33.3 5 38.5 .304 n.s
Simulation models
4 20.0 - - 2 22.2 2 20.0 .118 n.s - - 2 66.7 2 15.4 .513 n.s
Systems N % G % LO % F % C Sig L % M % S % C Sig
Group decision support systems
11 55.0 - - 6 66.7 5 50.0 .302 n.s 2 50.0 2 66.7 7 53.8 .103 n.s
Strategic decision support systems
18 90.0 1 100 8 88.9 9 90.0 .079 n.s 4 100 2 66.7 12 92.3 .342 n.s
Note that: *=p<0.05, **=p<.01, ***=p<0.001
235

Figure 11.8 shows the usefulness of the models/systems identified in table 11.9.
Overall, banks think computer models/systems have been useful but, not very useful for
their corporate planning. However, government banks reported a higher usefulness over
the locally owned and foreign owned banks. There were significant differences in the
usefulness of computer models and systems by ownership aspects. It was also found
that only two banks (locally owned) had computer systems, which link the corporate
planning system with the second level units.
Figure 11.8 The usefulness of computer models/systems for corporate planning
Not at all Very Not at all Very useful useful useful useful
Ownership aspects Size aspects 1 2 3 4 5 1 2 3 4 5
ПT=3.0 ПT=3.0 •_______•________•________•_______• * •_______•________•________•_______• ПG=4.0 ПLO=3.0 ПF=3.0 ПL=3.0 ПM=3.3 ПS=3.0 N=1 N=9 N=10 N=4 N=3 N=13
Note that: *=p<0.05, **=p<.01, ***=p<0.001 Government Local Foreign Large Medium Small
11.3.7 Corporate planning department
Table 11.10 reveals the banks which had a corporate planing department. Only 7 of the
20 banks reported having a corporate planning department and those banks included 2
large, 2 medium and 3 small sized banks and all of them were locally owned banks. It is
worth noting that in most of the banks corporate planning is done by the corporate level
management and they did not have a separate corporate planning department. Results
also found that there were significant differences in the banks which had a corporate
planning department by ownership aspects.
When asked about the number of professional personnel in the corporate planning
departments, it was found that there were 2-3 personnel in 2 banks, 8-10 personnel in 4
banks and 15 personnel in 1 bank.
236

Table 11.10 Banks which had a corporate planning department
Total Ownership aspects Size aspects Response N % G % LO % F % L % M % S %
Yes 7 35.0 - - 7 77.8 - - 2 50.0 2 66.7 3 23.1
No 13 65.0 1 100 2 22.2 10 100 2 50.0 1 33.3 10 76.9
Size: Cramer’s V=0.356 P=0.282 Ownership: Cramer’s V=0.811 P=0.001 Figure 11.9 shows to what extent line personnel were rotated through the corporate
planning department. Banks reported having a very low level (1.9) of rotation of the line
personnel in the planning department with no significant differences by size aspects.
Figure 11.9 The extent that line personnel were rotated through the corporate planning department
No rotation Extensive No rotation Extensive rotation rotation
Ownership aspects Size aspects ПT=1.9, N=7 ПT=1.9, N=7
1 2 3 4 5 1 2 3 4 5 •_______•________•________•_______• •_______•________•________•_______• ПLO=1.9 ПL=1.5 ПM=2.5 ПS=1.7 N=7 N=2 N=2 N=3
Size: Cramer’s V=0.500 P=0.478 Government Local Foreign Large Medium Small
Figure 11.10 displays the extent to which the chief corporate planner attends meetings.
It was found that chief corporate planner was more likely to attend capital budgeting
meetings than divisional planning meetings and group planning meetings with no
statistically significant differences by size aspects. The attendance to board meetings by
the chief corporate planner was very low compared to capital budgeting, divisional
planning and group planning meetings.
237

Figure 11.10 Extent of chief corporate planner attend meetings Never Always Never Always
Ownership aspects Size aspects 1 2 3 4 5 1 2 3 4 5
Board meetings •_______•________•________•________• •_______•________•________•_______• ПT=2.9, N=7 ПLO=2.9 ПL=3.5 ПM=3.5 ПS=2.0 N=7 N=2 N=2 N=3 Capital budgeting meetings •_______•________•________•________• •_______•________•________•_______• ПT=4.4, N=7 ПLO=4.4 ПL=4.5 ПM=4.5 ПS=4.3 N=7 N=2 N=2 N=3 Divisional planning meeting •_______•________•________•________• •_______•________•________•_______• ПT=3.4, N=7 ПLO=3.4 ПL=3.5 ПM=3.0 ПS=3.7 N=7 N=2 N=2 N=3 Group planning meetings •_______•________•________•________• •_______•________•________•_______• ПT=3.3, N=7 ПLO=3.3 ПL=3.5 ПM=3.0 ПS=3.3 N=7 N=2 N=2 N=3 Government Local Foreign Large Medium Small Figure 11.11 shows the authority of the corporate planning department. It was found
that overall, corporate planning department had the authority to obtain substantive
revisions in second level plans, obtain procedural revisions in second level plans and
review and criticise second level plans to a higher extent but not to accept or reject
second level plans. There were no significant differences in the level of authority that
the corporate planning department had either by size or ownership aspects.
Figure 11.11 The authority of the corporate planning department
No Complete No Complete authority authority authority authority
Ownership aspects Size aspects 1 2 3 4 5 1 2 3 4 5
Obtain substantive revisions in •_______•________•________•________• •_______•________•________•_______• second level plans ПLO=3.7 ПL=3.5 ПM=3.0 ПS=4.3 (ПT=3.7, N=7) N=7 N=2 N=2 N=3 Obtain procedural revisions in •_______•________•________•________• •_______•________•________•_______• second level plans ПLO=3.6 ПL=3.5 ПM=3.0 ПS=4.0 (ПT=3.6, N=7) N=7 N=2 N=2 N=3 Review and criticize second •_______•________•________•________• •_______•________•________•_______• level plans ПLO=3.6 ПL=3.5 ПM=3.0 ПS=4.0 (ПT=3.6, N=7) N=7 N=2 N=2 N=3 Accept and reject second •_______•________•________•________• •_______•________•________•_______• level plans ПLO=2.4 ПL=2.0 ПM=2.0 ПS=3.0 (ПT=2.4, N=7) N=7 N=2 N=2 N=3 Government Local Foreign Large Medium Small
238

Figure 11.12 displays the performance of the corporate planning group. It was found
that overall, all the banks agreed to a high extent that for their corporate planning
department specific performance goals have been clearly established, and numerical or
quantitative procedures are extensively used to measure performance.
It was also found that six banks prepared detailed reports once a year and only one
medium sized bank prepared detailed reports 2 times per year.
Figure 11.12 The performance of the corporate planning group
Disagree Strongly Disagree Strongly agree agree
Ownership aspects Size aspects 1 2 3 4 5 1 2 3 4 5
Specific performance goals have •_______•________•________•________• •_______•________•________•_______• been clearly established ПLO=4.0 ПL=4.0 ПM=4.0 ПS=4.0 N=7 N=2 N=2 N=3 Numerical or quantified procedures •_______•________•________•________• •_______•________•________•_______• are use extensively to ПLO=4.0 ПL=4.0 ПM=4.0 ПS=4.0 measure performance N=7 N=2 N=2 N=3 Government Local Foreign Large Medium Small Table 11.11 reveals the documents used by the corporate planning departments. It was
found that all the 7 banks used documents specifying roles and responsibilities for
corporate planning, written schedules for the corporate planning process, and standard
forms for the evaluation of strategic proposals. There were no significant differences in
the documents used by the corporate planning department either by ownership or size
aspects.
239

Table 11.11 Document used by the corporate planning department
Total Ownership aspects Size aspects Document used N % G % LO % F % C Sig L % M % S % C Sig
Documents describing the planning procedures
6 85.7 - - 6 85.7 - - n.a n.a 1 50.0 2 100 3 100 .645 n.s
Documents specifying roles and responsibilities for corporate planning
7 100 - - 7 100 - - n.a n.a 2 100 2 100 3 100 n.a n.a
Written schedules (time tables) for the corporate planning process
7 100 - - 7 100 - - n.a n.a 2 100 2 100 3 100 n.a n.a
Standard forms for the collection of planning data
5 71.4 - - 5 71.4 - - n.a n.a 2 100 1 50.0 2 66.7 .428 n.a
Standard forms for the evaluation of strategic proposals
7 100 - - 7 100 - - n.a n.a 2 100 2 100 3 100 n.a n.a
Note that: Total (N) = 7 11.4 Second level planning 4 of the 20 banks reported having second level long term plans and table 11.12
describes the banks which had second level long term plans in terms of size and
ownership aspects. These four banks included 2 large and 2 medium sized banks and it
was found that none of the small bank reported having second level long term plans.
Results found that size aspects were more associated with the banks which had second
level long term plans than the ownership aspects.
Table 11.12 Does your bank has second level long term plans?
Total Ownership aspects Size aspects Response N % G % LO % F % L % M % S %
Yes 4 20.0 - - 4 44.4 - - 2 50.0 2 66.7 - -
No 16 80.0 1 100 5 55.6 10 100 2 50.0 1 33.3 13 100
Size: Cramer’s V=.692 P=.008 Ownership: Cramer’s V=.553 P=.047
240

11.4.1 Major headings of second level long term plans
Table 11.13 displays the major headings of the banks second level long term plans. It
was found that the major headings for these four banks in their second level long term
plans were environmental analysis (internal and external), business strategies, forecasts
and budgets, revenue targets, time frames for assessments and volume targets for
products and services. One medium sized bank reported having headings such as
number of employees with grades and individual targets.
Table 11.13 Major headings of second level long term plans
Total Ownership aspects
Size aspects Major heading
N % G % LO % F % L % M % S % Environmental analysis (Internal and external)
4 100 - - 4 100 - - 2 100 2 100 - -
Business strategies
4 100 - - 4 100 - - 2 100 2 100 - -
Forecasts and budgets
4 100 - - 4 100 - - 2 100 2 100 - -
Revenue targets
4 100 - - 4 100 - - 2 100 2 100 - -
Number of employees with grades
1 25.0 - - 1 25.0 - - - - 1 50.0 - -
Individual targets
1 25.0 - - 1 25.0 - - - - 1 50.0 - -
Time frames for assessment
4 100 - - 4 100 - - 2 100 2 100 - -
Volume targets for products and services
4 100 - - 4 100 - - 2 100 2 100 - -
Note that: Total (N) = 4
These four banks grouped their second level units for planning, the same way they were
grouped for operations and their major long term plans at the second level were revenue
targets, volume targets and the time frames for the assessments. It was found that all
these major plans were reviewed at the corporate level. It was also found that except for
one medium sized bank all the other three banks second level planning units were profit
centres. All the four banks updated their second level long term plans yearly and they
reviewed the progress against their second level plans every three months.
241

Figure 11.13 shows to what extent the annual budgets for the second level units were
integrated with the long term plans of these units and these were integrated to a
reasonable extent (П=3.7). All four banks had standardized formats for their second
level plans and except for one large bank all the other banks 100 percent of the plans
conformed to a standardized format and for the one large bank 80 percent of the second
level plans conformed to standardized formats. It was also found that none of the banks
had specialized planning personnel at the second level.
Figure 11.13: The extent annual budgets for the second level units were integrated with the long term plans of these units
Not at all Very integrated Size aspects 1 2 3 4 5
•_______•________•________•_______• ПT=3.7, N=4 ПL=4.0 ПM=3.5 N=2 N=2
Large Medium 11.4.2 Computer models/system to support second level planning
Figure 11.14 displays to what extent computer models/systems were used by the banks
for their second level planning. It was found that computer models/systems were used to
some extent but, not to a high extent. There were no statistically significant differences
either by size or ownership aspects. Except for one large bank all the other banks
models/systems used for their second level planning were different from the
models/systems they used for their corporate planing. It was found that all the banks
used forecasting models for their second level planning while 2 banks were using
econometric models. Interestingly, all the banks had developed in house software
models for their second level planning.
Figure 11.14 Use of computer models/system to support second level planning
No use Extensive use
Size aspects 1 2 3 4 5
•_______•________•________•_______• ПT=3.0, N=4 ПL=3.0 ПM=3.0 N=2 N=2
Large Medium
242

Figure 11.15 shows to what extent computer models/systems have been useful for banks
second level planning and it was found that computer models were useful to a
reasonable degree.
Figure 11.15 Usefulness of computer models/systems
Not at all Very useful useful Size aspects 1 2 3 4 5
•_______•________•________•_______• ПT=3.2, N=4 ПL=3.0 ПM=3.5 N=2 N=2
Large Medium 11.5 Third level and fourth level long term business plans
2 of the 20 banks had third level long term business plans and none of the banks
reported having fourth level long term business plans.2 banks which had third level
business plans were locally owned one large and one medium sized bank.
11.6 Contingency planning
All the banks which had a formalized strategic planning system developed formal
contingency plans as part of their long term planning effort. Table 11.14 shows the
organizational levels for which the banks developed formal contingency plans. It was
found that in 9 banks contingency plans were developed only for corporate level and 11
banks had contingency planning both for the corporate and second level. Major
variables in all the banks contingency planning were uncontrollable environmental
factors and 14 banks also considered unpredictable strategic actions as their major
variables.
243

Table 11.14 organizational levels that has contingency planning
Total Ownership aspects Size aspects Level N % G % LO % F % C Sig L % M % S % C Sig
Corporate level only
9 45.0 1 100 4 44.4 4 40.0 .257 n.s 3 75.0 1 33.3 5 38.5 .304 n.s
Both corporate and second level
11 55.0 - - 5 55.6 6 60.0 .304 n.s 1 25.0 2 66.7 8 61.5 .304 n.s
11.7 Various functions of corporate planning Figure 11.16 shows the various functions of corporate planning namely the specific
planning tasks, overall planning responsibility, assistance at corporate level, assistance
at second level and improving planning performances. Government banks expended
more effort on preparing specific studies than the locally and foreign owned banks and
this was a significant difference by ownership aspects. Medium sized banks spent more
effort to monitor and control progress versus plans than the large and small sized banks
and this was a statistically significant difference by size aspects. Help corporate
management with merger and joint venture plans were associated with ownership
aspects and mostly seen in the government banks. It was also found that more effort was
spent in small sized banks to help corporate management with sources and uses of fund
plans than the large and medium sized banks. There were no significant differences
found in the activities of assistance at second level and improving planning
performances by ownership and size aspects.
244

Figure 11.16 Various functions of corporate planning No High No High effort degree effort degree of effort of effort
Ownership aspects Size aspects 1 2 3 4 5 1 2 3 4 5
Specific planning tasks: Define guidelines, formats •_______•________•________•________• •_______•________•________•_______• and timetables for planning ПG=4.0 ПLO=4.0 ПF=3.9 ПL=4.0 ПM=4.0 ПS=3.9 activity (ПT=3.9) N=1 N=9 N=10 N=4 N=3 N=13 Develop macro forecasts •_______•________•________•________• •_______•________•________•_______• of the economy, financial markets, ПG=4.0 ПLO=3.9 ПF=3.6 ПL=3.7 ПM=4.0 ПS=3.7 political environment and etc (ПT=3.7) N=1 N=9 N=10 N=4 N=3 N=13 * Prepare specific studies •_______•________•________•________• •_______•________•________•_______• (ПT=2.6) ПG=4.0 ПLO=2.9 ПF=2.2 ПL=2.7 ПM=3.3 ПS=2.4 N=1 N=9 N=10 N=4 N=3 N=13 Develop improved accounting and •_______•________•________•________• •_______•________•________•_______• financial data for strategic planning ПG=4.0 ПLO=3.8 ПF=3.6 ПL=3.7 ПM=3.7 ПS=3.7 (ПT=3.7) N=1 N=9 N=10 N=4 N=3 N=13 Identify areas of new business •_______•________•________•________• •_______•________•________•_______• opportunity (ПT=3.8 ПG=4.0 ПLO=3.9 ПF=3.8 ПL=4.0 ПM=3.7 ПS=3.8 N=1 N=9 N=10 N=4 N=3 N=13 Reorganize the company around •_______•________•________•________• •_______•________•________•_______• more clearly defined business units ПG=4.0 ПLO=3.9 ПF=3.7 ПL=4.0 ПM=3.7 ПS=3.8 (ПT=3.8) N=1 N=9 N=10 N=4 N=3 N=13 No High No High effort degree effort degree of effort of effort
Ownership aspects Size aspects 1 2 3 4 5 1 2 3 4 5
Overall planning responsibility: Develop and write the corporate plans •_______•________•________•________• •_______•________•________•_______• (ПT=3.5) ПG=4.0 ПLO=3.6 ПF=3.5 ПL=3.2 ПM=4.0 ПS=3.5 N=1 N=9 N=10 N=4 N=3 N=13 * Monitor and control progress versus plans •_______•________•________•________• •_______•________•________•_______• (ПT=3.9) ПG=3.0 ПLO=4.0 ПF=3.9 ПL=3.5 ПM=4.3 ПS=3.9 N=1 N=9 N=10 N=4 N=3 N=13
245

Figure 11.16 Various functions of the corporate planning (continued) No High No High effort degree effort degree of effort of effort
Ownership aspects Size aspects 1 2 3 4 5 1 2 3 4 5
Assistance at corporate level: Help corporate management formulate •_______•________•________•________• •_______•________•________•_______• goals and objectives ПG=4.0 ПLO=4.0 ПF=3.8 ПL=4.0 ПM=4.0 ПS=3.8 (ПT=3.9) N=1 N=9 N=10 N=4 N=3 N=13 Help corporate management •_______•________•________•________• •_______•________•________•_______• formulate strategy ПG=4.0 ПLO=4.0 ПF=3.8 ПL=4.0 ПM=4.0 ПS=3.8 (ПT=3.9) N=1 N=9 N=10 N=4 N=3 N=13 Help corporate management with •_______•________•________•________• •_______•________•________•_______• acquisition plans ПG=3.0 ПLO=2.8 ПF=2.3 ПL=2.7 ПM=3.3 ПS=2.3 (ПT=2.5) N=1 N=9 N=10 N=4 N=3 N=13 Help corporate management with •_______•________•________•________• •_______•________•________•_______• divestiture plans ПG=3.0 ПLO=2.4 ПF=2.2 ПL=2.5 ПM=3.0 ПS=2.2 (ПT=2.3) N=1 N=9 N=10 N=4 N=3 N=13 Help corporate management with •_______•________•________•________• •_______•________•________•_______• identification of financing needs ПG=4.0 ПLO=3.8 ПF=3.5 ПL=3.5 ПM=4.0 ПS=3.6 (ПT=3.6) N=1 N=9 N=10 N=4 N=3 N=13 Help corporate management with •_______•________•________•________• •_______•________•________•_______• non- performing loans plans ПG=4.0 ПLO=3.4 ПF=3.4 ПL=3.5 ПM=2.7 ПS=3.6 (ПT=3.4) N=1 N=9 N=10 N=4 N=3 N=13 Help corporate management with •_______•________•________•________• •_______•________•________•_______• merger plans ПG=3.0 ПLO=2.4 ПF=2.1 * ПL=2.2 ПM=2.7 ПS=2.2 (ПT=2.3) N=1 N=9 N=10 N=4 N=3 N=13 Help corporate management •_______•________•________•________• •_______•________•________•_______• with joint venture plans ПG=3.0 ПLO=2.2 ПF=2.1 * ПL=2.2 ПM=2.7 ПS=2.1 (ПT=2.2) N=1 N=9 N=10 N=4 N=3 N=13 Help corporate management with •_______•________•________•________• •_______•________•________•_______• sources and uses of fund plans ПG=3.0 ПLO=3.7 ПF=3.7 ПL=3.2 ПM=3.3 ПS=3.8 * (ПT=3.6) N=1 N=9 N=10 N=4 N=3 N=13 Assistance at second level: Help Second level management •_______•________•________•________• •_______•________•________•_______• formulate goals and objectives ПG=3.0 ПLO=3.6 ПF=3.3 ПL=3.2 ПM=3.3 ПS=3.5 (ПT=3.4) N=1 N=9 N=10 N=4 N=3 N=13 Help second level management •_______•________•________•________• •_______•________•________•_______• formulate strategy ПG=3.0 ПLO=3.3 ПF=3.1 ПL=3.0 ПM=3.3 ПS=3.2 (ПT=3.2) N=1 N=9 N=10 N=4 N=3 N=13 Review and evaluate second •_______•________•________•________• •_______•________•________•_______• level plans ПG=3.0 ПLO=3.6 ПF=3.4 ПL=3.2 ПM=3.7 ПS=3.5 (ПT=3.4) N=1 N=9 N=10 N=4 N=3 N=13 Integrate second level plans with •_______•________•________•________• •_______•________•________•_______• the corporate plan ПG=3.0 ПLO=3.3 ПF=3.2 ПL=3.0 ПM=3.7 ПS=3.2 (ПT=3.2) N=1 N=9 N=10 N=4 N=3 N=13
246

Figure 11.16 Various functions of the corporate planning (continued) No High No High effort degree effort degree of effort of effort
Ownership aspects Size aspects 1 2 3 4 5 1 2 3 4 5
Improving planning performance: Improve the quality of strategic •_______•________•________•________• •_______•________•________•_______• thinking of corporate management ПG=4.0 ПLO=3.8 ПF=2.9 ПL=4.0 ПM=3.3 ПS=3.2 (ПT=3.3) N=1 N=9 N=10 N=4 N=3 N=13 Improve the quality of strategic •_______•________•________•________• •_______•________•________•_______• thinking of second level management ПG=3.0 ПLO=3.8 ПF=2.9 ПL=3.5 ПM=3.7 ПS=3.2 (ПT=3.3) N=1 N=9 N=10 N=4 N=3 N=13 Assess the overall effectiveness •_______•________•________•________• •_______•________•________•_______• of the planning process ПG=3.0 ПLO=4.0 ПF=3.6 * ПL=3.7 ПM=4.0 ПS=3.7 (ПT=3.7) N=1 N=9 N=10 N=4 N=3 N=13 Note that: *=p<0.05, **=p<.01, ***=p<0.001 Government Local Foreign Large Medium Small
11.8 Nature of the banks planning process
Figure 11.17 shows the nature of the banks planning process in terms of roles, conflict
resolution, uncertainty and risk resolution, and resource allocation. It was found that
overall, banks planning process plays an important role in strategically managing banks
organizational structure, to sequence future activities, and it has a measurable positive
effect on sale and profits to a high extent. In lage and small banks their planning process
plays an important role in auditing ongoing activities compared with the medium sized
banks and this was a significant difference by size aspects. Similarly, roles such as
encourages the development of new business by combining expertise and resources
from lower level units, and helps to focus the R& D activities were associated with
ownership aspects and were reported from a government owned bank to a great extent.
Overall, banks agreed with the statements that planning process is a means for
systematically dealing with uncertainty, enables the company to avoid unacceptably
high levels of risks, and has constrained the strategic risk taking behaviour of lower
level managers to a high extent. However, government owned banks did not agree with
the statement that planning process is a means for systematically dealing with
uncertainty and this was a significant difference by ownership aspects.
247

It was found that planning process is a key device for allocating corporate resources
through out the company and has improved the company’s long term resource
allocation decisions to a high extent.
Figure 11.17 Nature of the banks planning process
Disagree Strongly Disagree Strongly agree agree
Ownership aspects Size aspects 1 2 3 4 5 1 2 3 4 5 Roles: The planning process plays an •_______•________•________•________• •_______•________•________•_______• important role in the organization’s ПG=4.0 ПLO=4.0 ПF=3.3 ПL=4.0 ПM=3.3 ПS=3.6 communication network (ПT=3.6) N=1 N=9 N=10 N=4 N=3 N=13 * The planning process plays an •_______•________•________•________• •_______•________•________•_______• important role in auditing ongoing ПG=3.0 ПLO=3.7 ПF=3.6 ПL=3.7 ПM=3.0 ПS=3.8 activities (ПT=3.6) N=1 N=9 N=10 N=4 N=3 N=13 The planning process plays an important •_______•________•________•________• •_______•________•________•_______• role in strategically managing our ПG=3.0 ПLO=4.1 ПF=3.8 ПL=4.0 ПM=3.7 ПS=3.9 company’s organization’s structure N=1 N=9 N=10 N=4 N=3 N=13 (ПT=3.9) The planning process plays an important •_______•________•________•________• •_______•________•________•_______• role in strategically managing our ПG=3.0 ПLO=3.7 ПF=3.5 ПL=3.5 ПM=3.0 ПS=3.7 company’s quality issues (ПT=3.5) N=1 N=9 N=10 N=4 N=3 N=13 The planning process play an important •_______•________•________•________• •_______•________•________•_______• role in strategically managing our ПG=4.0 ПLO=3.4 ПF=2.8 ПL=3.5 ПM=3.0 ПS=3.1 company’s culture (ПT=3.1) N=1 N=9 N=10 N=4 N=3 N=13 The planning process plays an important •_______•________•________•________• •_______•________•________•_______• role in strategically managing our ПG=4.0 ПLO=3.2 ПF=2.8 ПL=3.2 ПM=2.7 ПS=3.1 company’s managerial styles (ПT=3.0) N=1 N=9 N=10 N=4 N=3 N=13 The planning process is necessary to •_______•________•________•________• •_______•________•________•_______• sequence future activities ПG=4.0 ПLO=3.9 ПF=3.8 ПL=3.7 ПM=4.0 ПS=3.8 (ПT=3.8) N=1 N=9 N=10 N=4 N=3 N=13 * The planning process encourages the •_______•________•________•________• •_______•________•________•_______• development of new business by ПG=4.0 ПLO=4.0 ПF=3.4 ПL=4.0 ПM=4.0 ПS=3.5 combining expertise and resources N=1 N=9 N=10 N=4 N=3 N=13 from lower level units (ПT=3.7)
248

Figure 11.17 Nature of the banks planning process (continued)
Disagree Strongly Disagree Strongly agree agree Ownership aspects Size aspects Roles 1 2 3 4 5 1 2 3 4 5 The planning process is a means of •_______•________•________•________• •_______•________•________•_______• ensuring that specialized knowledge is ПG=4.0 ПLO=3.4 ПF=3.1 ПL=3.5 ПM=3.3 ПS=3.2 stored and available to the whole N=1 N=9 N=10 N=4 N=3 N=13 organization (ПT=3.3) The planning process has had a measurable •_______•________•________•________• •_______•________•________•_______• positive effect on sale and profits ПG=4.0 ПLO=4.0 ПF=3.7 ПL=4.0 ПM=3.7 ПS=3.8 (ПT=3.8) N=1 N=9 N=10 N=4 N=3 N=13 The planning process acts mainly as an •_______•________•________•________• •_______•________•________•_______• agency for assembling financial reports ПG=3.0 ПLO=3.3 ПF=3.1 ПL=3.0 ПM=2.7 ПS=3.4 (ПT=3.3) N=1 N=9 N=10 N=4 N=3 N=13 *** The planning process helps to focus the •_______•________•________•________• •_______•________•________•_______• company’s R & D efforts around defined ПG=4.0 ПLO=2.3 ПF=2.3 ПL=2.7 ПM=2.3 ПS=2.3 opportunity areas (ПT=2.4) N=1 N=9 N=10 N=4 N=3 N=13 Conflicts resolution: The planning process is a device to assure •_______•________•________•________• •_______•________•________•_______• that conflicting expectations are resolved ПG=3.0 ПLO=3.9 ПF=3.1 ПL=3.5 ПM=3.7 ПS=3.4 (ПT=3.4) N=1 N=9 N=10 N=4 N=3 N=13 The planning process is a means of •_______•________•________•________• •_______•________•________•_______• organizational conflict resolution ПG=3.0 ПLO=3.4 ПF=2.7 ПL=3.2 ПM=2.7 ПS=3.1 (ПT=3.0) N=1 N=9 N=10 N=4 N=3 N=13 The planning process involves a great •_______•________•________•________• •_______•________•________•_______• deal of bargaining ПG=2.0 ПLO=3.3 ПF=2.7 ПL=3.0 ПM=2.7 ПS=3.0 (ПT=2.9) N=1 N=9 N=10 N=4 N=3 N=13 Uncertainty and risk resolution: ** The planning process is a means for •_______•________•________•________• •_______•________•________•_______• systematically dealing with uncertainty ПG=2.0 ПLO=4.0 ПF=4.0 ПL=3.2 ПM=4.0 ПS=4.1 (ПT=3.9) N=1 N=9 N=10 N=4 N=3 N=13 The planning process enables the •_______•________•________•________• •_______•________•________•_______• company to avoid unacceptably high ПG=3.0 ПLO=3.9 ПF=3.8 ПL=3.7 ПM=3.3 ПS=3.9 levels of risks (ПT=3.8) N=1 N=9 N=10 N=4 N=3 N=13 The planning process has constrained •_______•________•________•________• •_______•________•________•_______• the strategic risk taking behaviour of ПG=3.0 ПLO=3.8 ПF=3.9 ПL=3.5 ПM=3.7 ПS=3.9 lower level managers (ПT=3.8) N=1 N=9 N=10 N=4 N=3 N=13 Resource allocation: The planning process is a key device for •_______•________•________•________• •_______•________•________•_______• allocating corporate resources ПG=4.0 ПLO=4.0 ПF=3.9 ПL=4.0 ПM=4.0 ПS=3.9 throughout the company (ПT=3.9) N=1 N=9 N=10 N=4 N=3 N=13 The planning process assures that scarce •_______•________•________•________• •_______•________•________•_______• resources are allocated to high yield uses ПG=4.0 ПLO=3.9 ПF=3.5 ПL=3.7 ПM=3.7 ПS=3.7 (ПT=3.7) N=1 N=9 N=10 N=4 N=3 N=13 The planning process has improved the •_______•________•________•________• •_______•________•________•_______• company’s long-term resource allocation ПG=4.0 ПLO=3.9 ПF=3.9 ПL=3.7 ПM=4.0 ПS=3.9 decisions (ПT=3.9) N=1 N=9 N=10 N=4 N=3 N=13 Long-term resource allocation decisions •_______•________•________•________• •_______•________•________•_______• are made as an integral part of the planning ПG=4.0 ПLO=3.8 ПF=3.7 ПL=3.7 ПM=4.0 ПS=3.7 process (ПT=3.7) N=1 N=9 N=10 N=4 N=3 N=13 Note that: *=p<0.05, **=p<.01, ***=p<0.001
Government Local Foreign Large Medium Small
249

11.9 Planning process and external analysis
Figure 11.18 displays the planning process and its external analysis of the banks.
Overall, banks agreed that their planning effort is an adaptive, evolving, learning
activity to a reasonably high extent while the government bank strongly agreed. It was
found that a reasonably high effort is expended in attempting to identify competitors
cost structures and it was a major activity of corporate level management. Overall,
banks agreed with the statement that a great deal of effort is expended in attempting to
identify the sources of funds to a high extent and overall it was a major activity of
corporate level management and finance people. It was also found that locally owned
and foreign owned banks considered supplier analysis as a major activity of corporate
management and finance people to a higher extent than the government bank and these
were significant differences by ownership aspects.
A great deal of effort is expended in attempting to identify the customer demand and it
was found that customer analysis is a major activity of marketing people and corporate
management. Small banks reported that the customer analysis is a major activity of
second level management more than the medium and large banks and this was a
significant difference by size aspects. It was also found that for banks overall, a
reasonable effort is expended in attempting to identify the possible impacts of the
government on their business operations and that was a major activity of corporate level
management. Similarly for banks a great deal of effort is expended in economic analysis
and that was a major activity of corporate level management.
Not much effort is expended on social and cultural analysis and responses confirmed
that social and cultural analysis is a major activity of corporate and second level
managements. Banks agreed with the statement that a great deal of effort is expended in
attempting to identify the technological developments to a high extent. It was found that
technological analysis is a major activity of operations people rather than the corporate
and second level management.
250

Figure 11.18 Planning process and external analysis
Disagree Strongly Disagree Strongly
agree agree Ownership aspects Size aspects
1 2 3 4 5 1 2 3 4 5 Planning process ** Our planning effort is an adaptive, •_______•________•________•________• •_______•________•________•_______• evolving, learning activity ПG=5.0 ПLO=3.6 ПF=2.9 ПL=3.7 ПM=4.3 ПS=2.9 (ПT=3.3) N=1 N=9 N=10 N=4 N=3 N=13 * Our planning effort is a fairly •_______•________•________•________• •_______•________•________•_______• routinised activity ПG=3.0 ПLO=2.8 ПF=2.9 ПL=2.2 ПM=2.7 ПS=3.1 (ПT=2.8) N=1 N=9 N=10 N=4 N=3 N=13 In our planning process, all key personnel •_______•________•________•________• •_______•________•________•_______• contribute their fair share of effort ПG=3.0 ПLO=3.4 ПF=3.1 ПL=3.2 ПM=3.3 ПS=3.2 (ПT=3.2) N=1 N=9 N=10 N=4 N=3 N=13 In our company daily routine drives out •_______•________•________•________• •_______•________•________•_______• planning effort (ПT=2.6) ПG=2.0 ПLO=2.8 ПF=2.6 ПL=2.5 ПM=3.0 ПS=2.6 N=1 N=9 N=10 N=4 N=3 N=13 Planning is often characterized by distortion •_______•________•________•________• •_______•________•________•_______• of data (ПT=2.8) ПG=3.0 ПLO=3.0 ПF=2.7 ПL=3.0 ПM=2.7 ПS=2.8 N=1 N=9 N=10 N=4 N=3 N=13 Competitive analysis: In our company, a great deal of effort is •_______•________•________•________• •_______•________•________•_______• expended in attempting to identify ПG=4.0 ПLO=3.7 ПF=3.4 ПL=3.7 ПM=3.0 ПS=3.6 competitors cost structure (ПT=3.5) N=1 N=9 N=10 N=4 N=3 N=13 Our company focuses its competitive •_______•________•________•________• •_______•________•________•_______• analysis on competitive products analysis ПG=4.0 ПLO=3.7 ПF=3.6 ПL=3.7 ПM=3.3 ПS=3.7 (ПT=3.6) N=1 N=9 N=10 N=4 N=3 N=13 * Competitive analysis is primary the •_______•________•________•________• •_______•________•________•_______• responsibility of our sales and marketing ПG=2.0 ПLO=3.7 ПF=2.9 ПL=3.0 ПM=3.7 ПS=3.2 people (ПT=3.2) N=1 N=9 N=10 N=4 N=3 N=13 Competitive analysis is a major activity •_______•________•________•________• •_______•________•________•_______• of the corporate planning department ПLO=2.7 ПL=2.7 ПM=2.5 ПS=3.0 (ПT=2.7) N=7 N=2 N=2 N=3 Competitive analysis is a major activity •_______•________•________•________• •_______•________•________•_______• of the corporate level management ПG=3.0 ПLO=3.9 ПF=3.8 ПL=3.7 ПM=3.3 ПS=3.9 (ПT=3.8) N=1 N=9 N=10 N=4 N=3 N=13 Competitive analysis is a major activity •_______•________•________•________• •_______•________•________•_______• of our second level management ПG=2.0 ПLO=2.7 ПF=2.7 ПL=2.5 ПM=2.3 ПS=2.8 (ПT=2.6) N=1 N=9 N=10 N=4 N=3 N=13
251

Figure 11.18 Planning process and external analysis (continued)
Disagree Strongly Disagree Strongly agree agree
Ownership aspects Size aspects 1 2 3 4 5 1 2 3 4 5
Supplier analysis: * A great deal of effort is expended in •_______•________•________•________• •_______•________•________•_______• attempting to identify the sources of funds ПG=3.0 ПLO=4.0 ПF=3.8 ПL=3.7 ПM=3.7 ПS=3.9 (ПT=3.8) N=1 N=9 N=10 N=4 N=3 N=13 *** The supplier analysis is primarily the •_______•________•________•________• •_______•________•________•_______• responsibility of our financial people ПG=2.0 ПLO=3.9 ПF=3.6 ПL=3.5 ПM=3.3 ПS=3.8 (ПT=3.6) N=1 N=9 N=10 N=4 N=3 N=13 The supplier analysis is a major activity •_______•________•________•________• •_______•________•________•_______• of the corporate planning department ПLO=3.0 ПL=3.0 ПM=3.0 ПS=3.0 (ПT=3.0) N=7 N=2 N=2 N=3 ** The supplier analysis is a major activity of •_______•________•________•________• •_______•________•________•_______• the corporate level management ПG=3.0 ПLO=3.9 ПF=4.0 ПL=3.7 ПM=3.7 ПS=4.0 (ПT=3.9) N=1 N=9 N=10 N=4 N=3 N=13 The supplier analysis is a major activity •_______•________•________•________• •_______•________•________•_______• of the second level management ПG=2.0 ПLO=2.6 ПF=2.2 ПL=2.2 ПM=2.3 ПS=2.4 (ПT=2.3) N=1 N=9 N=10 N=4 N=3 N=13 Customer analysis In our company, a great deal of effort is •_______•________•________•________• •_______•________•________•_______• expended in attempting to identify the ПG=3.0 ПLO=3.9 ПF=3.9 ПL=3.7 ПM=3.7 ПS=3.9 customer demands (ПT=3.8) N=1 N=9 N=10 N=4 N=3 N=13 The customer analysis is primarily the •_______•________•________•________• •_______•________•________•_______• responsibility of our marketing people ПG=3.0 ПLO=3.9 ПF=3.3 ПL=3.7 ПM=3.7 ПS=3.5 (ПT=3.5) N=1 N=9 N=10 N=4 N=3 N=13 The customer analysis is a major activity •_______•________•________•________• •_______•________•________•_______• of the corporate planning department ПLO=3.2 ПL=3.0 ПM=3.0 ПS=3.5 (ПT=3.2) N=7 N=2 N=2 N=3 The customer analysis is a major activity •_______•________•________•________• •_______•________•________•_______• of the corporate level management ПG=3.0 ПLO=3.7 ПF=3.4 ПL=3.5 ПM=3.0 ПS=3.6 (ПT=3.5) N=1 N=9 N=10 N=4 N=3 N=13 * The customer analysis is a major activity •_______•________•________•________• •_______•________•________•_______• of the second level management ПG=2.0 ПLO=3.2 ПF=3.4 ПL=2.7 ПM=2.7 ПS=3.5 (ПT=3.2) N=1 N=9 N=10 N=4 N=3 N=13
Note that: *=p<0.05, **=p<.01, ***=p<0.001 Government Local Foreign Large Medium Small
252

Figure 11.18 Planning process and external analysis (continued)
Disagree Strongly Disagree Strongly agree agree
Ownership aspects Size aspects 1 2 3 4 5 1 2 3 4 5 Political analysis A great deal of effort is expended in •_______•________•________•________• •_______•________•________•_______• attempting to identify the possible impacts ПG=3.0 ПLO=3.4 ПF=3.4 ПL=3.2 ПM=3.3 ПS=3.5 of the government on our business N=1 N=9 N=10 N=4 N=3 N=13 operations (ПT=3.4) The political analysis is primarily the •_______•________•________•________• •_______•________•________•_______• responsibility of our operations people ПG=2.0 ПLO=2.7 ПF=2.2 ПL=2.7 ПM=2.7 ПS=2.2 (ПT=2.4) N=1 N=9 N=10 N=4 N=3 N=13 The political analysis is a major activity •_______•________•________•________• •_______•________•________•_______• of the corporate planning department ПLO=3.0 ПL=3.0 ПM=3.0 ПS=3.0 (ПT=3.0) N=7 N=2 N=2 N=3 The political analysis is a major activity •_______•________•________•________• •_______•________•________•_______• of the corporate level management ПG=4.0 ПLO=3.7 ПF=3.8 ПL=4.0 ПM=3.3 ПS=3.8 (ПT=3.7) N=1 N=9 N=10 N=4 N=3 N=13 The political analysis is a major activity •_______•________•________•________• •_______•________•________•_______• of the second level management ПG=2.0 ПLO=2.3 ПF=2.1 ПL=2.0 ПM=2.3 ПS=2.2 (ПT=2.2) N=1 N=9 N=10 N=4 N=3 N=13 Economic analysis: A great deal of effort is expended in •_______•________•________•________• •_______•________•________•_______• attempting to identify the possible impacts ПG=4.0 ПLO=4.0 ПF=4.0 ПL=4.0 ПM=4.0 ПS=4.0 of the economy on our business operations N=1 N=9 N=10 N=4 N=3 N=13 (ПT=4.0) The economic analysis is primarily the •_______•________•________•________• •_______•________•________•_______• responsibility of our operations people ПG=3.0 ПLO=3.6 ПF=2.8 ПL=3.0 ПM=3.0 ПS=3.2 (ПT=3.1) N=1 N=9 N=10 N=4 N=3 N=13 The economic analysis is a major activity •_______•________•________•________• •_______•________•________•_______• of the corporate planning department ПLO=3.6 ПL=3.7 ПM=3.5 ПS=3.5 (ПT=3.6) N=7 N=2 N=2 N=3 The economic analysis is a major activity •_______•________•________•________• •_______•________•________•_______• of the corporate level management ПG=4.0 ПLO=4.0 ПF=4.0 ПL=4.0 ПM=4.0 ПS=4.0 (ПT=4.0) N=1 N=9 N=10 N=4 N=3 N=13 The economic analysis is a major activity •_______•________•________•________• •_______•________•________•_______• of the second level management ПG=2.0 ПLO=2.8 ПF=2.8 ПL=2.7 ПM=2.7 ПS=2.8 (ПT=2.7) N=1 N=9 N=10 N=4 N=3 N=13
253

Figure 11.18 Planning process and external analysis (continued)
Disagree Strongly Disagree Strongly agree agree
Ownership aspects Size aspects 1 2 3 4 5 1 2 3 4 5 Social and cultural analysis: A great deal of effort is expended in •_______•________•________•________• •_______•________•________•_______• Attempting to identify the possible impacts ПG=3.0 ПLO=3.0 ПF=2.7 ПL=2.7 ПM=3.0 ПS=2.8 of the Sri Lankan culture on our business N=1 N=9 N=10 N=4 N=3 N=13 operations (ПT=2.8) The cultural analysis is primarily the •_______•________•________•________• •_______•________•________•_______• responsibility of our operations people ПG=3.0 ПLO=3.1 ПF=2.8 ПL=3.2 ПM=2.7 ПS=2.9 (ПT=2.9) N=1 N=9 N=10 N=4 N=3 N=13 The cultural analysis is a major activity of •_______•________•________•________• •_______•________•________•_______• the corporate planning department (ПT=2.6) ПLO=2.6 ПL=3.0 ПM=2.5 ПS=2.5 N=7 N=2 N=2 N=3 The cultural analysis is a major activity of •_______•________•________•________• •_______•________•________•_______• the corporate level management (ПT=3.4) ПG=3.0 ПLO=3.3 ПF=3.5 ПL=3.2 ПM=3.3 ПS=3.5 N=1 N=9 N=10 N=4 N=3 N=13 The cultural analysis is a major activity of •_______•________•________•________• •_______•________•________•_______• the second level management (ПT=3.0) ПG=3.0 ПLO=3.1 ПF=3.0 ПL=3.2 ПM=2.7 ПS=3.1 N=1 N=9 N=10 N=4 N=3 N=13 Technology analysis A great deal of effort is expended in •_______•________•________•________• •_______•________•________•_______• Attempting to identify technological ПG=3.0 ПLO=4.0 ПF=3.8 ПL=3.7 ПM=4.0 ПS=3.8 Developments (ПT=3.8) N=1 N=9 N=10 N=4 N=3 N=13 The technology analysis is primarily the •_______•________•________•________• •_______•________•________•_______• responsibility of our operations people ПG=3.0 ПLO=3.9 ПF=3.7 ПL=3.7 ПM=3.7 ПS=3.8 (ПT=3.7) N=1 N=9 N=10 N=4 N=3 N=13 The technology analysis is a major activity •_______•________•________•________• •_______•________•________•_______• of the corporate planning department ПLO =2.7 ПL=2.7 ПM=3.5 ПS=2.0 (ПT=2.7) N=7 N=2 N=2 N=3 The technology analysis is a major activity •_______•________•________•________• •_______•________•________•_______• of the corporate level management ПG=3.0 ПLO=3.8 ПF=3.6 ПL=3.5 ПM=3.3 ПS=3.8 (ПT=3.6) N=1 N=9 N=10 N=4 N=3 N=13 The technology analysis is a major activity •_______•________•________•________• •_______•________•________•_______• of the second level management ПG=3.0 ПLO=3.8 ПF=3.5 ПL=3.5 ПM=3.3 ПS=3.7 (ПT=3.6) N=1 N=9 N=10 N=4 N=3 N=13 Note that: *=p<0.05, **=p<.01, ***=p<0.001
Government Local Foreign Large Medium Small
11.10 Coordination issues involved in the banks planning process
Figure 11.19 shows the coordination issues involved in the planning process in terms of
coordination of planning, quality of information, and resistance to planning. It was
254

found that overall, banks agreed that their corporate planning coordinated with financial
planning, operations planning, marketing planning, human resource planning, and
technology planning to a reasonably high extent with no significant differences either
by size or ownership aspects.
Overall, banks agreed to a reasonably high extent that their finance, operation,
marketing, and human resource departments provide very high quality information for
their corporate planning. It was found that locally owned banks received high quality
information from finance department more than the foreign and government owned
banks and this was a significant difference by ownership aspects.
Responses also confirmed that overall, banks were not getting a great deal of resistance
from the finance, operations, marketing, and human resource departments for their
corporate planning. However, the government bank was getting a great deal of
resistance from their finance, operations and human resource people compared with the
local and foreign banks and this was a significant difference by ownership aspects.
Figure 11.19 Coordination issues involved in the banks planning process
Disagree Strongly Disagree Strongly agree agree
Ownership aspects Size aspects 1 2 3 4 5 1 2 3 4 5 Coordination of planning: The financial planning is closely •_______•________•________•________• •_______•________•________•_______• coordinated with corporate planning ПG=4.0 ПLO=4.1 ПF=4.0 ПL=4.2 ПM=4.0 ПS=4.0 (ПT=4.0) N=1 N=9 N=10 N=4 N=3 N=13 The operations planning is closely •_______•________•________•________• •_______•________•________•_______• coordinated with corporate planning ПG=4.0 ПLO=3.7 ПF=3.7 ПL=3.5 ПM=3.7 ПS=3.8 (ПT=3.7) N=1 N=9 N=10 N=4 N=3 N=13 The marketing planning is closely •_______•________•________•________• •_______•________•________•_______• coordinated with corporate planning ПG=4.0 ПLO=3.7 ПF=3.3 ПL=3.5 ПM=3.7 ПS=3.5 (ПT=3.5) N=1 N=9 N=10 N=4 N=3 N=13 The human resource planning is closely •_______•________•________•________• •_______•________•________•_______• coordinated with corporate planning ПG=4.0 ПLO=3.6 ПF=3.5 ПL=3.5 ПM=3.7 ПS=3.5 (ПT=3.5) N=1 N=9 N=10 N=4 N=3 N=13 The technology planning is closely •_______•________•________•________• •_______•________•________•_______• coordinated with corporate planning ПG=4.0 ПLO=3.6 ПF=3.5 ПL=3.5 ПM=3.7 ПS=3.5 (ПT=3.5) N=1 N=9 N=10 N=4 N=3 N=13
255

Figure 11.19 Coordination issues involved in the banks planning process (continued)
Disagree Strongly Disagree Strongly agree agree
Ownership aspects Size aspects 1 2 3 4 5 1 2 3 4 5 Quality of information * Your company gets very high quality •_______•________•________•________• •_______•________•________•_______• information from the finance department ПG=3.0 ПLO=3.9 ПF=3.4 ПL=3.7 ПM=3.3 ПS=3.6 for corporate planning (ПT=3.6) N=1 N=9 N=10 N=4 N=3 N=13 Your company gets very high quality •_______•________•________•________• •_______•________•________•_______• information from the operations department ПG=3.0 ПLO=3.7 ПF=3.5 ПL=3.2 ПM=3.7 ПS=3.6 for corporate planning (ПT=3.5) N=1 N=9 N=10 N=4 N=3 N=13 Your company gets very high quality •_______•________•________•________• •_______•________•________•_______• information from the marketing department ПG=2.0 ПLO=3.7 ПF=2.9 ПL=3.0 ПM=3.7 ПS=3.2 for corporate planning (ПT=3.2) N=1 N=9 N=10 N=4 N=3 N=13 Your company gets very high quality •_______•________•________•________• •_______•________•________•_______• information from the human resource ПG=2.0 ПLO=3.8 ПF=2.9 ПL=3.0 ПM=4.0 ПS=3.2 department for corporate planning N=1 N=9 N=10 N=4 N=3 N=13 (ПT=3.2) Your company gets very high quality •_______•________•________•________• •_______•________•________•_______• information from technology development ПG=3.0 ПLO=2.7 ПF=2.7 ПL=2.7 ПM=3.0 ПS=2.6 (R & D) for corporate planning N=1 N=9 N=10 N=4 N=3 N=13 (ПT=2.7) Resistance to planning: *** Your company gets a great deal of •_______•________•________•________• •_______•________•________•_______• resistance from its finance people ПG=4.0 ПLO=2.6 ПF=2.3 ПL=3.0 ПM=1.7 ПS=2.5 (ПT=2.5) N=1 N=9 N=10 N=4 N=3 N=13 * Your company gets a great deal of •_______•________•________•________• •_______•________•________•_______• resistance from its operations people ПG=3.0 ПLO=1.9 ПF=2.1 ПL=2.2 ПM=1.7 ПS=2.1 (ПT=2.0) N=1 N=9 N=10 N=4 N=3 N=13 Your company gets a great deal of •_______•________•________•________• •_______•________•________•_______• resistance from its marketing people ПG=2.0 ПLO=1.9 ПF=2.0 ПL=2.0 ПM=1.7 ПS=2.0 (ПT=2.0) N=1 N=9 N=10 N=4 N=3 N=13 *** * Your company gets a great deal of •_______•________•________•________• •_______•________•________•_______• resistance from its human resource people ПG=4.0 ПLO=1.9 ПF=2.0 ПL=2.5 ПM=1.7 ПS=2.0 (ПT=2.0) N=1 N=9 N=10 N=4 N=3 N=13
Note that: *=p<0.05, **=p<.01, ***=p<0.001
Government Local Foreign Large Medium Small
256

11.11 Personal involvement in the corporate planning process
Figure 11.20 shows the involvement of the CEO/GM in the corporate planning process
in the banks. It was found that CEO/GM’s were involved in the development of
corporate goals, missions, objectives, alternative strategies, and evaluation and approval
of the corporate plans, and having planning as a philosophy in the bank to a great extent
with no statistically significant differences either by ownership or size aspects.
Figure 11.20 CEO’s personal involvement in the corporate planning process Not at all Very Not at all Very
Involved involved involved involved Ownership aspects Size aspects 1 2 3 4 5 1 2 3 4 5 The development of corporate •_______•________•________•________• •_______•________•________•_______• goals, missions, objectives ПG=4.0 ПLO=4.2 ПF=4.3 ПL=4.0 ПM=4.0 ПS=4.4 N=1 N=9 N=10 N=4 N=3 N=13 The development of alternative •_______•________•________•________• •_______•________•________•_______• corporate strategies ПG=4.0 ПLO=4.3 ПF=4.3 ПL=4.2 ПM=4.0 ПS=4.4 N=1 N=9 N=10 N=4 N=3 N=13 The evaluation and approval of •_______•________•________•________• •_______•________•________•_______• the corporate plans ПG=4.0 ПLO=4.2 ПF=4.1 ПL=4.0 ПM=4.0 ПS=4.2 N=1 N=9 N=10 N=4 N=3 N=13 Having planning as a philosophy •_______•________•________•________• •_______•________•________•_______• in the company ПG=4.0 ПLO=4.2 ПF=4.1 ПL=4.0 ПM=4.0 ПS=4.2 N=1 N=9 N=10 N=4 N=3 N=13 Government Local Foreign Large Medium Small
The board of director’s involvement in the corporate planning process in foreign owned
banks was low compared with the government and locally owned banks and similarly,
large banks reported a higher involvement than the small and medium sized banks (see
figure 11.21. There were statistically significant differences found by ownership aspects
but, not by size aspects. Figure 11.21 Board of director’s involvement in the corporate planning process
Not Very Not Very Involved involved involved involved
Ownership aspects Size aspects ПT=2.4, N=20 ПT=2.4, N=20
1 2 3 4 5 1 2 3 4 5 ** •_______•________•________•_______• •_______•________•________•_______• ПG=3.0 ПLO=3.1 ПF=1.7 ПL=3.2 ПM=2.3 ПS=2.2 N=2 N=9 N=10 N=4 N=3 N=13 Note that: *=p<0.05, **=p<.01, ***=p<0.001
Government Local Foreign Large Medium Small
257

It was found that board of directors in government banks were more supportive than the
board of directors in locally and foreign owned banks for their corporate planning
process and similarly, board of directors in large banks reported higher support for than
the medium and small sized banks (see figure 11.22). There were no significant
differences found either by ownership or size aspects.
Figure 11.22 How supportive the board of directors regarding corporate planning activities
Not Very Not Very Supportive supportive supportive supportive
Ownership aspects Size aspects ПT=3.1, N=20 ПT=3.1, N=20
1 2 3 4 5 1 2 3 4 5 •_______•________•________•_______• •_______•________•________•_______• ПG=4.0 ПLO=3.2 ПF=2.9 ПL=3.5 ПM=3.0 ПS=3.0 N=2 N=9 N=10 N=4 N=3 N=13 Government Local Foreign Large Medium Small 11.11.1 Roles of various personnel in the planning process Figure 11.23 explores the roles of various personnel in the corporate planning process.
It was found that chief executive officer had a strong influence in format of corporate
plan, assumption used in the final corporate plan, objectives embodied in the final
corporate plan, approval of the final corporate plan, and development of missions for
second level units with no significant differences either by size or ownership aspects.
Overall, the influence of outside members of board of directors on their format of
corporate plan, assumption used in the final corporate plan, objectives embodied in the
final corporate plan, approval of the final corporate plan was lower but, government and
locally owned banks reported a greater influence than the foreign owned banks and
these were significant differences by ownership aspects. The influence of corporate planning department on banks format of corporate plan,
assumption used in the final corporate plan, objectives embodied in the final corporate
plan, approval of the final corporate plan, and development of missions for second level
units were reasonably high with no significant differences either by size or ownership
aspects. It was also found that overall banks top second level line managers had a
reasonably high influence on development of missions for their second level units but
258

had less influence for the format of corporate plan, assumption used in the final
corporate plan, objectives embodied in the final corporate plan, approval of the final
corporate plan
Figure 11.23 Roles of various personnel in the planning process No Very great No Very great influence influence influence influence Ownership aspects Size aspects 1 2 3 4 5 1 2 3 4 5 Chief executive officer: Format of corporate plan •_______•________•________•________• •_______•________•________•_______• (П T=4.2, N=20) ПG=4.0 ПLO=4.2 ПF=4.2 ПL=4.2 ПM=4.0 ПS=4.2 N=1 N=9 N=10 N=4 N=3 N=13 Assumptions used in the •_______•________•________•________• •_______•________•________•_______• final corporate plan ПG=4.0 ПLO=4.2 ПF=4.2 ПL=4.2 ПM=4.0 ПS=4.2 (П T=4.2, N=20) N=1 N=9 N=10 N=4 N=3 N=13 Objectives embodied in the •_______•________•________•________• •_______•________•________•_______• final corporate plan ПG=4.0 ПLO=4.2 ПF=4.2 ПL=4.2 ПM=4.0 ПS=4.2 (П T=4.2, N=20) N=1 N=9 N=10 N=4 N=3 N=13 Approval of the final •_______•________•________•________• •_______•________•________•_______• corporate plan ПG=4.0 ПLO=4.1 ПF=4.2 ПL=4.0 ПM=4.0 ПS=4.2 (П T=4.1, N=20) N=1 N=9 N=10 N=4 N=3 N=13 Development of missions •_______•________•________•________• •_______•________•________•_______• for second level units ПG=3.0 ПLO=4.0 ПF=4.1 ПL=3.7 ПM=3.7 ПS=4.2 (П T=4.0, N=20) N=1 N=9 N=10 N=4 N=3 N=13 Outside members of the board of directors: * Format of corporate plan •_______•________•________•________• •_______•________•________•_______• (П T=2.5, N=20) ПG=3.0 ПLO=3.3 ПF=1.8 ПL=3.2 ПM=2.7 ПS=2.3 N=1 N=9 N=10 N=4 N=3 N=13 * Assumptions used in the final corporate •_______•________•________•________• •_______•________•________•_______• plan ПG=2.0 ПLO=3.0 ПF=1.8 ПL=3.0 ПM=2.3 ПS=2.2 (П T=2.3, N=20) N=1 N=9 N=10 N=4 N=3 N=13 * Objectives embodied in the final corporate •_______•________•________•________• •_______•________•________•_______• plan ПG=3.0 ПLO=3.0 ПF=1.8 ПL=3.2 ПM=2.3 ПS=2.2 (П T=2.4, N=20) N=1 N=9 N=10 N=4 N=3 N=13 * Strategies embodied in the final corporate •_______•________•________•________• •_______•________•________•_______• plan ПG=3.0 ПLO=3.0 ПF=1.8 ПL=3.2 ПM=2.3 ПS=2.2 (П T=2.4, N=20) N=1 N=9 N=10 N=4 N=3 N=13 * Approval of the final corporate plan •_______•________•________•________• •_______•________•________•_______• (П T=2.6, N=20) ПG=3.0 ПLO=3.4 ПF=1.8 ПL=3.5 ПM=2.7 ПS=2.3 N=1 N=9 N=10 N=4 N=3 N=13 Development of missions for second •_______•________•________•________• •_______•________•________•_______• level units ПG=1.0 ПLO=2.4 ПF=1.8 ПL=2.0 ПM=2.0 ПS=2.1 (П T=2.0, N=20) N=1 N=9 N=10 N=4 N=3 N=13
259

Figure 11.23 Roles of various personnel in the planning process (continued) No Very great No Very great influence influence influence influence Ownership aspects Size aspects 1 2 3 4 5 1 2 3 4 5 Corporate planning department: Format of corporate plan •_______•________•________•________• •_______•________•________•_______• (П T=3.6, N=7) ПLO=3.6 ПL=3.5 ПM=4.0 ПS=3.5 N=7 N=2 N=2 N=3 Assumptions used in the final corporate •_______•________•________•________• •_______•________•________•_______• Plan (П T=3.5, N=7) ПLO=3.5 ПL=3.5 ПM=3.5 ПS=3.5 N=7 N=2 N=2 N=3 Objectives embodied in the final corporate •_______•________•________•________• •_______•________•________•_______• plan (П T=3.7, N=7) ПLO=3.7 ПL=3.5 ПM=3.5 ПS=4.0 N=7 N=2 N=2 N=3 Strategies embodied in the final corporate •_______•________•________•________• •_______•________•________•_______• plan (П T=3.5, N=7) ПLO=3.5 ПL=3.5 ПM=3.5 ПS=3.5 N=7 N=2 N=2 N=3 Approval of the final corporate plan •_______•________•________•________• •_______•________•________•_______• (П T=3.0, N=7) ПLO=3.0 ПL=3.0 ПM=3.5 ПS=2.5 N=7 N=2 N=2 N=3 Development of missions for second •_______•________•________•________• •_______•________•________•_______• level units ПLO=3.0 ПL=3.0 ПM=3.0 ПS=3.0 (П T=3.0, N=7) N=7 N=2 N=2 N=3 Top second level line managers: Format of corporate plan •_______•________•________•________• •_______•________•________•_______• (П T=2.8, N=20) ПG=2.0 ПLO=2.9 ПF=2.8 ПL=2.7 ПM=3.3 ПS=2.7 N=1 N=9 N=10 N=4 N=3 N=13 Assumptions used in the final corporate •_______•________•________•________• •_______•________•________•_______• plan (П T=2.8, N=20) ПG=2.0 ПLO=3.0 ПF=2.8 ПL=3.0 ПM=3.0 ПS=2.8 N=1 N=9 N=10 N=4 N=3 N=13 Objectives embodied in the final corporate •_______•________•________•________• •_______•________•________•_______• plan (П T=2.7, N=20) ПG=2.0 ПLO=2.8 ПF=2.7 ПL=2.5 ПM=3.0 ПS=2.7 N=1 N=9 N=10 N=4 N=3 N=13 ** * Strategies embodied in the final corporate •_______•________•________•________• •_______•________•________•_______• plan (П T=2.7, N=20) ПG=1.0 ПLO=2.9 ПF=2.7 ПL=2.2 ПM=3.0 ПS=2.8 N=1 N=9 N=10 N=4 N=3 N=13 Approval of the final corporate plan •_______•________•________•________• •_______•________•________•_______• (П T=1.9, N=20) ПG=1.0 ПLO=2.0 ПF=1.9 ПL=1.7 ПM=2.3 ПS=1.9 N=1 N=9 N=10 N=4 N=3 N=13 Development of missions for second •_______•________•________•________• •_______•________•________•_______• level units ПG=2.0 ПLO=3.7 ПF=3.4 ПL=3.2 ПM=3.7 ПS=3.5 (П T=3.4, N=20) N=1 N=9 N=10 N=4 N=3 N=13 Note that: *=p<0.05, **=p<.01, ***=p<0.001
Government Local Foreign Large Medium Small
260

11.12 Major problems of current planning process
Only two banks reported experiencing problems specifically as a result of using their
current planning systems and those two banks include one government owned bank and
one foreign owned bank. The major problems they experienced were lack of
participative decision making processes and lack of strategic thinking at the top level.
Both banks believed that their planning system needs to be changed in order to deal
with the problems they experienced and these banks think their planning process should
be an on-going process and there should be a system to discuss the changes.
11.13 Expected changes in the strategic management approach
Table 11.15 summarises the banks expected changes in their strategic management
approach in the next five years. 8 banks mentioned that they will continue with
participatory decision making process for strategic planning while 8 banks expect no
change during the next five years. 7 of the 20 banks were expected to develop strategic
thinking capabilities in all levels of their banks in the next five years. It was found that
applying participatory techniques and methods in planning process was associated with
ownership aspects and was an expected change in one government owned bank and two
foreign owned banks.
Table 11.15 Banks expected changes in the strategic management approaches in the next five years
Total Ownership aspects Size aspects Expected change N % G % LO % F % C Sig L % M % S % C Sig
Apply participating techniques and methods in planning process
3 15.0 1 100 - - 2 20.0 .610 * 1 25.0 - - 2 15.4 .206 n.s
We expect no changes during the next five years
8 40.0 - - 3 33.3 5 50.0 .250 n.s 1 25.0 1 33.3 6 46.2 .178 n.s
Possibility of hiring a private company to consult
1 5.0 - - - - 1 10.0 .229 n.s - - - - 1 7.7 .168 n.s
261

Table 11.15 Banks expected changes in the strategic management approaches in the next five years (continued)
Total Ownership aspects Size aspects Expected change N % G % LO % F % C Sig L % M % S % C Sig
Develop strategic thinking capabilities in all levels of the bank
7 35.0 - - 5 55.6 2 20.0 .400 n.s 2 50.0 2 66.7 3 23.1 .356 n.s
Continue the participatory decision making process for strategic planning
8 40.0 - - 6 66.7 2 20.0 .500 n.s 2 50.0 1 33.3 5 38.5 .108 n.s
Concern more on cost efficiency within the bank
2 10.0 - - 2 22.2 - - .369 n.s 1 25.0 - - 1 7.7 .266 n.s
11.14 Importance of informal planning
Informal planning with respect to strategic management was believed to be important
with no statistically significant differences either by ownership or size aspects (see
figure 11.24).
Figure 11.24 Importance of informal planning
Not Very Not Very
important important important important Ownership aspects Size aspects ПT=3.6, N=20 ПT=3.6, N=20
1 2 3 4 5 1 2 3 4 5 •_______•________•________•_______• •_______•________•________•_______• ПG=4.0 ПLO=3.9 ПF=3.3 ПL=4.0 ПM=4.3 ПS=3.3 N=1 N=9 N=10 N=4 N=3 N=13 Government Local Foreign Large Medium Small
262

11.15 Planning effectiveness
Figure 11.25 shows the effectiveness of the banks planning process. It was found that
government owned banks had the lowest level of planning effectiveness compared with
locally and foreign owned banks. Results also found there were significant differences
by the ownership aspects but, not by the size aspects.
Figure 11.25: Planning effectiveness of the banks Not Very Not Very
important important important important Ownership aspects Size aspects ПT=3.8, N=20 ПT=3.6, N=20
1 2 3 4 5 1 2 3 4 5 ПG=3.0 ПLO=4.0 ПF=3.7 ПL=3.7 ПM=4.0 ПS=3.8
•_______•________•________•_______• * •_______•________•________•_______•
N=1 N=9 N=10 N=4 N=3 N=13
Note that: *=p<0.05, **=p<.01, ***=p<0.001 Government Local Foreign Large Medium Small
11.16 Contribution of formal planning Overall, banks formal planning process made a reasonably high contribution to their
strategic management process (see figure 11.26). There were no significant differences
found in the contribution of formal planning either by size or ownership aspects.
Figure 11.26 contribution of formal planing No Major No Major
contribution contribution contribution contribution Ownership aspects Size aspects ПT=4.0, N=20 ПT=4.0, N=20
1 2 3 4 5 1 2 3 4 5 •_______•________•________•_______• •_______•________•________•_______•
ПG=4.0 ПLO=4.1 ПF=3.9 ПL=4.0 ПM=3.7 ПS=4.1 N=1 N=9 N=10 N=4 N=3 N=13 Government Local Foreign Large Medium Small
263

11.17 The extent that the banks strategically managed
Figure 11.27 shows to what extent the banks were strategically managed. It was found
that overall, banks were strategically managed to a high extent with no significant
differences either by size or ownership aspects.
Figure 11.27 The extent that the banks strategically managed
Not Very Not Very
important important important important Ownership aspects Size aspects ПT=3.9, N=20 ПT=3.9, N=20
1 2 3 4 5 1 2 3 4 5 •_______•________•________•_______• •_______•________•________•_______•
ПG=4.0 ПLO=3.9 ПF=4.0 ПL=4.0 ПM=4.0 ПS=3.9 N=1 N=9 N=10 N=4 N=3 N=13 Government Local Foreign Large Medium Small
11.18 Chapter summary
Except for one government owned bank all the other banks reported having a
formalized strategic planning system at their corporate level. It was found that only 4
banks had a formalized strategic planning system at their second level and these four
banks included one government and three locally owned banks. It was also found that in
18 of the 20 banks the longer term plan was prepared first and the shorter term plan then
fitted into long term plan.
Most of the banks corporate plans were updated yearly and they reviewed the progress
of corporate plans monthly or quarterly. Overall, most banks corporate planning efforts
were spent on action planning or operational planning for the next 1-3 years followed
by short term emergency planning and formalized contingency planning. It was also
found that overall, banks did not think about what the bank wants to be in the next 10-
20 years.
264

The areas most banks purchased external forecasts were laws and regulations for
financial services sector and technology. The areas where forecasts were most
transmitted from corporate level to second level were domestic economy, technological,
laws and regulations for financial services, and human resources. Banks overall, felt that
there would not be a severe impact on their quality of corporate planning, second level
planning, and other lower levels planning efforts if the external forecasts purchased by
corporate planning were not available.
Goals and objectives, corporate strategies, deposit mobilization, implementation and
monitoring, and feedback were all included in the banks corporate long range plans. It
was found that ownership aspects were more associated with the major headings in the
banks corporate plans than the size aspects. 15 of the 20 banks senior management only
had the access to their corporate plan and only in 4 banks personnel in the second level
and up had access to their corporate plan. Financial, and sources and uses of funds had
the highest added values in corporate plans over the banks second level plans. It was
also found that banks did not have an extensive use of computer models/systems for
their corporate planning. 18 of the 20 banks used forecasting and financial models and
strategic decision support systems for their corporate planning but, reported these
models and systems were not used extensively.
Only 7 locally owned banks reported having a corporate planning department in their
banks and the rotation of the line personnel in corporate planning departments was low.
It was found that the chief corporate planner was more likely to attend capital budgeting
meetings than divisional planning meetings and group planning meetings. It was also
found that corporate planning department had the authority to obtain substantive
revisions, to obtain procedural revisions, and to review and criticize second level plans
to a reasonably high extent.
The major headings of most of the 4 banks that had second level long term plans were
environmental analysis, business strategies, forecasts and budgets, revenue targets, time
frames for assessment, and volume targets for products and services. All the banks
grouped their second level units for planning, the same way they were grouped for
operations. The annual budget for the second level units was integrated to a reasonably
high extent with the long term plans of these units. It was also found that computer
265

models/systems were used for second level planning to some extent but, not to a high
extent.
Only two locally owned banks reported having long term plans at the third level and
these two banks included one large and one medium sized bank. None of the banks had
a long term plan at their fourth level.
It was found that 9 banks had contingency planning only for corporate level and 11
banks had contingency planning both for the corporate and second level. There were
significant differences found in the specific planning task by ownership aspects and to
prepare specific studies was greater in government bank than the locally and foreign
owned banks. Overall, banks planning process plays an important role in strategically
managing banks organizational structure, sequence future activities, and have
measurable positive effect on sales and profits. Banks also think the planning process is
a device to assure that conflicting expectations are resolved. It was also found that
locally and foreign owned banks think the planning process is a means for
systematically dealing with uncertainty to a greater extent than the government bank.
While the government bank strongly agreed to the statement that their planning effort is
an adaptive, evolving, learning activity other locally and foreign owned banks agreed to
a high extent. Overall, banks put effort into identifying possible impacts of the
economy, the sources of funds, the customer demands, technological developments,
competitors cost structure, and the impacts of the government on banks operations
respectively. It was also found that banks competitive analysis, supplier analysis,
economic analysis, and political analysis were major activities of corporate level
management, customer analysis was a major activity of marketing people and corporate
level management, and technology analysis was a major activity of operations people.
The banks corporate planning was coordinated with financial planning to a great extent.
It was also found that their finance, operations, marketing, and human resource
departments provide very high quality information for their corporate planning.
Furthermore, Banks were not getting any great deal of resistance from their finance,
operations, marketing, and human resource departments for their corporate planning.
266

CEO/GM’s were involved to a great extent in the development of corporate goals,
missions, objectives, alternative corporate strategies, and evaluation and approval of the
corporate plans, and having planning as a philosophy in the bank. The involvement of
the board of directors in the corporate planning process in foreign banks was low
compared to government and locally owned banks. Furthermore, the board of directors
in the government bank were more supportive than the board of directors in locally
owned and foreign owned banks.
It was found that chief executive officer had the greatest influence on the format of
corporate plan, assumption used in the final corporate plan, objectives embodied in the
final corporate plan, approval of the final corporate plan, and development of missions
for second level units while corporate planning department had a reasonably high
influence and the outside board of directors had less influence. It was also found that
top second level line managers had a reasonably high influence only for development of
missions for second level units.
The banks expected major changes in their strategic management process and these
were to continue the participatory decision making process for strategic planning, and to
develop strategic thinking capabilities in all levels of the banks. Eight banks were not
expecting to introduce any changes to their strategic management process in the next
five years.
Informal planning with respect to strategic management was believed to be important.
Similarly, it was found that government owned banks had the lowest level of planning
effectiveness compared to locally and foreign owned banks. It was also found that
overall, formal planning process made a reasonably high contribution to their strategic
management process. Finally, the responses of the banks confirmed that the banks felt
they were strategically managed to a great extent.
The next chapter will analyse the strategic thinking capabilities of the banks.
267

Chapter 12 Strategic thinking capabilities 12.1 Introduction This chapter will analyse the strategic thinking capabilities of the banks in terms of
employee participation and their risk taking behaviours, system perspective, strategic
intent, thinking in time, and intelligent opportunism. The significant differences either
by size or ownership aspects will be highlighted. Then the sample companies will be
categorized under three major categories such as strong strategic thinkers, moderate
strategic thinkers, and the weak strategic thinkers to identify which companies had the
highest level of strategic thinking.
12.2 Employee participation and risk taking behaviour
Figure 12.1 shows to what extent employees participate in the strategy making process
and also their risk taking behaviours. Overall, banks agreed with the statement that
strategy is made on an iterative basis, involving managers, staff and executives in an on
going dialogue to a reasonably high extent. Overall, the banks employees were not
willing to take risks. The major reason for that may be that banking operations are more
structured than other company’s operations and therefore, employees do not have an
environment in which to experiment. However medium sized banks encouraged their
employees more to do experiments than the other banks and similarly, locally owned
banks encouraged their employees more to do experiments than the government and
foreign owned banks. Furthermore, in locally owned banks their employees had more
input into decisions that affect them than the foreign owned and government owned
banks.
268

Figure 12.1 Employee’s participation and their risk taking behaviour Disagree Strongly Disagree Strongly agree agree Ownership aspects Size aspects 1 2 3 4 5 1 2 3 4 5 Strategy is made on an iterative •_____•______•______•_____• •_____•______•______•_____• basis, involving managers staff and ПG=4.5 ПLO=3.7 ПF=3.1 ПL=3.8 ПM=4.0 ПS=3.2 executive in an on-going dialogue N=2 N=9 N=10 N=5 N=3 N=13 (ПT=3.5, N=21) Business planning in our company •_____•______•______•_____• •_____•______•______•_____• is ongoing, involving everyone in the ПG=3.0 ПLO=3.4 ПF=3.2 ПL=3.2 ПM=3.7 ПS=3.2 process to some degree N=2 N=9 N=10 N=5 N=3 N=13 (ПT=3.3, N=21) Most people in this company have •_____•______•______•_____• •_____•______•______•_____• * input into decisions that affect them ПG=2.5 ПLO=3.3 ПF=3.1 ПL=2.8 ПM=4.0 ПS=3.1 (ПT=3.1, N=21) N=2 N=9 N=10 N=5 N=3 N=13 Our company continually adopts its •_____•______•______•_____• ** •_____•______•______•_____• strategy based upon feedback from the ПG=3.0 ПLO=4.0 ПF=3.5 ПL=3.6 ПM=4.0 ПS=3.6 market (ПT=3.7, N=21) N=2 N=9 N=10 N=5 N=3 N=13 Most people in this organization are •_____•______•______•_____• •_____•______•______•_____• willing to take risks (ПT=2.4,N=21) ПG=2.5 ПLO=2.4 ПF=2.3 ПL=2.2 ПM=3.3 ПS=2.2 N=2 N=9 N=10 N=5 N=3 N=13 People are encouraged to experiment in •_____•______•______•_____• •_____•______•______•_____• this company so as to identify new, more ПG=2.5 ПLO=3.1 ПF=2.6 ПL=2.6 ПM=3.3 ПS=2.8 innovative approaches or products N=2 N=9 N=10 N=5 N=3 N=13 (ПT=2.9 N=21) Employees in this company understand what •_____•______•______•_____• * •_____•______•______•_____• needs to be accomplished in order for the ПG=3.5 ПLO=4.0 ПF=3.2 ПL=3.8 ПM=4.0 ПS=3.2 organization to survive and prosper N=2 N=9 N=10 N=5 N=3 N=13 (ПT=3.6 N=21) Government Local Foreign Large Medium Small 12. 3 Systems perspective Figure 12.2 shows the relationship of the interdependencies included in the banks value
creation process. Banks overall, reasonably agreed with all the statements that were
identified in figure 12.2. Banks think strategically about which of these competing
networks of suppliers we join and how we position ourselves within this ecosystem to a
high extent and that was seen in a locally owned banks to a greater extent. It was found
that medium sized banks and locally owned banks reported the strategic thinking
capabilities in systems perspectives than other banks. Government banks overall did not
clarify each individual about the effects of their behaviour in the whole system and also
not appreciate the inter relationships among the internal pieces in their organizations
like locally owned and foreign owned banks and these were significant differences by
ownership aspects.
269

Figure 12.2 The relationship of the interdependencies included in the banks value creation process Disagree Strongly Disagree Strongly agree agree
Ownership aspects Size aspects 1 2 3 4 5 1 2 3 4 5
We view our company not as a member •_____•______•______•_____• * •_____•______•______•_____• of a single industry but as part of a business ПG=3.5 ПLO=4.1 ПF=2.9 ПL=4.0 ПM=4.0 ПS=3.2 system that crosses a variety of industries N=2 N=9 N=10 N=5 N=3 N=13 (ПT=3.5, N=21) We co-evolve capabilities around a new •_____•______•______•_____• ** •_____•______•______•_____• innovation and work co-operatively and ПG=3.5 ПLO=3.9 ПF=2.6 ПL=3.8 ПM=4.0 ПS=2.8 competitively to support new products N=2 N=9 N=10 N=5 N=3 N=13 (ПT=3.2, N=21) Our company think strategically about which •_____•______•______•_____• * •_____•______•______•_____• of these competing networks of suppliers we ПG=3.5 ПLO=4.1 ПF=3.3 ПL=4.0 ПM=4.0 ПS=3.5 join and how we position ourselves within N=2 N=9 N=10 N=5 N=3 N=13 this ecosystem (ПT=3.7, N=21) Our company knows the importance of fit •_____•______•______•_____• •_____•______•______•_____• between corporate, business, functional, and ПG=3.0 ПLO=3.9 ПF=3.4 ПL=3.4 ПM=4.0 ПS=3.5 the personal level which may be the most N=2 N=9 N=10 N=5 N=3 N=13 critical of all levels (ПT=3.6, N=21) Our company also appreciate the •_____•______•______•_____• •_____•______•______•_____• inter-relationships among the internal pieces that, ПG=2.5 ПLO=3.8 ПF=3.2 ПL=3.2 ПM=4.0 ПS=3.4 taken together, comprise the whole N=2 N=9 N=10 N=5 N=3 N=13 (ПT=3.4, N=21) Our company clarifies each individual about the •_____•______•______•_____• ** •_____•______•______•_____• effects of their behaviour on other parts of the ПG=2.5 ПLO=3.9 ПF=3.3 ПL=3.4 ПM=3.7 ПS=3.5 whole system and its final outcome N=2 N=9 N=10 N=5 N=3 N=13 (ПT=3.5, N=21) Government Local Foreign Large Medium Small 12.4 Strategic intent
Figure 12.3 displays to what extent the banks adopted the concept of strategic intent. It
was found that overall; banks did not focus on their strategic intent to a high degree.
However, government banks focused organization’s attention on the essence of winning
the intent, and motivating people by communicating the value of the intent more than
the locally and foreign owned banks and these were significant differences. It was also
found that small banks had the lowest level of focus on strategic intent than the large
and medium sized banks and therefore, there were significant differences found in all
the elements identified in the figure 12.3 by size aspects.
270

Figure 12.3 strategic intent Disagree Strongly Disagree Strongly
agree agree Ownership aspects Size aspects
1 2 3 4 5 1 2 3 4 5 Our company has a long term corporate dream •_____•______•______•_____• •_____•______•______•_____• * (intent) about the competitive position that our ПG=3.5 ПLO=3.1 ПF=2.5 ПL=3.6 ПM=3.7 ПS=2.4 company hopes to build over the coming decade N=2 N=9 N=10 N=5 N=3 N=13 (ПT=2.9, N=21) Our company is focusing the organization’s •_____•______•______•_____• * •_____•______•______•_____• * attention on the essence of winning the intent ПG=4.0 ПLO=3.0 ПF=2.4 ПL=3.6 ПM=3.3 ПS=2.4 (ПT=2.8, N=21) N=2 N=9 N=10 N=5 N=3 N=13 Our company is motivating people by •_____•______•______•_____• * •_____•______•______•_____• * communicating the value of the intent ПG=3.5 ПLO=2.9 ПF=2.2 ПL=3.2 ПM=3.3 ПS=2.2 (ПT=2.6, N=21) N=2 N=9 N=10 N=5 N=3 N=13 Our company is leaving room for individual •_____•______•______•_____• •_____•______•______•_____• * and team contributions to achieve the intent ПG=2.5 ПLO=2.9 ПF=2.2 ПL=2.8 ПM=3.3 ПS=2.2 (ПT=2.5, N=21) N=2 N=9 N=10 N=5 N=3 N=13 Our company is sustaining enthusiasm by •_____•______•______•_____• •_____•______•______•_____• * providing new operational definitions as ПG=3.0 ПLO=2.9 ПF=2.3 ПL=3.0 ПM=3.3 ПS=2.3 circumstances change N=2 N=9 N=10 N=5 N=3 N=13 (ПT=2.6, N=21) Our company is using intent consistently to •_____•______•______•_____• •_____•______•______•_____• * guide resource allocations ПG=3.5 ПLO=2.8 ПF=2.3 ПL=3.2 ПM=3.3 ПS=2.3 (ПT=2.6, N=21) N=2 N=9 N=10 N=5 N=3 N=13 Government Local Foreign Large Medium Small 12.5 Thinking in time
Figure 12.4 shows to what extent “thinking in time” is important for the banks in their
strategic management. It was found that overall banks agreed with the statement that
strategic thinking, is always thinking in time and it connects past, present and future to a
high extent. However, it was found that locally owned banks considered thinking in
time as a more important factor in their strategic thinking process than the government
and foreign owned banks and therefore, all the statements that identified in the figure
12.4 were associated with the ownership aspects. There were no significant differences
found in by size aspects.
271

Figure 12.4 Banks thinking in time
Disagree Strongly Disagree Strongly agree agree
Ownership aspects Size aspects
1 2 3 4 5 1 2 3 4 5 Strategic thinking, is always “thinking in time” •_____•______•______•_____• ** •_____•______•______•_____• and it connects past, present, and future ПG=3.0 ПLO=4.0 ПF=3.6 ПL=3.6 ПM=4.0 ПS=3.7 (ПT=3.7, N=21) N=2 N=9 N=10 N=5 N=3 N=13 Thinking in time uses an organization’s memory •_____•______•______•_____• * •_____•______•______•_____• to think well about creating its future ПG=3.0 ПLO=4.0 ПF=3.6 ПL=3.6 ПM=4.0 ПS=3.7 (ПT=3.7, N=21) N=2 N=9 N=10 N=5 N=3 N=13 Oscillation between the past, present and, •_____•______•______•_____• •_____•______•______•_____• future is essential for the execution of strategy ПG=3.5 ПLO=4.0 ПF=3.4 ПL=3.8 ПM=4.0 ПS=3.5 as well as its formulation (ПT=3.7, N=21) N=2 N=9 N=10 N=5 N=3 N=13 Our company believes strategic question is not •_____•______•______•_____• * •_____•______•______•_____• only “what does the future that we want”, but ПG=3.5 ПLO=4.0 ПF=3.5 ПL=3.8 ПM=4.0 ПS=3.6 also what must we keep and loose from N=2 N=9 N=10 N=5 N=3 N=13 our past and create in our present to go there (ПT=3.7, N=21) Government Local Foreign Large Medium Small 12.6 Intelligent opportunism
Figure 12.5 reveals the elements of intelligent opportunism in the banks. It was found
that overall; banks did not leave much room for emergent strategies. However, locally
owned banks had more room for their emergent strategies than the government and
locally owned banks and this was a significant difference by ownership aspects.
Similarly, medium sized banks had encouraged more of their lower level employees to
practise alternative strategies better suited for changing environments than the large and
small banks and this was a significant difference by size aspects. It was also found that
employees rely more on their top management foresight and they were not willing to
take risk.
272

Figure 12.5 Intelligent opportunism
Disagree Strongly Disagree Strongly agree agree
Ownership aspects Size aspects
1 2 3 4 5 1 2 3 4 5 Our company always leave room for emerging •_____•______•______•_____• * •_____•______•______•_____• Strategies in addition to intended strategies ПG=3.0 ПLO=3.4 ПF=2.6 ПL=3.2 ПM=3.7 ПS=2.8 (ПT=3.0, N=21) N=2 N=9 N=10 N=5 N=3 N=13 Our company always encourage lower level •_____•______•______•_____• •_____•______•______•_____• * employees to practice alternative strategies better ПG=2.0 ПLO=2.7 ПF=2.5 ПL=2.6 ПM=3.3 ПS=2.3 suited for changing environments N=2 N=9 N=10 N=5 N=3 N=13 (ПT=2.5, N=21) Our employees not rely on top management •_____•______•______•_____• •_____•______•______•_____• foresight and they are willing to take risk ПG=2.5 ПLO=2.2 ПF=2.3 ПL=2.4 ПM=3.0 ПS=2 .1(ПT=2.3, N=21) N=2 N=9 N=10 N=5 N=3 N=13 Government Local Foreign Large Medium Small 12.7 Classification for strategic thinkers
All the banks were categorized as either strong, moderate, or weak strategic thinkers
and table 12.1 shows the classification for strategic thinkers. The average scores of 4 to
5 was categorized as strong strategic thinkers and the average scores of 3 to 3.9 was
categorized as moderate strategic thinkers. Similarly, the average scores below 3 was
categorized as weak strategic thinkers.
Table 12.1: Classification for the strategic thinkers
Size aspects Average Score
Strong strategic thinkers (SST) Between 4 - 5
Moderate strategic thinkers (MST) Between 3 - 3.9
Weak strategic thinkers (WST) Below 3
Table 12.2 displays the categorization of the strategic thinking capabilities of the banks
by ownership and size aspects. It was found that medium sized banks had the highest
averages for all the strategic thinking capabilities that are identified in the table 12.2
compared with the large and small sized banks. However, overall medium and large
273

banks fell in to the category of moderate strategic thinkers. Even though large banks had
higher profits and revenues and also the higher number of employees and branches than
medium sized banks, medium sized banks had a higher level of strategic thinking
capabilities than the large banks. Small banks fell in to the category of weak strategic
thinkers and this was due to their lack of the strategic thinking capabilities such as
strategic intent and intelligent opportunism.
Except for strategic intent locally owned banks reported the highest averages for all the
other elements that are identified in the table 12.2. However, both the locally owned
banks and government banks fell in to the category of moderate strategic thinkers.
Foreign owned banks were weak strategic thinkers and thinking capabilities such as
intelligent opportunism and strategic intent were low for these banks.
Table 12.2 categorized strategic thinking capabilities of size and ownership aspects
Ownership aspects Size aspects Elements of strategic thinking G LO F L M S Employee participation & their risk taking behaviour
3.1 (MST)
3.4 (MST)
3.0 (MST)
3.1 (MST)
3.8 (MST)
3.0 (MST)
System perspective 3.1 (MST)
3.9 (MST)
3.1 (MST)
3.6 (MST)
3.9 (MST)
3.3 (MST)
Strategic intent 3.3 (MST)
2.9 (WST)
2.3 (WST)
3.2 (MST)
3.4 (MST)
2.3 (WST)
Thinking in Time 3.2 (MST)
4.0 (SST)
3.5 (MST)
3.7 (MST)
4.0 (SST)
3.6 (MST)
Intelligent opportunism 2.5 (WST)
2.8 (WST)
2.5 (WST)
2.7 (WST)
3.3 (MST)
2.4 (WST)
Overall 3.0 (MST)
3.4 (MST)
2.8 (WST)
3.3 (MST)
3.7 (MST)
2.9 (WST)
Table 12.3 shows the overall strategic thinking capabilities in terms of ownership and
size aspects. It was found that locally owned banks and government owned banks fell
into the category of moderate strategic thinkers and small sized banks were fell into the
category of weak strategic thinkers. Similarly, medium sized and large banks were
moderate strategic thinkers and foreign owned banks were weak strategic thinkers. No
banks fell into the category of strong strategic thinkers.
274

Table 12.3 Overall strategic thinking capabilities of the banks
Ownership aspects Size aspects Category G LO F L M S
Weak strategic thinkers -
- × - - ×
Moderate strategic thinkers
× × - × × -
Strong strategic thinkers -
- - - - -
Note that: Total (N)=21, G(N)=2, LO(N)=9, F(N)=10, L(N)=5, M(N)=3, S(N)=13 12. 8 Chapter summary
This chapter has discussed the strategic thinking capabilities of the banks in terms of
employee participation and their risk taking behaviours, systems perspective, strategic
intent, thinking in time, and intelligent opportunism.
Overall, banks strategy is made on an iterative basis, involving managers, staff and
executives in an on going dialogue to a reasonably high extent and the banks employees
were not willing to take risks. Medium sized banks encouraged their employees more to
experiment than the other banks and similarly, locally owned banks encouraged their
employees to experiment more than the government and foreign owned banks.
Furthermore, locally owned banks employees had more input into decisions that affect
them than the foreign owned and government owned banks.
Banks considered they were just a part of a business system that crosses a variety of
industries and they think strategically about which of these competing networks of
suppliers they join and how they position within that ecosystem to a reasonable high
extent. Similarly, banks identified to a reasonably high extent the importance of fit
between corporate, business, functional, and personnel levels. Thus, overall, banks had
a reasonably high understanding about the relationship of the interdependencies of their
value creation process.
It was found that, overall banks did not focus much on strategic intent. However,
government banks focused organization’s attention on the essence of winning the intent,
and motivating people by communicating the value of the intent more than the locally
275

and foreign owned banks. Small banks had the least level of focus on their strategic
intent than the large and medium banks.
Overall, banks agreed with the statement that strategic thinking is always thinking in
time and it connects past, present and future to a high extent. However, it was found that
locally owned banks considered thinking in time as a more important factor in their
strategic thinking process than the government and foreign owned banks. Thus, banks
overall had a high understanding about the importance of “thinking in time” in their
strategic management.
It was found that overall, banks did not leave much room for emergent strategies.
However, locally owned banks had more room for their emergent strategies than the
government and foreign owned banks. Similarly, medium sized banks had encouraged
more of their lower level employees to practise alternative strategies better suited for
changing environments than the large and small banks. It was also found that employees
rely more on their top management foresight and they were not willing to take risks.
Thus, the intelligent opportunism of banks lower levels was low.
The results show that medium sized banks had a higher level of strategic thinking
capabilities than the large and small sized banks. However, large and medium sized
banks fell in to the category of moderate strategic thinkers and small sized banks fell in
to the category of weak strategic thinkers. Similarly, locally owned banks had a higher
level of strategic thinking capabilities than the government and foreign owned banks.
Government and locally owned banks were moderate strategic thinkers and foreign
owned banks were weak strategic thinkers. Furthermore, no banks category reported
having strong strategic thinking capabilities.
The next chapter will analyse the analytical tools/techniques, corporate strategies and
the management of quality of the banks.
276

Chapter 13: Analytical tools/ techniques, corporate strategies and the management of quality
13.1 Introduction
This chapter mainly focuses on the analytical tools and techniques which were used in
the strategy development processes, corporate strategies, and the management of quality
of the Sri Lankan commercial banks. Under corporate strategies, the formation of the
corporate strategies and the procedures and processes used for their development by the
commercial banks will be analysed. The major corporate strategies analysed in this
chapter include strategies such as product and market growth, research and
development, international, acquisition, divestiture, merger and turnaround. In addition
to the analyses, the significant differences either by size and ownership aspects will be
highlighted. A summary of the analyses of analytical tools and techniques, corporate
strategies and the management of quality will be provided at the end of the chapter.
13.2 Analytical tools and techniques which influence bank’s strategies
Analytical tools and techniques that influence banks corporate strategies will be
discussed under two categories namely the environment and resource analysis
techniques, and planning techniques.
13.2.1 Environment and resource analysis techniques (over the last five years)
Figure 13.1 shows to what extent the environment and resource analysis techniques
influenced the banks corporate strategies during the last five years. According to the
banks, SWOT analysis had the greatest influence on bank’s corporate strategies over the
last five years followed by five forces and PEST analysis. Results also found that key
success factors, product life cycle, driving forces, product market, portfolio and strategy
analysis also had a reasonable influence on banks corporate strategies. Surprisingly,
277

PEST and five forces analysis did not have a greater influence in government bank’s
corporate strategies.
Figure 13.1 The influence of environment and resource analysis techniques (over the last five years)
No influence Very great No influence Very great Influence Influence
Ownership aspects Size aspects 1 2 3 4 5 1 2 3 4 5 PEST analysis •_______•________•________•________• •_______•________•________•_______• (political, economic, social, technological) ПG=3.0 ПLO=4.2 ПF=4.3 ** ПL=4.2 ПM=4.0 ПS=4.2 * (ПT=4.1, N=21) N=2 N=9 N=10 N=5 N=3 N=13 Five forces analysis •_______•________•________•________• •_______•________•________•_______• (supplier, buyer, competitor, new entrant, ПG=3.0 ПLO=4.3 ПF=4.3 ** ПL=4.2 ПM=4.3 ПS=4.2 substitute) (ПT=4.2, N=21) N=2 N=9 N=10 N=5 N=3 N=13 SWOT analysis •_______•________•________•________• •_______•________•________•_______• (strengths, weaknesses, opportunities, threats) ПG=4.5 ПLO=4.3 ПF=4.4 ПL=4.6 ПM=4.7 ПS=4.2 (ПT=4.4, N=21) N=2 N=9 N=10 N=5 N=3 N=13 Driving forces analysis •_______•________•________•________• •_______•________•________•_______• (ПT=3.5, N=21) ПG=3.0 ПLO=3.8 ПF=3.3 ПL=3.4 ПM=4.0 ПS=3.4 N=2 N=9 N=10 N=5 N=3 N=13 Key success factors •_______•________•________•________• •_______•________•________•_______• (ПT=3.7, N=21) ПG=4.0 ПLO=3.9 ПF=3.5 ПL=4.0 ПM=4.0 ПS=3.5 N=2 N=9 N=10 N=5 N=3 N=13 Product life cycle analysis •_______•________•________•________• •_______•________•________•_______• (ПT=3.6, N=21) ПG=3.0 ПLO=3.9 ПF=3.4 ПL=3.8 ПM=3.7 ПS=3.5 N=2 N=9 N=10 N=5 N=3 N=13 Product market fit analyses •_______•________•________•________• •_______•________•________•_______• (ПT=3.1, N=21) ПG=3.5 ПLO=3.2 ПF=3.0 ПL=3.4 ПM=3.3 ПS=3.0 N=2 N=9 N=10 N=5 N=3 N=13 Portfolio and strategy analysis •_______•________•________•________• •_______•________•________•_______• (ПT=3.0, N=21) ПG=3.5 ПLO=3.2 ПF=2.8 ПL=3.2 ПM=3.7 ПS=2.8 N=2 N=9 N=10 N=5 N=3 N=13 ETOP and SAP analysis •_______•________•________•________• •_______•________•________•_______• (ПT=2.5, N=21) ПG=2.0 ПLO=2.7 ПF=2.4 ПL=2.4 ПM=2.7 ПS=2.5 N=2 N=9 N=10 N=5 N=3 N=13 Note that: *=p < 0.05, **= p<0.01, ***=p<0.001 Government Local Foreign Large Medium Small
13.2.2 Planning techniques (over the last five years)
Figure 13.2 displays to what extent planning techniques influenced the banks strategies
during the last five years. Results found that total quality management had the highest
influence on banks strategies followed by the BCG service portfolio matrix. All the
other planning techniques identified in figure 13.2 were reported as having very little
influence on bank’s corporate strategies. BCG service portfolio matrix, General Electric
278

matrix, and service and market portfolio matrix had a reasonable influence on large
banks corporate strategies but not in the medium and small sized banks. TOWS
technique had a reasonable influence in government owned and locally owned banks but
did not have a reasonable influence in foreign owned banks. Similarly, 7-S framework
had no influence on government banks corporate strategies.
Figure 13.2 The influence of Planning techniques (over the last five years)
No influence Very great No influence Very great Influence Influence
Ownership aspects Size aspects 1 2 3 4 5 1 2 3 4 5 BCG service portfolio matrix •_______•________•________•________• •_______•________•________•_______• (ПT=2.9, N=21) ПG=2.0 ПLO=3.4 ПF=2.6 * ПL=3.2 ПM=2.7 ПS=2.8 N=2 N=9 N=10 N=5 N=3 N=13 General Electric matrix •_______•________•________•________• •_______•________•________•_______• (ПT=2.4, N=21) ПG=2.5 ПLO=2.9 ПF=2.0 ПL=3.2 ПM=2.7 ПS=2.1 * N=2 N=9 N=10 N=5 N=3 N=13 Service and market portfolio matrix •_______•________•________•________• •_______•________•________•_______• (ПT=2.5, N=21) ПG=3.5 ПLO=2.9 ПF=2.0 ПL=3.2 ПM=2.7 ПS=2.2 N=2 N=9 N=10 N=5 N=3 N=13 Grand strategy technique •_______•________•________•________• •_______•________•________•_______• (ПT=2.3, N=21) ПG=2.5 ПLO=2.4 ПF=2.1 ПL=2.4 ПM=2.0 ПS=2.3 N=2 N=9 N=10 N=5 N=3 N=13 TOWS technique •_______•________•________•________• •_______•________•________•_______• (ПT=2.4, N=21) ПG=3.0 ПLO=2.8 ПF=2.0 ** ПL=3.0 ПM=1.7 ПS=2.4 * N=2 N=9 N=10 N=5 N=3 N=13 7-S framework (7S- Mickinsey excellent •_______•________•________•________• •_______•________•________•_______• factors) (ПT=2.1, N=21) ПG=1.0 ПLO=2.3 ПF=2.2 ** ПL=1.8 ПM=2.0 ПS=2.3 N=2 N=9 N=10 N=5 N=3 N=13 PIMS (profit impact of market strategy) •_______•________•________•________• •_______•________•________•_______• (ПT=2.4, N=21) ПG=3.0 ПLO=2.4 ПF=2.3 ПL=2.6 ПM=2.3 ПS=2.4 N=2 N=9 N=10 N=5 N=3 N=13 TQM (total quality management) •_______•________•________•________• •_______•________•________•_______• (ПT=3.6, N=21) ПG=3.5 ПLO=3.7 ПF=3.5 ПL=3.8 ПM=3.7 ПS=3.5 N=2 N=9 N=10 N=5 N=3 N=13 Strategy centre concept (A.D. Little) •_______•________•________•________• •_______•________•________•_______• (ПT=2.1, N=21) ПG=2.0 ПLO=2.1 ПF=2.1 ПL=2.2 ПM=1.7 ПS=2.2 N=2 N=9 N=10 N=5 N=3 N=13 Note that: *=p < 0.05, **= p<0.01, ***=p<0.001 Government Local Foreign Large Medium Small 13.2.3 Environment and resource analysis techniques (over the next five
years) Figure 13.3 shows the expected influence of the environment and resource analysis
techniques on the banks corporate strategies in the next five years. It was found that
279

SWOT, PEST, five forces analysis, and key success factors expected to have a greater
influence on banks corporate strategies in the next five years respectively. Driving
forces, product life cycle, product market fit, portfolio and strategy, ETOP & SAP
analysis are also expected to have a reasonable influence on banks corporate strategies
over the next five years. PEST analysis had a greater influence on large banks corporate
strategies than the medium and small sized banks, similarly SWOT analysis had a
greater influence on medium sized banks than the large and small banks and these all
were significant differences by size aspects. Furthermore, ETOP & SAP analysis had a
greater influence in medium sized banks than the small and large banks and this was a
significant difference by size aspects.
Figure 13.3 The influence of environment and resource analysis techniques (over the next five years)
No influence Very great No influence Very great Influence Influence
Ownership aspects Size aspects 1 2 3 4 5 1 2 3 4 5 PEST analysis •_______•________•________•________• •_______•________•________•_______• (political, economic, social, ПG=4.0 ПLO=4.3 ПF=4.5 ПL=4.6 ПM=4.3 ПS=4.3 * -technological) (ПT=4.4, N=21) N=2 N=9 N=10 N=5 N=3 N=13 Five forces analysis •_______•________•________•________• •_______•________•________•_______• (supplier, buyer, competitor, ПG=4.0 ПLO=4.4 ПF=4.4 ПL=4.6 ПM=4.7 ПS=4.2 - new entrant, substitute) (ПT=4.4, N=21) N=2 N=9 N=10 N=5 N=3 N=13 SWOT analysis •_______•________•________•________• •_______•________•________•_______• (strengths, weaknesses, ПG=4.5 ПLO=4.6 ПF=4.5 ПL=4.8 ПM=5.0 ПS=4.3 * -opportunities, threats)( ПT=4.5, N=21) N=2 N=9 N=10 N=5 N=3 N=13 Driving forces analysis •_______•________•________•________• •_______•________•________•_______• (ПT=3.7, N=21) ПG=3.0 ПLO=3.9 ПF=3.7 ПL=3.8 ПM=3.3 ПS=3.8 N=2 N=9 N=10 N=5 N=3 N=13 Key success factors •_______•________•________•________• •_______•________•________•_______• (ПT=4.0, N=21) ПG=4.5 ПLO=4.1 ПF=3.8 ПL=4.4 ПM=4.0 ПS=3.8 N=2 N=9 N=10 N=5 N=3 N=13 Product life cycle analysis •_______•________•________•________• •_______•________•________•_______• (ПT=3.7, N=21) ПG=3.0 ПLO=3.8 ПF=3.7 ПL=3.6 ПM=3.7 ПS=3.7 N=2 N=9 N=10 N=5 N=3 N=13 Product market fit analyses •_______•________•________•________• •_______•________•________•_______• (ПT=3.2, N=21) ПG=3.5 ПLO=3.2 ПF=3.1 ПL=3.4 ПM=3.3 ПS=3.1 N=2 N=9 N=10 N=5 N=3 N=13 Portfolio and strategy analysis •_______•________•________•________• •_______•________•________•_______• (ПT=3.3, N=21) ПG=3.5 ПLO=3.4 ПF=3.1 ПL=3.4 ПM=4.0 ПS=3.1 N=2 N=9 N=10 N=5 N=3 N=13 ETOP and SAP analysis •_______•________•________•________• •_______•________•________•_______•
ПG=3.0 ПLO=3.4 ПF=2.8 ПL=3.2 ПM=4.0 ПS=2 8 * (ПT=3.1, N=21) . N=2 N=9 N=10 N=5 N=3 N=13
Note that: *=p < 0.05, **= p<0.01, ***=p<0.001 Government Local Foreign Large Medium Small
280

13.2.4 Planning techniques (over the next five years)
Figure 13.4 displays the expected influence of planning techniques on banks corporate
strategies over the next five years. According to the banks, TQM and the BCG portfolio
matrix will be the most influential techniques on banks corporate strategies and all the
other techniques that identified in the figure 13.4 will have low influence on banks
corporate strategies over the next five years. It is worth noting that total quality
management will be adapted by all most all the banks as part of their corporate planning
to a great extent over the next five years. There were no significant differences found in
the planning techniques that influence banks corporate strategies over the next five
years either by ownership or size aspects.
Figure 13.4 The influence of Planning techniques (over the next five years)
No influence Very great No influence Very great Influence Influence
Ownership aspects Size aspects 1 2 3 4 5 1 2 3 4 5 BCG service portfolio matrix •_______•________•________•________• •_______•________•________•_______• (ПT=3.5, N=21) ПG=3.5 ПLO=3.8 ПF=3.3 ПL=3.8 ПM=3.7 ПS=3.4 N=2 N=9 N=10 N=5 N=3 N=13 General Electric matrix •_______•________•________•________• •_______•________•________•_______• (ПT=2.7, N=21) ПG=3.0 ПLO=3.0 ПF=2.4 ПL=3.4 ПM=2.7 ПS=2.5 N=2 N=9 N=10 N=5 N=3 N=13 Service and market portfolio matrix •_______•________•________•________• •_______•________•________•_______• (ПT=2.6, N=21) ПG=3.0 ПLO=2.8 ПF=2.3 ПL=3.0 ПM=2.7 ПS=2.4 N=2 N=9 N=10 N=5 N=3 N=13 Grand strategy technique •_______•________•________•________• •_______•________•________•_______• (ПT=2.4, N=21) ПG=3.0 ПLO=2.4 ПF=2.2 ПL=2.8 ПM=2.0 ПS=2.3 N=2 N=9 N=10 N=5 N=3 N=13 TOWS technique •_______•________•________•________• •_______•________•________•_______• (ПT=2.4, N=21) ПG=2.5 ПLO=2.6 ПF=2.2 ПL=2.6 ПM=2.0 ПS=2.4 N=2 N=9 N=10 N=5 N=3 N=13 7-S framework (7S- Mickinsey excellent •_______•________•________•________• •_______•________•________•_______• factors) (ПT=2.4, N=21) ПG=2.0 ПLO=2.3 ПF=2.5 ПL=2.4 ПM=2.3 ПS=2.4 N=2 N=9 N=10 N=5 N=3 N=13 PIMS (profit impact of market strategy) •_______•________•________•________• •_______•________•________•_______• (ПT=2.4, N=21) ПG=3.0 ПLO=2.4 ПF=2.3 ПL=2.8 ПM=2.3 ПS=2.3 N=2 N=9 N=10 N=5 N=3 N=13 TQM (total quality management) •_______•________•________•________• •_______•________•________•_______• (ПT=4.0, N=21) ПG=3.0 ПLO=4.0 ПF=4.0 ПL=3.6 ПM=4.0 ПS=4.0 N=2 N=9 N=10 N=5 N=3 N=13 Strategy centre concept (A.D. Little) •_______•________•________•________• •_______•________•________•_______• (ПT=2.2, N=21) ПG=2.5 ПLO=2.0 ПF=2.3 ПL=2.4 ПM=2.0 ПS=2.2 N=2 N=9 N=10 N=5 N=3 N=13 Note that: *=p < 0.05, **= p<0.01, ***=p<0.001 Government Local Foreign Large Medium Small
281

13.3 Benchmarking
Figure 13.5 shows the influence of benchmarking on banks corporate strategies over the
last five years and also in the next five years in terms of ownership and size aspects.
Government banks had a higher influence of benchmarking on their corporate strategies
than the locally and foreign owned banks and similarly, large banks reported having a
greater influence than the medium and small sized banks. Results also found that there
were no significant differences in the influence of benchmarking on banks strategies
either by size or ownership aspects. In the next five years there is a slight increase in
overall influence from benchmarking (4.0 vs 3.9).
Figure 13.5 Influence of benchmarking on banks strategies (over the last five- -years)
No Very great No Very great
influence influence influence influence
Ownership aspects Size aspects 1 2 3 4 5 1 2 3 4 5
In the last five years •_____•______•______•_____• •_____•______•______•_____• (ПT=3.9, N=21) ПG=4.0 ПLO=3.8 ПF=3.9 ПL=4.0 ПM=3.7 ПS=3.8
N=2 N=9 N=10 N=5 N=3 N=13 Over the next five years •_____•______•______•_____• •_____•______•______•_____•
(ПT=4.0, N=21) ПG=4.0 ПLO=4.0 ПF=4.0 ПL=4.0 ПM=4.0 ПS=4.0 N=2 N=9 N=10 N=5 N=3 N=13
Government Local Foreign Large Medium Small
13.3.1 Benchmark groups
Figure 13.6 displays to what extent Sri Lankan banks benchmark with other groups.
Three major benchmark groups of the banks were domestic banks in Sri Lanka, foreign
owned banks in Sri Lanka and government owned banks respectively and banks
reported having a lower level of benchmarking with the other groups identified in the
figure 13.6. It was also found that government banks benchmark with each other to a
greater extent than the locally owned and foreign owned banks benchmark with
government banks. Furthermore, government banks benchmark with the groups such as
domestic finance and security, and credit financial companies in Sri Lanka, companies
outside financial service sector in Sri Lanka and overseas to a reasonable level and do
so more than the locally owned and foreign owned banks.
282

Figure 13.6 Benchmark groups and the level of benchmarking
Not at all Significant Not at all Significant Bench marking Bench marking
1 2 3 4 5 1 2 3 4 5
Ownership aspects Size aspects
Domestic banks in Sri Lanka •_______•________•________•________• •_______•________•________•_______• (ПT=4.0, N=21) ПG=4.0 ПLO=4.0 ПF=4.0 ПL=4.0 ПM=4.0 ПS=4.0 N=2 N=9 N=10 N=5 N=3 N=13 Foreign banks in Sri Lanka •_______•________•________•________• •_______•________•________•_______• (ПT=3.5, N=21) ПG=3.5 ПLO=3.2 ПF=3.7 ПL=3.6 ПM=3.7 ПS=3.4 N=2 N=9 N=10 N=5 N=3 N=13 Sri Lankan government banks •_______•________•________•________• •_______•________•________•_______• (ПT=3.0, N=21) ПG=4.5 ПLO=2.7 ПF=2.9 * ПL=3.4 ПM=2.3 ПS=2.9 N=2 N=9 N=10 N=5 N=3 N=13 Domestic finance and security companies in •_______•________•________•________• •_______•________•________•_______• Sri Lanka (ПT=2.1, N=21) ПG=3.0 ПLO=2.0 ПF=2.1 * ПL=2.6 ПM=1.7 ПS=2.1 * N=2 N=9 N=10 N=5 N=3 N=13 Foreign finance and security companies in •_______•________•________•________• •_______•________•________•_______• Sri Lanka ПG=2.5 ПLO=2.0 ПF=2.1 ПL=2.4 ПM=1.7 ПS=2.1 * (ПT=2.1, N=21) N=2 N=9 N=10 N=5 N=3 N=13 Government finance and security companies •_______•________•________•________• •_______•________•________•_______• in Sri Lanka (ПT=2.1, N=21) ПG=2.5 ПLO=2.1 ПF=2.1 ПL=2.4 ПM=2.0 ПS=2.1 * N=2 N=9 N=10 N=5 N=3 N=13 Domestic credit financial companies in Sri Lanka •_______•________•________•________• •_______•________•________•_______• (ПT=2.2, N=21) ПG=3.0 ПLO=2.0 ПF=2.2 ПL=2.4 ПM=2.0 ПS=2.2 N=2 N=9 N=10 N=5 N=3 N=13 Companies outside financial sector in Sri Lanka •_______•________•________•________• •_______•________•________•_______• (ПT=2.1, N=21 ) ПG=3.0 ПLO=1.8 ПF=2.3 * ПL=2.4 ПM=1.7 ПS=2.2 N=2 N=9 N=10 N=5 N=3 N=13 Companies outside financial service sector in •_______•________•________•________• •_______•________•________•_______• overseas (ПT=2.0, N=21) ПG=3.0 ПLO=1.8 ПF=2.1** ПL=2.4 ПM=2.0 ПS=1.9 N=2 N=9 N=10 N=5 N=3 N=13 Note that: *=p < 0.05, **= p<0.01, ***=p<0.001 Government Local Foreign Large Medium Small
13.3.2 Major dimensions of banks benchmark process
Table 13.1 shows the three major dimensions that the banks considered in their
benchmarking process. Most banks reported three major dimensions in their
benchmarking process were Profitability, asset quality, and the NPL. Competitiveness
and market leadership were associated with ownership aspects and were dimensions in a
government owned bank. It was also found that major dimensions such as profitability,
market share and type of client were associated with size aspects.
283

Table 13.1 Three major dimensions of banks benchmarking process
Total Ownership aspects Size aspects Major dimension N % G % LO % F % C Sig L % M % S % C Sig
Profitability 20 95.2 2 100 8 88.9 10 100 .258 n.s 5 100 2 66.7 13 100 .548 *
Productivity 6 28.6 1 50.0 1 11.1 4 40.0 .340 n.s 2 40.0 - - 4 30.8 .272 n.s
Cost/Income 5 23.8 1 50.0 - - 4 40.0 .489 n.s 1 20.0 - - 4 30.8 .251 n.s
Competitiveness 1 4.8 1 50.0 - - - - .689 ** 1 20.0 - - - - .400 n.s
Market leadership
1 4.8 1 50.0 - - - - .689 ** 1 20.0 - - - - .400 n.s
Market share 3 14.3 - - 3 33.3 - - .471 n.s 1 20.0 2 66.7 - - .655 *
Type of Client 1 4.8 - - 1 11.1 - - .258 n.s - - 1 33.3 - - .548 *
Service Quality 3 14.3 - - 2 22.2 1 10.0 .212 n.s 1 20.0 1 33.34 1 7.7 .266 n.s
NPL 7 33.3 - - 4 44.4 3 30.0 .272 n.s 1 20.0 1 33.3 5 38.5 .162 n.s
Deposit mobilizations
3 14.3 - - 2 22.2 1 10.0 .212 n.s 1 20.0 - - 2 15.4 .175 n.s
Asset Quality 9 42.9 - - 3 33.3 6 60.0 .380 n.s 1 20.0 1 33.3 7 53.8 .294 n.s
ROE 4 19 - - 2 22.2 2 20.0 .160 n.s 1 20.0 1 33.3 2 15.4 .156 n.s
Liquidity 1 4.8 - - 1 11.1 - - .258 n.s - - - - 1 7.7 .175 n.s
ROA 1 4.8 - - 1 11.1 - - .258 n.s - - - - 1 7.7 .175 n.s
Note that: *=p < 0.05, **= p<0.01, ***=p<0.001 13.4 Resource allocation decisions When the question was asked about the budgetary distinction between resources
required to maintain current activities and those, which will provide the long term
benefits for the four areas in figure 13.7, it was found that budgetary distinction in
capital expenditure was the most important decision followed by market development,
people development, and research and development respectively. Research and
development expenditures in government banks was reported as having a higher
importance than in the locally and foreign owned banks and similarly, large banks had a
higher importance on research and development expenditures than the medium and
small sized banks. Locally owned banks had a greater budgetary distinction than
government and foreign owned banks for the people development, and government
banks had a greater distinction for the market development expenditures than the locally
and foreign owned banks. There were statistically significant differences found in the
research and development expenditures by ownership aspects but, there were no
statistically significant differences found in the expenditures that were identified in
figure 13.7 by size aspects.
284

Figure 13.7 The importance of the long-term resource allocation decisions
No Very clear No very clear Distinction distinction distinction distinction Ownership aspects Size aspects
1 2 3 4 5 1 2 3 4 5
Capital expenditures •_______•________•________•________• •_______•________•________•_______• (ПT=4.0, N=21) ПG=4.0 ПLO=4.1 ПF=4.0 ПL=4.0 ПM=4.3 ПS=4.0 N=2 N=9 N=10 N=5 N=3 N=13 Research and development expenditures •_______•________•________•________• •_______•________•________•_______• (ПT=2.3, N=21) ПG=3.0 ПLO=2.8 ПF=1.8 ** ПL=2.8 ПM=2.7 ПS=2.0 N=2 N=9 N=10 N=5 N=3 N=13 Market development expenditures •_______•________•________•________• •_______•________•________•_______• (ПT=3.2, N=21) ПG=3.5 ПLO=3.4 ПF=3.0 ПL=3.4 ПM=3.7 ПS=3.1 N=2 N=9 N=10 N=5 N=3 N=13 People development expenditures •_______•________•________•________• •_______•________•________•_______• (ПT=3.0, N=21) ПG=3.0 ПLO=3.3 ПF=2.8 ПL=3.2 ПM=3.7 ПS=2.8 N=2 N=9 N=10 N=5 N=3 N=13 Note that: *=p < 0.05, **= p<0.01, ***=p<0.001 Government Local Foreign Large Medium Small
13.4.1 The importance of criteria in evaluating expenditure proposals
Figure 13.8 shows the importance of criteria in evaluating banks expenditure proposals.
It was found that forecast return on investment, forecast net operating profit, discounted
cash flow analysis were the most important criteria in evaluating expenditure proposals
which are expected to yield banks long-term benefits. Government banks were more
concerned with market share position and forecast market share growth than the locally
and foreign owned banks. Overall, banks were not very much concerned about the short
term cash flow benefits and also the impact on earnings per share. However, locally
owned banks were more concerned with the impact on earnings per share, and short
term cash flow benefits than the government and foreign owned banks. It was also
found that both the track record of the unit requesting funds and the track record of
manager of unit requesting funds were important to banks. There were statistically
significant differences found in the criteria of forecast net operating profit, short term
cash flow benefits, discounted cash flow analysis, present market share position,
forecast market share growth, growth of market for which expenditure is required,
impact on earnings per share, and impact on company resource needs by ownership
aspects.
285

Figure 13.8 The importance of criteria in evaluating expenditure proposals
Not Very Not Very
Important Important Important Important
Ownership aspects Size aspects
1 2 3 4 5 1 2 3 4 5
Financial criteria Forecast return on investment •_______•________•________•________• •_______•________•________•_______• (ПT=4.0, N=21) ПG=4.0 ПLO=4.1 ПF=3.9 ПL=4.2 ПM=4.0 ПS=4.1 N=2 N=9 N=10 N=5 N=3 N=13 Forecast net operating profit •_______•________•________•________• •_______•________•________•_______• (ПT=4.0, N=21) ПG=3.5 ПLO=4.1 ПF=4.0 * ПL=3.8 ПM=4.0 ПS=4.1 N=2 N=9 N=10 N=5 N=3 N=13 Short-term cash flow benefit •_______•________•________•________• •_______•________•________•_______• (ПT=3.6, N=21) ПG=3.0 ПLO=3.7 ПF=3.6 * ПL=3.2 ПM=3.3 ПS=3.8 N=2 N=9 N=10 N=5 N=3 N=13 Discounted cash flow analysis •_______•________•________•________• •_______•________•________•_______• (ПT=4.0, N=21) ПG=2.5 ПLO=4.2 ПF=4.0 ** ПL=3.4 ПM=4.3 ПS=4.1 N=2 N=9 N=10 N=5 N=3 N=13 Market criteria Present market share position •_______•________•________•________• •_______•________•________•_______• (ПT=3.1, N=21) ПG=4.5 ПLO=3.7 ПF=2.4 ** ПL=4.2 ПM=3.3 ПS=2.7 * N=2 N=9 N=10 N=5 N=3 N=13 Forecast market share growth •_______•________•________•________• •_______•________•________•_______• (ПT=3.5, N=21) ПG=4.0 ПLO=3.9 ПF=3.0 ** ПL=3.8 ПM=4.0 ПS=3.2 N=2 N=9 N=10 N=5 N=3 N=13 Growth of market for which expenditure •_______•________•________•________• •_______•________•________•_______• is required (ПT=3.4, N=21) ПG=2.5 ПLO=3.9 ПF=3.2 ** ПL=3.2 ПM=3.7 ПS=3.5 N=2 N=9 N=10 N=5 N=3 N=13 Forecast sales growth •_______•________•________•________• •_______•________•________•_______• (ПT=3.9, N=21) ПG=4.0 ПLO=3.8 ПF=3.9 ПL=3.6 ПM=4.0 ПS=3.9 N=2 N=9 N=10 N=5 N=3 N=13 Personality criteria Track record of unit requesting funds •_______•________•________•________• •_______•________•________•_______• (ПT=3.7, N=21) ПG=3.5 ПLO=3.7 ПF=3.7 ПL=3.6 ПM=3.3 ПS=3.8 N=2 N=9 N=10 N=5 N=3 N=13 Track record of manager of unit requesting •_______•________•________•________• •_______•________•________•_______• funds (ПT=3.5, N=21 ) ПG=.3.0 ПLO=3.6 ПF=3.5 ПL=3.0 ПM=3.3 ПS=3.7 N=2 N=9 N=10 N=5 N=3 N=13 Other criteria Impact on earnings per share •_______•________•________•________• •_______•________•________•_______• (ПT=3.1, N=21) ПG=2.5 ПLO=3.8 ПF=2.7 ** ПL=3.4 ПM=3.3 ПS=3.0 N=2 N=9 N=10 N=5 N=3 N=13 Impact on company resource needs •_______•________•________•________• •_______•________•________•_______• (ПT=3.9, N=21) ПG=3.0 ПLO=4.0 ПF=3.9 ** ПL=3.6 ПM=4.0 ПS=3.9 N=2 N=9 N=10 N=5 N=3 N=13 Note that: *=p < 0.05, **= p<0.01, ***=p<0.001 Government Local Foreign Large Medium Small
286

13.5 Corporate strategies Figure 13.9 displays the extent that the participants formalize their corporate strategies
in terms of size, and ownership. It was found that banks formulate their strategies to a
reasonable extent with no statistically significant differences either by size or ownership
aspects.
Figure 13.9 Formalization of corporate strategies Not at all To a Not at all To a
great great extent extent
Ownership aspects Size aspects 1 2 3 4 5 1 2 3 4 5 To what extent do you formalise •_____•______•______•_____• •_____•______•______•_____• your corporate strategies ПG=3.5 ПF=3.6 ПLO=3.7 ПL=3.4 ПM=4.0 ПS=3.6 (ПT=3.6) N=2 N=10 N=9 N=5 N=3 N=13 Ownership: Cramer’s V=0.195 P=0.808 Size aspects: Cramer’s V=0.409 p=0.134 Government Local Foreign Large Medium Small
Figure 13.10 shows the explicit nature of the Sri Lankan commercial banks corporate
strategies. The most explicit part of the banks corporate strategy was entering in to high
growth markets. The other two most important considerations were to enter or develop
service business and to enter in to the markets where technology is important. Overall,
banks did not want to find markets where joint ventures and mergers were feasible. The
importance of markets where technology is important was associated with the size and
ownership aspects and was seen in locally owned banks and the medium sized banks to
a greater degree. It was also found that entering in to the markets with small number of
competitors and also to exit from markets with large number of competitors were not
explicit for most banks in their corporate strategies.
287

Figure 13.10 The explicit part of banks corporate strategies Disagree Strongly Disagree Strongly agree agree agree agree
Ownership aspects Size aspects 1 2 3 4 5 1 2 3 4 5 To enter high growth markets •_______•________•________•________• •_______•________•________•_______• (ПT=4.0, N=21) ПG=4.0 ПLO=4.0 ПF=3.9 ПL=4.0 ПM=4.0 ПS=3.9 N=2 N=9 N=10 N=5 N=3 N=13 To enter markets with small number of •_______•________•________•________• •_______•________•________•_______• competitors (ПT=2.6, N=21 ) ПG=2.5 ПLO=2.4 ПF=2.8 ПL=2.4 ПM=2.0 ПS=2.8 N=2 N=9 N=10 N=5 N=3 N=13 To enter or develop service business •_______•________•________•________• •_______•________•________•_______• (ПT=3.5, N=21) ПG=3.5 ПLO=3.6 ПF=3.5 ПL=3.6 ПM=3.0 ПS=3.6 N=2 N=9 N=10 N=5 N=3 N=13 Markets where it can attain large shares of •_______•________•________•________• •_______•________•________•_______• served markets (ПT=3.1, N=21) ПG=3.5 ПLO=3.2 ПF=3.0 ПL=3.4 ПM=3.0 ПS=3.1 N=2 N=9 N=10 N=5 N=3 N=13 Markets, which require low capital intensity •_______•________•________•________• •_______•________•________•_______• (ПT=3.0, N=21) ПG=3.0 ПLO=3.1 ПF=2.8 ПL=2.6 ПM=2.3 ПS=3.2 N=2 N=9 N=10 N=5 N=3 N=13 Markets where technology is important •_______•________•________•________• •_______•________•________•_______• (ПT=3.4, N=21) ПG=3.5 ПLO=3.7 ПF=3.1 * ПL=3.6 ПM=4.0 ПS=3.1 * N=2 N=9 N=10 N=5 N=3 N=13 To exit from markets with large numbers •_______•________•________•________• •_______•________•________•_______• of competitors (ПT=2.4, N=21) ПG=3.0 ПLO=2.2 ПF=2.4 ПL=2.6 ПM=2.0 ПS=2.4 N=2 N=9 N=10 N=5 N=3 N=13 Markets where joint ventures are feasible •_______•________•________•________• •_______•________•________•_______• (ПT=2.1, N=21) ПG=2.5 ПLO=2.0 ПF=2.1 ПL=2.4 ПM=2.0 ПS=2.0 N=2 N=9 N=10 N=5 N=3 N=13 Markets where mergers are feasible •_______•________•________•________• •_______•________•________•_______• (ПT=2.0, N=21) ПG=2.0 ПLO=2.0 ПF=2.1 ПL=2.2 ПM=2.0 ПS=2.0
N=2 N=9 N=10 N=5 N=3 N=13
Note that: *=p < 0.05, **= p<0.01, ***=p<0.001 Government Local Foreign Large Medium Small
13.5.1 Product/market growth strategies Figure 13.11 reveals the banks product/market growth strategies for the last and next
five years. During last five years overall, banks seek growth mainly through introducing
existing products in to existing markets and introducing existing products in to new
markets. This finding suggests that there are still available opportunities and good rate
of returns in existing markets in Sri Lanka. However, it was found that medium sized
banks mainly seek their growth by introducing new products in to existing markets and
also introducing new products in to new markets. Small banks seek their growth mainly
by introducing existing products in to existing markets and to the new markets.
Government owned banks seek their growth mainly by introducing existing products in
288

to new markets and new products in to new markets. Introducing new products in to
new markets was associated with the size aspects and was more important in medium
and large banks than the small sized banks.
In the next five years Sri Lankan banks will mainly seek their growth through
introducing new products in to existing markets and also by introducing new products
into new markets. Government banks will try to introduce new products in to new
markets more than the foreign and locally owned banks. There were significant
differences found in the introducing new products into new markets by size aspects and
that it was more important for small and medium sized banks than the large banks. Figure 13.11 Product/market growth strategies Not at all Very Not at all Very important important important important
Ownership aspects Size aspects 1 2 3 4 5 1 2 3 4 5
Our company seeks growth through: (Over the last five years) Existing products in existing markets (a) •_______•________•________•________• •_______•________•________•_______• (ПT=3.6, N=21) ПG=3.5 ПLO=3.7 ПF=3.5 ПL=3.6 ПM=3.0 ПS=3.7 N=2 N=9 N=10 N=5 N=3 N=13 Introducing existing products into new markets (b) •_______•________•________•________• •_______•________•________•_______• (ПT=3.6, N=21) ПG=4.0 ПLO=3.7 ПF=3.4 ПL=3.8 ПM=3.0 ПS=3.6 N=2 N=9 N=10 N=5 N=3 N=13 Introducing new products into existing markets (c) •_______•________•________•________• •_______•________•________•_______• (ПT=3.2, N=21) ПG=3.5 ПLO=3.2 ПF=3.2 ПL=3.6 ПM=4.0 ПS=2.9 N=2 N=9 N=10 N=5 N=3 N=13 Introducing new products into new markets (d) •_______•________•________•________• •_______•________•________•_______• (ПT=3.1, N=21) ПG=4.0 ПLO=3.1 ПF=2.9 ПL=3.8 ПM=4.0 ПS=2.6 * N=2 N=9 N=10 N=5 N=3 N=13 Our company seeks growth through: (For the next five years) Existing products in existing markets (a) •_______•________•________•________• •_______•________•________•_______• (ПT=3.1, N=21) ПG=2.5 ПLO=3.3 ПF=3.1 ПL=2.8 ПM=2.7 ПS=3.4 N=2 N=9 N=10 N=5 N=3 N=13 Introducing existing products into new markets (b) •_______•________•________•________• •_______•________•________•_______• (ПT=3.2, N=21) ПG=4.0 ПLO=3.1 ПF=3.2 ПL=3.4 ПM=3.0 ПS=3.2 N=2 N=9 N=10 N=5 N=3 N=13 Introducing new products into existing markets (c) •_______•________•________•________• •_______•________•________•_______• (ПT=3.8, N=21) ПG=3.5 ПLO=3.8 ПF=3.9 ПL=3.8 ПM=3.7 ПS=3.8 N=2 N=9 N=10 N=5 N=3 N=13 Introducing new products into new markets (d) •_______•________•________•________• •_______•________•________•_______• (ПT=3.7, N=21) ПG=4.0 ПLO=3.8 ПF=3.6 ПL=4.0 ПM=4.3 ПS=4.5 *
N=2 N=9 N=10 N=5 N=3 N=13 Note that: *=p < 0.05, **= p<0.01, ***=p<0.001 Government Local Foreign Large Medium Small
289

13.5.1.1 Company’s strategies concerning new products and service introductions Figure 13.12 displays the banks strategies concerning new products and service
introductions. Banks responses confirm that overall, banks preferred to be an entrant
into mature, stable markets and also a later entrant into still growing markets. However,
government banks preferred to be first to market with new products and services and an
early follower of initial entrants in fast growing new markets while foreign and locally
owned banks preferred to be a later entrant in established but still growing markets and
an entrant in mature stable markets. When considering the size aspects, large banks
preferred to be first to market with new products and services and an early follower of
initial entrants in fast growing markets where as small banks preferred to be later
entrants in established but still growing markets. It was found that no banks wanted to
enter into declining markets. There were significant differences found in the banks
strategic concerns about new products and service introductions both by size and
ownership aspects.
Figure 13.12 Company’s strategies concerning new products and service introductions Disagree Strongly Disagree Strongly agree agree
Ownership aspects Size aspects 1 2 3 4 5 1 2 3 4 5 Our company attempts to be: First to market with new products and services •_______•________•________•________• •_______•________•________•_______• (ПT=2.9, N=21) ПG=4.0 ПLO=2.9 ПF=2.6 ПL=3.8 ПM=3.3 ПS=2.4*** N=2 N=9 N=10 N=5 N=3 N=13 An early follower of initial entrants in fast •_______•________•________•________• •_______•________•________•_______•
growing new markets (ПT=3.0, N=21) ПG=4.0 ПLO=2.8 ПF=2.9 ПL=3.2 ПM=2.0 ПS=3.1 N=2 N=9 N=10 N=5 N=3 N=13 A later entrant in established but still growing •_______•________•________•________• •_______•________•________•_______• markets (ПT=3.6, N=21) ПG=2.5 ПLO=3.7 ПF=3.8 ПL=2.8 ПM=3.0 ПS=4.1 * N=2 N=9 N=10 N=5 N=3 N=13 An entrant in mature, stable markets •_______•________•________•________• •_______•________•________•_______• (ПT=3.6, N=21) ПG=2.0 ПLO=3.9 ПF=3.7 *** ПL=3.0 ПM=4.0 ПS=3.8 N=2 N=9 N=10 N=5 N=3 N=13 An entrant in declining markets •_______•________•________•________• •_______•________•________•_______• (ПT=1.9, N=21) ПG=1.5 ПLO=1.9 ПF=2.0 ПL=1.8 ПM=1.7 ПS=2.0 N=2 N=9 N=10 N=5 N=3 N=13 At the cutting edge of technological innovation •_______•________•________•________• •_______•________•________•_______• (ПT=3.0, N=21) ПG=3.5 ПLO=3.0 ПF=2.8 * ПL=3.2 ПM=3.0 ПS=2.8
N=2 N=9 N=10 N=5 N=3 N=13
Note that: *=p < 0.05, **= p<0.01, ***=p<0.001 Government Local Foreign Large Medium Small
290

13.5.1.2 Organizational responsibility for new products and markets
Figure 13.13 shows the organizational responsibility for new products and markets.
Banks overall, agree with the comment that new product development was part of the
responsibility of their second level operating units. In addition to the new product
development, the responses confirmed that screening of new product ideas,
development of new markets for existing products, and screening of new market ideas
were part of the responsibility of their second level operating units rather than the
responsibility of special organizational units. In government banks screening of new
product ideas, development of new markets for existing products, and screening of new
market ideas were the responsibility of a special organizational unit to a higher extent
than the locally owned and foreign owned banks and these were significant differences.
Figure 13.13 Organizational responsibility for new products and markets Disagree Strongly Disagree strongly agree agree
Ownership aspects Size aspects 1 2 3 4 5 1 2 3 4 5 New product development is: Part of the responsibility of our second level •_______•________•________•________• •_______•________•________•_______• operating units (ПT=3.1, N=21 ) ПG=3.0 ПLO=3.0 ПF=3.2 ПL=3.0 ПM=3.0 ПS=3.2 N=2 N=9 N=10 N=5 N=3 N=13 The responsibility of a special organizational unit •_______•________•________•________• •_______•________•________•_______• (ПT=2.5, N=21) ПG=3.5 ПLO=2.8 ПF=2.1 ПL=3.0 ПM=3.0 ПS=3.2 N=2 N=9 N=10 N=5 N=3 N=13 Screening of new product ideas is: Part of the responsibility of our second level •_______•________•________•________• •_______•________•________•_______• operating units (ПT=3.2, N=21 ) ПG=4.0 ПLO=3.1 ПF=3.2 ПL=3.8 ПM=2.7 ПS=3.2 N=2 N=9 N=10 N=5 N=3 N=13 The responsibility of a special organizational unit •_______•________•________•________• •_______•________•________•_______• (ПT=2.5, N=21) ПG=3.5 ПLO=2.7 ПF=2.2 * ПL=2.6 ПM=3.3 ПS=2.3 N=2 N=9 N=10 N=5 N=3 N=13 Development of new markets for existing products is: Part of the responsibility of our second level •_______•________•________•________• •_______•________•________•_______• operating units (ПT=3.0, N=21) ПG=4.0 ПLO=2.9 ПF=3.0 ПL=3.8 ПM=2.7 ПS=2.8 * N=2 N=9 N=10 N=5 N=3 N=13 The responsibility of a special organizational unit •_______•________•________•________• •_______•________•________•_______• (ПT=2.6, N=21) ПG=3.5 ПLO=2.9 ПF=2.2 **ПL=3.0 ПM=3.3 ПS=2.3 N=2 N=9 N=10 N=5 N=3 N=13 Screening of new market ideas is: part of the responsibility of our second level •_______•________•________•________• •_______•________•________•_______• operating units (ПT=3.0, N=21) ПG=3.0 ПLO=3.0 ПF=3.0 ПL=3.4 ПM=2.7 ПS=2.9 N=2 N=9 N=10 N=5 N=3 N=13 the responsibility of a special organizational unit •_______•________•________•________• •_______•________•________•_______• (ПT=2.7, N=21) ПG=4.5 ПLO=2.8 ПF=2.2 * ПL=3.2 ПM=3.3 ПS=2.3 N=2 N=9 N=10 N=5 N=3 N=13 Note that: *=p < 0.05, **= p<0.01, ***=p<0.001 Government Local Foreign Large Medium Small
291

13.5.2 Research and development strategies
Figure 13.14 explains the reasons for banks research and development strategies. When
the question was asked about the research and development strategies (R & D) except
for one foreign owned bank all the other foreign owned banks mentioned that they were
not involved with the research and development strategies in their corporate planning
for their Sri Lankan branches. Therefore, only 12 banks responded to the research and
development questions.
The most important aspects of the research and development strategies were to be
highly service innovative, technologically innovative and to avoid high risk activities
respectively. It was also found that the emphasis of banks R & D expenditures was not
highly applied. Large and medium sized banks wanted to be more technology
innovative through their R & D strategies than the small banks. Similarly, locally and
foreign owned banks wanted more to avoid the high risks of their activities through R&
D activities than the government owned banks. There were statistically significant
differences in the R & D strategies by size aspects but, not by the ownership aspects.
Figure 13.14 Research and development strategies Disagree Strongly Disagree Strongly agree agree Ownership aspects Size aspects 1 2 3 4 5 1 2 3 4 5
Our company considers itself to be •_______•________•________•________• •_______•________•________•_______• highly technology innovative (ПT=3.6, N=12) ПG=4.0 ПLO=3.4 ПF=4.0 ПL=3.8 ПM=4.0 ПS=3.2 * N=2 N=9 N=1 N=5 N=2 N=5 Our company considers itself to be •_______•________•________•________• •_______•________•________•_______• highly service innovative (ПT=3.9, N=12) ПG=3.5 ПLO=4.0 ПF=4.0 ПL=3.8 ПM=4.5 ПS=3.8 N=2 N=9 N=1 N=5 N=2 N=5 The emphasis of our R& D expenditures is •_______•________•________•________• •_______•________•________•_______• highly applied (ПT=2.0, N=12) ПG=2.0 ПLO=1.9 ПF=3.0 ПL=2.0 ПM=2.0 ПS=2.0 N=2 N=9 N=1 N=5 N=2 N=5 Our R & D effort tends to avoid high risk activity •_______•________•________•________• •_______•________•________•_______• (ПT=3.6, N=12) ПG=2.5 ПLO=3.8 ПF=4.0 ПL=3.2 ПM=4.0 ПS=3.8 N=2 N=9 N=1 N=5 N=2 N=5 Our company prefers to seek growth via •_______•________•________•________• •_______•________•________•_______• acquisitions rather than internal R & D ПG=3.0 ПLO=2.0 ПF=2.0 ПL=2.6 ПM=2.5 ПS=1.6 (ПT=2.2, N=12) N=2 N=9 N=1 N=5 N=2 N=5 Note that: *=p < 0.05, **= p<0.01, ***=p<0.001 Government Local Foreign Large Medium Small
292

13.5.2.1 Support staff for R& D strategies Table 13.2 reveals the support staff for R & D strategies. According to the respondents,
internal and both the internal and external staff supported the R& D strategies in 2 and
10 banks respectively. All the locally owned banks R & D activities were supported by
both the internal and external staff and in one government bank R & D activities were
supported only by their internal staff. Results also found that there were significant
differences in the support staff for the R & D strategies by ownership aspects but, not by
size aspects.
Table 13.2 Supporting staff of R& D strategies
Total Ownership aspects Size aspects Supporting staff N % G % LO % F % L % M % S % Internal staff 2 16.7 1 50.0 - - 1 100 1 20.0 - - 1 20.0 Both internal and external staff
10 83.3 1 50.0 9 100 - - 4 80.0 2 100 4 80.0
Ownership: Cramer’s V=.837 P=.015, Size: Cramer’s V=.200 P=.787
When information was requested about the percentages of corporate revenues allocated
to R & D activities, only 7 banks were in a position to give the figures and it was found
that 1.42% of the total corporate revenue was allocated to R & D activities in those 7
banks. It was also found that none of the banks allocated more than 2% of their total
corporate revenues to their R & D activities. Table 13.3 shows the percentage of R & D
allocations to new products and services and to new processes. Results found that 51%
of the R & D allocations were going to develop new products and services, and the
other 49% was going to develop new processes. There were no statistically significant
differences found in the R & D allocations to the above mentioned two areas either by
size or ownership. It was also found that 25% of the R & D budget was expended on the
development of new information technology in the above mentioned 7 commercial
banks with no statistically significant differences either by size or ownership aspects.
293

Table 13.3 Percentage of revenue allocations
Ownership aspects Size aspects Total G LO F L M S
Revenue allocation
% N % N % N % N % N % N % N New products and services
51.0 7 55.0 2 50.0 4 50.0 1 51.0 5 50.0 1 50.0 1
New processes
49.0 7 45.0 2 51.0 4 50.0 1 49.0 5 50.0 1 50.0 1
Size aspects: Cramer’s V=0.283 P=0.891 Ownership aspects: Cramer’s V=0.500 P=0.478 13.5.3 International strategies Among the 11 locally owned and government owned banks, 8 banks reported having
international operations and information about the banks which had international
operations is shown in the table 13.4. All the government owned banks and 6 of the 9
locally owned banks had international operations and similarly, all the large banks, one
medium sized bank and 2 small banks reported having international operation in their
banks. The banks which did not have international operations mentioned that they do
not want to start international operations in their banks in the next five years. It was also
found that there were no significant differences in the banks which had international
operations either by size or ownership aspects.
Table 13.4 Does your company have international operations?
Total Ownership aspects Size aspects Response N % G % LO % F % L % M % S %
Yes 8 72.7 2 100 6 66.7 - - 5 100 1 50.0 2 50.0 No 3 27.3 - - 3 33.3 - - - - 1 50.0 2 50.0
Ownership: Cramer’s V=.289 P=.338, Size: Cramer’s V=.559 P=.179
Table 13.5 reveals the average sales revenues which take place outside Sri Lanka. It was
found that 13.8% of average revenues of the 8 banks which had international operations
took place outside Sri Lanka with no statistically significant differences either by size or
ownership aspects. For the next five years banks expect that 18.7% of their total
revenues will come from outside Sri Lanka. Therefore, banks expect more revenues
from outside markets in the next five years. It was also found that there were no
294

significant differences in the revenues which will take place outside Sri Lanka in the
next five years either by size or ownership aspects.
Table 13.5: Bank’s revenues take place outside Sri Lanka
Ownership aspects Size aspects Total G LO F L M S
Revenue outside Sri Lanka % N % N % N % N % N % N % N
At present 13.8 8 12.5 2 14.2 6 - - 11.0 5 20.0 1 17.5 2
In the next five years
18.7 8 17.5 2 19.1 6 - - 16.0 5 25.0 1 22.5 2
At present: Ownership: Cramer’s V=0.428 P=0.733 Size: Cramer’s V=0.661 P=0.409 In the next five years: Ownership: Cramer’s V=1.000 P=0.221 Size: Cramer’s V=0.901 P=0.329
Table 13.6 displays the bank’s three major types of overseas revenues. Trade services,
imports, treasury related transactions, exports and remittance were the most reported
major business types for the banks overseas revenues respectively. It is worth noting
that most of the large banks overseas revenues came from the trade services.
Table 13.6 Three major business types of overseas revenues
Total Ownership aspects Size aspects Business type N % G % LO % F % C Sig L % M % S % C Sig
Trade services
5 62.5 1 50.0 4 66.7 - - .149 n.s 4 80.0 - - 1 50.0 .554 n.s
Banking 1 12.5 1 50.0 - - - - .655 n.s 1 20.0 - - - - .293 n.s
Treasury related transaction
2 25.0 - - 2 33.3 - - .333 n.s 1 20.0 - - 1 50.0 .635 n.s
Imports 3 37.5 - - 3 50.0 - - .447 n.s 1 20.0 1 100 1 50.0 .554 n.s
NRFC 1 12.5 1 50.0 - - - - .655 n.s 1 20.0 - - - - .293 n.s
Exports 2 25.0 - - 2 33.3 - - .333 n.s - - 1 100 1 50.0 .816 n.s
Travel 1 12.5 1 50.0 - - - - .655 n.s 1 20.0 - - - - .293 n.s
Investments 1 12.5 - - 1 16.7 - - .218 n.s - - - - 1 50.0 .655 n.s
Dealings 1 12.5 - - 1 16.7 - - .218 n.s - - 1 100 - - 1.00 *
Remittance 2 25.0 - - 2 33.3 - - .333 n.s - - - - 2 100 1.00 -
Note that: Total (N)=8, *=p < 0.05, **= p<0.01, ***=p<0.001
Japan, India, and Europe were reported as the three most important overseas markets for
the Sri Lankan banks during last five years (see table 13.7). All the government owned
banks considered UK as one of their major overseas market and 5 of the 6 locally
owned banks considered Europe as their most important major markets and these were
295

significant differences by ownership aspects. Most of the locally owned banks
considered their most important overseas markets were Japan, India, and Europe.
Table 13.7 Three most important overseas markets of the banks (Over the last five years)
Total Ownership aspects Size aspects Overseas market N % G % LO % F % C Sig L % M % S % C Sig
Japan 6 75.0 1 50.0 5 83.3 - - .333 n.s 3 60.0 1 100 2 100 .447 n.s
UK 2 25.0 2 100 - - - - 1.00 ** 2 40.0 - - - - .477 n.s
India 6 75.0 1 50.0 5 83.3 - - .333 n.s 3 60.0 1 100 2 100 .447 n.s
USA 1 12.5 - - 1 16.7 - - .218 n.s 1 20.0 - - - - .293 n.s
Middle East 2 25.0 1 50.0 1 16.7 - - .333 n.s 2 40.0 - - - - .447 n.s
Maldives 1 12.5 1 50.0 - - - - .655 n.s 1 20.0 - - - - .293 n.s
Europe 5 62.5 - - 5 83.3 - - .745 * 3 60.0 1 100 1 50.0 .306 n.s
China 1 12.5 - - 1 16.7 - - .218 n.s - - - - 1 50.0 .655 n.s
Note that: *=p < 0.05, **= p<0.01, ***=p<0.001
Table 13.8 reveals the major reasons why overseas markets were chosen. The
established business and transactions was the main reason for the all banks. Six banks
mentioned attractive rate of return as a reason to choose overseas markets and reasons
such as larges economies in the globe, and growing economies were reported by one
bank each. There were no significant differences in the reasons to choose overseas
markets either by size or ownership aspects.
Table 13.8 Major reasons overseas markets were chosen
Total Ownership aspects Size aspects Major reason N % G % LO % F % C Sig L % M % S % C Sig
Established business and transactions
8 100 2 100 6 100 - - n.a n.a 5 100 1 100 2 100 n.a n.a
Attractive rate of returns
6 75.0 1 50.0 5 83.3 - - .333 n.s 3 60.0 1 100 2 100 .447 n.s
Larges economies in the globe
1 12.5 - - 1 16.7 - - .218 n.s - - - - 1 50.0 .655 n.s
Growing economies
1 12.5 - - 1 16.7 - - .218 n.s - - - - 1 50.0 .655 n.s
296

Table 13.9 shows the three major overseas markets expected for the next five years.
According to the respondents, India, China and Middle East will be the three major
overseas markets for a high number of commercial banks in Sri Lanka. The high
earning potential in the world’s most growing markets such as India and China may be
the reason why they chose to consider them as the major overseas markets in the next
five years. Surprisingly, only one bank expected Japan as their major market in the next
five years given that this was a major market for 75% of the banks during the last five
years. There were no significant differences found in the future overseas markets either
by size, or ownership aspects.
Table 13.9 Three most important overseas markets of the banks (Over the next five years)
Total Ownership aspects Size aspects Overseas market N % G % LO % F % C Sig L % M % S % C Sig
US 1 12.5 1 50.0 - - - - .655 n.s 1 20.0 - - - - .293 n.s
India 8 100 2 100 6 100 - - n.a n.a 5 100 1 100 2 100 n.a n.a
China 5 62.5 1 50.0 4 66.7 - - .149 n.s 3 60.0 - - 2 100 .600 n.s
Middle East 4 50.0 - - 4 66.7 - - .577 n.s 2 40.0 1 100 1 50.0 .387 n.s
Europe 2 25.0 - - 2 33.3 -- - .333 n.s 1 50.0 1 100 - - .683 n.s
Pakistan 2 25.0 1 50.0 1 16.7 - - .333 n.s 2 40.0 - - - - .447 n.s
Japan 1 12.5 - - 1 16.7 - .218 n.s - - - - 1 50.0 .655 n.s
UK 1 12.5 1 50.0 - - - - .655 n.s 1 20.0 - - - - .293 n.s
For the international operations of the above 8 banks, it was found that in all the banks
the international division head reported to the banks CEO about their international
operations. Figure 13.15 shows the global orientation and the international strategies of
the Sri Lankan commercial banks. It was found that, overall, Sri Lankan commercial
banks corporate planning; second level planning, procurement strategies, and marketing
strategies were not conducted or developed on a world wide basis. Banks preferred to
introduce new products and services to the overseas markets after they had done so in
Sri Lanka. It was also found that banks overall seek foreign markets in which they can
market existing products and technologies, and also joint ventures in overseas
operations. There were no significant differences found in the international strategies
and the global orientation of the banks either by ownership or size aspects.
297

Figure 13.15 Global orientation and the international strategies
Disagree Strongly Disagree Strongly agree agree Ownership aspects Size aspects
1 2 3 4 5 1 2 3 4 5 Global orientation: Our corporate planning is conducted on a •_______•________•________•________• •_______•________•________•_______• worldwide basis (ПT=1.5, N=8) ПG=2.0 ПLO=1.3 ПL=1.6 ПM=2.0 ПS=1.0 N=2 N=6 N=5 N=1 N=2 Our second level planning is conducted •_______•________•________•________• •_______•________•________•_______• on a worldwide basis (ПT=1.5, N=8) ПG=2.0 ПLO=1.3 ПL=1.6 ПM=2.0 ПS=1.0 N=2 N=6 N=5 N=1 N=2 Our procurement strategies are developed •_______•________•________•________• •_______•________•________•_______• on a worldwide basis (ПT=1.6, N=8) ПG=2.0 ПLO=2.5 ПL=2.6 ПM=3.0 ПS=1.5 N=2 N=6 N=5 N=1 N=2 Our investment strategies are developed •_______•________•________•________• •_______•________•________•_______• On a worldwide basis (ПT=2.4, N=8) ПG=3.0 ПLO=1.5 ПL=2.0 ПM=2.0 ПS=1.5 N=2 N=6 N=5 N=1 N=2 Our marketing strategies are developed on •_______•________•________•________• •_______•________•________•_______• a worldwide basis (ПT=1.9, N=8) ПG=2.0 ПLO=1.3 ПL=1.6 ПM=2.0 ПS=1.0 N=2 N=6 N=5 N=1 N=2 International strategies: We introduce new products in overseas •_______•________•________•________• •_______•________•________•_______• markets after we have done so in Sri Lanka ПG=2.5 ПLO=3.3 ПL=1.6 ПM=2.0 ПS=1.0 (ПT=3.1, N=8) N=2 N=6 N=5 N=1 N=2 We seek foreign markets in which we can •_______•________•________•________• •_______•________•________•_______• market existing products and technologies ПG=3.5 ПLO=3.2 ПL=3.4 ПM=3.0 ПS=3.0 (ПT=3.2, N=8) N=2 N=6 N=5 N=1 N=2 We develop new products and technologies •_______•________•________•________• •_______•________•________•_______• especially for overseas markets (ПT=1.9, N=8) ПG=1.5 ПLO=2.0 ПL=1.8 ПM=2.0 ПS=2.0 N=2 N=6 N=5 N=1 N=2 We actively seek joint ventures in •_______•________•________•________• •_______•________•________•_______• overseas operations (ПT=3.0, N=8) ПG=3.5 ПLO=2.8 ПL=3.2 ПM=3.0 ПS=2.5 N=2 N=6 N=5 N=1 N=2 We actively seek mergers in •_______•________•________•________• •_______•________•________•_______• overseas operations ПG=2.5 ПLO=2.2 ПL=2.4 ПM=2.0 ПS=2.0 (ПT=2.2, N=8) N=2 N=6 N=5 N=1 N=2
Government Local Foreign Large Medium Small 13.5.4 Acquisition strategies When the question was asked about the significant acquisitions made by the banks
during last five years, the responses confirmed that only four banks had made
significant acquisitions during last five years (note: this study did not focus on the
acquisitions made by the foreign banks outside the Sri Lankan markets). The details of
298

the banks which made acquisitions during last five years are shown in the table 13.10.
These four banks include 3 locally owned banks and one foreign owned bank.
Table 13.10 Did your bank make any significant acquisitions during last five year?
Total Ownership aspects Size aspects Response N % G % LO % F % L % M % S %
Yes 4 19.0 - - 3 33.3 1 10.0 1 20.0 1 33.3 2 15.4 No 17 81.0 2 100 6 66.7 9 90.0 4 80.0 2 66.7 11 84.6
Ownership: Cramer’s V=.323 P=.334, Size: Cramer’s V=.156 P=.774
It was found that all of those acquisitions were within the Sri Lankan markets. It was
found that the large bank’s acquired revenues which were 100% from the products in
decline stage and the medium size bank’s acquired revenues which were 100% from the
products in maturity stage while two small sized banks 100% revenues were from the
products in growth and introductory stages each. Figure 13.16 displays the acquisition
strategies of the above mentioned four banks. To develop new business lines and to
expand in to new markets with a new configuration of business lines were the banks
major acquisition strategies during last five years. However, the foreign owned bank’s
major strategies were to extend their core business activities and to develop a new
configuration of business lines through acquisitions.
Figure 13.16 Acquisition strategies Disagree Strongly Disagree Strongly agree agree Ownership aspects Size aspects
1 2 3 4 5 1 2 3 4 5 Our company intends to extend its core •_______•________•________•________• •_______•________•________•_______• business activities (ПT=3.0, N=4) ПLO=2.7 ПF=4.0 ПL=3.0 ПM=3.0 ПS=3.0 N=3 N=1 N=1 N=1 N=2 Our company intends to develop a new •_______•________•________•________• •_______•________•________•_______• configuration of business lines (ПT=3.5, N=4) ПLO=3.3 ПF=4.0 ПL=3.0 ПM=4.0 ПS=3.5 N=3 N=1 N=1 N=1 N=2 Our company intends to expand into •_______•________•________•________• •_______•________•________•_______• new markets with our existing businesses ПLO=2.3 ПF=3.0 ПL=2.0 ПM=3.0 ПS=2.5 (ПT=2.5, N=4) N=3 N=1 N=1 N=1 N=2 Our company intends to expand into new markets •_______•________•________•________• •_______•________•________•_______• with a new configuration of business lines ПLO=3.0 ПF=3.0 ПL=3.0 ПM=3.0 ПS=3.0 (ПT=3.0, N=4) N=3 N=1 N=1 N=1 N=2 Government Local Foreign Large Medium Small
299

Figure 13.17 shows to what extent acquisitions are expected to play a role in banks
corporate planning over the next five years. Overall, banks were not expecting
acquisitions to play a significant role in their corporate strategies in the next five years.
However, Acquisitions will play a greater role in medium sized banks than the small
and large banks, and similarly, government owned banks also expecting acquisitions to
play a slightly greater role in their banks over the locally and foreign owned banks.
There were significant differences found in the acquisition strategies of the banks over
the next five years by size aspects but, not by ownership aspects.
Figure 13.17 Acquisition strategies (next five years) No role Significant No role Significant role role
Ownership aspects Size aspects
1 2 3 4 5 1 2 3 4 5
The role of acquisitions in •_____•______•______•_____• •_____•______•______•_____• * corporate strategies over the ПG=3.0 ПLO=2.8 ПF=2.7 ПL=2.8 ПM=4.0 ПS=2.5 next five years (ПT=2.8, N=21) N=2 N=9 N=10 N=5 N=3 N=13 Note that: *=p < 0.05, **= p<0.01, ***=p<0.001 Government Local Foreign Large Medium Small 13.5.5 Divestiture strategies Four of the twenty one banks have divested, liquidated or eliminated important
operations during last five years and these banks are shown in the table 13.11. These
four banks include one government, two locally owned and one foreign owned banks.
Table 13.11 Banks which divested, liquated or eliminated any important operations
Total Ownership aspects Size aspects Response N % G % LO % F % L % M % S %
Yes 4 19.0 1 50.0 2 22.2 1 10.0 1 20.0 1 33.3 2 15.4 No 17 81.0 1 50.0 7 77.8 9 90.0 4 80.0 2 66.7 11 84.6
Ownership: Cramer’s V=0.295 P=.400, Size: Cramer’s V=.156 P=.774
300

The government bank divested 3 important operations in overseas markets while the
other two locally owned banks divested 1 and 4 of their important operations in Sri
Lankan markets. The only foreign bank that divested had divested 2 of their important
operations. According to the four banks which divested mentioned that all the
divestitures revenues were in the maturity and declining stages. One locally owned and
one government banks divested revenues which were 100% in the maturity stage and
the other locally and foreign owned bank had divested revenues which were 100% in
the decline stage. Figure 13.18 reveals the major reasons for divestiture strategies for
the banks which divested their important operations during last five years. Overall,
major reasons for divestitures strategies of the banks were to refocus their business
portfolio on their core businesses and to dispose/retrench unprofitable lines of
businesses. However, the government bank’s major reason was to meet corporate
liquidity requirements.
Figure 13.18 Major reasons for divestitures strategies
Disagree Strongly Disagree Strongly agree agree Ownership aspects Size aspects
1 2 3 4 5 1 2 3 4 5 Our company intends to: Refocus the business portfolio on its •_______•________•________•________• •_______•________•________•_______• core businesses (ПT=4.0, N=4) ПG=4.0 ПLO=4.0 ПF=4.0 ПL=4.0 ПM=4.0 ПS=4.0 N=1 N=2 N=1 N=1 N=1 N=2 Dispose/ retrench unprofitable lines of business •_______•________•________•________• •_______•________•________•_______• (ПT=4.0, N=4) ПG=4.0 ПLO=4.0 ПF=4.0 ПL=4.0 ПM=4.0 ПS=4.0 N=1 N=2 N=1 N=1 N=1 N=2 Eliminate production inefficiency •_______•________•________•________• •_______•________•________•_______• (ПT=2.5, N=4) ПG=1.0 ПLO=3.5 ПF=2.0 ПL=1.0 ПM=4.0 ПS=2.5 N=1 N=2 N=1 N=1 N=1 N=2 Eliminate business peripheral to our firm’s •_______•________•________•________• •_______•________•________•_______• strategy (ПT=2.0, N=4) ПG=1.0 ПLO=3.0 ПF=1.0 ПL=1.0 ПM=4.0 ПS=1.5 N=1 N=2 N=1 N=1 N=1 N=2 Withdraw from geographic area •_______•________•________•________• •_______•________•________•_______• (ПT=1.7, N=4) ПG=4.0 ПLO=1.0 ПF=1.0 ПL=4.0 ПM=1.0 ПS=1.0 N=1 N=2 N=1 N=1 N=1 N=2 Meet corporate liquidity requirements •_______•________•________•________• •_______•________•________•_______• (ПT=2.0, N=4) ПG=5.0 ПLO=1.0 ПF=1.0 ПL=5.0 ПM=1.0 ПS=1.0 N=1 N=2 N=1 N=1 N=1 N=2 Finance new acquisitions •_______•________•________•________• •_______•________•________•_______• (ПT=1.0, N=4) ПG=1.0 ПLO=1.0 ПF=1.0 ПL=1.0 ПM=1.0 ПS=1.0 N=1 N=2 N=1 N=1 N=1 N=2 Raise money quickly •_______•________•________•________• •_______•________•________•_______• (ПT=1.5, N=4) ПG=1.0 ПLO=2.0 ПF=1.0 ПL=1.0 ПM=3.0 ПS=1.0 N=1 N=2 N=1 N=1 N=1 N=2 Government Local Foreign Large Medium Small
301

Figure 13.19 shows the extent those divestiture strategies are expected to play a role in
banks corporate strategies in the next five years. Overall, banks expect that divestiture
strategies will not play a major role in their corporate strategies and therefore, most of
the banks will continue their current operations for the next five years. Government
banks reported a higher role for divestiture strategies in their corporate strategies
compared to locally and foreign owned banks but, it was not statistically significant.
Figure 13.19 Future roles of divestiture strategies No role Significant No role Significant
role role
Ownership aspects Size aspects 1 2 3 4 5 1 2 3 4 5 The role of divestitures in •_____•______•______•_____• •_____•______•______•_____• corporate strategies over the ПG=3.0 ПLO=1.8 ПF=2.5 ПL=2.2 ПM=1.7 ПS=2.4 next five years(ПT=2.2, N=21) N=2 N=9 N=10 N=5 N=3 N=13 Government Local Foreign Large Medium Small
13.5.6 Merger strategies
Table 13.12 shows the banks which had merged with other companies during last five
years. Only three banks reported having mergers with no significant differences either
by size or ownership aspects. Only four significant individual mergers were made by
these three banks and all of these mergers were made with Sri Lankan companies in Sri
Lanka. These four mergers include two mergers by one locally owned small sized bank
and one merger each by the other two locally owned banks.
Table 13.12 Banks which merge with other companies
Total Ownership aspects Size aspects Response N % G % LO % F % L % M % S %
Yes 3 14.3 - - 3 33.3 - - - - 1 33.3 2 15.4No 18 85.7 2 100 6 66.7 10 100 5 100 2 66.7 11 84.6 Ownership: Cramer’s V=.471 P=.097, Size: Cramer’s V=.287 P=.420
The main objectives banks tried to achieve through their mergers were to extend the
banks core business activities and to develop new configuration of business lines (see
302

figure 13.20). However, for one medium sized bank to meet the central bank’s
minimum capital requirements was a major aim.
Figure 13.20 Major aims of mergers
Disagree Strongly Disagree Strongly agree agree Ownership aspects Size aspects
1 2 3 4 5 1 2 3 4 5 Our company intends to:
Extend its core business activities •_______•________•________•________• •_______•________•________•_______• (ПT=4.0, N=3) ПLO=4.0 ПM=4.0 ПS=4.0 N=3 N=1 N=2 Develop a new configuration of business lines •_______•________•________•________• •_______•________•________•_______• (ПT=4.0, N=3) ПLO=4.0 ПM=5.0 ПS=3.5 N=3 N=1 N=2 Expand into new markets with our existing •_______•________•________•________• •_______•________•________•_______• businesses (ПT=2.7, N=3) ПLO=2.7 ПM=3.0 ПS=2.5 N=3 N=1 N=2 Expand into new markets with a new •_______•________•________•________• •_______•________•________•_______• configuration of ПLO=3.0 ПM=3.0 ПS=3.0 business lines (ПT=3.0, N=3) N=3 N=1 N=2 Meet the minimum capital requirement policy •_______•________•________•________• •_______•________•________•_______• of the Sri Lankan government ПLO=3.3 ПM=4.0 ПS=3.0 (ПT=3.3, N=3) N=3 N=1 N=2 Solve the non-performing loans problem •_______•________•________•________• •_______•________•________•_______• Others (please specify) (ПT=1.3, N=3) ПLO=1.3 ПM=1.0 ПS=1.5 N=3
N=1 N=2
Government Local Foreign Large Medium Small
Figure 13.21 displays to what extent mergers will play a role in the banks corporate
strategies in the next five years. Overall, mergers will not play a major role in banks
corporate strategies in the next five years but, in locally owned banks mergers will play
a greater role in their corporate strategies than for foreign and government owned banks.
Similarly, large banks reported a greater role for the mergers than the medium and small
sized banks. It was also found that there were no significant differences in the role of
mergers in banks corporate strategies either by size or ownership aspects.
303

Figure 13.21 Future roles of merger strategies
No role Significant No role Significant role role
Ownership aspects Size aspects
1 2 3 4 5 1 2 3 4 5 The role of mergers in •_____•______•______•_____• •_____•______•______•_____• corporate strategies over the ПG=2.0 ПLO=2.4 ПF=2.2 ПL=2.4 ПM=2.0 ПS=2.3 next five years (ПT=2.3, N=21) N=2 N=9 N=10 N=5 N=3 N=13
Government Local Foreign Large Medium Small 13.5.7 Turnaround strategies Nine of the twenty one banks made significant turnarounds in the last five years and the
details of the banks which made turnaround are shown in the table 13.13. The 9 banks
which made turnarounds included 1 government, 5 locally owned and 3 foreign owned
banks and it was found that there were no significant differences in the banks which
made turnarounds either by size or ownership aspects.
Table 13.13 Has your company made any significant turnarounds in the last five years?
Total Ownership aspects Size aspects Response N % G % LO % F % L % M % S %
Yes 9 42.9 1 50.0 5 55.6 3 30.0 2 40.0 - - 7 53.8No 12 57.1 1 50.0 4 44.4 7 70.0 3 60.0 3 100 6 46.2 Ownership: Cramer’s V=.250 P=.520, Size: Cramer’s V=.372 P=.234
The banks major objective for their turnaround strategies was to restore money losing
businesses to profitability rather than to divest (see figure 13.22). It was found that one
government owned bank sought to strengthen management and culture, two locally
owned banks sought to pursue merger and acquisitions and one locally owned bank
wanted to be more careful in their lending. No significant differences were found in the
turnarounds either by size or ownership aspects.
304

Figure 13.22 Turnaround strategies Disagree Strongly Disagree Strongly agree agree Ownership aspects Size aspects
1 2 3 4 5 1 2 3 4 5 Our company intends to: Pursue merger strategies instead of acquisition •_______•________•________•________• •_______•________•________•_______• strategies (ПT=1.7, N=9) ПG=1.0 ПLO=1.8 ПF=1.7 ПL=1.5 ПS=1.7 N=1 N=5 N=3 N=2 N=7 Pursue joint venture strategies instead of •_______•________•________•________• •_______•________•________•_______• acquisition Strategies (ПT=1.7, N=9) ПG=1.0 ПLO=1.8 ПF=1.7 ПL=1.5 ПS=1.7 N=1 N=5 N=3 N=2 N=7 Restore money-losing business to profitability •_______•________•________•________• •_______•________•________•_______• rather than divest (ПT=3.3, N=9) ПG=3.0 ПLO=3.0 ПF=4.0 ПL=3.5 ПS=3.3 N=1 N=5 N=3 N=2 N=7 Strengthen management and culture •_______•________•________•________• •_______•________•________•_______• (ПT=4.0, N=1) ПG=4.0 ПL=4.0 N=1 N=1 Merger and acquisition •_______•________•________•________• •_______•________•________•_______• (ПT=4.0, N=2) ПLO=4.0 ПS=4.0 N=2 N=2 Be careful in lending •_______•________•________•________• •_______•________•________•_______• (ПT=4.0, N=1) ПLO=4.0 ПS=4.0 N=1 N=1 Government Local Foreign Large Medium Small
Figure 13.23 reveals to what extent turnaround strategies will play a role in banks
corporate strategies over the next five years. It was found that turnaround strategies will
play a reasonable role in banks corporate strategies with no statistically significant
differences either by size or ownership aspects.
Figure 13.23 Future roles of turnaround strategies
No role Significant No role Significant
role role
Ownership aspects Size aspects
1 2 3 4 5 1 2 3 4 5 The role of turnarounds in •_____•______•______•_____• •_____•______•______•_____• corporate strategies over the ПG=3.5 ПLO=3.1 ПF=2.9 ПL=3.0 ПM=2.3 ПS=3.2 (ПT=3.0, N=21) N=2 N=9 N=10 N=5 N=3 N=13
Government Local Foreign Large Medium Small
305

13.6 Management of quality
Figure 13.24 shows how important the management of quality was for the banks during
the last five years and in the next five years. It was found that management of quality
was considered significant to a great extent during last five years with no significant
differences either by size or ownership aspects. It was also found that management of
quality was expected to be more significant for the banks in the next five years than the
last five years (4.0 Vs 4.3).
Figure 13.24 The importance of management of quality
No role Significant No role Significant role role
Ownership aspects Size aspects
1 2 3 4 5 1 2 3 4 5 During last five years •_____•______•______•_____• •_____•______•______•_____• (ПT=4.0, N=21) ПG=4.0 ПLO=4.0 ПF=4.0 ПL=3.8 ПM=4.3 ПS=4.0 N=2 N=9 N=10 N=5 N=3 N=13
During next five years _____•______•______•_____• •_____•______•______•_____• •(ПT=4.3, N=21) ПG=4.5 ПLO=4.2 ПF=4.4 ПL=4.2 ПM=4.7 ПS=4.3 N=2 N=9 N=10 N=5 N=3 N=13 Government Local Foreign Large Medium Small Figure 13.25 shows the extent that the management of quality was addressed as a
strategic issue in the banks. Responses confirmed overall, the banks considered
management of quality as a strategic issue to a reasonably great extent with no
statistically significant differences either by size or ownership aspects.
Figure 13.25 The extent that the management of quality addressed as a strategic issue Not at all To a Not at all To a great great extent extent Ownership aspects Size aspects 1 2 3 4 5 1 2 3 4 5 •_____•______•______•_____• •_____•______•______•_____• ПG=4.0 ПLO=3.6 ПF=3.7 ПL=3.6 ПM=4.0 ПS=3.6 N=2 N=9 N=10 N=5 N=3 N=13 Note that: ПT=3.7 N=21 Government Local Foreign Large Medium Small
306

13.6.1 Strategic approaches towards the quality in banks
Table 13.14 reveals the strategic approach towards quality in the banks. Customer care
and staff training for every level of the organization were the most reported strategic
approaches towards quality by the banks. Incentives/rewards for quality services, re-
engineering programmes, and physical importance of workplaces were seen as strategic
approaches in government banks and were associated with ownership aspects. Train and
monitor of operational staff was seen in 6 locally owned, and 1 foreign owned banks
and was also associated with ownership aspects.
Table 13.14 Strategic approach towards quality in the banks
Total Ownership aspects Size aspects Strategic approach N % G % LO % F % C Sig L % M % S % C Sig
Awareness building and training to change the attitude
3 14.3 1 50.0 1 11.1 1 10.0 .331 n.s 1 20.0 1 33.3 1 7.74 .266 n.s
incentives/ rewards for quality services
1 4.8 1 50.0 - - - - .689 ** 1 20.0 - - - - .400 n.s
Re-engineering programmes
1 4.8 1 50.0 - - - - .689 ** 1 20.0 - - - - .400 n.s
Technological upgrading programmes
2 9.5 1 50.0 1 11.1 - - .482 n.s 2 40.0 - - - - .400 n.s
Customer care
15 71.4 1 50.0 7 77.8 7 70.0 .174 n.s 4 80.0 - - 11 84.6 .647 *
Physical importance of work places
1 4.8 1 50.0 - - - - .689 ** 1 20.0 - - - - .400 n.s
Operational level staff is trained in quality and monitored
7 33.3 - - 6 66.7 1 10.0 .615 * 3 60.0 1 33.3 3 23.1 .325 n.s
A complementary step is successfully begin ISO certified in trade and central processing operations
1 4.8 - - 1 11.1 - - .258 n.s - - 1 33.3 - - .548 *
307

Table 13.14 Strategic approach towards quality in the banks (continued)
Total Ownership aspects Size aspects Strategic approach N % G % LO % F % C Sig L % M % S % C Sig
Staff training for every level of the organization
15 71.4 - - 7 77.8 8 80.0 .514 n.s 2 40.0 2 66.7 11 84.6 .412 n.s
Brainstorming 2 9.5 - - 1 11.1 1 10.0 .107 n.s - - 2 66.7 - - .795 **
Customer survey
3 14.3 - - 2 22.2 1 10.0 .212 n.s 1 20.0 1 33.3 1 7.7 .266 n.s
Improve product efficiency while retaining only in the essential services
1 4.8 - - - - 1 10.0 .235 n.s - - 1 33.3 - - .548 *
Strict adhering to the guidelines
1 4.8 - - - - 1 10.0 .235 n.s - - - - 1 7.7 .175 n.s
Practical involvements
1 4.8 - - - - 1 10.0 .235 n.s - - - - 1 7.7 .175 n.s
13.6.2 Personnel responsible for addressing the major strategic quality issues
Table 13.15 displays the personnel responsible for addressing the banks major strategic
quality issues. It was found that chief executive officer and corporate level management
were the most reported personnel responsible for addressing major strategic issues. In a
government owned bank outside members of the board of directors and other lower
levels of management also were responsible for their major strategic quality issues and
these were significant differences by ownership aspects.
Table 13.15 Personnel responsible for addressing the major strategic quality issues
Total Ownership aspects Size aspects Personnel responsible N % G % LO % F % C Sig L % M % S % C Sig
Corporate level management
19 90.5 2 100 9 100 8 80.0 .340 n.s 5 100 3 100 11 84.6 .255 n.s
Chief executive officer
19 90.5 2 100 8 88.9 9 90.0 .107 n.s 5 100 2 66.7 12 92.3 .349 n.s
Outside members of the board of directors
1 4.8 1 50.0 - - - - .689 ** 1 20.0 - - -- .400 n.s
308

Table 13.15 Personnel responsible for addressing the major strategic quality issues (continued)
Total Ownership aspects Size aspects Personnel responsible N % G % LO % F % C Sig L % M % S % C Sig
Second level line mangers
8 38.1 2 100 4 44.4 2 20.0 .478 n.s 3 60.0 3 100 2 15.4 .645 *
Other lower levels of management
1 4.8 1 50.0 - - - - .689 ** 1 20.0 - - - - .400 n.s
Assistant general manager
1 4.8 - - - - 1 10.0 .175 n.s - - - - 1 7.7 .175 n.s
13.6.3 The extent that the employees are involved in the quality approach
Figure 13.26 shows the extent that the employees are involved in the banks quality
approach. Overall, banks employees were involved in their quality approach to a
reasonable extent. Locally owned banks reported a greater extent of involvement than
the government and foreign banks and similarly, medium sized banks reported a greater
extent of involvement than the large and small sized banks. There were no significant
differences found in the level of extent that the employees involved in quality approach
either by size or ownership aspects.
Figure 13.26 The extent that the employees are involved in the quality approach
Not Very Not Very Involved involved Involved involved Ownership aspects Size aspects 1 2 3 4 5 1 2 3 4 5 •_____•______•______•_____• •_____•______•______•_____•
ПG=3.5 ПLO=3.8 ПF=3.5 ПL=3.6 ПM=4.0 ПS=3.5 N=2 N=9 N=10 N=5 N=3 N=13 Ownership: Cramer’s V=0.283 p=0.431 Size: Cramer’s V=0.325 P=0.331 Note that: ПT=3.7 N=21 Government Local Foreign Large Medium Small
309

13.6.4 Total quality management strategies Figure 13.27 shows the total quality management strategies of the sample banks in
terms of importance of total quality management, top management involvement,
employee involvement, quality assessment, and customer relationship. Overall, banks
agreed to a high degree that quality is the responsibility of everyone in the bank, the
quality of customer service is a key issue, and the management of quality is a major
philosophy that pervades the whole organization.
It was also found that CEO seeks to establish the total quality management philosophy
within the company to a high degree. Furthermore, the company training of employees
in quality issues plays an important role in the banks to a high degree. It was also found
that banks overall continually try to improve the relationship with their customers to a
great degree and determine future customer requirements and expectations on a regular
basis, and regularly measure customer satisfaction to a reasonably high degree.
Figure 13.27 Total quality management strategies Disagree Strongly Disagree Strongly Agree agree Ownership aspects Size aspects 1 2 3 4 5 1 2 3 4 5 Importance of total quality management: The management of quality is a major philosophy •_____•______•______•_____• •_____•______•______•_____• that pervades the whole organization ПG=4.0 ПLO=3.8 ПF=3.5 ПL=3.6 ПM=4.0 ПS=3.6 (ПT=3.7, N=21) N=2 N=9 N=10 N=5 N=3 N=13 Continuous quality improvement is a major •_____•______•______•_____• •_____•______•______•_____• factor in the strategic management of our company ПG=3.5 ПLO=3.6 ПF=3.5 ПL=3.4 ПM=3.7 П S=3.5 (ПT=3.5, N=21) N=2 N=9 N=10 N=5 N=3 N=13 Quality is the responsibility of everyone in the •_____•______•______•_____• •_____•______•______•_____• organization ПG=3.5 ПLO=4.0 ПF=3.7 ПL=3.8 ПM=4.0 П S=3.8 (ПT=3.8, N=21) N=2 N=9 N=10 N=5 N=3 N=13 ** The quality of customer service is a key issue •_____•______•______•_____• •_____•______•______•_____• (ПT=3.9, N=21) ПG=4.5 ПLO=4.0 ПF=3.7 ПL=4.2 ПM=4.0 П S=3.8 N=2 N=9 N=10 N=5 N=3 N=13 Government Local Foreign Large Medium Small
310

Figure 13.27 Total quality management strategies (continued) Disagree Strongly Disagree Strongly Agree agree
Ownership aspects Size aspects 1 2 3 4 5 1 2 3 4 5 Top management involvement: * The CEO seeks to establish the total quality •_____•______•______•_____• •_____•______•______•_____• Management philosophy within the company ПG=4.5 ПLO=3.8 ПF=3.7 ПL=4.0 ПM=3.3 П S=3.8 (ПT=3.8, N=21) N=2 N=9 N=10 N=5 N=3 N=13 ** The senior management commits the resources for •_____•______•______•_____• •_____•______•______•_____• continuous quality improvements ПG=3.5 ПLO=4.0 ПF=3.3 ПL=3.8 ПM=4.0 П S=3.5 (ПT=3.6, N=21) N=2 N=9 N=10 N=5 N=3 N=13 * The senior management provides the leadership for •_____•______•______•_____• •_____•______•______•_____• continuous quality improvements ПG=3.5 ПLO=3.9 ПF=3.3 ПL=3.8 ПM=4.0 П S=3.4 (ПT=3.6, N=21) N=2 N=9 N=10 N=5 N=3 N=13 Employee involvement: The company has special rewards and incentives for •_____•______•______•_____• •_____•______•______•_____• employees who make contributions to quality ПG=3.5 ПLO=3.0 ПF=2.7 ПL=3.4 ПM=3.0 П S=2.7 improvements (ПT=2.9, N=21) N=2 N=9 N=10 N=5 N=3 N=13 The company training of employees in quality •_____•______•______•_____• •_____•______•______•_____• Issues plays an important role ПG=3.5 ПLO=3.9 ПF=3.5 ПL=3.8 ПM=4.0 П S=3.5 (ПT=3.7, N=21) N=2 N=9 N=10 N=5 N=3 N=13 Quality assessment: * Our company regularly assesses the quality •_____•______•______•_____• •_____•______•______•_____• of its tangible products ПG=2.0 ПLO=3.4 ПF=3.1 ПL=2.6 ПM=3.5 П S=3.2 (ПT=3.1, N=21) N=2 N=9 N=10 N=5 N=3 N=13 ** Our company regularly assesses the quality of its •_____•______•______•_____• •_____•______•______•_____• services production processes ПG=4.0 ПLO=3.8 ПF=3.2 ПL=3.6 ПM=4.0 П S=3.4 (ПT=3.5, N=21) N=2 N=9 N=10 N=5 N=3 N=13 *** Our company regularly assess the quality of its •_____•______•______•_____• •_____•______•______•_____• intangible products ПG=2.0 ПLO=3.3 ПF=3.0 ПL=3.0 ПM=3.3 П S=3.1 (ПT=3.1, N=21) N=2 N=9 N=10 N=5 N=3 N=13 Customer relationship: Our company continually tries to improve •_____•______•______•_____• •_____•______•______•_____• the relationship with its customers ПG=4.0 ПLO=4.0 ПF=3.9 ПL=4.0 ПM=4.0 П S=3.9 (ПT=3.9, N=21) N=2 N=9 N=10 N=5 N=3 N=13 Our company regularly measures customer •_____•______•______•_____• •_____•______•______•_____• satisfaction ПG=3.0 ПLO=3.8 ПF=3.4 ПL=3.6 ПM=3.7 П S=3.5 (ПT=3.5, N=21) N=2 N=9 N=10 N=5 N=3 N=13 Our company determines future customer •_____•______•______•_____• •_____•______•______•_____• requirements and expectations on a regular basis ПG=3.5 ПLO=3.9 ПF=3.5 ПL=3.8 ПM=3.7 П S=3.6 (ПT=3.7, N=21) N=2 N=9 N=10 N=5 N=3 N=13 Government Local Foreign Large Medium Small It was also found that only one foreign owned small size bank was having problems in
their quality management approach and mentioned that their head office policies were
not suited to the local market (Sri Lankan market).
311

13.7 Chapter Summary This chapter has discussed the analytical tools and techniques which are used in the
strategy development process, the formation of the corporate strategies and the
procedures and processes used for their development, corporate strategies and the
management of quality of the commercial banks.
SWOT, PEST and five forces analysis had the strongest influence on company
strategies and TQM was adopted more extensively by the banks for their corporate
planning during last five years. Over the next five years banks expected that SWOT,
PEST and five forces analysis and total quality management will all have a greater
influence on the banks corporate strategies.
Benchmarking also had a reasonable influence on banks strategies during last five years
and the banks preferred benchmarking groups were domestic banks in Sri Lanka,
foreign banks in Sri Lanka and Sri Lankan government banks respectively. The major
benchmarking dimensions for most banks were profitability, asset quality, NPL, and
productivity respectively.
It was found that capital expenditures and market development expenditures were more
important to the banks than the research and development, and people development
expenditures. The banks most important criteria in evaluating expenditure proposals
were forecast return on investments, forecast net operating profits, discount cash flow
analysis, forecast sales growth and impact on company resource needs respectively.
The banks formalize their corporate strategies to a reasonably high extent. The most
explicit parts of banks corporate strategies were to enter high growth markets and to
enter or develop service business respectively. During last five years banks have sought
growth through introducing existing products into new markets and introducing existing
products into existing markets to a high extent. Over the next five years banks will seek
their growth through introducing new products into existing markets to a high extent. It
was also found that banks overall attempt to be entrants in mature, stable markets and
also later entrants in established but still growing markets.
312

The major objectives of the banks research and development strategies were to be
highly service innovative, technologically innovative and to avoid high risk activities.
None of the banks allocated more than 2% of their total corporate revenues to their
R & D activities.
Only 8 of the 11 locally and government owned banks reported having international
operations and 13.8% of their average revenues came from these international
operations and these banks also expected that the average revenues from the
international operations will increase up to 18.7% in the next five years. The three major
overseas markets for most banks were Japan, India and Europe during last five years
and in the next five years the three most important markets for most banks will be India,
China, and Middle East respectively.
Only four banks made acquisitions during the last five years and the main objective of
those acquisitions was to develop a new configuration of business lines. Banks do not
expect that the acquisitions will play a significant role in their corporate strategies in the
next five years.
Only four banks divested, liquidated or eliminated important operations during the last
five years and the main reasons for these divestures was to refocus the business
portfolio on its core business and to dispose/retrench unprofitable lines of business.
Overall, banks think divestitures will not play a major role in their corporate strategies
in the next five years.
It was found that only 3 mergers occurred during last five years and the banks intended
to extend their core business activities, develop a new configuration of business lines
and also to meet the minimum capital requirements of the Central bank by these
mergers. Surprisingly, banks think mergers will not play a major role in their corporate
strategies in the next five years.
9 of the 21 banks made significant turnarounds during last five years and major
objective of their turnarounds was to restore money losing businesses to profitability
313

rather than to divest and banks overall, believe turnarounds will play a reasonable role
in their corporate strategies in the next five years.
Overall, banks considered management of quality was important to a great extent during
last five years and will be so in the next five years. It was also found that banks overall
considered management of quality as a strategic issue in their banks to a reasonably
high degree. Most reported strategic approaches towards quality in the banks were
customer care, and staff training for every level of the organization. Corporate
management and CEO were responsible for quality issues in 19 banks and in 8 banks
second level management were also responsible. It was also found that bank employees
were involved with management of quality to a reasonable extent but, not to a great
extent.
Overall, banks agreed to a high extent that quality is the responsibility of everyone in
the bank, the quality of customer service is a key issue, and the management of quality
is a major philosophy that pervades the whole organization. It was also found that the
CEO seeks to establish the total quality management philosophy within the banks to a
high degree. Furthermore, the company training of employees in quality issues plays an
important role in the banks. It was also found that banks overall continually try to
improve the relationship with their customers to a high extent and determine future
customer requirements and expectations, and measure customer satisfaction on a regular
basis to a reasonably high degree.
The next chapter will compare the strategic management practices of Sri Lankan
commercial banks with the strategic management practices in the companies of other
countries such as India, Thailand and Australia.
314

PART FOUR
DISCUSSION: COMPARISON WITH PREVIOUS STUDIES AND THE MAJOR RESEARCH FINDINGS Chapter 14: Comparison with previous studies Chapter 15: The major research findings and further research directions
315

Chapter 14 Comparison with previous studies 14.1 Introduction
This chapter will compare the major research findings of strategic management
practices of Sri Lankan commercial banks with the major research findings of other
selected research studies previously conducted about strategic management practices in
other countries. The previous studies will include the studies of Nimmanphatcharin
(2002), Kakanamveetil (2004), and Bonn (1996). This study will not consider the
major research findings of Angkasuvana (2005) because of the nature of its population
(Thai hotel companies).
14.2 Background of the previous studies
Table 14.1 displays the population and the sample sizes of the current and previous
selected research studies. The study of Kakanamveetil (2004) includes 30
manufacturing companies in India and the study of Nimmanphatcharin (2002) includes
71 banking and financial companies in Thailand. Similarly the study of Bonn (1996)
includes 35 manufacturing companies in Australia. The major research findings of
Angkasuvana (2005) will not consider for the comparison because of its nature of the
population (Thai hotel companies). As stated earlier this study consists with 21 Sri
Lankan commercial banks in Sri Lanka.
Table 14.1 Population and the sample size of the current and previous studies
Name of the research study
Description of the Population Sample size
Current study
Sri Lankan commercial banks 21
Kakanamveetil (2004)
Indian large manufacturing companies
30
Nimmanphatcharin (2002) Thai banking and financial institutions
71
Bonn (1996) Australian large manufacturing companies
35
316

14.3 Formalized strategic planning
Table 14.2 shows the percentages of the non formal planners and the formal planners in
the current and previous research studies. The research study of Sri Lankan banking
industry reported the highest percentage for the formal planners than the Thai, Indian,
and Australian studies respectively. Thus, formal planning plays a major role in Sri
Lankan banks. However, all these studies confirmed that formal strategic planning plays
an important role in their strategic management practices.
Table 14.2 Percentages of formal and non formal planners
Name of the research study Percentage of non formal planners
Percentage of formal planners
Current study 4.8 95.2
Indian study (2004) 26.7 73.3
Thai study (2002) 19.7 80.3
Australian study (1996) 28.6 71.4
14. 3.1 Relationship between plans
Table 14.3 reveals the relationship between corporate and short term plans of three
developing countries namely the Sri Lanka, India, and Thailand. In Sri Lanka and
Thailand most companies prepared their long term plan first and then short term plan
fitted into long term plans. However, in India most of the companies prepared their
short term and long term plans simultaneously.
317

Table 14.3 Relationship between corporate and short term plans
Relationship Current study/ (%) Indian study/ (%) Thai study/ (%)
Long term plan prepared first, shorter term plan then fitted into long term plan
90.0 35.0 72.0
Shorter term plan prepared first, longer term plans are then extended
- 9.0 5.0
Short term and long term plans prepared simultaneously
5.0 52.0 21.0
14.3.2 Corporate planning effort
Table 14.4 shows the corporate planning effort spent on different type of planning in the
companies of Sri Lanka, India, Thailand, and Australia. In all four studies most of the
efforts was spent on action planning or operational planning for the next 1 to 3 years.
However, Sri Lankan companies reported the lowest level of effort for the action
planning or operational planning for the next 1 to 3 years compared with the other three
countries. All the three developing countries spent more effort on short term emergency
planning than the Australian companies. Indian and Australian companies spent more
efforts on 10-20 years planning than the Sri Lankan and Thai companies but it was not a
greater effort compared with the efforts they spent on short term emergency and 1-3
years planning. The major highlight of the table 14.3 is the Sri Lankan companies’
lower level of efforts on long term planning for the next 5-10 years than the Thai,
Australian, and Indian companies.
318

Table 14.4 Corporate planning effort spent on different planning activities
Type of planning Current study Indian study Thai study Australian study
Short term emergency planning
3.7 3.0 4.0 2.3
Action planning or operational planning for the next 1 to 3 years
3.9 4.1 4.2 4.2
Long term planning for the next 5-10 years
2.6 3.3 3.5 3.4
“what the company wants to be in the next 10-20 years” planning
2.0 3.1 2.3 2.9
Note that: 1 represent disagree and 5 represent strongly agree in the given scale
14.3.3 Corporate planning effort spent on Forecasting
Table 14.5 shows the means of corporate plan effort spent on different forecasting areas
by the companies in the four different studies. Not surprisingly, companies in all the
four countries spent a greater effort in the areas of competitive analysis and industry
level demand than the other areas. Interestingly, Sri Lankan companies spent a higher
level of effort in the forecasting area of human resource than the other four countries.
Similarly, Thai companies spent a high effort in the forecasting area of foreign
economies.
Table 14.5 Corporate plan effort spent in forecasting areas
Forecasting area Current study Indian study Thai study Australian study
Competitive analysis
4.2 4.3 4.3 4.2
Industry level demand
4.0 4.4 4.2 3.6
Domestic economy
4.0 4.0 4.2 3.1
Financial markets 3.8 3.8 3.9 3.2
Human resources 3.7 3.6 3.2 3.3
Governmental - 3.8 3.7 3.0
Foreign economies 3.0 3.1 3.6 2.8
Social and or cultural
2.5 3.1 2.8 2.4
Note that: 1 represent disagree and 5 represent strongly agree in the given scale
319

Table 14.6 displays means of the transmission of forecasts which were developed or
purchased by corporate planning, from corporate level to the second level by the
companies in the four studies. Sri Lankan companies reported the lowest level of
transmission in the areas of competitive analysis, industry level demand, foreign
economies, and social and or cultural compared with the Indian, Thai and Australian
companies. However, Sri Lankan companies reported a higher degree of forecast
transmission in the area of human resources than the other three countries.
Table 14.6 Forecast transmission from corporate to second level
Area Current study Indian study Thai study Australian study
Competitive analysis
3.6 3.9 3.9 4.2
Industry level demand
3.5 4.1 3.9 4.1
Domestic economy
3.9 3.6 3.7 4.2
Financial markets 3.4 3.3 3.7 4.0
Human resources 3.8 3.0 2.9 3.7
Governmental - 3.5 3.0 3.7
Foreign economies 2.7 2.8 3.2 3.7
Social and or cultural
2.7 3.0 2.8 3.3
Technological 3.9 3.5 3.2 3.7
Note that:1 represent never transmitted and 5 represent regular transmitted in the given scale
14.3.4 Use of computer models/systems
Table 14.7 shows percentages of the models and systems used by the companies in four
different studies for their corporate planning. Smaller percentage of Sri Lankan
companies used simulation models for their corporate planning than the Indian, Thai,
and Australian companies. However, higher percentage of Sri Lankan companies used
the strategic decision models and the group decision support models than the Indian,
Thai, and Australian companies.
320

Table 14.7 The models and systems used by the companies for their corporate planning
Model Current study/ (%) Indian study/ (%) Thai study/ (%) Australian study/ (%)
Financial models 90.0 95.0 95.0 79.1 Forecasting models
90.0 89.0 79.0 66.6
Simulation models 20.0 47.0 93.0 37.5 Planning models 45.0 63.0 18.0 45.9 Econometric models
- 32.0 11.0 8.3
Strategic decision support models
90.0 53.0 40.0 20.9
Group decision support models
55.0 53.0 9.0 16.7
14.3.5 Nature of corporate planning
Table 14.8 displays the means of the responses received in three different studies about
the company’s nature of the corporate planning process. Planning process plays a
greater role in organization’s communication network in Thai companies but a
reasonably high role in Sri Lankan and Indian companies. Similarly, the planning
process was more necessary to sequence future activities for Thai and Indian companies
than the Sri Lankan companies. Furthermore, the planning process in Sri Lankan
companies plays a high role in systematically dealing with uncertainty, and as a key
device to allocate corporate resources throughout the company. Table 14.8 also
highlights that the planning process in Indian and Thai companies enable them to avoid
high levels of risk to a greater extent but in Sri Lankan companies to a reasonably high
extent.
321

Table 14.8 Nature of corporate planning process
Nature of corporate planning process
Current study/(Mean) Indian study/(Mean) Thai study/(Mean)
Planning process plays an important role in organization’s communication network
3.6 3.5 4.2
Planning process plays an important role in strategically managing the company’s structure
3.9 3.8 3.6
Planning process is necessary to sequence future activities
3.8 4.1 4.3
Planning process systematically deals with uncertainty
3.9 3.8 3.9
Planning process enables the company to avoid high levels of risk
3.8 4.0 4.0
Planning process is a key device which allocates corporate resources throughout the company
3.9 4.1 3.8
Note that: 1 represent disagree and 5 represent strongly agree in the given scale
Table 14.9 displays the means of responses in the three studies regarding the co-
ordination of corporate planning with other planning. In Sri Lankan companies
corporate planning was co-ordinated with financial planning to a greater extent than the
marketing, operational, and HR planning. In Indian companies, their corporate planning
was co-ordinated with financial, marketing, operational, and HR to a greater extent than
the Sri Lankan and Thai companies.
Table 14.9 Corporate planning co-ordination with other planning
Corporate planning is Co-ordinated with:
Current study / (Mean) Indian study/(Mean) Thai study/(Mean)
Financial planning 4.0 4.4 4.4 Marketing planning 3.5 4.5 2.3 Operational planning 3.7 4.2 3.0 HR planning 3.5 3.8 3.1 Note that: 1 represent disagree and 5 represent strongly agree in the given scale Table 14.10 reveals the various functions of the corporate planning of companies in
three research studies in three different countries. It was revealed that Sri Lankan
322

companies spent a lower degree of effort in preparing specific studies than the Indian
and Thai companies. Similarly, Sri Lankan companies spent a lower degree of effort on
identifying areas of new business opportunity than Thai and Indian companies.
However, effort spent on define guidelines, formats, and timetables for planning
activities, and develop macro forecasts of the economy, financial markets, political
environments etc were relatively equal in the companies in all three countries.
Table 14.10Various functions of the corporate planning
Current study/mean Indian study/mean Thai study/mean
Define guidelines, formats, and timetables for planning activities
3.9 4.0 3.9
Develop macro forecast of the economy, financial markets, political environment and etc
3.7 3.8 3.9
Prepare specific studies
2.6 3.7 3.6
Develop improved accounting and financial data for strategic planning
3.7 3.7 4.0
Identify areas of new business opportunity
3.8 4.1 4.2
Reorganize the company around more clearly defined business units
3.8 - 4.1
Note that: 1 represents no effort and 5 represents high degree of effort in the given scale
Table 14.11 shows the corporate planning effort put on external analyses in the
companies in the three research studies. Possible impact of economy was the most
important external analysis of the corporate planning in Sri Lankan and Thai companies
and in Indian companies it was technological developments. Identifying the possible
impacts of the government on company’s business operations was less important in Sri
Lankan companies but, it was very important in Thai companies. Furthermore, a lower
degree of effort was spent on identifying the possible impacts of the culture on
company’s business operation in both the Sri Lankan and Thai companies.
323

Table 14.11 Corporate Planning effort put on external analysis
In our company, a great deal of effort is expended in attempting to identify:
Current study/mean Indian study/mean Thai study/mean
competitors cost structure
3.5 3.6 3.4
The sources of funds
3.8 - 4.0
The customer demands
3.8 3.9 4.1
The possible impacts of the government on our business operations
3.4 - 4.1
The possible impacts of the economy on our business operations
4.0 - 4.3
The possible impacts of the culture on our business operations
2.8 - 2.6
Technological developments
3.8 4.0 4.0
Not that: 1 represent disagree and 5 represent strongly agree in the given scale
Table 14.12 reveals the quality of information received from the various departments
for the company’s corporate planning in the three different studies. Indian companies
received higher quality information from the departments such as finance,
operations/production, and marketing for their corporate planning than the Sri Lankan
and Thai companies. Overall, Sri Lankan companies did not receive very high quality
information from the departments that were identified in the table 14.12. However, Sri
Lankan companies did receive higher quality information for their corporate planning
from the marketing and operations departments than the Thai companies.
324

Table 14.12 Quality of information received from various departments for corporate planning Our company gets very high quality information for the corporate planning from the:
Current study Indian study Thai study
Finance department
3.6 4.2 3.7
Operation/production department
3.5 4.1 3.2
Marketing department
3.2 4.3 3.1
Human resource department
3.2 - 3.4
Technology development (R & D)
2.7 - 3.3
Not that: 1 represent disagree and 5 represent strongly agree in the given scale
14.4 Chapter summary
The current research study reported the highest percentage of companies with formal
strategic planning compared with the Australian, Indian and Thai studies. Thus, it is
worth noting that formal planning plays a major role in most of the Sri Lankan
companies whether it is large, medium, or small.
In Sri Lanka and Thailand most of the companies prepared long term plans first and
shorter term plans were then fitted into long term plans. However, in India more than
half of the companies prepared short term and long term plans simultaneously. In all the
four studies most of the efforts were spent on the action planning or operational
planning for the next 1 to 3 years. However, Sri Lankan companies reported the lowest
level of effort for the action planning or operational planning for the next 1 to 3 years
compared with the Australian, Indian, and Thai companies. It was also found that all the
three developing countries spent more effort on short term emergency planning than the
Australian companies. Overall, Sri Lankan companies did not spend effort on “what the
company wants to be in the next 10-20 years” planning.
Overall, companies in all the four countries spent a greater effort in the forecasting areas
of competitive analysis, and industry level demand than the other areas. Interestingly,
325

Sri Lankan companies spent a greater effort in the forecasting area of human resources
than the other three countries. Regarding the transmission of forecasts from corporate
level to second level, Sri Lankan companies reported the lowest level of transmission
from corporate level to second level in the areas of competitive analysis, industry level
demand, foreign economies, and social and or cultural compared with the other three
countries.
Most used models for corporate planning in the companies in the studies of Sri Lanka,
India, and Australia were financial, and forecasting models and in Thailand those were
financial and simulation models. It was also found that a higher percentage of Sri
Lankan companies used strategic decision support models and group decision support
models than the other three countries.
In Sri Lankan companies their planning process, plays an important role in strategically
managing the company’s structure, is a key device which allocates corporate resources
throughout the company, and for systematically dealing with uncertainty to a high
extent. For Thai companies their planning process is necessary to sequence future
activities and plays an important role in organization’s communication network to a
great extent. In Indian companies their planning process is necessary to sequence future
activities, and is a key device which allocated corporate resources throughout the
company to a great extent.
Corporate planning in Sri Lankan companies was coordinated with financial planning to
a great extent but, marketing, operational, and HR planning to a reasonably high extent.
In Indian companies their corporate planning was coordinated with financial, marketing,
and operational planning to a great extent and in Thailand companies their corporate
planning was only coordinated with financial planning to a great extent. Possible impact
of economy was the most important external analysis of the corporate planning in Sri
Lankan and Thai companies but Indian companies it was technological developments.
Sri Lankan companies get very high quality information for their corporate planning
from the finance and operation departments to a reasonable extent. However, Indian
companies received very high quality information for their corporate planning from the
finance, operation, marketing to a great extent. It is worth noting that for the item very
326

high quality information received from the technology development for corporate
planning in Sri Lankan companies was relatively low.
The comparison of the major research findings of these four studies shows that overall
the strategic management practices in these four studies were remarkably alike and also
formal strategic planning is still alive well. Thus, it is worth noting that formal strategic
planning is still not dead and plays a major role in company’s strategic management
process.
The next chapter will discuss the major research findings of this research, the unique
features of the strategic management practices by ownership and size aspects and also
the unique features of the strategic management practices in Sri Lankan commercial
banks. Furthermore, the significance of this research, future research directions and also
the limitations of the research will be stated.
327

Chapter 15 Major research findings and further research directions 15.1 Introduction This chapter will discuss the major research findings of this study in terms of the major
research questions developed in chapter 4. Then the unique features of the strategic
management practices by ownership and size aspects and also the unique features of the
strategic management practices in Sri Lankan commercial banks will be summarized.
Then the significance of this research study for the field of strategic management will be
discussed. Finally, further research directions and the limitations of this research study
will be stated.
15.2 Major Research findings of the research No one has attempted to investigate the strategic management practices in any industry
in Sri Lanka and therefore, this study was designed to analyse the strategic management
practices of Sri Lankan commercial banks. Because of the large number of variables
that were expected to be investigated in this study, and also with no prior knowledge
about how the variables behave in the Sri Lankan banking industry this study was
developed around key the research questions. There were six major research questions
developed to seek answers in this study (in chapter 4) and therefore, the major research
finding of this study will be discussed under these six major research questions.
15.2.1 Research question 1: The overall strategic management characteristics of Sri Lankan commercial banks
The overall strategic management characteristics of the Sri Lankan commercial banks
will be discussed in terms of respondents characteristics, vision and mission, corporate
and second level long term goals, corporate strategies and processes, and management
of quality.
328

15.2.1.1 Respondents characteristics
There were twenty one commercial banks who participated in this research study and all
the participating banks were categorized according to their size, ownership, and
planning systems aspects. The major consideration for the ownership aspects was who
owns more than fifty percent of the total shares and ownership aspects were classified
into three categories namely government owned, locally owned, and foreign owned. The
major consideration for size aspects was the asset base of the banks and size aspects
were classified into three categories namely large, medium, and small. By considering
the planning system aspects all the banks were divided into two categories namely
banks which had formalized strategic planning system and the banks which did not have
a formalized strategic planning system.
Large banks reported having higher profits, revenues, assets, and number of branches
and it was found that all the large banks were locally owned and government owned
banks. There were two government owned banks and both were large banks. It was also
found that two government banks reported the highest profit for the year of 2005 and
reported having the most number of branches. Except for one medium sized bank all the
other foreign owned banks were small sized banks. It was also found that except for one
government owned bank all the other banks had a formalized strategic planning system.
15.2.1.2 Vision and mission statements
Except for one locally owned medium sized bank all the other banks had a mission
statement for their banks. Most government and locally owned banks included
statements about the employees, customers, service excellence, and their financial
services in their mission statements. Banks mission statements were influenced by the
corporate level management followed by CEO and outside members of the board of
directors. Eight of the ten locally and government owned banks had changed their
mission statements during last five years and most of the banks had stated their mission
more specifically. The factors that affected banks mission statements were strategic
considerations, introduction of new plans, and development of new capabilities. Banks
also believe that their mission statements are appropriate for the next five years to a
high degree.
329

All the locally and government owned banks had a vision and most reported major
characteristics of banks vision include to be the best bank of the people, and to
dominate the financial sector in Sri Lanka. Corporate management had the most
influence on their vision followed by the CEO and outside members of the board of
directors.
15.2.1.3 Long term goals at corporate and second level
19 of the 21 banks had long term goals at corporate level. All the banks which had
corporate long term goals had quantitative goals and similarly, except for one foreign
owned bank all the other banks had qualitative goals. Most banks quantitative goals
include goals such as return, profits, income, cash flows, deposits and financial ratio
controls. Customer focus, focus on market segments, and leadership in quality and
service were the qualitative goals reported by most banks. Overall, banks corporate
level long term goals were mostly influenced by corporate level management and the
bank CEO. In 6 banks formulating long term goals at corporate level was a negotiation
process between the CEO and corporate level management and in 5 banks it was a
negotiation process between the corporate level/board of directors group and second
level management. The most important roles of banks corporate goals were the
evaluation of its past performance and to monitor current performance. 14 banks had
changed their corporate goals and 13 banks had upgraded or updated their goals and 7
banks instituted new goals. Major factors that influenced the changes of banks corporate
goals were changes in economic environment and technological breakthroughs. Except
for two foreign owned banks all the other banks met or exceeded their corporate goals
during the last five years. The major reasons for these performances were
appropriateness of goals and managerial competencies.
Only 8 banks had long term goals at their second level. Banks second level long term
goals were mostly influenced by the corporate level management followed by the CEO
and second level line managers. Most of the banks second level long term goals were
formulated through a negotiation process between the corporate level and second level
managements. The major roles of banks second level long term goals were to be used as
standards to evaluate business unit performance, and also as a major influence on final
330

corporate goals. Overall, banks believe that they have good quality second level long
term goals.
15.2.1.4 Corporate strategies and processes
The major analytical tools and techniques that influenced the banks corporate strategies
during the last five years were SWOT, five forces and PEST respectively.
Benchmarking had a reasonable influence on corporate strategies during the last five
years and the banks preferred benchmarking groups were domestic banks, foreign
banks, and government banks in Sri Lanka. The major benchmarking dimensions for
most banks were profitability, asset quality, NPL, and productivity respectively. Capital
expenditures and market expenditures were the most important expenditures to the
banks and the most important criteria in evaluating expenditure proposals were forecast
return on investments, forecast net operating profits, and discount cash flow analysis.
The banks formulate their corporate strategies to a reasonably high degree and the most
explicit part of the banks corporate strategies were to enter high growth markets and to
enter or develop service business. Banks sought growth through introducing existing
products into existing and new markets and they attempt to be entrants in mature, stable
markets and also later entrants in established but still growing markets.
The major objectives of the banks research and development strategies were to be
highly service and technologically innovative and also to avoid high risk activities. But,
none of the banks allocated more than 2% of their total revenues to their R & D
activities. 8 of the 11 locally owned and government owned banks had international
operations and 13.8% of their revenues came from these international operations. Only
four banks made acquisitions during the last five years and only three banks had
mergers during that period. It was also found that only four banks divested, liquidated
or eliminated important operations during the last five years. Therefore, acquisitions,
mergers and divestitures did not play a major role in banks corporate strategies.
However, 9 of the 21 banks had significant turnarounds during the last five years.
331

15.2.2 Research question 2: Internal environmental factors that affect strategic management practices of the Sri Lankan commercial banks
The internal environmental factors that affect the banks strategic management practices
will discuss under 7 major parts namely, organizational structure, ownership, size,
culture, management style, stakeholder’s expectation, and resources, capabilities and
key success factors.
15.2.2.1 Organizational structure
52.4% of the banks had MSBU structures, and 28.6% and 19.0% reported have SSBU
and mix of MSBU and SSBU structures respectively. All the banks had corporate and
second levels and only 15 and 2 banks had a third level and fourth level respectively. In
18 of the 21 banks their corporate levels were headed by a CEO or a GM. Most banks
reported the highest position at their second level was a DGM followed by the senior
manager and the manager. Similarly the most reported senior position at third level was
a branch manager. In 19 banks second management level units were defined as profit
centres and the lowest level of profit centre in most banks was operational level. 14
banks had a hybrid form of centralized and decentralized structures and 6 banks had
centralized structures.
Only 9 banks had changed their structures during the last five years and the important
structural changes of most banks include the introduction of new positions, introduction
of new procedures and policies, establishment of new profit centres, and new areas of
activities respectively. The major reasons for most structural changes were to improve
efficiency and the change of their CEO/GM. Furthermore, 14 banks believe that they
need to change their structures in the next five years. Twelve of these 14 banks think
that their structures need to be adjusted according to the business and competitive
environments. Seven banks expected to introduce new positions and 5 banks expected
to open new branches in the next five years. The main reason banks expected structural
changes was due to the expected growth of the banking industry in Sri Lanka.
332

15.2.2.2 Ownership
It was found that 2 government owned banks, 9 locally owned banks and 10 foreign
owned banks were included in the sample of this research study. Only 6 locally owned
banks were selling shares in the SLSM and among these six banks 4 were widely held
and 2 were subsidiaries of Sri Lankan companies. Seventeen of the 21 banks did not
change their ownership during the last five years. The major changes of ownership in
the 4 banks included two mergers, 1 transfer of ownership limited liability and 1 change
of major shareholders. The major reasons for these changes were capital requirements,
to make capital gains, company not listed in the share market, to enhance shareholder
value, and unsatisfactory performance of the bank. Good earning potential and the
Central Bank capital requirements were the major factors that supported the above
ownership changes in most banks. These 4 banks think their ownership changes were
successful and helped them strategically. Furthermore, 19 banks do not expect to
change their ownership in the next five years.
15.2.2.3 Size
Overall banks were reasonably satisfied with their performance compared to their size.
But 17 banks believed that they need to enhance their size to gain more profits. Most of
the banks had the barriers to growth such as capital requirements, government policies,
and lack of managerial and employee skills to enhance their bank’s size.
15.2.2.4 Organizational Culture
All the banks considered that the management of their culture was important and
overall, all the banks were satisfied with their organizational cultures. Company CEO
and corporate level management had the most influence on the banks culture. The most
reported major characteristics of organizational culture were loyalty, team spirit, and
commitment. The most important actions of banks culture were to encourage
communication and co-operation between different departments, and encourage team
work rather than individual contribution. Only 13 banks had a change to their
organizational culture during the last five years and among these banks 9 banks had
333

incremental changes and the other 4 banks had both the incremental and revolutionary
changes. The main reasons for changes of most cultures were to be competitive in the
market, customer orientation, survival of the company, and the development which took
place in the banking sector. Major cultural changes made by most were change of
values to core customers, introduction of new tasks, introduction of job descriptions,
and recruitment of new staff etc. The major factors that supported those cultural changes
were introduction of new products by the banking sector in Sri Lanka, growth of the
banks and low profitability respectively. Only 7 banks reported having factors which
made cultural changes difficult such as influence of trade unions and informal groups,
age structure of the staff, and barriers in bottom to top communication etc. Furthermore,
only 4 banks had difficulties when they had implemented cultural changes such as to
obtain the required trade union support, to change the attitude of the staff, and the age
structure and qualification of the staff etc.
Overall, banks rated their cultural changes successful. Only 9 banks expected to change
their cultures during the next five years and these expected changes included new
positions at corporate and operational level, new staff recruitments, and changes to the
bank hierarchy respectively. Only 8 banks reported have subcultures in their banks and
the main reasons for the development of subcultures were working within a department,
presence of different societies, and geographic distributions of operations respectively.
Most of the banks believe development of subcultures weaken or undermine their
organization. It was also found that 17 of the 21 banks needed to have flexible culture
for their organization. The banks also think their culture have a strong influence on their
strategies.
15.2.2.5 Management style
Top to bottom approach, bureaucratic, and participatory decision making were the key
characteristics of most banks. The banks management styles were influenced by
corporate level management to the greatest extent followed by second level
management and other lower levels of management. Overall banks believe that
management style has an effect on their follower’s performance and job satisfaction.
Similarly, banks believe that their management style has an influence on company
performance and their strategies to a reasonably high extent. Only four banks reported
334

having problems in their management styles and their major problems included too
much listening to trade union views, lack of strategic planning, low concentration on
human aspects, high turnovers of staff etc. There was a reasonably high power distance
between managers and their subordinates. Furthermore, there were some internal
politics seen in the banks but not to a great extent and top management think internal
politics are bad because that political behaviour is undertaken for personal rather than
organizational gain.
15.2.2.6 Stakeholder’s expectation
The major stakeholder groups of most banks were depositors and customers, employees,
Sri Lankan community, and Sri Lankan government etc. The most reported
stakeholder’s expectations were excellent service, timelines, higher interest benefits,
career opportunities, job security, rewards, good working conditions, return on equity,
revenue through taxes etc. The top management interests were aligned with
stakeholder’s interest to a reasonable extent. The banks top management decides how
much stakeholder interests they must take into account and banks consider stakeholder
power when they are giving priorities. Finally, stakeholder expectations had a
reasonably high influence on banks strategies.
15.2.2.7 Resources, capabilities and key success factors
Banks most reported physical assets were their location, buildings, ATM networks, and
computer systems and their intellectual assets were professional skills of the staff, brand
name, and reputation and cultural assets were implementation of professional banking,
implementing international banking facilities, and brand image of a local bank etc.
Professional staff, up to date technology, service excellence, brand image were the most
reported major capabilities of banks and the major capabilities that were crucial to the
success of the business in the banking industry (key success factors) in most were up to
date technology, professionalism of the staff, service excellence, and brand image etc.
335

15.2.3 Research question 3: The external environmental factors which influenced the strategic management practices of Sri Lankan commercial banks
The major findings of the external environmental factors that influenced the banks
strategic management practices will be discussed under three major headings namely
demand environment, competitive environment, and industrial and general
environmental factors.
15.2.3.1 Demand environment
The demand environments of the banks that 70% of revenues were fairly predictable
during the last five years and banks expected that it will not change during next five
years. Overall, 90% of the banks revenues felt into markets that were growing and
banks expected that their 93% of the revenues will fall into growing environment in the
next five years.
15.2.3.2 Competitive environment
Only four banks reported being market leaders in markets where there were 1-2 major
competitors and 19% of the total revenues came from those markets.13 banks reported
being market leaders in the markets where there were 3-7 major competitors and 19% of
the total revenues came from those markets. Similarly, 7 banks reported being market
leaders in markets where there were more than 7 major competitors and 22% of the total
revenues came from those markets. The major competitors of the banks were locally
owned banks, foreign owned banks, government banks, leasing companies, and credit
finance companies respectively and their expected competitors in the next five years
will be the same. Overall, bank’s competitors had a reasonable influence on their
strategies during the last five years and banks expected a slight increase in the influence
of competitors on their strategies in the next five years. Overall, banks were in the
markets where their competitor’s actions were fairly predictable for up to 71% of their
revenues and banks expected that it will reduce up to 68% in the next five years.
336

15.2.3.3 Industrial factors
Industrial factors will be explained under the heading of competition and market share,
major customers, company suppliers, and new entrants.
15.2.3.3.1 Competition and market share
Customer deposits, corporate, and retail were the most important markets for most
banks during the last five years. Government banks had a market share of more than
20% from their most important markets while other banks reported having a market
share of 10-20%. Most important markets of most banks in the next five years will be
retail, deposits, and corporate and government banks expected to keep their market
share over 20% while other banks expected to keep their market share of 10%-20% in
their most important markets.
15.2.3.3.2 Major customers
Major customer groups of the most banks were manufacturing, export, wholesale and
retail, and service sector respectively. The most expected customer groups for the next
five years will be export, manufacturing, and wholesale and retail trade sectors
respectively. Overall, banks were dependent on their 100 major customers to a
reasonable extent but, not to a great extent and 48% of their total revenues came from
their 100 major customers.
15.2.3.3.3 Company suppliers
Major sources of funds for the commercial banks were domestic customers, foreign
bank’s overseas head offices, and domestic organizations etc. For the next five years
banks expected to obtain more funds from the domestic customers. The banks had a
great dependence on their major sources of funds during the last five years but, they
expected a slight decrease in the next five years. Overall, 84.0% of the funds for banks
felt into the category of no availability problems in the last five years and banks
expected that this will increase up to 86.0% in the next five years.
337

15.2.3.3.4 New entrants
Possible new entrants to the Sri Lankan banking industry were Indian banks with back
office in India, Islamic banks, and non banking corporate lending institutions
respectively. Banks also believe entry into the banking industry in Sri Lanka is not
difficult.
15.2.3.4 General environmental factors
The major research findings about the general environmental factors will be discussed
under the headings of political and legal factors, economic factors, social cultural
factors, and technology factors.
15.2.3.4.1 Political and legal factors
Government policies impacted on banks operations to a reasonably high level during the
last five years and at present and banks expected that this will increase slightly in the
next five years. Current impacts of government policies on banks environment were
capital requirements, increase of taxes, interest rate controls, and Central Bank
regulations with government policies etc. However, government involvement in banks
operations remained low. Similarly, Sri Lankan laws and regulations had a reasonably
high impact on banks operations and these impacts include capital requirements, single
borrowing limit, government audit requirements, for recovery matters, and CBSL
regulations respectively.
15.2.3.4.2 Economic factors
Sri Lankan economy had an impact on banks operations to a great extent during the last
five years and at present and it was expected to increase slightly in the next five years.
The major economic impacts on banks operations include profitability, low investment
opportunities due to political uncertainty, and deposit mobilization etc.
338

15.2.3.4.3 Social cultural factors
The social cultural environment did not have a major impact on bank’s operations and
banks expected it will also not change in the next five years. The major impacts of
social cultural environment on bank’s operations were peace/war situation in the
country, demography (more youngsters in the market), and technology driven delivery
channels.
15.2.3.4.4 Technology factors
Technology did have a reasonably high impact on banks operation during the last five
years, it has a high impact at present and also is expected to have a greater impact in the
next five years. The current impacts of technology on banks operations include new
products, customer services, network banking, link with global network such as Cirrus
and Maestro etc.
15.2.4.1 Research question 4 part1:Strategic planning practices of the banks which had a formalized strategic planning system
Except for one government owned bank all the other banks had a formalized strategic
planning system at their corporate level and therefore, strategic planning plays a major
role in the Sri Lankan commercial bank’s strategic management.
15.2.4.1.1 Strategic planning at corporate level
In 18 of the 20 banks the longer term plan was prepared first then the shorter term plan
was fitted into long term plan. Most of the banks update their corporate plans every year
and review the progress of corporate plans monthly or quarterly (more than half of the
banks). Most effort was spent on action planning or operational planning for the next 1
to 3 years followed by short term emergency planning and formalized contingency
planning.
The banks spent a higher degree of effort on forecast development in the areas of
competitive analysis, laws and regulations for financial services sector, industry level
339

demand, and domestic economy respectively. Overall, most of the banks purchased
external forecasts in the areas of laws and regulations for financial services sector, and
technology. The highest degree of forecast transmission from corporate level to second
level were for domestic economy, technological, laws and regulations for financial
services and human resources. Overall banks did not report a severe impact on quality
of corporate planning, second level planning, and other lower levels of planning efforts
if external forecasts purchased by corporate planning were not available.
The most reported major headings of the banks corporate plans were goals, objectives,
corporate strategies, deposit mobilizations, implementation and monitoring, feedbacks,
competitive analysis, and environmental analysis etc. In most of the banks only senior
management had access to their corporate plan. The areas of corporate plan which had
the highest added values over the second level plans were financial, sources and uses of
funds.
The banks did not have an extensive use of computer models/systems for their corporate
planning. However, almost all the banks used forecasting models, financial models, and
strategic decision support systems for their corporate planning.
Only 7 locally owned banks reported having a corporate planning department and these
banks also had a very low level of rotation of the line personnel through the corporate
planning department. The chief corporate planner was more likely to attend capital
budgeting meetings than divisional planning meetings and group planning meetings.
Furthermore, the corporate planning department had the authority to obtain substantive
revisions in second level plans, obtain procedural revisions in second level plans, and
review and criticise second level plans to a high extent.
Banks spent a reasonably high amount of effort to define guidelines, formats and time
tables for planning activity, in identifying areas of new business opportunities, and
reorganize the company around more clearly defined business units. Similarly a high
amount of effort was given to help corporate management formulate goals and
objectives, and to help corporate management formulate strategy.
340

Overall, the banks planning process plays an important role in strategically managing
banks organizational structure, to sequence future activities, and have measurable
positive effect on sales and profits. The banks planning process is a device to assure that
conflicting expectations are resolved and is a means for systematically dealing with
uncertainty, and a key device for allocating corporate resources throughout the
company.
Overall, banks put a high amount of effort to identify possible impacts of the economy,
the sources of funds, the customer demands, technological developments, competitors
cost structure, and the impacts of the government on banks operations respectively.
Banks competitive analysis, supplier analysis, economic analysis, and political analysis
were major activities of corporate level management, customer analysis was a major
activity of marketing people and corporate level management, and technology analysis
was a major activity of operations people.
The banks corporate planning were coordinated with financial planning, operations
planning, marketing planning, human resource planning, and technology planning to a
reasonably high extent. Furthermore, the banks finance, operations, marketing, and
human resource departments provide high quality information for their corporate
planning. It was also found that banks were not getting a great deal of resistance from
their finance, operations, marketing, and human resource departments to their corporate
planning.
CEO/GM’s were involved to a great extent in the development of corporate goals,
missions, objectives, alternative strategies, and evaluation and approval of the corporate
plans, and having planning as a philosophy in the bank. Furthermore, the CEO had a
greater influence on the format of the corporate plan, assumptions used in the final
corporate plan, objectives embodied in the final corporate plan, approval of the final
corporate plan, and development of missions for second level units while corporate
planning department had a reasonably high influence and the outside board of directors
had less influence. The top second level line managers had a reasonably high influence
only for development of missions for second level units.
341

Eight banks were not expecting to introduce any changes to their strategic management
process and the other banks expected major changes in their strategic management
process were to continue participatory decision making process for strategic planning,
and develop strategic thinking capabilities in all levels of the banks.
15.2.4.1.2 Strategic planning at second level
Only four banks reported have second level long term plans. The major headings of
second level plans in most banks were environmental analysis, business strategies,
forecasts and budgets, revenue targets, time frames for assessment and volume targets
for products and services etc. Banks grouped their second level units for planning the
same way they were grouped for operations and their major long term plans at the
second level were revenue targets, volume targets, and the time frames for the
assignments.
The banks used computer models, systems for their second level planning to some
extent but not to a high extent. It was also found that computer models/systems have
been useful to a reasonable degree.
15.2.4.1.3 Contingency planning
All the banks with formalized strategic planning developed formal contingency plans as
part of their long term planning effort. Nine banks had contingencies only for corporate
level and the other 11 banks had contingency plans both for the corporate and second
level
15.2.4.1.4 Third level and fourth level planning
Only 2 banks had third level business plans and none of the banks reported have fourth
level long term planning.
342

15.2.4.2 Research question 4 part 2: Strategic thinking capabilities of the banks
Overall, banks strategy is made on an iterative basis, involving managers, staff and
executives in an on going dialogue to a reasonably high extent and the banks employees
were not willing to take risks.
Banks considered they just a part of a business system that crosses a variety of
industries and they think strategically about which of these competing networks of
suppliers they join and how they position within that ecosystem to a reasonable high
extent. Similarly, banks identified the importance of fit between corporate, business,
functional, and personal may be the most critical at all levels to a reasonably high
extent. Thus, overall, banks had a reasonably high understand about the relationship of
the interdependencies of their value creation process.
It was found that, overall banks did not focus much about the strategic intent. It was
also found that size aspects were more associated with the strategic intent than the
ownership aspects.
Overall, banks agreed with the statement that strategic thinking is always thinking in
time and it connects past, present and future to a high extent. Thus, banks overall had a
high understand about the importance of “thinking in time” in their strategic
management.
It was found that overall, banks did not leave much room for emergent strategies.
However, It was also found that employees rely more on their top management
foresight and they were not willing to take risks. Thus, the intelligent opportunism of
banks lower levels remained low.
The results show that medium sized banks had the higher level of strategic thinking
capabilities than the large and small sized banks and locally owned banks had the higher
level of strategic thinking capabilities than the government and foreign owned banks.
343

15.2.5 Research question 5: Differences in the strategic management practices by size and ownership aspects
The differences in the strategic management practices either by size or ownership
aspects were highlighted throughout the data analyses in chapters 7-13. To answer
research question 5 the significant differences of key strategic management practices
either by size or ownership aspects will be briefly explained in terms of company
structure, culture and management style, mission and vision, long term goals, planning
and planning systems, corporate strategies and processes, and management of quality.
15.2.5.1 Company structure
All the large and medium sized banks had MSBU structures and most of the small sized
banks reported have SSBU structures. Similarly, all the government and 88.9% of the
locally owned banks reported have MSBU structures and 60% of the foreign owned
banks had SSBU structures. Surprisingly, ownership aspects were more associated with
company structures than the size aspects. More products and services of the government
owned and the locally owned banks caused locally and government banks to have more
MSBU structures than the foreign owned banks.
All the locally owned and government banks had a third level and only government
banks reported have a fourth level.
15.2.5.2 Organizational culture and management style
The influence of Sri Lankan government on government banks organizational cultures
was significantly higher than for the locally owned and foreign owned banks. The
cultural characteristics such as concentrate more on self development along with the
development of organization, influence on country politics, reacting nature and slow
adaptation to the culture, informal group prefer their values, norms beliefs contribute to
the culture were seen in a government bank and were associated with ownership
aspects. Furthermore, the most important action such as encouragement of team work
rather than individual contributions was seen as of low importance in government
banks.
344

Some of the major cultural changes made by the banks during the last five years such as
introduction of new job descriptions, and introduction of new tasks were associated with
ownership aspects and were seen only in foreign owned banks. Similarly, 3 foreign
owned banks reported low profitability and economic changes as major factors that
supported their major cultural changes during the last five years. Influence of trade
unions and informal groups was a major factor that made government banks cultural
changes difficult. It was also found that two government banks and a locally owned
bank expected to introduce changes for their bank hierarchy in the next five years.
The presence of sub cultures was seen in all the large banks, 2 medium and 1 small
sized banks. Working within a department was a major reason for the development of
sub cultures in 5 locally owned banks.
Key management characteristics such as individual performance, and power motives
rather than achievement motives were seen only in a government owned bank.
Furthermore, corporate management in locally owned banks had a greater influence on
their management styles than the government and foreign owned banks. It was also
found that government bank’s management styles had a greater effect on follower’s
performance and job satisfaction than the foreign and locally owned banks. The
government owned banks and two foreign owned banks reported have problems in their
current management styles.
15.2.5.3 Mission and Vision statements
This study investigated the mission and vision statements of only government and
locally owned banks and therefore, only the significant differences by size aspects will
be mentioned.
Corporate level management, CEO, outside members of the board of directors in large
and small sized banks had a greater influence on their current mission statement than the
medium sized bank. However, second level managers in large banks had a significantly
lower level of influence on their current mission statement than the medium and small
sized banks.
345

Regarding the vision statement, corporate planning department, and other lower levels
of managements in large banks had a significant lower level of influence than the
medium and small sized banks.
15.2.5.4 Long term goals
Quantitative long term goals such as stock market goals and dividend maintenance
goals were reported only from 5 locally owned banks and similarly goals such as loans,
and staffing were reported only from a government bank. Market share was a
quantitative long term goal of 3 large and 1 medium sized banks but not reported from
any of the small sized banks. Most of the foreign owned banks did not have the societal
goals but those were qualitative goals for all the government banks and most of the
locally owned banks. Furthermore, Central Bank of Sri Lanka had a significantly higher
influence on government banks corporate long term goals than for the locally owned
and foreign owned bank’s corporate long term goals.
All the large and small sized banks which changed their corporate long term goals had
upgraded or updated the goals during the last five years and only one medium sized
bank reported the formalization or explicitness of goals. Unsatisfactory performance of
government banks played a greater role to change their corporate long term goals than
for locally owned and foreign owned banks.
Only 8 banks had long term goals at their second level and these include 4 large, 2
medium and 2 small sized banks. The banks which had second level long term goals
were associated with size aspects. The units of measurements of second level long term
goals such as return ratios and cash flows were associated with ownership aspects and
were seen in the locally owned and foreign owned banks.
346

15.2.5.5 Planning and planning systems
Only one government bank did not have a formalized strategic planning system at their
corporate level and all the other banks reported have a formalized strategic planning
system. However, only 4 banks reported have a formalized planning system at second
level and these banks included 2 large and 2 medium sized banks.
Most of the banks updated their corporate plans every year but the government banks
and the other 3 foreign owned banks updated their corporate plans every six months.
Similarly, most of the locally owned banks reviewed the progress of corporate plans
quarterly.
Regarding contingency planning, the government owned bank spent a higher degree of
effort on formulating contingency planning than the locally owned and foreign owned
banks.
The government bank spent a significantly higher degree of effort on forecast
development in the area of social and or cultural than the locally owned and foreign
owned banks and similarly, large banks reported a significantly higher effort on social
and or cultural than the small and medium sized banks. Furthermore, government banks
had a significantly higher level of transmission of forecasts in the area of social and or
cultural from corporate level to second level and similarly, medium sized banks had a
significantly higher transmission in the area of suppliers requirements than the large and
small sized banks.
The major headings of corporate plan such as vision, mission, and action plans, were
seen in the government and most of the locally owned banks and the major heading
such as customer analysis was seen in all the locally owned and most of the foreign
owned banks. Similarly policies and procedures, and customer demand were major
headings of corporate plan in all the large and most of the small sized banks. The
government bank reported a significantly higher added value of the corporate plans over
the second level plans in the areas of operations and research and developments.
347

Most of the locally and foreign owned banks used financial models while the
government banks and most of the locally owned banks used planning models for their
corporate planning. Government banks reported a significantly higher usage of
computer models/systems for their corporate planning than the locally owned and
foreign owned banks.
Only 7 banks had a corporate planning department and all these were locally owned
banks.
Regarding the various functions of corporate planning, government banks put a
significantly higher degree of effort on preparing specific studies, help corporate
management with merger plans, and help corporate management with joint venture
plans than for the locally owned and foreign owned banks. However, locally owned
banks put a higher degree of effort on assessing the overall effectiveness of the planning
process than the government and foreign owned banks. Similarly, medium sized banks
put a higher degree of effort on monitor and control progress versus plans than large and
small banks, and small banks put a higher degree of effort on help corporate
management with sources and uses of fund plans than the large and medium sized
banks.
Regarding the nature of the banks planning process, in large and small sized banks
planning process plays an important role in auditing ongoing activities rather than for
the medium sized banks. Similarly, in government and locally owned banks the
planning process encourages the development of new business by combining expertise
and resources from lower level units to a greater extent than for the foreign owned
banks. It was also found that government bank’s planning process helps to focus the
company’s R & D efforts around defined opportunity areas more than for the locally
owned and foreign owned banks. Locally owned and foreign owned banks considered
their planning process is a means of systematically dealing with uncertainty than for the
government banks.
In the government bank their planning process is more adaptive, evolving, learning
activity than for the locally owned and foreign owned banks. Small banks considered
their planning effort is a more routinised activity than for the large and medium sized
348

banks. Sales and marketing people in locally owned banks were more responsible for
their competitive analysis than the sales and marketing people in government owned
and foreign owned banks. Furthermore, government bank did not put a great deal of
effort to identify the sources of funds than for the other banks and the financial people
in locally owned and foreign owned banks were more responsible for their supplier
analysis than the financial people in government banks. Corporate level management
were also more responsible for the supplier analysis in locally owned and foreign owned
banks than for the government banks. It was also found that customer analysis was a
major activity of the second level management in small banks but, not in large and
medium sized banks.
Regarding the coordination issues involved in the banks planning process, locally
owned banks get very high quality information from the finance department for
corporate planning than for the government and foreign owned banks. Furthermore,
government banks get a great deal of resistance from their finance people and
operations people than do the locally owned and foreign owned banks from their
finance and operations people.
The board of directors involvement in corporate planning processes in foreign owned
banks were significantly lower than for the locally owned and government owned
banks. The influence of outside members of the board of directors in foreign owned
banks on the format of the corporate plan, assumptions used in the final corporate plan,
objectives and strategies embodied in the final corporate plan, and approval of the
corporate plan was also significantly lower than for the government and locally owned
banks. Furthermore, there was no influence of top second level line managers in the
government owned bank on the strategies embodied in their final corporate plan and the
approval of their final corporate plan.
The planning effectiveness of the government bank was lower when compared with the
locally owned and foreign owned banks.
Only 4 banks reported have formalized long term plans at second level and these
include 2 large and 2 medium sized banks. Thus, the banks which had second level
planning systems were associated with size aspects.
349

15.2.5.6 Corporate strategy and processes
PEST and five forces analysis were used in locally owned and foreign owned banks to a
greater extent than the government banks during the last five years. The government
banks benchmarked with each other to a greater extent than the locally owned and
foreign owned banks benchmarked with the government banks. Competitiveness and
market leadership were major dimensions of a government bank’s benchmarking
process and similarly market share was a major dimension of most of the medium sized
banks.
Regarding the importance of criteria in evaluating expenditure proposals, government
banks reported a lower importance in forecast net operating profit, short term cash flow
benefits, and discounted cash flow analysis than the locally owned and foreign owned
banks. The foreign owned banks considered the forecast of market share growth less
important than for the government and locally owned banks. Locally owned banks
considered growth of market for which expenditure is required as more important than
the government and foreign owned banks.
The explicit part of the medium sized banks and also the locally owned banks corporate
strategies was to enter markets where technology is important. Large and medium sized
banks seek growth through introducing new products into new markets more than for
the small sized banks during the last five years. Surprisingly, in the next five years small
banks expected to introduce new products into new markets more than for the large and
medium sized banks. Furthermore, large banks attempted to be first to market with new
products and services and small sized banks attempted to be a later entrant in
established but still growing markets to a great extent. Similarly, locally and foreign
owned banks attempted to be an entrant in mature, stable markets to a greater extent
than the government banks.
Regarding acquisition strategies, medium sized banks expected that acquisition
strategies will play more of a major role in their corporate strategies than the large and
small sized banks in the next five years.
350

15.2.5.7 Management of quality
There were significant differences found in the strategic approach towards quality in the
banks either by size or ownership aspects. Awareness building and training to change
the attitude, incentives/rewards for quality services, re-engineering programmes, and
physical importance of work places were strategic approaches towards quality in a
government bank. Similarly customer care was a strategic approach in most of the large
and small sized banks but, not in the medium sized banks. Medium sized banks reported
strategic approaches were brainstorming, and improve product efficiency and these
were not reported by the small and large banks.
In addition to the corporate level management and the CEO, in a government owned
bank outside members of the board of directors, corporate planning department, and
other lower levels of management were also responsible for addressing their major
strategic quality issues. In all the medium sized and most of the large banks second
level line managers were also responsible for addressing their strategic quality issues.
Government owned banks considered the quality of customer service more than for the
locally owned and foreign owned banks. Similarly, the CEO in government banks seek
to establish the total quality management philosophy within the company to a greater
extent than for the locally owned and foreign owned banks but, senior managements in
local banks commit the resources for continuous quality improvements to a greater
extent than the government and foreign owned banks. Furthermore, locally owned and
foreign owned banks regularly assess the quality of its tangible assets, and the quality of
its intangible products more than for the government banks.
15.2.6 Research question 6: Without a formalised strategic planning system, how do the commercial banks strategically manage their banks?
There was only one bank which did not have a formalized strategic planning system at
their corporate level. Thus, this research study has ignored the planning system aspects
because to compare one bank with other 20 banks which had formalized strategic
planning system will not provide a meaningful comparison for the reader. For this
reason, this study did not explore research question number six.
351

15.3 The unique features associated with different categories of banks
The major findings of the current study demonstrate a number of unique features for the
strategic management practices associated with different categories of Sri Lankan
commercial banks. These features will be discussed under the six different categories
namely government owned, locally owned, foreign owned, large, medium, and small
banks.
15.3.1 Government banks
The research findings reveal the number of unique features that were associated with the
government banks. Government banks reported the maximum profits for the year of
2004 when compared with the other commercial banks in Sri Lanka. The only bank
which had a NFSP in this study was a government owned bank. However, that
government bank which had a NFSP system mentioned that they are planning to re-
establish a formalized planning system in their bank within the next two years.
The government banks had the most number of branches and employees compared to
other commercial banks. The only banks which had a fourth level of organization
structure were government owned banks. All the government banks had changed their
structures during the last five years and to improve their efficiency was the main reason
for their structural changes. Thus, it is worth noting that efficiency was a major
consideration for the government banks during the last five years.
The government banks had the lowest level of satisfaction with their current
organizational culture compared with the locally owned and foreign owned banks. Their
trade union actions negatively affected the banks culture. They also reported having
problems in their current management styles such as lack of strategic planning, too
much listening to trade union’s views, and inequity on policy decisions. It also found
that government banks had the highest power distance between managers and their
subordinates and also more internal politics compared with the other banks.
352

Two different processes were used by the two government banks to develop their
corporate goals. One government bank developed their corporate goals by aggregating
the goals developed by second level management and the other government bank
developed their corporate goals through a negotiation process between the corporate
level/board of directors group and second level management.
The government bank which had a FSP system spent a high degree of effort on
contingency planning. They also purchased the external forecasts in the areas of
domestic economy, laws and regulations for financial services sector, and competitive
analysis. Furthermore, they transmitted forecasts of social and or cultural, financial
markets, human resources, industry level demand, technological, competitive analysis
from corporate level to second level to a great extent. However, this government bank’s
second level units had difficulties to obtain information if they had to purchase from
external sources which they currently receive from the corporate level. It was also found
that the second level and up had access to the government bank’s corporate plan.
Furthermore, the areas of operations, technology, financial, human resources, research
and development, markets had a greater added value to the corporate plan than for the
second level plans.
The government bank developed contingencies only for the corporate level. They
prepared specific studies in their corporate planning to a higher degree and helped
corporate level management with non performing loan plans than for the locally owned
and foreign owned banks. However, the government bank’s planning process did not
play a greater role in auditing ongoing activities, strategically managing their
company’s organizational structure, and strategically managing their quality issues. The
government bank gets a higher level of resistance from the finance and operations
people for their corporate planning than for the other banks.
The government bank that had a FSP system experienced problems in their strategic
planning process and these problems included lack of participative decision making
processes and a lack of strategic thinking at the top level. Therefore, the government
bank expected to apply more participatory techniques and methods in their strategic
management approaches in the next five years.
353

Overall, the government banks were categorized as moderate strategic thinkers and
except for intelligent opportunism all the other thinking capabilities such as employee’s
participation and risk taking behaviours, systems perspective, strategic intent, and
thinking in time remained at moderate levels.
Surprisingly, PEST and five forces analysis did not have a great influence on
government banks corporate strategies and they used service and market portfolio
matrix to a higher extent than the other banks. The government banks benchmarked
with each other to a greater extent and their major dimensions of benchmarking process
were profitability, productivity, cost/income, competitiveness, and market leadership.
Furthermore, the government banks seek the growth through introducing existing
products into new markets and introducing new products into new markets both during
the last five years and also for the next five years to a great extent. They also attempt to
be first to market with new products and services, and also an early follower of initial
entrants in fast growing new markets to a great extent.
15.3.2 Locally owned banks
There were nine locally owned banks who were operating in Sri Lanka and these
include 3 large, 2 medium and 4 small sized banks. Most of the locally owned banks
had multiple business unit structures. All the locally owned banks had a corporate,
second, and third levels and this may be due to their high number of products and
services. More than 60 percent of the locally owned banks had a hybrid form of
centralized and decentralized structures and more than 50 percent of the locally owned
banks did not change their structures during the last five years.
Six of the nine locally owned banks were listed in the Sri Lankan stock market and
among them 4 were widely held and 2 were subsidiary of Sri Lankan companies. Three
locally owned banks had changed their ownership during the last five years and these
include two mergers and 1 change of major shareholders. Except for one locally owned
bank all the other banks did not expect to change their ownership in the next five years.
354

Locally owned banks reported the highest level of satisfaction with their current
organizational culture and CEO and corporate level management had the highest
influence on their organizational culture. Regarding the management style, none of the
locally owned banks reported any significant problem in their management style.
Over the last five years for locally owned banks most of the revenues came from 5-10%
market growth environments. Their sales revenues fell into more unpredictable
competitor environments than the government and foreign owned banks and their most
important markets were deposits and retail. Furthermore, the major customer groups of
most of the locally owned banks were manufacturing, export, wholesale and retail trade.
Locally owned banks reported the lowest level of company dependence on their major
100 customers and their major sources of funds were domestic customers and domestic
organizations respectively.
Except for one locally owned bank all the other locally owned banks had corporate long
term goals. Most of the locally owned banks developed their corporate long term goals
through the negotiation process between the corporate level/board of directors group
and second level management and through the negotiation process between the chief
executive officer and corporate level management respectively. These banks also
reported the highest level of corporate goal achievement than for the other banks.
All the locally owned banks reported having a formalized planning system at their
corporate level and for most their longer term plan was prepared first and the shorter
term plan then fitted into long term plan. These banks spent a high degree of effort on
action planning or operational planning for the next 1 to 3 years and short term
emergency planning and also they spent a high degree of effort on forecast development
in the areas of competitive analysis, industry level demand, laws and regulations for
financial services sector, and domestic economy. Most of these banks purchased
external forecasts in the areas of technological and laws and regulations for financial
services sector. High degrees of forecast transmission were in the areas of domestic
economy and technological aspects from corporate level to second level. In most of the
locally owned banks only senior management had the access to their corporate plan. The
areas of financial, and sources and uses of funds had a higher added value to the
corporate plan than for the second level plans. 77.8% of the locally owned banks had a
355

corporate planning department and only 4 locally owned banks reported having second
level long term plans.
In locally owned banks their planning process plays a greater role in their
communication network and also managing their organizational structure. In these
banks the planning process plays a greater role in allocating corporate resources
throughout the company and systematically dealing with uncertainty. All key personnel
in locally owned banks contribute their fair share of effort for their corporate planning
to a great extent than the other banks. Their corporate management were more
responsible for the competitor analysis, supplier analysis, political analysis, economic
analysis, and social and or cultural analysis than the other personnel in their banks and
operations people were more responsible for the technology analysis and marketing
people were more responsible for the customer analysis. Furthermore, locally owned
banks financial planning was closely coordinated with corporate planning than the other
banks. They also received high quality information from the finance, operations,
marketing, and human resources departments for their corporate planning than for the
other banks. Most of the locally owned banks expected to continue their participatory
decision making process for strategic planning, and develop strategic thinking
capabilities in all levels of the bank in the next five years.
Locally owned banks benchmark with domestic banks to a great extent and major
dimensions of most of their benchmark process were profitability and NPL. The most
important criteria in their evaluating expenditure proposals were discounted cash flow
analysis, forecast return on investment and net operating profit. The explicit parts of
locally owned banks corporate strategies were to enter high growth markets and to enter
markets where technology is important. These banks sought growth through introducing
existing products into new markets and also introducing existing products into existing
markets during the last five years and expected the growth through introducing new
products into existing markets and also to the new markets for the next five years.
Furthermore, they preferred to be an entrant in mature, stable markets and a later entrant
in established but, still growing markets.
Regarding the strategic thinking capabilities, these banks reported the highest level of
thinking capabilities than for the government and foreign owned banks. Employee’s
356

participation and their risk taking behaviours, systems perspectives remained at
moderate level and thinking in time was strong in these banks. However, capabilities
such as strategic intent and intelligent opportunism were low in these banks.
These banks considered management of quality as a strategic issue more than the other
banks and most of the locally owned banks reported strategic approaches towards
quality were customer care, staff training for every level of the organization etc.
15.3.3 Foreign owned banks
There were only one medium sized foreign owned bank and all the other banks were
small sized. Most of the foreign owned banks had single business unit structures and
only 4 foreign owned banks reported having a third level.
Foreign owned banks considered important the management of their culture but it was
less important than for the other banks. Corporate level management and chief
executive officer had the highest influence on their company culture and half of the
foreign owned banks had changed their cultures during the last five years. Their most
important action on their company culture was to encourage the communication and co-
operation between different departments. Half of the foreign owned banks expected to
change their cultures in the next five years and most of these changes were due to the
expected growth in the banking industry of Sri Lanka. Most of foreign owned banks
reported having characteristics such as bureaucratic, top to bottom approach, and
participatory decision making in their management style.
For foreign owned banks most of the revenues came from the 5-10% market growth
markets. Most of these banks major customer groups were export, manufacturing, and
wholesale and retail trade and their major sources of funds were from domestic
customers and overseas head offices respectively. Government policies had an impact
on their banks operations to a greater extent than for the other banks and capital
requirements, increase of taxes in financial services, on sight and off sight
examinations, and interest rate controls were the government policies that most affected
their operations.
357

All the foreign owned banks just follow their mission and vision of their head office and
did not develop separate missions or visions for the Sri Lankan banking industry.
Ninety percent of the foreign owned banks had long term corporate goals and all of
them reported having quantitative corporate goals and 89% of them reported having
qualitative corporate goals. Most of these banks developed their long term corporate
goals through a negotiation process between the chief executive officer and corporate
level management. Furthermore, 80% of the foreign owned banks did not have long
term goals at the second level.
All the foreign owned banks had formalized strategic planning system at their corporate
level. In these banks the longer term plan was prepared first, and the shorter term plan
was then fitted into the long term plan. Most of the foreign owned banks update their
corporate plans every year and review the progress of corporate plans monthly. Their
most effort was spent on action planning or operational planning for the next 1 to 3
years and the most of the effort spent on the forecasts development was in the area of
laws and regulations for financial services sector. Most of these banks purchased
external forecasts in the area of laws and regulations for financial services sector. In
70% of the foreign owned banks only senior management had the access to their
corporate plan. All of them used forecasting models and financial models and 90% of
them used strategic decision support systems for their corporate planning. None of the
foreign owned bank reported having a corporate planning department.
A high degree of effort was spent on defining guide lines, formats and timetables for
planning activities and identifying areas of new business opportunities in the foreign
owned banks. Their planning process plays an important role in strategically managing
their organization’s structure and it has had a measurable positive effect on their sales
and profits. In these banks corporate level management were more responsible for their
competitive, supplier, customer, political and economic analysis than the other people in
their banks. Furthermore, in these banks financial planning was closely coordinated
with corporate planning and these banks get very high quality information from the
operations department for corporate planning to a reasonably high extent. The CEO had
a great influence on the format of corporate plan, the assumptions used in the final
corporate plan, and the approval of the final corporate plan but their outside members of
the board of directors had a low influence on these aspects.
358

Foreign owned banks benchmark with domestic banks and other foreign owned banks
to a great extent. Most of these banks major dimensions for the benchmarking process
were profitability, asset quality, productivity, and cost/income respectively. Discounted
cash flow analysis, forecast net operating profit and return on investment, forecasts sales
growth, and track record of manager of unit requesting funds were considered more
important for these banks in evaluating expenditure proposals. The explicit part of their
corporate strategies was to enter high growth markets. These banks sought growth
through introducing existing products into existing markets over the last five years and
they expected to seek the growth through introducing new products into existing
markets in the next five years. Overall, foreign owned banks preferred to be a later
entrant in established but still growing markets.
Foreign owned banks were weak strategic thinkers and these banks were lacking the
strategic thinking capabilities such as strategic intent and intelligent opportunism.
However, capabilities such as employees’ participation and their risk taking behaviours,
and thinking in time remained at moderate level.
Management of quality was considered significant in all the foreign owned banks and
strategic approaches towards management of quality in most of these banks were
customer care, staff training for every level of the organization etc. The employees of
these banks were involved in the quality approach to a reasonably high extent.
15.3.4 Large banks
There were 5 large banks in the sample of this study and these were two government
owned and 3 locally owned banks. Large banks had the higher revenues, profits and
employees than the other banks and except for one large bank all the other banks had a
formalized strategic planning system at their corporate level. All the large banks
reported having multiple business unit structures and all of them had corporate, second,
and third levels. All of these banks categorized their structural type as hybrid form of
centralized and decentralized structures.
359

In large banks their mission, strategy and goals were widely communicated to the
employees and managers provided a greater deal of support to their subordinates than
for the other banks. Only two large banks had significant problems in their management
style and these were the government owned banks.
Major capabilities of most of the large banks were brand image, professional staff, up to
date technology, and island wide branch network and most of the large banks
categorized these capabilities as crucial to the success of their business in the Sri
Lankan banking sector.
Most of the revenues of large banks came from the markets that have a growth rate of 5-
10% and 10-20% respectively. Furthermore, for these banks 25% and 30% of revenues
fell into environments which their competitor’s actions were highly predictable and
predictable. Major customer groups of most of the large banks were manufacturing,
wholesale and retail trade, services and agriculture respectively. Overall, 70% of these
banks funds came from the domestic customers and 83% of their major sources of funds
had no availability problems.
All the large banks had missions, visions, and corporate long term goals. Corporate
level management and CEO had the greatest influence on corporate long term goals and
most important roles of these banks corporate long term goals were to evaluate their
past performance and monitor current performance. Except for one large bank all the
other banks had second level long term goals and for most of these banks second level
goals were created through a negotiation process between the corporate level/and
second level management.
Large banks spent most of their effort on action planning or operational planning for the
next 1 to 3 years and formalizing contingency planning. Similarly these banks spent
most effort on forecast development in areas of domestic economy, financial markets,
human resources, and competitive analysis. Most of these banks purchased external
forecasts in the areas of laws and regulations for financial services sector. The higher
degrees of forecast transmission from corporate level to second level were for domestic
economy, technological, human resources, and industry level demand. Most of the large
banks developed contingencies only for the corporate level. Identify areas of new
360

business opportunity and recognize the company around more clearly defined business
units, and define guidelines, formats, and timetables for planning activities were the
major specific planning tasks in these banks corporate planning. Corporate level was
most responsible for the competitive, supplier, political and economic analyses and
marketing people were most responsible for the customer analysis and operational
people were most responsible for the technology analysis in these banks. Thus, in large
banks the responsibilities of external analyses were decentralized to other departments
to a great extent. Furthermore, in these banks financial planning is closely coordinated
with corporate planning to a great extent and they get very high quality information
from the finance department for corporate planning to a great extent. In large banks the
board of directors had a greater involvement in their corporate planning process and
they were more supportive than for the other banks.
SWOT, five forces, and PEST analyses had a great influence on corporate planning and
benchmarking also played a major role on their corporate strategies. The major
dimensions of most of these banks benchmarking process were profitability and
productivity. Budgetary distinction in capital expenditure were considered most
important in the long term resource allocation decisions and forecasts return on
investment and present market share position were the most important criteria in
evaluating expenditure proposals.
The explicit part of these banks corporate strategies was to enter high growth markets.
Overall, large banks preferred to be first to market with new products and services. All
these banks had international operations and 11% of their revenues came from outside
Sri Lanka. These banks also seek foreign markets to a high extent in which they can
market existing products and technologies.
Large banks were moderate strategic thinkers and except for intelligent opportunism
their thinking capabilities such as systems perspective, strategic intent, and thinking in
time remained at a moderate level.
Overall, large banks considered the management of quality as a strategic issue to a
reasonably high extent and for most of these banks the strategic approach towards
quality in their banks were customer care and operational level staff are trained in
361

quality and monitored. Sixty percent of these banks reported their second level line
managers and up were responsible for addressing their major strategic quality issues.
15.3.5 Medium sized banks
There were 3 medium sized banks in the sample and these include 2 locally owned
banks and one foreign owned bank. All these banks had multiple business unit
structures and also they had corporate, second, and third levels. Medium sized banks
reported a higher level of importance about the management of culture than the other
banks. The CEO had the greatest influence on their company culture and most
important action on their company culture was to encourage the development and
implementation of new ideas. The major characteristics of these banks management
style were bureaucratic, top to bottom approach, participatory and it was corporate
management who had the greatest influence on their management style. None of these
banks had any problem with their management style.
Most of the sales/revenues came from the markets which had a market growth rate of 5-
10% during the last five years. Similarly, most of their revenues fell into environments
which their major competitor’s actions were predictable. Major customer groups of
these medium sized banks were manufacturing, export, wholesale and retail trade.
Medium sized banks reported the lowest level of dependence on their major 100
customers. Overall, 65% of the funds came from the domestic customers.
Only two medium sized banks had mission statements and all the medium sized banks
had a vision, and corporate long term goals. Corporate level management and CEO had
the most influence on these banks corporate long term goals. In one bank corporate long
term goals were formulated by the corporate level, board of directors and second level
management and in other two banks it was a negotiation process between the chief
executive officer and corporate level management. The most important roles of these
banks corporate long term goals were the evaluation of past performance and monitor
current performance. Only two banks in this category reported having second level long
term goals.
362

All the medium sized banks had a planning system at their corporate level. In these
banks longer term plan was prepared first, and the shorter term plan was then fitted into
long term plan. They update their corporate plan every year. More effort was spent on
contingency planning than the other planning activities. Furthermore, these banks spent
the most effort on forecast development in the areas of competitive analysis and
industry level demand. Most of these banks purchased external forecasts in the area of
technological. The higher level of forecasts transmission from corporate level to second
level were in the areas of technological, laws and regulations for financial services
sector, and competitive analysis. Only two of these banks had a formalized planning
system at their second level.
Define guidelines, formats and timetables for planning activity, and develop macro
forecast of the economy, financial markets, political environments etc were the major
planning tasks of these banks corporate planning. In medium sized banks the planning
process was necessary to sequence future activities, and it encouraged the development
of new business by combining expertise and resources from lower level units to a great
extent. Marketing people were most responsible for the competitive analysis and
customer analysis in these banks and corporate people were most responsible for the
supplier analysis, political analysis, economic analysis, and social cultural analysis.
Furthermore, operational people were most responsible for the technology analysis. It
was also found that financial planning was more coordinated with corporate planning
than the operations, marketing, human resources, and technology planning. Two of the
medium sized banks expected to develop strategic thinking capabilities in all levels of
their banks in the next five years.
SWOT and five forces analysis had the greatest influence on corporate strategies in the
medium sized banks. Benchmarking also had a high influence on corporate strategies
and these banks benchmark with domestic banks to a great extent. The major
dimensions for most of these banks benchmarking process were profitability and market
share. Budgetary distinction in capital expenditure was considered most important in the
long term resource allocation decisions. Discounted cash flow analysis, forecast return
on investment and net operating profit were the most important financial criteria in
evaluating expenditure proposals.
363

The most explicit parts of these banks corporate strategies were to enter high growth
markets and also to enter markets where technology is important. These banks expected
the growth through introducing new products into new markets in the next five years to
a great extent. Furthermore, these banks preferred to be an entrant in mature, stable
markets. Medium sized banks considered management of quality as a strategic issue
more than the other banks and brainstorming and staff training for every level of the
organization were the strategic approaches towards quality in most of these banks.
Personnel at second level and up were responsible for addressing their major strategic
issues.
Medium sized banks reported the highest level of strategic thinking capabilities than for
the other banks. Thinking in time was strong in these banks and other capabilities such
as employee participation, strategic intent, and intelligent opportunism remained at
moderate levels. Thus, these banks were moderate strategic thinkers.
15.3.6 Small sized banks
There were 13 small sized banks in the sample and 4 were locally owned and 9 were
foreign owned. Most of the small sized banks had single business unit structures and
most of them did not change their structures during the last five years. Similarly 90% of
these banks did not change their ownership during the last five years.
In the small sized banks the CEO had the greatest influence on their company culture.
The most important action on these banks company culture was to encourage
communication and co-operation between departments. The majority of these banks did
not expect to change their cultures in the next five years. Corporate management had the
greatest influence on small banks management style and only 2 banks reported having
problems in their management style. Internal politics in these banks were minimal
compared with the large and medium sized banks.
The most reported major capabilities of these banks were up to date technology,
professional staff, and service excellence and most of these banks considered those
three capabilities are crucial to the success of their business in the Sri Lankan banking
industry.
364

Most of the small banks revenues came from the markets that had a 5-10% and 10-20%
growth rates respectively. Overall, 62% of their sales/revenues fell in to environments
that had more than 7 major competitors and these banks were not market leaders in
these markets. Major customer groups of most of these banks were export,
manufacturing, and wholesale and retail trade. Small banks reported a higher
dependence on their major 100 customers than the other banks.
All the small banks reported having a mission, vision and except for 2 small sized banks
all the other banks had corporate level long term goals. Most of these banks reported
having quantitative goals such as return goals, profits, income, cash flows, NPL, and
deposits and the qualitative goals such as customer focus, and focus on market segments
etc. The most important roles of corporate long term goals in these banks were monitor
current performance, and evaluate past performance. Not surprisingly only 2 small sized
banks had second level long term goals.
All the small banks had a formalized strategic planning system at their corporate level
and none of these banks had a formalized strategic planning system at their second
level. Except for one bank all these banks prepared their longer term plan first, and the
shorter term plans was then fitted into long term plan. Most of the effort was spent on
action planning or operational planning for the next 1 to 3 years rather than the other
planning activities. Overall, these banks spent a higher degree of effort on forecast
development in areas of laws and regulations for financial services sector, competitive
analysis, and supplier requirements. The higher degrees of forecasts transmission from
corporate level to second level were for domestic economy, laws and regulations for
financial services sector, technological and human resources. In most of these banks
only senior management had access to their corporate plan.
The major roles of these banks planning process were to strategically manage
company’s organizational structure, auditing ongoing activities, and sequence future
activities. In these banks corporate management was most responsible for the
competitive analysis, supplier analysis, customer analysis, political analysis, economic
analysis, and social and cultural analysis. Furthermore, in these banks financial planning
was coordinated with corporate planning to a great extent.
365

PEST, SWOT, and five forces analysis had the greatest influence on small sized banks
corporate strategies. Benchmarking had only a reasonably high influence on their
corporate strategies during the last five years. Major dimensions of most of these banks
benchmarking process were profitability, asset quality, and NPL. Budgetary distinction
in capital expenditures was considered most important in the long term resource
allocation decisions and forecast return on investment, forecast net operating profit and
discounted cash flow analysis were the most important criteria in evaluating these banks
expenditure proposals.
Small sized banks preferred to enter high growth markets and these banks sought
growth through introducing existing products in existing markets to a great extent in the
last five years. Among the 3 banks who made significant mergers there were two small
sized banks and the main objective of those two mergers was to extend their core
business activities. Seven small sized banks made significant turnarounds during the last
five years and they intend to restore money losing business to profitability rather than
divest.
These banks were weak strategic thinkers and were lacking strategic thinking
capabilities such as strategic intent and intelligent opportunism.
15.4 The unique features associated with strategic management practices in Sri Lankan banks
The major research findings reveal a number of important aspects of the strategic
management practices of the Sri Lankan commercial banks. First, whether it is large,
medium, or small, almost all these banks had formalized strategic planning systems at
their corporate level. It was also revealed that banks were also concerned about the
development of strategic thinking capabilities within their companies.
Overall, corporate level management were most responsible for the competitive,
supplier, economic and political analyses and marketing people were most responsible
for the customer analysis and operations people were most responsible for the
technology analysis. Therefore, banks responsibilities were decentralized to different
366

departments. Furthermore, the higher degrees of forecast transmission from corporate
level to second level were seen in the areas of domestic economy and technological
aspects.
The use of computer models/systems to support corporate planning remained at a lower
level but almost all the banks had used the models such as forecasting and financial
models and also strategic decision support systems.
There were no strong strategic thinkers found in the Sri Lankan commercial banks. The
strategic thinking capabilities such as strategic intent and intelligent opportunism were
not seen in most of the banks to a high extent. However, a high number of banks
expected to continue their participatory decision making process for strategic planning,
and also to seek to develop strategic thinking capabilities in all levels of their banks.
15.5 Significance of the study
15.5.1 Contribution to theory
This study provides a number of significant contributions to strategic management
theory. First, this study has investigated the strategic management practices of a
particular industry in a developing country which no one has attempted earlier.
Secondly, this study has investigated the strategic management practices of Sri Lankan
commercial banks by examining in depth a large number of variables that can affect
their strategic management practices. This study identifies how these variables operate
in the banking industry in Sri Lanka. Thirdly, the theoretical framework developed for
this study provides the foundation for other studies that want to investigate the strategic
management practices of other industries in Sri Lanka or in other developing countries.
Finally, this study highlights the importance of strategic planning for most of the banks
of Sri Lanka.
367

15.5.2 Contribution to practice
This study provides a number of contributions to the strategic management practices of
the Sri Lankan banking industry. First, this study has identified and discussed the
overall strategic management characteristics of the commercial banks. This will help the
corporate level managers to compare their strategic management characteristics with
other banks and to find out the strengths and weaknesses of their strategic management
practices. Secondly, this study investigates the number of internal and external factors
that can potentially affect the strategic management practices of the Sri Lankan banking
industry in the next five years. This will help corporate level managers to identify the
critical factors in their strategic management practices that need to be addressed in the
next five years. Finally, this study will provide insight knowledge about the strategic
management practices of the Sri Lankan banking sector and this will help both the local
and foreign investors who are willing to invest in this industry.
15.5.3 Contribution to the methodology
This study provides the methodology for the researchers who are willing to do research
on strategic management in Sri Lanka. This study reveals the importance of having
personal contacts with potential responding companies to achieve their participation in
research. This study also demonstrates the most applicable data collection method as
personal interviews for this type of research as most of the executives in Sri Lanka
preferred to give details in face to face interviews rather in writing especially for
confidential information. An introductory letter about the project that highlights the
importance of the research to the companies as well as to the Sri Lankan banking
industry may also help influence the companies to participate.
15.6 Limitations of the study
There are some limitations of this research. First, this study collected primary data from
the respondents in February 2006 and at that time most of the banks did not have final
annual reports for the year 2005. Thus, this research had to use the financial figures of
banks for the year 2004.
368

Secondly, due to time limits this study interviewed only one respondent from each of
the banks and therefore, the responses received for this study may be affected by
personal biases. Thus, the lack of interviews with lower level managers can be
highlighted as a limitation of this research.
15.7 Future directions
There are number of future directions possible to build on this study. First, a similar
kind of questionnaire and research approach can be used to investigate the strategic
management practices of other financial institutions in the Sri Lankan financial sector
such as specialized banks, insurance companies, non banking lending companies,
leasing companies etc.
Secondly, the theoretical framework and the major research questions of this study can
be redeveloped to investigate the strategic management practices of other industries in
Sri Lanka as well as in the other developing countries.
Finally, the database developed from this study provides valuable information on Sri
Lankan commercial banks for other researchers who are willing to do further research
into the Sri Lankan commercial banks.
15.8 Chapter Summary
First, this chapter has discussed the major research findings of this research according to
the major research questions developed for this study. Secondly, the unique features of
the strategic management practices by ownership and size aspects and also the unique
features of the strategic management practices in Sri Lankan commercial banks have
been discussed. Then this chapter states the significance of the study in terms of
contribution to theory, contribution to practice, and contribution to methodology.
Finally, this chapter highlights the limitations and possible future research directions.
369

References
370

References
Abeyaratna, D B 2005, Deposit taking by Non-Banking institutions (NBI) and emerging
challenges for commercial banks and regulators viewed 27 October 2007, http://www.apbsrilanka.org/articales/15an/artical-dheerendra.html.
Ackermann, F & Eden, C 2003, 'Powerful and interested stakeholders matter: Their
identification and management', Academy of Management proceedings, vol., pp. B1-B6.
Ahamed, I 2006, Market risk-applicability in emerging markets, viewed 27 October
2007, http://www.apbsrilanka.org/articales/17an/artical-17a-iftikar_ahamed.html. Anand, J & Singh, H 1997, 'Asset redeployment, acquisitions and corporate strategy in
declining industries', Strategic Management Journal, vol. 18, no. S1, July, pp. 99-118.
Angkasuvana, C 2005, Strategic management practices in the hotel industry of
Thailand, Doctoral Dissertation Thesis, AGSE, Swinburne University of Technology, Melbourne.
Ansoff, H I 1965, Corporate Strategy, McGraw-Hill, New York. Ansoff, H I 1988, The new corporate strategy, John Wiley & Sons, Inc. , New York. Ansoff, H I 1991, 'Critique of Henry Mintzberg's 'The design School: Reconsidering the
basic premises of strategic management'', Strategic Management Journal, vol. 12, no. 6, February, pp. 449-461.
Ansoff, H I & McDonnell, E J 1990, Implanting Strategic Management, 2 edn., Prentice
Hall International (UK) Ltd, Cambridge. Argenti, J 1980, Practical Corporate Planning, Allen and Unwin, London Armstrong, J S 1982, 'The Value of Formal Planning for Strategic Decisions:Review of
empirical research', Strategic Management Journal, vol. 3, no. 3, January, pp. 197-211.
Bakshi, G S & Zhiwu, C 1994, 'Baby boom, Population Aging, and Capital Markets',
Journal of Business, vol. 67, no. 2, Apr, pp. 165-238. Barker, V L & Duhaime, I M 1997, 'Strategic Change In The Turnaround Process:
Theory And Empirical Evidence', Strategic Management Journal, vol. 18, no. 1, January, pp. 13-38.
371

Barney, J B 1986, 'Organizational Culture:Can It Be a Source of Sustained Competitive Advantage? ' Academy of Management Review, vol. 11, no. 3, pp. 656-665.
Bate, S P 1996, 'Towards a strategic framework for chaning corporate culture', Strategic
Change, vol. 5, no. 1, January, pp. 27-42. Bergh, D 1997, 'Predicting divestiture of unrelated acquisitions:an integrative model of
exante conditions', Strategic Management Journal, vol. 18, no. 9, October, pp. 715-731.
Berkhout, F 1996, 'Life cycle assessment and innovation in large firms', Business
strategy and the environment, vol. 5, pp. 145-155. Berman, S L, Wicks, A C, Kotha, S & Jones, T 1999, 'Does Stakeholder Orientation
Matter? The Relationship Between Stakeholder Management Models And Firm Financial Performance', Academy of Management Journal, vol. 42, no. 5, October, pp. 488-506.
Bhander, G S & McAloone, T 2003, 'Implementing Life Cycle:Assessment in Product
Development', Environmental Progress, vol. 22, no. 4, December, pp. 255-267. Bisp, S, Sorensen, E & Grunert, G 1998, 'Using the key success factors concept in
competitor intelligence and benchmarking', Competitive intelligence Review, vol. 9, no. 3, July/September, pp. 55-67.
Blau, J 2007, 'Philips Tears Down Eindhoven R & D Fence', Research Technology
Management, vol., November-December, pp. 9-10. Bonn, I 1996, Strategic Management in Australian Organizations, Doctoral dissertation
thesis, AGSE, Swinburne University of Technology, Melbourne. Bonn, I & Christodoulou, C 1996, 'Strategic Planning to Strategic Management', Long
Range Planning, vol. 29, no. 4, August, pp. 543-551. Bossink, B A G 2007, 'Leadership for Sustainable Innovation', Internal Journal of
Technology Management and Sustainable Development, vol. 6, no. 2, pp. 135-149.
Bourgeois, L J 1980, ‘Performance and consensus’, Strategic Management Journal, vol.
1, no. 3, July-September, pp. 227-248. Bourgeois, L J 1996, Strategic Management: From Concept to Implementation, Dryden
Press, Fort Worth, TX.
372

Bowen, H P & Wiersema, M 2005, 'Foreign-based competition and corporate diversification strategy', Strategic Management Journal, vol. 26, no. 12, December, pp. 1153-1171.
Brewer, H L 1981, 'Investor benefits from corporate international diversification', Journal
of financial and quantitative analysis, vol. 16, no. 1, March, pp. 113-126. Campbell, A 1997, 'Mission Statements', Long Range Planning, vol. 30, no. 6, pp. 931-
932. Capon, N, Christodoulou, C, Farley, J U & Hulbert, J 1986, Corporate planning practice
in major American and Australian manufacturing companies , Columbia University Press, New York.
Capon, N, Farley, J U & Hulbert, J 1987, Corporate strategic planning, Columbia
University Press, New York. Capron, L, Mitchell, W & Swaminathan, A 2001, 'Asset Divestiture Following Horizontal
Acquisitions: A Dynamic View', Strategic Management Journal, vol. 22, no. 9, September, pp. 817-844.
Carmeli, A & Ashler, T 2004, 'The relationship between intangible organizational
elements and organizational performance', Strategic Management Journal, vol. 25, no. 13, December, pp. 1257-1278.
Cassiman, B & Veugelers, R 2006, 'In Search of Complementarity in Innovation
Strategy: Internal R & D and External Knowledge Acquisition ', Management Science, vol. 52, no. 1, January, pp. 68-82.
Central Bank of Sri Lanka 2005a, Financial Stability Review 2005, cat. no. Central Bank
of Sri Lanka, Colombo, pp. 1-46. Viewed March 2007, http://www.cbsl.gov.lk/pics_n_docs/10_publication/_docs/efr/financial_system_stability_review/FSR2005.pdf
Central Bank of Sri Lanka 2005b, Objectives, Functions & Organization, cat. no. Central
Bank of Sri Lanka, Colombo. Viewed October 2007, http://www.cbsl.gov.lk/pics_n_docs/10_publication/_docs/pa/booklet/bl_1.pdf
Central Bank of Sri Lanka 2006, Financial Stability Review 2006, cat. no. Colombo.
Viewed October 2007, http://www.cbsl.gov.lk/pics_n_docs/10_publication/_docs/efr/financial_system_stability_review/FSSR2006.pdf
373

Central Bank of Sri Lanka 2007, Financial Stability Review 2007, cat. no. Central Bank of Sri Lanka, Colombo. Viewed October 2007, http://www.cbsl.gov.lk/pics_n_docs/10_publication/_docs/efr/financial_system_stability_review/FSSR2007.pdf
Champoux, J E 2003, Organizational Behavior:Essential tenets, 2 edn.,
Mason:Thomson/South Western, Ohio. Chandler, A D 1962, Strategy And Structure, Massachusetts Institute of Technology,
USA. Channon, D F 1975, Strategy, Structure and financial performance in the service
industries, The SSRC, London. Charlene, L N N & Carolyn, Y W 2003, 'Technology sourcing and output of established
firms in a regime of encompassing technological change', Strategic Management Journal, vol. 24, no. 7, July, pp. 651-666.
Chiang, C C 2006, 'Return on R & D Investment Across High Tech Products Life Cycle',
The Journal of American Academy of Business, vol. 8, no. 2, March, pp. 260-264.
Chinowsky, P S & Byrd, M A 2001, 'Strategci Management in Design Firms ', Journal of
Professional Issues in Engineering Education and Practice, vol., no. 1, January, pp. 32-40.
Christodoulou, C 1984, Strategic Planning by Selected Australian Organizations,
Doctoral Dissertation thesis, Monash University, Melbourne. Clark, D N 2000, 'Implementation issues in core competence strategy making', Strategic
Change, vol. 9, no. 2, March-April, pp. 115-127. Clemens, B, Bamford, C.E & Douglas, T.J 2007, 'Choosing strategic responses to
address emerging environmental regulations: Size, perceived influence and uncertainty', Business Strategy and the Environment, October31.
Collins, D B 2001, 'Organizational Performance: The Future Focus of Leadership
Development', Journal of Leadership Studies, vol., Winter-Spring, p. 43. Collins, D B & Holton, E F 2004, 'The effective of managerial leadership development
programs: A meta-analysis of studies from 1980 to 2001', Human Resource Development Quarterly, vol. 5, no. 2, Summer, p. 217248.
Collis, D J & Montgomery, C A 1995, 'Competing on Resources: Strategy in the 1990s',
Harvard Business Review, vol. 73, no. 4, July/Aug, pp. 118-128.
374

Cummins, J D & Xie, X 2007, 'Mergers and acquisitions in the US property-liability insuarance industry: Productivity and efficiency effects', Journal of Banking & Finance, vol., September 2007.
Daft, R L 2001, Organization Theory and Design, 7 edn., South Western College
Publishing, Ohio. David, F R 1997, Strategic Management, 6 edn, Prentice Hall, Upper River, N.J. Davis, J G & Devinney, T M 1997, The Essence of Corporate Strategy:Theory for
modern decision making, Allen & Urwin, St.Leonards. Delios, A & Beamish, P W 1999, 'Geographic scope, product diversification, and the
corporate performance of japanese firms ', strategic Management Journal vol. 20, no. 8, August, pp. 711-727.
Demil, B & Bensedrine, J 2005, 'Process of Legitimization and Pressure Toward
Regulation', International Studies of Management and Organization, vol. 35, no. 2, Summer, pp. 56-77.
Denis, D J, Denis, D K & Sarin, A 1999, 'Agency Theory and the Influence of Equity
Ownership Structure on Corporate Diversification Strategies', Strategic Management Journal, vol. 20, no. 11, November, pp. 1071-1076.
Denis, D J, Denis, D K & Yost, K 2002, 'Global diversification, industrial diversification,
and firm value', The Journal of Finance, vol. 57, no. 5, October, pp. 1951-1979. Dess, G G, Lumpkin, G T & Eisner, A B 2006, Strategic Management-Text and Cases,
2 edn., McGraw-Hill/Irwin, New York. D'Orleans, J 2007, 'Give meaning to your mission statement', Hotel & Motel
Management, vol., September 18. D'Souza, C, Taghian, M & Khosla, R 2007, 'Examination of environmental beliefs and its
impact on the influence of price, quality and demographic characteristics with respect to green purchase intention', Journal of Targeting, Measurement & Analysis for Marketing, vol. 15, no. 2, Jan.
Duhaime, I M & Grant, J H 2006, 'Factors Influencing Divestment Decision Making:
Evidence from a Field Study', Strategic Management Journal, vol. 5, no. 4, November, pp. 301-318.
Erikkson, K, Johanson, J, Majkgard, A & Sharna, D D 1997, 'Experiential knowledge
and cost in the international process', Journal of International Business Studies, vol. 28, no. 2, 2nd quarter, pp. 337-360.
375

Farjoun, M 2002, 'Towards an Organic Perspective on Strategy ', Strategic Management Journal, vol. 23, no. 7, July, pp. 561-594.
Fiedler, F E 1996, 'Research on Leadership Selection and Training: One Overview of
the Future', Administrative Science Quarterly, vol. 41, no. 2, June, pp. 241-250. Fred, R D 1997, Strategic Management, 6 edn., Prentice Hall, New Jersey. Frost, F A & Joson, G R 1998, 'Turnaround strategies of electric utilities in New Zealand
and the Philippines', Strategic Change, vol. 7, no. 5, August, pp. 289-300. Furman, J L & Anita, M M 2002, 'Turnarounds', Managerial and decision Economics,
vol. 23, no. 4-5, June-Aug, pp. 283-300. Gedajlovic, E R & shapiro, D M 1998, 'Management and OwnershipEffects:Evidence
From Five Countries', Strategic Management Journal, vol. 19, no. 6, June, pp. 533-553.
Geringer, J M, Beamish, P W & Dacosta, R 1988, 'Diversification strategy and
internationalization: Implications for mne performance', Strategic Management Journal, vol. 10, no. 2, June, pp. 109-119.
Geringer, J M, Tallman, S & Olsen, D M 2000, 'Product and international diversification
among japanese multinational firms', Strategic Management Journal, vol. 21, no. 1, January, pp. 51-80.
Ghosal, S & Bartlett, C A 1995, 'Changing the Role of Top Management:Beyond
Structure to Process', Harvard Business Review, vol. 73, no. 1, January/February, pp. 86-96.
Gill, J 2002, Research Methods for Managers, 3edn, Sage Publications Ltd, London. Glaister, K W & Falshaw, J R 1999, 'Strategic planning: still going strong?' Long Range
Planning, vol. 32, no. 1, 19 March, pp. 107-116. Glueck, W & Jauch, L R 1984, Strategic Management and business Policy, 2 edn.,
McGraw-Hill USA. Goodstein, J D & Wick, A C 2007, 'Corporate and stakeholder responsibility: MAKING
business ethics a two-way conversation.' Business Ethics Quarterly, vol. 17, no. 3, July, pp. 375-398.
Grant, R M 1991, 'The resource based theory of competitive advantage:Implications for
strategy formulation', California Management Review, vol. 33, no. 3, Spring, pp. 114-135.
376

Grant, R M 2003, 'Strategic Planning in a turbulent environmnet: Evidence from the oil Majors ', Strategic Management Journal, vol. 24, no. 6, June, pp. 491-517.
Greenley, G E 1986, 'Does strategic planning improve company performance', Long
Range Planning, vol. 19, no. 2, April, pp. 101-109. Grete, B & Cayan, T 2005, 'Consumer purchasing behaviour: an investigation of the UK
mature women's clothing market', Journal of Consumer Behaviour, vol. 4, no. 6, December, pp. 453-464.
Grinyer, P H, Ardekani, M Y & Al-Bazzaz, S 1980, 'Strategy, Structure, the Environment,
and Financial Performance in 48 United Kingdom Companies', Academy of Management Journal, vol. 23, no. 2, June, pp. 193-120.
Hafeez, K, Zhang, Y & Malak, N 2002, 'Core Competence for sustainable competitive
advantage: A structural methodology for identifying core competence', IEEE Transactions on Engineering Management, vol. 49, no. 1, February, pp. 28-35.
Hambrick, D C 1987, 'The top management team: Key to strategic success ', California
Management Review, vol. 30, no. 1, pp. 88-108. Hamel, G & Prahalad, C K 1989, 'Strategic Intent', Harvard Business Review, vol. 67,
no. 3, May-June, pp. 63-78. Hammonds, K H 2002, 'Size is Not a Strategy', Fast Company, vol., no. 62, Sep, pp.
78-86. Haque, A, Khatibi, A & Karim, K 2006, 'Re-Organization Impact on the Telecom
Malaysia's International Division Productivity', Journal of Social Science, vol. 2, no. 2, pp. 35-40.
Harrison, J S, Bosse, D & Phillips, R A 2007, 'Stakeholder Theory And Competitive
Advantage', Academy of Management proceedings, vol., pp. 1-6. Harry, M & Denise, F 2000, 'Globalization and strategic change: some lessons from the
UK small business sector', Strategic Change, vol. 9, no. 7, November, pp. 437-449.
Heinrich, C J 2007, 'Evidence-Based Policy and Performance Management" Challenges
and Prospects in Two Parallel Movements', American Review of Public Administration, vol. 37, no. 3, Sep, pp. 255-277.
Hellriegel, D, John, W S J & Richard, W W 1998, Organizational Behavior, 8 edn.,
South-Western College Publishing, Ohio.
377

Heracleous, L 1998, 'Strategic Thinking or Strategic Planning', Long Range Planning, vol. 31, no. 3, June, pp. 481-487.
Hitt, M A, Bierman, L, Uhlenbruck, K & Shimizu, K 2006, 'The importance of resources
in the internationlization of professional service firms: The good, the bad, and the ugly', Academy of Management Journal, vol. 49, no. 6, December, pp. 1137-1157.
Hitt, M A, Hoskisson, R E & Harrison, J 1991, 'Strategic Competitiveness in the
1990's:Challenges and opportunities for U.S. executives ', Academy of Management, vol. 5, no. 2, May, pp. 7-22.
Hitt, M A, Hoskisson, R E & Kim, H 1997, 'International diversification:Effects on
innovation and firm performance in product-diversified frims', Academy of Management Journal, vol. 40, no. 4, August, pp. 767-798.
Hitt, M A, Ireland, R D & Hoskisson, R E 2005, Strategic Management :
Competitiveness and Globalization 6edn., Thomson/South-Western, Mason, Ohio
Hoskisson, R E, Hitt, M A, Johnson, R A & Moesel, D D 1993, 'Construct validity of an
objective (entropy) categorical measure of diversification strategy', Strategic Management Journal, vol. 14, no. 3, March, pp. 215-235.
Hoskisson, R E & Turk, T A 1990, 'Corporate restructuring: Governance and control
limits of the internal capital market', Academy of Management Review, vol. 15, no. 3, pp. 459-477.
Hoskisson, R E, Wan, W P & Yiu, D 1999, 'Theory and Research in Strategic
Management: Swings of a Pendulum', Journal of Management vol. 25, no. 3, May, pp. 417-456.
Hubbard, G 2000, Strategic Management- Thinking, Analysis And Action, 1 edn.,
Person Education Australia, NSW. Hussy, D 1998, Strategic Management-from theory to implementation, 4 edn.,
Butterworth-Heinemann, MA. Ikoma, T 2005, 'Research and Development and Innovation Boost Firm Value', The
Japanese Economy, vol. 33, no. 4, Winter, pp. 110-127. Ivancevich, J, Olekalns, M & Matteson, M 1997, Organizational Behaviour and
Management, McGraw-Hill Book Company, Roseville. Johanson, J & Vahlne, J E 1990, 'The Mechanism of Internationalism', International
Marketing Review, vol. 7, no. 4, pp. 11-14.
378

John, A P, Bruce, L C & Fred, R D 1982, 'Environmental Scanning For Small And Growing Firms', Journal of Small Business Management, vol. 20, no. 3, July, pp. 27-34.
John, E B 1987, 'Theories of technological innovation as useful tools for corporate
strategy', Strategic Management Journal, vol. 9, no. 1, January-February, pp. 15-29.
Johnson, F W 2007, 'Vision Quest: Writing your organizational mission statement',
Tactics, vol., September. Johnson, G & Scholes, K 1999, Exploring Corporate Strategy, 5 edn., Prentice Hall,
Essex. Johny, K J & George, S Y 1993, 'Exploiting globalization potential: U.S. and Japanese
strategies', Strategic Management Journal, vol. 15, no. 8, October, pp. 579-601. Kakanamveetil, A 2004, Strategic Management in Indian Manufacturing Companies,
Doctoral Dissertation thesis, AGSE, Swinburne University of Technology, Melbourne.
Kendra, S A 2004, 'Environmental Scanning: Radar for Success ', The Information
Management Journal, vol. 38, no. 3, May/June, pp. 38-45. Kotter, J P & Heskett, J L 1992, Corporate culture and performance, The Free Press,
New York. Kruse, T A, Park, H Y, Park, K & Suzuki, K 2007, 'Long term performance following
mergers of japanese companies:The effects of diversification and affiliation', Pacific Finance Journal, vol. 15, no. 2, April, pp. 154-172.
Kubicek, M 2006, 'Size Matters', Personal Today, vol., October 24. Kumara, S 2006, Branch banking is still valid, viewed 27 October 2007,
http://www.apbsrilanka.org/articales/15an/artical-saliya%20kumara.html. Lang, L H P & Stulz, R M 1994, 'Tobin's q, Corporate Diversification, and Firm
Performance', Journal of Political Economy, vol. 102, no. 6, December, p. 1248. Lanyon, L E & Abdalla, C W 1997, 'An Environmental Scanning Indicator Proposed for
Strategic Agribusiness Management ', John Wiley & Sons, Inc, vol. 13, no. 6, pp. 613-622.
Lee, Y D & Chang, H M 2006, 'Leadership Style and Innovation Ability: An Empirical
Study of Taiwanese Wire and Cable Companies ', The Journal of American Academy of Business vol. 9, no. 2, September, pp. 218-222.
379

Leonard, N H, Scholl, R W & Kowalski, K B 1999, 'Information Processing Style and Decision Making', Journal of Organizational Behavior, vol. 20, no. 3, May, pp. 407-420.
Lewis, G, Morkel, A & Hubbard, G 1993, Australian Strategic Management: Concepts,
Cotext and Cases, Prentice Hall of Australia Pty Ltd, Allambie, Heights. Li, M & Simerly, R L 1998, 'The Moderating Effect Of Environmental Dynamism On The
Ownership And Performance Relationship', Strategic Management Journal, vol. 19, no. 2, February, pp. 169-179.
Liedtka, J M 1998, 'Strategic Thinking: Can it be Taught', Long range Planning, vol. 31,
no. 1, pp. 120-129. Lindani, B N 1980, 'Effective protection and economic efficiency in Zimbabwe
Manufacturing in the 1980's', Journal of International Development, vol. 8, no. 6, November pp. 767-783.
Lipson, M L & Mortal, S 2007, 'Liquidity and firm characteristics:Evidence from mergers
and acquisitions', Journal of Finance Markets, vol. 10, no. 4, November, pp. 342-361.
Loderer, C & Martin, K 1997, 'Executive Stock Ownership and Performance Tracking
Faint Traces', Journal of Finance Economics, vol. 45, no. 2, Aug, pp. 223-255. Lorange, P 1980, Corporate Planning : An Executive Viewpoint Prentice-hall, 1980,
Englewood Cliffs, N.J. Lorange, P & Vancil, R F 1977, Strategic Planning Systems Prentice-hall, Englewood
Cliffs, N.J. Lu, J W & Beamish, P W 2001, 'The internationalization and performance of SME's',
Strategic Management Journal, vol. 22, no. 6-7, June-July, pp. 565-586. Lu, J W & Beamish, P W 2004, 'International diversification and firm performance: the
S-Curve hypothesis', Academy of Management Journal, vol. 47, no. 4, August, pp. 598-609.
Lubatkin, M & O'Neill, H 1988, 'Merger strategies, economic cycles, and stockholder
value', Interfaces, vol. 18, no. 6, December, pp. 65-71. Lynch, R 2006, 'International Acquisition and other growth strategies: Some lessons
from the food and drink industry', Thunderbird International Business Review, vol. 48, no. 5, September-October, pp. 605-322.
380

Madhok, A 1997, 'Cost, Value and foreign market entry mode: The transaction and the firm', strategic Management Journal, vol. 18, no. 1, January, pp. 39-61.
Madurapperuma, A 2005, Capital Inadequacy, viewed 27 October 2007,
http://www.apbsrilanka.org/articales/17an/artical-17a-ajantha-madurap.html. Madurapperuma, A 2006, Fundamental economic Functions of banking and the role of
substitutes, viewed 27 October 2007 2007, http://www.apbsrilanka.org/articales/15an/artical-ajantha%20madurapperuma.html.
Maier, J L, Rainer, R K & Snyder, C A 1997, 'Environmental Scanning for Information
Technology: An Empirical investigation', Journal of management information systems, vol. 14, no. 2, pp. 177-224.
Marc, T J 2002, 'Globalization and organizational restructuring: A strategic perspective',
Thunderbird International Business Review, vol. 44, no. 3, May/June, pp. 325-351.
Meyer, R & Wit, d B 1999, Strategy Synthesis, resolving strategy paradoxes to create
Competitive Advantage, International Thomson Business Press, London. Michael, J T & Ravipreet, S S 2003, 'IT competency and firm performance: is
organizational learning a missing link?' Strategic Management Journal, vol. 24, no. 8, August, pp. 745-761.
Miller, C C & Cardinal, L B 1994, 'Strategic Planning and Firm Performance:A Synthesis
of More Than Two Decades of Research ', Academy of Management Journal, vol. 37, no. 6, December, pp. 1649-1665.
Mintzberg, H 1987, 'Crafting Strategy', Harvard Business Review, vol. 65, no.
4,July/August, pp. 66-75. Mintzberg, H 1990, 'The design school:Reconsidering the basic premises of strategic
management', Strategic Management Journal, vol. 11, no. 3, May, pp. 171-195. Mintzberg, H 1994, 'The Fall and Rise of Strategic Planning', Harvard Business Review,
vol. 72, no. 1, January-February, pp. 107-114. Mintzberg, H 1994a 'Rethinking strategic Planning:Part 1:Pitfalls and Fallacies ', Long
Range Planning, vol. 27, no. 3, June, pp. 12-21. Mintzberg, H 1994b, 'Rethinking Strategic Planning:Part 2:Pitfalls and Fallacies', Long
Range Planning, vol. 27, no. 3, June, pp. 22-30.
381

Mintzberg, H, Ahlstrand, B & Lampel, J 1998, Strategy Safari, Prentice Hall, USA. Mintzberg, H, Lampel, J, Quinn, J B & Ghosal, S 2003, The Strategy Process:Concepts
Contexts Cases, 4 edn., Prentice Hall, New Jersey. Mintzberg, H & Quinn, J B 1996, The strategy process : concepts, contexts, cases,
Prentice Hall International, London. Mitchell, R K, Agle, B R & Wood, D J 1997, 'Toward a Theory of Stakeholder
Identification and Salience:Defining the Principle of Who And What Really Counts', Academy of Management Review, vol. 22, no. 4, October, pp. 853-886.
Molina, M A, Pino, I B D & Rodriguez, A C 2004, 'Industry, Management capabilities and
firm's competitiveness: An Empirical Contribution', Managerial and decision Economics, vol. 25, no. 5, July/August, pp. 265-281.
Mont, O & Bleischwitz, R 2007, 'Sustainable Consumption and Resource Management
in the Light of Life Cycle Thinking', European Environmnet, vol. 17, pp. 59-76. Morsing, M & Schultz, M 2006, 'Corporate Social Responsibility
Communication:Stakeholder Information, Response and Involvement Strategies', Business Ethics:A European Review, vol. 15, no. 4, October, pp. 323-338.
Narjoko, D A 2007, 'Survey of Recent Developments', Bulletin of Indonesian Economic
Studies, vol. 43, no. 2, Aug, pp. 143-170. Newbert, S 2007, 'Empirical research on the resource-based view of the firm: An
assessment and suggestions for future research', Strategic management journal, vol. 28, no. 2, March, pp. 121-146.
Nimmanphatcharin, N 2002, Strategic Management Practices by Selected Thai Banks
and Financial Organizations, Doctoral Dissertation thesis, AGSE, Swinburne University, Melbourne.
Nix, T W, Whitehead, C J & Blair, J D 1990, 'Beyond the squeaky wheel:strategies for
assessing and managing organizational stakeholders', Academy of Management vol., pp. 149-153.
Nonaka, I & Takeuchi, H 1995, The knowledge-creating company : How Japanese
companies create the dynamics of innovation Oxford University Press, New York Nystedt, L 1997, 'wHO should rule? Does personality matter?' European Journal of
Personality, vol. 11, no. 1, March, pp. 1-14.
382

O'Regan, N & Ghobadian, A 2007, 'Formal strategic planning:annual raindance or wheel of success?' Strategic Change, vol. 16, January-April, pp. 11-22.
Orly, l 2005, 'The influence of top management team attention patterns on global
strategic posture of firms', Journal of Organizational Behavior, vol. 26, no. 7, November, pp. 797-819.
O'Shannassy, T 2003, 'Modern strategic management:balancing strategic thinking and
strategic planning for internal and external stakeholders', Singapore Management Review, vol. 25, no. 1, 1st half, pp. 53-67.
Palich, L E, Cardinal, L B & Miller, C C 2000, 'Curvilinearity in the diversification-
performance linkage: An Examination of over three decades of research', Strategic Management Journal, vol. 21, no. 2, February, p. 2000.
Palmer, I & Hardy, C 2000, Thinking about Management, SAGE Publications Inc,
London. Papadakis, V M, Lioukas, S & Chambers, D 1998, 'Strategic Decision-Making Process:
The Role of Management and Context ', Strategic Management Journal, vol. 19, no. 2, February, pp. 115-147.
Parekh, A & Jayasinghe, M 2006, Emerging Issues in Risk and Sound Risk
Management, viewed 27 October 2007, http://www.apbsrilanka.org/articales/17an/artical-17a-buwanekabahu_perera.html.
Pearce, J A, Freeman, E B & Robinson, R B 1987, 'The Tenuous link between formal
strategic planning and financial performance', Academy of Management Review, vol. 12, no. 4, October, pp. 658-675.
Peng, M W 2004, 'Outside Directors and Firm Performance During Institutional
Transitions', Strategic Management Journal, vol. 25, no. 5, May, pp. 453-471. Perera, B 2006, Relationship management in corporate banking, viewed 27 October
2007, http://www.apbsrilanka.org/articales/15an/artical-buwnekabahu%20perera.html.
Peter, S 2004, 'Democracy, Markets and Sustainable Development: The European
Union as an example Piyasena, B & Corera, A 2006, IS it worth the risk? A framework for pricing credit risk,
viewed 27 October 2007, http://www.apbsrilanka.org/articales/16an/artical-16a-buddik-alaster.html.
383

Poole, M L 1991, 'Environmental Scanning Is Vital to Strategic Planning', Education Leadership, vol. 48, no. 7, Apr, pp. 40-41.
Porter, M E 1979, 'How competitive forces shape strategy', Harvard Business Review,
vol., March-April 1979, pp. 137-145. Porter, M E 1980, Competitive Strategy: Techniques for Analysing Industries and
Competitors, New York Press, New York. Porter, M E 1980, Competitive strategy:Techniques for analysing industries and
competitors, New York Press, New York. Porter, M E 1985, Competitive Advantage: Creating and Sustaining Superior
Performance, Free Press, New York. Porter, M E 1991, 'Towards a Dynamic Theory of Strategy', Strategic Management
Journal, vol. 12, Winter, pp. 95-117 Porter, M E 2004, Competitive Advantage: Creating and Sustaining Superior
Performance, Free Press, New York. Poulin, B J & Hackman, M Z 2001, 'The Rise and Fall of the T.Eaton Company of
Canada: Lasting Lessons on Leadership and Strategy', The Journal of Leadership Studies, vol. 8, no. 1, Summer, pp. 96-112.
Prahalad, C K & Hamel, G 1990, 'The core competence of the corporation', Harvard
Business Review, vol. 68, no. 3, May-June, pp. 79-91. Prahalad, C K & Hamel, G 1990 May-June, 'The Core Competence of the Corporation',
in Montgomery, C A and Porter, M E (eds), Strategy, Havard Business review, USA.
Quer, D & Claver, E 2007, 'Determinants of Spanish Foreign Direct Investment in
Morocco', Emerging Markets Finance and Trade, vol. 43, no. 2, Mar/Apr, pp. 19-32.
Quinn, J B 1980, Strategies for Change : Logical Incrementalism Homewood, Ill : R.D.
Irwin, 1980. Ramaswamy, K, Li, M & Veliyath, R 2002, 'Variations in Ownership Behavior and
Propensity to Diversify:A Study of The Indian Corporate Context', Strategic Management Journal, vol. 23, no. 4, April, pp. 345-358.
Ransom, P & Lober, D J 1999, 'Why Do Firms Set Environmental Performance Goals?
Some Evidence From Organizational Theory', Business Strategy and the Environmnet, vol. 8, pp. 1-13.
384

Rasheed, H S 2005, 'Turnaround strategies for declining small business: The effects of performance and resources', Journal of Developmental Entrepreneurship vol. 10, no. 3, July, pp. 239-252.
Richey, R G, Kiessling, T S, Tokman, M & Dalela, V 2007, 'Market growth through
mergers and acquisitions: The role of the relationship marketing manager in sustaining performance', Industrial Marketing Management, vol., 4 May
Rivers, P A, Fottler, M D & Parker, M 2005, 'Environmental Assessment of the Indian
Health Services', Health Care Management Review, vol. 30, no. 4, Oct-Dec, pp. 293-303.
Robbins, S P 1987, Organization Theory:Structure, Design, and Application, 2 edn.,
Prentice Hall, Inc, New Jersey. Romanek, B 2002, Mergers & Acquisitions, Capstone Publishing, Chichester. Ronald, S M 2003, 'Environmental Scanning Makes Planning Possible ', Association
Management, vol. 55, no. 8, August, p. p65. Roth, K & Ricks, D 1993, 'Goal Configuration in a Industry Context', Strategic
Management Journal, vol. 15, no. 2, May, pp. 103-120. Rugman, A M 1986, 'New theories of the multinational enterprise: an assessment of
internationalization theory', Bulletin of Economic Research, vol. 38, no. 2, pp. 101-118.
Rumelt, R P 1974, Strategy, Structure, and economic performance, Harvard University
Press, Cambridge. Rumelt, R P 1982, 'Diversification strategy and profitability', Strategic Management
Journal, vol. 3, no. 4, April, pp. 359-369. Saari, L M 1988, 'A survey of management training and education practices in U.S.
companies', Personal Psychology, vol. 41, no. 4, Winter, pp. 731-743. Salama, A, Holland, W & Vinten, G 2003, 'Challenges and opportunities in mergers and
acquisitions:three international case studies-Deutsche Bank-Bankers Trust;British petroleum-Amoco;Ford-Volvo', Journal of European Industrial Training, vol. 27, no. 6, pp. 313-321.
Senders, T R 1998, Strategic Thinking and the New Science: Planning in the Midst of
Chaos, Complexity and Change, The Free Press.
385

Sapienza, H J, Autio, E, George, G & Zahra, S A 2006, 'A capabilities perspective on the effects of early internationalization on firm survival and growth', Academy of Management Review, vol. 31, no. 4, October, pp. 914-933.
Savage, G T, Nix, T W, Whitehead, C J & Blair, J D 1990, 'Strategies for assessing and
managing organizational stakeholders ', Academy of Management Executive, vol. 5, no. 2, May, pp. 61-75.
Schein, E H 1985, 'Organizational Culture and Leadership', Academy of Management
Review, vol. 11, no. 3, July, pp. 677-680. Schreyogg, G & kliesch-Eberl, M 2005, 'How dynamic can organizational capabilities
be?Towards a dual-process model of capability dynamization ', Strategic Management Journal, vol. 28, April, pp. 913-933.
Schroder, B & Mavondo, F 2006, 'Strategy/performance/environmental linkages in
agribusiness: Conceptual issues and a developing country example', Wiley Inter Science vol. 10, no. 5, pp. 419-429.
Schweiger, D M & Very, P 2001, 'International mergers and acquisitions special issue',
Journal of World Business, vol. 36, no. 1, Spring, pp. 1-2. Scinta, J 2007, 'Where More R & D Dollars Should Go', Harvard Business Review, vol.
85, no. 7-8, July-August, pp. 26-26. Scroggins, W A 2006, 'Managing meaning for strategic change:The role of perception
and meaning congruence', Journal of Health and Human Services Administration, vol. 29, no. 1, Summer, pp. 83-102.
Shaker, A Z & Jeffrey, G C 1993, 'Business strategy, technology policy and firm
performance', Strategic Management Journal, vol. 14, no. 6, September, pp. 451-478.
Shields, J F 2005, 'Does Rural Location Matter? The Significance of a Rural Setting for
small Businesses', Journal of Developmental Entrepreneurship vol. 10, no. 1, Apr, pp. 49-63.
Short, H 1994, 'Ownership, Control, Financial Structure And The Performance Of
Firms', Journal of Economic Surveys, vol. 8, no. 3, September, pp. 203-249. Simpson, D G 1998, 'Why Most Strategic Planning is a waste of Time and What You
Can Do About It-Part 2', Long range planning, vol. 31, no. 4, pp. 623-627. Stace, D & Dunphy, D 1994, Beyond the boundaries: leading and re-creating the
successful enterprise McGraw-Hill, Sydney.
386

Steiner, G A 1979, Strategic Planning:What every manager must know, The Free Press, New York.
Taylor, B 1997, 'The Return of Strategic Planning-Once more with feeling', Long Range
Planning, vol. 30, no. 3, pp. 334-344. Teece, D J, Pisano, G & Shuen, A 1997, 'Dynamic capabilities and strategic
management', Strategic management, vol. 18, no. 7, pp. 509-533. Thomas, A H 2004, 'The strategic Management of Trade Secrets in Technology Based
Firms', Technology Analysis and Strategic Management, vol. 14, no. 4, December, pp. 479-494.
Thomas, C P & Anne, D M 1996, 'Information technology as competitive advantage: the
role of human, business, and technology resources', Strategic Management Journal, vol. 18, no. 5, May, pp. 375-405.
Thomsen, S & Pedersen, T 2000, 'Ownership Structure and Economic Performance in
the Largest European Companies', Strategic Management Journal, vol. 21, no. 6, June, pp. 689-705.
Thomsen, S & Pedersen, T 2000, 'Ownership Structure And Economic Performance In
The Largest European Companies', Strategic Management Journal, vol. 21, January, pp. 689-705.
Thomson, A A & Strickland, A J 2003, Strategic Management: Concepts and Cases, 13
edn., McGraw-Hill/Irwin, Boston. Tirpak, T M, Miller, R, Schwartz, L & Kashdan, D 2006, 'R & D Structure in a Changing
World ', Industrial Research Institute, vol. 49, no. 5, September-October, pp. 19-26.
Tubbs, M 2007, 'The relationship between R & D And Company Performance',
Research Technology Management, vol. 50, no. 6, November-December, pp. 23-30.
Vecchio, R P, Hearn, G & Southey, G 1996, Organizational Behaviour, 2 edn., Harcourt
Brace & Company, NSW. Viljoen, J 1996, Strategic management : planning and implementing successful
corporate strategies 2edn., Longman Cheshire, Melbourne Villalonga, B & Mcgahan 2005, 'The Choice Among Acquisitions, Alliances, and
Divestitures', Strategic Management Journal, vol. 26, no. 13, December, pp. 1183-1208.
387

Waddell, D, Devine, J, Jones, G R & George, J M 2007, Contemporary Management, McGraw-Hill Irwin, North Ryde.
Wan, W P 2005, 'Country Resource Environmnets, Firm Capabilities, and Corporate
Diversification Strategies', Journal of management Studies, vol. 42, no. 1, January, pp. 161-182.
Whittington, R 1993, What is Strategy and Does it Matter?, Internation Thomson
Business Press, London. Wiersema, M & Bowen, H P 2007, 'Corporate diversification: The impact of foreign
competition, Industry globalization, and product diversification', Strategic Management Journal, vol., 21 August.
William, G Z 2003, Business Research Methods, 7 edn., Thomson South Western,
Ohio. Wilson, I 1998, 'Strategic Planning for the Millenium:Resolving the Dilemma', Long
Range Planning, vol. 31, no. 4, pp. 507-513. Wit, d B & Meyer, R 1998, Strategy-Process, Content Context: An International
Perspective, Thompson Business Press. Wright, P, Kroll, M, Lado, A & Ness, B V 2002, 'The Structure of Ownership and
Corporate Acquisition Strategies', Strategic Management Journal, vol. 23, no. 1, January, pp. 41-53.
Zahra, S A, Ireland, R D & Hitt, M A 2000, 'International expansion by new venture
firms: International diversity, mode of market entry, technological learning, and performance', Academy of Management Journal, vol. 43, no. 5, October, pp. 925-950.
388

APPENDIX 1
Research questionnaire
389

Survey of the Strategic Management Practices of the Sri Lankan Commercial Banks
Thank you for your participating in this survey of the strategic management practices of the Sri
Lankan commercial banks. This questionnaire consists of three major parts and in this
questionnaire we shall be asking a series of questions about your strategic management practices
in respect to the following aspects:
• Assessment of internal and external environments
• Assessment of company’s mission statement, long-term objectives and strategic planning
and it’s extended strategic thinking capabilities.
• Assessment of company’s analytical tools/techniques, corporate level strategies and the
management of quality.
All responses that you provide will be strictly confidential and all analyses will be undertaken
with aggregated data from all respondents. The data will be coded to ensure that no unauthorized
person can identify or interpret an organization’s return. This questionnaire will be used for
academic purposes only. Once again, when the results are published, it will not be possible to
identify any individual company data.
Company: ________________________________________________________ Date: ____________________________________________________________
390

Internal environments
First we would like to know some information about your company structure.
1.1 Could you please provide us with an organization chart of your company?
Yes (enclosed) No
1.2 If no, could you please select one of the following choices which best matches your company structure?
і)
Corporate Level
Functional Level
Marketing Operation Human Resource
Financial Information Technology
іі) Corporate Level
Business Unit A
Business Unit B
Marketing Operation Financial Human Resource
Information Technology
Functional level of unit A
Functional level of unit BFunctional level of unit C
Business Unit C
391

ііі) Corporate Level
Two business types (A & B)
Functional level for both A and B
Marketing for A & B
Operation For A & B
Human Resource for A & B
Financial for A& B
IT for A & B
Other type of structures, please specify:
392

2. Please identify the various organizational levels of operating responsibility that exist in your company. For your convenience, an example is given below to show the information we are seeking. Example Level number Organizational unit Number of units Highest position At each level 1 Corporate 1 CEO 2 Business 5 DGM 3 Functional 7 Senior manager Your company Level number Organizational unit Number of units Highest position At each level …1……….. ……………….. …………… ……………. …2……….. ……………….. …………… ……………. …3……….. ……………….. …………… ……………. …4……….. ……………….. …………… ……………. 3. Are the second management level units, defined as profit centres?
Yes No
4. What is the lowest level of profit centre? (Please select one)
Second level Third level Operational level Others (please specify) __________________________________________________
5. Which structural type best describes your bank’s organizational structure?
Centralized structure Decentralized structure Hybrid form or combination of centralized and decentralized structure Others (please specify) ____________________________________________
6. Did you change the organizational structure of your company substantially over the last five years? 6.1
Yes No (Go to question 9)
6.2 If yes when was the last major change? In 200_ _
393

7. Could you please specify the most important changes made at that time?
8. What were the main reasons for these changes? 9. Do you expect that your current organizational structure will still be applicable in the next five years?
Yes No
If no, please specify the major changes you expect.
7.1 Establishment of new profit centres 7.2 Organized the business units under heads/DGMs 7.3 Structural changes at corporate level positions 7.4 Appointment of chief financial officer above the DGM 7.5 Combining two structures into one 7.6Harmonizing the HR function 7.7 Appointment of a single CEO 7.8Opening of new departments 7.9 Introduction of new positions 7.10 Decentralization of operations 7.11 Linked all branches 7.12 Created a centralized operation unit 7.13 Created market product development units 7.14. Introduction of new procedures and policies 7.15 New products and branches 7.16 New areas of activities 7.17 Redesigning the job definitions
8.1 To improve efficiency 8.2 To empower the managers 8.3 Merger with another company 8.4 Change of CEO/GM 8.5 To expand the businesses 8.6 Rapid growth of the bank and the banking industry in Sri Lanka 8.7 To take the bank ahead 8.8 To make the bank profit 8.9 Economy in the country
9.1 Depending on the business and competitive environment it needs to be adjusted 9.2 New positions 9.3 New branches 9.4 Expand the operational level 9.5 Innovations 9.6 Introduction of money market operations 9.7 Introduction of new products and markets 9.8 Introduction high technology for the banking operations 9.9 Introduction of new business units 9.10 Expand the size 9.11 Introducing credit cards and personal loans
394

In this section we are seeking information about the ownership of your company.
10. Does your company sell its shares in the “Sri Lankan stock market”?
Yes, started in year ---------- No (Please go to question 13 )
If yes, what approximate Sri Lankan Rupees is traded as shares on the Sri Lankan stock market per year? Sri Lankan rupees 11. Which best describes your company shareholders (ownership)?
All Sri Lankans Sri Lankan holding more than foreigners Foreigners holding more than Sri Lankans All foreign shareholders Sri Lankan government holding almost 100% Sri Lankan government holding more than 50% and the remainder held by Sri Lankans Sri Lankan government holding more than 50% and the remainder held by foreigners Sri Lankan government holding less than 50% and the remainder held by Sri Lankans Sri Lankan government holding less than 50% and the remainder held by foreigners Others (Please specify)
12. Based on the pattern of shareholding, how would classify your company?
Widely held Subsidiary of Sri Lankan companies Subsidiary of foreign companies Family owned Government owned Others (Please specify)
13. Does your company sell its shares in “overseas stock markets (overseas stock exchange)”?
yes No
If yes to both question 10 and 13 please go to question 16 14. Does your company plan to sell its shares in the stock market in the next five years?
Yes No
If yes which market?
Sri Lankan stock market Overseas markets Both the Sri Lankan and overseas markets
395

15. If your company is not selling shares in the Sri Lankan stock market how can you categorize the ownership of your company?
Government owned Foreign owned Sri Lankan companies owned Foreign government owned
16. From 2000 until year 2005, which of the following best describes changes in your company’s ownership? (Please select one of the following)
No change Merger with another company Joint venture with another company Others (please specify) Changed the main share holders of the bank
17. What do you think is likely to happen to your bank in terms of ownership in the next five years? (Please select one of the following)
No change Joint venture with another company Transfer of ownership-limited libility Planning to sell 40% to the overseas market
18. Since 2000, has your bank changed owners/ main shareholders?
Yes No (Go to question 24)
19. What were the main reasons for the changes in your company’s ownership?
19.1 Shares changed hands to make capital gains 19.2 Capital requirements 19.3 Company not listed in the share market 19.4 Enhancing shareholder value 19.5 Unsatisfactory performance of the bank (Big losses)
396

20. What are the major factors that supported these changes?
20.1 Good earning potential of the bank 20.2 Satisfactory past performance 20.3 Appreciation of share value 20.4 Central bank intervention to find capital 20.5 Bank’s unsatisfactory performances
21. Did your company face any problem when the ownership changed?
Yes No
If yes, what were the major problems you faced?
22. In your opinion, how successful have the ownership changes been? Unsuccessful Very successful
1 2 3 4 5 23. To what extent did your company’s ownership changes strategically help your company? Not at all To a great extent 1 2 3 4 5
397

24. Do you expect that your company will change ownership/ main shareholders in the next five years?
Yes No (if no please go to question 26) Others (please specify) ___________________________________________________________
__________________________________________________________________________________ If yes, what are the main reasons for these expected changes?
24.2.1 Privatization
If yes, which group is likely to become a major owner?
Sri Lankan people Foreigners Sri Lankan government Others (Please specify) ___________________________________________________________
25. How much do the following groups influence any potential change of ownership/ main shareholding in your company? No influence Very great influence Corporate level management 1 2 3 4 5 Chief executive officer 1 2 3 4 5 Outside members of the board of directors 1 2 3 4 5 Second level line managers 1 2 3 4 5 Sri Lankan government 1 2 3 4 5 Current main shareholders 1 2 3 4 5 Other lower levels of management 1 2 3 4 5 Others (Please specify) 1 2 3 4 5 Indian government
398

In this section we are seeking information about your company size
26. To what extent does your company measure its size from the following? Not at all To a great extent Size is measured by revenue 1 2 3 4 5 Size is measured by assets 1 2 3 4 5 Size is measured by number of employees 1 2 3 4 5 Size is measured by the profitability 1 2 3 4 5 Size is measured by the customer base 1 2 3 4 5 Size is measured by the number of branches 1 2 3 4 5 Others (Please specify)__Deposit base 1 2 3 4 5 Of these size measures, is one of these considered most important?
Yes If yes, please specify ____________________________________________ No
27. What are your company’s current Profit after tax (For the year 2005): _____________________________ Sri Lankan Rupees Assets (As at 31 December 2005): __________________________________Sri Lankan Rupees Return on equity ratio ______________________ Number of employees (Full time or full time equivalent): ____________________________ Number of branches :_____________________________________ 28. To what extent are you satisfied with your company’s current performance compared to its size? Dissatisfied Very satisfied 1 2 3 4 5
29. Do you think you need to enhance the size of your bank to gain more profits?
Yes No
If yes, what are the main barriers that you have to enhancing your bank’s size? (You may select more than one)
Government policies Capital requirements Lack of managerial and employee skills Lack of technology No barriers Head office credit policies RBI approval Unstable economy due to war
399

In this section we are seeking information about the Organization culture of your company.
30. How important is the management of culture in your company? Not at all Very important Important 1 2 3 4 5 31. To what extent are you satisfied with the current culture of your company? Dissatisfied Very satisfied 1 2 3 4 5 32. How much did the following groups influence the culture in your company over the last five years? No influence Very great influence
Corporate level management 1 2 3 4 5
Chief executive officer 1 2 3 4 5
Outside members of the board of directors 1 2 3 4 5
Second level line managers 1 2 3 4 5
Sri Lankan government 1 2 3 4 5
Other lower levels of management 1 2 3 4 5
Others (Please specify) Trade unions____________ 1 2 3 4 5
______________________________________
33. Could you please describe the key characteristics of your company’s culture? (e.g. our employees have good team spirit, our employees have a strong culture of loyalty etc.)
33.1 Commitment 33.2 Loyalty 33.3 Team spirit 33.4 Concentrate more on self development along with the development of organization 33.5 Influence on country politics 33.6 Reacting nature and slow adaptation to the culture 33.7 Informal group prefer their values, norms beliefs contribute to the culture 33.8 Mutual respect 33.9 Diversity 33.10 Multicultural 33.11 Spirit of giving best to the customer and to the organization 33.12 Less rigid 33.13 Flexible 33.17 Conservative 33.14 Overall knowledge 33.18 Blend of government and private sector 33.15 More than 20 years of experience 33.19 Young staff 33.16 Corporative 33.20 Very transparent 33.21 Approachable 33.22 Reacting market practices 33.23 Parents company influence 33.24 Very motivated
400

34. To what extent do you agree with the following? Disagree Strongly agree Our company encourages the development and 1 2 3 4 5 implementation of new ideas Our company encourages communication and 1 2 3 4 5 co-operation between different departments Our company encourages an open discussion 1 2 3 4 5 of conflicts and differences Our company encourages participative decision-making 1 2 3 4 5 processes in and between organizational levels Our company encourages informal conversation between 1 2 3 4 5 senior and subordinate personnel Our company encourages teamwork rather than 1 2 3 4 5 individual contributions In our company the emphasis is on getting thing done, 1 2 3 4 5 even if this means disregarding formal procedures In our company our mission, strategy and goals are 1 2 3 4 5 widely communicated to the employees In our company managers provide a great deal of 1 2 3 4 5 support to their subordinates In our company people are rewarded in proportion 1 2 3 4 5 to the excellence of their performance 35. Has your top management made any major attempts to change your company’s culture during the last five years?
Yes No (If no, please go to question 42)
If yes, how can you categorize those changes?
Incremental changes Revolutionary changes Both incremental and revolutionary changes
401

36. What were the main reasons for these attempts to change your company’s culture?
36.1 In order to improve the financial viability in the market 36.2 To be competitive in the market 36.3 Decline of market share of the organization 36.4 Migration to modern IT systems 36.5 M OU and the government’s signal for the importance of performance 36.6 In order to harmonize two different cultures that existed before the merger 36.7 Not having job descriptions 36.8 Need of decentralization of the powers 36.9 Diversity of the human resources of the bank 36.10 Emphasis on mutual respect & team work 36.11 The belief of head office that the Sri Lankan banking system is too risky 36.12 Customer orientation 36.13 Opening of new branches 36.14 To enhance the moral of the staff 36.15 Staff are required from different banks 36.16 Had a different culture 36.17 Survival of the company 36.18 Development took place in the banking sector 36.19 Environmental changes in the banking sector 36.20 Growth of the bank 36.21 Unsatisfactory performance of the bank
37. What were the main changes in your company’s culture?
37.1Goal oriented action 37.2 Planning 37.3 Evaluation with financial achievements/ratios 37.4 Performance management/evaluation 37.5 Change of values to core customers 37.6 Induction of business sense and change of attitude 37.7 Address people by the first name 37.8 Open door policy of managers and supervisors 37.9 Acceptance of younger people at management grade 37.10 Changed the CEO/GM 37.11 Introduction of new task 37.12 Introduction of job descriptions 37.13 Emphasis on team work 37.14 Diversity respecting 37.15 Open communications and exchange of views 37.16 Cut down the staff to work with the minimum capacity 37.17 Change the policies and procedures of company 37.18 Recruitment of new staff 37.19 New uniforms to the staff 37.20 Dialog between staff and management 37.21 Marketing orientation 37.22 Bring the team spirit 37.23 Changed of senior management 37.24 Recruited senior managers from various other banks in Sri Lanka 37.25 Concerned about cost efficiency of the bank
402

38. What were the major factors that supported these changes?
38.1 Govt support 38.2 Commitment of corporate management and the board 38.3 Trade union’s support 38.4 External forces (competitors, owners) 38.5 Induction of network banking 38.6 Recruitment of new employees with professional background 38.7 Appointment of consultants to key areas to inject new culture 38.8 Acceptance of change by majority of staff 38.9 Unsatisfactory performances of the bank 38.10 Low profitability 38.11 Opening of new branches 38.12 Appreciation of effort 38.13 Rewards 38.14 Manage to recruit young staff 15 Let the staff by example 16 Introduction of new products by the banking sector in Sri Lanka 17 Economic changes 18 Growth of the bank 19 To meet capital requirements of central bank 20 The change of main shareholders
39. What were the major factors that you had to consider which made these changes difficult?
39.1 Influence on trade union and informal groups 39.2 Age structure of the staff 39.3 Lack of commitment from the leadership 39.4 Mechanistic organizational structure 39.5 Barriers in bottom to top communication 39.6 Lack of a link between performance and rewarding 39.7 Major share of free riders in work force 39.8 Previous structure of the bank 39.9 Large number of employees who had been with the other bank 39.10 Different views of two organizational cultures 39.11 Long term planning 39.12 High expenses 39.13 Huge turnovers of staff 39.14 Low profitability 39.15 Decrease staff moral 39.16 Capital requirements 39.17 Lack of skills 39.18 Monitoring authority of central bank 39.19 There were no major factors which made these changes difficult
403

40.1 Did your company experience any problems when you implemented these changes? Yes No
40.2 If yes, what were the major problems you faced?
40.2.1 Obtaining required TUs corporation 40.2.2 Change of attitude of staff 40.2.3 Age structure and qualification of staff 40.2.4 Barriers in language (poor English) 40.2.5 Resistance to change in roles, location 40.2.6 Staff moral has decreased
41. In your opinion, how successful have the changes in culture been? Unsuccessful Very successful 1 2 3 4 5 42.1 Do you expect any major changes in your company’s culture in the next five years?
Yes No
42.2 If yes, what kind of changes do you expect?
42.2.1 Introduction of performance evaluation & reward system 42.2.2 Changes to the bank hierarchy 42.2.3 New positions at corporate and operational level 42.2.4 New staff recruitments 42.2.5 Need to change the culture to attract the best talent in the market 42.2.6 Administrative changes
404

43.1Do you have subcultures in your company? Yes No
43.2 If, yes what are the main reasons for the development of sub cultures?
43.2.1 Traditionally used systems 43.2.2 Trade unions and connected mechanisms 43.2.3 Presence of different societies 43.2.4 Geographical distributions of operations 43.2.5 Working within a department 43.2.6 Working culture of Sri Lanka
44. Do you think development of subcultures weaken or undermine the organization?
Yes No
45. According to your opinion the banking culture should be,
Strong Flexible Weak Others (please specify) _____________________________________________________________
46. In your opinion, to what extent does your organization’s culture influence your company strategies? No influence Very great influence 1 2 3 4 5
405

In this section we are seeking information about management styles, power and internal politics of your company.
47. Could you please describe your company’s key management style?
47.1 Bureaucratic 47.2 Top to bottom approach 47.3 Individual performance rather than group performance 47.4 Power motives rather than achievement motives 47.5 Participatory 47.6 Autocratic 47.7 Collective 47.8 Decisions are made by a committee 47.9 Collective decisions by the board of directors 47.10 People friendly 47.11 Honest, sincere transparent culture
48. How much do the following groups influence the management style of your company? No influence Very great influence
Corporate level management 1 2 3 4 5 Outside members of the board of directors 1 2 3 4 5 Second level line managers 1 2 3 4 5 Corporate planning department 1 2 3 4 5 Other lower levels of management 1 2 3 4 5 Others (please specify) _Trade unions__________ 1 2 3 4 5 _Chairman of the head office________________________________________ 49. In your opinion, to what extent does the management style of your company have an effect on the follower’s performance and job satisfaction? Not at all To a great extent 1 2 3 4 5
406

50. To what extent does the management style of your company have an effect on the company performance? Not at all To a great extent
1 2 3 4 5 51. To what extent company key management style influences the company strategies? Not at all To a great extent
1 2 3 4 5 52.1 Did your company face any significant problems with its current management style over the last five years?
Yes No
52.2 If yes, what are major problems of the current management style?
52.2.1 Too much listening to TUs views 52.2.2 Lack of strategic planning 52.2.3 Inequity on policy decisions 52.2.4 Poor practice and use of modern management techniques 52.2.5 Low concentrations on human aspects 52.2.6 Non existence of clear management style 52.2.7 Decreasing of profitability 52.2.8 High turnovers of staff 52.2.9 Dissatisfaction of the employees
53. How would you describe the gap between managers and subordinates in terms of the power in your company?
Low High 1 2 3 4 5
54. To what extent does your company have internal politics? Not at all To a great extent 1 2 3 4 5
407

55. To what extent do you agree or disagree with the following statements. Disagree Strongly agree Organizational politics is bad because that political 1 2 3 4 5 behaviour is undertaken for personal rather than organizational gain Organizational politic is good because it achieves positive 1 2 3 4 5 outcomes for organization that can not be achieved through formal measures Organizational politics is neither good nor bad 1 2 3 4 5 but rather is neutral Organizational politics is good but too much politics 1 2 3 4 5 can be bad
408

In this section we are seeking information about stakeholder expectations of your company.
56. Who are the top six stakeholders of your company?
56.1 Depositors and other customers 56.2 Sri Lankan government 56.3Cooperatives 56.4 Strategic enterprise management agency 56.5 Employees 56.6 Sri Lankan community 56.7 Shareholders 56.8 Directors 56.9 Managers 56.10 Shareholders of the parent bank 56.11 Chairman of the bank 56.12 Overseas head office 56.13 Individual share companies
57. Could you please briefly explain their expectations? (e.g. customers: satisfaction with interest rate, fast service, use of high technology)
57.1 Excellent service+timelines+higher interests benefits 57.2 Assisting government development programmes, funding, provision of employment opportunities 57.3 Financial support 57.4 Viable financial organization 57.5 Career opportunities, job security, rewards, good working conditions 57.6 Assistance to develop the country & economy 57.7 ROE 57.8Good management 57.9 Revenues through taxes 57.10 More profits and to be in the top 25 leading banks in the world
409

58. To what extent are your company’s top level management interests aligned with the overall stakeholders’ interests? Not at all To a great extent
1 2 3 4 5 59. To what extent do you agree or disagree with the following statements?
Disagree Strongly agree
When we are giving priorities for stakeholder’s 1 2 3 4 5 we consider the level of power they have We are trying to meet minimum obligations of stakeholders 1 2 3 4 5 Our top management team decides how much stakeholder 1 2 3 4 5 interests we must take into account 60. To what extent do stakeholder expectations influence your company strategies? Not at all To a great extent
1 2 3 4 5
410

In this section we are seeking information about capabilities and key success factors of your company.
61. Could you please describe the current resources of your company? (For your convenience we have divided the resources into three categories such as physical assets: e.g. Location, building, intellectual assets: e.g. brand name, reputation, cultural assets: e.g. working ethics such as a belief in empowerment)
61.1 Physical assets: 61.1.1 Location 61.1.2 Buildings 61.1.3 Computer system 61.1.4 ATM network 61.2 Intellectual assets: 61.2.1 State ownership 61.2.2 Professional skills of the staff 61.2.3 History of the bank 61.2.4 Reputation 61.2.5 Brand name 61.2.6 Brand name of the parent bank 61.3 Cultural assets: 61.3.1 Strong commitment of some fraction of the staff 61.3.2 Implementation of professional banking 61.3.3 Strong culture developed over the years 61.3.4 Religion bank 61.3.5 Implementing international banking facilities 61.3.6 Brand image as a Local bank
62. Could you please mention the major capabilities of your company in terms of enabling the firm to deliver a fundamental customer benefit? .
411
62.1 Outreach 62.2 Commitment 62.3 Brand image 62.4 State ownership 62.5 Island wide branch network 62.6 Strong asset base 62.7 Up-to-date technology 62.8 Professional staff 62.9 Expertise in development and commercial banking 62.10 Product innovations 62.11 Service Excellency 62.12 Global reach 62.13 Strong balance sheet 62.14 More than 100 years of history 62.15 High credit rating 62.16 Young staff 62.17 Strong asset base of the head office 62.18 Business network 62.19. Vast experience of the CEO 62.20 High calibre senior management 62.21 One stop shop concept 62.22 Finance conglomerate 62.23 Centralized operation system

63. Among the capabilities you mentioned in question 62; could you identify the capabilities which are crucial to the success of the business in the Sri Lankan banking sector?
63.1Outreach 63.2Brand image 63.3Branch network 63.4Professionalism of the staff 63.5Up to date technology 63.6Service Excellency 63.7Strong balance sheet 63.8High credit rating 63.9Business understanding 63.10 Low costs of funds 63.11 Responsiveness to client’s requirements
412

External environment
In this section we are seeking information about the demand environment of your company.
64. Could you please assess what approximate percentage of your company’s revenues fell into each of the following categories over the last five years? The demand environment has been: 64.1Highly predictable % 64.2Predictable % 64.3Fairly predictable % 64.4Unpredictable % 64.5Highly unpredictable % 100 % 65 Over the next five years, what approximate percentage of your company’s revenues do you expect to fall into each of the following categories? The demand environment will be 65.1Highly predictable % 65.2Predictable % 65.3Fairly predictable % 65.4Unpredictable % 65.5Highly unpredictable % 100 % 66. Over the last five years, what approximate percentage of your company’s revenues fell into markets growing at real rates of: 66.1 Over 20% per year % 66.2 0-20% per year % 66.3 5-10% per year % 66.4 0-5% per year % 66.5 Declining market % 100 % 67. Over the next five years, what approximate percentage of your company’s revenues do you expect to fall into markets growing at real rates of? 67.1 Over 20% per year % 67.2 10-20 % per year % 67.3 5-10% per year % 67.4 0-5% per year % 67.5 Declining market % 100%
413

In this section we are seeking information about the competitive environment of your company.
68. What approximate percentage of your sales is achieved in each of the following competitive environment in your business type? 1 to 2 major competitors:
You are the market leader % You are not the market leader %
3 to 7 major competitors:
You are the market leader % You are not the market leader %
More than 7 major competitors
You are the market leader % You are not the market leader %
100% 69. Over the last five years, approximately what percentage of your revenues fell into categories in which your major competitors’ actions were? 69.1Highly predictable % 69.2 Predictable % 69.3 Fairly predictable % 69.4 Unpredictable % 69.5 Highly unpredictable % 100 % 70. Over the next five years, approximately what percentage of your revenues do you expect to fall into categories in which your major competitor’s actions are? 70.1Highly predictable % 70.2 Predictable % 70.3 Fairly predictable % 70.4 Unpredictable % 70.5 Highly unpredictable % 100 %
414

In this section we are seeking information about the competition and market share of your company.
71. Over the last five years, what was your company’s market share in your three most important markets? 71.1 Most important market: 71.1.1Name of the market: __________________________ 71.1.2 Market share (Please select one)
Over 20% 10-20% 5-10% 0-5%
71.2 Second most important market: 71.2.1 Name of the market: __________________________ 71.2.2 Market share (please select one)
Over 20% 10-20% 5-10% 0-5%
71.3 Third most important market: 71.3.1 Name of the market :______________________ 71.3.2 Market share (please select one)
Over 20% 10-20% 5-10% 0-5%
72. Over the next five years, what do you expect your share to be in your three most important markets? 72.1 Most important market 72.1.1 Name of the market _____________________________ 72.1.2 Market share (please select one)
Over 20% 10-20% 5-10% 0-5%
72.2 Second most important market 72.2.1 Name of the market: _____________________________ 72.2.2 Market share (please select one)
Over 20% 10-20% 5-10% 0-5%
415

72.3 Third most important market 72.3.1 Name of the market: _________________________ 72.3.2 Market share (please select one)
Over 20% 10-20% 5-10% 0-5%
416

The following questions deal with your company customers.
73. Over the last five years, who were five major customer groups of your company?
Agriculture sector Manufacturing sector Construction sector Real estate business sector Property business sector Export business sector Wholesale and retail trade sector Public utilities sector Service sector Personal consumption Leasing business sector Others (Please specify) _trade and finance, mining, Commercial, garments, financial intstitutions__,
Transport__________ 74. Over the next five years, who do you expect to be your five major customer groups?
Agriculture sector Manufacturing sector Construction sector Real estate business sector Property business sector Export business sector Wholesale and retail trade sector Public utilities sector Service sector Personal consumption Leasing business sector Others (Please specify) _mining, Commercial, garments, financial institutions, transport, imports______
75. To what extent is your company dependent on its 100 major customers? Not dependent Very dependent 75.1 Over the last five years 1 2 3 4 5 75.2 Over the next five years 1 2 3 4 5 75.What approximate percentage of your revenue is from your 100 largest customers? Approximate percentage: _______________ %
417

The following questions deal with your company competitors.
76. Over the last five years, who were five major competitor groups of your company? (You may select more than one)
Government Banks Foreign Banks Local commercial banks Insurance companies Leasing companies Credit finance companies Foreign exchange black market Others (Please specify) ____________________________________
77. Over the next five years, who do you expect to be the five major competitor groups? (You may select more than one)
Government Banks Foreign Banks Local commercial banks Insurance companies Leasing companies Credit finance companies Foreign exchange black market Others (Please specify) ____________________________________
78. To what extent do the major competitors influence your company strategies? No influence Very great influence Over the last five years 1 2 3 4 5 Over the next five years 1 2 3 4 5
418

The following questions deal with your company business and the government.
79. Over the last five years, what percentage of your sales has been in businesses which are? Highly government regulated % Somewhat government regulated % Not at all government regulated % 100% 80. Over the next five years, what percentage of your sales do you expect to fall into categories for which government regulation will? Increase % No change % Decrease % 100% 81. To what extent are you satisfied with the current government rules and regulations on the banking industry? Dissatisfied Very satisfied
1 2 3 4 5
419

The following question deal with your company suppliers (Sources of funds).
82. Over the last five years, what were the three major sources of funds for your company? (Please also specify approximate percentage of your three major sources of funds)
Funds from government ________ % Funds from foreign organizations ________ % Funds from domestic organizations ________ % Funds from domestic customers ________ % Funds from investments in domestic financial market ________ % Funds from investment in overseas financial market ________ % Others (please specify)_Overseas head office _____________________ % Funds from other banks
83. Over the next five years, what do you expect will be the three major sources of funds for your company? (Please also specify approximate percentage of your three major sources of funds)
Funds from government _______ % Funds from foreign organizations ________% Funds from domestic organizations ________% Funds from domestic customers ________% Funds from investments in domestic financial market ________% Funds from investment in overseas financial market ________% Others (please specify) ___ Head office of parent bank _______________%
84. How dependent is your company on its major sources of funds? Not at all dependent Very dependent Over the last five years 1 2 3 4 5 Over the next five years 1 2 3 4 5 85. Over the last five years, what percentage of your major fund sources fell into the following categories? No availability problems _______% Some availability problems _______% Significant availability problems _______% Severe availability problems _______%
100%
86. Over the next five years, what approximate percentage of your major fund sources do you expect to fall into the following categories? No availability problems _______% Some availability problems _______% Significant availability problems _______% Severe availability problems _______% 100%
420

The following questions deal with new entrants to your company’s business sector.
87. Over the next five years, who are three possible major new entrants into your business sector that you expect?
1. Private local banks 2. Corporative banks 3. Foreign banks (except India and Pakistan) 4. Indian banks with back office in India 5. Islamic banks 6. Non banking corporate lending institutions 7. Capital market institutions 8. Non banking financial institutions
88. In your opinion, how difficult is entry into your company’s business sector for these three possible new entrants? Easy to enter Difficult to enter
1 2 3 4 5
421

Our next question deals with political, economic, social, and technological environments.
89. To what degree have the Sri Lankan government policies impacted on your company’s operations in the following time period? No impact Severe impact Over the last five years 1 2 3 4 5 At present 1 2 3 4 5 Over the next five years 1 2 3 4 5 90. Could you please describe the current impacts of the Sri Lankan government policies on your company’s operations? (e.g. interest rate controls, capital requirements etc.)
1 Capital requirements 2 Monetary contacts 3 Assisting government programmes/organizations 4 Fiscal policies of government 5 CBSL regulations with government policies 6 Economic development policies 7 Re-introduce of stamp duty from 01/04/2006 8 Increase of taxes in financial services 9 On sight and off sight examinations 10 Internal controls 11 Interest rate controls 12 Money lending policy
91. To what degree has the Sri Lankan government been involved in your company’s operation in the following time periods? No involvement Very high involvement Over the last five years 1 2 3 4 5 At present 1 2 3 4 5 Over the next five years 1 2 3 4 5
422
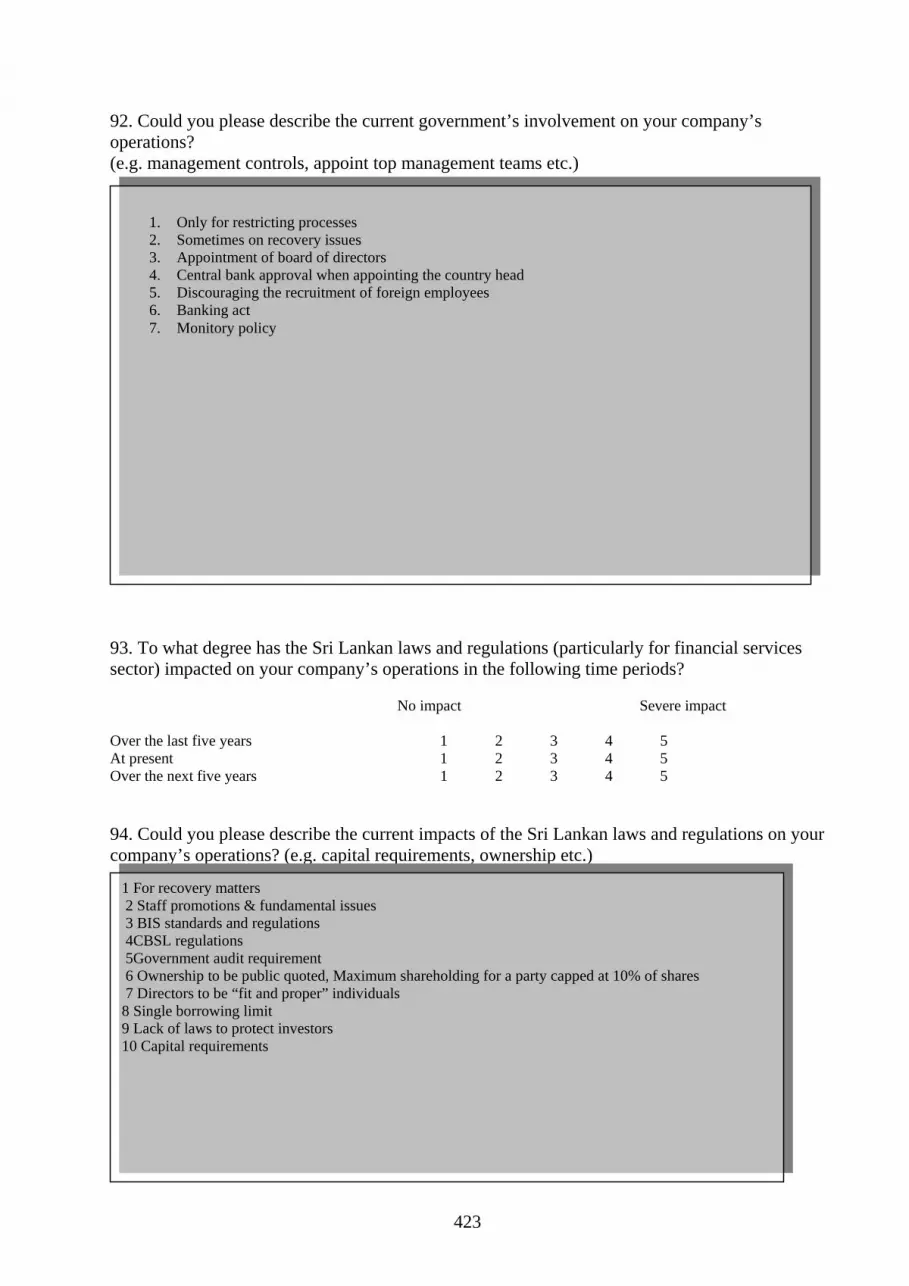
92. Could you please describe the current government’s involvement on your company’s operations? (e.g. management controls, appoint top management teams etc.)
1. Only for restricting processes 2. Sometimes on recovery issues 3. Appointment of board of directors 4. Central bank approval when appointing the country head 5. Discouraging the recruitment of foreign employees 6. Banking act 7. Monitory policy
93. To what degree has the Sri Lankan laws and regulations (particularly for financial services sector) impacted on your company’s operations in the following time periods? No impact Severe impact Over the last five years 1 2 3 4 5 At present 1 2 3 4 5 Over the next five years 1 2 3 4 5 94. Could you please describe the current impacts of the Sri Lankan laws and regulations on your company’s operations? (e.g. capital requirements, ownership etc.)
1 For recovery matters 2 Staff promotions & fundamental issues 3 BIS standards and regulations 4CBSL regulations 5Government audit requirement 6 Ownership to be public quoted, Maximum shareholding for a party capped at 10% of shares 7 Directors to be “fit and proper” individuals 8 Single borrowing limit 9 Lack of laws to protect investors 10 Capital requirements
423

95. To what degree has the Sri Lankan economy impacted on your company’s operations in the following time periods?
No impact Severe impact Over the last five years 1 2 3 4 5 At present 1 2 3 4 5 Over the next five years 1 2 3 4 5 96. Could you please describe the current impacts of the Sri Lankan economy on your company’s operations? (e.g. investment opportunities, profitability etc)
96.1 Low Investment opportunities due to political uncertainty 96.2 Deposit mobilization 96.3 Profitability 96.4 Branch expansion 96.5 Low consumption pattern 96.6 Low rates of borrowings
97. To what degree has the Sri Lankan social/cultural environment impacted on your company’s operations in the following time periods?
No impact Severe impact Over the last five years 1 2 3 4 5 At present 1 2 3 4 5 Over the next five years 1 2 3 4 5
424

98. Could you please describe the current impacts of the Sri Lankan social cultural environment on your company’s operations?
98.1 Specially peace/war situation in the country 98.2 Demography (more youngsters in the market) 98.3 Technology driven delivery channels
99. To what degree has the innovative technology available in Sri Lanka impacted on your company’s operations in the following time periods?
No impact Severe impact Over the last five years 1 2 3 4 5 At present 1 2 3 4 5 Over the next five years 1 2 3 4 5 100. Could you please describe the current impacts of the new technology on your company’s operations? (e.g. customer service, new products etc.)
100.1 New products 100.2 Customer services 100.3 Planning & management 100.4 Network banking 100.5 Office automation 100.6 Centralized operation 100.7 Link with global network such as Cirrus and maestro
425

Part 2
The Assessment of Company’s:
• Mission and vision statements • Long-term goals • Strategic planning and strategic thinking capabilities
426

In this section we are seeking information about the mission statement and the vision of your company.
101. Does your company have a formal mission statement as a whole?
Yes No (If no please go to question 109)
102. Could you please describe your current company’s mission statement?
102.1 Customers 102.2 Owners 102.3 Employees 102.4 Society 102.5 To be dominant in the financial sector 102.6 Shareholders 102.7 Service excellence 102.8 Stakeholder expectations 102.9 Technology 102.10 Financial services 102.11 Financial goals
103. How much have the following groups influenced the formulation of your present corporate mission? No influence Very great influence Corporate level management 1 2 3 4 5
Chief executive officer 1 2 3 4 5
Outside members of the board of directors 1 2 3 4 5
Second level line managers 1 2 3 4 5
Corporate planning department 1 2 3 4 5
Sri Lankan government 1 2 3 4 5
Other lower levels of management 1 2 3 4 5
104. Has your company changed its mission statement in the last five years?
Yes It was changed in 19 _ _ No (Please go to question 107)
427

105. What changes were made in your mission statement at that time? (You may select more than one)
Mission stated for the first time Mission was stated more specifically Mission statement was expanded Others Mission was completely
changed______________________________________________________________________________ 106. How much did the following factors influence the change in your company’s mission statement? No influence Very great influence Mission changed because of new chief executive officer 1 2 3 4 5 Mission changed because owner or main shareholders changed 1 2 3 4 5 Mission changed because of top management teams changed 1 2 3 4 5 Mission changed because of joint venture with other organizations 1 2 3 4 5 Mission changed because of merger with other organizations 1 2 3 4 5 Mission changed because of Sri Lankan politics 1 2 3 4 5 Mission changed because of economic factors 1 2 3 4 5 Mission changed because of social factors 1 2 3 4 5 Mission changed because of technological factors 1 2 3 4 5 Mission changed because of law and regulations 1 2 3 4 5 Mission changed because company developed new capabilities 1 2 3 4 5 Mission changed because of strategic considerations 1 2 3 4 5 Others (Please specify) ___As new plans introduced _______ 1 2 3 4 5 __________________________________________________ 107. To what extent does your company consider its mission statement to have been appropriate over the last five years? Not appropriate Very appropriate 1 2 3 4 5 108. How long do you expect that your company will continue to follow its current mission statement? Approximately _____________ years
428

109. Does your company have a vision?
Yes No (If no, please go to question 113 )
110. What is the vision of your company?
1. To be the best bank of the people 2. Have an international presence in the future 3. Dominate the financial sector 4. Provide exceptional banking services 5. To be the premium retail focused Sri Lankan bank 6. A world class Sri Lankan bank
111. How much have the following groups influenced the formulation of your present vision of the company? No influence Very great influence Founders of the company 1 2 3 4 5
Corporate level management 1 2 3 4 5
Chief executive officer 1 2 3 4 5
Outside members of the board of directors 1 2 3 4 5
Second level line managers 1 2 3 4 5
Corporate planning department 1 2 3 4 5
Sri Lankan government 1 2 3 4 5
Other lower levels of management 1 2 3 4 5
Others (please specify) __________________ 1 2 3 4 5 _____________________________________ 112. How long do you expect that your company will continue to follow its current vision of the company? Approximately _____________ years
429

In this section we are seeking information about the setting of corporate long- term goals in your company.
113. Does your company have formal corporate long-term goals, which it seeks to achieve?
Yes No (If no, please go to question 125)
114. Could you please indicate the quantitative goals, which serve guiding roles in decisions that are strategic for the bank as a whole? (You may select more than one)
Return goals Stock market goals Number of new branches per year Profits, income, cash flow Dividend maintenance Financial ratio controls Others (Please specify) Deposit Loans NPL Staffing Market share
115. Does your bank also have formal qualitative long- term goals?
Yes No
If yes, Please indicate the main ones: (You may select more than one)
Technological leadership and advantage Maintain acceptable financial posture/control cost Leadership in quality and service Leadership in reputation and image Focus on market segment Customer focus Societal goals Others (Please specify) __________________________________________________
_______________________________________________________________ 116. How much have the following groups influenced the formulation of your present company long term- goals? No influence Very great influence Corporate level management 1 2 3 4 5 Chief executive officer 1 2 3 4 5 Outside members of the board directors 1 2 3 4 5 Second level line managers 1 2 3 4 5 Corporate planning department 1 2 3 4 5
430

Central bank of Sri Lanka 1 2 3 4 5 Others (Please specify) ____SEMA ___ 1 2 3 4 5 _________________________________ 117. Which of the following best reflects the process for formulating company long-term goals? (Please select one of the following)
Formulated for the company by the chief executive officer Formulated for the company by the corporate level management Formulated for the company by the board of directors Aggregation of the goals developed by second level management Negotiation process between the corporate level/board of directors group and second level management Negotiation process between the chief executive officer and key advisors Negotiation process between the chief executive officer and corporate level management Others (Please specify)________________________________________________________________
___________________________________________________________________________________ 118. To what extent do your corporate goals serve an important role in each of the following area? Not important Very important Evaluation of its past performance 1 2 3 4 5 Communication to external public 1 2 3 4 5 Evaluation of second level objectives 1 2 3 4 5 Evaluation of other lower levels objectives 1 2 3 4 5 Monitor current performance 1 2 3 4 5 Activate contingencies 1 2 3 4 5 Provide challenge and motivation 1 2 3 4 5 119. Have your corporate level goals changed in the last five years?
Yes No (If no, please go to question 122)
If yes, in year 200 _ _ 120. What corporate goals changed at that time? (You may select more than one)
Focus on philosophy Upgrade or update of goals Change of financial factors Formalization or explicitness of goals General qualitative additions Instituted new goals Others (Please specify) ______________________________________________________
_____________________________________________________________________________
431

121. How much do the following factors influence changes in the goals of the corporate level? No influence Very great influence Changes in ownership 1 2 3 4 5 Changes in top management 1 2 3 4 5 Unsatisfactory performance 1 2 3 4 5 Technological breakthroughs 1 2 3 4 5 Changes in economic environment 1 2 3 4 5 Changes in government policies 1 2 3 4 5 Others (Please specify) ____________________ 1 2 3 4 5 _______________________________________ 122. How long will your corporate level continue following the current goals? Approximately years 123. Over the last five years, would you say your company had, in general, exceeded, met or failed to achieve its key goals? Failed to Met Exceeded goals achieve goals goals 1 2 3 4 5 124. In your opinion, what are the reasons for that performance and how important were those reasons? Not at all important Very important Appropriateness of goals 1 2 3 4 5
Managerial competence 1 2 3 4 5
Competition 1 2 3 4 5
Economic environment 1 2 3 4 5
Technological change 1 2 3 4 5
Others (please specify) use of high technolgy __ 1 2 3 4 5
_ In appropriate corporate policy in head office
Opening of new branches
______________________________________
432

Next section, we would like some information about the setting of second level’s long-term goals of your company.
125. Does your company have formal second level long term goals, which it seeks to achieve?
Yes No (If no, please go to question 131)
126. Do all second level operating units have the same goals with respect to units of measurement?
Yes No
If yes, what is the unit of measurement? (You may select more than one)
Return on investment, return on assets, return on capital Profits Cash flow Sales growth Return on sales Other (please specify) Productivity measurements
If no; why they are different?
126.3.1 The type of work done by departments remain different, hence the methodology of measurement will differ
What is the unit of measurement? (You may select more than one) Return on investment, return on assets, return on capital Profits Cash flow Sales growth Return on sales Other (please specify) _________________________________________________
___________________________________________________________
433

127. How much do the following groups influence the formulation of the second level long-term goals? No influence Very great influence Corporate level management 1 2 3 4 5 Chief executive officer 1 2 3 4 5 Outside members of the board of directors 1 2 3 4 5 Corporate planning department 1 2 3 4 5 Second level line managers 1 2 3 4 5 Other lower levels of managers 1 2 3 4 5 Others (Please specify) ___________________ 1 2 3 4 5 ________________________________ 128. Which of the following best reflects your company’s process for formulating second level long-term goals? (Please select one of the following)
Formulated for second level by the corporate level management Formulated for second level by the CEO Aggregation of the goals developed by third level management Negotiation process between the corporate level/ and second level management Formulated by second level management Others (Please specify) _______________________________________________________
______________________________________________________________ 129. To what extent do your second level goals serve an important role in your company? Not important Very important As a major influence on final 1 2 3 4 5 corporate goals As rationing devices for capital and 1 2 3 4 5 other resources As standards to evaluate business 1 2 3 4 5 unit performance As a basis for formally determining an 1 2 3 4 5 incentive portion of managerial compensation 130. How do you assess the quality of your second level management long-term goals? Very poor Very good 1 2 3 4 5
434

In this section we are seeking information about the planning and planning systems of your company.
131. Does your company have a formalized strategic planning system at? Corporate level Yes No Second level Yes No If no to both, please go to question 197 132. For what time horizons does your company develop a formal corporate plan? Years ____________________ Years ____________________ Years ____________________ 133. Which of the plans noted in question 132 would you consider the key guiding long-term plan for your company? Years _________________ 134. What is the relationship between these plans? (Please select one)
Prepared independently and not coordinated Longer term plan prepared first, shorter term plan then fitted into long-term plan Shorter-term plan prepared first, longer-term plan then extended Shorter term plan prepared first, longer term plans are then modified from previous year. Short and long term plans prepared simultaneously
135. When did your company first develop a formal corporate long term plan? Year_________________ 136. How often is your corporate plan updated? (e.g. six monthly, every year, every 1-2 years etc.) _________________________________ 137. How frequently is progress reviewed against this plan? (Please select one of the followings) (e.g. monthly, quarterly, six monthly etc.) ________________________________
435

138. How would you characterize the extent to which corporate planning effort is spent on the following types of activity?
No effort High degree of effort Short term emergency planning 1 2 3 4 5 Action planning or operational planning 1 2 3 4 5 For the next 1 to 3 years Formalized contingency planning 1 2 3 4 5 Long-term planning for the next 5 to 10 years 1 2 3 4 5 “What the company wants to be in the next 1 2 3 4 5 10-20years” planning Acquisitions 1 2 3 4 5 Divestitures 1 2 3 4 5 International expansion 1 2 3 4 5 Others (Please specify) __________________________ 1 2 3 4 5 ______________________________________ 139. How much efforts (in terms of time and/or financial resources) were expended by corporate planning in each of the following forecast areas over the last five years? Please indicate also whether or not external forecasts were purchased. No effort High degree of effort Purchase of
external forecasts
Domestic economy 1 2 3 4 5 Yes No Foreign economies 1 2 3 4 5 Yes No Technological 1 2 3 4 5 Yes No Sri Lankan politics 1 2 3 4 5 Yes No Laws and regulations for 1 2 3 4 5 Yes No financial services sector Social and /or cultural 1 2 3 4 5 Yes No Financial markets 1 2 3 4 5 Yes No Human resources 1 2 3 4 5 Yes No Industry level demand 1 2 3 4 5 Yes No Competitive analysis 1 2 3 4 5 Yes No Suppliers requirements 1 2 3 4 5 Yes No (Sources of fund)
436

140. To what extent are forecasts, which were developed or purchased by corporate planning, transmitted to the second level in one form or another for each of the following areas? Never transmitted Regular transmitted
Domestic economy 1 2 3 4 5
Foreign economies 1 2 3 4 5
Technological 1 2 3 4 5
Sri Lankan politics 1 2 3 4 5
Laws and regulations for financial services sector 1 2 3 4 5
Social and/ or cultural 1 2 3 4 5
Financial markets 1 2 3 4 5
Human resources 1 2 3 4 5
Industry level demand 1 2 3 4 5
Competitive analysis 1 2 3 4 5
Suppliers requirements (sources of fund) 1 2 3 4 5
141. If the external forecasts purchased by corporate planning were not available, how severe would be the impact on the:
No impact Severe impact
Quality of corporate planning effort 1 2 3 4 5 Quality of second level planning effort 1 2 3 4 5 Quality of other lower levels planning effort 1 2 3 4 5 142. How difficult would it be for the second level units to obtain for themselves the information they currently receive from corporate planning? Not difficult Very difficult 1 2 3 4 5
437

143. Would you please provide us with a copy of the table of contents of your latest corporate long-range plan?
Yes (enclosed) No
If no, alternatively, would you please list the major headings of your latest corporate long-range plan? (e.g missions, goals and objectives, customer analysis, competitor analysis, corporate strategies etc.)
143.2.1 Vision 143.2.2 Mission 143.2.3 Objectives 143.2.4 Goals 143.2.5 Competitive analysis 143.2.6 Action plans 143.2.7 Customer analyses 143.2.8 Political environment 143.2.9 Shareholder requirements in overseas head office 143.2.10 Corporate strategies 143.2.11 Environmental analyses 143.2.12 Policies and procedures 143.2.13 Customer demand 143.2.14 Deposit mobilizations 143.2.15 Implementation and monitoring 143.2.16 Feedbacks
144. Which organizational personnel have access to the current corporate plan? (You may select more than one)
Second level and up Third level and up Senior management only Senior staff Operating managers Others (please specify) _Head of department and above________________________________________
_______________________________________________________
438

145. To what extent do the efforts at corporate level in developing a corporate plan, provide added value over and above the second level plans in each of the following areas? No added value Major added value Financial 1 2 3 4 5
Human resources 1 2 3 4 5
Research and development 1 2 3 4 5
Markets 1 2 3 4 5
Technology 1 2 3 4 5
Operations 1 2 3 4 5
Sources and uses of funds 1 2 3 4 5
Organization structure 1 2 3 4 5
Competitive analysis 1 2 3 4 5
146. To what extent does your company use computer models/systems to support corporate planning?
No use Extensive use 1 2 3 4 5
147. Which models/systems are used regularly to support your corporate planning? Models: Forecasting models Yes No
Financial models Yes No
Econometric models Yes No
Planning models Yes No
Simulation models Yes No
Others (Please specify) ___________________ Yes No
______________________________________ Systems Strategic decision support systems Yes No
Group decision support systems Yes No
Others (Please specify)_____________________ Yes No
____________________________________
439

148. How useful have these models/systems been? Not at all useful Very useful
1 2 3 4 5 149. Does your company have any computer systems, which link the corporate planning system with second level units?
Yes No
150. Does your company have a corporate planning department?
Yes No (If no go to question 162)
151. What, in rough terms, is the annual direct cash budget (excluding allocations) of the corporate planning department? ________________________ Sri Lankan Rupees 152. How many professional (non-clerical) personnel comprise the corporate planning department? Number: ______________________ 153. Could please classify these professional personnel in terms of their current skills? (Give full-time equivalents if applicable) Number Planning specialists __________________
Economists __________________
Business forecast specialists __________________
Computer/information specialists __________________
Marketing specialists __________________
Financial specialists __________________
Legal specialists __________________
Services and products specialists __________________
International business specialists __________________
Research and development specialists __________________
Others (please specify) ________________________ __________________
____________________________________ 154. On average, how long do corporate planning personnel stay in corporate planning jobs? Years_______________
440

155. To what extent are line personnel rotated through the corporate planning department? No rotation Extensive rotation
1 2 3 4 5 156. Who is the immediate supervisor of the chief corporate planner?
Chairman Chief executive officer/managing director Treasure/controller/finance director Executive general manager Others (Please specify) ________________________
157. To what extent does the chief corporate planner attend: Never Always
Board meetings 1 2 3 4 5
Capital budgeting meetings 1 2 3 4 5
Divisional planning meeting 1 2 3 4 5
Group planning meetings 1 2 3 4 5
158. To what extent does the corporate planning department have the authority to:
No authority Complete authority Obtain substantive revisions in second level plans 1 2 3 4 5
Obtain procedural revisions in second level plans 1 2 3 4 5
Review and criticize second level plans 1 2 3 4 5
Accept and reject second level plans 1 2 3 4 5
159. To what extent do you agree or disagree with each of the following statement regarding the performance of the corporate planning group? Disagree Strongly agree Specific performance goals have been clearly established 1 2 3 4 5
Numerical or quantified procedures are use extensively to 1 2 3 4 5 measure performance Are detailed reports of the performance of corporate planning prepared?
Yes No
If yes, how frequently? ________________ Times per year
441

160. Which of the following documents are used by the corporate planning group? (You may select more than one)
Documents describing the planning procedures Documents specifying roles and responsibilities for corporate planning Written schedules (time tables) for the corporate planning process Standard forms for the collection of planning data Standard forms for the evaluation of strategic proposals
161. Is your corporate planning process written up in a planning manual?
Yes No
442

In this section we are seeking information about the second level planning of your company.
162. Does your company prepare second level long term business plans?
Yes No
If no, please go to question 179 163. Would you please provide us with a copy of the table of contents of your current most common type of the second level business plan?
Yes (enclosed) No
If no, alternatively, would you please list the major headings of your current most common type of second level business plans?
163.2.1 Environmental analysis 163.2.2 Business strategies 163.2.3 Forecasts and budgets 163.2.4 Revenue targets 163.2.5 Number of employees with grades 163.2.6 Individual targets 163.2.7 Time frames for assessment 163.2.8 Volume targets for products and services
164. Do you group second level units for planning, the same way as they are grouped for operations?
Yes No (If no please go to question 166)
443

165. Could you please specify and describe three major long term plans at the second level: Type of plan No of plans of Reviewed at corporate This type levels 1_Revenue Target_____________ _____________ Yes No 2._Volume targets______ _____________ Yes No 3.__Time frames_______ _____________ Yes No When did you first start formal long-term planning at the second level? Year: _________________ with this configuration of plans? Year:_________________ Are these second planning units profit centres
Yes No
Please go to question 167 166. How do you group your business planning units, what are the bases for their definition and what is the number of units of each type? Example of names: SBU, division, sector Example of bases for definition: product, market, function, resource. Type of second level planning unit Bases for definition Number of units ___________________________ _______________ ____________ ___________________________ _______________ ____________ ___________________________ _______________ ____________ What are the major reasons why this particular configuration was chosen? (e.g: common competitors, customers, and facilities)
444

When did you first start formal long-term planning at the second level? Year:_____________ And with this configuration of plans? Year_____________ Are these second planning units profits centres
Yes No
167. How often are you second level plans updated? (Please select one of the following)
Monthly Quarterly Six monthly Yearly More than once a year
168. How frequently is progress reviewed against the second level plan? (Please select one of the following)
Monthly Quarterly Six monthly Yearly More than once a year
169. To what extent are the annual budgets for the second level units integrated with the long term plans of these units?
Not at all Very integrated
1 2 3 4 5 170. Has your company developed a standardized format for the second level?
Yes No
If yes, approximately what percentages of the plans in fact conform to this format? Per cent: ___________ 171. Does your company have specialized planning personnel at the second level?
Yes No (go to question 176)
If yes, how many second level planning units are there in your company? Number ___________________
445

Across all second level units, how many specialized planning personnel does your company have? Number _____________ 172. What are the three most frequent functional backgrounds of second level planners in your company? 1. ______________________ 2. ______________________ 3. ______________________ 173. On average, how long do personnel stay in second level planning jobs? Years: ________________ 174. To what extent are line personnel rotated through the second level planning units?
No rotation Extensive rotation
1 2 3 4 5 175. Who is the immediate supervisor of the top second level planner?
Senior second level operating officer Subordinate of the top corporate level planner Corporate planner Second level controller Other (please specify) ____________________________________________
176. To what extent does your company use computer models/systems to support second level planning?
No use Extensive use 1 2 3 4 5
446

177. Do the models/systems used to support your second level planning similar to models/systems used at your corporate level planning?
Yes No
If no, which models/systems are used regularly to support your second level planning? Models: Forecasting models Yes No Financial models Yes No Econometric models Yes No Planning models Yes No Simulation models Yes No Others (Please specify)__________________ Yes No Systems Strategic decision support systems Yes No Group decision support systems Yes No Others (Please specify)In house develop__________ Yes No Model in excel 178. How useful have these models/systems been?
Not at all Very useful
1 2 3 4 5 179. Does your company develop third level long-term business plans?
Yes No
180. Does your company develop fourth level long term business plans?
Yes No
181. Does your company develop formal contingency plans as part of its long-term planning effort?
Yes No
If yes, at what levels are major contingencies developed?
Corporate level only Second level only Both corporate and second level
Which are the major variables in your contingency plans?
Uncontrollable environmental factors Unpredictable strategic actions
447

The following question deals with the various functions of corporate planning in your company. If no corporate planning, please go to question 183.
182. Could you please asses how much effort is expended by corporate planning in each of the following activities? The following statements are focused on activities at corporate level. No effort High degree of effort Specific planning tasks: Define guidelines, formats and timetables for planning activity 1 2 3 4 5 Develop macro forecasts of the economy, financial 1 2 3 4 5 markets, political environment and etc Prepare specific studies 1 2 3 4 5 Develop improved accounting and financial data for strategic planning 1 2 3 4 5 Identify areas of new business opportunity 1 2 3 4 5 Reorganize the company around more clearly defined business units 1 2 3 4 5 Overall planning responsibility: Develop and write the corporate plans 1 2 3 4 5 Monitor and control progress versus plans 1 2 3 4 5 Assistance at corporate level: Help corporate management formulate goals and objectives 1 2 3 4 5 Help corporate management formulate strategy 1 2 3 4 5 Help corporate management with acquisition plans 1 2 3 4 5 Help corporate management with divestiture plans 1 2 3 4 5 Help corporate management with identification of financing needs 1 2 3 4 5 Help corporate management with non- performing loans plans 1 2 3 4 5 Help corporate management with merger plans 1 2 3 4 5 Help corporate management with joint venture plans 1 2 3 4 5 Help corporate management with sources and uses of fund plans 1 2 3 4 5 Assistance at second level: Help Second level management formulate goals and objectives 1 2 3 4 5 Help second level management formulate strategy 1 2 3 4 5 Review and evaluate second level plans 1 2 3 4 5 Integrate second level plans with the corporate plan 1 2 3 4 5
448

No effort High degree of effort Improving planning performance: Improve the quality of strategic thinking of corporate management 1 2 3 4 5 Improve the quality of strategic thinking of second level management 1 2 3 4 5 Assess the overall effectiveness of the planning process 1 2 3 4 5
449

The following questions deal with the nature of the planning process in your company
183. To what extent do you agree or disagree with each of the following statements? In the case of no corporate planning, please answer for planning that exists. Disagree Strongly agree
Roles: The planning process plays an important role in the 1 2 3 4 5 organization’s communication network The planning process plays an important role 1 2 3 4 5 in auditing ongoing activities The planning process plays an important role in strategically 1 2 3 4 5 managing our company’s organization’s structure The planning process plays an important role in strategically 1 2 3 4 5 managing our company’s quality issues The planning process play an important role in strategically 1 2 3 4 5 managing our company’s culture The planning process plays an important role in strategically 1 2 3 4 5 managing our company’s managerial styles The planning process is necessary to sequence future activities 1 2 3 4 5 The planning process encourages the development of new 1 2 3 4 5 business by combining expertise and resources from lower level units The planning process is a means of ensuring that specialized 1 2 3 4 5 knowledge is stored and available to the whole organization The planning process has had a measurable positive effect 1 2 3 4 5 on sale and profits The planning process acts mainly as an agency for assembling 1 2 3 4 5 financial reports The planning process helps to focus the company’s R & D 1 2 3 4 5 efforts around defined opportunity areas Conflicts resolution: The planning process is a device to assure that conflicting 1 2 3 4 5 expectations are resolved The planning process is a means of organizational 1 2 3 4 5 conflict resolution The planning process involves a great deal of bargaining 1 2 3 4 5
450

Disagree Strongly agree Uncertainty and risk resolution: The planning process is a means for systematically 1 2 3 4 5 dealing with uncertainty The planning process enables the company to avoid 1 2 3 4 5 unacceptably high levels of risks The planning process has constrained the strategic 1 2 3 4 5 risk taking behaviour of lower level managers Resource allocation: The planning process is a key device for allocating 1 2 3 4 5 corporate resources throughout the company The planning process assures that scarce resources 1 2 3 4 5 are allocated to high yield uses The planning process has improved the company’s 1 2 3 4 5 long-term resource allocation decisions Long-term resource allocation decisions are made as an 1 2 3 4 5 integral part of the planning process 184. To what extent do you agree or disagree with each of the following statements? Disagree Strongly agree
Planning process Our planning effort is an adaptive, evolving, learning activity 1 2 3 4 5 Our planning effort is a fairly routinised activity 1 2 3 4 5 In our planning process, all key personnel contribute 1 2 3 4 5 their fair share of effort In our company daily routine drives out planning effort 1 2 3 4 5 Planning is often characterized by distortion of data 1 2 3 4 5 Competitive analysis: In our company, a great deal of effort is expended in 1 2 3 4 5 attempting to identify competitors cost structure Our company focuses its competitive analysis on 1 2 3 4 5 competitive products analysis Competitive analysis is primary the responsibility of 1 2 3 4 5 our sales and marketing people Competitive analysis is a major activity of the corporate 1 2 3 4 5 planning department Competitive analysis is a major activity of the corporate 1 2 3 4 5 level management Competitive analysis is a major activity of our second 1 2 3 4 5 level management
451

Disagree Strongly agree Supplier analysis: A great deal of effort is expended in attempting to 1 2 3 4 5 identify the sources of funds The supplier analysis is primarily the responsibility 1 2 3 4 5 of our financial people The supplier analysis is a major activity of the corporate 1 2 3 4 5 planning department The supplier analysis is a major activity of the corporate 1 2 3 4 5 level management The supplier analysis is a major activity of the second 1 2 3 4 5 level management Customer analysis In our company, a great deal of effort is expended in 1 2 3 4 5 attempting to identify the customer demands The customer analysis is primarily the responsibility 1 2 3 4 5 of our marketing people The customer analysis is a major activity of the corporate 1 2 3 4 5 planning department The customer analysis is a major activity of the corporate 1 2 3 4 5 level management The customer analysis is a major activity of the second 1 2 3 4 5 level management Political analysis A great deal of effort is expended in attempting to identify 1 2 3 4 5 the possible impacts of the government on our business operations The political analysis is primarily the responsibility of our 1 2 3 4 5 operations people The political analysis is a major activity of the corporate 1 2 3 4 5 planning department The political analysis is a major activity of the corporate 1 2 3 4 5 level management The political analysis is a major activity of the second 1 2 3 4 5 level management Economic analysis: A great deal of effort is expended in attempting to identify 1 2 3 4 5 the possible impacts of the economy on our business operations The economic analysis is primarily the responsibility of our 1 2 3 4 5 operations people The economic analysis is a major activity of the corporate 1 2 3 4 5 planning department
452

Disagree Strongly agree The economic analysis is a major activity of the corporate 1 2 3 4 5 level management The economic analysis is a major activity of the second 1 2 3 4 5 level management Social and cultural analysis: A great deal of effort is expended in attempting to identify 1 2 3 4 5 the possible impacts of the Sri Lankan culture on our business operations The cultural analysis is primarily the responsibility of our 1 2 3 4 5 operations people The cultural analysis is a major activity of the corporate 1 2 3 4 5 planning department The cultural analysis is a major activity of the corporate 1 2 3 4 5 level management The cultural analysis is a major activity of the second 1 2 3 4 5 level management Technology analysis A great deal of effort is expended in attempting to identify 1 2 3 4 5 technological developments The technology analysis is primarily the responsibility of our 1 2 3 4 5 operations people The technology analysis is a major activity of the corporate 1 2 3 4 5 planning department The technology analysis is a major activity of the corporate 1 2 3 4 5 level management The technology analysis is a major activity of the second 1 2 3 4 5 level management
453

Our next question deals with some of the coordination issues involved in planning
185. To what extent do you agree or disagree with each of the following statements? Note; if no corporate planning, answer for planning that exists. Disagree Strongly agree Coordination of planning: The financial planning is closely coordinated 1 2 3 4 5 with corporate planning The operations planning is closely coordinated 1 2 3 4 5 with corporate planning The marketing planning is closely coordinated 1 2 3 4 5 with corporate planning The human resource planning is closely 1 2 3 4 5 coordinated with corporate planning The technology planning is closely coordinated with 1 2 3 4 5 Quality of information Your company gets very high quality information 1 2 3 4 5 from the finance department for corporate planning Your company gets very high quality information 1 2 3 4 5 from the operations department for corporate planning Your company gets very high quality information from 1 2 3 4 5 the marketing department for corporate planning Your company gets very high quality information from 1 2 3 4 5 the human resource department for corporate planning Your company gets very high quality information from 1 2 3 4 5 technology development (R & D) for corporate planning Resistance to planning: Your company gets a great deal of resistance from 1 2 3 4 5 its finance people Your company gets a great deal of resistance from 1 2 3 4 5 its operations people Your company gets a great deal of resistance from 1 2 3 4 5 its marketing people Your company gets a great deal of resistance from 1 2 3 4 5 its human resource people
454

The following questions deal with the roles of various corporate personnel in the planning process.
186. To what extent is the CEO personally involved in the following? Not at all involved Very involved
The development of corporate goals, missions, objectives 1 2 3 4 5 The development of alternative corporate strategies 1 2 3 4 5 The evaluation and approval of the corporate plans 1 2 3 4 5 Having planning as a philosophy in the company 1 2 3 4 5 187. To what extent is the board of directors involved in corporate planning? Not involved Very involved
1 2 3 4 5 188. How supportive is the board of directors regarding corporate planning activities? Not supportive Very supportive
1 2 3 4 5 189. How influential are the following groups in the six corporate planning areas listed? No influence Very great influence Chief executive officer: Format of corporate plan 1 2 3 4 5
Assumptions used in the final corporate plan 1 2 3 4 5
Objectives embodied in the final corporate plan 1 2 3 4 5
Approval of the final corporate plan 1 2 3 4 5
Development of missions for second level units 1 2 3 4 5
Outside members of the board of directors: Format of corporate plan 1 2 3 4 5
Assumptions used in the final corporate plan 1 2 3 4 5
Objectives embodied in the final corporate plan 1 2 3 4 5
Strategies embodied in the final corporate plan 1 2 3 4 5
Approval of the final corporate plan 1 2 3 4 5
Development of missions for second level units 1 2 3 4 5
455

No influence Very great influence Corporate planning department: Format of corporate plan 1 2 3 4 5
Assumptions used in the final corporate plan 1 2 3 4 5
Objectives embodied in the final corporate plan 1 2 3 4 5
Strategies embodied in the final corporate plan 1 2 3 4 5
Approval of the final corporate plan 1 2 3 4 5
Development of missions for second level units 1 2 3 4 5
Top second level line managers: Format of corporate plan 1 2 3 4 5
Assumptions used in the final corporate plan 1 2 3 4 5
Objectives embodied in the final corporate plan 1 2 3 4 5
Strategies embodied in the final corporate plan 1 2 3 4 5
Approval of the final corporate plan 1 2 3 4 5
Development of missions for second level units 1 2 3 4 5
190. Do you currently experience any problems specifically as a result of using the planning system you have described?
Yes No (If no, go to question 192)
If yes could you please specify the major problems you experience?
190.2.1 Lack of participative decision making processes 190.2.2.Lack of strategic thinking at the top level
456

191. Do you expect planning system changes to be made in order to deal with these problems? Yes No
If yes what kind of changes do you expect? 192. In your opinion, what are going to be the major changes in the way your company approaches strategic management in the next five years?
191.2.1 It should be an on-going process 191.2.2 There should be a system to discuss the changes
192.1 Apply participating techniques and methods in planning process 192.2 We expect no changes during the next five years 192.3 Possibility of hiring a private company to consult 192.4 Develop strategic thinking capabilities in all levels of the bank 192.5 Continue the participatory decision making process for strategic planning 192.6 Concern more on cost efficiency within the bank
193. How important do you believe informal planning is with respect to strategic management of your company? Not important Very important
1 2 3 4 5
457

194. How would you rate the effectiveness of the planning process in your company?
Not at all Very effective effective 1 2 3 4 5
195. What contribution does the formal planning process make to the strategic management process in your company? No contribution Major contribution
1 2 3 4 5 196. To what extent do you think that your bank is strategically managed?
Not at all To a great extent 1 2 3 4 5
Now please go to question 219.
458

If no to question 131, please answer the following questions
197. What are your main reasons for not having a formalised strategic planning system? 144. To what extent do you believe your bank is strategically managed? Not at all To a great extent 1 2 3 4 5 198. Could you describe the procedures and process you use for managing your company strategically?
197.1 Low value on strategic planning 197.2 Lack of knowledge on strategic planning techniques 197.3 Strategic planning processes perceived as a cost not as an investment 197.4 None concentration on annual financial objects targets for monitoring and performance
199. Does your company address strategic issues?
On a regular time cycle Ad hoc As required Not at all Others (Please specify) ___________________________
459

If strategic issues are address on a regular time cycle, how often are these strategic issues addressed? (Please select one)
Monthly Quarterly Six monthly Every year More than once a year
200. Who is responsible for addressing these strategic issues? 201. What time horizon does your company use to develop its main strategies? (Please select one)
Less than one year 1 to 3 years 4 to 10years not applicable
202. Could you please specify the main areas where key strategic decisions have been made during the last five years?
200.1 ALCO 200.2 PPC 200.3 Audit policy committee 200.4 Corporate management
202.1 Technology 202.2 Profitability 202.3 Compliance to international and CBSL standards 202.4 Customer service 202.5 Asset management/cost management
460

203. To what extent do you agree or disagree with each of the following descriptions? Disagree Strongly agree Our strategies emerge from the vision of the CEO 1 2 3 4 5 The CEO defines overall targets and boundaries 1 2 3 4 5 within which lower management formulates the strategies Our strategies evolve through a bargaining and negotiation 1 2 3 4 5 process among the different groups in our company The environment dictates our strategies 1 2 3 4 5 Our strategies emerge from an incremental process of 1 2 3 4 5 adapting to external events Our strategies emerge from solving day to day 1 2 3 4 5 problems 204. To what extent do you agree or disagree with the following descriptions of your strategic decision making process? Disagree Strongly agree
It is a continuing process of incremental steps 1 2 3 4 5
It is largely intuitive 1 2 3 4 5
It is based on objective criteria and analysis 1 2 3 4 5
205. How would you describe the strategic decisions in your company? (Please select one)
They are integrated They are disjointed They are loosely coupled
461

206. What effort is expended by your corporate management in each of the following activities? No effort high degree of effort
Develop macro forecast of the external factors 1 2 3 4 5 (e.g. economy, financial market, political and, etc) Prepare specific studies 1 2 3 4 5 Develop improved accounting and financial data for 1 2 3 4 5 strategic decisions Identify areas of new business opportunity 1 2 3 4 5 Reorganize the company around more clearly 1 2 3 4 5 defined business units Improve the quality of strategic thinking in the company 1 2 3 4 5 Formulate goals and objectives 1 2 3 4 5 Formulate missions 1 2 3 4 5 Formulate strategy 1 2 3 4 5 Prepare acquisition plans 1 2 3 4 5 Prepare divestiture plans 1 2 3 4 5 Prepare international expansion plans 1 2 3 4 5 Identify financing needs 1 2 3 4 5 Prepare non-performing loan plans 1 2 3 4 5 Prepare merger plans 1 2 3 4 5 Prepare joint venture plans 1 2 3 4 5 Prepare sources and uses of fund plans 1 2 3 4 5
462

207. How much effort is expended by your second level management in each of the following activities? No effort high degree of effort Develop macro forecast of the external factors 1 2 3 4 5 (e.g. economy, financial market, political etc) Prepare specific studies 1 2 3 4 5 Develop improved accounting and financial data for strategic decisions 1 2 3 4 5 Identify areas of new business opportunity 1 2 3 4 5 Reorganize the company around more clearly defined business units 1 2 3 4 5 Improve the quality of strategic thinking in the company 1 2 3 4 5 Formulate goals and objectives 1 2 3 4 5 Formulate missions 1 2 3 4 5 Formulate strategy 1 2 3 4 5 Prepare acquisition plans 1 2 3 4 5 Prepare divestiture plans 1 2 3 4 5 Prepare international expansion plans 1 2 3 4 5 Identify financing needs 1 2 3 4 5 Prepare non-performing loan plans 1 2 3 4 5 Prepare merger plans 1 2 3 4 5 Prepare joint venture plans 1 2 3 4 5 Prepare sources and uses of fund plans 1 2 3 4 5
463

208. How much effort was made regarding the following forecast areas over the last five years of your company?
No effort High degree of effort Domestic economy 1 2 3 4 5
Foreign economies 1 2 3 4 5
Technological 1 2 3 4 5
Sri Lankan politics 1 2 3 4 5
Laws and regulations for financial services sector 1 2 3 4 5
Government policies 1 2 3 4 5
Social/and or cultural 1 2 3 4 5
Financial markets 1 2 3 4 5
Human resources 1 2 3 4 5
Industry level demand 1 2 3 4 5
Competitive 1 2 3 4 5
Suppliers requirements 1 2 3 4 5
209. Does your company purchase the following forecasts from external sources? Domestic economy Yes No
Foreign economies Yes No
Technological Yes No
Sri Lankan politics Yes No
Laws and regulations for financial services sector Yes No
Government policies Yes No
Social/and or cultural Yes No
Financial markets Yes No
Human resources Yes No
Industry level demand Yes No
Competitive Yes No
Suppliers requirements Yes No
210. Who is responsible for developing or purchasing these forecasts? (Please select one of the following)
Corporate level management Second level management Chief executive officer Outside member of the board of directors Other lower levels management Corporate level management and chief executive officer Others (Please specify) ______________________________________________________
464

211. To what extent do you agree or disagree with the following descriptions? Disagree Strongly agree Competitive analysis: In our company, a great deal of effort is expended 1 2 3 4 5 in attempting to identify competitor’s cost structure Our company focuses its competitive analysis on 1 2 3 4 5 competitive products analysis Competitive analysis is primarily the responsibility of 1 2 3 4 5 our sales and marketing people Competitive analysis is a major activity of the corporate 1 2 3 4 5 management Competitive analysis is a major activity of our second 1 2 3 4 5 level management Supplier analysis: A great deal of effort is expended in attempting to identify 1 2 3 4 5 the sources of funds The supplier analysis is primarily the responsibility of our 1 2 3 4 5 financial people The supplier analysis is a major activity of the corporate 1 2 3 4 5 level management The supplier analysis is a major activity of the second 1 2 3 4 5 level management Customer analysis: A great deal of effort is expended in attempting to identify 1 2 3 4 5 the customer demands The customer analysis is primarily the responsibility of our 1 2 3 4 5 marketing people The customer analysis is a major activity of the corporate 1 2 3 4 5 level management The customer analysis is a major activity of the second 1 2 3 4 5 level management Political analysis A great deal of effort is expended in attempting to identify 1 2 3 4 5 the possible impacts of the government on our business The political analysis is primarily the responsibility of our 1 2 3 4 5 operations people The political analysis is a major activity of the corporate 1 2 3 4 5 level management The political analysis is a major activity of the second 1 2 3 4 5 level management
465

Disagree Strongly agree Economic analysis A great deal of effort is expended in attempting to identify 1 2 3 4 5 the possible impacts of the economy on our business The economic analysis is primarily the responsibility of our 1 2 3 4 5 operations people The economic analysis is a major activity of the corporate 1 2 3 4 5 level management The economic analysis is a major activity of the second 1 2 3 4 5 level management Social and cultural analysis A great deal of effort is expended in attempting to identify 1 2 3 4 5 the possible impacts of the Sri Lankan culture on our business The cultural analysis is primarily the responsibility of our 1 2 3 4 5 human resource people The cultural analysis is a major activity of the corporate 1 2 3 4 5 level management The cultural analysis is a major activity of the second 1 2 3 4 5 level management Technological analysis A great deal of effort is expended in attempting to identify 1 2 3 4 5 technological developments The technology analysis is primarily the responsibility of our 1 2 3 4 5 technical specialists The technology analysis is a major activity of the corporate 1 2 3 4 5 level management The technology analysis is a major activity of the second 1 2 3 4 5 level management 212. To what extent does your company use computer models/systems to support your strategic management efforts?
No use Extensive use 1 2 3 4 5
466

213. Which models/systems are used regularly to support your company strategic management effort? Models Forecasting models Yes No Financial models Yes No Econometric models Yes No Planning models Yes No Simulation models Yes No Others (please specify)___________________ Yes No _____________________________________ Systems
Strategic decision support systems Yes No Group decision support systems Yes No Others (please specify) __________________________ Yes No ______________________________________ 214. How useful have these models/systems in your company been?
Not useful Very useful 1 2 3 4 5
215. Do you currently experience any problems with the strategic management procedures/ processes you described?
Yes No
If yes, could you please specify the major problems?
215.2.1 No strategic management unit 215.2.2 Given no value to external information 215.2.3 Poor knowledge on strategic management 215.2.4 Poor use of IT on decision making
467

216. Do you expect any changes are likely to be made in order to deal with these problems? Yes No
If yes, what kind of changes do you expect? 217. In your opinion, what are going to be the major changes in the way your company approaches strategic management in the next five years?
216.2.1 Form of separate strategic management unit
217.1 Link IT to strategic management process 217.2 Strategic thinking culture to be introduced at all levels of management
468

218. Does your company intend to implement a formalized planning system within the next five years?
Yes No
If yes, what are the reasons for this intention?
218.2.1 Competitiveness 218.2.2 Decline of market share in key businesses 218.2.3 Request made by the owner (the government)
469

In this section we are seeking information about the extended strategic thinking capabilities of your company
219. To what extent do you agree or disagree with the following statements.
Disagree Strongly agree Strategy is made on an iterative basis, involving 1 2 3 4 5 managers staff and executive in an on-going dialogue Business planning in our company is ongoing, 1 2 3 4 5 involving everyone in the process to some degree Most people in this company have input into 1 2 3 4 5 decisions that affect them Our company continually adopts its strategy based 1 2 3 4 5 upon feedback from the market Most people in this organization are willing to 1 2 3 4 5 take risks People are encouraged to experiment in this company 1 2 3 4 5 so as to identify new, more innovative approaches or products Employees in this company understand what needs to be 1 2 3 4 5 accomplished in order for the organization to survive and prosper 220. To what extent do you agree or disagree with the following statements about your company’s value creation process and understanding of the interdependencies within it? Disagree Strongly agree We view our company not as a member of a single industry 1 2 3 4 5 but as part of a business system that crosses a variety of industries We co-evolve capabilities around a new innovation and work 1 2 3 4 5 co-operatively and competitively to support new products Our company think strategically about which of these competing 1 2 3 4 5 networks of suppliers we join and how we position ourselves within this ecosystem Our company knows the importance of fit between corporate, 1 2 3 4 5 business, functional, and the personal level which may be the most critical of all levels Our company also appreciate the inter-relationships among the 1 2 3 4 5 internal pieces that, taken together, comprise the whole Our company clarifies each individual about the effects of their 1 2 3 4 5 behaviour on other parts of the whole system and its final outcome
470

221. To what extent do you agree or disagree with the following statements about your company’s strategic intent? Disagree Strongly agree Our company has a long term corporate dream (intent) about the 1 2 3 4 5 competitive position that our company hopes to build over the coming decade Our company is focusing the organization’s attention on the 1 2 3 4 5 essence of winning the intent Our company is motivating people by communicating the value 1 2 3 4 5 of the intent Our company is leaving room for individual and team contributions 1 2 3 4 5 to achieve the intent Our company is sustaining enthusiasm by providing new 1 2 3 4 5 operational definitions as circumstances change Our company is using intent consistently to guide resource 1 2 3 4 5 Allocations 222. To what extent do you agree or disagree with the following statements about your company’s “thinking in time”? Disagree Strongly agree Strategic thinking, is always “thinking in time” and it connects 1 2 3 4 5 past, present, and future Thinking in time uses an organization’s memory to think 1 2 3 4 5 Well about creating its future Oscillation between the past, present and, future is essential for 1 2 3 4 5 the execution of strategy as well as its formulation Our company believes strategic question is not only “what does the 1 2 3 4 5 future that we want”, but also what must we keep and loose from our past and create in our present to go there 223. To what extent do you agree or disagree with the following statements about your company’s intelligent opportunism? Disagree Strongly agree Our company always leave room for emerging strategies 1 2 3 4 5 in addition to intended strategies Our company always encourage lower level employees to practice 1 2 3 4 5 alternative strategies better suited for changing environments Our employees not rely on top management foresight and 1 2 3 4 5 they are willing to take risk
471

Part 3 Assessment of the Company’s:
• Analytical tools/techniques • Corporate level strategies • Management of quality
472

In this section we are seeking information about the analytical tools and techniques which influence your company strategies.
224. To what extent have the following analytical tools/ techniques influenced your company strategies in the last five years?
No influence Very great Influence
Environment and resource analysis techniques: PEST analysis (political, economic, social, technological) 1 2 3 4 5 Five forces analysis (supplier, buyer, competitor, new entrant, substitute) 1 2 3 4 5 SWOT analysis 1 2 3 4 5 (strengths, weaknesses, opportunities, threats) Driving forces analysis 1 2 3 4 5
Key success factors 1 2 3 4 5
Product life cycle analysis 1 2 3 4 5
Product market fit analyses 1 2 3 4 5
Portfolio and strategy analysis 1 2 3 4 5
ETOP and SAP analysis 1 2 3 4 5
Other analysis techniques (please specify) 1 2 3 4 5
Planning techniques: BCG service portfolio matrix 1 2 3 4 5
General electric matrix 1 2 3 4 5
Service and market portfolio matrix 1 2 3 4 5
Grand strategy technique 1 2 3 4 5
TOWS technique 1 2 3 4 5
7-S framework (7S- Mickinsey excellent factors) 1 2 3 4 5
PIMS (profit impact of market strategy) 1 2 3 4 5
TQM (total quality management) 1 2 3 4 5
Strategy centre concept (A.D. Little) 1 2 3 4 5
Other techniques (Please specify) 1 2 3 4 5
Balance score card
473

225. In your opinion, to what extent will the following analytical tools/ techniques influence your corporate strategies in the next five years?
No influence Very great influence Environment and resource analytical techniques: PEST analysis 1 2 3 4 5 (political, economic, social, technological) Five forces analysis 1 2 3 4 5 (supplier, buyer, competitor, new entrant, substitute) SWOT analysis 1 2 3 4 5 (strengths, weaknesses, opportunities, threats)
Driving forces analysis 1 2 3 4 5
Key success factors 1 2 3 4 5
Product life cycle analysis 1 2 3 4 5
Product market fit analyses 1 2 3 4 5
Portfolio and strategy analysis 1 2 3 4 5
ETOP and SAP analysis 1 2 3 4 5
Other analysis techniques (please specify) 1 2 3 4 5
Planning techniques: BCG service portfolio matrix 1 2 3 4 5
General electric matrix 1 2 3 4 5
Service and market portfolio matrix 1 2 3 4 5
Grand strategy technique 1 2 3 4 5
TOWS technique 1 2 3 4 5
7-S framework (7S- Mickinsey excellent factors) 1 2 3 4 5
PIMS (profit impact of market strategy) 1 2 3 4 5
TQM (total quality management) 1 2 3 4 5
Strategy centre concept (A.D. Little) 1 2 3 4 5
Other techniques (Please specify)___________________ 1 2 3 4 5
__balance score card____________________________________________ 226. To what extent has benchmarking influenced your corporate strategies in the last five years? No influence Very great influence 1 2 3 4 5
474

227. To what extent will benchmarking influence your corporate strategies in the next five years? No influence Very great influence 1 2 3 4 5 228. To what extent does your company benchmark with the following groups?
Not at all Significant benchmarking
Domestic banks in Sri Lanka 1 2 3 4 5
Foreign banks in Sri Lanka 1 2 3 4 5
Sri Lankan government banks 1 2 3 4 5
Domestic finance and security companies in Sri Lanka 1 2 3 4 5
Foreign finance and security companies in Sri Lanka 1 2 3 4 5
Government finance and security companies in Sri Lanka 1 2 3 4 5
Domestic credit foncier companies in Sri Lanka 1 2 3 4 5
Companies outside financial sector in Sri Lanka 1 2 3 4 5
Companies outside financial service sector overseas 1 2 3 4 5
229. Could you please indicate the three major dimensions that you consider as part of your benchmarking process?
229.1 Profitability 229.2 Productivity 229.3 Cost/Income 229.4 Competitiveness 229.5 Market leadership 229.6 Market share 229.7 Type of client 229.8 Service quality 229.9 NPL 229.10 Deposit mobilizations 229.11 Asset quality 229.12 ROE 229.13 Liquidity 229.14 ROA
475

Our Next questions deal with the long-term resource allocation decisions in your company.
230. Does your company make a budgetary distinction between resources required to maintain current activities and those, which will provide long term benefits for the following areas?
No distinction Very clear distinction Capital expenditures 1 2 3 4 5
Research and development expenditures 1 2 3 4 5
Market development expenditures 1 2 3 4 5
People development 1 2 3 4 5
231 . How important are the following criteria in evaluating expenditure proposals, which are expected to yield long-term benefits?
Not important Very important Financial criteria Forecast return on investment 1 2 3 4 5
Forecast net operating profit 1 2 3 4 5
Short-term cash flow benefit 1 2 3 4 5
Discounted cash flow analysis 1 2 3 4 5
Market criteria Present market share position 1 2 3 4 5
Forecast market share growth 1 2 3 4 5
Growth of market for which expenditure is required 1 2 3 4 5
Forecast sales growth 1 2 3 4 5 Personality criteria Track record of unit requesting funds 1 2 3 4 5
Track record of manager of unit requesting funds 1 2 3 4 5
Other criteria Impact on earnings per share 1 2 3 4 5
Impact on company resource needs 1 2 3 4 5
Others (please specify) 1 2 3 4 5
476

The following section deals with your corporate strategy including the formalization of your corporate strategies and the procedures/ processes used for their development.
232. To what extent do you formalise your corporate strategies? Not at all To a great extent
1 2 3 4 5
233. Could you please describe how corporate strategy is developed in your company? (e.g : our corporate strategies formulated by our corporate level management)
233.1 Our corporate strategies formulated by corporate level management 233.2 Through workshops/brainstorming methods to a certain extent 233.3 Corporate strategy developed by a committee consists of corporate management and financial department officers 233.4 Strategy developed by senior managers with the input of second line managers 233.5 Our corporate strategies formulated by the corporate level management (specially the head of the Sri Lankan branch) under the approval of the overseas head office. 233.6 Corporate strategy formulated by the CEO in overseas head office with the consultation of country head in Sri Lanka 233.7 Senior management through participation by various levels 233.8 Our corporate strategies developed by the corporate level management with consultation of second level management 233.9 Corporate strategies formulated by the AGM with consultation of our senior management given limits of overseas head office 233.10 Our corporate strategies are formulated by the country manager and the committee members with the approval of overseas head office 233.11. Corporate strategies are formulated by the corporate level management with the board of directors 233.12 Our corporate strategies are formulated by our corporate level mgmt with the information acquired from the operational and business level managers 233.13 Negotiation process between corporate level mgmt and country head of Sri Lanka and the CEO of the overseas head office 233.14 Negotiation process between the head of the corporate planning and the senior mgmt of the Sri Lankan branch 233.15 Negotiation process between CEO and the corporate level management 233.16 Negotiation process between CEO and all the head of departments
234. To what extent do you agree or disagree with the following statements? Disagree Strongly agree
An explicit part of our corporate strategy is to seek: To enter high growth markets 1 2 3 4 5 To enter markets with small number of competitors 1 2 3 4 5 To enter or develop service business 1 2 3 4 5 Markets where it can attain large shares of served markets 1 2 3 4 5 Markets, which require low capital intensity 1 2 3 4 5 Markets where technology is important 1 2 3 4 5 To exit from markets with large numbers of competitors 1 2 3 4 5 Markets where joint ventures are feasible 1 2 3 4 5 Markets where mergers are feasible 1 2 3 4 5
477

Our next questions deal with your Product/market growth strategies.
235.One way to classify strategies for seeking growth is shown below: New Products Existing (to the
company) Products
a
c
b
d
Existing markets
New markets (to the company)
(1) How important was each of these product/ market combinations in your corporate strategy over the last five years, regardless of whether they were pursued internally or via acquisition?
Not at all important Very important Our company seeks growth through: Existing products in existing markets (a) 1 2 3 4 5 Introducing existing products into new markets (b) 1 2 3 4 5 Introducing new products into existing markets (c) 1 2 3 4 5 Introducing new products into new markets (d) 1 2 3 4 5 (∏) How important do you think each of these will be in your corporate strategy in the next five years? Not at all important Very important Our company seeks growth through: Existing products in existing markets (a) 1 2 3 4 5 Introducing existing products into new markets (b) 1 2 3 4 5 Introducing new products into existing markets (c) 1 2 3 4 5 Introducing new products into new markets (d) 1 2 3 4 5
478

Our next question deals with your company’s strategies concerning new products and service introductions.
236. To what extent do you agree or disagree with the following statements? Disagree Strongly agree Our company attempts to be: First to market with new products and services 1 2 3 4 5 An early follower of initial entrants in fast growing new markets 1 2 3 4 5 A later entrant in established but still growing markets 1 2 3 4 5 An entrant in mature, stable markets 1 2 3 4 5 An entrant in declining markets 1 2 3 4 5 At the cutting edge of technological innovation 1 2 3 4 5
479

Our next question deals with the organizational responsibility for new products and markets
237. To what extent do you agree or disagree with the following statements? Disagree Strongly agree New product development is: Part of the responsibility of our second level 1 2 3 4 5 operating units The responsibility of a special organizational unit 1 2 3 4 5 Screening of new product ideas is: Part of the responsibility of our second level 1 2 3 4 5 operating units The responsibility of a special organizational unit 1 2 3 4 5 Development of new markets for existing products is: Part of the responsibility of our second level operating units 1 2 3 4 5 The responsibility of a special organizational unit 1 2 3 4 5 Screening of new market ideas is: part of the responsibility of our second level 1 2 3 4 5 operating units the responsibility of a special organizational unit 1 2 3 4 5
480

Our next questions deal with the your company’s research and development (R & D) strategies. (If you do not have any research and development strategies pls. go to question 243)
238. To what extent do you agree or disagree with the following descriptions for the research and development strategies of your company? Disagree Strongly agree Our company considers itself to be 1 2 3 4 5 highly technology innovative Our company considers itself to be 1 2 3 4 5 highly service innovative The emphasis of our R& D expenditures is 1 2 3 4 5 highly applied Our R & D effort tends to avoid high risk activity 1 2 3 4 5 Our company prefers to seek growth via 1 2 3 4 5 acquisitions rather than internal R & D Others (please specify) _________________________ 1 2 3 4 5 ____________________________________________
239. When did you commence the R & D activity in your company? Year: ___________________ Is your company’s R & D activities supported by?
Internal staff External groups or companies Both the external and internal researchers
240. What percentage of your corporate revenue has been allocated to R & D activities over the last five years? Approximate percentage: ________________________ % 241. Of your corporate revenue which has been allocated to R & D activities, what was the split between R & D for the development of new products and services, and R & D for the development of new processes? New products and services Approximate percentage: _____________________ % New processes Approximate percentage: ____________________ % Total 100%
481

242 . What approximate percentage of your R & D budget was expended on the development of new information technology? Approximate percentage: ____________________ %
482

Our next questions deal with your company’s international strategies. (If your company is a foreign company, please go to question 252)
243. Do you have any international operations?
Yes No
If no, are you considering any international operations within the next five years? Yes No
If you don’t have any international operations, Please go to question 252 244. What percentage of your revenues takes place outside Sri Lanka? Approximate percentage: ______________________ Of your overseas revenue, what is the percentage of overseas revenue by the three major business types? Business type Percentage 1. _Trade service_______________ ___70_______ 2. _Nrfc______________________ ___20_______ 3. _Travel_____________________ ___10_______ 4. ___banking, treasury, imports, exports, Personal finance, Corporate banking, global markets 245. What percentage of your revenues do you expect to take place outside Sri Lanka in next 5 years? Approximate percentage: ___________________% 246. When did you first start international operations? Year: _________________ 247. Which countries are currently your three most important overseas markets? 1. __Japan________________________ 2. __Middle east region________________________ 3. ___UK______________________
483

248. What are the main reasons for these choices?
248.1 Established business and transactions 248.2 Attractive rate of returns 248.3 Larges economies in the globe 248.4 Growing economies
249. Which countries do you expect to be the three most important overseas markets in next five years? 1._______________________________________ 2._______________________________________ 3._______________________________________ 250. Which description best describe your companies organization for international operations? (Please select one of the following)
International business department National subsidiary CEO’s report to company CEO Worldwide functional heads report to company CEO International division head reports to company CEO Geographic region heads report to company CEO Worldwide product division heads report to company CEO International operations report to line management (not CEO) Others (please specify) _______________________________
484

251. To what extent do you agree or disagree with the following statements about your company’s international strategies? Disagree Strongly agree Global orientation: Our corporate planning is conducted on a 1 2 3 4 5 worldwide basis n.a Our second level planning is conducted 1 2 3 4 5 on a worldwide basis n.a Our procurement strategies are developed 1 2 3 4 5 on a worldwide basis Our investment strategies are developed 1 2 3 4 5 On a worldwide basis Our marketing strategies are developed on 1 2 3 4 5 a worldwide basis International strategies: We introduce new products in overseas 1 2 3 4 5 markets after we have done so in Sri Lanka We seek foreign markets in which we can 1 2 3 4 5 market existing products and technologies We develop new products and technologies 1 2 3 4 5 especially for overseas markets We actively seek joint ventures in 1 2 3 4 5 overseas operations We actively seek mergers in 1 2 3 4 5 overseas operations
485

Our next questions deal with your company’s acquisition strategies.
252. Has your company made any significant acquisitions in the last five years?
Yes No
If no, please go to question 257 253. How many individual significant acquisitions has your company made in the last five years? Number in Sri Lanka _____________________ Number overseas _____________________ 254. Of those acquisitions, what percentages of their revenue when acquired were from products in the following categories? Revenue from products in introductory stage _______________________________ % Revenue from products from growth stage _______________________________ % Revenue from products in maturity stage _______________________________ % Revenue from products in decline stage _______________________________ % Total 100 % 255. What sales revenue would you attribute to those acquisitions in the present year? Sri Lankan rupees 256. To what extent do you agree or disagree with the following descriptions of your acquisition strategies? Disagree Strongly agree Our company intends to extend its core 1 2 3 4 5 business activities Our company intends to develop a new 1 2 3 4 5 configuration of business lines Our company intends to expand into 1 2 3 4 5 new markets with our existing businesses Our company intends to expand into new markets 1 2 3 4 5 with a new configuration of business lines Others (please specify) 1 2 3 4 5 257. Do you expect acquisitions to play a role in your corporate strategy over the next five years?
No role Significant role 1 2 3 4 5
486

The following questions deal with your company’s divestiture strategies
258. Has your company divested, liquidated or eliminated any important operation in the last five years?
Yes No
If no please go to question 263 259. How many individual significant divestitures has your company made in the last 5 years? Number in Sri Lanka __________________ Number overseas __________________ 260. Of those divestitures, what percentage of their revenue when divested were products in the following categories? Revenue from products in introductory stage ______________________ % Revenue from products in growth stage ______________________ % Revenue from products in maturity stage ______________________ % Revenue from products in decline stage ______________________ %
Total 100%
261. If you retained those units, what would you expect their 2006 sales revenue to have been? ________________________ Sri Lankan Rupees 262. To what extent do you agree or disagree with the following statements about your company’s divestiture strategies?
Disagree Strongly agree Our company intends to: Refocus the business portfolio on its core businesses 1 2 3 4 5
Dispose/ retrench unprofitable lines of business 1 2 3 4 5
Eliminate production inefficiency 1 2 3 4 5
Eliminate business peripheral to our firm’s strategy 1 2 3 4 5
Withdraw from geographic area 1 2 3 4 5
Meet corporate liquidity requirements 1 2 3 4 5
Finance new acquisitions 1 2 3 4 5
Raise money quickly 1 2 3 4 5
Act against declining profits as a result of economic 1 2 3 4 5 recession Others (please specify) 1 2 3 4 5
487

263.Do you expect divestitures to play a role in your corporate strategy in the next five years? No role Significant role 1 2 3 4 5
488

Our next questions deal with merger strategies in your company.
264. Has your company merged with another company in the last five years? Yes No (If no please go to question 267)
265. How many significant individual mergers has your company made in the last five years? Number in Sri Lanka ______________________ Number in Overseas _______________________ 266. To what extent do you agree or disagree with the following statements about your company’s merger strategies? Disagree Strongly agree Our company intends to: Extend its core business activities 1 2 3 4 5
Develop a new configuration of business lines 1 2 3 4 5
Expand into new markets with our existing businesses 1 2 3 4 5
Expand into new markets with a new configuration of 1 2 3 4 5 business lines Meet the minimum capital requirement policy of the 1 2 3 4 5 Sri Lankan government
Solve the non-performing loans problem 1 2 3 4 5
Others (please specify) ____________________________ 1 2 3 4 5 267. Do you expect mergers to play a role in your corporate strategy in the next five years? No role Significant role 1 2 3 4 5
489

Our next questions deal with turnaround strategies
268. Has your company made any significant turnarounds in the last five years? Yes No (If no, please go to question 270)
269. To what extent do you agree or disagree with the following statements about turnaround strategies in your company? Disagree Strongly agree Our company intends to: Pursue merger strategies instead of acquisition 1 2 3 4 5 strategies Pursue joint venture strategies instead of acquisition 1 2 3 4 5 strategies Restore money-losing business to profitability 1 2 3 4 5 rather than divest Others (please specify) _Strengthen management___ 1 2 3 4 5 And culture Merger and acquisition Be careful in lending 270. Do you expect turnaround to play a role in your corporate strategy in the next five years? No role Significant role 1 2 3 4 5
490

Our next questions deal with the quality management of your company
271. In a strategic sense, how important has the management of quality been in your company over the last five years? Not important Very important 1 2 3 4 5 272. How important do you believe the management of quality will be in the next five years? Not important Very important 1 2 3 4 5 273. To what extent is the management of quality currently addressed as a strategic issue in your company? Not al all To a great extent 1 2 3 4 5 274. Could you please describe the strategic approach towards quality in your company?
274.1 Awareness building and training to change the 274.2 incentives/ rewards for quality services 274.3 Re-engineering programmes 274.4 Technological upgrading programmes 274.5 Customer care 274.6 Physical importance of work places 274.7 Operational level staff is trained in quality and monitored 274.8 A complementary step is successfully being ISO certified in trade and central processing operations 274.9 Staff training for every level of the organization 274.10 Brain storming 274.11 Customer survey 274.12 Improve product efficiency while retaining only in the essential services 274.13 Strict adhering to the guide lines 274.14 Practical involvements
491

275. Which level is responsible for addressing the major strategic quality issues? (You may select more than one)
Corporate level management Chief executive officer Outside members of the board of directors Second level line managers Specialist unit at second level Corporate planning department Other lower levels of management Other (please specify)__AGM____________________________________
276. To what extent are the employees in your company involved in the quality approach? Not involved Very involved 1 2 3 4 5 277. Do the employees have responsibility for the quality of their products?
Yes No
278. To what extent do you agree or disagree with the following statements? Disagree Strongly agree Importance of total quality management: The management of quality is a major philosophy 1 2 3 4 5 that pervades the whole organization Continuous quality improvement is a major factor in the 1 2 3 4 5 strategic management of our company Quality is the responsibility of everyone in the organization 1 2 3 4 5 The quality of customer service is a key issue 1 2 3 4 5 Top management involvement: The CEO seeks to establish the total quality management 1 2 3 4 5 philosophy within the company The senior management commits the resources for 1 2 3 4 5 continuous quality improvements The senior management provides the leadership for 1 2 3 4 5 continuous quality improvements Employee involvement: The company has special rewards and incentives for 1 2 3 4 5 employees who make contributions to quality improvements The company training of employees in quality issues 1 2 3 4 5 plays an important role
492

Disagree Strongly agree Quality assessment: Our company regularly assesses the quality 1 2 3 4 5 of its tangible products Our company regularly assesses the quality of its 1 2 3 4 5 services production processes Our company regularly assess the quality of its 1 2 3 4 5 intangible products Customer relationship: Our company continually tries to improve 1 2 3 4 5 the relationship with its customers Our company regularly measures customer satisfaction 1 2 3 4 5 Our company determines future customer requirements 1 2 3 4 5 and expectations on a regular basis 279. Is your company currently facing any problems with its quality management approach?
Yes No
If yes, please specify your three major problems
279.1 Does not suit the local market
280. Did your company win any awards involving quality management? Yes No
If yes, please specify_____________________________________ ______________________________________________________ ______________________________________________________ __________________________
493

Thank you for your participation and valuable cooperation in completing this survey. We will send you copies of all papers developed from this study and at the end of the study you will receive a final paper on the major research findings.
Copyright by Professor Chris Cristodoulou and E.M.H.B.Edirisinghe, 2005.
All rights reserved.
494

APPENDIX 2
Introductory letter and letter of consent
495

Strictly private And confidential
Mr. ≥Position≤ ≤Name of Company≥ ≥Address of the Company≤ Dear Mr. We are conducting a research project titled “strategic management practices of Sri Lankan commercial banks”. The fieldwork will be done by Mr. E.M.H.B.Edirisinghe, a full time doctoral research student of the School devoted to this project, under the supervision of Professor Chris Christodoulou of the Australian Graduate School of Entrepreneurship. For this research, the survey will be based upon the research questions developed in the Christodoulou (1984) and Nut-tapon (2002) studies. The survey has been adapted to recognize the unique aspects of the Sri Lankan banking industry and the culture of Sri Lanka. A comprehensive investigation into the strategic management practices of the Sri Lankan banking industry has not been previously undertaken, and therefore we believe, ours will be a pioneering endeavour of great importance. The survey will be conducted by personal interviews and all the commercial banks in Sri Lanka will be invited to participate in this study. In terms of this research, it will be requested that the respondent should be a senior executive responsible for corporate planning for the bank. On completion of the study, we will provide the participating companies with a report of the most important research findings. The information gathered through the interviews will be treated as confidential. The information that is provided will be coded to ensure that no unauthorised person can gain access to identify, or interpret the data in respect of any particular organization. The identity of the participants will also be shrouded in the results that are published, so that it will not be possible to decipher individual company data. Only aggregated data will be used for publication purposes. We look forward to your support and participation in this research study and we would appreciate if you could pass on the name and phone number of an appropriate person whom we could contact to arrange an interview, which is expected to take approximately two to three hours. We need your written consent to participate and we would appreciate your signing the attached consent form and returning it to me before the interview. Mr E.M.H.B.Edirisinghe will be in Sri Lanka for three months to undertake this research. He will arrive on the 15th February 2006 and his contact particulars are given below. Telephone number: 0777309702 E-mail address: [email protected] Postal address: 19/513, Buddhagaya Mawatha, Anuradhapura
496

If you have any concerns please contact either myself or Mr.E.M.H.B.Edirisinghe. Should there be any unresolved concerns with the conduct of this survey your complaints can be directed to: The Chair Human Research Ethics Committee Swinburne University of Technology PO Box 218, Hawthorn, Victoria 3122, Australia Phone:+(613)92145223 We look forward to your support and participation in this study. Thank you. Professor Chris Christodoulou Australian Graduate School of Entrepreneurship Swinburne University of Technology PO Box 218 Hawthorn, Victoria 3122, Australia. Phone: + (613) 92145863 Email: [email protected]
497

Letter of consent I _____________________________________________________have read and understood the information provided to me about this research project titled “Strategic management practices of Sri Lankan commercial banks”. Any questions I have asked have been answered to my satisfaction. I agreed to participate in this activity, realising that I may withdraw at any time. I agree that the research data collected for the study may be published or provided to other researchers on the condition that anonymity is preserved and that I cannot be identified. I also grant permission to the researcher to enter into the bank premises as necessary for the purpose of conducting a personal interview. Name of Bank: _____________________________________________ Name of participant: _________________________________________ Signature: ________________________________________________ Date: _____________________________________________________
498


