Embed Size (px)
Citation preview
Downloade
Stimulus uncertainty and insensitivity to pitch-change directionSamuel R. Mathiasa�
Department of Psychology, University of York, York YO10 5DD, United Kingdom
Christophe MicheylDepartment of Psychology, University of Minnesota, Twin Cities Campus, Minneapolis, Minnesota 55455
Peter J. BaileyDepartment of Psychology, University of York, York YO10 5DD, United Kingdom
�Received 15 September 2009; revised 16 February 2010; accepted 18 February 2010�
In a series of experiments, Semal and Demany ��2006�. J. Acoust. Soc. Am. 120, 3907–3915�demonstrated that some normally hearing listeners are unable to determine the direction of small butdetectable differences in frequency between pure tones. Unlike studies demonstrating similar effectsin patients with brain damage, the authors used stimuli in which the standard frequency of the toneswas highly uncertain �roved� over trials. In Experiment 1, listeners were identified as insensitive tothe direction of pitch changes using stimuli with frequency roving. When listeners were retestedusing stimuli without roving in Experiment 2, impairments in pitch-direction identification weregenerally much less profound. In Experiment 3, frequency-roving range had a systematic effect onlisteners’ thresholds, and impairments in pitch-direction identification tended to occur only when theroving range was widest. In Experiment 4, the influence of frequency roving was similar forcontinuous frequency changes as for discrete changes. Possible explanations for the influence ofroving on listeners’ insensitivity to pitch-change direction are discussed.© 2010 Acoustical Society of America. �DOI: 10.1121/1.3365252�
PACS number�s�: 43.66.Fe, 43.66.Hg �BCM� Pages: 3026–3037
I. INTRODUCTION
In the classic experiments measuring difference limensfor frequency �DLFs; e.g., Harris, 1952a, 1952b , Moore,1973, 1974, Nordmark, 1968, and Wier et al. 1977�, listenerswere presented with two successive pure tones on each trial.These tones differed slightly in frequency, and listeners indi-cated which tone had the higher frequency, or whether thesecond tone was higher or lower than the first. It is reason-able to assume that successful performance in these kinds ofexperiments is achieved through the percept of a differencein pitch, usually defined as “that attribute of auditory sensa-tion in terms of which sounds may be ordered on a scaleextending from low to high” �ANSI, 1994�.
The DLFs measured in these experiments can be re-markably small. For instance, in Moore’s �1974� study, themean DLF across three listeners for 200-ms tones at a testfrequency of 1000 Hz was 1.8 Hz—a frequency difference ofless than 0.2%. Clearly these experiments require listeners tobe—and indeed demonstrate that they often are—sensitive tothe direction or sign of very small frequency changes. How-ever, three more recent studies have suggested that in certaincircumstances some listeners can detect the presence of asmall frequency difference, but are unable to identify thedirection of the resulting percept �Johnsrude et al., 2000;Tramo et al., 2002; Semal and Demany, 2006�.
Two of the studies cited above involved listeners withcortical lesions. Johnsrude et al. �2000� tested patients with
a�Author to whom correspondence should be addressed. Electronic mail:
[email protected]3026 J. Acoust. Soc. Am. 127 �5�, May 2010 0001-4966/2010/12
d 12 Jun 2010 to 128.101.98.21. Redistribution subject to ASA license
unilateral temporal lobe excisions and healthy controls usingtwo frequency discrimination tasks: a two-interval, two-alternative forced-choice �2I-2AFC� task similar to thoseused in classic studies of frequency discrimination, and asame-different �SD� task in which the second tone wasequiprobably identical to or higher in frequency than the firsttone. For the 2I-2AFC task, which required listeners to besensitive to the direction of frequency changes, they foundthat a group of patients with right-hemisphere lesions thatencroached Heschl’s gyrus had much larger DLFs than theother groups of patients and controls. In contrast, the DLFsmeasured using the SD task, which did not require listenersto be sensitive to frequency change direction, were not el-evated for any patient group compared to controls. Similarly,Tramo et al. �2002� reported that a single patient with lesionsincluding bilateral Heschl’s gyri had much larger DLFs in a2I-2AFC task than in an SD task. These findings have beeninterpreted as indicating that successfully identifying the di-rection of frequency changes recruits cortical networks thatare not necessary for simply detecting frequency differences�Foxton et al., 2009�.
Semal and Demany �2006� used a dual-pair paradigm tomeasure DLFs for frequency-change detection andfrequency-direction identification for the same listeners un-der directly comparable stimulus conditions. In their mainexperiment, listeners heard two pairs of pure tones on eachtrial. In one pair the tones were identical, and in the otherpair the tones differed in frequency. In the “detection” task,listeners indicated which pair �first or second� contained thechange in frequency. In the “identification” task, listeners
indicated the direction �up or down� of the change. For three© 2010 Acoustical Society of America7�5�/3026/12/$25.00
or copyright; see http://asadl.org/journals/doc/ASALIB-home/info/terms.jsp
Downloade
of their listeners, identification DLF �IDLF� was consider-ably larger than detection DLF �DDLF�. Follow-up experi-ments showed that the discrepancy between detection andidentification abilities observed for frequency in these listen-ers did not generalize to other sound dimensions �level or therate of amplitude modulation�, and remained even after ex-tensive practice in both tasks.
What makes Semal and Demany’s �2006� findings par-ticularly intriguing is that their listeners, unlike those in thestudies of Johnsrude et al. �2000� and Tramo et al. �2002�,appeared to be audiologically and neurologically normal.The elevation in IDLFs—though similar in magnitude to thatobserved by Johnsrude et al.—was not symptomatic of anyobvious real-world hearing problems, such as congenitalamusia �Peretz et al., 2003�. An important difference be-tween Semal and Demany’s study and those involving clini-cal patients is that the former employed frequencyroving—on each trial, the frequencies of the first tones ineach pair were randomly varied over a wide range �400–2400 Hz�. This raises the question of whether the specificdeficit observed for some of Semal and Demany’s listenerswould also occur under conditions in which the stimuli arenot roved in frequency over a wide range.
A number of previous studies have demonstrated thatfrequency roving is deleterious to normally hearing listeners’sensitivity to frequency differences �Amitay et al., 2005; De-many and Semal, 2005; Harris, 1952a; Jesteadt and Bilger,1974�. For instance, Jesteadt and Bilger measured discrim-inability �d�� for frequency differences between pure tonesusing a 2I-2AFC task and several variants of the SD task forfour listeners. The standard frequency of the tones within arun of trials was either fixed, “jittered” �varied randomlyover a 40-Hz range�, or roved �varied randomly over a465-Hz range�. For their listeners—who had no apparent dif-ficulty in identifying frequency-change direction1—rovingresulted in smaller d� than for the fixed and jittered condi-tions.
Amitay et al. �2005� measured DLFs using a 2I-2AFCtask for three groups of listeners. The groups differed in thetraining they received: the first was trained using stimuli inwhich the standard frequency was fixed; the second withstimuli roved over a 200-Hz range; and the third with stimuliroved over a 1580-Hz range. Large individual differences inDLFs were found initially within all three groups. For thefixed-stimuli group, the individual differences were consid-erably reduced by training. In contrast, the individual differ-ences within the roving-stimuli groups remained pronouncedafter extensive training, and both groups had larger DLFs onaverage than the fixed-stimuli group2. These results suggestthat frequency roving increases DLFs overall, but to differentextents for different listeners. Since Amitay et al. only mea-sured DLFs using a 2I-2AFC task, and DLFs with and with-out roving were not measured for the same listeners, it is notknown if the influence of roving on DLFs is greater in indi-viduals who have difficulty identifying the direction of fre-quency changes.
Here we report four experiments which aimed to inves-tigate if the difficulty in identifying the direction of fre-
quency changes between pure tones observed in some listen-J. Acoust. Soc. Am., Vol. 127, No. 5, May 2010 Mat
d 12 Jun 2010 to 128.101.98.21. Redistribution subject to ASA license
ers is influenced by stimulus roving. We follow Semal andDemany �2006� in assuming that the primary cue listenersused in these experiments was pitch, and therefore that, al-though cues other than pitch may have sometimes beenavailable, it is appropriate to refer to them as pitch discrimi-nations �other possible cues on which the discriminationscould have been based are considered later�. Experiment 1was primarily a replication of Semal and Demany’s �2006�main experiment. As in that study, DDLFs and IDLFs weremeasured using a dual-pair paradigm with frequency rovedboth between and within trials. In Experiment 2, most of thesame individuals were retested in a similar procedure with-out frequency roving. In Experiment 3, frequency-rovingrange was manipulated systematically, and additional condi-tions including level roving but no frequency roving wereadded. Finally, in Experiment 4 listeners were tested usingcontinuous frequency-modulated tones rather than discretetone pairs, both with and without carrier-frequency roving.
II. EXPERIMENTS 1 AND 2
A. Methods
1. Listeners
Sixteen listeners �13 females; 12 right-handed; age range18–26 years� took part in Experiment 1, of whom 13 alsotook part in Experiment 2 �11 females; 10 right-handed; agerange 18–24 years�. In what follows, individual listeners areidentified by number �L1, L2, etc�. L1 was author SRM, andonly L1–3 had considerable prior experience in psychoa-coustical experiments involving frequency and/or pitch dis-crimination.
L4–16, who were paid for their participation, were un-dergraduates selected using a short pre-test experiment simi-lar to that used by Semal and Demany �2006�. For the pretesta total of 355 undergraduates were presented with 60 dual-pair trials �30 detection, 30 identification� with various mag-nitudes of frequency change, via the loudspeaker system in alarge lecture room. For each participant, the proportion ofcorrect trials �PC� was calculated from pen-and-paper re-sponses. Listeners for the main experiment were chosen fromthe 61 individuals �17.2%� whose PC for identification trialswas lower than their PC for detection trials, and for whomthis difference exceeded one standard deviation of the meandifference across the whole group. L1–3 took part in a web-based version of the pre-test and their results did not indicatea difficulty with pitch-direction identification. Listeners var-ied in their musical experience, but none was a professionalmusician or performed music regularly.
Hearing levels were measured for frequencies between250 and 4000 Hz in octave steps using pure tone audiometry.For all listeners except three, hearing levels did not exceed20 dB hearing level �HL� at any frequency. For L4, hearinglevel was 25 dB HL for 250 and 500 Hz in the right ear, and30 dB HL for 250 and 500 Hz in the left ear. For L12 andL16, hearing levels were 25 dB HL for 250 and 500 Hz intheir right ears3. For all listeners, worst-ear averages over all
frequencies were �20 dB HL.hias et al.: Stimulus uncertainty and frequency discrimination 3027
or copyright; see http://asadl.org/journals/doc/ASALIB-home/info/terms.jsp
Downloade
2. Stimuli
All tones were 250-ms sinusoids presented at 60 dBsound pressure level �SPL� with random starting phases and20-ms cosine-squared on/off ramps. Stimuli were generateddigitally and delivered diotically through headphones�Sennheiser HD580� using a 24-bit digital-to-analog con-verter �LynxONE� at a sampling rate of 22500 Hz.
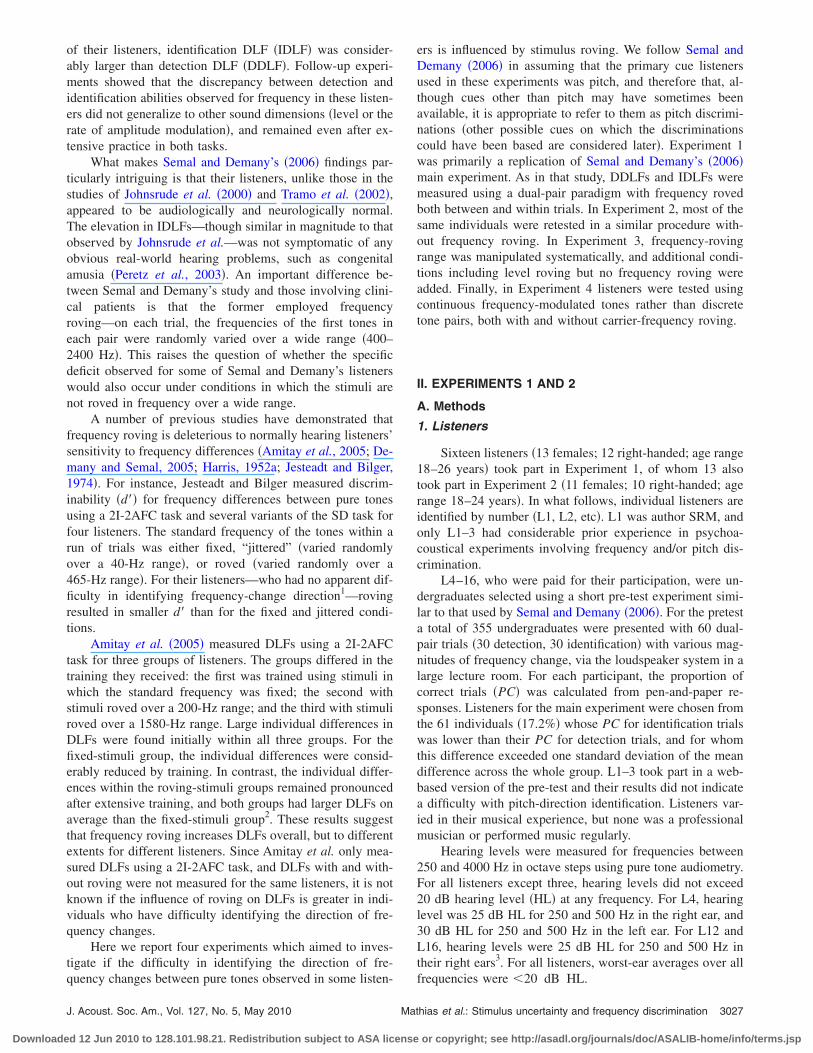
In both experiments, the stimuli were four successivetones arranged temporally into two pairs, with a 700-ms si-lent interval �ISI� between pairs, and a 250-ms ISI betweenthe tones in each pair �illustrated in Fig. 1�. In one of thepairs, selected randomly, the second tone was equiprobablyhigher or lower in frequency than the preceding tone by anamount ��F� expressed in musical cents �1 cent equals1/100th of a semitone or 1/1200th of an octave�. In the otherpair, the two tones were identical. In Experiment 1, the fre-quencies of the first tones in each pair were independentlydrawn from a rectangular distribution defined on a log-frequency �cents� scale with limits of 0 and 3102 cents above400 Hz �400 and 2400.1 Hz�. In Experiment 2 there was nofrequency rove; the first tone in each pair always had thesame frequency, 979.8 Hz �1551 cents above 400 Hz�, whichcorresponds to the center of the roving range in Experiment1.
3. Procedure
Prior to testing, hearing levels were measured and eachlistener completed two questionnaires: the Speech, Spatialand Qualities of Hearing Scale questionnaire �SSQ; Gate-house and Noble, 2004�4 and a questionnaire about their mu-sical experience and expertise. Following these assessments,listeners took part in Experiment 1. DLFs were measuredusing two tasks in separate runs of trials: in the detectiontask, listeners indicated which tone pair contained the fre-quency change �first or second�; and in the identificationtask, listeners indicated the direction of the change �up ordown� that occurred in the pair containing different tones,without specifying which pair this was. Listeners first com-pleted a few trials in each condition to familiarize themselveswith the stimuli and procedure. Testing was carried out indi-vidually in a sound-attenuating booth �IAC� in three sessionslasting approximately 1 h each, on different days. Responseswere made using a keyboard, and were followed by visualfeedback and a 600-ms pause before the start of the next
freq
uenc
y(lo
gscale)
time
∆F
freq
uenc
y(lo
gscale)
time
∆F
Experiment 1
random frequency
fixed frequency
Experiment 2
FIG. 1. Illustrations of example trials in Experiments 1 �left-hand panel� and2 �right-hand panel�. Solid lines represent pure tones. In both cases thecorrect response would be “second” �for detection� or ‘‘up’’ �for identifica-tion�.
trial.
3028 J. Acoust. Soc. Am., Vol. 127, No. 5, May 2010
d 12 Jun 2010 to 128.101.98.21. Redistribution subject to ASA license
The magnitude of �F in a run of trials was set initiallyto 100 cents, and was manipulated within the run using aweighted one-up one-down adaptive procedure that estimatesDLFs corresponding to 75% correct on the psychometricfunction �Kaernbach, 1991�. Up to the fifth reversal in thedirection of the staircase, �F was decreased by a factor of�3 2.25 following a correct response and increased by a factorof 2.25 following an incorrect response. At the fifth reversalonwards, down and up step sizes were �3 1.5 and 1.5, respec-tively. In each run, �F was limited to a maximum of 600cents. A run ended after the 14th reversal. DLF for a run wasdefined as the geometric mean of all �F values used fromthe fifth reversal onward.
During testing, instructions for the current task were pre-sented on the computer screen, together with the current trialnumber and current �F. The task alternated from one run tothe next, with the order of task presentation counterbalancedacross listeners. Twenty DLFs were measured for each taskand for each listener.
Thirteen of the 16 listeners who had taken part in Ex-periment 1 subsequently took part in Experiment 2. The pro-cedure for this experiment was similar to that for Experiment1, except that 15 DLFs were measured for each task and foreach listener, using the non-roved stimuli described above.Testing for this experiment was carried out in two 1-h ses-sions on different days.
B. Results
1. Experiment 1: Wide frequency roving
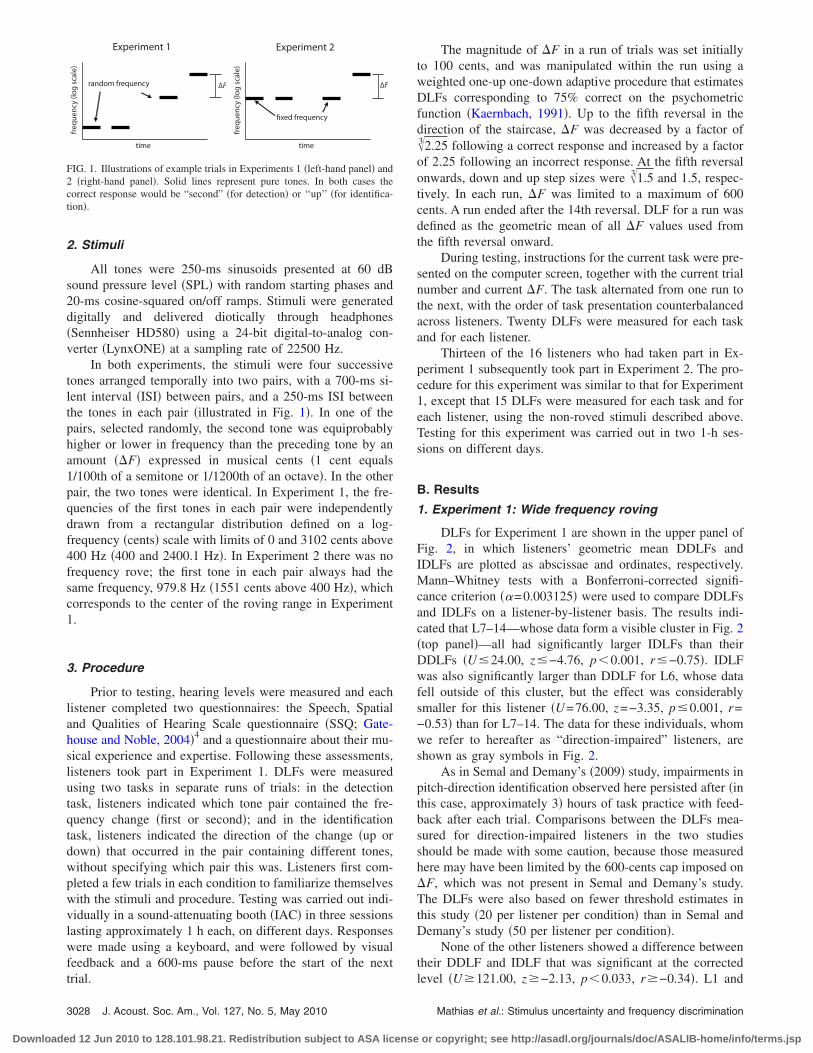
DLFs for Experiment 1 are shown in the upper panel ofFig. 2, in which listeners’ geometric mean DDLFs andIDLFs are plotted as abscissae and ordinates, respectively.Mann–Whitney tests with a Bonferroni-corrected signifi-cance criterion ��=0.003125� were used to compare DDLFsand IDLFs on a listener-by-listener basis. The results indi-cated that L7–14—whose data form a visible cluster in Fig. 2�top panel�—all had significantly larger IDLFs than theirDDLFs �U�24.00, z�−4.76, p�0.001, r�−0.75�. IDLFwas also significantly larger than DDLF for L6, whose datafell outside of this cluster, but the effect was considerablysmaller for this listener �U=76.00, z=−3.35, p�0.001, r=−0.53� than for L7–14. The data for these individuals, whomwe refer to hereafter as “direction-impaired” listeners, areshown as gray symbols in Fig. 2.
As in Semal and Demany’s �2009� study, impairments inpitch-direction identification observed here persisted after �inthis case, approximately 3� hours of task practice with feed-back after each trial. Comparisons between the DLFs mea-sured for direction-impaired listeners in the two studiesshould be made with some caution, because those measuredhere may have been limited by the 600-cents cap imposed on�F, which was not present in Semal and Demany’s study.The DLFs were also based on fewer threshold estimates inthis study �20 per listener per condition� than in Semal andDemany’s study �50 per listener per condition�.
None of the other listeners showed a difference betweentheir DDLF and IDLF that was significant at the corrected
level �U�121.00, z�−2.13, p�0.033, r�−0.34�. L1 andMathias et al.: Stimulus uncertainty and frequency discrimination
or copyright; see http://asadl.org/journals/doc/ASALIB-home/info/terms.jsp
Downloade
L2, who achieved the smallest DLFs overall, had IDLFs thatwere approximately 5 to 6 cents smaller than their DDLFs.Though counterintuitive, smaller IDLFs than DDLFs werealso observed for some listeners by Semal and Demany�2006�, and this pattern of performance is broadly consistentwith the predictions of a model they propose in which bothdetection and identification tasks are limited solely by thesame internal noise �this point is revisited in the general dis-cussion�. For L3–5, IDLFs were slightly larger than theirDDLFs. This pattern of performance was also seen by Semaland Demany, and overall DLFs for L1–5 are reasonablysimilar to those of their counterparts in that study.
Two listeners in Experiment 1 did not fit neatly into anyof the groups identified by Semal and Demany �2006�. L15and L16 had very large DDLFs �143 and 253 cents respec-tively�, yet relatively their IDLFs were not elevated signifi-cantly. This combination of large IDLF and large DDLF inthe same individual was not observed for the smaller sampleof listeners tested by Semal and Demany. L15 exhibited abias for better performance on both tasks when the frequencydifference was in the second pair, responding correctly on
IDLF
(cen
ts)
2.5
5
10
20
50
100
200
500600
L1
L2
L3
L4
L5
L6
L7
L8
L9
L10
L11
L12
L13
L14L15
L16
DDLF (cents)
5 10 20 50 100 200 5002.5
5
10
20
50
100
200
500
Experiment 1:Test tones roved in frequency
Experiment 2:Test tones fixed in frequency
FIG. 2. Results of Experiments 1 �upper panel� and 2 �lower panel�. Eachlistener is represented by a unique symbol and number. Listeners repre-sented by gray symbols are those deemed to be direction-impaired listenersin Experiment 1 �see text�. The abscissa and ordinate of each symbol rep-resents that listener’s geometric mean DDLF and IDLF, respectively, witherror bars representing geometric 95% confidence intervals, on logarithmicaxes. Error bars are smaller than the symbol if not shown. The upper diag-onal line in each panel represents the locus of equivalent performance. Thelower diagonal line represents the locus of performance predicted by amodel, discussed by Semal and Demany �2006�, in which IDLFs andDDLFs are limited only by the same internal noise �see also Micheyl et al.,2008�.
only 62% of first-pair trials compared to 85% of second-pair
J. Acoust. Soc. Am., Vol. 127, No. 5, May 2010 Mat
d 12 Jun 2010 to 128.101.98.21. Redistribution subject to ASA license
trials. Contrastingly, L16 was not able to perform either taskat the accuracy targeted by the adaptive procedure �75% cor-rect�, with an overall accuracy of 63% correct across all tri-als. The DLFs measured for this listener are therefore likelyto be underestimates of her true thresholds for frequencydiscrimination.
2. Experiment 2: No frequency roving
DLFs for Experiment 2 are shown in the lower panel ofFig. 2. Overall, DLFs were smaller than those measured inExperiment 1. Bonferroni-corrected Mann–Whitney tests��=0.003846� were used to compare listeners’ DDLFs andIDLFs in Experiment 2. Four listeners had significantlylarger IDLFs than their DDLFs �L8, L10, L12, and L16; U�42.00, z�−2.92, p�0.003, r�−0.46�, and none of theremaining listeners exhibited a significant difference betweentheir DDLF and IDLF �U�65.00, z�−1.97, p�0.050, r�−0.31�.
Of the nine listeners who had significantly larger IDLFsthan DDLFs in Experiment 1 �L6–14�, only three showed asimilar effect in Experiment 2 �L8, L10, and L12�. For L6,L7, L9, and L11, IDLFs were no longer significantly largerthan their DDLFs at the corrected level. L16 was the onlylistener whose IDLF was significantly elevated relative toDDLF in Experiment 2 and not in Experiment 1, probably asa result of DLFs being underestimated in Experiment 1. L13and L14 were unavailable for re-testing in Experiment 2.
3. Influence of roving on I/D ratios
A listener’s relative ability to identify pitch-change di-rection can be quantified by dividing their IDLF by theirDDLF. Figure 3 �left-hand panel� shows the geometric mean“I/D ratios” for the group who took part in both experiments.A paired-samples t-test performed on listeners’ log-
Experiment 1 Experiment 20
2
4
6
8
10
12
Experiment 1 Experiment 2
I/Dratio
1
2
3
4
Group means (N=13) Direction-impairedlisteners (N=8)
FIG. 3. I/D ratios in Experiments 1 and 2 for the listeners taking part in bothexperiments. The left-hand panel shows geometric mean ratios for the groupas a whole, with bars representing 1 geometric standard error of the mean,on a logarithmic axis. The right-hand panel shows the I/D ratios for the eightindividuals showing the pitch-direction impairment in either or both experi-ments, with symbol and color combinations consistent with Fig. 2, plottedon a linear axis so that the individual points can be seen clearly. Solidhorizontal lines in both panels represent an I/D ratio of 1 �i.e., equal DDLFsand IDLFs�.
transformed I/D ratios confirmed that they were reliably
hias et al.: Stimulus uncertainty and frequency discrimination 3029
or copyright; see http://asadl.org/journals/doc/ASALIB-home/info/terms.jsp
Downloade
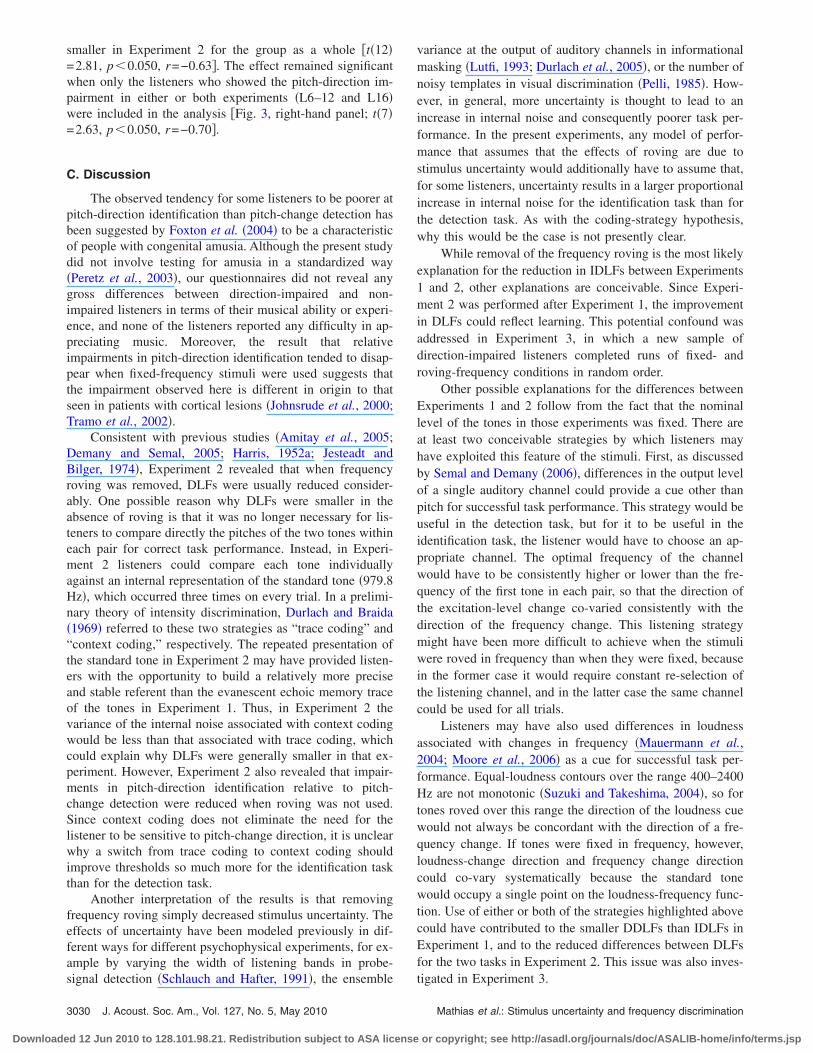
smaller in Experiment 2 for the group as a whole �t�12�=2.81, p�0.050, r=−0.63�. The effect remained significantwhen only the listeners who showed the pitch-direction im-pairment in either or both experiments �L6–12 and L16�were included in the analysis �Fig. 3, right-hand panel; t�7�=2.63, p�0.050, r=−0.70�.
C. Discussion
The observed tendency for some listeners to be poorer atpitch-direction identification than pitch-change detection hasbeen suggested by Foxton et al. �2004� to be a characteristicof people with congenital amusia. Although the present studydid not involve testing for amusia in a standardized way�Peretz et al., 2003�, our questionnaires did not reveal anygross differences between direction-impaired and non-impaired listeners in terms of their musical ability or experi-ence, and none of the listeners reported any difficulty in ap-preciating music. Moreover, the result that relativeimpairments in pitch-direction identification tended to disap-pear when fixed-frequency stimuli were used suggests thatthe impairment observed here is different in origin to thatseen in patients with cortical lesions �Johnsrude et al., 2000;Tramo et al., 2002�.
Consistent with previous studies �Amitay et al., 2005;Demany and Semal, 2005; Harris, 1952a; Jesteadt andBilger, 1974�, Experiment 2 revealed that when frequencyroving was removed, DLFs were usually reduced consider-ably. One possible reason why DLFs were smaller in theabsence of roving is that it was no longer necessary for lis-teners to compare directly the pitches of the two tones withineach pair for correct task performance. Instead, in Experi-ment 2 listeners could compare each tone individuallyagainst an internal representation of the standard tone �979.8Hz�, which occurred three times on every trial. In a prelimi-nary theory of intensity discrimination, Durlach and Braida�1969� referred to these two strategies as “trace coding” and“context coding,” respectively. The repeated presentation ofthe standard tone in Experiment 2 may have provided listen-ers with the opportunity to build a relatively more preciseand stable referent than the evanescent echoic memory traceof the tones in Experiment 1. Thus, in Experiment 2 thevariance of the internal noise associated with context codingwould be less than that associated with trace coding, whichcould explain why DLFs were generally smaller in that ex-periment. However, Experiment 2 also revealed that impair-ments in pitch-direction identification relative to pitch-change detection were reduced when roving was not used.Since context coding does not eliminate the need for thelistener to be sensitive to pitch-change direction, it is unclearwhy a switch from trace coding to context coding shouldimprove thresholds so much more for the identification taskthan for the detection task.
Another interpretation of the results is that removingfrequency roving simply decreased stimulus uncertainty. Theeffects of uncertainty have been modeled previously in dif-ferent ways for different psychophysical experiments, for ex-ample by varying the width of listening bands in probe-
signal detection �Schlauch and Hafter, 1991�, the ensemble3030 J. Acoust. Soc. Am., Vol. 127, No. 5, May 2010
d 12 Jun 2010 to 128.101.98.21. Redistribution subject to ASA license
variance at the output of auditory channels in informationalmasking �Lutfi, 1993; Durlach et al., 2005�, or the number ofnoisy templates in visual discrimination �Pelli, 1985�. How-ever, in general, more uncertainty is thought to lead to anincrease in internal noise and consequently poorer task per-formance. In the present experiments, any model of perfor-mance that assumes that the effects of roving are due tostimulus uncertainty would additionally have to assume that,for some listeners, uncertainty results in a larger proportionalincrease in internal noise for the identification task than forthe detection task. As with the coding-strategy hypothesis,why this would be the case is not presently clear.
While removal of the frequency roving is the most likelyexplanation for the reduction in IDLFs between Experiments1 and 2, other explanations are conceivable. Since Experi-ment 2 was performed after Experiment 1, the improvementin DLFs could reflect learning. This potential confound wasaddressed in Experiment 3, in which a new sample ofdirection-impaired listeners completed runs of fixed- androving-frequency conditions in random order.
Other possible explanations for the differences betweenExperiments 1 and 2 follow from the fact that the nominallevel of the tones in those experiments was fixed. There areat least two conceivable strategies by which listeners mayhave exploited this feature of the stimuli. First, as discussedby Semal and Demany �2006�, differences in the output levelof a single auditory channel could provide a cue other thanpitch for successful task performance. This strategy would beuseful in the detection task, but for it to be useful in theidentification task, the listener would have to choose an ap-propriate channel. The optimal frequency of the channelwould have to be consistently higher or lower than the fre-quency of the first tone in each pair, so that the direction ofthe excitation-level change co-varied consistently with thedirection of the frequency change. This listening strategymight have been more difficult to achieve when the stimuliwere roved in frequency than when they were fixed, becausein the former case it would require constant re-selection ofthe listening channel, and in the latter case the same channelcould be used for all trials.
Listeners may have also used differences in loudnessassociated with changes in frequency �Mauermann et al.,2004; Moore et al., 2006� as a cue for successful task per-formance. Equal-loudness contours over the range 400–2400Hz are not monotonic �Suzuki and Takeshima, 2004�, so fortones roved over this range the direction of the loudness cuewould not always be concordant with the direction of a fre-quency change. If tones were fixed in frequency, however,loudness-change direction and frequency change directioncould co-vary systematically because the standard tonewould occupy a single point on the loudness-frequency func-tion. Use of either or both of the strategies highlighted abovecould have contributed to the smaller DDLFs than IDLFs inExperiment 1, and to the reduced differences between DLFsfor the two tasks in Experiment 2. This issue was also inves-
tigated in Experiment 3.Mathias et al.: Stimulus uncertainty and frequency discrimination
or copyright; see http://asadl.org/journals/doc/ASALIB-home/info/terms.jsp
Downloade
III. EXPERIMENT 3
A. Rationale
The first aim of Experiment 3 was to test if the results ofExperiments 1 and 2 could be replicated while controllingfor the potential confounds highlighted in the previous sec-tion. A new sample of direction-impaired listeners completedruns of different conditions in random order, and most con-ditions included random changes in level from tone to tone.The second aim was to test whether the impairment in pitch-direction identification depends critically on the use of a verywide roving range �3102 cents, as in Experiment 1�, or ifsignificant impairments can also be observed with smallerroving ranges.
B. Method
1. Listeners
The 10 listeners who took part in Experiment 3 formedtwo subgroups: “experts” and “novices.” The expert groupconsisted of four listeners �four males; three right-handed;age range 24–61 years�: L1, L2, and two new listeners, L17�author PJB� and L18. All of these had taken part in manyprevious psychoacoustical experiments involving frequencyand/or pitch discrimination. The novice group consisted ofsix new listeners �L19–L24; six females; four right-handed;age range 18–22 years� who were selected from the cohort ofundergraduates as having particular difficulty with identify-ing pitch-change direction using the pre-test described previ-ously, and who had no prior experience in such experiments.None of the listeners in either group was a professional orpracticing musician.
2. Stimuli and procedure
The new listeners first underwent preliminary assess-ments as in Experiments 1 and 2. For five of the new listen-ers, hearing levels did not exceed 20 dB HL at any fre-quency. For the remaining listener �L19�, hearing level at250 Hz was 30 dB HL in one ear3. For all listeners, worst-earaverages over all frequencies were �20 dB HL. As before,in the main part of the experiment listeners heard two pairsof tones on every trial. The frequency of the first tone in eachpair was either fixed or randomly selected from a rectangularprobability distribution. There were four levels of frequency-roving range: a “wide” range of 3102 cents �400–2400.1 Hz,as in Experiment 1�; a “medium” range of 310 cents �895.9–1071.6 Hz�; a “narrow” range of 31 cents �988.9–971.4 Hz�;and “none,” corresponding to the absence of frequency rov-ing �as in Experiment 2�. For each roving range, the level ofeach tone in every trial was randomly set within a 7-dBrange ��3.5 dB around 60 dB SPL�. To assess if these leveldifferences influenced DLFs, two more stimulus arrange-ments without frequency roving were included: in the first,all tones were presented at 60 dB SPL �as in Experiments 1and 2�; and in the second, tone level was roved between pairsbut was fixed for the two tones within each pair.
For each of the six stimulus conditions, 20 DDLFs and20 IDLFs were obtained from each listener, resulting in 240
threshold measurements per listener in total. Listeners com-J. Acoust. Soc. Am., Vol. 127, No. 5, May 2010 Mat
d 12 Jun 2010 to 128.101.98.21. Redistribution subject to ASA license
pleted 11 sessions on different days. The initial session in-volved gathering the questionnaire and audiometric data, fol-lowed by a short practice block. The remaining sessionscontained two experimental blocks, and each block con-tained one run of each condition in a random order.
The adaptive procedure in Experiment 3 was similar tothat used previously, but included the following modifica-tions. If listeners made an error within the first three trials,two additional first-phase reversals were added to the run; insuch cases, the measurement phase started on the seventhrather than the fifth reversal. The maximum allowed �F was2400 cents. If listeners did not make an error within the firstthree trials, each adaptive run lasted for 12 rather than 14reversals. Again, the DLF was defined as the geometric meanof all values visited during the measurement phase.
C. Results and discussion
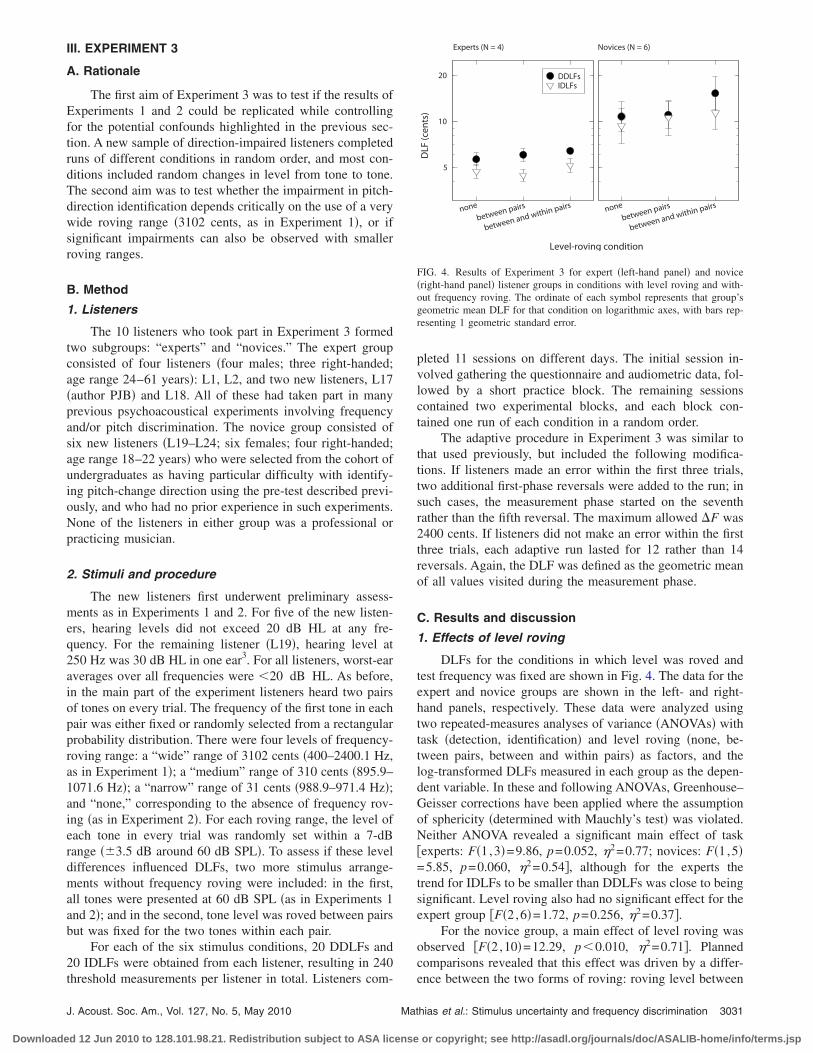
1. Effects of level roving
DLFs for the conditions in which level was roved andtest frequency was fixed are shown in Fig. 4. The data for theexpert and novice groups are shown in the left- and right-hand panels, respectively. These data were analyzed usingtwo repeated-measures analyses of variance �ANOVAs� withtask �detection, identification� and level roving �none, be-tween pairs, between and within pairs� as factors, and thelog-transformed DLFs measured in each group as the depen-dent variable. In these and following ANOVAs, Greenhouse–Geisser corrections have been applied where the assumptionof sphericity �determined with Mauchly’s test� was violated.Neither ANOVA revealed a significant main effect of task�experts: F�1,3�=9.86, p=0.052, �2=0.77; novices: F�1,5�=5.85, p=0.060, �2=0.54�, although for the experts thetrend for IDLFs to be smaller than DDLFs was close to beingsignificant. Level roving also had no significant effect for theexpert group �F�2,6�=1.72, p=0.256, �2=0.37�.
For the novice group, a main effect of level roving wasobserved �F�2,10�=12.29, p�0.010, �2=0.71�. Plannedcomparisons revealed that this effect was driven by a differ-
Level-roving condition
nonebetwe
en pairs
between and
withinpairs
DLF
(cen
ts)
5
10
20 DDLFsIDLFs
nonebetwe
en pairs
between and
withinpairs
Experts (N = 4) Novices (N = 6)
FIG. 4. Results of Experiment 3 for expert �left-hand panel� and novice�right-hand panel� listener groups in conditions with level roving and with-out frequency roving. The ordinate of each symbol represents that group’sgeometric mean DLF for that condition on logarithmic axes, with bars rep-resenting 1 geometric standard error.
ence between the two forms of roving: roving level between
hias et al.: Stimulus uncertainty and frequency discrimination 3031
or copyright; see http://asadl.org/journals/doc/ASALIB-home/info/terms.jsp
Downloade
and within pairs resulted in significantly larger DLFs thanroving level between pairs only �F�1,5�=14.60, p�0.050,r=0.86�. No significant interaction was found for eithergroup �experts: F�2,6�=0.51, p=0.625, �2=0.15; novices:F�2,10�=3.62, p=0.066, �2=0.42�.
The effects of level roving on frequency discriminationhave been explored in previous studies. Emmerich et al.�1989� found that DLFs measured for fixed-frequency tonepairs were larger when the tones were roved independentlyin level over a 12-dB range than when they were fixed inlevel �see also Henning, 1966�. Conversely, Moore and Glas-berg �1989� did not find a significant difference betweenDLFs measured for tones that were either fixed or roved overa 6-dB range. The non-significant �experts� and modest �nov-ices� effects of level-roving reported here are perhaps notsurprising given that our level-roving range �7-dB� was clos-est to the one used by Moore and Glasberg.
Importantly, although the novice listeners had slightlyelevated DLFs when level was roved between and withinpairs, their IDLFs were not larger than their DDLFs in theseconditions, which did not involve any frequency roving. Thisis consistent with the results of Experiment 2, where impair-ments in pitch-direction identification were far less profoundthan in Experiment 1. The results also suggest that the dif-ferences between the results of Experiments 1 and 2 are notlikely to be due to the use of cues other than pitch, whichwere available in Experiment 2 but not in Experiment 1.
2. Effects of frequency roving
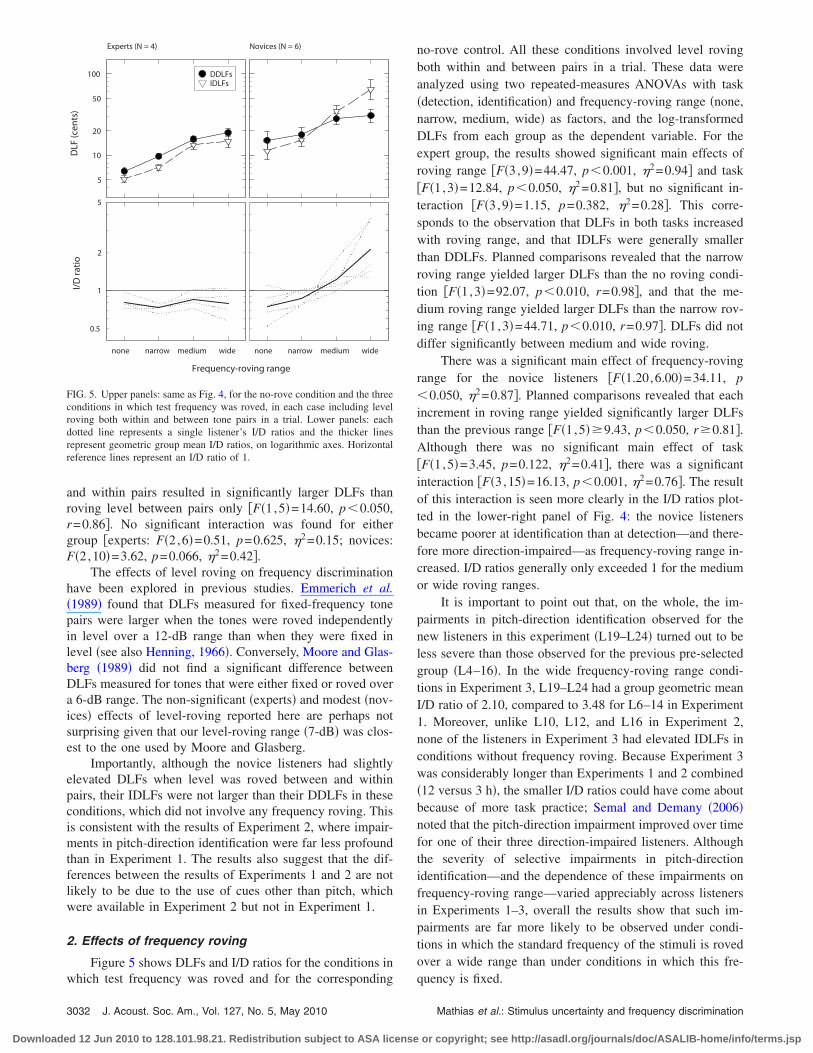
Figure 5 shows DLFs and I/D ratios for the conditions in
DLF
(cen
ts)
5
10
20
50
100
Experts (N = 4) Novices (N = 6)
Frequency-roving range
none narrow medium wide
I/Dratio
0.5
1
2
5
none narrow medium wide
DDLFsIDLFs
FIG. 5. Upper panels: same as Fig. 4, for the no-rove condition and the threeconditions in which test frequency was roved, in each case including levelroving both within and between tone pairs in a trial. Lower panels: eachdotted line represents a single listener’s I/D ratios and the thicker linesrepresent geometric group mean I/D ratios, on logarithmic axes. Horizontalreference lines represent an I/D ratio of 1.
which test frequency was roved and for the corresponding
3032 J. Acoust. Soc. Am., Vol. 127, No. 5, May 2010
d 12 Jun 2010 to 128.101.98.21. Redistribution subject to ASA license
no-rove control. All these conditions involved level rovingboth within and between pairs in a trial. These data wereanalyzed using two repeated-measures ANOVAs with task�detection, identification� and frequency-roving range �none,narrow, medium, wide� as factors, and the log-transformedDLFs from each group as the dependent variable. For theexpert group, the results showed significant main effects ofroving range �F�3,9�=44.47, p�0.001, �2=0.94� and task�F�1,3�=12.84, p�0.050, �2=0.81�, but no significant in-teraction �F�3,9�=1.15, p=0.382, �2=0.28�. This corre-sponds to the observation that DLFs in both tasks increasedwith roving range, and that IDLFs were generally smallerthan DDLFs. Planned comparisons revealed that the narrowroving range yielded larger DLFs than the no roving condi-tion �F�1,3�=92.07, p�0.010, r=0.98�, and that the me-dium roving range yielded larger DLFs than the narrow rov-ing range �F�1,3�=44.71, p�0.010, r=0.97�. DLFs did notdiffer significantly between medium and wide roving.
There was a significant main effect of frequency-rovingrange for the novice listeners �F�1.20,6.00�=34.11, p�0.050, �2=0.87�. Planned comparisons revealed that eachincrement in roving range yielded significantly larger DLFsthan the previous range �F�1,5��9.43, p�0.050, r�0.81�.Although there was no significant main effect of task�F�1,5�=3.45, p=0.122, �2=0.41�, there was a significantinteraction �F�3,15�=16.13, p�0.001, �2=0.76�. The resultof this interaction is seen more clearly in the I/D ratios plot-ted in the lower-right panel of Fig. 4: the novice listenersbecame poorer at identification than at detection—and there-fore more direction-impaired—as frequency-roving range in-creased. I/D ratios generally only exceeded 1 for the mediumor wide roving ranges.
It is important to point out that, on the whole, the im-pairments in pitch-direction identification observed for thenew listeners in this experiment �L19–L24� turned out to beless severe than those observed for the previous pre-selectedgroup �L4–16�. In the wide frequency-roving range condi-tions in Experiment 3, L19–L24 had a group geometric meanI/D ratio of 2.10, compared to 3.48 for L6–14 in Experiment1. Moreover, unlike L10, L12, and L16 in Experiment 2,none of the listeners in Experiment 3 had elevated IDLFs inconditions without frequency roving. Because Experiment 3was considerably longer than Experiments 1 and 2 combined�12 versus 3 h�, the smaller I/D ratios could have come aboutbecause of more task practice; Semal and Demany �2006�noted that the pitch-direction impairment improved over timefor one of their three direction-impaired listeners. Althoughthe severity of selective impairments in pitch-directionidentification—and the dependence of these impairments onfrequency-roving range—varied appreciably across listenersin Experiments 1–3, overall the results show that such im-pairments are far more likely to be observed under condi-tions in which the standard frequency of the stimuli is rovedover a wide range than under conditions in which this fre-
quency is fixed.Mathias et al.: Stimulus uncertainty and frequency discrimination
or copyright; see http://asadl.org/journals/doc/ASALIB-home/info/terms.jsp
Downloade
IV. EXPERIMENT 4
A. Rationale and method
In a recent series of experiments, Demany et al. �2009a�measured DDLFs and IDLFs for discrete and continuous fre-quency changes. They found that DLFs for both tasks wereimproved when the tones within a pair were connected by afrequency glide compared to when they were separated by asilent ISI �see also Sek and Moore, 1999; Lyzenga et al.,2004�. Although the data reported in that study only includedlisteners who did not experience difficulty identifying pitch-change direction, the authors mentioned in a footnote thatfour additional listeners did have larger IDLFs than DDLFsin the discrete and continuous conditions. This observationsuggests that the impairment in pitch-direction identificationis not specific to the use of discrete tones. However, Demanyet al.’s experiments always involved frequency roving over awide range. Experiment 4 assessed whether the effects offrequency roving on DLFs and I/D ratios observed in ourprevious experiments were specific to the particular stimuliemployed or generalized to a second stimulus arrangement inwhich the target frequency change was continuous.
The listeners from Experiment 3 were retested after thefinal session of the previous experiment. The stimuli in Ex-periment 4 were similar to those used above, except that thepair of same frequency tones was replaced by a constant-frequency tone, and the pair of different-frequency tones wasreplaced by two 250-ms steady-state plateaux connected by afrequency sweep. The sweep was a half-cycle sinusoidalfrequency-modulation function with no change in amplitudeand with phase continuity. The two tones had durations of750 ms and were separated by a 700-ms silent ISI. Thus,instead of hearing four discrete tones on every trial, listenersheard two tones with one containing a continuous frequencysweep. The sweep could occur in either the first or the sec-ond tone, and could be upward or downward. The level ofeach tone was independently varied over a 7-dB range cen-tered on 60 dB SPL.5 DDLFs and IDLFs were measuredusing two stimulus conditions: the starting frequency of thetones was fixed at 979.8 Hz for a run of trials, or rovedindependently from 400–2400.1 Hz. Six DLFs were mea-sured per condition for each listener.
B. Results
The group geometric mean DDLFs and IDLFs �and thecorresponding I/D ratios� measured in Experiment 4 areshown in Fig. 6. A repeated-measures ANOVA with expertgroup DLFs as the dependent variable, and with frequencyroving �roving, no roving� and task �detection, identification�as factors, revealed a main effect of frequency roving only�F�1,3�=43.72, p�0.050, �2=0.94�. The effect of task wasnot significant �F�1,3�=0.76, p=0.448, �2=0.20�, and therewas no significant interaction �F�1,3�=0.36, p=0.862, �2
=0.12�. A corresponding ANOVA for the novice group re-vealed significant main effects of frequency roving �F�1,5�=179.46, p�0.001, �2=0.97� and task �F�1,5�=10.14, p�0.050, �2=0.67�. As in Experiment 3, there was a signifi-cant interaction �F�1,5�=9.22, p�0.050, �2=0.65�, sug-
gesting that roving mediated the relative difficulty in pitch-J. Acoust. Soc. Am., Vol. 127, No. 5, May 2010 Mat
d 12 Jun 2010 to 128.101.98.21. Redistribution subject to ASA license
direction identification using continuous stimuli also. In thisexperiment, the geometric mean I/D ratio observed for thenovice group with roved stimuli was 2.25, which is similar tothe ratio observed for the same listeners in the maximum-roving condition in Experiment 3 �2.10�.
V. GENERAL DISCUSSION
A. Summary of the findings
�1� Experiment 1 replicated the finding that some listen-ers have difficulty identifying the direction of small but de-tectable frequency changes between pure tones when thestandard frequency is roved widely. Other listeners showedno such deficit in pitch-direction identification, and consis-tent with previous results their IDLFs were roughly equal toor smaller than their DDLFs.
�2� When frequency roving was removed in Experiment2, the large discrepancies between IDLFs and DDLFs �re-flected in large I/D ratios� were reduced. Many of the listen-ers who had been identified as direction-impaired in Experi-ment 1 no longer had significantly larger IDLFs than DDLFsin Experiment 2.
�3� Experiment 3 revealed that DLFs tended to increasemonotonically with frequency-roving range for all listeners.For direction-impaired listeners, I/D ratios also increasedwith frequency-roving range. These listeners appeared to bedirection-impaired only when a relatively wide frequency-roving range �3102 cents� was used, and not when level wasroved and frequency was fixed.
�4� In Experiment 4, listeners were tested with continu-ous instead of discrete frequency changes. Again, the resultsshowed generally larger DLFs—and larger I/D ratios indirection-impaired listeners—under wide frequency roving
DLF
(cen
ts)
5
10
20
50
100
Experts (N = 4) Novices (N = 6)
Frequency-roving condition
without roving with roving
I/Dratio
0.5
1
2
5
without roving with roving
DDLFsIDLFs
FIG. 6. Same as Fig. 5, for the conditions in Experiment 4.
than under no roving.
hias et al.: Stimulus uncertainty and frequency discrimination 3033
or copyright; see http://asadl.org/journals/doc/ASALIB-home/info/terms.jsp
Downloade
B. Implications for the origin of the impairment
Why are some listeners unable to reliably identify thedirection of small yet detectable frequency changes? Basedon earlier findings, which suggest that the human auditorysystem contains neural populations that are selectively sen-sitive to the direction of small frequency changes �Demanyand Ramos, 2005; Demany et al., 2009b� Semal and De-many, �2006� proposed that such frequency-shift detectors�FSDs� may not respond to small shifts in the brains ofdirection-impaired listeners. The result that insensitivity topitch-change direction is greatly reduced or eliminated whenwide frequency roving is not used suggests either that thisexplanation is incorrect, or that when the stimuli are notroved widely in frequency, listeners’ ability to identify pitch-change direction no longer relies on FSDs. As mentionedearlier, when the standard frequency of the tones is fixed,listeners may be able to compare the frequencies evoked bythe tones to a standard referent stored in long-term auditorymemory �context coding� instead of comparing directly theechoic traces of the two tones �trace coding�. If FSDs arenecessary for successful task performance only when listen-ers use trace coding and not context coding, less or no im-pairment may be observed with fixed-frequency stimuli. Thisexplanation rests on several assumptions that need to betested further.
A second possible explanation for the findings is that,when performing the identification task with stimuli thatwere not roved widely in frequency, direction-impaired lis-teners were able to make more effective use of the detailedfeedback provided after every trial. According to this expla-nation, direction-impaired listeners could not perceive asmall pitch change as upward or downward per se in theseconditions, but could perceive a difference between tonepairs containing upward and downward changes, simply be-cause the second element in the sequence was perceived asdifferent in the two cases. Owing to the provision of feed-back after each trial, and to the fact that the stimuli did notvary widely across trials, listeners could have learned to cor-rectly label the two different-sounding cases as either “up” or“down,” allowing for more successful task performance.Since this strategy requires that the tones forming the up anddown cases do not vary widely across trials, this could ex-plain why IDLFs were considerably elevated relative toDDLFs when the frequency-roving range of the stimuli waswide.
If this “learning” hypothesis is correct, in conditionswithout wide frequency roving, direction-impaired listenersmight show an initial impairment in pitch-direction identifi-cation that decreases over trials. This was investigated byexamining how threshold estimates obtained in Experiment 2for L6, L7, L9, and L11 changed over time. The data did notshow learning over the course of the experiment �i.e., therewas not a monotonic decrease in thresholds�, nor did theyshow differences in learning between the detection and iden-tification tasks. Although this analysis does not support thelearning hypothesis it does not rule it out completely, be-cause the listeners may have learned to utilize feedback in
Experiment 2 very rapidly �within the first run of trials�. A3034 J. Acoust. Soc. Am., Vol. 127, No. 5, May 2010
d 12 Jun 2010 to 128.101.98.21. Redistribution subject to ASA license
stronger test of the hypothesis would involve measuringIDLFs in direction-impaired listeners using fixed-frequencystimuli without trial-by-trial feedback. In this circumstance,the listeners should not be able to learn to label upward anddownward changes appropriately, and they should remaindirection-impaired regardless of the frequency-roving rangeused. This could not be assessed with the present data, sincefeedback was included in all four experiments.
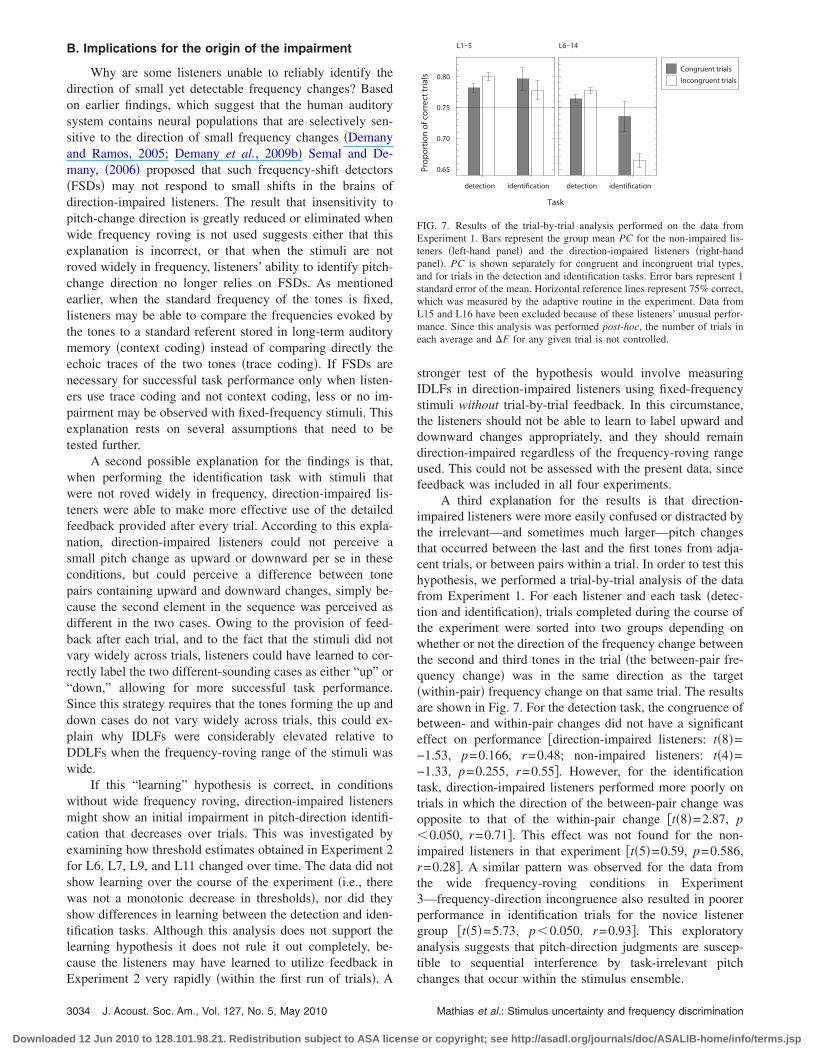
A third explanation for the results is that direction-impaired listeners were more easily confused or distracted bythe irrelevant—and sometimes much larger—pitch changesthat occurred between the last and the first tones from adja-cent trials, or between pairs within a trial. In order to test thishypothesis, we performed a trial-by-trial analysis of the datafrom Experiment 1. For each listener and each task �detec-tion and identification�, trials completed during the course ofthe experiment were sorted into two groups depending onwhether or not the direction of the frequency change betweenthe second and third tones in the trial �the between-pair fre-quency change� was in the same direction as the target�within-pair� frequency change on that same trial. The resultsare shown in Fig. 7. For the detection task, the congruence ofbetween- and within-pair changes did not have a significanteffect on performance �direction-impaired listeners: t�8�=−1.53, p=0.166, r=0.48; non-impaired listeners: t�4�=−1.33, p=0.255, r=0.55�. However, for the identificationtask, direction-impaired listeners performed more poorly ontrials in which the direction of the between-pair change wasopposite to that of the within-pair change �t�8�=2.87, p�0.050, r=0.71�. This effect was not found for the non-impaired listeners in that experiment �t�5�=0.59, p=0.586,r=0.28�. A similar pattern was observed for the data fromthe wide frequency-roving conditions in Experiment3—frequency-direction incongruence also resulted in poorerperformance in identification trials for the novice listenergroup �t�5�=5.73, p�0.050, r=0.93�. This exploratoryanalysis suggests that pitch-direction judgments are suscep-tible to sequential interference by task-irrelevant pitch
L1–5
Task
detection identification
Prop
ortio
nof
correcttria
ls
0.65
0.70
0.75
0.80Congruent trials
Incongruent trials
L6–14
detection identification
FIG. 7. Results of the trial-by-trial analysis performed on the data fromExperiment 1. Bars represent the group mean PC for the non-impaired lis-teners �left-hand panel� and the direction-impaired listeners �right-handpanel�. PC is shown separately for congruent and incongruent trial types,and for trials in the detection and identification tasks. Error bars represent 1standard error of the mean. Horizontal reference lines represent 75% correct,which was measured by the adaptive routine in the experiment. Data fromL15 and L16 have been excluded because of these listeners’ unusual perfor-mance. Since this analysis was performed post-hoc, the number of trials ineach average and �F for any given trial is not controlled.
changes that occur within the stimulus ensemble.
Mathias et al.: Stimulus uncertainty and frequency discrimination
or copyright; see http://asadl.org/journals/doc/ASALIB-home/info/terms.jsp
Downloade
If confirmed, the inability of some listeners to ignoreirrelevant stimulus variations when making pitch-directionjudgments would be similar in some respects to findingsfrom the informational masking literature. In those experi-ments, listeners’ ability to hear out a target stimulus—usuallya single pure tone of known frequency or a short sequence oftones—is impaired when the target is presented in a back-ground of spectrally distant, task-irrelevant masker tones �forreviews, see Kidd et al., 2008 and Watson, 2005�. A clearaspect of informational masking is that listeners often attendto a frequency region that is wider than the region occupiedby the target, such that random variability of the maskerswhich fall within the attended region affects performance. Asecond aspect is that susceptibility to informational maskingis subject to large individual differences; some listeners aregreatly affected by masker uncertainty, while others are ableto listen “analytically” and largely ignore the maskers �Neffand Callaghan, 1988; Neff and Dethlefs, 1995�. The indi-vidual differences in pitch-direction identification are similarto individual differences in informational masking in thatgreater susceptibility to masker uncertainty does not appearto be symptomatic of any real-world hearing deficits �Neffand Dethlefs, 1995�, and the differences remain pronounceddespite extensive task practice �Neff and Callaghan, 1988�. Itwould be interesting to determine if those individuals whoare relatively insensitive to pitch-change direction are alsorelatively more susceptible to informational masking.
Finally, it is important to note again that three of thelisteners tested still had significantly larger IDLFs than theirDDLFs in Experiment 2, in which frequency roving was notused, and in which the potential for interference from irrel-evant pitch changes was rather small. This suggests thatwhile sequential interference appears to have contributed tothe impairment, it may not be the sole cause of the difficul-ties experienced by these listeners. It is plausible that greatersusceptibility to sequential interference could actually resultfrom a genuine difficulty in identifying the direction of smallpitch changes even under conditions in which this interfer-ence is minimal. In this case, listeners who were unable toperceive the direction of the within-pair frequency changemay have indicated the direction of the most salient fre-quency change occurring in the trial �i.e., the between-pairchange�, hence making more errors when the directions ofthe two changes were incongruent. However, it is equallynoteworthy that most direction-impaired listeners tested herewere not direction-impaired in the absence of frequency rov-ing, which suggests that impairments in pitch-direction iden-tification may have more than one cause.
C. Implications for psychophysical models
The findings of this series of experiments present severalchallenges for psychophysical models of frequency discrimi-nation. One challenge is to account for the general influenceof frequency roving—for all listeners, DDLFs and IDLFstended to increase monotonically with increasing frequency-roving range. Arguably the simplest models that can be ap-plied to the present data are phenomenological models based
on signal detection theory �SDT�, such as those described byJ. Acoust. Soc. Am., Vol. 127, No. 5, May 2010 Mat
d 12 Jun 2010 to 128.101.98.21. Redistribution subject to ASA license
Semal and Demany �2006� and Micheyl et al. �2008�. Thesemodels make few assumptions as to how pitch is determinedin the auditory system, merely that listeners’ decisions in afrequency discrimination task are based on noisy internalrepresentations �“observations”� of the pitch of the stimulipresented. The decision variable in these models is based onthe differences between observations within each stimuluspair. Specifically, the listener is assumed to select whicheverpair yields the largest difference �for detection trials�, or torespond upward or downward depending on whether the signof this difference is positive or negative �for identificationtrials�. This so-called “differencing strategy” has often beenutilized in psychophysical models of frequency and intensitydiscrimination, and forms the basis of the SDT analysis ofthe popular 2I-2AFC paradigm �Green and Swets, 1966;Macmillan et al., 1977; Noreen, 1981; Macmillan and Creel-man, 2005�. When frequency is roved widely across pairs,the differencing strategy is actually the optimal strategy inthe dual-pair detection and identification tasks �Micheyl andMessing, 2006; Micheyl and Dai, 2009�. However, modelsthat use solely a differencing strategy cannot account forchanges in DLFs as a function of roving range. Mathemati-cally, the application of across-pair roving corresponds toadding the same quantity �drawn from a random distribution�to the two observations within a pair. This quantity cancelsout when one takes the difference between the pairs, yieldingno difference in predicted DLFs whether roving is applied ornot. For differencing models to account for the effects ofroving, the variance of the internal noise that limits sensitiv-ity to frequency differences must be assumed to increasewith frequency-roving range. This could correspond to as-suming different coding strategies depending on rovingrange, as in Durlach and Braida’s �1969� model, or increasesin internal noise with increasing stimulus uncertainty, as out-lined earlier.
A second challenge is to account for the large individualdifferences observed in listeners’ I/D ratios. While direction-impaired listeners have elevated IDLFs relative to theirDDLFs, listeners without such impairment have IDLFs thatare equal to or smaller than their DDLFs. Semal and Demany�2006� and Micheyl et al. �2008� demonstrated that the latteroutcome can be explained by SDT models in which the samesource of internal noise limits performance in both detectionand identification tasks. Under the traditional, equal-varianceGaussian noise assumption, SDT predicts that IDLFs shouldbe smaller than DDLFs by a factor of 1.56 �corresponding toan I/D ratio of 0.64�. However, the ratio measured for reallisteners who show no specific deficit in the identificationtask is often different from this value. Micheyl et al. �2008�pointed out that I/D ratios between 0.64 and 1 can be pre-dicted by models in which observations are discretized into avariable number of categories, or by assuming Poisson-ratherthan Gaussian-distributed noise. In short, if it is assumed thatthe same internal noise limits both pitch-change detectionand pitch-direction identification, listeners’ IDLFs should bethe same as or slightly smaller than their DDLFs.
Arguably the most pressing challenge is to account forthe relationship between DDLFs and IDLFs in direction-
impaired listeners, and for the influence of frequency rovinghias et al.: Stimulus uncertainty and frequency discrimination 3035
or copyright; see http://asadl.org/journals/doc/ASALIB-home/info/terms.jsp
Downloade
on this relationship. One way to account for the relationshipwithout throwing away existing models of frequency dis-crimination is to abandon the parsimonious—but clearly notgenerally correct—assumption that sensitivity in pitch-change detection and pitch-direction identification tasks islimited by the same internal noise, and assume instead that,for some reason, the internal noise is greater in the latter thanthe former. Consider frequency discrimination as a two-stepdecision process: first the listener must detect a change infrequency, and then assign the correct direction �up or down�to the change. In the present experiments, the detection taskwould require only the first step, while the identification taskwould require both steps. The first step involves comparingsensory observations and so would be limited by internalsensory noise. When listeners are required additionally toperform the second step, a novel source of internal noisecould be introduced. For listeners with no difficulty identify-ing pitch-change direction, this additional noise could be as-sumed to be minimal, and therefore the phenomenologicalmodels provided by Micheyl et al. �2008� would be appli-cable. For direction-impaired listeners, one potential sourceof additional noise has been identified above, namely se-quential interference effects between across- and within-pairpitch changes. However, at least one other source is neededin order to account for the observation that some listenersstill had significantly larger IDLFs than DDLFs in Experi-ment 2. At present, the origin of this additional source ofidentification-specific internal noise is not clear.
While formulating a new psychophysical model of lis-teners’ behavior in pitch-change detection and pitch-directionidentification tasks is beyond the scope of this empirical re-port, it is clear that current models will need to be enhancedif they are to account for the range of individual differencesand the effects of roving observed in the experiments re-ported above.
ACKNOWLEDGMENTS
We thank Brian Moore, Catherine Semal, and an anony-mous reviewer for their comments on earlier drafts of thisarticle. S.R.M. is supported by a studentship from the UKBiotechnology and Biological Sciences Research Council.C.M. is supported by NIH under Grant No. R01 DC 05216.
1For three of the listeners in that study, d� was larger on average for the2I-2AFC task than for the SD tasks for equivalent magnitudes of fre-quency difference. This suggests that the frequency differences were noless discriminable in the 2I-2AFC task than they were in the SD tasks. Forthe remaining listener, d� was small ��1� in all conditions, suggesting thatthis listener had difficulty discriminating small frequency differences re-gardless of task.
2In that study DLFs were largest on average for the group trained with themore narrowly roved stimuli.
3Since all the stimuli in the experiments were clearly audible to all listen-ers, we think that it is very unlikely that the minor audiometric abnormali-ties observed in some individuals influenced the results. Therefore wehave chosen to include the data for all listeners in the results reported here.
4The SSQ was administered to explore the relationship between listeners’reports of any difficulties with hearing in real-world situations and theirability to detect or identify the direction of frequency changes. These dataare not included in the present article.
5The level roving used in this experiment could not control for potential
loudness or excitation-pattern cues—as in Experiment 3—because the3036 J. Acoust. Soc. Am., Vol. 127, No. 5, May 2010
d 12 Jun 2010 to 128.101.98.21. Redistribution subject to ASA license
level was always constant within each tone. However, the results of Ex-periment 3 suggest that it was very unlikely that listeners actually madeuse of such cues.
Amitay, S., Hawkey, D. J. C., and Moore, D. R. �2005�. “Auditory fre-quency discrimination learning is affected by stimulus variability,” Per-cept. Psychophys. 67, 691–698.
ANSI �1994�. American National Standards Acoustical Terminology�American National Standards Institute, New York�.
Demany, L., Carlyon, R. P., and Semal, C. �2009a�. “Continuous versusdiscrete frequency changes: Different detection mechanisms?,” J. Acoust.Soc. Am. 125, 1082–1090.
Demany, L., Pressnitzer, D., and Semal, C. �2009b�. “Tuning properties ofthe auditory frequency-shift detectors,” J. Acoust. Soc. Am. 126, 1342–1348.
Demany, L., and Ramos, C. �2005�. “On the binding of successive sounds:Perceiving shifts in nonperceived pitches,” J. Acoust. Soc. Am. 117, 833–841.
Demany, L., and Semal, C. �2005�. “The slow formation of a pitch perceptbeyond the ending time of a short tone burst,” Percept. Psychophys. 67,1376–1383.
Durlach, N. I., and Braida, L. D. �1969�. “Intensity perception: I. Prelimi-nary theory of intensity resolution,” J. Acoust. Soc. Am. 46, 372–383.
Durlach, N. I., Mason, C. R., Gallun, F. J., Shinn-Cunningham, B., Colburn,H. S., and Kidd, G., Jr. �2005�. “Informational masking for simultaneousnonspeech stimuli: Psychometric functions for fixed and randomly mixedmaskers,” J. Acoust. Soc. Am. 118, 2482–2497.
Emmerich, D. S., Ellermeier, W., and Butensky, B. �1989�. “A reexamina-tion of the frequency discrimination of random-amplitude tones, and a testof Henning’s modified energy-detector model,” J. Acoust. Soc. Am. 85,1653–1659.
Foxton, J. M., Dean, J. L., Gee, R., Peretz, I., and Griffiths, T. D. �2004�.“Characterization of deficits in pitch perception underlying ‘tone deaf-ness’,” Brain 127, 801–810.
Foxton, J. M., Weisz, N., Bauchet-Lecaignard, F., Delpuech, C., and Ber-trand, O. �2009�. “The neural bases underlying pitch processing difficul-ties,” Neuroimage 45, 1305–1313.
Gatehouse, S., and Noble, W. �2004�. “The speech, spatial and qualities ofhearing scale �SSQ�,” Int. J. Audiol. 43, 85–99.
Green, D. M., and Swets, J. A. �1966�. Signal Detection Theory and Psy-chophysics �Wiley, New York�.
Harris, J. D. �1952a�. “The decline of pitch discrimination with time,” J.Exp. Psychol. 43, 96–99.
Harris, J. D. �1952b�. “Pitch discrimination,” J. Acoust. Soc. Am. 24, 750–755.
Henning, G. B. �1966�. “Frequency discrimination of random amplitudetones,” J. Acoust. Soc. Am. 39, 336–339.
Jesteadt, W., and Bilger, R. C. �1974�. “Intensity and frequency discrimina-tion in one- and two-interval paradigms,” J. Acoust. Soc. Am. 55, 1266–1276.
Johnsrude, I. S., Penhune, V. B., and Zatorre, R. J. �2000�. “Functionalspecificity in the right human auditory cortex for perceiving pitch direc-tion,” Brain 123, 155–163.
Kaernbach, C. �1991�. “Simple adaptive testing with the weighted up-downmethod,” Percept. Psychophys. 49, 227–229.
Kidd, G., Jr., Mason, C. R., Richards, V. M., Gallun, F. J., and Durlach, N.I. �2008�. “Informational masking,” Auditory Perception of SoundSources, edited by W. A. Yost, A. N. Popper, and R. R. Fay �Springer,New York�, pp. 143–189.
Lutfi, A. �1993�. “A model of auditory pattern analysis based on component-relative-entropy,” J. Acoust. Soc. Am. 94, 748–758.
Lyzenga, J., Carlyon, R. P., and Moore, B. C. J. �2004�. “The effects of realand illusory glides on pure-tone frequency discrimination,” J. Acoust. Soc.Am. 116, 491–501.
Macmillan, N. A., and Creelman, C. D. �2005�. Dection Theory: A User’sGuide �Lawrence Erlbaum Associates, Mahwah, NJ�.
Macmillan, N. A., Kaplan, H. L., and Creelman, C. D. �1977�. “Psychophys-ics of categorical perception,” Psychol. Rev. 84, 452–471.
Mauermann, M., Long, G. R., and Kollmeier, B. �2004�. “Fine structure ofhearing threshold and loudness perception,” J. Acoust. Soc. Am. 116,1066–1080.
Micheyl, C., and Dai, H. �2009�. “Likelihood ratio, optimal decision rulesand relationship between proportion correct and d� in the dual-pair AB-
versus-BA identification paradigm,” Percept. Psychophys. 71, 1426–1433.Mathias et al.: Stimulus uncertainty and frequency discrimination
or copyright; see http://asadl.org/journals/doc/ASALIB-home/info/terms.jsp
Downloade
Micheyl, C., Kaernbach, C., and Demany, L. �2008�. “An evaluation ofpsychophysical models of auditory change perception,” Psychol. Rev. 115,1069–1083.
Micheyl, C., and Messing, D. P. �2006�. “Likelihood ratio, optimal decisionrules and correct response probabilities in a signal detection theoretic,equal-variance Gaussian model of the observer in the 4IAX paradigm,”Percept. Psychophys. 68, 725–735.
Moore, B. C. J. �1973�. “Frequency difference limens for short-durationtones,” J. Acoust. Soc. Am. 54, 610–619.
Moore, B. C. J. �1974�. “Relation between critical bandwidth and frequency-difference limen,” J. Acoust. Soc. Am. 55, 359–359.
Moore, B. C. J., and Glasberg, B. R. �1989�. “Mechanisms underlying thefrequency discrimination of pulsed tones and the detection of frequencymodulation,” J. Acoust. Soc. Am. 86, 1722–1732.
Moore, B. C. J., Glasberg, B. R., Low, K. E., Cope, T., and Cope, W. �2006�.“Effects of level and frequency on the audibility of partials in inharmoniccomplex tones,” J. Acoust. Soc. Am. 120, 934–944.
Neff, D. L., and Callaghan, B. P. �1988�. “Effective properties of multicom-ponent simultaneous maskers under conditions of uncertainty,” J. Acoust.Soc. Am. 83, 1833–1838.
Neff, D. L., and Dethlefs, T. M. �1995�. “Individual-differences in simulta-neous masking with random-frequency, multicomponent maskers,” J.Acoust. Soc. Am. 98, 125–134.
Nordmark, J. O. �1968�. “Mechanisms of frequency discrimination,” J.Acoust. Soc. Am. 44, 1533–1540.
Noreen, D. �1981�. “Optimal decision rules for some common psychophysi-
cal paradigms,” Mathematical Psychology and Psychophysiology: Pro-J. Acoust. Soc. Am., Vol. 127, No. 5, May 2010 Mat
d 12 Jun 2010 to 128.101.98.21. Redistribution subject to ASA license
ceedings of the Symposium in Applied Mathematics of the American Math-ematical Society and the Society for Industrial and Applied Mathematics,edited by S. Grossberg �American Mathematical Society, Providence, RI�,Vol. 13, pp. 237–279.
Pelli, D. G. �1985�. “Uncertainty explains many aspects of visual contrastdetection and discrimination,” J. Opt. Soc. Am. A 2, 1508–1532.
Peretz, I., Champod, S., and Hyde, K. �2003�. “Varieties of musical disor-ders: The Montreal battery of evaluation of amusia,” Ann. N. Y. Acad. Sci.999, 58–75.
Schlauch, R. S., and Hafter, E. R. �1991�. “Listening bandwidths and fre-quency uncertainty in pure-tone signal-detection,” J. Acoust. Soc. Am. 90,1332–1339.
Sek, A., and Moore, B. C. J. �1999�. “Discrimination of frequency stepslinked by glides of various durations,” J. Acoust. Soc. Am. 106, 351–359.
Semal, C., and Demany, L. �2006�. “Individual differences in the sensitivityto pitch direction,” J. Acoust. Soc. Am. 120, 3907–3915.
Suzuki, Y., and Takeshima, H. �2004�. “Equal-loudness-level contours forpure tones,” J. Acoust. Soc. Am. 116, 918–933.
Tramo, M. J., Shah, G. D., and Braida, L. D. �2002�. “Functional role ofauditory cortex in frequency processing and pitch perception,” J. Neuro-physiol. 87, 122–139.
Watson, C. S. �2005�. “Some comments on informational masking,” Acust.Acta Acust. 91, 502–512.
Wier, C. C., Jesteadt, W., and Green, D. M. �1977�. “Frequency discrimina-tion as a function of frequency and sensation level,” J. Acoust. Soc. Am.
61, 178–184.hias et al.: Stimulus uncertainty and frequency discrimination 3037
or copyright; see http://asadl.org/journals/doc/ASALIB-home/info/terms.jsp
![[Congenital insensitivity to pain with anhidrosis associated with congenital myasthenic syndrome]](https://img.dokumen.tips/doc/110x75/634cbd47b5aff40b380eac76/congenital-insensitivity-to-pain-with-anhidrosis-associated-with-congenital-myasthenic.jpg)


