Embed Size (px)
Citation preview
STEEL AND COMPOSITE BEAMS
WITH
WEB OPENINGS
WARREN K. LUCAS
DAvm DARWIN
A Report on Research Sponsored by
THE AMERICAN IRON AND STEEL INSTITUTE
The University of Kansas
Lawrence, Kansas
June 1990

ii
ABSTRACT
Three design methods, osiginally deveIoped by Donahey and Darwin (19861, for
dewmining the maximum shear capacity of composite beams with unreinforced web openings are
extended to include steel and composite beams with or without reinforcement at the opening. The
three design methods incorporate sirnplirylng assumptions that pennit closed-form sofutions for
maximum shear capacity. The first method assumes that the neutral axes for secondary knding
lie in the flanges of the top and bottom tees and defines the interaction of shear and normal
stresses by a linear approximation of the von Mises yield function. The second method ignores
the contribution of the flanges to secondary bending moments and employs the von Mises yield
function to define the interaction of shear and normal stresses. The third method ignores the
contribution of the flanges to secondary bending moments and defines the interaction between
shear and normal smsses with a linear approximation of the von Mises yield function. Simplified
design expressions for the maximum moment capacity of steel and composite beams with web
openings are presented. Six refinements of the design methods are investigated to determine their
significance in predicting member strengths. Simplified design expressions developed by Darwin
(1990) for determining the maximum moment capacity of steel and composite kams at web
openings are surnmarjzed. The accuracy and ease of application of the design methods presented
in this report (Methods I, TI, and JJI) and applicable procedures proposed by Redwood and
Shrivastava (1980), Redwood and Poumboums (19841, and Redwood and Cho (1986) are
compared with experimental results of fifty steel beams and thirty-five composite beams.
Resistance factors are- calculated for use in LRFD of structural steel buiIdings. The simplest of
the design methods
iii
presented in this coupled with moment-shear interaction procedures proposed by Donahey
and Darwin (19861, provides excellent agreement with test results and a superior approach in
terms of accuracy and ease of application. Resistance factors of 0.90 and 0.85, applied to both
shear and bending, are suitable for steel and composite beams, respectively.
iv
ACKNOWLEDGEMENTS
This report is based on research performed by Warren R Lucas in partfaI fulfillment of
requirements for the M.S.C.E. degree. The research was supported by the American Iron and
Steel Institute and the University of Kansas Center for Research, Inc. Structural Engineering and
Materids Laboratory. Numerical calculations were performed on the HARRIS f 200 computer at
the University of Kansas Computer Aided Engineering Laboratory and microcomputer and VAX
computing resources owned by Black & Veatch, Kansas City, Missouri.

v
TABLE OF CONTENTS
ABSTRACT . . . . . . . . . . . . . . . . . . . . . . . . . . . . . . . . . . . . . . . . . . . . . . . . . . . . . . . . ii
ACKNOWLEDGEMENTS . . . . . . . . . . . . . . . . . . . . . . . . . . . . . . . . . . . . . . . . . . . . . iv
SECTION 1.0 INTRODUCTION . . . . . . . . . . . . . . . . . . . . . . . . . . . . . . . . . . . . . . . . 1
SECTION 2.0 STRENGTH DESIGN PROCEDURES
2.1 Overview of Design Procedures . . . . . . . . . . . . . . . . . . . . . . . . . . . . . . . . . . . . 3
2.2 Interaction Curve . . . . . . . . . . . . . . . . . . . . . . . . . . . . . . . . . . . . . . . . . . . . . . 4
2.3 Forces at the Opening . . . . . . . . . . . . . . . . . . . . . . . . . . . . . . . . . . . . . . . . . . . 5
2.4 Shear Capacity Equations . . . . . . . . . . . . . . . . . . . . . . . . . . . . . . . . . . . . . . . . 6
2.5 Moment Capacity Equations . . . . . . . . . . . . . . . . . . . . . . . . . . . . . . . . . . . . . 22
2.6 Redwood Methods . . . . . . . . . . . . . . . . . . . . . . . . . . . . . . . . . . . . . . . . . . . . 29
SECTION 3.0 ANALYSIS AND RESUILTS
3.1 Introduction . . . . . . . . . . . . . . . . . . . . . . . . . . . . . . . . . . . . . . . . . . . . . . . . . 31
3.2 Proportioning and Detailing Guidelines . . . . . . . . . . . . . . . . . . . . . . . . . . . . . . 32
. . . . . . . . . . . . . . . . . . . . . . . . . . . . . . . . . . 3.3 Resistance Factor Determination 33
3.4 Effect of Varying h . . . . . . . . . . . . . . . . . . . . . . . . . . . . . . . . . . . . . . . . . . . 34
3.5 Effect of Reducing Tee Depth for Reinforcement . . . . . . . . . . . . . . . . . . . . . . 36
3.6 Effect ai' Limiting PC, by the Net Top Tee Steel . . . . . . . . . . . . . . . . . . . . . . . 37
3.7 Effect of Limiting P, by WeId Strength . . . . . . . . . . . . . . . . . . . . . . . . . . . . . 38
. . . . . . . . . . . . . . . . . . . . . . . . . . . . . . . . . . . . . . . . . . . 3.8 Effect of Flanges .. 38
. . . . . . . . . . . . . . . . . . . . . . . . . . . . . . . . . . . . . 3.9 Effect of Limiting M, by M, 39
3.10 Redwood Design Methods . . . . . . . . . . . . . . . . . . . . . . . . . . . . . . . . . . . . . . . 39
3.1 1 Comparison of Design Methods with Test Results . . . . . . . . . . . . . . . . . . . . . . 41
TABLE OF CONTENTS (continued)
SECTION 4.0 SUMMARY AND CONCLUSIONS
. . . . . . . . . . . . . . . . . . . . . . . . . . . . . . . . . . . . . . . . . . . . . . . . . . . 4.1 S u m m m 44
. . . . . . . . . . . . . . . . . . . . . . . . . . . . . . . . . . . . . . . . . . . . . . . . . 4.2 Conclusions 45
REFERENCES . . . . . . . . . . . . . . . . . . . . . . . . . . . . . . . . . . . . . . . . . . . . . . . 48
TABLES . . . . . . . . . . . . . . . . . . . . . . . . . . . . . . . . . . . . . . . . . . . . . . . . . . . . 53
FIGURES . . . . . . . . . . . . . . . . . . . . . . . . . . . . . . . . . . . . . . . . . . . . . . . . . . . . . 100
APPENDIX A DEFINITIONS AND NOTATION . . . . . . . . . . . . . . . . . . . . . . . . . 129
APPENDIX B SHEAR CAPACITY EXPRESSIONS FOR
COMPARISON WITH TEST DATA . . . . . . . . . . . . . . . . . . . . . . . 136
APPENDIX C DERIVATION ANB CALCULATION OF VALIXS FOR
THEORETICAL COMPARISON OF METHODS I, TI.
ANDIII . . . . . . . . . . . . . . . . . . . . . . . . . . . . . . . . . . . . . . . . . . . . 138
APPENDIX D GUIDELINES FOR PROPORTIONING AND
DETAILING BEAMS WITH WEB OPENINGS . . . . . . . . . . . . . . . 142
APPENDIX E SUMMARY OF BEAMS NOT MEETING DESIGN
LIMITATIONS . . . . . . . . . . . . . . . . . . . . . . . . . . . . . . . . . . . . . . 153
APPENDTX F DERIVATION OF FOR COMPOSITE BEAM
SIMPLIFIED MOMENT EQUATION . . . . . . . . . . . . . . . . . . . . . . 171
APPENDIX G STEEL AND COMPOSITE BEAM RESULTS FOR
METHODS I AND III WITH h = 1.207 . . . . . . . . . . . . . . . . . . . . . 175

Table
3.0
3.1
3.2
3 3
3.4
35
3.6
3.7
3.8
3.9
3.10
3.11
vii
LEST OF TABLES
Description Page
. . . . . . . . . . . . . . . . . . . . . . . References Corresponding to Beam Designations 53
Materia1 and Section Properties for Steel Beams . . . . . . . . . . . . . . . . . . . . . . . 54
Material and Section Propesties for Composite Beams . . . . . . . . . . . . . . . . . . . 56
. . . . . . . . . . . . . . . . . . . . . . . . . Design Limitation Summary for Steel Beams 60
Design Limitation S u r n m q for Composite Beams . . . . . . . . . . . . . . . . . . . . . 65
Steel Beam Shear Capacity Summary: Method I. h = 1.414 . . . . . . . . . . . . . . . 68
. . . . . . . . . . . Composite Beam Shear Capacity Summary: Method I. h = 1.41 4 69
. . . . . . . . . . . . . . . . . . . . . . Steel Beam Shear Capacity Summary: Method I1 70
Composite Beam Shear Capacity Summary: Method TI . . . . . . . . . . . . . . . . . . 71
. . . . . . . . . . . . . . Sted Beam Shear Capacity Summary: Method III. h = 1.414 72
Composite Beam Shear Capacity Summary: Method IIL h = 1.4 14 . . . . . . . . . . 73
Steel Beam Shear Capacity Summary:
. . . . . . . . . . . . . . . . . . . . . . . . . . . . . . . . . . Redwood and Shrivastava (1980) 74
Composite Bearn Shear Capacity Summary:
. . . . . . . . . . . . . . . . . . . . . . . . . . . . . . . . . Redwood and Poumbouras (1984) 76
. . . . . . . . . . . . . . . . . . . Steel Beam Capacity Summary: Method I. = 1.4 14 77
. . . . . . . . . . . . . . . Composite Beam Capacixy Summary: Method 1. h = 1.414 79
. . . . . . . . . . . . . . . . . . . . . . . . . . . Steel Beam Capacity Summary: Method I1 81
. . . . . . . . . . . . . . . . . . . . . . . Composite Beam Capacity Summary: Method Il 83
. . . . . . . . . . . . . . . . . . Steel Beam Capacity Summary: Method 111. h = 1.414 85
. . . . . . . . . . . . . . Composite Beam Capacity Summary: Method 111. h = 1.414 87
Steel Bean Capacity Summary: Redwood and Shrivastava (1980) . . . . . . . . . . 89


ix
LTST OF TABLES (continued)
Table Description Page
G.6 Steel Beam Capacity Summary. Method Ill. h = 1.207 . . . . . . . . . . . . . . . . . . 182
G.7 Campsite Beam Capacity Summary. Method I. h = 1.207 . . . . . . . . . . . . . . . 184
G S Composite Beam Capacity Summary. Method 111. h = 1.207 . . . . . . . . . . . . . . I 8 6
G.9 AnalysisSumma~.h=1.207(MethodsIandIII) . . . . . . . . . . . . . . . . . . . . . 188
X
LIST OF l?EURES
Figure Description
2.1 Opening CorPZgurations for Steel Beams;
(a) Opening Configuration for an Un~inforced SteeI Beam
(b) Opening Configuration for a Reinforced Steel Beam . .
Page
2,2 Opening configurations for Comp~site Beams;
(a) Opening Configuration for an Urninforced Composite Beam
. . . . . . . . . . . . . . . . . . . . . . . . . . . . . . . . . . . . . . . . . . . with a Solid Slab 101
(b) Opening Configuration for an Unreinforced Composite Beam
with Transverse Ribs . . . . . . . . . . . . . . . . . . . . . . . . . . . . . . . . . . . . . . . . 101
(c) Opening Configuration for a Reinforced Cornpasite Beam
with Longitudinal Ribs . . . . . . . . . . . . . . . . . . . . . . . . . . . . . . . . . . . . . . . . 102
2.3 Cubic Moment-Shear Interaction (Darwin and Donahey 1988) . . . . . . . . . . . . 103
2.4 Forces Acting at a Web Opening (Darwin 1990) . . . . . . . . . . . . . . . . . . . . . . 104
2 5 Normal Forces in a Composite Opening . . . . . . . . . . . . . . . . . . . . . . . . . . . . 105
2.6 Yield Functions for Combined Shear and Normal Stress . . . . . . . . . . . . . . . . . 105
. . . . . . . . . . . . . . . . . 2.7 Stress Distributions for Design Method I (Darwin 1940) 106
2.8 Stress Distributions for Design Methods I1 and III (Darwin 1990) . . . . . . . . . . 106
2.9 Comparison of Yield Functions Considering Practical Restraints . . . . . . . . . . . 107
2.10 Difference between Methods I1 and Ill versus aJs. . . . . . . . . . . . . . . . . . . . . . 107
2.11 Ratio of Methods II and 111 versus ads. . . . . . . . . . . . . . . . . . . . . . . . . . . . . . 108
2.12 Comparison of Methods I and III with and without adjustment
inTeeDcpth . . . . . . . . . . . . . . . . . . . . . . . . . . . . . . . . . . . . . . . . . . . . . . 108
xi
LIST OF FIGURES (continued)
Figure Description
2.13 Steel section in pure bending
(a) Unreinforced Steel Beam in Pure Bending . . . . . .
(b) Reinforced Steel Beam in Pure Bending
Page
. . . 109
with Neutral Axis in Reinforcement . . . . . . . . . . . . . . . . . . . . . . . . . . . . . . 109
(c) Reinforced Steel Beam in Pure Bending
with Neutral Axis in Web . . . . . . . . . . . . . . . . . . . . . . . . . . . . . . . . . . . . . . 109
2.14 Composite section in pure bending
(a) Compesite Beam in Pure Bending with
. . . . . . . . . . . . . . . . . . . . . . . . . . . . . Neutral Axis at or above Steel Flange 110
(b) Composite Beam in Pure Bending with
Neutral Axis in the Steel mange . . . . . . . . . . . . . . . . . . . . . . . . . . . . . . . . . 110
(c) Composite Beam in Pure Bending with
Neutral Axis in Web . . . . . . . . . . . . . . . . . . . . . . . . . . . . . . . . . . . . . . . . . . 110
Legend for Moment . Shear Curves for Figs . 3.1 . 3.85 . . . . . . . . . . . . . . . . . 111
Moment . Shear Interaction Curves for Test B-1 . . . . . . . . . . . . . . . . . . . . . . 112
Moment . Shear Interaction Curves for Test B-2 . . . . . . . . . . . . . . . . . . . . . . 112
Moment . Shear Interaction Curves for Test B-3 . . . . . . . . . . . . . . . . . . . . . . 112
Moment . Shear Interaction Curves for Test B-4 . . . . . . . . . . . . . . . . . . . . . . 112
Moment . Shear Interaction Curves for Test CSK-1 . . . . . . . . . . . . . . . . . . . . 112
Moment . Shear Interaction Curves for Test CRdA . . . . . . . . . . . . . . . . . . . . 112
Moment . Shear Interaction Curves for Test DO-1 . . . . . . . . . . . . . . . . . . . . . 112
Moment . Shear Interaction Curves for Test DO-2 . . . . . . . . . . . . . . . . . . . . . 112

Figure
xii
LIST OF FIGURES (continued)
Description Page
. . . . . . . . . . . . . . . . . . . . . Moment . Shear Interaction Curves for Test DO-3 113
Moment . Shear heraction Curves for Test DO-4 . . . . . . . . . . . . . . . . . . . . . 113
Moment . Shear Interaction Curves for Test DO-5 . . . . . . . . . . . . . . . . . . . . . 113
Moment . Shear Interaction Curves for Test RBD-R1 . . . . . . . . . . . . . . . . . . . I13
Moment . Shear Interaction Curves for Test RBD-R2 . . . . . . . . . . . . . . . . . . . 113
Moment . Shear Intemczion Cusves for Test RM-2F . . . . . . . . . . . . . . . . . . . . 113
Moment . Shear Interaction Curves for Test RM4F . . . . . . . . . . . . . . . . . . . . 113
Moment . Shear Interaction Curves forTest RM4R . . . . . . . . . . . . . . . . . . . 113
Moment . Shear Interaction Curves for Test M - 1 IH . . . . . . . . . . . . . . . . . . 114
Moment . Shear Interaction Curves for Test M - 2 1H . . . . . . . . . . . . . . . . . . 114
Moment . Shear Interaction Cusves for Test CZ-4B . . . . . . . . . . . . . . . . . . . . 114
Moment . Shear Interaction Curves for Test CS-E . . . . . . . . . . . . . . . . . . . . . 114
Moment . Shear Interaction Curves for Test CS-2 . . . . . . . . . . . . . . . . . . . . . 114
Marnem . Shear Interaction Curves for Test CS-3 . . . . . . . . . . . . . . . . . . . . . 114
Moment . Shear Interaction Curves for Test CSK-2 . . . . . . . . . . . . . . . . . . . . 114
Moment . Shear Interaction Curves for Test CSK-5 . . . . . . . . . . . . . . . . . . . . 114
Moment . Shear Interaction Curves for Test CSK-6 . . . . . . . . . . . . . . . . . . . . 115
Moment . Shear Interaction Curves for Test CSK-7 . . . . . . . . . . . . . . . . . . . . 115
Moment . Shear Interaction Curves for Test CR-3A . . . . . . . . . . . . . . . . . . . . 115
Moment . Shear Interaction Curves for Test CR-3B . . . . . . . . . . . . . . . . . . . . 115
. . . . . . . . . . . . . . . . . . . . . Moment Shear Interaction Curves for Test CR4A 115
Moment . Shear Interaction Curves for Test CR43 . . . . . . . . . . . . . . . . . . . . 115
Figure
331
3.32
3.33
3.34
3.35
3.36
337
3-38
3.39
3.40
3.41
3.42
3.43
3.44
3.45
3.46
3.47
3.48
3.49
3.50
3.51
3.52
xiii
LIST OF FIGURES (continued)
Description Page
Moment . Shear Interaction Curves for Test CR-SA . . . . . . . . . . . . . . . . . . . . 215
Moment . Shear Interaction Cuwes for Test CR-I A . . . . . . . . . . . . . . . . . . . . 115
IMornent . Shear Interaction Curves far Test CR-2A . . . . . . . . . . . . . . . . . . . . 116
Moment . Shear heraction Curves for Test CR-2B . . . . . . . . . . . . . . . . . . . . 116
Moment . Shear Interaction Curves for Test CR-2C . . . . . . . . . . . . . . . . . . . . 116
Moment . Shear Interaction Curves for Test (33-2D . . . . . . . . . . . . . . . . . . . . 116
Moment . Shear hteraction Cutves for Test CR-TB . . . . . . . . . . . . . . . . . . . . I16
Moment . Shear Intemctioo Curves for Test CR-7D . . . . . . . . . . . . . . . . . . . . 116
. . . . . . . . . . . . . . . . . . . . . . Moment Shear Interaction Curves for Test RL-5 216
. . . . . . . . . . . . . . . . . . . . . . Moment Shear Interaction Curves for Test K - 6 116
. . . . . . . . . . . . . . . . . . . . Moment Shear Interaction Curves for Test RB D-C I 117
. . . . . . . . . . . . . . . . . . . . Moment Shear Interaction Curves for Test RM- 1A 117
. . . . . . . . . . . . . . . . . . . . Moment Shear Interaction Curves for Test RM-2A 117
. . . . . . . . . . . . . . . . . . . . Moment Shear Interaction Cusves for Test M - 2 C 117
Moment . Shear Enteraction Curves for Test RM3A . . . . . . . . . . . . . . . . . . . 117
Moment . Shear Interaction Curves for Test M 4 A . . . . . . . . . . . . . . . . . . . 117
Moment . Shear Intemction Curves for Test M 4 C . . . . . . . . . . . . . . . . . . . 117
Moment . Shear Interaction Curves for Test M - I B . . . . . . . . . . . . . . . . . . . 117
Moment . Shear Interaction Curves for Test RM-2B . . . . . . . . . . . . . . . . . . . 118
Moment . Shear Interaction Curves for Test Rhf-4B . . . . . . . . . . . . . . . . . . . 118
Moment . Shear Interaction Curves for Test D-1 . . . . . . . . . . . . . . . . . . . . . . 119
Moment . Shear Interaction Curves for Test D-2 . . . . . . . . . . . . . . . . . . . . . . 119
Figure
353
354
3.55
3.56
3.57
3.58
3.59
3.60
3.61
3.62
3.63
3-64
3.65
3.66
3.67
3*68
xiv
LIST OF FIGURES (continued)
Description Page
Moment . Shear Interaction Curves for Test D-3 . . . . . . . . . . . . . . . . . . . . . . 119
Moment . Shear Interaction Curves for Test D-5A . . . . . . . . . . . . . . . . . . . . . 119
Moment . Shear Interaction awes for Test D-5B . . . . . . . . . . . . . . . . . . . . . 119
Moment . Shear Interaction Curves for Test D-6A . . . . . . . . . . . . . . . . . . . . . I19
Moment . Shear Interaction Curves for Test D-6B . . . . . . . . . . . . . . . . . . . . . 119
Moment . Shear Interaction Curves for Test D-7A . . . . . . . . . . . . . . . . . . . . . 119
Moment . Shear Interaction Curves for Test D-7B . . . . . . . . . . . . . . . . . . . . . 120
Moment . Shear Interaction CElsves for Test D-8A . . . . . . . . . . . . . . . . . . . . . 120
Moment . Shear Interaction Curves for Test D-9A . . . . . . . . . . . . . . . . . . . . . 120
Moment . Shear Interaction Curves for Test D-9B . . . . . . . . . . . . . . . . . . . . . 120
Moment . Shear Interaction Curves for Test R-0 . . . . . . . . . . . . . . . . . . . . . . 120
Moment . Shear Interaction Curves for Test R-1 . . . . . . . . . . . . . . . . . . . . . . 120
Moment . Shear Tnteractjon Curves for Test R-2 . . . . . . . . . . . . . . . . . . . . . . 120
Moment . Shear Interaction Curves for Test R-3 . . . . . . . . . . . . . . . . . . . . . . 120
Moment . Shear Interaction &mes for Test R-4 . . . . . . . . . . . . . . . . . . . . . . 121
Moment . Shear Interaction Curves for Test R-5 . . . . . . . . . . . . . . . . . . . . . . 121
. . . . . . . . . . . . . . . . . . . . . . 3.69 Moment . Shear Interaction Curves for Test R-6 121
3.70 Moment . Shear Interrtction Curves for Test R-7 . . . . . . . . . . . . . . . . . . . . . . 121
3.71 Moment . Shear Tntemction Curves for Test R-8 . . . . . . . . . . . . . . . . . . . . . . 121
3.72 Moment . Shear Interaction Curves for Test C-1 . . . . . . . . . . . . . . . . . . . . . . 121
3.73 Moment . Shear Interaction Curves for Test C-2 . . . . . . . . . . . . . . . . . . . . . . 121
3.74 Moment . Shear Interaction Cusvcs for Test C-3 . . . . . . . . . . . . . . . . . . . . . . 121

Figure
3.7s
3.76
3.77
3.7s
3.79
3.80
3.81
3.82
3.83
3.84
3.85
3.86
3.87
xv
LIST OF FIGURES (continued)
Description Page
Moment . Shear Interaction Curves for Test C-4 . . . . . . . . . . . . . . . . . . . . . . I22
Moment . Shear Interaction Curves for Test C-5 . . . . . . . . . . . . . . . . . . . . . . 122
Moment . Shear Interaction Curves for Test C-6 . . . . . . . . . . . . . . . . . . . . . . 122
Moment . Shear Interaction Curves for Test G-1 . . . . . . . . . . . . . . . . . . . . . . 122
Moment . Shear Interaction Curves for Test G-2 . . . . . . . . . . . . . . . . . . . . . . 122
Moment . Shear Interaction Curves for Test (330-3 . . . . . . . . . . . . . . . . . . . . 122
Moment . Shear Interaction Curves for Test CHO-4 . . . . . . . . . . . . . . . . . . . . 122
Moment . Shear Interaction Curves for Test CHO-5 . . . . . . . . . . . . . . . . . . . . 122
Moment . Shear Interaction Curves for Test CHO-6 . . . . . . . . . . . . . . . . . . . . 123
Moment . Shear Interaction Curves for Test CHO-7 . . . . . . . . . . . . . . . . . . . . 123
. . . . . . . . . . . . . . . . . . . . Moment . Shear Interaction Curves for Test WSE-l 123
Difference Between Methods I and 111 versus At/ A, . . . . . . . . . . . . . . . . . . . 124
Linear Moment-Shear Interaction Curve
(Redwood and Shrivastava 1980) . . . . . . . . . . . . . . . . . . . . . . . . . . . . . . . . . 125
Curvilinear Moment-Shear Interaction Curve
. . . . . . . . . . . . . . . . . . . . . . . . . . . . . . . . . (Redwood and Shrivastava 1980) 126
Comparison of Method III with Test Results
for Steel Beams . . . . . . . . . . . . . . . . . . . . . . . . . . . . . . . . . . . . . . . . . . . . . 127
Comparison of Method I11 with Test Results
. . . . . . . . . . . . . . . . . . . . . . . . . . . . . . . . . . . . . . . . . for Composite Beams 128
Limits on Opening Dimensions. a. /ho versus h. /d Darwin 1990) . . . . . . . . . . 151
. . . . . . . . . . . . . . D.2 Limits on Opening Dimensions. a. /s. versus ao/sb. po = 5.6 152


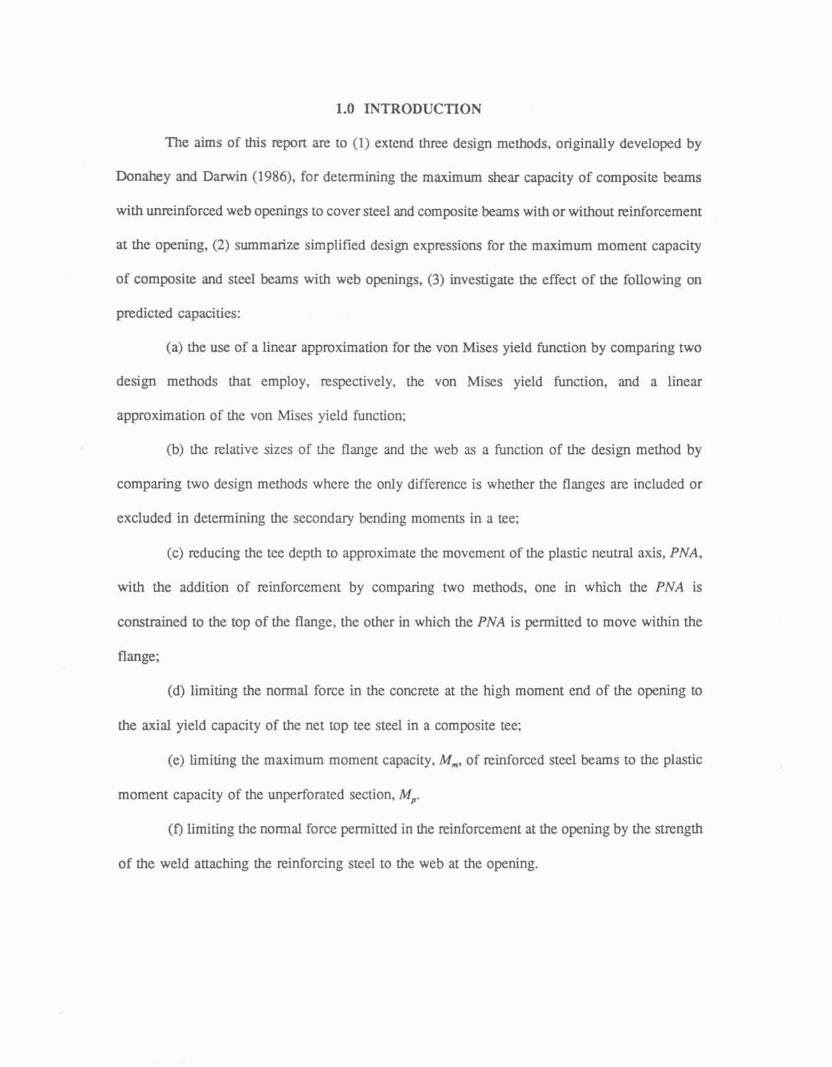
1.0 INTRODUCTION
The aims of this repon are to (1) extend three design methods, originally developed by
Donahey and Danvin (1 986), for determining the maximum shear capacity of composite beams
with unreinforced web openings to cover steel and composite beams with or without reinforcement
at the opening. (2) summarize simplified design expressions for the maximum moment capaciw
of composite and steel beams with web openings, (3) investigate the effect of the following on
predicted capacities:
(a) the use of a linear approximation for the yon Mises yield function by comparing two
design methods that employ, respectively, the von Mises yield function. and a linear
approximation of the yon Miscs yield function;
(b) the relative sizes of h e flange and the web as a function of the design method by
comparing two design methods where the only difference is whether the flanges are included or
excluded in determining the secondary bending moments in a tee;
(c) reducing the tee depth to approximate the movement of the plastic neutral axis, PNA,
with the addition of reinforcement by comparing two methods, one in which &e PNA is
constrained to the top of the flange, the other in which the PNA is permitted to move within the
flange;
(d) limiting the normal force in the concrete at the high moment end of the opening to
the axial yield capacity of the net top tee steel in a composite tee;
(e) limiting the maximum moment capacity, M,, of reinforced steel beams to ~e plastic
moment capacity of the unperforated section. M,.
( f ) limiting the normal force permitted in the reinforcement at the opening by the strength
of the weld attaching the seinforcing steel to the web at me opening.

2
(4) compase the accuracy and ease of application of the three methods with procedures proposed
by Redwood and Shrivastava (1980), Redwood and P o u m b u n s (1984), and Redwood and Cho
(19861, and (5) calculate resistance factors, 9, for use in load and resistance factor design of
structuraf steel buildings.
Comparisons are made with experimental results of thirty-five composite beams and fifty
steel beams. The methods for shear and moment capacity found in Section 2.0 are compand with
results obtained using procedures proposed by Redwood and Shrivastava (1980) for steel beams
and with resuIts published by Redwood and Shrivastava (1980), Redwood and Poumburas (1984),
and Redwood and Che (1986) for composite beams with ribkd slabs, and composite beams with
soIid slabs, respective1 y.
3
2.0 STRENGTH DESIGN PROCEDURES
2.1 Overview of Design Procedures
In this section, the three design methods proposed by Donahey and Darwin (1986) for
determining the maximum shear capacity, V,, of cornposi te beams with unreinforced web openings
are modified to account for in for cement at the opening and extcnded to cover steel kams.
Design expressions for the maximum moment capacity, Mm, of composite and steel beams, with
or without reinforcement, are also presented, as are the procedures for moment-shear interaction
proposed by Donahey and Dawin (1986).
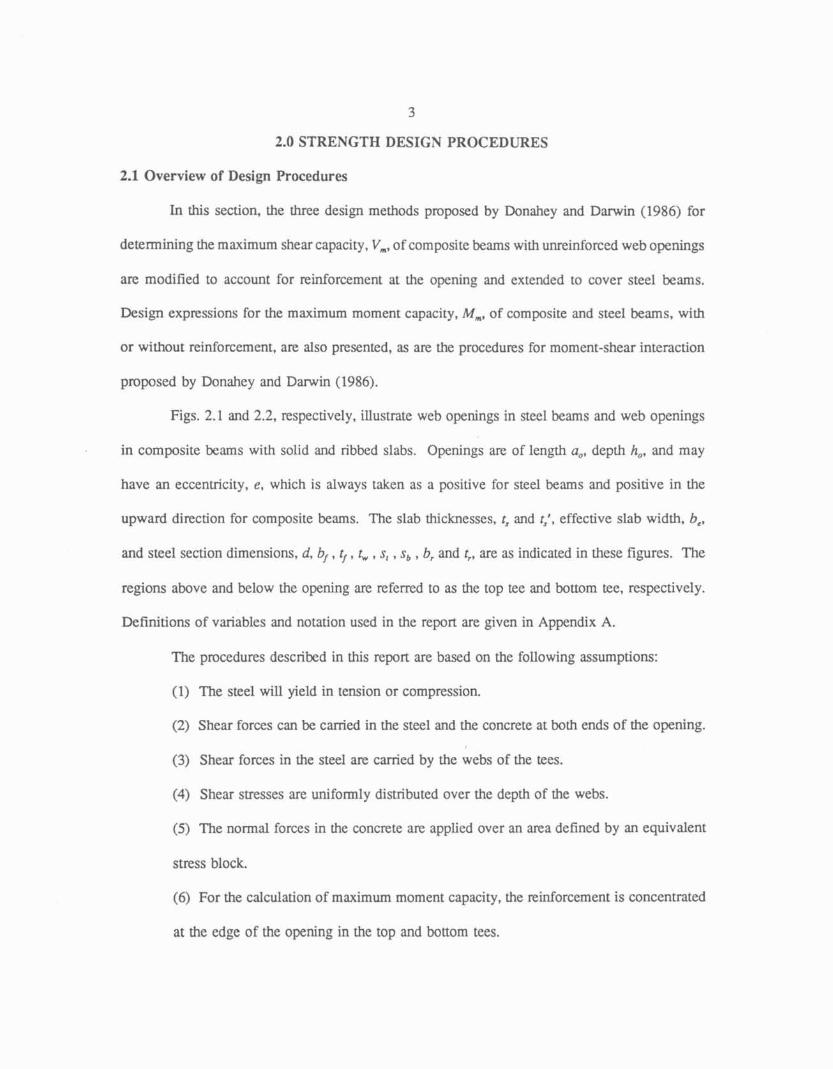
Figs. 2.1 and 2.2, respectively, illustrate web openings in stcel beams and web openings
in composite bems with solid and ribbed slabs. Openings are of length a,, depth h,, and may
have an eccentricity, e, which is always taken as a positive for steeI beams and positive in the
upward direction for composite beams. The slab thicknesses. r, md r,', effective slab width, b,,
and steel section dimensions, d, bf , tf , t, , s, , sb , b, and t,, are as indicated in these figures. The
regions above and below the opening are referred to as the top tee and bomm tee, respectively.
Definitions of variables and notation used in the report are given in Appendix A.
The procedures descrikd in this report are based on the following assumptions:
(1) The steel will yield in tension or compression.
(2) Shear forces can be carried in the steel and the concrete at both ends of the opening.
(3) Shear forces in the steeI are carried by the webs of the tees.
(4) Shear stresses are uniformIy distributed over the depth of the webs.
(5) The normal forces in the concrete are applied over an area defined by an equivalent
stress block.
(6) For the calculation of maximum moment capacity, the reinforcement is concentrated
at the edge of the opening in the top and bottom tees.
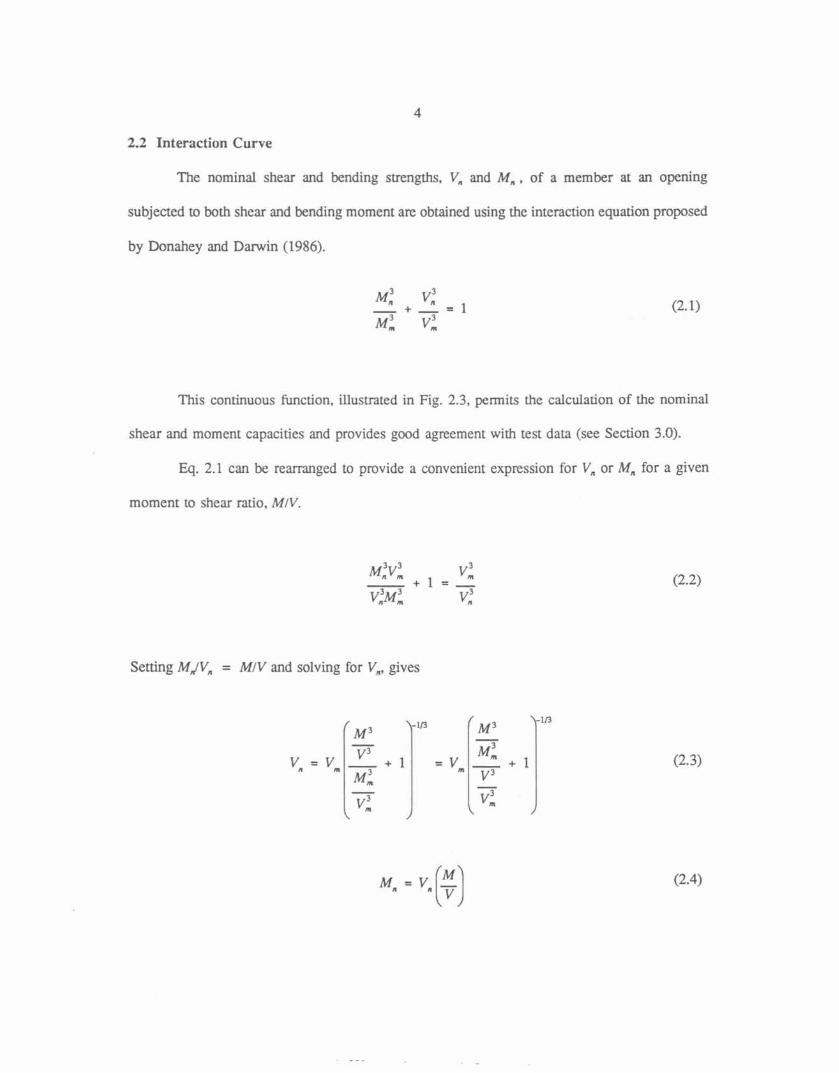
2.2 Interaction Curve
The nominal shear and bending strengths. V, and M,, of a member at an opening
subjected to b t h shear and bending moment are obtained using the interaction equation proposed
by Donahey and Darwin (1986).
This continuous function, iIlustrated in Fig. 2.3, permits the calculation of the nominal
shear and moment capacities and provides good agreement w i h test data (see Section 3.0).
Eq. 2.1 can be reasranged to provide a convenient expression for V, or Mn for a given
moment to shear ratio, MIV.
Setting MJV, = MIV and solving for Vn. gives
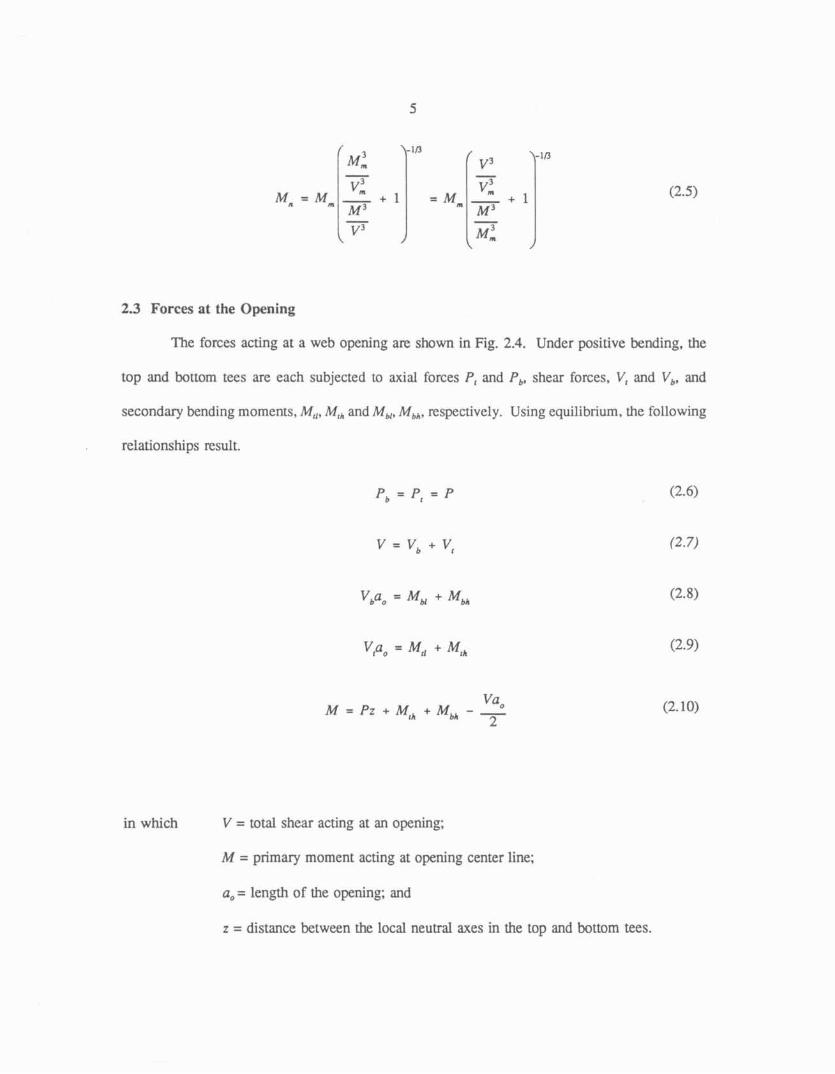
2.3 Forces at the Opening
The forces acting at a web opening are shown in Fig. 2.4. Under positive bending, the
top and bottom tees an: each subjected to axial forces P, and P,, shear forces, V, and V,, and
secondary bending moments, M , , M,, and M,,, M,,, respectively. Using equilibrium, the following
relationships result.
in which V = total shear acting at an opening;
M = primary moment acting at opening center line;
a, = length of the opening; and
z = distance between the local neutrd axes in the top and bottom tees.
2.4 Shear Capacity Equations
In this section, the three design methods, developed by Donahey and Damin (1986) to
predict the maximum shear capacity of composite beams with mreinforced web openings, are
extended to cover both steel and composite hams with or without reinforcement at She opening.
Theoretical differences between the methods and limitations of the methods are discussed.
A closed-form solution for the maximum shear capacity at a web opening requires the use
of several simplifying a?sumptions. Three closed-form solutions for the maximum shear capacity
are derived, each simpler than the previous one. These closed-form solutions, hereafter referred
to as Methods I, 11, and 111, are based on the assumption that the normal forces in the top and
bottom tees is zero. As discussed by Qawson and Darwin (1980) and Donahey and Darwin
(19861, this Ioad stare only approximates pure shear at the opening in composite beams because
the secondary bending moments at the high and low moment ends of the top tee are not equal.
As a result, the total moment at the opening center line is cIose to, but not equd to zero. The
procedute, however, does represent pure shear in steel beams and gives a close appmximation of
the me maximum shear maximum capacity at web openings in composite beams.
The approach that is taken in the following sections is to develop an expression for the
maximum shear capacity of the most general case, a top tee in a composite beam with a reinforced
opening. The capacity of the other tees, top or bttom, can lx obtained from the general case by
neglecting appropriate terms in the expressions. The total shear capacity at an opening is obtained
by summing the shear strengths of the top and bottom tees.

7
2.4.1. Forces in the Concrete and Steel
Normal forces in a composite tee are illustrated in Fig. 2.5. For composite beams, the
normal force in the concrete at the high moment end of the opening, PC,, is limited by the
compressive strength of the concrete, the shear connector capacity, and the tensile suength of the
top-tee steel. These limitations are expressed as follows.
in which t, = t, for solid slabs;
= t,' for ribbed slabs with mansvene ribs;
= (t, + t,')/2 for ribbed slabs with longitudinal ribs;
= concrete compressive strength, ksi;
= shear connector capacity accounting for appropriate reduction factor for
ribbed slabs;
= area of top tee steel, including reinforcement; and
= number of shear connectors from high moment end of opening to the
support.

8
Fig. 2.5 shews the location of the concrete normal forces. Shear smsses are assumed to
have no effect on the normal stresses in the concrete at the maximum load.
The concrete force at the low moment end of the tee. PC,, is dependent upon the number
of shear connectors over the opening, No, and the high moment end concrete force, PC,.
No and N include only the shear connectors entirely within the opening. Connectors at the edge
of the high-moment end of the opening are not included.
The moment arms of the high moment end and low moment end concrete forces about
the top of the steel fIange, d, and d,, respectively, are given by the foIlowing equations.
For solid slabs,
For ribbed slabs with transverse ribs,
For ribbed slabs with longitudinal: ribs, d, is the distance from the top of the flange to the centroid
of the compre~sior~ force in the concrete. Only the ribs h a t lie within the effective width, b,, are
considered for this calculation. A conservative estimate of dl can be obtained by treating the sum
of the minimum widths of the ribs that lie within the effective width of the slab as b,.
9
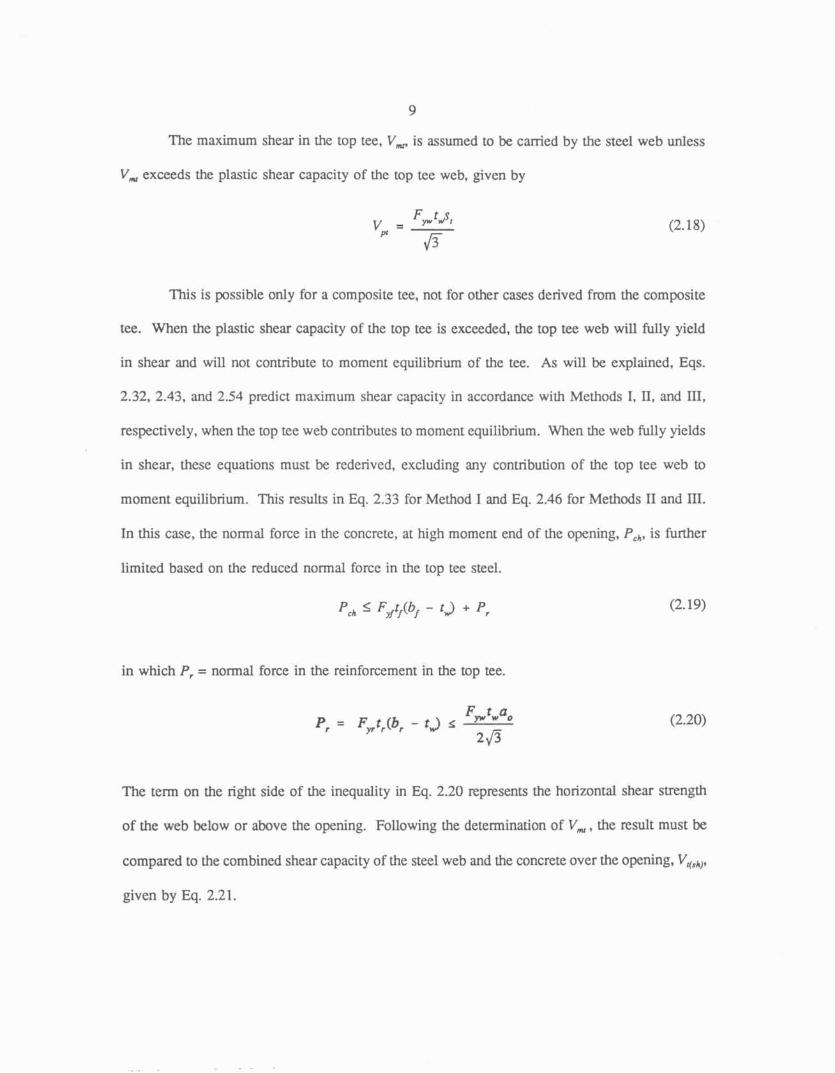
The maximum shear in the top tee, V,, is assumed to be carried by the steel web unIess
V , exceeds the plastic shear capacity of she top tee web, given by
This is possible only for a composite tee, not for other cases derived from the composite
tee. W e n the plastic shear capacity of the sop tee is exceeded, the top tee web will fully yield
in shear and will not contribute to moment equilibrium of the tee. As will 'be explained, Eqs.
2.32, 2.43, and 2.54 predict maximum shear capacity in accordance with Methods I, 11, and 111.
respectively, when the top tee web contributes to moment equilibrium. When the web f i l ly yields
in shear, these equations musr be rederived, excluding any contribu~on of the top tee web to
moment equilibrium. This results in Eq. 2.33 for Method I and Eq. 2.46 for Meshods I1 and 111.
In this case, the normal force in the concrete, at high moment end of the opening, PC,, is further
limited based on the reduced normal force in the top tee steel.
in which P, = noma1 force in the reinforcement in the top tee.
P, = F,,f (b, - tJ s F,*,Q, 2 f i
The term on the right side of the inequality in Eq. 2.20 represents the horizontal shear strength
of the web below or above the opening. Following the determination of V,, the result must be
compared to the combined shear capacity of the steel web and the concrete over the opening, VdSh,,
given by Eq. 2.21.
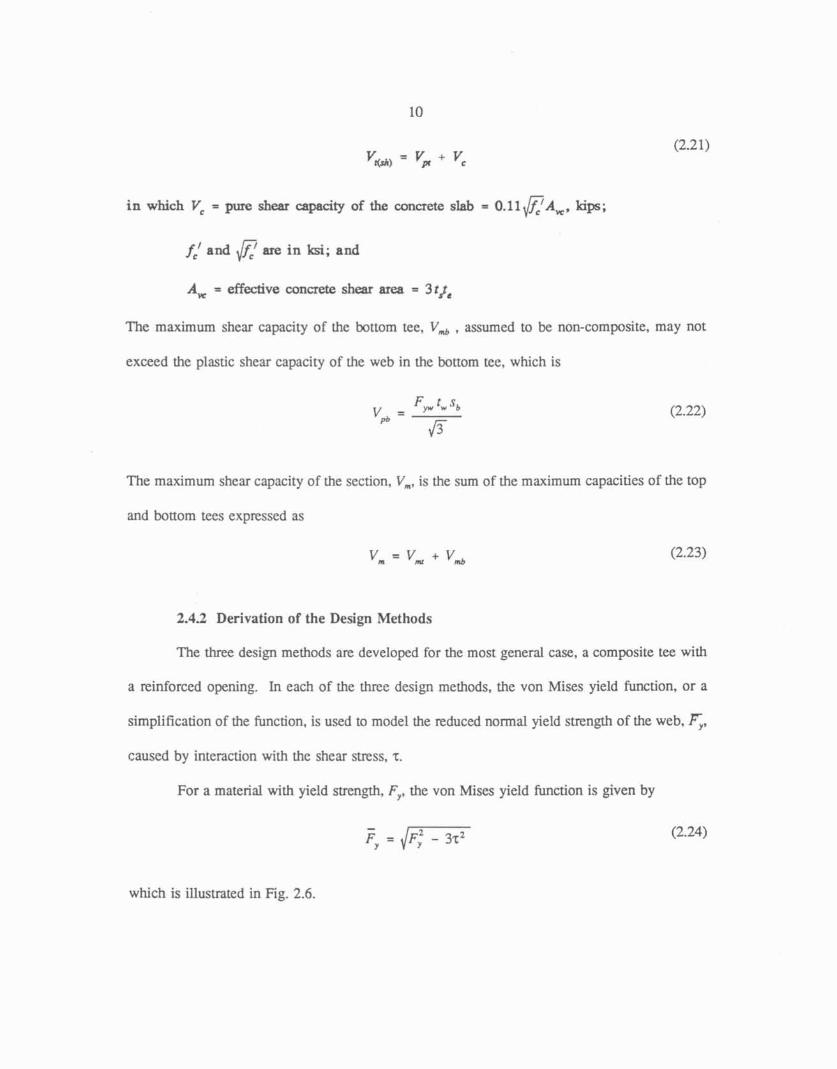
VW) = v, + V,
in which V, = pure shear -city of the concrete slab = 0 . 1 1 ~ ~ ~ . kip;
f,' and fl me in lai; and
A, = effective concrete shear area = 3 t ~
The maximum shear capacity of the bottom tee, V , , assumed to be non-composite, may not
exceed the plastic shear capacity of the web in the bottom tee, which is
The maximum shear capacity of the section, V,, is the sum of the maximum capacities of the top
and bottom tees expressed as
2.42 Derivation of the Design Methods
The three design methods are developed for the most general case, a composite tee with
a reinforced opening. In each of the three design methods, the von Mises yield function. or a
simplification of the function, is used to model the reduced normal yield strength of the web. 5,
caused by interaction with the shear stress, T.
For a material with yield strength. F,, the von Mises yield function is given by
which is iIlustrated in Fig. 2.6.
11
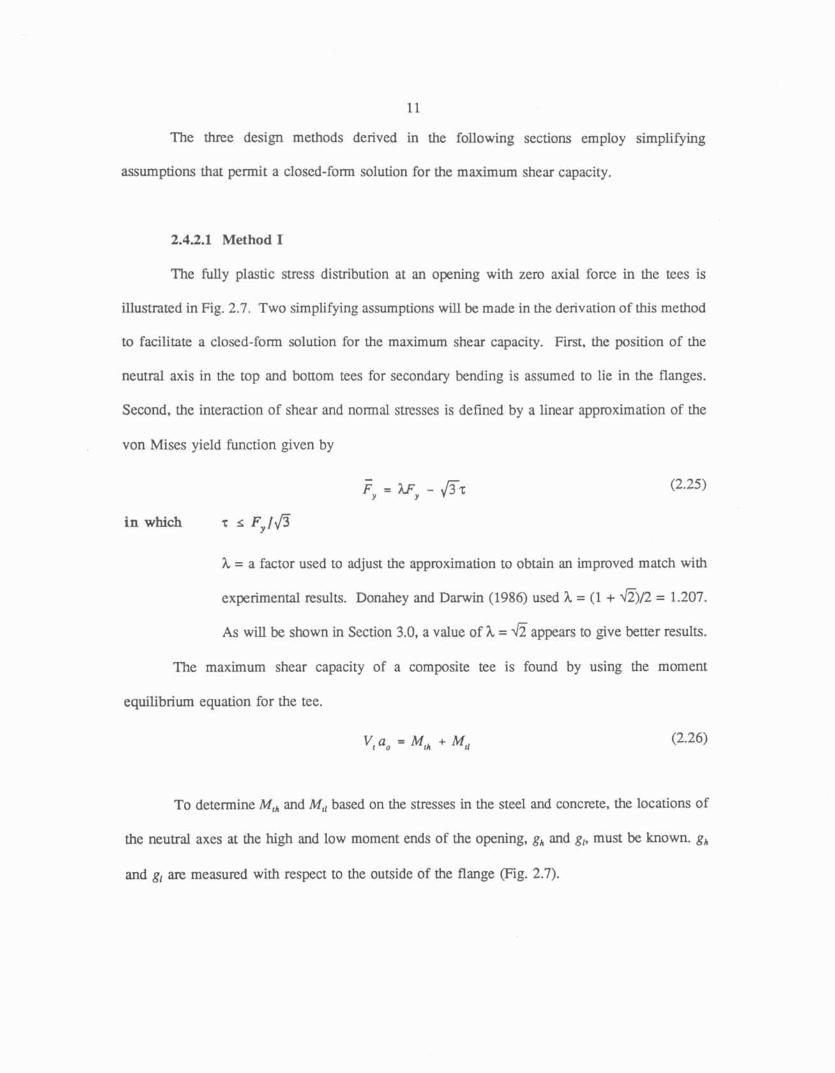
The three design methods derived in the following sections empIoy simpIiQing
assumptions that permit a cIosed-form solution for the maximum shear capacity.
2.42.1 Method I
The fully plastic s t m s distribution at an opening with zero axial force in the tees is
illustrated in Fig. 2.7. Two simplifying assumptions wdl be made in the derivation of this method
to facilitate a closed-form solution for the maximum shear capacity. First, the position of the
neutral axis in the top and bottom tees for secondary bending is assumed 'to lie in the flanges.
Second, the interaction of shear and normal stresses is defined by a linear approximation of the
von Mises yield fbnction given by
h = a factor used to adjust the approximation to obtain an improved match with
experimental results. Donahey and Darwin (1986) used h = (1 + @/'2 = 1.207.
As will be shown in Section 3.0, a value of h = fi appears to give better results.
The maximum shear capacity of a composite tee is found by using the moment
equilibrium equation for the tee.
To determine M,, and M,, based on the stresses in the steeI and concrete, the locations of
the neutral axes at the high and low moment ends of the opening, g, and g,, must be known. g,
and g, are measured with respect 20 the outside of the flange @g. 2.7).
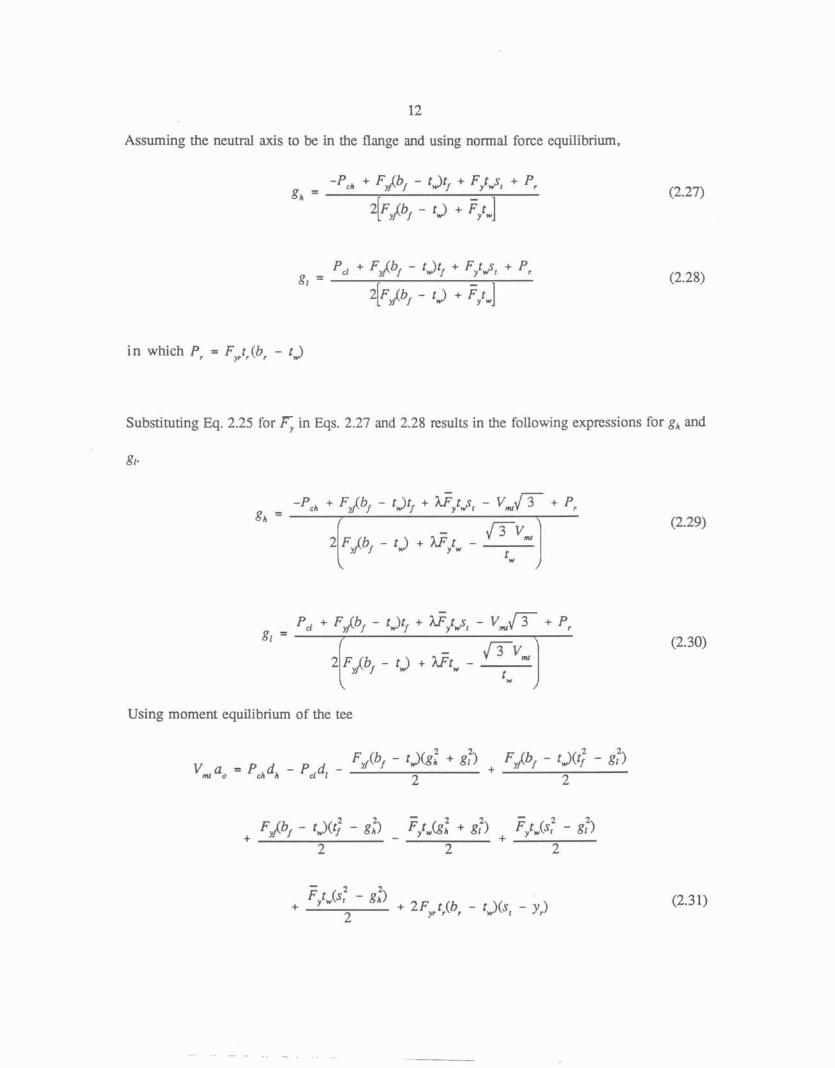
Assuming the neutral axis to k in the flange and using normal force equilibrium,
i n which PI = Fyrt,(b, - tJ
Substituting Eq. 2.25 for F; in Eqs. 2.27 and 2.28 results in the following expressions for gh and
g,,
Using moment equilibrium of the tee
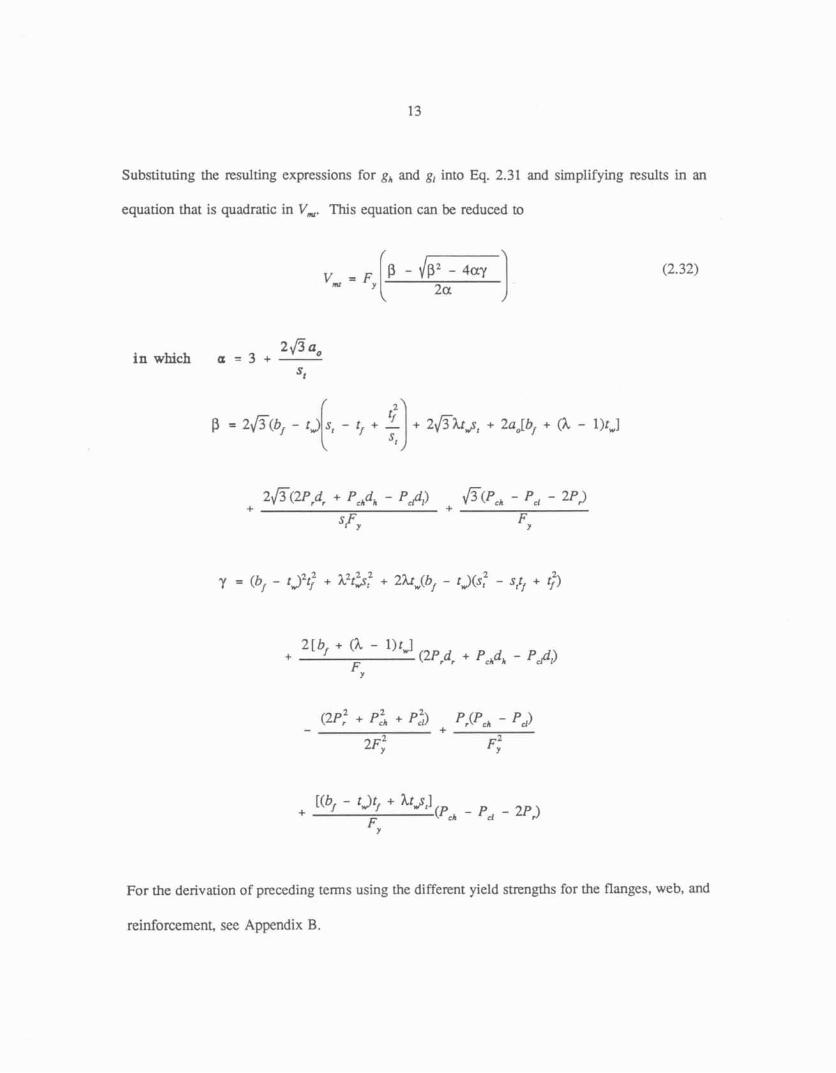
Substituting the resulting expressions for g, and g, into Eq. 2-31 and simplifying results in an
equation that is quadratic in V,. This equation can k reduced u>
For the derivation of preceding terms using the different yield strengths for the flanges, web, and
reinforcement see Appendix B.
14
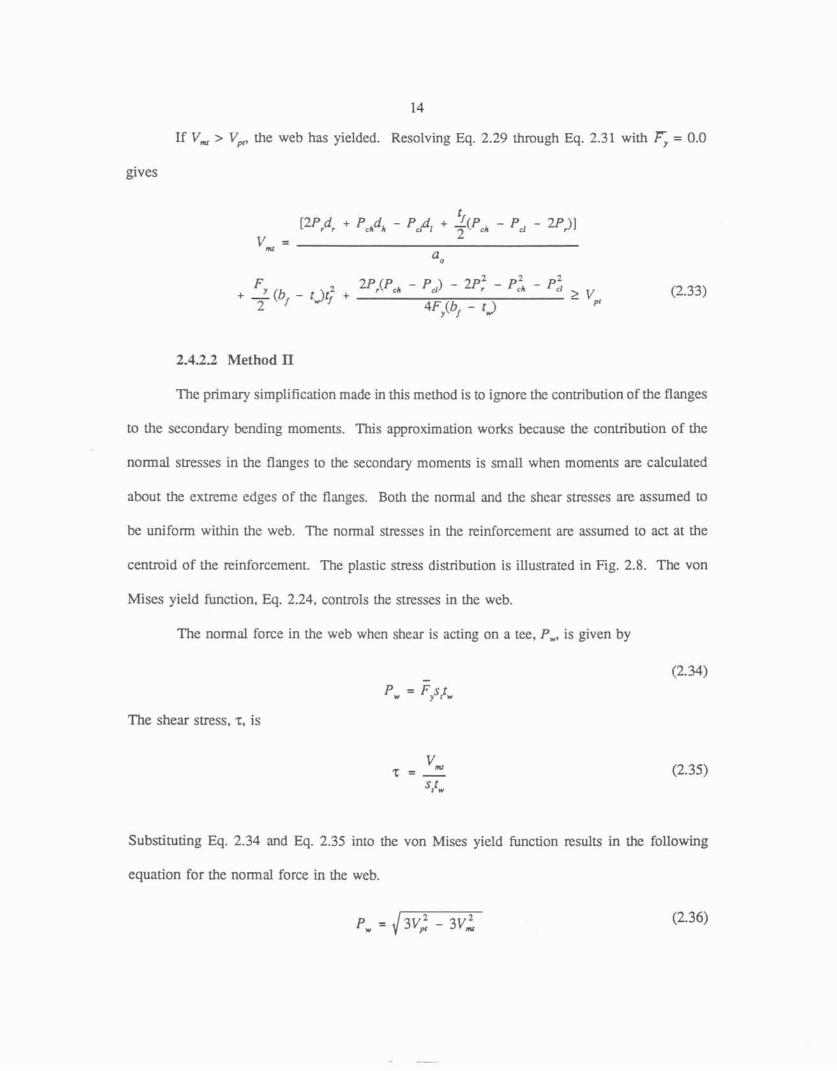
If V, > V,, the web has yielded. Resolving Eq. 2.29 through Eq. 2.31 with = 0.0
gives
2.4.22 Method ll
The primary simplification madc in this method is to ignore the conribution of the flanges
to the secondary bending moments. This approximation works kcause the contribution of the
normal stresses in the flanges to the secondary moments is small when moments are calculated
about the extreme edges of the Ranges. Both the normal and the shear smsses are assumed to
be uniform within the web. The normaI stresses in the reinforcement are assumed to act at the
centroid of the reinforcement. The plastic stress distribution is illustrated in Fig. 2.8. The van
Mises yield function, Eq. 2.24, controls the stresses in the web.
The normal force in the web when shear is acting on a tee, P,, is given by
The shear stress, z, is
Substituting Eq. 2.34 and Eq. 2.35 into the von Mises yidd function results in the following
equation for the normal force in the web.
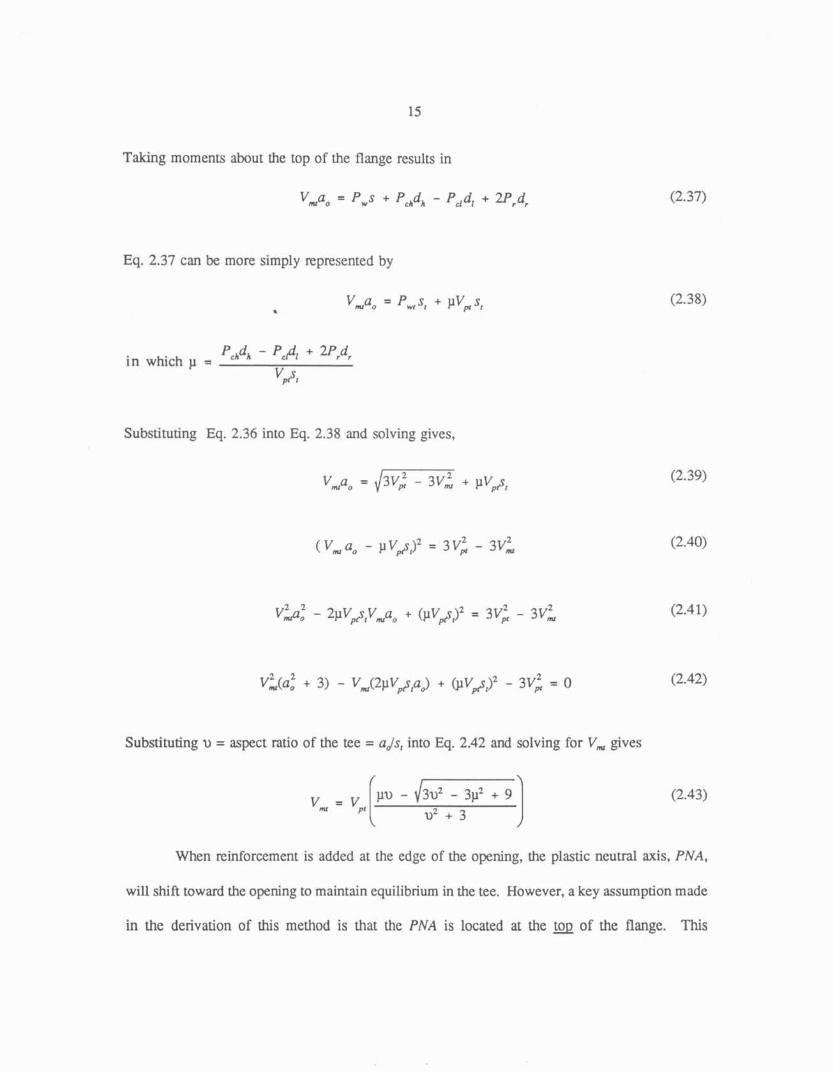
Taking moments about the top of the flange results in
V,ao = P,s +Pchdh - P c , d , + 2Prd,
Eq. 2.37 can be more simpIy represented by
Vmmo = PwrS, + P V ~ J , *
in which p = P c ~ d ~ - PCP, + 2Prdr Vp,s,
Substituting Eq. 2.36 into Eg. 2.38 and solving gives,
Substituting u = aspect ratio of the tee = ads, into Eq. 2.42 and solving for V, gives
When reinforcement is added at the edge of the opening, the pIastic n e u t d axis, PNA,
will shift toward the opening to maintain equilibrium in the tee. However, a key assumption made
in the derivation of this method is that the PNA is located at the top of the flange. This

16
assumption becomes increasingly unconsentative as more reinforcement is added. An adjustment
can be made to approximate the true movement of the PNA by reducing the effective depth of the
steel tee, in the calmtation of u, by a distance which is proportional to the amount of
reinforcement present.
Ar in which; = s - - 2bs
The procedure to approximate the movement of the PNA is discussed in greater detail in Section
2.4.3.2.
When V , exceeds the plastic shear capacity of the web, V,,, an ahemate determination of
maximum shear capacity is necessary because the web has yielded in shear. In this case, P, =
0.0 and Eq. 2.38 gives
Solving for V, gives
in which p is defined in Eq. 2-38 and u = ads. adjustment is necessary in s for Eq. 2.46,
when reinforcement is presenz
17
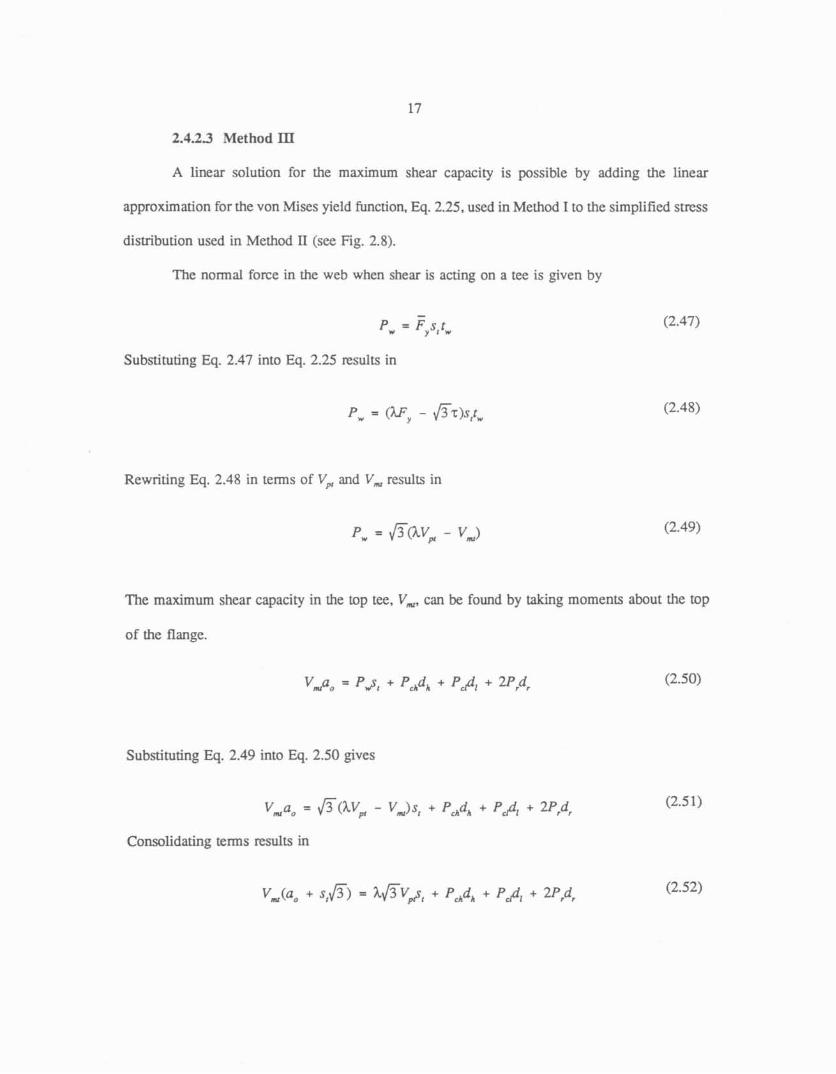
2.423 Method III
A linear solution for the maximum shear capacity is possible by adding the linear
approximation for the von Mises yield function, Eq. 2.25, used in Method I to the simplified stress
distribution used in Method I1 (see Fig. 2.8).
The normal force in the web when shear is acting on a tee is given by
pW = Fys,tw
Substituting Eq. 2.47 into Eq. 2.25 results in
Rewriting Eq. 2.48 in terms of V , and V , results in
The maximum shear capacity in the top tee, V,, can be found by taking moments about the top
of the flange.
Substituting Eq. 2.49 into Eq. 2.50 gives
V,no = 6(hvP - V_)s, + P,dk c PC#, r 2P,dr
ConsoIidating terms results in
18
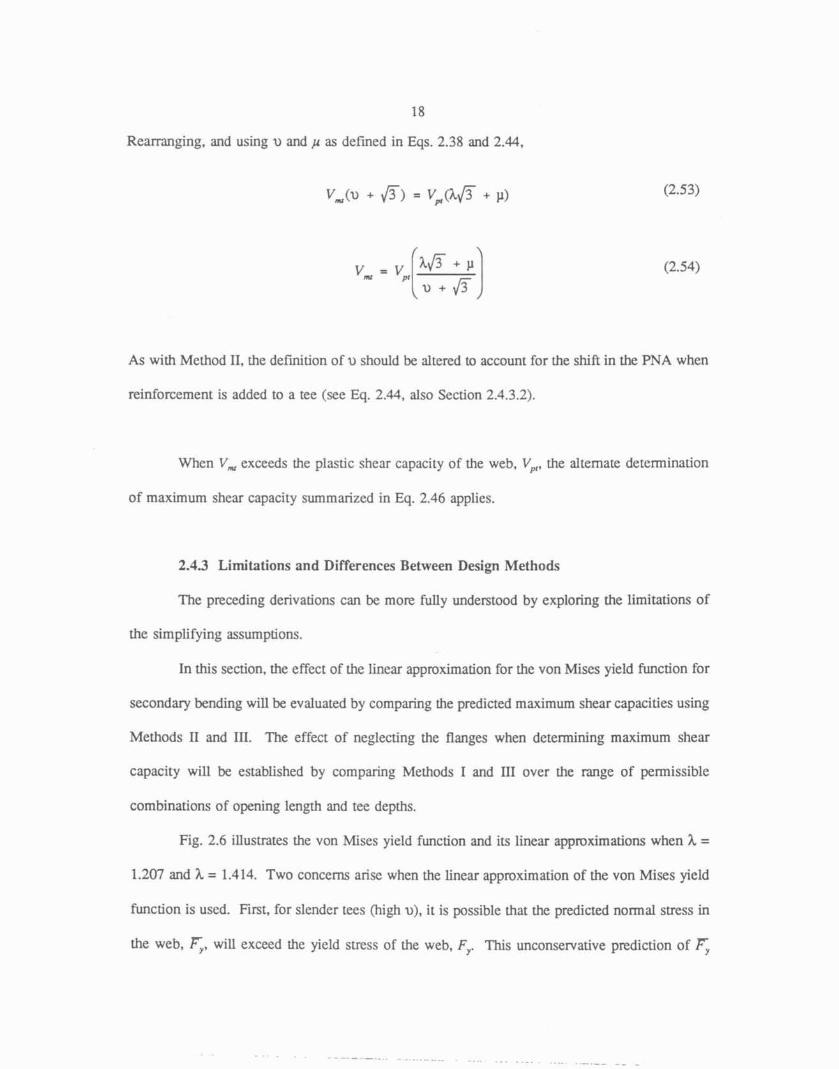
Rearranging. and using u and p as defined in Eqs. 2.38 and 2.44,
As with Method 11, the definition of u shodd be altered to account for the shift in the PNA when
reinforcement is added to a tee (see Eq. 2.44, also Section 2.4.3.2).
When V , exceeds the plastic shear capacity of the web, V,,, the alternate determination
of maximum shear capacity summarized in Eq. 2.46 applies.
2-43 Limitations and Differences Between Design Methods
The preceding derivations can be more fufulIy understood by exploring the limitations of
the simplibing assumptions.
En this section, the effect of the Iinear approximation for the von Mises yield function for
secondary bending will be evaluated by compating the predicted maximum shear capacities using
M e ~ o d s II and 111. The effect of neglecting the flanges when determining maximum shear
capacity will be established by comparing Methods I and III over the range of pennissibIe
combinations of opening length and tee depths.
Fig. 2.6 Iustsates the von Mises yield funchon and its Iinear approximations when h =
1.207 and h = 1.414. Two concerns arise when the linear approximation of the von Mises yield
function is used. First, for slender tees (high u), it is possible that the predicted normal stress in
the web, Fy, will exceed the yield stress of the web, F;, This unconsewative prediction of 5
19
results in a Iess conservative and potentidy unconservative prediction of the maximum shear
capacity when using Methods I and HI, compared to the maximum shear capacity predicted by
Method 11. Second, for stocky tees (low u), it is possible that the predicted shear stress in the
web, T, will exceed the shear stress predicted by the von Mises yield function. This will also
result in less consewative predictions of maximum shear capacity for Methods I and III compared
to Method 11.
2.43.1 Effect of the Linear Approximation of the von Mises Yield Function
The linear approximation of the von Mises yield function allows the normal stress in &e
web, 5, to be overpredicted by as much as 41 % when h = 1.41 4, as indicated in Fig. 2.9, which
is a comparison of yield functions considering practical restraints. While this large averprediction
is possible, the practical maximum stress predicted by the linear yield function is 1.236FY when
u is limited to 12.0 and h = 1.414 (see Appendix C). At this same practical maximum. for an
unreinfarced tee, Method III predicts a maximum shear capacity that exceeds that predicted by
Method TI by 24.5%, while the absolute difference between Methods II and III is 3.5% of the
plastic shear capacity of the tee, V,. For an unreinforced tee, when h. = 1.207 and u = 12.0, the
predicted maximum shear capaci~es of Method I1 and IIZ differ by 6.3% which translates to 0.90%
of V,. Another practicd consideration that further reduces the effect of the unconservative normal
stress in the web on the predicted maximum shear capacity is a restriction, p,, placed on the size
of the opening (see Appendix 13). This restriction limits the value of u for the second tee to
2.836 when p, = 5.6, adh, = 3.0 and u = 12.0 for first tee. This is illustrated for h = 1.414 and
h = 1.207 in Figs. 2.10 and 2.1 1. Fig 2.10 iflustrates she difference between the maximum shear
capacities predicted by Methods II and I11 for the top and bottom tees normalized on the plastic
shear capacity of the perforated web versus adsr Fig. 2.11 illustrates the ratio of Methods I1 and
20
versus ads,. A W21X44 beam with an opening depth, h,, equal m 50% of the overall beam
depth is used for the comparisons. The curves were generated by varying the opening length, a,
me ratio of opening length to tee depth for the bottom we, ads,, becomes limited as the opening
length increases, consequently, the difference in h e combined maximum shear capacities of the
top and bottom tees predicted by Methods 11 and I11 diminishes as she opening length increases.
Fig. 2.11 was generated with the same beam and opening except the ratio of the maximum shear
capacities predicted by Methods I1 and III is plotted with respect to aJq. For either value of h,
the predicted maximum shear capacity is not significantly affected by the unconservative
prediction of the normal saess in the web by the linear approximation of the von Mises yield
function.
For openings with a 'low U, the Iinear approximation of the von Mises yield function can
predict the shear stress in the web of a tee to be as much as 9.7% higher than that predicted by
the von Mises yield function when 3c = 1.414 and u = 0.727, as illustrated in Fig 2.9. The
corresponding maximum shear capacities predicted by Methods I1 and III differ by 9.9%, or 9.0%
of the plastic shear capacity of the tee. When h = 1.207 and u = 0.359, the linear approximation
overpredicts the shear smss in the web by 2.1%, and the corresponding maximum shear capacities
predicred by Methods I1 and IIE differ by 2.2%, or 2.1% of the plastic shear capacity of the tee.
When h = 1.414 and u = 0.717, the potential difference kmeen the maximum shear capacities
predicted by Methods TI and 111 are significant and will have the most effect on the nominal shear
capacity when the opening is under high shear. Openings with u = 0.717 or 0.359 are very
unlikely, however. Comequentty, potentially unconsetvative predictions of maximum shear
capacity by Method HI are very unlikely to occur in practice.
The effect of the linear approximation of the von Mses yield function on the predicted
capacities of fifty steel and thirty-five composite beams is investigated further in Section 3.4.

2.43.2 Effect of Reducing the Tee Depth in Proportion to Reinforcement
For an unreinfotced steel tee, with p = 0.0, Method I predicts a higher maximum shear
capacity than Method 111 over the entire range of acceptable vaIues of u = ads. as illustrated in
Fig. 2.12. This difference is as high as 15% of the pIastic shear capacity of the tee when ads =
2.00. As reinforcement is added to a tee, the PNA will shift toward the opening, and the
assumption made in the derivation of M e h d s I1 and III, that the PNA is at the top of the flange,
kcomes increasingly unconservative. Method I accounts far the shift of the PNA, so reasonably
conservative predictions of shear capacity can k expected regardless of the amount of
reinforcement at an opening. The unconservative difference between Methods I and I11 when
nothing is done to account for the shift in the PNA is about 7.5% of the plastic shear capacity of
the tee when y = 9.0 and ads = 12.0. By reducing the depth of h e tee in propofiion to the
reinforcement present (Eq. 2.44), the uncon~svative difference between Methods 1 and III is
reduced to a b u t 2% of V,, for heavily reinforced slender tees. As shown in Fig. 2.12, with
increasing quantities of reinforcement, it becomes more likely that the maximum sheat capacity
of a steel tee will be governed by the plastic shear capacity of the tee. The unconsezvazive affect
on predicted shear capacity by an unadjusted PNA Iocation for Method I11 will likely be lessened
in many situations because the plastic shear capacity of a tee will govern However. reducing the
tee depth in proportion to the reinforcement present to approximate the actual shift in the PNA
pennits the prediction of maximum shear capacity more in line with those predicted by
Method I.
2 5 Moment Capacity Equations
The expressions for the maximum moment capacity of steel and compasitc beams with
web openings presented in this section are applicable only to members meeting AISC (19861
criteria for compact sections. InstabiIities in the compression flange or web, likely in non-compact
sections, may render the expressions of this section unconsemative because the full smngth at the
opening may not bc attained.
Well established strength procedures are employed in deriving the expressions for
maximum moment capacity, M,. En all cases, fully plastic behavior is aqsumed for the steeI
section in both tension and compression.
2.5.1 Steel Beams
The maximum moment capacity of unreinforced steel beams, as derived in this section,
invoIves no approximations. Simplified, conservative design expressions for reinforced steel
bearns are derived by assuming that she reinforcement is concentrated along the top and bottom
edges of the opening and that the thickness of the reinforcement is small. For members with an
eccentric opening, e $0, the plastic neutraI axis will be Iocated in the reinforcement at the edge
of the opening closest to fithe centroid of the original steel section or in the web of the deeper tee.
When reinforcement is used, the maximum moment capacity, M,, should not exceed the flexural
strength of the unperforated beam, M,.
The eccentricity of an opening, e, is always taken to be positive in steel bearns. Figs.
2.13(a), 2.13(b), and 2.13(c) illustrate st~ess diagrams for steel sections in pure bending.
23
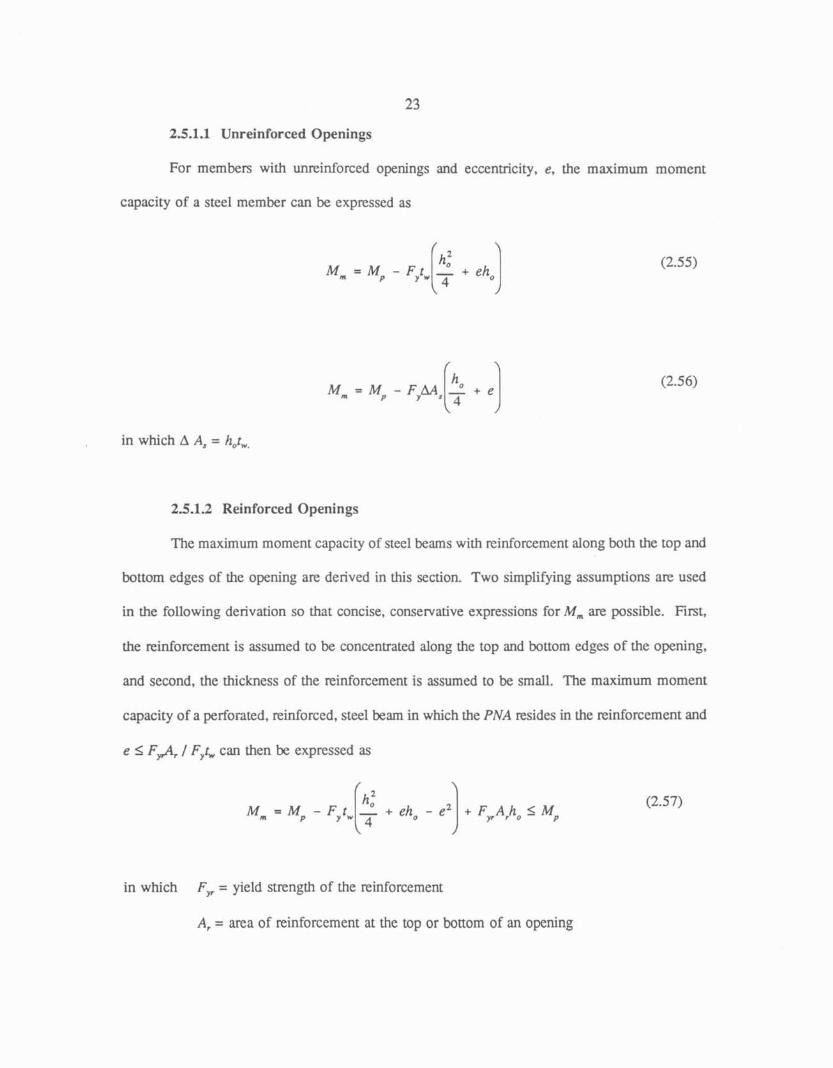
25.1.1 Unreinforced Openings
For members with unreinforced openings and eccentricity, e, the maximum moment
capacity of a steel member can be expressed as
in which A A, = hotw,
2.5.12 Reinforced Openings
The maximum moment capacity of steel beams with reinforcement along both the top and
lmttorn edges of the opening are derived in this section. Two simplifying assumptions are used
in the following derivation so that concise, conselvative expressions for M, are possibIe. First,
the reinforcement is assumed to be concentrated dong the top and bttorn edges of the opening,
and second, zhe thickness of the reinforcement is assumed to be small. The maximum moment
capacity of a perforated, reinforced, steel beam in which the PNA resides in the reinforcement and
e I FA, / F,t, can en be expressed as
in which F, = yield strength of the reinforcement
A, = area of reinforcement at the top or bottom of an opening
24
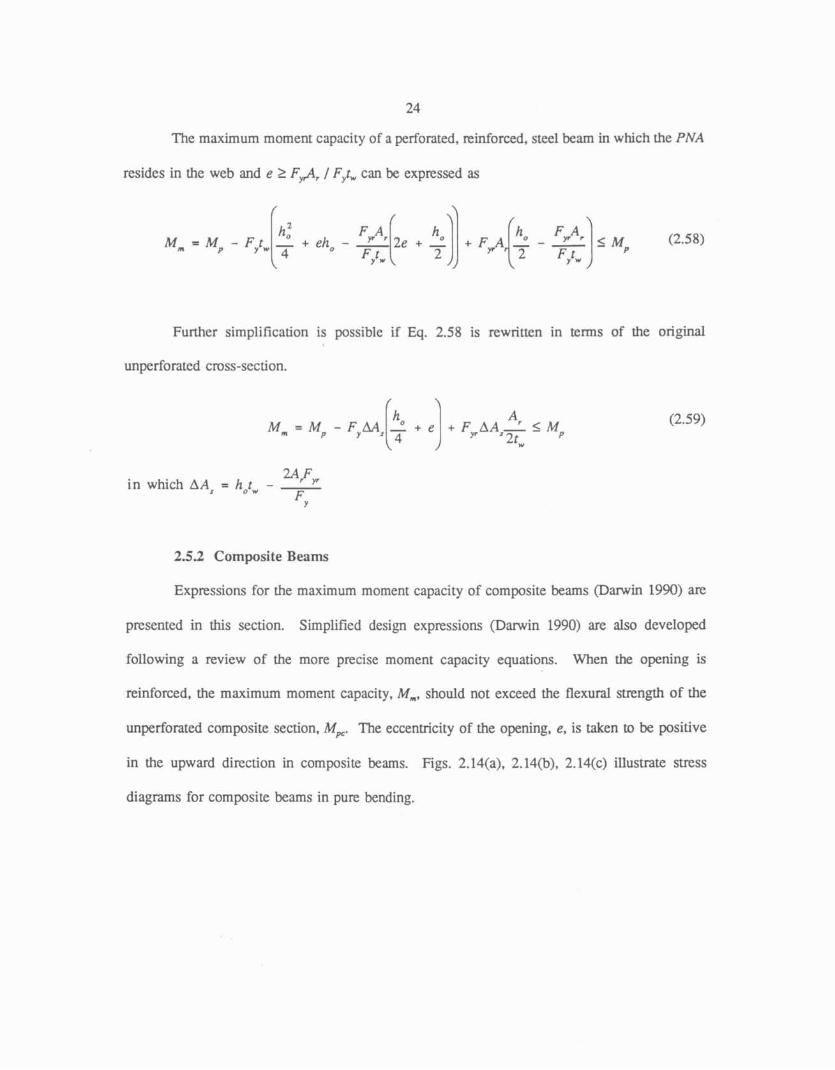
The maximum moment capacity of a perforated, reinforced, steel beam in which the PNA
resides in the web and e 2 F d , / F,P, can be expressed as
["[ : ] ) + F # & - ! & ] 5 M p (2-581 M m = Mp - Fytw - + eh, - - 2e + -
Further simplification is possible if Eq. 2.58 is rewritten in terms of the original
unperforated cross-section.
2ArFF in which AA, = h t - 0 W
FY
2.52 Composite Beams
Expressions for the maximum moment capacity of composite kams p a w i n 1990) arc
presented in this section. Simplified design expressions (Darwin 1990) are also developed
following a review of the more precise moment capacity equations. When the opening is
reinforced, the maximum moment capacity, M,. should not exceed the flexural stsength of the
unperforated composite section, M,. The eccentricity of the opening, e. is taken to be positive
in the upward direction in composite kms. Figs. 2.14(a), 2.14(b), 2.14(c) illustmle m e s s
diagrams for composite beams in pure bending.
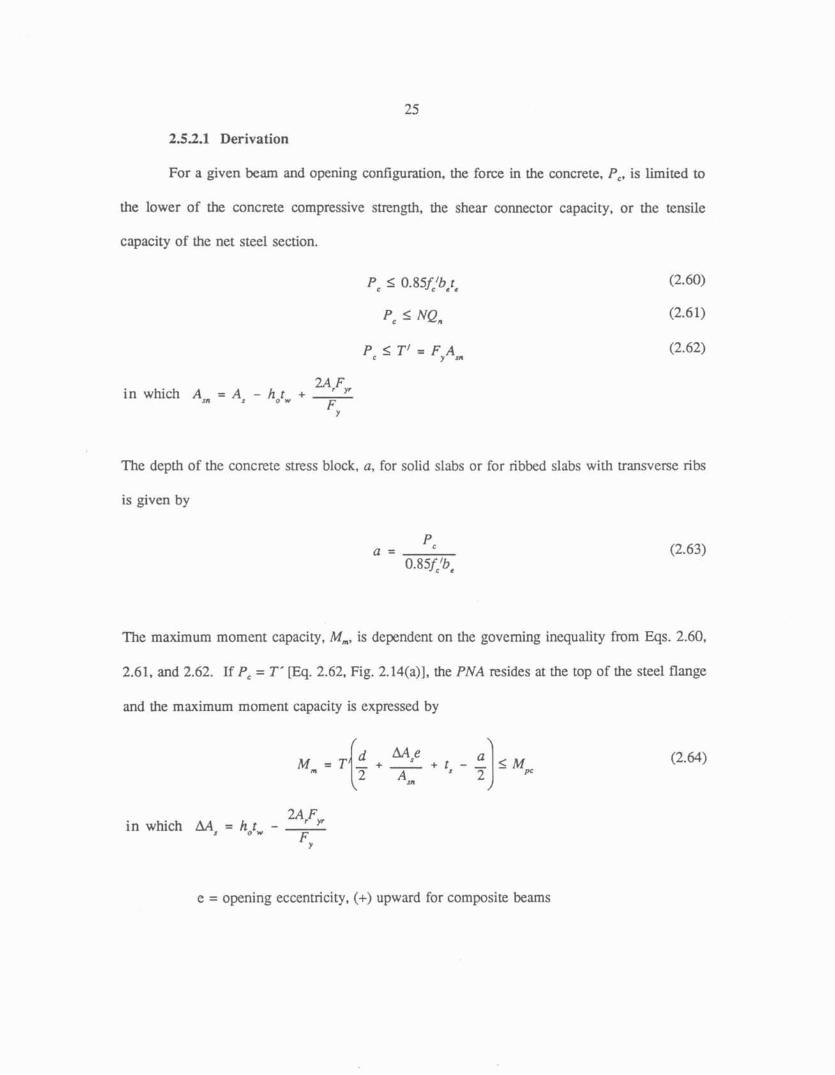
2.5.2.1 Derivation
For a given beam and opening configuration. the force in the concrete, PC, is limited to
the lower of the concrete compressive strength, the shear connector capacity, or the tensile
capacity of the net steel section.
The depth of the concrete stress block, a, for solid slabs or for ribbed slabs with transverse ribs
is given by
The maximum moment capacity, M,, is dependent on the governing inequality from Eqs. 2.60,
2.67, and 2.62. If PC = T' [Eq. 2.62, Fig. 2.141a)l. the PNA resides at the top of the steel flange
and the maximum moment capacity is expressed by
2*,Fr in which AAr = hotw - - FY
e = opening eccentricity. (+) upward for composite beams
26
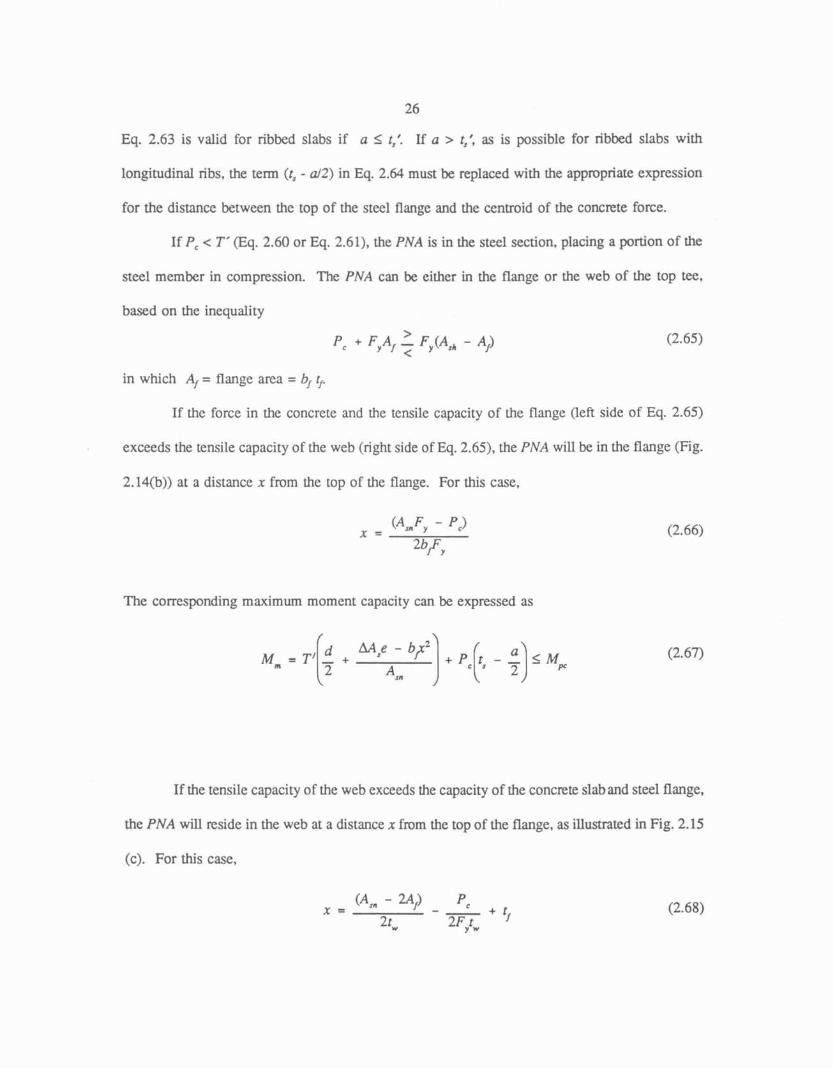
Eq. 2.63 is valid for ribkd dabs if a I t,'. If a > t,', as is possible for ribbed slabs with
longitudinal ribs, the term jt, - d 2 ) in Eq. 2.64 must be replaced with the appropriate expression
for lhe distance between the top of the steel flange and the centroid of the concrete force.
If PC < T * (Eq. 2.60 or Eq. 2.61), the PNA is in the steel section, placing a portion of the
steel member in compression. The PNA can k eithcr in the flange or the web of the top tee,
based on the inequality
in which A, = flange area = b, 9.
If the force in the concrete and the tensile capacity of the flange (left side of Eq. 2.55)
exceeds the tensile capacity of the web (right side of Eq. 2.65). the PNA will be in the flange (Fig.
2.14(b)) at a distance x from the top of the flange, For this case,
The corresponding maximum moment capacity can k expressed as
If the tensile capacity of the web exceeds the capacity of the concrete slab and steel flange,
the PNA will reside in the web at a distance x from the top of the flange. as illustrated in Fig. 2.15
(6). For this case,
The corresponding maximum moment capacity can be expressed as
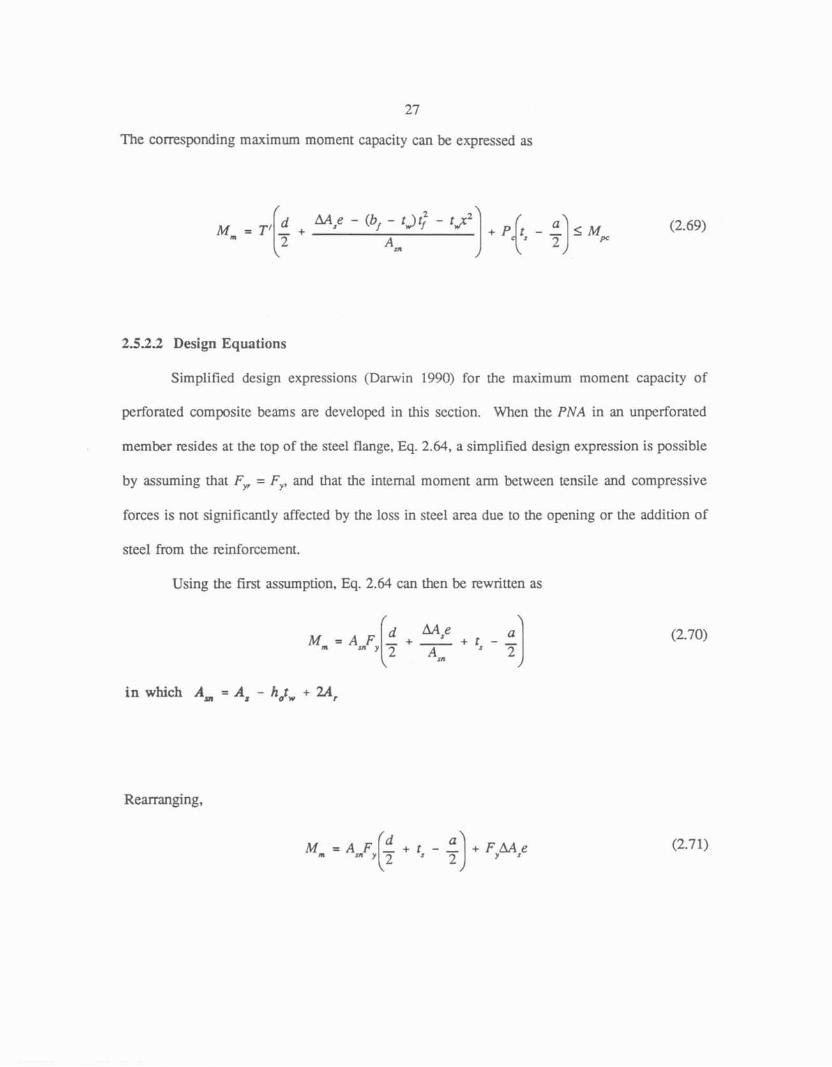
2.522 Design Equations
Simplified design expressions (Damin 1990) for the maximum moment capacity of
perforated composite beams are developed in this section. When the PNA in an unperforated
member resides at the top of the steeI flange, Eq. 2.64, a simplified design expression is possible
by assuming sat F, = F,, and that lthe inlemal moment a m between tensile and compressive
forces is not significantly affected by the loss in steel area due to the opening or the addition of
steel from the reinforcement.
Using the first assumption, Eq. 2.64 can then be rewritten as
in which A, = A, - hotw + 2.4,
Rearranging,
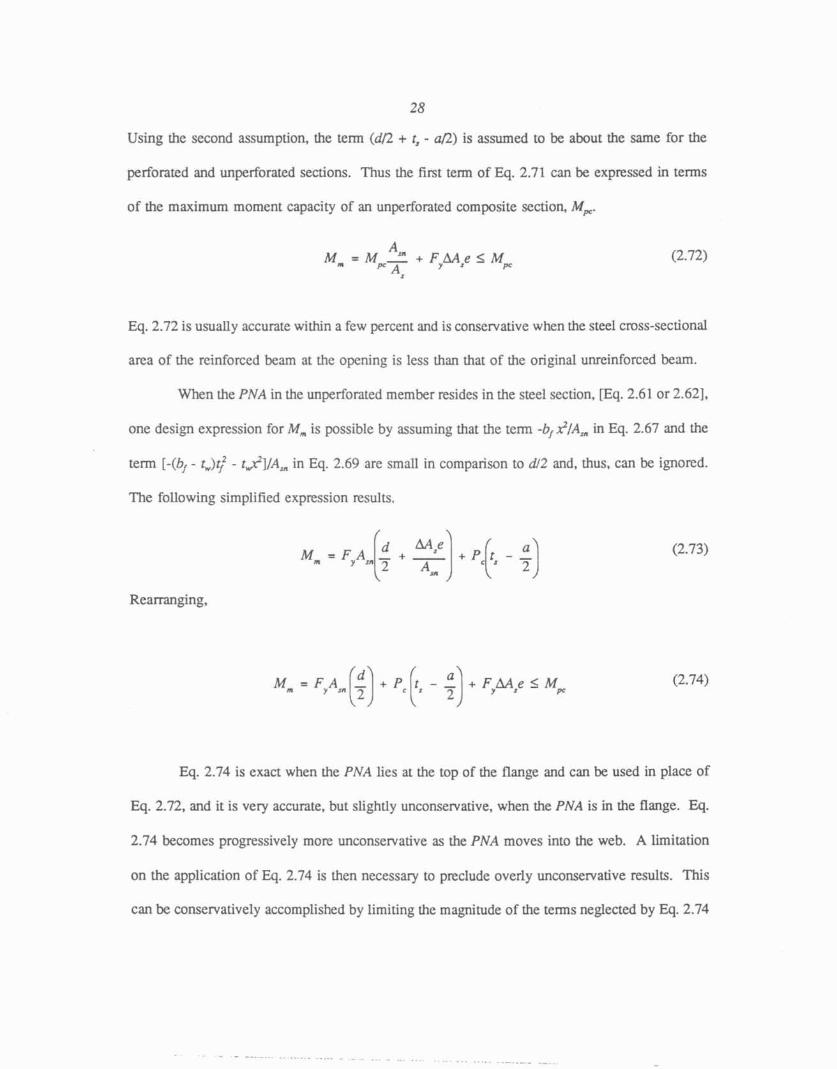
28
Using the second assumption. the term (di2 + t, - a12) is assumed to be about the same for the
perforated and mperforated sections. Thus the first term of Eq. 2.71 can k expressed in terms
of the maximum moment capacity of an unperforated composite section, MF.
Eq. 2.72 is usually accurate within a few percent and is conservative when the steel cross-sectional
area of the reinforced beam at the opening is Iess than that of the original unreinforced beam.
When the PNA in the unperforated member resides in the steel section, [Eq. 2.61 or 2.621,
one design expression for M, is possible by assuming that the tern -b,2lA, in Eg. 2.67 and the
term [-(bf - s,)$ - ~A]/A, in Eq. 2.69 are smaEl in comparison to d 2 and, thus, can be ignored.
The following simplified expression results.
Rearranging,
Eq. 2.74 is exact when the PNA lies at the top of the flange and can Ix used in place of
Eq. 2.72, and it is very accurate, but slightly unconservative, when the PNA is in Ehe flange. Eq.
2.74 becomes progressively more unconservative as the PNA moves into the web, A limitation
on the application of Eg. 2.74 is then necessary to preclude overly unconservative results. This
can be conservatively accomplished by limiting the magnitude of the terms neglected by Eq. 2.74
29
(see Eq. 2.67 and 2.69) to less h n 4 percent of dl2 for members in which the flange area is
greater than or equal to 40 percent of the web area [i.e., (bf - tJtf 1 0.4m. This is accomplished
by limiting the force in the concrete, PC, to values greater than FY(0.75t& - M,). The flange-to-
web area ratio stipulation is consemative, and as that ratio increases. the accuracy of Eq. 2.74
improves. For members in which the PNA resides in the web, arid either PC < F,(0.75twd - M,),
or the flange-to-web area ratio is less than 0.40, M, must be determined using Eq. 2.67 or 2.69.
A derivation of the stipulation on P, for configurations where the PNA is located in the web can
be found in Appendix E.
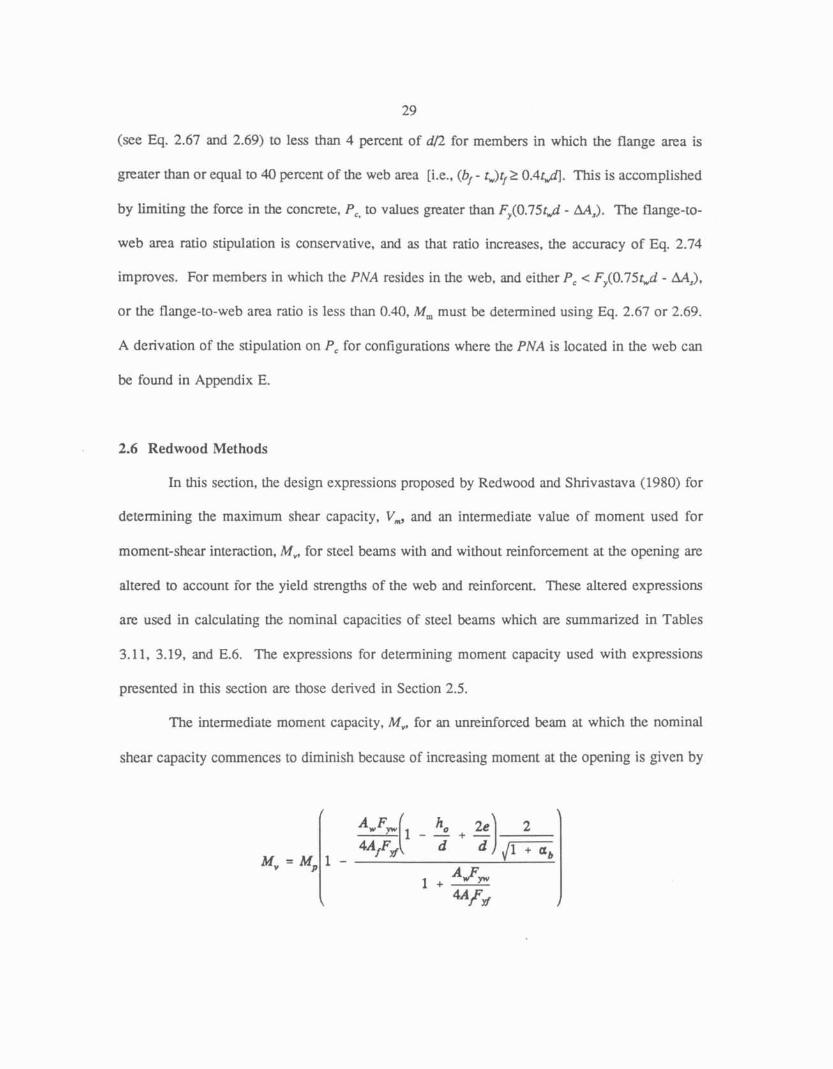
2.6 Redwood Methods
In Ibis section, the design expressions proposed by Redwood and Shrivastava (1980) for
determining the maximum shear capacity, Vm, and an intermediate value of moment used for
moment-shear interaction, M,. for steel beams with and without reinforcement at the opening are
altered to account for the yield strengths of the web and rcinforcent. These aItered expressions
are used in calculating the norninaI capacities of steel beams which are summarized in Tables
3.11, 3.19, and E.6. The expressions for determining moment capacity used with expressions
presented in this section are those derived in Section 2.5.
The intermediate moment capacity, M, for an unreinforced beam at which the nominal
shear capacity commences to diminish kcause of increasing moment at the opening is given by

30
The maximum shear capacity, V,, of the top and bottom tees of an unreinfozced beam is
in which
The intermediate moment capacity, w, far a reinforced beam at which the nominal shear
capacity commences to diminish because of increasing moment at the opening is given by
The maximum shear capacity, Vm, of the top and bottom tees of a reinforced beam is
31
3.0 ANALYSTS AND RESULTS
3.1 Introduction
In this section, the three design methods described in Section 2.0 are evaluated. The
results from fifty steel beams and thirty-five composite beams are used for comparison. Of the
fifty steel kams, nineteen are unreinfocced with rectangular openings, ten are unreinforced with
circular openings, and twenty-one are reinforced with rectangular openings. Of the thirty-five
composite beams. twenty-two have ribbed slabs and thirteen have solid slabs. Two of the beams
with solid slabs and one of the beams wizh ribbed slabs are reinforced at the opening. The
proportioning and detailing guidelines presented in Appendix D are also discussed in this section,
along with the equations used to calculate resistance factors. The results of six specific amas of
investigation are presented in Sections 3.4 - 3.9. The six areas investigated are the effects of (1)
varying h, the factor used in the linear approximation of the von Mises yield function, (2)
reducing she tee depth of a reinforced tee to approximate the actual rnoverncnt of the plastic
neutral axis with the addition of reinforcement, (3) limiting PC,, the normal force in the concrete
at the high moment end of the opening, by the axiaf yield capacity of the net steel in a composite
tee, (4) limiting the nonnd force in the reinforcement at an opening by the capacity of the
accompanying weld. (5 ) size of the flanges relative to the web as a hncrion of the design method,
and (6) limiting the maximum moment capacity of a perforated beam to the plastic moment
capacity of the unperforated beam. These six areas are important because they are refinements,
simplificadons, and limitations that impact the accurate prediction of shear and moment capacity.
The comparisons made in Sections 3.4 - 3.9 are not based on tests specifically fomuIated
to validate the refinement, simplification, or limitation in question, however. Consequently, the

32
comparisons, in themselves, may not present a complete picture and the theoretical basis of these
comparisons is of greater importance.
Dimensions znd properties for the steel and composite beams included in Lhe analysis are
contained in Tables 3.1 and 3.2, respectively.
The resuIts obtained using the expressions developed in Section 2.0 and presented in
Appendix B to account for the yield strengths of the flanges, web, and reinforcement are
summarized in Tables 3.3 - 3.10, and 3.13 - 3.18. Results obtained using the appropriate methods
proposed by Redwood and Shrivastava (1980), Redwood and Poumbouras (1 984) and Redwood
and Cho (1986) are summarized in Tables 3.1 I. 3.12, 3.19 and 3.20. Table 3.21 is an overall
summary of the results of the analysis for all of the methods considered.
3.2 Proportion~ng and Detailing Guidelines
Proportioning guidelines have been developed for web openings in steel and composite
beams which ar.: ros t recently summarized by Darwin (1990). These appear in Appendix D.
The majority of h c guidelines help to insure that failure of a beam, as predicted by the design
methods presented in Section 2.0, does not occur prernatu~ly.
The design limitations dictated by the proportioning and detailing guidelines for h a m s
used in the analysis are presented in Table 3.3 for steel beams and in Table 3.4 for composite
beams. Ten of the beams used in the analysis violate one or more of the proportioning
guideleines which are summarized in Table 3.30 and Table 3.4(d) for steel and composite beams,
respectively. These beams were retained in the analysis because either the violdon was reIated
more to detailing practice than to the strength of the beam and/or faiIure did not occur bcause
of the violation.

33
Twenty-one steel beams and one composite beam tested in previous studies have been
excluded from consideration in this maIysis due to violations of the proportioning and detailing
guidelines. Sixteen steel hams tested by Kim (1980) were excluded because of extremely
conservative testltheory ratios for tests with shear acting at the opening. Dimensions and
properties, design limitations and results for the design methods presented in this repart and the
applicable Redwood method for the excluded beams are presented in Appendix E.
3 3 Resistance Factor Determination
Resistance factors appropriate for the design methods presented in this report and design
methods proposed by Redwood and Shrivastava (1980), Redwood and Poumbouras (I984), and
Redwood and Cho (1986) were determined in accordance with proceduses outlined in AlSC
(1986). The basic equation for determining the resistance factor, 4, is
in which R, = mezn resistance
R, = nominal resistance according to expressions in Section 2.0
ip = reliability index = 3.0
V, = coefficient of variation of the resistance
The term RJR, is the average testltheosy mtio for a group of beams, expressed as

34
in which FY JFY" = mean steel strengthlnominal steel strength = 1.07;
This vaIue was determined by Gdmbos (1978) using a large number of test coupons
from steel beams. It serves te account for the additional strength available from steel
beams beyond the nominal yield strength.
V , = actual shear capacity at an opening
vm = predicted shear capacity at an opening
Mtes, = actual moment capacity at an opening
Mn = predicted moment capacity at an opening
The term V, is the coefficient of variation ~ w l t i n g from several sources of variation, which is
given by
in which V, = coefficient of variation of F,JFp = 0.10 (Galambs 1978)
V, = coefficient of variation of construction = 0.05 (Gdmbos I9783
V,, = coeficient of variation of the prediction method (obtained from comparison of
predicted strengths with test results)
3.4 Effect of Varying h
Ttie first of six areas investigated is the effect of varying h, the variabIe used in the linear
approximation of the von Mises yield function. The effect of varying his investigated to establish
a value that yields the most accurate predictions of maximum shear capacity by Methods E and
111. Two values for h are considered, 1.207 and 1.414. Donahey and Darwin (1986) used h =

35
1.207 which represents the best uniform approximation of the von Mises yeEd function This
study uses h = 1.414, which represents the practical upper limit for a linear approximation (Fig
2.6). The maximum shear capacities, and the predicted nominal shear and moment capacities for
steel and composite beams using h = I .414 are presented in Tables 3.5 - 3.10, 3.13 - 3.18 and
3.21. The maximum shear capacities, and the predicted nominal shear and moment capacities for
steel and composite beams using h = 1.207 are presented in Tables G.1 - G.9.
For the fifty steel b e m s . when h = 1.414, the mean tesvheory mtios are 1.158, 1.213.
and 1.183 and the coefficients of variation are 0.134, 0.179, and 0.150 for Methods I, 11, and 111,
respectively. The corresponding resistance factors for the three methods are 0.929, 0.916, and
0.929. Considering the tesqtheory means, Method I is the most accurate foPlowed by Mchod 111
and Method TI. The fact that Method 111 is more accurate, for the bems considered, than Method
I1 might not be expected considering Method 111 is a simpIification of M~:thod 11. However,
Method En, with A = 1.414, tends to give a better match with the test data because the yon Mises
yield function does not account for strain hardening, which appears in virtudly all of the high
shear tests. The higher values of shear strength obtained with Methods I and TIT with h = 1.474
take advantage of this behavior. For the same steel beams, when h = 1.207, the mean testltheory
ratios are 1.232 and 1.281 and the coefficients of variation are 0.166 and 0.193 for Methods I and
111, respectiveIy. The corresponding ~siszance factors for Methods 1 and IIE are 0.947 and 0.949.
Method 11 is not influenced by h Considering test/theory means, coefficients of variation, and
resistance factors, Method I is rhe most accurate followed by Method II and Method III, when
h = 1.207. In ger-esal, for the steel beams, using h = 1.414 for Methods I and 111 produces lower
testltheosy ratios, lower coefficients of variation, and lower resistance factors. In all cases,
resistance factors are higher than 0.90.

36
For the thirty-five composite beams, when A = 1.414. the mean test/theory ratios are
1.02.4, 1.065, and 1.039 and the coeficients of variation are 0.084,0.088, and 0.092 for Methods
I. 11, and IIT, respectively. The comsponding resistance factors for the three methods are 0.870,
0.901, and 0.876. Considering the tesvtheory means, coefficients of variation, and resistance
factors, Method I is the most accurate followed by Methods 111 and 11. For the same composite
hams, when h = 1.207, the mean testhheory ratios are 1.060 and 1.083 and the coefficients of
variation are 0.079 and 0.086 for Methods t and 111, respectively. The corresponding resisance
factors for Mcthods I and III are 0.905 and 0.918. Method 11 is not influenced by h. Considering
tesvtheory means, coefficients of variation, and resistance factors, Methed I is the most accurate
followed by Method II and Method In, when h = 1.207. In general. for the composite beams,
using h = 1.414 produces lower test/theory ratios, slightly higher coefficients of variation, and
lower resistance factors. In a l l cases, resistance factors are higher than 0.85. Using h = 1.414 for
both steel and composite beams produces more accurate predictions of nominaI capacity.
3.5 Effect of Reducing Tee Depth for Reinforcement
The effect of reducing the depth of a tee when reinforcement is present for Methods II
and III is investigated to establish its significance with test data. ResuIts obtained using Method
111 with no adjustment in the tee for reinforcement are compared wirh results obtained using
Method III with am adjustment in the tee for reinforcement. me effect of rcducing the depth of
a tee in the cdculation of u in Eq. 2.44 is summarized in Table 3.22 for twenty-one reinforced
steel beams and three reinforced composite beams. Reducing the tee depth for reinforcement does
reduce the predicted maximum shear capacity and produces slightly more conservative nominal
capacities for those k a m s affected. The overall testJtheory ratio mean for the steel beams
increases from 1.141 to 1.148, the coefficient of variation does not change and the resistance
37
factor increases from 0,929 to 0.935 when the stub is reduced proportionally ~y the reinforcement
present. The test/thcory ratio for the single reinforced composite beam affected (CRO-6) increases
from 1.1 I2 to 1.11 8 when the stub is reduced. The other two beams have very little shear (CHO-
7) or no shear (WE-2) and are thus not affected. Reducing the tee depth by an amount
proportional to the reinforcement present does not have a large affect on many other beams
because the reinforcement contributes to shear capacity in excess of the maximum permitted by
Section D.1.2. This restriction serves to maintain sirniliar conservatism availabIe with Method I
for tees with significant quantities of reinforcement.
3.6 Effect of Limiting P,, by the Net Top Tee Steel
The effect of limiting PC,, the normal force in the concrete slab at the high-moment end
of the opening. by the normal force in the net steel in the top tee when V , < Ve for Methods II
and I11 was investigated to estabIish if the limitation could be applied accurately and consistently
with all three design methods for predicting maximum shear capacity presented in Section 2.0.
The basis of comparison is h e resuIts obtained from Methods 11 and 111 with h = 1.414 and PC,
not limited to the normal force in the net steel when V , < V,. Donahey and Darwin (1986) did
not limit P, when V, c V,, for Methods II and IIE because this was thought 10 be unconservative
and hconsistent with the assumptions made in the derivation of Methods I1 and 111.
The results of limiting PC, by the net steel when V , < V, and h = 1.414 are summarized
for Method 111 in Table 3.23. For the D-series k m s , the test/theosy mean is unchanged at 0.974,
the coefficient of variation increases from 0.060 to 0.067 and the resistance factor decreases From
0.845 to 0.84 1 when the limitation is applied to PC,. For the R-series beams, the testltheory mean
decreases from 1.065 to 1.050, the coefficient of variation decreases from 0.087 to 0.057, and the
resistance factor increases from 0.902 to 0.915. For the C, G and CHO-series beams the
38
test/theory mean decreases from I. 121 to 1.1 16. the coemcient of variation increases from 0.076
to 0.080. and the resistance factor decreases from 0.960 to 0.952. For the CHO-series bems
(reinforced) the testhheory mean, the coefficient of variation and the resistance factor do not
change. For h e composite beams as a group, the test/theory mean decrease from 1 .Q48 to 1.043,
the coefficient of variation decreases from 0.1395 to 0.091 and the resistance factor is unchanged
at 0.880. For the thirty-five composite beams considered with h = 1.414, the limitation on PC,
yields tedtheory means closer to l.MM and smaller coefficients of variation, though the
differences are small.
3.7 Effect of Limiting P, by Weld Strength
The effect of limiting the normal force in the reinforcement by the weld strength in
determining the maximum shear capacity is checked to establish its significance on the prediction
of maximum shear capzcity for reinforced beams. The results of this investigation are summarized
in Table 3.24. F , kr. nine beams of the twenty-four reinforced beans was affected by the
limitation. Of these nine beams, the maximum shear capacity of only one. CHO-6, was
influenced. No change was seen in the maximum shear capacity for the other eight beams
because the maximum shear capacity was limited by the plastic shear capacity of the tee even after
applying the limitation.
3.8 Effect of Flanges
Because Methods TI and I11 ignore the cemribution of the flanges to the secondary bending
moments, is is possiMe, for beams with large A, /A, ratios, that these rwo methods could
significantly undetpxdict h e maximum shear capacity when compared LQ Method I. Fig. 3.86
(refer to Table 3.25 for selected members and other study parameters) illustrates that. as the Af /A,
39
ratio increases, the difference between Methods I and III also increases and can be very
significant. Within the typical range of Af /A. 0.40 to 0.80, the difference between thc two
methods is never larger than 5% of V,. For A, /A, ratios larger an 0.80, for sections typically
used as beams, the difference between the two methods is as high as 16% (for a W12x58). A
larger difference between the two methods occurs for a W 14x109, but t h i s section is not typically
used as a h a m . me effect of ignoring the contribution of the flanges to the secondary bending
moments for sections typicdly used as hams with moderate flange areas is not significant.
However, unnecessarily conservative predictions of shear capacity can result for some beam
sections using Methods 11 or 111, if the A, /A, rasio exceeds 0.80.
3.9 Effect of Limiting M, by M,
The effcct of limiting the maximum moment capacity by the plastic moment capacity of
the unperforated section is summarized in Table 3.26. All but two of the twenty-one reinforced
steel beams are affected by the limitation. As a group, the tesutheory ratio mean increased from
1.233 to 1.148, the coefficient of variation dropped from 0.128 to 0.122, and the resistance factor
increased from 0.9:6 to 0.935. Insuring that M, I Mp provides slightly more conservative
predictions of strengh than when M, is not limited to M,.
3.10 Redwood Design Methods
For the purpose of comparison with the current work, nominal shear and moment
capacities are obtained for all of the steel and composite beams considered in the report using
applicable methods deveIoped by Redwood and his coworkers. Maximum capacities are
cdculated for the steel beams using procedures proposed by Redwood and Shrivastava (1980) and
are given in Table 3.11 for beams included in the analysis and in Table E.6 for ;beams not used

40
in the analysis. Equations proposed by Redwood and Shrivastava (1980) are modified in Section
2.6 to account for the individual yield strengths of the flanges, web and reinforcement. Tables
3.1 E and E.6 contain intermediate values, defined in the respective table nnd the respective
reference, used to calculate the maximum shear capacities. Maximum shear capacities are
calculated for thirteen composite beams with ribtxd-slabs tested by Donahey and Darwin (1986)
(D-series) using procedures presented by Redwood: and Pournburas (1984) which are given in
Table 3.12. Capacities for nine composite beams with ribbed slabs tested: by Redwood and
Pournbouras (1984) (R-series) are taken from published values. The capacities for the remaining
unreinforced composite beams with solid slabs are taken from values published by Redwood and
Cho (1986). The predicted nominal shear and moment capacities for the steel and composite
beams are presented in Tables 3-19 and 3.20, respectively. Capacities were not calculated or
provided for beams CHO-6, CHO-7, and W E - 1 because no Redwood method has been published
which accounts for reinforcement in cornpsitc beams. Several of the calculated capacities for
composite beams do not agree with capacities published by Redwood. These discrepencies may
be due to the way in which the shear connector capacities are calculated (see Donahey and Darwin
(7986)).
Two moment-shear interaction procedures have been proposed by Redwood and
Shrivnstava (1980). Both require the calculation of an intermediate value for the moment, M,, at
which interaction with shear begins to have an influence on the moment capacity. M,. The first
interaction diagram is composed of two straight lines connecting the maximum shear capacity, Vm,
to M*, and M, to the maximum moment capacity, Mm (see Fig. 3.87). This method is referred to
as Redwood&). The second interaction procedure used by Redwood uses a straight line to
connect V, to M,, and a circuIar arc to connect Mv to Mm (see Fig. 3.88). This procedure is

4 1
referred to as RedwoodCC). Both interaction procedures are used for the steel beams, while only
Redwood(C) is used for the composite kams .
3.11 Compariscn of Design Methods with Test Results
In this section the nominal shear and moment capacities obtained using the design
methods discussed in Section 2.0. using h = 1.414, and those by Redwood and Shrivastava (1980),
Redwood and Poumbouras (1984) and Redwood and Cho (1986) are compared with test results.
The analysis includes fifty steel beams and thirty-five composite beams. A tabular summary of
resuIts for both steel and composite beams is given in Table 3.21. Individual moment-shear
interaction curves and the respective beam test values are given in Figs. 3.1 - 3.85 for the steel
and composite beams. GraphicaI comparisons of the predicted strengths using Method TI1 and the
amaI test v f ues for the steel and composite beams art: given in Figs. 3.89 and 3.90, respectively.
3.1 1.1 Steel Beams
Nineteen of the fifty steel beams are unreinforced with rectangular openings, ten are
unreinfomd with circuIar openings, and twenty-one are reinforced with rectangular openings. The
beams with unreinforced mcmgular openings have testltheory means of 1.213. 1.302, 1.250,
1.265, and 1.391 with coefficients of variation of 0.142, 0.21 1, 0.1 67, 0.191 and 0.195 for
Methods I, 3E, HI, Redwmd(C), and Redwood&), respectiveIy. The corresponding resistance
factors are Q.963, 0.939, 0.960,0.939, and 1.027. The beams with unreinforced circuIar openings
have testhheory means of 1 .OM, 1.145, 1.127, 1.1 I I , and 1.264 with coefficients of variation of
0.1 19, 0.154, 0.142, 0.140 and 0.131 for Methods I, 11, 111, Redwood(C), and Redwood&),
respectively. The corresponding resistance factors are 0.889,0.895,0.895,0.885, and 1.01 8. The
42
group of beams with reinforced rectangular openings have tesmeory means of 1.143, 1,166.
1.148, 1.142, and 1.362 wih coefficients of variation of 0.121, 0.125, 0.122, 0,151 and 0.195 for
Methods I, IT, IEI, Redwood(C), and Redwood&), respectively. me corresponding resistance
factors are 0.932, 0.946, 0.935, 0.896, and 1.006. Overall. the fifay steel beams have test/Lheory
means of 1.158, 1.213, 1.183, 1.183, and 1.353 with coefficients of variation of 0.134, 0.179,
0.150, 0.174 and 0-1 85 for Methods I, 11. 111, RedwoadCC), and Redwood(L3, respectively. The
cemsponding resistance factors are 0.929, 0.916, 0.930, 0.900, and 1.013. Generally, Method I
provides testhltheory means closest to 1.000, followed by Method 111, Redwood(C), Method 11, and:
Redwood&). Method I gives the smallest coefficients of variation, followed by Method EII,
Redwood(C), Method II, and Redwood&). Redwood(C) gives the lowest resistance factor
followed by Method PI, Method I, ,Method 111, and Redwood(L).
3.11.2 Composite Beams
OF the thirty-five cornpositc beams, twenty-one have ribbed slabs and unreinforced
rectangular openings. eleven have solid slabs and unreinforced rectangular openings, one has a
ribbed slab and a reinforced rectangular opening, and two have solid slabs and reinforced
rectangular openings. Methods I, Il and 111 are applied to al l thirty-five kms. The Redwood(Q
method (Ftedwood and Pornbourn (1984) and Redwood and Cho (1986)) is applied to the thirty-
two beams without reinforcement. Redwood&) is not applicable. The gmup of beams with
rjbkd slabs and unreinforced rectangular openings have test/theery means of 0.995, 1.037, 1 .W6,
and 1.090 with coefficients of variation of 0.071, 0.069, 0,072, and 0.121 for Methods I, IT, 111,
and Redwood(C), respectively. The corresponding resistance factors are 0.856,0.893,0.8@, and
0.889. The hams with solid slabs and unreinforced ectangutar openings have test'theoq means
of 1.092, 1. I4 1, 1.1 16, and 1.207 with coefficients of variation of 0.066, 0.075, 0.080, and 0.124
43
for Methods 1, 11, 111, and Redwood(Q, respectively. The corresponding resistance factors are
0.943, 0.978,0.952, and 0.98 1. The beams with ribbed and solid slabs with reinforced rectangular
openings have testhheory means of 0.978, 0.985, and 0.983 with coefficients of variation of 0.1 10,
0.122. and 0.1 19 for Methods I, 11, and III, respectively. The corresponding resistance factors are
0.808, 0.802, and 0.803. These low values are due to h e fact that only three beams are used for
this calculation, and the results are dominated by a singIe member (WE-1) for which failure was
controlled by shear connector capacity (Wiss et al. 1914). Thus these values are not considered
to be representative of what is expected in practice.
The thirty-five composite beams [thirty-two for Redwood(C)] have tesvtheory means of
1.024, 1.065, 1.039, and 1.131, with coefficients of variation of 0.084, 0.088, 0.092, and 0.1 28
for Methods I, II, 111, and Redwood(C), respectively. The corresponding resistance factors are
0.870, 0.901, 0,875, and 0.895. Overall, Method I provides tesmeory means closest lo 1.000,
followed by Method 111, Method 11, and RedwoodCC). Method I provides the smallest coefficients
of variation, followed by Method 11, Method 111, and Redwood(C). Method I yields the lowest
resistance factor followed by Meshod 111, RedwoodlC), and Method 31.
3.113 Recommendations
Method 111, the simplest of the design methods for determining maximum shear capacity.
coupled with the cubic moment-shear interaction procedure proposed by Donahey and Darwin
(1986) i s recommended for design. Resistance factors of 0.90 and 0.85, applied to shear and
bending, are recommended for the design of steel and composite beams, respectively. As
illustrated in Figs. 3.89 and 3.90, none of the hams used for the comparisons had a strength
M o w the product of the resistance factor and the predicted strength,
44
SECTION 4.0 SUMMARY AND CONCLUSIONS
4.1 Summary
Three design methods, originally developed by Donahey and Darwin (1986). for
determining the maximum shear capacity of composite beams with unreinfocced web openings are
extended to include steel and composite beams with or without reinforcement at the opening. The
three design methods incorporate simplifying assumptions that permit closed-form solutions for
maximum shear capacity. The first method assumes that the neutral axes for secondary bending
lie in the flanges of the top and bottom tees and defines the interaction of shear and normal
stresses by a linear approximation of the von Mises yield function. The second method ignores
the contribution of the flanges to secondary bending moments and employs the von Mises yield
function to define the interaction of shear and normal smsses. The third method ignores the
contribution of the flanges to secondary bending moments and defines the interaction between
shear and normal suesses w i ~ a linear approximation of the yon Mises yield function Simplified
design expressions for the maximum moment capacity of steel and composite beams with web
openings are presented. Six refinements of the design methods are investigated to determine their
significance in predicting member strengths. Simplified design expressions developed by Darwin
(1990) for determining rhe maximum moment capacity of steel and composite beams at web
opnings are summarized. The accuracy and ease of application of the design methods presented
in this report (Methods I, IT, and 111) and applicable procedures proposed by Redwood and
Shrivastava (1980). Redwood and Poumbouras (1984). and Redwood and Cho (1986) are
compared with experimental results of fifty steel beams and thirty-five composite beams.
Resistance factors are calculated for use in LRFD of structural steel buildings.
4.2 ConcIusions
Based on the work presented in this report, the following concIusions can be made:
1. For slender tees, the predictions of normal stress made by the linear approximation of
the von Mises yield function, when h = 1.414, can be as much as 41% higher than the normal
s t ~ s s predicted by the von Mises yield function. Considering practical design limitations on
opening sizes (Appendix D), lthe normal stress is overpredicted by 26.3%. This translates into a
maximum shear capacity that is overpredicted by 3.5% of the plustic shear capacity of a tee when
considering the design limitations presented in Appendix D.
2. stocky tees, the linear approximation of the von Mises yield function can
overpredict the shear stress in a tee by as much as 9.7% when h = t .414 and u = 0.717. This
translates into a difference in predicted maximum shear capacity of 9.0% of the plastic shear
capacity of a see. While this difference is signicant, such low values of u are very unlikely to
occur in practice.
3. Using h = 1.414 with Methods E and In, instead of 1.207, for both steel and
composite beams produces more accurate predictions of nominal capacity and more consistent
resistance factors for different opening and slab types thus eliminating unnecessary conservatism
from potential designs.
4. Unnecessatily conservative predictions of shear capacity can result for some beam
sections using Methods IT or III, if the ratio of the area of the flange to the area of the web, AjA,,
exceeds 0.80.
5. The effect of reducing the tee depth by an amount proportional to the reinforcement
present, when calculating the maximum shear capacity at an opening, did not have a large effect
in many of the reinforced beams considered, because the reinforcement contributed to shear
capacity in excess of the maximum permitted by Section D.1.2. The procedure, however, serves
46
to maintain conscrvalism similiar to that obtained with Method I for tees with significant
quantities of reinforcement.
6. For the thirty-five composite beams considered, with h = 1.414, consiskntIy limiting
PC, by Ihe axial yield capacity of the top tee steel gives test/theory means closer to 1.0 and smaller
coefficients of variation, than when PC, is not Iimited by the net top tee steel.
7. Insuricg that M, 5 M, provides sIightly more conservative predictions of moment
capacity than when M, is not limited to M,.
8. Insuring that the normal force in the reinforcement is Iess than the capacity of the
corresponding weld provides predictions of shear capacity that are more conservative than when
the normal force in the reinforcement is not limited by the weld capacity.
9. For the steel beams, Method I provides tesvtheory means closest to 1.0, followed by
Method III, Redwood(C), Method 11, and Redwood&). Method I gives the smallest coefficients
of variation, followed by Method 111, Redwood(C), Method 11, and Redwood(L). For the group
of steel beams, Redwood(C) yieIds the lowest resistance factor followed by Method II, Method
I, Method 111, and Redwood&). Far the composite beams, Method I provides testhheory means
closest to 1.0, foIlowed by Method 11, Method 111, and Redwood(C). Method I yields the smallest
coefficients of variation, followed by Method /I, Method 111, and Redwood(C). Method I gives
the lowem resistance factor followed by Method ITE, Redwood(C), and Method 11.
10. Methods proposed by Redwood and Shrivastava (1980), Redwood and Pournbouras
(1986) and Redwood and Cho (1986) for determining shear and moment capacity for steel beams.
composite beams with ribbed slabs, and composite beams with soIid slabs, respectively, are
genesally more complex than the methods in this report and do nos offer any additional accuracy.

47
11, Method I11 coupled with the moment-shear interaction procedures proposed by
Donahey and Dsnvin (1986) is easily applied and provides strength predictions that are in
excellent agreement with test data.
12. Resistance factors for shear and bending of 0.90 and 0.85 are appropriate for steel
and composite beams, respectively.
REFERENCES
Aglan, Ahmed A., and Qaqish, Samih. (1982). "Plastic Behavior of Beams with Mid-depth Web Openings," AISC Enpineerin.~ Journal, VoI. 19, No.1, pp. 20-26.
Aglan, A h e d A., and Redwood, Richard G. (1974). "Web Buckling in Catellatcd Beams," Proceedings, Part 2, Institution of Civil Engineering (London), Vot. 57, June, pp. 307-320.
Bower, John E. (1968). "Ultimate Strength of Beams with Rectangular Holes,'Voumal of the ASCE, Vol. 94, No. ST 6, June, pp. 1315-1337.
Cato, S. L. (1964). "Web Buckling Failure of BuiIt-up Girden with Rectangular HoIes," MS. Thesis, Oregon State University, Corvallis, Oregon.
Cho, Soon Ho. (1982). "An Iwestigation on the Strength of Composite Beams with Web Openings,'W.S. Arch. Eng. Thesis. Hanyong University, Seoul, Korea, Dec., 270 pp.
Cho, Soon Ho, and Redwood, Richard G. (1986). ''The Design of Composite Beams with Web Openings,'YStructural Enfineerinpl Series No. 86-2, McGill University, Montreal, Quebec, Canada, June, 66 pp.
Clawson, William C., and Danvin, David. (1980). "Composite Beams with Web Openings," Report No. 4, University of Kansas Center for Research, Lawrence, Kansas, Oct., 209 pp.
Clawson. William C.. and Danvin. David. (I982a). "Tests of Composite Beams with Web Openings,''JoumaP of the Smctuml Division, A S E , Vol. 108, No, STI, Jan., pp. 145-162.
Clawson, WilIim C., and Darwin, David. (1982b). "Strength of Composite Beams with Web Openings." Journal of the Structural Division, ASCE, Val. 108, No. ST3. Mar., pp. 623-641. Discussions by R. G. Redwood and Closure to Discussion Vol. 109, No. ST5, Apr. 1983, pp. 1307-1309.
Congdon, Judith G., and Redwood, Richard G. (1970). "'Plastic Behavior of Beams with Reinforced Holes," Journal of the Structural Division, ASCE, Vol. 96, No. ST9, ST., pp. 1933- 1955.
Cooper, Peter B., and Snell, Robert R. (1 972). "Tests on Beams with Reinforced Web Openings,'" Journd of the Structural Division, ASCE, Vol. 98, No. ST3, Mar.,pp. 611-632.
Cooper, Peter B.; SnelI, Robert R.; and Knosman, Hany D. (1972). "'Failurr: Tests on Beams with Eccentric Web Holes," Journal of the Structuml Division, ASCE, Vol. 103, No. ST9, Sep., pp. 1731-1737.
Darwin, David. (1984). "'Composite Beams with Web Openings," Proceedings, National Engineering Conference, American Institute of SteeI Construction, Chicago, Illinois, Mar.. 17 pp. Also, Journal of the Boston Societv of Civil Engineers Section, ASCE, Vol. 71, No. 1 & 2, 1985, pp. 67-83.
Darwin, David. (1988). "Behavior and Design of Composite Beams with Web Openings," Chapter 3, Steel-Concrete Composite Structures: Stabilitv and Strensh. R. Narayanan, Ed., Applied Science Publishers, London and New Yo&, 1988, pp. 53-78.
Darwin, David. (1990). Design of Steel and Composite Beams with Web Openings, American Institute of Steel Construction, Chicago, IL, 63 pp.
Darwin, David, and Donahey, Rex C. (1988). "LRFD for Composite Beams with Unreinforced Web Openings," Journal of Structural En~neerinp, ASCE, Vol. 114, No. 3, Mar.. pp. 535-552.
Donahey, Rex C. (1987). "Deflections of Composite Beams with Web Openings," Buildinq Structures, Proceedings, ASCE Structures Congress, D. R. Sherman, Ed., Orlando, Florida, Aug., pp. 404417.
Donahey, Rex C., and Darwin, David. (1986). "Perfomancc and Design of Composite Beams with Web Openings,"' SM Report No. 18, University of Kansas Center for Research, Lawrence, Kansas, Apr., 267 pp.
Donahey, Rex C., and Darwin, David. (1988). "Web Openings in Composite Beams with Ribbed Slabs," Journal of Structural En~neering, ASCE, VoL 114, No. 3, Mar., pp. 518-534.
Donoghue, C. Michael. (1982). i'Composite Beams with Web Openings: Design," JournaI of the Structural Division, ASCE, VoI. 108, No. ST12, Dec., pp. 2652-2667.
Dougherty, Brian K. (1980). "Elastic Deformation of Beams with Web Openings," Journal of the Structural: Division, ASCE, Vol. 106, No. STI, Jan., pp. 301-312.
Mughesty, Brian K. (1981). "Buckling of Web Posts in Perforated Beams," Journal of the Structural Division, ASCE, Vol. 107, No. ST 3, Mar., pp. 507-519.
Ellingwood, Bruce; Galambs, Theodore V.; MacGregor, James G.; and Cornell, C. AUin,. (1980). Development of a Probability Based Load Criterion for American National Standard 9 National Bureau of Standards, Washington, DC, June.
Frost, Ronald W.. Leffler, Robert E. (1 97 1). "Fatigue Tests of Beams with Rectangular Web HoIes," Journal of the Stmctvral Division, ASCE, Vol, 97, No. ST2, Feb., pp. 509-527.
Galamhs, Theodore V. (1978). ""Proposed Criteria for Load and Resistance Factor Design of Steel BuiIding Structures," Steel Research for Construction Bulletin No. 27, American Iron and Steel Institute, Washington, DC. Jan.
Galambos, Theodore V., and Ravindra, Mayasandra K. (1973). "Tentative Lead and Resistance Factor Design Criteria for Steel Buildings," Research Report No. 18, Civil Engineering Department, Washington University, St. Louis, Missouri, Sep.

Galambos, Theodore V., and Ravindm, Mayasandm K. (1976). "Load and Resistance Factor Design Criteria for Composite Beams," Research Report No. 44, Civil Engineerjng Department, Washington Univc~ity, St. Louis, Missouri, Apr.
Granade, Charles J. (1968). "An Investigation of Composite Beams having Large Rectangular Openings in Their Webs,'%.S. Thesis, University of Alabama, at University, Alabama, 61 pp.
Hansell, William C.; Galambos, Theodore V.; Ravindra, Mayasandra K.; and Viest, Ivan M. (1978). "Composite Beam Criteria in LRFD," Journal of the Sltmcturrtl Division, ASCE, Val. 1W, No. STY, Sep., pp. 1409-1426.
Kim, Kyu Suk. (1980). "An Experimental Study of H-Shape Beams with Role in Web," F Korean), JournaI of Architectural Tnstitutc of Korea, Vol. 24, No. 95, Aug., pp. 76-85.
hostman, Harry D.; Cooper, Peter B.; and Snell, Robert R. (1977). "Shear Force Distribution at Eccentric Web Openings," Journal of the Structural Division, A S E , Vol. 103, No. ST6, June, pp. 1276-1221.
Kussman, Richard L., and Cooper, Peter B. (1976). "Design Example for Beams with Web Openings," ATSC En!zineesing; Journal, VoI. 13, No. 2, pp. 48-56.
Load and Resistance Factor Desim Manual of Steel Construction. (1986). First Edition. American Institute of Steel Construction, Inc., Chicago, IL.
Load and Resistance Factor Design Specification for Structural Steel Buildings. (1986). American Institute of Stecl Construction. Inc.. Chicago, Illinois.
Lupien, Roger, and Redwood, Richard G. (1978). "Steel Beams wilh Web Openings Reinforced on One Side," Canadian Journal of Civil En~ineering, Vol. 5, No. 4, Dec., pp. 45 1-461.
McComick, Michael M. (1972a). "Opcn Web Beams - Behavior, Andysis and Design," Report, MRL 17/18, Melbourne Research Laboratories, The Broken Hill Proprietary Company Limited, Clayton, Vic., Australia, Feb., 195 pp.
McCormick, Michael M. (1972b). Discussion of "Suggested Design Guides for Beams with Web Holes," Journal of the StmctvraI Division, ASCE, Vol. 98, No. ST12, Dec., pp. 2814-2816.
Poumbouras, George. (1983). "Modification of a Theory Predicting the Shear Strength of Composite Beams with Large Web Openings," Project Report No. U83-20, Department of Civil Engineering and Applied Mechanics, McGill University, Montreal, Quebec, CanadaApr., 109 pp.
Rectanpular, Concentric and Eccentric Unreinforced Web Penetrations in Steel Beams - A Desim Aid. (1986). Revised Ed., ADUSS 27-8482-02, U.S. Steel Corp., Pittsburgh, Pennsylvania, Apr,, - 3 2 ~ ~ .
Rectangular, Concentric and Eccentric Reinforced Web Penetrations in Composite Steel Beams - A Design Aid. (1984). ADUSS 27-8532-01, US. Steel Corp., Pittsburgh, Pennsylvania, Oct., 27
Rectanmlar, Concentric and Eccentric Unreinforced Web Penetrations in Composite SteeI Beams - A Design Aid. (1981). ADUSS 27-7108-01, U.S. Steel Corp., Pittsburgh, Pennsylvania, June,
Redwood, Richard G. (1968a). "Plastic Behavior and Design of Beams with Web Openings," Proceedings, first Camdim Stmctusal Engineering Conference, Toronto, Canadian Steel Industries Construction Council, Toronto, Canada, Feb., pp. 127-158.
Redwood, Richard G. (1968b). "Ultimate Strength of Beams with Multiple Openings." P~print No. 757, ASCE Structural Engineering conference, Pittsburgh, Oct.
Redwood, Richard G. (1969). "The Strength of Steel Beams with Unreinforced Web Holes," Civil Eneineerin-4 and Public Works Review (London), VoI. M, No. 755, June, pp. 559-562.
Redwood, Richard G. (197 1). "Simplified Plastic Andy sis for Reinforced Web Holes," AISC Engineerin2 Journal, Vol. 8, No. 3, pp. 128-131.
Redwood, Richard 6. (3983). "Design of I-Beams with Web Perforations," Chapter 4, Beams and Beam Columns: Stability and Strenjgh, R. Narayanan, Ed., Applied Science Publishers, London and New York, pp. 95-133.
Redwood, Richard G. (1986). "Tile Design of Composite Beams with Web Openings," Proceedinns, Firs! Pacific Strtlcmral Steel Conference, Auktand, New Zealand, Vol. I , Aug.,pp. 169-185.
Redwood. Richard G.; Baranda. Heman; and Daly. Michael J . (1978). "Tests of Thin-Webkd Beams with Unreinfbsced HoIes," Journal of the Structural Division, A S E , Vol. 104, No. ST3, Mar., pp. 577-595.
Redwood. Richard G., and McCutcheon, John 0. (1968). "Beam Tests with Unreinforced Web Openings," Journal of the Structural Division, ASCE, Vol. 94, No. ST1, Jan., pp. 1-17.
Redwood, Richard G., and Poumbouras, George. (1983). "Tests of Composite Beams with Web Holes," Canadian Journal of Civil Enfineerinq, Vol. 10, No. 4, kc., pp 713-721.
Redwood, Richard G., and Poumbouras, George. (1 984). "Analysis of Composite Beams with Web Openings," Journal of Structural Engineering, ASCE, VoI. 1 10, No. ST9, Sep.. pp. 1949- 1958.
Redwood. Richard G., and Shrivastava, Suresh C. (1980). "Design Recommendations for Steel Beams with Web Holes," Canadian Journal of Civil Engineering, Vol. 7, No. 4, Dec., pp 642-650.
Redwood, Richard G., and Uenoya, Minoru. (I 979). "Critical Loads for Webs with Holes,"Journd of the Structural Division, ASCE, Vol. 105, No. STTO, Oct, pp. 2053-2076.
Redwood, Richard G., and Wong, Pahick K. (1982). "Web Holes in Composite Beams with SteeI Deck," Pmwedincs, Ei~hth Canadian Structurd Enfineering Conference, Canadian Steel Construction Council, Willowdale, Ontario. Canada, Feb.. 41 pp.
Structural: lnvestipation of a Typical moor Beam at the 200 West Adams Buildinn Chicago, Illinois. (1984). W E No. 840795, Wiss, Janney, Elstner Associates, Inc., Northbrook, Illinois, - Aug.. 21 pp.
"Suggested Design Guides for Beams with Web Holes." (1971). By the S u ~ m r n i m e on Beams with Web Openings of the Task Committee on Flexure Memlxrs of the Smctural Division. John E. Bower, Chmn., Journal of the Structural Division, ASCE, Vol. 97, No. ST1 1, Nov., pp. 2707-2728. Closure to Discussion, Vol. 99, No. ST.6, June 1973, pp. 1312-1315.
Todd, David M., and Cooper, Peter 3. (1980). ' S ~ t ~ n g t h of Composite Beams with Web Openings," Journal of the Structural Division, ASCE, VoI. 106, No. STZ, Feb., pp. 431-444.
Uenoya, Minoru, and Redwood, Richard G. (1978). "Buckling of Webs witb Openings," Computers and Structures, Vol. 9, No. 2, pp. 191-199.
Wang, Tsong-Miirt; SneU, Robert R.; and Cooper, Peter B. (1975). "Strength of Beams with Eccentric Reinforced Holes." Journal af the Structural Division, ASCE, Vol. 101, No. ST9, Sep., pp. 1783-1799.

53
Table 3.0 References Corresponding to Beam Designations
Designation Reference
Steel Beams
CS
CSK
DO
KKS
RBD
Composite Beams
D
CHO
WJE
Bower (1968)
Clawson and Darwin (1980)
Congdon and Redwood (1970)
Cooper and Snell (1972)
Cooper, Snell, and hostman (1972)
Doughterty (1980)
Kim (1980)
Redwood, Baranda, and Daly (1978)
Lupien and Redwood (1978)
Redwood and McCutcheon (1968)
Clawson and Danvin (1980)
Donahey and Darwin (1986)
Ch3 (1982)
tiranade (1968)
Redwood and Pournbouras (1 9 83)
Wiss, Janney, and Elstnet (1984)
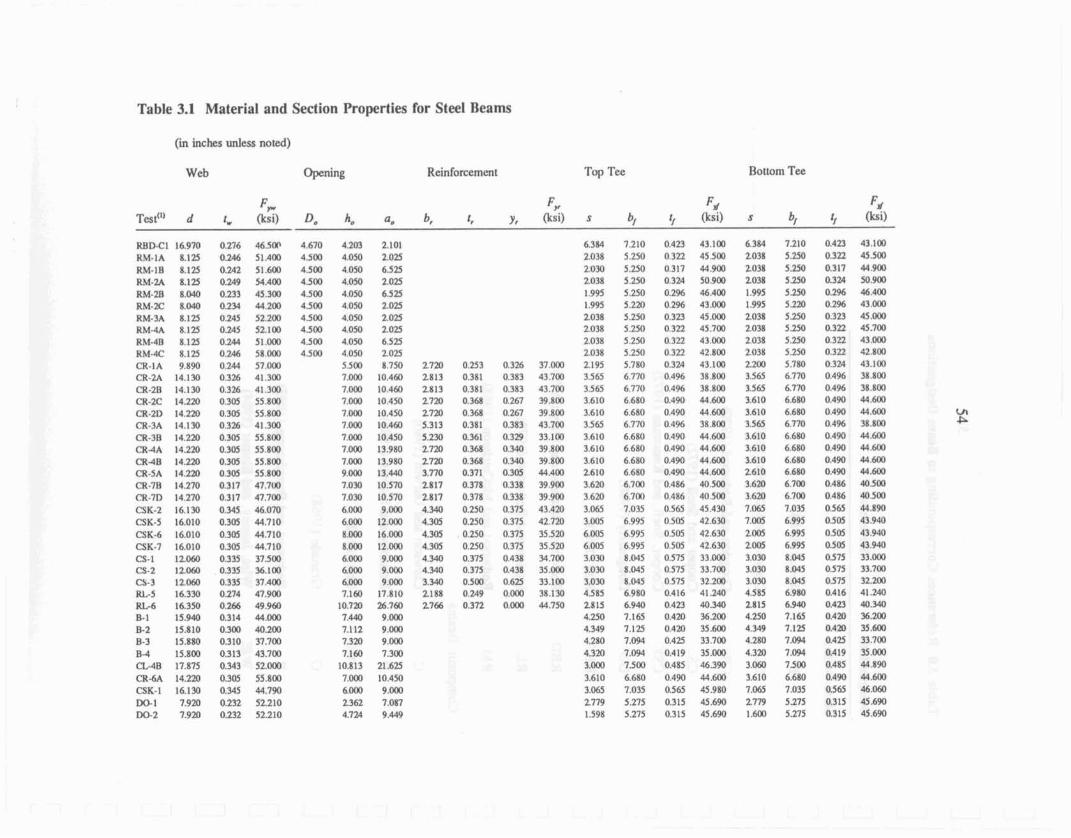
Table 3.1 Material and Section Properties for Steel Reams
(in hches unless noted)
Web Opening
Test'" d
Reinforcement
RBD-CI 16.970 RM-IA 8.125 RM-I0 8.125 RM-2A 8.125 RM-2R 8.WO R M - X 8.040 RM-3A 8.125 WM-4A 8 1 s RM-4B 8.123 RM-4C 8.125 CK-1 A 9.890 CR-ZA 14.130 CR-ZB 14.130 CR-2C 14.220 CR-ZR 14,2'M CH-3A 14.13[1 CR-3R 14.220 C R 4 A 14.220 CR4B 14220 CR-SA 14220 CR-7B 14.270 CK-7D 14.270 CSK-2 16.330 CSK-5 16.010 CSK-6 16.010 CSK-7 16.010 CS-I 12.w CS-2 1 2 . m CS-3 12.m RL.5 16.330 RL-6 16.350 B-1 15.940 B-2 15.810 B-3 15.880 B-4 15.800 &4B 17.875 CRaA 14.220 CSK-I 16.130 W-l 7.920 DO-2 7.920
Top Tee Rottom Tee

Table 3.1 (continued)
Web w i g Reinforcement Top Tse Bottom Tee
1. Refer to Table 3.0 for key to beam designations
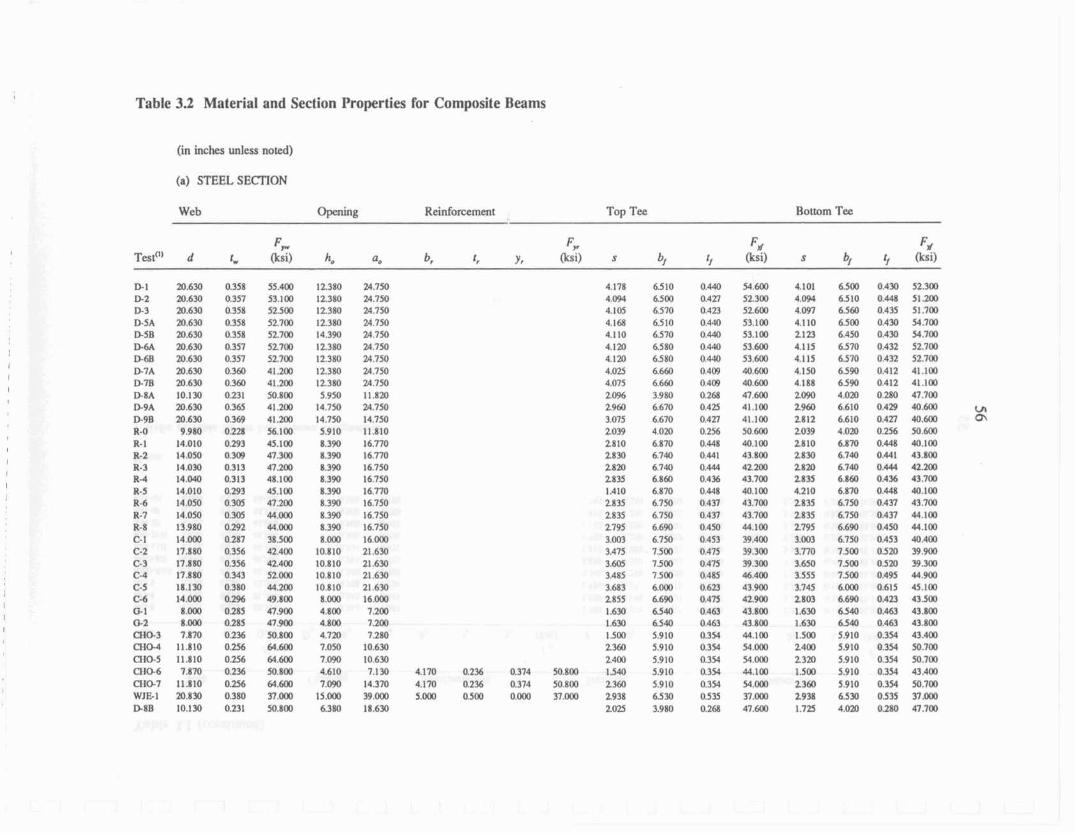
Table 3.2 Material and Section Properties for Composite Reams
(in inches unless noted)
(a ) STEEL SECTION
Web o w i n g Reinforcement Top Tee Rottorn Tee

Table 3.2 (continued)
Testu" Type (psi) b, 4' 4 4 W- W- wr f*,
TRIB TRlB TRIB TRIn TRI A THIR 1,HIl3 1.HI13 L R l U T H l H T H l R THlB T H l H T H l U TKlR TRIIt TRlR TRIH TRIR TKII3 TRIB 501, SOL SOL SOL SOL SOL SOL SOL SOL SOL SOL SOL SOL
TRll3 m a

Table 3.2 (continued)
(c) SHEAR CONNECTORS
F" A, & h*Q, R,*Q, L " F , , NZm N,(I) N,,O , (ksi) Dia. i n ) R," RIrn (k) (k) &) &)
D-1 D-2 U-3 D-5 A D 5 R D-6A D-&I3 D-?A 0-7B D-8A D 8 R D-9A 6-9t l R-O R-l R-2 R-3 K-4 R-5 R- 6 R-7 R-8 C- 1 C-2 C-3 c-4 C-5 C-6 G-1 G-2 CHO-3 CH04 CIIO-5 CHO-6 Cll#7 WIFxI
30m 3000 30.00 Ma) MOO 3000 3000 MOO 3000 19.39 W 85 n.92 30 39 30 39 OM om 000 0 0 0 000 000 om 0 0 0 001) 0 0 0 om 0.00 0.00 0.00 am 0 0 0 om 0 0 0 000 000 am 000
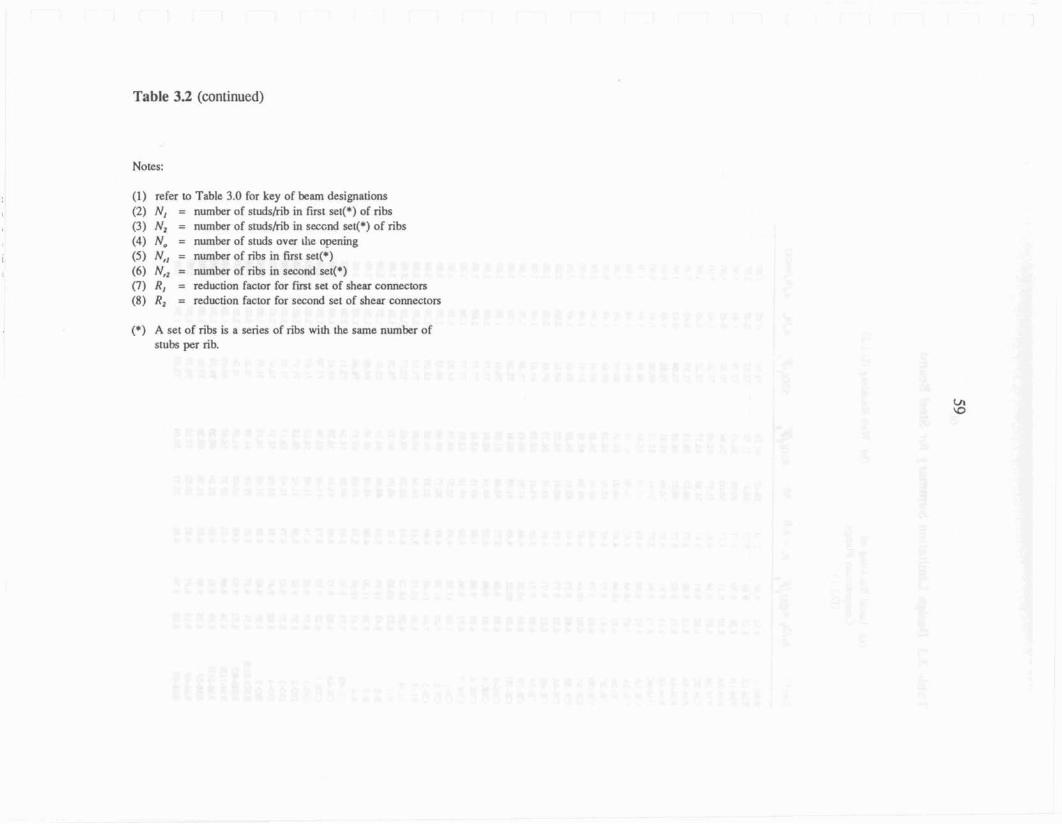
Table 3.2 (continued)
Notes:
(I) refer m Table 3.0 for key of beam designations (2) N, = number of studshib in Erst set(*) of ribs (3) hF1 = number of studsfrib in sec~nd set(*) of ribs (4) N, = number of studs over the opening (5 ) N,, = number of ribs in First set(*]
(6) N,, = number of ribs in second set(*)
(7) R, = reduction factor for h t set of shear connectors (8) R, = reduction Factor for second set of shear connectors
( *3 A set of ribs i s a series of sibs with the same number of stubs per rib.
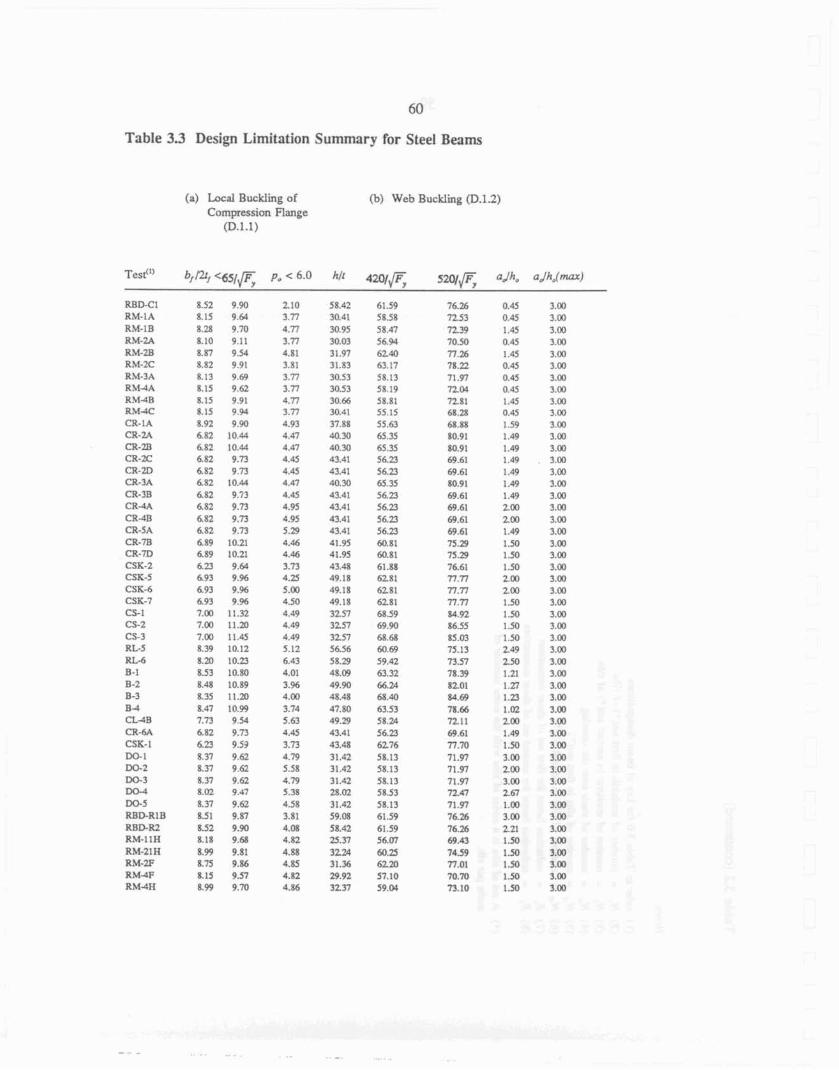
60
Table 3.3 Design Limitation Summary for Steel Beams
Test"'
RBD-CI RM-IA RM-IB RM-2.4 RM-ZB RW-2C RM-314 R M 4 A R.M4R R1W4C CR-IA CR-2.4 CR-2B CR-32 CR-2D CR-3A CR-3R CR4A C R 4 B CR-5A CR-7R CR-m CSK-2 CSK-5 CSK-6 CSK-7 CS- I CS-2 CS-3 RL-5 RL4 B-1 B-2 B-3 B 4 C M B C A-6.4 CSK-I DO-1 W-2 m3 D o 4 DO-S R B P R l B R B P W R M - l f H RM-21H RM-2F R M 4 F R M 4 H
(a) h a l Buckling of Compression Flange
(D.l.1)
@] Web Buckling (D.1.2)
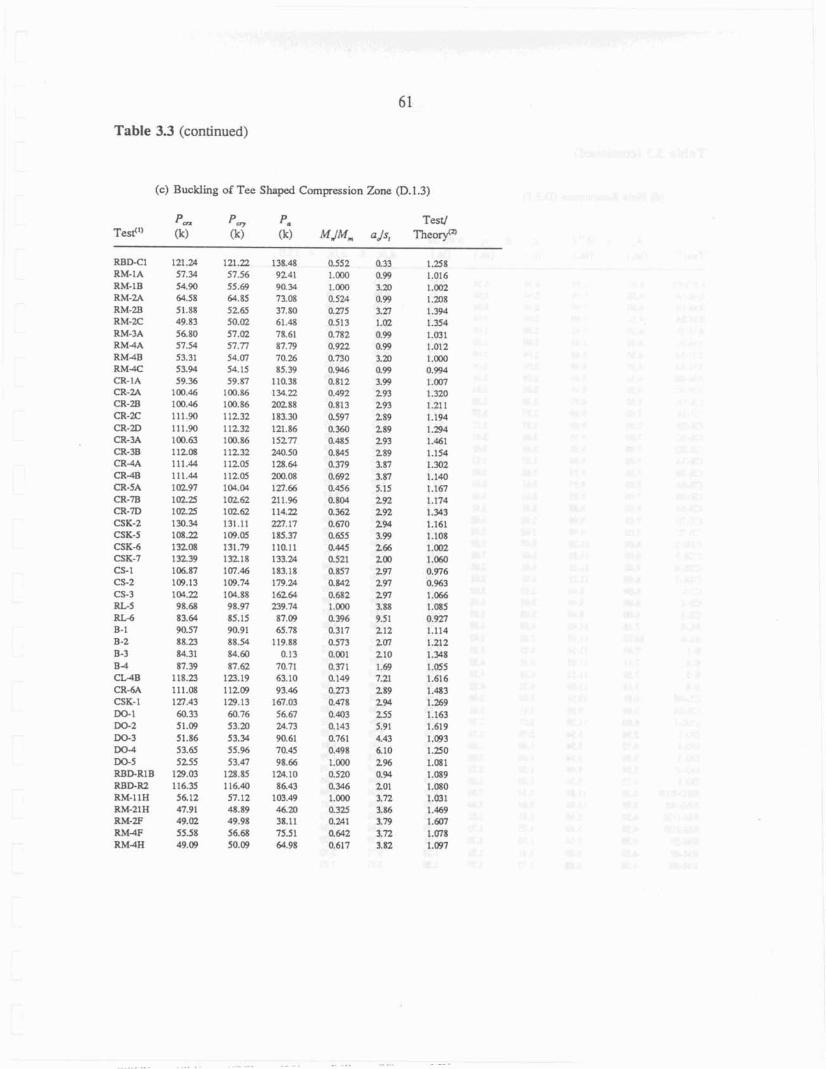
Table 3.3 (continued)
(c) Buckling of Tee Shaped Compression Zone (D.1.3)
R B D C l RM-I-IA RM*lB RM-2.4 RM-2B R>f-2C RM-3A R.Ua.4 RM4B R M 4 C CR-1A CR-2.4 CR-2B CR-aC CR-2D CR-3b CR-W CR-4A C R 4 B CR-SA CR-70 CR-m CSK-2 CSK-5 CSK-& CSK-7 CS- 1 CS-2 CS-3 RL-S R t b B-1 B-2 B-3 B 4 C L 4 B CR-6A CSK-I m1 W-2 Do-3 m4 DO-5 KBDRlB RBDR2 RM-11H RM-ZIH RM-ZF R M 4 F R M 4 H
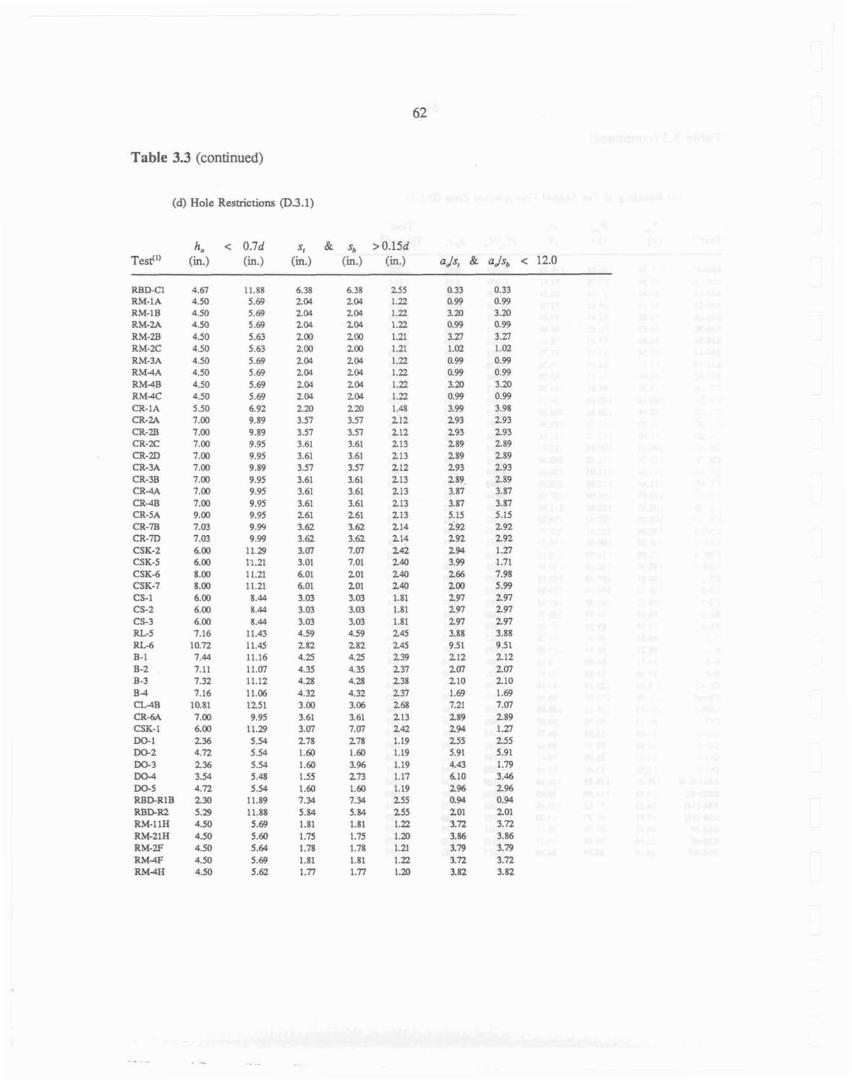
Table 3.3 (continued)
(d) Hole Reshictions (D3.1)
h, c 0.7d s, & s, > 0.1% Test""i.) (in.) (in.) (in.) (in.)
RBDCl RM-IA RM-1B R M - U RM-ZB RM-2C RM-3A R M 4 A RM4B RM4C CR-IA CR-2.4 CR-28 CR-2C CR-2D CR-3A CR-38 CR4A CR-43 CR-5A a - 7 B CR-m CSK-2 CSK-5 CSK-6 CSK-7 CS-l CS-2 CS-3 Rt-5 RG6 B-1 B-2 B-3 B 4 CL4B CK-6A CSK-I m1 DO-2 m3 Da4 W S RBD-RIB RBD-R2 RM-1131 RMZlH RM-2F RM4F RMdH
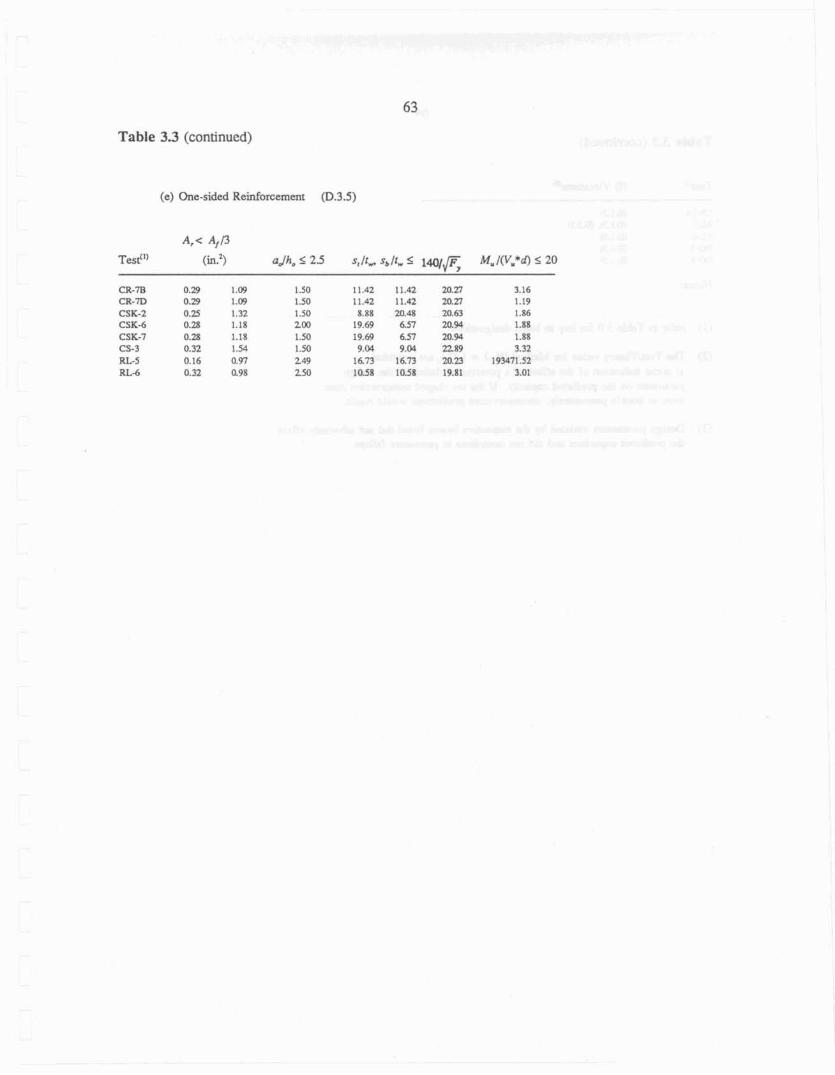
Table 33 (continued)
(e) One-sided Reinfofcemenr (D.3.5)
Test/') (in?) aJh0 5 23 s, / t , s, I f , 5 l q J - , M, I(V,*d) l 20
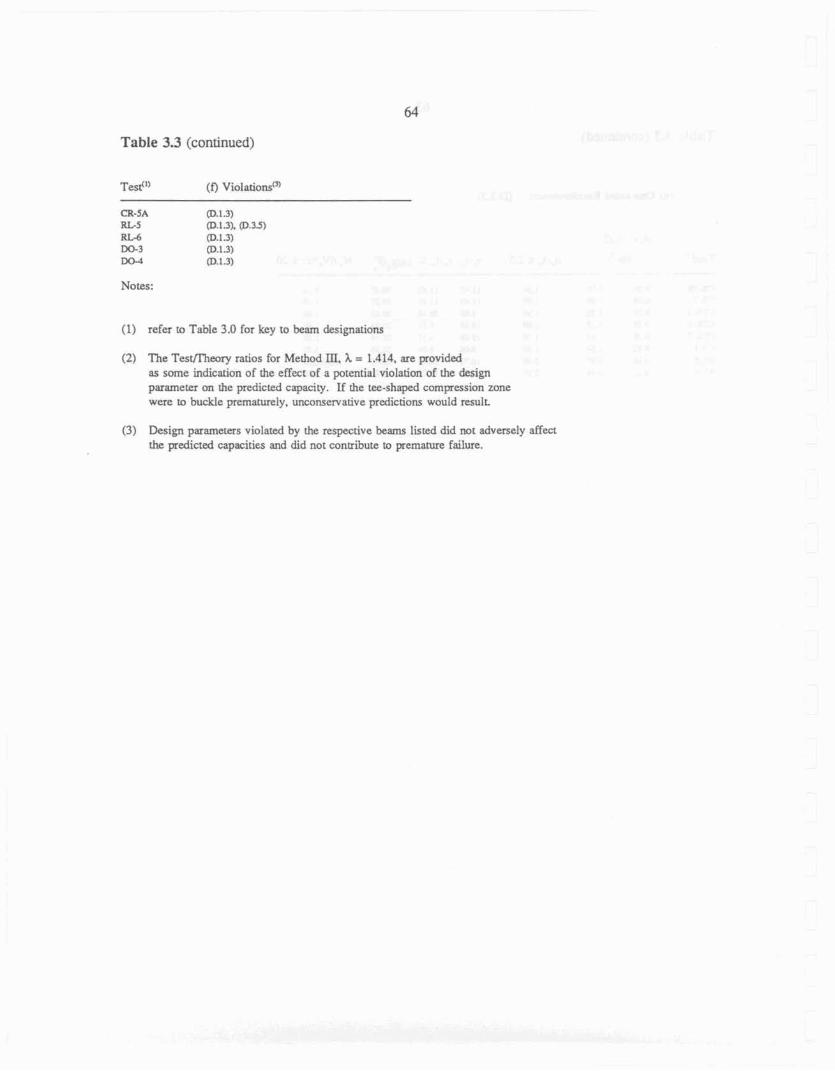
Table 3.3 (continued)
Notes:
(1) refer to Table 3.0 for key to beam designations
(2) The Test lThq ratios fm Method IH, k = 1.414, are provided as some indication of the effect of a potential violation of the design parameter on the predicted capacity. If the tee-shaped compression zone were to buckle prernarurely. unconservarive predictions would result.
(3) Design parameters violated by the respective beams listed did not adversely affect the prdicted capaciti~s and did not conkibute to premature failure.
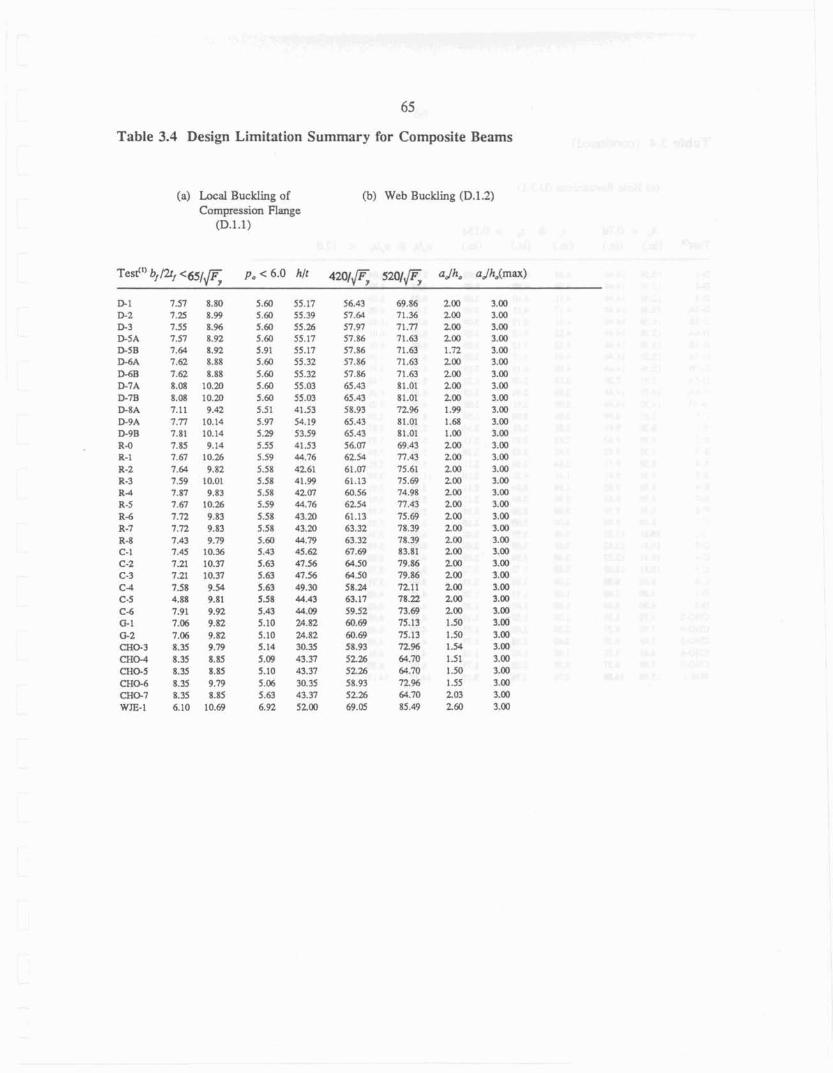
65
Table 3.4 Design Limitation Summary for Composite Beams
(a) Local Buckling of Compression Flange (D. I. 1)
(b) Web Buckling (D.1.2)

Table 3.4 (continued)
(c ) Hole Resaictions (D.3.1)
ha < 0.7d s, B s, > 0.1% Ted1' (in.) (in.) (in.) (in.) (in.)
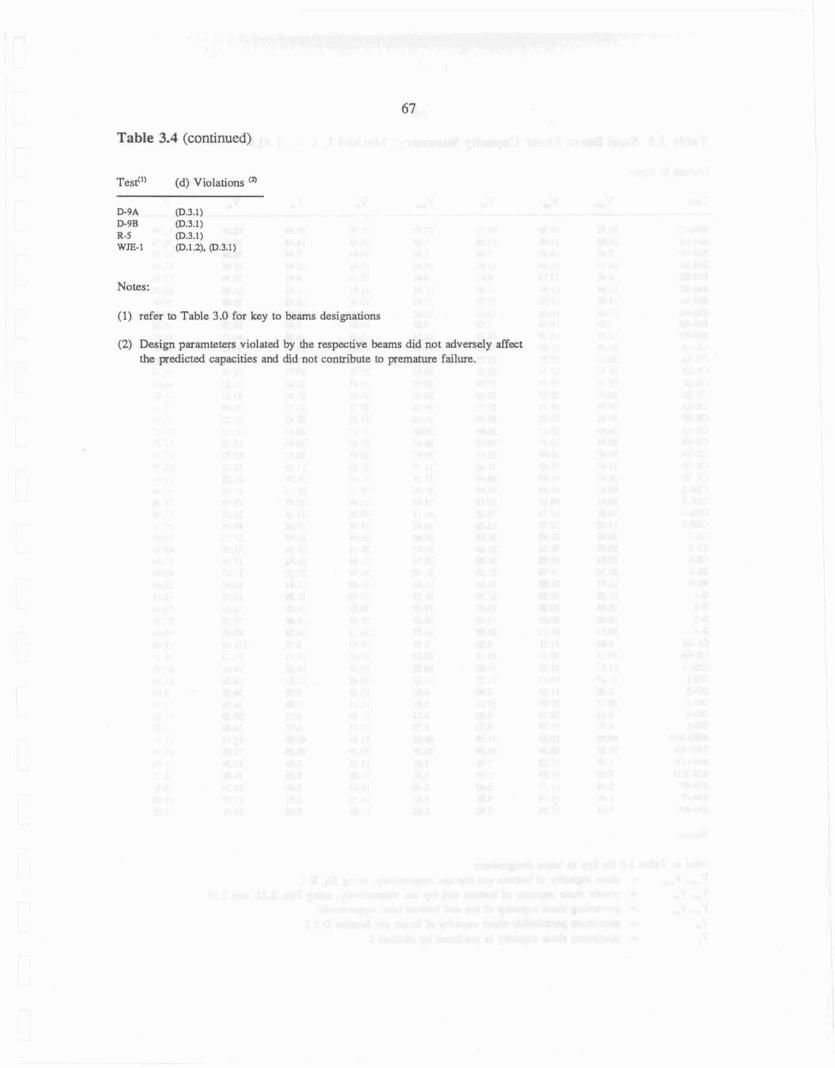
Table 3.4 (continued)
Test") (d) Violations
(1) refer ta Table 3.0 for key to beams designatims
(2) Design pmamteters violated by the respective beams did not adversely affect the predicted capacities and did not contribute to premature failure.
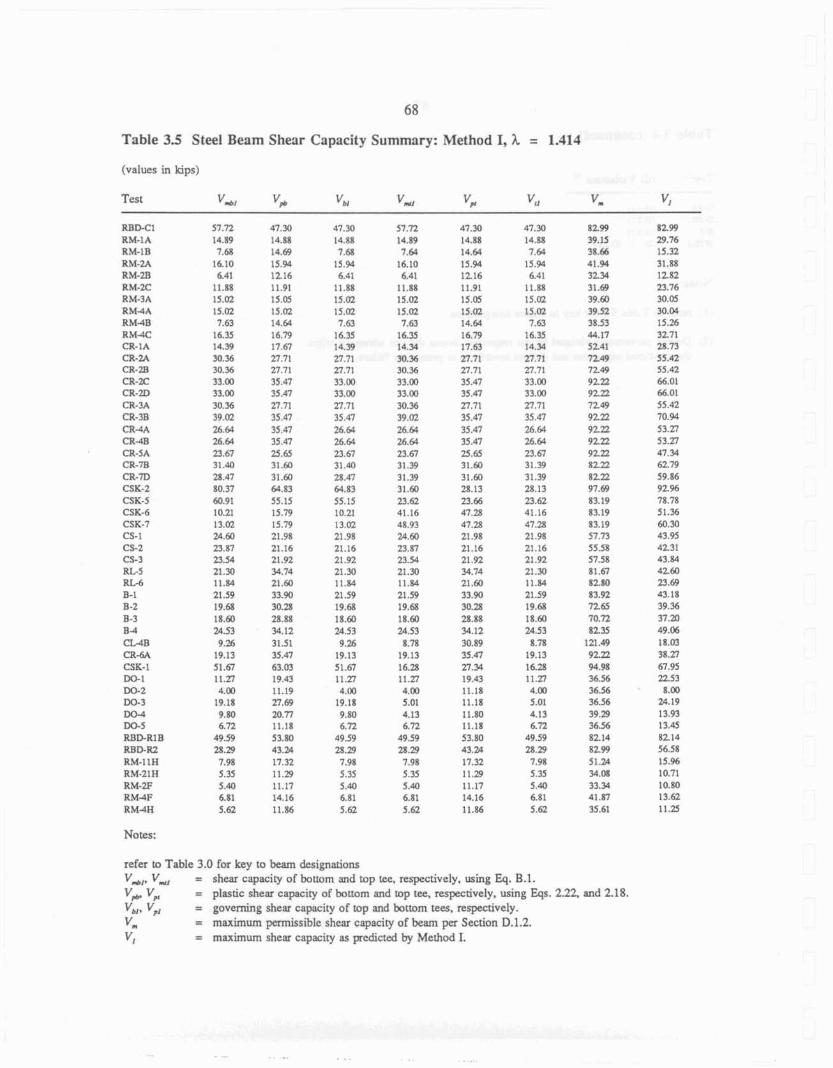
Table 3.5 Steel Beam Shear Capacity Summary: Method I, h = 1,414
(values in kips)
Test vnbl v*
RBD+Cl 57.72 47.30 RM-1A 14.89 14.88 RM-IR 7.M 14.69 RM-?A 16.10 15.94 RM-2B 6.41 12.16 RM-2C 11 .a8 11.91 RM-3A 15.02 15.05 RM4A 15.U2 15.02 R M 4 B 7.63 14.M R M d C 16.35 16.79 CR-1A 14.39 17.67 CR-?A 30.35 27.71 CR-2n 30.35 27.71 CR-2C 33.00 35.47 CR-2D 33.M) 35.47 CR-3.4 30 36 27.71 CR-3B 39.a2 35.47 c a -a~ 26.64 35.47 CRAB 26.64 35.47 CR-5A 23.67 25.6 CR-'IB 31 .a 31.W CR-7D 28.47 31.60 CSK-3 8a.n 64.83 CSK-5 M.91 55.15 CSK-6 10.21 15.79 CSK-'I 13.02 15.79 CS- l W.60 21.98 CS-2 23.87 21.16 CS-3 23.54 21.92 RL5 21.30 34.74 RL.4 11.84 21.60 B-1 21.59 33.W B-2 19.68 30.23 8 -3 18.60 28.88 R 4 24.53 34.12 C U B 9.26 31.51 CR4.4 19.13 35.47 CSK-I 5l.m 63.M DO-I r 1-27 19.43 W-2 4.00 11.19 DO-3 19.18 27.69 lm.4 9.w m.n DO-5 6.72 11.18 RBD-RIB 49.59 53.80 R B P R 2 28.29 43.24 RM-I1H 7.98 17.32 RM-21H 5.35 11.29 RM-2F 5.40 11.17 RM4F 6.81 14.16 RM4A 5.62 11.86
Notes:
refer to Table 3.0 for key to beam designations V,,, V, = shear capaciw of bottom and top tee, respectively, wing Eq. B.1.
v+- v~ = plastic shear capacity of bottom and top tee, respectively. using Eqs. 2.22 and 2.18.
v * i m V p ~ = governing shear capacity of top and bottom tees. respectively.
vM = maximum permissible shear capacity of beam per Section D.1.2. v, = maximum shear capacity as predicted by Method I.
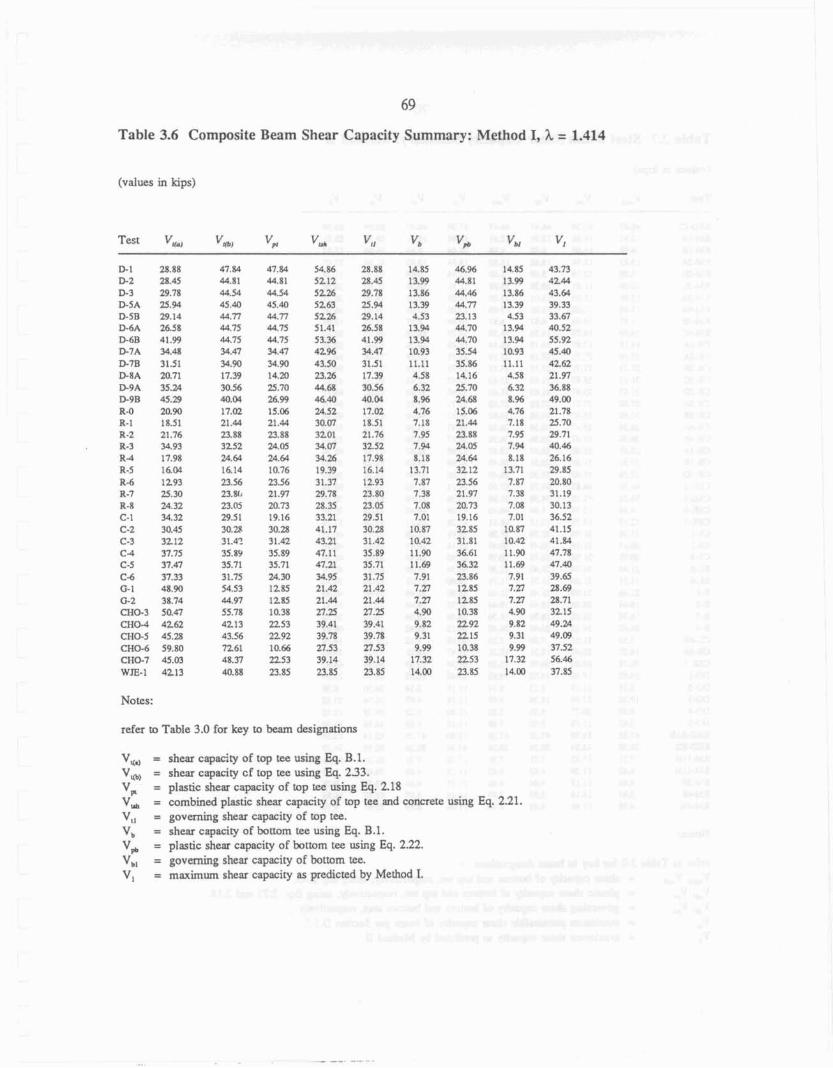
Table 3,6 Composite Beam Shear Capacity Summary: Method I, h = 1.414
(values in kips)
Test
D- 1 D-2 D.3 P 5 A D*5B D 6 A D-6R D7.4 D=IB D-814 P 9 A D9B R-O A-1 R-2 R-3 R 4 R-5 R-6 R-7 R-Il C-l C-2 C-3 C-4 C.5: C-5 GI '3-2 CH03 cm-4 c 3 o . 5 CnO-6 CH O=I W E - I
Notes:
refer to Table 3.0 for key to beam designations
shear capachy of top tee using Eq. B. 1. shear capacity cf top tee using Eq. 2.33. plastic shear capacity of top tee using Eq. 218 combined plastic shear capacity of top tee and concrete using Eq. 2.21. governing shear capacity of 'top tee. shear capacity of bottom tee using Eq. B.1. plastic shear capacity of ht tom tee using Eq. 2-22. governing shew capacity of bottom tee. maximum shear capaciq as predicted by Method I.
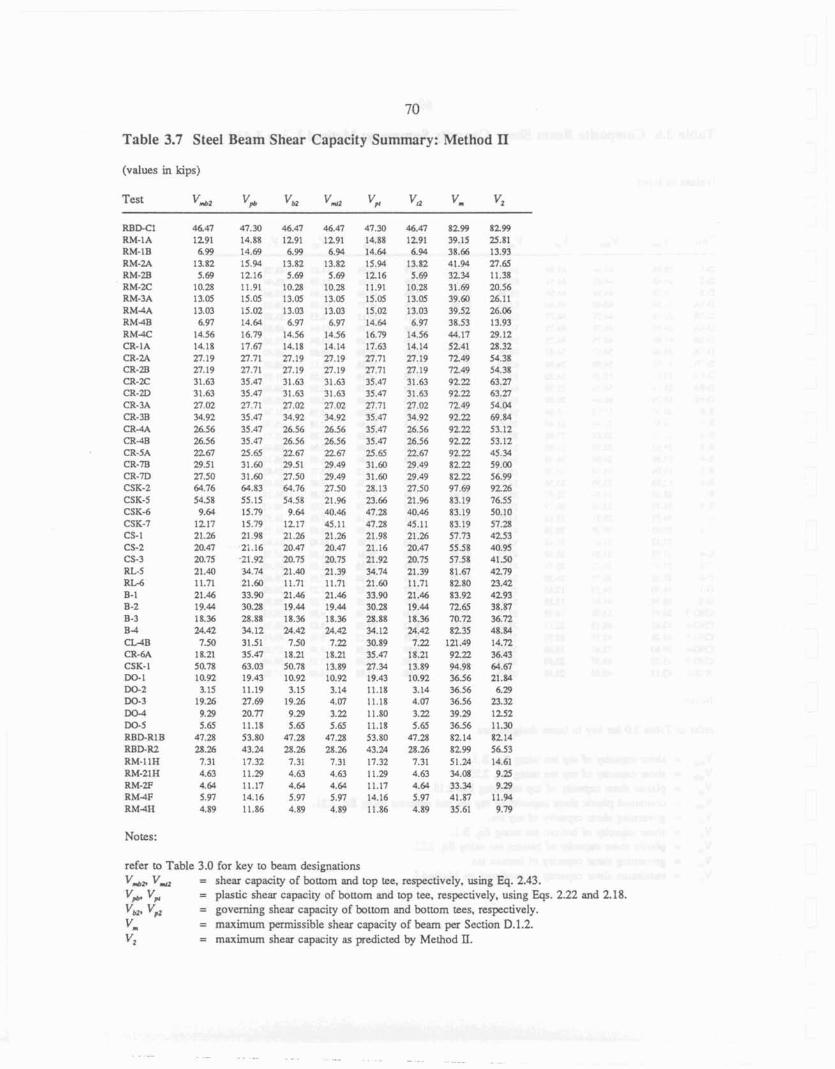
Table 3.7 Steel Beam Shear Capacity Summary: Method Il
(values in kips)
Test Vnbz VM Vbz V d V va v- Vt
R B P C l RM-1A RM-IH RM-2A RM-2B RM-2C R M 3 A RM4A R M 4 B R M N CR-IA CR-2-4 CR-ZB CR-2C CR-2D CR-3.4 CR-3R CR-4A CR-48 CR-5 A CR-m CR-m CSK-2 CSK-S CSK-6 CSK-7 CS-1 CS-2 CS-3 RL-5 R M B-l B-2 B-3 B 4 C U E CR-6A CSGE DO-1 W-2 Do-3 W-l D0.5 RED-RI B RBQ-R2 RM-11B RM-21H R M + E R , W F R M 4 H
Notes:
refer to Table 3.0 for key to beam designations V,, V, = shear capacity of battorn and top tee, respectively. using Eq. 2.43.
Ye v~ = plastic shear capacity OF bottom and top tee, respectively, using Eqs. 2.22 and 2.18. vm v3 = govcming sheat capacity of h t t o m and bottom tees, respectivefy.
vm = maximum permissible shear capacity of beam pa Section 0.1.2. v2 = maximum shear capacity as predicted by Method IL.

Table 3.8 Composite Beam Shear Capacity Summary: Method II
(values in kips)
Test VNa,
Dl 29.00 D-2 29.n D-3 30.48 D 5 A 26.40 D-513 29.93 D - 6 ~ n.01 B 6 B 41.03 D-7A 327'7 D78 31.36 D 8 A 0.m D-9A D.[Y) D-9B 0.00 R 4 0.00 PI-1 17.84 R-2 21.87 R-3 0.m R 4 18.64 R-5 0.00 R-6 1248 R.7 0.00 R.8 0.03 C-1 0.00 C-Z 29.41 C-3 30.74 C 4 35.29 C-5 34.90 ca 0.00 G-l 0.00 G 2 0.00 ma3 0.m 4x04 0.00 CHO-5 0.00 C H M 0.03 6HG7 0.00 WJE-I 0.00
Notes:
refer to Table 3.0 for key to beam designations
shear capacity of top tee using Eq. 2.43 shear capacity of top tee using Eq. 2.46. plastic shear capacity of top tee using Eq. 2-18 combined plastic shear capacity OF top tee and concrete using Eq. 2.21. governing shear capacity of top tee. shear capacit~l of bottom tee using Eq. 243. plastic shear capacity of ;bottom tee using Q. 2.22. governing shear capacity of bottom tee. maximum shear capacity as predicted by Method II.
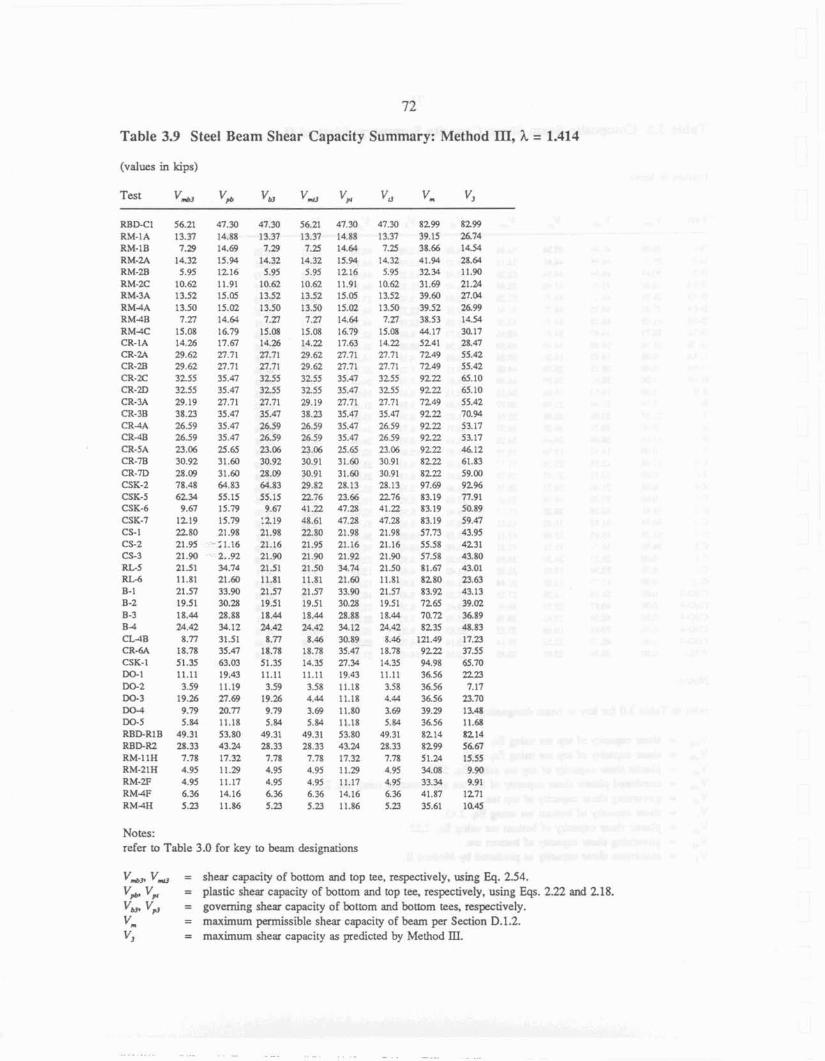
Table 3.9 Steel Beam Shear Capacity Summary: Method m, h = 1.414
(values in kips)
Test
RBD-Ct RM-IA RMlB R M - 2 4 RM-2B RM-2C RM-3A RM4A R M 4 E R M X CR-IA CR-2A CR-2B CR-2C CR-2D CR-3A CR- 3B CR-4A CR-4B EX-5A CR-7B CR-m CSK-2 CSK-5 CSK-6 CSK-7 CS-I CS-Z CS-3 A t 5 Rt6 B-1 B -2 B-3 Bd CLdB CR-M CSK-I w-1 D a 2 DO-3 DO-4 W-5 RBD-R1 B R B D R 2 RM-1TH RM-21H RM-2F R M 4 F RM4H
Notes: refer to Table 3.0 for key to beam designations
V,, V, = shear capacity of bottom and top tee, respectively. wing Eq. 2.54.
V,, V, = plastic shear capacity of h a o m and top tee. respectiveIy, using Eqs. 2.22 and 218. V,, V, = governing shear capacity of bottom and bamm tees, respectively. vm = maximum permissible shear capacity of beam per Section D. 1.2. VJ = maximum shear capacity as predicted by Method Dl.
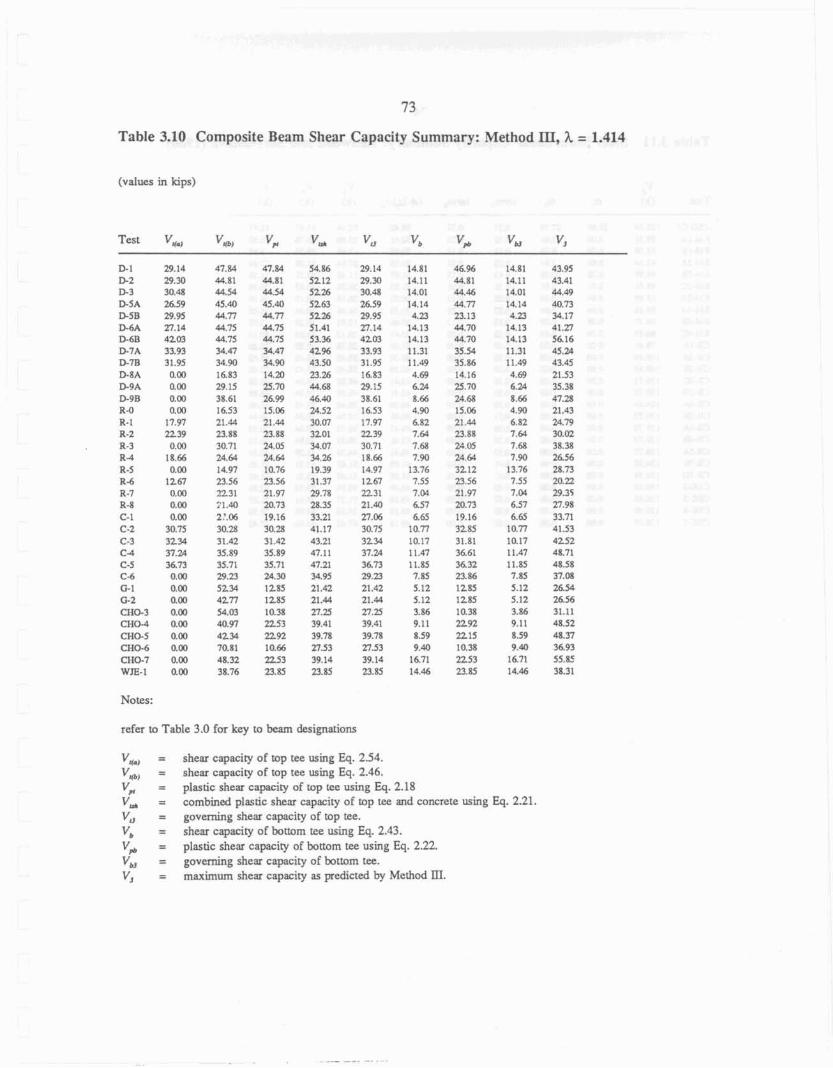
Table 3.10 Composite Beam Shear Capacity Summary: Method EX, h = 1.414
(values in kips)
refer to Table 3.0 for key to beam designations
she= capacity of top tee using Eq. 2.54. shear capacity of top tee using Eq. 2.46. plastic shear capacity of top tee using Eq. 2.18 combined plastic shear capacity of top tee and concrete using Eq. 2.21. governing shear capacity of top tee. shear capacity of bottom tee using Eq. 2.43. plastic shear capacity of bottom tee using Eq. 2.22. governing shear capacity of bottom tee. maximum shear capacity as predicted by Method 111.
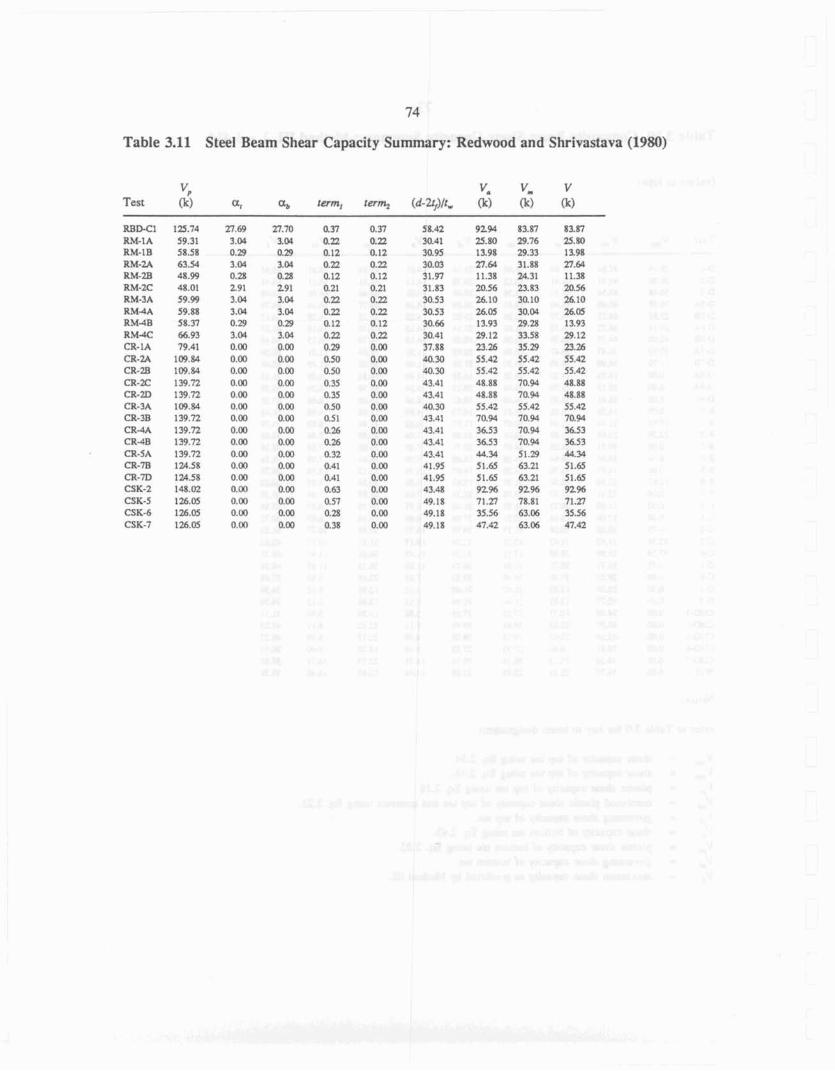
Table 3.11 Steel Beam Shear Capacity Summary: Redwood and Shrivastava (1980)
v, Test Ik) 01, a, term, term,
R8BC1 RM-IA R M l B RM-9-24 RM-2E RM-2C RM-3A RMJA R M 4 R R M 4 C CR-IA CR-24 CR-2& CR-2C CR-ZD CR-3A CR-3B CR-4A CR4B CR-5A CR-7B CR-7Q CSK-2 CSK-5 CSK-6 CSK-7
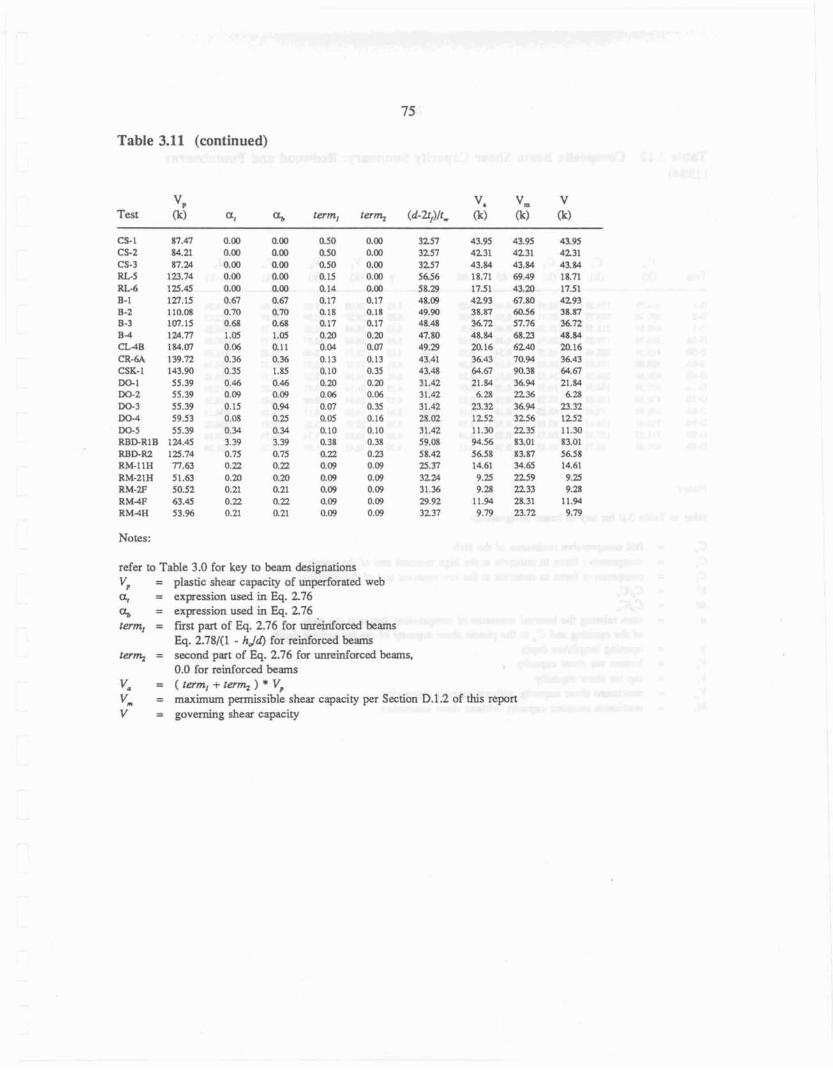
Table 3.11 (continued)
VP v, v, Y Test (k) a, term, term, d l (k) 6) Ik)
CS-I Cs-2 CS-3 RL5 RL-6 B-1 B-2 B-3 B 4 aaB CF-6.4 CSK- I D o 1 W - 2 W 3 W-4 DO-5 RBD-RIB RBIE W RM-I1 W RM-21H RM-2F R M 4 F R M 4 H
0 . 0 0.00 0.50 0.00 3257 43.95 43.95 0.m a.m aso 0.m 3x57 4x31 4231 0.00 0.00 0.50 0.00 3257 43.84 43.84 0.00 0.00 0.15 0.00 56.56 18.71 69.49 0.00 QW 0.14 0.00 58.29 17.51 43.20 0.67 0.67 0.17 0-17 48.W 4293 67.80 0.70 0.70 0.18 0.18 49.9.90 3Z.m M56 0.68 0.H 0.17 0.17 48.48 36.72 57.76 1.05 1.05 0 . B 0.m 47.40 48.84 68.P O.M 0.11 0 0.07 49.29 20.16 6240 0.36 0.36 0.13 0.13 43Al 36.43 70.96 0.35 1.85 0.10 0.35 43.48 64.67 90.38 0.4 0.66 0.20 0.M 31.42 21.811 36.W 0.09 0.09 0.06 0.M 31.42 6.23 2236 0.15 0.94 0.07 0.35 31.42 23.32 36.94 0 OR 025 Q 05 0.16 28.02 1252 3256 0.34 0.34 0.10 0.10 3t.42 11.30 2L35 3.39 3.39 0.38 0.38 59.08 94.56 83.01 0.75 0.75 0.22 0.B 58.42 56.58 83.81 0 . 2 0 . z 0.m 0.09 21.37 14.61 34.65 0.20 0.20 0.09 0.09 3224 9.25 2259 0.21 0.21 0.09 0.09 3 1 . 3 9.28 2233 0.22 0.Z 0.W 0.09 29.92 11.W 28.31 0.21 0.21 QW 0.09 3237 9.79 23.72
Notes:
refer to Table 3.0 for key to beam designations V = plastic shear capacity of unperforatd web a, = expression used in Eq. 2.76 a, = expression used in Eq. 2.76 term, = fnst part of Eq. 2.76 for unreinfmed beams
Eq. 2.781(1 - h J 4 for reinforced k a m s term, = second part of Eq. 2.76 for unreinfmced beams,
0.0 for Teinforced beams v* = term, + ter- ) * v, Vm = maximum permissible shear capacity per Smtion D.1.2 of this report V = governing shear capacity
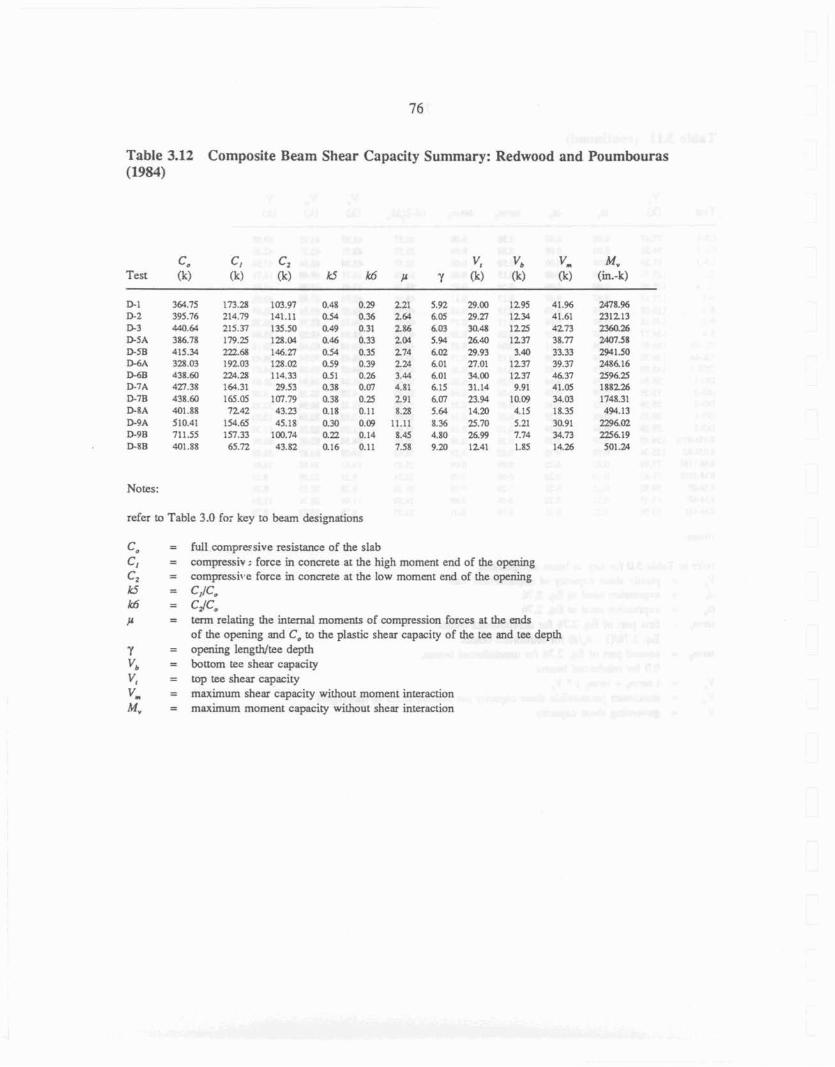
Table 3.12 Composite Beam Shear Capacity Summary: Redwood and Poumhuras (1984)
c, c, cz v, v, v, M, Test (k) (k) (k) k6 p Y (k) (kj 04 (in.-k)
Notes:
ref- to TabIe 3.0 for key to beam designations
fuIl mmpresive resistance of the sIab compressiv : force in concrete at the high moment end of the opening cornpressiq.c force in concrete at the low moment end of the opening c,/c* C4Ca term relating the in- moments of compression forces at the ends of the opening and C, to the plastic she= capacity of the tee and tee depth opening length/tee depth bottom tee shear capacity top tee shear capacity maximum shear capacity without moment interaction maximum moment capacity without shear interaction

77
Table 3.13 Steel Beam Capacity Summary: Method I, h = 1.414
Cicular Opening
vm MI, vm, Mn \ Test/ (k) lm.-k) (k) lm.-k) (k) Theory
Mepn ........................ 1.088 Cocffient of Variation . . . . . . . . . . . 0.1 I9 Rtsirmncc Rmr . . . . . . . . . . . . . . . . 0.889
Rectangular Opening
B-1 B-2 B-3 B 4 C U B CR-M CSK-1 Do.1 DO-2 DO-3 Da4 m 5 RBD-RIB RBDR2 RM-EIH RM-21 H RM-2F RM-4F RMdH
........................ M u n 1113 Cdtimn d Variatim . . . . . . . . . . . 0.142 Rsiswcc Factor . . . . . . . . . . . . . . . . 0.963
Mean ........... 1.170 Cafficien of Variation . . . . . . . . . . . 0.143 R d n a Famr ........... 0.923
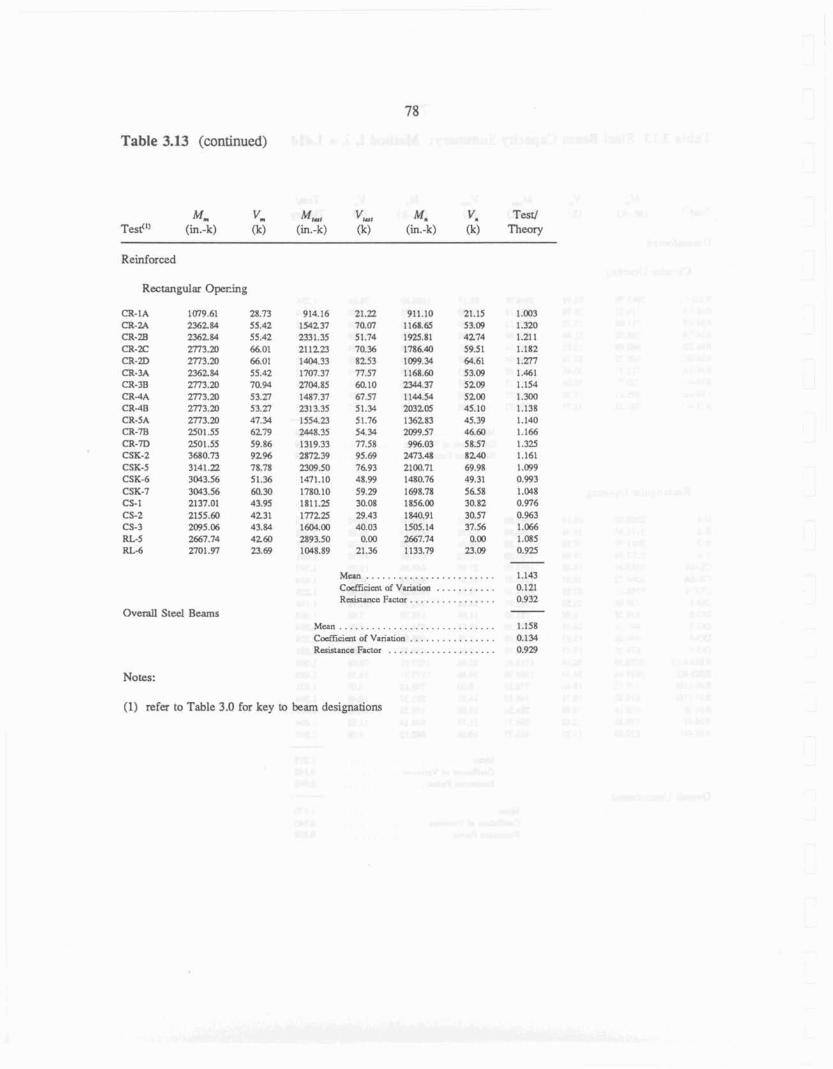
TabIe 3.13 (continued)
v, M,-, Test?? (in--k) (k) (in.-k)
Reinforced
Rectangular Oper-ing
CR-1A CR-2A CR-Z3 CR-2C CR-ZD CR-3A CR-3R CR-4A CR-4A CReSA CR-7B CR-7D CSK-2 CSK-5 CSK-6 C S K-7 CS-I CS-2 CS-3 RL-5 RL6
O v e d Steel Beams
Notes:
Mean ........................ 1,143 ........... Cafficimr of Vinaliun 0.121
Resistance Fa-. ............... 0.932
Mean ............................. 1.158 ................ CdEicnt of Variatim 0.1 34
Resisranm Factor .................... 0.929
(1) refer to Table 3.0 for key to beam designations
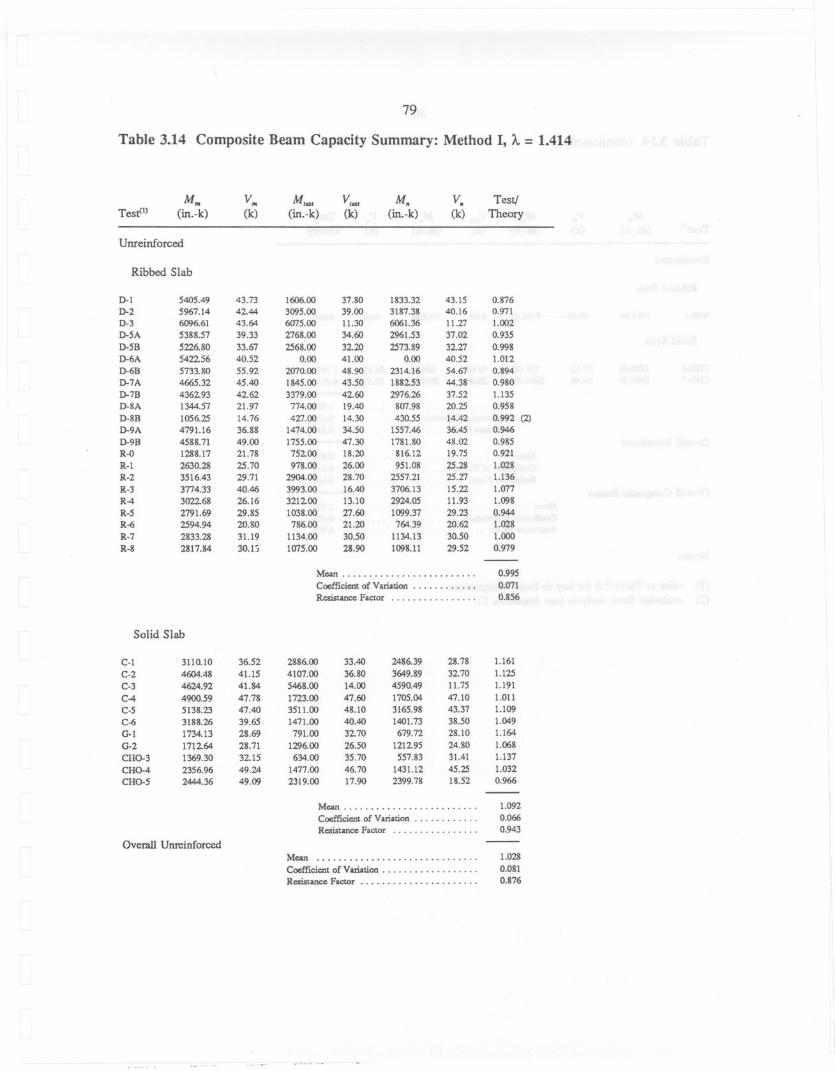
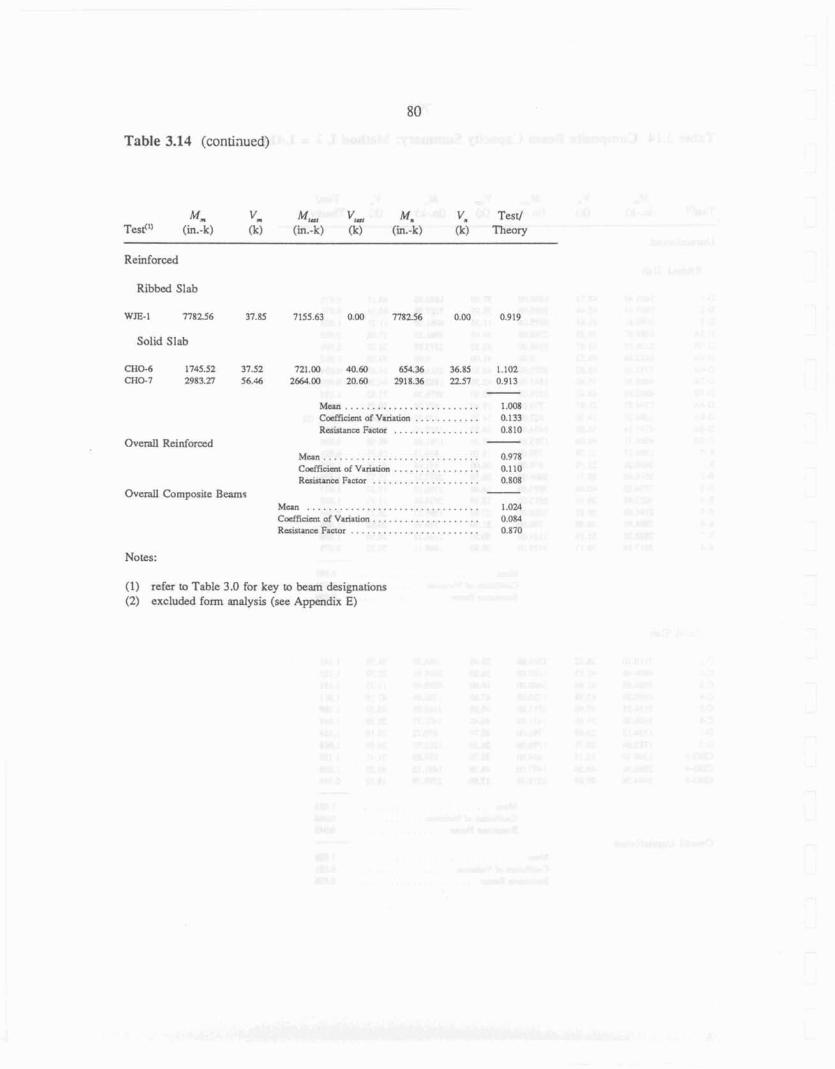
Table 3.14 (continued)
Reinforced
Ribbed Slab
W E - I 7782.56 37.85 7155.63 0.W 778256 0.00 0.919
Solid Slab
Rcsiaancc Factor . . . . . . . . . . . Overall Reinforced
Mcan . . . . . . . . . . . . . . . . . . . . . . . . . . . . . Coeff~cimt of Variatim . . . . . . . . . . . . . . . Rcslstance Fanor . . . . . . . . . . . . . . . . . . . .
Overall Composite Beamr M a n . . . . . . . . . . . . . . . . . . . . . . . . . . . . . . . .
. . . . . . . . . . . . . . . . . . . . C&cim of Vanation R m t a n c c Facm . . . . . . . . . . . . . . . . . . . . . . . .
Notes:
(1) refer to Table 3.0 for key to beam designations (2) excluded form malysis (see Appendix E)
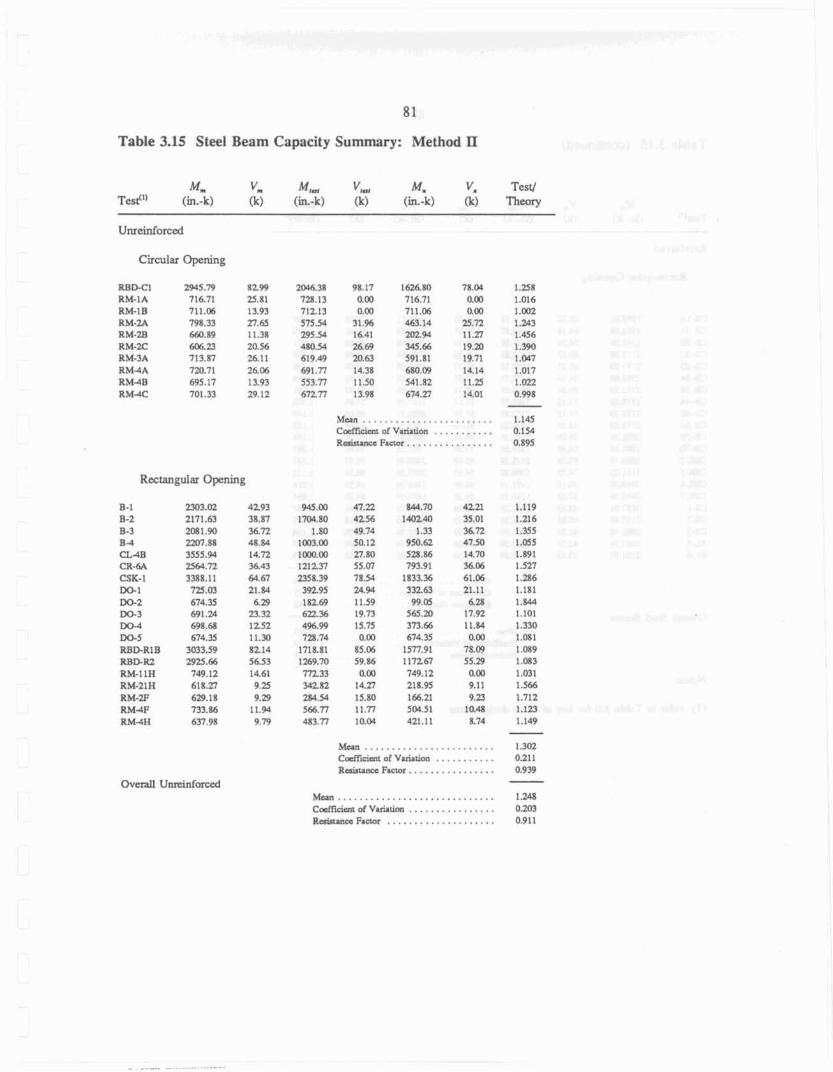
Table 3.15 SteeI Beam Capacity Summary: Method TI
Mm v, M , V,, Mm V, Test/ Test""in.-k) (k) (h.-k) Ikl (in.-k) (k) Theoty
M a n . . . . . . . . . . . . . . . . . . . . . . . . 1.145 CotfTini of Variation . . . . . . . . . . . 0.141
............... R&me Fanor. 0.895
RectanguIar Opening
Overall Unreinfwced ...................... M a n . . . . . . . 1.248
................ C a f i c i s u of Variation 0.203 .................... Rcgistpnec Famr 0.911
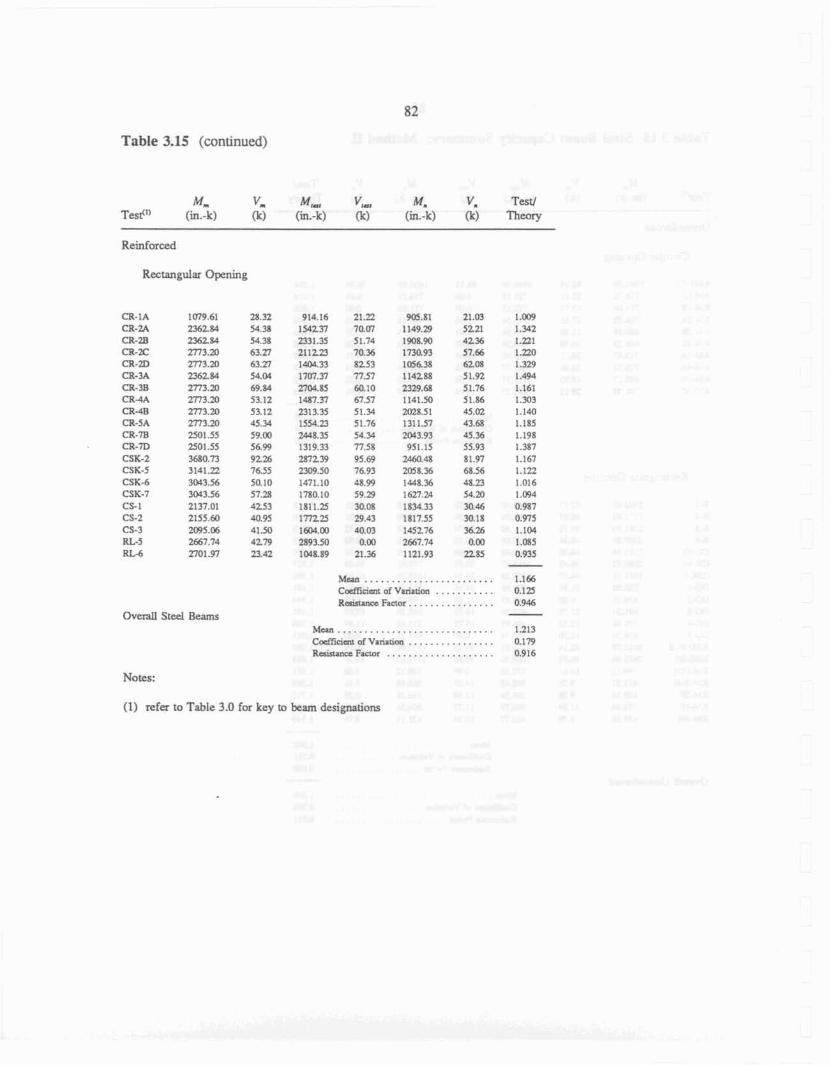
Table 3.15 (continued)
M , vm MM VM M, V, Test/ Test'" (in.-k) Ik) h - k ) Ik) h . - k ) (k) n~
Reinfarced
Rectangular Opening
a - I A 1079.61 CR-2A 236284 CR-28 u6284 CR-2C 2T73.20 CR-2D m3.m CR-3A 236284 a - 3 B ZT'3.m CR-4A Zn3.20 C R 4 B 2773.23 CR-5A m3.20 CR-70 2501.55 CR-7D 2501.55 CSK-2 3680.73 CSK-5 3141.22 CSK-6 3W3.56 CSK-7 3043.56 CS-I 2137.01 CS-2 2155.60 CS-3 2055% R L 5 2667.74 RL-6 2702.97
Overall Steel Beams
........................ M a 1.166 Cafficicnt of Variation . . . . . . . . . . . 0.1 25 Rcsist4na Factor. ............... 0.946 -
.... M - n . . . . . . . . . . . . . . . . . . . . . . . . . 1213 Cocflitimt of Variation ................ 0.179 R-ancc Fa- .................... 0.916
Notes:
(1) refer to Table 3.0 for key to beam designations
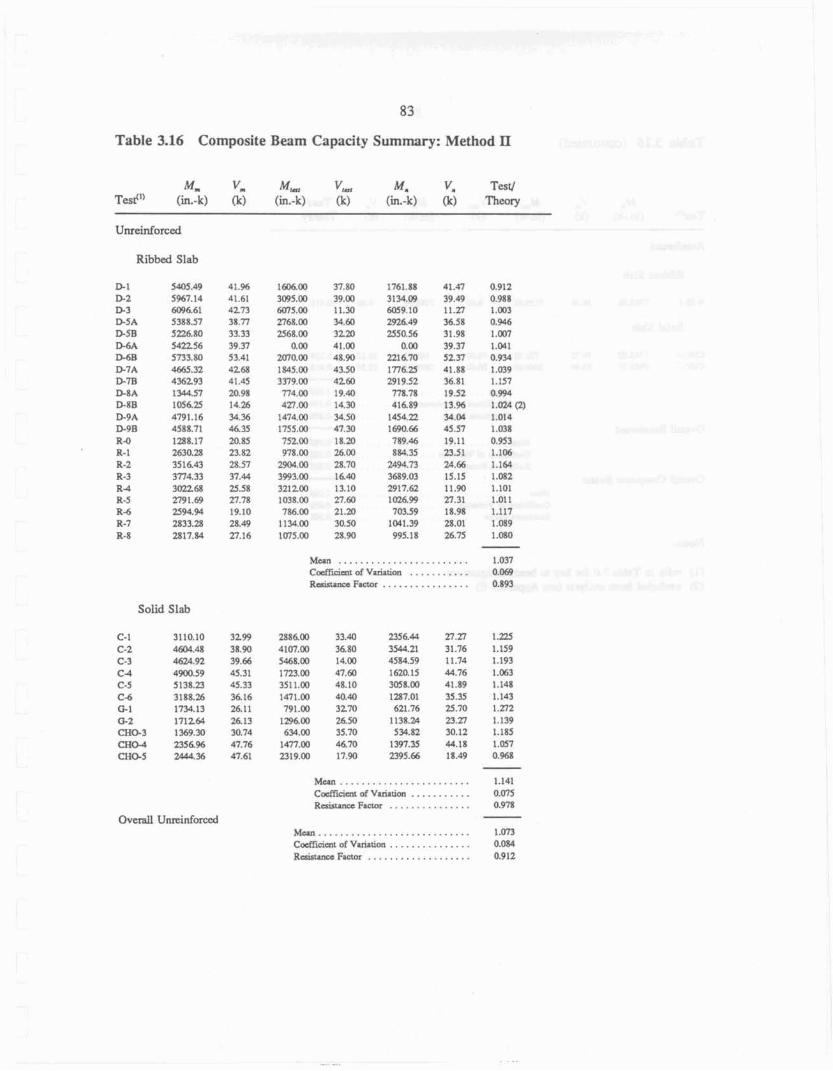
Table 3.16 Composite Beam Capacity Summary: Method I1
Ribbed Slab
Mcan ........................ Codician of Variation ........... R m n m r Factor ................
........................ Mran 1.141 ........... cocr1Cicnt of vrrintim 0.075
. . . . . . . . . . . . . . . R e k u n c e Factor 0.971
.................. M e a n . . . . . . . . . . 1.073 ............... Cwfficknt of Variation 0.084
R&arsccFactor ................... 0.912
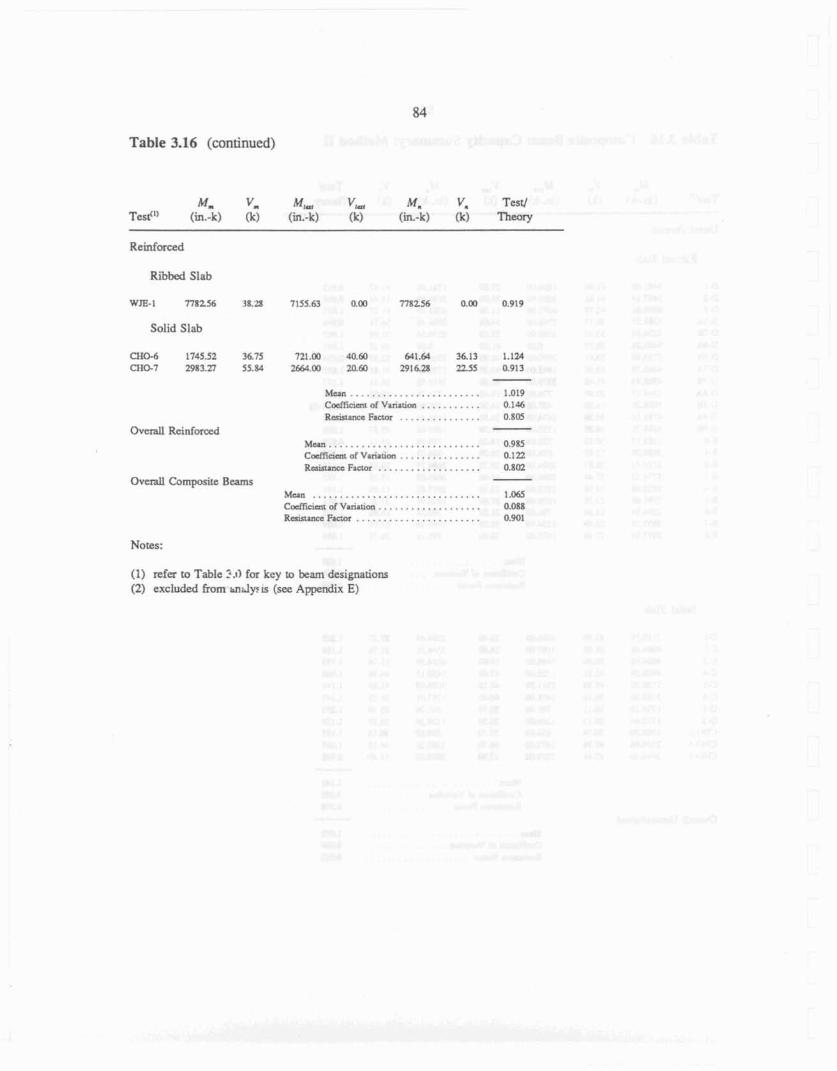
Table 3.16 (continued)
M, vm hP,, VIPI M m V Test/ TesP [in.-k) (k) (in.-k) (k) - (k) Themy
Ribbed Slab
SaIid Slab
Muul . . . . . . . . . . . . . . . . . . . . . . Cocfficlcnt of Variation . . . . . . . . . . . Rcnstancc Fanor . . . . . . . . . . . . . . .
Q v d Reinforced Mean . . . . . . . . . . . . . . . . . . . . . . . . . . . .
............... C.~cfficimt of Variation R&tmec Factor . . . . . . . . . . . . . . . . . . .
Overall Composite Beams Mean ............................... Cocffieinn of Variation ................... RmsumFactor .......................
Notes:
(1) refer to Table ?.tl for key to beam designations (2) excluded from maly LS (see Appendix E)
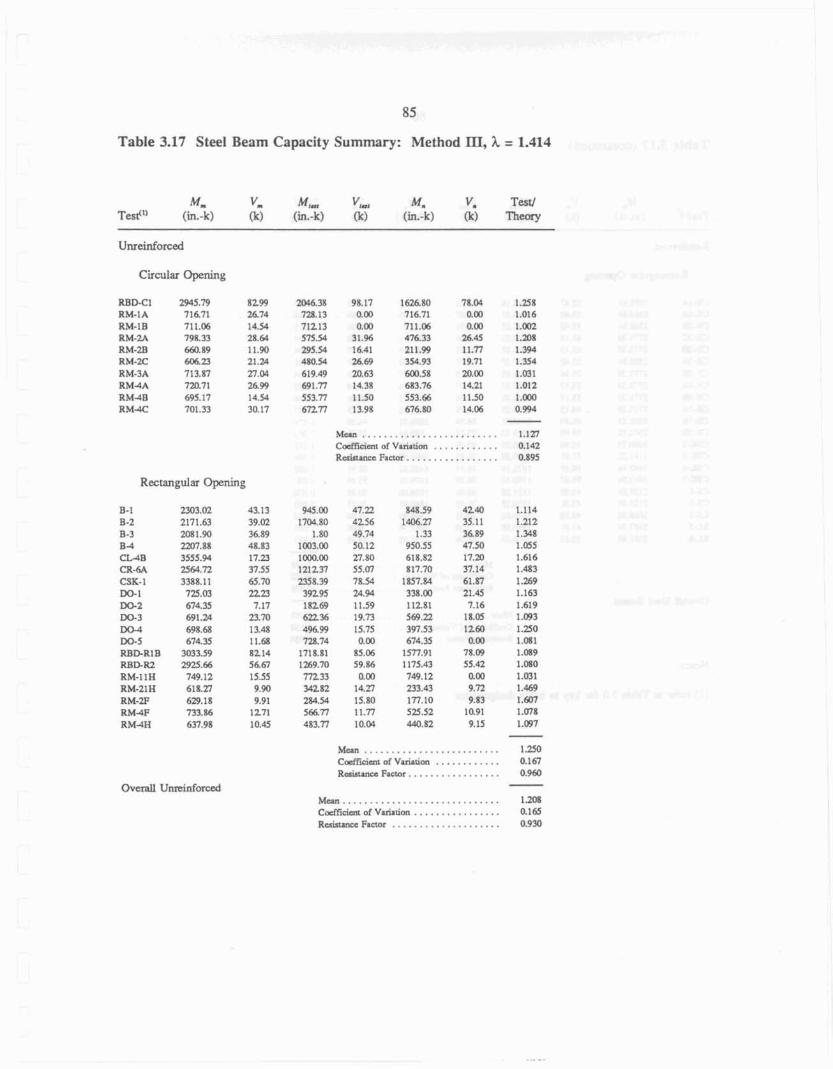
85
Table 3.17 Steel Beam Capacity Summary: Method PIE, h = 1.414
M, v, Test"' (in.-k) (k)
Circular Opening
RBD*Cl RM-I A RM-1B RM-2.4 RM-2E RM-2C RM-3.4 R M 4 A R M 4 B RM4C
Rectangular Opening
B-1 B.2 B-3 B 4 C W B CR-6A CSK-I W-l m 2 m 3 DCF4 W 5 R B P R I B RBD-R2 RM-IlH RM-ZIH RMZF R M 4 F RM4H
Overall U n r t i n f d
......................... Mean 1.250 . . . . . . . . . . . . C M i m i of Vaiiatim 0.1 67
............... R k t a n c c Factor.. 0.960 -
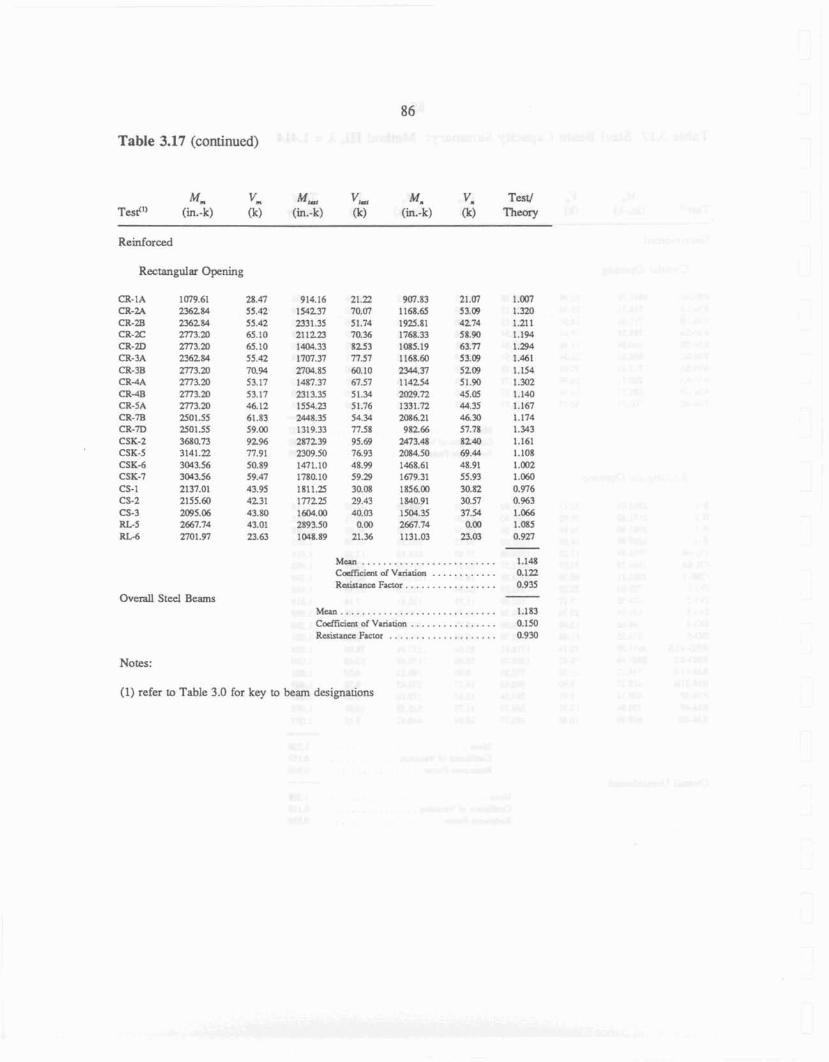
Table 3.17 (continued)
Reinforced
Rectangular Opening
CR-IA CR-24 CR-2B CR-ZC CR-2D CR-3A CR- 3B CRdA CRAB CR-5.4 CR-m CR-m CSK-2 CSK-5 CSK-6 CSK-7 CS-1 CS-2 CS-3 R L S R I A
Overall Steel Beams
914.16 21.12 907.83 21.m 1.W 154237 70.m 11603 53.09 1.320 2331.35 51.74 1925.81 4274 1.211 21 1221 70.36 1768.33 58.90 1.194 1404.33 8253 1085.19 63.77 1.294 1707.37 77.57 1168.60 53.W 2.461 2704.85 60.10 2344.37 52W 1.154 1487.37 67.57 IldZY 51.93 1.302 2313.35 51.34 2029.72 45.05 1.140 1554.23 51.76 1331.72 44.35 1.167 2d48.35 54.34 2086.21 d6.39 1.174 131 9.33 77.58 9R2.G 57.78 1.343 287239 95.69 2473.48 8240 1.161 2309.50 76.93 2084.50 69.44 1.108 1471.10 48.99 1468.61 48.91 1.002 1780.10 59.29 1679.31 55.93 l.W 1811.25 30.08 185600 30.82 0.W6 171225 29.43 1840.91 30.57 0.963 1Wl.00 d0.M 1504.35 37.54 1 -066 2993.50 0.00 2667.74 0.M LOB5 1M8.89 21.24 1131.03 23.M 0.927
......................... M u n 1.148 ............ CoefSrcian of V&tica 0.1Z2
Rcsistanea Fador. ................ 0.935
Mean. ............................ 1.183 ................ Cafficicnt of Vanation 0.1 50
. . . . . . . . . . . . . . . . . . . . Resistance Factor 0.930
Notes:
(1) refer to Table 3.0 for key to beam designations

87
Table 3.18 Composite Beam Capacity Summary: Method III, h = 1.414
Mm v- M M VM M. V Test/ Test'" {in.-k) (k) (in.-k) (k) (in.-k) (k) Theory
Ribbed Slab
Dl 5405.49 D-2 5967.14 D-3 604661 D-SA 5388.57 D-5B 5226.80 P 6 A 542256 D-6B 5733.80 D-?A 4665.32 D-78 436293 nsn 1 w . 5 7 c - 8 ~ lo%.s D-9A 4791.16 D-98 4588.71 R-0 1258.17 R-l 2630.28 R-2 3516.43 R -3 3774.33 R 4 3 0 2 2 8 R-5 2791.69 Rd 2594.96 R-7 2833.23 R-8 2817.84
Mean . . . . . . . . . . . . . . . . . . . . . . . . . . . . . . . . . . . . . Coefficient of Varirum
Resmancc Rmr . . . . . . . . . . . . . . . .
Solid Slab
M u . . . . . . . . . . . . . . . . . . . . . . . . . . . . . . . . . . . . . Cpfficht of Variation
Ruisuncc F a c m . . . . . . . . . . . . . . . . Overall Unreinforced
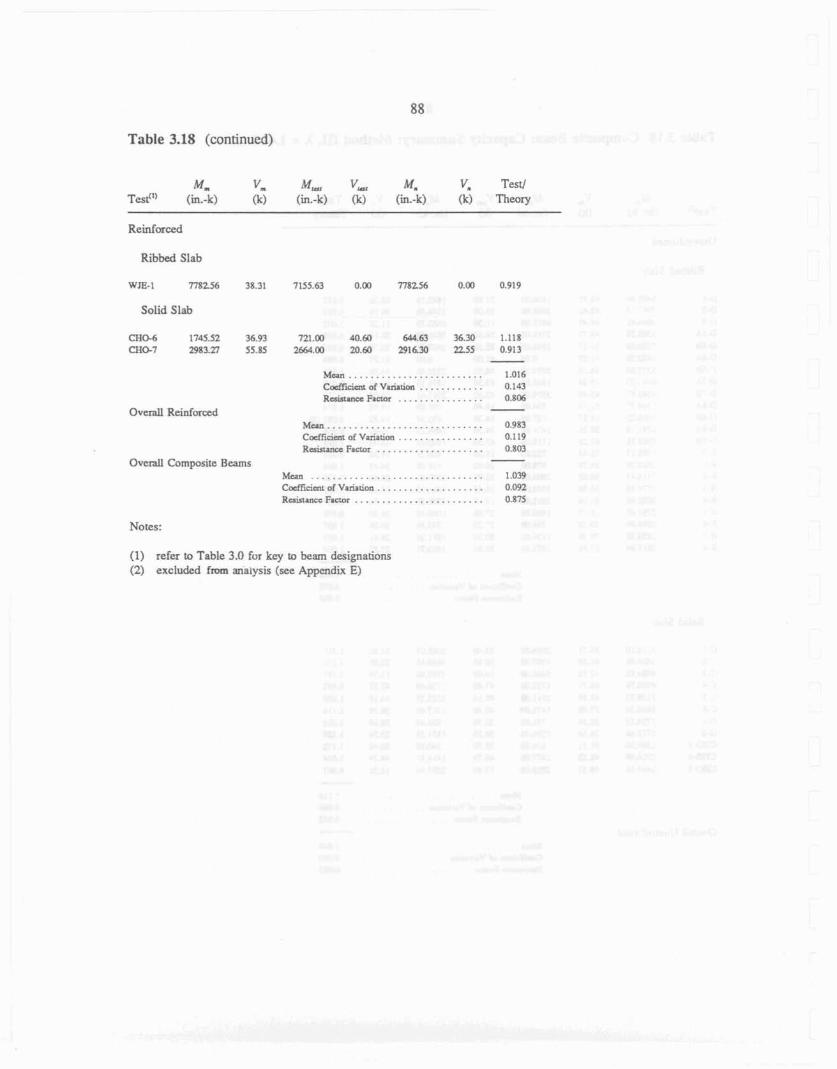
Table 3.18 (continued)
M, v, v-, Mm V, Testl Testcn (in.-k) (k) (in.-k) (k) (in--k) (k) Theory
Reinforced
Ribbed Slab
WIE-I 7782% 38.31
Solid Slab
M m . . . . . . . . . . . . . . . . . . . . . . . . . C d c i c n t of Variation . . . . . . . . . . . . R&ancc F a m r . . . . . . . . . . . . . . . .
O v e d Composite Beams
Notes:
(1) refer to Table 2.0 fur key to beam designations (2) excluded from analysis (see Appendix E)
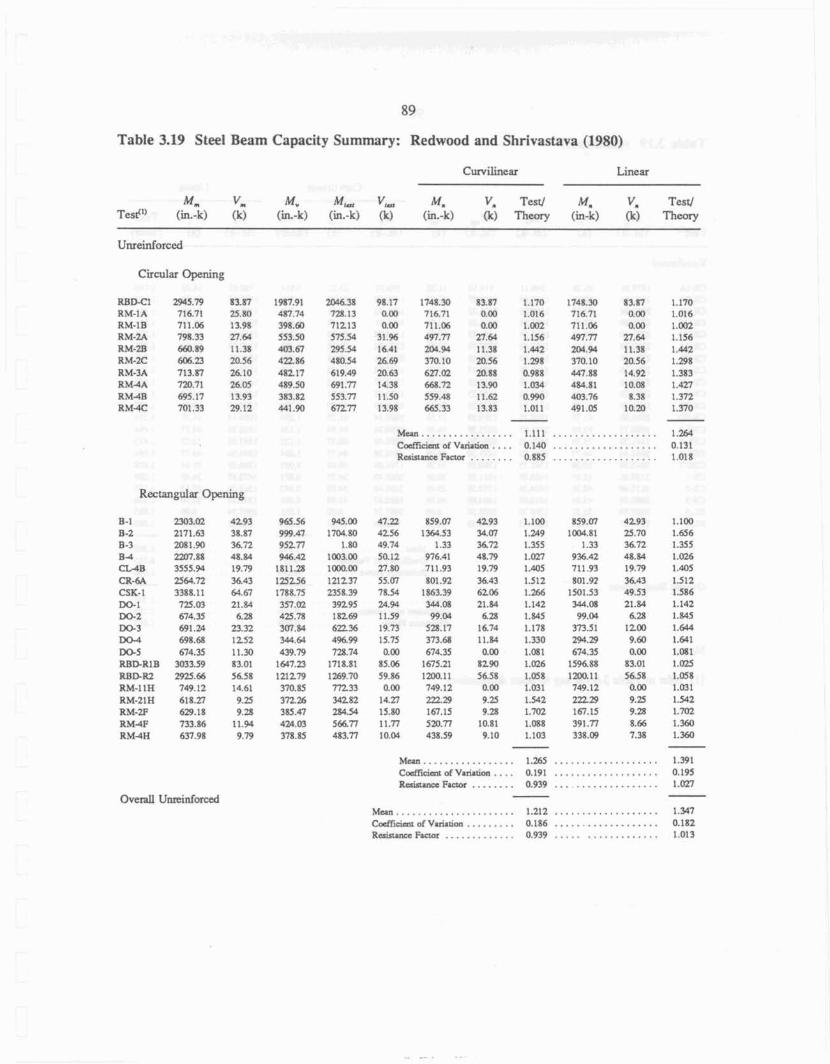
Table 3.19 Steel Beam Capacity Summary: Redwood and Shrivastava (1980)
Cwilinear Linear
Mm v, M , v,mi M. V, Test1 M, V, Test/ Test""in,-k) (k) (in.-k) (in.-k) (k) (in.-k) (k) Thwry (ii-k) (k) Theory
Ci la t Opening
M a . ............... C d i c i u n of Variatiun ... Rcsislancc Factor .......
Rectangular Opening
47.22 159.M 4293 1.100 859.07 4293 1.100 4256 1M.53 34.07 1.249 10M.81 25.70 1.656 49.74 1.33 3472 1.355 1.33 3&72 1.355 50.12 976.41 48+7J 1.M7 936.42 48.84 1.026 n.so 711.93 I . 1.405 711 93 19.79 1.405 5 5 801.92 36.43 1.512 801.92 36.43 1.512 78.54 1863.39 6205 1.266 1501.53 49.53 1.586 2a.W 2 4 OR 21-84 1.142 344.m 21.84 1.142 11.59 99.W 6.28 1.845 99.W 6.28 1.845 19.73 528.17 16.74 1.178 373.51 1200 1.644 15.75 373.68 11.84 1.330 2W.29 9.60 1.641 0.00 674.35 0.00 1.081 674.35 0.00 1.081
85.06 1675.21 8290 1.026 159688 83.01 1,025 59.86 l200.11 5658 1.a58 1EQ.11 56.58 1.058 0.m 749.12 aCKl 1.M1 749.12 0.00 1.031
14.27 22229 9.25 1.542 2n29 9.25 1.542 15.80 161.15 9.28 1.702 167.15 9 . 3 1.702 1P.n 5m.n 10.81 1.m8 391.7 3.6 1.3~) I . 438.59 9.10 1.103 338.09 7.38 1.M
................... ................. M a n 1.265 1.391 .... ................... Cafflcimt of Vuirtim 0.191 0,195
........ .................. R-na Factor 0.939 1 . m
................... ...................... M u n 1.212 1.347
................... ......... C M i ~ n t of V~atim 0.186 0.182
. . . . . . . . . . . . . . . . . . ............. Reastame Factor 0.939 1.013

Table 3.19 (continued)
M, vm Test'" (in.-k) (k]
Overall Steel Beams
Curvilinear Line a?
..................... Mun 1.183 Cdcient of Variation ........ 0.174
. . . . . . . . . . . . R@ar~ee Factm 0.900
Notes:
(1) refer ta Table 3.0 for key to km designations
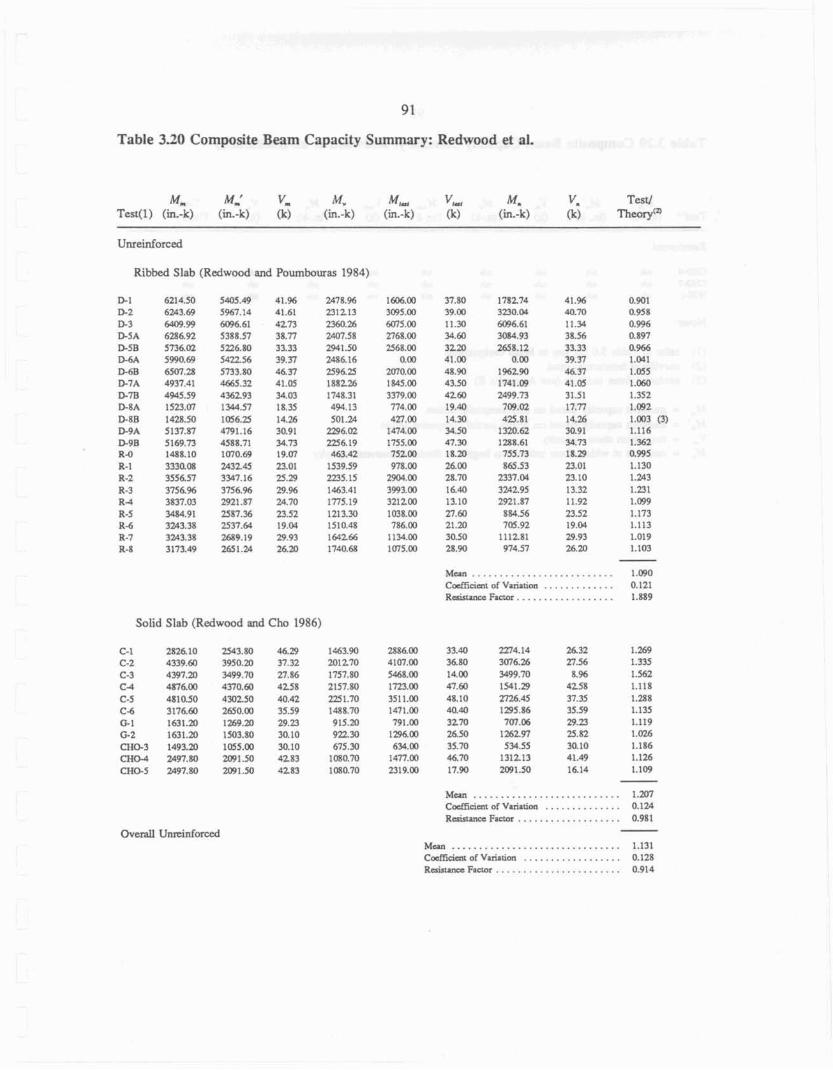
91
'Sable 3.20 Composite Beam Capacity Summary: Redwood et al.
Ribbed Slab (Redwood and Poumboufas 1984)
Solid Slab (Redwood and Cho 1986)
2886.00 33.W 2214.14 2632 1.269 4 l M . m 36.80 3076.26 27.56 1.335 5468.00 14.00 399.70 8.% 1.562 1723.00 47.60 1541.29 4258 1.11% 3511.00 48.10 2726.45 37.35 1.288 1471.00 40.40 1295.86 35.59 1.135 791.W. 3270 7Q7.06 29.Z 1.119
1 X 0 0 26.50 1262.97 25.82 1.026 634.00 35.30 534.55 30.11) 1.186
14?74n.a) 46.70 131213 41.49 1.126 2319.00 17.W ZWt.50 16.14 1.109
M a n ........................... 1.m CDctfician of Variation .............. 0.124
................... R&pnoeFacror 0.981
............................... Mean 1.131 .................. Cocmcian or Vpri.tion 0.128
. . . . . . . . . . . . . . . . . . . . . R&~ncaFactor . . 0.914
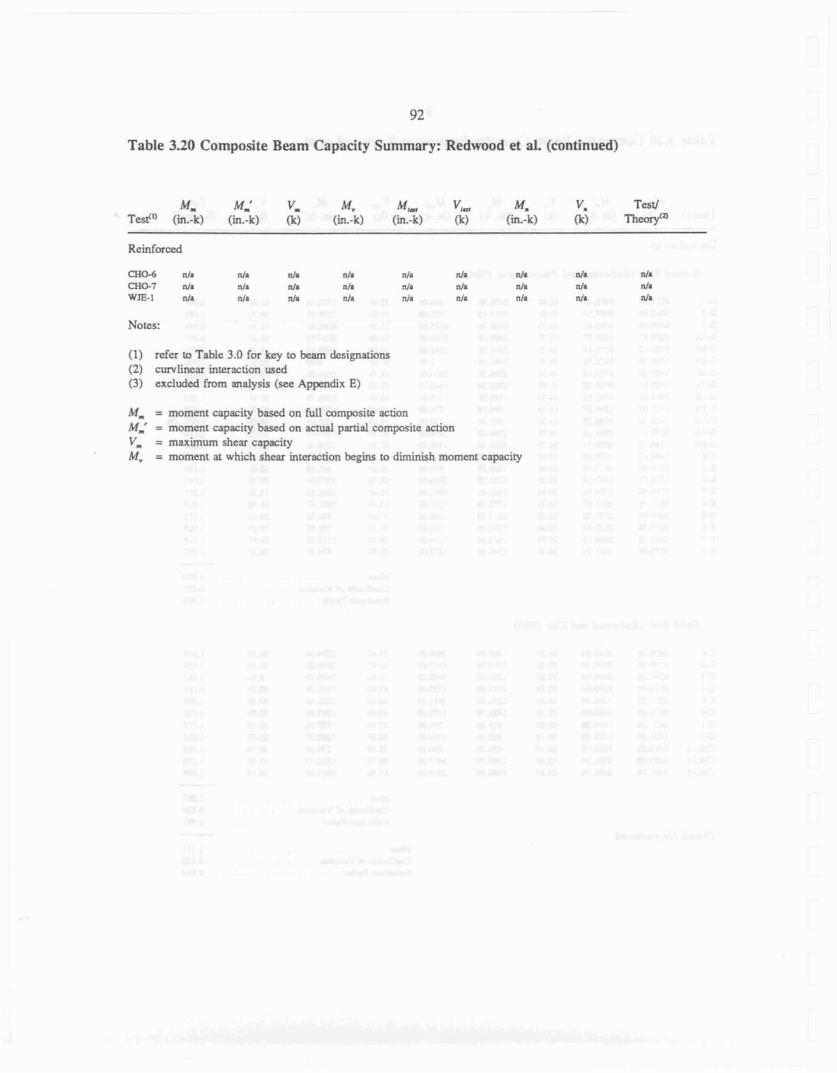
Table 3.20 Composite Beam Capacity Summary: Redwood et al. (continued)
Urn M,' v, M v Mw v,m Mrn v a Test/ Tedu (in.-k) (in-k) m) k (in-k) Ck) (h-k] Ik) =WM
Reinforced
(1) refer to Table 3.0 for key to beam designxions (2) cumlinear interaction used (3) exduded from analysis (see A p d i x E)
M, = moment capacity based on full composite action M,' = moment capacity based on actud parrial composite action Vm = maximum shear capacity M, = moment at which shexu interaction begins to diminish moment capacity
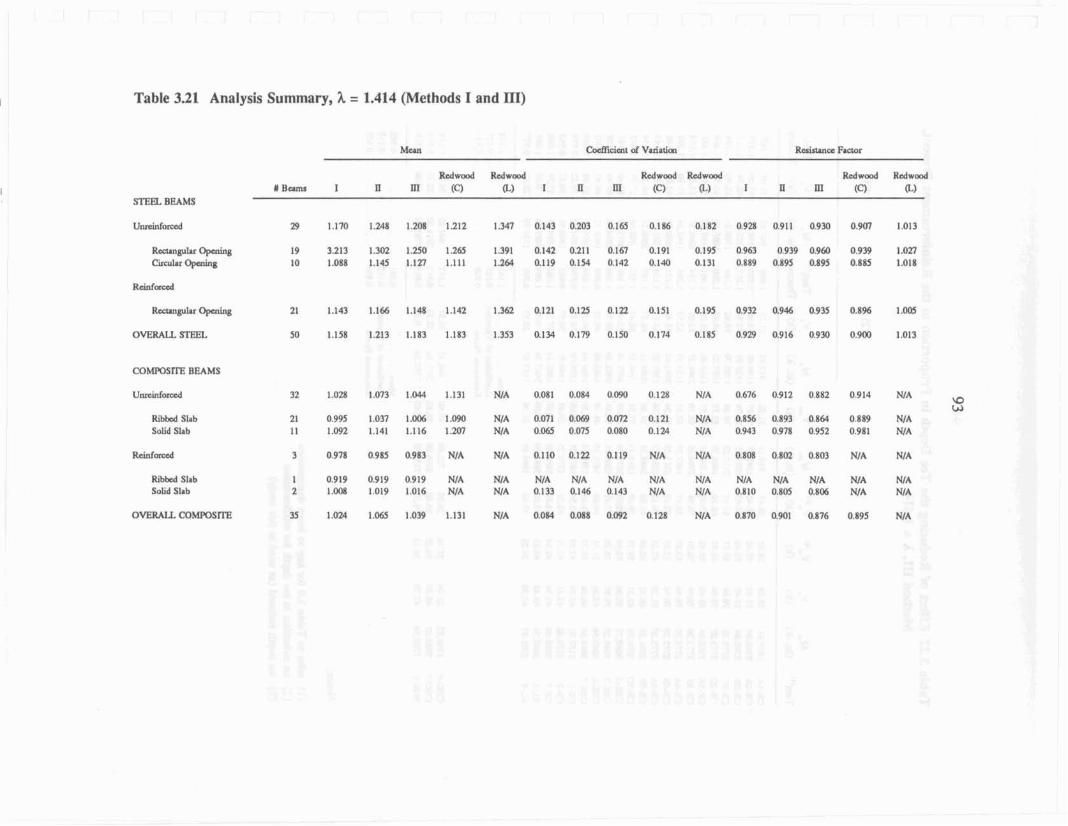
Table 3.21 Analysis Summary, h = 1.414 (Methods I and
STEEL BEAMS
RMlnptnr Opening C h l a r Opening
Rcclangulu O p a h g
OVERALL STEn
MMPOSTTE BEAMS
Riblxd Slab Solid Slab
Ribbed Slab Solid S t b
32 1.028 ).On 1.044 1.131 NIA 0081 0.084 O W 0128 NIA 0.676 0912 0.882 0914 N/A
21 0.995 1.037 1.M 1.090 NI.4 0071 0.019 0.m 0.121 NIA 0.856 0.893 0864 0 889 NIA 11 1092 1.141 1.116 1.207 NIA 0065 0075 0080 0.124 NIA 0943 0.978 0.952 0.981 NIA
3 0978 0985 0983 NIA NIA 0.110 0.122 0.119 NIA NIA 0.808 0.801 0803 NIA NIA
1 0.919 0.919 0919 N/A NIA NIA N/A NIA A NIA NIA NIA NIA NIA NIA 2 1.M8 1.019 1.016 NIA NIA 0.133 0.146 0 143 NJA NIA 0.810 0.805 O.$M NIA NIA
35 1.024 1.065 1.039 1.131 NIA 0.084 0.088 0.092 0.l2e NIA 0.870 0.901 0.876 Q.895 FF/A
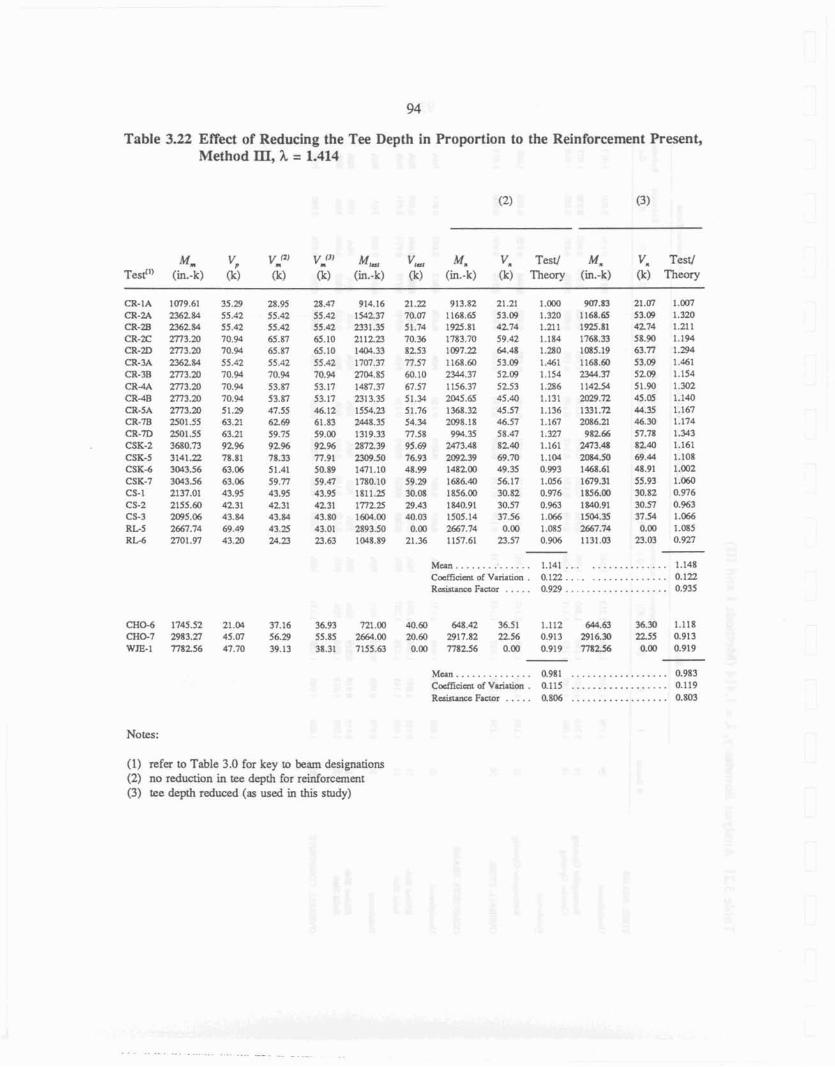
Table 3.22 Effect of Reducing the Tee Depth in Proportion to the Reinforcement Present, Method III, h = 1.414
M, vp VmoJ V i 3 1 M M V-, M, V Tesd M, V, Test/ Tesr'" (in.-k) (k) @) (k) (in.-k) (k) (in.-k) (k) Theory (in,-k) (k) Theory
(I) refer to Tabla 3.0 for key to beam designations (2) no reduction in tee depth for reinforcement (3) tee depth reduced (as used in this study)
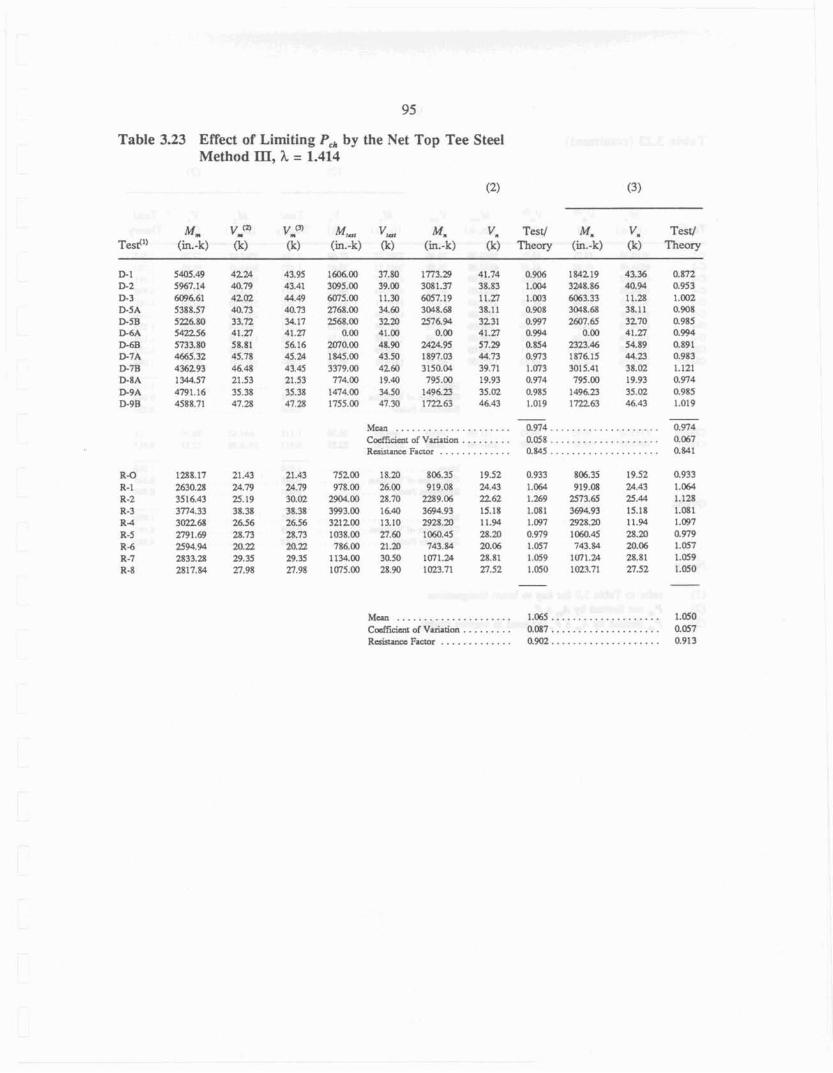
Table 3.23 Effect of Limiting P,, by the Net Top Tee Steel Method III, h = 1.414
Mrn Vmm vmm M-r VM M. Vm Tesv rM, V, Test/ T e d ' (in.-k) Ck) (k) (in.-k) (k) (in.-k) (k) Theory @I.-k) (k} Theory
D-1 5405.49 42% 43.95 1606.06 33.80 1773.29 41.74 0.906 184219 43.36 0.872 B 2 5967.14 40.79 43.41 -5.M) 39.00 3 0 8 1 3 38.83 1.004 3248.86 40.W 0.953 D- 3 m661 4202 44.49 m ~ . m 11.m 6057.19 11.n 1 . ~ 3 6063.33 11.28 1.002 D 5 A 5388.57 40.n 40.73 2768.00 24.m 3048.48 38.11 0.908 3048.68 38.11 0.908 D 5 B 5226.80 33.72 34.17 2568.00 32m 2576.94 3231 0.997 2607.65 3270 0.985 D6.4 542256 41.27 41.27 0.00 41.00 0.m 41.27 0.994 0.00 41.27 0.W4 D-6B 5733.80 58.81 $416 2U70.00 48.90 2424.95 5 3 3 QS54 2323.46 54.89 0.891 M A M 5 . 3 2 45.78 45.24 1845.00 4350 1897.03 44.73 0.973 1876.15 . 0.983 B3& 436293 46.48 43.45 3379.a) 4260 3150.W 39.71 1.073 3015.41 38.02 1.121 D-% A 1344.57 21 -53 21.53 774.00 19.W 795.M) 14.93 0.974 795.00 19.93 0.974 P 9 A 4791.16 35.38 35.38 1474.M) 34.50 1496.23 35.02 0.985 149623 35.02 a985 D-9B 4588.71 47.25 47 28 1755.00 47.30 172263 46.43 1.019 172L63 46.43 1.019
- - Mean . . . . . . . . . . . . . . . . . . . . . 0.974.. . . . . . . . . . . . . . . . . . a974 C M i d c m of Variatim . . . . . . . . . 0.058 . . . . . . . . . . . . . . . . . . . . 0.067 Resutancc Factor . . . . . . . . . . . . . 0.845 . . . . . . . . . . . . . . . . . . . . 0.W1
Mtan ..................... 1.065 .................... 1.050 CoEffidmt of Varhiiur~ . . . . . . . . . 0.087 . . . . . . . . . . . . . . . . . . . . O.M7 R w Actor . . . . . . . . . . . . . 0.W2.. . . . . . . . . . . . . . . . . . . 0.913

Table 3.23 (continued)
Mm vmm Vmm M, v ~ , Mm Vc Test/ Ma I/, Test/ Test"' (in.-k) (k) (k) (in.-kg (k) (in.-k) &) Theory (in.-k) (k) Themy
c-l C-2 C-3 C 4 C-5 C-5 G. 1 G- 2 CH0.3 CHO-4
Mean . . . . . . . . . . . . . . Cocff~c imt oIV~ristim . . R&unec Factor . . . . . .
- - .................... ..................... M a n 1.016 1.016
. . . . . . . . . . . . . . . . . . . . . . . . . . . . . Cdcimt of Variation 0. I45 0.145 . . . . . . . . . . . . . . . . . . . . . . . . . . . . . . . . . Rmistancc Factor 0.8W 0.854
- - Man ..................... 1.048 .................... 1.039 C d c i e n t of Vuietim . . . . . . . . . 0 . m .................... 0.091
............. ... . . . . . . . . . . . . . . . . . R&ance Factor 0.880 0.880
Notes:
(1) refer ta Table 3.0 for key to beam designations (2) P, not limited by A, x F, (3) P, limited by A, x F, (as used in current study)

Table 3.24 Effed of Restricting Normal Force in Reinforcement by the Weld Strength
CR-IA CR-M CR-rn (IR-2C CR-2D CR-3A CR-3B CR4A C R 4 B CR-SA CR--78 CR-7D CSK-2 CSK-5 CSK4 CSK-7 CS- I CS-2 CS-3 RL-5 R t . 4 CH06 C H 0 7 W E - 1
35.29 23.1% 28.47 23.18 25.47 1.007 55.42 41.41 55.42 40.65 55.42 1.320 55.42 41.41 55.42 40.65 55.42 1.211 70.W 35.37 65.10. 3 5 3 65.10 1.194 70.94 35.37 65.10 35.37 65.10 1.294 55.42 83.03 55.42 40.65 55.42 1.461 70.94 58.85 70.94 5E.M 70.94 1.154 70.94 35.37 53.17 3 5 . 9 53.17 1.302 70.94 35.- 53.17 35.37 53.17 1.140 51.29 57.011 6 1 2 57.08 46.12 1.167 63.21 37.71 61.83 37.71 61.83 1.174 63.21 37.71 59.00 37.71 59.M 1.343 92.96 43.37 9296 41.29 9296 1.161 78.81 4272 77.91 6272 n.91 l.lO8 63.06 35.52 S0.W 35.52 50.89 E , W X 63.06 35.52 59.47 35.52 59.47 1.060 43.95 5212 43.95 32W 43.95 0.976 42.31 5257 4231 31.42 42.31 0.963 43.84 49.n 4184 3255 4330 1.066 69.49 18.17 43.01 18-17 43.01 1.085 42.20 41.62 23.63 41.62 23.63 0 . W nla 47.16 40 50 24.68 36.93 1.091 nle 46.92 55.85 4 . 9 2 55.85 0.913 nh 84.43 38.31 85.47 38.31 0.919
Notes:
(1) refer to Table 3.0 for key to beam designations (2) no reshiction on normal f m e in reinforcement (3) nonnal force resPicted
V, = ptasdc shear capacity of the top and bottom tees
P, = normal force in the remforcement
Vm = nanimum shear capacity as predicted by Method
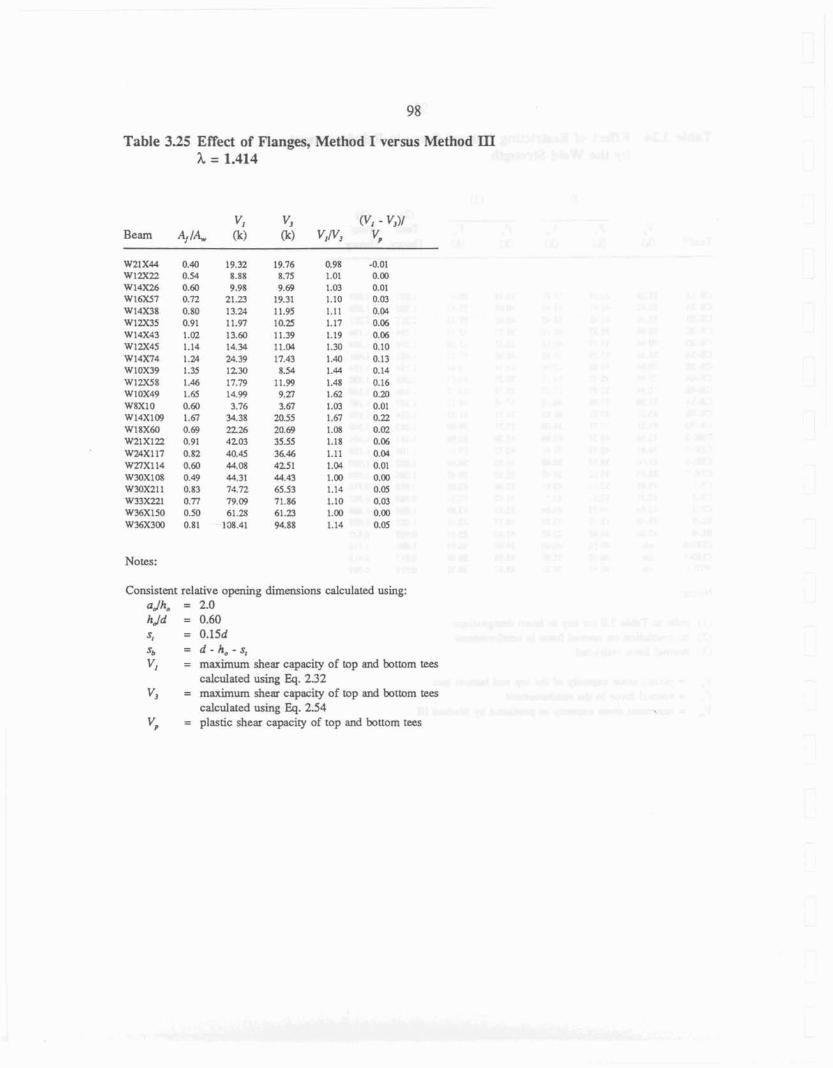
Table 3-25 Effect of Flanges, Method T versus Method El h = 1.414
Notes:
Consistent rdative opening dimensions calculated using: aJh, = 2.0 hJd = 0,60
= 0.15d Sb = d - h, - $, V, = maximum shear capacity of top and bottom tees
calculated using Eq. 232 V, = maximum shear capacity of tap and bttorn tew
cdculated using Eq. 2.54
Vp = plastic shear capacity of top and bottom tees
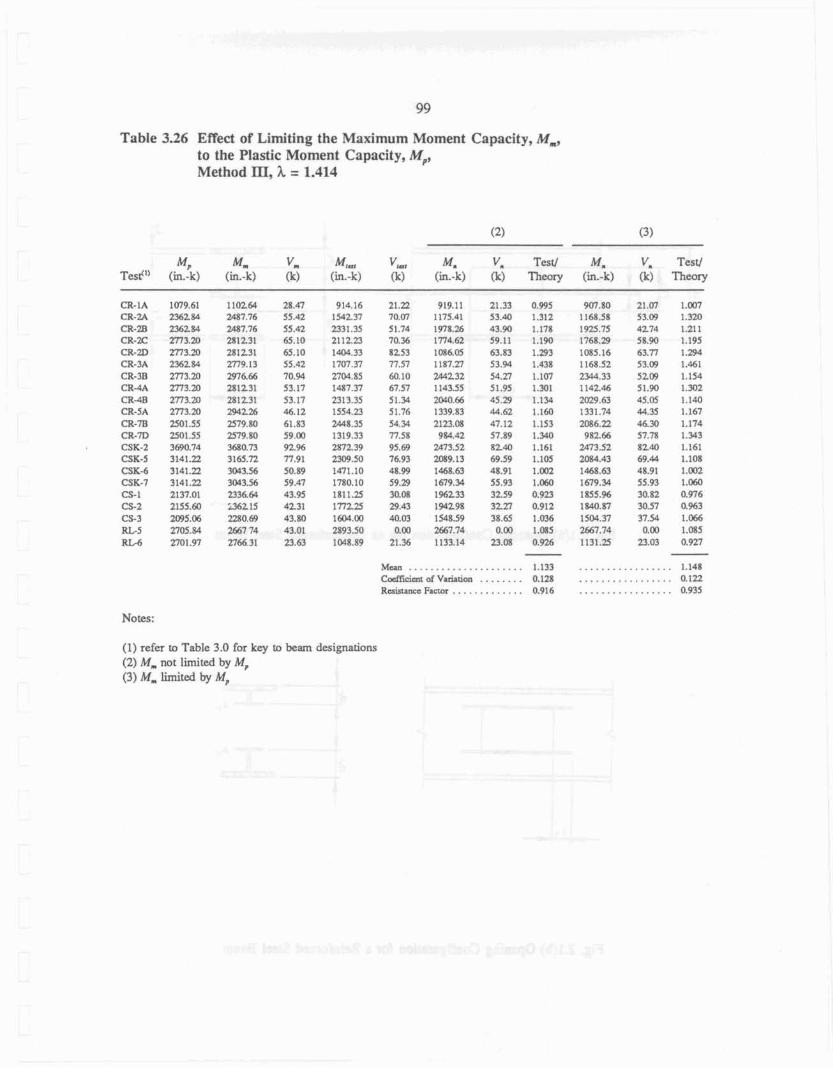
Table 3.26 Effect of Limiting the Maximum Moment Capacity, M,, to the Plastic Moment Capacity, Mp, Method El, h = 1.414
12)
4 M , Vm M,m, vw Mu v. Test/ Test'" ( k ) (in.-k) (k) (in.-k) (k) (in.-k) (k) Theory
C X I A IU79,61 T1026Q 28.47 914.16 21.22 919.11 21.33 0.995 CR-;?A 2 3 2 8 4 2487.76 55.42 1542.37 70.07 1175.41 53.40 1.312 CR-rn 236284 2487.76 55.42 2331.35 51.74 1978.26 43.90 1.178 CR-2C 273.20 281231 65.10 2112.23 70.3 1714.62 59.11 1.190 CR-2D 2773.20 281231 65.10 1404.33 8253 1086.05 63.83 1.293 CR-3A 236284 2779.13 55.42 1707.37 77.57 1187.27 53.94 1.438 CR-3B 2773.20 2976.45 70.94 Z704.85 60.10 244232 54.n 1.107 CA4A ZT'3.20 281231 53.17 1487.37 67.57 1143.55 51.95 1.301 CR-48 2773.20 281231 53.17 2313.35 5I.M 2M0.66 45.23 1.134 CR-SA 2773.23 294226 46-12 1554.23 51.76 1339.83 44.62 1.160 CR-78 2501.55 2579.80 61.83 2448.35 54.34 2123.W 47.12 1.153 CR-7D 2501.55 2579.80 59.00 1319.33 n.5E 9g4.42 57.89 1.340 CSK-2 3690.74 3480.73 9296 2872.39 95.69 2~473.52 82.00 1.161 CSK.5 3141.22 3165.72 77.91 2309.53 76.93 2089.13 69.59 1.105 CSK-6 3141.22 3W3.56 50.89 1471.10 48.99 1d68.63 48.91 1.002 CSK-7 3141.22 3043.56 59.47 1780.10 59.29 1679.Y 55.93 1 . M CS-I 2137.01 2 3 ~ 6 4 43.95 18ii.s 3aoa 146233 32.5~ 0.923 CS-2 2155.60 36215 4231 17'7225 29.43 1W298 3223 0.912 CS-3 2095.06 22R0.69 43.80 1iW.00 40.03 1548.59 38.65 1.M6 RL-5 2705.84 2&7 74 43.01 2893.50 0.00 2667.74 0.00 1.035 R I A 2701.97 2766 31 23.63 IW8.89 21.36 1133.14 23.08 0.926
Mean ..................... 1.133 Cdcimt of Variation ........ 0.128
............. R&stana Factor 0.91 6
Notes:
Ma V, Test/ (in.-k) (k) Theory
(1) refer to Table 3.0 fm key to beam designations (2) rM, not limited by M, (3) M , limited by M,
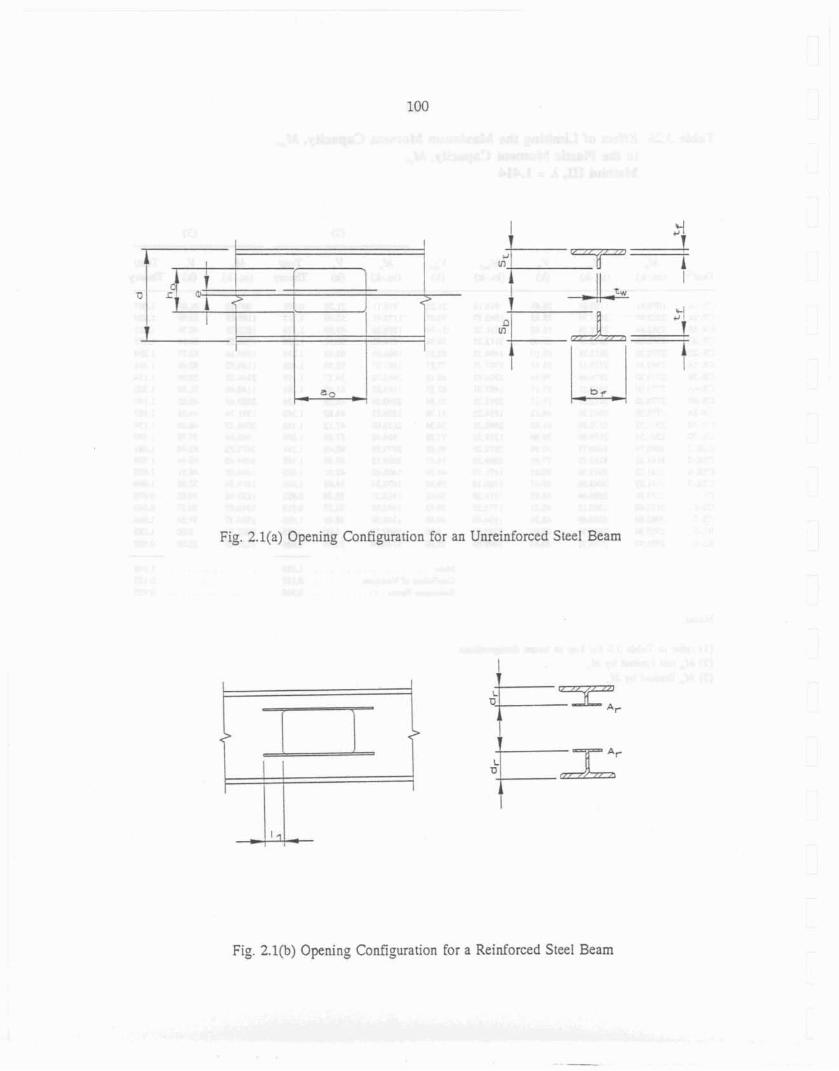
Fig. 2.l(a) Opening Configurntion for an Unreinforced Steel Beam
Fig. 2.l(b) Opening Configuration for a Reinforced Steel Beam
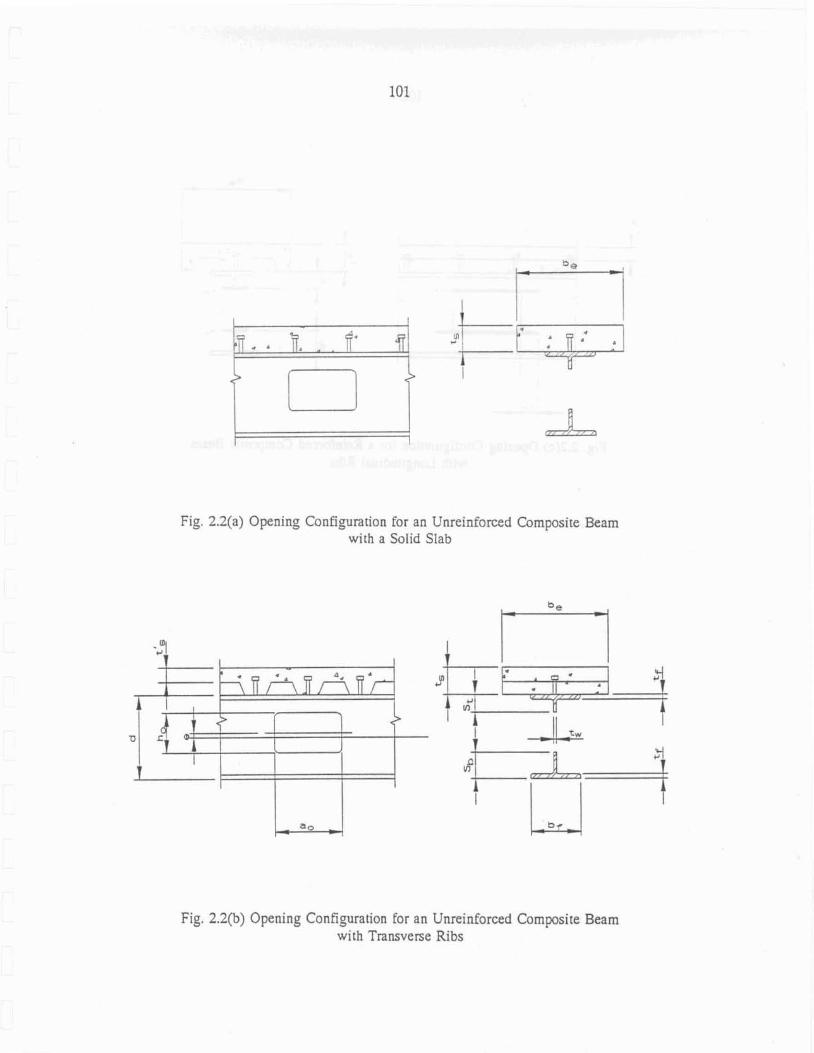
Fig. 2.2(a) Opening Configuration for an Unreinforced Composite Beam with a SoIid Slab
Fig. 2.2(b3 Opening Configuration for an Unreinforced Composite Beam with Transverse Ribs
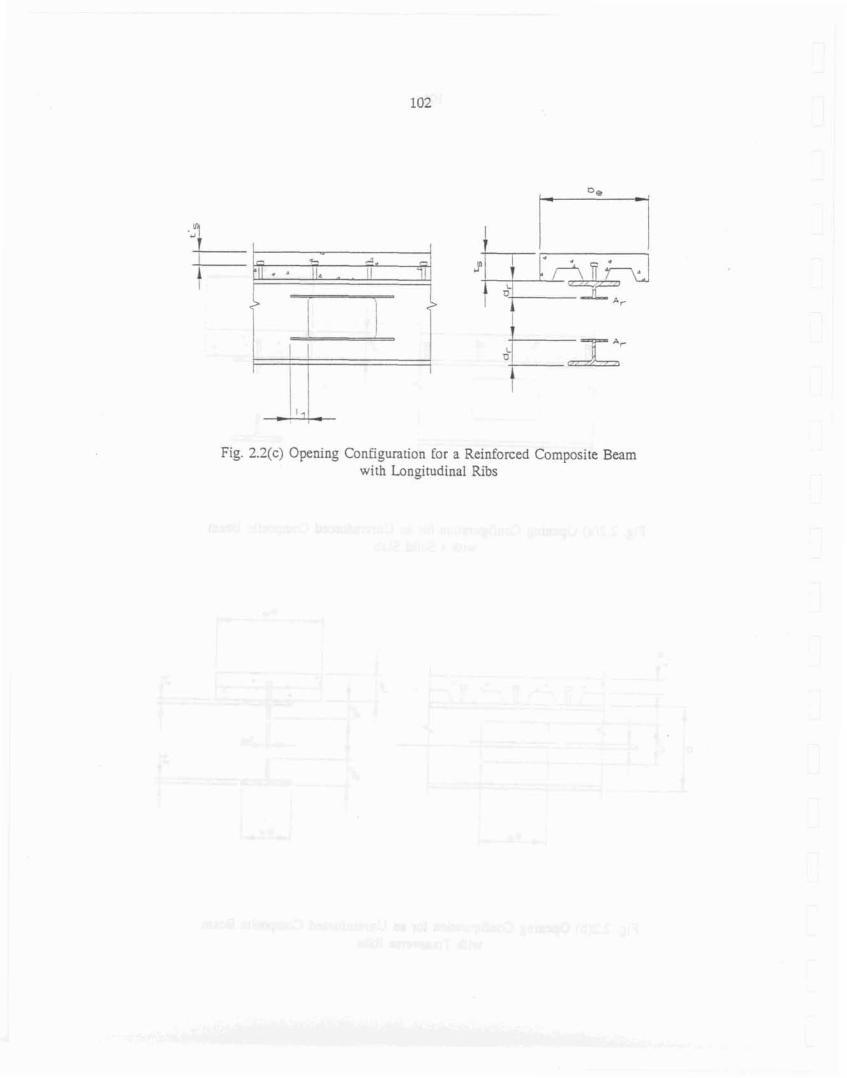
Fig. 2.2(c) Opening ConB_euration for a Reinforced Composite Beam with Longitudinal Ribs
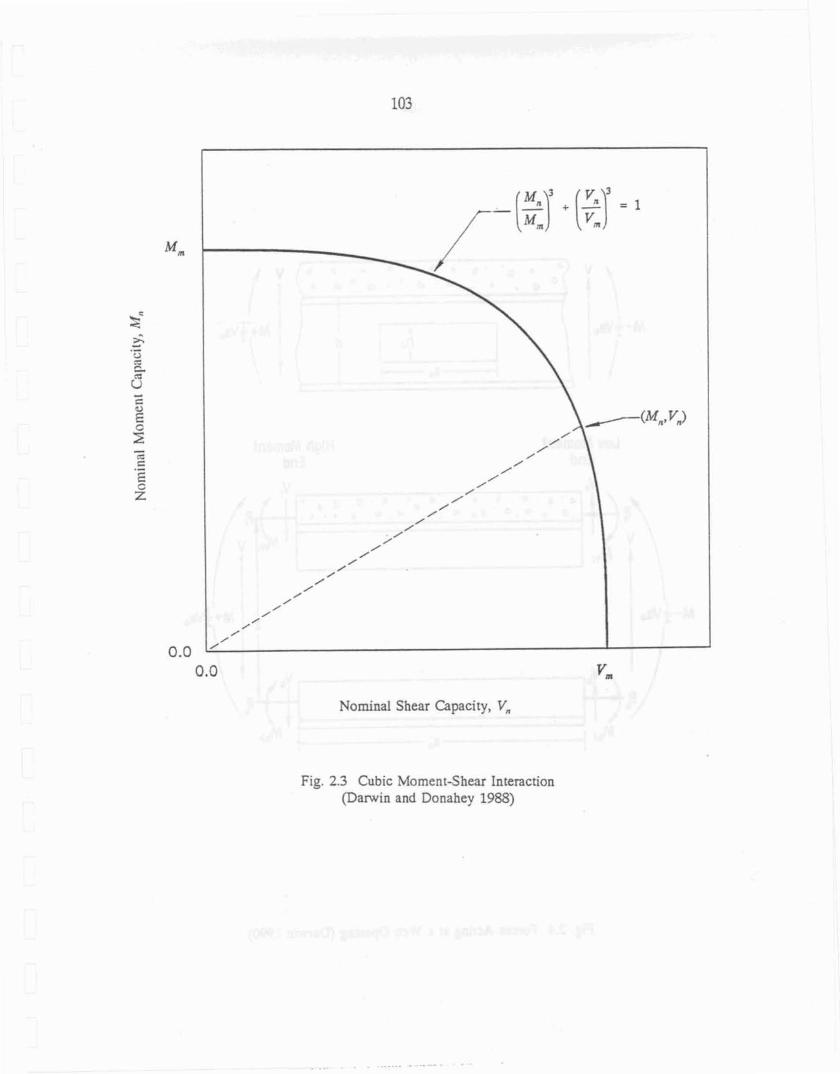
Nominal Shear Capacity, V,
Fig. 2.3 Cubic Moment-Shear Interaction (Darwin and Donahey 1988)
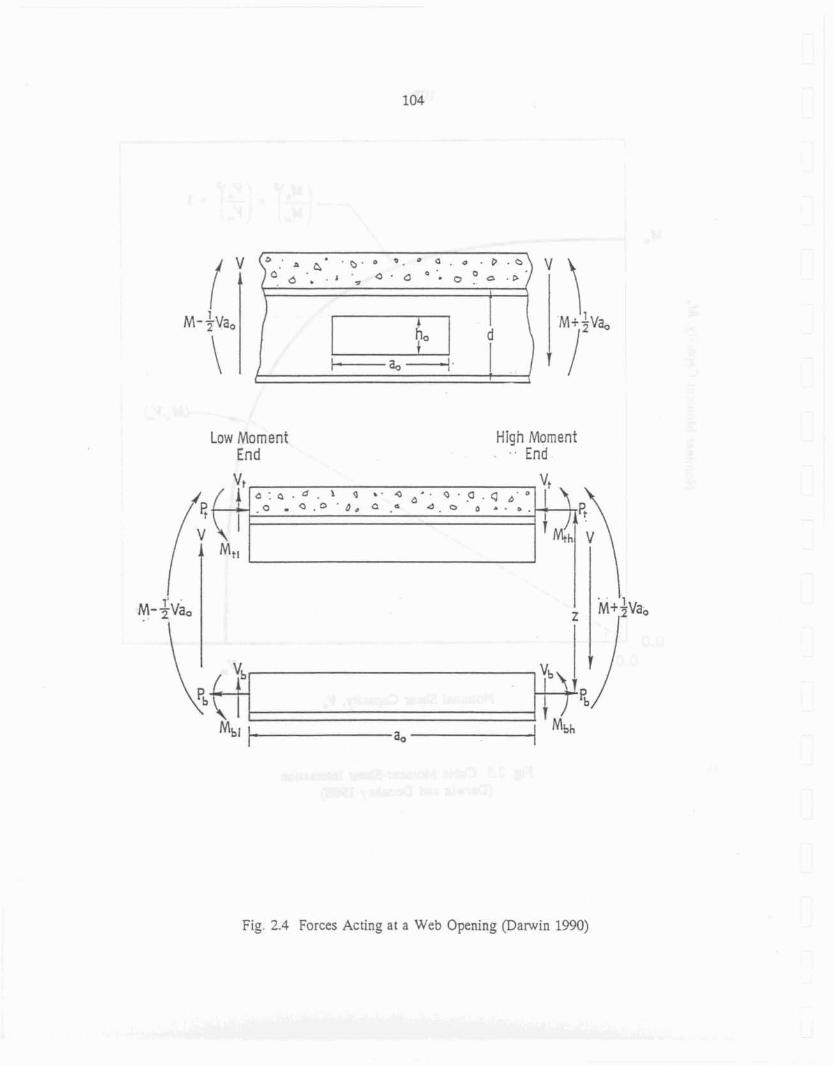
Low Moment End
High Moment . . . End
Fig. 2.4 Forces Acting at a Web Opening (Darwin 1990)

I
I -,,, I -Pr / "> .= Fy
7
F Y ~ 'J
1 ', -.. L O W High
~ o m e n t Moment I
V r n ~ €la End
Fig. 2.5 Normal Forces in a Composite Opening
Von Miscs Yield Function
0.00 0.00 F?
Reduced Axial Yield Strenm 7
Fig. 2.6 Yield Functions for Combined Shear and Normal Stress
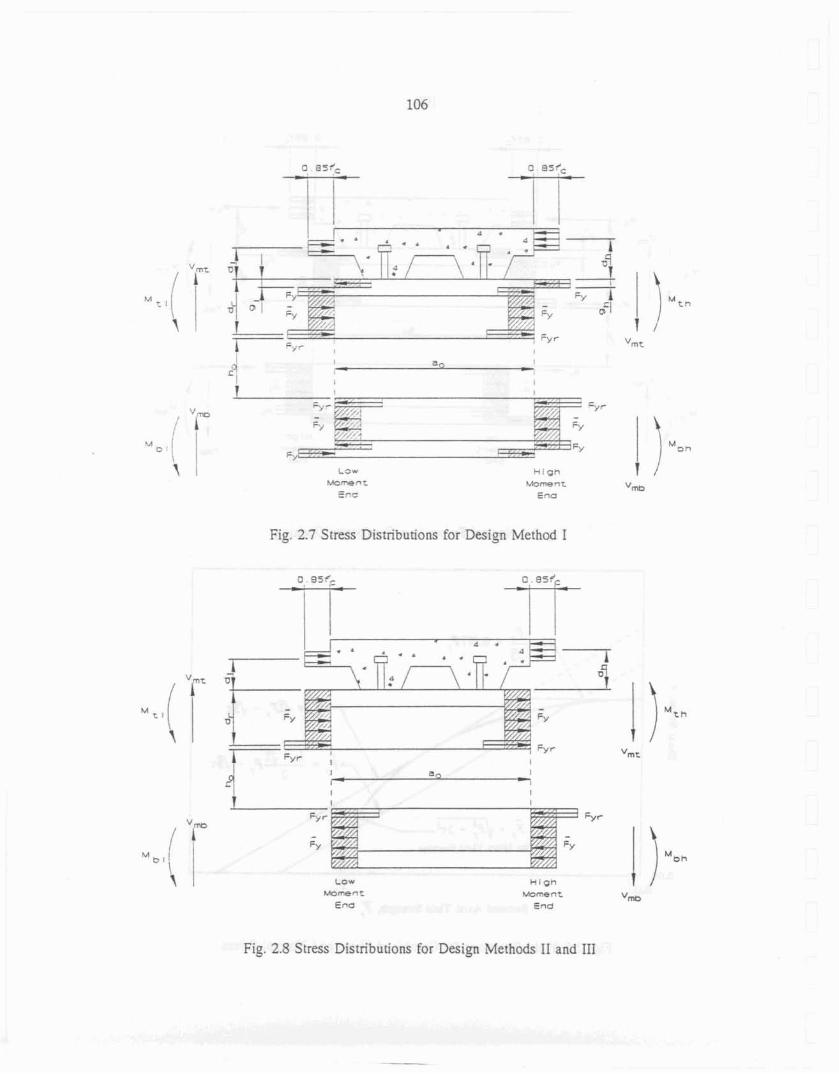
-._ 7 7 .- - 7- "9 r
, "r" -' * sY f, V,
/ , ." I_ , ,. M - 4. FY 1 ) i i Law t t i p t l
M C m e r r L Moment T
'mb E-c E nc
Fig. 2-7 Stress Distributions for D e s i g Method I
H i gn Moment
End
Fig. 2.5 Stress Distributions for Design Methods II and 111
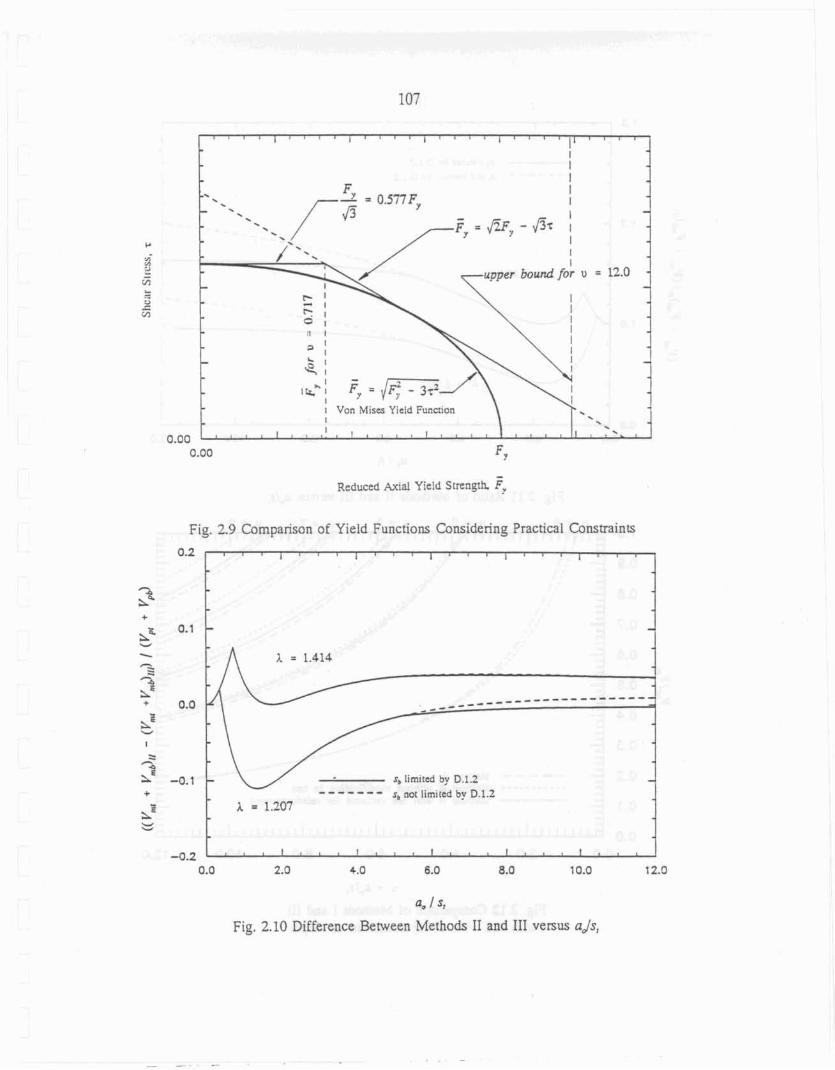
Reduced Axial Yie!d Strcnyk F?
Fig. 2.9 Comparison of YieId Functions Considering Practical Constraints
0.2
s, I im~ttd by D.1.2 ------- q not limited by D.1.2
a, l ST
Fig. 2-10 Difference Beween Methods I1 and 111 versus aJs,

sb lim~tad by D.12 s, not Iirntrcd by D.1.2
Fig. 2.11 Ratio of Methods I1 and III versus adst
-\ -
1- - 3 -- -
----- Method I ---- d ---= -------- - - - Method I11 without modification to tee - Method Ill w i t h tee mducrd fee reinforcement -1 -
u = a,Is,
Fig. 2.12 Comparison of Methods 1 and 111 with and without adjustment in tee depth

Fig. 2.13(a) Umeinforced Steel Beam ia Pure Bending Fig. 2.13@) Reinforced Steel Ream in Pure Bentling Fig. 2.13(c) Reinforced Steel Beam in Pure Bending with Neutral Axis in Reinforcement wirh Neutral Axis cn Web

Flg, 2.14(a) C o m p i l e Beam in Pure Bending with Neutral h i s at or above Steel FLange
Fig. 2.14(b) Composite Beam in Pure Bending with Neutral Axis at i n r l~e Steel Flange
Fig. 2.14(c) Campsite Beam in Pure Bending with Neutral Axis at in the Wcb

Cubic Moment-Shear Interaction Using Method 111
- ---*-*-**- Curvlinear Moment-Shear Interaction Using Redwood & Shrivasatava (19801, Redwood & Pournbouras (19841, and Redwood & Cno (1986)
0 Actual Moment-Shear Value €or Beam
Fig. 3.0 Legend for Moment-Shear Interaction Curves in Figs. 3.1 - 3.85
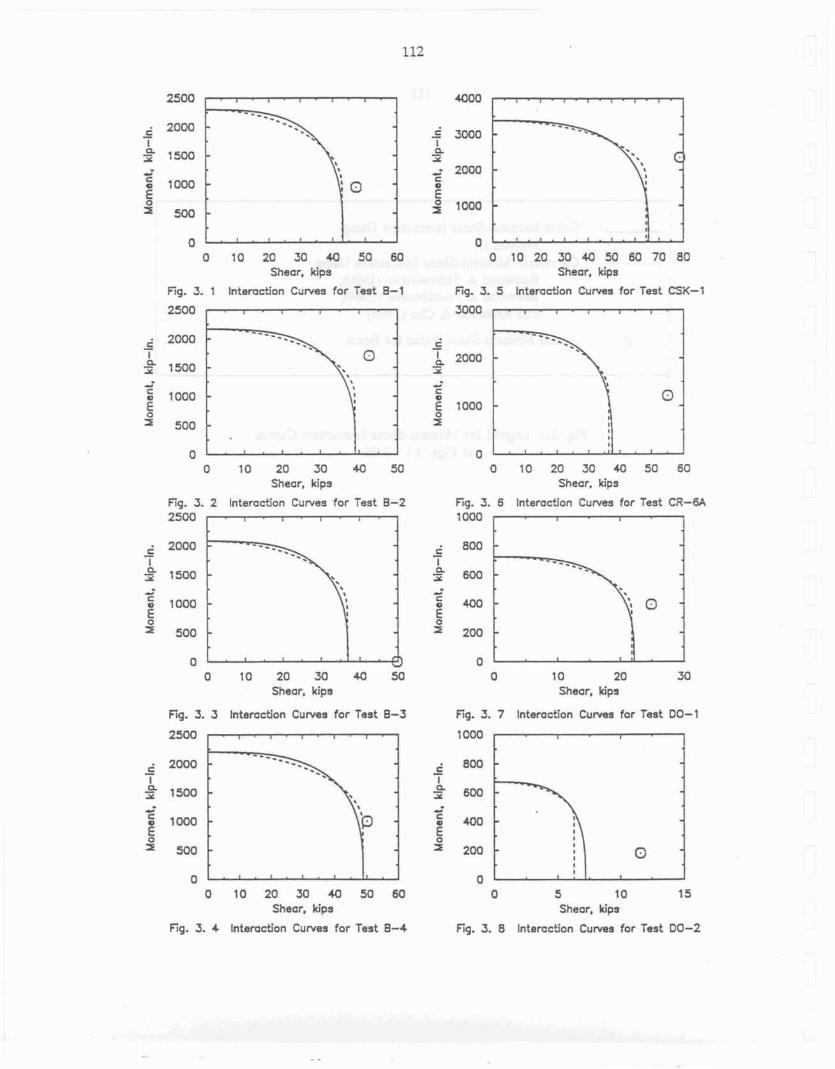
I] Q 10 20 30 4-0 50 60
Shear, kips
Fig. 3. 1 Interaction Curves for Test 8-1
2500
0 0 10 20 30 40 50
Shear, kips
Fig. 3. 2 Interaction Cuwes for Test 8-2
0 10 20 30 40 50 Shear, kips
Fig. 3. 3 kiteruction Curvas for Test 8-3
2500
0 o 10 20 30 eo se 60 70 ao
Shear, kips
Fg. 3. 5 Interaction Curves for Test CSK-1
3000
0 0 10 20 30 4Q 50 60
Shear, kips
f ig. 3. 6 Internetion Curvea for Test CR-M 1000
a o I a 20 30
Shear, kips
Fig. 3. 7 Intametion C u m for Test 00-1
1000
0 10 20 30 44 50 60 Q 5 10 15 Shear, kips Shear, kips
Fiq. 3. 4 tntemction Curves for Test 8-4 Fig. 3. 8 Interaction Curves for Test DO-2
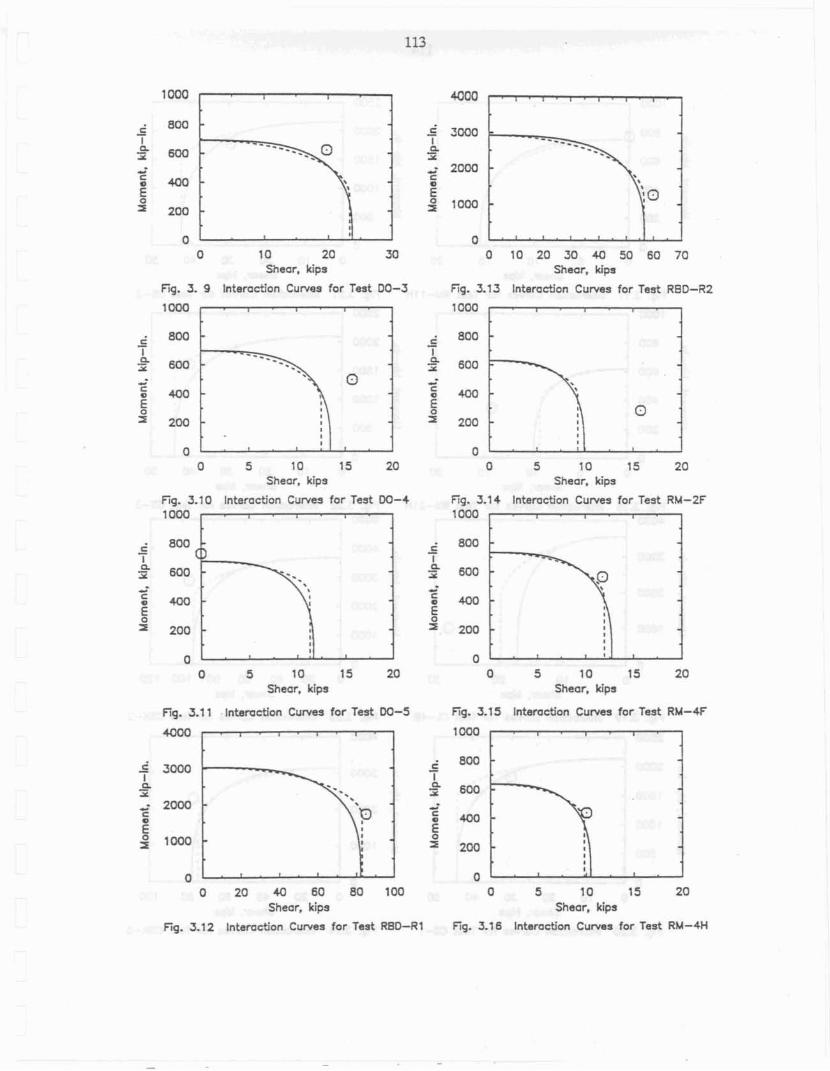
0 0 0 10 20 30 0 10 20 30 40 50 60 70
Shear. kips Shear, kips
Fig. 3. 9 Interndon Curves for Test DO-3 Fig. 3.13 Interaction Curves for Test RBQ-R2 1000 1.000
0 0 0 5 10 15 20 0 5 10 15 20
Shear, kips Shear, kips
Fig. 3.1 0 Interaction Curves for Test 00-4 Fg. 3-1 4 Interaction Curves for Test RM-2F tom 1000
0 0 0 5 10 15 20 0 5 10 15 20
Shear, kips Shear, kips
fig. 3.1 1 Internetion Curwrs for Test DO-5 Fig. 3,t5 lntamctian Curves for Test RM-4F
0 20 40 6Q 80 100 0 5 10 15 20 Shear, kips Shear, kips
Fig. 3.32 Interaction Cunres for Test REiD-81 Fig. 3.16 Interaction Curves for Test AM-4H
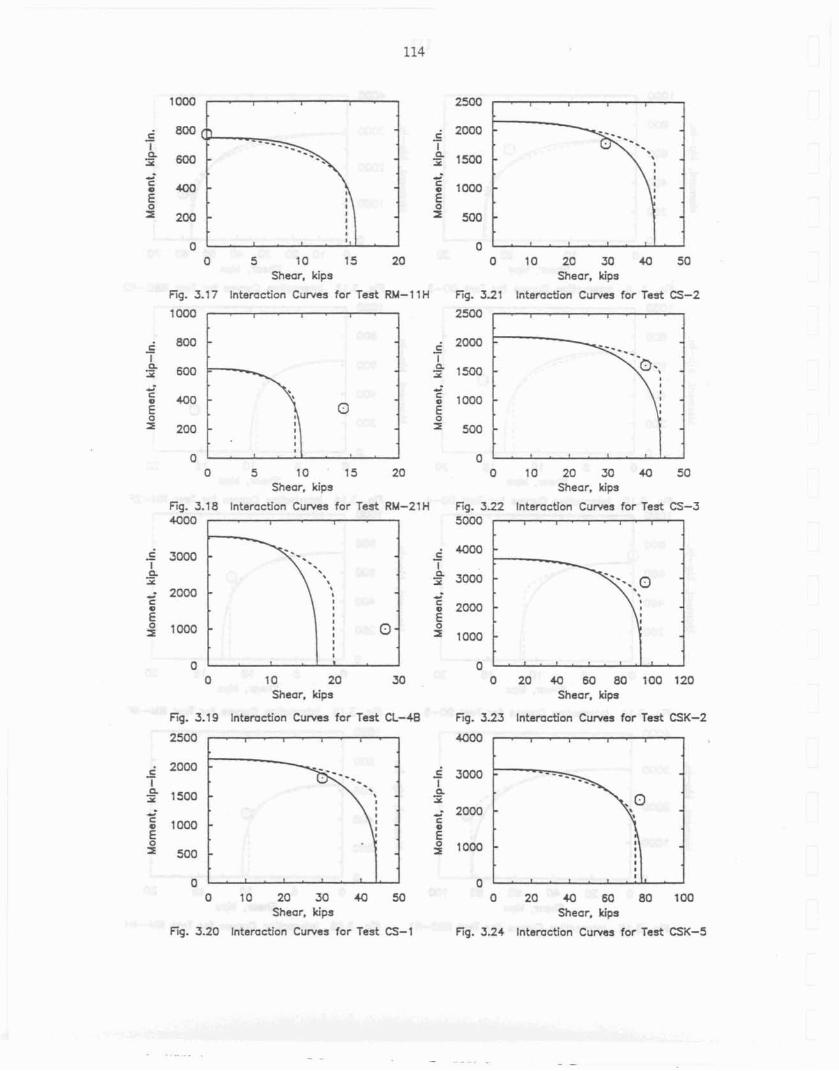
0 5 1 O 15 20 0 10 20 30 40 50 Shear, kips Shear, kips
Fig. 3.17 InteractJon Curves for Test RM- l lH Fiq. 3.21 Tntemetion Curves for Test CS-2
IOOO 2500
0 0 0 5 10 15 20 0 10 20 30 40 50
Shear, kips Shear. kips
Fig. 3-78 Interaction Curves far Test RM-21 H Fig. 3.22 tnteraciion Curves for T e d CS-3 4000 5000
0 10 20 30 Shear, kips
0 20 40 80 80 100 120 Shear, kips
Fig. 3 -1 9 Interaction Cunres for Test Ct-48 Fig. 3.23 Interactition Curvas for Test CSK-2
2500 4000
0 10 20 30 4-0 50 0 20 40 50 80 100 Shear, kips Sheor. kips
Fig. 3.20 Interaction Curves l o r Test CS-t Fig. 3 2 4 lntemcthn Cunes for Test CSK-5

fig. 3.25
10 20 30 40 50 60 0 SO 20 30 40 50 60 70 Shaar, kips Shear, kips
lnteradon Cusues for Test CSK-6 Fig. 3.29 lntemction Curves for Jest CR-4A
0 10 20 30 40 50 60 70 0 10 20 30 40 SO 60
Shear, kips Shear. kips
Interaden Curves for Test CSK-7 Fig. 330 Intemd'on Curves for Test CR-48 3500
c 2500
a E 2000 d
1500
tooo 2
0 0 0 10 20 30 40 50 60 70 80 0 10 20 30 4U 50 60
Shear. kips Sheor, kips
Fig. 3.27 Enteraction C u m s for Test CR-3A Fig. 331 Intnmetion Curves for Test CR-SA
4000 t 500
0 10 20 30 40 50 60 70 80 0 10 20 30 4CJ Shear. kips Shear, kips
Fig. 3.28 Interaction Curves for Test CR-58 f ig . 3.32 Interaction Cums for Test CR-tA
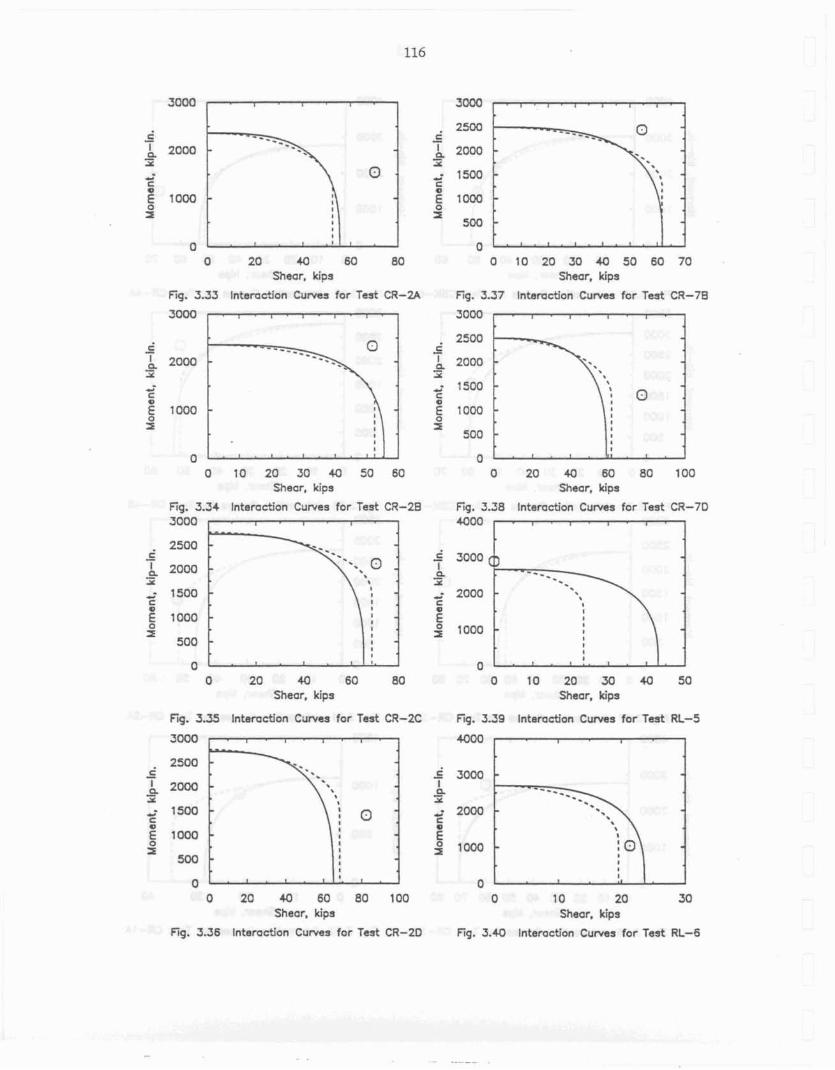
0 10 20 40 60 90
Shear, kips
Fig. 3.33 Intamdon Curvas for Test CR-2A
3 OOO
i - h 2000 - a C E
i tooo 0 I
0 10 20 30 4-0 50 60 Shear, kips
0 0 10 20 30 41) 50 60 70
Sheur, kips
Fiq. 3.37 Intemction Curves for Test CR-78
0 20 40 60 80 100 Shear. kips
Eg. 3.34 lntsrrrction Curves for Test CR-28 Fig. 3.38 Interndon Curvas for Test CR-7D 3000 M O O
0 20 40 60 80 Shear, kips
1 - T ' l - b '
- - - - - *.
- I t I
I . I . . r . I
1 .
O 10 20 30 40 50 Shear. kips
Fig. 3.55 Interu&on Curves for T a d CR-2C Fig. 3.39 lntamction Curws tor Test RL-5
0 20 40 60 80 100 0 10 20 30 Shear. kips Shear. kips
Fig. 3.36 Interaction Curves for Test CR-2I3 Fig. 3.M Interaction Cuwes for Test RL-6
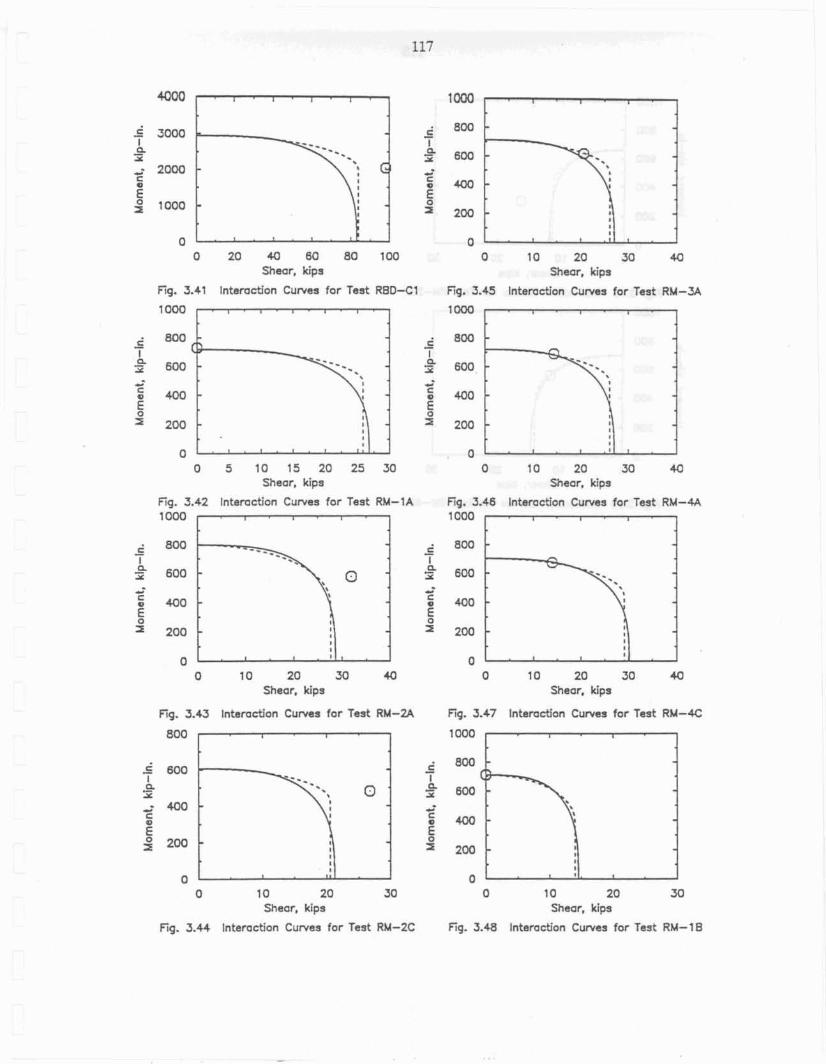
0 0 0 20 CO 60 80 100 0 10 20 30 40
Sheor, kips Shear, kips
Fig. 3.41 Interaction Curves for fsst RBD-Cf Fig. 3.45 rntemetion Curves for Test RM-3A
1 m 10M1
0 0 0 5 10 15 20 25 30 0 10 20 30 40
Shear, kips Shear, kips
Fig. 3.42 Interaction Curves for Test RM-1A Fig. 3-46 Interaction Curves fur Test RM-4A 1000 1000
0 10 20 30 40 Shear, kips
0 10 20 313 # Shear. kips
Fig. 3-43 Intamdon Curves far Tnst RM-24 Eg. 3.47 !ntemction CUFMS for Test RM-4C
0 3 0 20 30 0 t O 20 30 Shear, kips Shear, kips
Fig. 5.44 Interaction Curves for Test RM-PC Fig. 3.48 Internetion Curves for Test RM-I&
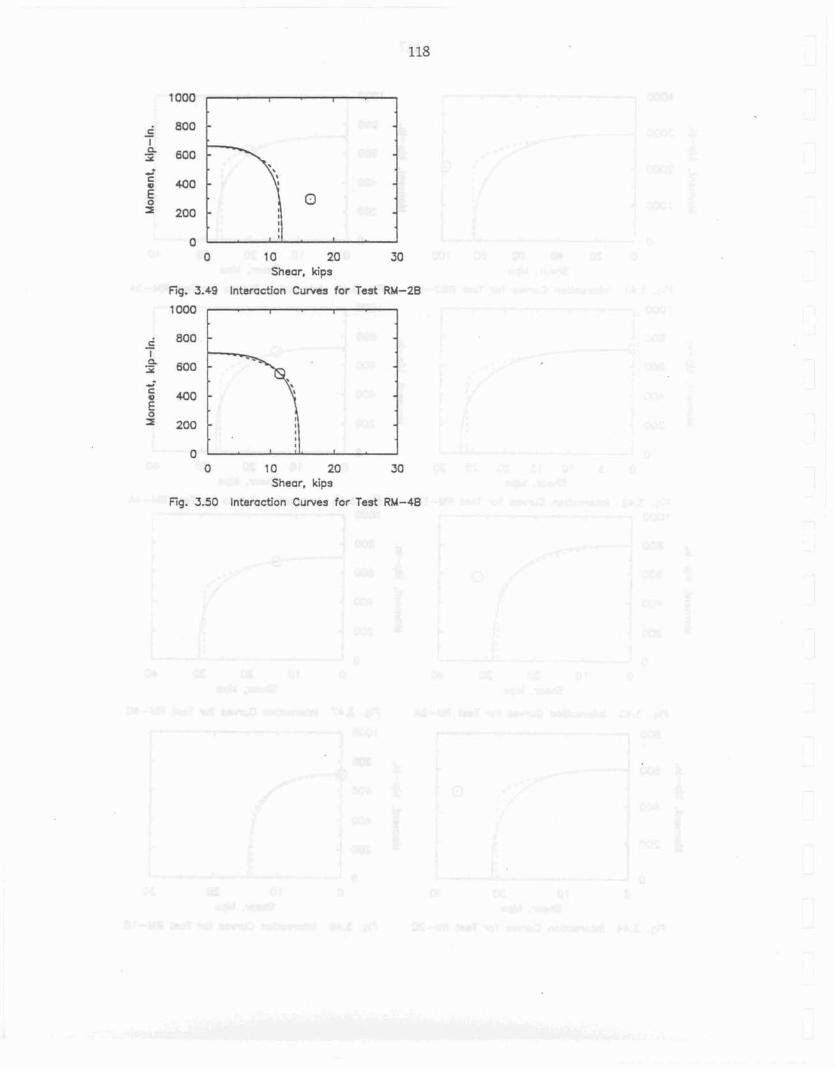
Q 0 15 213 30
Shear. kips
Fig. 3.49 lntsmction Curves for Test RM-ZB
f OW
0 0 10 20 30
Shear, kips
Fig. 3.50 lnteroction Curves for Test RM-4B
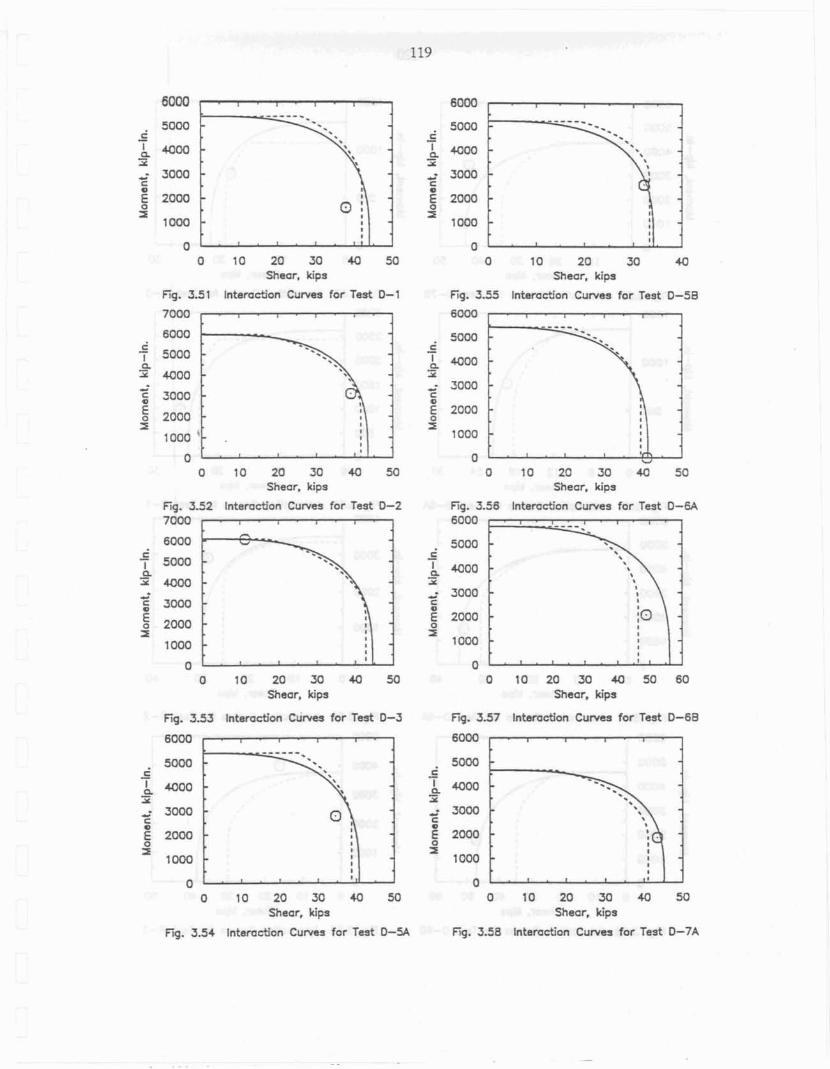
0 0 10 20 30 50
Shear. kips
0 0 10 20 30 40
Shaur, kips
Flg. 3.51 Interadon Curves for Test 0-1 Fig. 3-55 InSemetjon Curves for Test 0-5B
0 0 10 20 30 40 50
Shear. kipo
Fig, 3.52 Interaction Curve% for Test 0-2 7000
6000
0 70 20 30 40 50 Shear. kips
Fig. 3.56 Interaction Curves for Test 0-66 6000
0 O t O 20 30 40 50 60
Shear, kips
(3
0 31) 20 30 40 50 Shear, kips
Fig. 353 Interaction Cumes for Test 0-3 Fig. 3.57 lntaraetion C u m for Test D-6B
6000
0 0 10 20 30 40 SO
Shear, kips
Fig. 3-54 interaction C u m 3 far Test D-5A
0 0 10 20 30 40 50
Shear, kipo
Fig. 3.58 Interaction Curves for Test Q-?A
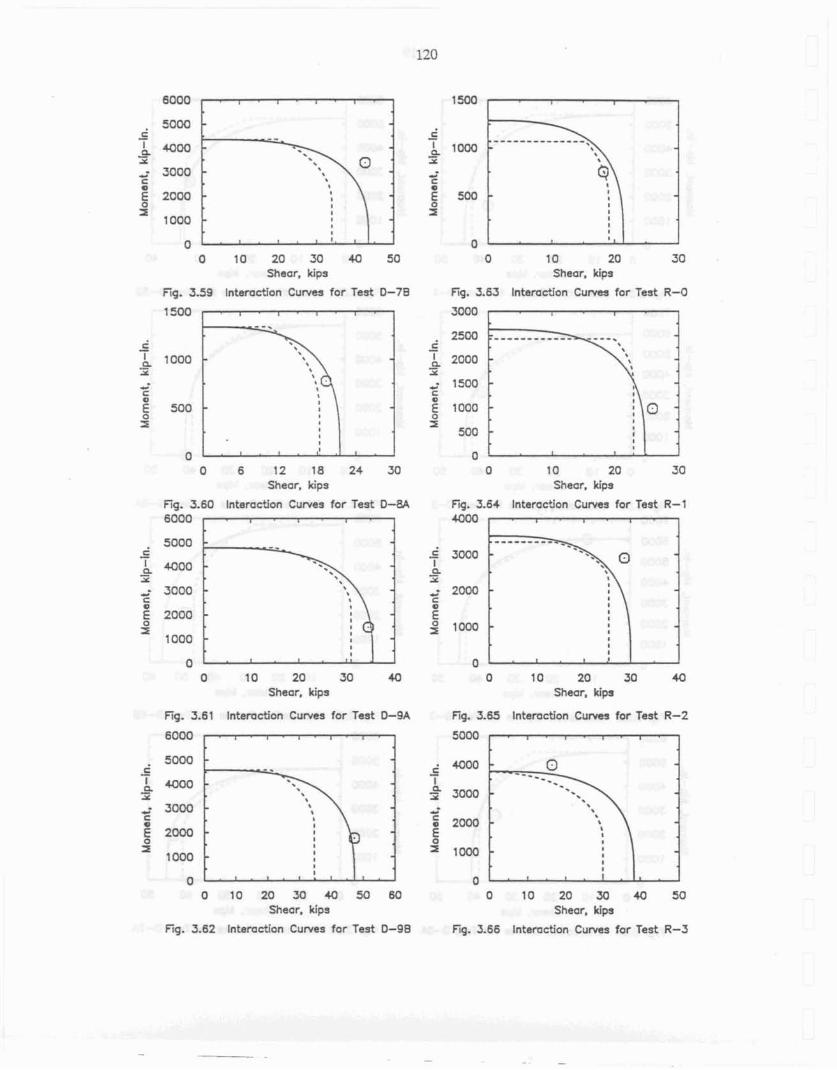
Fig. 3.59
1 ZOO
0 10 20 30 40 501 0 10 20 30
Shear, kips Shear, kips
Fig. 3.60 6000
lntamction Cuwes for Test D-78 fig. 3.63 Interaction C u m for Test R-O
30OU
6 FZ 18 24 30 Shear, kips
InBmefion Curves for Test D-8A
2 0 20 30 40 Shear, kips
!riterattion Curves for Test D-9.4
o 10 20 30 Shear. kips
Fig. 3.64 Interae+ion Curves lor Test R-1 400
0 0 10 20 30 40
Shenr. kips
Fig. 3.85 lntemction C u m far Test R-2
5000
0 I 0 20 30 4Q 50 60 0 10 20 30 40 50 Shear, kips Shear, kips
Fig. 3.62 Interaction Curves for Test 0-98 Fig. 2-56 lntemction C u m for Test R-3
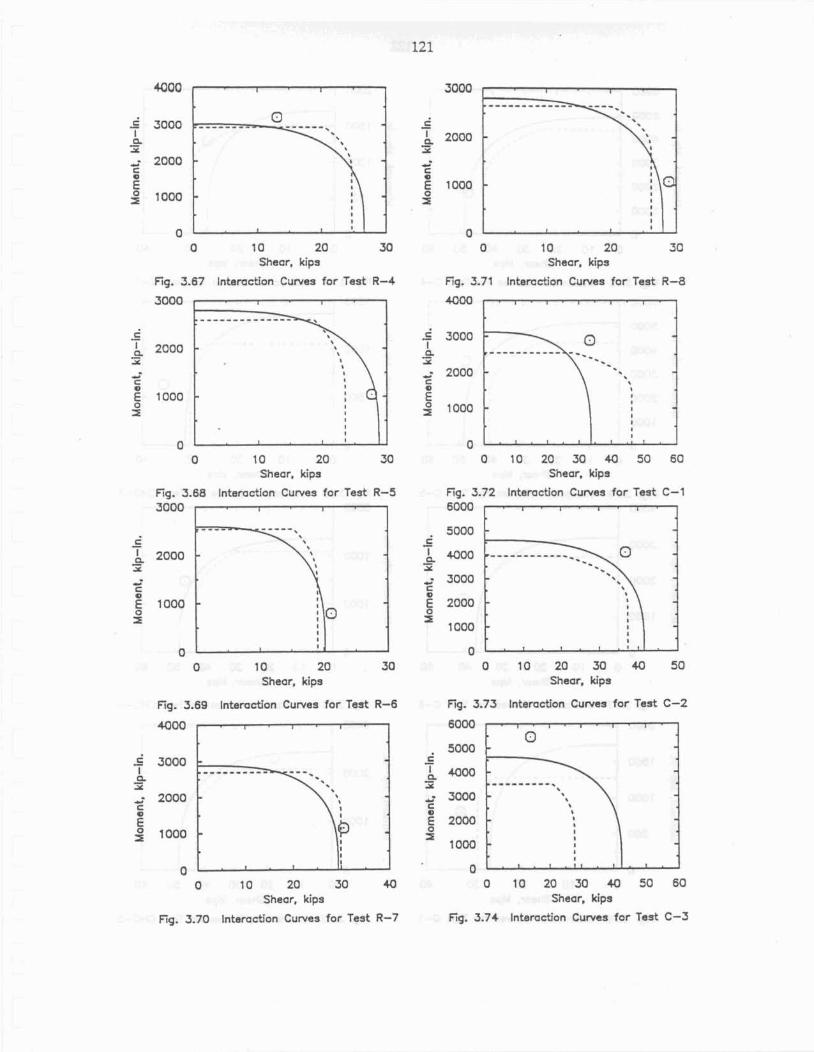
0 0 10 20 30
Shear, kips
Fig. f.fi7 lntemetion Curves for Test R-4
3OQO
0 0 10 20 30
Shear. kips
Fig. 3.88 lntemctian Cumes for Test R-5 3 000
a 0 10 20 30
Shear, kips
Fig. 3.64 I n t ~ m d o n Curves for Test R-6
4000
0 0 t O 20 30
Shear, kips
Fig. 3.71 Intam&*h'on Cuwaa for Test R-8
0 0 10 20 30 40 50 50
Shear, kips
Fig. 3.72 Interndon Curves for Test C-1 moo
0 0 TO 20 30 40 50
Shear, kips
Fig. 3.73 Interadion Curves for %st C-2
I) 10 20 3Q 40 0 10 20 30 40 50 60 Shear, kips Shear, kips
Fg. 3.70 Interaction Curves for Test R-7 Fig. 3.74 Interaction Curves far Test C-3
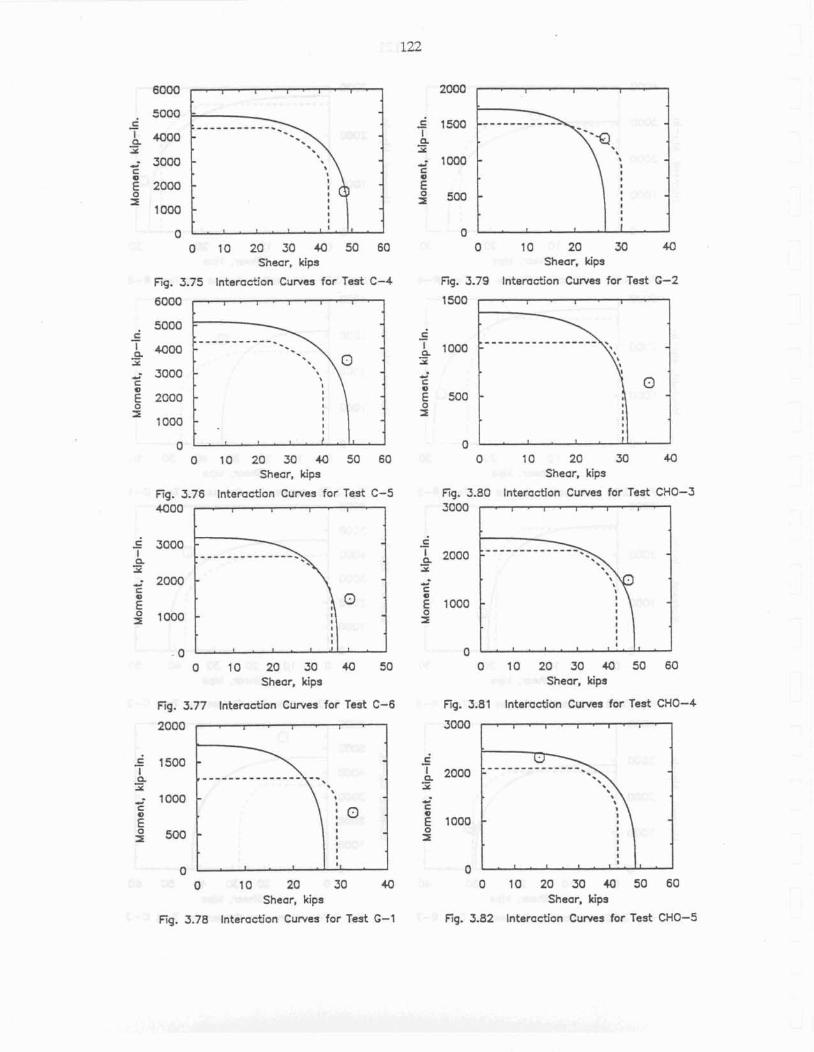
0 10 20 30 40 50 60 0 10 20 M 4U Shear, kips Shear, kips
Fig. 3.75 Intsmc50n Curves for Test C-4 Fig. 3.79 Interadion Curves for Test G-2
6000 t 500
0 0 O t O 20 30 40 50 60 0 10 20 30 40
Shear, kips Shear, kips
Fig. 3.76 Interaction Cumes for Test C-5 Fig. 3.80 Interaction Curves for Test CHO-3 4000 3000
0 10 20 30 40 50 Shear, kips
0 10 20 30 40 50 60 Shear, kips
Fiq. 3.77 Interaction Curves for Test C-6 Fig. 3.81 Internetion Curras for Test CHO-4
2000 3000
0 10 20 30 40 0 10 20 30 4 50 60 Shear, kips Shear, kips
Fig. 3.78 Interaction Curves for Test G-5 Fig. 3,82 lntamctian Cuwes for f i s t CHO-5
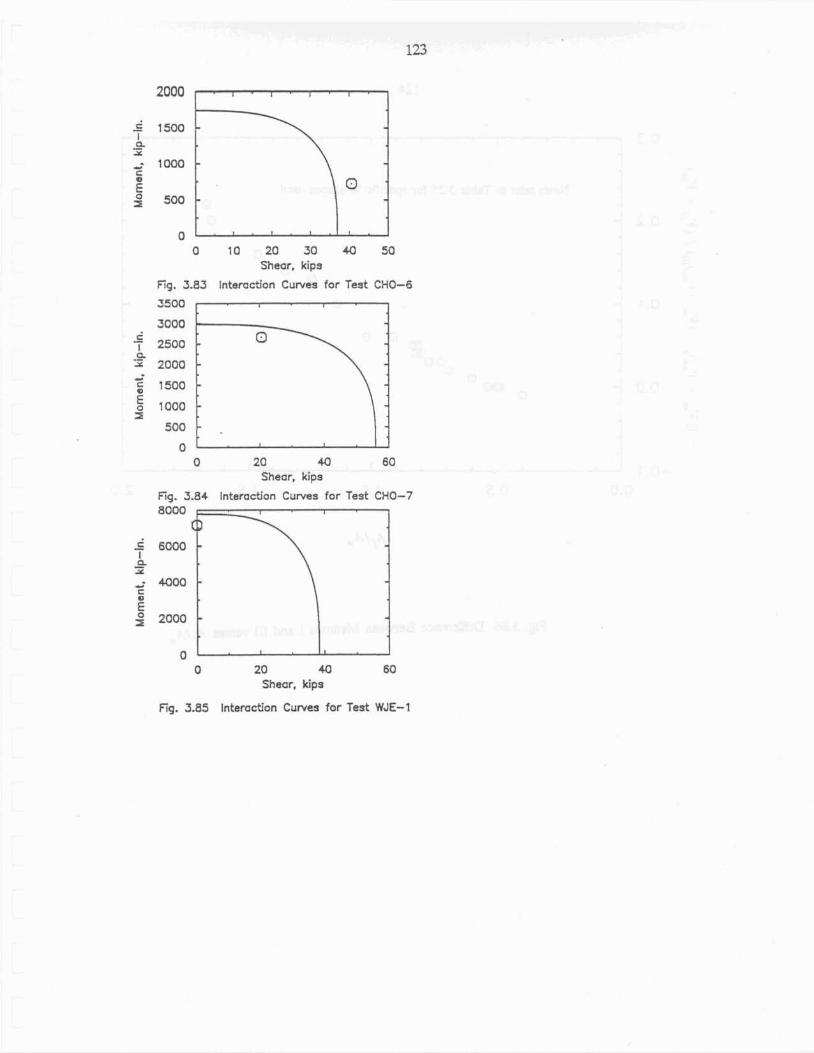
0 0 10 20 30 40 50
Shear. kips
Fig. 3.83 Int~raction Curves for Test CHO-6
0 0 20 40 60
Shear, kips
f ig. 3.84 Interaction Curves fo r Test CHO-7
0 20 40 60 Shear, kips
Flg, 3.85 Interaction Curves far Teat WJE-I
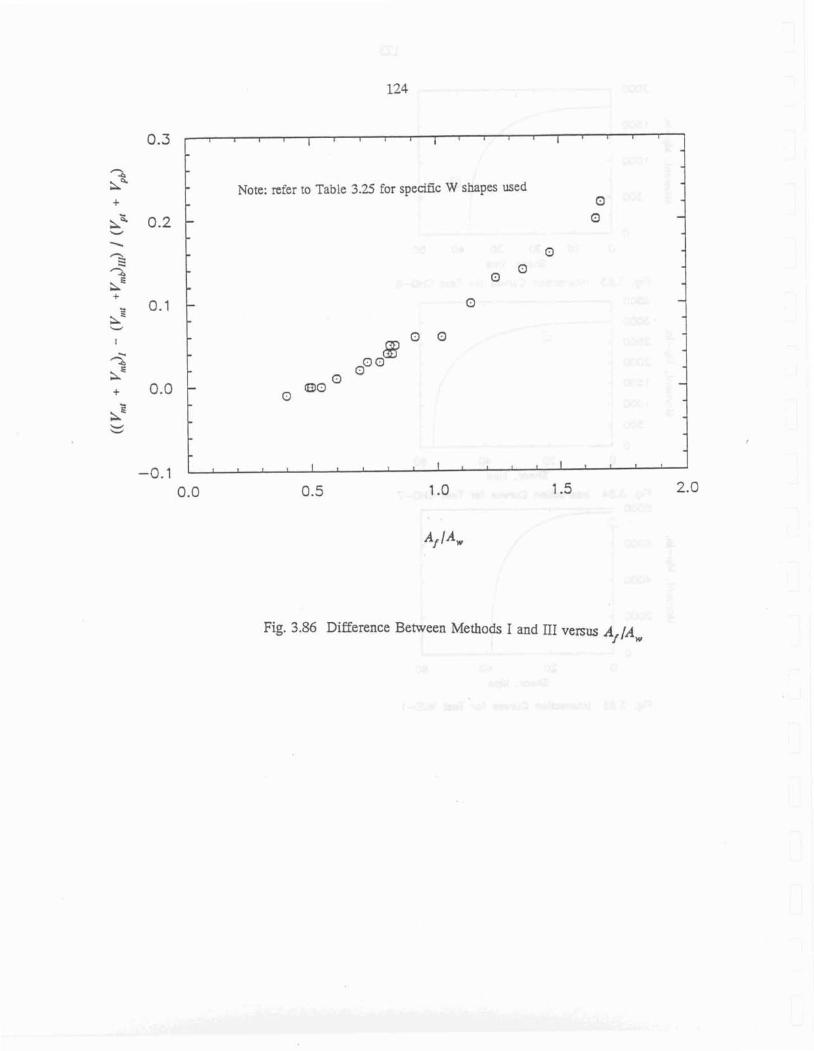
Note: refer to Table 3-25 for specific W shapes used
Fig. 3.86 Difference Behveen Methods 1 and Ili Venus At/A,
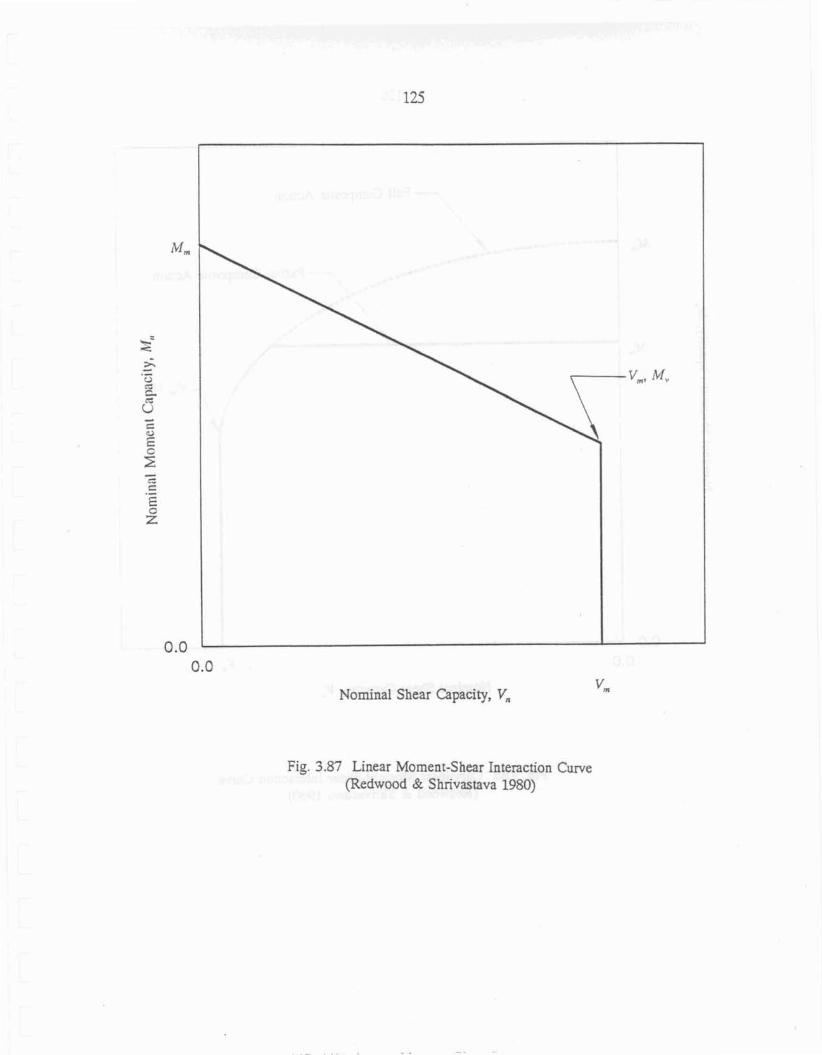
0.0
NominaI Shear Capacity, V,
Fig. 3.87 Linear ldoment-S hear Interaction Curve (Redwood & Shrivastava 1980)
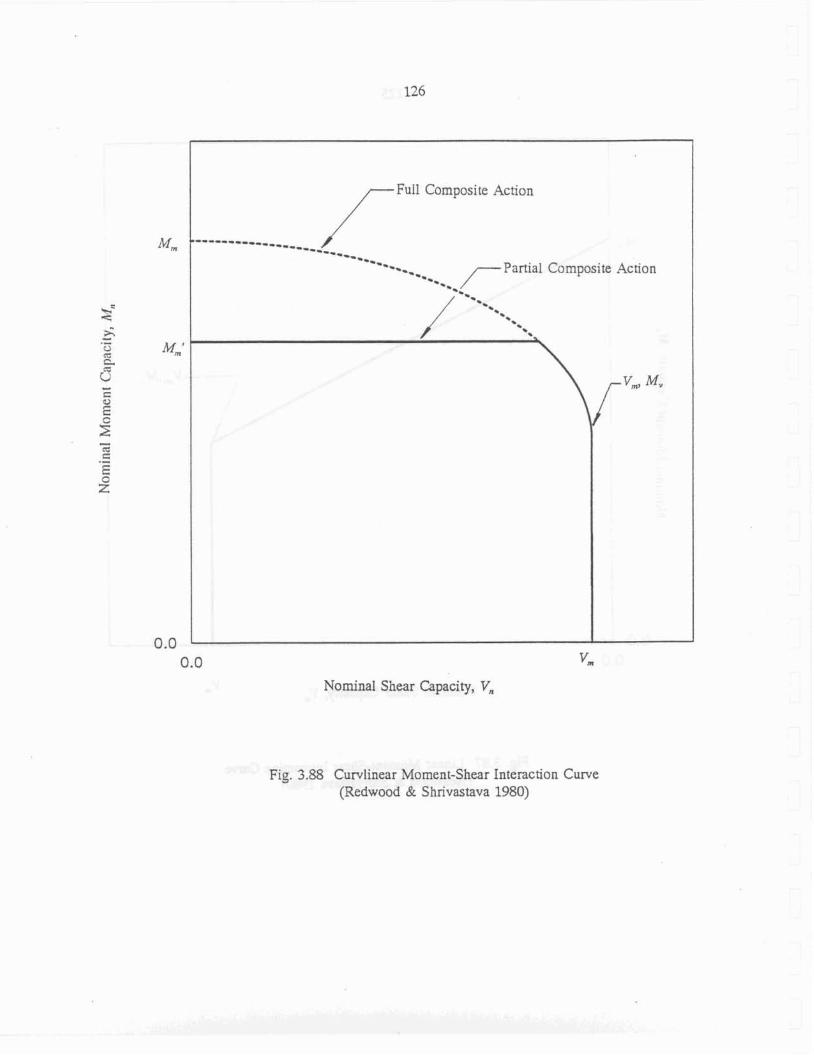
/"- FulI Composite Action
----------- ------- --- ---_ --1 -- -*- Partial Composite Action ----. ,-
I
v m
Nominal Shear Capacity, V,
Fig. 3.88 Curvlinear Moment-Shear Interaction Curve (Redwood & Shrivastava 1980)

Fig. 3.89 Comparison of Method 111 with Test Results for Steel Beam
I I I I 1 I 1 1
Rectonquiar Opening, Unreinforesd - O Circular Opening, Vnreinfomed
- A Rectanqubr Opening. Reinfarced ------- Predicted Strength x Resistance Factor (0.90) -
Predicted Strength -
- -
----------- - -- - -
- A
- - a
- - El
- - \
- I 1 1 I - I I I
& 1 1
-
-
-
I I t
I I 1 1 1 I 1 1 I 1 - 1

Fig. 3.90 Comparison of Method 111 with Test Results for Composite Beams
I I I 1 I I I 1 I I 1 I 1 1
O Ribbed Slab - Solid Slab -
A Reinforced ------- - Predicted Strength x Resistance Factor (0.85) - Predicted Strength
- -
- - Q Q
- -
----3--__ ----- - -
- -
- -
- - -
- :o - 1
- 1 I 1
- I 1 I
- -
I I I 1 1 I I 1 L I n I I I t
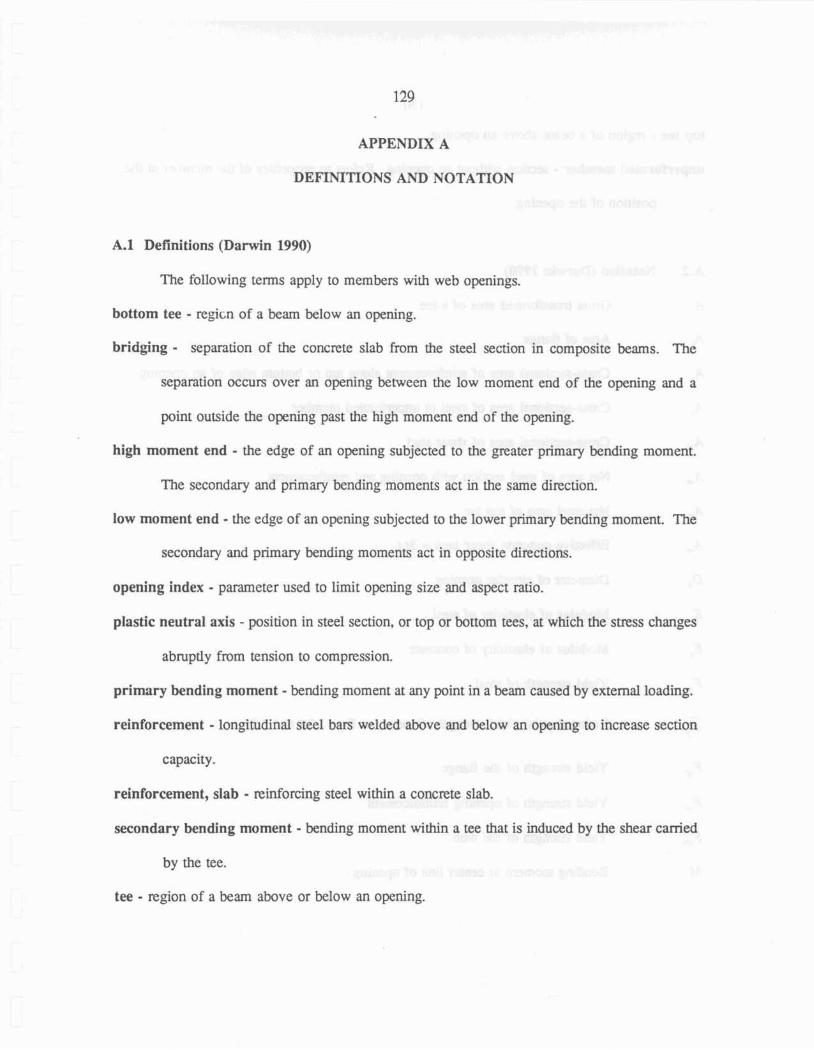
129
APPENDIX A
DEFINITIONS AND NOTATION
A.1 Definitions (Darwin 1990)
The following terms apply to members with web openings.
bottom tee - regicn of a beam below an opening.
bridging - separation of the concrete sIab from the steel section in composite beams. The
separation occurs over an opening between the low moment end of the opening and a
point outside the opening past the high moment end of the opening.
high moment end - the edge of an opening subjected to the greater primary bending moment.
The secondary and primary bending moments act in the same direction.
low moment end - the edge of an opening subjected to the lower primary bending moment. The
secondary and primary bending moments act in opposite directions.
opening index - parameter used to limit opening size and aspect ratio.
pIastic neutral axis - position in steeI section, or top or bottom tees, at which the stress changes
abrupsTy from tensj on to compression.
primary bending moment - bending moment at my point in a beam caused by external loading.
reinforcement - longitudinal steel bars welded above and below an o p i n g to increase section
capacity.
reinforcement, dab - in forcing steel within a concrete slab.
secondary bending moment - bending moment within a tee that is induced by the shear camed
by the tee.
tee - region of a beam above or below an opening.

top tee - region of a beam above an opening.
unperforated member - section without an opening. Refers to properties of the member at the
position of h e opening.
Notation (Darwin 1990)
Gross transformed area of a tee
Area of flange
Cross-sectional area of reinforcement along top or bottom edge of an opening
Cross-sectional area of steel in unperforated member
Cross-sectional area of shear stud
Net area of steel section with opening and reinforcement
Net steel area of top tee
Effective concrete shear area = 344
Diameter of circular opening
Modulus of elasticity of steel
Modulus of eIasticity of concrete
Yield strength of steel
- FY
Reduced axial yield strength of steel; see Eqs. 2.24 and 2.25
Fd Yield strength of the flange
5 Yield strength of opening reinforcement
F, Yield strength of the web
M Bending moment at center Iine of opening
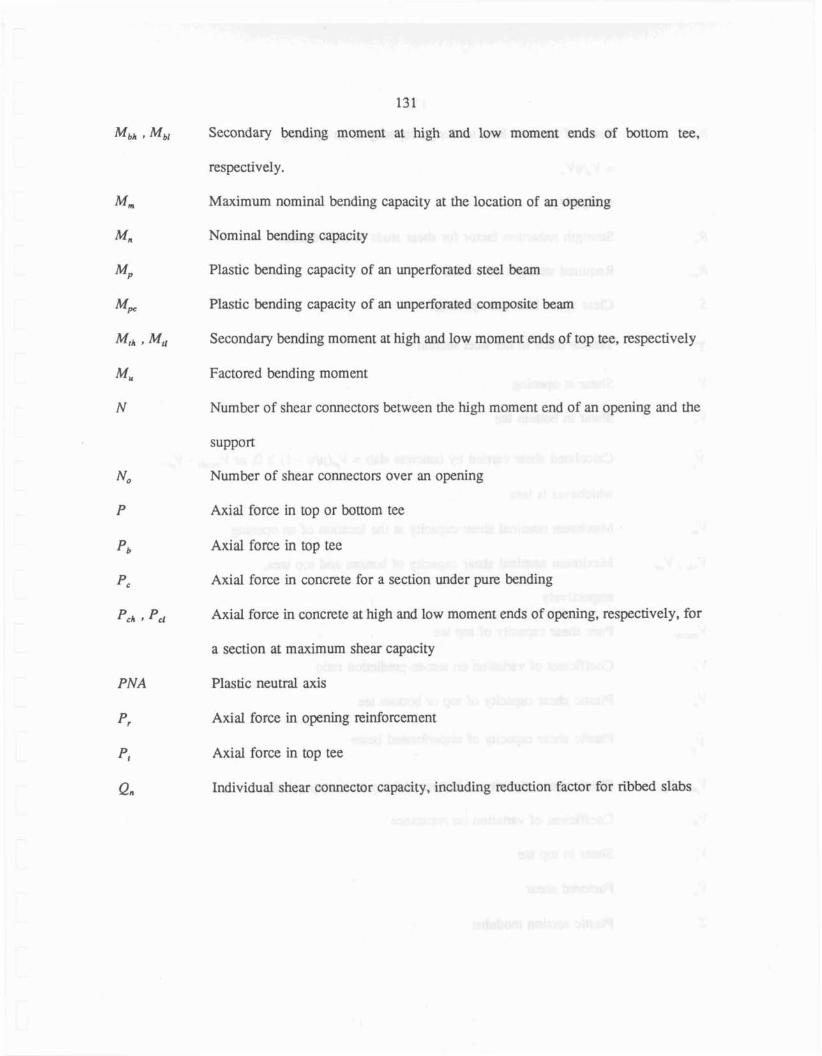
PNA
p r
p,
Qn
13 1
Secondary bending moment at high and low moment ends of bottom tee,
respectively.
Maximum nominal bending capacity at the location of an opening
Nominal bending capacity
Plastic hading capacity of an unperforated steel beam
Plastic bending capacity of an unperforated composite beam
Secondary bending moment at high and low moment ends of top tee, respectively
Factored bending moment
Number of shear connectors between the high moment end of an opening and the
support
Number of shear connectors over an opening
Axial force in top or httom tee
Axial force in top tee
Axial force in concrete for a section under pure hnding
Axial force in concrete at high and Iow moment ends of opening, respectively, for
a section at maximum shear capacity
Plastic neutraI axis
Axial force in opening reinforcement
Axial force in top tee
lndividual shear connector capacity, including reduction factor for ribbed dabs
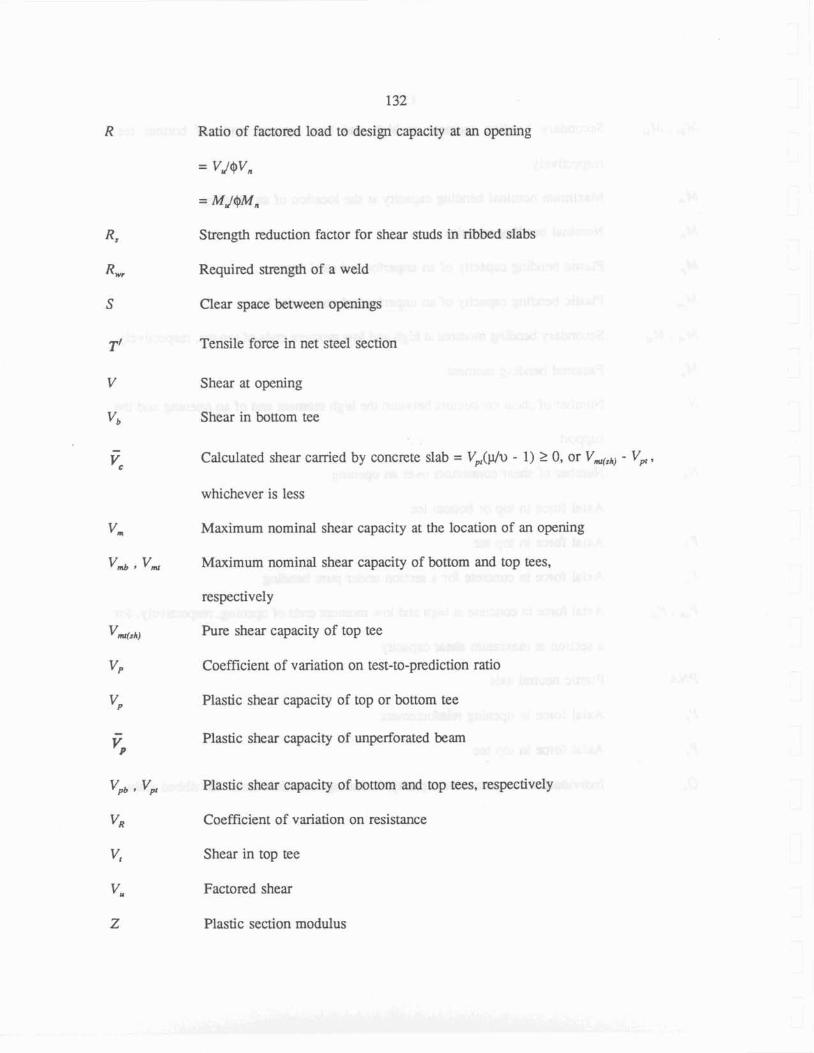
132
Ratio of facto~d load to design capacity at an opening
= V J W ,
= M A M ,
Strength reduction factor for shear studs in ribbed slabs
Required strength of a weld
Clear space I>etween openings
Tensile force in net steel section
Shear at opening
Shear in bottom tee
Calculated shear carried by concrete dab = V,(p/v - 1) 1 0, or V,,,, - V, ,
whichever is less
Maximum nomind shear capacity at the location of an opening
Maximum nominal shear capacity of bottom and top tees,
respectively
Pure shear capacity of top tee
Coefficient of variation on test-to-prediction ratio
Plastic shear capacity of top or bottom tee
Plastic shear capacity of unperforated ham
Plastic shear capacity of bottom and top tees, respectively
Coefficient of variation on resistance
Shear in top tee
Factored shear
Plastic section modulus
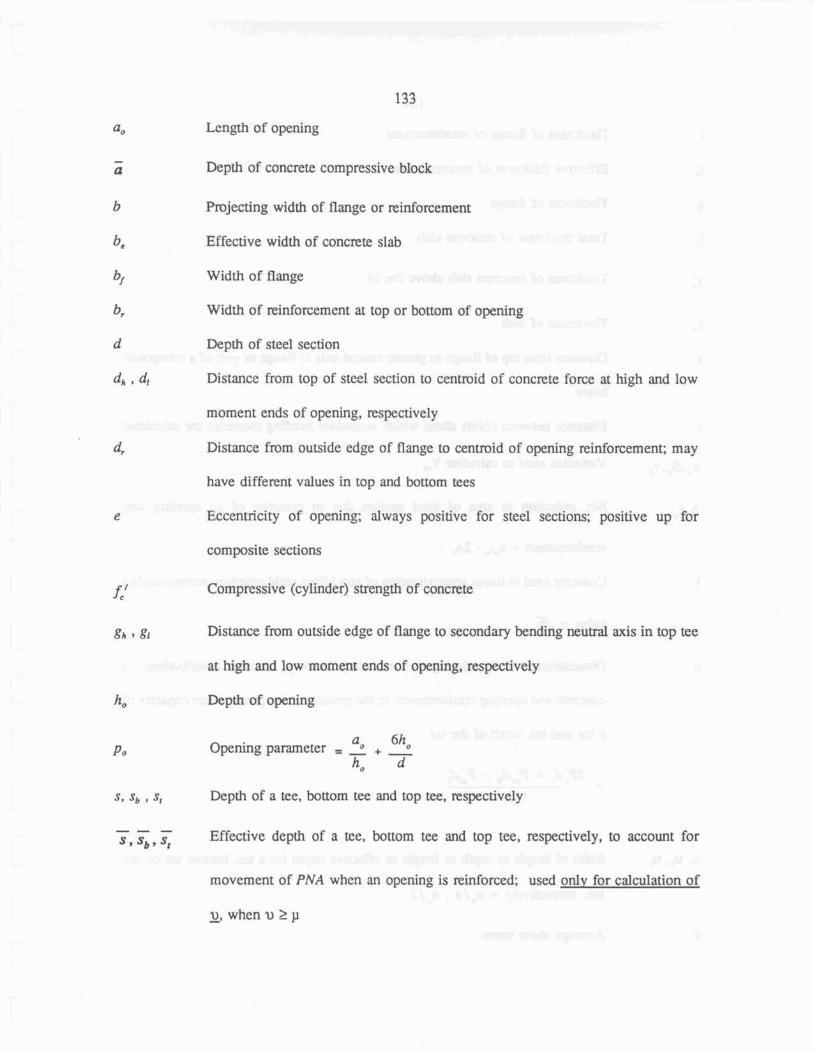
133
Length of opening
Depth of concrete compressive block
Projecting width of flange or reinforcement
Effective width of concrete slab
Width of flange
Width of reinforcement at top or bottom of opening
Depth of steel section
Distance from top of steel section to centroid of concrete force at high and low
moment ends of opening, respectively
Distance from outside edge of flange to centroid of opening reinfotcement; may
have different values in top and bottom tees
Eccentricity of opening; always positive for steel sections; positive up for
composite sections
Compressive (cylinder) strength of concrete
Distance from outside edge ef flange to secondary bending neutrd axis in top tee
at high and low moment ends of opening, respectively
h0 Depth of opening
P o ah0 Opening parameter = 2 + - h o d
3, Sb , St Depth of a tee. httorn tee and top tee, respectively
- - - S, S b P s, Effective depth of a tee. bttorn tee and top tee, respectively, to account for
movement of PNA when an opening is reinforced; used ody for cdculation of
u, when u l p *
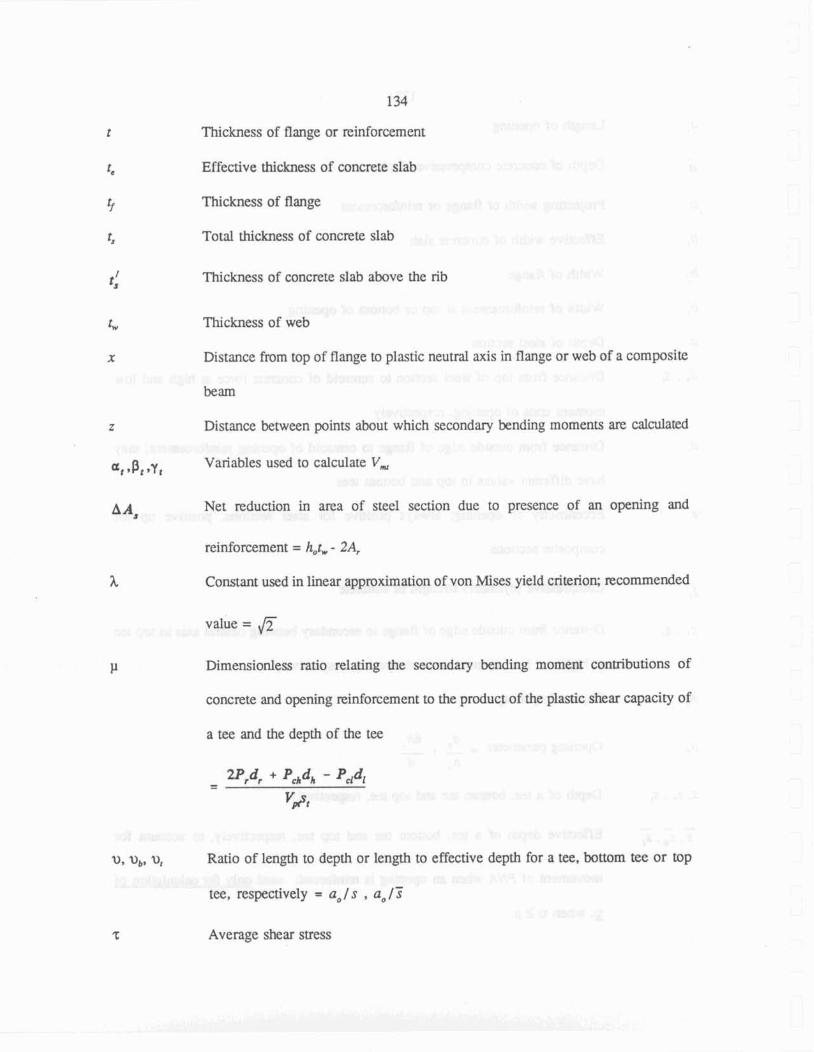
134
Thickness of flange or reinforcement
Effective thickness of concrete sIab
Thickness of fIange
Total thickness of concrete slab
Thickness of concrete slab above the rib
Thickness of web
Distance from top of flange to plastic n e u d axis in flange or web of a composite
beam
z Distance between points about which secondary knding moments are caldated
at ,PI =Y Variables used to calculate V ,
A As Net reduction in area of steel section due to presence of an opening and
reinforcement = hotw - 2 4
Constant used in linear approximation of von Mises yield criterion; recommended
vdue = fi
Dimensionless ratio relating the secondary bending moment contributions of
concrete and opening reinforcement to the product of the plastic shear capacity of
a tee and the depth of the tee
U, Ub, U, Ratio of length to depth or length to effective depth for a tee, bottom tee or top
tee, respecxively = a,/s , a, /?
T Average shear stress
Resistance factor
Subscripts:
b Bottom tee
m Maximum or mean
n Nominal
t Top tee
~1 Facto~d

136
APPENDIX B
SHEAR CAPACITY EXPRESSIONS FOR
COMPARISON WITH TEST DATA
B.1 Method I.
The top and bottom tee shear capacities determined by Method I, considering different
yield strengths for the web, flange, and stiffener, are- calculated using the following expressions.
in which
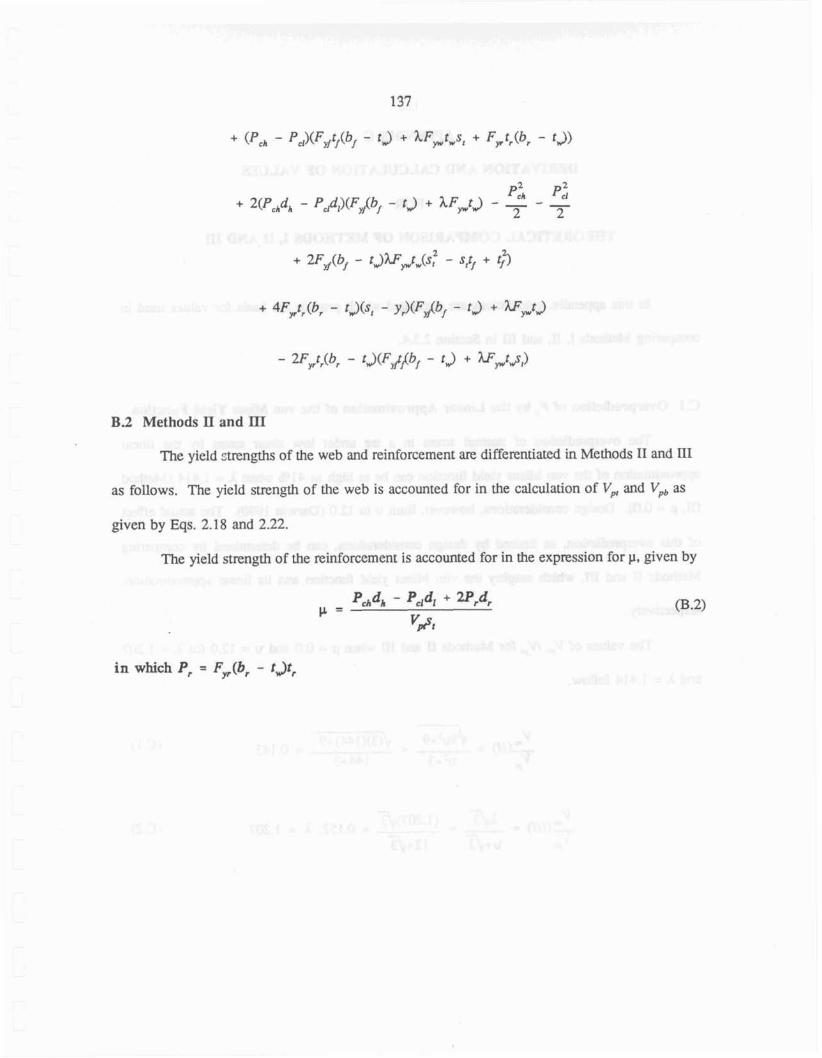
B 2 Methods II and III
The yield strengths of the web and reinforcement are differentiated in Methods II and I11
as follows. The yield strength of the web is accounted for in the calcuIation of V, and V,, as
given by Eqs. 2.18 and 2.22.
The yield strength of the reinforcement is accounted for in the expression for p, given by
in which P, = FJb, - tJt,
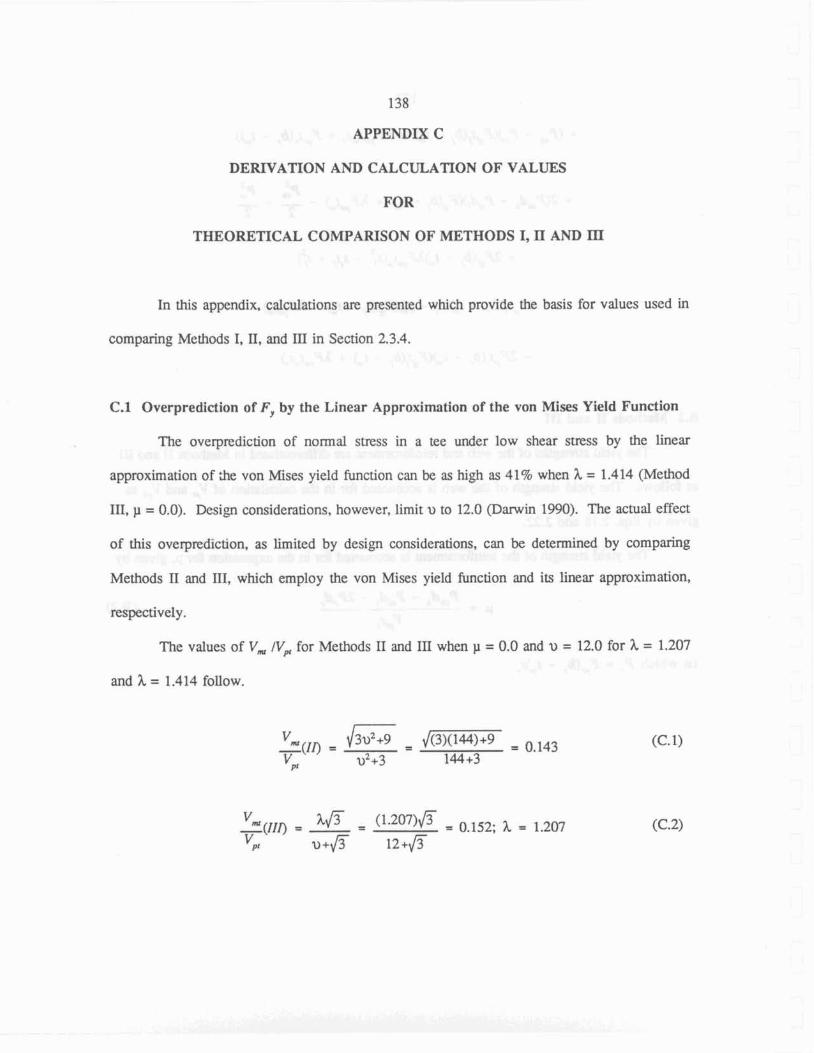
138
APPENDIX C
DEWATION AND CALCULATION OF VALUES
FOR
THEORETICAL COMPARISON OF METHODS I, IL AND m
In this appendix, calculations are presented which provide the basis for values used in
comparing Methods 1, TI, and III in Section 2.3.4.
C.1 Overprediction of F, by the Linear Approximation of the von Mises Yield Function
The overprediction of normal stress in a tee under low shear stress by the linear
approximation of the von Mises yield bnction can be as high as 41% when h = 1.414 (Method
111, p = 0.0). Design considerations, however, limit u to 12.0 @amin 1990). The actual effect
of this overprediction, as limited by design considerations, can be determined by comparing
Methods I1 and Ill, which employ the von Mises yield function and irs linear approximation,
respectively.
The values of V, JV, for Methods IT and 111 when p = 0.0 and u = 12.0 for h = 1.207
and h = 1.414 follow.
vm ( I T ) = \ /3d+9 - - Jw = 0.143
v@ u"3 144 +3
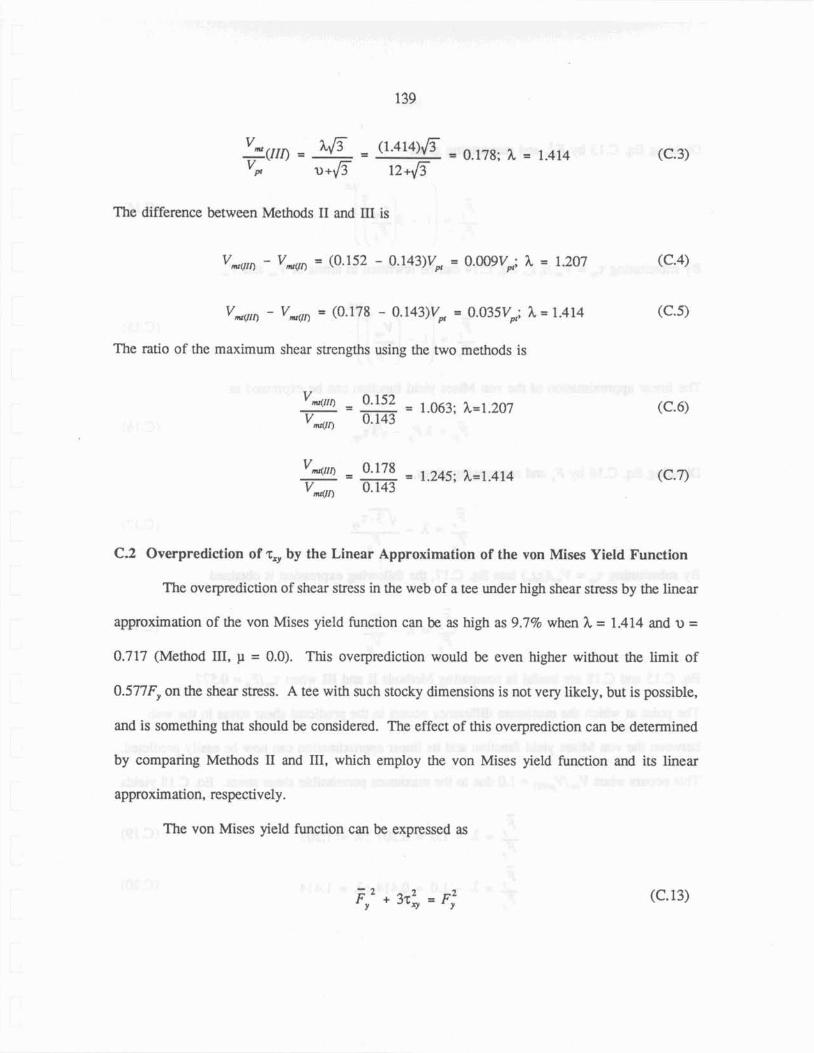
The difference between Methods TI and 111 is
v m r ( ~ ~ ~ - Vnvvr) = (0.178 - 0.143)V, = 0.035VpI; h = 1.474
The ratio of the maximum shear strengths using the two methods is
C,2 Overprediction of T~ by the Linear Approximation of the von Mises YieId Function
The werprediction of shear stress in the web of a tee under high shear stress by the linear
approximation of the von Mises yield function can be as high as 9.7% when h = 1.414 and u =
0.717 (Method III, p = 0.0). This overprediction wodd be even higher without the limit of
0.577FY on the shear stress. A tee with such stocky dimensions is not very likely, but is possible,
and is something that should be considered. The effect of this overprediction can be determined
by comparing Methods I1 and m, which employ the von Mises yield function and its linear
approximation, respectively.
The von Mises yield hnction can be expressed as
(C. 13)
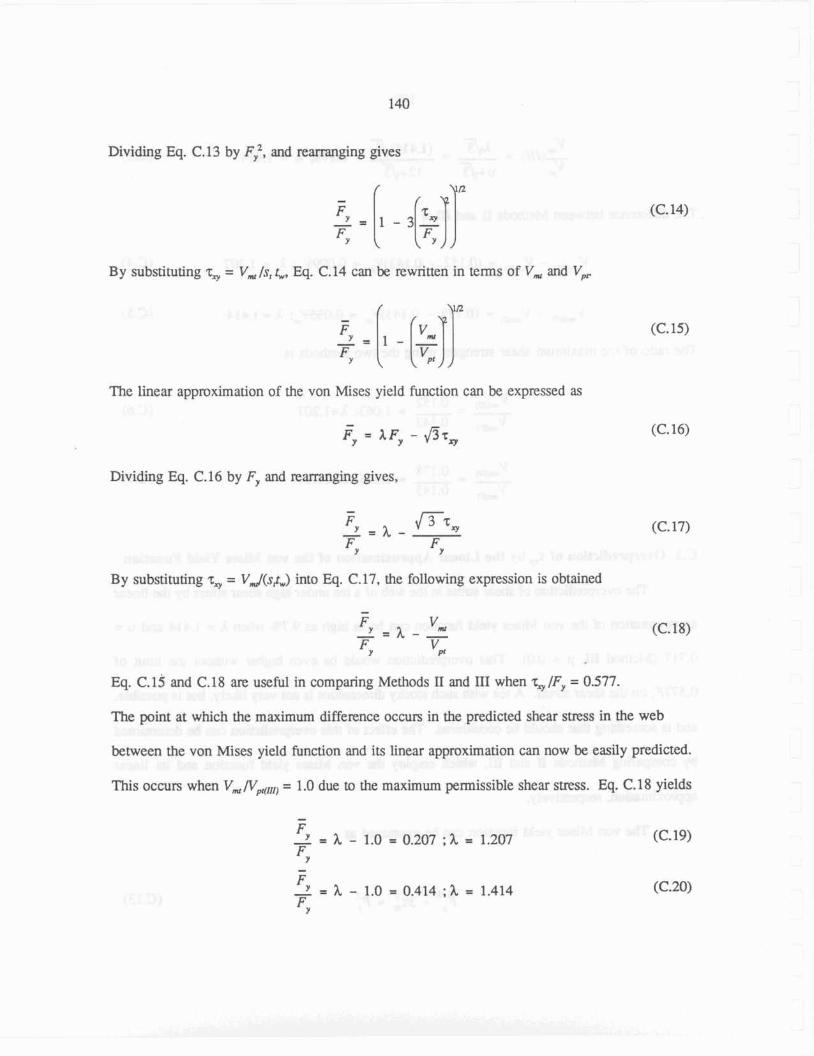
Dividing Eq. C.13 by F:, and rearranging gives
By substituting T~ = V,/S,L, Eq. C.14 can be rewritten in terms of V , and V,
The linear appmximation of she yon Mises yield function can be expressed as
Dividing Eq. C.16 by F, and rearranging gives,
By substituting z, = V,,J(SJ~) into Eq. C.17, the following expression is obtained
(C. 16)
Eq. C.13 and C.18 arc useful in comparing Methods I1 and 111 when z, IF, = 0.577.
The point at which the maximum difference occurs in the predicted shear stress in the web
between the von Mises yield function and its linear approximation can now be easiIy predicted.
This occurs when V,/Vdf,IE = 1.0 due to the maximum permissible shear stress. Eq. C.18 yields
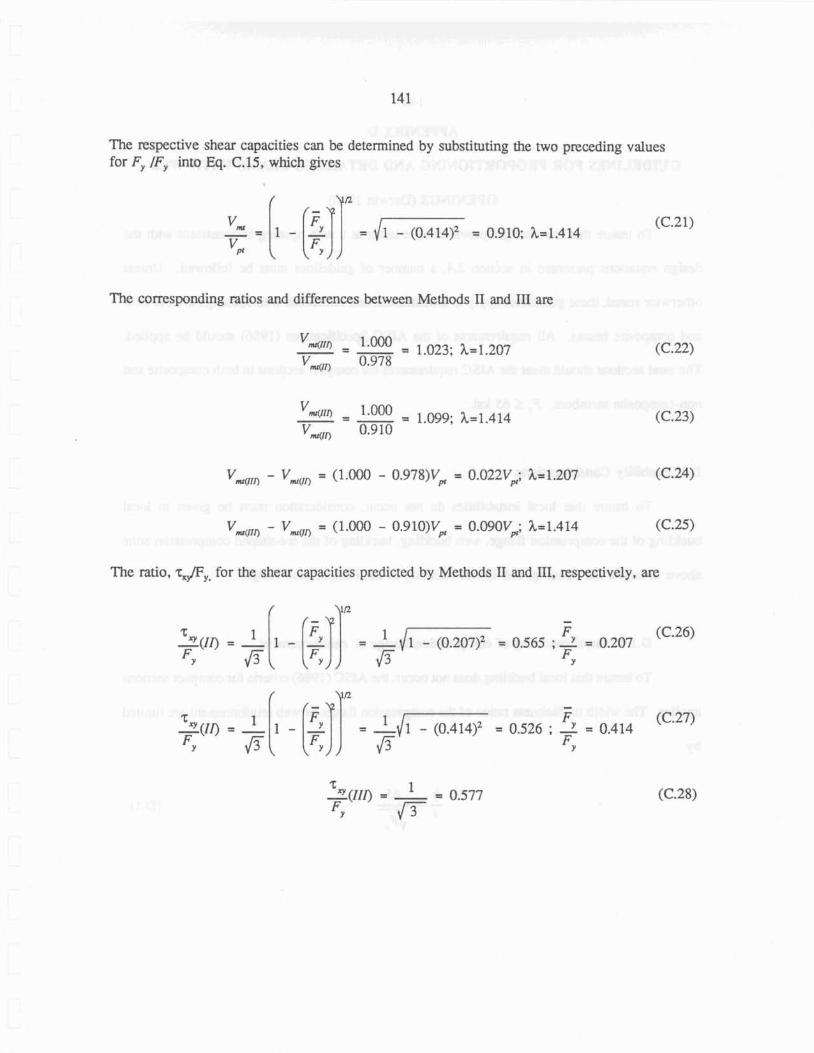
The ~spective shear capacities can be determined by substisudng the two preceding values for F, /F, into Eq. C.15, which gives
The corresponding ratios and differences between Methods I1 and 111 arr:
The ratio, Wy, for the shear capacities predicted by Methods II and 111, respectively, are
142
APPENDIX D
GUIDELINES FOR PROPORTIONING AND DETAILING BEAMS WITH WEB
OPENINGS (Darwin 1990)
To insure that the strength provided by a beam at a web opening is consistent with the
design equations presented in section 2.4, a number of guidelines must be followed. Unless
otherwise stated, these guidelines apply to unreinforced and reinforced web openings in both steel
and composite beams. All requirements of the AlSC Specifications (1986) should be applied.
The steel sections should meet the AISC requirements for compact sections in both composite and
non-composite members. F, 1 65 ksi.
D.1 Stability Considerations
To insure that locd instabilities do not occur, consideration must be given to local
buckling of the compression flange, web buckling, buckling of the tee-shaped compression zone
above or below the opening, and lateral buckling of the compression flange.
D.I.l Local buckIing of compression flange or reinforcement
To insure that local buckling does not occur, the AISC (1986) criteria for compact sections
applies. The width to thickness ratios of the compression flange: or web reinforcement are limited
by
143
in which b = projecting width of flange or reinforcement
t = thickness of flange or seinfoscement
F, = yield strength in ksi
For a flange of width, bf , and hichess. tf , Eq. D.1 becomes
D.1.2 Web Buckling
To prevent buckling of the web, two criteria should be met:
(a) The opening parameter, p,, should be limited to a maximum vafue of 5.6 for steel
sections and 6.0 for composite sections.
in which a, and h, = length and width of opening, respectively
d = depth of skel section
(b) The w ~ b width-thickness ratio should be limited as follows
in which r,= thickness of web
144
If (d - 2t,)/t, 5 420/% the web qualifies as stocky, In this case, the upper limit on adh.
is 3.0 and the upper limit on V, (maximum nominal shear capacity) for non-composite sections
is 0.675, in which 6 = F,~J /JS , the plastic shear capacity of the unperforated web. For
composite sections, this upper limit may be increased by which equals V,(p,h - 1) 1 0, or
VW, - V,,, whichever is less. All standard rolled W shapes qualify as stocky members.
If 4 2 0 6 < (d - 2t,)/tw 5 520/%, then aJh, should be limited a 2.2, and Vm should be
limited to 0.458, for both composite and non-composite members. The limits on opening
dimensions to pwent web buckling, presented in this section are summarized graphically in Egs.
D. 1, D.2, and D.3. Fig. D. 1 graphs aJh, versus hJd to determine permissible opening sizes. Figs.
D.2 and D.3 graph ads! versus the value a&, that meets the opening dimension requirements of
this section for steel (p, = 5 6 ) and composite Cp, = 6.0) beams, respectively.
D.13 Buckling of tee-shaped compression zone
For steel b e m s only: The tee which is in compression should be investigated as an
axially loaded column following the procedures of AISC (1986). For urninforced members, this
is not required when the aspect ratio of the tee (u = ad's) is less fian or equaI to 4. For reinforced
openings. this check is only required for Iarge openings in regions of high moment.
D.1.4 Lateral Euckling
For steel beams only: In members subject to lateral buckling of the compression flange,
strength should not lx governed by strength at the opening (calculated without reg& te lateral
buckling).
145
In mernkrs with unheinforced openings or reinforced openings with Phe reinforcement
placed on both sides of the web, the torsional constant, J , shodd k multiplied by
in which L, = unbraced length of compression flange
bA, = h,- 24,
In members reinforced on o d y one side of the web, A, = 0 for the calculation of M3 in
Eq. D.5. Membcrs reinforced en one side of the web should not be used for long, IateraIly
unsupported spans. For shorter spans the lateral bracing closest to the opening should be designed
for an additional load equal to 2 p-cent of the force in the compression flange.
D.3 Other Considerations
D3.1 Opening and tee dimensions
Opening dimensions are restricted based on the criteria in section D.I.2. Additional
criteria &o apply.
The opening depth should not exceed 70 percent of the section depth (h, 5 0.74. The
depth of the top tee should not k Iess than 15 percent of the depth of the steel section (st 2
0.156). The depth of the bottom tee. s, should not be less than 0.1Sd for steel sections or O.12d
for composite sections. The aspect ratios of the tees (u = aJs) should not be greater than 12 (a&,
I 12, ads, 5 12).
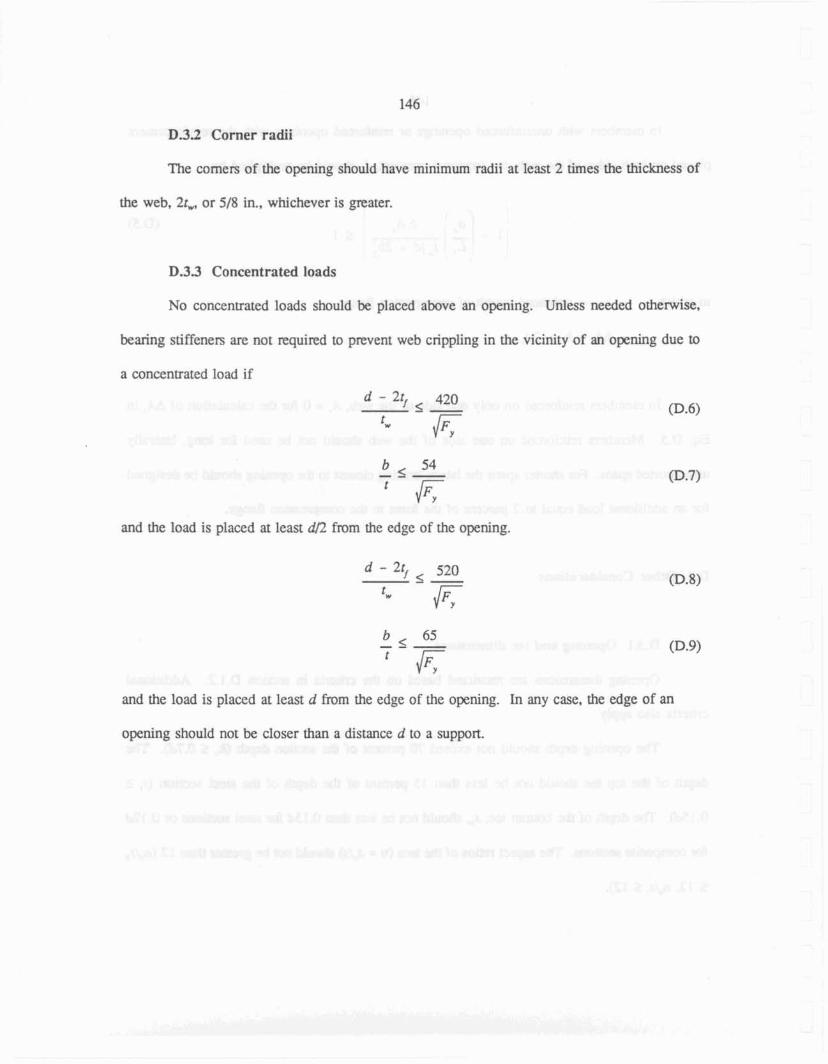
D.3.2 Corner radii
The comers of the opening should have minimum radii at least 2 times the thickness of
the web, 2t, or 5/8 in., whichever is greater.
D.33 Concentrated loads
No concentrated loads should be placed above an opening. Unless needed otherwise,
karing stiffeners are not required to prevent web crippling in the vicinity of an opening due to
a concentrated load if
and h e load is placed at least dJ2 from the edge of the opening.
and the load is placed a t least d from the edge of the opening. In any case, the edge of an
opening should not be closer than a distance d to a support.
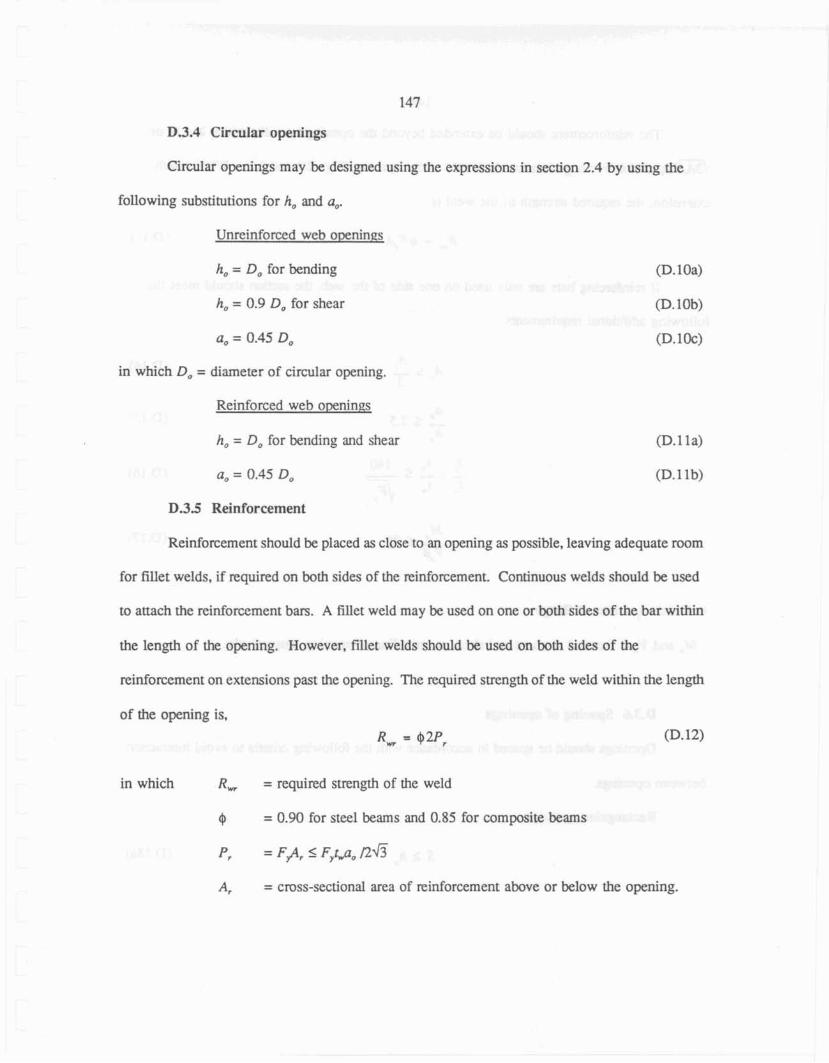
147
D3.4 Circular openings
Circular openings may be designed using the expressions in section 2.4 by using the
following substitutions for h, and a,.
Wnreinforced web openines
h, = Do for bending
h, = 0.9 D, for shear
a, = 0.45 D,
in which D, = diameter of circular opening.
Reinforced web openings
h, = Do for bending and shear
a, = 0.45 Do
D.35 Reinforcement
(D. lOa)
(D. 1 Ob)
(D. 1 Oc)
(Dl la)
(D. 1 1b)
Reinforcement should be placed as close to an opening as possible, leaving adequate room
for fillet welds, if required on both sides of the reinforcement. Continuous welds should lx used
t attach the reinforcement bars, A fillet weld may be used on one or both sides of the bar within
the length of the opening. However, fillet welds should be used on both sides of the
reinforcement on extensions past the opening. The required strength of the weId within the length
sf the opening is,
RW = 42PI
in which Rw = required strength of the weld
4) = 0.90 for steel beams and 0.85 for cornpsire beams
pr = F#,< F,t$. I245
A, = cross-sectiond area of reinforcement above or below the opening.
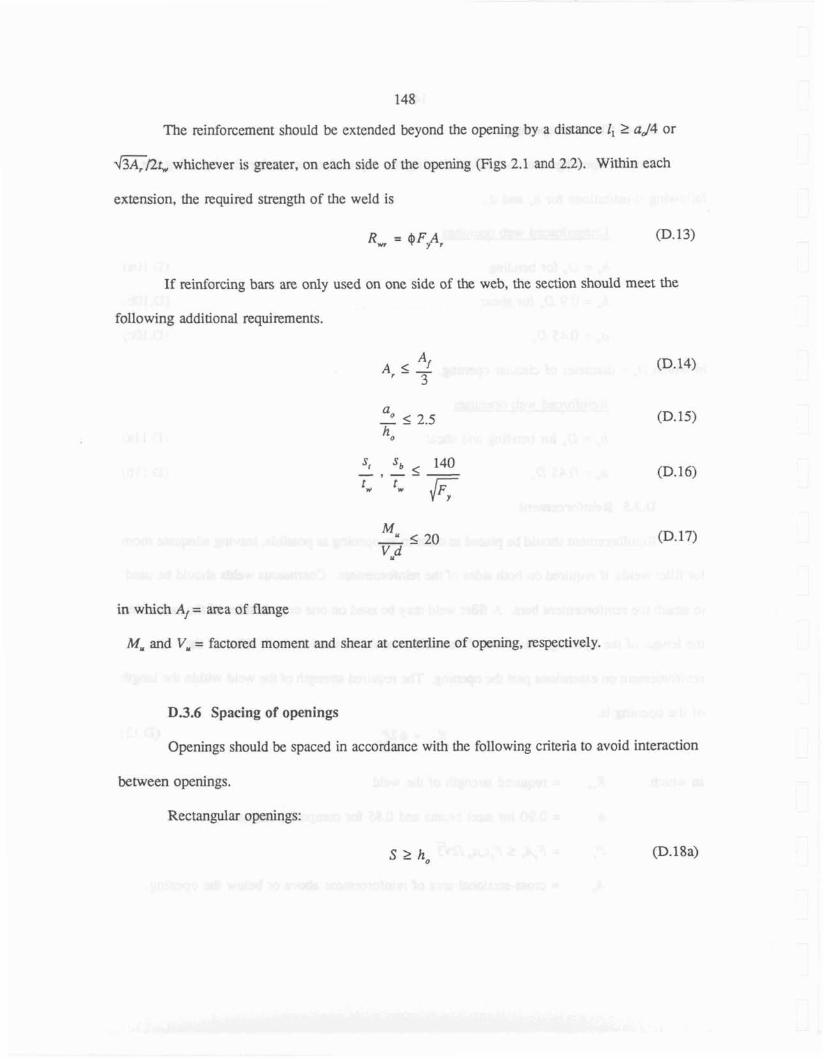
148
The reinforcemmt should be extended beyond the opening by a distance I , 1 aJ4 or
KJZ~, whichever is greater, on each side of the opening (F~gs 2.1 and 2.2). Within each
extension, the required strength of the weld is
Rw = V>Pr
If reinforcing bars are only used on one side of the web, the section should meet the
fouowing additional requirements.
(D. I 6 )
in which Af = area of flange
MM and V, = factored moment and shear at centerline of opening, respectively.
D3.6 Spacing of openings
Openings should be spaced in accordance with the follewing criteria to avoid interaction
between openings.
Rectangular openings:
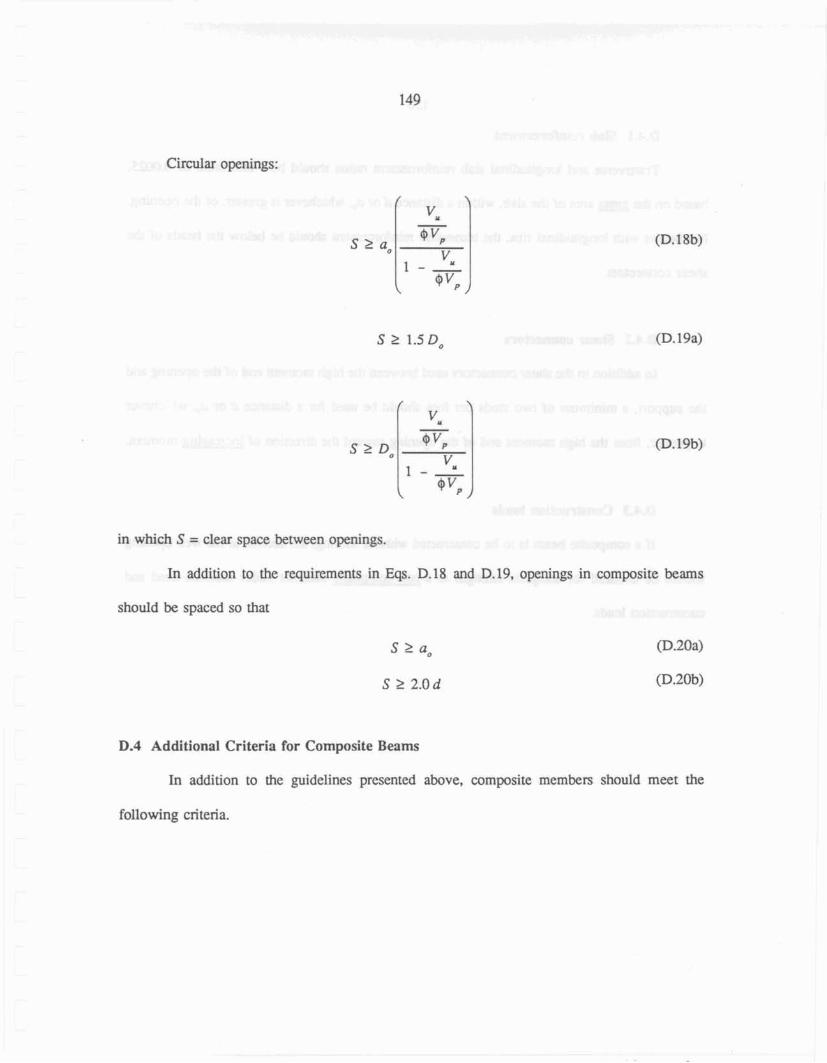
Circular openings:
(D. 18b)
(D. 19a)
in which S = clear space between openings.
In addition to the requirements in Eqs. D.18 and D.19, openings in composite beams
should be spaced so that
S 2 a, @.20a)
S 1 2.0 d (D.20b)
D.4 Additional Criteria for Composite Beams
Tn addition to the guidelines presented above, composite membess shouId meet the
following criteria.
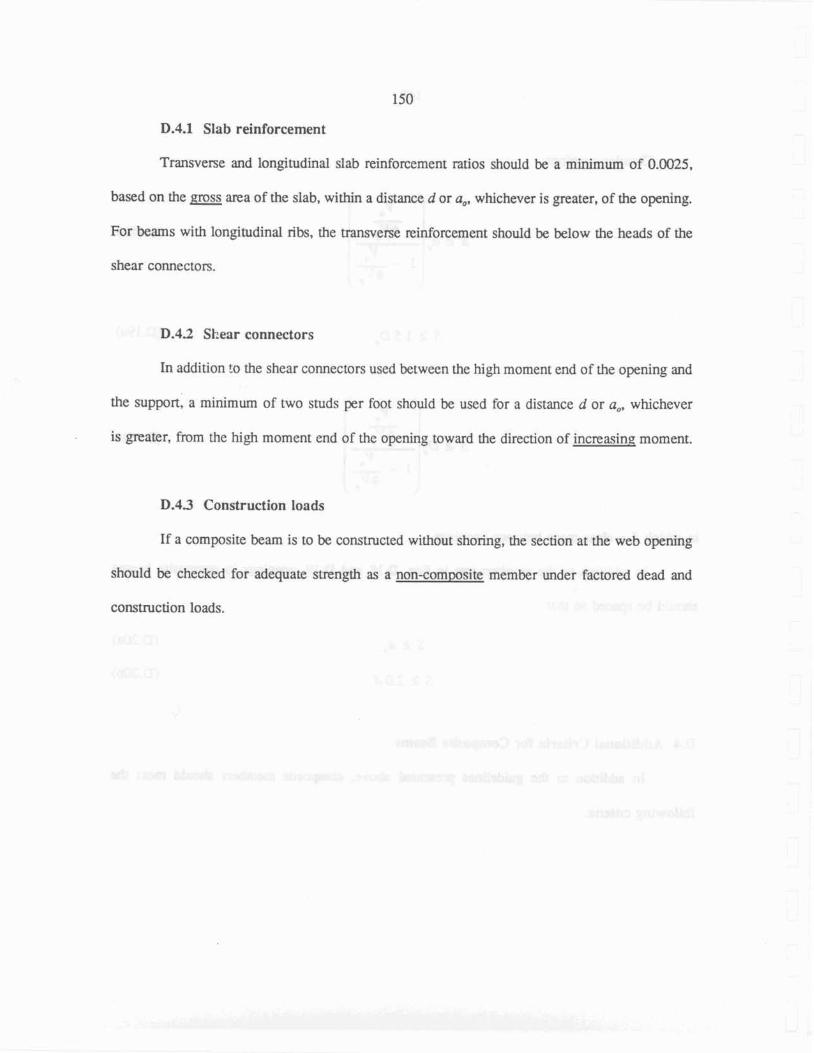
150
D.4.1 Slab reinforcement
Transverse and longitudinal slab reinforcement ratios should k a minimum of 0.0025,
based on the gmss area of the slab, within a distance d or a,, whichever is greater, of the opening.
For beams with longitudinal ribs, the transverse reinforcement should be below the heads of the
shear connectors.
D.4.2 Shear connectors
In addition to the shear connectors used between the high moment end of the opening and
the support, a minimum of two studs per foot should be used for a distance d or a,. whichever
is greater, from the high moment end of the opening toward the direction of increasing moment.
D.43 Construction loads
If a composite beam is to be constructed without shoring, the section ar the web opening
should be checked for adequate strength as a non-composite member under factored dead and
construction loads,

Fig. D.1 Limits on Opening Dimensions aJhe versus hJd (Darwin 1990)
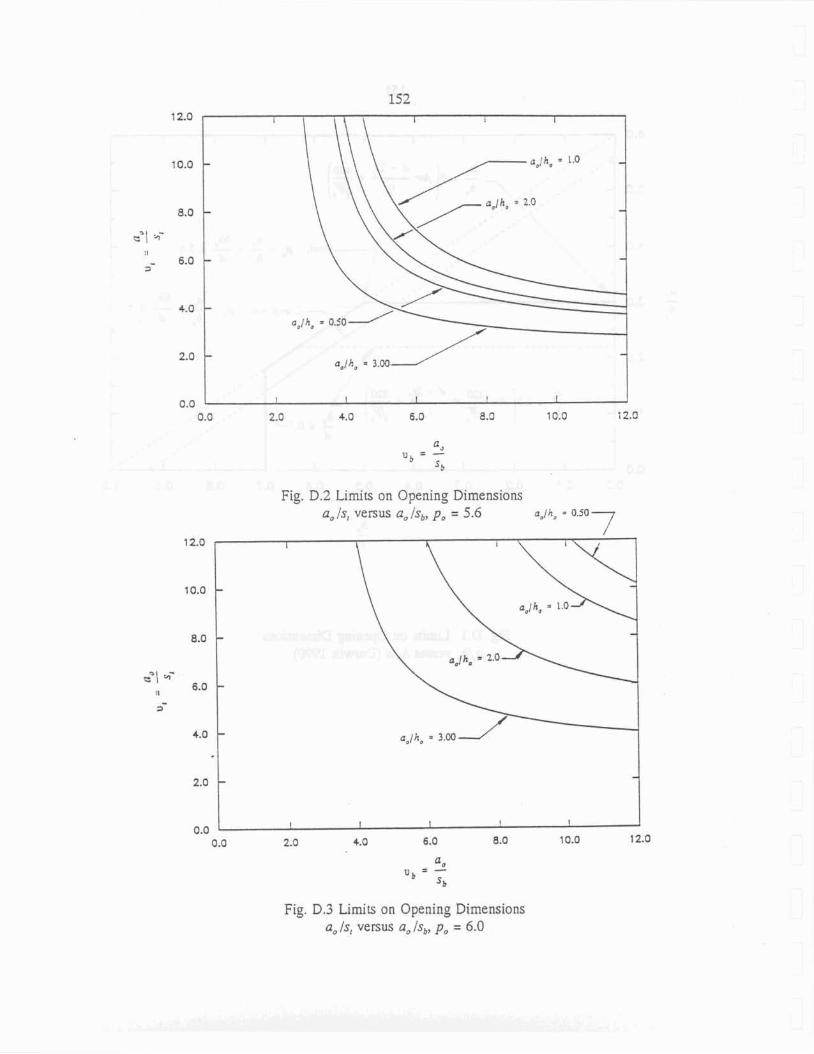
Fig. D.2 Limits on Opening Dimensions a, Is, versus a, Is,, go = 5.6
Fig. D.3 l m i t s on Opening Dimensions a,/s, versus aoIsb, p, = 6.0
APPENDIX E
SUMMARY OF BEAMS NOT MEETING DESIGN LIMITATIONS
A total of thirty-eight steel and composite beams available from previous research were
excIuded from consideration in determining resistance factors kcause of one or more violations
of design limitations presented in Appendix D. Tables containing materid and section properties,
design l imitdon summaries. and capacity summaries and figures showing shear and moment
interaction plots for the excluded beams follow (Tables E.1 - E.6 and Figs. E.0 - E.38).
Most of the excluded beams violated limitations pertaining to local buckling of the
compression flange andlor the web. These violations contributed most significantly to premature
failure of the barns, as illustrated by the results for beams RBD-UG2, RL-3, and RL-4. With the
exception of RL-3. the predicted capacities for h a m s resisting high moment at the opening agreed
reasonably well with test data. The predicted capacities for kams resisting high shear at the
opening generally did not agree very well with test data.
Five beams, RM-ID, RM-2D, RM4D. RM-21 G, and RM4G had closely spaced openings
which, in three cases W - 2 D , RM-2lG, and RM4G), failed as a unit (Redwood and McCutcheon
1968) However, the predicted capacities of all five hams were conservative. Beams RL-1,
RL-2, RL-3, and RL-4 were reinforced on one side of the web and violated associated design
limitations. Beam RL-3 exhibited very premature failure with a testrtheoty ratio of 0.455.
Reasonable strength predictions were obtained for the other four beams.
Sixteen kams tested by Kim (1980). (KKS-series), were excluded from the analysis
although they met all of the design limitations. Without exception, the beams subjected to any
amount of shear were unusually strong when compared to predicted capacities.
154
The predicted capacity of KKS-2HRC was the mast conservative with a test/theory ratio of 2.022.
These conservative results may well be due to strain hardening which is not accounted for by the
prediction methods.
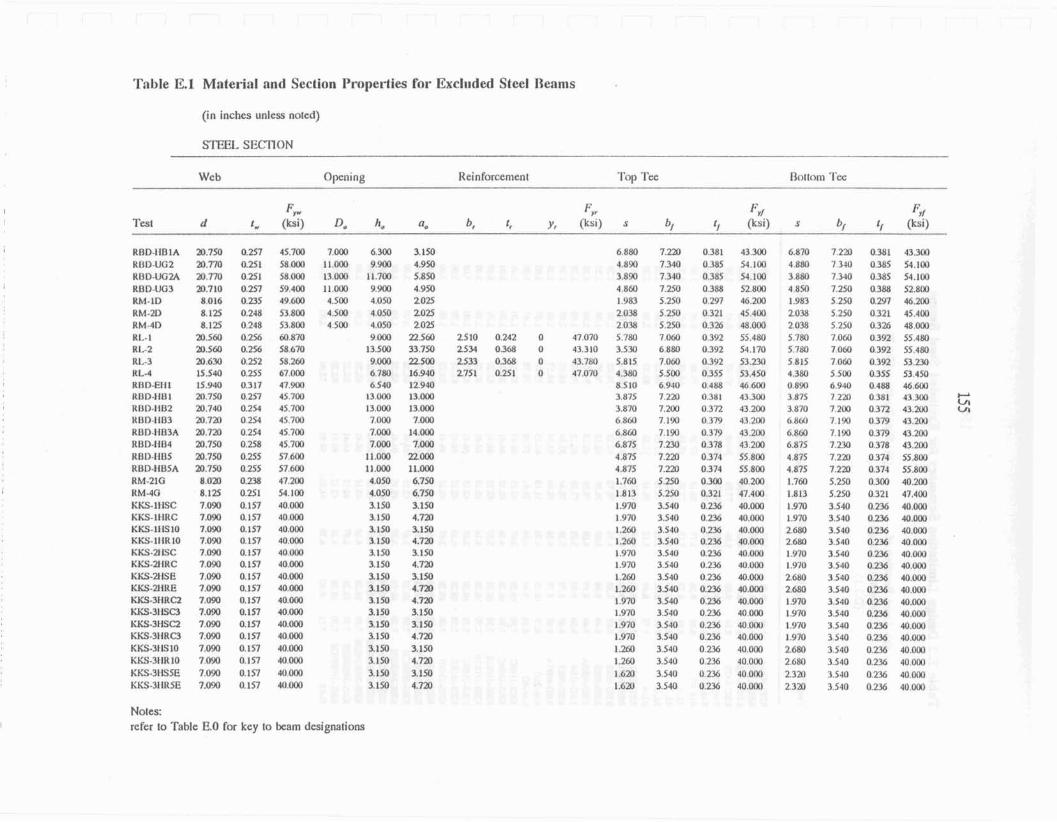
Talde E.1 Material nnd Section Properties for Excl~lded Steel Reams
(in inches unless noted)
STEEL SECTION
Wcb Opening Rein foreenlent Top Tee n n ~ l n m 'I'ex
FP FW FYi Frr Test d f, (hi) 130 he 0, b, I , y, (ksi) s hi #, (ksi) s b, (ksi)
RRD-I1RlA Kttll-UG2 RIIU-UG24 HRD-UG3 RM- ID RM-2D KM-4D Rl--1 RIA-2 R I A RL-4 RI3D-EIII Ilt%ll-HI11 RtIO-11B2 ltt10-llB3 WUD-HR3A Rl3D-11134 HB1)-HRS RRD-I IRSA RM-21G HM-4G KKS-IHSC KKS-II IRC KKS-IIISIO KKS-1IIRIO K W - 2 t ISC KKS-21 IRC KE-2HSE M - 2 H H E KKS.31 lRC2 US-31 ISC3 KKS-3tISQI KB-3tIRC3 KKS-3tlSIO KW-3tllllO KKS-3HSS.E KKS-31 t11SE
Notes: refer lo Table E.0 for key to beam designations
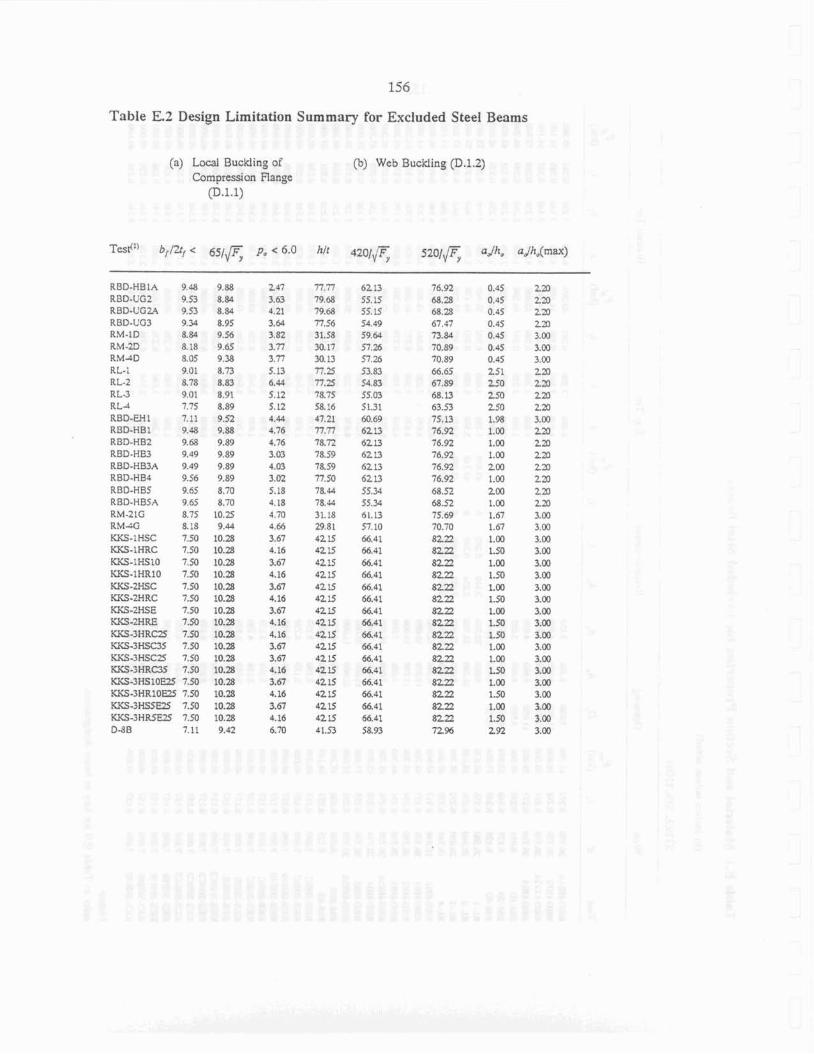
TnbEe E.2 Design Limitation Summary for Exduded SteeI Beams
(a) Local Buckling of Toy Web Buckling (D.1.2) Compression Range
(D.1.1)
p, c 6.0 hlt
RBD-HBIA 9.48 RBD-UG2 9.53 RBD.UG24 953 RED-UG3 934 RM-1D 8.84 RM-ZD 8 18 RM4D 8 05 RL-I 9 01 RL-2 8.78 R L 3 9.01 R L 4 7.75 RBD-W I 7.11 RED-HB1 9.43 RBD-HBZ 9.m RBD-HB3 9.49 RBD-HB3A 9.49 RBD-HB4 9.56 RBD-HBS 9.65 RBD-HBSA 9 65 RM-2lG 8.75 RMAG 8.18 KKS-IHSC 7.50 KKS-LHRC 7.50 KKS-IHS10 750 KKS-lHR10 7.50 KKS-WSC 7.50 KECS-WRC 7.50 KG-2HSE 7.50 K K S - 2 H E 7.M KKS-3HK25 7.50 WS-3HSC3S 7.50 KKS-3HSC25 7.50 KKS-3HRC3S 7.50 KKS.~HSIOEIS 7.50 KG-3iiRlOE2S 7.50 KKS-3AS4U5 7.50 KKS-3IfRSF25 7.50 0-38 7.11
247 77.77 3.63 796B 4.21 79.43 3.U 77.56 3.82 31.58 3 . 7 33.17 3.77 33.13 5.13 77.25 6.44 77.25 5.12 78.75 5.12 58.16 4.44 47.21 4.76 n.n 4.76 78.72 3.03 78.59 4.03 ram 3.02 77.50 5.18 7a44 4 18 78.44 4.70 31.18 4 . 2981 3.67 421s 4.16 42-15 3.67 4215 4.16 4215 3.61 421.5 4.16 4215 3.67 4z15 4.16 4215 4.16 d2I5 3.67 4215 3.67 4215 4.16 4215 3.67 4215 4.16 42s
3.67 4215 4.16 4215 6.70 41.53
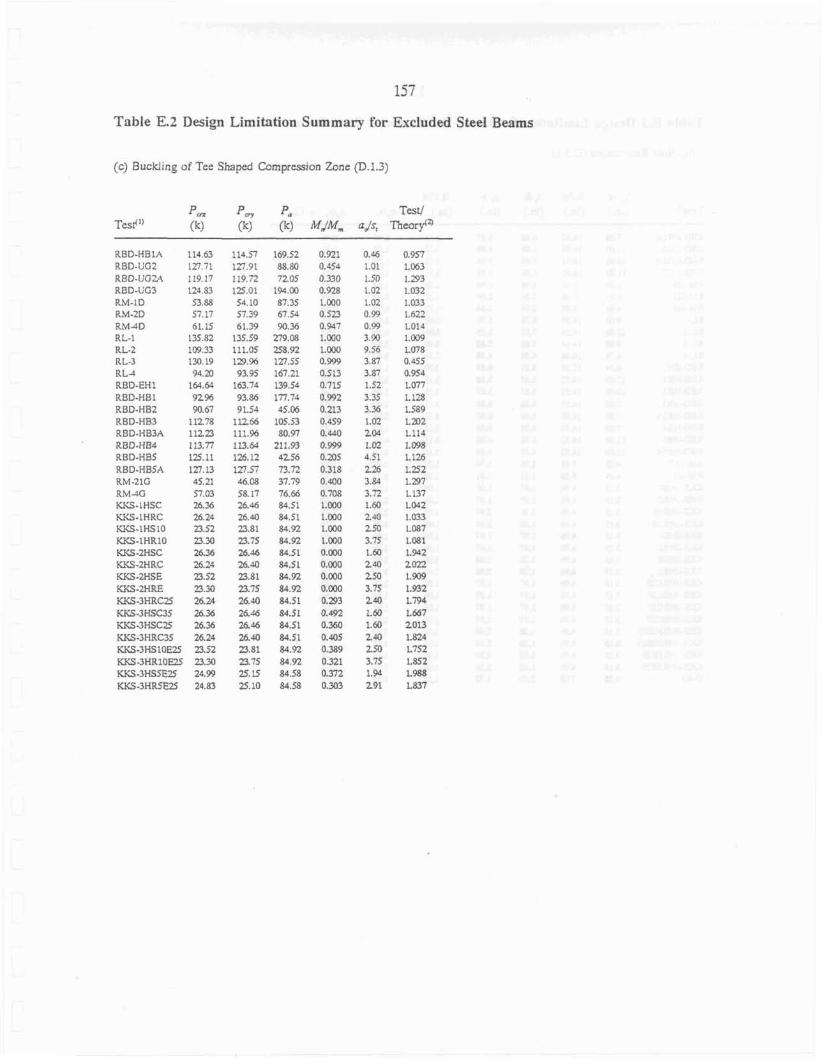
Table E.2 Deign Limitation Surnrnav for Excluded Steel Beams
(c) Buckling of Tee S h a e Compression Zone p.1.;)
p, p, pa Test/ Test") (k) (k) (k] IMJM,,, a& Theor,@
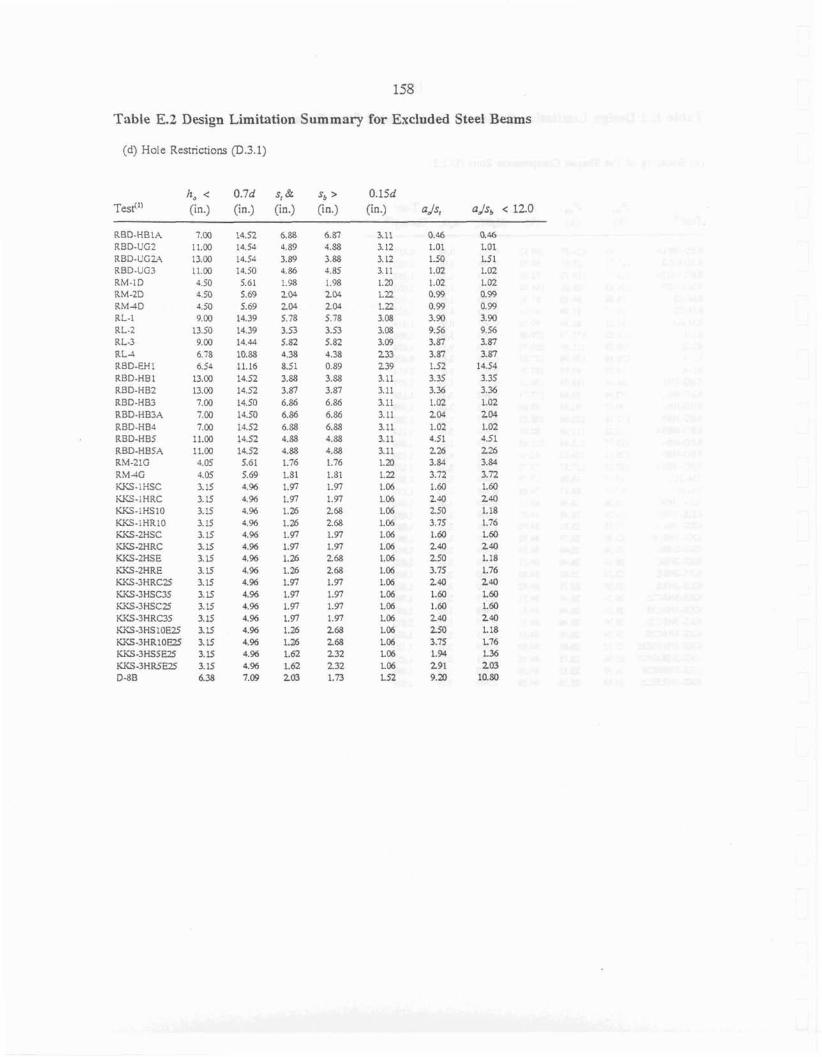
Table E.2 Design Limitation Summary for Excluded Steel Beams
(d) Hole Rcstnctions p.3.1)
h, < O.Td st& s, > 0.15d Tess'" (in.) (in.) (in.) (in.) (in.) aJs, aJsb < 12.0
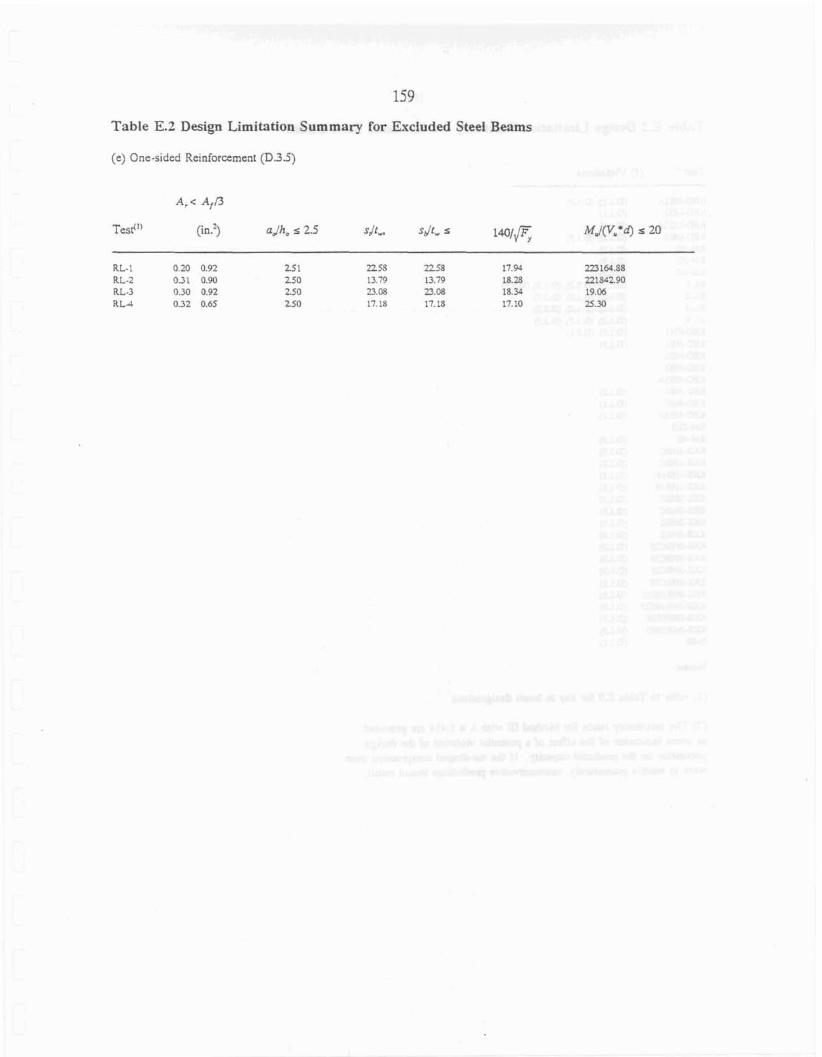
Table E.2 Design Limitation Summary for Excluded Steel Beams
(c) One-sided Reinforcement (D.3.S)
A,< Af.n
Test"' (in.? aJh0 s 2.5 s d L sdt, s 1 ~ 1 f i MuIIVu*4 s 20
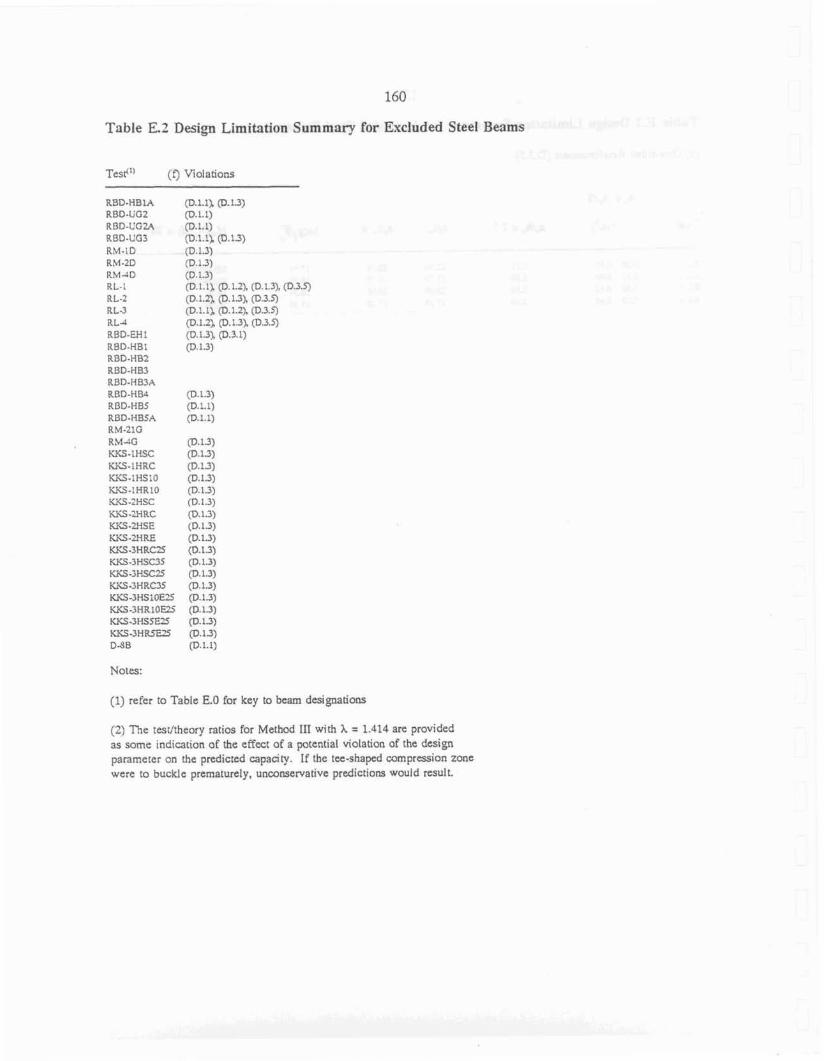
Table E.2 Design Limitation Snrnmaq ror Excluded SteeI Beams
Test'" (f) Violations
Notes:
(1) refer to Table E.0 for key to beam designations
(2) ?he test/thtory ratios for Method III with h = 1.414 are provided as some indication of the effect of a potential violation of the design parameter on the predicted capadry. If the tee-shaped mmpression zone were to buckle prematurely, unconservative prdictiom would result.

Table E.3 Excluded Beam Capacity Summary: Method I, h = 1,414
i'fm v m M,, v,, M" Test"' (in.-k) (k) (in.-k) (k) (in.+k)
RBD-H3IA RBDUGZ RBD-UG2A RBD.UG3 RM-1D RM-2D BM4D RL-I RL-2 RL-3 RLd MD-EHI R B B r n l RBD-IIB2 RBD-H83 RBD-Hn3A RBD-IIB4 RRD-HRS RnD-HBS A RM-21G RMdG KKS-1 HSC KKS-1HRC KKS-1HSIM KKS-IHRIQE K K S - m c KKS-ZKIIC KKSlHSE m - Z H R E KKS-3HRC25 KKS-3NSC35 KKS-3HSW KKS-3HRC35 KKS-3HS 10E25 WCS-3m1 om KKS-3HS5E2S KKS-3HR5E25
Notes:
(1) refer to Table E.0 for key to beam designations
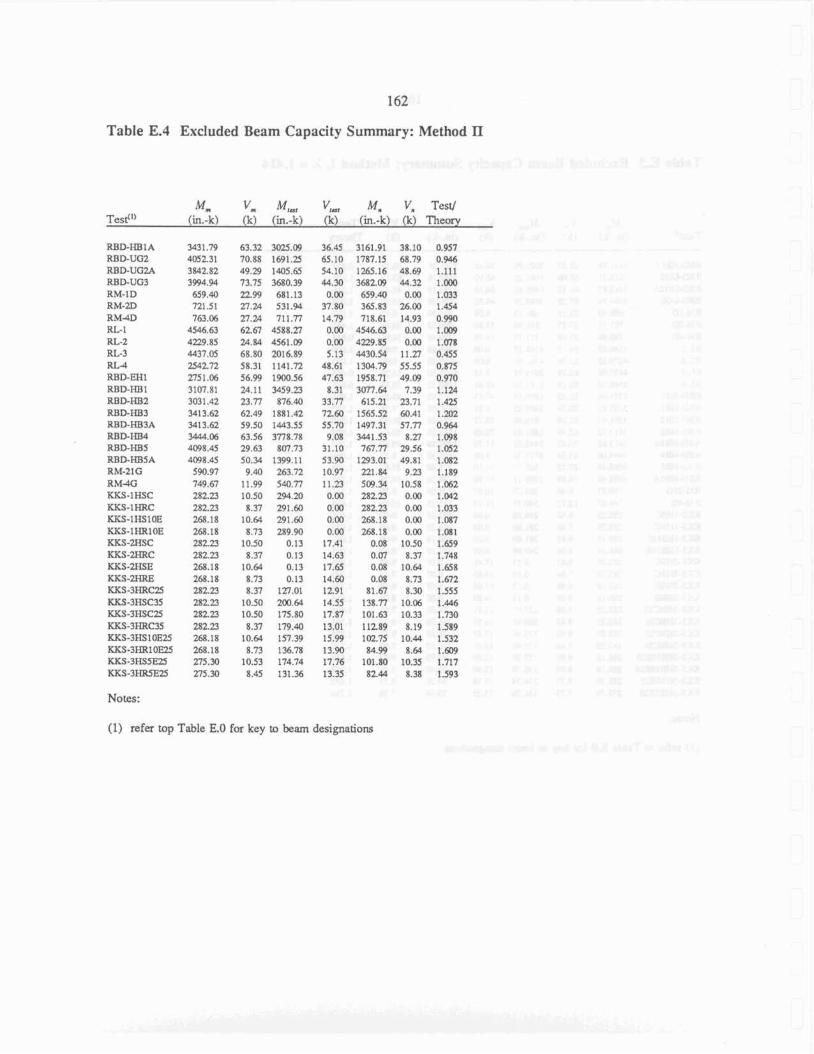
162
Table E.4 Excluded Beam Capacity Summary: Method TI
Test"'
RBD3.HBI A RBD-UGZ RBD-UGZA RBD-UC3 RM-ID RM-2D RMPD RL-1 RL-2 RL-3 RL4 RBD-EHI RBD-HI31 RBD-K8Z RBQHB3 RED-HB3A RBD-HB4 REID-FIBS R B B r n S A RM-2lG RM4G m.1HSc KKS-IHRC KKS-IHSIOE KKS.lHR10E WCS.WSC KKS .2mc KKS-ZIISE KKS-2HRE KKS-3HRC25 KKS-3HSC35 KKS-3IISC25 w s - 3 ~ ~ ~ 3 5 KKS-3HSI W Z KKS-3HR10E25 KKS-3HS5E25 KKS-3HR5E25
Notes:
M, V, Test/ (in.-k) (k) Theory
(1) refer top Table E.0 fa key to beam designations
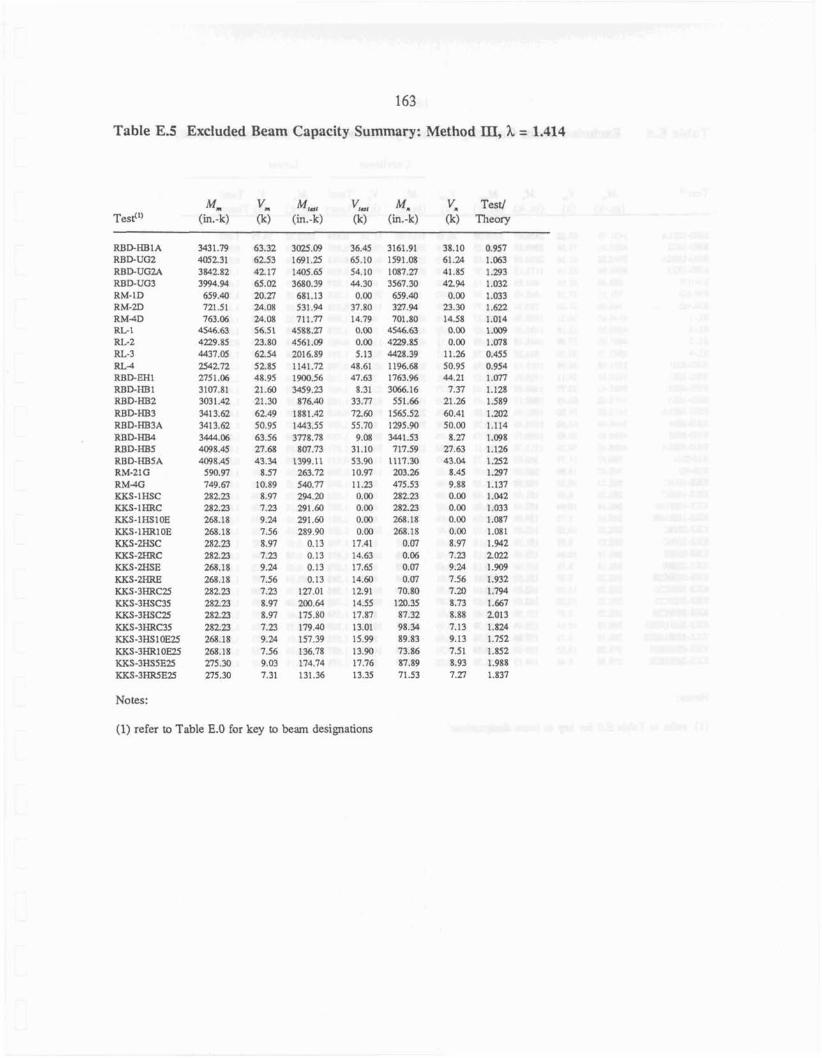
163
Table E.5 Excluded Beam Capacity Summary: Method m, h = 1.414
M, Vm M,.,, vw, Mn Test"' (in.-k) (k) (in.-k) (k) (in.-k)
Notes:
(1) refer to Table E.0 for key to beam designations
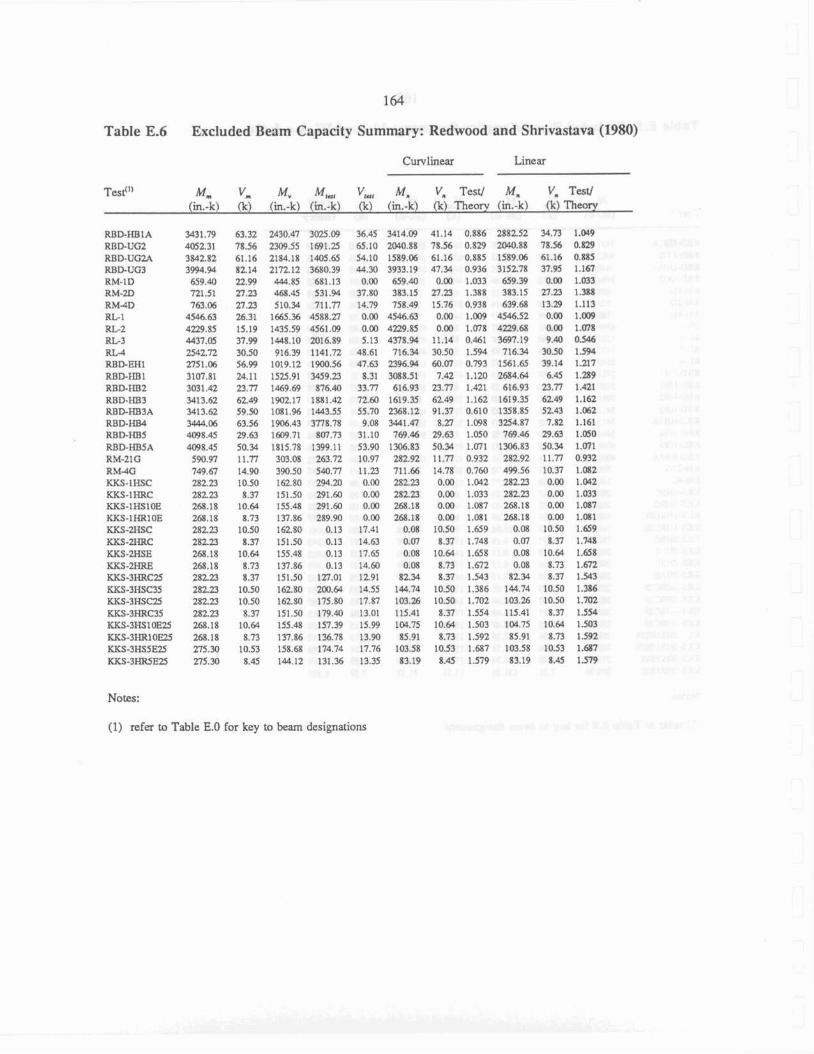
Table E.6 Excluded Beam Capacity Summary: Redwood and Shrivastava (1980)
Curvlinear Linear
Test(" M, V, Mv M , V , M, V, Test/ M, V, Test/ (in.4) (k) . k (W (in.-k) (k) Theory (in.-k) (k) Theory
Nates:
(1) refer to Table E.0 for key to beam designations

Cubic Moment-Shear Interaction Using Method 111
------------ Curvlinear Moment-Shear Interaction Using Redwood & Shrivasatava (1980), Redwood & Poumbouras (1984), and Redwood & Cho (1986)
Actual Moment-Shtas Value for Beam
Fig. E.0 Legend for Moment-Shear Interaction Curves in Figs. E.1 - E.38

0 10 20 30 40 50 60 70 Shear. kips
.i soe I n E
L
E 2 ZOO
0 10 20 30 Shear, kips
Fig. E. 1 lntemction Curves for Test RBO-HB1A Fig. E 5 Intaraction Curves far Test RM-1 D
0 10 20 3Q 40 50 60 70 80 9Q Shear, kips
Fig. E 2 Interaction Curves for Test RBD-UG2 5000
0 10 20 30 40 Sheor. kips
Fg. 6 Interaction Curves for Test RM-20 800
0 0 0 10 20 30 4U 50 60 70 0 10 20 30 40
Shear, kips Shear. kips
Fig. E; 3 InternetIan Curves for Test RB5-UG2A Fig. E 7 Interaction Curves for Test RM-40
5000 5000 (
O 10 20 30 40 50 60 70 80 90 0 10 20 30 40 50 60 70 Shear. kips Shsar, kips
f i g . E. 4 Interaction Curves for Test RED-UG3 Fig. E. 8 Interaction G u m s for Test RL-1
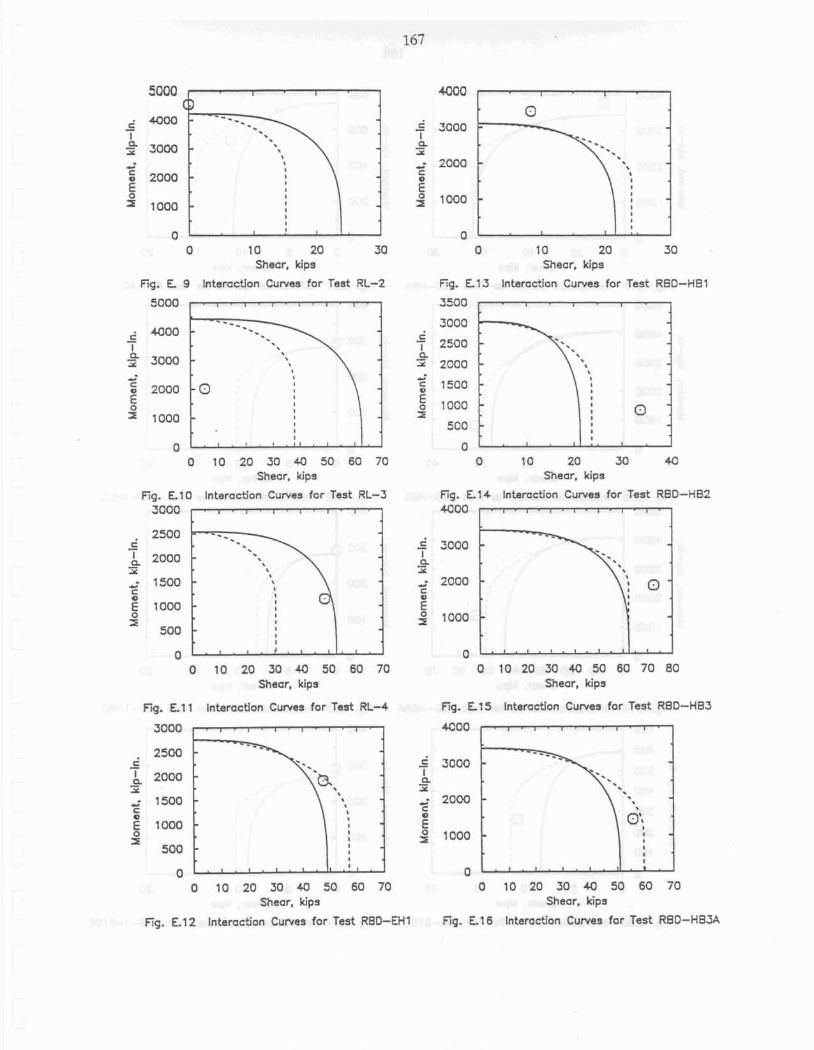
0 0 0 1 C) 20 30 0 10 20 30
Shear, kips Shear, kips
Kg. E l 9 Intenetion Cum- for Test RL-2 Fig. El3 Interaction Curves for Test RED-HB1
5000 3500
0 10 20 30 40 50 60 70 Shear, kips
Fig. El Q Interaction Curves for Test Rt-3 3000
0 0 10 20 30 40 50 60 70
Shear, kips
Fig. Et 1 lnteraetion Curves for Test R L 4
0 70 20 30 40 Shear, kips
Fig . El4 Interaction Cumes for Test RBD-HB2 4400
0 0 10 20 30 40 50 60 70 80
Shear, kips
Fig. Ett 5 Interaction Curves for Test RBD-HBJ
a00
0 10 20 30 40 50 60 70 0 10 20 30 40 50 60 70 Shear, kips Shear, kips
Fig. €.I2 Interaction Curves for Test RED-EH1 Sig. Et 6 Internetion Curves tot Test RED-H83A
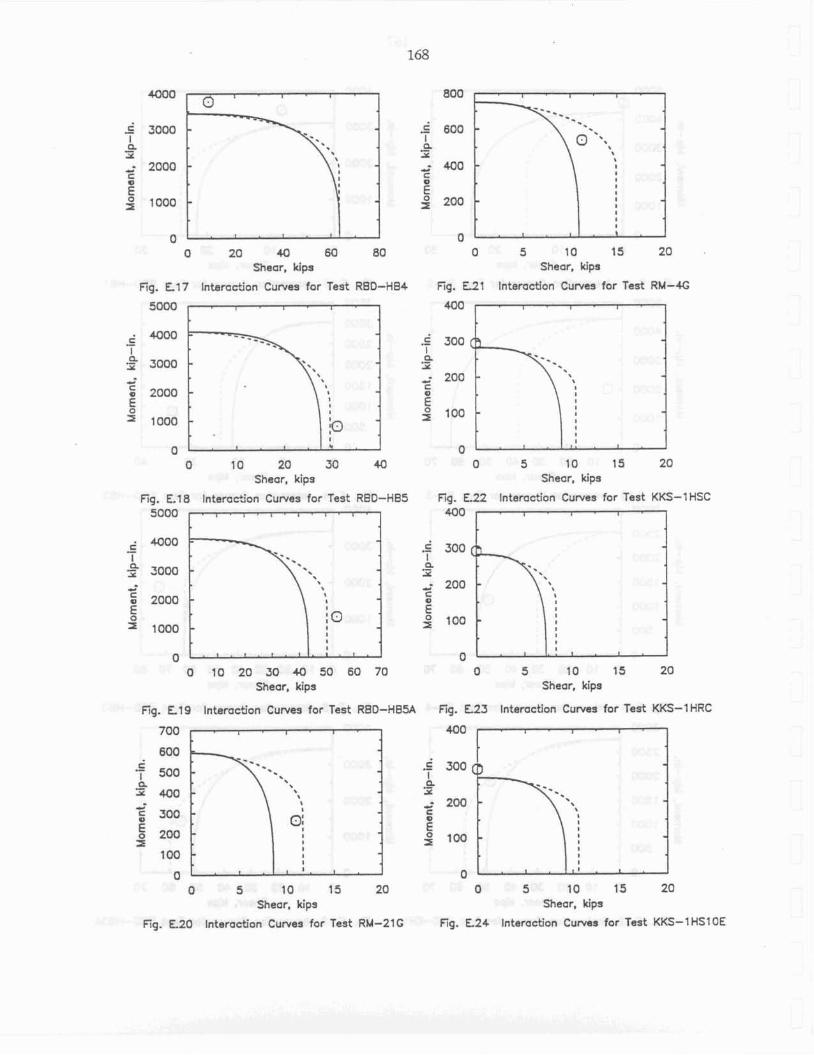
a 20 413 60 80 Shear, kips
Q 5 10 15 20 Shear, kips
Fig. El7 Intemction Cumes for Test RRD-HB4 Fig. E.21 Internetion Cuwes for Test RM-4G
0 10 20 30 40 0 5 10 15 20 Shear, kips Shear. kips
Fig. E.18 Intemction Curves for Test RED-HB5 Fig. €22 Interaction Curves for Test KKS-1 HSC 5000 400
0 10 20 30 40 50 60 70 Shear, kips
0 5 f 0 3 5 20 Shear. kips
Fig. El9 Interaction Curves far Test RBD-HB5A Eg. E.23 Intemction Curves for Test KKS-1 HRC
0 5 10 15 20 0 5 1 Q 15 20 Shear, kips Shear, kips
Fig. E20 Interndon Curves for Test RM-2lG Fig. E24 Interaction Curves for Test KKS-1 HSf OE
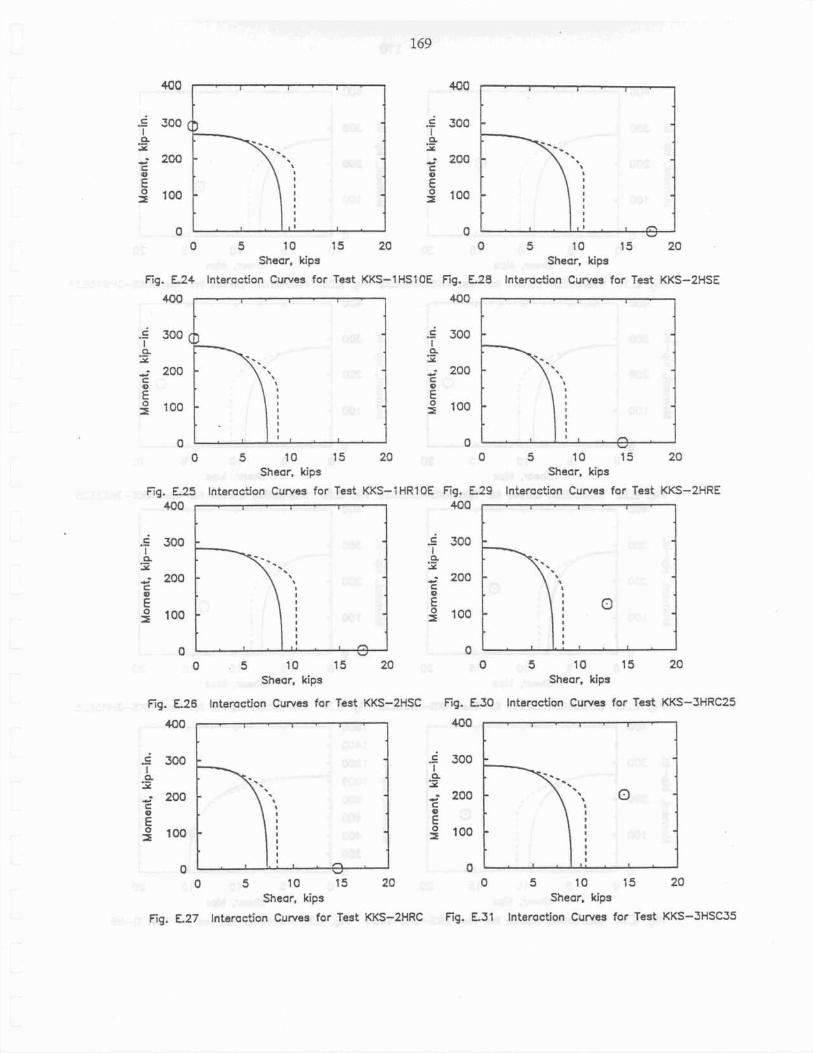
0 0 V
o 5 to 15 20 a 5 t o 15 20 Shear, kips Shear, kips
f ig. U 4 Interaction Curves far Test KKS-1HSf OE Fig. E.28 lntem&on Curves far Test KKS-2HSE
4# 400
.g 300 c .g 300 I I a 11 E 2
; 200 ; 200 C C 0 0
100 100
0 0 0 5 10 15 20 0 5 10 15 20
Shear, kips Shear, kips
Fq. E-25 Interaction Curves for Test KKS-IHRIOE f ig . E29 Interaction Curves fur Test KKS-2HRE 400 4-00
0 - 5 10 15 20 Shear, kips
0 5 10 15 20 Shear, kips
f ig . E.26 tntemction Cunres for Teat KKS-2HSC Fig. E30 Interndon Curves far Test KKS-3HRC25
400 400
; 200 C
E .$ roo
0 0 0 5 10 15 20 0 5 to 15 20
Shear, kips Shear, kips
Fig. E27 Interaction Curves for Jest KKS-2HRC Kg. E51 Interaction Cuwes for Test KKS-3HSW5
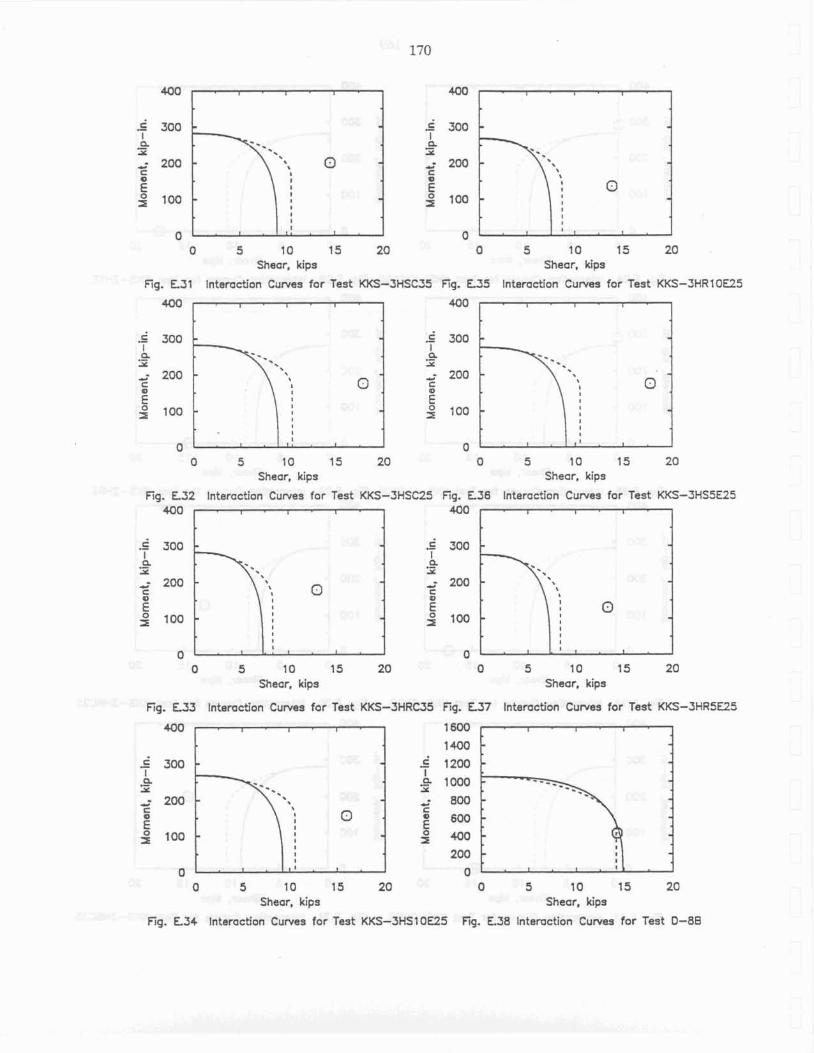
0 0 0 5 10 15 20 0 5 10 I5 20
Shear, kips Shear. kips
Fig. U1 In teradon C u m s far Test KKS-3HSUS Fig. U 5 Interaction Cumas far Test KKS-3HRIDE25
0 0 o 5 10 15 20 o 5 10 15 20
Shear, kips Shear, kips
Fig. E.32 Interaction Curves far Test KK5-3HSC25 Fig. E36 lntamction Curves for Test KKS-3HS5E25 400 400
0 5 10 15 20 Shear, kips
0 5 10 15 20 Shear. kips
Fig. E.33 Interaction Curves for Test KKS-3HRC35 Fig. €37 lntamction Curves far Test KKS-3HR5U5
4QO 1600
1400
$ 300 1200 I E a E 3 1000
Y
0 5 10 15 20 0 5 10 15 20 Shear, kips Shear, kips
Fig. L34 lntemction Curves for Test KG-3HSlOE25 Kg. E.38 lntemction Curves for Test 0-88
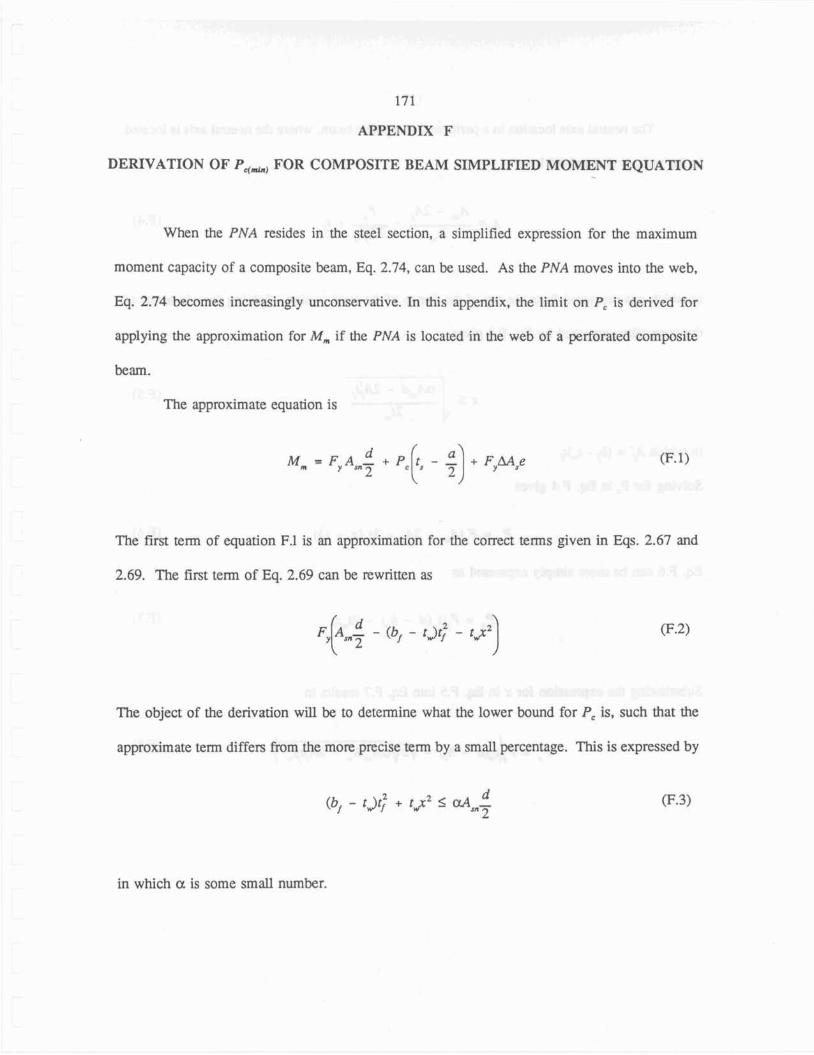
171
APPENDIX F
DERIVATION OF P,,, FOR COMPOSITE BEAM SIMPLIFIED MOMENT EQUATION
When the PNA resides in the steel section, a simplified expression for the maximum
moment capacity of a composite beam, Eq. 2.44, can be used. As the PNA moves into the web,
Eq. 2.74 becomes increasingly unconservarive. In this appendix, the Iirnit on PC is derived for
applying the approximation for M, if the PNA is located in the web of a perforated composite
beam.
The approximate equation is
The first tern of equation F.1 is an approximation for the correct terns given in Eqs. 2.67 and
2.69. The first term of Eq. 2.69 can be rewritten as
The object of the derivation witl tx tto determine whar the lower bound for PC is, such that the
approximate term differs h r n the more precise term by a small percentage. This is expressed by
in which a is some small number.
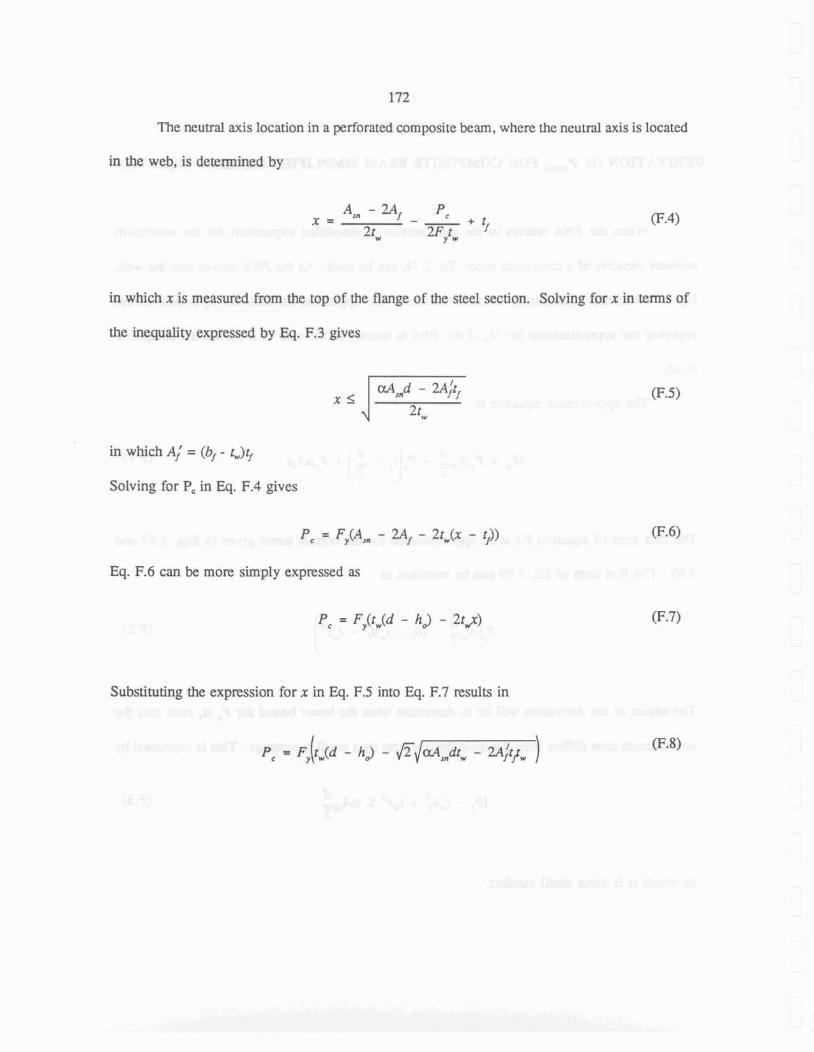
172
The neutral axis location in a perforated composite beam, where the neutral axis is located
in the web, is determined by
in which x is measured from the top of the ff ange of the steel section. Solving for x in terms of
the inequality expressed by Eq. F.3 gives
in which A,' = (bf - L)$
Solving for PC in Eq. F.4 gives
PC = Fy(AJn - 2AI - 2tW(x - 5))
Eq. F.6 can be more simply expressed as
Substituting the expression for x in Eq. F.5 into Eq, F.7 results in
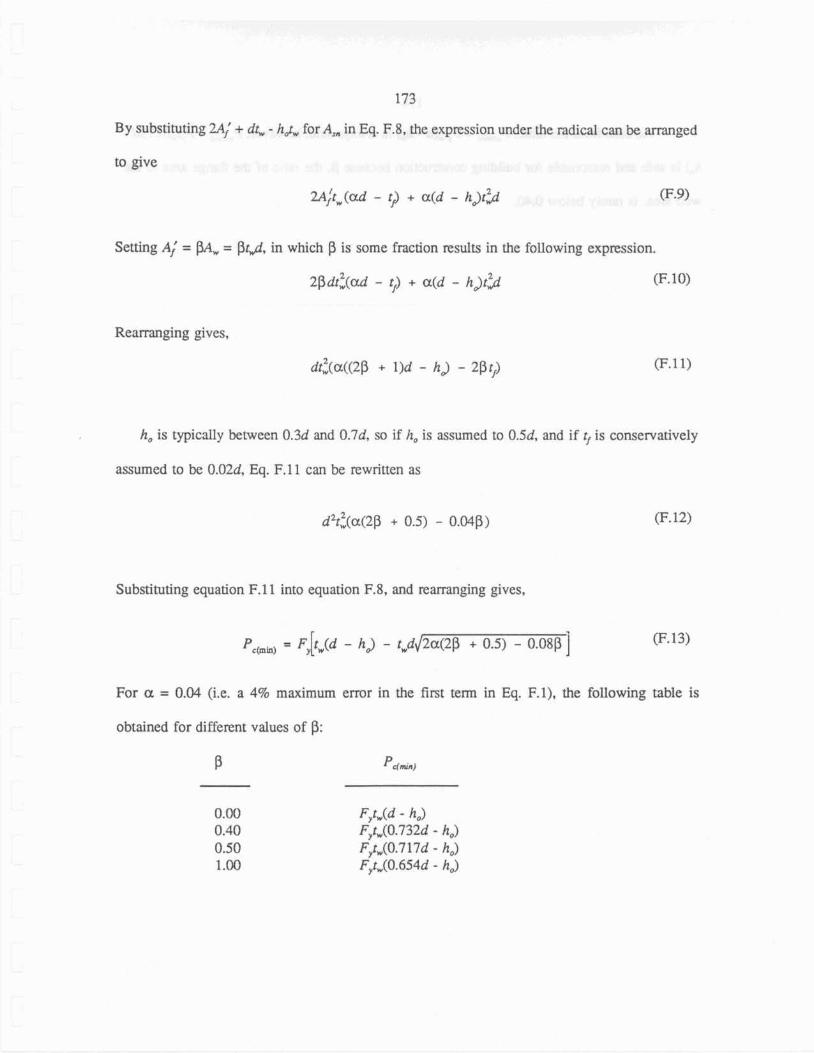
173
By substituting 2Af' + dt, - hotw for A,, in Eq. F.8, xhe expression under the radical can be arranged
to give
2~; ; (ad - 9 + a(d - h>r&' F.9)
Setting Af' = PA, = PtJ* in which P is some fraction results in the following expression.
2pdt:(ad - 5) + ta(d - h ~ t 3 (F. 10)
Rearranging gives,
d t : (u ( (2~ + 1)d - hJ - 2P ti) (F. 1 1)
h, is typicalIy between 0.3d and 0.7d, so if h, is assumed to 0.5d, and if + is conservatively
assumed to be O.Md, Eq. F.11 can be rewritten as
Substituting equation F.11 into equation F.8, and rearranging gives,
For a = 0.04 (i,e. a 4% maximum error in the first term in Eq, F.1), the following table is
obtained for different values of P:
F,t,(d - h,3 F,tw(Q.732d - h,) Fytw(0.717d - h,) F,tW(0.654d - h,)
174
As seen from the table, P,,, = F,t,(d - hJ is always safe, however, P , c ~ n , = F,tw(0.75d -
h2 is safe and reasonable for building constnrction because p, the ratio of the flange area to the
web area, is rarely below 0.40.
175
APPENDIX G
STEEL AND COMPOSITE BEAM RESULTS FOR METHODS I AND III
WITH h = 1.207
This appendix contains nine tables summarizing shear capacities and analysis results for
steel and composite kams obtained using Methods I and I11 with h = 1.207. These results were
used to calculate the resistance factors corresponding to h = 1.207,

Table G.1 Steel Beam Shear Capacity Summary: Method I, h = 1.207
(values in kips)
Test vdt ve V ~ I YM, vu vm VI
RBD-CI RM-1A RMlB R M - 2 . RM-ZB R M d C RM-3A RM-4A R M 4 B RM4C CR-IA CR-24 CR-2B CR-211 CR-21) CR-3 A CR+3B C R 4 A CR4B CR-5A CR-7B CR-nJ CSK.2 CSK-5 CSK-6 CSK-7 CS-1 CS-2 CS-3 RL5 R M B-l B.2 B-3 I34 CL.48 CB-6A CSK-1 D a l W-2 DO-3 W - 4 W-5 RBD-RIB RBD-R2 RM-I 1H RM-21H RM-2F RM4F R M 4 H
refer to Table 3.0 for key to bean designations V,,. V,,, = shear capaciq of bottom and top tee, respectively, using Eq. B.1 . v& v~ = plastic shear capacity of bottom and top tee, respectively, using Eqs. 2.22, and 2.18. V,,, V,, = governing shear capacity of top and bottom tees. respectively.
v, = maximum permissible shear capacity of beam per Section D.1.2.

Table G.2 Composite Beam Shear Capacity Summary: Method I, h = 1.207
(values in kips)
Test
D-1 D-2 D-3 D-5A D-SB D 6 A D 6 B D 7 A D 7 B D 8 A IT9A D-9B R 4 R-l R-2 R-3 R d R-5 Ba R-7 R.8 C-1 C-2 C-3 C-4 C-5 Cd G.1 G-2 CHO-3 am4 CHO-S CHO-6 CHQ-7 WTE- 1
Notes:
refer to Table 3.0 for key to beam designations
shear capacity of top tee using Eq. B .I. shear capacity of tap tee using Eq. 233. plastic shear capacity of top tee using Eq. 2.18 combined plastic shear capaciv of top tee and concrete using Eq. 221. governing shear capacity of top tee. shes capacity of bomm tee using Eq. B.1. plastic shear capaciry of bottom tee using Eq. 2.22. governing shear capacity of bottom tee.
maximum sheat capacity as predicted by Method I.Notes:
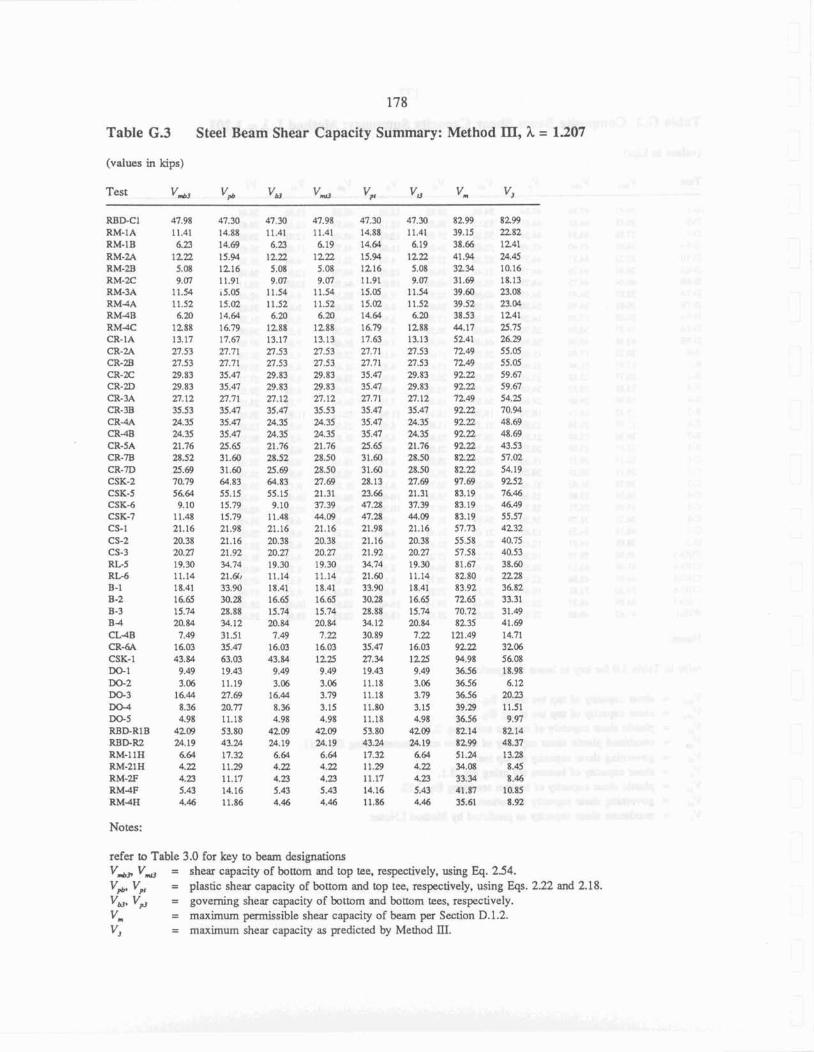
Table G.3 Steel Beam Shear Capacity Summary: Method III, h = 1307
(values in kips)
Test YW V e Vw vgr VU V. v~
RBD-CI RM-IA RM-IB RM-2A RM-28 RM-2C RM-3A RM4A RM-lB R.U4C CR-1A CR-24 CR-2l3 CR-ZC CR-2D CR-3A CR-3B CR-4A CR48 CR-SA a - 7 B CR-7D CSK-2 CSK-5 CSK-6 CSK-7 CS- 1 CS-2 CS-3 Rt-5 RL-6 B-1 8-2 B-3 B 4 CLdB -4.4 CSK-I DO-1 Im-2 DO-3 DO-4 M 1 5 RBIlRlB RBD.R.2 RM-IIH RM-21 H RM-2F R M 4 F R M 4 H
Notes:
refer to TabIe 3.0 for key to beam designations V,, V, = shear capadty of bomm and top tee, respecrively, using Eq. 2.54.
V,, V, = plastic shear capacity of bottom and top tee, respectively, wing Eqs. 2.22 and 218.
V V = governing sheat capacity of bettom and bottom tees, respectively.
vm = maximum permissible she= capacity of beam per Section D.1.2. v~ = maximum shear capacity as predicted by Method III.
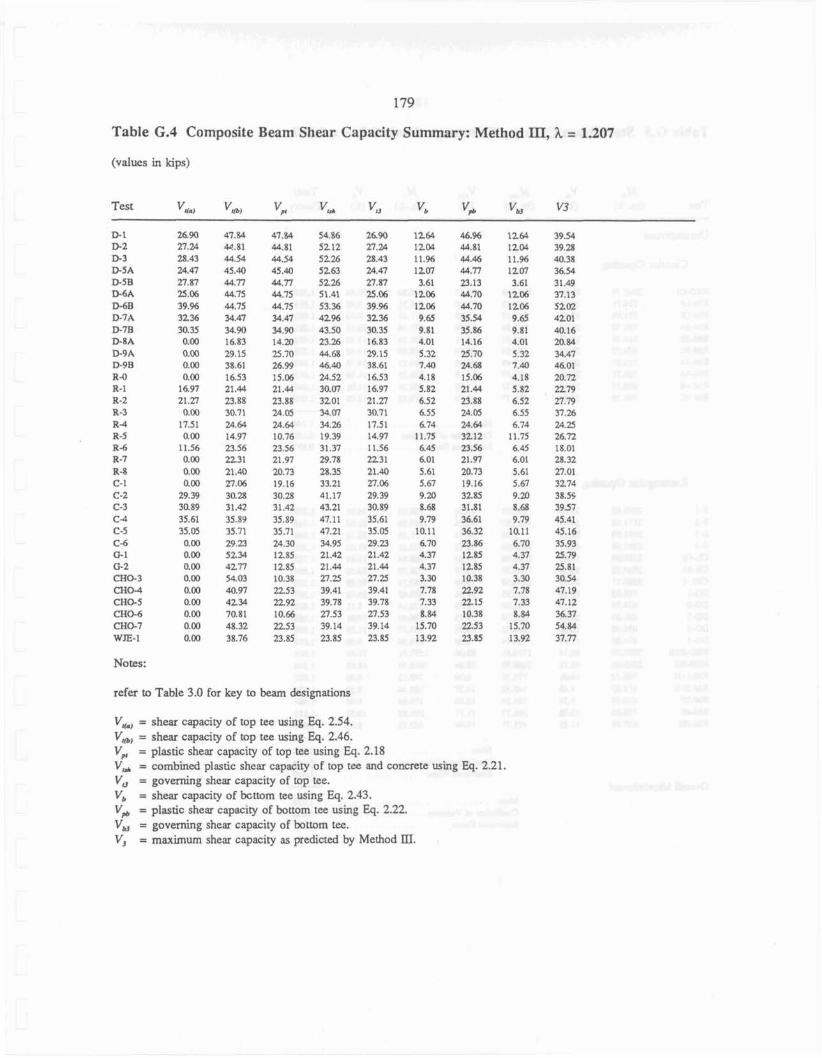
Table 6.4 Composite Beam Shear Capacity Summary: Method El, h = 1.207
Test
D-1 D-2 I13 D-SA D.5B D-6A D a R D A D-78 D 8 A D-9.4 D 9 B R-0 R-1 R-2 R-3 R 4 R-5 R 4 R-7 R-8 C.1 C-2 C-3 C-4 C-5 C b G.1 G 2 CH0.3 ma4 CH05 CHo.6 CHG7 W E - I
Notes:
refer to Table 3.0 for key to beam designations
Yw = shear capaciry of top tee using Eq. 2.54. Ifrlb, = shear capacity of top tee using Eq. 2.46. Vp, = plastic shear capacity of top tce using Eq. 2.18 V, = combined plastic shear capacity of top tee and concrete wing F.q. 2.21. V, = governing shear capacity of top tee. Vb = shear capaciry of kmm tee using Eq. 2.43. V* = plastic shear capacity of bottom tee using Eq. 2.22. V, = governing shear capacity of bottom tee. V3 = maximum shear capacity as predictad by Method Dl.
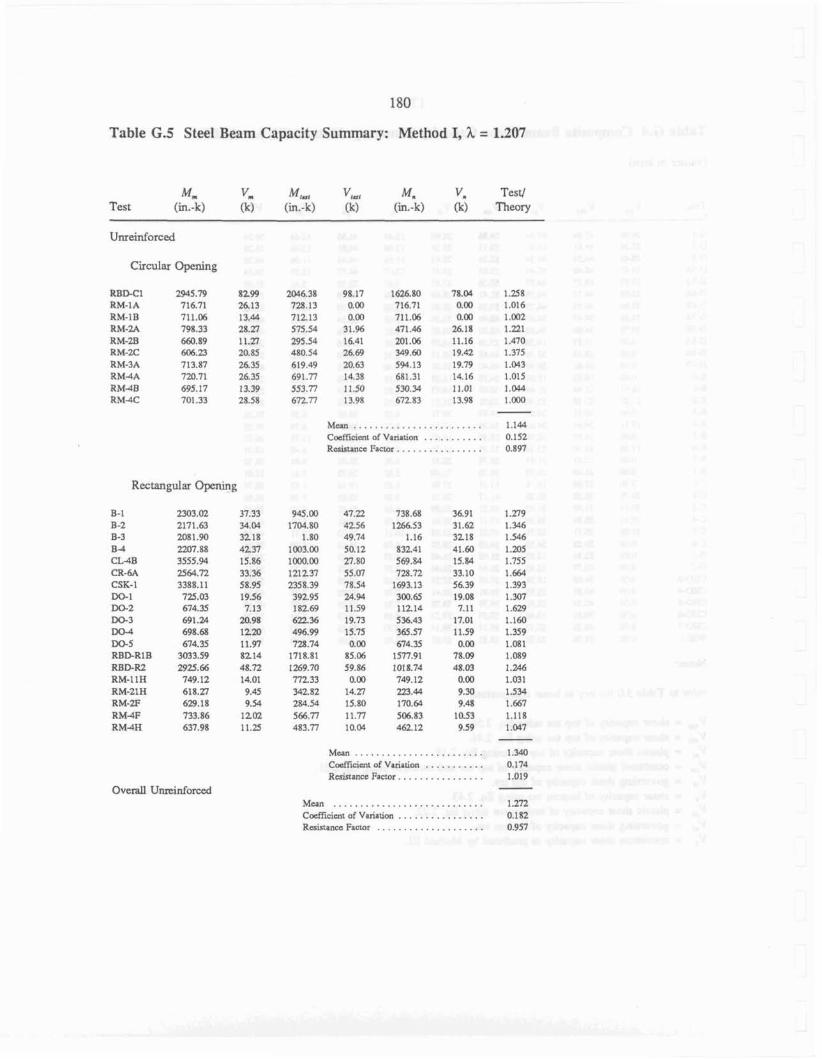
180
Table G.5 Steel Beam Capacity Summary: Method I, h = 1.207
4 Vm MI, vw, M. V, Test/ Test (in .-k) (k) - 1 oil (in.-k) (k) Theory
Circular Opmng
Mean . . . . . . . . . . . . . . . . . . . . . . . . 1.144 ........... Coefficient of Variptim 0.1 52
............... Rcsjstancc Factor. 0.897
Rectangular Opening
B-E B -2 B-3 B 4 C M B CR-6A CSK-1 m1 DO-2 m3 DO-4 m s RBD-RIB RBD-R2 RM-1 I H RM-21H I1M.P RM4F RM4H
Overall Uminforoed
945.00 47.22 738.68 36.91 1.n9 1704.80 4256 126653 31.62 1.346
1.80 49.74 1.16 3218 1.546 1.003.00 50.12 832.41 41.60 1.205 1000.M) 27.80 569.84 15.84 1.755 121237 55.07 728.72 33.10 1.664 2358.39 78.54 1693.13 5639 1.393 39295 24.94 300.65 19.08 1 . m 182.69 11.59 11214 3.11 1.629 622.M 19.73 536.43 17.01 1.160 496.99 IS.% 365.51 11.59 1.359 728.74 QM1 674.35 0.W 1.Ml
171 8.81 85.06 I 577.91 78.m 1.089 1269.70 59.86 1018.74 48.03 1 .246 77x33 0.00 749.12 am 1.031 342.82 14.27 Zp.44 9.30 1.534 284.54 15.80 170.64 9-48 1.667 566.n 11.n 506.83 10.53 1.118 4 8 3 . 7 10M 462. I2 9.59 1.047
. . . . . . . . . . . . . . . . . . . . . . . . M a n 1.340 Coeffitimt d Variation ........... 0.174 R d a n c e Factor. ............... 1.019 -
Mean ............................ 1.272 C d i e n t of Vanation ................ 0.187 Resiaartcc Factor .................... 0.957
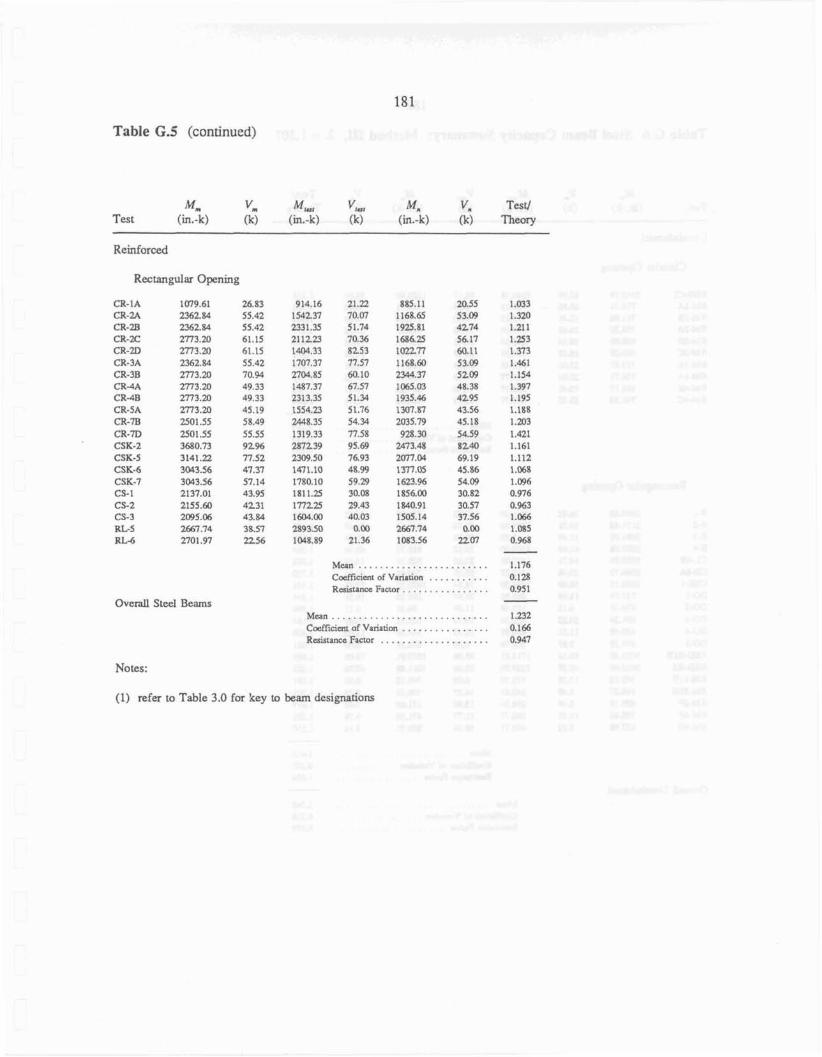
Table G S (continued)
Mm vm M,, VW, Mm V, Test/ Test (in.-k) ( k i d (k) (in.-k) Theory
Rectangular Opening
CR-IA CR-2.4 CRZB CR-2C CR-2D CR-3A CR-3B CR-4.4 CRdR CR-5A CR-7B CR-7D CSK-Z CSK-5 CSK-6 CSK.7 CS.1 CS-2 CS.3 R L S R L 6
Overall Steel Beams
Notes:
Mcan . . . . . . . . . . . . . . . . . . . . . . . . 1.176 Cocfficimt of Vanaum . . . . . . . . . . . 0.123 Resistance Fanor. . . . . . . . . . . . . . . 0.951
............................. Mean 1.232 Coeffcim of Variation ................ 0.1 66 Resistance Factor .................... 0.947
(1) refer to Table 3.0 for key to beam designations
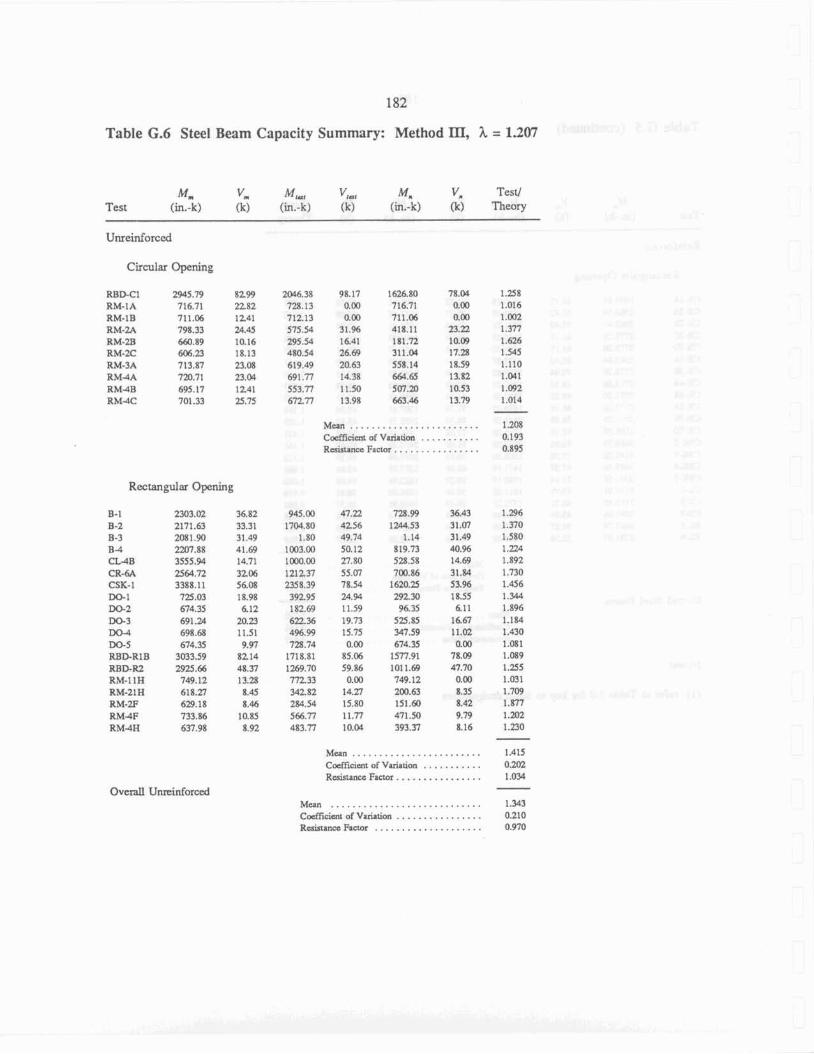
I82
Table G.6 Steel Bean Capacity Sumrnau: Method m, h = 1.207
h vm M , v , ~ t MM V, Test/ Tesr (in.-k) (Id (in.-k) @I (in.-k) (k) Theory
Cirnrlar Opening
Kectangdar Opening
B.1 B-2 B-3 B 4 cLag CR-6.4 CSK-I DO-t W 2 W 3 DO-4 DO-5 RBD-RIB RBD-R2 BM-I lf3 RM-21 H R M-2F R M 4 F RM4H
Mean .............. Cafficitnr of Variatim . Resistance Factor
Mean ........................ Codficicm of Varianon ........... Rcsistanec Factor ................

Table G.6 (continued)
Mm vm M , V M M. V, Tesd Test (in.-k) 03 (in.-k) 04 ( h k ) (k) Theory
Reinforced
Rectangular Opening
CR-IA CR-2A CR-2n CR-aC CR-2D CR-M a - 3 B CR4A CR4B CR-5A GR-7B CR-7D CSK-2 CSK-5 C S L 6 CSK-7 CS-1 CS-2 CS-3 RL-5 R M
Mean . . . . . . . . . . . . . . . . . . . . . . . . . . . . . . . . . . . Coefficient of Variadon
Resistance Factor. . . . . . . . . . . . . . . . O v e d Steel Beams
Mean . . . . . . . . . . . . . . . . . . . . . . . . . . . . . . . . . . . . . . . . . . . . . Coelfcicnt of Variation
.................... Resistance Factor
Notes:
(1) refer to Table 3.0 for key ro beam designations
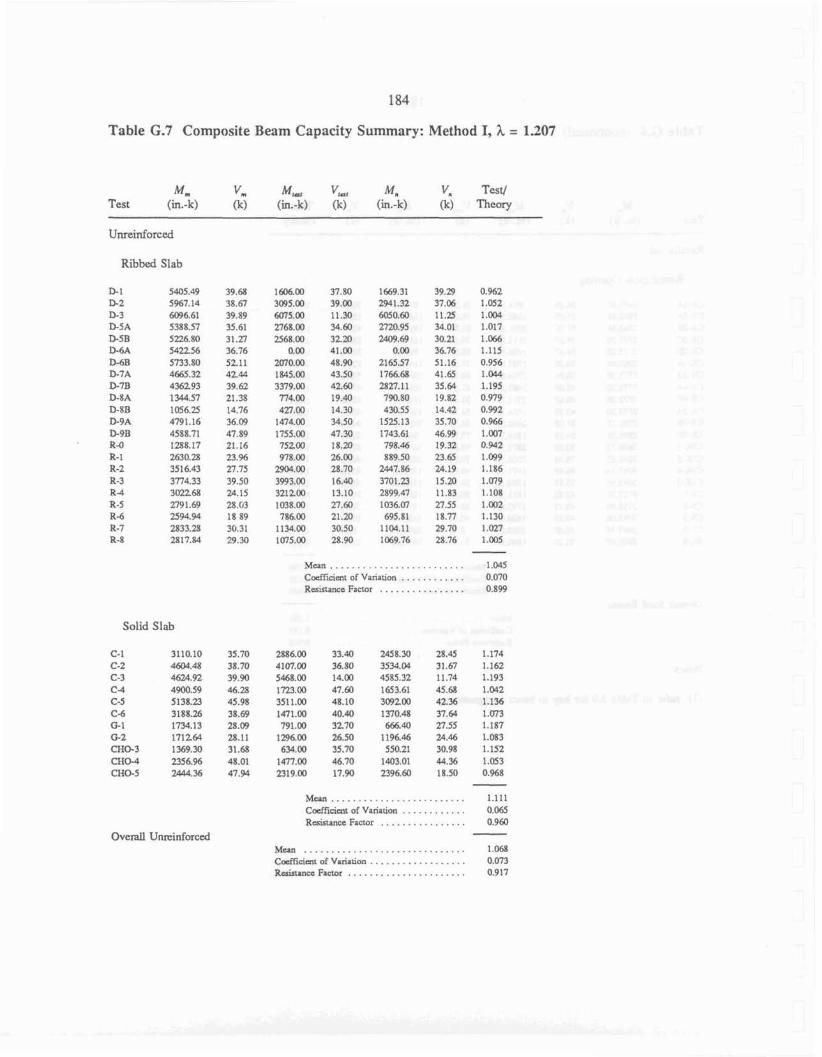
184
TabIe G.7 Composite Beam Capacity Summary: Method I, h = 1.207
M m v m Test (in.-k) 0)
M,, vm, 4 V, Test/ (in.-k) (k) (in.-k) (k) Theory
Ribbed Stab
. . . . . . . . . . . . . . . . . . . . . . . . . Mcan 1.M5 CoefFicimt of Variation ............ 0.070
. . . . . . . . . . . . . . . . Raktance Factor 0.899
Solid Slab
Mcpn ......................... ... . . . . . . . . . Cmfficicnr of Variation
. . . . . . . . . . . . . . . . Resistance Factor
Overall Unreinforcd
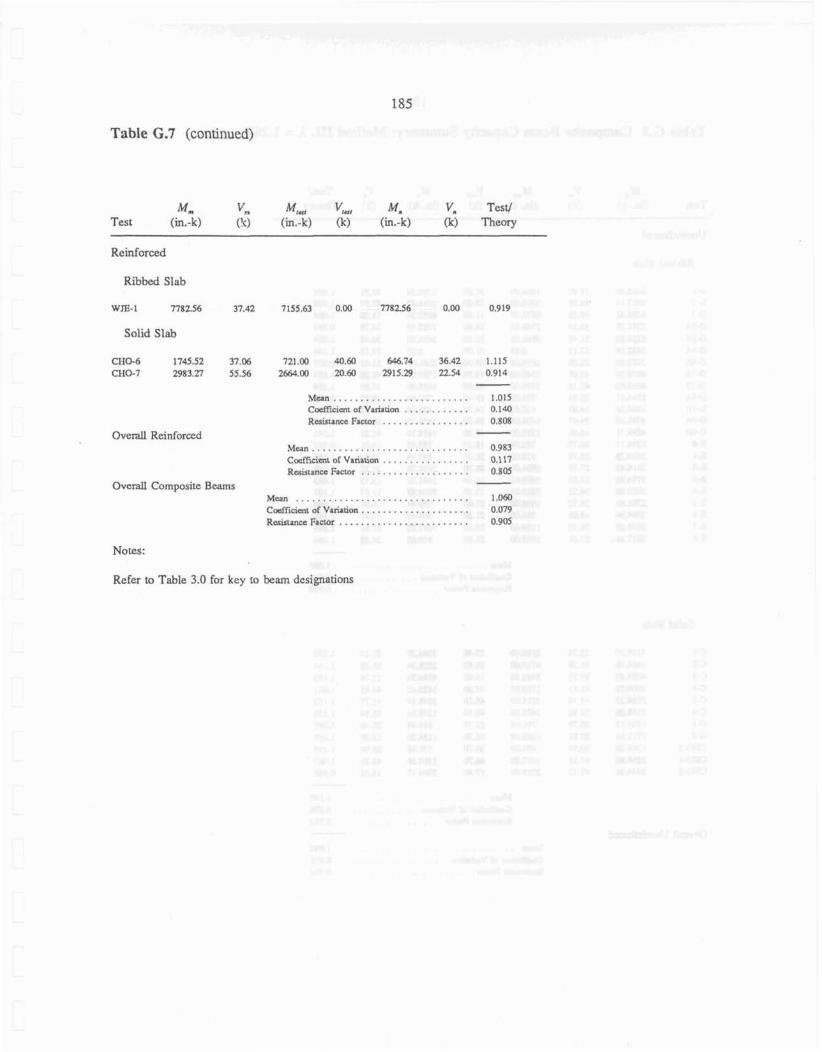
Table 6.7 (continued)
M, v, M,, vim M. V, Tesd Test (in.-k) ('4 (in.-k) (k) (in.-k) (kl n e w y
Reinforced
Ribbed Slab
Solid Slab
M a n ......................... . . . . . . . . . . . . Cocffieicnt of Varialion
. . . . . . . . . . . . . . . . Resistance Factor
OveraIl Reinfored
Overall Composite Beams
Mean . . . . . . . . . . . . . . . . . . . . . . . . . . . . . Coclficimt of Variptiml . . . . . . . . . . . . . . . . Resisrancc Factor . . . . . . . . . . . . . . . . . . . .
. . . . . . . . . . . . . . . . . . . . . . . . . . . . . . . . Mean I.Om . . . . . . . . . . . . . . . . . . . . C o e f f i m of Variation 0.079
. . . . . . . . . . . . . . . . . . . . . . . . Itmistance Factor 0.905
Notes:
Refer to Table 3.0 for key m beam designations
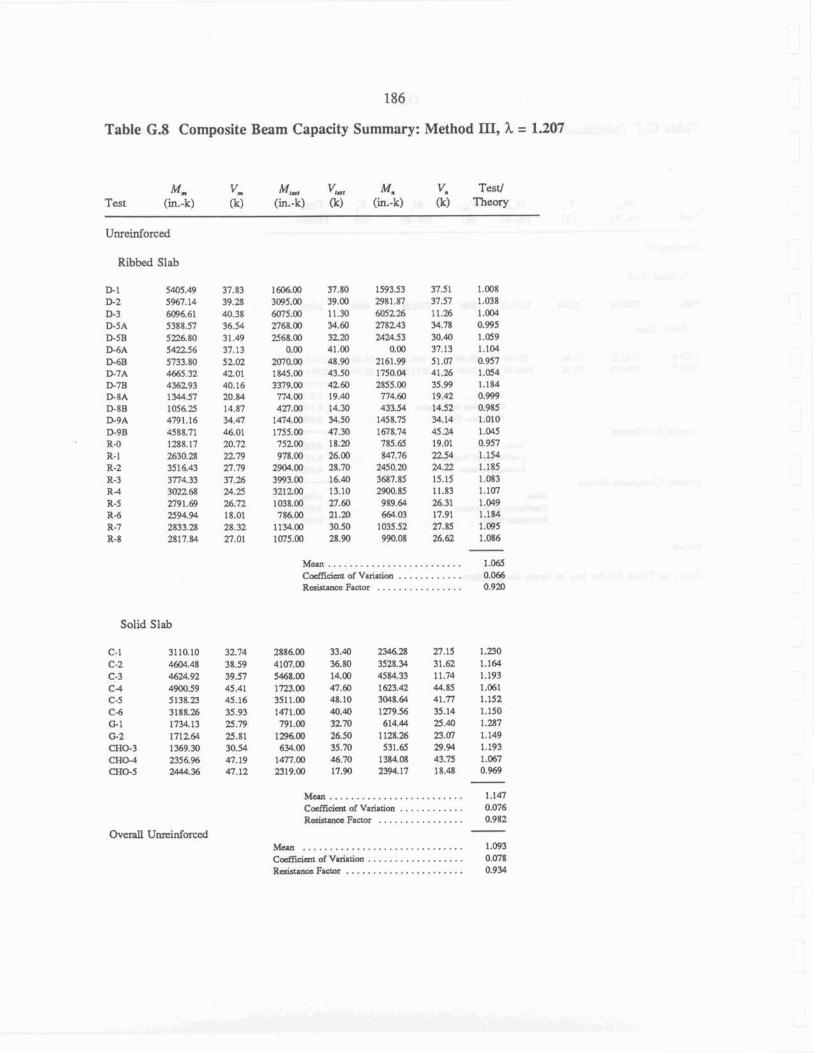
186
Table (3.8 Composite Beam Capacity Summary: Method III, h = 1.207
M , vm M, v,.., Mm V, Test/ Test (in.-k) (k) (in.-k) (k) (in.-k) (k3 T h e w
umeinforced
Ribbgd Slab
D- E D-2 D-3 D-5A D-5B 11.6A D 6 B D-7A w a D-8A D-SB D-9A D-9R R 4 a-t R-2 R-3 R 4 B-5 R.6 R-7 R-8
Solid Slab
C-E 3110.10 C-Z 460448 C-3 4624.92 c 4 4900.59 C-5 5138.23 C b 3188.26 GI 1734.13 6 2 171264 CHG~ 1369.30 CHO-4 2356% CHO-5 2d44.36
1606.O(F 37.80 1593.53 37.51 1.008 3095.06 39.00 ZPll.87 37.57 1.038 Mn5.00 11.30 6052% 11.26 1.m 2368.00 34.60 278243 34.78 0.995 2568.00 3220 ZdW.53 30.40 1.059
0.00 47.00 0.00 37.13 1.104 2070.03 48.W 2161.99 51-07 0.957 1845.00 43.50 1750.W 41.26 1.054 3379.00 42.60 2855 00 35.W 1.184 774.m 19.M 774.60 19.42 O . W 427.00 14.30 433.54 14.52 0.985 1474.W 34.50 1458.75 34.14 1.010 1755.00 47.30 167g.74 45.24 1.045 75200 18.20 785.65 19.01 0.957 978.00 26.00 847.76 2254 1.154 2904.00 28.70 2450.20 24.22 1.115 3W3.00 16.40 3687.85 15.15 1.083 321200 13.10 241XJ.85 11.83 1.107 1038.00 27.60 989.6.1 26.31 1.W9 784.M 21.20 664.03 17.91 1.184 llW.00 30.50 1035.52 27.85 1.095 1075.M1 28.90 9543.08 26.62 1.086 -
Mean ......................... 1.065 C d c n t of Variation ............ 0.066 R a Factor ................ 0.920
Ma...... ................... ............ CocKimt af Variation
................ R & m m Factor
Mern .............................. C d e i c m of Vcrilrion .................. l7eshrm Factor ......................

Table G.8 (continued)
Mm vm M E , V,-, Mm V, Tesd Test (in.-k) (k) (in.-k) (k) (in.-k) (k) Theory
Reinfurced
RibM Slab
W E - I 7782.56 37.X' 7155.63 0.00 7782.56 0.00 0.919
Solid Slab
Overall Reinforced
. . . . . . . . . . . . . . . . . . . . . . . . . Men 1.0s Cocffcient of Variation . . . . . . . . . . . . 0.152 R c m r m a F m r ................ 0.803 - ............................. Man 0.990
................ Coefficimt of Veriatim 0.127 .................... Resistance Factor 0.801
O v e d Composite Beams - ................................ Mean 1.083
Caffinmk of Variation . . . . . . . . . . . . . . . . . . . . 0.086 ........................ Rcnnancc Factor 0.91 8
Notes:
refer to Table 3.0 for key to beam design~ions
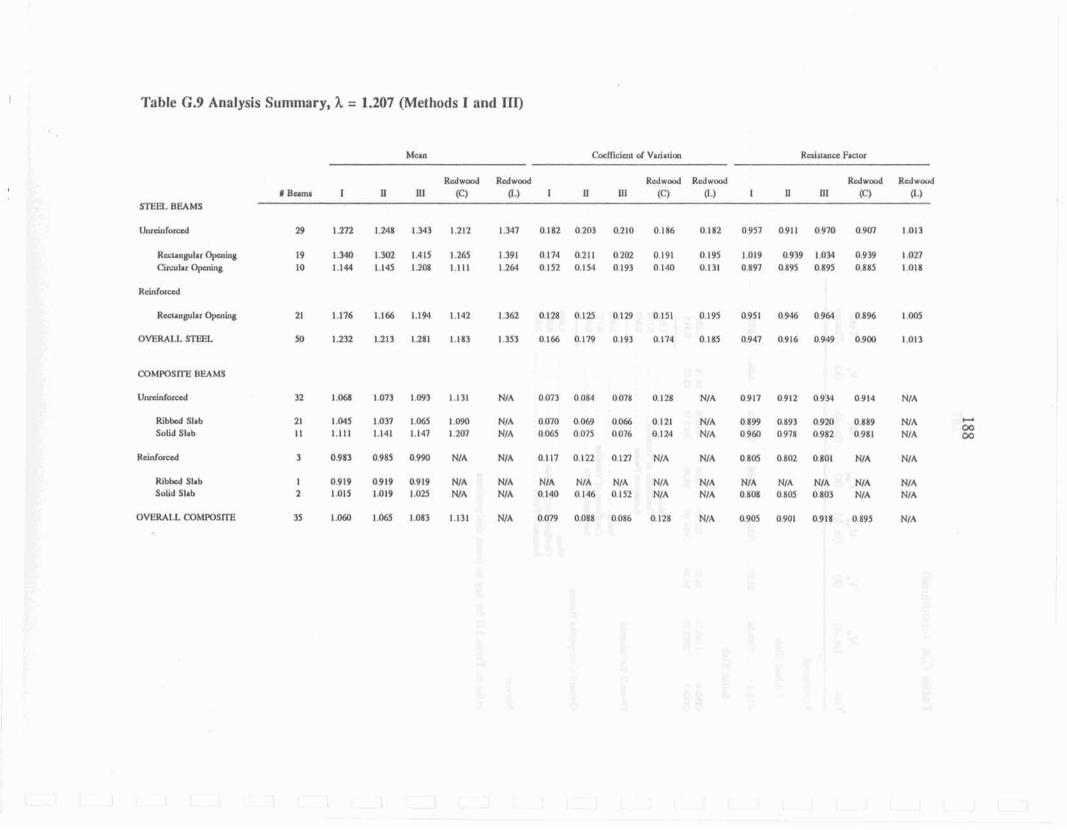
Table G.9 Analysis S~rmrnary, X = 1.207 (Methods I and 111)
3TElX BEAMS
Rtclangular Opening Circular Opaung
Reinforced
MMMSTTT! REAMS
RibM Slnb Solid Slab
Ribbcd SIab Solid Slab
32 1.06% 1.073 1.093 1.131 NIA 0073 0084 O M 8 0128 N/A 0917 09J2 0934 0914 N/A
21 1.045 1.037 IM5 1 . M NIA 0070 0069 0066 0121 N I A 0899 0893 0920 0B89 NIA I t 1.111 1.141 1.147 1.207 MIA 0065 0075 0076 0.124 N j A 0978 0982 0981 NIA
1 0919 0919 0919 NIA NIA NIA NIA MIA N I A NIA NIA NEA MIA NIA NIA 2 1.015 1.019 1.023 MIA NIA 0 140 Q.146 0 152 N/A NIA 0 Ic08 0 805 0803 NIA NIA
35 1 1.065 1.053 1.131 N/A OM9 OD88 0086 0 128 NIA 0904 0901 0918 0895 NIA


