Embed Size (px)
Citation preview

J
S
Ma
b
c
a
ARRAA
KSABBM
1
armputvabpcfmttm
(
h2
ARTICLE IN PRESSG ModelWPE-100; No. of Pages 7
Journal of Water Process Engineering xxx (2015) xxx.e1–xxx.e7
Contents lists available at ScienceDirect
Journal of Water Process Engineering
journa l h om epage: www.elsev ier .com/ locate / jwpe
tart up performance of biochar packed bed anaerobic digesters
ichael John Cooneya,∗, Ken Lewisa, Kevin Harrisb, Qian Zhangc, Tao Yanc,∗∗
Hawaii Natural Energy Institute, University of Hawaii at Manoa, 1680 East West Road, POST 109, Honolulu, HI 96822, United StatesPacific Biodiesel Technologies, 40 Hobron Avenue, Kahului, HI 96732, United StatesDepartment of Civil and Environmental Engineering, University of Hawaii at Manoa, Honolulu, HI 96822, United States
r t i c l e i n f o
rticle history:eceived 8 July 2014eceived in revised form 2 December 2014ccepted 6 December 2014vailable online xxx
eywords:tart-upnaerobic digestion
a b s t r a c t
The development of microbial biofilm community in biochar packed anaerobic digesters was exploredduring start up at demonstration scale on high strength grease trap waste wastewater. Total and solublechemical oxygen demand reduction reached 68% and 69%, respectively, after just fifty nine days at anHRT of 1.8 days. Methane head space gas compositions averaged across all reactors exceeded 60% andtotal methane production rates approached the theoretical maximum per kilogram of chemical oxygendemand reduced. Aggressive consumption of volatile organic acids correlated linearly with an increasein pH from 5.86 in the mixing reactor to a value of 7.61 in the final effluent. Both soluble and total phos-phorous and total nitrogen were relatively unaffected by the treatment. Active methanogenic microbial
iochariofilmethanogenic microbial communities
biofilm communities possessing high proportions of methanogens were established despite the pres-ence of feed wastewater streams possessing significantly different populations of planktonic bacteria. Insum, these results indicate that biochar alone can support the rapid development of robust well balancedmethanogenic microbial biofilms that effectively minimize the impact of influent microbial communitieson the reactor microbial biofilm communities.
. Introduction
The complete anaerobic digestion of organic waste requires well-working and balanced cascade of trophic levels of bacte-ia (acido and acetogens) and archaea (methanogens) [1,2]. Theseicroorganisms are both diverse with respect to their growth rates,
H optima, and inhibitors. They are also symbiotically dependentpon each other in terms of metabolite consumption and produc-ion. Methanogens are relatively slow growers optimized for pHalues around 7.0 and sensitive to reactor conditions while acidond acetogens are relatively fast growers that prefer pH valuesetween 5.5 and 6.0 [1,3]. For these reasons a properly balancedopulation is difficult to achieve during start up. It is also diffi-ult to maintain during continuous operation – particularly whened wastewaters populated with complex and poorly balanced
icrobial communities. Establishing a balanced biofilm popula-
Please cite this article in press as: M.J. Cooney, et al., Start up performEng. (2015), http://dx.doi.org/10.1016/j.jwpe.2014.12.004
ion during the start-up phase is, therefore, critical. The benefitso biofilms, attached community of microbes, include proximity to
aximize resource utilization, decreased competition, resistance
∗ Corresponding author. Tel.: +1 8089567337.∗∗ Co-Corresponding author. Tel.: +1 8089566024.
E-mail addresses: [email protected] (M.J. Cooney), [email protected]. Yan).
ttp://dx.doi.org/10.1016/j.jwpe.2014.12.004214-7144/© 2014 Elsevier Ltd. All rights reserved.
© 2014 Elsevier Ltd. All rights reserved.
to stress, and increased metabolic activity. Not surprisingly thestart-up process, especially under overload and stress operations,has gained increased interest, with several procedures proposedand evaluated to inoculate the reactor with a sufficient mass of awell-balanced methanogenic microbial community.
The most direct technique is the inoculum ratio (v/v) whichshould be at least 5% of the total reactor volume [4]. Another is topre-aerate the feed substrate to reduce easily degradable organiccarbons which otherwise might lead to a disproportionate pro-duction of volatile organic acids and a sudden drop in pH [5].Sudden drops in pH can lead to a substantial growth spurt of fastergrowing acido and acetogens at the expense of the slower grow-ing methanogens which prefer pH values closer to 7.0. Charleset al. (2009) demonstrated that pre-aeration for five days signifi-cantly improved the start-up process [6]. Additional methodologiesinclude the source of the inoculum [3,7], the initial mode of oper-ation of the digesters in terms of mixing/stirring intensity [8], theorganic loading rate (OLR) and hydraulic and solid retention time[9], and the adaptation and pre-incubation of the biomass prior theanaerobic digestion process [9–11].
More recently the seeding of the reactors during the start-up
ance of biochar packed bed anaerobic digesters, J. Water Process
phase with specialized inocula that can metabolize high concen-trations of acetate has been proposed [12,13]. Acetate is both theend product and substrate for acetoclastic methanogens to pro-duce methane and is therefore a key metabolite produced during

ARTICLE IN PRESSG ModelJWPE-100; No. of Pages 7
xxx.e2 M.J. Cooney et al. / Journal of Water Process Engineering xxx (2015) xxx.e1–xxx.e7
F g volume 1200 L), RXR C: 1500 L (working volume 1200 L), holding tank: 7570 L (workingv
tdpwfatatrt
eicics[radt(t
2
goh7wto1fsaru
ig. 1. HRAD schematic. RXR A: 900 L (working volume 600 L), RXR B: 1500 L (workinolume 5500 L).
he anaerobic digestion of carbohydrates. If the start-up phaseoes not achieve an effective balance between fermentative acid-roducers and methanogens, however, the concentration of acetateill exceed a specific critical upper threshold and the reactor will
ail. To address this scenario, the step wise addition of a specificcetate degrading enrichment culture over a six week period wasested against controls and a faster start-up period under highcetate concentrations was achieved [12,13]. Despite these posi-ive initial results, however, the authors noted the need for furtheresearch with regard to fermenter designs and cultivation condi-ions.
The pretreatment steps described above are also problematic toxecute at commercial scale. It would be of great benefit, therefore,f well-balanced methanogenic microbial biofilm communitiesould be achieved rapidly during the start-up phase and with min-mal treatments. Previously, the authors tested, at lab scale, theapacity of biochar packed upflow column reactors to treat hightrength wastewaters at relatively low hydraulic retentions times1]. Their results suggested that biochar alone could support theapid development of biofilms possessing balanced populationscido, aceto, and methanogens. In this work this strategy was testeduring start-up at demonstration scale on non-sterilized wastewa-er that possessed both high concentrations of volatile organic acidsincluding acetate) and high proportions of microorganisms thathreaten to upset the population balance.
. Materials and methods
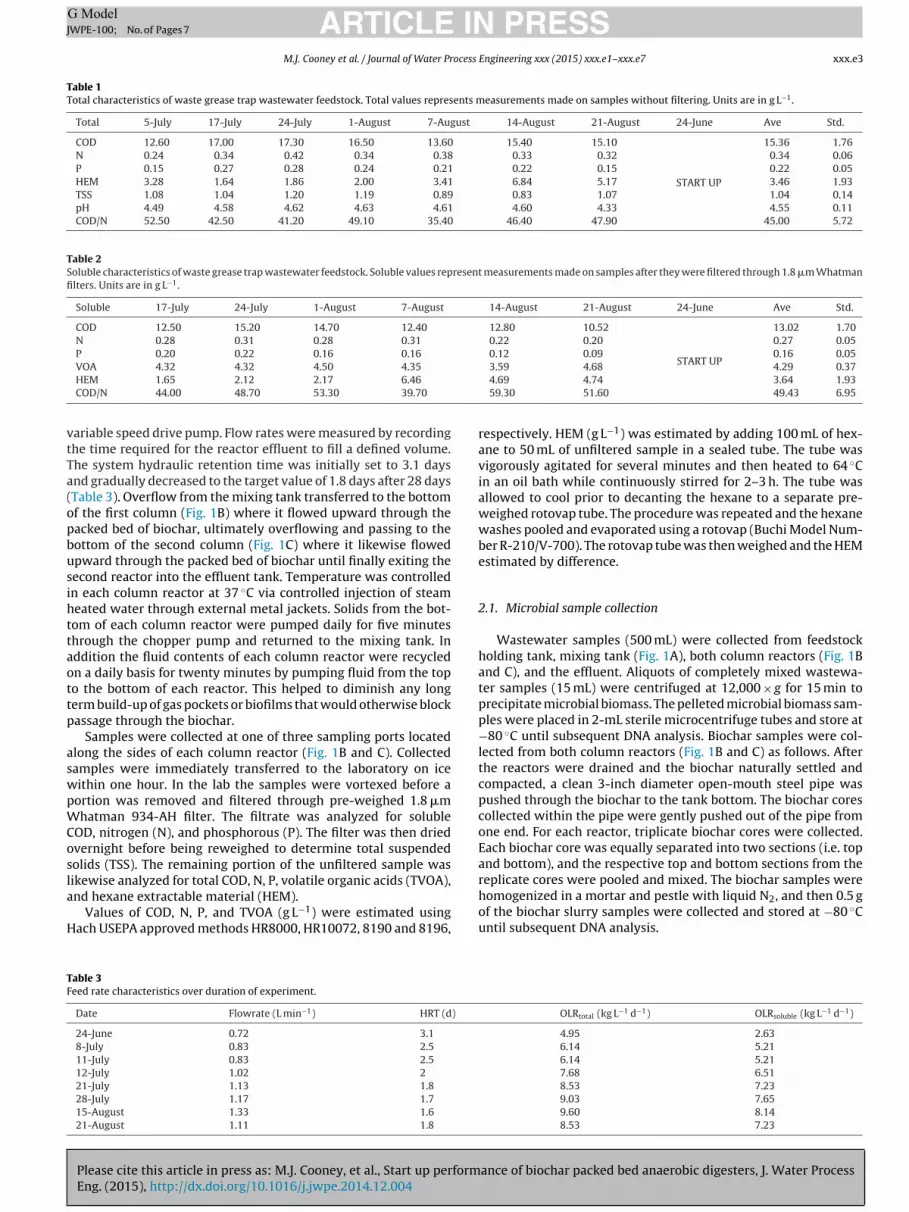
The packed bed anaerobic reactor system is presented as dia-ramed in Fig. 1 and as installed in Fig. 2. Wastewater separatedn site from grease trap waste was transferred from wastewaterolding tanks in one thousand gallon increments and stored in a570 L feedstock holding tank. The characteristics of the grease trapaste wastewater feedstock were measured intermittently over
he full period of operation (Tables 1 and 2). The total chemicalxygen demand (COD) was higher than its soluble counterpart at5.36 ± 1.76 vs. 13.02 ± 1.7 g L−1. The total suspended solids wasairly constant at 1.4 ± 0.14 g L−1 as was the total volatile organic
Please cite this article in press as: M.J. Cooney, et al., Start up performEng. (2015), http://dx.doi.org/10.1016/j.jwpe.2014.12.004
olids at 4.29 ± 0.37 g L−1. The COD/N ratio was 45.0 g L−1 (total)nd 49.4 g L−1 (soluble). The COD:N:P ratios over this period wereelatively consistent at 100:2.2:1.38 (total) and 100:2.17:1.27 (sol-ble) and in general agreement with the previous work of Lopez
Fig. 2. Installed pilot scale HRAD system.
et al. (2013) who evaluated grease trap waste wastewater obtainedfrom the same plant.
Agitation in the mixing tank (Fig. 1A) was accomplished bypumping fluid out through the bottom via an aggressive chopperstyle pump and returning it to the tanks upper section. Tempera-ture was controlled at 37 ◦C by passing the returned fluid through aset-point controlled heat exchanger. The pH in the mixing tank was
ance of biochar packed bed anaerobic digesters, J. Water Process
measured and maintained at a set-point of 5.8 through addition ofconcentrated NaOH using a dosing controller and metering pump.The grease trap waste wastewater feedstock was metered from thefeedstock holding tank to the initial mixing tank (Fig. 1A) via a
ARTICLE IN PRESSG ModelJWPE-100; No. of Pages 7
M.J. Cooney et al. / Journal of Water Process Engineering xxx (2015) xxx.e1–xxx.e7 xxx.e3
Table 1Total characteristics of waste grease trap wastewater feedstock. Total values represents measurements made on samples without filtering. Units are in g L−1.
Total 5-July 17-July 24-July 1-August 7-August 14-August 21-August 24-June Ave Std.
COD 12.60 17.00 17.30 16.50 13.60 15.40 15.10
START UP
15.36 1.76N 0.24 0.34 0.42 0.34 0.38 0.33 0.32 0.34 0.06P 0.15 0.27 0.28 0.24 0.21 0.22 0.15 0.22 0.05HEM 3.28 1.64 1.86 2.00 3.41 6.84 5.17 3.46 1.93TSS 1.08 1.04 1.20 1.19 0.89 0.83 1.07 1.04 0.14pH 4.49 4.58 4.62 4.63 4.61 4.60 4.33 4.55 0.11COD/N 52.50 42.50 41.20 49.10 35.40 46.40 47.90 45.00 5.72
Table 2Soluble characteristics of waste grease trap wastewater feedstock. Soluble values represent measurements made on samples after they were filtered through 1.8 �m Whatmanfilters. Units are in g L−1.
Soluble 17-July 24-July 1-August 7-August 14-August 21-August 24-June Ave Std.
COD 12.50 15.20 14.70 12.40 12.80 10.52
START UP
13.02 1.70N 0.28 0.31 0.28 0.31 0.22 0.20 0.27 0.05P 0.20 0.22 0.16 0.16 0.12 0.09 0.16 0.05
vtTa(opbusihttaottp
aswpWCosla
H
TF
VOA 4.32 4.32 4.50 4.35
HEM 1.65 2.12 2.17 6.46
COD/N 44.00 48.70 53.30 39.70
ariable speed drive pump. Flow rates were measured by recordinghe time required for the reactor effluent to fill a defined volume.he system hydraulic retention time was initially set to 3.1 daysnd gradually decreased to the target value of 1.8 days after 28 daysTable 3). Overflow from the mixing tank transferred to the bottomf the first column (Fig. 1B) where it flowed upward through theacked bed of biochar, ultimately overflowing and passing to theottom of the second column (Fig. 1C) where it likewise flowedpward through the packed bed of biochar until finally exiting theecond reactor into the effluent tank. Temperature was controlledn each column reactor at 37 ◦C via controlled injection of steameated water through external metal jackets. Solids from the bot-om of each column reactor were pumped daily for five minuteshrough the chopper pump and returned to the mixing tank. Inddition the fluid contents of each column reactor were recycledn a daily basis for twenty minutes by pumping fluid from the topo the bottom of each reactor. This helped to diminish any longerm build-up of gas pockets or biofilms that would otherwise blockassage through the biochar.
Samples were collected at one of three sampling ports locatedlong the sides of each column reactor (Fig. 1B and C). Collectedamples were immediately transferred to the laboratory on iceithin one hour. In the lab the samples were vortexed before aortion was removed and filtered through pre-weighed 1.8 �mhatman 934-AH filter. The filtrate was analyzed for soluble
OD, nitrogen (N), and phosphorous (P). The filter was then driedvernight before being reweighed to determine total suspendedolids (TSS). The remaining portion of the unfiltered sample was
Please cite this article in press as: M.J. Cooney, et al., Start up performEng. (2015), http://dx.doi.org/10.1016/j.jwpe.2014.12.004
ikewise analyzed for total COD, N, P, volatile organic acids (TVOA),nd hexane extractable material (HEM).
Values of COD, N, P, and TVOA (g L−1) were estimated usingach USEPA approved methods HR8000, HR10072, 8190 and 8196,
able 3eed rate characteristics over duration of experiment.
Date Flowrate (L min−1) HRT (d)
24-June 0.72 3.1
8-July 0.83 2.5
11-July 0.83 2.5
12-July 1.02 2
21-July 1.13 1.8
28-July 1.17 1.7
15-August 1.33 1.6
21-August 1.11 1.8
3.59 4.68 4.29 0.374.69 4.74 3.64 1.9359.30 51.60 49.43 6.95
respectively. HEM (g L−1) was estimated by adding 100 mL of hex-ane to 50 mL of unfiltered sample in a sealed tube. The tube wasvigorously agitated for several minutes and then heated to 64 ◦Cin an oil bath while continuously stirred for 2–3 h. The tube wasallowed to cool prior to decanting the hexane to a separate pre-weighed rotovap tube. The procedure was repeated and the hexanewashes pooled and evaporated using a rotovap (Buchi Model Num-ber R-210/V-700). The rotovap tube was then weighed and the HEMestimated by difference.
2.1. Microbial sample collection
Wastewater samples (500 mL) were collected from feedstockholding tank, mixing tank (Fig. 1A), both column reactors (Fig. 1Band C), and the effluent. Aliquots of completely mixed wastewa-ter samples (15 mL) were centrifuged at 12,000 × g for 15 min toprecipitate microbial biomass. The pelleted microbial biomass sam-ples were placed in 2-mL sterile microcentrifuge tubes and store at−80 ◦C until subsequent DNA analysis. Biochar samples were col-lected from both column reactors (Fig. 1B and C) as follows. Afterthe reactors were drained and the biochar naturally settled andcompacted, a clean 3-inch diameter open-mouth steel pipe waspushed through the biochar to the tank bottom. The biochar corescollected within the pipe were gently pushed out of the pipe fromone end. For each reactor, triplicate biochar cores were collected.Each biochar core was equally separated into two sections (i.e. topand bottom), and the respective top and bottom sections from the
ance of biochar packed bed anaerobic digesters, J. Water Process
replicate cores were pooled and mixed. The biochar samples werehomogenized in a mortar and pestle with liquid N2, and then 0.5 gof the biochar slurry samples were collected and stored at −80 ◦Cuntil subsequent DNA analysis.
OLRtotal (kg L−1 d−1) OLRsoluble (kg L−1 d−1)
4.95 2.636.14 5.216.14 5.217.68 6.518.53 7.239.03 7.659.60 8.148.53 7.23

ARTICLE IN PRESSG ModelJWPE-100; No. of Pages 7
xxx.e4 M.J. Cooney et al. / Journal of Water Process Engineering xxx (2015) xxx.e1–xxx.e7
Fig. 3. Performance of packed bed anaerobic reactor as a function of location atday fifty nine after innoculation. Symbols: Open triangles, total COD; open squares,soluble COD; open triangles, total volatile organic acids; crosses, pH. Key: R1 referst3t
2
ulatBfVPHpVwodr
2
wotieducadtt
3
3
(T2aFl
o the first column reactor (VR-3010), R2 refers to the second column reactor (VR-015), P3 refers to lower sample port, P2 refers to middle sample port, and P1 referso top sample port, respectively.
.2. 16S rRNA gene amplification and Illumina sequencing
The samples were subjected to total genomic DNA extractionsing the PowerSoil DNA extraction kit (MoBio, Carlsbad, CA) fol-
owing the manufacture’s procedure. Preparation of 16S rRNA genemplicon and subsequent Illumina sequencing were conducted byhe DNA Services Facility at the University of Illinois at Chicago.riefly, PCR amplification were conducted in triplicate reactions
or all samples using the 515f/806r primer set that amplifies the4-V5 region of the 16S rRNA gene [14]. Amplicons of the triplicateCR reactions were pooled and then sequenced using an IlluminaiSeq 2000 instrument. De novo assemble of paired-end reads waserformed with the software package CLC Genomics Workbenchersion 6.0 (CLC bio, Cambridge, MA), and the resulting fastq filesere trimmed using a cutoff quality score of Q15 and read length
f larger than 200 bp [15]. Only the forward reads were used forownstream analysis, as it was reported that including the reverseeads add little additional information [15].
.3. Data analysis
Bioinformatics analyses were conducted using the QIIME soft-are package [15]. Sequence reads were assigned to unique
perational taxonomic units (OTUs) at the ≥97% sequence iden-ity level. For individual samples, species richness (chao1), Shannonndex (H′), and Faith’s phylogenetic diversity were calculated tostimate alpha diversity. Phylogenetic metrics of the pairwiseistances between microbial communities were estimated usingnweighted Unifrac distances. Principal coordinates analyses wereonducted in PRIMER [16] using the unweighted Unifrac distancess input. To test whether sample categories harbored significantifferences between wastewater samples and biochar samples inhe anaerobic digester process, we conducted analysis of similari-ies (ANOSIM) tests as implemented in PRIMER.
. Results and discussion
.1. Anaerobic digestion
The start-up phase was operated over a fifty nine days periodTable 3). During this time the HRT was reduced from 3.1 to 1.8 days.he total and soluble organic loading rates increased from 4.95 and
Please cite this article in press as: M.J. Cooney, et al., Start up performEng. (2015), http://dx.doi.org/10.1016/j.jwpe.2014.12.004
.63 to 8.53 and 7.23 kg L−1 d−1, respectively. System performancet day fifty nine as a function of reactor location is presented inig. 3. The total and soluble chemical oxygen demand decreasedinearly with distance traveled through the reactor’s packed bed
Fig. 4. PH profile as a function of location at various times after inoculation. Symbols:Open diamonds, fifty nine days after innoculation; open squares, fifty three daysafter innoculation; open triangles, twenty eight days after innoculation.
and achieved an overall COD reduction of 68% and 69%, respectively,by day fifty nine. The total volatile organic acids were aggressivelyconsumed from 4.7 g L−1 in the feed to 1.46 g L−1 in the effluent andcorrelated well with a linear increase in pH from 5.86 in the mixingreactor to a final effluent value of 7.61 and a corresponding decreasein the total volatile organic acids. An additional indicator of thebiofilm maturation can be seen in the pH profiles across the systemwith respect to time from inoculation (Fig. 4). As time increased thepH profile across the system approached values of 7.0 more rapidly,indicating the enhanced development of the biofilm methanogenicmicrobial community.
The total N decreased from 0.34 g L−1 in the feed to 0.268 g L−1
in the effluent while the soluble N increased from 0.27 g L−1 in thefeed to 0.298 g L−1 in the effluent. More, the soluble N in the efflu-ent was slightly higher than its total value (0.298 vs. 0.268 g L−1),reflecting the ability of anaerobic digestion to solubilize metabo-lites that would be otherwise locked in the solid phase (e.g. as foodparticles). The total P decreased from 0.22 to 0.107 g L−1 while thesoluble P remained steady from 0.106 to 0.109 g L−1. The decreaseof total P reflects the removal of phosphorous containing foodscrap solids. The negligible decrease in soluble P reflects the factthat anaerobic digestion does not produce significant amounts ofbiomass and thus does not consume significant amounts of sol-uble phosphorus. More, the soluble P that is taken up is likelycountered by soluble P that is gained during the digestion of pro-tein. Combined these results confirmed the development of activeanaerobic methanogenic microbial biofilm communities through-out the packed beds in both columns.
3.2. Community assessment
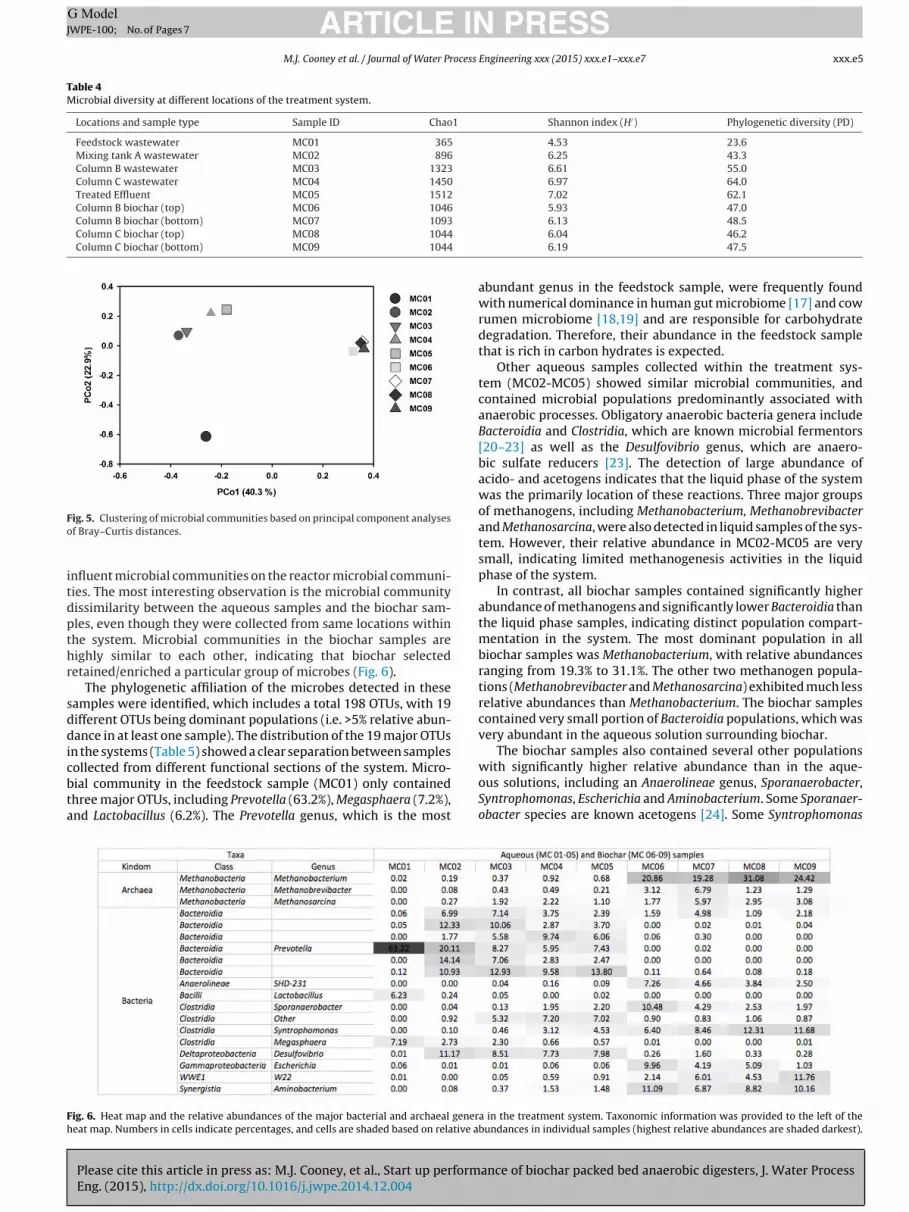
The Illumina sequencing of the 16S rRNA gene amplicon real-ized high sequencing depths, averaging 8289 sequence reads persample. The sequencing depths were adequate to capture major-ity of the microbial diversity, as indicated by the rarefaction curvesapproaching the asymptotic state. Microbial communities at thedifferent stages of the anaerobic digestion processes all showedvery diverse microbial communities (Table 4). The Shannon index(H′) for aqueous samples ranged from 6.25 to 7.02, which are alllarger than the Shannon index for the feedstock sample (4.53).Similar difference was also observed based on the phylogeneticdiversity.
Microbial communities in these samples were clustered basedon the sequencing results, which showed clear difference amongstsamples collected from different locations of the system and group-
ance of biochar packed bed anaerobic digesters, J. Water Process
ing between samples collected from locations expected to performsimilar functions (Fig. 5). The feedstock sample (MC01) was sig-nificantly different from the other aqueous samples (MC02-05),indicating that the system effectively minimized the impact of
ARTICLE IN PRESSG ModelJWPE-100; No. of Pages 7
M.J. Cooney et al. / Journal of Water Process Engineering xxx (2015) xxx.e1–xxx.e7 xxx.e5
Table 4Microbial diversity at different locations of the treatment system.
Locations and sample type Sample ID Chao1 Shannon index (H′) Phylogenetic diversity (PD)
Feedstock wastewater MC01 365 4.53 23.6Mixing tank A wastewater MC02 896 6.25 43.3Column B wastewater MC03 1323 6.61 55.0Column C wastewater MC04 1450 6.97 64.0Treated Effluent MC05 1512 7.02 62.1Column B biochar (top) MC06 1046 5.93 47.0Column B biochar (bottom) MC07 1093
Column C biochar (top) MC08 1044
Column C biochar (bottom) MC09 1044
Fo
itdpthr
sddicbta
with significantly higher relative abundance than in the aque-
Fh
ig. 5. Clustering of microbial communities based on principal component analysesf Bray–Curtis distances.
nfluent microbial communities on the reactor microbial communi-ies. The most interesting observation is the microbial communityissimilarity between the aqueous samples and the biochar sam-les, even though they were collected from same locations withinhe system. Microbial communities in the biochar samples areighly similar to each other, indicating that biochar selectedetained/enriched a particular group of microbes (Fig. 6).
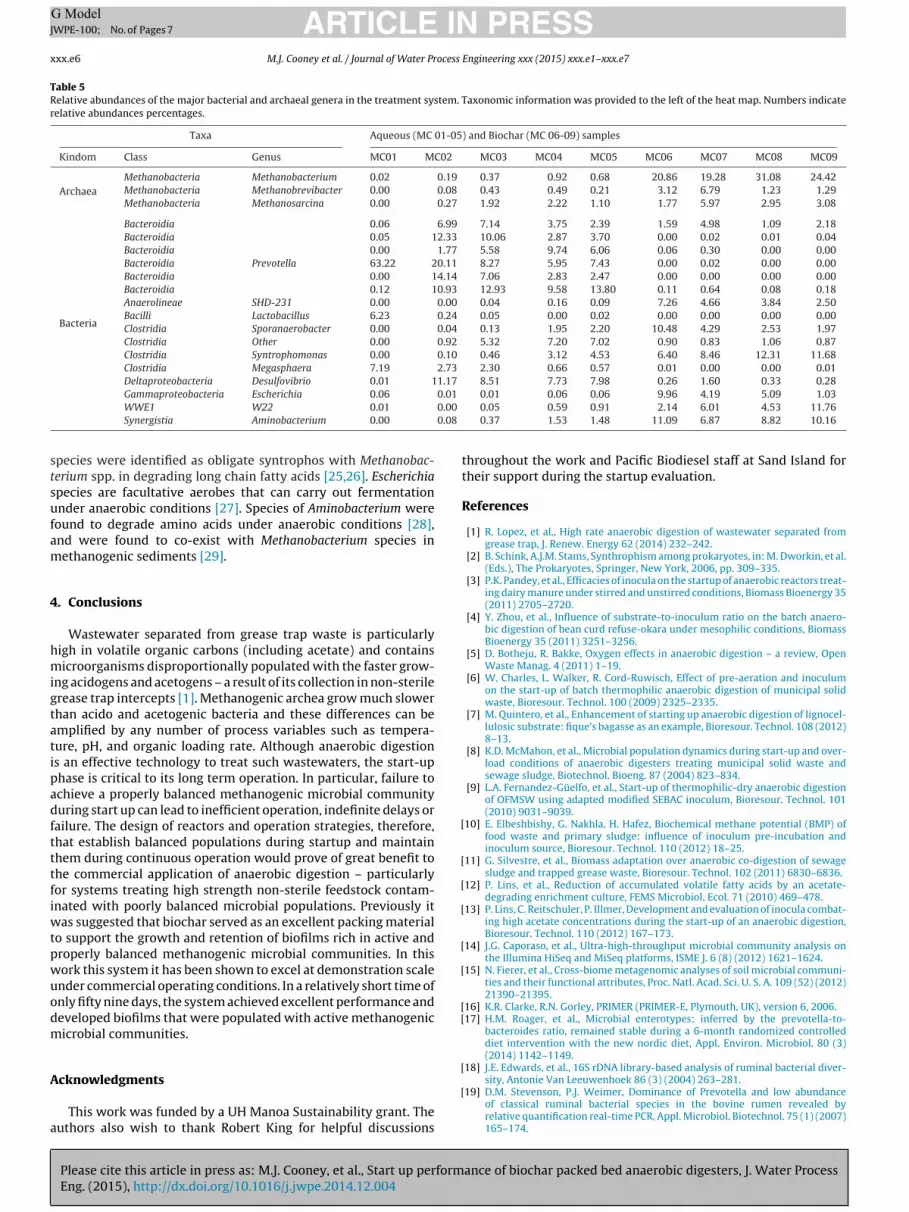
The phylogenetic affiliation of the microbes detected in theseamples were identified, which includes a total 198 OTUs, with 19ifferent OTUs being dominant populations (i.e. >5% relative abun-ance in at least one sample). The distribution of the 19 major OTUs
n the systems (Table 5) showed a clear separation between samplesollected from different functional sections of the system. Micro-
Please cite this article in press as: M.J. Cooney, et al., Start up performEng. (2015), http://dx.doi.org/10.1016/j.jwpe.2014.12.004
ial community in the feedstock sample (MC01) only containedhree major OTUs, including Prevotella (63.2%), Megasphaera (7.2%),nd Lactobacillus (6.2%). The Prevotella genus, which is the most
ig. 6. Heat map and the relative abundances of the major bacterial and archaeal genereat map. Numbers in cells indicate percentages, and cells are shaded based on relative a
6.13 48.56.04 46.26.19 47.5
abundant genus in the feedstock sample, were frequently foundwith numerical dominance in human gut microbiome [17] and cowrumen microbiome [18,19] and are responsible for carbohydratedegradation. Therefore, their abundance in the feedstock samplethat is rich in carbon hydrates is expected.
Other aqueous samples collected within the treatment sys-tem (MC02-MC05) showed similar microbial communities, andcontained microbial populations predominantly associated withanaerobic processes. Obligatory anaerobic bacteria genera includeBacteroidia and Clostridia, which are known microbial fermentors[20–23] as well as the Desulfovibrio genus, which are anaero-bic sulfate reducers [23]. The detection of large abundance ofacido- and acetogens indicates that the liquid phase of the systemwas the primarily location of these reactions. Three major groupsof methanogens, including Methanobacterium, Methanobrevibacterand Methanosarcina, were also detected in liquid samples of the sys-tem. However, their relative abundance in MC02-MC05 are verysmall, indicating limited methanogenesis activities in the liquidphase of the system.
In contrast, all biochar samples contained significantly higherabundance of methanogens and significantly lower Bacteroidia thanthe liquid phase samples, indicating distinct population compart-mentation in the system. The most dominant population in allbiochar samples was Methanobacterium, with relative abundancesranging from 19.3% to 31.1%. The other two methanogen popula-tions (Methanobrevibacter and Methanosarcina) exhibited much lessrelative abundances than Methanobacterium. The biochar samplescontained very small portion of Bacteroidia populations, which wasvery abundant in the aqueous solution surrounding biochar.
The biochar samples also contained several other populations
ance of biochar packed bed anaerobic digesters, J. Water Process
ous solutions, including an Anaerolineae genus, Sporanaerobacter,Syntrophomonas, Escherichia and Aminobacterium. Some Sporanaer-obacter species are known acetogens [24]. Some Syntrophomonas
a in the treatment system. Taxonomic information was provided to the left of thebundances in individual samples (highest relative abundances are shaded darkest).
ARTICLE IN PRESSG ModelJWPE-100; No. of Pages 7
xxx.e6 M.J. Cooney et al. / Journal of Water Process Engineering xxx (2015) xxx.e1–xxx.e7
Table 5Relative abundances of the major bacterial and archaeal genera in the treatment system. Taxonomic information was provided to the left of the heat map. Numbers indicaterelative abundances percentages.
Taxa Aqueous (MC 01-05) and Biochar (MC 06-09) samples
Kindom Class Genus MC01 MC02 MC03 MC04 MC05 MC06 MC07 MC08 MC09
ArchaeaMethanobacteria Methanobacterium 0.02 0.19 0.37 0.92 0.68 20.86 19.28 31.08 24.42Methanobacteria Methanobrevibacter 0.00 0.08 0.43 0.49 0.21 3.12 6.79 1.23 1.29Methanobacteria Methanosarcina 0.00 0.27 1.92 2.22 1.10 1.77 5.97 2.95 3.08
Bacteria
Bacteroidia 0.06 6.99 7.14 3.75 2.39 1.59 4.98 1.09 2.18Bacteroidia 0.05 12.33 10.06 2.87 3.70 0.00 0.02 0.01 0.04Bacteroidia 0.00 1.77 5.58 9.74 6.06 0.06 0.30 0.00 0.00Bacteroidia Prevotella 63.22 20.11 8.27 5.95 7.43 0.00 0.02 0.00 0.00Bacteroidia 0.00 14.14 7.06 2.83 2.47 0.00 0.00 0.00 0.00Bacteroidia 0.12 10.93 12.93 9.58 13.80 0.11 0.64 0.08 0.18Anaerolineae SHD-231 0.00 0.00 0.04 0.16 0.09 7.26 4.66 3.84 2.50Bacilli Lactobacillus 6.23 0.24 0.05 0.00 0.02 0.00 0.00 0.00 0.00Clostridia Sporanaerobacter 0.00 0.04 0.13 1.95 2.20 10.48 4.29 2.53 1.97Clostridia Other 0.00 0.92 5.32 7.20 7.02 0.90 0.83 1.06 0.87Clostridia Syntrophomonas 0.00 0.10 0.46 3.12 4.53 6.40 8.46 12.31 11.68Clostridia Megasphaera 7.19 2.73 2.30 0.66 0.57 0.01 0.00 0.00 0.01Deltaproteobacteria Desulfovibrio 0.01 11.17 8.51 7.73 7.98 0.26 1.60 0.33 0.28
0.010.00
0.08
stsufam
4
hmigtatipadftttfiwtpwuodm
A
a
[
[
[
[
[
[
[[
[
Gammaproteobacteria Escherichia 0.06WWE1 W22 0.01
Synergistia Aminobacterium 0.00
pecies were identified as obligate syntrophos with Methanobac-erium spp. in degrading long chain fatty acids [25,26]. Escherichiapecies are facultative aerobes that can carry out fermentationnder anaerobic conditions [27]. Species of Aminobacterium wereound to degrade amino acids under anaerobic conditions [28],nd were found to co-exist with Methanobacterium species inethanogenic sediments [29].
. Conclusions
Wastewater separated from grease trap waste is particularlyigh in volatile organic carbons (including acetate) and containsicroorganisms disproportionally populated with the faster grow-
ng acidogens and acetogens – a result of its collection in non-sterilerease trap intercepts [1]. Methanogenic archea grow much slowerhan acido and acetogenic bacteria and these differences can bemplified by any number of process variables such as tempera-ure, pH, and organic loading rate. Although anaerobic digestions an effective technology to treat such wastewaters, the start-uphase is critical to its long term operation. In particular, failure tochieve a properly balanced methanogenic microbial communityuring start up can lead to inefficient operation, indefinite delays orailure. The design of reactors and operation strategies, therefore,hat establish balanced populations during startup and maintainhem during continuous operation would prove of great benefit tohe commercial application of anaerobic digestion – particularlyor systems treating high strength non-sterile feedstock contam-nated with poorly balanced microbial populations. Previously it
as suggested that biochar served as an excellent packing materialo support the growth and retention of biofilms rich in active androperly balanced methanogenic microbial communities. In thisork this system it has been shown to excel at demonstration scalender commercial operating conditions. In a relatively short time ofnly fifty nine days, the system achieved excellent performance andeveloped biofilms that were populated with active methanogenicicrobial communities.
Please cite this article in press as: M.J. Cooney, et al., Start up performEng. (2015), http://dx.doi.org/10.1016/j.jwpe.2014.12.004
cknowledgments
This work was funded by a UH Manoa Sustainability grant. Theuthors also wish to thank Robert King for helpful discussions
[
0.01 0.06 0.06 9.96 4.19 5.09 1.030.05 0.59 0.91 2.14 6.01 4.53 11.760.37 1.53 1.48 11.09 6.87 8.82 10.16
throughout the work and Pacific Biodiesel staff at Sand Island fortheir support during the startup evaluation.
References
[1] R. Lopez, et al., High rate anaerobic digestion of wastewater separated fromgrease trap, J. Renew. Energy 62 (2014) 232–242.
[2] B. Schink, A.J.M. Stams, Synthrophism among prokaryotes, in: M. Dworkin, et al.(Eds.), The Prokaryotes, Springer, New York, 2006, pp. 309–335.
[3] P.K. Pandey, et al., Efficacies of inocula on the startup of anaerobic reactors treat-ing dairy manure under stirred and unstirred conditions, Biomass Bioenergy 35(2011) 2705–2720.
[4] Y. Zhou, et al., Influence of substrate-to-inoculum ratio on the batch anaero-bic digestion of bean curd refuse-okara under mesophilic conditions, BiomassBioenergy 35 (2011) 3251–3256.
[5] D. Botheju, R. Bakke, Oxygen effects in anaerobic digestion – a review, OpenWaste Manag. 4 (2011) 1–19.
[6] W. Charles, L. Walker, R. Cord-Ruwisch, Effect of pre-aeration and inoculumon the start-up of batch thermophilic anaerobic digestion of municipal solidwaste, Bioresour. Technol. 100 (2009) 2325–2335.
[7] M. Quintero, et al., Enhancement of starting up anaerobic digestion of lignocel-lulosic substrate: fique’s bagasse as an example, Bioresour. Technol. 108 (2012)8–13.
[8] K.D. McMahon, et al., Microbial population dynamics during start-up and over-load conditions of anaerobic digesters treating municipal solid waste andsewage sludge, Biotechnol. Bioeng. 87 (2004) 823–834.
[9] L.A. Fernandez-Güelfo, et al., Start-up of thermophilic-dry anaerobic digestionof OFMSW using adapted modified SEBAC inoculum, Bioresour. Technol. 101(2010) 9031–9039.
10] E. Elbeshbishy, G. Nakhla, H. Hafez, Biochemical methane potential (BMP) offood waste and primary sludge: influence of inoculum pre-incubation andinoculum source, Bioresour. Technol. 110 (2012) 18–25.
11] G. Silvestre, et al., Biomass adaptation over anaerobic co-digestion of sewagesludge and trapped grease waste, Bioresour. Technol. 102 (2011) 6830–6836.
12] P. Lins, et al., Reduction of accumulated volatile fatty acids by an acetate-degrading enrichment culture, FEMS Microbiol. Ecol. 71 (2010) 469–478.
13] P. Lins, C. Reitschuler, P. Illmer, Development and evaluation of inocula combat-ing high acetate concentrations during the start-up of an anaerobic digestion,Bioresour. Technol. 110 (2012) 167–173.
14] J.G. Caporaso, et al., Ultra-high-throughput microbial community analysis onthe Illumina HiSeq and MiSeq platforms, ISME J. 6 (8) (2012) 1621–1624.
15] N. Fierer, et al., Cross-biome metagenomic analyses of soil microbial communi-ties and their functional attributes, Proc. Natl. Acad. Sci. U. S. A. 109 (52) (2012)21390–21395.
16] K.R. Clarke, R.N. Gorley, PRIMER (PRIMER-E, Plymouth, UK), version 6, 2006.17] H.M. Roager, et al., Microbial enterotypes: inferred by the prevotella-to-
bacteroides ratio, remained stable during a 6-month randomized controlleddiet intervention with the new nordic diet, Appl. Environ. Microbiol. 80 (3)(2014) 1142–1149.
18] J.E. Edwards, et al., 16S rDNA library-based analysis of ruminal bacterial diver-
ance of biochar packed bed anaerobic digesters, J. Water Process
sity, Antonie Van Leeuwenhoek 86 (3) (2004) 263–281.19] D.M. Stevenson, P.J. Weimer, Dominance of Prevotella and low abundance
of classical ruminal bacterial species in the bovine rumen revealed byrelative quantification real-time PCR, Appl. Microbiol. Biotechnol. 75 (1) (2007)165–174.

ING ModelJ
ocess
[
[
[
[
[
[
[
[
ARTICLEWPE-100; No. of Pages 7
M.J. Cooney et al. / Journal of Water Pr
20] S.T. Yang, I.C. Tang, M.R. Okos, Kinetics of homoacetic fermentation of lactate byclostridium formicoaceticum, Appl. Environ. Microbiol. 53 (4) (1987) 823–827.
21] P.J. Weimer, J.G. Zeikus, Fermentation of cellulose and cellobiose by Clostridiumthermocellum in the absence of Methanobacterium thermoautotrophicum, Appl.Environ. Microbiol. 33 (2) (1977) 289–297.
22] D.M. Stevenson, P.J. Weimer, Expression of 17 genes in Clostridium thermocel-lum ATCC 27405 during fermentation of cellulose or cellobiose in continuousculture, Appl. Environ. Microbiol. 71 (8) (2005) 4672–4678.
Please cite this article in press as: M.J. Cooney, et al., Start up performEng. (2015), http://dx.doi.org/10.1016/j.jwpe.2014.12.004
23] H.D. Peck, The Atp-dependent reduction of sulfate with hydrogen in extracts ofdesulfovibrio desulfuricans, Proc. Natl. Acad. Sci. U. S. A. 45 (5) (1959) 701–708.
24] G. Hernandez-Eugenio, et al., Sporanaerobacter acetigenes gen. nov., sp. nov.,a novel acetogenic, facultatively sulfur-reducing bacterium, Int. J. Syst. Evol.Microbiol. 52 (Pt 4) (2002) 1217–1223.
[
[
PRESSEngineering xxx (2015) xxx.e1–xxx.e7 xxx.e7
25] A.J. Cavaleiro, D.Z. Sousa, M.M. Alves, Methane production from oleate:assessing the bioaugmentation potential of Syntrophomonas zehnderi, WaterRes. 44 (17) (2010) 4940–4947.
26] D.Z. Sousa, et al., Syntrophomonas zehnderi sp. nov., an anaerobe that degradeslong-chain fatty acids in co-culture with Methanobacterium formicicum, Int. J.Syst. Evol. Microbiol. 57 (Pt 3) (2007) 609–615.
27] D.P. Clark, The fermentation pathways of Escherichia coli, FEMS Microbiol. Rev.5 (3) (1989) 223–234.
ance of biochar packed bed anaerobic digesters, J. Water Process
28] J. Li, et al., Straw- and slurry-associated prokaryotic communities differ duringco-fermentation of straw and swine manure, Appl. Microbiol. Biotechnol. 98(10) (2014) 4771–4780.
29] S. Baena, et al., Aminobacterium mobile sp. nov., a new anaerobic amino-acid-degrading bacterium, Int. J. Syst. Evol. Microbiol. 50 (Pt 1) (2000) 259–264.


