Embed Size (px)
Citation preview
Chemical Geology 270 (2010) 216–226
Contents lists available at ScienceDirect
Chemical Geology
j ourna l homepage: www.e lsev ie r.com/ locate /chemgeo
Stable carbon and oxygen isotopes in Sphagnum fuscum peat from subarctic Canada:Implications for palaeoclimate studies
Päivi Kaislahti Tillman a,⁎, Steffen Holzkämper a,1, Peter Kuhry a,2, A. Britta K. Sannel a,3,Neil J. Loader b,4, Iain Robertson b,5
a Department of Physical Geography and Quaternary Geology, Stockholm University, 106 91 Stockholm, Swedenb Department of Geography, Swansea University, Singleton Park, Swansea SA2 8PP, UK
⁎ Corresponding author. Tel.: +46 8 164961; fax: +4E-mail addresses: [email protected] (P. Ka
[email protected] (S. Holzkämper), Pete(P. Kuhry), [email protected] (A.B.K. Sannel), N(N.J. Loader), [email protected] (I. Robertson)
1 Tel.: +46 8 164891.2 Tel.: +46 8 164806.3 Tel.: +46 8 164795.4 Tel.: +44 1792 295546; fax: +44 1792 295955.5 Tel.: +44 1792 295184; fax: +44 1792 295955.
0009-2541/$ – see front matter © 2009 Elsevier B.V. Adoi:10.1016/j.chemgeo.2009.12.001
a b s t r a c t
a r t i c l e i n f oArticle history:Received 13 July 2009Received in revised form 14 October 2009Accepted 1 December 2009
Editor: B. Bourdon
Keywords:Sphagnum peatStable isotopesCanadian subarcticClimate changePeat decomposition
Stable carbon and oxygen isotope ratios in single plant components in Sphagnum peat have a good potentialto reveal environmental changes in peat archives. Two peat profiles, covering the past ∼6000 years, and aSphagnum hummock from a discontinuous permafrost area in west central Canada were studied in order toevaluate the effect of decomposition rate on isotope records and to assess which plant components are mostsuitable for climate reconstructions. The stable isotope values from the most recently forming Sphagnumtissues were compared with observational climate data to study the impact of variations in temperature andprecipitation on the peat isotopes. Our results show that there is high correlation between δ13C values in α-cellulose isolated from Sphagnum fuscum stems and summer temperatures, whereas δ18O in the plant tissuesis controlled by several factors, such as summer precipitation, summer temperature and evaporation.According to our results, decomposition as derived from C/N values and colorimetry does not seem to affectthe oxygen and carbon isotope values of α-cellulose from Sphagnum fuscum peat significantly. There is,however, a (quasi-) constant offset between the isotope values of branches and stems and between wholeplant material and α-cellulose, which makes it crucial to select single moss-fractions when past climate andenvironmental changes are to be derived from the isotope record.
6 8 164818.islahti Tillman),[email protected]@swansea.ac.uk.
ll rights reserved.
© 2009 Elsevier B.V. All rights reserved.
1. Introduction
Peatlands of the northern hemisphere are possible sources of vastquantities of greenhouse gases to the atmosphere and can thusenhance predicted temperature increases in high latitudes throughpositive feedback mechanisms (Schuur et al., 2009). The role ofvariations in temperature and moisture in permafrost thawing andfollowing decay of soil organicmatter will bemost pronouncedwithinthe discontinuous permafrost zones (Prowse and Ommanney, 1990;Turetsky et al., 2007). On the other hand, the response of vegetationmigration patterns to environmental changes can lead to potentialnegative feedback mechanisms by increasing evapotranspiration and
latent heat loss (Foley et al., 2003) through poleward advance ofboreal ecotones. One way to improve our understanding of Arcticclimate and its feedbackmechanisms is to analyse past environmentalchanges from peat archives with continuous Holocene records, whereanthropogenic imprints are sparse. Plants growing in ombrotrophicbogs assimilate only meteoric water (Charman et al., 1999), contain-ing an isotopic signal that reflects the climate from their growthperiod and the source water isotopic composition. During the lastdecade several studies have demonstrated the potential of stableisotopes (δ18O, δ13C, δ2H) in peat mosses as proxies for environmentalchange, such as temperature, humidity and/or precipitation shifts(Ménot-Combes et al., 2002; Sharma et al., 2004; Loader et al., 2007;Lamentowicz et al., 2008; Daley et al., 2009; Moschen et al., 2009;Loisel et al., 2009). Still, the interpretation of the isotopic compositionin peat in terms of environmental changes is complicated by thevarying time resolution of peat samples due to uneven growth rates,species-specific differences, poorly known biochemical pathways inplant tissues, and signal preservation in decomposed peat.
Differences in decay rates between plants and species in sameenvironments (Blackford and Chambers, 1993; Charman et al., 1999)could lead to systematic errors for the preservation of the isotopesignal in peat profiles (Loader et al., 2007). The minimum sample sizerequired for isotope analysis limited earlier moss studies to the use of
217P. Kaislahti Tillman et al. / Chemical Geology 270 (2010) 216–226
bulk peat, but recent developments in mass spectrometry haveenabled analyses of single plants and isolated moss components(Loader et al., 2007). Sphagnum fuscum is a favourable species forsingle plant studies for several reasons. It inhibits competition fromother species by building thick mats high above the groundwatertable and creating acidic, relatively dry hummocks (Lindholm, 1990;Rydin and Jeglum, 2006). It also has high accumulation rates due togood preservation although the productivity is lower than for speciesgrowing in hollows, e.g. S. cuspidatum (Gunnarsson, 2005). Further-more, S. fuscum is a common moss species at high latitudes in NorthAmerica, Fennoscandia and Asia (Lindholm, 1990; Andersson et al.,1995), which is a benefit for pan-Arctic environmental studies.
In previous stable isotope studies, the preparation of peat sampleshas mainly followed methods used for vascular plants. Most of thetree-ring studies have traditionally used the cellulose fraction of plantmaterial for isotope analyses. An interlaboratory comparison ofcellulose preparation methods suggested that the use of α-cellulose(alkali insoluble fraction) is preferable to holocellulose (Boettgeret al., 2007). The necessity of cellulose preparation is also debated, asthe procedure is time consuming and requires special laboratoryequipment (Borella et al., 1998; Ménot and Burns, 2001; Cullen andGrierson, 2005). Whole plant material from modern Sphagnumsamples has been used successfully for palaeoclimatic carbon isotopestudies (Ménot and Burns, 2001; Loader et al., 2007; Skrzypek et al.,2007a). However, different decay rates of e.g. lipids and cellulosefractions in whole plants could influence results from palaeosamples,and different decay rates of plant components (branches and stems)may lead to systematic errors caused by the isotopic offset betweenthem (Loader et al., 2007).
Our study focuses on the question which climate parameters showthe highest correlation with oxygen and carbon isotopes in differentfractions of Sphagnum fuscum and on methodological uncertainties,such as isotope fractionation by different plant components and theclimate signal preservation in peat that has formed during theHolocene. The study includes stable isotope (δ13C and δ18O) analysesfrom whole plant and cellulose fraction of S. fuscum stems and
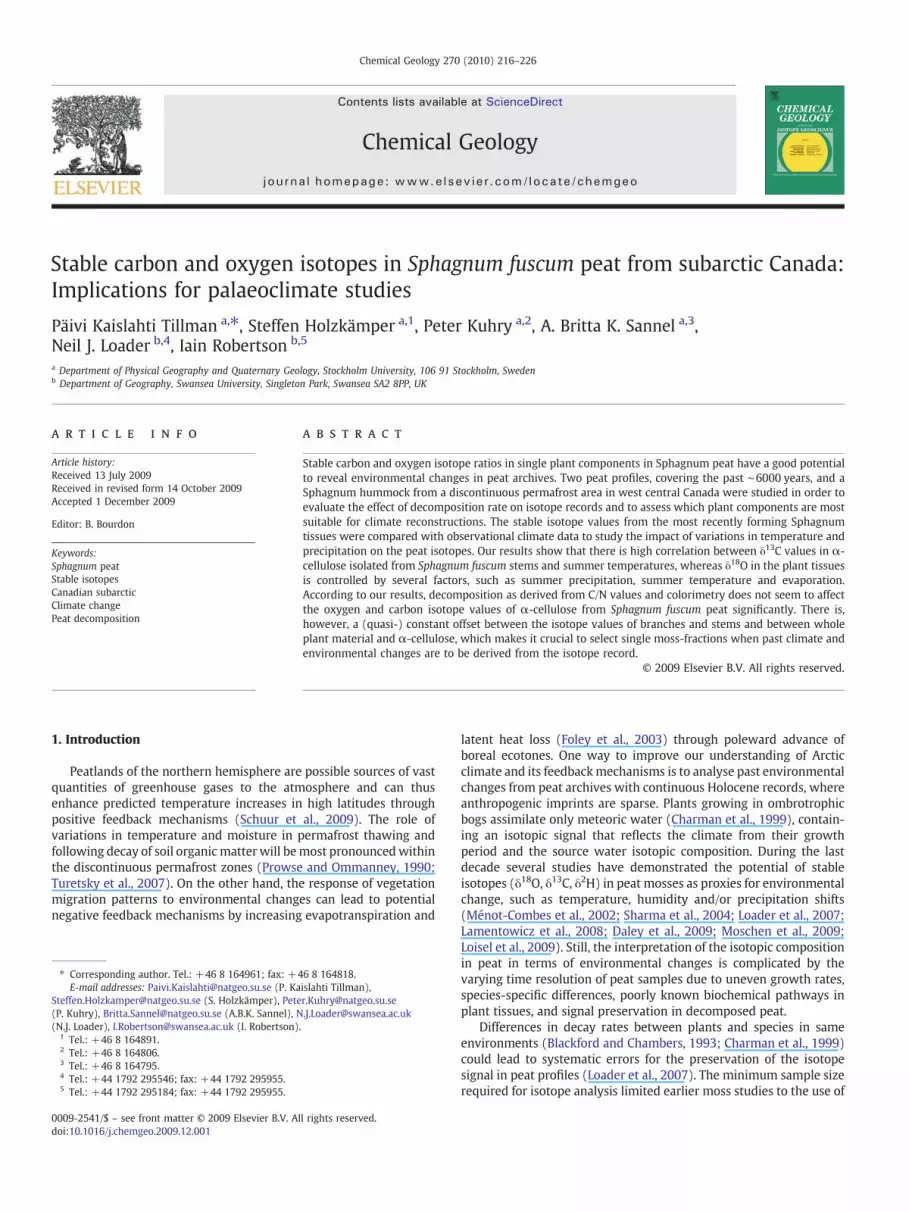
Fig. 1. Sites S52 and S53 are located c. 3 km from each other, close to the south-eastern shordiscontinuous permafrost zone, like the previous study sites. The closest meteorological s(continuous permafrost zone). Present permafrost zones: SPZ=sporadic, DPZ=discontinu
branches, as well as analyses of peat decomposition by colorimetric(humic substances) and geochemical (C/N) methods. Our research isstructured around three key questions:
• What is the impact of peat decay on the stable isotope compositionof Sphagnum fuscum peat?
• Is cellulose purification from Sphagnum mosses necessary for stableisotope studies and which Sphagnum components are most suitablefor palaeoclimate reconstructions?
• Which climate parameters can be reconstructed by the analysis ofoxygen and carbon isotopes in peat?
2. Study area
Thematerial consists of two peat profiles and a hummock sampledwithin the discontinuous permafrost zone (DPZ) in northernSaskatchewan, Canada (Fig. 1). In the DPZ, most of the water bodiesand fens are not underlain by permafrost unlike peat plateaux andpalsas (Zoltai, 1995), where the seasonally unfrozen active layer has athickness from a few tens of centimetres to up to a couple of meters(Davis, 2001). The peat profiles used for our study, S52 (59°52′ N,104°12′ W; 395 m elevation) and S53 (59°55′ N, 104°13′ W; 394 m),were collected in 1993 in the peatlands southeast of Selwyn Lake. S52was cut from a forested peat plateau and profile S53 in a peat plateau/palsa complex. The observed vegetation at the study sites consistedof trees (Picea mariana, Larix laricina), shrubs (Chamaedaphnecalyculata, Ledum sp., L. groenlandicum, Rubus chamaemorus, Oxycoc-cus palustris, Vaccinium uliginosum, V. vitis-idaea), mosses (Sphagnumfuscum, S. rubellum, S. spp., Drepanocladus sp.) sedges (Carex spp.,Eriophorum sp., Equisetum sp.) and unidentified lichen species. In2005, field work was carried out at Misaw Lake c. 90 km east of SelwynLake. The Sphagnum fuscum hummock ML3 (59°52′ N, 102°34′ W;390 m) collected in that year was included in the study. The vegetationaround the hummock consisted of Picea mariana, Betula glandulosa, Le-dum groenlandicum, and Vaccinium vitis-idaea.
e of Selwyn Lake in NE Saskatchewan, Canada. Site ML3 lays c. 90 km east of S52 in thetations to study sites are Stony Rapids (sporadic permafrost zone) and Ennadai Lakeous and CPZ=continuous permafrost zone after Zoltai (1995).
218 P. Kaislahti Tillman et al. / Chemical Geology 270 (2010) 216–226
The closest meteorological stations to our study sites are located150–200 km west–southwest in Stony Rapids and northeast inEnnadai Lake; c. 400–450 km southwest in Cree Lake and west inFort Smith; c. 500 km east–southeast in Churchill and c. 600 kmnortheast in Baker Lake. The locations of stations with regard topermafrost, mean annual temperature and precipitation are given inTable 1.
The oxygen isotope data in precipitation are available from astation in Fort Smith (AD 1962–1965) and from Churchill (AD 1989–1999) (Birks et al., 2004). The most frequent wind directions (AD1971–2000) were from west in Churchill and from southeast in FortSmith (Environment Canada). Generally, the precipitation north of60° N in Canada is dominated by rainfall during the summer months(Prowse and Ommanney, 1990).
3. Materials and methods
3.1. Stratigraphy
The hummock ML3 consists mainly of Sphagnum fuscum from thesurface to 51 cm depth with only minor occurrence of Polytrichum sp.and rootlet peat at 27–35 cm. Rootlet peat dominates below 51 cmand the permafrost table was found at 54 cm depth. The profile S52consists of Sphagnum peat, rootlet peat, lichen and charcoal layers.Samplingwas stopped at 200 cm depth because of rocks and boulders.In profile S53, layers of Sphagnum peat, rootlet peat and charcoallayers were underlain by wood at 119–120 cm depth, by sylvic, sandypeat with charcoal at 120–132 cm, and by boulders below 132 cmdepth.
3.2. Chronology
Five AMS radiocarbon samples based on cleaned and isolatedSphagnum remains have been dated in Poznan Radiocarbon Labora-tory, and added to previously published data by Sannel and Kuhry(2008, 2009). In the previous studies, profiles S52 and S53 wererenamed to SL1 and SL2, respectively, and the depths of SL1 werereduced by 3 cm because of fresh lichen content at 0–3 cm depth. Inthis study, the profile names follow field notes with original depths.The program OxCal 4.0 (Bronk Ramsey, 2007) was used to calibratethe radiocarbon dates. The age models of the profiles were developedbased upon linear regression and best fit between means of either thewhole calibrated 2σ interval or the mean of a distinct peak coveringmore than 68% of the 2σ interval, +/− the rest of the interval(Appendix A).
The upper part (41 cm) of the hummock ML3 was dated in theEnvironmental Change Research Centre, University College London(UCL). Peat samples were analysed for 210Pb, 226Ra, 137Cs and 241Amby direct gamma assay using ORTEC HPGe GWL series well-typecoaxial low background intrinsic germanium detector. Corrections for
Table 1Location of meteorological stations, mean annual temperatures (MAT) and mean annual pr* From Fort Smith, temperature data were available AD 1928–2003 and precipitation data Asporadic permafrost zone.
Station (zone) Longitude Latitude Elevation P
Cree Lake (SPZ) 107°07′80″W 57°21′00″N 494 m 1Stony Rapids (SPZ) 105°49'80″W 59°15′00″N 245 m 1Fort Smith (SPZ) 111°58′12″ W 60°01′12″ N 203 m 1
1Ennadai Lake (CPZ) 100°52′80″W 61°07′80″N 353 m 1
1Churchill A (CPZ) 94°03′60″ W 58°44′40″ N 29 m 1Baker Lake (CPZ) 96°04′80″ W 64°18′00″ N 18 m 1
1
the effect of self absorption of low energy gamma rays within thesample as well as calculations of the chronological data by using theCRS dating model were made at UCL.
3.3. Plant macrofossil analysis
Sphagnum species in the hummock ML3 and the profile S53 wereidentified from samples diluted in distilled water under the lightmicroscope by stem leafmorphologywith 400×magnification (Lange,1982; Andersson et al., 1995) while manually picking plant tissues forchemical analyses. The method description and results of themacrofossil analysis for the profile S52 are published by Sannel andKuhry (2008).
3.4. Colorimetric analysis (T%) and carbon/nitrogen ratio (C/N)
For colorimetric analysis, bulk peat samples (1–2 cm3) were ovendried at 50 °C before homogenization. From some levels also Sphag-num fuscum branches were selected under a stereomicroscope frombulk material suspended in distilled deionized water (DDW). Themethod described by Blackford and Chambers (1993) was slightlymodified: the sample size was reduced to 50 mg in order to analysesingle plant material and the dilution scheme was modified in thesame proportions. After boiling, samples were centrifuged (10 min,4000 rpm) following Borgmark (2005) and analysed with a UNICAMspectrophotometer at 540 nm wavelength, 4±0.5 h after initialmixing in the alkali solution. The colorimetric results are shown aspercentage transmittance (T%), low values indicating a high degree ofhumification. Colorimetric values were compared with earlierunpublished C/N results for profile S53 and published C/N resultsfor profile S52 (Sannel and Kuhry, 2009). For a detailed methoddescription, see Sannel and Kuhry (2009), who reported an averageuncertainty range of 4.4% for the calculated C/N ratios.
3.5. Stable isotope analysis
Freeze stored bulk peat samples (c. 2 cm3) were suspended inDDW over night and treated in an ultrasonic bath at roomtemperature for 5–10 min. Sphagnum fuscum stems and brancheswere selected under a stereo binocular microscope (20–40× magni-fication) and oven dried at c. 50 °C. Remaining rootlets and otherimpurities were removed. Plant remains were analysed both asuntreated fractions and as cellulose fractions. The isolation of α-cellulose followed the original chemical method (Green, 1963)modified to suite small (moss) samples in Soxhlet extraction vessels(Loader et al., 1997; Daley, 2007). Samples were oxidized toholocellulose five times with c. 5 ml sodium chlorite (NaClO2(solid)
dissolved in DDW acidified with glacial acetic acid, 1.4 w/v%) for atotal of 5 h (approximately 1 h per treatment) in a water bath at 70 °C.Rinsed samples were heated with sodium hydroxide (NaOH 10%m/v)
ecipitation amounts (MAP) for the given periods (Data source: Environment Canada).D 1944–1989 and AD 1999–2003. CPZ stands for continuous permafrost zone, SPZ for
eriod MAT MAP
970–1993 −2.3 °C (1971–2000) 446 mm (1971–2000)960–1978, 1986–2005 −3.3 °C (1987–2002) 430 mm (1987–2002)928–2003*944–1989, 1999–2003
−2.3 °C (1971–2000) 362 mm (1971–2000)
950–1979,998–2005
−9.2 °C (1950–1978) 291 mm (1950–1978)
943–2005 −6.9 °C (1971–2000) 432 mm (1971–2000)946,950–2005
−11.8 °C (1971–2000) 270 mm (1971–2000)
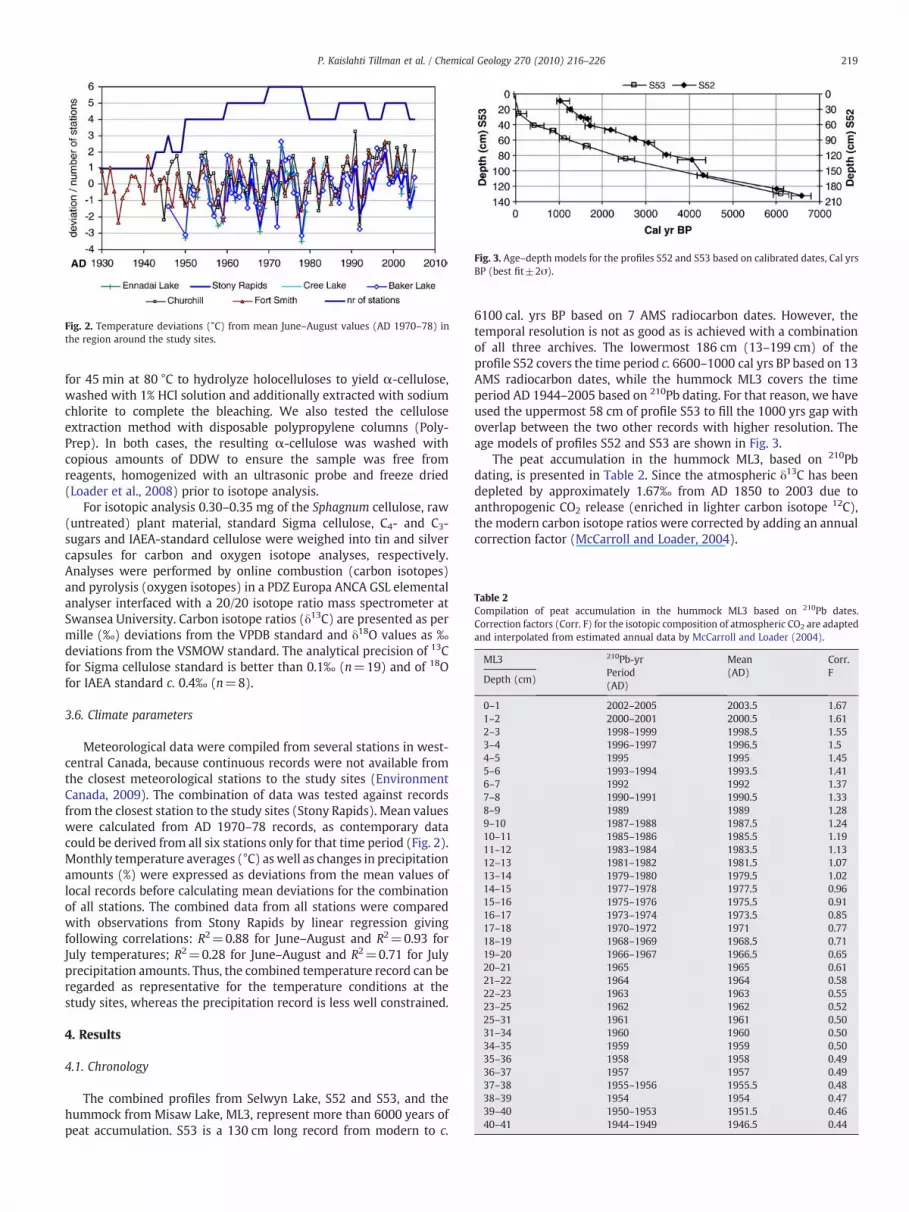
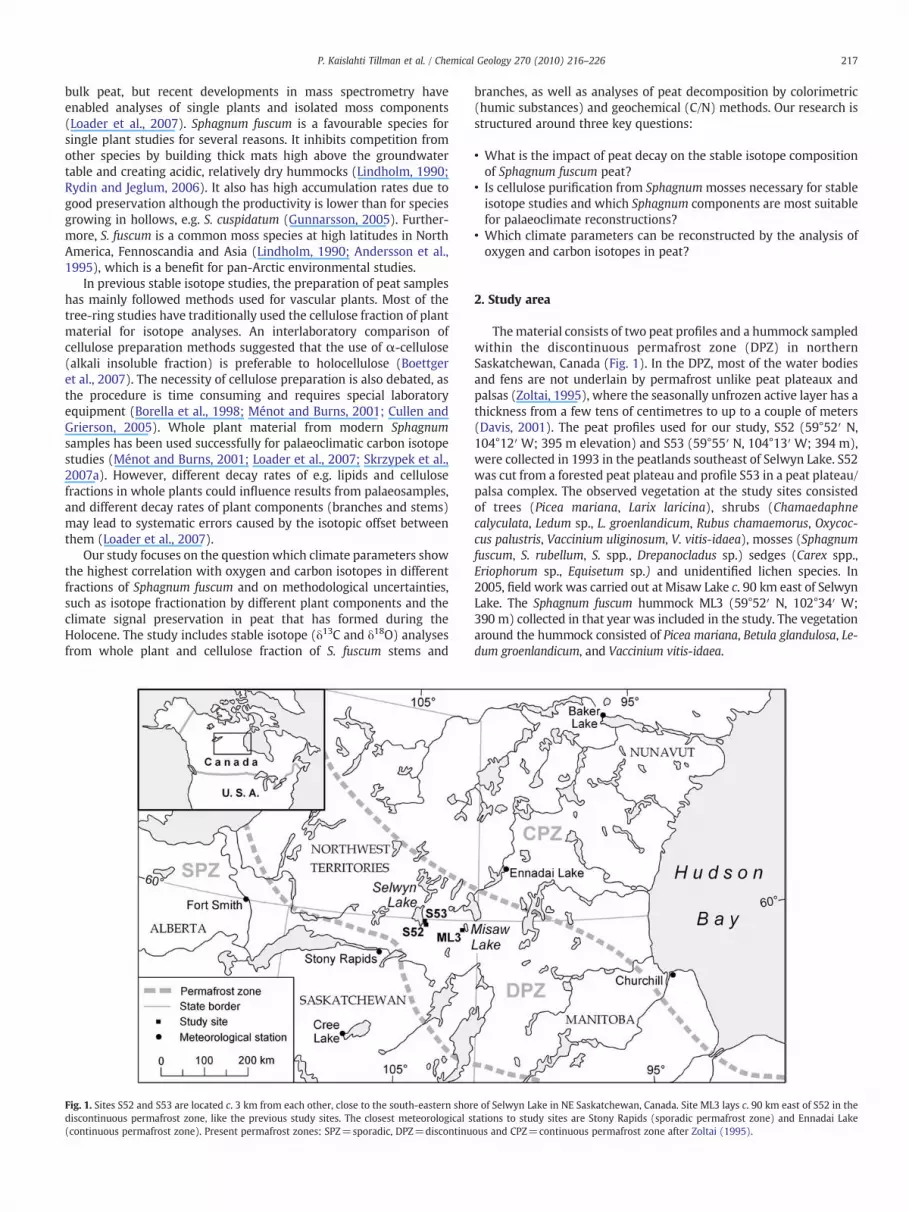
Fig. 2. Temperature deviations (°C) from mean June–August values (AD 1970–78) inthe region around the study sites.
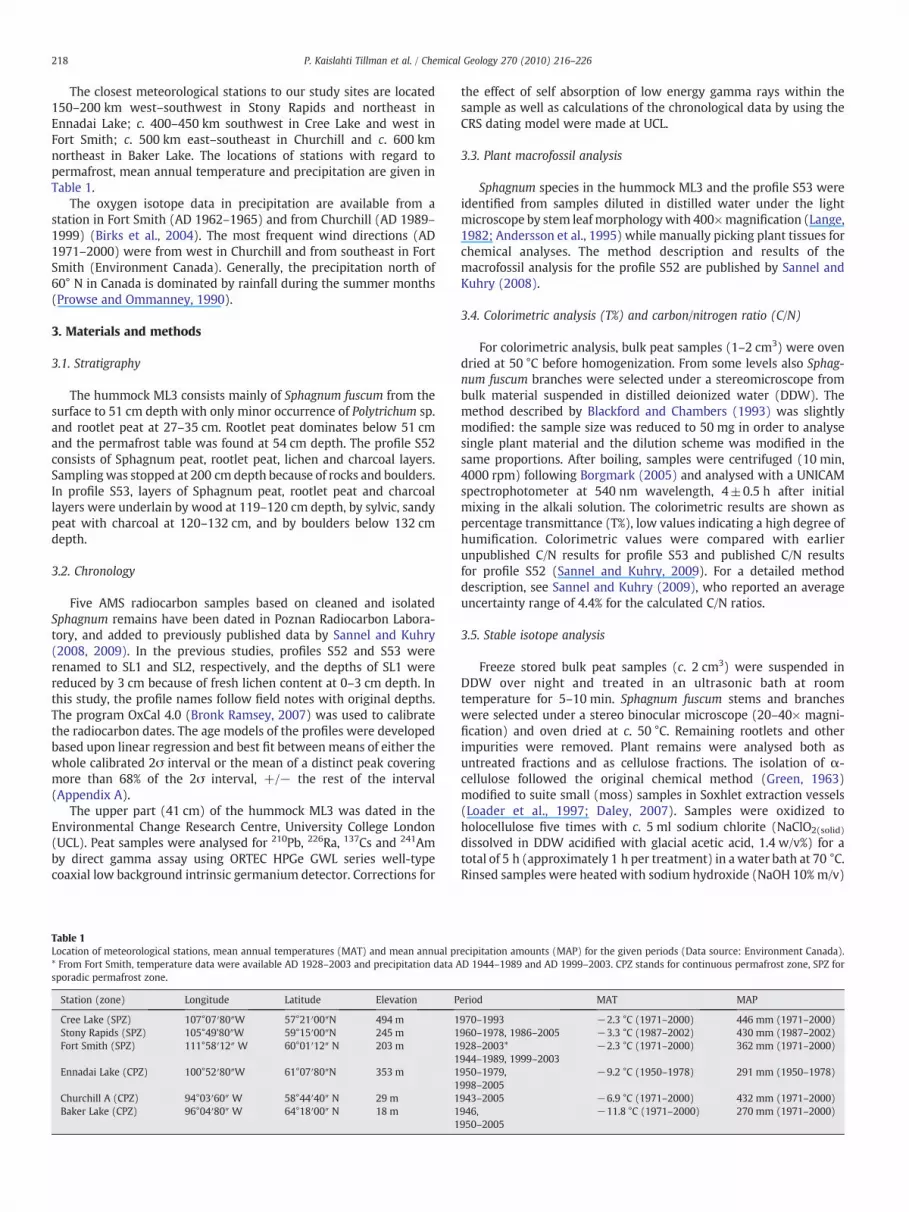
Fig. 3. Age–depth models for the profiles S52 and S53 based on calibrated dates, Cal yrsBP (best fit±2σ).
Table 2Compilation of peat accumulation in the hummock ML3 based on 210Pb dates.Correction factors (Corr. F) for the isotopic composition of atmospheric CO2 are adaptedand interpolated from estimated annual data by McCarroll and Loader (2004).
ML3 210Pb-yrPeriod(AD)
Mean(AD)
Corr.F
Depth (cm)
0–1 2002–2005 2003.5 1.671–2 2000–2001 2000.5 1.612–3 1998–1999 1998.5 1.553–4 1996–1997 1996.5 1.54–5 1995 1995 1.455–6 1993–1994 1993.5 1.416–7 1992 1992 1.377–8 1990–1991 1990.5 1.338–9 1989 1989 1.289–10 1987–1988 1987.5 1.2410–11 1985–1986 1985.5 1.1911–12 1983–1984 1983.5 1.1312–13 1981–1982 1981.5 1.0713–14 1979–1980 1979.5 1.0214–15 1977–1978 1977.5 0.9615–16 1975–1976 1975.5 0.9116–17 1973–1974 1973.5 0.8517–18 1970–1972 1971 0.7718–19 1968–1969 1968.5 0.7119–20 1966–1967 1966.5 0.6520–21 1965 1965 0.6121–22 1964 1964 0.5822–23 1963 1963 0.5523–25 1962 1962 0.5225–31 1961 1961 0.5031–34 1960 1960 0.5034–35 1959 1959 0.5035–36 1958 1958 0.4936–37 1957 1957 0.4937–38 1955–1956 1955.5 0.4838–39 1954 1954 0.4739–40 1950–1953 1951.5 0.4640–41 1944–1949 1946.5 0.44
219P. Kaislahti Tillman et al. / Chemical Geology 270 (2010) 216–226
for 45 min at 80 °C to hydrolyze holocelluloses to yield α-cellulose,washed with 1% HCl solution and additionally extracted with sodiumchlorite to complete the bleaching. We also tested the celluloseextraction method with disposable polypropylene columns (Poly-Prep). In both cases, the resulting α-cellulose was washed withcopious amounts of DDW to ensure the sample was free fromreagents, homogenized with an ultrasonic probe and freeze dried(Loader et al., 2008) prior to isotope analysis.
For isotopic analysis 0.30–0.35 mg of the Sphagnum cellulose, raw(untreated) plant material, standard Sigma cellulose, C4- and C3-sugars and IAEA-standard cellulose were weighed into tin and silvercapsules for carbon and oxygen isotope analyses, respectively.Analyses were performed by online combustion (carbon isotopes)and pyrolysis (oxygen isotopes) in a PDZ Europa ANCA GSL elementalanalyser interfaced with a 20/20 isotope ratio mass spectrometer atSwansea University. Carbon isotope ratios (δ13C) are presented as permille (‰) deviations from the VPDB standard and δ18O values as ‰
deviations from the VSMOW standard. The analytical precision of 13Cfor Sigma cellulose standard is better than 0.1‰ (n=19) and of 18Ofor IAEA standard c. 0.4‰ (n=8).
3.6. Climate parameters
Meteorological data were compiled from several stations in west-central Canada, because continuous records were not available fromthe closest meteorological stations to the study sites (EnvironmentCanada, 2009). The combination of data was tested against recordsfrom the closest station to the study sites (Stony Rapids). Mean valueswere calculated from AD 1970–78 records, as contemporary datacould be derived from all six stations only for that time period (Fig. 2).Monthly temperature averages (°C) as well as changes in precipitationamounts (%) were expressed as deviations from the mean values oflocal records before calculating mean deviations for the combinationof all stations. The combined data from all stations were comparedwith observations from Stony Rapids by linear regression givingfollowing correlations: R2=0.88 for June–August and R2=0.93 forJuly temperatures; R2=0.28 for June–August and R2=0.71 for Julyprecipitation amounts. Thus, the combined temperature record can beregarded as representative for the temperature conditions at thestudy sites, whereas the precipitation record is less well constrained.
4. Results
4.1. Chronology
The combined profiles from Selwyn Lake, S52 and S53, and thehummock from Misaw Lake, ML3, represent more than 6000 years ofpeat accumulation. S53 is a 130 cm long record from modern to c.
6100 cal. yrs BP based on 7 AMS radiocarbon dates. However, thetemporal resolution is not as good as is achieved with a combinationof all three archives. The lowermost 186 cm (13–199 cm) of theprofile S52 covers the time period c. 6600–1000 cal yrs BP based on 13AMS radiocarbon dates, while the hummock ML3 covers the timeperiod AD 1944–2005 based on 210Pb dating. For that reason, we haveused the uppermost 58 cm of profile S53 to fill the 1000 yrs gap withoverlap between the two other records with higher resolution. Theage models of profiles S52 and S53 are shown in Fig. 3.
The peat accumulation in the hummock ML3, based on 210Pbdating, is presented in Table 2. Since the atmospheric δ13C has beendepleted by approximately 1.67‰ from AD 1850 to 2003 due toanthropogenic CO2 release (enriched in lighter carbon isotope 12C),the modern carbon isotope ratios were corrected by adding an annualcorrection factor (McCarroll and Loader, 2004).
220 P. Kaislahti Tillman et al. / Chemical Geology 270 (2010) 216–226
4.2. Gross stratigraphies
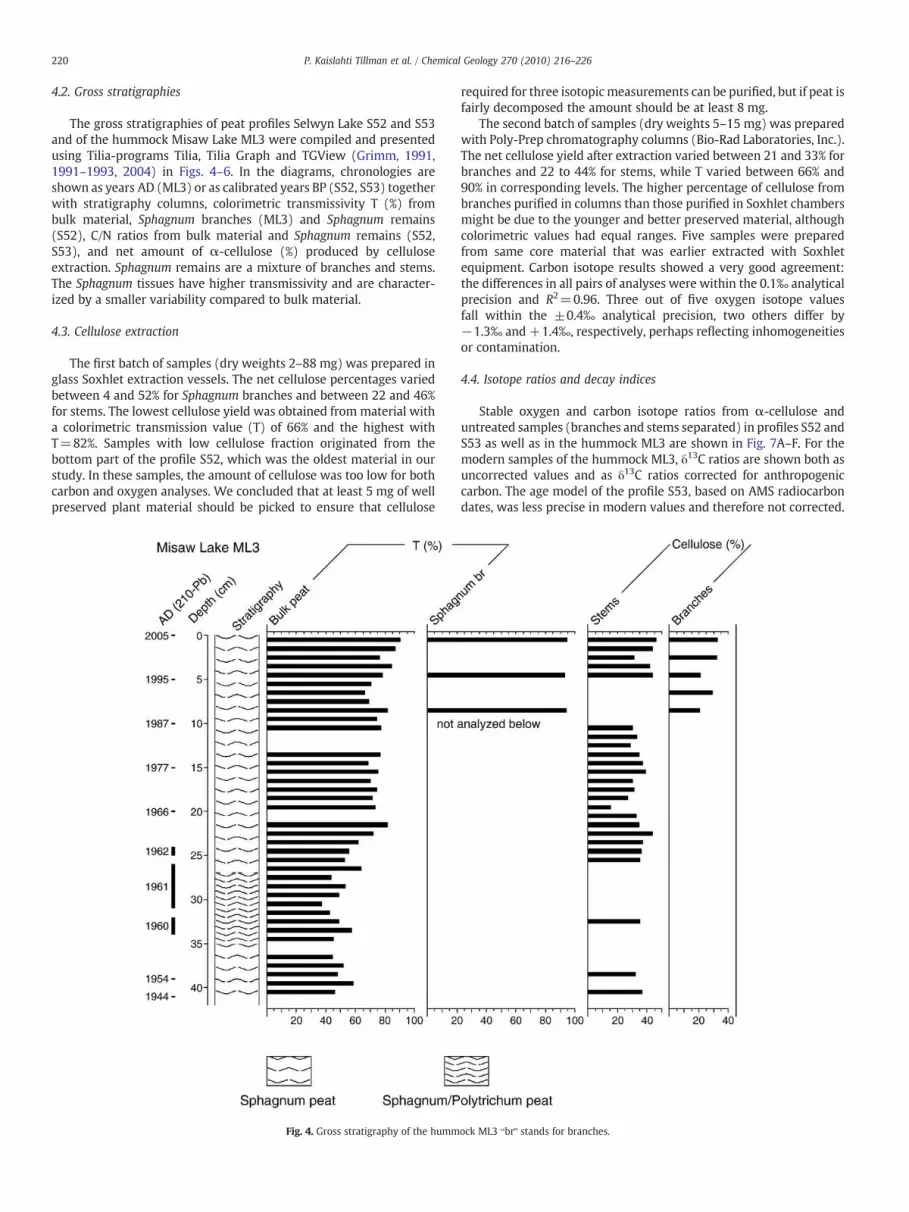
The gross stratigraphies of peat profiles Selwyn Lake S52 and S53and of the hummock Misaw Lake ML3 were compiled and presentedusing Tilia-programs Tilia, Tilia Graph and TGView (Grimm, 1991,1991–1993, 2004) in Figs. 4–6. In the diagrams, chronologies areshown as years AD (ML3) or as calibrated years BP (S52, S53) togetherwith stratigraphy columns, colorimetric transmissivity T (%) frombulk material, Sphagnum branches (ML3) and Sphagnum remains(S52), C/N ratios from bulk material and Sphagnum remains (S52,S53), and net amount of α-cellulose (%) produced by celluloseextraction. Sphagnum remains are a mixture of branches and stems.The Sphagnum tissues have higher transmissivity and are character-ized by a smaller variability compared to bulk material.
4.3. Cellulose extraction
The first batch of samples (dry weights 2–88 mg) was prepared inglass Soxhlet extraction vessels. The net cellulose percentages variedbetween 4 and 52% for Sphagnum branches and between 22 and 46%for stems. The lowest cellulose yield was obtained from material witha colorimetric transmission value (T) of 66% and the highest withT=82%. Samples with low cellulose fraction originated from thebottom part of the profile S52, which was the oldest material in ourstudy. In these samples, the amount of cellulose was too low for bothcarbon and oxygen analyses. We concluded that at least 5 mg of wellpreserved plant material should be picked to ensure that cellulose
Fig. 4. Gross stratigraphy of the humm
required for three isotopicmeasurements can be purified, but if peat isfairly decomposed the amount should be at least 8 mg.
The second batch of samples (dry weights 5–15 mg) was preparedwith Poly-Prep chromatography columns (Bio-Rad Laboratories, Inc.).The net cellulose yield after extraction varied between 21 and 33% forbranches and 22 to 44% for stems, while T varied between 66% and90% in corresponding levels. The higher percentage of cellulose frombranches purified in columns than those purified in Soxhlet chambersmight be due to the younger and better preserved material, althoughcolorimetric values had equal ranges. Five samples were preparedfrom same core material that was earlier extracted with Soxhletequipment. Carbon isotope results showed a very good agreement:the differences in all pairs of analyses were within the 0.1‰ analyticalprecision and R2=0.96. Three out of five oxygen isotope valuesfall within the ±0.4‰ analytical precision, two others differ by−1.3‰ and +1.4‰, respectively, perhaps reflecting inhomogeneitiesor contamination.
4.4. Isotope ratios and decay indices
Stable oxygen and carbon isotope ratios from α-cellulose anduntreated samples (branches and stems separated) in profiles S52 andS53 as well as in the hummock ML3 are shown in Fig. 7A–F. For themodern samples of the hummock ML3, δ13C ratios are shown both asuncorrected values and as δ13C ratios corrected for anthropogeniccarbon. The age model of the profile S53, based on AMS radiocarbondates, was less precise in modern values and therefore not corrected.
ock ML3 bbrQ stands for branches.
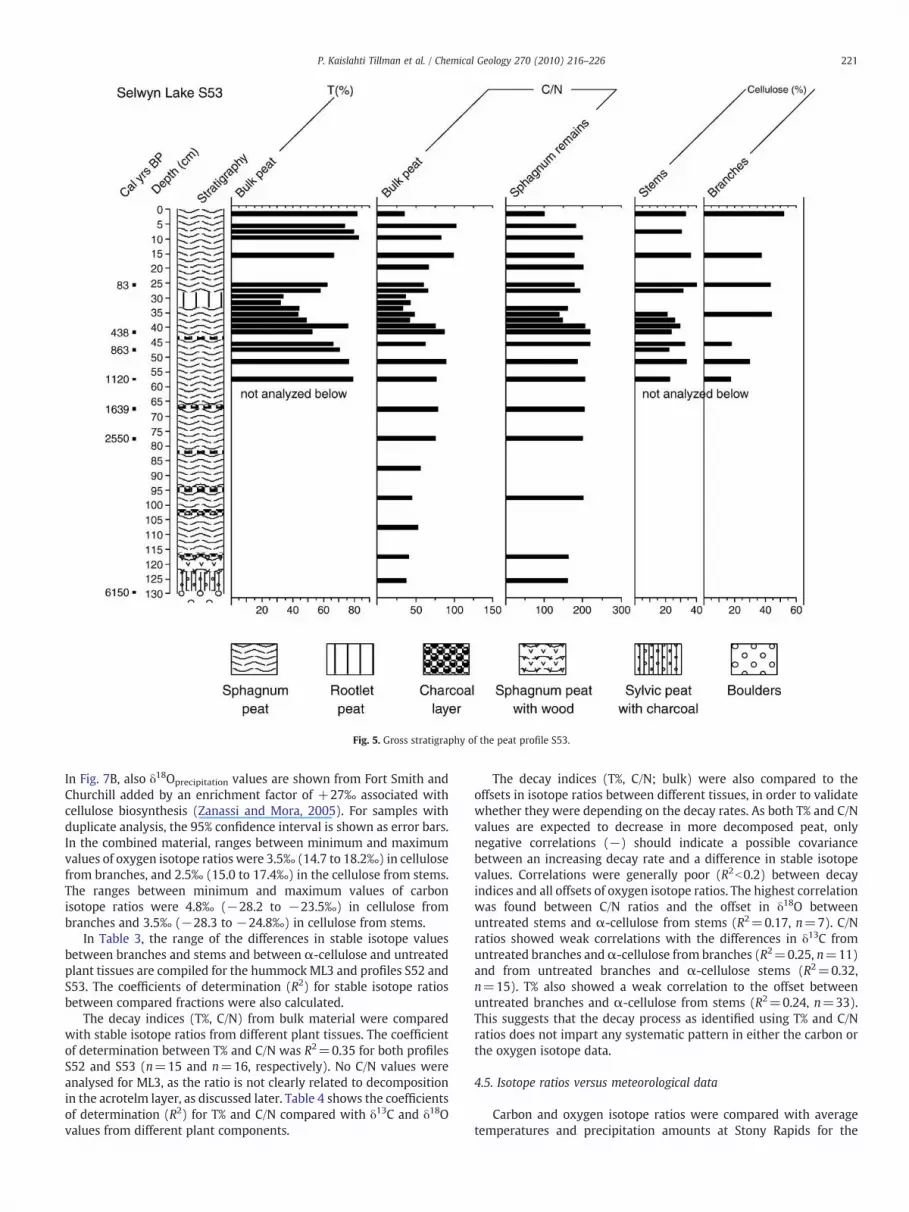
Fig. 5. Gross stratigraphy of the peat profile S53.
221P. Kaislahti Tillman et al. / Chemical Geology 270 (2010) 216–226
In Fig. 7B, also δ18Oprecipitation values are shown from Fort Smith andChurchill added by an enrichment factor of +27‰ associated withcellulose biosynthesis (Zanassi and Mora, 2005). For samples withduplicate analysis, the 95% confidence interval is shown as error bars.In the combined material, ranges between minimum and maximumvalues of oxygen isotope ratios were 3.5‰ (14.7 to 18.2‰) in cellulosefrom branches, and 2.5‰ (15.0 to 17.4‰) in the cellulose from stems.The ranges between minimum and maximum values of carbonisotope ratios were 4.8‰ (−28.2 to −23.5‰) in cellulose frombranches and 3.5‰ (−28.3 to −24.8‰) in cellulose from stems.
In Table 3, the range of the differences in stable isotope valuesbetween branches and stems and between α-cellulose and untreatedplant tissues are compiled for the hummock ML3 and profiles S52 andS53. The coefficients of determination (R2) for stable isotope ratiosbetween compared fractions were also calculated.
The decay indices (T%, C/N) from bulk material were comparedwith stable isotope ratios from different plant tissues. The coefficientof determination between T% and C/N was R2=0.35 for both profilesS52 and S53 (n=15 and n=16, respectively). No C/N values wereanalysed for ML3, as the ratio is not clearly related to decompositionin the acrotelm layer, as discussed later. Table 4 shows the coefficientsof determination (R2) for T% and C/N compared with δ13C and δ18Ovalues from different plant components.
The decay indices (T%, C/N; bulk) were also compared to theoffsets in isotope ratios between different tissues, in order to validatewhether they were depending on the decay rates. As both T% and C/Nvalues are expected to decrease in more decomposed peat, onlynegative correlations (−) should indicate a possible covariancebetween an increasing decay rate and a difference in stable isotopevalues. Correlations were generally poor (R2b0.2) between decayindices and all offsets of oxygen isotope ratios. The highest correlationwas found between C/N ratios and the offset in δ18O betweenuntreated stems and α-cellulose from stems (R2=0.17, n=7). C/Nratios showed weak correlations with the differences in δ13C fromuntreated branches andα-cellulose from branches (R2=0.25, n=11)and from untreated branches and α-cellulose stems (R2=0.32,n=15). T% also showed a weak correlation to the offset betweenuntreated branches and α-cellulose from stems (R2=0.24, n=33).This suggests that the decay process as identified using T% and C/Nratios does not impart any systematic pattern in either the carbon orthe oxygen isotope data.
4.5. Isotope ratios versus meteorological data
Carbon and oxygen isotope ratios were compared with averagetemperatures and precipitation amounts at Stony Rapids for the

Fig. 6. Gross stratigraphy of the peat profile S52.
222 P. Kaislahti Tillman et al. / Chemical Geology 270 (2010) 216–226
periods May–September, June–August, June–September and July forthe time interval AD 1987–2005. The best correlation (R2=0.60,p=0.009) between carbon isotope ratios andmean temperatures wasfound for the cellulose stem fraction and July averages (Fig. 8A). Nocorrelation was found between the cellulose from stems andprecipitation amounts (Fig. 8B), but there was a weak positivecorrelation between the cellulose from branches and July sums(R2=0.27, p=0.12). Oxygen isotope ratios in the cellulose fromstems had a weaker correlation with July temperatures (R2=0.38,p=0.058) than carbon isotope ratios, and approximately the samepositive correlation with precipitation amounts between cellulosefrom branches and July averages (R2=0.28, p=0.12).
The observed temperatures and precipitation amounts werecalculated as average deviations from mean values from Cree Lake,Stony Rapids, Ennadai Lake, Churchill, Baker Lake and Fort Smithbetween AD 1970 and 1978.The trend lines of deviations from July andJune–August temperature averages and from the carbon isotope ratioaverages in the same period are shown in Fig. 9. In a 50 year period, thetrend lines show an increase of δ13C values by 0.96‰ and an averagetemperature change of +0.92 °C in June–August and +0.91 °C in July.Compared to the temperature curves, the stable isotope curve issmoothed due to the lower than annual time resolution.
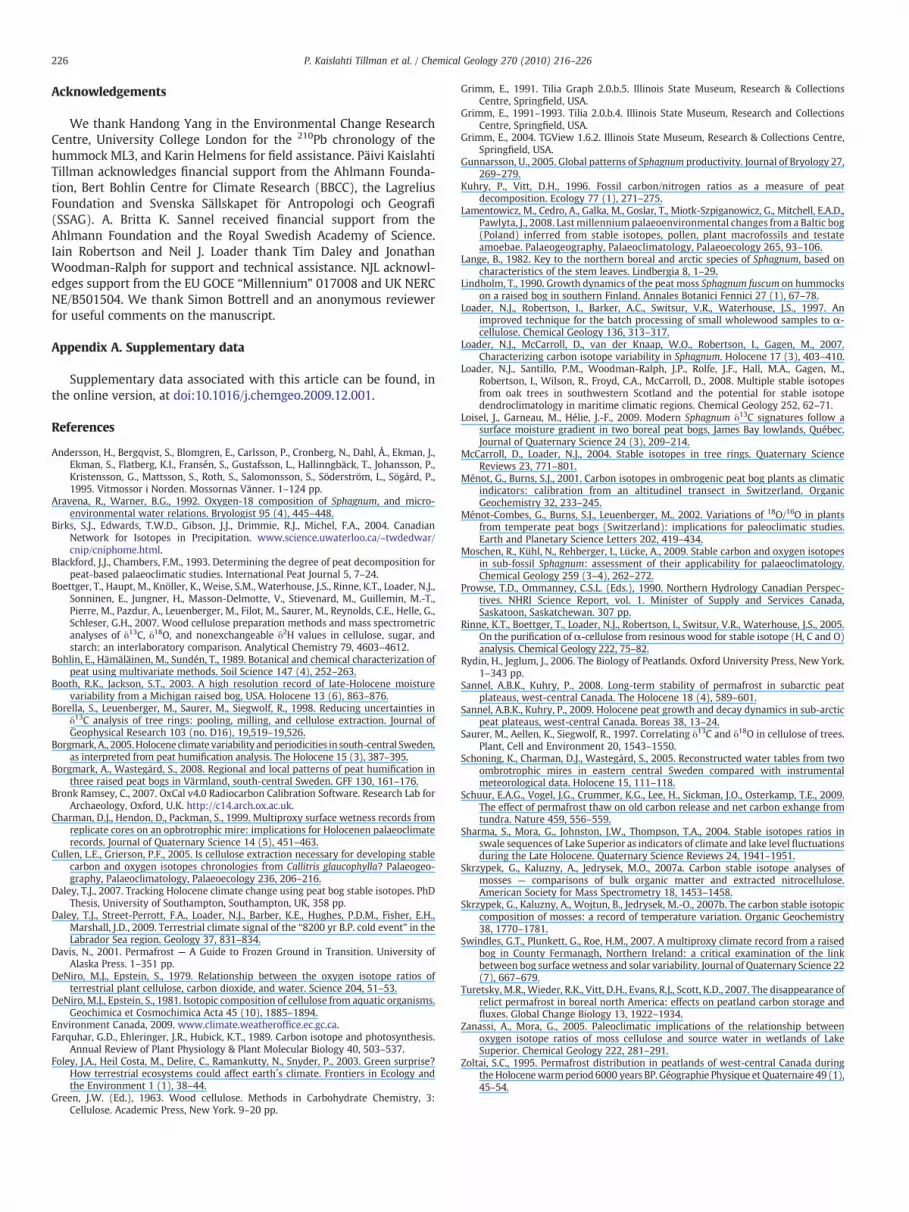
According to the trend line (Fig. 10), July precipitation increasedby c. 12% between AD 1950 and 2000. The oxygen isotope ratiosfollow the pattern of changes in summer precipitation amounts ratherthan summer temperatures, but the trend line does not show thesame increasing trend as both temperature and precipitation.
5. Discussion
The macrofossil study is crucial prior to a single plant study ofstable isotopes, because it has been shown that heavy oxygen isotopesbecome more enriched in Sphagnum species growing in relativelydrier hummocks than in those growing in hollows, while heavycarbon isotopes are enriched in species growing closer to the watertable (Aravena andWarner, 1992; Ménot-Combes et al., 2002; Zanassiand Mora, 2005; Loisel et al., 2009). The study material from the peatprofiles in this study was rather well preserved facilitating themorphological identification of Sphagnum fuscum tissues in oursamples. According to plant macrofossil analysis no other Sphagnumspecies than S. fuscum (section Acutifolia) were found, except S. cf.jensenii (section Cuspidata) at 161–162 cm level in profile S52. Theaccuracy of identificationmay diminishwith an increasing rate of peatdecomposition. A possible confusion might be with other speciesbelonging to the section Acutifolia with similar leave size, morphologyand geographic distribution (Andersson et al., 1995).
Compared to branches, stems were easier to pick withoutcontamination of small rootlets and decomposed material that wasobscured between bigger branch leaves. It has been shown earlier thatthere are differences between stable isotope values from individualplant components (Loader et al., 2007) and the need for homogeneitywithin cellulose samples has been stressed (Rinne et al., 2005; Loaderet al., 2007). Our results for replicate analyses show less variability forbranches in comparison to stems, probably because the picking of alarge number of branches and leaves is necessary for each analysis due
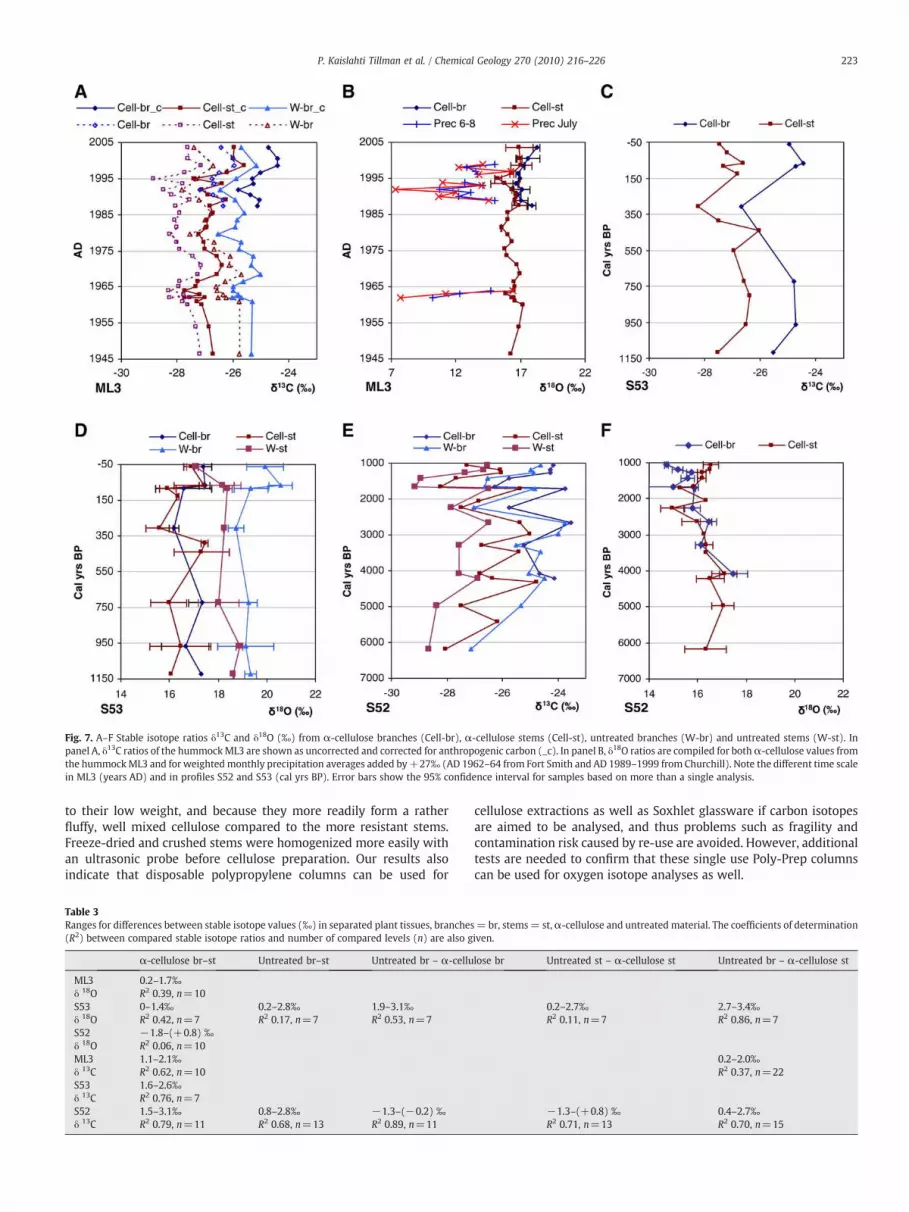
Fig. 7. A–F Stable isotope ratios δ13C and δ18O (‰) from α-cellulose branches (Cell-br), α-cellulose stems (Cell-st), untreated branches (W-br) and untreated stems (W-st). Inpanel A, δ13C ratios of the hummockML3 are shown as uncorrected and corrected for anthropogenic carbon (_c). In panel B, δ18O ratios are compiled for bothα-cellulose values fromthe hummockML3 and for weightedmonthly precipitation averages added by+27‰ (AD 1962–64 from Fort Smith and AD 1989–1999 from Churchill). Note the different time scalein ML3 (years AD) and in profiles S52 and S53 (cal yrs BP). Error bars show the 95% confidence interval for samples based on more than a single analysis.
223P. Kaislahti Tillman et al. / Chemical Geology 270 (2010) 216–226
to their low weight, and because they more readily form a ratherfluffy, well mixed cellulose compared to the more resistant stems.Freeze-dried and crushed stems were homogenized more easily withan ultrasonic probe before cellulose preparation. Our results alsoindicate that disposable polypropylene columns can be used for
Table 3Ranges for differences between stable isotope values (‰) in separated plant tissues, branches(R2) between compared stable isotope ratios and number of compared levels (n) are also g
α-cellulose br–st Untreated br–st Untreated br – α-cellu
ML3 0.2–1.7‰δ 18O R2 0.39, n=10S53 0–1.4‰ 0.2–2.8‰ 1.9–3.1‰δ 18O R2 0.42, n=7 R2 0.17, n=7 R2 0.53, n=7S52 −1.8–(+0.8) ‰δ 18O R2 0.06, n=10ML3 1.1–2.1‰δ 13C R2 0.62, n=10S53 1.6–2.6‰δ 13C R2 0.76, n=7S52 1.5–3.1‰ 0.8–2.8‰ −1.3–(−0.2) ‰δ 13C R2 0.79, n=11 R2 0.68, n=13 R2 0.89, n=11
cellulose extractions as well as Soxhlet glassware if carbon isotopesare aimed to be analysed, and thus problems such as fragility andcontamination risk caused by re-use are avoided. However, additionaltests are needed to confirm that these single use Poly-Prep columnscan be used for oxygen isotope analyses as well.
=br, stems= st,α-cellulose and untreated material. The coefficients of determinationiven.
lose br Untreated st – α-cellulose st Untreated br – α-cellulose st
0.2–2.7‰ 2.7–3.4‰R2 0.11, n=7 R2 0.86, n=7
0.2–2.0‰R2 0.37, n=22
−1.3–(+0.8) ‰ 0.4–2.7‰R2 0.71, n=13 R2 0.70, n=15
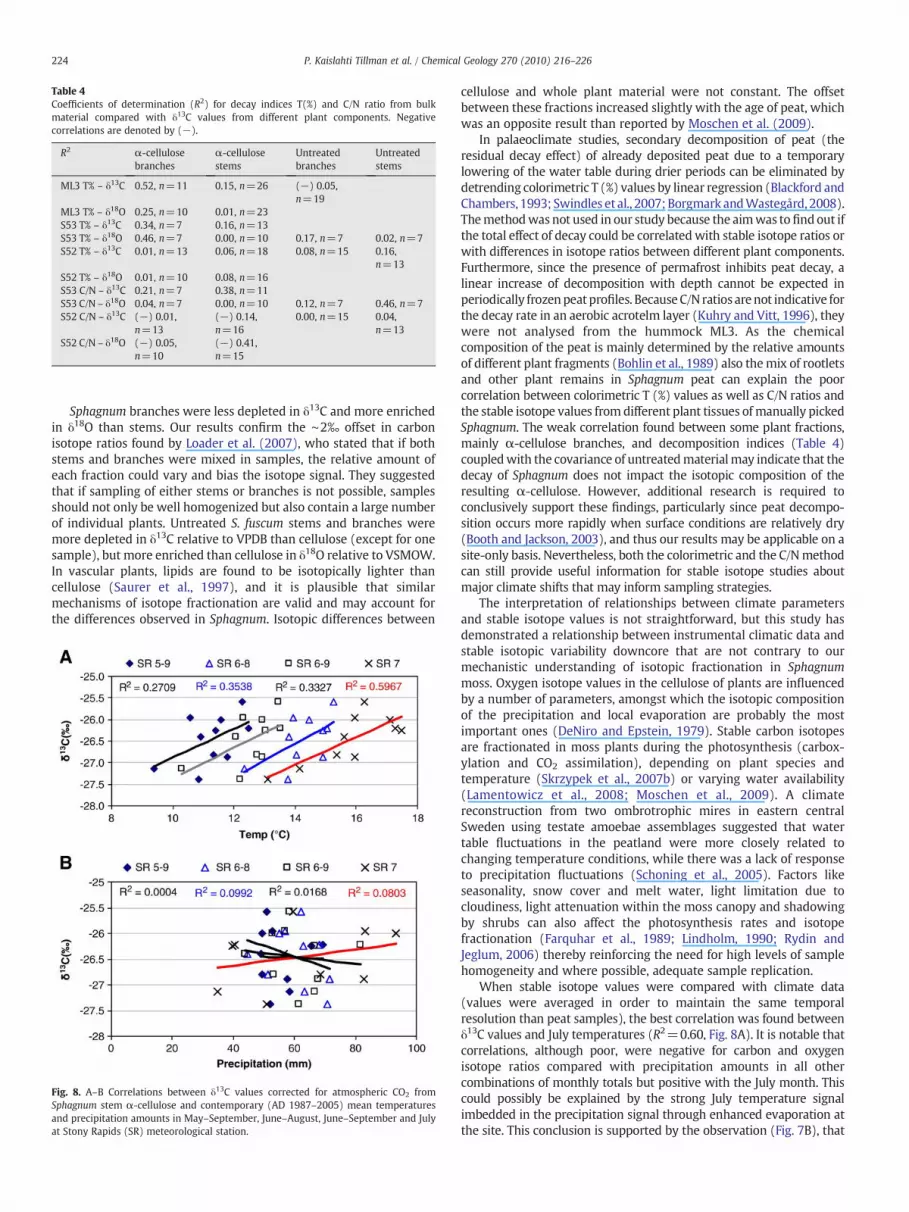
Table 4Coefficients of determination (R2) for decay indices T(%) and C/N ratio from bulkmaterial compared with δ13C values from different plant components. Negativecorrelations are denoted by (−).
R2 α-cellulose α-cellulose Untreated Untreatedstemsbranches stems branches
ML3 T% – δ13C 0.52, n=11 0.15, n=26 (−) 0.05,n=19
ML3 T% – δ18O 0.25, n=10 0.01, n=23S53 T% – δ13C 0.34, n=7 0.16, n=13S53 T% – δ18O 0.46, n=7 0.00, n=10 0.17, n=7 0.02, n=7S52 T% – δ13C 0.01, n=13 0.06, n=18 0.08, n=15 0.16,
n=13S52 T% – δ18O 0.01, n=10 0.08, n=16S53 C/N – δ13C 0.21, n=7 0.38, n=11S53 C/N – δ18O 0.04, n=7 0.00, n=10 0.12, n=7 0.46, n=7S52 C/N – δ13C (−) 0.01,
n=13(−) 0.14,n=16
0.00, n=15 0.04,n=13
S52 C/N – δ18O (−) 0.05,n=10
(−) 0.41,n=15
224 P. Kaislahti Tillman et al. / Chemical Geology 270 (2010) 216–226
Sphagnum branches were less depleted in δ13C and more enrichedin δ18O than stems. Our results confirm the ∼2‰ offset in carbonisotope ratios found by Loader et al. (2007), who stated that if bothstems and branches were mixed in samples, the relative amount ofeach fraction could vary and bias the isotope signal. They suggestedthat if sampling of either stems or branches is not possible, samplesshould not only be well homogenized but also contain a large numberof individual plants. Untreated S. fuscum stems and branches weremore depleted in δ13C relative to VPDB than cellulose (except for onesample), but more enriched than cellulose in δ18O relative to VSMOW.In vascular plants, lipids are found to be isotopically lighter thancellulose (Saurer et al., 1997), and it is plausible that similarmechanisms of isotope fractionation are valid and may account forthe differences observed in Sphagnum. Isotopic differences between
Fig. 8. A–B Correlations between δ13C values corrected for atmospheric CO2 fromSphagnum stem α-cellulose and contemporary (AD 1987–2005) mean temperaturesand precipitation amounts in May–September, June–August, June–September and Julyat Stony Rapids (SR) meteorological station.
cellulose and whole plant material were not constant. The offsetbetween these fractions increased slightly with the age of peat, whichwas an opposite result than reported by Moschen et al. (2009).
In palaeoclimate studies, secondary decomposition of peat (theresidual decay effect) of already deposited peat due to a temporarylowering of the water table during drier periods can be eliminated bydetrending colorimetric T (%) values by linear regression (Blackford andChambers, 1993; Swindles et al., 2007;Borgmark andWastegård, 2008).Themethodwas not used in our study because the aimwas tofindout ifthe total effect of decay could be correlatedwith stable isotope ratios orwith differences in isotope ratios between different plant components.Furthermore, since the presence of permafrost inhibits peat decay, alinear increase of decomposition with depth cannot be expected inperiodically frozenpeat profiles. BecauseC/N ratios are not indicative forthe decay rate in an aerobic acrotelm layer (Kuhry and Vitt, 1996), theywere not analysed from the hummock ML3. As the chemicalcomposition of the peat is mainly determined by the relative amountsof different plant fragments (Bohlin et al., 1989) also themix of rootletsand other plant remains in Sphagnum peat can explain the poorcorrelation between colorimetric T (%) values as well as C/N ratios andthe stable isotope values from different plant tissues of manually pickedSphagnum. The weak correlation found between some plant fractions,mainly α-cellulose branches, and decomposition indices (Table 4)coupledwith the covariance of untreatedmaterialmay indicate that thedecay of Sphagnum does not impact the isotopic composition of theresulting α-cellulose. However, additional research is required toconclusively support these findings, particularly since peat decompo-sition occurs more rapidly when surface conditions are relatively dry(Booth and Jackson, 2003), and thus our results may be applicable on asite-only basis. Nevertheless, both the colorimetric and the C/Nmethodcan still provide useful information for stable isotope studies aboutmajor climate shifts that may inform sampling strategies.
The interpretation of relationships between climate parametersand stable isotope values is not straightforward, but this study hasdemonstrated a relationship between instrumental climatic data andstable isotopic variability downcore that are not contrary to ourmechanistic understanding of isotopic fractionation in Sphagnummoss. Oxygen isotope values in the cellulose of plants are influencedby a number of parameters, amongst which the isotopic compositionof the precipitation and local evaporation are probably the mostimportant ones (DeNiro and Epstein, 1979). Stable carbon isotopesare fractionated in moss plants during the photosynthesis (carbox-ylation and CO2 assimilation), depending on plant species andtemperature (Skrzypek et al., 2007b) or varying water availability(Lamentowicz et al., 2008; Moschen et al., 2009). A climatereconstruction from two ombrotrophic mires in eastern centralSweden using testate amoebae assemblages suggested that watertable fluctuations in the peatland were more closely related tochanging temperature conditions, while there was a lack of responseto precipitation fluctuations (Schoning et al., 2005). Factors likeseasonality, snow cover and melt water, light limitation due tocloudiness, light attenuation within the moss canopy and shadowingby shrubs can also affect the photosynthesis rates and isotopefractionation (Farquhar et al., 1989; Lindholm, 1990; Rydin andJeglum, 2006) thereby reinforcing the need for high levels of samplehomogeneity and where possible, adequate sample replication.
When stable isotope values were compared with climate data(values were averaged in order to maintain the same temporalresolution than peat samples), the best correlation was found betweenδ13C values and July temperatures (R2=0.60, Fig. 8A). It is notable thatcorrelations, although poor, were negative for carbon and oxygenisotope ratios compared with precipitation amounts in all othercombinations of monthly totals but positive with the July month. Thiscould possibly be explained by the strong July temperature signalimbedded in the precipitation signal through enhanced evaporation atthe site. This conclusion is supported by the observation (Fig. 7B), that
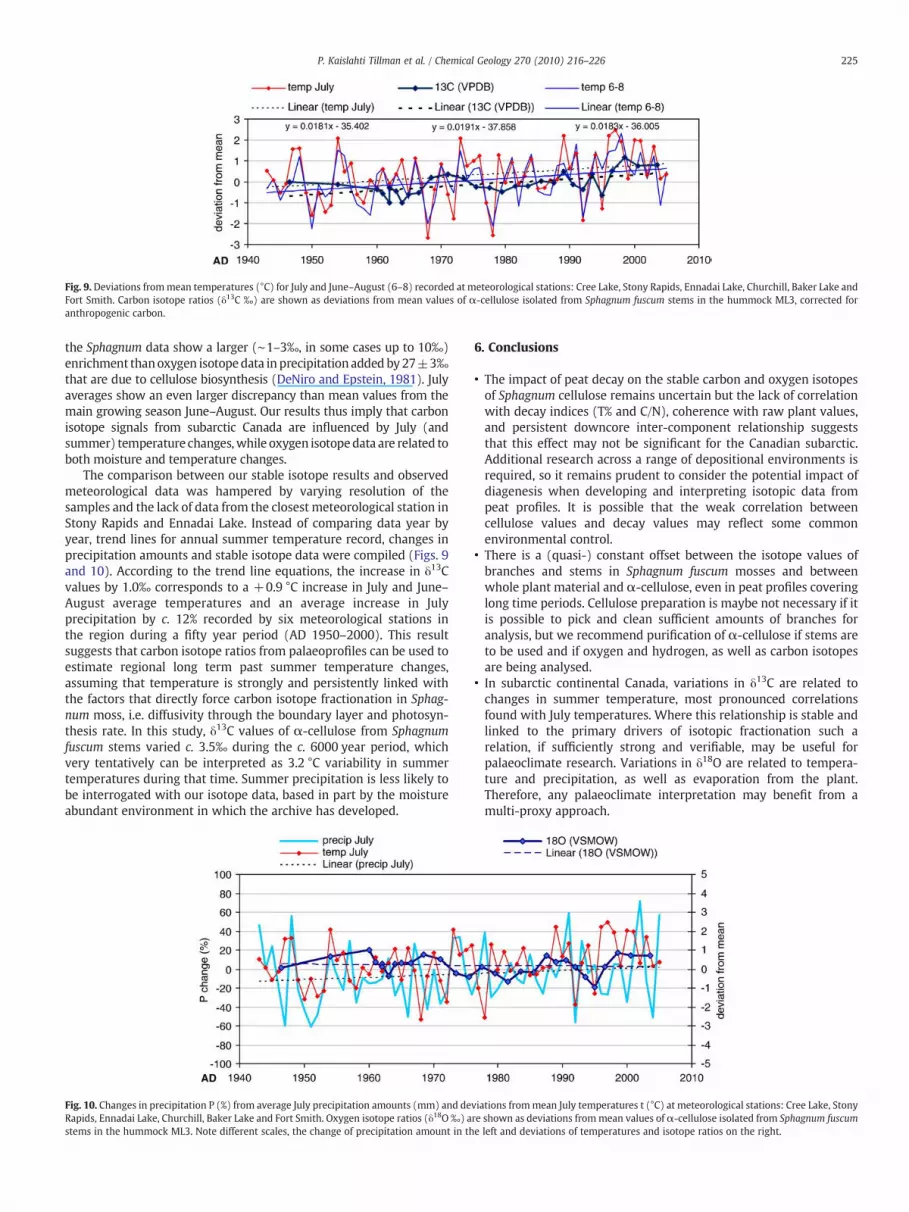
Fig. 9. Deviations frommean temperatures (°C) for July and June–August (6–8) recorded at meteorological stations: Cree Lake, Stony Rapids, Ennadai Lake, Churchill, Baker Lake andFort Smith. Carbon isotope ratios (δ13C ‰) are shown as deviations from mean values of α-cellulose isolated from Sphagnum fuscum stems in the hummock ML3, corrected foranthropogenic carbon.
225P. Kaislahti Tillman et al. / Chemical Geology 270 (2010) 216–226
the Sphagnum data show a larger (∼1–3‰, in some cases up to 10‰)enrichment thanoxygen isotopedata in precipitation added by 27±3‰that are due to cellulose biosynthesis (DeNiro and Epstein, 1981). Julyaverages show an even larger discrepancy than mean values from themain growing season June–August. Our results thus imply that carbonisotope signals from subarctic Canada are influenced by July (andsummer) temperature changes,while oxygen isotopedata are related toboth moisture and temperature changes.
The comparison between our stable isotope results and observedmeteorological data was hampered by varying resolution of thesamples and the lack of data from the closest meteorological station inStony Rapids and Ennadai Lake. Instead of comparing data year byyear, trend lines for annual summer temperature record, changes inprecipitation amounts and stable isotope data were compiled (Figs. 9and 10). According to the trend line equations, the increase in δ13Cvalues by 1.0‰ corresponds to a +0.9 °C increase in July and June–August average temperatures and an average increase in Julyprecipitation by c. 12% recorded by six meteorological stations inthe region during a fifty year period (AD 1950–2000). This resultsuggests that carbon isotope ratios from palaeoprofiles can be used toestimate regional long term past summer temperature changes,assuming that temperature is strongly and persistently linked withthe factors that directly force carbon isotope fractionation in Sphag-num moss, i.e. diffusivity through the boundary layer and photosyn-thesis rate. In this study, δ13C values of α-cellulose from Sphagnumfuscum stems varied c. 3.5‰ during the c. 6000 year period, whichvery tentatively can be interpreted as 3.2 °C variability in summertemperatures during that time. Summer precipitation is less likely tobe interrogated with our isotope data, based in part by the moistureabundant environment in which the archive has developed.
Fig. 10. Changes in precipitation P (%) from average July precipitation amounts (mm) and deRapids, Ennadai Lake, Churchill, Baker Lake and Fort Smith. Oxygen isotope ratios (δ18O‰) astems in the hummock ML3. Note different scales, the change of precipitation amount in th
6. Conclusions
• The impact of peat decay on the stable carbon and oxygen isotopesof Sphagnum cellulose remains uncertain but the lack of correlationwith decay indices (T% and C/N), coherence with raw plant values,and persistent downcore inter-component relationship suggeststhat this effect may not be significant for the Canadian subarctic.Additional research across a range of depositional environments isrequired, so it remains prudent to consider the potential impact ofdiagenesis when developing and interpreting isotopic data frompeat profiles. It is possible that the weak correlation betweencellulose values and decay values may reflect some commonenvironmental control.
• There is a (quasi-) constant offset between the isotope values ofbranches and stems in Sphagnum fuscum mosses and betweenwhole plant material and α-cellulose, even in peat profiles coveringlong time periods. Cellulose preparation is maybe not necessary if itis possible to pick and clean sufficient amounts of branches foranalysis, but we recommend purification of α-cellulose if stems areto be used and if oxygen and hydrogen, as well as carbon isotopesare being analysed.
• In subarctic continental Canada, variations in δ13C are related tochanges in summer temperature, most pronounced correlationsfound with July temperatures. Where this relationship is stable andlinked to the primary drivers of isotopic fractionation such arelation, if sufficiently strong and verifiable, may be useful forpalaeoclimate research. Variations in δ18O are related to tempera-ture and precipitation, as well as evaporation from the plant.Therefore, any palaeoclimate interpretation may benefit from amulti-proxy approach.
viations frommean July temperatures t (°C) at meteorological stations: Cree Lake, Stonyre shown as deviations frommean values of α-cellulose isolated from Sphagnum fuscume left and deviations of temperatures and isotope ratios on the right.
226 P. Kaislahti Tillman et al. / Chemical Geology 270 (2010) 216–226
Acknowledgements
We thank Handong Yang in the Environmental Change ResearchCentre, University College London for the 210Pb chronology of thehummock ML3, and Karin Helmens for field assistance. Päivi KaislahtiTillman acknowledges financial support from the Ahlmann Founda-tion, Bert Bohlin Centre for Climate Research (BBCC), the LagreliusFoundation and Svenska Sällskapet för Antropologi och Geografi(SSAG). A. Britta K. Sannel received financial support from theAhlmann Foundation and the Royal Swedish Academy of Science.Iain Robertson and Neil J. Loader thank Tim Daley and JonathanWoodman-Ralph for support and technical assistance. NJL acknowl-edges support from the EU GOCE “Millennium” 017008 and UK NERCNE/B501504. We thank Simon Bottrell and an anonymous reviewerfor useful comments on the manuscript.
Appendix A. Supplementary data
Supplementary data associated with this article can be found, inthe online version, at doi:10.1016/j.chemgeo.2009.12.001.
References
Andersson, H., Bergqvist, S., Blomgren, E., Carlsson, P., Cronberg, N., Dahl, Å., Ekman, J.,Ekman, S., Flatberg, K.I., Fransén, S., Gustafsson, L., Hallinngbäck, T., Johansson, P.,Kristensson, G., Mattsson, S., Roth, S., Salomonsson, S., Söderström, L., Sögård, P.,1995. Vitmossor i Norden. Mossornas Vänner. 1–124 pp.
Aravena, R., Warner, B.G., 1992. Oxygen-18 composition of Sphagnum, and micro-environmental water relations. Bryologist 95 (4), 445–448.
Birks, S.J., Edwards, T.W.D., Gibson, J.J., Drimmie, R.J., Michel, F.A., 2004. CanadianNetwork for Isotopes in Precipitation. www.science.uwaterloo.ca/~twdedwar/cnip/cniphome.html.
Blackford, J.J., Chambers, F.M., 1993. Determining the degree of peat decomposition forpeat-based palaeoclimatic studies. International Peat Journal 5, 7–24.
Boettger, T., Haupt, M., Knöller, K., Weise, S.M., Waterhouse, J.S., Rinne, K.T., Loader, N.J.,Sonninen, E., Jungner, H., Masson-Delmotte, V., Stievenard, M., Guillemin, M.-T.,Pierre, M., Pazdur, A., Leuenberger, M., Filot, M., Saurer, M., Reynolds, C.E., Helle, G.,Schleser, G.H., 2007. Wood cellulose preparation methods and mass spectrometricanalyses of δ13C, δ18Ο, and nonexchangeable δ2Η values in cellulose, sugar, andstarch: an interlaboratory comparison. Analytical Chemistry 79, 4603–4612.
Bohlin, E., Hämäläinen, M., Sundén, T., 1989. Botanical and chemical characterization ofpeat using multivariate methods. Soil Science 147 (4), 252–263.
Booth, R.K., Jackson, S.T., 2003. A high resolution record of late-Holocene moisturevariability from a Michigan raised bog, USA. Holocene 13 (6), 863–876.
Borella, S., Leuenberger, M., Saurer, M., Siegwolf, R., 1998. Reducing uncertainties inδ13C analysis of tree rings: pooling, milling, and cellulose extraction. Journal ofGeophysical Research 103 (no. D16), 19,519–19,526.
Borgmark, A., 2005.Holoceneclimate variability andperiodicities in south-central Sweden,as interpreted from peat humification analysis. The Holocene 15 (3), 387–395.
Borgmark, A., Wastegård, S., 2008. Regional and local patterns of peat humification inthree raised peat bogs in Värmland, south-central Sweden. GFF 130, 161–176.
Bronk Ramsey, C., 2007. OxCal v4.0 Radiocarbon Calibration Software. Research Lab forArchaeology, Oxford, U.K. http://c14.arch.ox.ac.uk.
Charman, D.J., Hendon, D., Packman, S., 1999. Multiproxy surface wetness records fromreplicate cores on an opbrotrophic mire: implications for Holocenen palaeoclimaterecords. Journal of Quaternary Science 14 (5), 451–463.
Cullen, L.E., Grierson, P.F., 2005. Is cellulose extraction necessary for developing stablecarbon and oxygen isotopes chronologies from Callitris glaucophylla? Palaeogeo-graphy, Palaeoclimatology, Palaeoecology 236, 206–216.
Daley, T.J., 2007. Tracking Holocene climate change using peat bog stable isotopes. PhDThesis, University of Southampton, Southampton, UK, 358 pp.
Daley, T.J., Street-Perrott, F.A., Loader, N.J., Barber, K.E., Hughes, P.D.M., Fisher, E.H.,Marshall, J.D., 2009. Terrestrial climate signal of the “8200 yr B.P. cold event” in theLabrador Sea region. Geology 37, 831–834.
Davis, N., 2001. Permafrost — A Guide to Frozen Ground in Transition. University ofAlaska Press. 1–351 pp.
DeNiro, M.J., Epstein, S., 1979. Relationship between the oxygen isotope ratios ofterrestrial plant cellulose, carbon dioxide, and water. Science 204, 51–53.
DeNiro, M.J., Epstein, S., 1981. Isotopic composition of cellulose from aquatic organisms.Geochimica et Cosmochimica Acta 45 (10), 1885–1894.
Environment Canada, 2009. www.climate.weatheroffice.ec.gc.ca.Farquhar, G.D., Ehleringer, J.R., Hubick, K.T., 1989. Carbon isotope and photosynthesis.
Annual Review of Plant Physiology & Plant Molecular Biology 40, 503–537.Foley, J.A., Heil Costa, M., Delire, C., Ramankutty, N., Snyder, P., 2003. Green surprise?
How terrestrial ecosystems could affect earth´s climate. Frontiers in Ecology andthe Environment 1 (1), 38–44.
Green, J.W. (Ed.), 1963. Wood cellulose. Methods in Carbohydrate Chemistry, 3:Cellulose. Academic Press, New York. 9–20 pp.
Grimm, E., 1991. Tilia Graph 2.0.b.5. Illinois State Museum, Research & CollectionsCentre, Springfield, USA.
Grimm, E., 1991–1993. Tilia 2.0.b.4. Illinois State Museum, Research and CollectionsCentre, Springfield, USA.
Grimm, E., 2004. TGView 1.6.2. Illinois State Museum, Research & Collections Centre,Springfield, USA.
Gunnarsson, U., 2005. Global patterns of Sphagnum productivity. Journal of Bryology 27,269–279.
Kuhry, P., Vitt, D.H., 1996. Fossil carbon/nitrogen ratios as a measure of peatdecomposition. Ecology 77 (1), 271–275.
Lamentowicz, M., Cedro, A., Galka, M., Goslar, T., Miotk-Szpiganowicz, G., Mitchell, E.A.D.,Pawlyta, J., 2008. Last millennium palaeoenvironmental changes from a Baltic bog(Poland) inferred from stable isotopes, pollen, plant macrofossils and testateamoebae. Palaeogeography, Palaeoclimatology, Palaeoecology 265, 93–106.
Lange, B., 1982. Key to the northern boreal and arctic species of Sphagnum, based oncharacteristics of the stem leaves. Lindbergia 8, 1–29.
Lindholm, T., 1990. Growth dynamics of the peat moss Sphagnum fuscum on hummockson a raised bog in southern Finland. Annales Botanici Fennici 27 (1), 67–78.
Loader, N.J., Robertson, I., Barker, A.C., Switsur, V.R., Waterhouse, J.S., 1997. Animproved technique for the batch processing of small wholewood samples to α-cellulose. Chemical Geology 136, 313–317.
Loader, N.J., McCarroll, D., van der Knaap, W.O., Robertson, I., Gagen, M., 2007.Characterizing carbon isotope variability in Sphagnum. Holocene 17 (3), 403–410.
Loader, N.J., Santillo, P.M., Woodman-Ralph, J.P., Rolfe, J.F., Hall, M.A., Gagen, M.,Robertson, I., Wilson, R., Froyd, C.A., McCarroll, D., 2008. Multiple stable isotopesfrom oak trees in southwestern Scotland and the potential for stable isotopedendroclimatology in maritime climatic regions. Chemical Geology 252, 62–71.
Loisel, J., Garneau, M., Hélie, J.-F., 2009. Modern Sphagnum δ13C signatures follow asurface moisture gradient in two boreal peat bogs, James Bay lowlands, Québec.Journal of Quaternary Science 24 (3), 209–214.
McCarroll, D., Loader, N.J., 2004. Stable isotopes in tree rings. Quaternary ScienceReviews 23, 771–801.
Ménot, G., Burns, S.J., 2001. Carbon isotopes in ombrogenic peat bog plants as climaticindicators: calibration from an altitudinel transect in Switzerland. OrganicGeochemistry 32, 233–245.
Ménot-Combes, G., Burns, S.J., Leuenberger, M., 2002. Variations of 18O/16O in plantsfrom temperate peat bogs (Switzerland): implications for paleoclimatic studies.Earth and Planetary Science Letters 202, 419–434.
Moschen, R., Kühl, N., Rehberger, I., Lücke, A., 2009. Stable carbon and oxygen isotopesin sub-fossil Sphagnum: assessment of their applicability for palaeoclimatology.Chemical Geology 259 (3–4), 262–272.
Prowse, T.D., Ommanney, C.S.L. (Eds.), 1990. Northern Hydrology Canadian Perspec-tives. NHRI Science Report, vol. 1. Minister of Supply and Services Canada,Saskatoon, Saskatchewan. 307 pp.
Rinne, K.T., Boettger, T., Loader, N.J., Robertson, I., Switsur, V.R., Waterhouse, J.S., 2005.On the purification of α-cellulose from resinous wood for stable isotope (H, C and O)analysis. Chemical Geology 222, 75–82.
Rydin, H., Jeglum, J., 2006. The Biology of Peatlands. Oxford University Press, New York.1–343 pp.
Sannel, A.B.K., Kuhry, P., 2008. Long-term stability of permafrost in subarctic peatplateaus, west-central Canada. The Holocene 18 (4), 589–601.
Sannel, A.B.K., Kuhry, P., 2009. Holocene peat growth and decay dynamics in sub-arcticpeat plateaus, west-central Canada. Boreas 38, 13–24.
Saurer, M., Aellen, K., Siegwolf, R., 1997. Correlating δ13C and δ18O in cellulose of trees.Plant, Cell and Environment 20, 1543–1550.
Schoning, K., Charman, D.J., Wastegård, S., 2005. Reconstructed water tables from twoombrotrophic mires in eastern central Sweden compared with instrumentalmeteorological data. Holocene 15, 111–118.
Schuur, E.A.G., Vogel, J.G., Crummer, K.G., Lee, H., Sickman, J.O., Osterkamp, T.E., 2009.The effect of permafrost thaw on old carbon release and net carbon exhange fromtundra. Nature 459, 556–559.
Sharma, S., Mora, G., Johnston, J.W., Thompson, T.A., 2004. Stable isotopes ratios inswale sequences of Lake Superior as indicators of climate and lake level fluctuationsduring the Late Holocene. Quaternary Science Reviews 24, 1941–1951.
Skrzypek, G., Kaluzny, A., Jedrysek, M.O., 2007a. Carbon stable isotope analyses ofmosses — comparisons of bulk organic matter and extracted nitrocellulose.American Society for Mass Spectrometry 18, 1453–1458.
Skrzypek, G., Kaluzny, A., Wojtun, B., Jedrysek, M.-O., 2007b. The carbon stable isotopiccomposition of mosses: a record of temperature variation. Organic Geochemistry38, 1770–1781.
Swindles, G.T., Plunkett, G., Roe, H.M., 2007. A multiproxy climate record from a raisedbog in County Fermanagh, Northern Ireland: a critical examination of the linkbetween bog surface wetness and solar variability. Journal of Quaternary Science 22(7), 667–679.
Turetsky, M.R., Wieder, R.K., Vitt, D.H., Evans, R.J., Scott, K.D., 2007. The disappearance ofrelict permafrost in boreal north America: effects on peatland carbon storage andfluxes. Global Change Biology 13, 1922–1934.
Zanassi, A., Mora, G., 2005. Paleoclimatic implications of the relationship betweenoxygen isotope ratios of moss cellulose and source water in wetlands of LakeSuperior. Chemical Geology 222, 281–291.
Zoltai, S.C., 1995. Permafrost distribution in peatlands of west-central Canada duringtheHolocenewarmperiod 6000 years BP. Géographie Physique et Quaternaire 49 (1),45–54.


