Embed Size (px)
Citation preview

Sp
YAa
b
c
d
e
a
ARRA
KCPSTWY
1
e
tTvbA
(
0h
Field Crops Research 149 (2013) 329–337
Contents lists available at SciVerse ScienceDirect
Field Crops Research
jou rn al hom epage: www.elsev ier .com/ locate / fc r
pring wheat yield in the semiarid Canadian prairies: Effects ofrecipitation timing and soil texture over recent 30 years
ong Hea,b, Yongsheng Weic, Ron DePauwa, Budong Qiand, Reynald Lemkee,sheesh Singha, Richard Cuthberta, Brian McConkeya, Hong Wanga,∗
Semiarid Prairie Agricultural Research Centre, Agriculture and Agri-Food Canada, Swift Current, Saskatchewan S9H3X2, CanadaPlant Biotechnology Institute, National Research Council, Saskatoon, Saskatchewan S7N0W9, CanadaCollege of Life Sciences, Northwest A&F University, Yangling, Shaanxi 712100, ChinaEastern Cereal and Oilseed Research Centre, Agriculture and Agri-Food Canada, Ottawa, Ontario K1A0C6, CanadaSaskatoon Research Centre, Agriculture and Agri-Food Canada, Saskatoon, Saskatchewan S7N5A8, Canada
r t i c l e i n f o
rticle history:eceived 1 March 2013eceived in revised form 17 May 2013ccepted 18 May 2013
eywords:anadian prairierecipitationoil textureimingheat
ield
a b s t r a c t
The large year-to-year and site-to-site variation in wheat production on rain-fed semiarid areas of theCanadian prairies is mainly due to the timing and amount of precipitation and soil water holding capacity.Here, we identify the critical periods of growing season precipitation on wheat yield and then utilize thisinformation to analyze which type of soil texture had higher drought resistance and higher grain yieldwhen precipitation was more than sufficient. Thirty years (1982–2011) of grain yield data on two siteslocated in the same rain-fed area with different soil texture types were used in our analysis. To seek thecritical periods of precipitation on yield, correlation over the whole growing season between precipitationand yield was first analyzed. By doing this, we calculated not only when the precipitation occurs that wasmost related to yield but also the duration of this period. To further understand these cause-and-effectinterrelationships, a modern version of path analysis – Structural Equation Modeling (SEM) was used. Theresult of SEM was satisfactory since 67% of yield variation can be explained by only 3 exogenous variables(early and late precipitation and fertilizer N) and 2 intermediate variables (thousand kernel weight andkernel nitrogen concentration). Results showed that early precipitation (from seeding to anthesis) was
most critical for high grain yield in our study area. Clay soil has a higher drought tolerance efficiency andlower drought susceptibility index. Grain yield was higher on the clay soil than on the silt loam soil inmost dry and wet years. We conclude that early precipitation had a deterministic effect on grain yield.The clay soil has a more stable yield under current fertilizer rates and the climate conditions in our studyarea. These results may lead to a better understanding of the crop–environmental interactions enablingbreeders to analyze their experimental trials with regard to the broad environments that they target.Crown Copyright © 2013 Published by Elsevier B.V. All rights reserved.
. Introduction
The yield performance of wheat is determined by crop-nvironmental interactions.
Adaptation of wheat to the surrounding environment is one ofhe best solutions for improving productivity (Nap et al., 2003).
herefore, it is necessary to have a better understanding of theariable response of wheat to the environment which is gainedy considering the growth of the wheat plant (McMaster, 1997).mong environmental factors, precipitation and soil may be the∗ Corresponding author. Tel.: +1 306 778 7288.E-mail addresses: [email protected] (Y. He), [email protected]
H. Wang).
378-4290/$ – see front matter. Crown Copyright © 2013 Published by Elsevier B.V. All rittp://dx.doi.org/10.1016/j.fcr.2013.05.013
most influential factors under rain-fed conditions (Lobell et al.,2002). Previous studies conducted on the semiarid areas of theGreat Plains showed that 60% of the variability in grain yield ofspring wheat (Triticum aestivum L.) was due to available growingseason precipitation (Campbell et al., 1997a,b). Drought effects oncrops in this region have been assessed by such studies as Nielsenet al. (2005) and Campbell et al. (2005). The independent or com-bined effects observed in this region can be ascribed mainly to (i)plant, water use efficiency of different wheat varieties (Zentneret al., 2003); (ii) environment, the main factors are distribution ofrainfall (Lehane and Staple, 1965; Robertson, 1974) and tempera-ture (McCaig, 1997); and (iii) management, such as fertilizer rate
(Kröbel et al., 2012), crop rotation (Campbell et al., 2005) and tillagemanagement (McConkey et al., 1996).It is well known that drought can reduce the final grain yield byinfluencing wheat growth in different growth stages. For example,
ghts reserved.

330 Y. He et al. / Field Crops Research 149 (2013) 329–337
Table 1Soil physical–chemical properties of the silt loam soil near Swift Current and the clay soil near Stewart Valley, SK.
Location Depth (cm) Particle size distribution (%) Bulk density (g cm−3) SLLLa SDULb SSKSc (cm d−1) SSATd Organic C (%) pH
Clay Silt Sand
Swift Current
0–15 18 50 31 1.15 0.09 0.28 1.42 0.30 1.8 6.515–30 24 49 26 1.25 0.09 0.28 1.43 0.30 1.5 6.630–45 23 52 24 1.35 0.09 0.28 2.76 0.32 1.3 7.045–60 25 33 41 1.40 0.10 0.27 4.32 0.34 0.9 7.760–90 32 28 40 1.45 0.10 0.27 5.61 0.34 0.5 7.890–120 33 26 41 1.55 0.10 0.25 3.04 0.34 0.3 8.1
120–150 33 28 40 1.65 0.10 0.25 3.04 0.34 0.1 8.5
Stewart Valley0–10 59 36 5 1.20 0.29 0.47 0.33 0.55 1.6 7.5
10–100 60 28 3 1.30 0.29 0.47 0.22 0.51 1.8 8.0
a Lower limit of plant extractable soil water (cm3 cm−3).b 3 −3
stsgredtcpocgiipC2ssp
pcisroTe
iIpgeCats(mafiuoui
Drained upper limit (cm cm ).c Saturated hydraulic conductivity (cm d−1).d Saturated upper limit (cm3 cm−3).
pikes per unit area decrease when water stress occurs during theillering stage (McMaster and Wilhelm, 2003). Kernel number perpike decreases sharply when water stress occurs during the spikerowth period (Hochman, 1982), with maximum yield reductionesulting when water stress develops within 10 days of spikemergence. Drought will also reduce kernel weight if it occursuring grain filling (Bindraban et al., 1998). Therefore, studyinghe influence of precipitation patterns on wheat production shouldombine field observation of growth stages with the timing ofrecipitation. However, long term studies that report phenologicalbservations are rare in the literature. Instead of analysing theorrelation between precipitation received during certain wheatrowth periods with yield production, most long term studiesn this area use growing season precipitation (GSP, total precip-tation from May to July) as an indicator to reflect the impact ofrecipitation pattern on yield production (McConkey et al., 1996;utforth and McConkey, 1997; Zentner et al., 2003; Campbell et al.,007). Because precipitation is highly variable over the growingeason and also because water demand varies according to growthtage, using GSP as a drought indicator may not accurately reflectrecipitation effect.
To explore the effects of timeliness of precipitation on wheatroduction, McCaig (1997) conducted an extensive analysis of pre-ipitation and provided a more detailed indication of the relativemportance of the precipitation periods during the growing sea-on using a 30-day moving average of GSP. However, a 30 dayange could be just as subjective as the critical water supply periodr periods might occur in bands wider or narrower than 30 days.herefore, the use of a 30-day period of precipitation may not bentirely appropriate.
Another important factor influencing spring wheat grain yieldn the rain-fed area of the semiarid Canadian prairies is soil texture.t is well known that soil texture, a categorical variable defined byarticle size, controls many important ecological, hydrological andeomorphic process such as water retention, ion exchange, nutri-nt uptake and crop yield (Parton et al., 1987; Carnol et al., 1997;haudhari et al., 2008). However, little quantitative information isvailable on the influence of soil texture on grain yield produc-ion in semiarid regions probably because such an effect is notufficiently demonstrated using a few years’ data. Van Wambeke1992) pointed out that coarse soil characterized by less clay and
ore sand in the first 100 cm of the soil depth is less productivend occurs in many parts of the world. However, based on a 6-yeareld experiment, Katerji and Mastrorilli (2009) found that water
se efficiency was reduced significantly when crops were grownn a clay soil instead of on a coarser soil and the decrease in waterse efficiency in clay soils was coupled with significant reductionn yield.
Such conflicting results are not surprising as it is simply not fea-sible to adequately assess the effect of soil texture with short termfield trials because the number of years used are too few to includea good representation of wet and dry periods. Other contributingfactors in the field, such as cultivar and management, make it diffi-cult to investigate the effect of soil texture. Our 30 year long-termexperiment (1982–2011) conducted under the rain-fed conditionswith two soil texture types offers an opportunity for the quantifica-tion of soil texture effects on yield production. Our objectives wereto investigate the critical period of precipitation for yield produc-tion and determine effect of soil texture on stable yield under ourcurrent fertilizer rate.
2. Materials and methods
2.1. Study sites and experimental set-up
The two sites were located in southwest Saskatchewan, Canada(50◦17′ N, 107◦48′ W) on Brown chernozem soils (Ayres et al., 1985)having gently undulating topography with slopes of 0.5–2%. Onesite (Swift Current) of the experiment was initiated in 1981 on asilt loam soil (Canada Soil Survey Committee, Subcommittee onSoil Classification 1978). Another site (Stewart Valley) was addedin 1982, on a heavy clay soil. The distance between these two sitesis around 30 km and the two sites are located in the drier portion ofthe Canadian prairies (Marchildon et al., 2007). The annual averagetemperature and total precipitation near here is 6.9 (◦C) and 332(mm), respectively (He et al., 2012). At Swift Current, plots were15 m wide by 76 m long and at Stewart Valley, plots were 15 mwide by 30 m long. Meteorological data was collected at Swift Cur-rent. The physical–chemical properties of both sites are reported inTable 1.
Spring wheat grown in consecutive years under conventionaltillage was used in this study at both locations. Management(tillage, fertilizer rate, etc.) was as consistent as possible betweenthe two sites. The same wheat varieties (Canuck (McBean, 1975),Leader (DePauw et al., 1982), AC Barrie (McCaig et al., 1996), ACEatonia (DePauw et al., 1994) or Lillian (DePauw et al., 2005)) weresown at both locations. A tillage operation occurred just prior toseeding, usually a day or two before the seeding operation. Tillagedepth was approximately 5 cm. In-crop herbicide application nor-mally occurred in early to mid-June, around the 5–6 leaf stage of thecrop. Fertilizer (ammonium nitrate – used until 2005, then replacedwith Urea) rates were based on regional recommendations accord-
ing to soil nitrate amount in the top 60 cm depth, measured in thefall. The targeted nutrient level was 72 kg ha−1 of available nitro-gen (soil NO3-N plus N applied) and 39 kg ha−1 P2O5 (available plusapplied) (Saskatchewan Agriculture, 1988). Until 1990, N fertilizer
Y. He et al. / Field Crops Research 149 (2013) 329–337 331
Table 2Nutrients applied, grain Yield, Thousand kernel weight and Kernel nitrogen concentration of wheat from 1982 to 2011.
Year Nutrients applied(NO3-N kg ha−1)
Grain yield (kg ha−1) Thousand kernel weight (g) Kernel nitrogen concentration (%)
Silt loam Clay Silt loam Clay Silt loam Clay Silt loam Clay
1982 62 43 2839 (245) 1577 (63) 30.18 (0.99) 30.36 (0.51) 2.04 (0.19) 1.71 (0.01)1983 55 55 2111 (56) – 27.30 (1.24) – 2.14 (0.13)1984 50 55 651 (154) 1166 (181) 19.90 (1.43) 26.00 (0.96) 2.85 (0.26) 2.65 (0.17)1985 35 25 764 (146) 1156 (197) – – 3.21 (0.17) 2.60 (0.19)1986 20 20 2873 (237) – 28.20 (0.42) – 2.34 (0.11) –1987 45 45 1399 (161) 783 (124) 25.90 (0.23) 25.33 (0.46) 2.73 (0.08) 2.53 (0.05)1988 38 5 532 (83) – 25.30 (0.30) – 3.52 (0.04) –1989 19 23 2258 (157) 1663 (181) 23.36 (0.89) 22.11 (0.42) 2.87 (0.08) 3.13 (0.12)1990 45 32 2485 (62) 2159 (150) 26.91 (1.59) 30.49 (0.76) 2.57 (0.15) 2.78 (0.07)1991 55 55 2770 (275) 3052 (45) 26.68 (0.52) 31.57 (0.83) 2.27 (0.14) 2.30 (0.14)1992 58 60 1866 (56) 2017 (28) 25.71 (0.98) 28.82 (1.04) 2.19 (0.15) 2.51 (0.15)1993 60 55 2430 (97) 2783 (331) 28.17 (0.83) 28.84 (0.73) 2.11 (0.04) 2.27 (0.09)1994 54 58 2384 (149) 2518 (340) 25.69 (0.66) 29.47 (0.80) 2.37 (0.17) 2.07 (0.10)1995 61 64 2809 (313) 2499 (427) 27.56 (1.45) 27.94 (0.52) 2.02 (0.07) 1.99 (0.05)1996 53 60 2320 (175) 2276 (111) 28.85 (0.34) 31.07 (0.46) 2.02 (0.08) 2.15 (0.01)1997 58 62 2775 (432) 2511 (148) 29.15 (0.89) 28.76 (0.62) 2.44 (0.15) 2.63 (0.07)1998 64 63 1072 (171) 1337 (53) 18.08 (2.17) 20.91 (0.63) 2.89 (0.15) 2.79 (0.03)1999 49 62 2416 (186) 3234 (256) 29.05 (0.60) 32.37 (0.75) 2.25 (0.06) 2.12 (0.06)2000 65 66 2035 (54) 1962 (488) – 25.11 (1.72) 2.28 (0.06) 2.33 (0.21)2001 63 64 970 (255) 663 (101) 26.44 (1.05) 26.49 (0.64) 2.85 (0.09) 2.89 (0.05)2002 32 25 2354 (388) 2100 (307) 28.73 (1.71) 32.09 (1.17) 2.30 (0.12) 2.54 (0.03)2003 60 51 1675 (227) 2145 (152) 23.65 (1.18) 24.93 (0.82) 2.55 (0.11) 2.60 (0.04)2004 46 46 3009 (83) 2690 (61) 32.01 (0.76) 30.44 (1.03) 2.09 (0.03) 2.22 (0.04)2005 60 56 2273 (263) 2948 (205) 26.10 (2.00) 28.96 (0.86) 2.31 (0.07) 2.13 (0.03)2006 58 60 1661 (196) 2037 (149) 22.75 (1.19) 23.44 (1.46) 2.80 (0.06) 2.50 (0.05)2007 61 65 1264 (129) 2193 (138) 19.37 (0.77) 24.36 (0.11) 3.12 (0.04) 2.71 (0.02)2008 40 55 2176 (260) 2970 (265) 32.00 (0.49) 31.17 (0.40) 2.55 (0.09) 2.21 (0.03)2009 55 57 1374 (193) 2278 (215) 26.9 (1.39) 31.89 (1.04) 2.66 (0.14) 2.34 (0.04)2010 49 54 2472 (282) 2932 (416) 33.29 (1.64) 33.37 (1.71) 2.40 (0.08) 2.17 (0.10)2011 55 57 2880 (492) 2638 (156) 32.07 (0.20) 33.31 (0.70) 2.16(0.07) 2.10 (0.08)
Mean 51 49 2030 2159 26.76 28.45 2.50 2.41
N
woiftpwtk(
cplm3fowot1
iotMspmo
rapidly, at a time when the demand for moisture is near its maxi-mum. Soft dough is reached by the end of the month. In August thecrop is ripening and is normally ready for harvest about mid to latemonth (Fig. 1).
Fig. 1. Averaged monthly precipitation with vertical bar indicating the standard
ote: Values in parentheses are the standard deviation. ‘–’ is missing value.
as broadcast prior to seedbed preparation or seeding at rates setut in the 1982 Nutrient Requirement Guidelines for Field Cropsn Saskatchewan. After 1990, N amounts up to 45 kg ha−1 in theorm of ammonium nitrate were applied with the seed and addi-ional amounts were broadcast (McConkey et al., 1996). All croppedlots received 10 kg P ha−1 as monoammonium phosphate, placedith the seed (McConkey et al., 2002). After 1996, all nitrogen fer-
ilizer was seed placed or side banded by a Flexi Coil Air Drill withnife openers. The fertilizer rates of the two sites were quite similarTable 2).
Grain yield, thousand kernel weight (TKW) and kernel nitrogenoncentration (KNC) (Table 2) was determined at full ripeness. Dailyrecipitation (1982–2011) was collected from a weather station
ocated near Swift Current. The 30 year (1982–2011) average ofonthly precipitation totals during the growing season (1 May to
1 July) is shown in Fig. 1. Precipitation during the summer andall periods was usually in the form of rain, most of which evap-transpires, but some penetrates to deeper soil layers. During theinter, the precipitation was usually in the form of snow that lies
n the frozen soil until March or April when it melts. Much ofhis snowmelt runs off and is lost to wheat production (Robertson,974).
Following seeding at the beginning of May, precipitationncreases along with crop demand through to the end of June. Basedn a 50 year average of observations, Robertson (1974) reportedhat spring wheat in our study area has usually emerged by mid-
ay and reached the fifth-leaf or beginning of internode elongation
tage by the end of May. During June, the crop passes through theeriod of grand growth and is usually headed out by the end of theonth. Early in July, anthesis takes place followed by kernel devel-pment. Near the beginning of July precipitation begins to decline
deviation from 1982 to 2011 at Swift Current area. Growth stages in Zadoks scalewere adopted from Robertson (1974). Germination (0–9); seedling growth (10–19);tillering (20–29); stem elongation (30–39); booting (40–49); inflorescence emer-gence (50–59); anthesis (60–69); milk development (70–79); dough development(80–89).

3 Research 149 (2013) 329–337
2
cASPaLpdwr
smicacvae
mcstyasrf(
D
wsuy
t
D
Tbipsiny
atclc(Fni(fi
Table 3Direct, indirect, and total effects of exogenous and endogenous variables on grainyield production and adjusted cross-product covariates on grain yield (r2 = 0.67).
Variable Directeffect
Indirecteffect
Totaleffect
r2
Thousand kernel weight 0.33 0.16 0.49 0.28Kernel nitrogen concentration −0.37 0.14 −0.23 0.39Early precipitation 0.34 0.28 0.62
32 Y. He et al. / Field Crops
.2. Data analyses
Randomized complete block designs were used, with four repli-ations on the silt loam site and three replications on the clay site.ll data were statistically analyzed by using the Statistical Analysisystem software (SAS, 2003) as described by Littell et al. (2006).ROC CORR was used to calculate Pearson correlations betweenmount and timing of precipitation with grain yield, TKW and KNC.inear regression (PROC REG) was used to explore the effects ofrecipitation on yield. PROC UNIVARIATE was used to analyze theistribution of precipitation. Treatment differences in all variablesere analyzed every year using PROC GLM with treatment and
eplication treated as fixed effect and random effect, respectively.To further understand these cause-and-effect interrelation-
hips, Structural Equation Modeling (SEM) was used. SEM is aodern version of path analysis that allows for both the direct and
ndirect theoretical causal relationships between networks of inter-orrelated variables to be tested (Lamb et al., 2011). In this study,ll path coefficients of SEM use standardized partial regressionoefficients that measure the direct influence of one independentariable on the dependent variable and permits the separation of
correlation coefficient into components of direct and indirectffects (Alwin and Hauser, 1975).
Drought resistance was estimated by comparing the perfor-ance of yield under stress (dry years) and non-stress (wet years)
onditions. Because precipitation is normally distributed (data nothown), dry years and wet years were selected based on 20% ofhe distribution tails. The remaining years were treated as normalears. Using data from these two water ‘treatments’, we calculated
drought intensity index for the experiment. As well, the differentusceptibility indices and means to assist in recognizing droughtesistant soil types were also calculated. Adopting the definitionrom Fischer and Maurer (1978), the drought susceptibility indexDSI) is calculated as follows:
SI = 1 − Yd/YpD
here DSI is drought susceptibility index; Yd is grain yield of eachoil texture under dry years; Yp is grain yield of each soil texturender wet years and D = 1 − (mean yield of all soil texture under dryears/mean yield of all soil texture soil texture under wet years).
Drought tolerance efficiency (DTE) was estimated by the equa-ion of Fischer and Wood (1981):
TE (%) =(
Yield under dry yearsYield under wet years
)× 100
o seek the critical periods of precipitation on yield, correlationetween precipitation and yield was first analyzed. Instead of seek-
ng the correlation between precipitation with yield in a fixederiod, such as monthly means (or 30-day moving mean), weearched for a correlation over the whole growing season. The testntervals ranged from 2 to 110 days. By doing this, we calculatedot only when the precipitation occurs that was most related toield but also the duration of this period.
The effect of timing of precipitation on yield production wasnalyzed using SEM, which has a wide range of potential applica-ions in crop sciences including the analysis of yield components,omplex multisite field trials, and genetic studies, yet it has seenimited use (Lamb et al., 2011). More details of theory and appli-ation of SEM in crop science were described by Dhungana et al.2007) and Vargas et al. (2007). The results of SEM were shown inig. 3 and Table 3. The final model fits well as demonstrated by a
onsignificant �2 (�2 = 7.20, p = 0.13) and the GFI (goodness-of-fitndex = 0.96), AGFI (adjusted goodness-of-fit index = 0.78) and NFINormed Fit Index = 0.93). Exogenous variables retained in thenal model had a significant path to at least one of the endogenous
Late precipitation – 0.41 0.41Fertilizer N – 0.19 0.19
variables. The distinction between these two types of variablesis whether the variable regresses on another variable or not. Asin regression, the dependent variable (DV) regresses on the inde-pendent variable (IV), meaning that the DV is being predicted bythe IV. In SEM terminology, other variables regress on exogenousvariables, but exogenous variables never regress on other variables.
3. Results and discussion
3.1. Critical periods of precipitation
Plotted in a three dimensional manner, the correlationcoefficients for grain yield and TKW of the two sites are shown inFig. 2. The critical precipitation period for grain yield (Fig. 2a and b)extends from approximately the beginning of May to early July forboth sites (calendar day 120–190), which is from seeding to begin-ning of anthesis. The critical period for grain yield we obtained waslonger and earlier than that of McCaig (1997) probably because wedid not limit our searching to 30 days. The critical period of precip-itation for TKW (Fig. 2c and d) was around mid-July to early Augustfor the two sites (calendar day 191–220). The critical period forTKW makes sense since it matches with the grain filling period ofthe crop. However, the critical period for yield is surprising sinceprecipitation in July is often considered critical for the productionof high yield. We discuss this in detail in the following SEM analy-sis. Here, we designate the critical period of precipitation for grainyield and kernel weight as ‘early precipitation’ and ‘late precipi-tation’ since the former occurs at an earlier stage of the growingseason. Because the critical periods for the two soil textures arequite similar we merged them together in the SEM analysis.
3.2. Effects of timing of precipitation on yield production
As shown in Table 3, among all exogenous factors (early and lateprecipitation, and Fertilizer N), early precipitation had the great-est total effect (0.62) on grain yield, followed by late precipitation(0.41) and fertilizer N (0.19). The effect of late precipitation on grainyield was mainly affected by TKW because it is the only exogenousfactor that had a direct effect on TKW. This result is similar to resultsfrom McCaig (1997), and seems reasonable since kernel develop-ment often takes place from middle to end of July. The final grainyield is a combination of kernel number per area and kernel weight.We did not include the kernel number per area in our analysesbecause the variable was a derived rather than a directly measuredvariable. In this study as in many others (e.g., McCaig, 1997) ker-nel number is determined algebraically by dividing the grain yieldby the average kernel weight. As this has the effect of confoundingthe error structure of the analysis (Lamb et al., 2011), we focusedonly on variables that were directly measured. The effect of kernelnumber, however, can be inferred from the strong direct effect ofearly precipitation on grain yield. The effect of early precipitation
on TKW is small and the total effect of late precipitation on grainyield is smaller than that of early precipitation. The most likely waythat early precipitation could affect grain yield is through kernelnumber. In other semiarid environments, researchers also found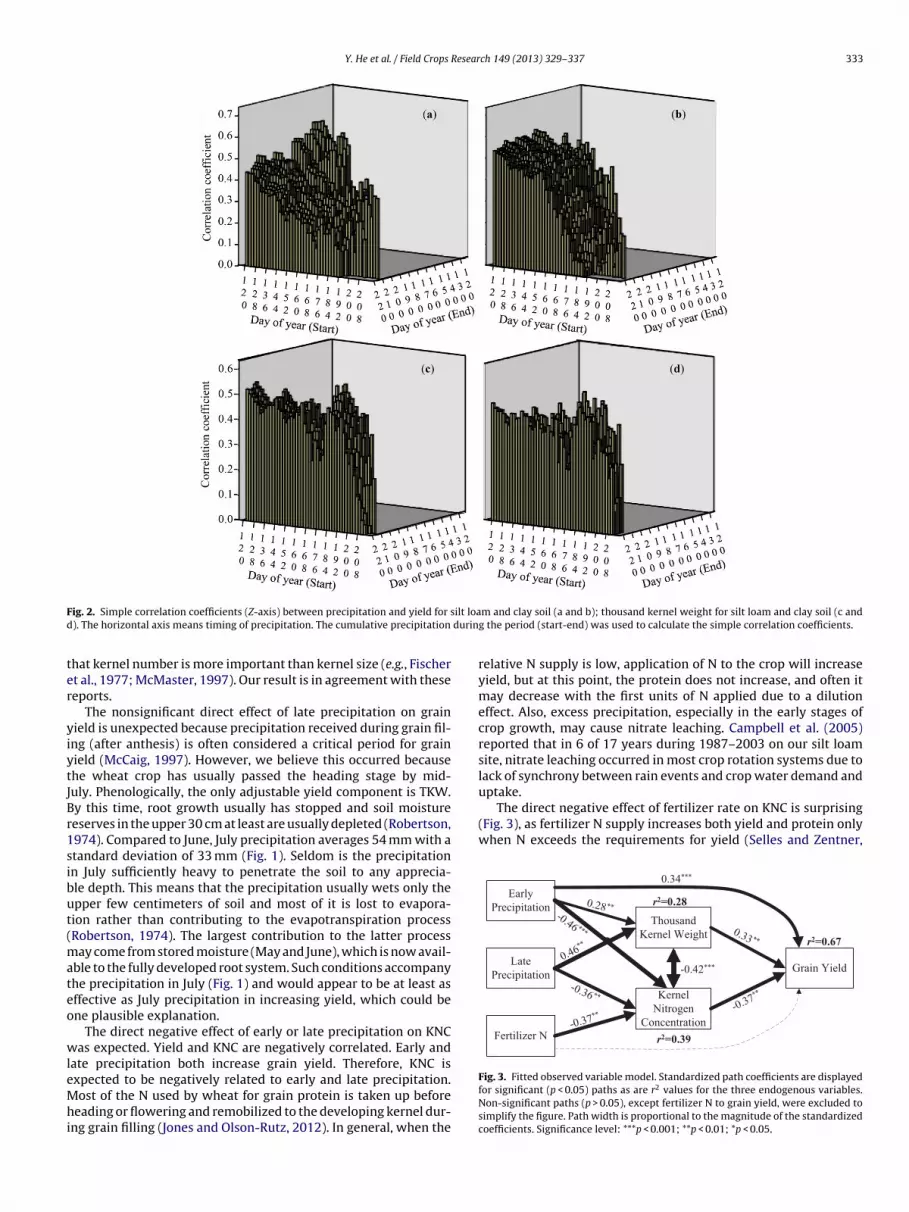
Y. He et al. / Field Crops Research 149 (2013) 329–337 333
F ilt load durin
ter
yiytJBr1sibut(mateo
wleMhi
uptake.The direct negative effect of fertilizer rate on KNC is surprising
(Fig. 3), as fertilizer N supply increases both yield and protein onlywhen N exceeds the requirements for yield (Selles and Zentner,
Early
Precipitation
Late
Precipitation
Fertilizer N
Thousand
Kernel Weight
Kernel
Nitrogen
Concentration
Grain Yield-0.42***
0.34***
r2=0.28
r2=0.39
r2=0.67
ig. 2. Simple correlation coefficients (Z-axis) between precipitation and yield for s). The horizontal axis means timing of precipitation. The cumulative precipitation
hat kernel number is more important than kernel size (e.g., Fischert al., 1977; McMaster, 1997). Our result is in agreement with theseeports.
The nonsignificant direct effect of late precipitation on grainield is unexpected because precipitation received during grain fil-ng (after anthesis) is often considered a critical period for grainield (McCaig, 1997). However, we believe this occurred becausehe wheat crop has usually passed the heading stage by mid-uly. Phenologically, the only adjustable yield component is TKW.y this time, root growth usually has stopped and soil moistureeserves in the upper 30 cm at least are usually depleted (Robertson,974). Compared to June, July precipitation averages 54 mm with atandard deviation of 33 mm (Fig. 1). Seldom is the precipitationn July sufficiently heavy to penetrate the soil to any apprecia-le depth. This means that the precipitation usually wets only thepper few centimeters of soil and most of it is lost to evapora-ion rather than contributing to the evapotranspiration processRobertson, 1974). The largest contribution to the latter process
ay come from stored moisture (May and June), which is now avail-ble to the fully developed root system. Such conditions accompanyhe precipitation in July (Fig. 1) and would appear to be at least asffective as July precipitation in increasing yield, which could bene plausible explanation.
The direct negative effect of early or late precipitation on KNCas expected. Yield and KNC are negatively correlated. Early and
ate precipitation both increase grain yield. Therefore, KNC is
xpected to be negatively related to early and late precipitation.ost of the N used by wheat for grain protein is taken up beforeeading or flowering and remobilized to the developing kernel dur-ng grain filling (Jones and Olson-Rutz, 2012). In general, when the
m and clay soil (a and b); thousand kernel weight for silt loam and clay soil (c andg the period (start-end) was used to calculate the simple correlation coefficients.
relative N supply is low, application of N to the crop will increaseyield, but at this point, the protein does not increase, and often itmay decrease with the first units of N applied due to a dilutioneffect. Also, excess precipitation, especially in the early stages ofcrop growth, may cause nitrate leaching. Campbell et al. (2005)reported that in 6 of 17 years during 1987–2003 on our silt loamsite, nitrate leaching occurred in most crop rotation systems due tolack of synchrony between rain events and crop water demand and
Fig. 3. Fitted observed variable model. Standardized path coefficients are displayedfor significant (p < 0.05) paths as are r2 values for the three endogenous variables.Non-significant paths (p > 0.05), except fertilizer N to grain yield, were excluded tosimplify the figure. Path width is proportional to the magnitude of the standardizedcoefficients. Significance level: ***p < 0.001; **p < 0.01; *p < 0.05.

334 Y. He et al. / Field Crops Research 149 (2013) 329–337
silt lo
2idNahwootb(
srSbtasefibbk
3
iidyb222
cToswct
wT
DSI and a higher DTE than silt loam. Draye et al. (2010) reported thata fine textured soil has a higher unsaturated conductivity whichtends to redistribute water throughout the soil profile more effi-ciently and thus has more available moisture left for later use. Based
Fig. 4. Early (calendar day 120–190) precipitation and grain yield at
001). Jones and Olson-Rutz (2012) pointed out that when fertil-zer N is not sufficient, KNC decreases with increasing yield due to ailution effect. This result indicates that the recommended fertilizer
rate in our experiment was too low. Jones and Olson-Rutz (2012)lso found that lower yield can increase protein content and with-olding late-season moisture can reduce N availability and uptake,hich can reduce protein. The most widely accepted explanation
f negative correlation between of KNC and TKW is that this levelf available N stimulates early season vegetative growth, which inurn increases water use. The consequence is depletion of soil watery the time of anthesis and reduced assimilation during grain fillingMcDonald, 1989).
Considering that a number of other factors were not included,uch as disease, temperature and aeration, which can influence theelative efficiency of crops on soils of different texture, the result ofEM seems satisfactory since 67% of yield variation can be explainedy only 3 exogenous variables (early and late precipitation and fer-ilizer N) and 2 intermediate variables (TKW and KNC). Using SEMllowed for insights into the data that a standard univariate analy-is would not have revealed. This analysis revealed that the effect ofarly precipitation on kernel number appears to be the main driveror final grain yield. For breeders or producers attempting to max-mize wheat yield in this area, an appropriate strategy would be toreed or plant varieties that have potentially higher kernel num-ers which can be achieved through plant strategies of number ofernels per unit area.
.3. Effect of soil texture on yield production
Since early precipitation plays the most important role inncreasing grain yield, the amount of precipitation obtained dur-ng this critical period was used as a drought index to group theata into dry and wet years (Fig. 4). The yield in these dry and wetears was used to analyze drought tolerance or drought suscepti-ility and yield potential of the two soil textures. In this study, using0% as a threshold, the driest years were 1984, 1985, 1987, 2001,007 and 2009 and the wettest years were 1991, 2000, 2002, 2006,008 and 2010. The remaining years were treated as normal years.
As shown in Fig. 5a, among the driest years, the yield in thelay soil was higher than that in the silt loam soil in 4 of 6 years.he clay soil significantly (p < 0.05) outperformed the silt loam in 3f 6 years. Our results agreed with Staple and Lehane (1941) whohowed that crops on clay outyielded the crops on loam by 20%hen water was limited. However, it probably cannot be directly
oncluded that a crop grown on clay soil withstands drought better
han those on lighter textured soils.To further substantiate which soil texture has higher yield whenater supply is limited, DSI and DTE were calculated. As shown in
able 4, the yield on clay soil was about 300 kg ha−1 higher in dry
am and clay soil; 20% driest years ; 20% Wettest years .
years than on silt loam soil. The yield reduction due to water stresswas higher for silt loam than that in clay. The clay soil has a lower
Fig. 5. Effect of soil texture on grain yield in dry (a) and wet (b) years. Means followedby the same letter within the same year are not significantly different at p = 0.05.

Y. He et al. / Field Crops Research 149 (2013) 329–337 335
y = 6.2553x + 1178
r² = 0.3253 (P<0.01)
0
500
1000
1500
2000
2500
3000
3500
0 50 100 150 200 250 300 350
Gra
in y
ield
(k
g h
a-1
)
Precipitation in critical period (mm)
Clay
y = -0.034x2 + 17.22x + 417
r² = 0.3820 (P<0.01)
0
500
1000
1500
2000
2500
3000
3500
0 50 100 150 200 250 300 350
Gra
in y
ield
(k
g h
a-1
)
Early precipitation (mm)
Clay
y = 7.4053x + 876
r² = 0.3809 (P<0.01)
0
500
1000
1500
2000
2500
3000
3500
0 50 100 150 200 250 300 350
Gra
in y
ield
(k
g h
a- 1
)
Precipitation in critical period (mm)
Silt loam
y = -0.060x2 + 26.42x - 393
r² = 0.5916 (P<0.0001)
0
500
1000
1500
2000
2500
3000
3500
0 50 100 150 200 250 300 350
Gra
in y
ield
(k
g h
a-1
)
Early precipitation (mm)
Silt loam
(a)
(d)
(b)
(c)
Fig. 6. Liner (a and b) and non-liner (c and d) relationships between early precipitation and grain yield in silt loam and clay soil over 30 years (1982–2011).
Table 4Drought susceptibility index (DSI) and drought tolerance efficiency (DTE) of two soil textures.
Soil texture Stressed yield (kg ha−1) (dry years) No stressed yield (kg ha−1) (wet years) % reduction DSI DTE
oastfitucmtarl
ttcfpacsatms
tpnmbd
precipitation when water is sufficient especially for silt loam soil.To further evaluate which type of soil texture has higher yield whenprecipitation is sufficient, a nonlinear regression analysis was alsoconducted. Compared with linear regression, the r2 of nonlinear
Silt loam 1070 2245
Clay 1373 2509
n an experiment conducted in the same area as our study, Lehanend Staple (1953) found that in a dry year crops that experiencelow growth in early June, and produce a minimum of leafage, usehe stored moisture when it is most needed for heading and grainlling in July. Therefore, the stress that plants experience accessinghe available moisture in a clay soil may actually modify moisturese and crop growth on these soils early in the season. Crops onoarse soil have lush early growth and heavy tillering, using upost of the available moisture under a minimum of stress. By the
ime moisture tension begins to affect water uptake, the supply ofvailable water is nearly exhausted (Lehane and Staple, 1962). Ouresults further substantiate that clay soil has higher yield than siltoam when water is deficient.
Grain yield in the wettest years is shown in Fig. 5b. Similar tohat in dry years, yield on the clay soil was higher than that onhe silt loam soil in 4 of 6 years. However, the clay soil signifi-antly (p < 0.05) outyielded the silt loam in only 2 of 6 years. Tourther examine this relationship, regression equations were com-ared between silt loam and clay soil. As shown in Fig. 6a and b,round 37% and 34% of the variation can be explained by only pre-ipitation in this period for silt loam and clay, respectively. Thelopes for the two equations are 7.25 and 6.26, respectively, andre assumed to provide some measure of sensitivity of grain yieldo precipitation. On this basis, wheat grown on a silt loam soil is
ore sensitive to precipitation than wheat grown on a clay soilince it has a higher slope.
As shown in Fig. 6a and b, the grain yields for the two soil tex-ures did not increase and even decreased in silt loam when earlyrecipitation was more than 210 mm. This indicates that water may
ot be a limiting factor for wheat in silt loam when precipitationeets crop demand at approximately 210 mm but rather coulde nutrient supply such as nitrogen. Besides, a linear regressionoes not accurately describe the relationship between yield and
52 1.08 47.745 0.93 54.7
Fig. 7. Effect of soil texture on grain yield in normal years. Vertical bars indicatestandard deviation (kg ha−1).

336 Y. He et al. / Field Crops Research 149 (2013) 329–337
-2000
-1000
0
1000
2000
3000
4000
Cu
mu
lati
ve
yie
ld d
iffe
ren
ce
(kg
ha
-1)
Silt loam - Clay
ain yie
rcHifponen
nirebtwtaltieNpotim
tpnaw
3
pTtdat(tyi3
-3000
Fig. 8. Cumulative difference of gr
egression increased significantly for silt loam (Fig. 6c), which indi-ates that a nonlinear regression is more suitable for silt loam.owever, such an increase was small for clay soil (Fig. 6d). As shown
n Fig. 6c and d, the yields reached maximum level at 2500 kg ha−1
or both sites, which means that these two sites have similar yieldotential. This yield potential is probably under genetic controlr because of some other agronomic and/or abiotic stress such asutrient stress. In related studies the realized yield at both sitesxceeded 4000 kg ha−1 in 2011 and 2012 with 100 kg ha−1 availableitrogen and 60 kg ha−1 of P2O5 available (data not shown).
A noticeable trend is that the yield in the silt loam decreased sig-ificantly whereas it was stable in clay soil when precipitation was
ncreased. A plausible explanation for this is that more drainage andun off occurred in a silt loam soil than a clay soil when precipitationxceeded soil water holding capacity. Also, nitrate leaching woulde more severe in the silt loam. Inthavong et al. (2011) pointed outhat soils with higher clay content generally have a low downwardater loss, and thereby are able to retain more water at the end of
he growing season. Large water losses through downward seep-ge can result in low water use efficiency, with associated nutrienteaching. However, a reduction in water seepage not only increaseshe water availability, but can also improve nutrient use efficiencyn fields (Ponnamperuma, 1972; Patrick and Reddy, 1978). Powlsont al. (1992) also found that the more rain that fell in the period after
application, the more labile nitrogen was lost. These reports sup-ort our assumption that too much (heavy) and poor distributionf precipitation in a dryland farming system reduces water and fer-ilizer use efficiencies, which lead to the conclusion that grain yieldn clay soil is more stable than a silt loam soil when precipitation is
ore than sufficient.The yield difference in normal years between the two soil tex-
ures was not as obvious as that in dry and wet years (Fig. 7)robably because water is not a key factor. Other factors domi-ated by soil texture, such as soil temperature (Wang et al., 2007)nd rhizosphere (Hinsinger et al., 2005), may play important role,hich is beyond the scope of this paper.
.4. Cumulative effect of soil texture on yield
The final analysis carried out was to determine if the effects ofrecipitation and soil texture were cumulative over the long term.o achieve this, the cumulative yield and cumulative difference forhe two sites was calculated. As shown in Fig. 8, the cumulativeifference (clay-silt loam) between the two texture types was neg-tive before 2006 because the silt loam soil exhibited higher yieldshan clay soil in normal years and the grain yield of the initial year1982) is higher in silt loam than that of clay soil. It is interesting
hat the difference in cumulative yield kept increasing (cumulativeield in clay soil is higher than silt loam soil) after 2006 and reachedts maximum (3050 kg ha−1) in 2010. This is 1.5 times that of the0-year average yield in the silt loam soil (Table 2). During the lastld between clay and silt loam soil.
6 years, there were 5 extreme years, where 2007 and 2009 are dryyears and 2006, 2008 and 2010 are wet years. This result provesthat extreme years amplify the difference between silt loam andclay soil. Combined with results obtained above, we may concludethat clay soil has more stable yield production under the climateconditions in our study area.
4. Conclusion
Under dry-land farming in southern Saskatchewan, the mostimportant factor for crop yield is the amount of the soil waterstores and is available for crop use. However, wheat productionis quite often limited by a shortage of available precipitation inthis rain-fed semiarid area. As discussed in this paper, knowledgeof the environment (precipitation and soil) can help to improvethe yield performance and the design of breeding programs. Weconclude that early precipitation is more important than late pre-cipitation and fertilizer N. The deterministic yield component inthis study was kernel number per area. Therefore, wheat vari-eties with greater drought tolerance in early growth stages maybe used as criterion of screening for drought resistance. This couldbe achieved by plants with greater capacity to retain fertile tillersand kernels per spike under drought conditions resulting in morekernels per unit area. The clay soil out yielded the silt loam soilin extreme (both dry and wet) years. This is explained using thephysical-chemical properties of the two soils. The clay can holdmore water and experiences less fertilizer leaching than the siltloam soil. The cumulative yield difference between the two soiltextures was amplified with increasing frequency of extreme years.The method used in this paper may be suitable to make compar-isons among soil types.
Undoubtedly, there are a number of other factors, such asdisease, temperature and aeration, which influence the relative effi-ciency of crops on different textured soils under field conditions.Also, the drought stress at various growth stages of wheat is dif-ficult to establish because it is controlled not only by availabilityof soil moisture, but also by root penetration. Further studies areneeded to investigate these factors.
Authors contribution
Y.H., Y.W., and H.W. analyzed data; H.W., B.M., and R.L. per-formed research; Y.H., Y.W., R.D., R.L., A.S., R.C., and H.W. wrotethe paper.
Acknowledgements
We gratefully acknowledge support for this research from theVisiting Fellowships in Canadian Government Laboratories Pro-gram, managed by the Natural Science and Engineering Research

Resear
CfS
R
A
A
B
C
C
C
C
C
C
C
D
D
D
D
D
F
F
F
H
H
H
I
J
K
Y. He et al. / Field Crops
ouncil of Canada. We thank Dr. Yong-Bi Fu (AAFC Saskatoon, SK)or his constructive suggestions. We also thank Kelsey Brandt (AAFCwift Current, SK) for his assistance on this paper.
eferences
lwin, D.F., Hauser, R.M., 1975. The decomposition of effects in path analysis. Am.Sociol. Rev. 40, 37–47.
yres, K.W., Acton, D.F., Ellis, E.G., 1985. The soils of the Swift Current Map Area72J, Saskatchewan. Saskatchewan Institute of Pedology. Publication 56. Exten-sion Division, University of Saskatchewan, Saskatoon, Saskatchewan. ExtensionPublication 481.
indraban, P.S., Sayre, K.D., Solis-Moya, E., 1998. Identifying factors that determinekernel number in wheat. Field Crops Res. 58, 223–234.
ampbell, C.A., Selles, F., Zentner, R.P., McConkey, B.G., Brandt, S.A., McKenzie, R.C.,1997a. Regression model for predicting yield of hard red spring wheat grownon stubble in the semiarid prairie. Can. J. Plant Sci. 77, 43–52.
ampbell, C.A., Selles, F., Zentner, R.P., McConkey, B.G., McKenzie, R.C., Brandt, S.A.,1997b. Factors influencing grain N concentration of hard red spring wheat inthe semiarid prairie. Can. J. Plant Sci. 77, 53–62.
ampbell, C.A., Zentner, R.P., Selles, F., Jefferson, P.G., McConkey, B.G., Lemke, R.,Blomert, B.G., 2005. Long-term effects of cropping system and nitrogen andphosphorus fertilizer on production and nitrogen economy of grain crops ina Brown Chernozem. Can. J. Plant Sci. 85, 81–93.
ampbell, C.A., Zentner, R.P., Basnyat, P., Wang, H., Selles, F., McConkey, B.G., Gan,Y.T., Cutforth, H.W., 2007. Water use efficiency and water and nitrate distribu-tion in soil in the semiarid prairie: effect of crop type over 21 years. Can. J. PlantSci. 87, 815–827.
arnol, M., Ineson, P., Anderson, J.M., Beese, F., Berg, M.P., Bolger, T., Coûteaux, M.M.,Cudlin, P., Dolan, S., Raubuch, M., et al., 1997. The effects of ammonium sulphatedeposition and root sinks on soil solution chemistry in coniferous forest soils.Biogeochemistry 38, 255–280.
haudhari, S., Singh, R., Kundu, D., 2008. Rapid textural analysis for saline and alka-line soils with different physical and chemical properties. Soil Sci. Soc. Am. J. 72,431–441.
utforth, H.W., McConkey, B.G., 1997. Stubble height effects on microclimate yieldand water use efficiency of spring wheat grown in a semiarid climate on theCanadian prairies. Can. J. Plant Sci. 77, 359–366.
ePauw, R.M., McBean, D.S., Buzinski, S.R., Townley-Smith, T.F., Clarke, J.M., McCaig,T.N., 1982. Leader hard red spring wheat. Can. J. Plant Sci. 62, 231–232.
ePauw, R.M., McLeod, J.G., Clarke, J.M., McCaig, T.N., Fernandez, M.R., Knox, R.E.,1994. AC Eatonia hard red spring wheat. Can. J. Plant Sci. 74, 821–823.
ePauw, R.M., Townley-Smith, T.F., Humphreys, G., Knox, R.E., Clarke, F.R., Clarke,J.M., 2005. Lillian hard red spring wheat. Can. J. Plant Sci. 85, 397–401.
hungana, P., Eskridge, K.M., Baenziger, P.S., Campbell, B.T., Gill, K.S., Dweikat, I.,2007. Analysis of genotype-by-environment interaction in wheat using a struc-tural equation model and chromosome substitution lines. Crop Sci. 47, 477–484.
raye, X., Kim, Y., Lobet, G., Javaux, M., 2010. Model-assisted integration of physio-logical and environmental constraints affecting the dynamic and spatial patternsof root water uptake from soils. J. Exp. Bot. 61, 2145–2155.
ischer, R.A., Maurer, R., 1978. Drought resistance in spring wheat cultivars. I. Grainyield responses in spring wheat. Aust. J. Agric. Sci. 29, 892–912.
ischer, K.S., Wood, G.,1981. Breeding and selection for drought tolerance in tropi-cal maize. In: Proc. Symp. on Principles and Methods in Crop Improvement forDrought Resistance with Emphasis on Rice. IRRI, Philippines.
ischer, R.A., Aquilar, I., Laing, D.R., 1977. Postanthesis sink size in a highyieldingdwarf wheat: yield response to grain number. Aust. J. Agric. Res. 28, 165–175.
e, Y., Wang, H., Qian, B., McConkey, B., DePauw, R., 2012. How early can the seedingdates of spring wheat be under current and future climate in Saskatchewan,Canada? PLoS ONE 7, e45153.
insinger, P., Gobran, G.R., Gregory, P.J., Wenzel, W.W., 2005. Rhizosphere geometryand heterogeneity arising from root-mediated physical and chemical processes.New Phytol. 168, 293–303.
ochman, Z.V.I., 1982. Effect of water stress with phasic development on yield ofwheat grown in a semi-arid environment. Field Crops Res. 5, 55–67.
nthavong, T., Fukai, S., Tsubo, M., 2011. Spatial variations in water availability, soilfertility and grain yield in rainfed lowland rice: a case study from SavannakhetProvince, Lao PDR. Plant Prod. Sci. 14, 184–195.
ones, C., Olson-Rutz, K., 2012. Practices to Increase Wheat Grain Protein, Availableat: http://www.landresources.montana.edu/soilfertility/publications.html
aterji, N., Mastrorilli, M., 2009. The effect of soil texture on the water use effi-ciency of irrigated crops: results of a multi-year experiment carried out in theMediterranean region. Eur. J. Agron. 30, 95–100.
ch 149 (2013) 329–337 337
Kröbel, R., Campbell, C.A., Zentner, R.P., Lemke, R., Steppuhn, H., Desjardins, R.L., DeJong, R., 2012. Nitrogen and phosphorus effects on water use efficiency of springwheat grown in the semiarid region of the Canadian Prairie. Can. J. Soil Sci. 92,573–587.
Lamb, E.G., Shirtliffe, S.J., May, W.E., 2011. Structural equation modeling in theplant sciences: an example using yield components in oat. Can. J. Plant Sci. 91,603–619.
Lehane, J.J., Staple, W.J., 1953. Water retention and availability in soils related todrought resistance. Can. J. Plant Sci. 33, 265–273.
Lehane, J.J., Staple, W.J., 1962. Effects of soil moisture tensions on growth of wheat.Can. J. Plant Sci. 42, 180–188.
Lehane, J.J., Staple, W.J., 1965. Influence of soil texture, depth of soil moisture andrainfall distribution on wheat yields in S. W. Saskatchevan. Can. J. Plant Sci. 45,207–219.
Littell, R.C., Milliken, G.A., Stroup, W.W., Wolfinger, R.D., Schabenberger, O., 2006.SAS for Mixed Models, second ed. SAS Institute Inc., Cary, NC.
Lobell, D.B., Ortiz-Monasterio, J.I., Addams, C.L., Asner, G.P., 2002. Soil climate, andmanagement impacts on regional wheat productivity in Mexico from remotesensing. Agric. Forest Meteorol. 114, 31–43.
Marchildon, G.P., Kulshreshtha, S., Wheaton, E., Sauchyn, D., 2007. Drought and insti-tutional adaptation in the Great Plains of Alberta and Saskatchewan, 1914–1939.Nat. Hazards 45, 391–411.
McBean, D.S., 1975. Canuck hard red spring wheat. Can. J. Plant Sci. 55, 315–316.McCaig, T.N., 1997. Temperature and precipitation effects on durum wheat grown
in southern Saskatchewan for fifty years. Can. J. Plant Sci. 77, 215–223.McCaig, T.N., DePauw, R.M., Clarke, J.M., McLeod, J.G., Fernandez, M.R., Knox, R.E.,
1996. AC Barrie hard red spring wheat. Can. J. Plant Sci. 76, 337–339.McConkey, B.G., Campbell, C.A., Zentner, R.P., Dyck, F.B., Lelles, F., 1996. Long-term
tillage effects on spring wheat production on three soil textures in the Brownsoil zone. Can. J. Plant Sci. 76, 747–756.
McConkey, B.G., Curtin, D., Campbell, C.A., Brandt, S.A., Selles, F., 2002. Crop andsoil nitrogen status of tilled and no-tillage systems in semi-arid regions ofSaskatchewan. Can. J. Plant Sci. 82, 489–498.
McDonald, G.K., 1989. The contribution of N fertiliser to the N nutrition of rainfedwheat crops in Australia: a review. Aust. J. Exp. Agric. 29, 455–481.
McMaster, G.S., 1997. Phenology development, and growth of the wheat (Triticumaestivum L.) shoot apex: a review. Adv. Agron. 59, 63–118.
McMaster, G.S., Wilhelm, W.W., 2003. Phenological responses of wheat and bar-ley to water and temperature: improving simulation models. J. Agric. Sci. 141,129–147.
Nap, J.P., Metz, P.L., Escaler, M., Conner, A.J., 2003. The release of genetically modifiedcrops into the environment. Part I. Overview of current status and regulations.Plant J. 33, 1–18.
Nielsen, D.C., Unger, P.W., Miller, P.R., 2005. Efficient water use in dryland croppingsystems in the great plains. Agron. J. 97, 364–372.
Parton, W.J., Schimel, D., Cole, C.V., Ojima, D.S., 1987. Analysis of factors control-ling soil organic matter levels in Great Plains grasslands. Soil Sci. Soc. Am. J. 51,1173–1179.
Patrick Jr., W.H., Reddy, C.N., 1978. Chemical changes in rice soils. In: Soils and Rice.International Rice Research Institute (IRRI), Manila, Philippines, pp. 361–379.
Ponnamperuma, F.N., 1972. The chemistry of submerged soils. Adv. Agron. 24, 29–96.Powlson, D.S., Hart, P.B.S., Poulton, P.R., Johnston, A.E., Jenkinson, D.S., 1992. Influ-
ence of soil type crop management and weather on the recovery of 15N-labelledfertilizer applied to winter wheat in spring. J. Agric. Sci. 118, 83–100.
Robertson, G.E.O.W., 1974. Wheat yields for 50 years at swift current Saskatchewanin relation to weather. Can. J. Plant Sci. 54, 625–650.
Saskatchewan Agriculture, 1988. General Recommendations for Fertilization inSaskatchewan. Agdex 541. Saskatchewan Agriculture, Soils and Crops Branch,Saskatoon, SK, Canada.
Selles, F., Zentner, R.P., 2001. Grain protein as a post-harvest index of N suffi-ciency for hard red spring wheat in the semiarid prairies. Can. J. Plant Sci. 83,631–636.
Staple, W.J., Lehane, J.J., 1941. The use of the wilting coefficient in soil moisturestudies in southwestern Saskatchewan. Can. J. Plant Sci. 21, 440–447.
van Wambeke, A., 1992. Soils of the Tropics—Properties and Appraisal. McGraw-Hill,New York.
Vargas, M., Crossa, J., Rynolds, M.P., Dhungana, P., Eskridge, K.M., 2007. Structuralequation modelling for studying genotype × environment interactions of phys-iological traits affecting yield in wheat. J. Agric. Sci. 145, 151–161.
Wang, H., Lemke, R.L., Goddard, T.W., Sprout, C., 2007. Tillage and root heat stress
in wheat in central Alberta. Can. J. Soil Sci. 87, 3–10.Zentner, R.P., Campbell, C.A., Selles, F., McConkey, B.G., Jefferson, P.G., Lemke, R.,2003. Cropping frequency, wheat classes and flexible rotations. Effects on pro-duction, nitrogen economy, and water use in a Brown Chernozem. Can. J. PlantSci. 83, 667–680.