Embed Size (px)
Citation preview
Spray Calcination/$ Melting: Effluent Characterization and Treatment
Prepared for the U.S. Department of Energy under Contract EY-76-C-06-1830
Pacific Northwest Laboratory Operated for the U.S. Department of Energy by Battelle Memorial Institute
{#Baltelle
UC-70
M. S. Hansolrs
March 1980
PNL-3109
DISCLAIMER
This report was prepared as an account of work sponsored by an agency of the United States Government. Neither the United States Government nor any agency Thereof, nor any of their employees, makes any warranty, express or implied, or assumes any legal liability or responsibility for the accuracy, completeness, or usefulness of any information, apparatus, product, or process disclosed, or represents that its use would not infringe privately owned rights. Reference herein to any specific commercial product, process, or service by trade name, trademark, manufacturer, or otherwise does not necessarily constitute or imply its endorsement, recommendation, or favoring by the United States Government or any agency thereof. The views and opinions of authors expressed herein do not necessarily state or reflect those of the United States Government or any agency thereof.
DISCLAIMER Portions of this document may be illegible in electronic image products. Images are produced from the best available original document.
SPRAY CALCINATION/IN-CAN MELTING: EFFLUENT CHARACTERIZATION AND TREATMENT
M. S. Hanson
March 1980
Prepared f o r the U.S. Department of Energy unde r Contract EY-76-C-06-1830
Pacif ic Northwest Laboratory Richland, Washington 99352
PNL-3109 UC-70
CONTENTS
INTRODUCTION . EQUIPMENT DESCRIPTIONS .
SPRAY CALCINATION . Laboratory-Scale Spray Ca lc ine r . P i l o t - S c a l e Spray Ca lc ine r . F u l l - s c a l e Spray Ca lc ine r
Rad ioac t i ve P i l o t - S c a l e Spray Ca lc ine r . IN-CAN MELTING .
P i l o t - S c a l e In-Can M e l t e r
Rad i oact i ve P i 1 o t -Sca 1 e In-C an Me1 t e r . PROCESS OFF-GAS SYSTEMS .
S in te red F i l t e r s
Nonrad ioac t ive Process Off-Gas System . Rad ioac t i ve Process Off-Gas System .
WASTE DESCRIPTIONS . CALCINE CHARACTERISTICS .
SOURCE TERMS . VOLATILE FISSION PRODUCTS
PARTICLE S I Z E ANALYSIS AND PARTICLE LOADINGS . GASEOUS CONSTITUENTS
POTENTIALLY VOLATILE NON-FISSION PRODUCTS . EFFLUENT TREATMENT . CONCLUSIONS .
3
3
4
6
6
6
10
13
13
13
13
19
20
25
26
31
31
35
47
52
59
7 1
ii i
CONTENTS (Contd)
ACKNOWLEDGMENTS
REFERENCES
APPENDIX: PARTICULATE S I Z E D I S T R I B U T I O N S FROM PILOT-SCALE SPRAY CALCINER .
73
75
77 b
i V
1 Spray Calciner . 2 Laboratory-Scale Spray Calciner/In-Can Melter . 3 Pilot-Scale Spray Calciner/In-Can Melter . 4 Full-scale Spray Calciner/In-Can Melter . 5 Radioactive Pilot-Scale Spray Calciner/In-Can Melter . 6 In-Can Melter . 7 Spray Calciner Filter Assembly . 8 Filter Permeability During Pilot-Scale
Spray Calciner Operation . 9 Filter Permeability .
10 Flow Diagram for Non-Radioactive Process Off-Gas System
11 Radioactive Process Off-Gas System . 12 Typical Spray-Calcine Particle-Size Distribution . 13 Typical Pilot-Scale Spray Calciner
Particle Size Analyzer Range . 14 Typical Pilot-Scale Spray Calciner
Particle Size Distribution from 0.35 to 0.755 pm
15 Typical Pilot-Scale Spray Calciner Particle Size Distribution from 0.50 to 2.75 urn. . .
16 Typical Pilot-Scale Spray Calciner Particle Size Distribution from 1.00 to 7.75 um. .
17 Typical Pilot-Scale Spray Calciner Particle Size Distribution from 2.0 to 20.0 urn. .
4
5
7
9
11
12
14
17
18
20
21
29
39
39
40
40
4 1
V
FIGURES (Contd)
18 Typical Pilot-Scale Spray Calciner Overall Pa r t i c l e Size Distribution from 0.32 t o 20.0 pm .
19 Typical Pilot-Scale Spray Calciner Mass Percent Distribution . ' * *
20 Mass Distribution, Off Gas from Pilot-Scale Spray Calciner With Clean F i l t e r s .
2 1 Full-scale Spray Calciner Off-Gas Pa r t i c l e Size Distribution from 0.32 t o 0.755 urn
22 Full-scale Spray Calciner Off-Gas Pa r t i c l e Size Distribution from 0.5 t o 2.75 um .
23 Full-scale Spray Calciner Off-Gas Pa r t i c l e Size Distribution from 1.0 t o 12.25 urn
24 Full -Scale Spray Calci ner Off -Gas Pa r t i c l e Size Distribution from 2.0 t o 20.0 urn .
25 Full-scale Spray Calciner Off-Gas Pa r t i c l e Size Distribution from 0.32 t o 0.755 pm
26 Full-scale Spray Calciner Integrated Off-Gas Pa r t i c l e Size Distribution from 0.32 t o 20.0 pm .
27 Gas Chromatograph Valving System . 28 Laboratory-Scal e Spray Calciner
29 Startup Condensate Concentrations . 30 Instantaneous Ruthenium and Cesium
Concentrations . 31 Average Ruthenium and Strontium
Condensate Concentrations .
42 b
42 &.
44
45
46
47
48
49
50
51
56 b
61 5
64
65
vi
. . . - . . . . . .
FIGURES (Contd)
32 Ven tu r i Scrubber Ruthenium and S t r o n t i urn Concentrat ions . 66
33 Instantaneous Ruthenium Concentrat ion,
34 S i n t e r e d S t a i n l e s s S tee l F i l t e r Cross
P i l o t - S c a l e Spray Ca lc ine r Run DSS-58 . 66
Section, l O O X . 67
/
.i
v i i
TABLES
1 Pilot-Scale Spray Calciner Design Features .
2 Full-scale Spray Calciner Design Features .
3 Defense-Waste Feed Composition . ., 4 Defense-Waste Activities . 5 Composition of Thorex Fuel-Cycle Wastes . 6 Compositions o f Six Representative High-Level
Radioactive Wastes as Liquids . 7 Physical Properties of Representative Calcined High-Level Wastes . 8 Critical Isotope Content of High-Level Waste (HLW) . 9 Maximum Permissible Radioactive-Release Quantities . 10 Pilot-Scale Spray Calciner/In-Can
Melter Tests
11 Volatile Species Decontamination Factors
12 Spray Calciner Operating Conditions During Particulate Analysis .
13 FSCC-9 Mass Loadings . 14 Full-scale Spray Calciner Gas
Concentrations . 15 Five-Day Full-scale Spray
Calci ner/In-Can Me1 ter Mean Off -Gas Data .
16 Full-scale Spray Calciner/In-Can Melter 5-Day Run Off-Gas Data .
17 Laboratory-Scale Spray Calciner Data
18 Effect of Calciner Temperature Set-Point on NOx Production
8
10 *
b 25
26
27
28
29
32
33
35
36
43
46
53
53 A
54
55
55
viii
TABLES (Contd)
19 Fluoride Losses from the Laboratory-Scale Spray Calciner 56
57
58
20
21
22
Glass Composition for TW-2
Elements Found in Off-Gas Traps
Typical Decontamination Factors Across Off-Gas Cleanup Devices . 59
60 23 Nonradioactive Off-Gas System Ruthenium
Decontamination Factors . 24 Nonradioactive Off-Gas System Cesium
Decontamination Factors . 60
62
62
63
Condensate Concentrations DSS-49 . 25
26
27
28
Venturi Scrub Concentrations DSS-49
Packed Scrub Concentrations DSS-49
Gross Activity Released to Stack During Radioactive Operation . 69
29 Radioactive Effluent System Minimum Decontamination Factors . 69
69 30 WSEP Spray Solidification Data .
ix
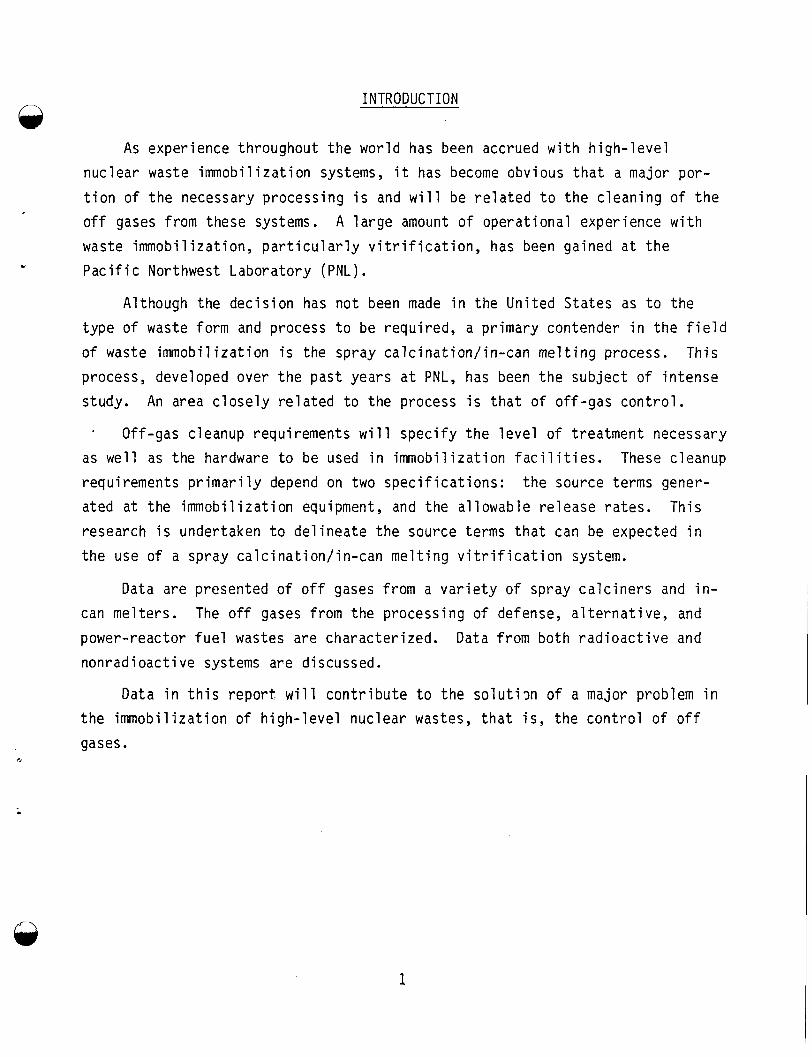
INTRODUCTION
As experience throughout the world has been accrued with high-level nuclear waste immobilization systems, it has become obvious that a major por- tion of the necessary processing i s and will be related to the cleaning of the off gases from these systems. waste immobilization, particularly vitrification, has been gained at the Pacific Northwest Laboratory (PNL).
A large amount of operational experience with
Although the decision has not been made in the United States as to the type of waste form and process to be required, a primary contender in the field of waste immobilization i s the spray calcination/in-can melting process. This process, developed over the past years at PNL, has been the subject of intense study. An area closely related to the process is that of off-gas control.
* Off-gas cleanup requirements will specify the level of treatment necessary as well as the hardware to be used in immobilization facilities. These cleanup requirements primarily depend on two specifications: ated at the immobilization equipment, and the allowable release rates. This research is undertaken to delineate the source terms that can be expected in the use of a spray calcination/in-can melting vitrification system.
the source terms gener-
Data are presented of off gases from a variety of spray calciners and in- can melters. The off gases from the processing of defense, alternative, and power-reactor fuel wastes are characterized. Data from both radioactive and nonradioactive systems are discussed.
Data in this report will contribute to the solutim of a major problem in the immobilization of high-level nuclear wastes, that is, the control of off gases.
c
.
1
.
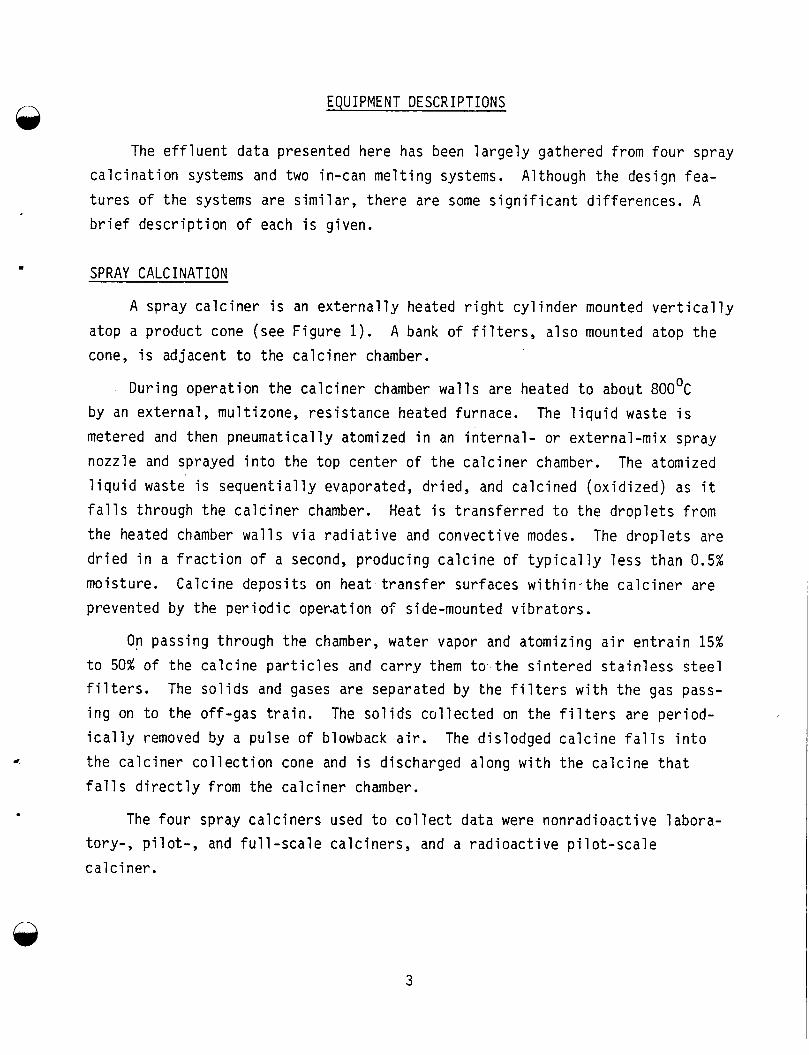
EQUIPMENT DESCRIPTIONS
The effluent data presented here has been largely gathered from four spray calcination systems and two in-can melting systems. tures of the systems are similar, there are some significant differences. A
brief description of each is given.
Although the design fea-
SPRAY CALCINATION
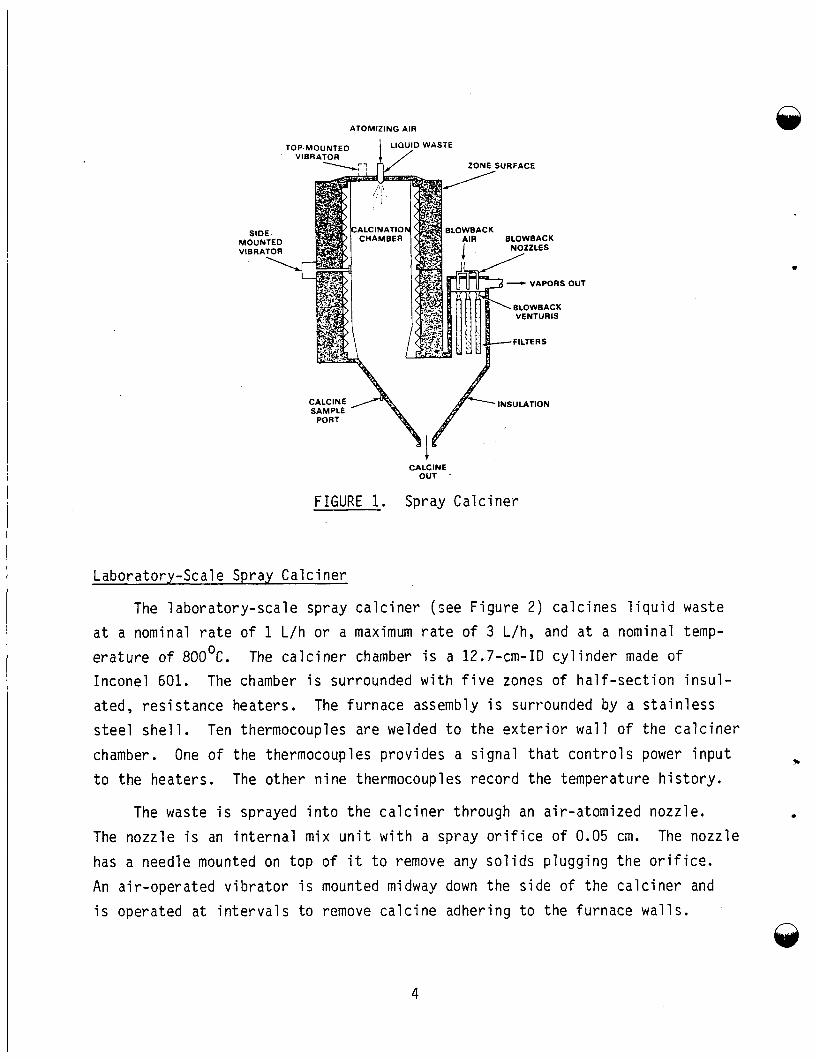
A spray calciner is an externally heated right cylinder mounted vertically atop a product cone (see Figure 1). cone, is adjacent to the calciner chamber.
A bank of filters, also mounted atop the
During operation the calciner chamber walls are heated to about 8OO0C by an external, multizone, resistance heated furnace. The liquid waste is metered and then pneumatically atomized in an internal- or external-mix spray nozzle and sprayed into the top center of the calciner chamber. The atomized liquid waste is sequentially evaporated, dried, and calcined (oxidized) as it falls through the calciner chamber. Heat is transferred to the droplets from the heated chamber walls via radiative and convective modes. The droplets are dried in a fraction of a second, producing calcine of typically less than 0.5% moisture. Calcine deposits on heat.transfer surfaces within-the calciner are prevented by the periodic openation o f side-mounted vibrators.
O n passing through the chamber, water vapor and atomizing air entrain 15% to 50% of the calcine particles and carry them to the sintered stainless steel filters. The solids and gases are separated by the filters with the gas pass- ing on to the off-gas train. ically removed by a pulse of blowback air. the calciner collection cone and is discharged along with the calcine that falls directly from the calciner chamber.
The solids collected on the filters are period- The dislodged calcine falls into
The four spray calciners used to collect data tory-, pilot-, and full-scale calciners, and a rad cal c i ner .
were oac t
nonradioactive labora- ve pi 1 ot-scal e
A
3
ATOMIZING AIR
- VAPORS
INSULATION
CALCINE OUT
SIDE. MOUNTED VIBRATOR
’ \
OUT
FIGURE 1. Spray C a l c i n e r
Laboratory-Scale Spray C a l c i n e r
The l a b o r a t o r y - s c a l e spray c a l c i n e r (see F i g u r e 2 ) c a l c i n e s l i q u i d waste
a t a nominal r a t e o f 1 L/h o r a maximum r a t e o f 3 L/h, and a t a nominal temp-
e r a t u r e o f 80OoC. Incone l 601. The chamber i s surrounded w i t h f i v e zones o f h a l f - s e c t i o n i n s u l -
ated, r e s i s t a n c e heaters . s t e e l s h e l l . Ten thermocouples are welded t o t h e e x t e r i o r w a l l o f t h e c a l c i n e r
chamber.
t o the heaters . The o t h e r n i n e thermocouples r e c o r d t h e temperature h i s t o r y .
The c a l c i n e r chamber i s a 12.7-cm-ID c y l i n d e r made o f
The fu rnace assembly i s surrounded by a s t a i n l e s s
One o f t he thermocouples p rov ides a s i g n a l t h a t c o n t r o l s power i n p u t c
The waste i s sprayed i n t o t h e c a l c i n e r th rough an a i r -a tomized nozz le.
The nozz le i s an i n t e r n a l mix u n i t w i t h a spray o r i f i c e o f 0.05 cm. The nozz le
has a needle mounted on t o p o f i t t o remove any s o l i d s p lugg ing t h e o r i f i c e .
An a i r -ope ra ted v i b r a t o r i s mounted midway down t h e s ide o f t h e c a l c i n e r and i s operated a t i n t e r v a l s t o remove c a l c i n e adher ing t o t h e fu rnace w a l l s .
4
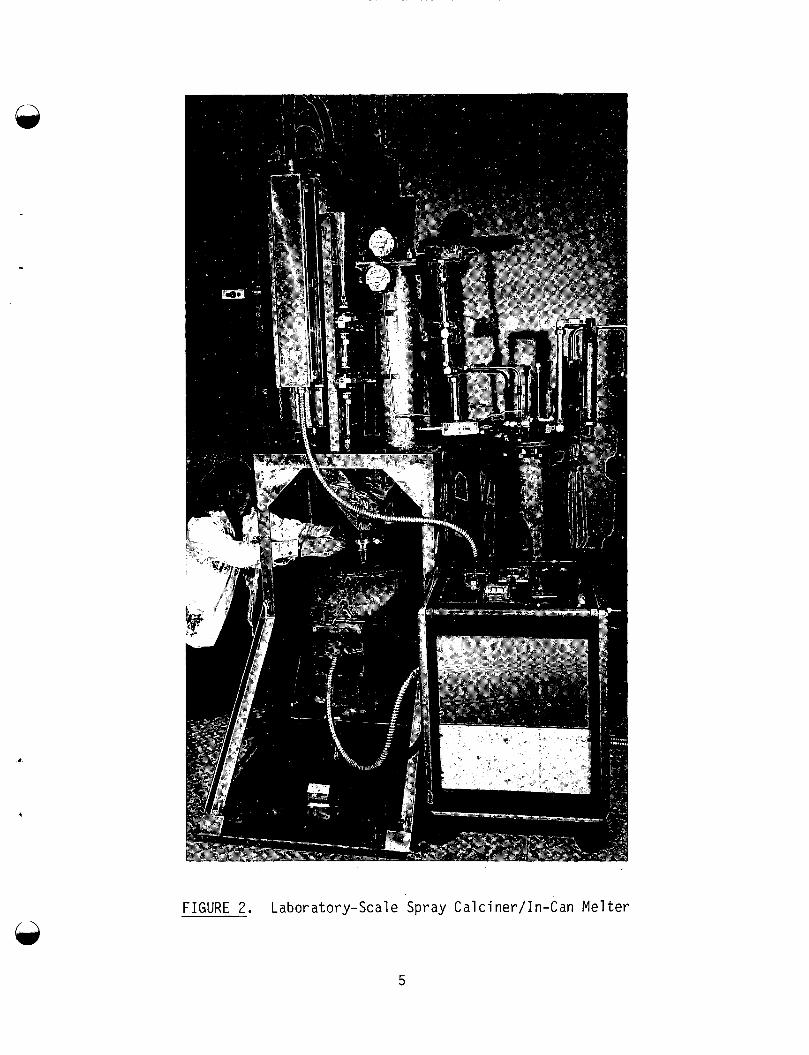
FIGURE 2. Laboratory-Scale Spray Calciner/In-Can Melter
5
@ The c a l c i n e and g lass fr it f a l l f rom the c a l c i n e r chamber i n t o the s t a i n - The system i s operated
Any gases generated by c a l c i n i n g are t rans - l e s s s t e e l c a l c i n e r cone and then o u t o f t h e c a l c i n e r . under 1.5 t o 3.0 cm o f Hg vacuum. f e r r e d through t h e f i l t e r chamber i n t o t h e e f f l u e n t c o n t r o l system. chamber conta ins th ree s t a i n l e s s s tee l , s in tered-meta l f i l t e r s t h a t t r a p dust p a r t i c l e s en t ra ined i n t h e gases. a i r t o remove the dust p a r t i c l e s whenever the pressure drop across these f i l -
t e r s exceeds a set value.
The f i l t e r
These f i l t e r s are au tomat i ca l l y pu lsed w i t h
P i l o t - S c a l e Spray Ca lc ine r
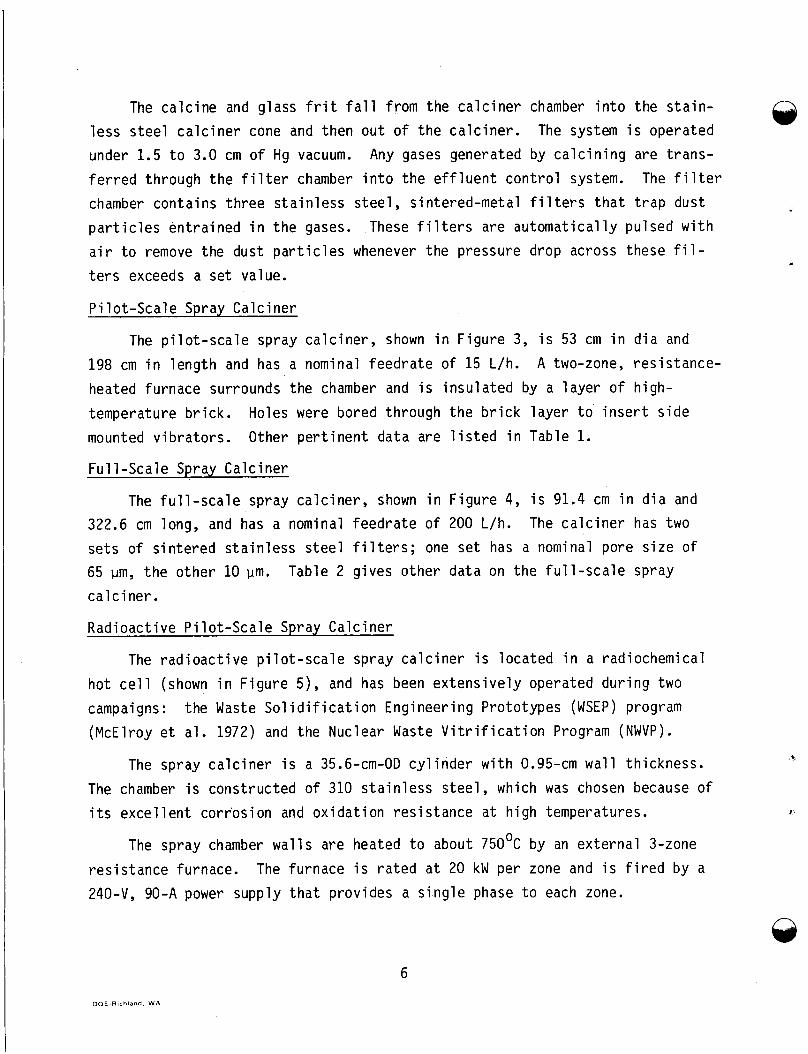
The p i l o t - s c a l e spray c a l c i n e r , shown i n F igu re 3, i s 53 cm i n d i a and
198 cm i n l eng th and has a nominal f eed ra te o f 15 L/h. heated furnace surrounds the chamber and i s i nsu la ted by a l aye r o f h igh-
temperature b r i c k . Holes were bored through t h e b r i c k l a y e r t o i n s e r t s i d e mounted v i b r a t o r s . Other p e r t i n e n t data are l i s t e d i n Table 1.
A two-zone, res i s tance -
F u l l - s c a l e Spray Ca lc ine r
The f u l l - s c a l e spray c a l c i n e r , shown i n F igu re 4, i s 91.4 cm i n d i a and The c a l c i n e r has two 322.6 cm long, and has a nominal f eed ra te o f 200 L/h.
se ts o f s i n t e r e d s t a i n l e s s s t e e l f i l t e r s ; one se t has a nominal pore s i z e o f 65 pm, t h e o the r 10 pm.
c a l c i ner . Rad ioac t ive P i l o t - S c a l e Spray Ca lc ine r
Table 2 g ives o the r da ta on t h e f u l l - s c a l e spray
The r a d i o a c t i v e p i l o t - s c a l e spray c a l c i n e r i s loca ted i n a rad iochemical
ho t c e l l (shown i n F igu re 5), and has been e x t e n s i v e l y operated du r ing two Prototypes (WSEP) program f i c a t i o n Program (NWVP).
campaigns: the Waste S o l i d i f i c a t i o n Engineer ing (McElroy e t a l . 1972) and the Nuclear Waste V i t r
The spray c a l c i n e r i s a 35.6-cm-OD c y l i n d e r
The chamber i s cons t ruc ted o f 310 s t a i n l e s s stee i t s e x c e l l e n t cor ros ion and o x i d a t i o n res i s tance
The spray chamber w a l l s are heated t o about
w i t h 0.95-cm w a l l th ickness.
, which was chosen because o f a t h igh temperatures.
750°C by an ex te rna l 3-zone
res i s tance furnace. 240-V, 90-A power supply t h a t prov ides a s i n g l e phase t o each zone.
The furnace i s r a t e d a t 20 kW per zone and i s f i r e d by a
DOE Rtchland. W A
6
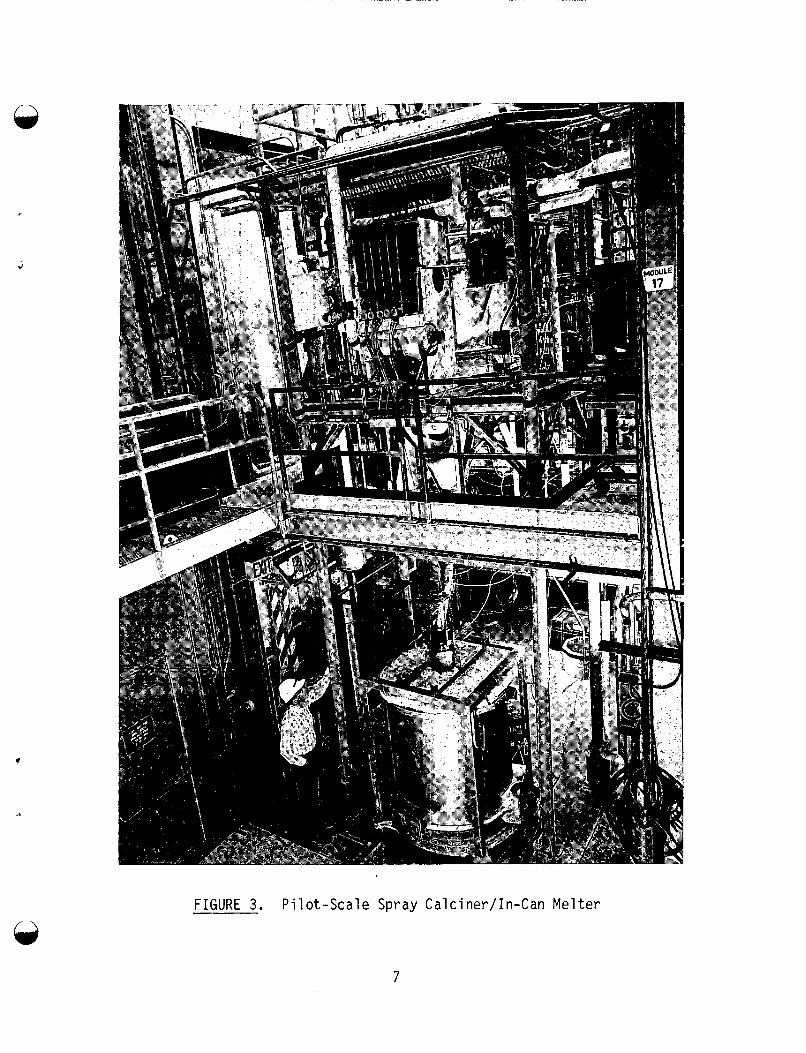
FIGURE 3. Pilot-Scale Spray Calciner/In-Can Melter
7
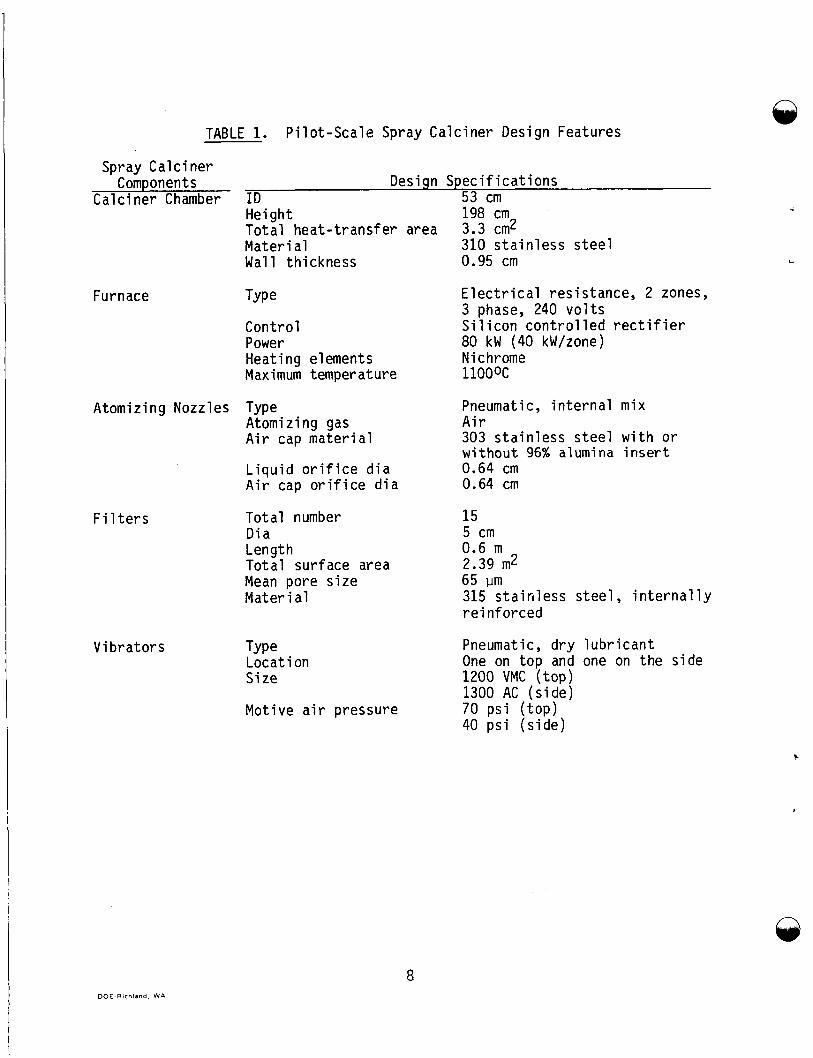
TABLE 1. P i l o t - S c a l e Spray Ca lc ine r Design Features
Spray Cal c i ner Components
Ca lc i ner Chamber
Furnace
Atomiz ing Nozzles
F i 1 t e r s
V i b r a t o r s
Design S p e c i f i c a t i o n s I D 53 cm Height 198 cm T o t a l hea t - t rans fe r area 3.3 cm2 Mate r i a1 Wall th ickness
Cont ro l Power Heat ing elements Maximum temperature
Type Atomi z i n g gas A i r cap m a t e r i a l
L i q u i d o r i f i c e d i a A i r cap o r i f i c e d i a
To ta l number D i a Length To ta l sur face area Mean pore s i z e Mater i a1
Type Locat i on S ize
Mot ive a i r pressure
310 s t a i n l e s s s t e e l 0.95 cm
E l e c t r i c a l res is tance, 2 zones, 3 phase, 240 v o l t s S i l i c o n c o n t r o l l e d r e c t i f i e r 80 kW (40 kW/zone) N i chrome llO0OC
Pneumatic, i n t e r n a l mix A i r 303 s t a i n l e s s s t e e l w i t h o r w i t h o u t 96% alumina i n s e r t 0.64 cm 0.64 cm
15 5 cm 0.6 m 2.39 m2 65 pm 315 s t a i n l e s s s tee l , i n t e r n a l l y r e i n f o r c e d
Pneumatic, d r y l u b r i c a n t One on t o p and one on the s ide 1200 VMC ( t o p ) 1300 AC ( s i d e ) 70 p s i ( t o p ) 40 p s i ( s i d e )
8 DOE Rchland . W A
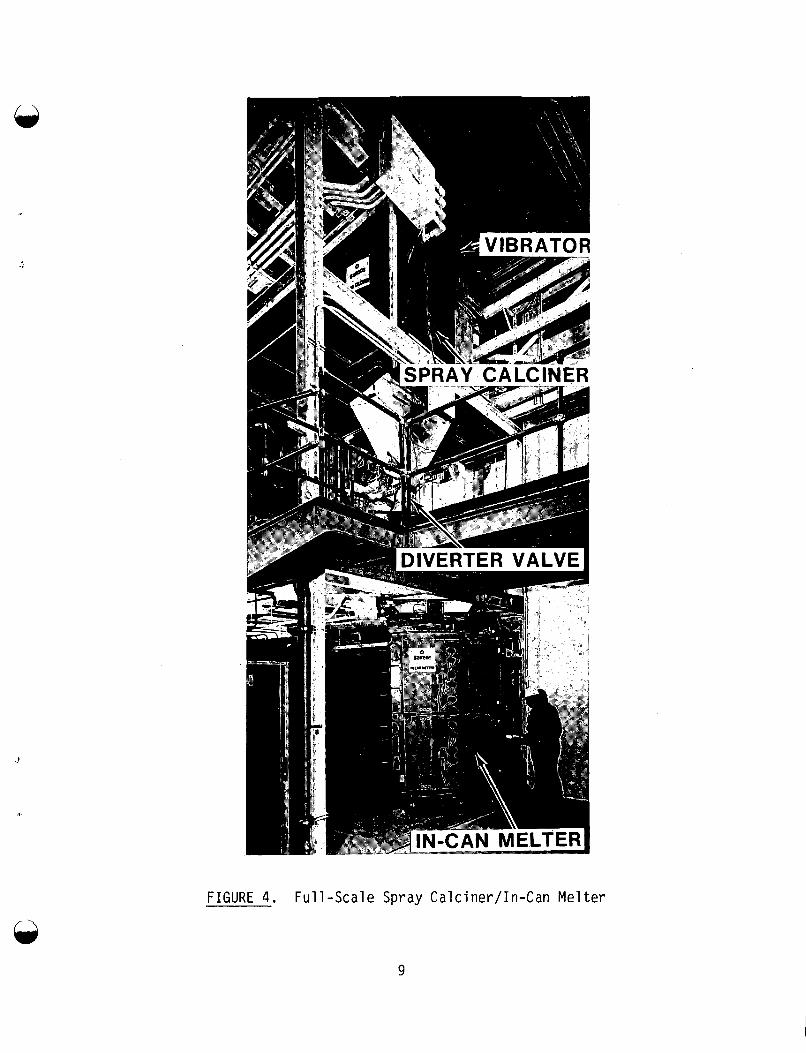
FIGURE 4. Full-scale Spray Calciner/In-Can Melter
9
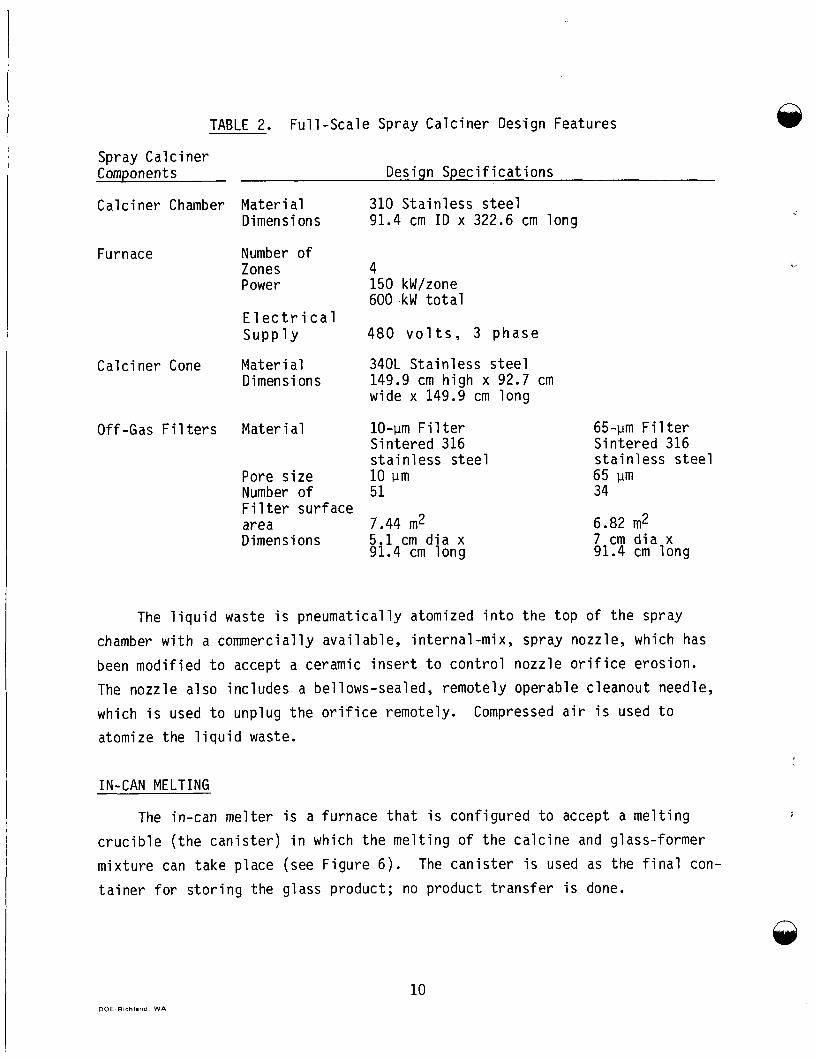
TABLE 2. Full-scale Spray Calciner Design Features
Spray Calciner Components
Calciner Chamber
Furnace
Calci ner Cone
Off-Gas Filters
The chamber w
Design Specifications
91.4 cm ID x 322.6 cm long Mater i a1 310 Stainless steel Dimensions
Number of Zones 4 Power 150 kW/zone
600 kW total Electrical Supply 480 volts, 3 phase
Mater i a1 340L Stainless steel Dimensions 149.9 cm high x 92.7 cm
wide x 149.9 cm long
Mater i a1 10-pm Filter 65-pm Filter Sintered 316 Sintered 316 stainless steel stainless steel
Pore size 10 pm Number of 51 34 Filter surface area 7.44 m2 6.82 m2 Dimensions 5.1 cm dia x 7 cm dia x
65 pm
91.4 cm long 91.4 cm long
iquid waste i s pneumatically atomized into the top o f the spray th a commercially available, internal-mix, spray nozzle, which has
been modified to accept a ceramic insert to control nozzle orifice erosion. The nozzle also includes a bellows-sealed, remotely operable cleanout needle, which is used to unplug the orifice remotely. atomize the liquid waste.
Compressed air is used to
IN-CAN MELTING
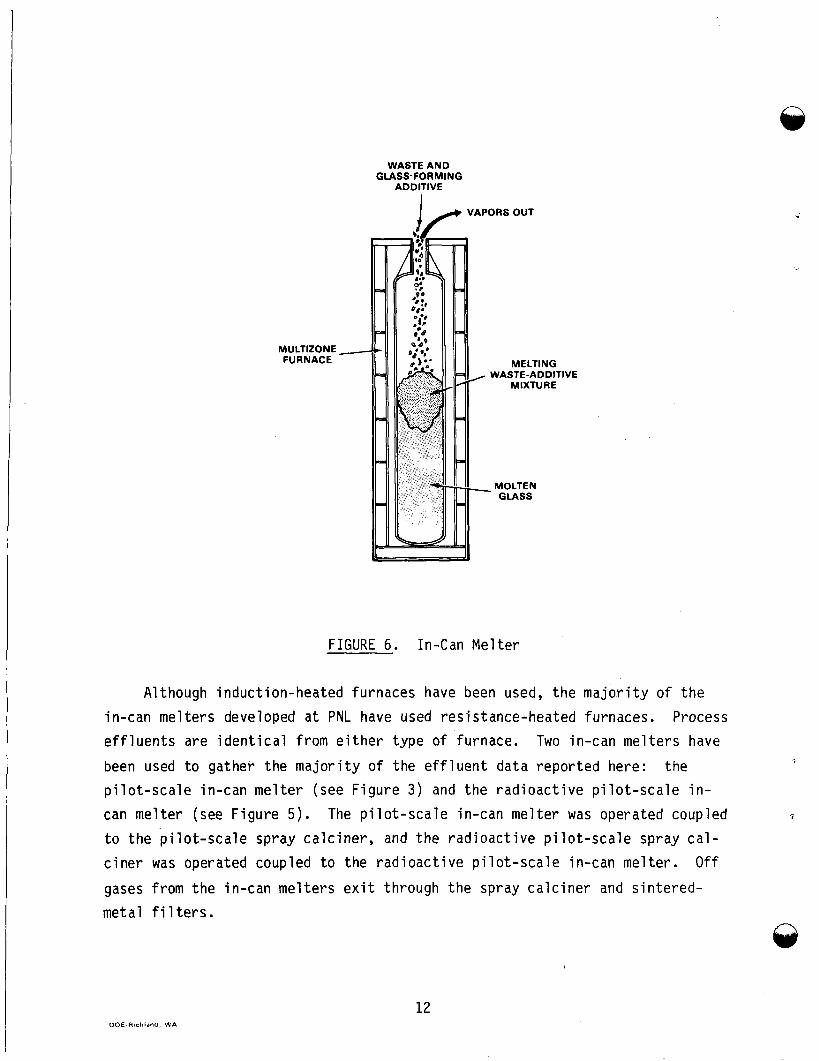
The in-can melter i s a furnace that is configured to accept a melting crucible (the canister) in which the melting o f the calcine and glass-former mixture can take place (see Figure 6 ) . tainer for storing the glass product; no product transfer is done.
The canister is used as the final con-
10
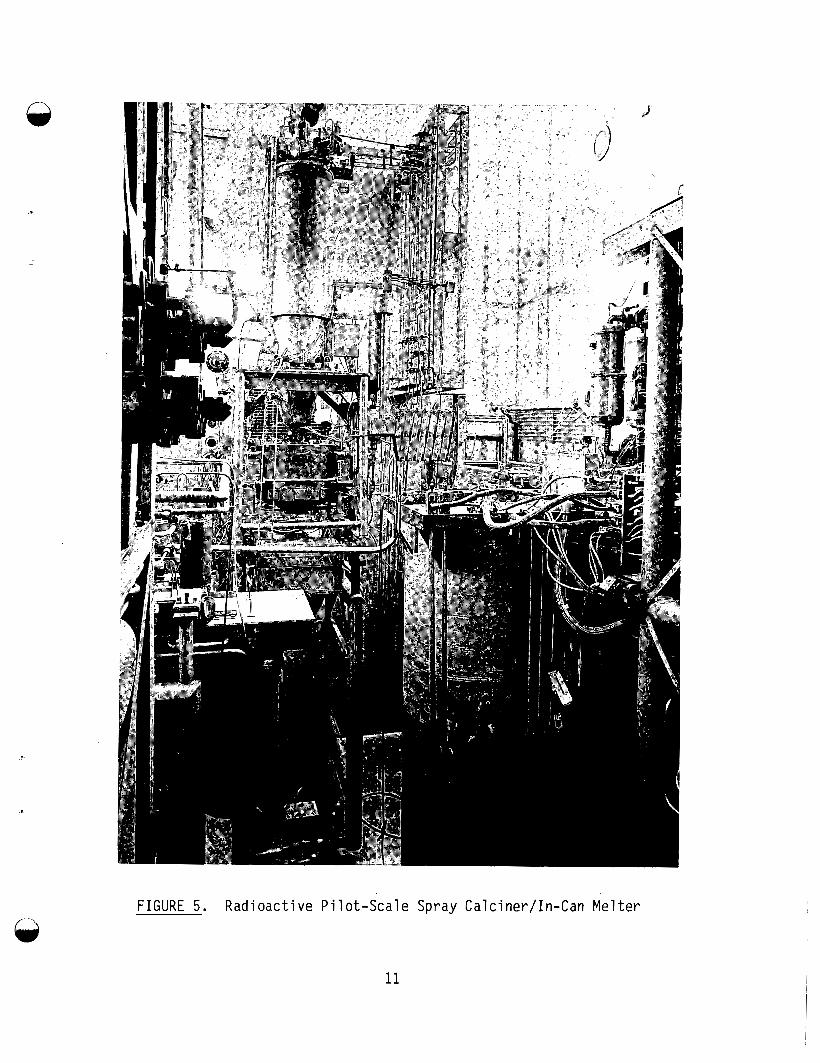
FIGURE 5. Radioactive Pilot-Scale Spray Calciner/In-Can Melter
11
MULTIZONE FURNACE
WASTE AND GLASS-FORMING
ADDITIVE
VAPORS OUT
MELTING WASTE-ADDITIVE
MIXTURE
MOLTEN GLASS
FIGURE 6. In-Can Melter
Although induction-heated furnaces have been used, the majority of the in-can me1 ters developed at PNL have used resistance-heated furnaces. effluents are identical from either type of furnace. Two in-can melters have been used t o gather the majority of the effluent data reported here: pilot-scale in-can melter (see Figure 3) and the radioactive pilot-scale in- can melter (see Figure 5). to the pilot-scale spray calciner, and the radioactive pilot-scale spray cal- ciner was operated coupled to the radioactive pilot-scale in-can melter. Off gases from the in-can melters exit through the spray calciner and sintered- metal filters.
Process
the
The pilot-scale in-can melter was operated coupled
12 DOE Richland. W A
"
@ Pilot-Scale In-Can Melter
The pilot-scale in-can melter is a single zcne, resistance-heated furnace. It has a maximum operating temperature of llOO°C and is rated to 70 kW. furnace can accommodate cans up to 40.6 cm in dia. a load cell and hung inside the furnace. There is an optional Hastelloy-X retort to provide a cover gas for the can. The furnace cavity is 140 cm long with a 49.5-cm-dia top opening. There are three Chromel-Alumel thermocouples in the furnace, one of which is used for power control.
The The cans are suspended from
-
Radioactive Pilot-Scale In-Can Melter
The in-can melter furnace is a 6-zone, resistance-heated furnace. Each zone is 35.6 cm high and has 15 kW of power. 50-A, 3-phase AC power supply. The design temperature for the furnace is 1000°C. A 38.1-cm-OD by 0.64-cm-thick wall Hastelloy-X susceptor tube is used in the furnace. the furnace is cooled to maintain canister wall temperatures within material limits. using air as the cooling medium.
The furnace is fired by a 95-V,
Since the waste is self-heating due to radioactive decay,
Each zone of the furnace has a 2.5-kW cooling capacity at 2.83 m /rnic, 3
PROCESS OFF-GAS SYSTEMS
Two process off-gas systems, one radioactive and one nonradioactive, have been extensively drawn upon to provide effluent data as related to spray cal- cination and in-can melting. In both systems, the first o f f - g a s cleanup step is filtration through the sintered-metal filters. A general discussion, as described by Bonner (1976), follows.
Sintered Filters
Due to the small particle size of the spray-dried calcine, 15% to 50% of L the solids are entrained
experiments with various types of dust removal equipment led to the adoption of sintered, stainless steel filters. The general design of the filters pre- sently used is shown in Figure 7.
in the water vapor and the atomizing air. Early
13

5 I NTERED MnAL
FIGURE 7. Spray Calciner Filter Assembly
During operation, solids filtered from the calciner vapors are temporarily retained on the filter surface. cine increases and produces a corresponding increase in filter differential pressure. directed into the filter from above. This reverse (blowback) air flow dis- lodges the calcine and allows it to fall to the calciner cone below.
With time the thickness of the deposited cal-
To remove the layer of calcine, a pulse of high-pressure air is
The sintered-metal filters that were used were made from appropriately sized metal powder that was formed into a sheet of suitable thickness and then
1
14
6d sintered. welded t o a venturi . t e r b a n k .
The sintered plate was then rol led i n t o a reinforced tube and Each venturi was then welded in to a p la te t o form a f i l -
Varying the metal p a r t i c l e s i ze can a l t e r the f i l t e r pore s ize . Small pores provide the most e f f i c i e n t f i l t r a t i o n , b u t also of fe r the la rges t r e s i s - tance t o vapor flow. However, the loss of eff ic iency w i t h large pores i s o f f - s e t by the buildup of a calcine layer on the f i l t e r surface. as a f i l t e r i n g media and produces a greater d i f f e ren t i a l pressure.
.. This layer ac ts
Tests have been conducted w i t h a combination of cyclones and f i l t e r s and w i t h various types of f i l t e r s . cyclone was used upstream of the f i l t e r s . removed by the pulsed blowback because only the f i n e s t pa r t i c l e s reached the f i l t e r .
As reported by Kaser and Moore (1966) , a The f i l t e r cake was not e a s i l y
These pa r t i c l e s apparently formed an especial ly adherent f i l t e r cake.
Various f i l t e r media have been tes ted including porous alumina, f i n e woven wire, f i ne wound wire, s intered-f iber metal, and sintered-metal powder. The sintered-powder f i l t e r s appear t o exhibi t the best compromise between f i l t e r eff ic iency and ease of cleaning by pulsed blowback air . Alumina f i l t e r s had 10-mm-thick walls and pore s izes ranging from 10 t o 100 urn. They were f r a g i l e and could not be cleaned ef fec t ive ly by pulsed blowback. wire f i l t e r s were n o t as e f fec t ive as sintered-powder f i l t e r s , and s intered- f i b e r metal f i l t e r s were expensive and operated a t high d i f f e ren t i a l pressure.
Wire-wound and woven-
An excessive f i l t e r d i f f e ren t i a l pressure caused by the b u i l d u p of ca l - cine on the f i l t e r surface i s prevented by using a blowback system t o dislodge the f i l t e r cake. of a venturi i s intended t o increase the entrainment of f i l t e r e d gas by the blowback gas j e t , thus decreasing the amount of external a i r required t o clean the f i l t e r s . L i t t l e information has been reported on venturi design; however, some work was done on the e f f ec t s of venturi shape on blowback performance (Kaser and Moore 1966;
The blowback system is analogous t o a j e t e jec tor . The use
3
Bjorklund 1976) .
I t is desirable to minimize calciner pressure surges caused by the pulses of blowback a i r . The variables t h a t a f fec t the magnitude of these surges are blowback pulse duration, blowback pressure, off-gas l ine flow res i s tance , and 0
15
the fraction of filters pulsed simultaneously. Experience has shown that a short 1/4-s pulse of 3OO0C air is as effective as a longer pulse. short pulse, blowback pressures of up to 530 cm of Hg can be used to clean one- fifth of the filters without pressurizing the calciner. experience has shown that a 300-to 400-cm of Hg, 1/4-s pulse of heated air, delivered at intervals of 2 to 100 min, effectively cleans the filters.
With this
In addition, past
Sintered stainless steel filters may not last indefinitely in continuous service due to gradual blockage of the filter pores. cine is smaller than the pore size of the filter, some particles penetrate the filter media and become lodged therein (Pall 1953). Calcine penetration is greatest at the filter surface, but is rapidly reduced when large particles bridge over the pores; this decreases the effective pore opening and acts as a filter precoat. During filter blowback the precoat is partially removed and some particles are again free to enter the filter media. Unfortunately, not all particles inside the filter media are removed during blowback, and a slow accumulation occurs. The rate of accumulation is dependent upon operating conditions and is eventually observed as an increase in minimum baseline dif- ferential pressure.
Since some of the cal-
In the radioactive pilot-scale calciner, the sintered stainless steel filters were periodically washed to provide added filter permeability. the low vacuum available for hot cell operations, the acceptable filter dif- ferential pressure was limited to about 1.9 cm of Hg, which was below the design value. city, the filters were periodically washed with water or nitric acid. cleansing was done by trickling water into the filter from above the venturi while activating the blowback cycle. Through this technique filter cake can be satisfactorially removed, and solids can be flushed from many of the filter pores. Improved filter cleaning can be obtained by using nitric acid instead of water--combining the force of physical removal with the chemical action of the acid.
Due to
Therefore, to prevent being forced to operate at reduced capa- This
16
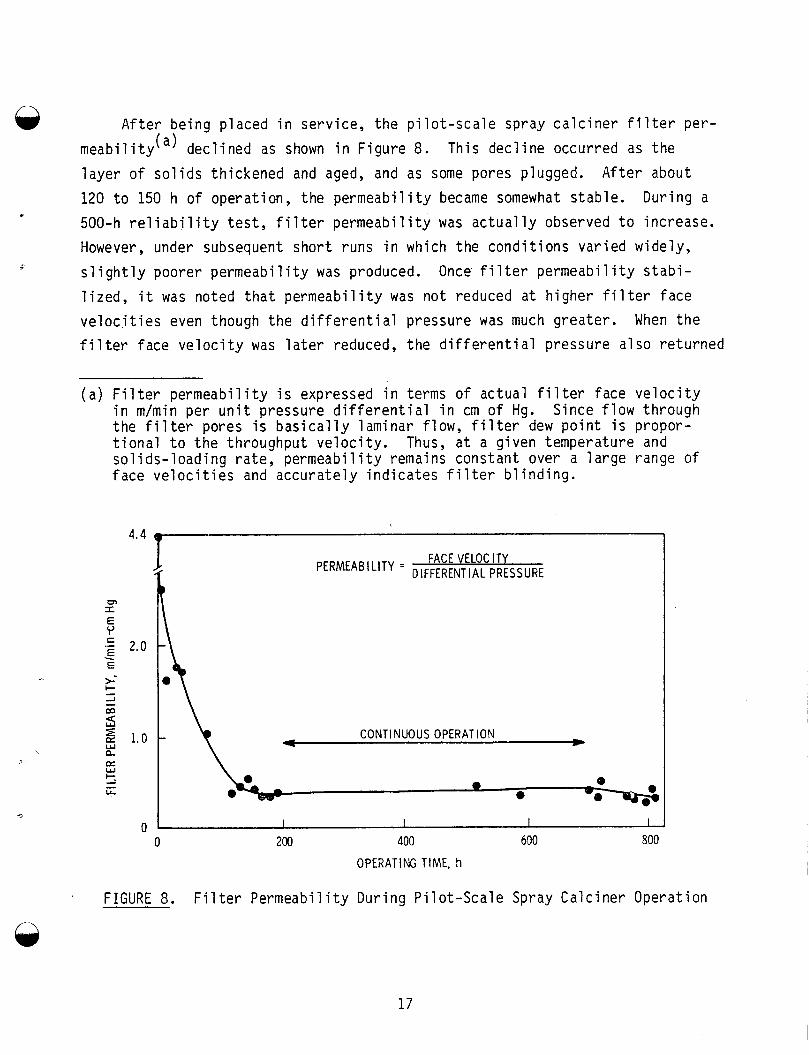
After being placed in service, the pilot-scale spray calciner fllter per- meability(a) declined as shown in Figure 8. layer of solids thickened and aged, and as some pores plugged. 120 to 150 h of operation, the permeability became somewhat stable. During a 500-h reliability test, filter permeability was actually observed to increase. However, under subsequent short runs in which the conditions varied widely, slightly poorer permeability was produced. Once filter permeability stabi- lized, it was noted that permeability was not reduced at higher filter face velocities even though the differential pressure was much greater. filter face velocity was later reduced, the differential pressure also returned
This decline occurred as the 6d
After about
When the
(a) Filter permeability is expressed in terms of actual filter face velocity in m/min per unit pressure differential in cm of Hg. Since flow through the filter pores is basically laminar flow, filter dew point is propor- tional to the throughput velocity. Thus, at a given temperature and solids-loading rate, permeability remains constant over a large range of face velocities and accurately indicates filter blinding.
4.4 T
I I I 0 200 400 600 800
OPERATING TIME, h
FIGURE 8. Filter Permeability During Pilot-Scale Spray Calciner Operation
17
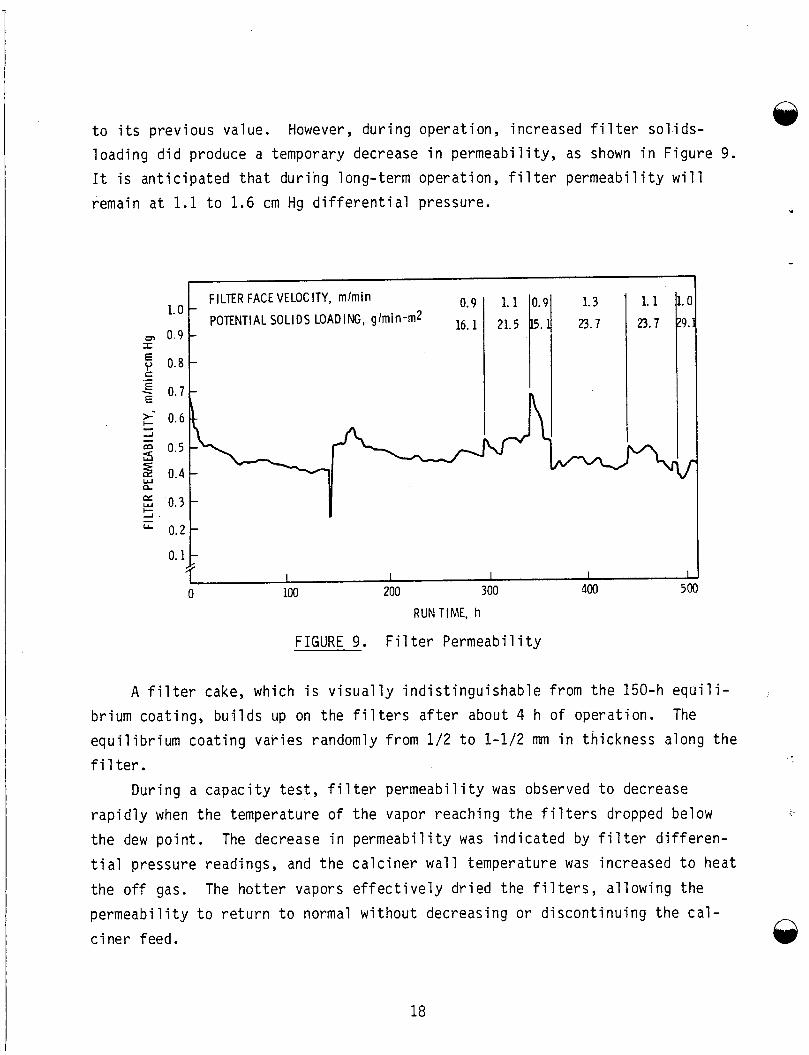
63 to its previous value. However, during operation, increased filter sol.ids- loading did produce a temporary decrease in permeability, as shown in Figure 9. It is anticipated that during long-term operation, filter permeability will
1. 1
23.7
remain at 1.1 to 1.6 cm Hg differential pressure.
I
1.1
29
FILTER FACE VELOCITY, m l m i n 0.9 POTENTIAL SOLIDS LOADING, g/min-m2 16.
al 0.9 r 7 0.8
- 0.7 c .- E E
1.3
23.7
m
I I I I I 100 200 300 400 500 0
RUN TIME, h
I I I I I 100 200 300 400 500 0
RUN TIME, h
FIGURE 9. Filter Permeability
A filter cake, which is visually indistinguishable from the 150-h equili- brium coating, builds up on the filters after about 4 h of operation. equilibrium coating varies randomly from 1/2 to 1-1/2 mm in thickness along the filter.
During a capacity test, filter permeability was observed to decrease
The
rapidly when the temperature of the vapor reaching the filters dropped below the dew point. tial pressure readings, and the calciner wall temperature was increased t o heat the off gas.
The decrease in permeability was indicated by filter differen-
The hotter vapors effectively dried the filters, allowing the
c i ner feed . w
18
Coupl ing a m e l t e r t o t h e c a l c i n e r has n o t a f fected t h e opera t i on o f t h e s in te red-meta l f i l t e r s . The volume o f gas l e a v i n g the m e l t e r i s no rma l l y neg-
l i g i b l e when compared t o t h e volume o f gas l e a v i n g t h e c a l c i n e r . Thus, t h e m e l t e r o f f gas has no n o t i c e a b l e e f f e c t on f i l t e r d i f f e r e n t i a l . V o l a t i l e com-
' ponents f rom t h e m e l t e r t h a t are t rapped i n t h e f i l t e r cake comprise o n l y a
smal l p o r t i o n o f the s o l i d s c o l l e c t e d there . Hence the v o l a t i l e components are removed d u r i n g f i l t e r blowback again w i t h o u t a n o t i c e a b l e e f f e c t on t h e
f i l t e r s . The concen t ra t i on o f some v o l a t i l e waste c o n s t i t u e n t s has been
observed t o be s l i g h t l y h ighe r i n c a l c i n e t h a t was removed f rom t h e f i l t e r s .
Th is observa t ion i n d i c a t e s t h a t these c o n s t i t u e n t s are scrubbed f rom the vapors
when the vapors pass through the f i l t e r - c a k e coat ing .
Nonrad ioac t ive Process Off-Gas System
-
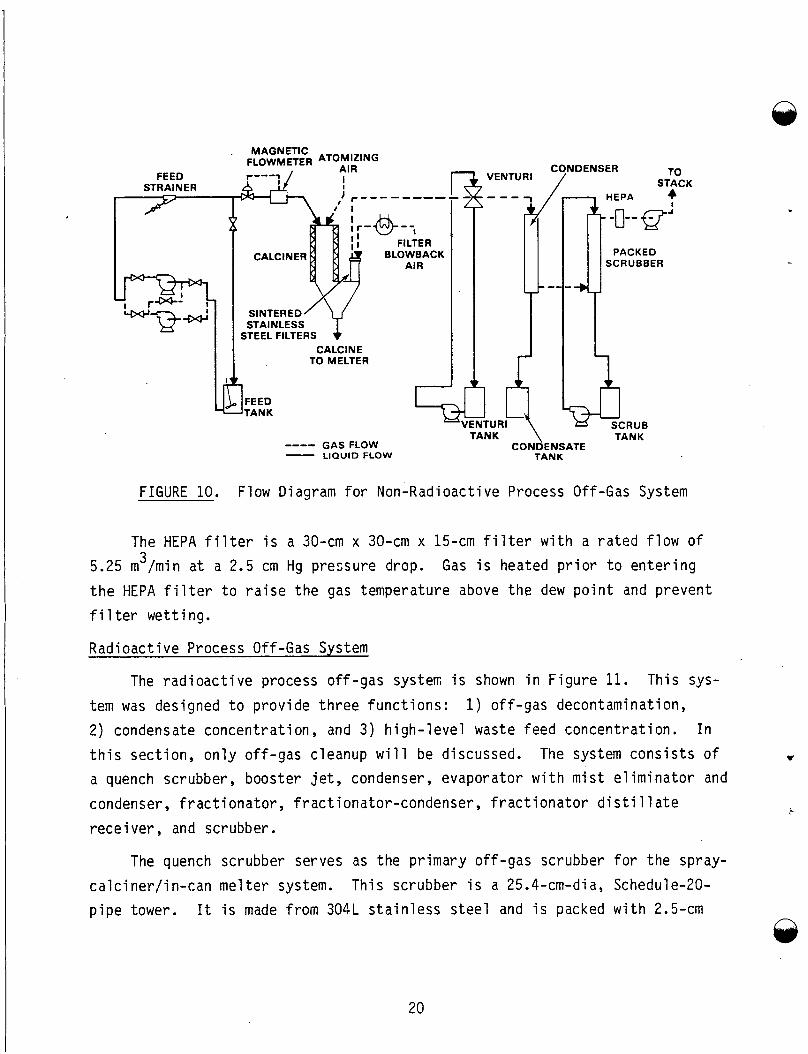
The nonrad ioac t i ve process o f f - g a s system used i s shown i n F igu re 10. The system f o l l o w i n g t h e s i n t e r e d f i l t e r s c o n s i s t s o f an e j e c t o r v e n t u r i scrubber, a condenser, a packed scrubber, and a h i g h - e f f i c i e n c y p a r t i c u l a t e a i r (HEPA)
f i l t e r f o l l o w e d by a vacuum-producing fan . The e n t i r e system i s operated a t
l ess than atmospher ic pressure t o i nsu re t h a t any gaseous leakage f l ows i n t o t h e process. A l l l i q u i d e f f l u e n t streams i n t h e system may be sampled. A v a r i e t y o f gas-sampling p o i n t s are a v a i l a b l e .
The e j e c t o r v e n t u r i scrubber i s a 316 s t a i n l e s s s t e e l v e n t u r i w i t h a 6 - i n .
It i s designed t o handle 14,160 L/m (500 acfm) of steam and 1,416 L/m t h r o a t . (50 acfm) o f NO2 a t 4OO0C and 4.7 cm Hg vacuum. The i n i t i a l scrub solut ion i s 182 L/m H20 a t 85OC and 310 cm Hg pressure. The v e n t u r i c o o l s the gases t o 6OoC and i s designed t o remove 90% of t he p a r t i c l e s 1 pm o r l a r g e r .
o p e r a t i n g w i t h a waste c o n t a i n i n g n i t r a t e s , t h e scrub s o i u t i o n reaches opera t -
When
i n g e q u i l i b r i u m a t V
- The condenser
I t ' s a s ing le-pass
s t r u c t i o n and 14.2
13OC and 310 cm Hg
packed- bed co 1 umn . r i n g s . The column
about 0.1M - HN03
i s a 304 s t a i n l e s s s t e e l s h e l l and tube heat exchanger.
down-draf t u n i t , tube-s ide process w i t h f l o a t i n g head con-
m o f sur face area. The s h e l l s i de f l u i d i s raw water a t pressure. The packed scrubber i s a 304L s t a i n l e s s s t e e l ,
The Packed bed i s 0.25 m3 of 2.54 cm x 0.08 cm r a s c h i g
has a 2.54-cm c o o l i n g c o i l w i t h 1.1 mz o f sur face area.
2
19
I
I
MAGNETIC FLOWMETER ""1 :ING
I , --------
I
FEED STRAINER r-
"-g&
CALCIN ER BLOWBACK
'Y SINTER ED STAINLESS
STEEL FILTERS CALCINE
TO MELTER
1 I
CONDENSER TO / STACK VENTURI
TANK \ TANK GAS FLOW CONDENSATE ----
TANK - LIQUID FLOW
FIGURE 10. Flow Diagram f o r Non-Radioact ive Process Off-Gas System
The HEPA f i l t e r i s a 30-cm x 30-cm x 15-cm f i l t e r w i t h a r a t e d f l o w o f 3 5.25 m /min a t a 2.5 cm Hg pressure drop.
t h e HEPA f i l t e r t o r a i s e t h e gas temperature above t h e dew p o i n t and p reven t f i l t e r we t t i ng .
Gas i s heated p r i o r t o e n t e r i n g
I Rad ioac t i ve Process Off-Gas System
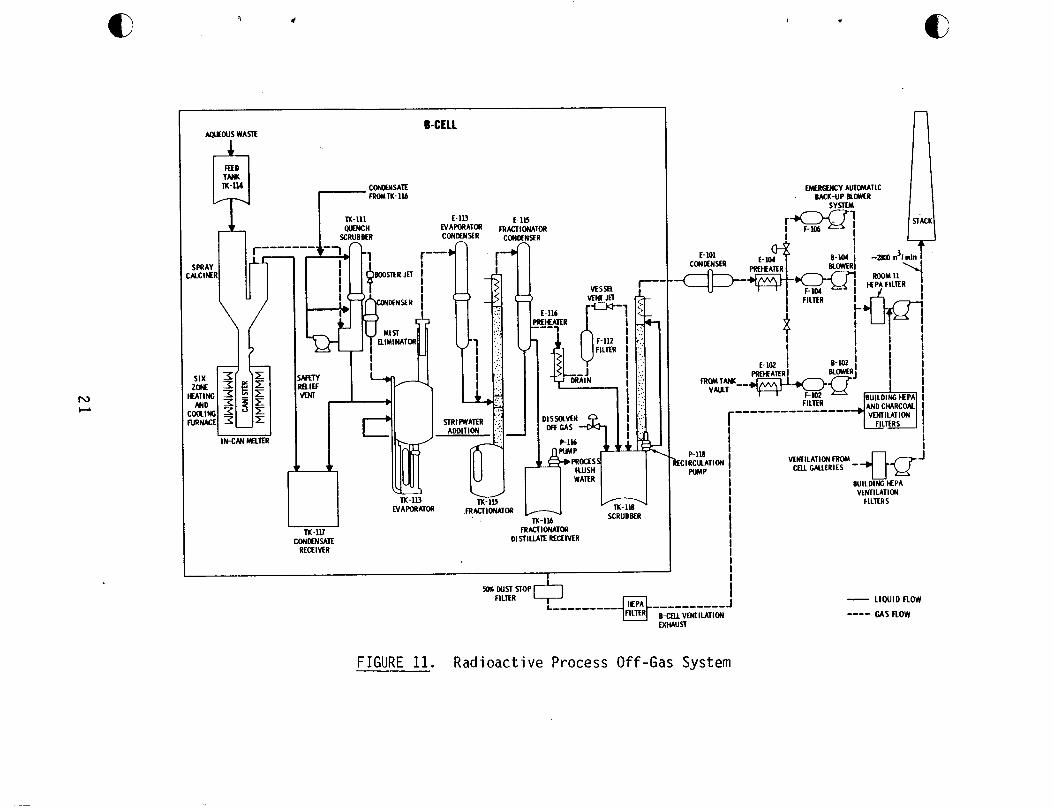
The r a d i o a c t i v e process o f f - g a s sys ten i s shown i n F i g u r e 11. 1) o f f -gas decontaminat ion,
Th is sys-
tem was designed t o p r o v i d e t h r e e f u n c t i o n s : 2 ) condensate concent ra t ion , and 3 ) h i g h - l e v e l waste feed concent ra t ion . I n t h i s sec t ion , o n l y o f f -gas c leanup w i l l be discussed. a quench scrubber, booster j e t , condenser, evapora tor w i t h m i s t e l i m i n a t o r and
condenser, f r a c t i o n a t o r , f rac t i ona to r -condenser , f r a c t i o n a t o r d i s t i l l a t e
The system c o n s i s t s o f
r e c e i v e r , and scrubber.
The quench scrubber serves as the p r imary off-gas scrubber f o r t he spray-
c a l c i n e r / i n - c a n m e l t e r system. Th is scrubber i s a 25.4-cm-diaY Schedule-20- p i p e tower. It i s made f rom 304L s t a i n l e s s s t e e l and i s packed w i t h 2.5-cm
I
~
20
I
B-CELL ApuEWS WASTE
r--- SPRAY K C I F E R
I Y C M MaTER
m-111 CONOMSATE
RECEIVER
FRACTIONATOR DISIILUTE RECEIVER
VtNTlLATlON FROM - PlU ' k E C l R C U T l O N puw 1 I ( I u C A U E R l E S q 8 j
I 8UlLDlffi H P A I VENTILATION
FILTERS I
- LlWlDnOW GAS now ----
FIGURE 11. Rad ioac t ive Process Off-Gas System
p a l l r i n g s o f t he same m a t e r i a l . t o p and a second a t t h e m idsec t i on of t h e tower, serve t o c o l l e c t and r e d i s - t r i b u t e scrub s o l u t i o n and condensate t o the packing.
f r a c t i o n a t o r d i s t i l l a t e r e c e i v e r i s pumped t o t h e t o p w e i r and, as i t f a l l s through the tower, i t scrubs the r i s i n g gas stream.
sp ray -ca l c ine r condensate f rom t h e quench s e c t i o n o f t h e tower a re c o l l e c t e d i n a tank a t t he base o f the tower and r e c y c l e d by a pump t o e i t h e r the t o p o r
t h e bottom o f t h e tower, depending on o p e r a t i n g needs. This r e c y c l e d l i q u i d i s cooled by pass ing i t through a water-cooled heat exchanger.
l i q u i d l e v e l i s mainta ined i n t h e c o l l e c t i o n tank by an o v e r f l o w w e i r which
a1 1 ows dra inage t o the evaporator .
Two l i q u i d d i s t r i b u t i o n wei rs , one near t h e
Condensate f rom t h e
The scrub s o l u t i o n and t h e
-
A cons tan t
Located downstream f rom t h e quench scrubber i s a booster j e t o r s team- jet
assembly. prescribed negative pressure. A condenser on the j e t discharge l i n e cools the gas and condenses t h e steam b e f o r e i t e n t e r s t h e evaporator .
This j e t ma in ta ins t h e spray c a l c i n e r / i n - c a n m e l t e r system a t t h e
The evaporator , cons t ruc ted e n t i r e l y o f commerc ia l ly pure t i t a n i u m , i s a medium-length-tube, thermosyphon-type designed t o operate w i t h a maximum-to- minimum o p e r a t i n g volume r a t i o o f 18:l. The evaporator has a tower w i t h ' f o u r
stages o f de-entrainment: two stages o f d r y impingement caps i n the cen te r , and 4 ) a remote l y rep laceab le
m i s t e l i m i n a t o r a t t h e top. impingement v e l o c i t i e s o f stages 1, 2, and 3 a re 11, 16, and 26 m/s, respec- t i v e l y . These v e l o c i t i e s a re s u f f i c i e n t f o r n e a r l y 100% removal o f ae roso ls o f 25, 7, and 4 pm, r e s p e c t i v e l y . The evaporator-condenser i s a tube and
s h e l l down-draft-operated, water-cooled condenser w i t h t h e process f l u i d on
t h e tube s ide.
1) a s imple chevron b a f f l e a t t h e bottom, 2 ) and 3 )
A t t h e maximum design b o i l u p r a t e (500 L/h) , t h e
The t o t a l l y t i t a n i u m a c i d f r a c t i o n a t o r c o n s i s t s o f a packed-tower d i s t i l - The t o p and bottom sphero id l a t i o n column surmounting a s tandard r e b o i l tank.
heads are p a r t i a l l y r e i n f o r c e d f o r added s t r e n g t h w i t h an e x t r a th i ckness o f
t i t a n i u m p l a t e . The r e c t i f y i n g s e c t i o n o f t h e f r a c t i o n a t o r tower i s packed
w i t h 2.5-cm-diaY t i t a n i u m r a s c h i g r i n g s . The exhaust ing s e c t i o n i nc ludes a s i m i l a r l y packed s e c t i o n surmounted by t h e d e - e n t r a i n i n g s ieve p l a t e and t h e
e
22
.
integral reflux condenser. Special features of the f rac t iona tor are the remotely replaceable tube bundle i n the reboi ler and the de-entraining sieve plate w i t h bypass provisions i n the tower. l iquid feed o f up t o 0.8M - HN03, an overhead f rac t ion o f 0.01M - HN03, and an acid concentration of up t o 10M - HN03., The fractionator-condenser is the same type as the evaporator-condenser.
The f rac t iona tor i s designed f o r a
The process off-gas scrubber i s a 1300-L tank surmounted by a packed scrubbing tower. tower a t r a t e s of up t o 40 L/min. accept ab1 e.
A pump recycles the l i q u i d scrub solution t o the t o p of the 3 Gas flows of up t o 11.8 m / m i n are
23
c
WASTE DESCRIPTIONS
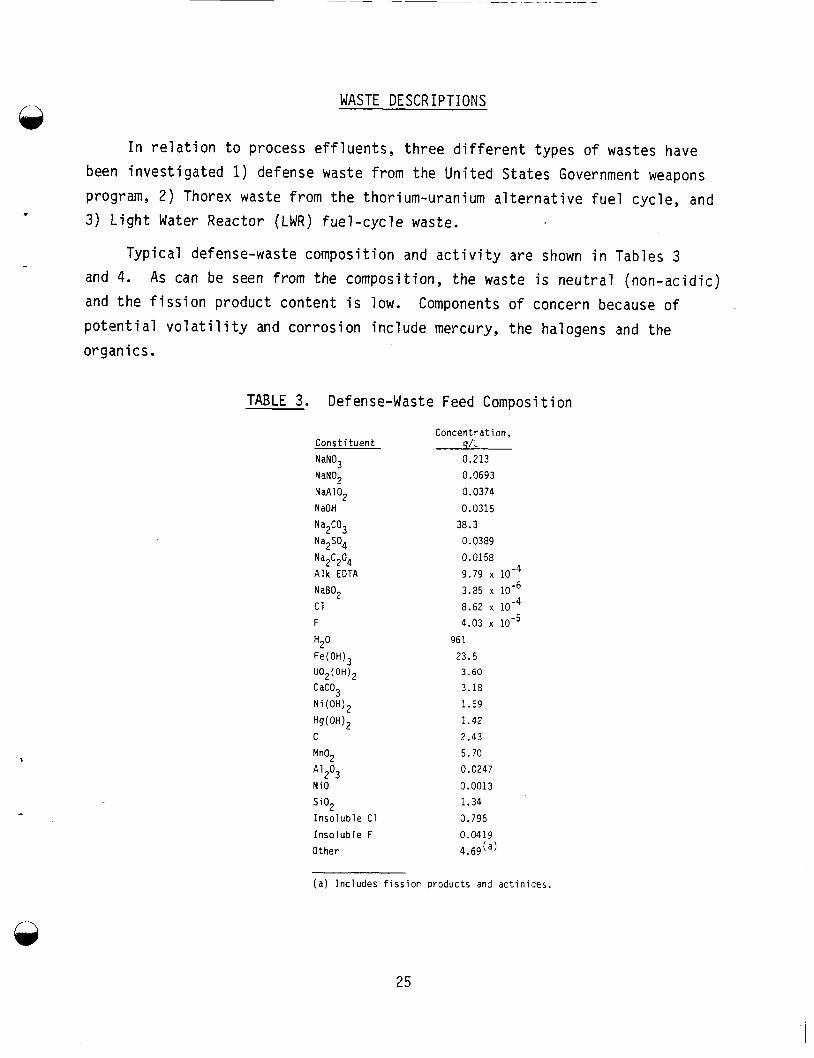
I n r e l a t i o n t o process e f f l u e n t s , t h r e e d i f f e r e n t types o f wastes have been i n v e s t i g a t e d 1) defense waste from the Un i ted S ta tes Government weapons
program, 2 ) Thorex waste f rom t h e thor ium-uranium a l t e r n a t i v e f u e l cyc le , and 3) L i g h t Water Reactor (LWR) f u e l - c y c l e waste.
Typ ica l defense-waste composi t ion and a c t i v i t y are shown i n Tables 3
Components o f concern because o f
and 4. and t h e f i s s i o n p roduc t con ten t i s low. p o t e n t i a l v o l a t i l i t y and c o r r o s i o n i n c l u d e mercury, t h e halogens and the
organ i cs .
As can be seen f rom the composi t ion, t h e waste i s n e u t r a l (non -ac id i c )
TABLE 3. Defense-Waste Feed Composit ion
C o n s t i t u e n t
NaN03
NaN02
NaA102
N aOH
Na2C03
Na2S04
Na2C204 A l k EDTA
NaB02
c1 F
H2° Fe(OH),
CaC03
Ni(OH)2
C
Mn02
A 2'3 N i O
S i 0 2 I n s o l u b l e C1
I n s o l u b l e F
Other
UO2 (OH) 2
Hg(oH)2
C o n c e n t r a t i o n , g/L 0.213
0.0693
0.0374
0.0315
38.3
0.0389
0.0158
9.79
3.85 x
8.62 4.03
96 1 23.5 3.60
3.18
1.59
1.42
2.43
5.70 0.0247
0.0013 1.34
0.795
0.0419
4 .69(a)
( a ) I n c l u d e s f i s s i o n p r o d u c t s and a c t i n i d e s .
25
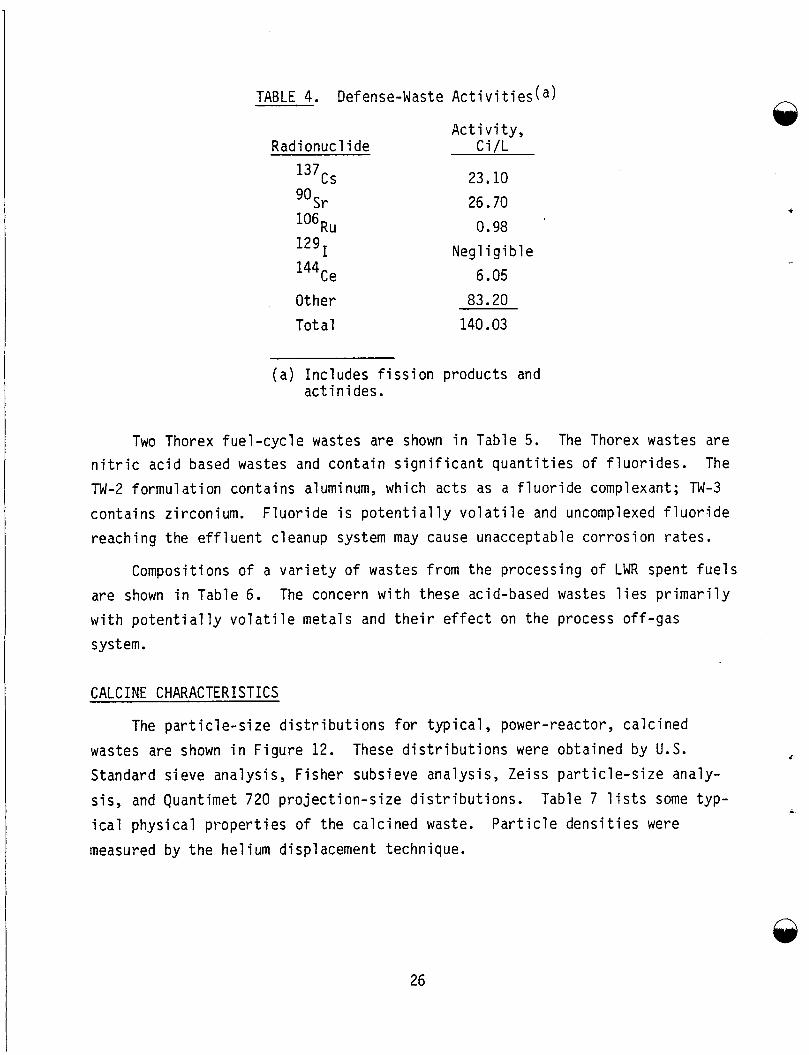
TABLE 4. Defense-Waste Activities(a1
Radionuclide
137cs ~r R u
129 I
144~e Other Total
Activity, Ci/L
23.10 26.70 0.98
Negl i gi bl e 6.05 83.20 140.03
(a) Includes fission products and actinides.
Two Thorex fuel-cycle wastes are shown in Table 5 . nitric acid based wastes and contain significant quantities of fluorides. TW-2 formulation contains aluminum, which acts as a fluoride complexant; TW-3 contains zirconium. Fluoride is potentially volatile and uncomplexed fluoride reaching the effluent cleanup system may cause unacceptable corrosion rates.
The Thorex wastes are The
Compositions of a variety of wastes from the processing of LWR spent fuels are shown in Table 6. The concern with these acid-based wastes lies primarily with potentially volatile metals and their effect on the process off-gas system.
CALCINE CHARACTERISTICS
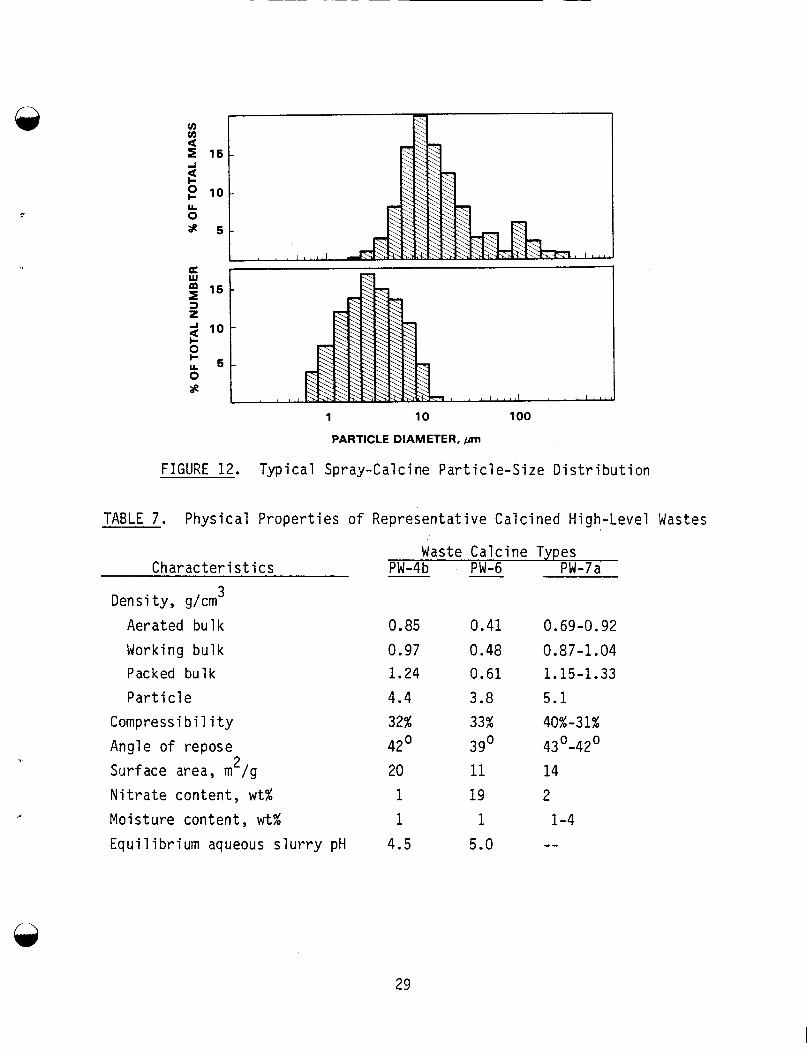
The particle-size distributions for typical , power-reactor, calcined These distributions were obtained by U.S. wastes are shown in Figure 12.
Standard sieve analysis, Fisher subsieve analysis, Zeiss particle-size analy- sis, and Quantimet 720 projection-site distributions. ical physical properties of the calcined waste. measured by the helium displacement technique.
<
Table 7 lists some typ- L
Particle densities were
26
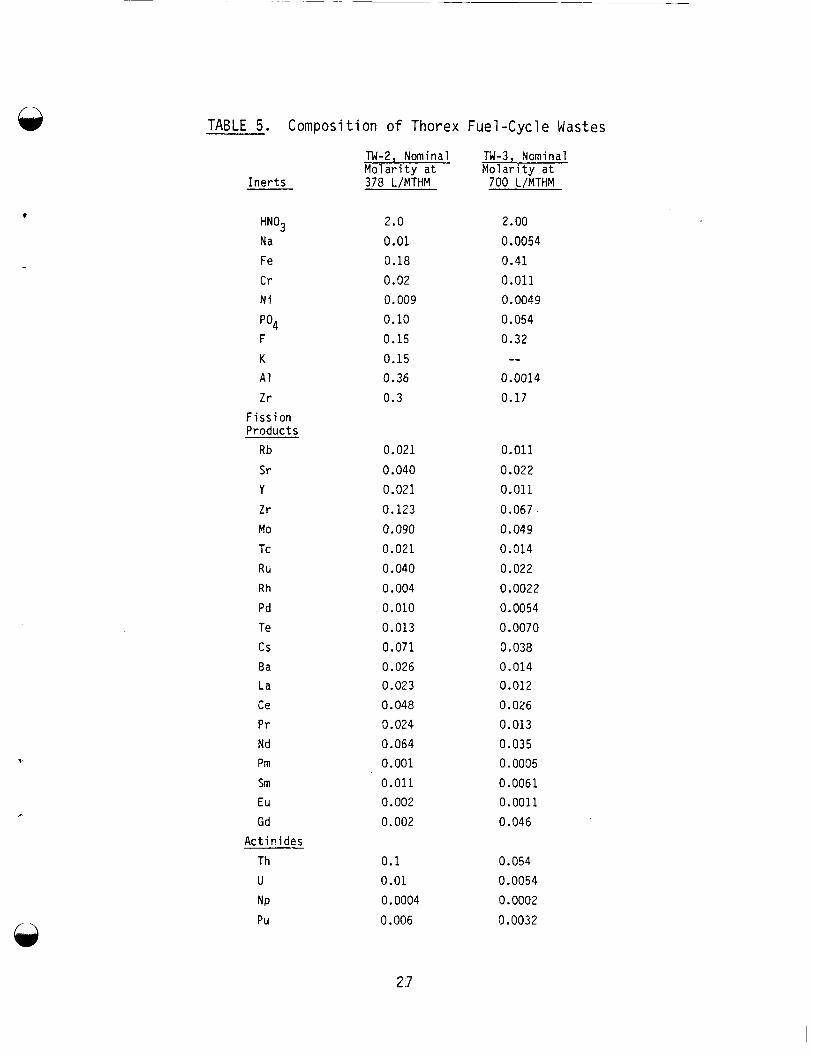
TABLE 5. Composition o f Thorex Fuel-Cycle Wastes
Inerts
HN03 Na Fe Cr Ni
p04 F K
A I Zr
Fission Products
Rb
Sr Y Zr Mo Tc RIA
Rh Pd Te cs Ba La
Ce Pr Nd Pm
Sm
Eu Gd
A c t i v i des Th
U
NP Pu
2.0 0.01 0.18 0.02 0.009 0.10 0.15 0.15 0.36 0.3
0.021
0.040 0.021 0.123 0.090
0.021 0.040 0.004 0.010 0.013 0.071 0.026 0.023 0.048 0.024 0.064 0.001 0.011 0.002 0.002
0.1 0.01
0.0004 0.006
700 L / ~ T H M
2.00 0.0054 0.41 0.011 0.0049 0.054 0.32 --
0.0014 0.17
0.011 0.022 0.011 0.067 0.049 0.014 0.022 0.0022 0.0054 0.0070 0.038 0.014 0.012 0.026 0.013 0.035 0.0005 0.0061 0.0011 0.046
0.054 0.0054 0.0002 0.0032
2 7
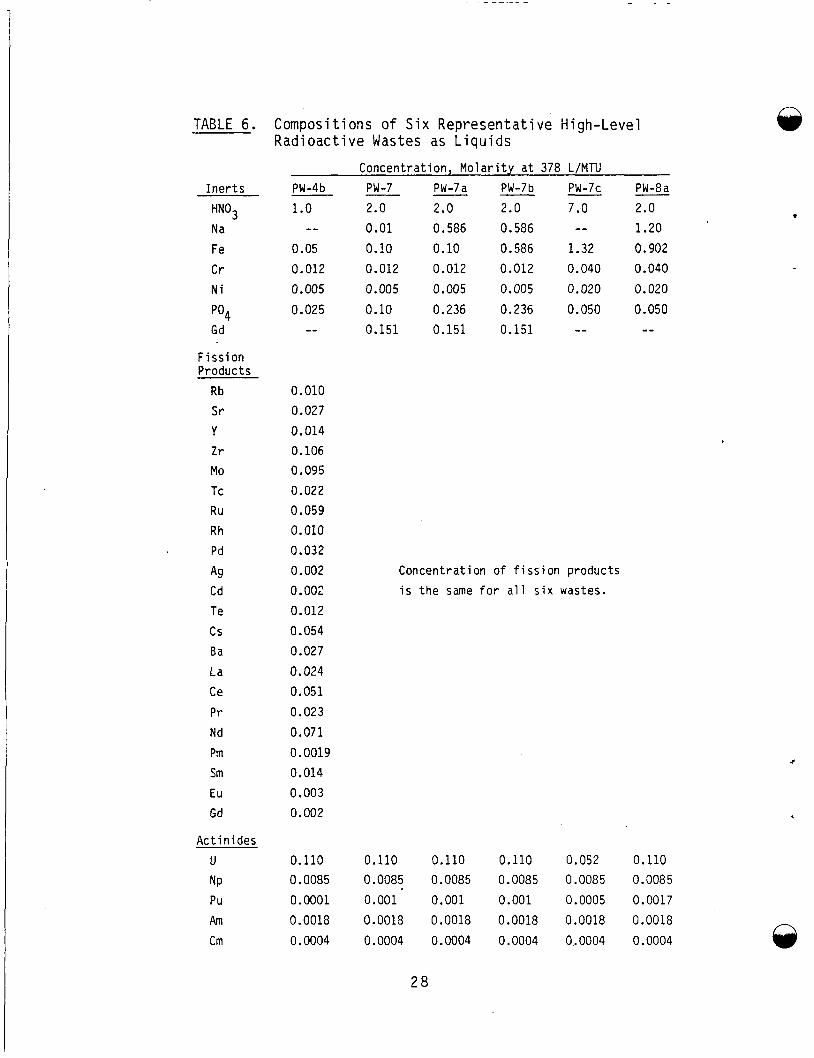
TABLE 6.
I n e r t s HN03 Na Fe C r N i
p04 Gd
F i ss i on Products
Rb S r Y Z r
Mo Tc Ru Rh Pd
Ag Cd Te cs Ba La Ce P r
Nd Pm Sm Eu Gd
Act i n i des U NP Pu Am
Cm
Composi t ions of S i x Representa t ive High-Level Rad ioac t i ve Wastes as L i q u i d s
PW-4b
1.0 --
0.05 0.012 0.005 0.025
--
Concentration, M o l a r i t y a t 378 L/MTU PW-7 PW-7a PW-7b PW-7c 2.0 2.0 2.0 7.0 0.01 0.586 0.586 -- 0.10 0.10 0.586 1.32 0.012 0.012 0.012 0.040
0.005 0.005 0.005 0.020
0.10 0.236 0.236 0.050 0.151 0.151 0.151 --
0.010 0.027 0.014 0.106
0.095 0.022 0.059 0.010 0.032 0.002 Concentrat ion of f i s s i o n products 0.002 i s the same f o r a l l s i x wastes.
0.012 0.054 0.027 0.024 0.051 0.023 0.071 0.0019 0.014 0.003 0.002
PW-8a 2.0 1.20 0.902 0.040 0.020 0.050
0.110 0.110 0.110 0.110 0.052 0.110 0.0085 0.0085 0.0085 0.0085 0.0085 0.0085 0.0001 0.001 0.001 0.001 0.0005 0.0017 0.0018 0.0018 0.0018 0.0018 0.0018 0.0018 0.0004 0.0004 0.0004 0.0004 0.0004 0.0004
2 8
A
c
v) v)
E 15 a
2 e 10 LL 0 s 5
E 15
a 2
lo
e k 5 0 s
1 10 100
PARTICLE DIAMETER, wn
FIGURE 12. Typical Spray-Calcine Particle-Size Distribution
TABLE 7. Physical Properties of Representative Calcined High-Level Wastes
Characteristics 3
Aerated bulk Working bulk Packed bulk Part i cl e
Density, g/cm
Compressibility Angle of repose Surface area, m /g
Nitrate content, wt% Moisture content, wt% Equilibrium aqueous slurry pH
2
Waste Calcine Types PW-4b PW-6 PW-7a
0.85 0.97 1.24
4.4 32% 42 20 1 1
4.5
0.41 0.48 0.61 3.8 33% 39O 11 19 1 5.0
0.69-0.92 0.87-1.04 1.15-1.33 5.1
43O-42' 14 2
40%-31%
1-4 --
29
A
4
SOURCE TERMS
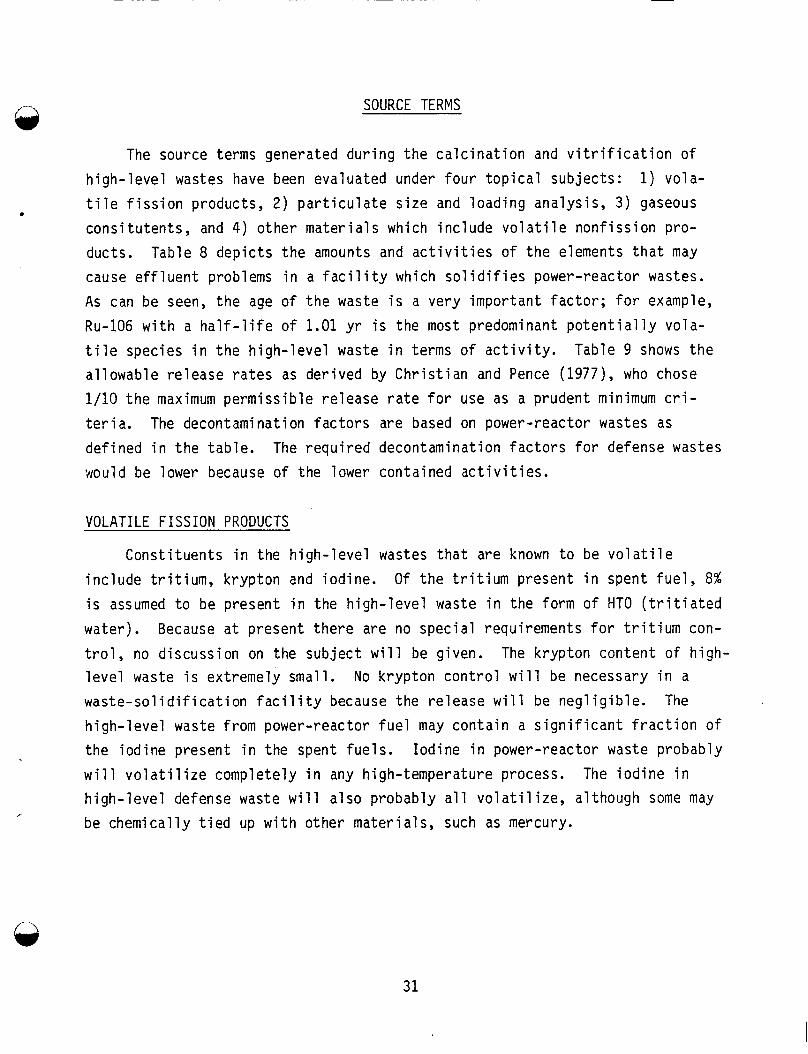
The source terms generated d u r i n g t h e c a l c i n a t i o n and v i t r i f i c a t i o n o f
h i g h - l e v e l wastes have been evaluated under f o u r t o p i c a l sub jec ts : t i l e f i s s i o n products , 2 ) p a r t i c u l a t e s i z e and l o a d i n g ana lys is , 3 ) gaseous
c o n s i t u t e n t s , and 4 ) o t h e r m a t e r i a l s which i n c l u d e v o l a t i l e n o n f i s s i o n pro- ducts. Table 8 d e p i c t s t h e amounts and a c t i v i t i e s o f t h e elements t h a t may cause e f f l u e n t p rob ems i n a f a c i l i t y which s o l i d i f i e s power-reactor wastes. As can be seen, t h e age o f t h e waste i s a ve ry impor tan t f a c t o r ; f o r example,
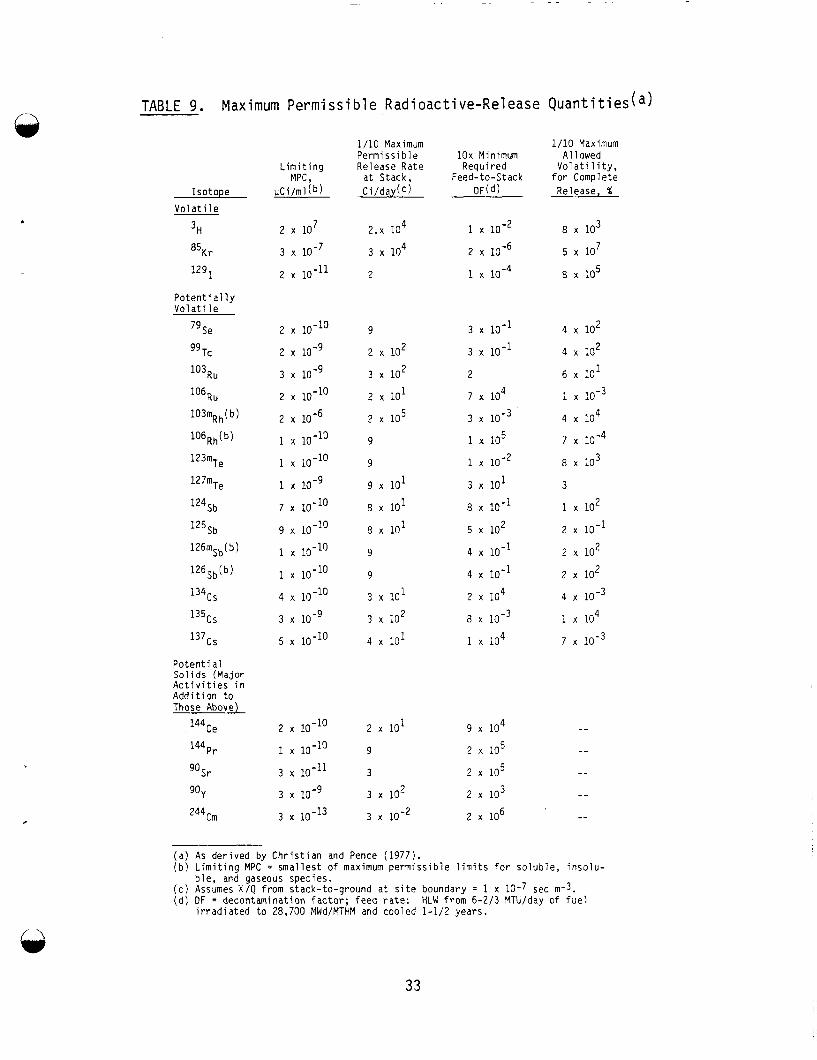
Ru-106 w i t h a h a l f - i f e o f 1.01 yr i s t he most predominant p o t e n t i a l l y vo la - t i l e spec ies i n t h e h i g h - l e v e l waste i n terms o f a c t i v i t y . Table 9 shows t h e a l l owab le r e l e a s e r a t e s as de r i ved by C h r i s t i a n and Pence (1977), who chose 1/10 t h e maximum p e r m i s s i b l e re lease r a t e f o r use as a p rudent minimum c r i -
t e r i a . The decontaminat ion f a c t o r s are based on power- reactor wastes as
de f i ned i n t h e t a b l e . would be lower because o f the lower conta ined a c t i v i t i e s .
1 ) vo la -
The r e q u i r e d decontaminat ion f a c t o r s f o r defense wastes
VOLATILE FISSION PRODUCTS
Cons t i t uen ts i n the h i g h - l e v e l wastes t h a t are known t o be v o l a t i l e i n c l u d e t r i t i u m , k ryp ton and iod ine . O f t h e t r i t i u m present i n spent f u e l , 8%
i s assumed t o be present i n the h i g h - l e v e l waste i n the form o f HTO ( t r i t i a t e d
water) . Because a t p resent t h e r e are no spec ia l requi rements f o r t r i t i u m con-
t r o l , no d i scuss ion on the s u b j e c t w i l l be given. The k ryp ton conten t o f h igh- l e v e l waste i s ex t remely smal l . No k ryp ton c o n t r o l w i l l be necessary i n a w a s t e - s o l i d i f i c a t i o n f a c i l i t y because the r e l e a s e w i l l be n e g l i g i b l e . The
h i g h - l e v e l waste f rom power- reactor f u e l may c o n t a i n a s i g n i f i c a n t f r a c t i o n o f t h e i o d i n e present i n the spent f u e l s . I o d i n e i n power-reactor waste p robab ly
w i l l v o l a t i l i z e comple te ly i n any h igh- temperature process. h i g h - l e v e l defense waste w i l l a l s o p robab ly a l l v o l a t i l i z e , a l though some may be chemica l l y t i e d up w i t h o the r m a t e r i a l s , such as mercury.
The i o d i n e i n
31
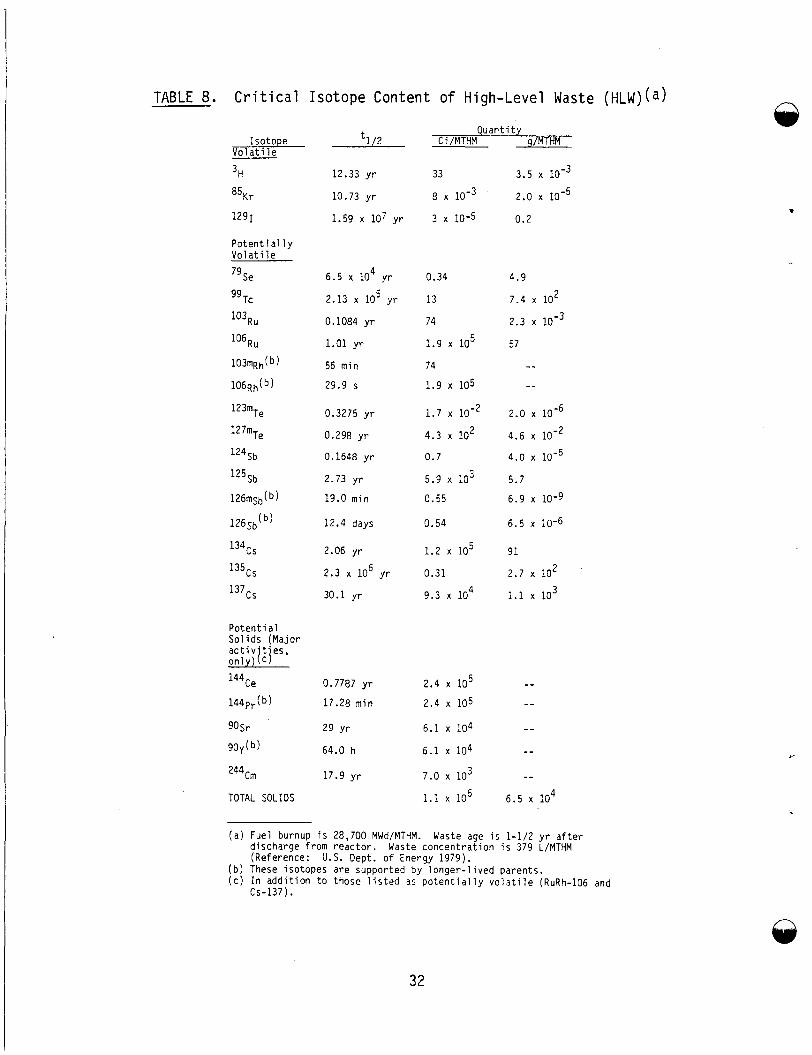
TABLE 8. Critical IsotoDe Content o f High-Level Waste (HLW)(a)
Isotope Vol at i le
3H
85Kr
1291
Potenti a1 1 y Volatile
79~e
"Tc
R u
lo6Ru 103mRh( b,
106~h ( b )
123mTe
127mTe
lZ4Sb
125Sb 126msb( b,
126~b(~)
134cs
135cs
137cs
Potential Solids (Major x;i;[tjes,
Y
144ce 144pr( b,
90~r
90y(b)
244~m
TOTAL SOLIDS
tl/2
12.33 yr
10.73 yr
1.59 x lo7 yr
4 6.5 x 10 yr
2.13 x 10 yr
0.1084 yr
1.01 yr
56 min 29.9 s
0.3275 yr
0.298 yr
0.1648 yr
2.73 yr 19.0 min
12.4 days
2.06 yr
2.3 x 10 yr
30.1 yr
5
6
0.7787 yr
17.28 min
29 yr
64.0 h
17.9 yr
Quantity C i /MTHM g/MTHM
33
8 x
3 10-5
0.34
13
74
1.9 lo5
1.9 105
4.3 x 10²
5.9 lo3
74
1.7 x
0.7
0.55
0.54
1.2 lo5
9.3 lo4
0.31
2.4 x 10' 2.4 105
6.1 104
6.1 x 10⁴
7.0 lo3
1.1 x lo6
3.5
2.0
0.2
4.9
7.4 x 10 2
2.3
57
-- --
2.0 x 10⁻⁶
4.0
6.9 10-9
4.6 x
5.7
6.5 x 10⁻⁶
91
2.7 x lo2 3 1.1 x 10
-- --
-- --
--
6.5 lo4
(a) Fuel burnup is 28,700 MWd/MTHM. discharge from reactor. Waste concentration is 379 L/MTHM (Reference:
(b) These isotopes are supported by longer-lived parents. (c) In addition to those listed as potentially volatile (RuRh-106 and
Waste age is 1-1/2 yr after
U.S. Dept. o f Energy 1979).
CS-137).
32
,
TABLE 9. Maximum Perm iss ib le Radioact ive-Release
I s o t ope
Vo l a t i l e
3 H
85Kr
12g1
P o t e n t i a l l y Vol a t i l e
7 9 ~ e
99 Tc
lo3Ru
lo6Ru
1 0 3 m ~ h ( b )
1 0 6 ~ h ( b )
123mTe
127mTe
124Sb
125Sb
126msb(b)
1 2 6 s b ( b )
134cs
135cs
137cs
P o t e n t i a1 S o l i d s (Major A c t i v i t i e s i n A d d i t i o n t o Those Above)
1 4 4 ~ e
144~r
Y
2 4 4 ~ m
L i m i t i n g MPC,
p C i / m l ( b )
2 10'
3
2 x 10-11
2 x 10⁻¹⁰
2
3
2 x 10⁻¹⁰
2 x 10⁻⁶
1 x 10⁻¹⁰
1 x 10⁻¹⁰
1
7 x 10⁻¹⁰
9 x 10⁻¹⁰
1 x 10⁻¹⁰
1 x 10⁻¹⁰
4 x 10⁻¹⁰
3
5 x 10⁻¹⁰
2 x 10⁻¹⁰
1 x 10⁻¹⁰
3 x 10-11
3
3 1 0 - l ~
1/10 Maximum P e r m i s s i b l e l o x Minimum Release Rate R e q u i r e d
a t S tack , Feed- to -Stack C i /day ( c D F ( ~ )
2.x 10 4 1 x 10⁻²
3 l o 4 2 x 10⁻⁶
2 1
9 3 x 10⁻¹
2 x l o 2 3 x 10⁻¹
3 x 10² 2
2 x lo1 7 l o 4 2 l o 5 3
9 1 lo5
9 1 x
9 x 101
8 x l o 1
3 x 101
5 x l o 2 8 x 10' 8 x 10⁻¹
9 4 x 10⁻¹
9 4 x 10⁻¹
3 x 101 2 l o 4
4 x l o 1 1 l o 4
3 x l o 2 8 x
2 x 101 9 l o 4 9 2 lo5
3 2 l o 5 3 x 10² 2 l o 3 3 x 10⁻² 2 x l o6
Quan t i t i e s ( a)
1 / 1 0 Maximum A1 1 owed
V o l a t i l i t y , f o r Complete
Release, %
8 x l o 3 5 l o 7
8 l o 5
4 x l o 2 4 x l o 2
1
4 lo4
7
6 x l o 1
8 x l o 3 3
( a ) As d e r i v e d by C h r i s t i a n and Pence (1977) . ( b ) L i m i t i n g MPC = s m a l l e s t o f maximum p e r m i s s i b l e l i m i t s f o r s o l u b l e , i n s o l u -
( c ) Assumes X/Q f r o m s t a c k - t o - g r o u n d a t s i t e boundary = 1 x 10⁻⁷ sec m-3. (d ) OF = d e c o n t a m i n a t i o n f a c t o r ; f e e d r a t e :
b l e , and gaseous spec ies .
i r r a d i a t e d t o 28,700 MWd/MTHM and c o o l e d 1-1 /2 y e a r s . HLW f r o m 6-2 /3 MTU/day o f fuel
33
Elements t ha t may be poten t ia l ly v o l a t i l e i n a waste so l id i f i ca t ion pro- cess include: R u , Cs, Sb, Te, Tc and se. Based on Table 9 , the v o l a t i l e and poten t ia l ly v o l a t i l e elements of primary concern are ruthenium and cesium. required decontamination f ac to r s are higher f o r ruthenium and cesium than fo r any other vo la t i l e or poten t ia l ly v o l a t i l e element, with the exception of I o 6 R h , a daughter product of the ruthenium, b u t with a shorter h a l f - l i f e ( Rh has a h a l f - l i f e of 29.9 s ) . In general then, i t can be s ta ted t h a t i f an e f f luent control system provides su f f i c i en t cleanup t o control the ruthenium and cesium, i t will a lso provide more than su f f i c i en t cleanup f o r the other v o l a t i l e f i ss ion products.
The
106
Ruthenium i s not merely a v o l a t i l e metal. or above, the formation of gaseous Ru04 takes place. the Ru03 vapor species is formed by the reaction of O2 or NO2 with Ru02. The formation reactions become more thermodynamically favorable as the temper- a ture increases. The formation of a s t ab le , gaseous, complex, n i t ro sy l -n i t r a t e form of ruthenium apparently occurs a t temperatures abou t 800°C or below, and i n the presence of n i t r i c acid. The v o l a t i l i t y of the complex form of ruthe- n i u m increases as the s o l i d i f i e r temperature decreases. Thus, control must be maintained by minimizing the v o l a t i l i t y i n i t i a l l y .
A t temperatures about 8OO0C A t higher temperatures,
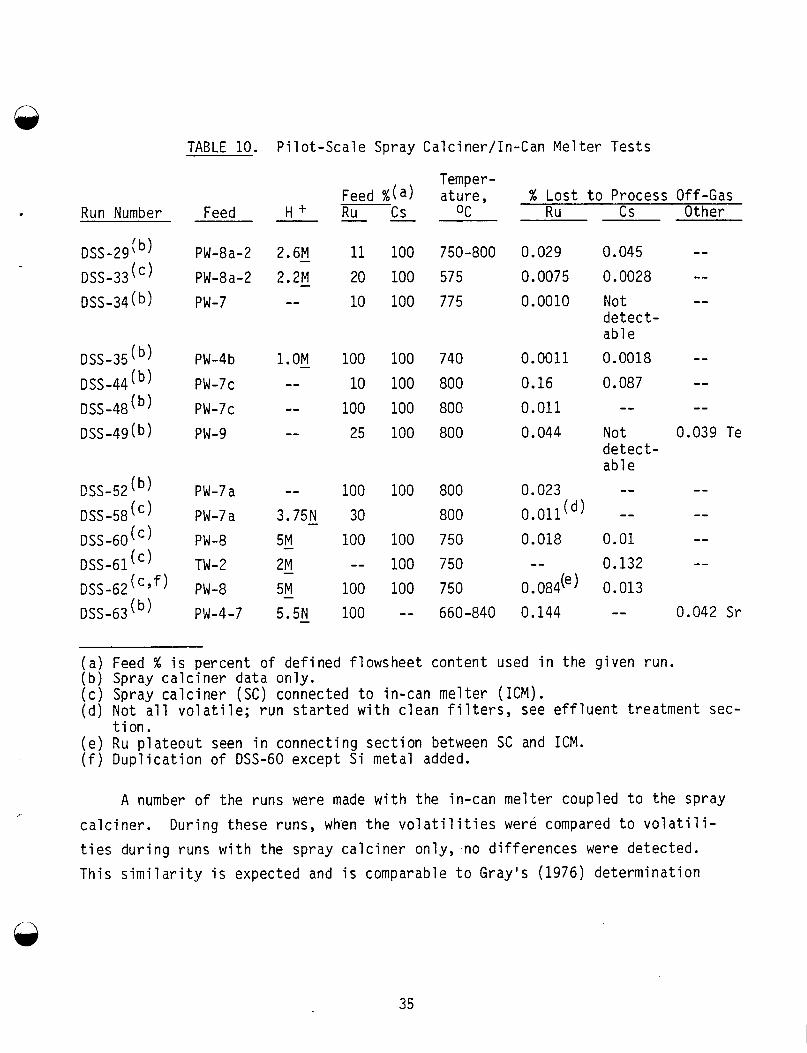
Therefore, a t ten t ion has been placed on determining ruthenium and cesium T h i s work has been losses from the spray calciner and in-can melter systems.
done primarily i n the p i lo t - sca le spray ca lc iner and in-can melter systems. var ie ty of feeds containing rut.henium and cesium were processed a t several d i f f e ren t temperatures. Table 10 gives the general r e s u l t s of the t e s t s . Overall average to t a l ruthenium and cesium losses were 0.045% and 0.042%, res - pectively, f o r a l l tests. Ruthenium losses varied from 0.001% t o 0.16%, and cesium losses varied from "not detectable" t o 0.132%. Correlations between v o l a t i l i t y and H content, or v o l a t i l i t y and operating temperatures were not possible due t o the large number of var iables , except for run number DSS-29. Half of t h i s run was made w i t h 2M - H+ and half w i t h 6M - H+.
i n v o l a t i l i t i e s were noted i n e i t he r half .
A
+
No differences
34
Run Number
DSS-29 b,
DSS-33(') DSS-34 ( b )
DSS-35( b,
DSS-44(b) DSS-48(b) DSS-49 ( b )
CSS-52 ( b )
DSS-58(') DSS-60 (' DSS-61 DSS-62 (' y f )
( b ) DSS-63
TABLE 10.
Feed
PW -8 a- 2
PW-8a-2 PW-7
PW-4b
PW-7c PW-7c PW-9
PW-7 a
PW-7 a PW-8 TW-2 PW-8 PW-4-7
P i l o t - S c a l e Spray Calc iner/ In-Can M e l t e r Tests
2.6M - 11 2.2M - 20 -- 10
1.OM - 100 -- 10
-- 100 -- 25
-- 100
3.75N 30 - 5M - 100
5M - 100
2M -- -
5.5N 100 -
100 100 100
100
100 100 100
100
100 100 100 --
Temp e r - a t ure ,
OC
750-800
57 5 775
740
800
800 800
800 800 750 750 750 660 -840
% Los t t o Process Off-Gas Ru c s Other
0.029 0.0075 0.0010
0.0011
0.16
0.011 0.044
0.023 0.01 1 ( d l 0.018
0. 084(e) 0.144
--
0.045 0.0028
Not d e t e c t - ab le 0.0018
0.087 --
Not d e t e c t - ab le
-- --
0.01
0.132 0.013 --
( a ) Feed % i s percent o f de f i ned f lowsheet content used i n the given run. ( b ) Spray c a l c i n e r data on ly . ( c ) Spray c a l c i ner ( S C ) connected t o in-can me1 t e r ( I C M ) . (d ) Not a l l v o l a t i l e ; r u n s t a r t e d w i t h c lean f i l t e r s , see e f f l u e n t t reatment sec-
( e ) Ru p l a t e o u t seen i n connect ing s e c t i o n between SC and ICM. ( f ) D u p l i c a t i o n o f DSS-60 except S i metal added.
t i o n .
A number of t he runs were made w i t h t h e in-can m e l t e r coupled t o t h e spray 7
c a l c i n e r . t i e s d u r i n g runs w i t h the spray c a l c i n e r on ly , no d i f f e r e n c e s were detected. Th is s i m i l a r i t y i s expected and i s comparable t o Gray 's (1976) de te rm ina t ion
Dur ing these runs, when t h e v o l a t i l i t i e s were compared t o v o l a t i l i -
35
-2 . of 7 x 10 %/h R u and 1.5% Cs losses from boros i l ica te glasses. I n the in-can melter, a cold cap of unmelted calcine and glass-former mater ia ls rests on top of the melt surface and condenses many of the vo la t i l e materials. Thus, the in-can melting process ac tua l ly gives f a r lower v o l a t i l i t i e s than those from an uncovered molten glass surface.
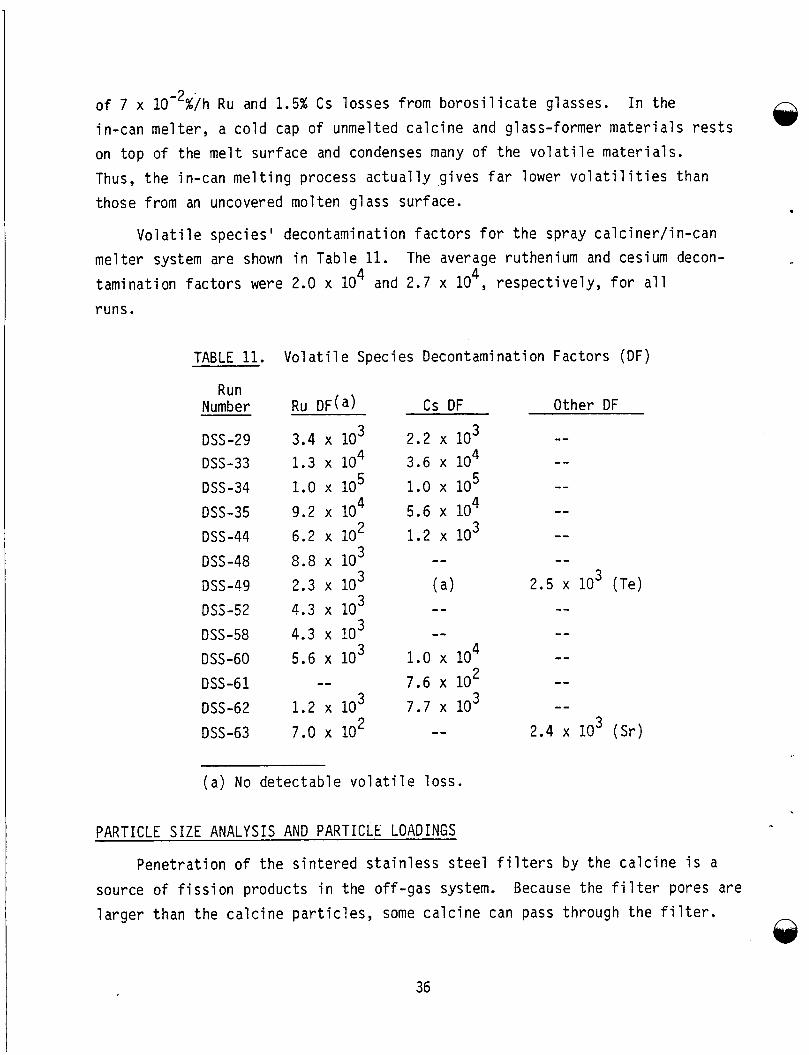
Volat i le species ' decontamination f ac to r s f o r the spray calciner/in-can melter system are shown i n Table 11. tamination fac tors were 2.0 x 10 and 2.7 x 10 , respect ively, f o r a l l runs.
The average ruthenium and cesium decon- 4 4
TABLE 11.
Run Number
DSS-29 DSS-33 DSS-34 DSS-35 DSS-44 DSS -48 DSS-49 DSS-52 DSS-58 DSS-60 DSS-61 DSS-62 DSS-63
Volat i le Species Decontamination Factors ( D F )
R U D F ~ ) Cs DF Other DF
3.4 lo3 2.2 lo3 1.3 lo4 3 . 6 lo4 1.0 x 10 5 1.0 lo5 9.2 lo4 5.6 lo4 6.2 x lo2 1 .2 lo3 8.8 x lo3 -- 2.3 lo3 ( a >
5.6 lo3 1.0 lo4
7.0 x 10' --
-- 3 3
4.3 x 10 4.3 x 10 --
-- 7.6 x 10' 3 1 .2 x 10 7.7 x 10
( a ) No detectable v o l a t i l e loss .
PARTICLE SIZE ANALYSIS AND PARTICLE LOADINGS
Penetration of the s intered s t a in l e s s s t ee l f i l t e r s by the calcine i s a source of f i s s ion products in the off-gas system. larger than the calcine pa r t i c l e s , some calcine can pass through t h e f i l t e r .
Because the f i l t e r pores are
36
.
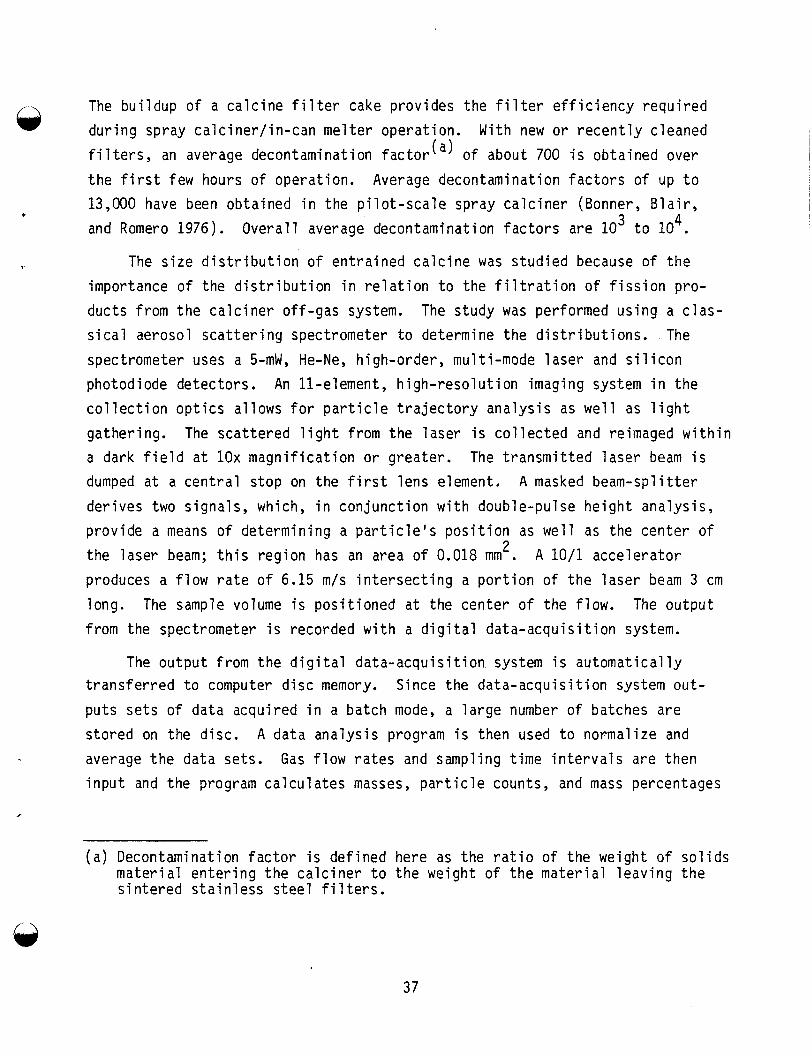
The bu i l dup o f a c a l c i n e f i l t e r cake prov ides the f i l t e r e f f i c i e n c y r e q u i r e d du r ing spray c a l c i n e r / i n - c a n m e l t e r opera t ion . Wi th new o r r e c e n t l y c leaned
f i l t e r s , an average decontaminat ion f a c t o r ( a ) o f about 700 i s ob ta ined over
t h e f i r s t few hours o f opera t ion . Average decontaminat ion f a c t o r s o f up t o 13,000 have been ob ta ined i n the p i l o t - s c a l e spray c a l c i n e r (Bonner, B l a i r ,
and Romero 1976). O v e r a l l average decontaminat ion f a c t o r s are 10 t o 10 . 3 4
The s i z e d i s t r i b u t i o n o f en t ra ined c a l c i n e was s t u d i e d because of t h e
importance o f t he d i s t r i b u t i o n i n r e l a t i o n t o t h e f i l t r a t i o n o f f i s s i o n pro- ducts f rom t h e c a l c i n e r o f f -gas system. s i c a l aerosol s c a t t e r i n g spectrometer t o determine t h e d i s t r i b u t i o n s . The
spectrometer uses a 5-mW, He-Ne, h igh-order , mult i -mode l a s e r and s i l i c o n photodiode de tec tors . An l l - e lemen t , h i g h - r e s o l u t i o n imaging system i n t h e c o l l e c t i o n o p t i c s a l l ows f o r p a r t i c l e t r a j e c t o r y a n a l y s i s as w e l l as l i g h t
ga ther ing . a dark f i e l d a t lox m a g n i f i c a t i o n o r g rea te r . dumped a t a c e n t r a l s top on t h e f i r s t l ens element. A masked beam-sp l i t t e r
de r i ves two s igna ls , which, i n c o n j u n c t i o n w i t h double-pulse h e i g h t ana lys i s , p rov ide a means o f de termin ing a p a r t i c l e ' s p o s i t i o n as w e l l as the cen te r o f
t he l a s e r beam; t h i s r e g i o n has an area of 0.018 mm . A 10/1 a c c e l e r a t o r produces a f l o w r a t e o f 6.15 m/s i n t e r s e c t i n g a p o r t i o n o f t h e l a s e r beam 3 cm
long. The sample volume i s p o s i t i o n e d a t the cen te r o f t he f low. The ou tpu t
f rom the spectrometer i s recorded w i t h a d i g i t a l d a t a - a c q u i s i t i o n system.
The s tudy was performed us ing a c l a s -
The s c a t t e r e d l i g h t f rom t h e l a s e r i s c o l l e c t e d and reimaged w i t h i n The t r a n s m i t t e d l a s e r beam i s
2
The o u t p u t f rom t h e d i g i t a l d a t a - a c q u i s i t i o n system i s a u t o m a t i c a l l y t r a n s f e r r e d t o computer d i s c memory. Since t h e d a t a - a c q u i s i t i o n system out -
pu ts s e t s o f da ta acqu i red i n a ba tch mode, a l a r g e number o f batches a re
s to red on the d i sc . average t h e da ta sets . Gas f l o w r a t e s and sampl ing t ime i n t e r v a l s a re then i n p u t and t h e program c a l c u l a t e s masses, p a r t i c l e counts, and mass percentages
A data a n a l y s i s program i s then used t o normal ize and
,
( a ) Decontaminat ion f a c t o r i s de f i ned here as t h e r a t i o o f t he weight o f s o l i d s m a t e r i a l e n t e r i n g t h e c a l c i n e r t o t h e weight o f t h e m a t e r i a l l e a v i n g t h e s i n t e r e d s t a i n l e s s s t e e l f i l t e r s .
37
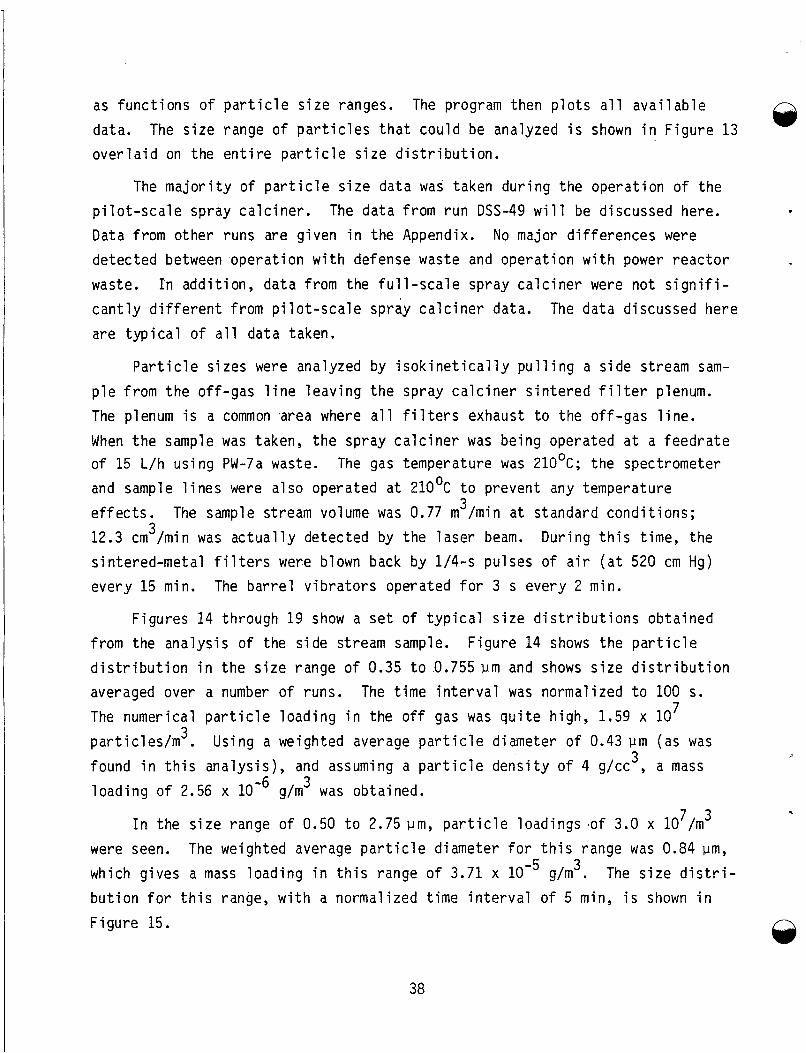
as functions of p a r t i c l e s i ze ranges. data. overlaid on the en t i r e p a r t i c l e s i ze d i s t r i b u t i o n .
The program then plots a l l avai lable The s ize range of p a r t i c l e s t ha t could be analyzed i s shown in Figure 13
The majority of p a r t i c l e s i ze data was taken d u r i n g the operation of the The data from r u n DSS-49 will be discussed here. p i lo t - sca le spray calciner .
Data from other runs are given i n the Appendix. No major differences were detected between operation w i t h defense waste and operation w i t h power reactor waste. In addition, da t a from the f u l l - s c a l e spray calciner were not s i g n i f i - cant ly d i f fe ren t from pi lo t - sca le spray calciner data. are typical of a l l data taken.
-
The data discussed here
Pa r t i c l e s izes were analyzed by i sok ine t i ca l ly pulling a s ide stream sam- ple from the off-gas l i n e leaving the spray calciner s intered f i l t e r plenum. The plenum i s a common 'area where a l l f i l t e r s exhaust t o the off-gas l ine . When the sample was taken, the spray ca lc iner was being operated a t a feedra te o f 15 L/h u s i n g PW-7a waste. The gas temperature was 210°C; the spectrometer and sample l ines were also operated a t 21OoC t o prevent any temperature e f f ec t s .
3 12.3 cm /min was actual ly detected by the laser beam. D u r i n g t h i s time, the sintered-metal f i l t e r s were blown back by 1/4-s pulses of a i r ( a t 520 cm Hg) every 15 min.
3 The sample stream volume was 0.77 m /min a t standard conditions;
The barrel vibrators operated for 3 s every 2 m i n .
Figures 14 through 19 show a s e t of typical s i z e d is t r ibu t ions obtained from the analysis of the s ide stream sample. d i s t r ibu t ion in the s i z e range of 0.35 t o 0.755 pm and shows s i z e d i s t r ibu t ion averaged over a number of runs. The numerical p a r t i c l e loading i n the off gas was qui te h i g h , 1.59 x 10 particles/m . f o u n d i n t h i s ana lys i s ) , and assuming a p a r t i c l e density of 4 g/cc3, a mass loading of 2.56 x g/m was obtained.
Figure 14 shows the p a r t i c l e
The time interval was normalized t o 100 s. 7
3 Using a weighted average p a r t i c l e diameter of 0.43 pm (a s was
3
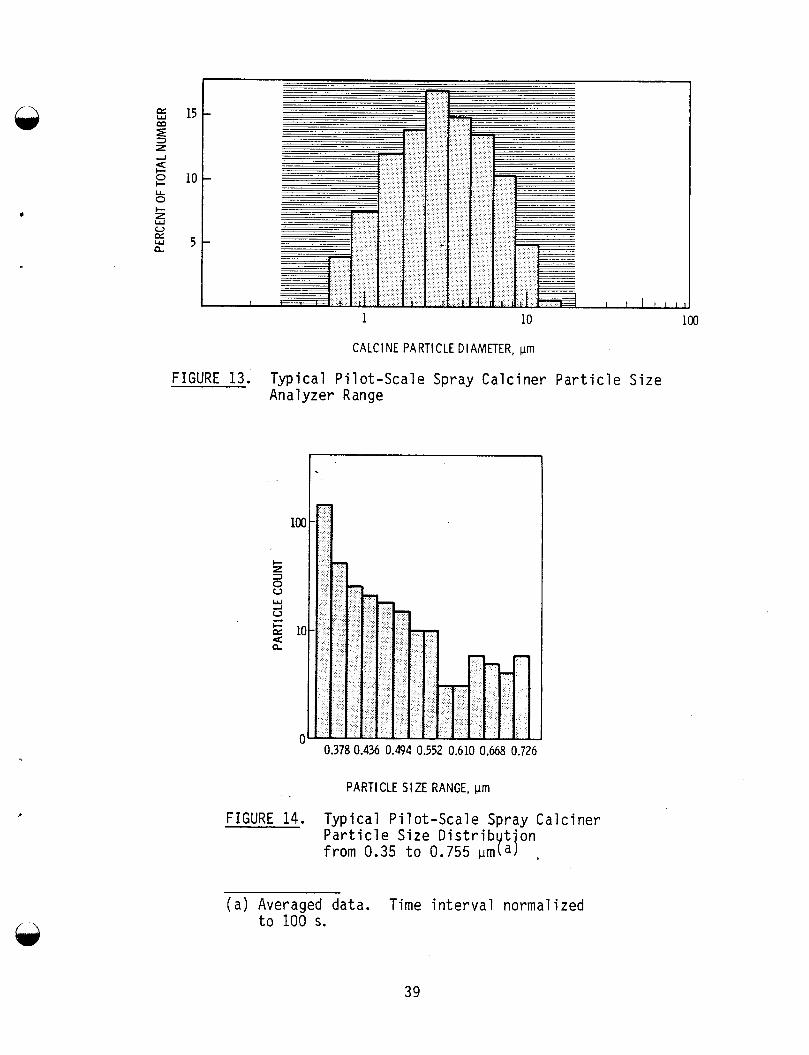
7 3 In the s i z e range of 0.50 t o 2.75 pm, p a r t i c l e loadings 'of 3.0 x 10 /m were seen. which gives a mass loading i n this range of 3.71 x bution f o r this range, with a normalized time interval of 5 m i n , i s shown i n Figure 15.
The weighted average p a r t i c l e diameter for this range was 0.84 pm,
g/m3. The s i z e d i s t r i -
.
n
,
1 10 100
CALCINE PARTICLE DIAMETER, prn
FIGURE 13. Typical Pilot-Scale Spray Calciner Particle Size Analyzer Range
0.378 0.436 0.494 0.552 0.610 0.668 0.726
PARTICLE SIZE RANGE, Vrn
FIGURE 14. Typical Pilot-Scale Spray Calciner Particle Size Distribution from 0.35 to 0.755 vm(a) ,
(a) Averaged data. to 100 s.
Time interval normalized
39
800
700
5 600
8 500 0
400 0 F 300 a d 200
100
0 0.50 0.80 1.10 1.40 1.70 2.00 2.30 2.60
PARTJCLE SIZE, ,um
FIGURE 15. Typical Pilot-Scale Spray Calciner Particle Size Distributjon from 0.50 to 2.75 urn (a)
(a) Averaged data. Time interval normalized t o 5 m i n .
1 I- z
0 8 200
ij 5 100
d
w
0 1.00 2.50 4.00 5.50 7.00
PARTICLE SIZE, ,urn
FIGURE 16. Typical Pilot-Scale Spray Calciner Particle Size Distributjon from 1.00 to 7.75 pm (a)
(a) Average data. Time interval normalized to 10 min.
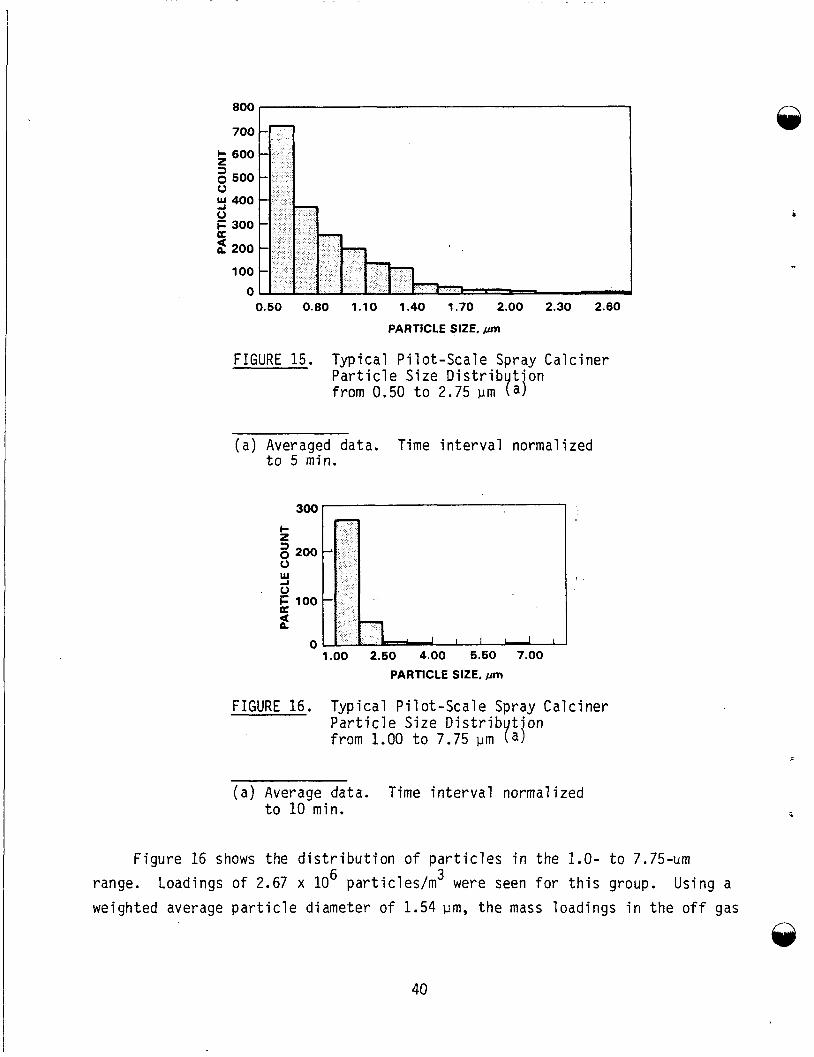
Figure 16 shows the distribution o f particles in the 1.0- t o 7.75-urn 6 3 range. Loadings of 2.67 x 10 particles/m were seen for this group. Using a
weighted average particle diameter of 1.54 pm, the mass loadings in the off gas
i
.
40
2.0 4.4 6.8 9.2 11.6 14.0 16.4 18.8
PARTICLE SIZE, pm
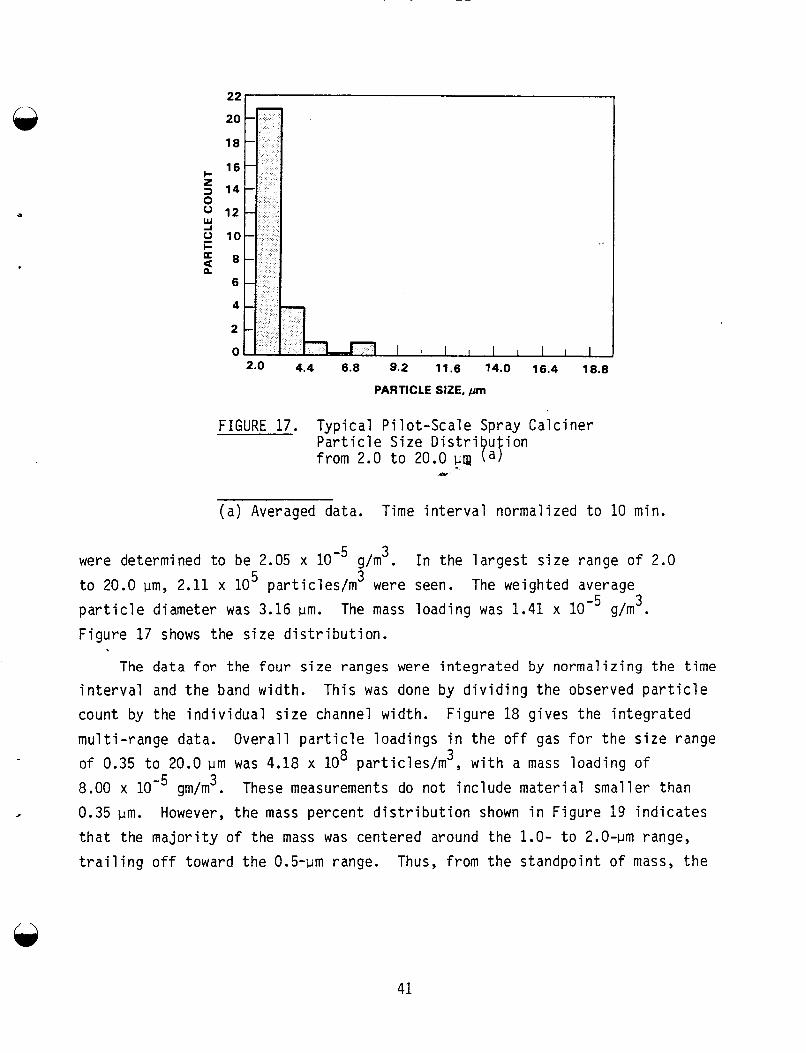
FIGURE 17. Typical Pilot-Scale Spray Calciner Pa r t i c l e Size from 2.0 t o 20.0 p a
.F
( a ) Averaged data. Time interval normalized t o 10 m i n .
3 were determined t o be 2.05 x loe5 g/m . t o 20.0 pm, 2.11 x 10 particles/m were seen. The weighted average p a r t i c l e diameter was 3.16 pm. The mass loading was 1.41 x g/m . Figure 17 shows the s ize d is t r ibu t ion .
In the la rges t s i ze range of 2.0 5 3
3
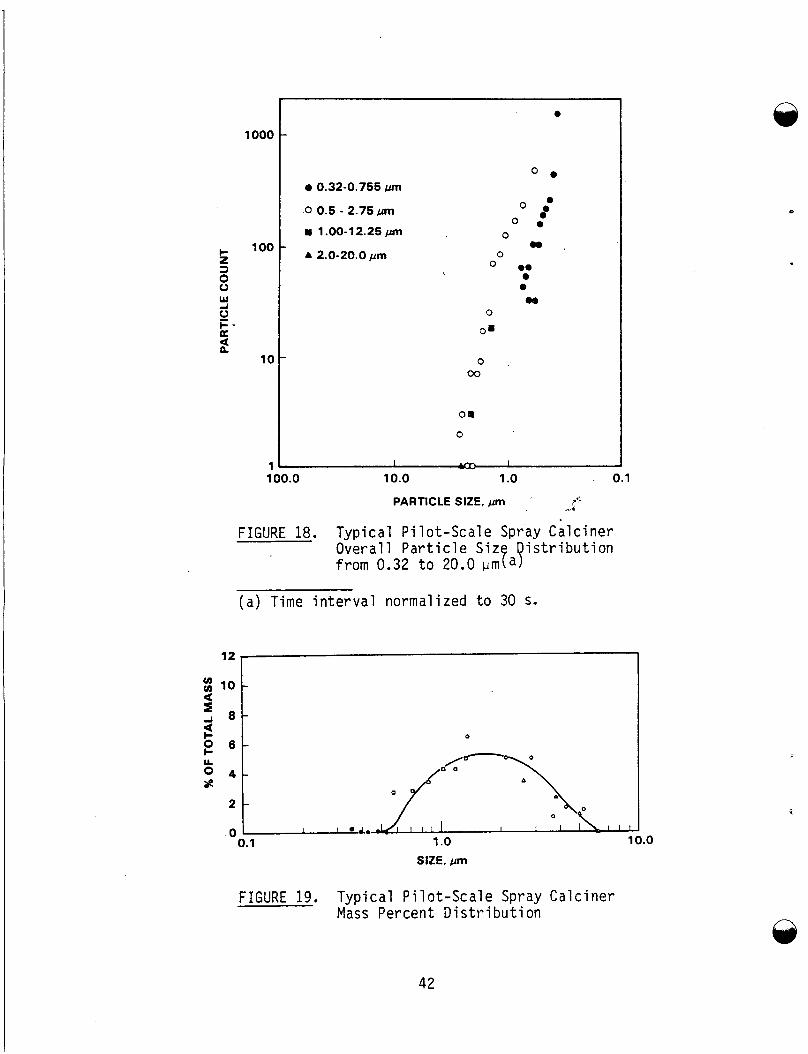
The d a t a f o r the f o u r s ize ranges were integrated by normal iz ing the time
interval and the band w i d t h . count by the individual s i ze channel w i d t h . Figure 18 gives the integrated multi-range data. of 0.35 t o 20.0 pm was 4.18 x 10 p a r t i c l e s h , w i t h a mass loading of 8.00 x These measurements do not include material smaller than 0.35 urn. However, the mass percent d i s t r ibu t ion shown i n Figure 19 indicates t ha t the majority of the mass was centered around the 1.0- t o 2.0-pm range, t r a i l i n g o f f toward the 0.5-pm range.
T h i s was done by dividing the observed p a r t i c l e
Overall p a r t i c l e loadings in the o f f gas for the s i z e range 8 3
gm/m3. ,
T h u s , from the standpoint of mass, the
41
A
1000
100
10
1
e
O e e 0.32-0.755 ptn
0 0.5 - 2.75pm 0 :
0 : 0 m 1 .OO-12.25 prn
- w b 2.0-20.0 pm 0
0 .e e e ea
0
0.
0 , 00
08
0
100.0 1 .o 10.0
PARTICLE SIZE, prn
. 0.1 ,7!
.. 4
FIGURE 18. Typical Pi lot-Scale Spray Calciner Overall P a r t i c l e Siz i s t r ibu t ion from 0.32 t o 20.0 prn ea7
( a ) Time interval normalized t o 30 s.
12
0
c -
$ 4 1 , y;-\Ll,, 2
0 +a- 1 .o 10.0 0.1
SIZE. pm
FIGURE 19. Typical Pi lot-Scale Spray Calciner Mass Percent Distr ibut ion
42
par t i c l e s smaller than 0.35 pm were ins igni f icant . data, the gross so l ids de-entrainment eff ic iency of the s intered f i l t e r s was 99.999%.
Based on the p a r t i c l e s i z e 6rs
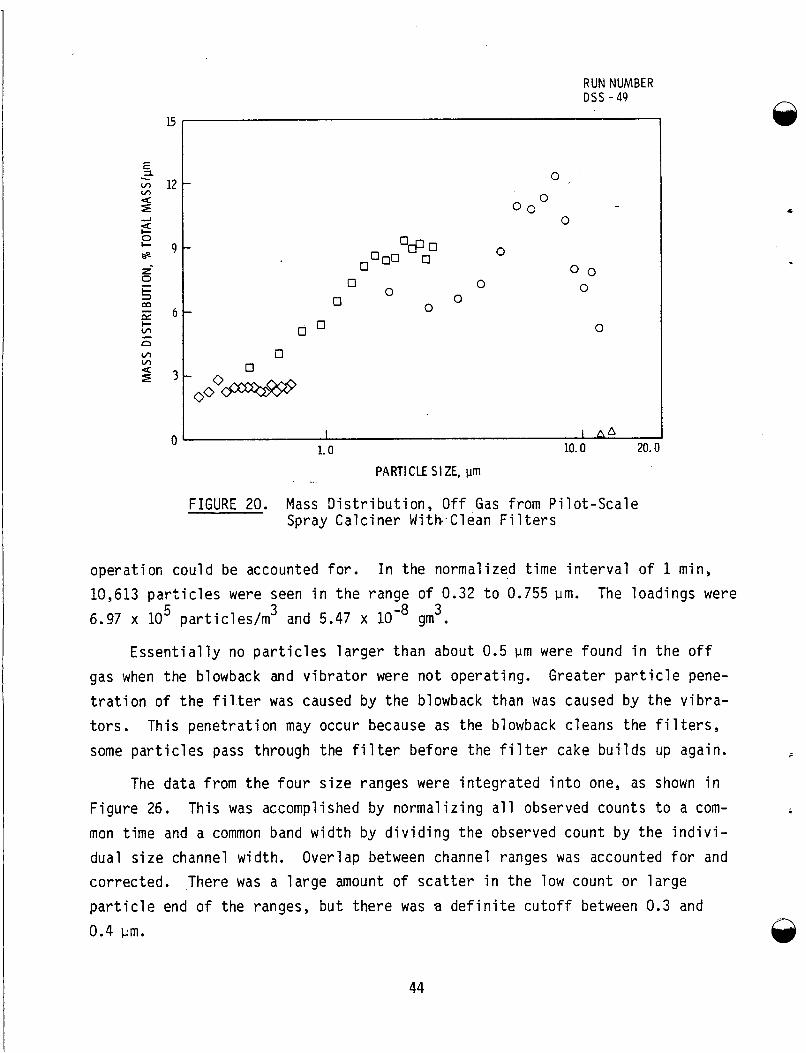
Par t icu la te data in the Appendix includes p i lo t - sca le spray calciner runs
0 DSS-47, 49, 50 and 51. Table 12 gives the operating conditions f o r the runs. The s intered f i l t e r s were cleaned prior t o r u n DSS-49 and Figure 20 shows the e f f ec t . The mass d is t r ibu t ion is skewed toward the larger-sized pa r t i c l e s .
TABLE 12. Spray Calciner Operating Conditions During Par t icu la te Analysis
Run Feed Cal c i ner Fi 1 ter Number Feed Type Rate, L/h Temperature, OC Temperature, OC
DSS -47 Defense 15 850 445 DSS-49 PW-9 15 800 350 DSS-50 Defense 15 600 272 DSS-51 Defense 15
w/G1 ass Formers
700 300
Par t icu la te penetration data from the fu l l - sca l e spray calciner have also besn obtained. operated a t 250 L/h w i t h simulated defense waste. The temperature of the cal- c iner was 78OoC and the f i l t e r s were a t 33OoC. a nominal (98%) p a r t i c l e removal ra t ing of 65 pm.
A t the time the samples were drawn, the calciner was being
The f i l t e r s being used had
Figures 21 through 24 show the data from the fu l l - sca l e spray ca lc iner . The mass loadings given i’n Table 13 were found using the weighted average p a r t i c l e diameters described e a r l i e r and p a r t i c l e dens i t ies of 4 g/cc. p a r t i c l e count i n the smallest s i ze range was by f a r the highest; the very small s i ze of the pa r t i c l e s accounts for the low mass loading.
The
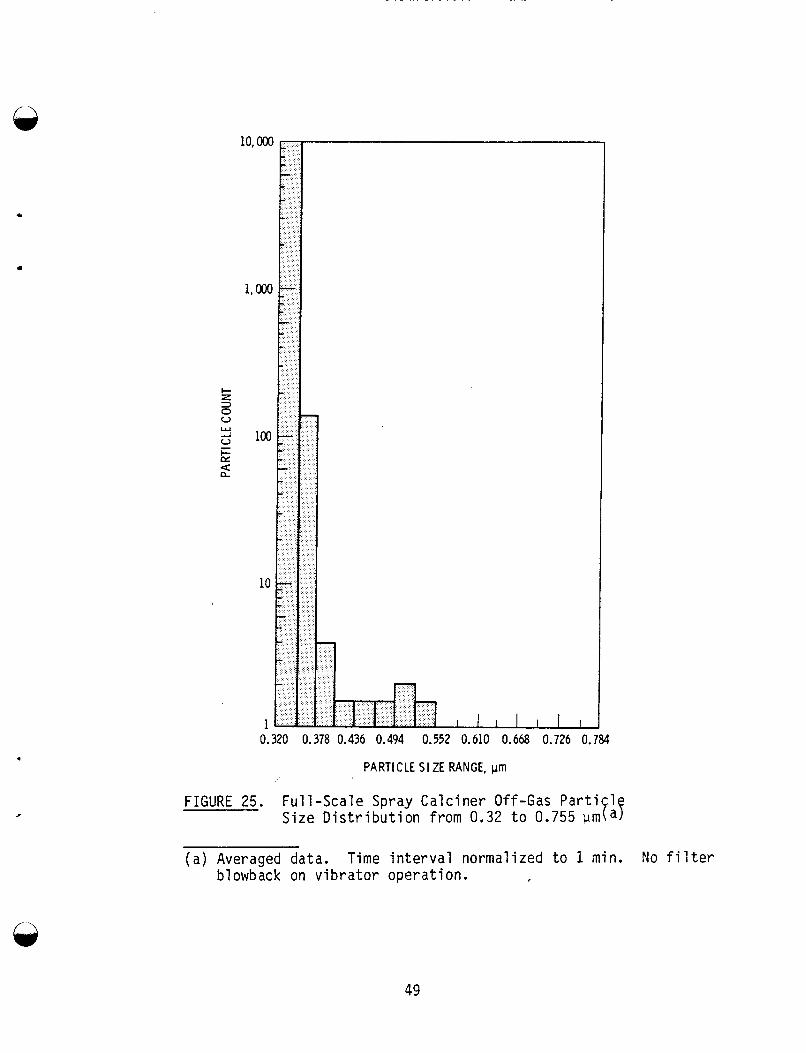
I Since i t appeared t h a t a large portion of the pa r t i c l e s was being released d u r i n g f i l t e r blowback and v i b r a t o r operation, a sample was taken w i t h b o t h f i l t e r blowback and vibrator of f . The r e s u l t s , shown i n Figure 25, indicate tha t only about one-third of the number of pa r t i c l e s detected during normal
43
RUN NUMBER DSS - 4 9
0 0
0 0 0 0
0 0
0 0 0
0
0
I 1 A A 1.0 10.0 20.0
PARTICLE SIZE, pm
FIGURE 20. Mass Distr ibut ion, Off Gas from Pilot-Scale Spray Calciner With.Clean F i l t e r s
operatiori could be accounted fo r . 10,613 pa r t i c l e s were seen in the range of 0.32 t o 0.755 pm.
6.97 x 10 particles/m and 5.47 x gm . In the normalized time interval of 1 m i n ,
The loadings were 5 3 3
Essent ia l ly no pa r t i c l e s larger than about 0.5 pm were f o u n d i n the off gas when the blowback and vibrator were not operating. Greater p a r t i c l e pene- t r a t ion of the f i l t e r was caused by the blowback than was caused by the vibra- t o r s . some par t ic les pass through the f i l t e r before the f i l t e r cake builds up again.
T h i s penetration may occur because as the blowback cleans the f i l t e r s ,
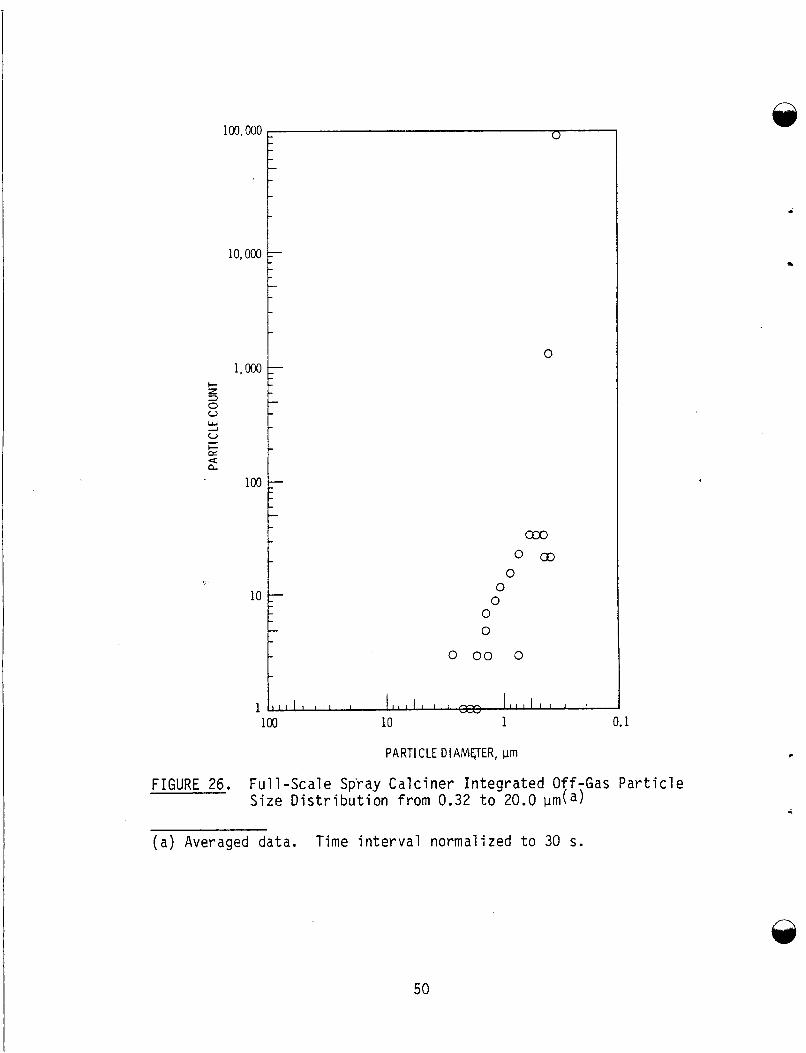
The data from the four s i z e ranges were integrated in to one, as shown in Figure 26. This was accomplished by normalizing a l l observed counts t o a com- mon time and a common band width by dividing the observed count by the indivi- dual s i ze channel w i d t h . Overlap between channel ranges was accounted fo r and corrected. p a r t i c l e end of the ranges, b u t there was a de f in i t e cutoff between 0.3 and
There was a large amount of s c a t t e r in the low count or large
0.4 pm. 0 44
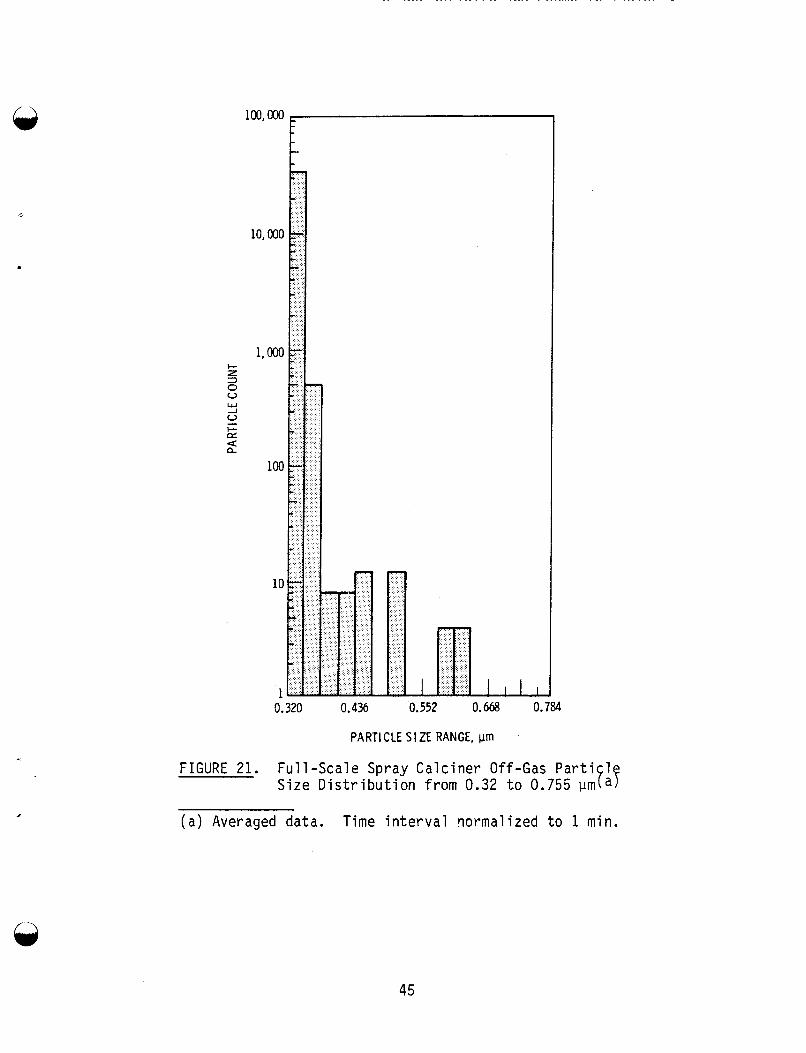
0.320 0.436 0.552 0,668 0.184
PARTICLE SI ZE RANGE, vrn
FIGURE 21. Full-scale Spray Calciner Off-Gas Parti 1 Size Distribution from 0.32 to 0.755 pm taf
, (a) Averaged data. Time interval normalized to 1 min.
45
'-- I 600
500
400
300
200
100
0 0.5 0.8 1.1 1.4 1.7 2.0 2.3 2.6 '
PARTICLE SIZE RANGE, prn
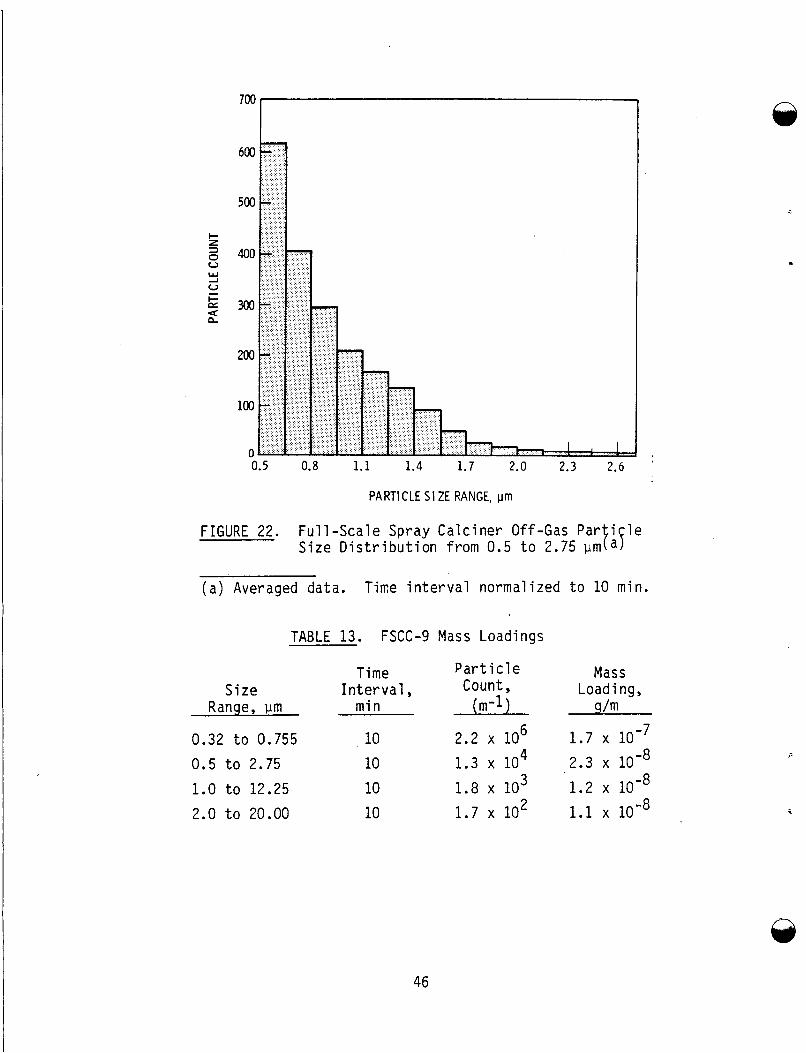
FIGURE 22. F u l l - s c a l e Spray C a l c i n e r Off-Gas Par i l e S ize D i s t r i b u t i o n f rom 0.5 t o 2.75 pm lraF
( a ) Averaged data. TiRe i n t e r v a l normal ized t o 10 min.
TABLE 13. FSCC-9 Mass Loadings
Time P a r t i c l e Mass S i z e I n t e r v a l , Count , Load i ng ,
Range, pm m i n ( m - 1 ) g/m
0.32 t o 0.755 10 2.2 x lo6 1.7
1.0 t o 12.25 10 1.8 lo3 1.2
0.5 t o 2.75 10 1.3 x l o4 2.3 x
2.0 t o 20.00 10 1.7 x 10' 1.1 x lom8
A
.
46
240
200
160
120
80
40
0 5 ' 1.0 2.5 4.0 5.5 7.0 8.5 10.0 11.5
PARTICLE S I ZE RANGE, pm
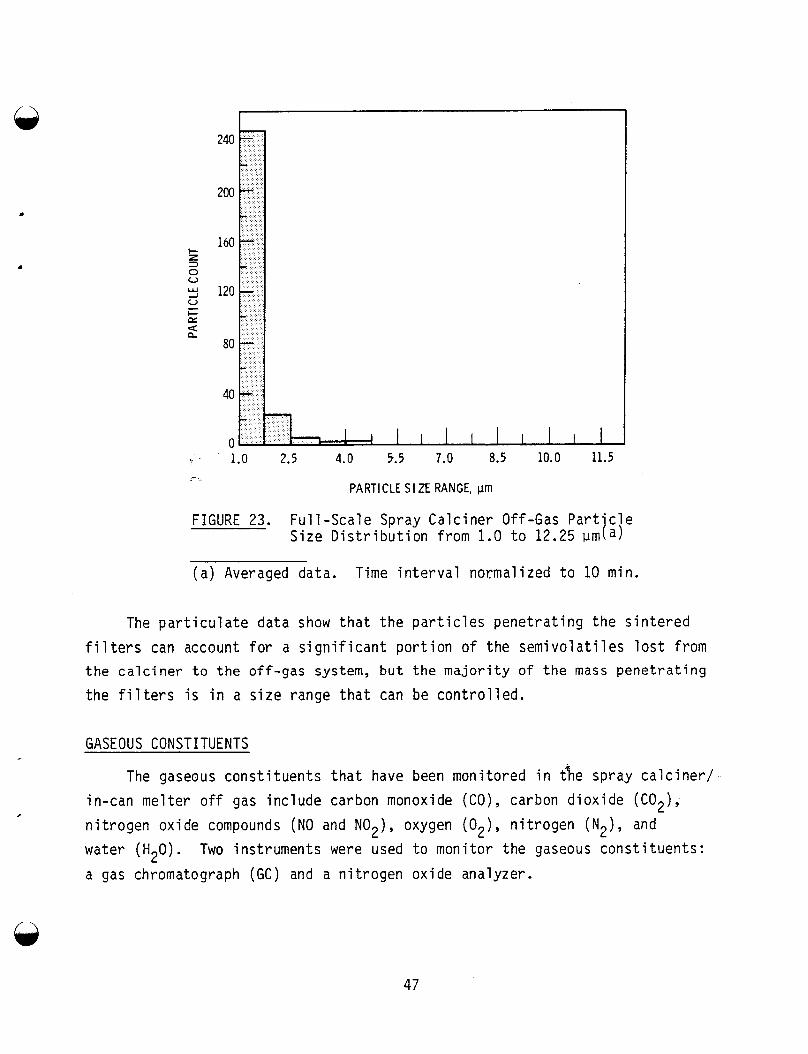
FIGURE 23. F u l l - s c a l e Spray Ca lc ine r Off-Gas P a r t ' c l e S i ze D i s t r i b u t i o n f rom 1.0 t o 12.25 pmta)
( a ) Averaged data. Time i n t e r v a l normal ized t o 10 min.
The p a r t i c u l a t e da ta show t h a t t h e p a r t i c l e s p e n e t r a t i n g t h e s i n t e r e d
f i l t e r s can account f o r a s i g n i f i c a n t p o r t i o n o f t h e s e m i v o l a t i l e s l o s t f rom t h e c a l c i n e r t o t h e o f f -gas system, b u t t h e m a j o r i t y o f t h e mass p e n e t r a t i n g
the f i l t e r s i s i n a s i z e range t h a t can be c o n t r o l l e d .
GASEOUS CONSTITUENTS
The gaseous c o n s t i t u e n t s t h a t have been moni tored i n t%e spray c a l c i n e r /
in-can me l te r o f f gas i nc lude carbon monoxide (GO), carbon d i o x i d e (C02),
n i t r o g e n ox ide compounds (NO and NO2), oxygen (02) , n i t r o g e n (N2), and water (H20).
a gas chromatograph (GC) and a n i t r o g e n ox ide analyzer.
I
Two inst ruments were used t o mon i to r t h e gaseous c o n s t i t u e n t s :
47
24 F
2.0 4.4 6.5 9.2 11.6 14.0 16.4 18.8
PARTICLE 5 I ZE RANGE. prn
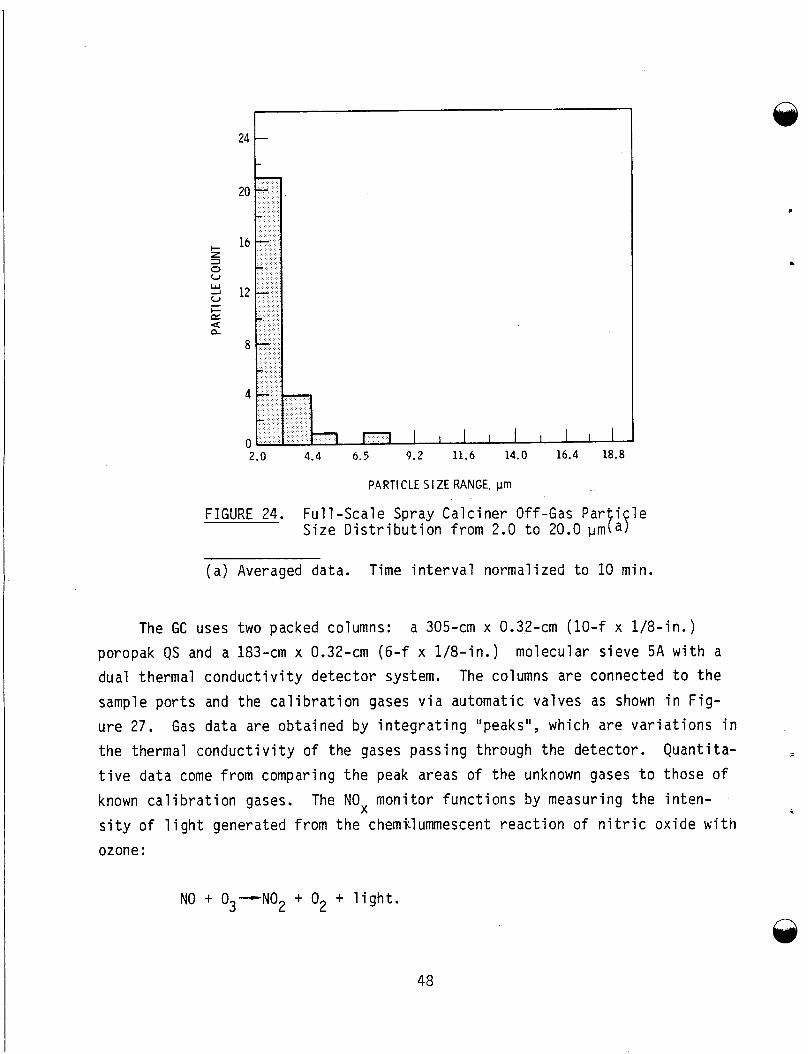
FIGURE 24. F u l l - s c a l e Spray C a l c i n e r Off-Gas Par i l e S ize D i s t r i b u t i o n f rom 2.0 t o 20.0 wn LF
( a ) Averaged data. Time i n t e r v a l normal ized t o 10 min.
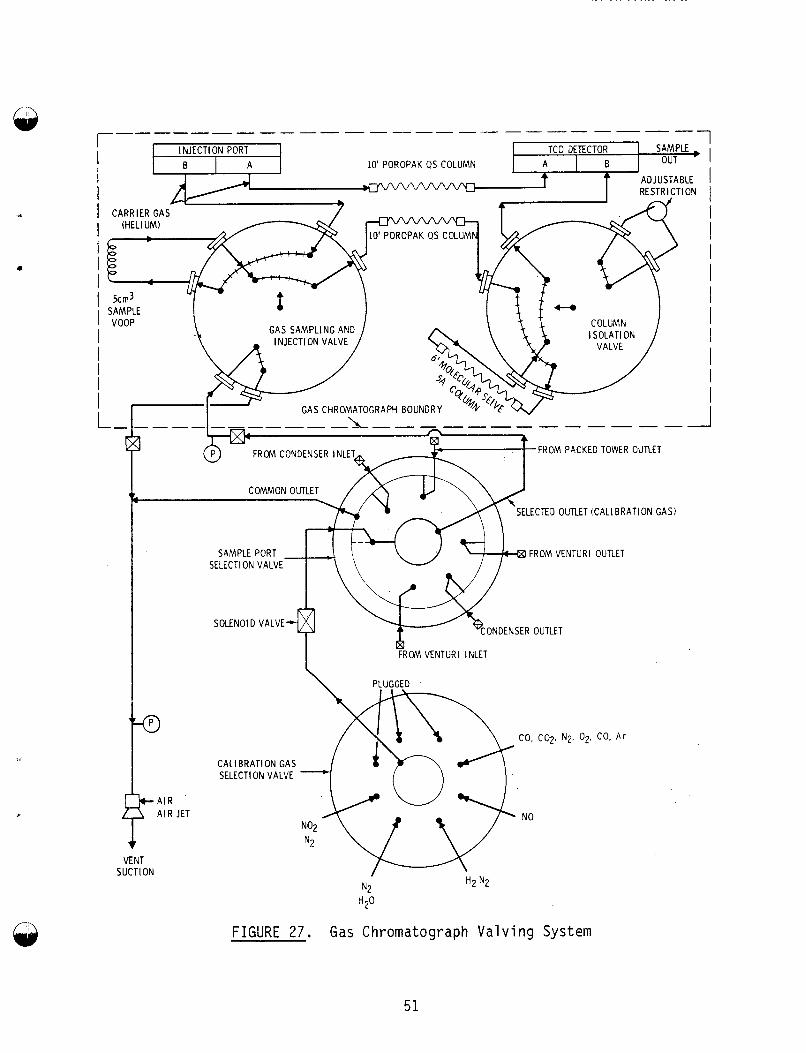
The GC uses two packed columns:
poropak QS and a 183-cm x 0.32-cm ( 6 - f x 1/8- in . ) mo lecu la r s ieve 5 A w i t h a dual thermal c o n d u c t i v i t y d e t e c t o r system. The columns are connected t o t h e
sample p o r t s and the c a l i b r a t i o n gases v i a automat ic va lves as shown i n F i g -
u r e 27. t h e thermal c o n d u c t i v i t y o f t he gases pass ing through t h e de tec to r .
t i v e da ta come f rom comparing t h e peak areas o f t h e unknown gases t o those o f
known c a l i b r a t i o n gases.
s i t y o f l i g h t generated f rom t h e chemiclumrnescent r e a c t i o n o f n i t r i c ox ide w i t h ozone :
a 305-cm x 0.32-cm (10 - f x 1/8- in . )
Gas da ta a re ob ta ined by i n t e g r a t i n g "peaks", which a re v a r i a t i o n s i n Q u a n t i t a -
The NOx mon i to r f u n c t i o n s by measur ing the i n t e n -
NO + 03-NOp + O2 + l i g h t .
48
0.320 0.378 0.436 0.494 0.552 0.610 0.668 0.726 0.784
PARTICLE S I ZE RANGE, pm
FIGURE 25. Full-scale Spray Calciner Off-Gas Parti 1 Size Distribution from 0.32 to 0.755 pm fa7
(a) Averaged data. Time interval normalized to 1 min. No filter blowback on vibrator operation.
49
*""( ""V
I , , I 1 1 - , I , 1 1 I I
V
0
ax> o m
0 0
0 0 0
0 00 0
FIGURE 26. Ful l -scale Sp'ray Calciner Integrated Off-Gas Pa r t i c l e Size Distribution from 0.32 t o 20.0 um(a)
( a ) Averaged data. Time interval normalized t o 30 s.
50
n
~ -1 TCD DETECTOR 1 SAMPLE.
I OUT 10' POROPAK OS COLUMN A
I
I
ON I I
I I I
LE I
! C A L A D I C I I I I <.....
I I I I I L-
1
VALVE I
_ _ _ - - - ---
FROM PACKED TOWER OUTLET FROM CONDENSER I NLE
COMMON OUTLET
SELECTED OUnET (CALIBRATION GAS)
SAMPLE PORT FROM VENTURI OUTLET SELECTION VALVE
VENT SUCTION
SOLENOI 0 VALVE*
FROM VENTURI INLET I
CALI BRATI ON GAS SELECTION VALVE
FIGURE 27. Gas Chromatograph Valving System
5 1
The intensity of the light generated is proportional to the concentration of the nitric oxide. is routed through a stainless steel converter where nitrogen dioxide and other nitrogen compounds are converted to nitric oxide:
If the concentration of NOx is desired, the sample flow
9oooc NO2 -NO + 1/2 O2 . 8
Gaseous data are presented from three operations: a full-scale spray calciner run, a full-scale spray calciner/in-can melter run, and a laboratory- scale spray calciner run. PW-7a feed. rate was 240 L/h. The gas analyses are shown in Table 14. during t h i s run.
The full-scale spray calciner operation was with The calciner chamber wall temperature was 6OO0C and the feed-
The samples were taken downstream of the sintered filters. The NOx monitor was not operated
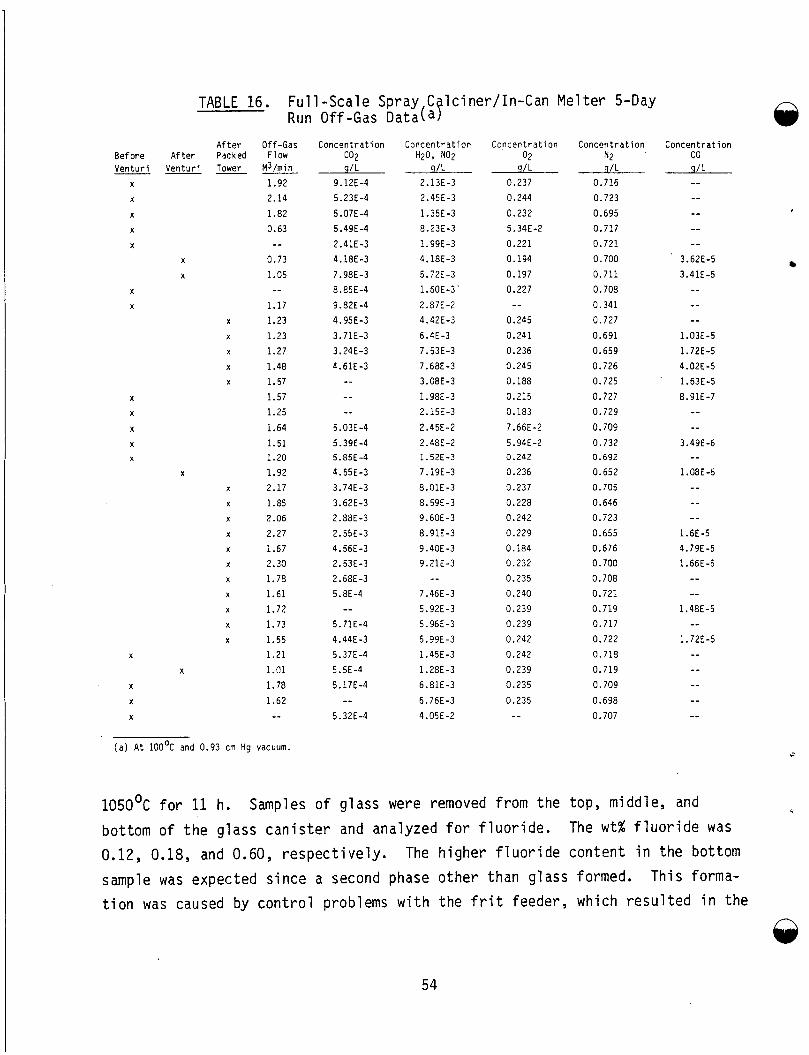
A second full-scale spray calciner/in-can melter operation lasted for a period of five days. was operated at 775OC. Table 16 gives detailed run data for all o f the samples.
The feed was defense waste fed at 245 L/h. The calciner Table 15 gives the mean gas data from the run and
Two runs were made in the laboratory-scale spray calciner to compare
The feedrate for both runs was approxi- nitric oxide and nitrogen dioxide quantities, one at the calciner furnace set point of 75OoC and one at 85OoC. mately 1.7 L/h, and the feed was PW-7a. and 18.
The results are shown in Tables 17
POTENTIALLY VOLATILE NON-FISSION PRODUCTS
Fluoride is a potentially volatile non-fission. product in Thorex fuel- cycle wastes and in some defense wastes. The primary potential problem caused by volatile fluoride is corrosion of the off-gas system and the sintered fil- ters. The laboratory-scale spray calciner, the pilot-scale spray calciner/ i n-can me1 ter and a laboratory-scale gl ass-melter crucible (constructed for volatility testing with TW-2 waste glass) were used to investigate fluoride volatility from simulated Thorex fuel-cycle wastes.
“I
@ Two waste types, TW-2 and
52
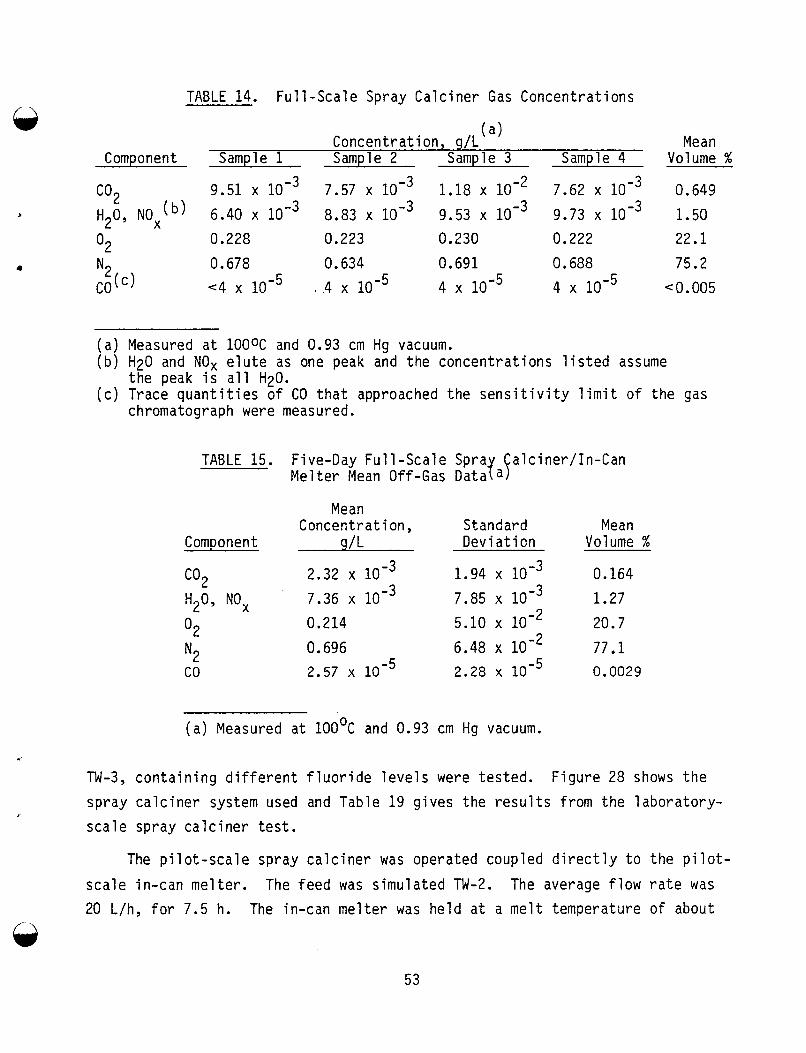
TABLE 14. Full-scale Spray Calciner Gas Concentrations
Mean (a) Concentration, g/L Component Sample 1 Sample 2 Sample 3 Sample 4 Volume %
9.51 x 7.57 x 1.18 x lo-' 7.62 x 0.649 J 9.53 9.73 1.50
0.228 0.223 0.230 0.222 22.1 a 0.678 0.634 0.691 0.688 75.2
co2 H ~ O , NO^(^) 6.40 x 8.83 x
O 2
co N2(c) (4 . .4 4 4 ~ 0 . 0 0 5
(a) Measured at l O O O C and 0.93 cm Hg vacuum. (b) H20 and NOx elute as one peak and the concentrations listed assume
(c) Trace quantities of CO that approached the sensitivity limit of the gas the peak is all H20.
chromatograph were measured.
TABLE 15. Five-Day Full-scale Spra alciner/In-Can Melter Mean Off-Gas Data YaF
Mean Concentration, St and ard Mean
2.32 1.94 0.164 7.36 7.85 1.27 0.214 5.10 x lo-' 20.7 0.696 6.48 x 77.1 2.57 2.28 0.0029
Component g/L Devi at i on Volume %
c02 $0, NO,
O 2 N2 co
(a) Measured at 100°C and 0.93 cm Hg vacuum.
TN-3, containing different fluoride levels were tested. spray calciner system used and Table 19 gives the results from the laboratory- scale spray calciner test.
Figure 28 shows the
The pilot-scale spray calciner was operated coupled directly t o the pilot- scale in-can melter. 20 L/h, for 7.5 h.
The feed was simulated TW-2. The average flow rate was The in-can melter was held at a melt temperature of about
53
Before Ven tu r i
X
X
X
X
X
X
X
A f t e r
Ven tu r i Tower A f t e r Packed --
X
X
X
X
X
X
X
X
X
X
X
X
X
X
TABLE 16. Ful l -scale Spray C lciner/In-Can Melter 5-Day R i m Off-Gas Data(a P
X
X
X
X
X
X
X
X
X
X
X
X
Off-Gas Flow
M3/min 1.92 2.14 1.82 0.63 --
0.73 1.05 --
1.17 1.23 1.23 1.27 1.48 1.57 1.57 1.25 1.64 1.51 1.20 1.92 2.17 1.85 2.06 2.27 1.67 2.30 1.78 1.61 1.72 1.73 1.55 1.21 1.01 1.78 1.62 --
Concentrat ion c02 g/L
9.12E-4 5.23E-4 5.07E-4 5.49E-4 2.41E-3 4.18E-3 7.98E-3 8.85E-4 9.82E-4 4.95E-3 3.71E-3 3.24E-3 4.61E-3
-- -- --
5.03E-4 5.39E-4 5.85E-4 4.55E-3 3.74E-3 3.62E-3 2.88E-3 2.55E-3 4.56E-3 2.53E-3 2.68E -3 5.8E-4
-- 5.71E-4 4.44E-3 5.37E-4 5.5E-4 5.17E -4
-- 5.32E-4
(a) A t 100°C and 0.93 cm Hg vacuum.
1O5O0C for 11 h . Samples of glass
Concentrat ion H20, NO2
g/L 2.13E-3 2.45E-3 1.35E-3 8.23E-3 1.99E-3 4.18E-3 5.72E-3 1.60E-3 2.87E-2 4.42E-3 6.4E-3 7.53E-3 7.68E-3 3.08E-3 1.98E-3 2.15E-3 2.45E-2 2.48E-2 1.52E-3
7.19E-3 8.01E-3 8.59E-3 9.60E-3 8.91E-3 9.40E-3 9.21E-3
- - 7.46E-3 5.92E-3 5.96E-3 5.99E-3 1.45E-3 1.28E-3 6.81E-3 6.76E-3 4.05E-2
Concentrat ion 02
g/L
0.237 0.244 0.232 5.34E-2 0.221 0.194 0.197 0.227 --
0.245 0.241 0.236 0.245 0.188 0.215 0.183 7.66E-2 5.94E-2 0.242 0.236 0.237 0.228 0.242 0.229 0.184 0.232 0.235 0.240 0.239 0.239 0.242 0.242 0.239 0.235 0.235 --
Concentrat ion N2 g/L
0.716 0.723 0.695 0.717 0.721 0.700 0.711 0.708 0.341 0.727 0.691 0.659 0.726 0.725 0.727 0.729 0.709 0.732 0.692 0.652 0.705
0.646 0.723 0.655 0.676 0.700 0.708 0.721 0.719 0.717 0.722 0.718 0.719 0.709 0.698 0.707
Concentrat ion co g/L -- -- -- -- --
3.62E-5 3.41E-5
-- -- --
1.03E-5 1.72E-5 4.02E-5 1.63E-5 8.91E-7
-- 3.49E-6
-- 1.03E-6
-- 1.6E-5 4.79E-5 1.66E-5
-- --
1.48E-5 _-
1.72E-5
r
were removed from the top, middle, and bottom of the glass canis te r and analyzed f o r f luor ide . 0.12, 0.18, and 0.60, respect ively. sample was expected since a second phase other than glass formed. t ion was caused by control problems w i t h the f r i t feeder, which resul ted in the
The w t % f luor ide was The higher f luoride content in the bottom
This forma-
54
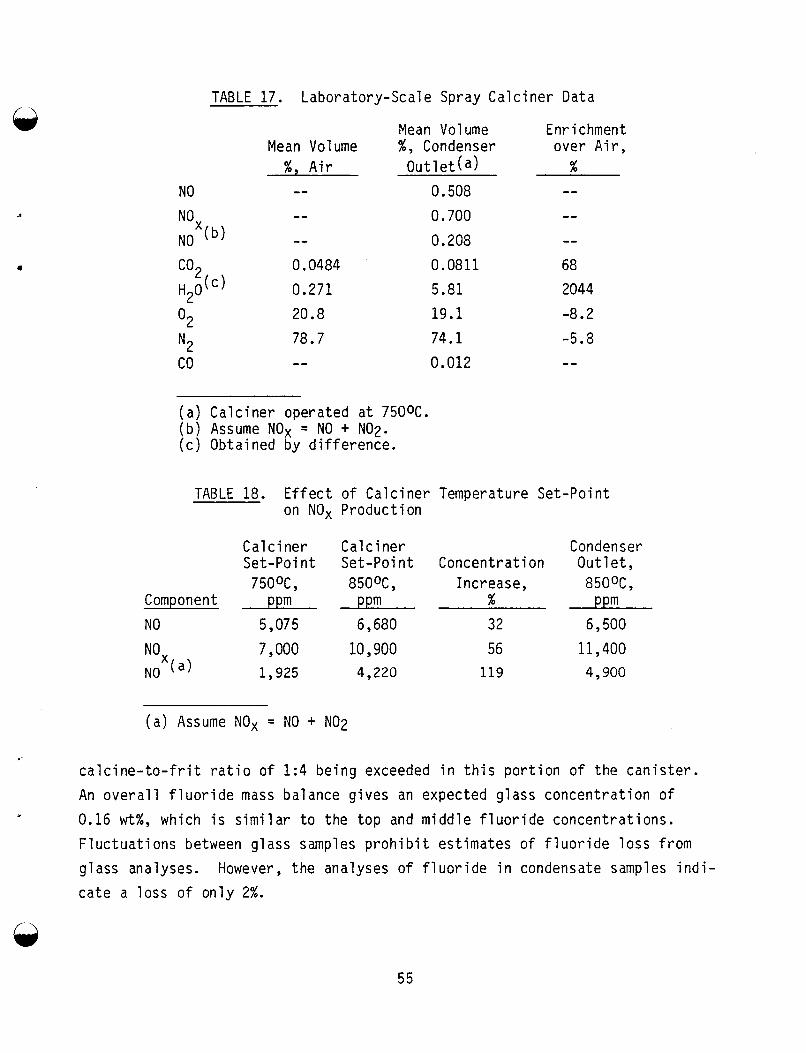
TABLE 17. Laboratory-Scale Spray C a l c i n e r Data
Mean Volume %, A i r
NO --
b ) NO co, 0.0484
0.271 20.8
78.7 O2 N2 -- co
Mean Volume %, Condenser
O u t l e t ( a )
0.508 0.700 0.208 0.0811 5.81 19.1 74.1 0.012
( a ) C a l c i n e r operated a t 750OC. ( b ) Assume NOx = NO + N02. ( c ) Obtained by d i f f e r e n c e .
TABLE 18. E f f e c t on NU,
C a l c i n e r Set-Point 750% ,
Component ppm NO 5,075
NO ( a )
7,000 1 , 925
( a ) Assume NOx =
c a l c i n e - t o - f r i t r a t i o o f
An o v e r a l l f l u o r i d e mass
Enrichment over A i r ,
% -- -- -- 68 2044 -8.2 -5.8 --
o f C a l c i n e r Temperature Set-Point Product i on
NO + NO2
Cal c i ner Condenser Set-Point Concentrat ion O u t l e t , 850OC , Increase , 850OC ,
ppm % ppm 6,680 32 6,500
10 , 900 56 11,400 4,220 119 4 , 900
1:4 be ing exceeded i n t h i s p o r t i o n o f t h e c a n i s t e r .
balance g i ves an expected g lass c o n c e n t r a t i o n o f
0.16 wt%, which i s s i m i l a r t o the t o p and m idd le f l u o r i d e concen t ra t i ons . F l u c t u a t i o n s between g lass samples p r o h i b i t est imates o f f l u o r i d e l o s s f rom
g lass analyses. However, t h e analyses o f f l u o r i d e i n condensate samples i n d i - c a t e a l o s s o f o n l y 2%.
55
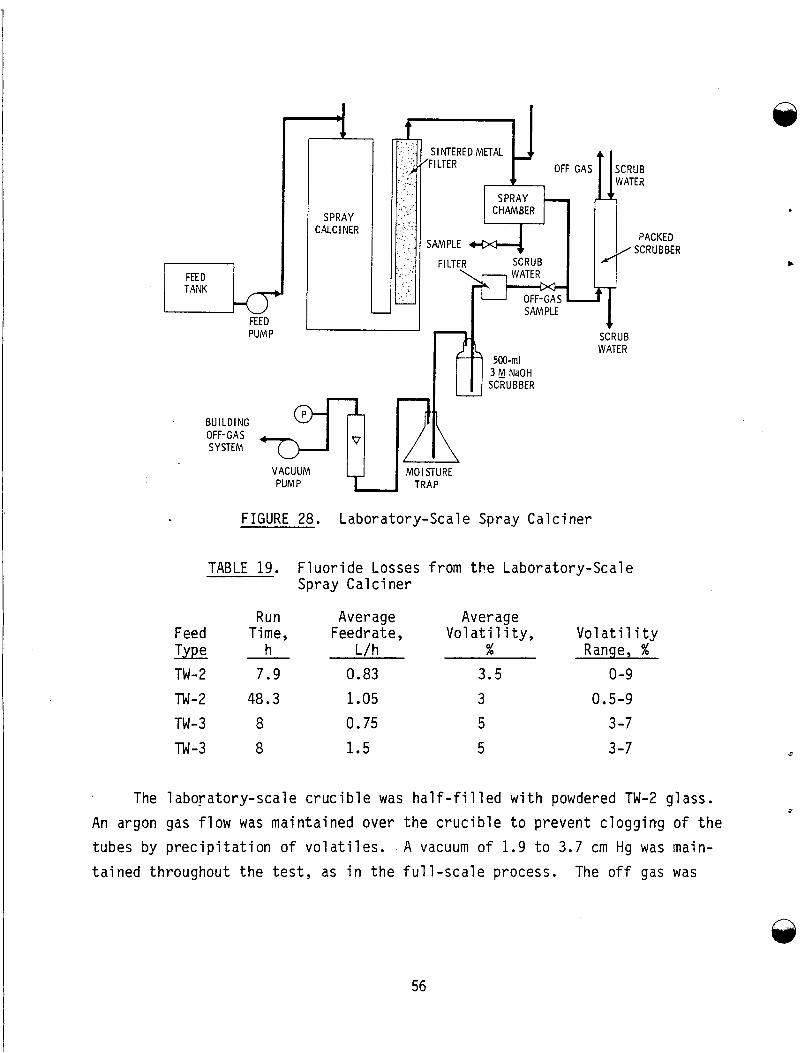
%ED PUMP
SINTERED M n A L
5M)-ml 3 M NaOH SCRUBBER
SCRUB WATER
BU ILDl NG OFF- GA 5 SYSTEM V
VACUUM MOISTURE PUMP TRAP
FIGURE 28. Laboratory-Scale Spray Ca lc ine r
TABLE 19. F l u o r i d e Losses f rom t h e Laboratory-Scale Spray C a l c i n e r
Run Average Average Feed Time , Feedr a t e , Vol a t i 1 i t y , V o l a t i l i t y T y p e - h L/h % Range, % TW-2 7.9 0.83 3.5 0-9 TW-2 48.3 1.05 3 0.5-9 TW-3 a 0.75 5 3-7
TW -3 8 1.5 5 3 -7
The laboya to ry -sca le c r u c i b l e was h a l f - f i l l e d w i t h powdered TW-2 g lass .
A vacuum o f 1.9 t o 3.7 cm Hg was main- An argon gas f l o w was main ta ined over t h e c r u c i b l e t o p revent c logg ing o f t h e tubes by p r e c i p i t a t i o n o f v o l a t i l e s .
t a i n e d throughout t h e t e s t , as i n t h e f u l l - s c a l e process. The o f f gas was
56
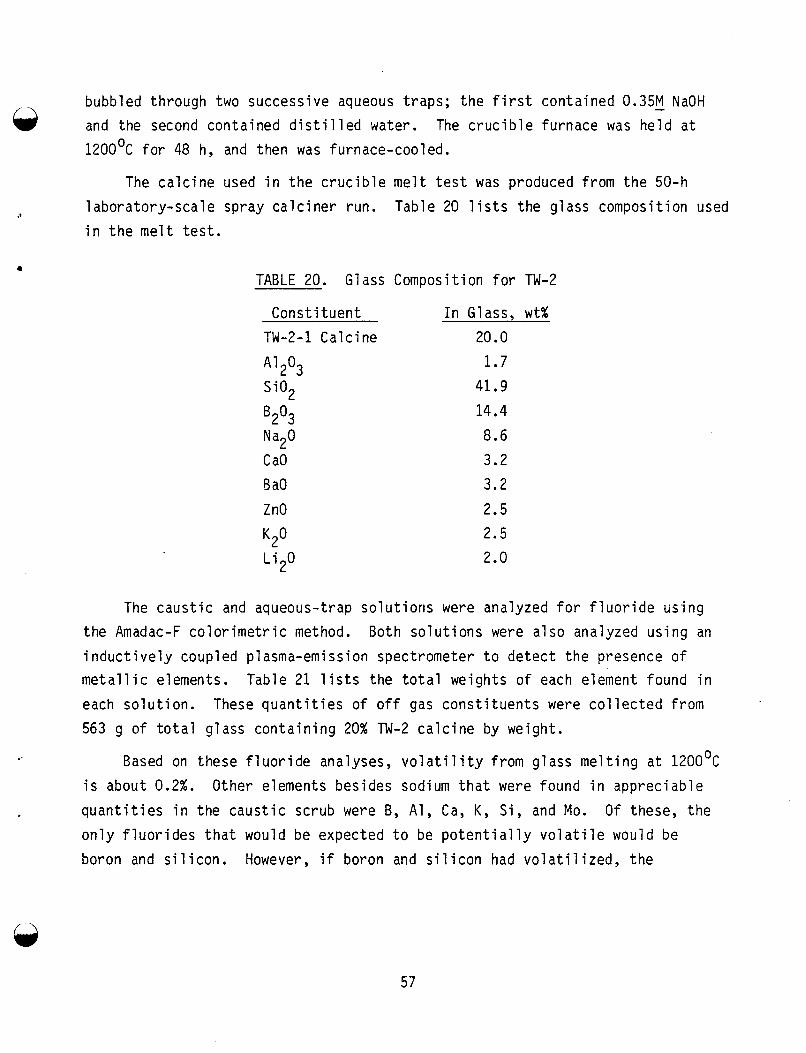
bubbled through two successive aqueous traps; the first contained 0.35M - NaOH and the second contained distilled water. The crucible furnace was held at 1200°C for 48 h, and then was furnace-cooled.
63 The calcine used in the crucible melt test was produced from the 50-h
9 laboratory-scale spray calciner run. in the melt test.
Table 20 lists the glass composition used
TABLE 20. Glass Composition for TW-2
Constituent TW-2-1 Calcine
2'3 Si02
B2°3 Na20 C a0 B a0 ZnO
K2° Li20
In Glass, wt% 20.0 1.7 41.9 14.4 8.6 3 . 2 3 . 2 2.5 2.5 2.0
The caustic and aqueous-trap solutioris were analyzed for fluoride using the Amadac-F colorimetric method. Both solutions were also analyzed using an inductively coupled plasma-emission spectrometer to detect the presence of metallic elements. Table 2 1 lists the total weights of each element found in each solution. 563 g of total glass containing 20% TW-2 calcine by weight.
These quantities of off gas constituents were collected from
Based on these fluoride analyses, volatility from glass melting at 1200°C is about 0.2%. quantities in the caustic scrub were B, Al, Ca, K, Si, and Mo. Of these, the only fluorides that would be expected to be potentially volatile would be boron and silicon. However, if boron and silicon had volatilized, the
Other elements besides sodium that were found in appreciable
57
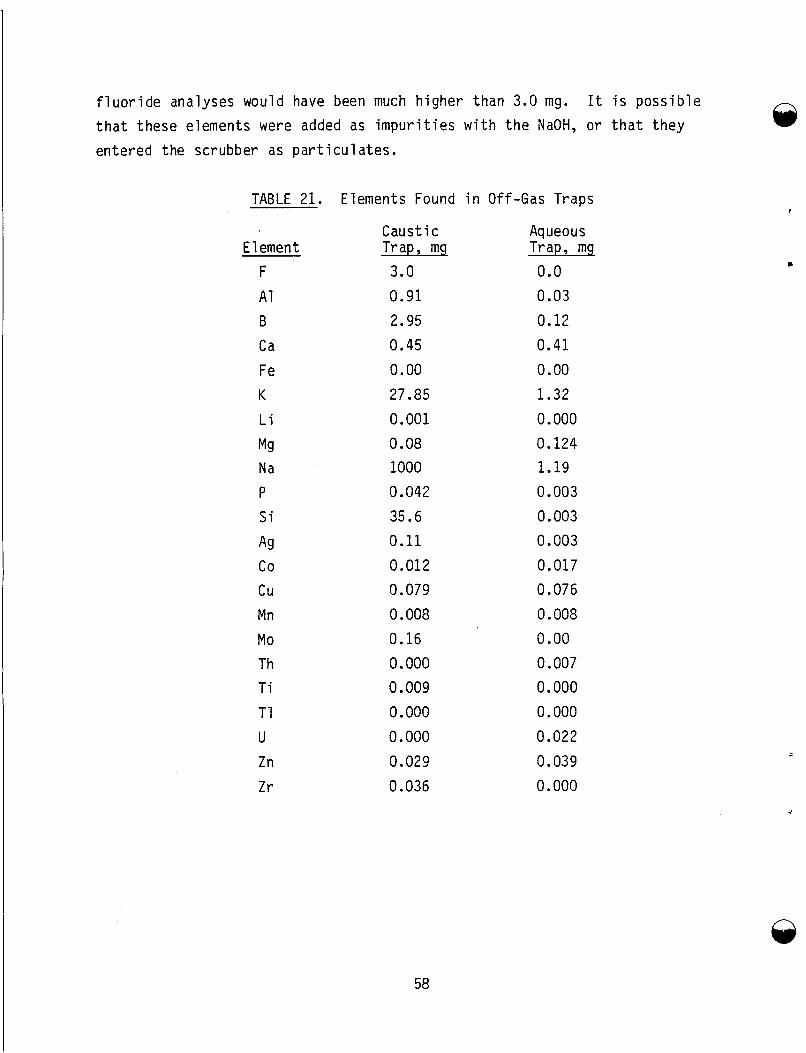
f luor ide analyses would have been much higher t h a n 3.0 mg. I t is possible t h a t these elements were added as impurit ies w i t h the NaOH, or t h a t they entered the scrubber as par t icu la tes .
TABLE 21. Elements Found i n Off-Gas Traps
Element F A1 B Ca Fe K
L i
Mg Na P S i
Ag co c u Mn Mo Th Ti T1 U Zn Zr
Caustic Trap, mg
3.0 0.91 2.95 0.45
0.00 27.85
0.001 0.08 1000 0.042 35.6 0.11
0.012 0.079 0.008 0.16 0.000 0.009 0.000 0.000
0.029 0.036
Aqueous Trap, mg 0.0 0.03
0.12 0.41
0.00
1.32 0.000 0.124 1.19 0.003 0.003 0.003 0.017 0.076 0.008 0.00 0.007 0.000
0.000 0.022
0.039 0.000
58
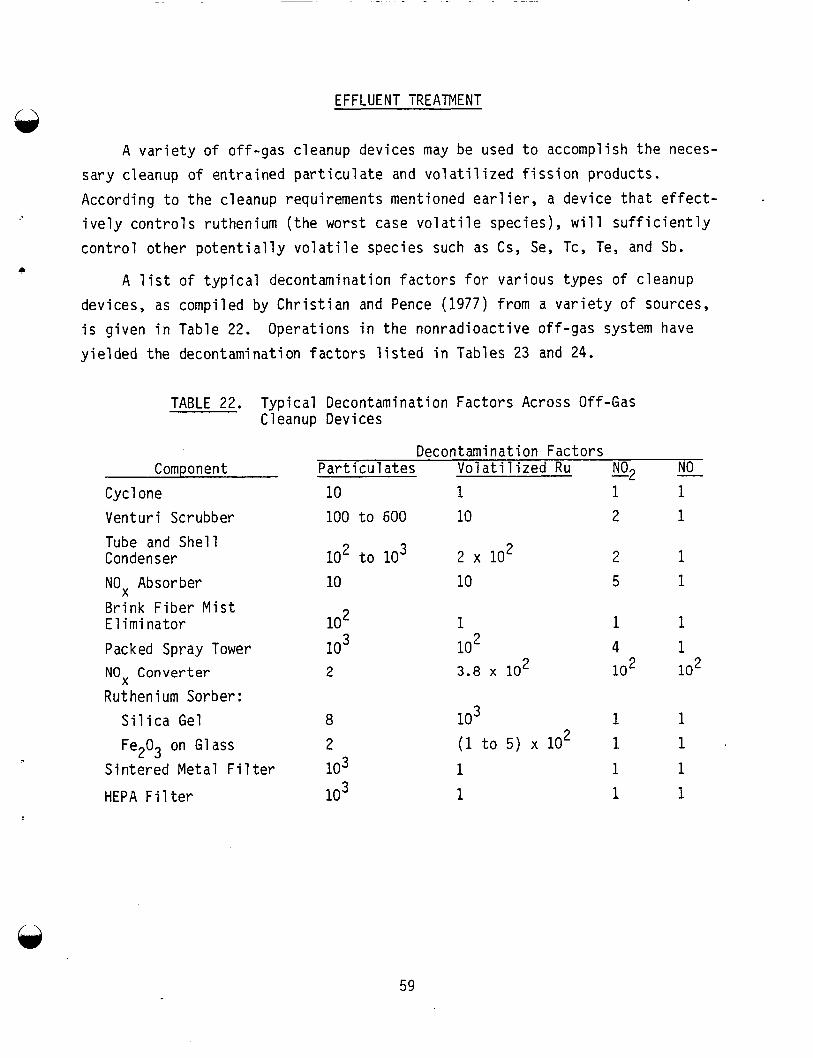
EFFLUENT TREATMENT
A variety of off-gas cleanup devices may be used to accomplish the neces- sary cleanup of entrained particulate and volatilized fission products. According to the cleanup requirements mentioned earlier, a device that effect- ively controls ruthenium (the worst case volatile species), will sufficiently control other potentially volatile species such as Cs, Se, Tc, Te, and Sb.
c A list of typical decontamination factors for various types of cleanup
Operations in the nonradioactive off-gas system have devices, as compiled by Christian and Pence (1977) from a variety of sources, is given in Table 22. yielded the decontamination factors listed in Tables 23 and 24.
TABLE 22. Typical Decontamination Factors Across Off-Gas Cleanup Devices
Component Cyclone Vent ur i Scrub b er Tube and Shell Con den s er NOx Absorber Brink Fiber Mist Elimi nator Packed Spray Tower NOx Converter Ruthenium Sorber:
Decontamination Factors NO - NO -2 Particulates Volatilized Ru
10 1 1 1 100 t o 600 10 2 1
lo2 to lo3 2 x l o 2 2 1 10 10 5 1
lo2 1 1 1 lo3 lo2 4 1 2 3 . 8 x 10 2 10 lo2
Silica Gel 8 Fe203 on Glass 2
Sintered Metal Filter 103
lo3 1 1 (1 to 5 ) x lo2 1 1 1 1 1
HEPA Fil ter lo3 1 1 1
59
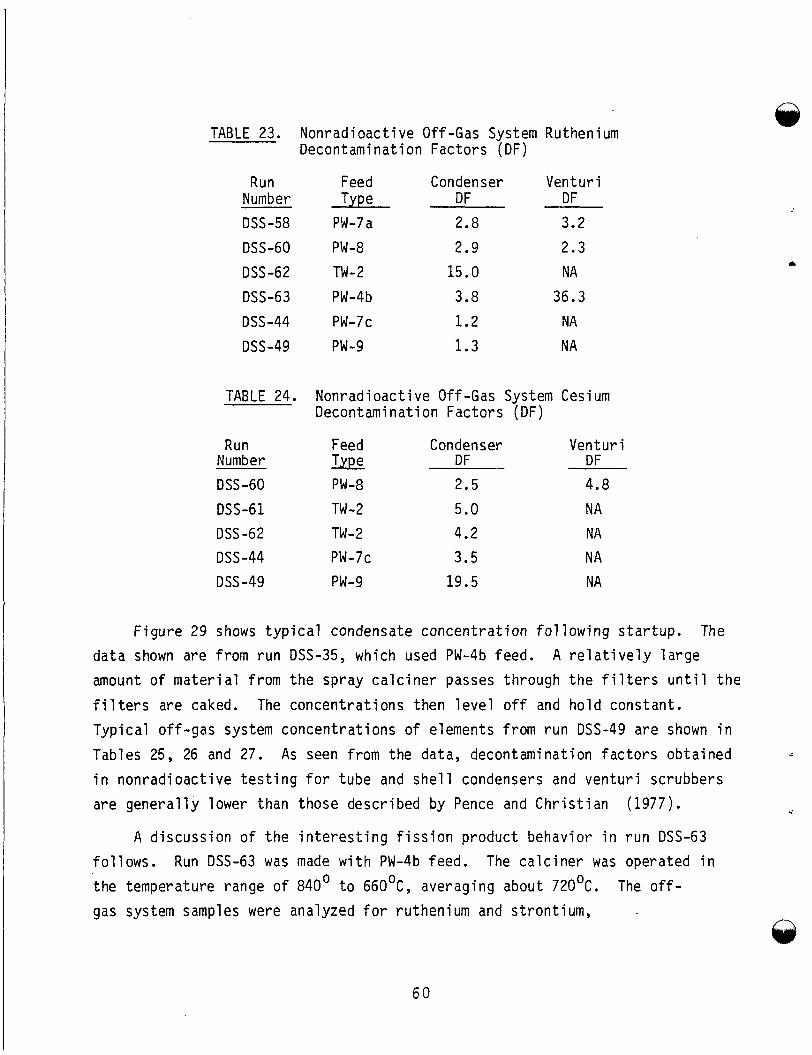
TABLE 23. Nonrad ioac t ive Off-Gas System Ruthenium Decontaminat ion Fac tors (DF)
Run Number DSS-58
DSS-60
DSS-62 DSS-63
DSS-44
DSS-49
Feed
PW-7a rype
PW -8
Tw-2
PW-4b
PW-7c
PW-9
Con denser DF
2.8
2.9
15.0
3.8
1.2 1.3
Ven tu r i DF
3.2
2.3
NA 36.3
NA
NA
TABLE 24. Nonrad ioac t ive Off-Gas System Cesium Decontaminat ion Fac tors (DF)
Run Feed Con den s e r Ven tu r i Number Type DF DF DSS -60 PW-8 2.5 4.8
DSS-61 TW-2 5.0 NA DSS-62 Tw- 2 4.2 NA
DSS-44 PW-7c 3.5 NA DSS-49 PW-9 19.5 NA
are
f o l t he
gas
F i g u r e 29 shows t y p i c a l condensate c o n c e n t r a t i o n f o l l o w i n g s t a r t u p . The
da ta shown are f rom r u n DSS-35, which used PW-4b feed. A r e l a t i v e l y l a r g e m o u n t o f m a t e r i a l f rom t h e spray c a l c i n e r passes th rough t h e f i l t e r s u n t i l t h e
f i l t e r s are caked. The concen t ra t i ons then l e v e l o f f and h o l d constant .
Typ ica l o f f - g a s system concen t ra t i ons o f elements f rom r u n DSS-49 are shown i n
Tables 25, 26 and 27. As seen f rom the data, decontaminat ion f a c t o r s ob ta ined
i n non rad ioac t i ve t e s t i n g f o r t ube and s h e l l condensers and v e n t u r i scrubbers
g e n e r a l l y lower than those descr ibed by Pence and C h r i s t i a n (1977). i
A d i scuss ion o f t h e i n t e r e s t i n g f i s s i o n p roduc t behav io r i n r u n DSS-63
ows. Run DSS-63 was made w i t h PW-4b feed. The c a l c i n e r was operated i n
temperature range o f 840' t o 66OoC, averaging about 72OoC.
system samples were analyzed f o r ru then ium and s t ron t ium,
The o f f -
60
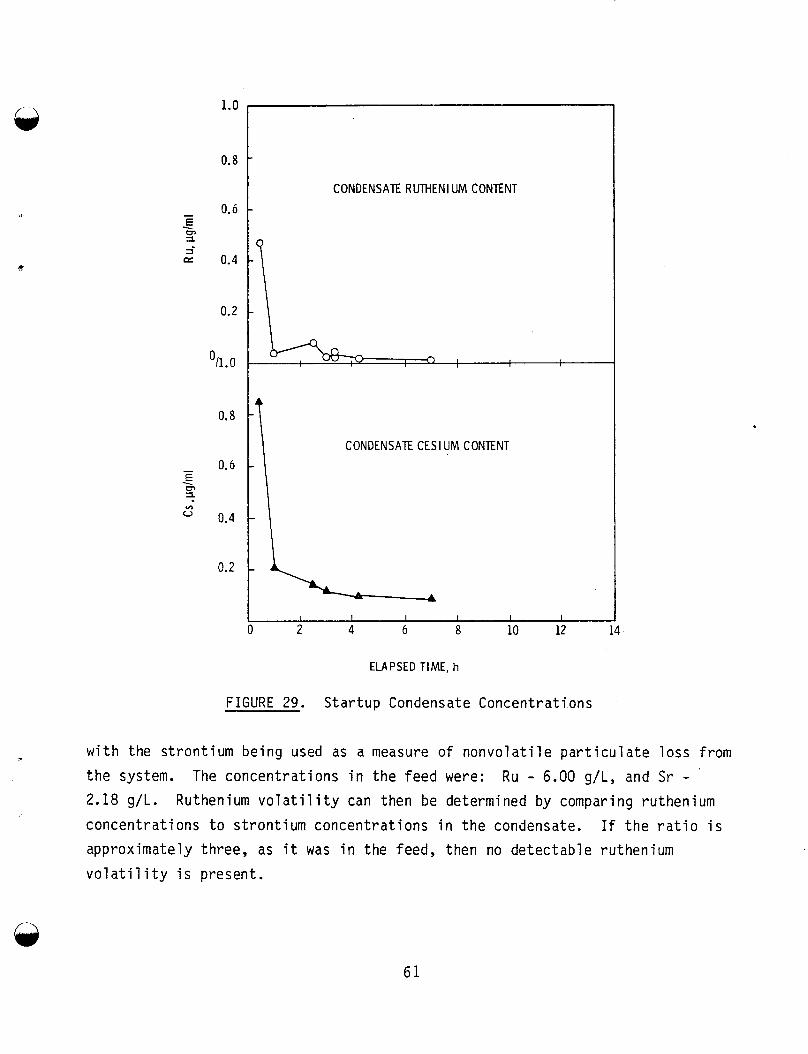
CONDENSATE RUTHENIUM CONTENT
J
0.8
- 0.6
I E - VI
v)
0.4
0.2
CONTENT
I I I I I I I
0 2 4 6 8 10 12 14
ELAPSED TIME, h
FIGURE 29. Startup Condensate Concentrations
with the strontium being used as a measure of nonvolatile particulate loss from the system. The concentrations in the feed were: Ru - 6.00 g/L, and Sr - 2.18 g/L. concentrations to strontium concentrations in the condensate. If the ratio is approximately three, as it was in the feed, then no detectable ruthenium volatility is present.
Ruthenium volatility can then be determined by comparing ruthenium
6 1
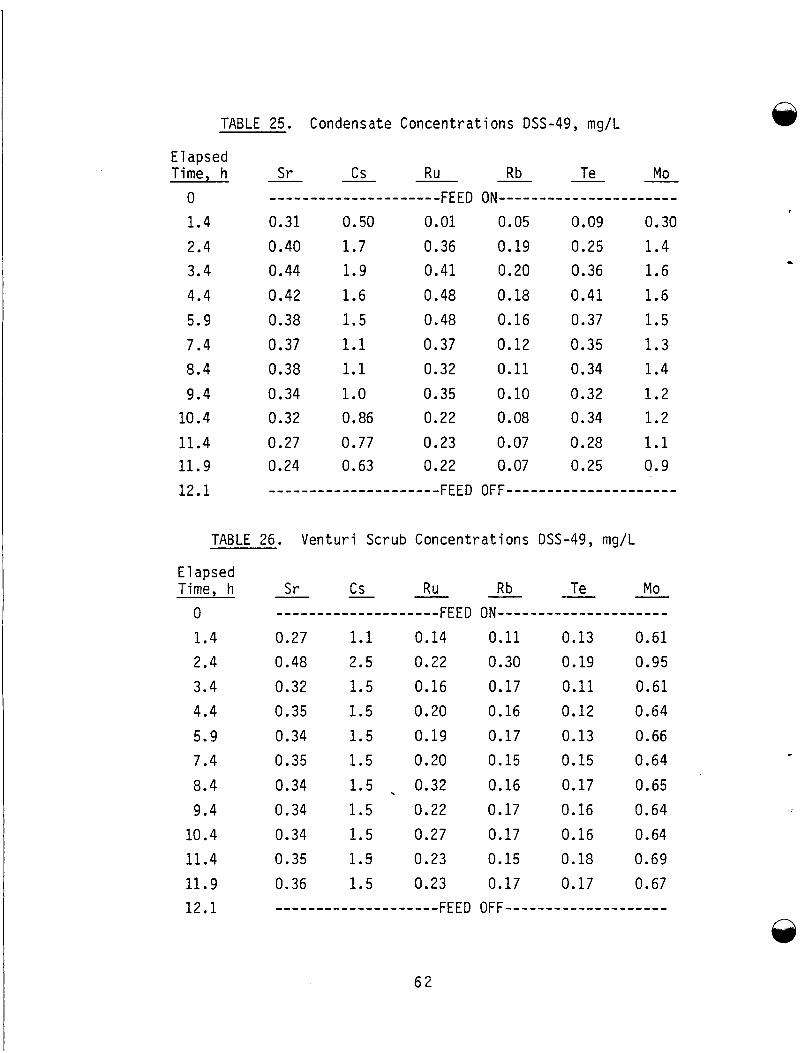
TABLE 25. Condensate Concentrat ions DSS-49, mg/L
E 1 apsed Time, h S r cs Ru Rb Te Mo
0 ..................... FEED ON--- - - - - - - - - - - - - - - - - - - -
1.4 0.31 0.50 0.01 0.05 0.09 0.30 2.4 0.40 1.7 0.36 0.19 0.25 1.4 3.4 0.44 1.9 0.41 0.20 0.36 1.6 4.4 0.42 1.6 0.48 0.18 0.41 1.6 5.9 0.38 1.5 0.48 0.16 0.37 1.5 7.4 0.37 1.1 0.37 0.12 0.35 1.3 8.4 0.38 1.1 0.32 0.11 0.34 1.4 9.4 0.34 1.0 0.35 0.10 0.32 1 . 2
10.4 0.32 0.86 0.22 0.08 0.34 1.2 11.4 0.27 0.77 0.23 0.07 0.28 1.1 11.9 0.24 0.63 0.22 0.07 0.25 0.9
TABLE 26. Ven tu r i Scrub Concent ra t ions DSS-49, mg/L
Elapsed Time, h
0
1.4 2.4 3.4 4.4 5.9 7.4 8.4 9.4
10.4 11.4 11.9 12.1
S r - cs Ru Rb Te Mo
0.27 1.1 0.14 0.11 0.13 0.61 0.48 2.5 0.22 0.30 0.19 0.95 0.32 1.5 0.16 0.17 0.11 0.61 0.35 1.5 0.20 0.16 0.12 0.64 0.34 1.5 0.19 0.17 0.13 0.66 0.35 1.5 0.20 0.15 0.15 0.64 0.34 1.5 . 0.32 0.16 0.17 0.65 0.34 1.5 0.22 0.17 0.16 0.64 0.34 1.5 0.27 0.17 0.16 0.64 0.35 1.5 0.23 0.15 0.18 0.69 0.36 1.5 0.23 0.17 0.17 0.67
.................... FEED ON---------------------
.................... FEED OFF--------------------
6 2
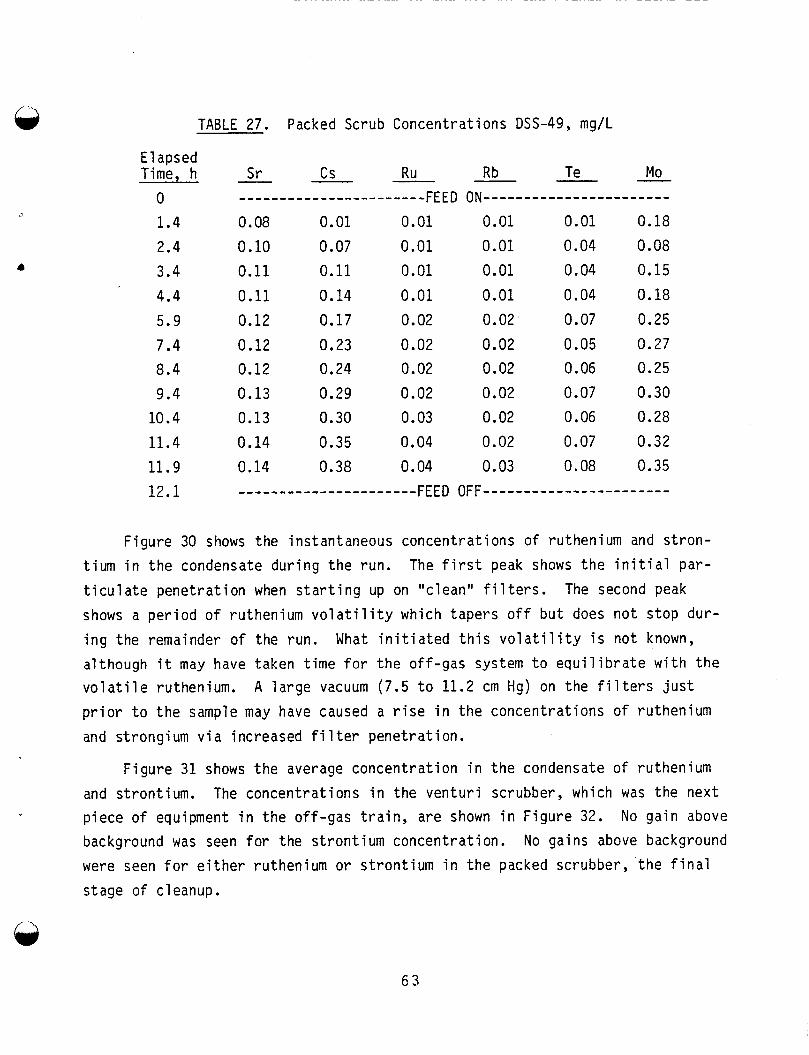
TABLE 27. Packed Scrub Concentrat ions DSS-49, mg/L
4
Elapsed Time, h
0 1.4
2.4 3.4
4.4 5.9
7.4 8.4 9.4
10.4
11.4 11.9 12.1
S r cs Ru Rb Te Mo - ....................... FEED ON----------------------- 0.08 0.01 0.01 0.01 0.01 0.18 0.10 0.07 0.01 0.01 0.04 0.08 0.11 0.11 0.01 0.01 0.04 0.15
0.11 0.14 0.01 0.01 0.04 0.18 0.12 0.17 0.02 0.02 0.07 0.25 0.12 0.23 0.02 0.02 0.05 0.27 0.12 0.24 0.02 0.02 0.06 0.25 0.13 0.29 0.02 0.02 0.07 0.30 0.13 0.30 0.03 0.02 0.06 0.28 0.14 0.35 0.04 0.02 0.07 0.32 0.14 0.38 0.04 0.03 0.08 0.35 ...................... FEED OFF-----------------------
F igu re 30 shows the instantaneous concen t ra t i ons o f ruthenium and s t r o n - The f i r s t peak shows t h e i n i t i a l pa r - t i u m i n t h e condensate d u r i n g t h e run.
t i c u l a t e p e n e t r a t i o n when s t a r t i n g up on "c lean" f i l t e r s .
shows a p e r i o d o f ru thenium v o l a t i l i t y which t a p e r s o f f b u t does n o t s top dur- i n g the remainder o f t he run. a l though i t may have taken t ime f o r t h e o f f -gas system t o e q u i l i b r a t e w i t h t h e v o l a t i l e ruthenium.
p r i o r t o t h e sample may have caused a r i s e i n t h e concen t ra t i ons o f ru thenium
and st rongium v i a increased f i l t e r p e n e t r a t i o n .
The second peak
What i n i t i a t e d t h i s v o l a t i l i t y i s n o t known,
A l a r g e vacuum (7.5 t o 11.2 cm Hg) on t h e f i l t e r s j u s t
F i g u r e 3 1 shows t h e average c o n c e n t r a t i o n i n t h e condensate o f ru thenium and st ront ium. The concen t ra t i ons i n the v e n t u r i scrubber, which was t h e nex t p iece o f equipment i n t h e o f f - g a s t r a i n , a re shown i n F i g u r e 32. background was seen f o r t he s t r o n t i u m concen t ra t i on .
were seen f o r e i t h e r ru thenium o r s t r o n t i u m i n t h e packed scrubber, t h e f i n a l
stage o f cleanup.
No g a i n above No gains above background
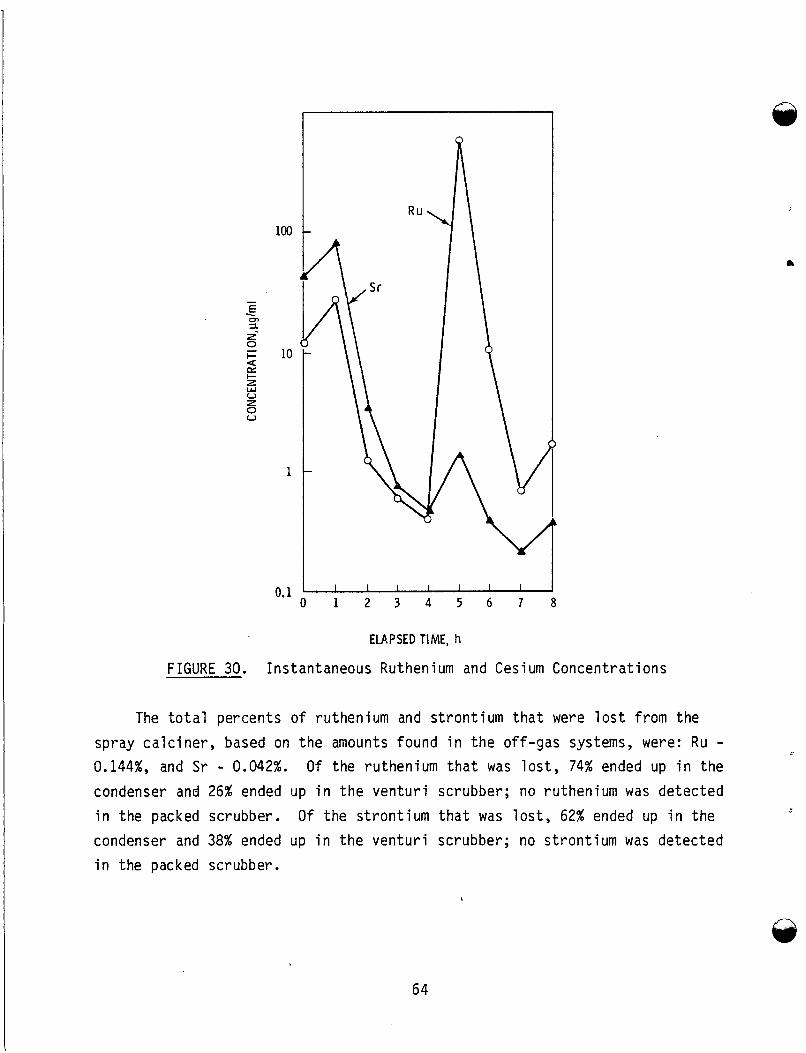
100
10
1
I I I I I I I 1. -
0 1 2 3 4 5 6 1 8
ELAPSED TIME, h
FIGURE 30. Instantaneous Ruthenium and Cesium Concentrations
The t o t a l percents of ruthenium and strontium tha t were l o s t from the spray ca l c ine r , based on the amounts found i n the off-gas systems, were: R u - 0.1449’0, and Sr - 0.042%. O f the ruthenium tha t was l o s t , 74% ended up i n the condenser and 26% ended up i n the venturi scrubber; no ruthenium was detected i n the packed scrubber. condenser and 38% ended up i n the venturi scrubber; no strontium was detected i n the packed scrubber.
O f the strontium tha t was l o s t , 62% ended up i n the
64
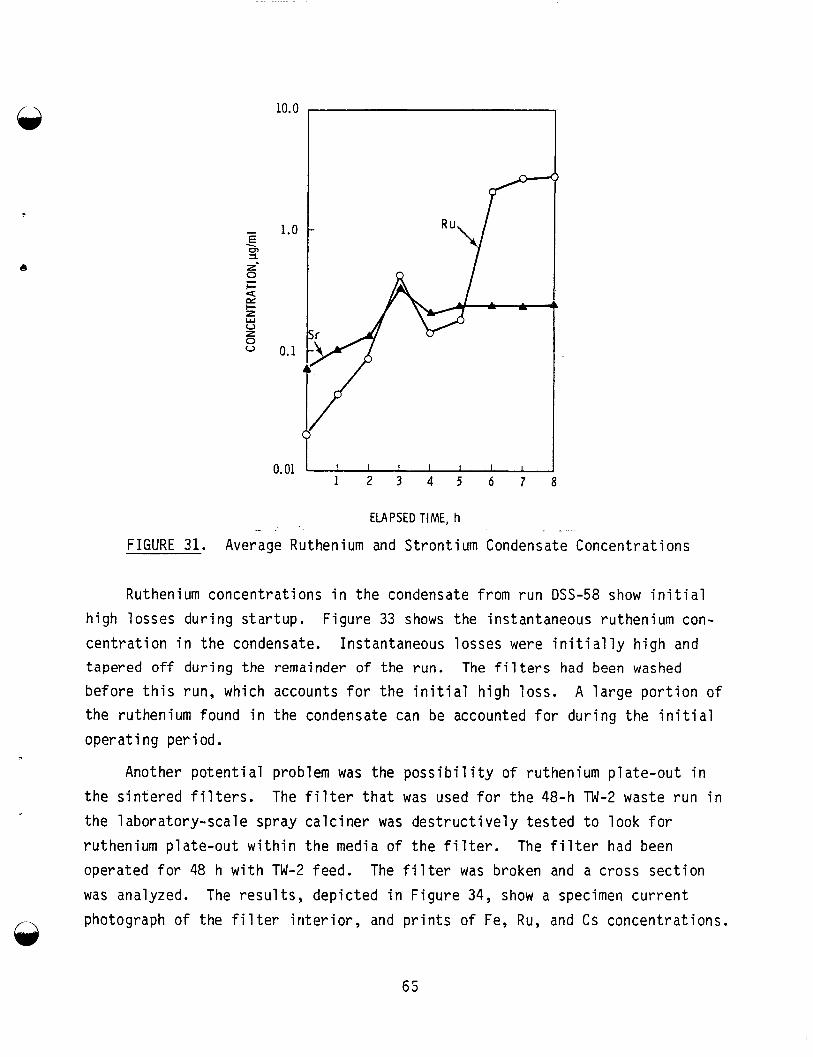
ELAPSED TIME, h
FIGURE 31. Average Ruthenium and St ront ium Condensate Concentrations
Ruthenium concentrations i n the condensate from r u n DSS-58 show i n i t i a l h i g h losses d u r i n g s ta r tup . Figure 33 shows the instantaneous ruthenium con- centrat ion i n the condensate. Instantaneous losses were i n i t i a l l y h i g h and t ape red of f d u r i n g t h e remainder of the r u n . The f i l t e r s had been washed
before t h i s run, which accounts f o r the i n i t i a l high loss. the ruthenium found i n the condensate can be accounted for d u r i n g the i n i t i a l oper a t i ng per i od .
A large portion of
Another potential problem was the poss ib i l i t y o f ruthenium plate-out i n the s intered f i l t e r s . The f i l t e r t h a t was used f o r the 48-h TW-2 waste run i n the laboratory-scale spray calciner was destruct ively tes ted t o look for ruthenium plate-out w i t h i n the media of the f i l t e r . The f i l t e r had been operated fo r 48 h w i t h TW-2 feed. The f i l t e r was broken and a cross section was analyzed. photograph of the f i l t e r i n t e r io r , and prints of Fe, R u , and Cs concentrations.
The r e s u l t s , depicted i n Figure 34, show a specimen current
65
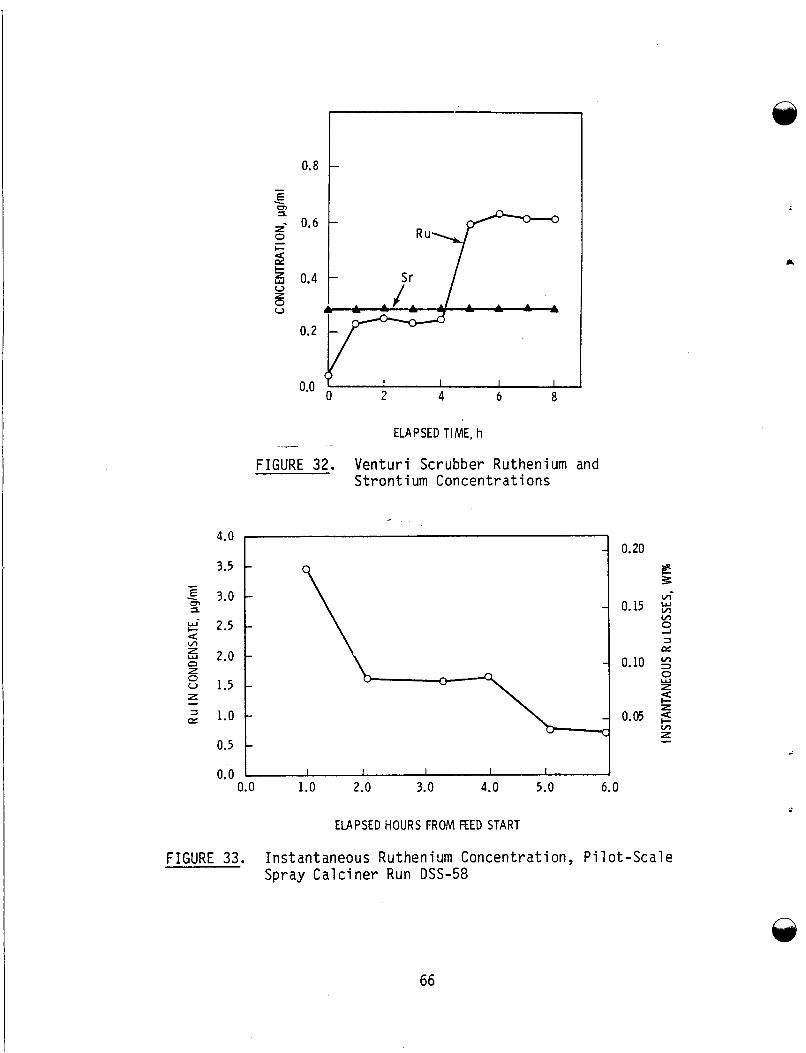
4.0
3.5
,E 3.0 z E- 2.5 a
5 2.0 a
-
cn
z 0
z o 1.5 - 2 1.0
0.5
0.2
0.20 - -
- - - - -
0.0
ELAPSED TIME, h --
FIGURE 32. Venturi Scrubber Ruthenium and Strontium Concentrations
0.0 I I I I I I 1 0.0 1.0 2.0 3.0 4.0 5.0 6.0
0.10 2
;I 0.05 3
z
s z vl
ELAPSED HOURS FROM FEED START
FIGURE 33. Instantaneous Ruthenium Concentration, Pilot-Scale Spray Calciner Run DSS-58
66
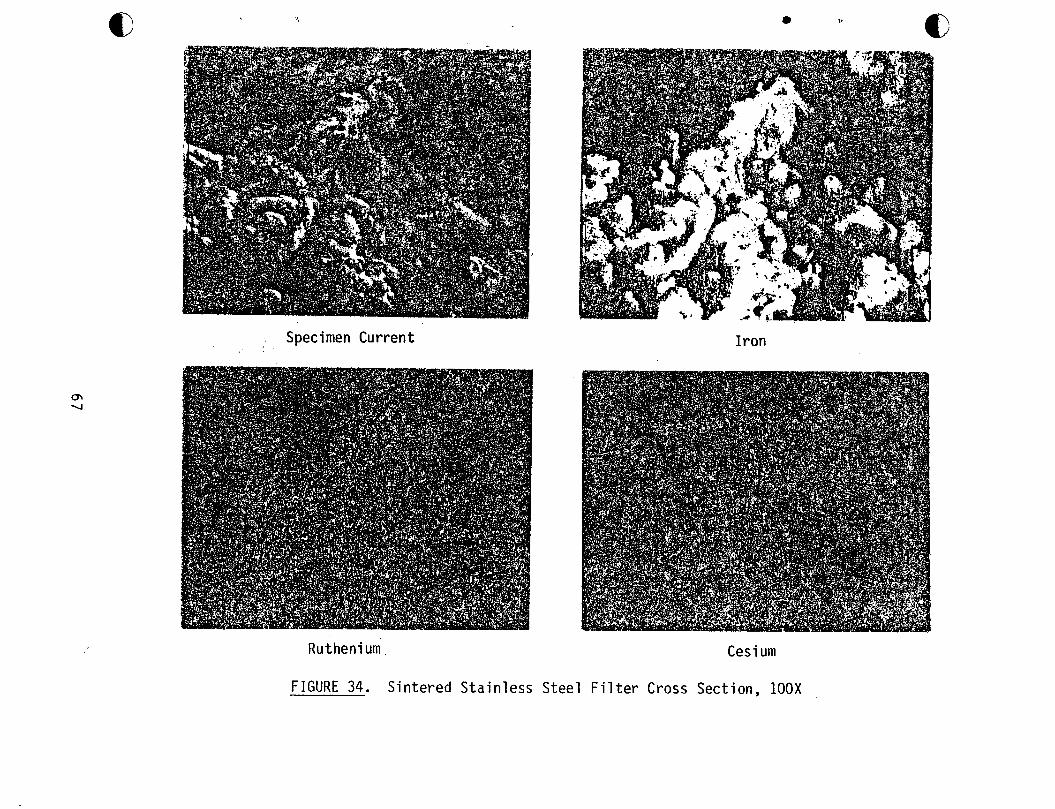
Specimen Current Iron
Ru theni urn Ces i urn
FIGURE 34. Sintered Stainless Steel Filter Cross Section, l O O X
@ The in tens i ty of the l i gh t areas i n the photographs i s a measure of the amount of the material seen. I t should be noted t h a t only the white areas showing on the iron specimen photograph l i e within the plane of focus (on a l l t e s t s ) . The amounts of ruthenium and cesium are n o t s ign i f icant ; the spots showing on the photograph are only background noise. concentrations greater t h a n 0.5% i n any 1-pm-dia area.
Analyses found no ruthenium or cesium
Radioactive e f f luent system data obtained d u r i n g two high-level waste
In the process of concentrating and sol idifying the high-level PW-8 type concentration and v i t r i f i c a t i o n operations a t PNL are shown in Tables 28 and 29. waste, more than 1.03 x 10 mater ia ls were processed. solut ion, nitrogen oxide ( N O i ) evaluations were also completed. The off-gas system su f f i c i en t ly reduced the NOx concentration from the so l id i f i ca t ion t o the stack such t h a t 5% opacity was never exceeded (5% i s the v i s ib l e opacity threshold) . Prior t o stack d i lu t ion , nitrogen oxide levels were low, generally i n the area of 1000 t o 2000 ppm.
6 3 curies of beta-gamma and 4.14 x 10 C i of alpha Since the radioactive waste was a n i t r i c acid based
Another source of radioactive off-gas data i s the Waste Sol id i f ica t ion Engineering Prototype (WSEP) program completed in the l a t e 1960s (McElroy e t a l . 1972). O f a l l the runs completed i n the WSEP program, only the f ina l two runs, SS-12 and SS-13, were made w i t h spray calciner and in-can melter hardware similar t o t ha t used i n the nonradioactive t e s t s . d i t i o n s and resul t ing ruthenium losses are shown i n Table 30. losses are believed t o be h i g h due t o ruthenium deposits i n the system from prev i ou s non - boros i 1 i cat e g: ass oper a t i on s .
The operating con- The ruthenium
Radioactive off-gas data was also obtained in the high-level waste research done by Y. B. Katayama (Mendel 1977). so l id i f i ca t ion process in an in-pot calciner ; v o l a t i l i t i e s from t h a t equipment would be expected t o be somewhat higher than those from a spray calciner . High-level'waste from the Zorita reactor was calcined a t 5OO0C in a batch of 100 g . losses were 0.31%. Decontamination f ac to r s obtained across the calciner ( n o
Katayama carr ied o u t the
R u t h e n i u m ( l o 6 R u ) losses were 0.05%. Cesium (137Cs and 134Cs)
3 2 and 3.2 x 10 for ruthenium and cesium, respectively. f i l t e r s ) were 2 x 10
68
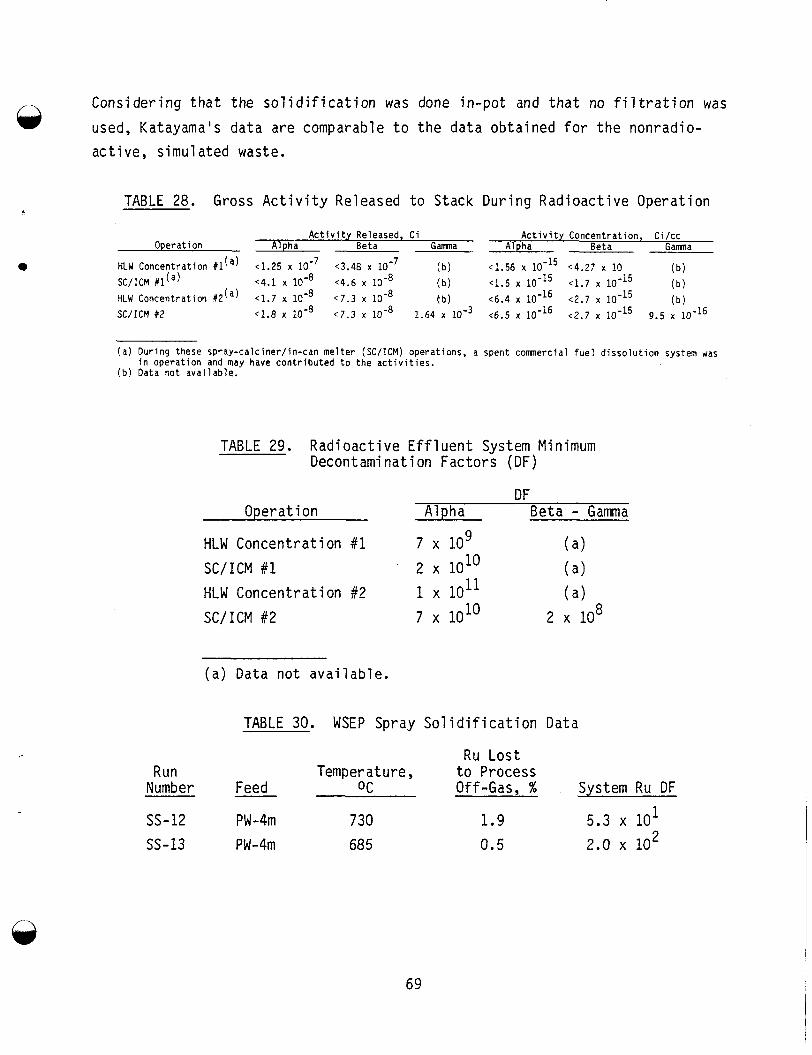
Cons ider ing t h a t the s o l i d i f i c a t i o n was done in -po t and t h a t no f i l t r a t i o n was
used, Katayama's da ta are comparable t o t h e da ta ob ta ined f o r t h e nonradio- a c t i v e , s imu la ted waste.
0
TABLE 28. Gross A c t i v i t y Released t o Stack Dur ing Rad ioac t i ve Operat ion
Activity Released, Ci Activity Concentration, Ci/cc Operation Alpha Beta Gamna Alpha Beta G a m a
(b) ~1.56 x ~4.27 x 10 (b) HLW Concentration ~ 1 . 2 5 x (3.48 x
SC/ICM #l(a) c4.1 x lo-' ~ 4 . 6 x (b) c1.5 1 0 - l ~ 4 . 7 10-l~ (b) ( b ) HLW Concentration #2(') <1.7 x lo-* C7.3 x fb)
SC/ICM #2 ~ 1 . 8 x ~ 7 . 3 x 1.64 x ~6.5 x <2.7 x 10- (6.4 x ~ 2 . 7 x 10- 15
l5 9.5 x 10⁻¹⁶
( a ) During these spray-calciner/in-can melter (SC/ICM) operations, a spent comnercial fuel dissolution system was
(b) Data not available. in operation and may have contributed to the activities.
TABLE 29. Rad ioac t i ve E f f l u e n t System Minimum Decontaminat ion Fac tors (DF)
DF Operat ion Alpha Beta - Gamma
HLW Concentrat ion #1 7 lo9 ( a ) S C / I C M #1 2 x 1o1O ( a > HLW Concentrat i on #2 1 x l o l l ( a > S C / I C M #2 7 x 1o1O 2 x lo8
( a ) Data n o t a v a i l a b l e .
TABLE 30. WSEP Spray S o l i d i f i c a t i o n Data
Ru L o s t Run Temper a t u re , t o Process
Number Feed OC Off-Gas, % System Ru DF
ss-12 PW-4m 730 1.9 5.3 x lo1 SS - 13 PW-4m 685 0.5 2.0 x lo2
69
CONCLUSIONS
According to data obtained during calcination of nonradioactive, simulated waste, ruthenium and cesium losses from the spray calciner are small, on the order of 3.5 x lo"% and 3.4 x lo-'%, respectively.
4 filter decontamination factors for ruthenium and cesium averaged 3.6 x 10 and 3.9 x lo4 , respectively. to 10 have been obtained using sintered stainless steel filters. A signi- ficant portion o f the ruthenium and cesium lost to the process off-gas system was due to particle penetration o f the filters. filters have a mass distribution centering about a size large enough to control with available technology.
Calciner-melter and
3 Particulate decontamination factors o f 10 4
The particles penetrating the
Processing wastes containing fluoride will probably volatilize a portion of the fluoride to the off-gas system, thus increasing the probability of cor- rosi on problems.
4
0
ACKNOWLEDGMENTS
Appreciation i s extended t o T. A. Nelson f o r his gas chromatograph and NOx m o n i t o r i n g work, t o J. T. J e f f s fo r the samples collected d u r i n g many hours of operational time, and t o F. T. Hara for his analyt ical expertise.
73
4
REFERENCES
B jork lund, W. J. 1976. Development and Use o f S intered-Meta l F i l t e r s w i t h F l u i d i z e d Bed and Spray C a l c i n a t i o n o f S imulated High-Level Waste. BNWL- 2074, P a c i f i c Northwest Laboratory , Rich land, Washington.
6d
Bonner, W. F., H. T. B l a i r and L. S. Romero. 1976. Spray S o l i d i f i c a t i o n o f Nuclear Waste. BNWL-2059, P a c i f i c Northwest Laboratory , Rich-land, Washing- ton.
4 C h r i s t i a n , J. D., and D. T. Pence. 1977. C r i t i c a l Assessment o f Methods f o r T r e a t i n g A i rborne E f f l u e n t s f rom High-Level Waste S o l i d i f i c a t i o n Process. PNL-2486, P a c i f i c Northwest Laboratory , Richland, Washington.
Gray, W. J. 1976. V o l a t i l i t y o f a Z inc B o r o s i l i c a t e Glass Con ta in in Simulated High-Level Rad ioac t i ve Waste. BNWL-2111, P a c i f i c Northwe!t Labor- a to ry , Rich land, Washington.
Kaser, J. D., and J. E. Moore. 1966. "The Development o f a Spray C a l c i n e r Me l te r . " I n Proceedings o f t h e Symposium on t h e S o l i d i f i c a t i o n and Long- Term Storage o f H i g h l y Rad ioac t i ve Wastes. Conf-66-2-8, ed. W. H. Region, pp. 350-351, Rich land, Washington.
McElroy, J. L., e t a l . 1972. Waste S o l i d i f i c a t i o n Program, Summary Report, Vol. 11, Eva lua t i on o f WSEP High-Level Waste S o l i d i f i c a t i o n Processes. BNWL-1667, P a c i f i c Northwest Laboratory , Rich land, Washington.
Mendel, J. E., e t a l . 1977. Annual Repor t on t h e C h a r a c t e r i s t i c s o f High-Level Waste Glass. BNWL-2252, P a c i f i c Northwest Laboratory , Rich land, Washington.
P a l l , D. B. 1953. " F i l t r a t i o n o f F l u i d C a t a l y s t F ines f rom E f f l u e n t Gases." I. and E. Chem. 45:1197-1202.
U.S. Dept. o f Energy. . 1979. Technology f o r Commercial Rad ioac t i ve Waste Management Volume 1 o f 5 DOE/ET-0028, Washington, D.C.
75
APPEND I X PARTICULATE SIZE DISTRIBUTIONS FROM
PILOT-SCALE SPRAY CALCINER
The material contained in this appendix describes the particulate size distributions from pilot-scale spray calciner operations as discussed in the section on Particle Size Analysis and Particle Loadings.
d
18.800 17.600 16.400
15.200 14.000
5 12.800 e 11.600 - 2 10.400 --1
c- 02 2 9.200 2 8.000
6.800
5.600 4.400
3.200
I . I
I -
I I
- I I
I I - I I I I - I I I
I - I
I I I - I I - 1 I I I I I - I I I - 1 . . I I - I I I
- I I I I - I I I
I - I
- I
2.000
1 10 100
PARTICLE COUNT
RUN NUMBER DSS - 47
I I I
I I I I I I I I I
1 I
I I I I I I I I I I I I
I I I
I I
I I I
I
10. 100.
PARTICLE COUNT
1OOO.
79
RUN NUMBER DSS-47
2.600 2.450 2.300 2.150 2.000
5 1.850 ~- 1.700 v, 1.550 2 1.400
1.250 z d
1.100 0.950 0.800 0.650
0.500
i 1 1 1 1
- Y
1 10 100
PARTICLE COUNT
RUN NUMBER
1 c 2 0.494 1
1 az 2 0.465 1
0.436
0.407
0.378 0.349 0.320
1 1 1 1
100 1000 10000 1 10
PARTICLE COUNT
8 0
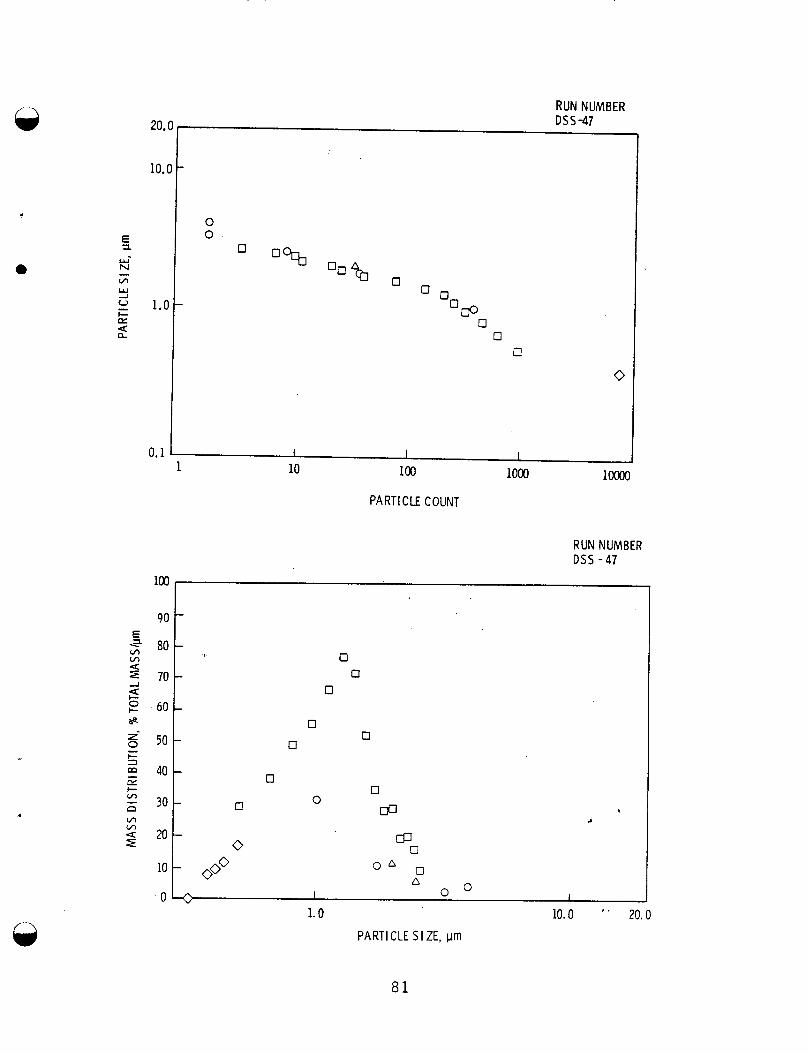
20.
10.
l . C
0.1
RUN NUMBER DSS-47
I 1 1
0 0
0 0
0 00 OO
0
100
90
80
70
60
50
40
30
20
10
0
RUN NUMBER D S S - 4 7
a 0
0
0 0
0
0
0
0
0 a
00
CP 0
O A 0 0O0 A
0 I 0 0 1
1.0
PARTICLE 5 I ZE, pm
10.0 ' . 20.0
8 1
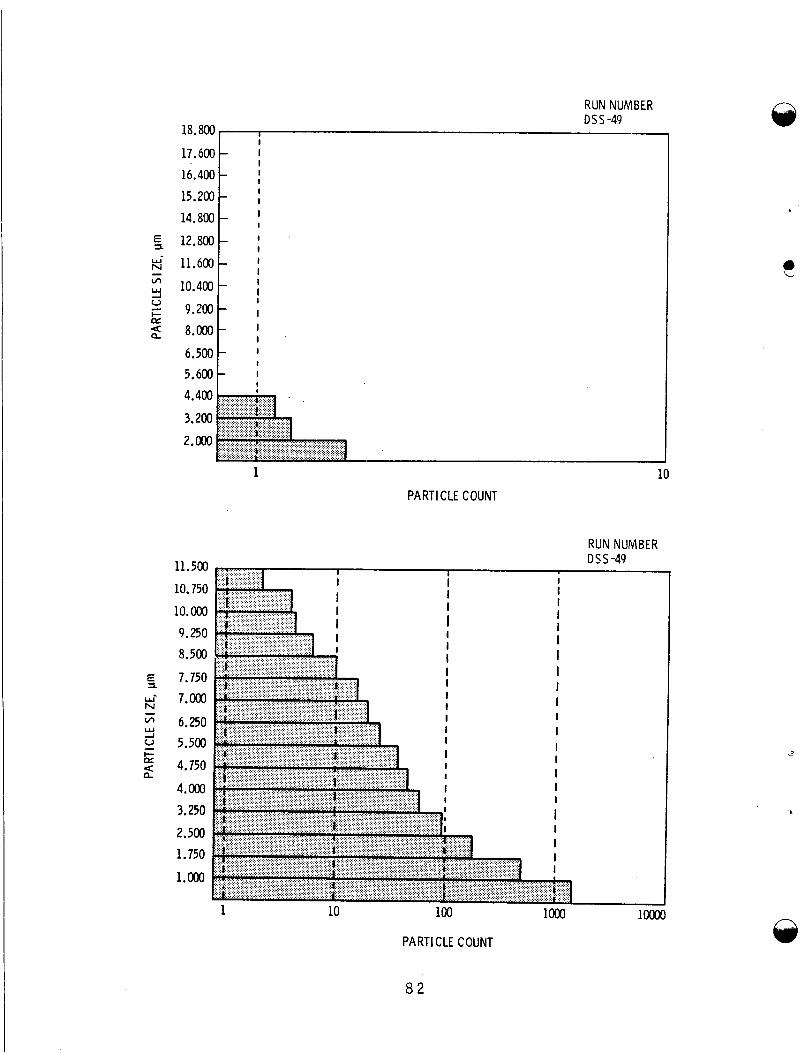
RUN NUMBER DSS -49
18.800
17.600 16.400 15.200 14.800
12.800 11.600
10.400
9.200 8.000
6.500 5.600 4.400
3.200
2.000
11.500
10.750 10. OaJ 9.250 8.500
7.750 w- 7.000
v, 6.250 2 5.500 5 4.750 n
4. ooo 3.250
2.500 1.750
1.000
E, N - Y A
1 10
PARTICLE COUNT
RUN NUMBER DSS-49
PARTICLE COUNT
'
0 L
A
8 2
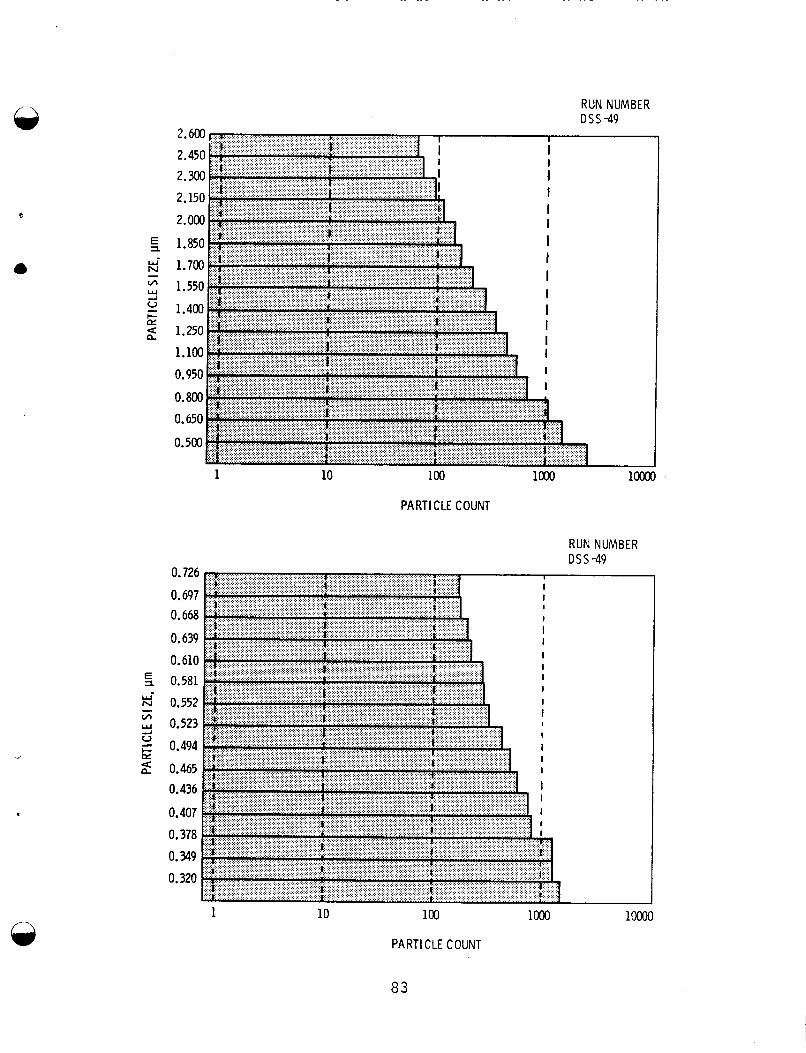
RUN NUMBER DSS -49
1 10 100 10001
PARTICLE COUNT
RUN NUMBER DSS -49
0.726 0.697 0.668
0.639 0.610
5 0.581 W’ N 0.552 w 0.523
0.494 s d 0.465
0.436
0.407 0.378 0.349 0.320
- v,
d
1 10 100
PARTICLE COUNT
83
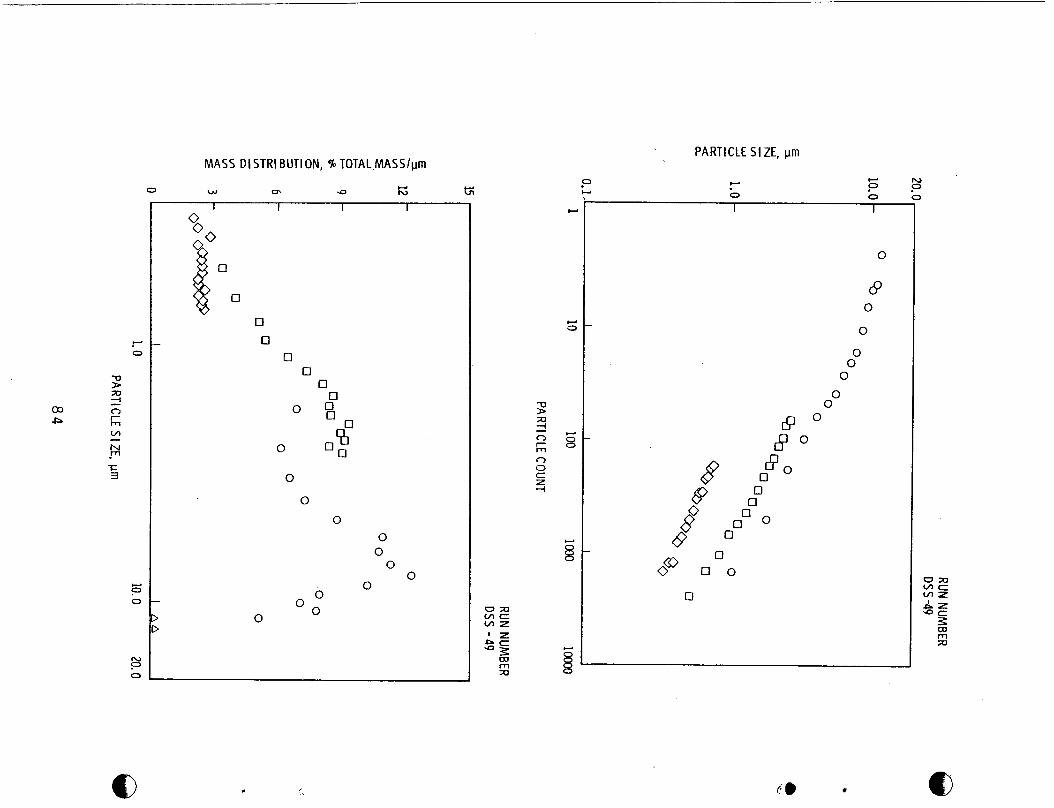
w 0
OT 0
N
0 P
M A S S DI STRl BUTION, % TOTAL.MASS/pm
Gi w w rn 9 h) 0
0 0
0 0 0 0
0 0 0
0 O O e"
0
0
0
0 0
0 0
0 0
O O 0
.
PARTICLE S I ZE, p m
w 0 w
0 0 1 1
0
8 0
0
0 0
0
0 0
0 8 61°
0 oa 0 0
0
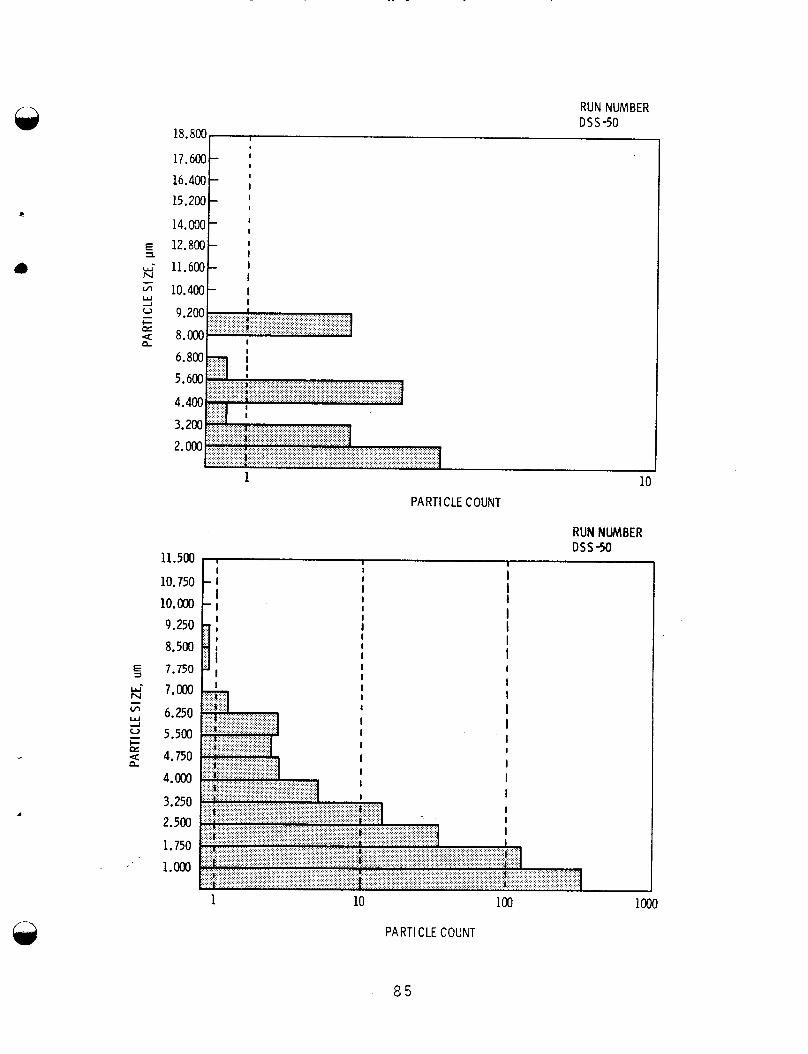
RUN NUMBER DSS-50
3.200 2. OOO
1 10 PARTICLE COUNT
11.500
10.750 10. ooo 9.250 8.500 7.750
u- N 7.000 - * w 6.250 2 5.500 a 4.750
4.000
3.250 2.500
1.750 1.000
J
I- = P
1 10 100
PARTICLE COUNT
1000
8 5
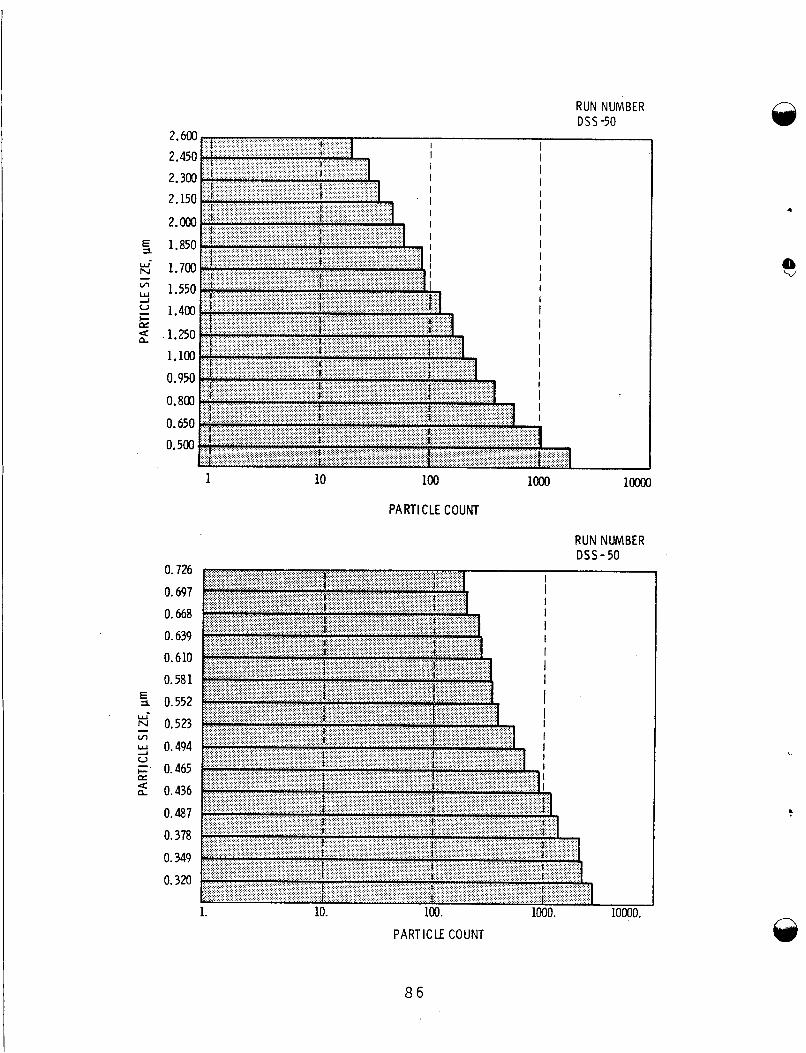
1 10 100
PARTICLE COUNT
RUN NUMBER DSS - 50
0.126 0.691 0.668 0.639 0.610 0.581
5 0.552 e - 0.523 w 0.494
0.465 d 0.436
0.487 0.318 0.349 0.320
vr -1
e
PART IC LE COUNT
8 6
10000.
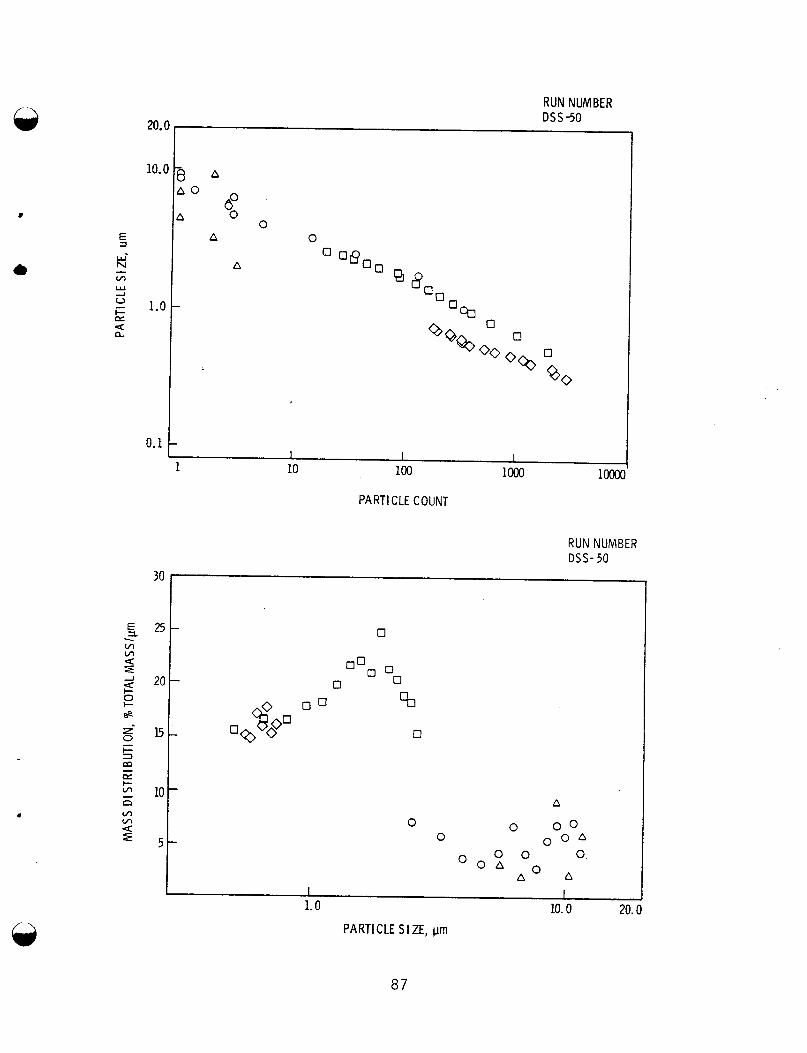
E, W' N m Y --I
I- @= U a
- 0
20.
10.
1.1
0.1
RUN NUMBER D S S S O
A 0
A 0
A
A
0
0 B
0
00 0
OCo
I I 1
100 loo0 loo00 1 10
PARTICLE COUNT
RUN NUMBER DSS- 50
0 25
10
5 0
0
A
0 0 0 o O A
I I
1.0 10.0 20.0 PARTICLE S I ZE, prn
87
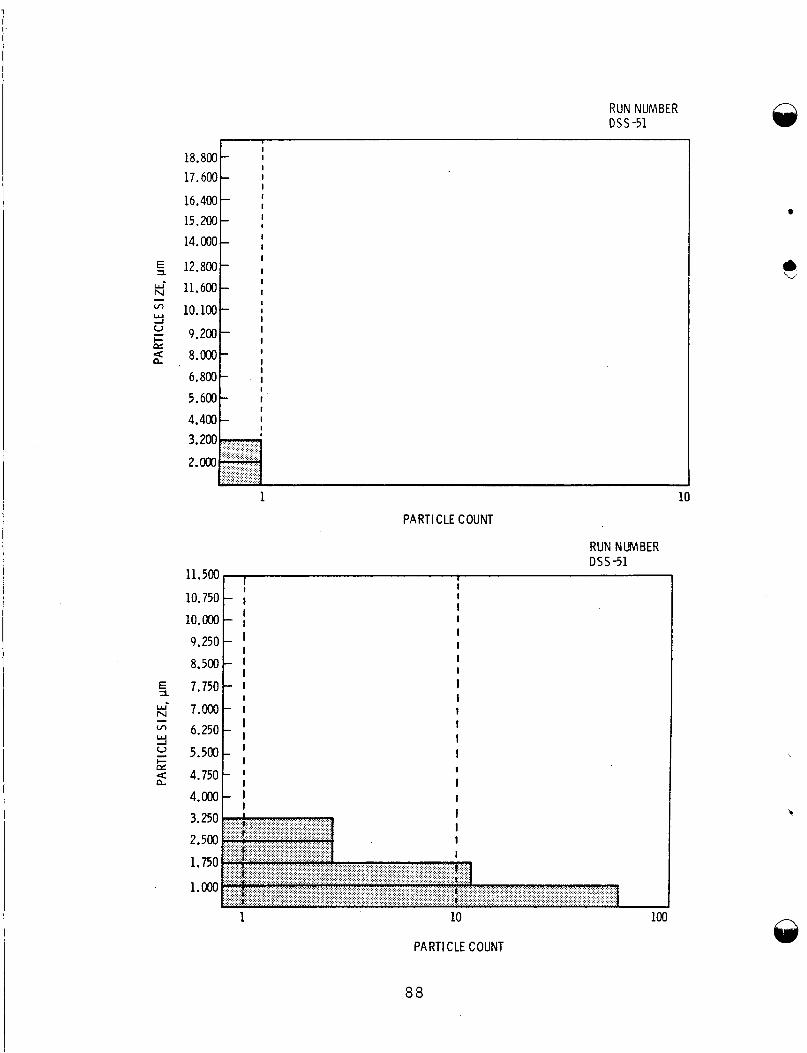
RUN NUMBER DSS -51
18.800 17.600
16.400 15.200 14.000
E, 12.800-
k- 11.600 - v, w 10.100-
2 8.ooo-
--I
2 I- 9.200-
6.800
5.600
4.400
- - - - -
-
- - -
I
11.500-
10.750
1o.Ooo
9.250
8.500
E, 7.750
k- 7.000 - v, 6.250
0 5.500 z 2 4.750
w --I
4.000-
I I I I I I I I I
I 1 I I I I I I I I I
I I I
I I I I
I
I
I I I I
I I - I
I I - I I
I I
- I 1 - I I - I I I I
- I I I I
I - I
- ; I I
I - I I I
3.200 2. ooo
1
PARTICLE COUNT
I I
3.250 2.500 I
I 1.750
1.OOO
10
1 10
PARTICLE COUNT
100
88
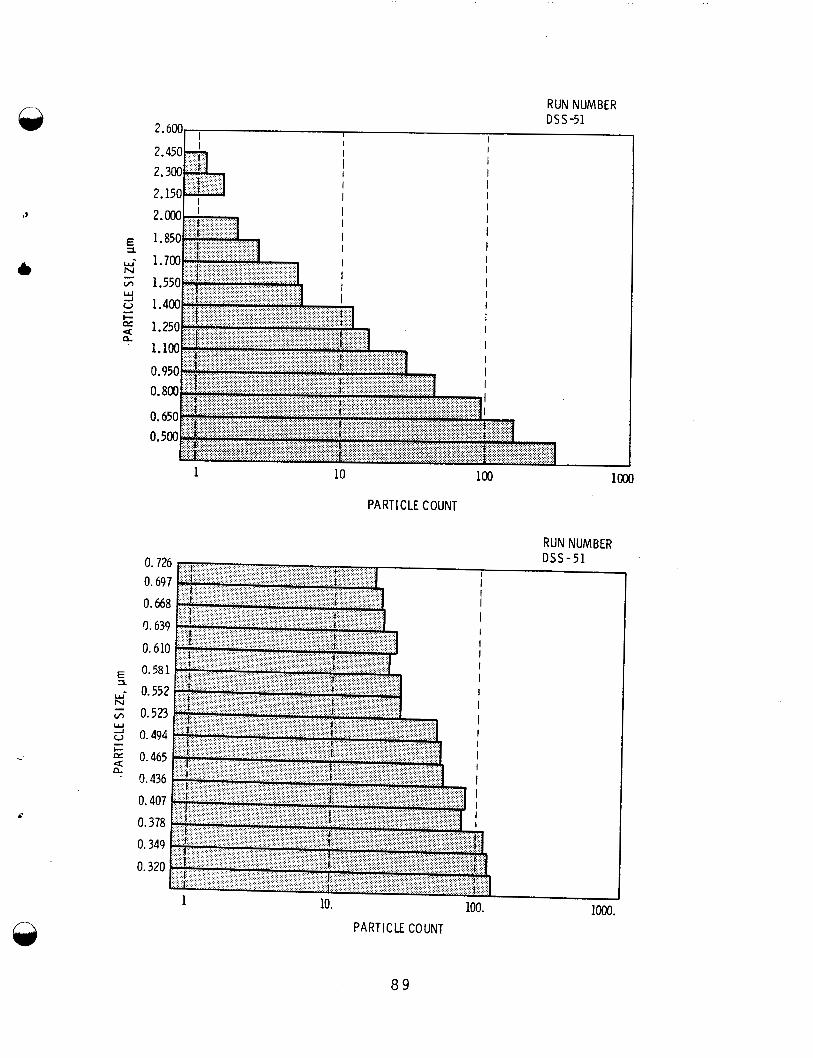
RUN NUMBER DSS-51
I I I
I I I I I I
I I I I I I
1 10
PARTICLE COUNT
RUN NUMBER
100
I
PARTICLE COUNT
89
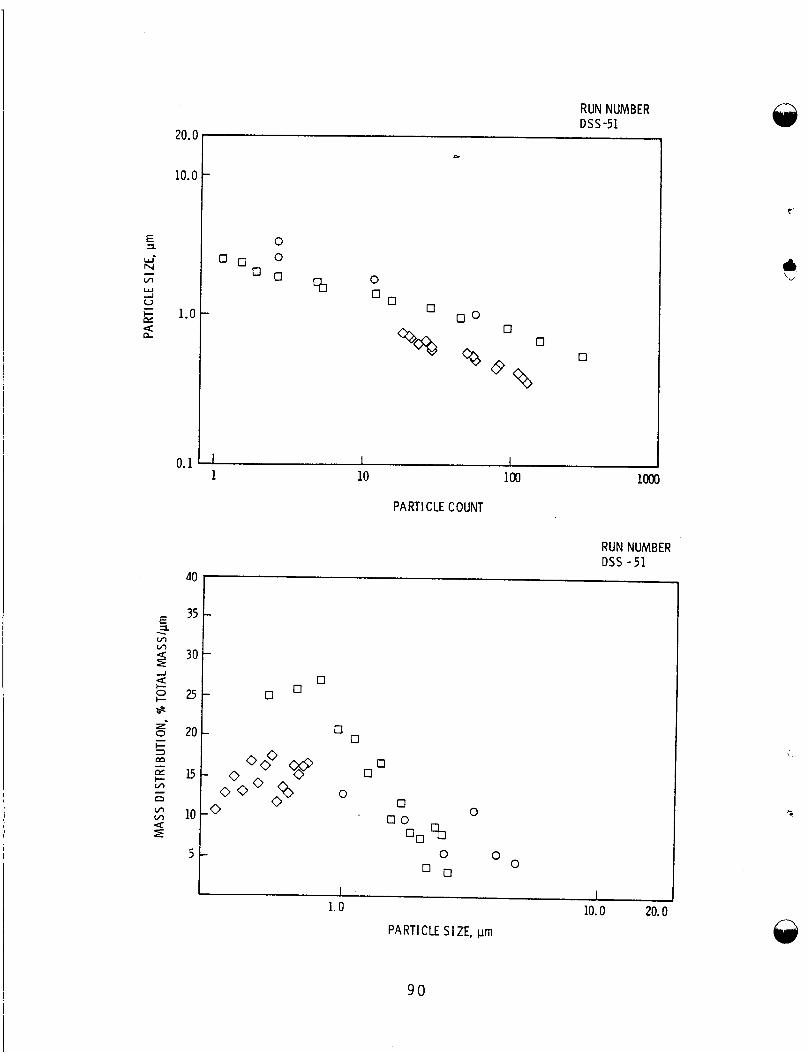
20.0
10.0
1.0
0.1
RUN NUMBER DSS-51
0 0 0
0 0
P
0
0
0 0
0
I 1 1 1 10 100
PARTICLE COUNT
RUN NUMBER DSS - 5 1
0
ooo O O 00 ' C 0
0 0
0 0
0 %? 0
5 0
0 0
0 0
OO % 0
0 0 O O
I ' 1
1.0 10.0 20.0 PARTICLE SI ZE, pm
9 0
PNL-3109 UC-70
DISTRIBUTION
No. of Cop i es
OFFSITE
A. A. Churm DOE Chicago Patent D i v i s i o n 9800 South Cass Avenue Argonne, I L 60439
b
R. E. Cunningham Deputy D i r e c t o r f o r Fue ls and
Nuclear Regu la to ry Commission S i l v e r Spr ings, MD 20910
Mater i a1 s
T. C. Chee DOE O f f i c e of Nuclear Waste
Washington, DC 20545 Man agemen t
C. R. Cooley DOE O f f i c e o f Nuclear Waste
Man a gem en t Washington, DC 20545
She 1 don Meyer s DOE O f f i c e o f Nuclear Waste
Management Washington, DC 20545
R. G. Romatowski DOE O f f i c e o f Nuclear Waste
Washington, DC 20545 Mangement
D. M. Rohrer Un i ted Sta tes Nuclear Regu la to ry
Commi s s i on Washington, DC 20545
C. A. Heath DOE O f f i c e o f Nuclear Waste
Washington, DC 20545 Man agemen t
No. o f Cop i es
G. Oer te l DOE O f f i c e o f Nuclear Waste
Washington, DC 20545 Man ag em en t
A. F. Perge DOE O f f i c e o f Nuclear Waste
Washington, DC 20545 Management
R. D. Walton DOE O f f i c e o f Nuclear Waste
Management Washington, DC 20545
W. E. Mot t DOE D i v i s i o n o f Environmental
Cont ro l Technology Washington, DC 20545
J. Nef f , Program Manager Department o f Energy Columbus Program O f f i c e 505 K i n Avenue ColumbGs, OH 43201
John Van Cleve DOE Oak Ridge Operat ions O f f i c e P.O. Box X Oak Ridge, TN 37830
J. B. W h i t s e t t DOE Idaho Operat ions O f f i c e P.O. Box 2108 Idaho F a l l s , I D 83401
E. S. Goldberg DOE Savannah R ive r Operat ions
O f f i c e P.O. Box A Aiken, SC 29801
D i s t r - 1
No. o f Copies
27 DOE Technica l I n fo rma t ion Center
No. o f Copies
J. R. Be r re th Exxon Nuclear Idaho Corp Box 2800 Idaho F a l l s, I D 83401
R. A. Brown Exxon Nuclear Idaho Corp. Box 2800 Idaho F a l l s , I D 83401
J. D. C h r i s t i a n Exxon Nuclear Idaho Corp Box 2800 Idaho F a l l s , I D 83401
Exxon Nuclear Idaho Corp ( F i l e Copy) Box 2800 Idaho F a l l s , I D 83401
A. Wi l l iams A l l ied-Genera l Nuclear Serv ice P.O. Box 847 Barnwel l , SC 29812
J. L. Jard ine Argonne Na t iona l Labora tory 9700 South Cass Avenue Argonne, I L 60439
M. M. S te ind le r /L . E. Trevorrow Argonne Na t iona l Labora tory 9700 South Cass Avenue Argonne, I L 60439
Wayne Carb i ener B a t t e l l e Memorial I n s t i t u t e 505 K i n g Ave. Columbl;s, OH 43201
J. K i r c h e r O f f i c e o f Nuclear Waste I s o l a t i o n B a t t e l l e Memorial I n s t i t u t e 505 K ing Ave. Columbus, OH 43201
B a t t e l l e Memori a1 I n s t i t u t e O f f i c e of Nuclear Waste I s o l a t i o n ATTN: Bever l y Rawles 505 K i n g Avenue Columbus, Ohio 43201
Brookhaven Na t iona l Labora tory Reference Sect ion I n f ormat i on D i v i s i on Upton, NY 11973
J. L. Cranda l l E. I. duPont DeNemours and Company Savannah R ive r Labora tory Aiken, SC 29801
T. B. Hindman E. I. duPont DeNemours and Company Savannah R ive r Labora tory Aiken, SC 29801
H. L. H u l l E. I. duPont DeNemours and Company Savannah R ive r Labora tory Aiken, SC 29801
R. G. Garv in E. 1. duPont DeNemours and Company Savannah R ive r Labora tory Aiken, SC 29801
4
Jim Howel E. I. duPont DeNemours and Company Savannah R ive r Labora tory Aiken, SC 29801
D. L. McIntosh E. I. duPont DeNemours and Company Savannah R ive r Labora tory i
Aiken, SC 29801
J. A. K e l l e y E. I. duPont DeNemours and Company Savannah R ive r Labora tory Aiken, SC 29801
D i s t r - 2
No. o f No. o f Copies
J. G. C l ine , Execut ive D i r e c t o r M. D. Boersma E. I . duPont DeNemours and Company NYS ERDA Savannah R ive r Labora tory Agency B u i l d i n g #2 Aiken, SC 29801 Empire S ta te Plaza
Albany, NY 12223 S. Mirshak E. I. duPont DeNemours and Company Oak Ridge Na t iona l Labora tory (DOE) Savannah R ive r Labora tory Cent ra l Research L i b r a r y
P.O. Box X E. W i l h i t e Oak Ridge, TN 37830 E. I. duPont DeNemours and Company Savannah R ive r Labora tory E. H. Kobisk Aiken, SC 29801 S o l i d S ta te D i v i s i o n
A. S. Jennings Oak Ridge, TN 37830 E. I. duPont DeNemours and'company Savannah R ive r Labora tory R. Roy Aiken, SC 29801 Pennsylvania S ta te U n i v e r s i t y
Ma te r i a l s Research Labora tory H. Henning U n i v e r s i t y Park, PA 16802 E l e c t r i c Power Research I n s t i t u t e 3412 H i 11 view Avenue J. B r a i thwai t e P.O. Box 10412 ORG 5831 Palo A l t o , CA 94301 Sandia Labora tor ies
Environmental P r o t e c t i o n Agency Albuquerque, NM 87185 Techno 1 ogy Assessment D i v i s i on
O f f i c e o f Rad ia t i on Programs Washington, DC 20460 Albuquerque, NM 87185
0 -
& Aiken, SC 29801 Document Reference Sect ion
Oak Ridge Na t iona l Labora tory
P.O. Box 5800
(AW-559) W. Weart Sandia Labora to r ies
R. G. Barnes General E l e c t r i c Company 175 Cur tner Avenue (M/C 858) San Jose, CA 95125
Los Alamos S c i e n t i f i c Labora tory
P.O. Box 1663 Los Alamos, NM 87544
J. P. Duckworth P 1 ant Manager Nuclear Fuel Services, Inc . P.O. Box 124 West Va l ley , NY 14171
(DOE 1
I
J. 0. Blomeke Union Carbide Corpora t ion (ORNL) C hemi ca 1 Techno 1 ogy D i v i s i on P.O. Box Y Oak Ridge, TN 37830
D i s t r - 3
R. E. Blanco Union Carbide Corpora t ion (ORNL) Chemi ca 1 Tec hno l ogy D i v i s i on P.O. Box Y Oak Ridge, TN 37830
No. of Copies
No. of Copies
D. E. Ferguson Union Carbide Corporation ( O R N L ) C hemi ca 1 Tec hno 1 ogy D i v i s i on P.O. Box Y Oak Ridge, TN 37830
H. W. Godbee Union Carbide Corporation ( O R N L ) Chemical Technology Division P.O. Box Y Oak Ridge, TN 37830
FOREIGN
S. Tashiro Japan Atomic Energy Research
Environmental Safety Research
1-1-13, Shibashi Minatopku, Tokyo JAPAN
I n s t i t u t e
Laboratory
2 Internat ional Atomic Energy Agency Kartner Ring 11 P.O. Box 590 A-1011, Vienna, AUSTRIA
D. W . Clelland United Ki ngdom Atomic Energy
Authority Risley, ENGLAND
B. Morris Atomic Energy Research
Est ab1 i s hmen t , Harwell , Di dcot , Berks, ENGLAND
E. R. Merz ONS ITE
3 DOE Richland Operations Office
D 5 m u 1 i ch Postfach 365 Federal Republic WEST GERMANY
P. A. Craig H. E . Ransom M. J. Zamorski
5 Rockwell Hanford Operations R . Bonniaud Center de Marcoule B.P. 170 30200 Baguols-Sur-Ceze FRANCE
F. Laude Centre de Marcoule B.P. 170 30200 Baguols-Sur-Ceze FRANCE
H. Krause Kernforschungszentrum Karl sruhe
GmbH ( K f K ) Postf ach 3640 D7500 Karl sruhe WEST GERMANY
L. Brown M. J. Kupfer G. Reep D. D. Wodrich , F i l e Copy
r
D i str-4
Exxon Nuclear Company
S. J. Beard
Westinghouse Hanford Company
A. G. Blasewitz 3
50 Pacific Northwest Laboratory
S. M. Barnes W. J. Bjorklund H. T. Blair W. F. Bonner R. A. Brouns J. L. Buelt
3 C. Devary R. D. Dierks R. W. Goles
11 M. S. Hanson A. J. Haverfield L. K. Holton J. H. Jarrett D. E. Knowlton D. E. Larson J. L. McElroy
4
J. E. Mendel F. A. Miller T. A. Nelson R. E. Nightingale K. H. Oma C. R. Palmer W. L. Partain A. M. Platt
J. M. Rusin D. H. Siemens S. C. Slate C. L. Timmerman R. T. Treat
2 D. L. Prezbindowski
5 Technical Information 2 Publishing Coordination SF
Di str-5