Embed Size (px)
Citation preview
December 2010

ii
City of Spokane Parks and Recreation – Roadmap to the Future Acknowledgements
Mayor of Spokane Mary Verner
Spokane City Council
Bob Apple, District 1 Steve Corker, District 3 Nancy McLaughlin, District 3 Richard Rush, District 2 Joe Shogan, President, At‐Large Jon Snyder, District 2 Amber Waldref, District 1
Spokane Parks and Recreation Board
Bob Apple, Council Liaison Randy Cameron Ross Kelley, President Gary Lawton Kimberly Morse Jim Quigley James Santorsola Elizabeth Schoedel, Vice‐president Martha Lou Wheatley‐Billeter Christopher Wright
Director of Parks and Recreation
Leroy Eadie
iii
Department Project Team Mike Aho, Recreation Supervisor Taylor Bressler, Parks Planning Manager Craig Butz, Recreation/Entertainment Manager Leroy Eadie, Director Jacki Faught, Administrative Secretary Nancy Goodspeed, Marketing/Communications Manager Rebecca Madany, Budget/Finance Manager Tony Madunich, Park Operations Manager Pamela McKinzie, Golf/Administration Manager
For more information about this document, please contact: GP RED, 3050 Industrial Lane, Broomfield, CO 80020
303‐439‐8369 Consultant Team
Jamie S. Sabbach, CPRP, Project Manager, 110%, LLC Karon Badalamenti, CPRP, Principal, GreenPlay, LLC Chris Dropinski, CPRP, Principal, GreenPlay, LLC Dr. Deb Jordan, East Carolina University Rob Layton, ASLA, Principal, Design Concepts Anne Miller, Project Consultant, GreenPlay, LLC David Peterson, Project Consultant, Design Concepts Mike Simone, RRC Associates
iv
Table of Contents
Executive Summary .................................................................................................................................................................................... 1
City of Spokane Parks and Recreation Values Statements ............................................................................................................................................................. 3
City of Spokane Parks and Recreation Vision Statement ............................................................................................................................................................... 3
City of Spokane Demographic Analysis ......................................................................................................................................................................................... 3
Park and recreation and allied industry Trends Analysis ................................................................................................................................................................ 3
Spokane Community Issues and Interests Matrix ......................................................................................................................................................................... 3
City of Spokane Parks and Recreation Service Portfolio ................................................................................................................................................................. 3
City of Spokane Parks and Recreation Mission Statement .............................................................................................................................................................. 3
City of Spokane Parks and Recreation Financial Resource Allocation Philosophy ............................................................................................................................ 3
City of Spokane Parks and Recreation Pricing Methodology .......................................................................................................................................................... 3
City of Spokane Parks and Recreation Level of Service Analysis and Perspectives .......................................................................................................................... 3
City of Spokane Parks and Recreation Physical Property Inventory Atlas ....................................................................................................................................... 3
City of Spokane Parks and Recreation Operational Actions ........................................................................................................................................................... 3
City of Spokane Parks and Recreation ........................................................................................................................................................ 5
A Rich and Revered History ................................................................................................................................................................................................................ 7
Today’s System .................................................................................................................................................................................................................................. 8
Governance .................................................................................................................................................................................................................................... 11
Powers of the Parks and Recreation Board ....................................................................................................................................................................................... 11
Parks and Recreation Budget and Disbursement of Funds ................................................................................................................................................................ 12
v
Spokane Demographics, Trends & Anticipated Impacts ............................................................................................................................. 13
Education ....................................................................................................................................................................................................................................... 25
Parks and Recreation Trends ............................................................................................................................................................................................................ 29
Source: Sporting Goods Manufacturers Association .......................................................................................................................................................................... 35
Nature Programming ....................................................................................................................................................................................................................... 43
Key Demographic & Parks and Recreation Trend Considerations ...................................................................................................................................................... 51
Values, Mission & Vision .......................................................................................................................................................................... 53
Key Values, Mission and Vision Considerations ................................................................................................................................................................................. 59
Spokane Community Issues & Interests ..................................................................................................................................................... 61
Parks and Recreation Interests ......................................................................................................................................................................................................... 67
Key Community Issues and Interests Considerations ......................................................................................................................................................................... 79
Parks & Recreation Services ..................................................................................................................................................................... 81
Evaluation & Analysis ................................................................................................................................................................................ 81
Parks & Recreation Policy Framework .............................................................................................................................................................................................. 83
Parks and Recreation Service Assessment ........................................................................................................................................................................................ 84
Level of Service Analysis ................................................................................................................................................................................................................... 90
Planning Coordination ................................................................................................................................................................................................................... 119
Key Parks and Recreation Services – Evaluation & Analysis Considerations ..................................................................................................................................... 120
Resource Allocation ................................................................................................................................................................................ 123
Financial Resource Allocation ......................................................................................................................................................................................................... 125
The Pyramid Methodology ............................................................................................................................................................................................................. 127
Property Resource Allocation ......................................................................................................................................................................................................... 143
vi
Staff Resource Allocation ............................................................................................................................................................................................................... 147
Key Resource Allocation Considerations ......................................................................................................................................................................................... 149
2010‐2012 Action Plan ............................................................................................................................................................................. 151
General Recommendations and Considerations for the 2013‐2014 Action Plan ...................................................................................... 167
General Recommendations and Considerations for the 2013‐2014 Action Plan ............................................................................................................................... 169
Table of Figures FIGURE 1: SPOKANE POPULATION ................................................................................................................................................................................ 15 FIGURE 3: POPULATION BY SUB‐AREA .......................................................................................................................................................................... 16 FIGURE 2: 2000 TO 2009 AND PROJECTED 2009‐2014 CITY OF SPOKANE, SPOKANE COUNTY, AND WASHINGTON STATE POPULATION ........................ 16 FIGURE 4: 2009 POPULATION BREAKDOWN PERCENT OF TOTAL BY AGE‐ CITY OF SPOKANE, SPOKANE COUNTY, AND WASHINGTON STATE ............... 17 FIGURE 5: 2000‐2014 CITY OF SPOKANE POPULATION AGE TRENDLINE ........................................................................................................................ 18 FIGURE 6: HOUSEHOLDS BY INCOME ‐ CITY OF SPOKANE, SPOKANE COUNTY, AND WASHINGTON STATE .................................................................... 27 FIGURE 7: IMPORTANCE OF ADDING, EXPANDING, OR IMPROVING INDOOR FACILITIES/AMENITIES ............................................................................ 29 FIGURE 8: MOST IMPORTANT EVENTS AND ACTIVITIES ................................................................................................................................................ 30 FIGURE 9: SPOKANE COUNTY AND WASHINGTON STATE ADULT OBESITY COMPARISON 1997‐2005 ............................................................................ 39 FIGURE 10: POPULATION WITH A DISABILITY BY AGE AND SEX IN SPOKANE COUNTY, 2008 ......................................................................................... 45 FIGURE 11: RESPONDENT DEMOGRAPHICS .................................................................................................................................................................. 67 FIGURE 12: HOUSEHOLD INFORMATION ...................................................................................................................................................................... 68
Table of Tables TABLE 1: RACE/ETHNICITY COMPARISONS FOR 2009 ................................................................................................................................................... 23 TABLE 2: EDUCATIONAL ATTAINMENT – 25 YEARS AND OLDER (2009) ......................................................................................................................... 26 TABLE 3: HOUSING UNITS (2008) ................................................................................................................................................................................ 28 TABLE 4: TOP TEN SPORTS RANKED BY TOTAL PARTICIPATION 2008 ............................................................................................................................ 31 TABLE 5: TEN‐YEAR HISTORY OF SPORTS PARTICIPATION 1998‐2008 ............................................................................................................................ 32 TABLE 6: MOST POPULAR EXTREME SPORTS IN THE USA (U.S. POPULATION; 6 YEARS OF AGE OR OLDER) ................................................................... 35 TABLE 7: WORLDWIDE FITNESS TRENDS FOR 2007 AND FOR 2008 ................................................................................................................................ 40

1
Executive Summary
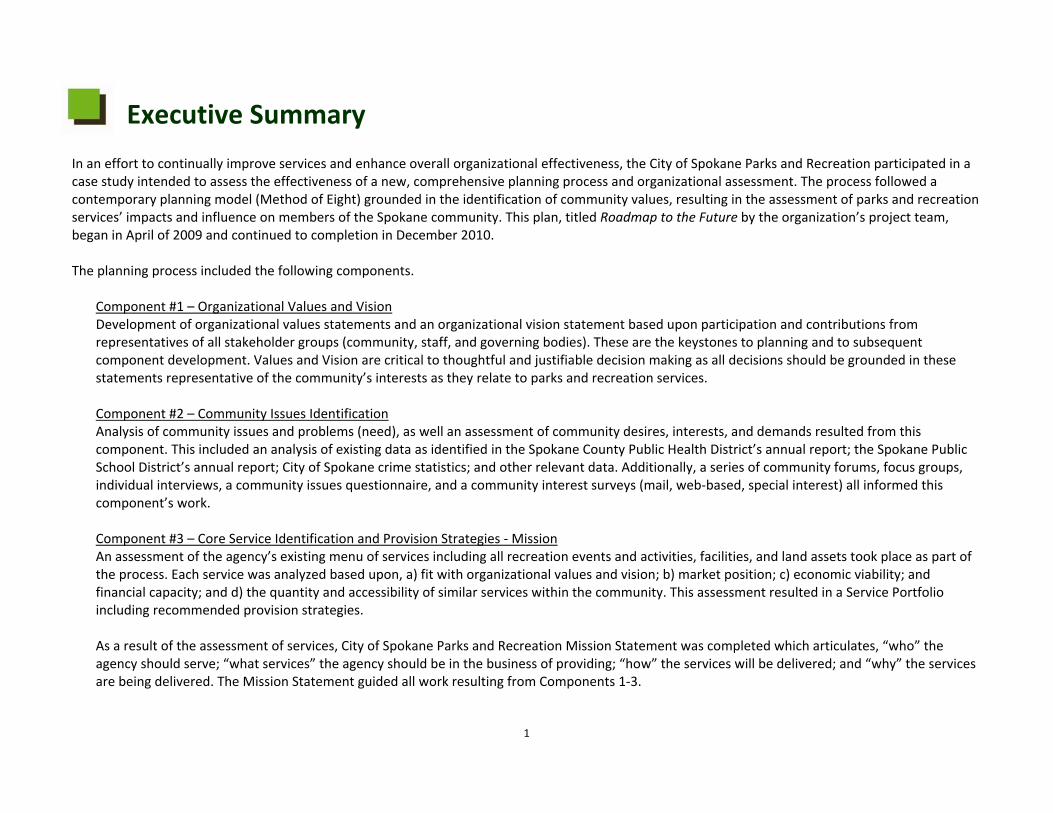
In an effort to continually improve services and enhance overall organizational effectiveness, the City of Spokane Parks and Recreation participated in a case study intended to assess the effectiveness of a new, comprehensive planning process and organizational assessment. The process followed a contemporary planning model (Method of Eight) grounded in the identification of community values, resulting in the assessment of parks and recreation services’ impacts and influence on members of the Spokane community. This plan, titled Roadmap to the Future by the organization’s project team, began in April of 2009 and continued to completion in December 2010. The planning process included the following components.
Component #1 – Organizational Values and Vision Development of organizational values statements and an organizational vision statement based upon participation and contributions from representatives of all stakeholder groups (community, staff, and governing bodies). These are the keystones to planning and to subsequent component development. Values and Vision are critical to thoughtful and justifiable decision making as all decisions should be grounded in these statements representative of the community’s interests as they relate to parks and recreation services.
Component #2 – Community Issues Identification Analysis of community issues and problems (need), as well an assessment of community desires, interests, and demands resulted from this component. This included an analysis of existing data as identified in the Spokane County Public Health District’s annual report; the Spokane Public School District’s annual report; City of Spokane crime statistics; and other relevant data. Additionally, a series of community forums, focus groups, individual interviews, a community issues questionnaire, and a community interest surveys (mail, web‐based, special interest) all informed this component’s work.
Component #3 – Core Service Identification and Provision Strategies ‐ Mission An assessment of the agency’s existing menu of services including all recreation events and activities, facilities, and land assets took place as part of the process. Each service was analyzed based upon, a) fit with organizational values and vision; b) market position; c) economic viability; and financial capacity; and d) the quantity and accessibility of similar services within the community. This assessment resulted in a Service Portfolio including recommended provision strategies. As a result of the assessment of services, City of Spokane Parks and Recreation Mission Statement was completed which articulates, “who” the agency should serve; “what services” the agency should be in the business of providing; “how” the services will be delivered; and “why” the services are being delivered. The Mission Statement guided all work resulting from Components 1‐3.
2
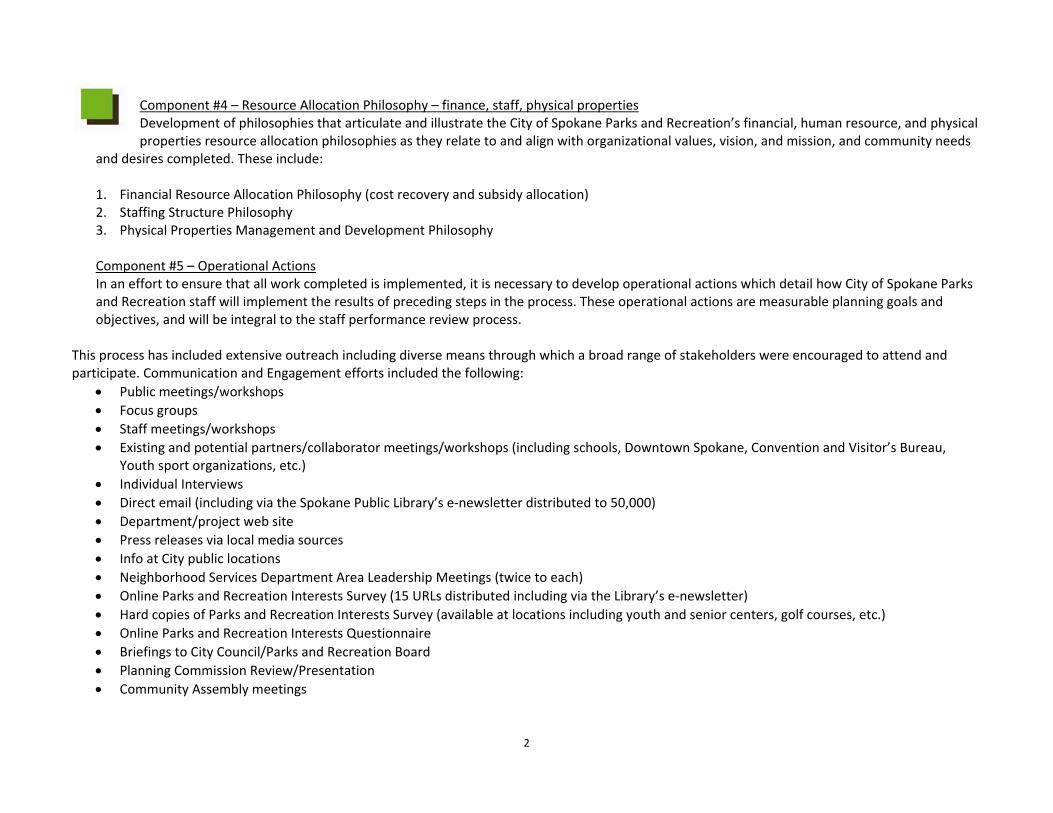
Component #4 – Resource Allocation Philosophy – finance, staff, physical properties Development of philosophies that articulate and illustrate the City of Spokane Parks and Recreation’s financial, human resource, and physical properties resource allocation philosophies as they relate to and align with organizational values, vision, and mission, and community needs
and desires completed. These include:
1. Financial Resource Allocation Philosophy (cost recovery and subsidy allocation) 2. Staffing Structure Philosophy 3. Physical Properties Management and Development Philosophy
Component #5 – Operational Actions In an effort to ensure that all work completed is implemented, it is necessary to develop operational actions which detail how City of Spokane Parks and Recreation staff will implement the results of preceding steps in the process. These operational actions are measurable planning goals and objectives, and will be integral to the staff performance review process.
This process has included extensive outreach including diverse means through which a broad range of stakeholders were encouraged to attend and participate. Communication and Engagement efforts included the following:
• Public meetings/workshops • Focus groups • Staff meetings/workshops • Existing and potential partners/collaborator meetings/workshops (including schools, Downtown Spokane, Convention and Visitor’s Bureau,
Youth sport organizations, etc.) • Individual Interviews • Direct email (including via the Spokane Public Library’s e‐newsletter distributed to 50,000) • Department/project web site • Press releases via local media sources • Info at City public locations • Neighborhood Services Department Area Leadership Meetings (twice to each) • Online Parks and Recreation Interests Survey (15 URLs distributed including via the Library’s e‐newsletter) • Hard copies of Parks and Recreation Interests Survey (available at locations including youth and senior centers, golf courses, etc.) • Online Parks and Recreation Interests Questionnaire • Briefings to City Council/Parks and Recreation Board • Planning Commission Review/Presentation • Community Assembly meetings
3
Essentially, the flow of the process intends to address these questions.
1. What is important to the community as it relates to parks and recreation services? 2. What are the issues (i.e., challenges and problems) in the community that can be affected, impacted, or influenced by parks and recreation
services? 3. What is the market position and financial capacity of each City of Spokane parks and recreation service? Who are the other providers in the
community that provide similar or like parks and recreation services to those offered by the City of Spokane? 4. What are suggested service provision (operational) strategies moving forward based upon this information? 5. What City planning efforts will have an impact on parks and recreation services in the future? 6. What key issues should be addressed to strengthen the position of the organization moving forward? 7. How will these key issues be addressed? 8. How will staff implement recommendations moving forward?
A variety of deliverables resulted from the City of Spokane Parks and Recreation’s Roadmap to the Future process. The following deliverables resulted from this process.
• City of Spokane Parks and Recreation Values Statements • City of Spokane Parks and Recreation Vision Statement • City of Spokane Demographic Analysis (including some County data) • Park and recreation and allied industry Trends Analysis • Spokane Community Issues and Interests Matrix • City of Spokane Parks and Recreation Service Portfolio (includes events and activities, facilities, and physical properties, as well as recommended
provision strategies) • City of Spokane Parks and Recreation Mission Statement • City of Spokane Parks and Recreation Financial Resource Allocation Philosophy • City of Spokane Parks and Recreation Pricing Methodology • City of Spokane Parks and Recreation Level of Service Analysis and Perspectives (e.g., ¼ mile access) • City of Spokane Parks and Recreation Physical Property Inventory Atlas • City of Spokane Parks and Recreation Operational Actions

City of Spokane Parks and Recreation
Answers the questions…Q: What is the City of Spokane Parks and Recreation Department?Q: What parks and recreation services are provided and/or supported by the organization?Q: What is its governance structure of the Department and its responsibility to the Spokane community?

7
A Rich and Revered History
In 1907, Spokane’s board of park commissioners retained the services of the influential and nationally renowned landscape design firm owned by step‐brothers John Charles Olmsted and Frederick Law Olmsted, Jr. With the help of the Olmsted Brothers, the Park Board prepared a comprehensive park plan to provide a magnificent park system that Spokane’s citizens still use today. In 1909, with strong support, a $1,000,000 bond issue for parks was approved by the voters. In 1908, the Olmsted Master Plan for Spokane proposed an ambitious development that called for four massive new parks, five smaller local parks, 11 playfields, numerous parkways, and major improvements to 10 existing parks. Many of these recommendations were soon put into effect, and by 1913, the city had multiplied its park acreage tenfold. Many of Spokane’s best‐known parks, including Finch Arboretum, High Bridge, and Downriver Parks owe their existence to the Olmsted plan. Even pre‐existing parks, including Manito Park, owe much of their aesthetic appeal to Olmsted suggestions. The Olmsted brothers even predicted that the City would one day reclaim the downtown riverfront, which in 1974 became the location for Spokane’s World Fair, EXPO ‘74, on the site known today as Riverfront Park. (Source: City of Spokane Parks and Recreation website) Spokane was the smallest city to host a world's fair until Knoxville, Tennessee held the 1982 World's Fair eight years later. The environmentally themed EXPO ‘74 was named "Celebrating Tomorrow's Fresh New Environment” and ran from May 4 – November 3 of that year. The heart of the fair park grounds was located on Canada Island, Havermale Island, and the adjacent south bank of the Spokane River in the center of the city. With the exception of two pavilions, all of the major buildings were modular structures assembled on the site. The fair had 5.2 million visitors and was considered a success, nearly breaking even, revitalizing the blighted urban core, and pumping an estimated $150 million into the local economy and surrounding region. Among the many attractions, architectural critics were intrigued by the Australian Pavilion with its 36 screen revolving audio visual platform which quickly gained an underground reputation as the place to experience something different. (The artistic director for the project was film director Jonathan Dawson).
After the event closed, the exposition site became the city's 100 acre Riverfront Park, containing the former U.S. Pavilion and a clock tower (part of a Great Northern rail depot that was demolished for EXPO ‘74), which prominently featured the park's logo.
Several structures built for the fair remain. The United States (U.S.) Pavilion still houses the IMAX Theater built for the fair, as well as a winter ice rink that is put to other varied uses in the warm months. The "Sky Ride" chairlift from EXPO ‘74 still stands as well, but not in its original place. It has since been moved to a theme park in Altoona, Iowa. The Washington State Pavilion still stands and is used as the Spokane Convention Center and the Opera House. The Carousel remains a popular attraction. It originated in Natatorium Park, which closed in 1967, and was restored for the World's Fair.
8
The original covering of the U.S. Pavilion was a thick vinyl sheeting that was not designed to last. It was allowed to remain until it began to deteriorate, become unsightly, and was thought a safety hazard. When the City opted to remove the covering, chunks of the thick vinyl could be purchased as keep‐sakes. The tent design itself with its heavy cables was not intended to stay up, however, the people of Spokane voiced
the opinion that it should remain as a unique architectural statement, and a monument to the EXPO ‘74. (Source: Wikipedia)
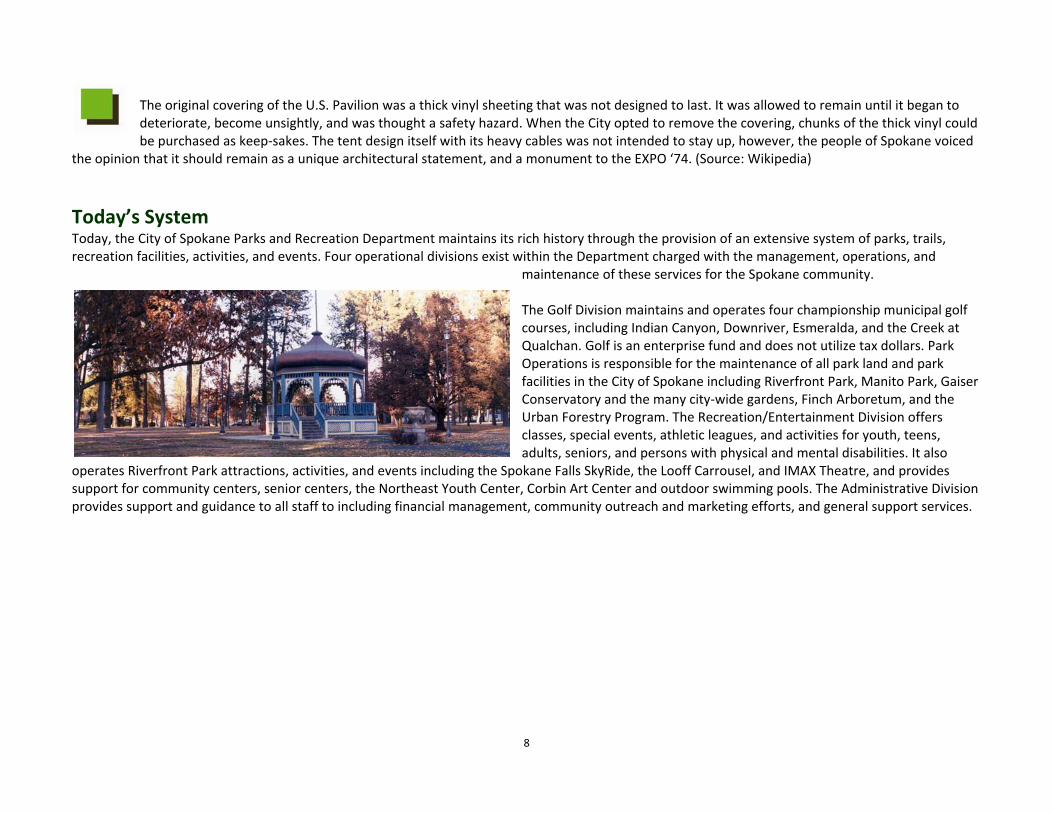
Today’s System Today, the City of Spokane Parks and Recreation Department maintains its rich history through the provision of an extensive system of parks, trails, recreation facilities, activities, and events. Four operational divisions exist within the Department charged with the management, operations, and
maintenance of these services for the Spokane community. The Golf Division maintains and operates four championship municipal golf courses, including Indian Canyon, Downriver, Esmeralda, and the Creek at Qualchan. Golf is an enterprise fund and does not utilize tax dollars. Park Operations is responsible for the maintenance of all park land and park facilities in the City of Spokane including Riverfront Park, Manito Park, Gaiser Conservatory and the many city‐wide gardens, Finch Arboretum, and the Urban Forestry Program. The Recreation/Entertainment Division offers classes, special events, athletic leagues, and activities for youth, teens, adults, seniors, and persons with physical and mental disabilities. It also
operates Riverfront Park attractions, activities, and events including the Spokane Falls SkyRide, the Looff Carrousel, and IMAX Theatre, and provides support for community centers, senior centers, the Northeast Youth Center, Corbin Art Center and outdoor swimming pools. The Administrative Division provides support and guidance to all staff to including financial management, community outreach and marketing efforts, and general support services.
9
Parks, Trails, and Recreational Facilities The City of Spokane Parks and Recreation Department is responsible for the management and prudent caretaking of more than 3,100 acres
of land including the following. Eighty (80) developed park areas Conservation lands Fifty (50) playgrounds Two Hundred (200) sports facilities Six (6) aquatics centers and 15 splashpads Four (4) championships golf courses Forty (40) miles of trails Riverfront Park Manito Park Gaiser Conservatory Six (6) garden facilities including the Nishinomiya Tsutakawa Japanese Garden John A. Finch Arboretum
Urban Forest Additionally, the Department provides for the care and well‐being of street trees, trees on developed public land and planting spaces along streets in the City including:
48,000 street trees 28,000 trees on developed public land 27,000 available planting spaces along streets
10
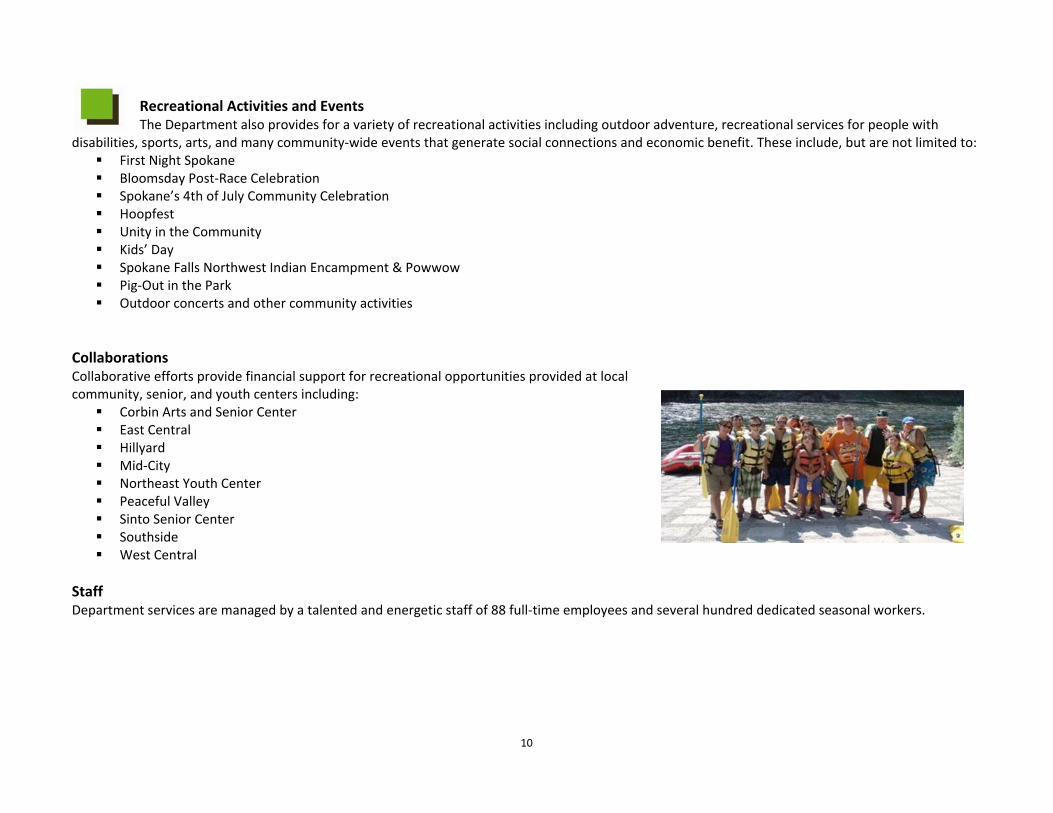
Recreational Activities and Events The Department also provides for a variety of recreational activities including outdoor adventure, recreational services for people with
disabilities, sports, arts, and many community‐wide events that generate social connections and economic benefit. These include, but are not limited to: First Night Spokane Bloomsday Post‐Race Celebration Spokane’s 4th of July Community Celebration Hoopfest Unity in the Community Kids’ Day Spokane Falls Northwest Indian Encampment & Powwow Pig‐Out in the Park Outdoor concerts and other community activities
Collaborations Collaborative efforts provide financial support for recreational opportunities provided at local community, senior, and youth centers including:
Corbin Arts and Senior Center East Central Hillyard Mid‐City Northeast Youth Center Peaceful Valley Sinto Senior Center Southside West Central
Staff Department services are managed by a talented and energetic staff of 88 full‐time employees and several hundred dedicated seasonal workers.
11
Governance Oversight and governance of the City of Spokane Parks and Recreation Department is provided by a non‐compensated, 10 member Parks and Recreation Board. This Board is appointed by the Spokane City Council with one member of the Council to be designated as the Council
representative. The council shall have power to remove any member for cause and to fill vacancies on the board. [Article V – Section 41/ORD C34385 Section 27] The term of office of the ten appointed members shall be five years with members limited to two terms. [Article V – Section 42/ORD C34385 Section 28] Powers of the Parks and Recreation Board
• To lay out, establish, purchase, procure, accept, and have the care, management, control, and improvement of all parks and grounds used for park purposes, all boulevards, connecting parks and structures thereon, and all parkways, now or hereafter owned or controlled by the City whether within or without the City limits, and may designate them by name;
• To lay out, establish, and improve boulevards and parkways, and to designate as a boulevard or parkway any existing highway or part thereof, but the highway or part thereof so designated shall remain under the control of the council;
• To exercise supervision over all shade trees, shrubs, and plants of all kinds on or in the streets and public places of the City and over all resting places, water stations, playgrounds, and parade grounds;
• To make rules and regulations for the use of parks and provide for the enforcement of such rules and regulations; • To prohibit or determine the place and manner of making excavations, and of placing or maintaining wires, pipes, poles, posts, masts, and
supports in parks or highways, and to compel the alteration or removal thereof at any time; • To improve and adorn parks and park property and do all things necessary or proper to render the parks or other property of value to the public;
and • To grant concessions, leases, and privileges under such restrictions and for such compensation as it shall prescribe, the revenue of which shall go
into the park fund; provided that, no concession or privilege shall ever be granted for the sale of any intoxicating liquors in any public park, square, play or recreation ground, park drive, parkway or park boulevard of the City; and that no concession, lease, or privilege shall be granted for a period of more than three years unless approved by ordinance. Nor shall either the park board or the city council, after January 1, 1982, have the power to allow the use of any part of Riverfront Park then or thereafter dedicated to park purposes by sale, lease, rent, permit, license, or other assignment for permanent commercial purposes without the prior approval of the City voters given by a majority vote in a regular municipal election. Permanent commercial purposes shall not include commercial activities existing prior to January 1, 1982, nor any activities operated directly by the City of Spokane or the park board for fee, nor any activity not having a fixed location, nor shall it include any activities approved by the park board not to exceed thirty days and renewable for periods not exceeding thirty days.
12
In no case shall the expenditure of the Parks and Recreation Board exceed the amount donated or appropriated for park and recreation purposes. Real and personal property may be granted, bequeathed, or devised to the City and accepted by the Board for park and recreation purposes or for the establishment or maintenance in parks or museums, zoological or other gardens, collections of natural history,
observatories, buildings, fountains, monuments, statues, or other works of art upon the trust and conditions prescribed by the donors thereof; and all such property, together with the income and profits thereof, shall be under the exclusive control of the park board. All property acquired by the Board shall be in the name of the City. Neither the Board nor the City Council shall have the power to sell or exchange any existing park or portion thereof without the prior approval of the electorate given by a majority vote at the next ensuing general municipal election or special municipal election, as the case may be. [Article V – Section 48/ORD C28870 Section 1] Parks and Recreation Budget and Disbursement of Funds
The City Council shall provide in the parks and recreation fund each fiscal year sufficient funds in order to maintain the parks, park system, and related activities, and to provide for the expenses authorized by this article. Such allocation shall be sufficient in amount and shall be a sum that represents no less than eight percent of the general fund expenditures of the last completed fiscal year. The funds so established may be reduced or otherwise adjusted by the city council only insofar as the total adopted general fund budget is reduced because of the insufficiency of revenues and in direct proportion to the reduction of the general fund budget. The funds so provided shall be used for the support of the parks and recreation department and shall be under the control of the park board. [Article V – Section 50/ORD C27101 Section 1] All taxes levied for park purposes, as provided in this charter, all moneys realized from the sale of park bonds, all moneys appropriated by the council for park purposes or received by the park board from any other source shall be turned into and kept in a fund designated the park fund and be deemed appropriated and shall be used exclusively for the purposes set forth in this article, and shall be expended upon the order of such officer or officers of the park board as may be selected by it for that purpose by resolution; copies of such resolution, duly certified, shall be filed with the accounting director. Said moneys shall be paid out by the treasurer upon warrants, checks, drafts, notes, or other order of the City of Spokane signed by the authorized city staff. [Article V – Section 51/ORD C34385 Section 33]
Spokane Demographics, Trends & Anticipated Impacts
Answers the questions…Q: What does the Spokane community look like today relative to population, age, income levels, education, race, ethnicity, and other demographic indicators?Q: What demographic adjustments and shifts can be expected over the next three to five years?Q: What are the potential impacts of these adjustments and shifts on the Department?

15
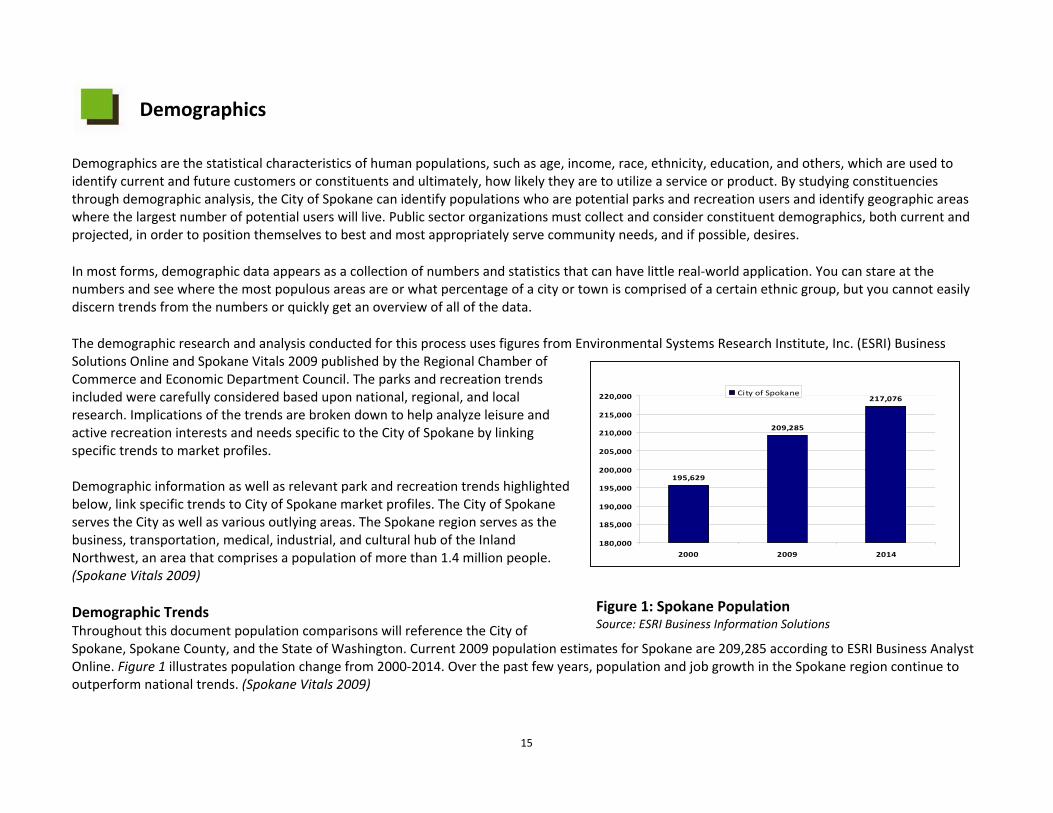
Figure 1: Spokane Population Source: ESRI Business Information Solutions
Demographics
Demographics are the statistical characteristics of human populations, such as age, income, race, ethnicity, education, and others, which are used to identify current and future customers or constituents and ultimately, how likely they are to utilize a service or product. By studying constituencies through demographic analysis, the City of Spokane can identify populations who are potential parks and recreation users and identify geographic areas where the largest number of potential users will live. Public sector organizations must collect and consider constituent demographics, both current and projected, in order to position themselves to best and most appropriately serve community needs, and if possible, desires.
In most forms, demographic data appears as a collection of numbers and statistics that can have little real‐world application. You can stare at the numbers and see where the most populous areas are or what percentage of a city or town is comprised of a certain ethnic group, but you cannot easily discern trends from the numbers or quickly get an overview of all of the data.
The demographic research and analysis conducted for this process uses figures from Environmental Systems Research Institute, Inc. (ESRI) Business Solutions Online and Spokane Vitals 2009 published by the Regional Chamber of Commerce and Economic Department Council. The parks and recreation trends included were carefully considered based upon national, regional, and local research. Implications of the trends are broken down to help analyze leisure and active recreation interests and needs specific to the City of Spokane by linking specific trends to market profiles. Demographic information as well as relevant park and recreation trends highlighted below, link specific trends to City of Spokane market profiles. The City of Spokane serves the City as well as various outlying areas. The Spokane region serves as the business, transportation, medical, industrial, and cultural hub of the Inland Northwest, an area that comprises a population of more than 1.4 million people. (Spokane Vitals 2009) Demographic Trends Throughout this document population comparisons will reference the City of Spokane, Spokane County, and the State of Washington. Current 2009 population estimates for Spokane are 209,285 according to ESRI Business Analyst Online. Figure 1 illustrates population change from 2000‐2014. Over the past few years, population and job growth in the Spokane region continue to outperform national trends. (Spokane Vitals 2009)
195,629
209,285
217,076
180,000
185,000
190,000
195,000
200,000
205,000
210,000
215,000
220,000
2000 2009 2014
City of Spokane
16
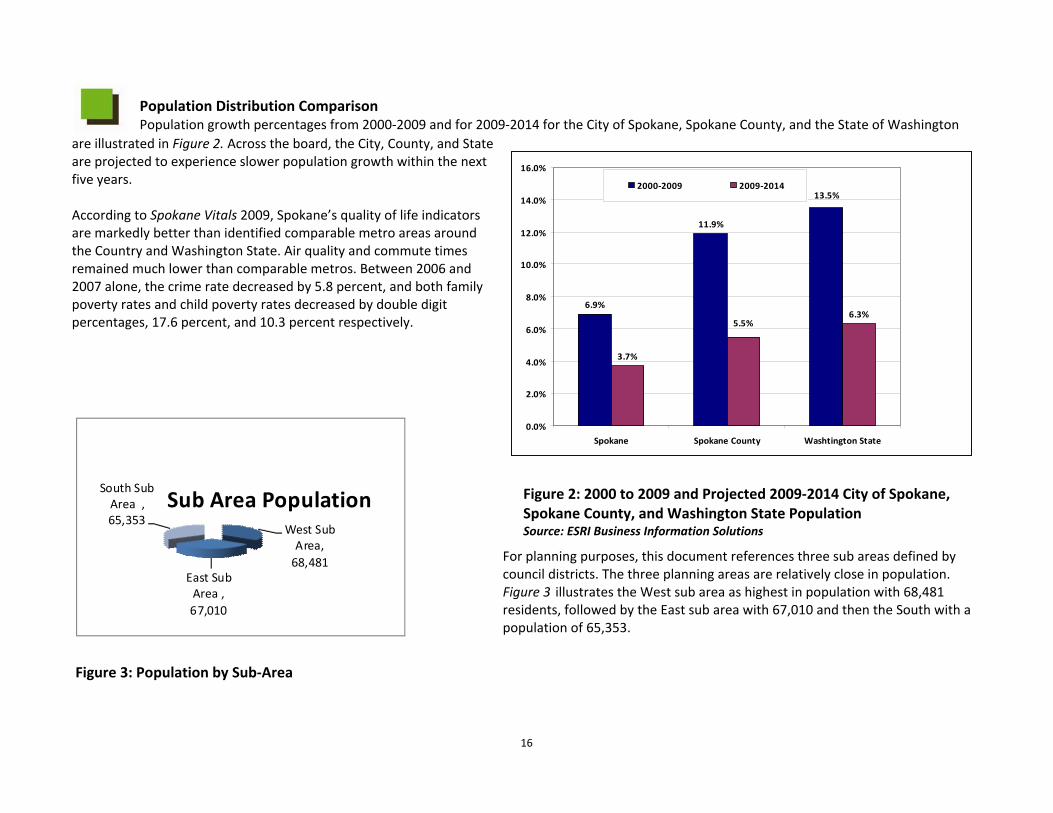
Figure 2: 2000 to 2009 and Projected 2009‐2014 City of Spokane, Spokane County, and Washington State Population Source: ESRI Business Information Solutions
Population Distribution Comparison Population growth percentages from 2000‐2009 and for 2009‐2014 for the City of Spokane, Spokane County, and the State of Washington
are illustrated in Figure 2. Across the board, the City, County, and State are projected to experience slower population growth within the next five years. According to Spokane Vitals 2009, Spokane’s quality of life indicators are markedly better than identified comparable metro areas around the Country and Washington State. Air quality and commute times remained much lower than comparable metros. Between 2006 and 2007 alone, the crime rate decreased by 5.8 percent, and both family poverty rates and child poverty rates decreased by double digit percentages, 17.6 percent, and 10.3 percent respectively.
For planning purposes, this document references three sub areas defined by council districts. The three planning areas are relatively close in population. Figure 3 illustrates the West sub area as highest in population with 68,481 residents, followed by the East sub area with 67,010 and then the South with a population of 65,353.
Figure 3: Population by Sub‐Area
6.9%
11.9%
3.7%
6.3%
13.5%
5.5%
0.0%
2.0%
4.0%
6.0%
8.0%
10.0%
12.0%
14.0%
16.0%
Spokane Spokane County Washtington State
2000‐2009 2009‐2014
West Sub Area, 68,481
East Sub Area , 67,010
South Sub Area , 65,353
Sub Area Population
17
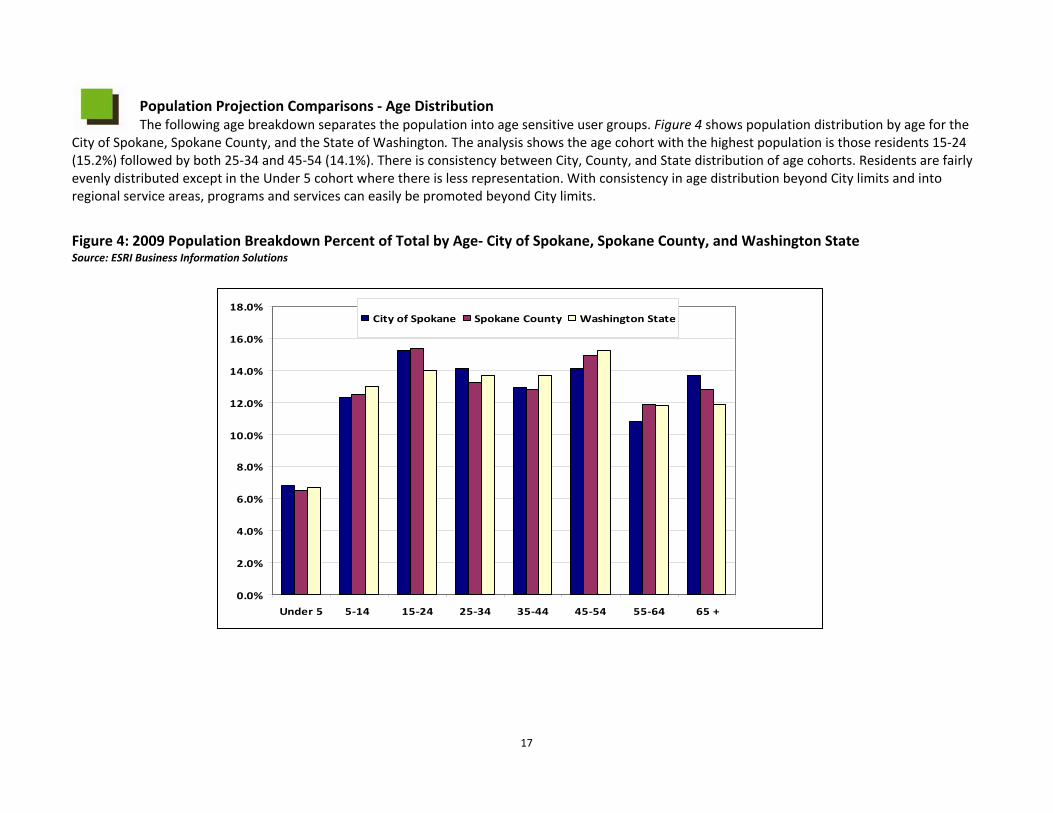
Population Projection Comparisons ‐ Age Distribution The following age breakdown separates the population into age sensitive user groups. Figure 4 shows population distribution by age for the
City of Spokane, Spokane County, and the State of Washington. The analysis shows the age cohort with the highest population is those residents 15‐24 (15.2%) followed by both 25‐34 and 45‐54 (14.1%). There is consistency between City, County, and State distribution of age cohorts. Residents are fairly evenly distributed except in the Under 5 cohort where there is less representation. With consistency in age distribution beyond City limits and into regional service areas, programs and services can easily be promoted beyond City limits.
Figure 4: 2009 Population Breakdown Percent of Total by Age‐ City of Spokane, Spokane County, and Washington State Source: ESRI Business Information Solutions
0.0%
2.0%
4.0%
6.0%
8.0%
10.0%
12.0%
14.0%
16.0%
18.0%
Under 5 5‐14 15‐24 25‐34 35‐44 45‐54 55‐64 65 +
City of Spokane Spokane County Washington State
18
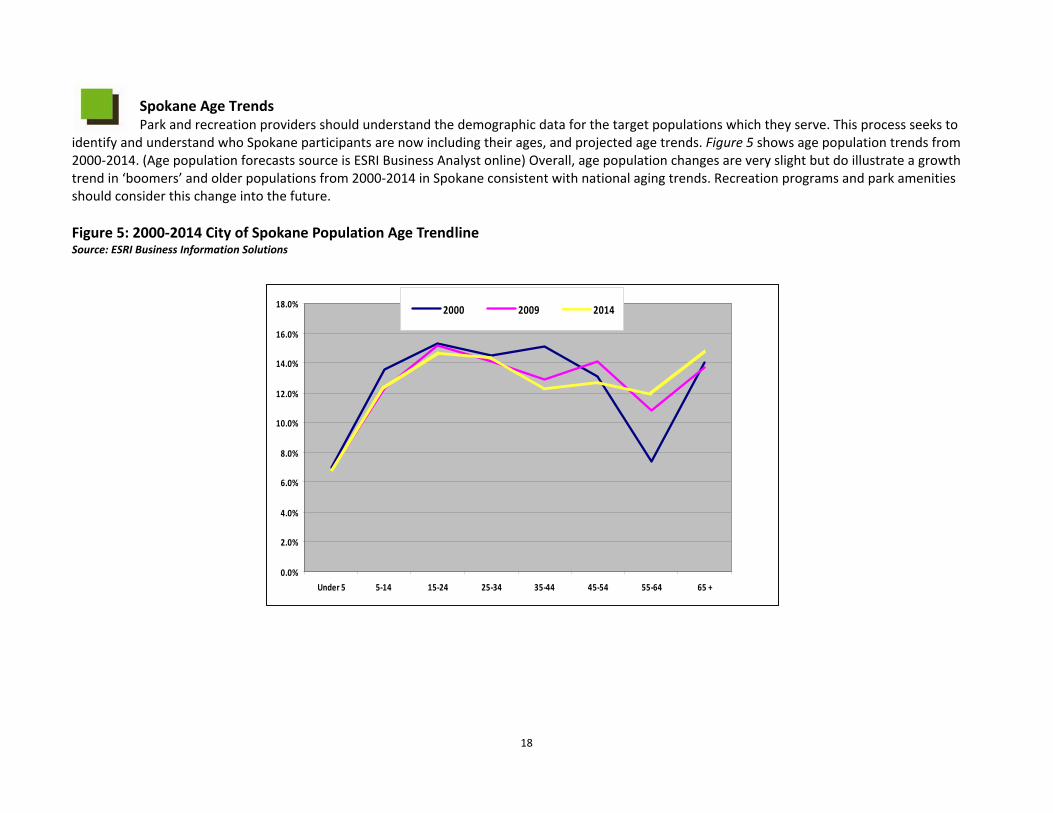
Spokane Age Trends Park and recreation providers should understand the demographic data for the target populations which they serve. This process seeks to
identify and understand who Spokane participants are now including their ages, and projected age trends. Figure 5 shows age population trends from 2000‐2014. (Age population forecasts source is ESRI Business Analyst online) Overall, age population changes are very slight but do illustrate a growth trend in ‘boomers’ and older populations from 2000‐2014 in Spokane consistent with national aging trends. Recreation programs and park amenities should consider this change into the future. Figure 5: 2000‐2014 City of Spokane Population Age Trendline Source: ESRI Business Information Solutions
0.0%
2.0%
4.0%
6.0%
8.0%
10.0%
12.0%
14.0%
16.0%
18.0%
Under 5 5‐14 15‐24 25‐34 35‐44 45‐54 55‐64 65 +
2000 2009 2014
19
Age Trends and Population Characteristics • Under 5 years: This group represents users of preschool and tot programs and facilities, and as trails and open space users, are often in
strollers. These individuals are future participants in youth activities. Spokane is not forecasted to see change in this age group by the year 2014, which will represent less than 7 percent of the population.
• 5 to 14 years: From 2009‐2014 there is not a projected population change for this age group. This group represents current youth program
participants and will be approximately 12.3 percent of the population. • 15 to 24 years: In five years this age group reflects a .5 percent increase in growth from 2009 to 2014 and is expected to be 15.7 percent of the
population. These program participants will shift from youth programs and into adult programs. Members of this age group are often seasonal employment seekers.
• 25 to 34 years: This group represents involvement in adult programming with social characteristics including the beginning of long‐term relationships
and establishing families. There is less than a .5% increase in change for this age group from 2009 to 2014. This group represents approximately 14.4 percent of the population.
• 35 to 44 years: This group uses of a wide range of adult programming and park facilities. Their family characteristics extend from having children
using preschool and youth programs to raising teens. Their time is limited to short commitments. There is a slight projected decrease of .6 percent within the next five years.
• 45 to 54 years: This group also represents users of adult programming and park facilities. Their characteristics extend from having young children
using youth sports and other recreation programs to becoming empty nesters and enjoying their own leisure time. There is a projected 1.4 percent decrease in this age group over the next five years. Those aged 45 to 54 years will make up 12.7 percent of the total population in 2014.
• 55 to 64 years: This group represents users of older adult programming. Many in this age group are approaching retirement or already retired and
are potentially enjoying grandchildren. This age group is anticipated to grow by 1.1 percent by 2014, representing almost 12% of the total population.
• 65 years plus: Nationally, this group will increase dramatically. This group generally ranges from very healthy, active seniors to physically inactive
seniors. This age group is projected to grow by 1.1 percent by 2014 and will make up almost 14.8 percent of the population.
20
Aging Trends The following are trends related to the aging population in the United States and are relevant to Spokane’s aging population:
• There is a growing body of evidence that indicates that aging has more to do with lifestyles and health behaviors than genetics. • Seniors control more than 70 percent of the disposable income available and have more than $1.6 trillion in spending power, according to Packaged
Facts, a division of MarketResearch.com, which publishes market intelligence on several consumer industries. • Seniors are the fastest growing segment of health club memberships, according to the International Health, Racquet, and Sports Club Association.
(IHRSA) • “Baby Boomers” are made up of adults born between 1946 and 1964. This generation makes up approximately 25 percent of the total population in
the United States. The following are “Boomer” trends: o According to International, Health, Racquet, and Sport Club Association, 91 percent of “Boomers” feel the need to take measures to ensure their
future health. o “Boomers” claim 37.6 percent of all health club memberships. o Eighty percent of “Boomers” in a study by American Association of Retired Persons
(AARP) believe they will continue to work either full‐ or part‐time into their retirement years.
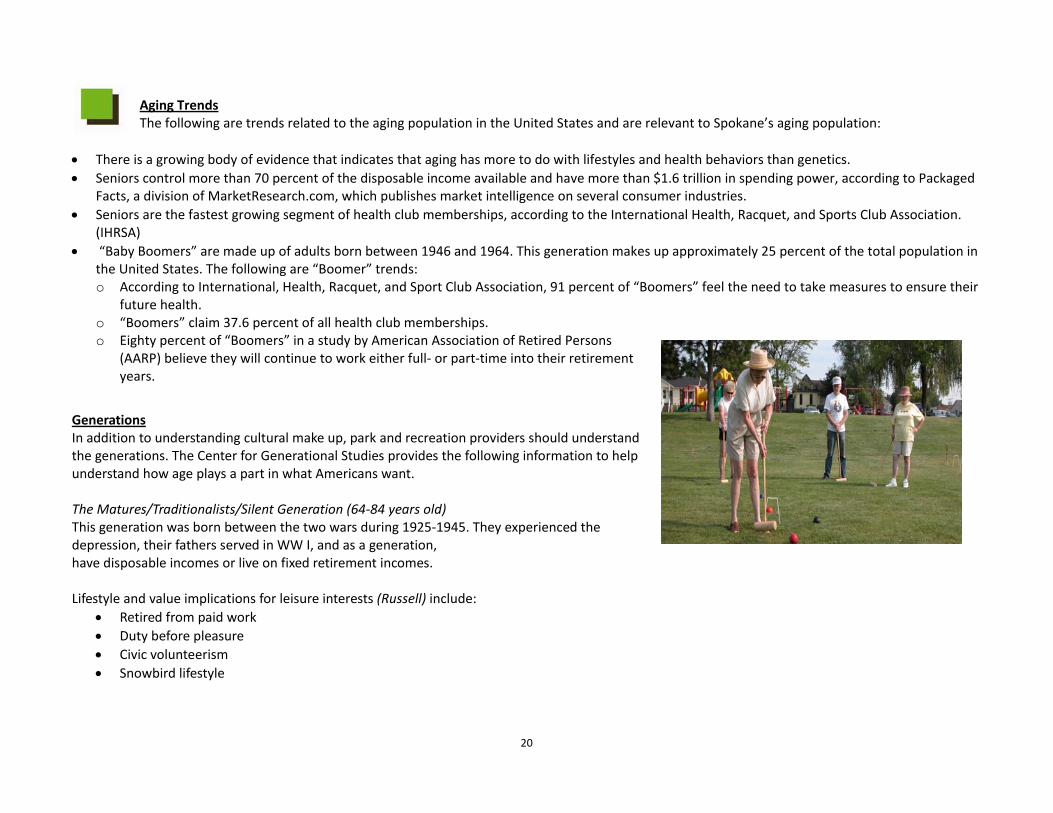
Generations In addition to understanding cultural make up, park and recreation providers should understand the generations. The Center for Generational Studies provides the following information to help understand how age plays a part in what Americans want. The Matures/Traditionalists/Silent Generation (64‐84 years old) This generation was born between the two wars during 1925‐1945. They experienced the depression, their fathers served in WW I, and as a generation, have disposable incomes or live on fixed retirement incomes.
Lifestyle and value implications for leisure interests (Russell) include:
• Retired from paid work • Duty before pleasure • Civic volunteerism • Snowbird lifestyle
21
With seniors getting into exercise, there is a growing trend towards specialized programs for older adults. These programs focus on the special needs of seniors like arthritis, osteoporosis, balance issues, flexibility, and better daily functioning.
According to AARP, 2008’s latest trends for the older population include: • Virtual Birding – View a photo gallery and name that bird’s tune • Electronic games – Senior adults (even well over 50) are enjoying Wii and other electronic games (for instance, golf, brain teasers, and other
sports games) • Incentive‐based walking programs • Wellness seminars
Additional recreation and leisure trends include:
• According to the National Sporting Goods Association (NSGA), the top three sports activities for persons 65 years and older are: exercise walking, exercising with equipment, and swimming.
• Seniors control more than 70 percent of the disposable income and have more than $1.6 trillion in spending power, according to Packaged Facts, a division of MarketResearch.com, which publishes market intelligence on several consumer industries.
• Seniors also are the fastest growing segment of health club memberships, according to the International Health, Racquet and Sportsclub Association.
Baby Boomers (45‐63 years old) This generation was born between 1946‐1964 – when individualism and free‐spirits reigned. They are social‐cause oriented, care about vitality and activity, claim that “65 is the new 50!” and are fitness and wellness driven. Lifestyle and value implications for leisure interests (Russell) include:
• Active with a wellness focus • Hectic lifestyle • No free time • Rejecting full‐time retirement
The first wave of boomers will turn 65 in less than two years. The new “don’t call me senior” group will enjoy some of the more active pursuits for older adults including exercising to stay healthy and age well. According to AARP, 2008’s latest trends for the older population include:
• Electronic games – Adults over 50 are enjoying Wii and other electronic games • Cocooning – as a group, those aged 25‐54 watch the most television
22
Generation X (25‐44 years old) This generation was born 1965‐1984. They were resourceful at an early age as most grew up in a house where both parents had careers. Xers entered a world with social turmoil with the assassination of JFK, anti‐war protests, Watergate, inflation, and massive layoffs. As a result, they
have become a generation skeptical of traditional practices and beliefs. Lifestyle and value implications for leisure interests (Russell) include:
• Fun and informality. • Friend focused. • Risk takers. • Strive for balance between work and leisure. • With their ability to deal with uncertainty and an emphasis on working to live, rather than living to work, they continue to transform the way
business is done. • X Games/Extreme sports. • Cocooning – as a group, those aged 25‐54 watch the most television.
The Millennials/Nexters/Gen Y/E‐Generation (under 25 years old) This generation was born 1985‐2005. They are growing up in a world where beliefs about family and society have been compromised and during a time of unprecedented growth in U.S. economy and development of technology. Media has taught them that they can challenge every convention and individual. Lifestyle and value implications for leisure interests (Russell) include:
• Sociability. • Prefer collective activities. • Media and technology based leisure. • Many enter jobs with what employers are calling a disturbing lack of basic skills, yet they are able to navigate software programs that intimidate
those older than them. • X Games/Extreme Sports. • Cocooning ‐‐ on line learning.
23
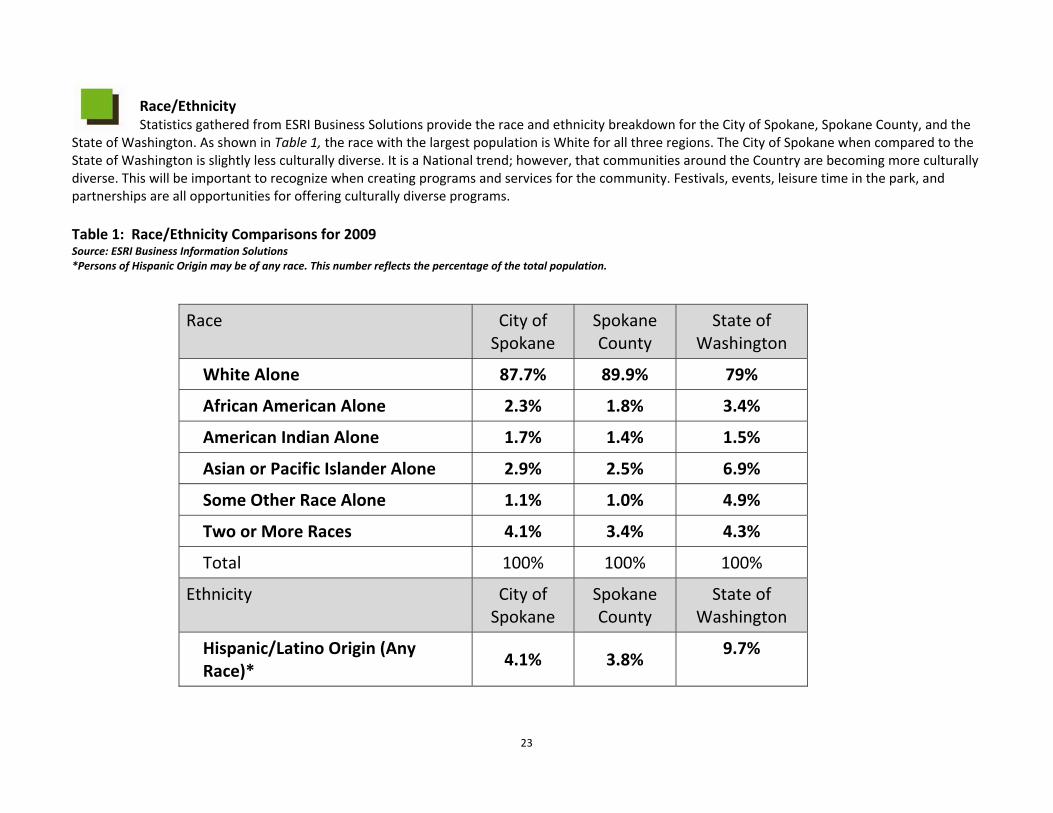
Race/Ethnicity Statistics gathered from ESRI Business Solutions provide the race and ethnicity breakdown for the City of Spokane, Spokane County, and the
State of Washington. As shown in Table 1, the race with the largest population is White for all three regions. The City of Spokane when compared to the State of Washington is slightly less culturally diverse. It is a National trend; however, that communities around the Country are becoming more culturally diverse. This will be important to recognize when creating programs and services for the community. Festivals, events, leisure time in the park, and partnerships are all opportunities for offering culturally diverse programs. Table 1: Race/Ethnicity Comparisons for 2009 Source: ESRI Business Information Solutions *Persons of Hispanic Origin may be of any race. This number reflects the percentage of the total population.
Race City of Spokane
Spokane County
State of Washington
White Alone 87.7% 89.9% 79%
African American Alone 2.3% 1.8% 3.4%
American Indian Alone 1.7% 1.4% 1.5%
Asian or Pacific Islander Alone 2.9% 2.5% 6.9%
Some Other Race Alone 1.1% 1.0% 4.9%
Two or More Races 4.1% 3.4% 4.3%
Total 100% 100% 100%
Ethnicity City of Spokane
Spokane County
State of Washington
Hispanic/Latino Origin (Any Race)*
4.1% 3.8% 9.7%

24
National Trends Following are select national demographic trends of a variety of ethnic communities.
• English as the first language at home will decrease as the United States becomes more multicultural. Fourteen percent (14%) of the United States population speaks a language other than English at home, with 54 percent of the non‐English speaking population speaking Spanish. The number of people speaking other languages will undoubtedly increase in the United States due to immigration. (Davis, B.)
• In 2005, the percentage of those over five (5) years in age that spoke a language other than English in the home was 19.4 percent. Of the foreign‐born population in the United States, the majority are from Latin America followed by Asia and Europe. (U.S. Census)
A recent study by the Pew Research Center cited the ranks of the 303 million Americans are projected to increase to 438 million by 2050 and that increase will be driven primarily by immigration, with the number of Hispanics estimated to triple. The Center’s projections are based on detailed assumptions about births, deaths, and immigration levels. Other projections from this report include:
• If current trends continue, 82 percent of the increase will be immigrants arriving from 2005 to 2050 and their U.S. born descendants. • The 117 million people added during this time period will consist of 67 million immigrants and 50 million of their U.S. born children. • Nearly one in five Americans (19%) will be an immigrant in 2050, compared with one in eight (12%) in 2005. • By 2025, the immigrant, or foreign‐born share of the population will surpass the peak during the last great wave of immigration a century ago. • The impact of immigration has been compounded as the number of births for U.S. women dropped sharply and then leveled off. • Hispanics will make up 29 percent of the U.S. population in 2050, compared with 14 percent in 2005. • The non‐Hispanic white population will increase more slowly than other racial and ethnic groups; whites will become a minority (47%) by
2050. • The nation's elderly populations will more than double in size from 2005 through 2050, as the Baby Boom generation enters the traditional
retirement years. • The number of working‐age Americans and children will grow more slowly than the elderly population, and will shrink as a share of the total
population.
Foreign‐Born • Less than three percent of the population (approximately eight million people) is foreign‐born residents who have entered the country from
2000 and beyond. Factors known about this group include: (USA Today) Hispanics make up more than half of this population. A larger percentage of these households (compared to average U.S. resident households) consist of married couples. Incomes are lower (25.6% families live below the poverty line compared to 10.2% of all Americans). Households are larger (3.6 vs. 2.6 people). Households are younger (27.6 years vs. 36.4 years median age). Eighty‐nine‐point‐five (89.5) percent speak a language other than English at home; 23.7 percent speak English “very well.”

25
African American • According to the US Census 2008 American Community Survey, over 39 million people in the United States, or 12.4 percent of the
population, are Black or African American. • The African American population is the third fastest growing population in the United States.
Hispanic
• The Hispanic or Latino (of any race) population is over 45 million and is about 15.4 percent of the total population. (US Census 2008 American Community Survey)
Asian/Pacific Islander
• According to the US Census, five percent of the United States population is Asian alone or Asian/Pacific Islander. • Chinese Americans are the largest Asian group in the United States, followed by Filipino, Asian Indians, Vietnamese, Koreans, and lastly
Japanese. • The number of people five and older who speak Chinese at home was estimated in 2006 to be 2.5 million. After Spanish, Chinese is the most
widely spoken non‐English language in the country.
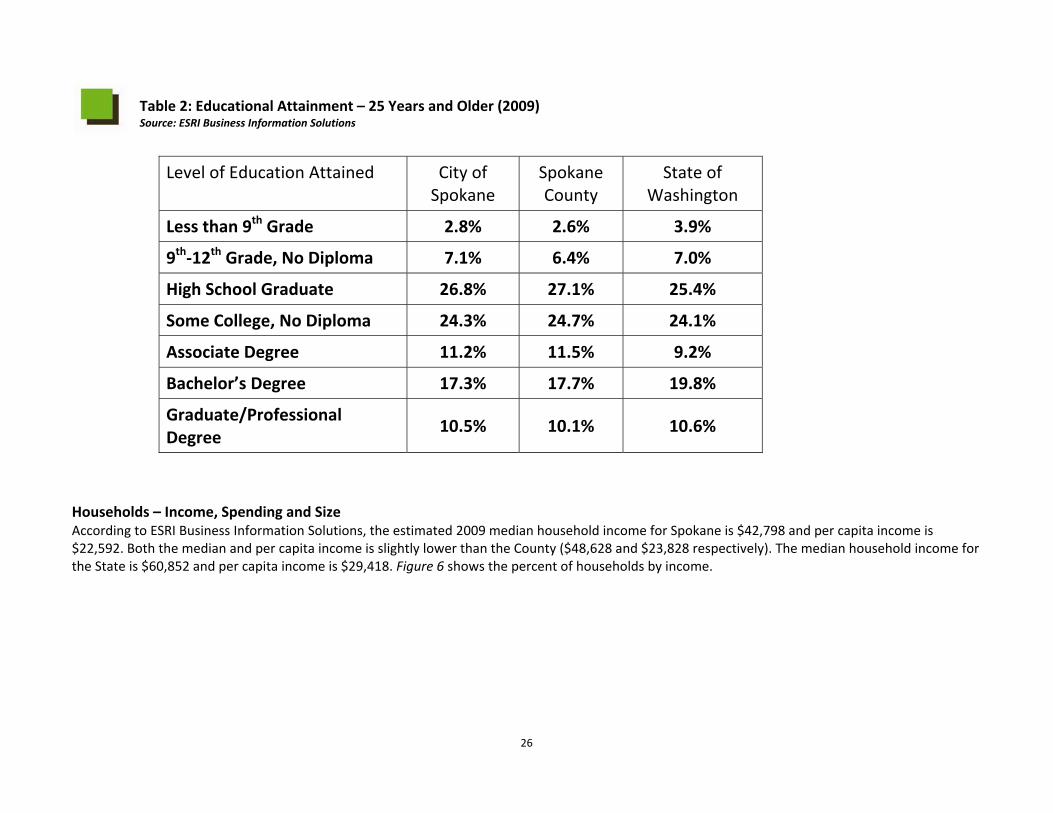
Education According to ESRI Business Information Solutions as shown in Table 2, the City of Spokane and the surrounding areas represent similar educational attainment levels as the State of Washington. The United Health Foundation 2009 State Rankings report cited some of the state of Washington’s challenges which included a low high school graduation rate.
26
Table 2: Educational Attainment – 25 Years and Older (2009) Source: ESRI Business Information Solutions
Level of Education Attained City of Spokane
Spokane County
State of Washington
Less than 9th Grade 2.8% 2.6% 3.9%
9th‐12th Grade, No Diploma 7.1% 6.4% 7.0%
High School Graduate 26.8% 27.1% 25.4%
Some College, No Diploma 24.3% 24.7% 24.1%
Associate Degree 11.2% 11.5% 9.2%
Bachelor’s Degree 17.3% 17.7% 19.8%
Graduate/Professional Degree
10.5% 10.1% 10.6%
Households – Income, Spending and Size According to ESRI Business Information Solutions, the estimated 2009 median household income for Spokane is $42,798 and per capita income is $22,592. Both the median and per capita income is slightly lower than the County ($48,628 and $23,828 respectively). The median household income for the State is $60,852 and per capita income is $29,418. Figure 6 shows the percent of households by income.
27
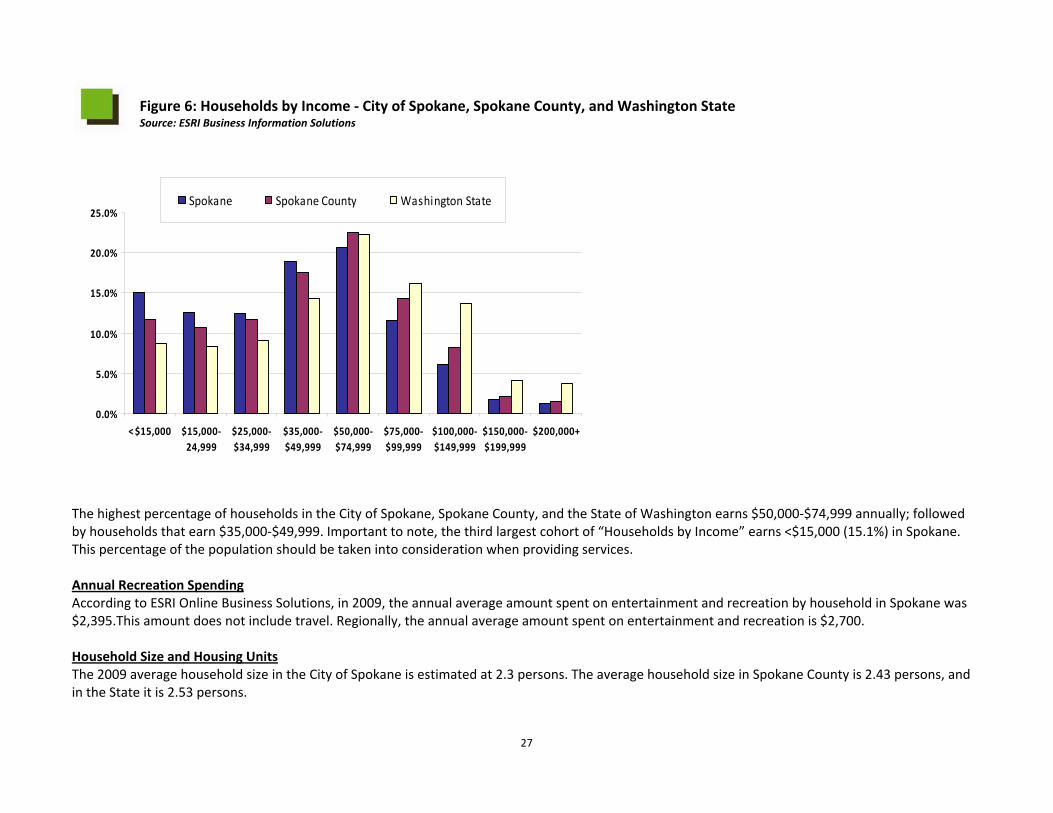
Figure 6: Households by Income ‐ City of Spokane, Spokane County, and Washington State Source: ESRI Business Information Solutions
The highest percentage of households in the City of Spokane, Spokane County, and the State of Washington earns $50,000‐$74,999 annually; followed by households that earn $35,000‐$49,999. Important to note, the third largest cohort of “Households by Income” earns <$15,000 (15.1%) in Spokane. This percentage of the population should be taken into consideration when providing services. Annual Recreation Spending According to ESRI Online Business Solutions, in 2009, the annual average amount spent on entertainment and recreation by household in Spokane was $2,395.This amount does not include travel. Regionally, the annual average amount spent on entertainment and recreation is $2,700. Household Size and Housing Units The 2009 average household size in the City of Spokane is estimated at 2.3 persons. The average household size in Spokane County is 2.43 persons, and in the State it is 2.53 persons.
0.0%
5.0%
10.0%
15.0%
20.0%
25.0%
< $15,000 $15,000‐24,999
$25,000‐$34,999
$35,000‐$49,999
$50,000‐$74,999
$75,000‐$99,999
$100,000‐$149,999
$150,000‐$199,999
$200,000+
Spokane Spokane County Washington State
28
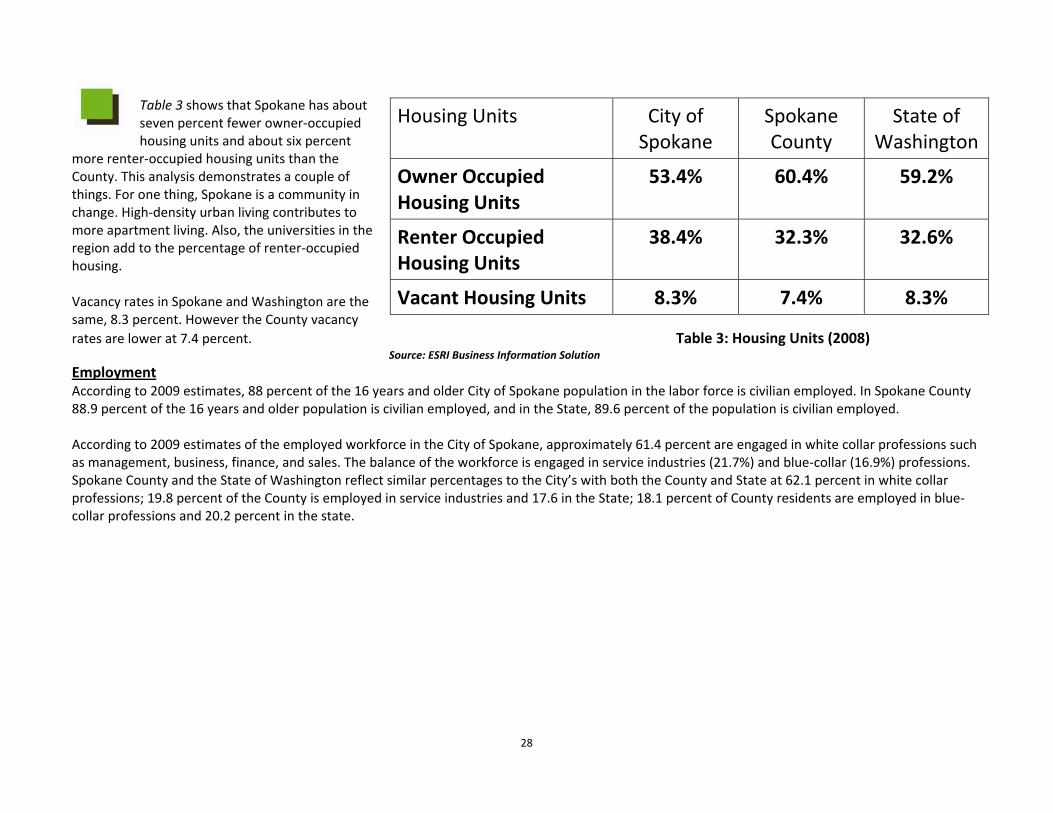
Table 3 shows that Spokane has about seven percent fewer owner‐occupied housing units and about six percent
more renter‐occupied housing units than the County. This analysis demonstrates a couple of things. For one thing, Spokane is a community in change. High‐density urban living contributes to more apartment living. Also, the universities in the region add to the percentage of renter‐occupied housing. Vacancy rates in Spokane and Washington are the same, 8.3 percent. However the County vacancy rates are lower at 7.4 percent. Table 3: Housing Units (2008)
Source: ESRI Business Information Solution
Employment According to 2009 estimates, 88 percent of the 16 years and older City of Spokane population in the labor force is civilian employed. In Spokane County 88.9 percent of the 16 years and older population is civilian employed, and in the State, 89.6 percent of the population is civilian employed. According to 2009 estimates of the employed workforce in the City of Spokane, approximately 61.4 percent are engaged in white collar professions such as management, business, finance, and sales. The balance of the workforce is engaged in service industries (21.7%) and blue‐collar (16.9%) professions. Spokane County and the State of Washington reflect similar percentages to the City’s with both the County and State at 62.1 percent in white collar professions; 19.8 percent of the County is employed in service industries and 17.6 in the State; 18.1 percent of County residents are employed in blue‐collar professions and 20.2 percent in the state.
Housing Units City of Spokane
Spokane County
State of Washington
Owner Occupied Housing Units
53.4% 60.4% 59.2%
Renter Occupied Housing Units
38.4% 32.3% 32.6%
Vacant Housing Units 8.3% 7.4% 8.3%
29
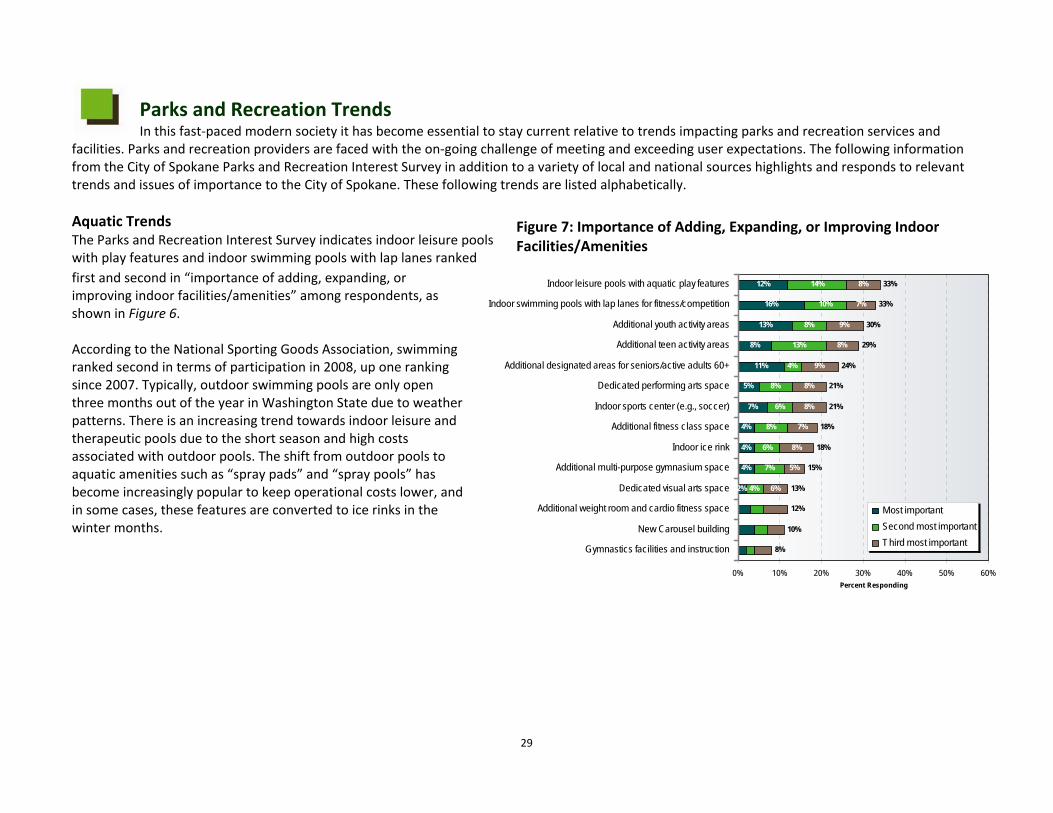
Figure 7: Importance of Adding, Expanding, or Improving Indoor Facilities/Amenities
Parks and Recreation Trends In this fast‐paced modern society it has become essential to stay current relative to trends impacting parks and recreation services and
facilities. Parks and recreation providers are faced with the on‐going challenge of meeting and exceeding user expectations. The following information from the City of Spokane Parks and Recreation Interest Survey in addition to a variety of local and national sources highlights and responds to relevant trends and issues of importance to the City of Spokane. These following trends are listed alphabetically. Aquatic Trends The Parks and Recreation Interest Survey indicates indoor leisure pools with play features and indoor swimming pools with lap lanes ranked first and second in “importance of adding, expanding, or improving indoor facilities/amenities” among respondents, as shown in Figure 6. According to the National Sporting Goods Association, swimming ranked second in terms of participation in 2008, up one ranking since 2007. Typically, outdoor swimming pools are only open three months out of the year in Washington State due to weather patterns. There is an increasing trend towards indoor leisure and therapeutic pools due to the short season and high costs associated with outdoor pools. The shift from outdoor pools to aquatic amenities such as “spray pads” and “spray pools” has become increasingly popular to keep operational costs lower, and in some cases, these features are converted to ice rinks in the winter months.
12%
16%
13%
8%
11%
5%
7%
4%
4%
4%
2%
14%
10%
8%
13%
4%
8%
6%
8%
6%
7%
4%
8%
7%
9%
8%
9%
8%
8%
7%
8%
5%
6%
33%
33%
30%
29%
24%
21%
21%
18%
18%
15%
13%
12%
10%
8%
0% 10% 20% 30% 40% 50% 60%
Indoor leisure pools with aquatic play features
Indoor swimming pools with lap lanes for fitness/competition
Additional youth activity areas
Additional teen activity areas
Additional designated areas for seniors/active adults 60+
Dedicated performing arts space
Indoor sports center (e.g., soccer)
Additional fitness class space
Indoor ice rink
Additional multi-purpose gymnasium space
Dedicated visual arts space
Additional weight room and cardio fitness space
New Carousel building
Gymnastics facilities and instruction
Percent Responding
Most importantSecond most importantThird most important
30
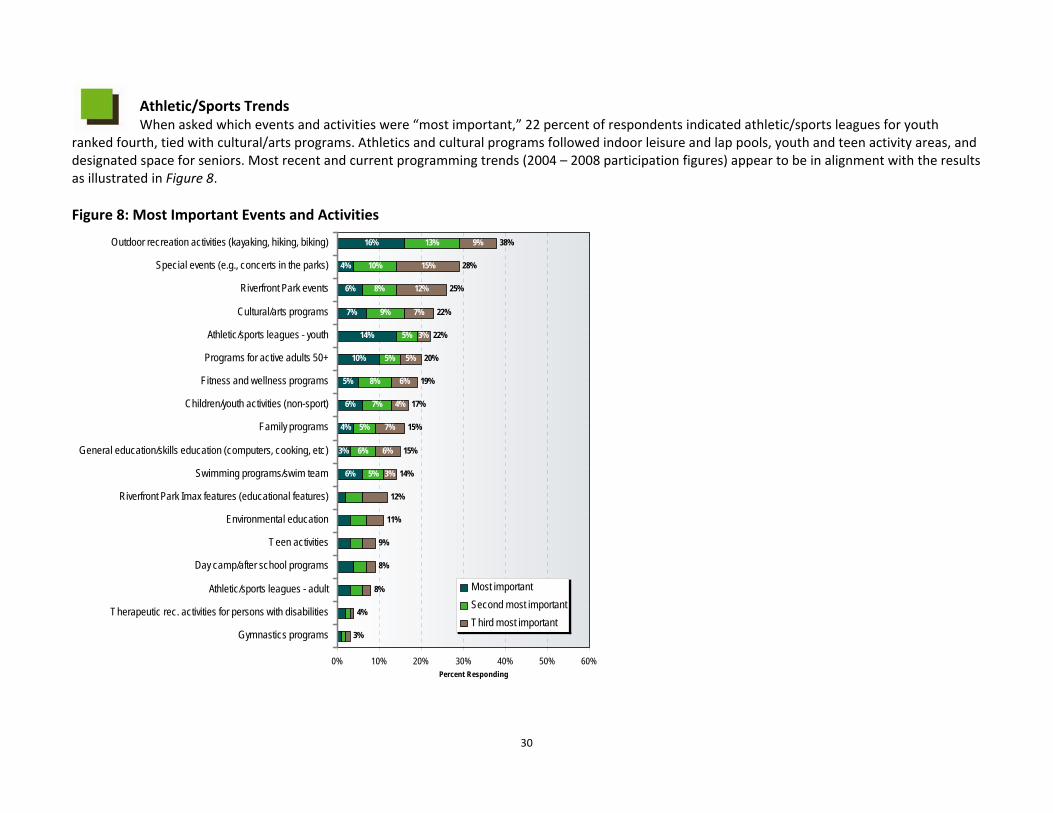
Athletic/Sports Trends When asked which events and activities were “most important,” 22 percent of respondents indicated athletic/sports leagues for youth
ranked fourth, tied with cultural/arts programs. Athletics and cultural programs followed indoor leisure and lap pools, youth and teen activity areas, and designated space for seniors. Most recent and current programming trends (2004 – 2008 participation figures) appear to be in alignment with the results as illustrated in Figure 8. Figure 8: Most Important Events and Activities
16%
4%
6%
7%
14%
10%
5%
6%
4%
3%
6%
13%
10%
8%
9%
5%
5%
8%
7%
5%
6%
5%
9%
15%
12%
7%
3%
5%
6%
4%
7%
6%
3%
38%
28%
25%
22%
22%
20%
19%
17%
15%
15%
14%
12%
11%
9%
8%
8%
4%
3%
0% 10% 20% 30% 40% 50% 60%
Outdoor recreation activities (kayaking, hiking, biking)
Special events (e.g., concerts in the parks)
Riverfront Park events
Cultural/arts programs
Athletic/sports leagues - youth
Programs for active adults 50+
Fitness and wellness programs
Children/youth activities (non-sport)
Family programs
General education/skills education (computers, cooking, etc)
Swimming programs/swim team
Riverfront Park Imax features (educational features)
Environmental education
Teen activities
Day camp/after school programs
Athletic/sports leagues - adult
Therapeutic rec. activities for persons with disabilities
Gymnastics programs
Percent Responding
Most importantSecond most importantThird most important
31
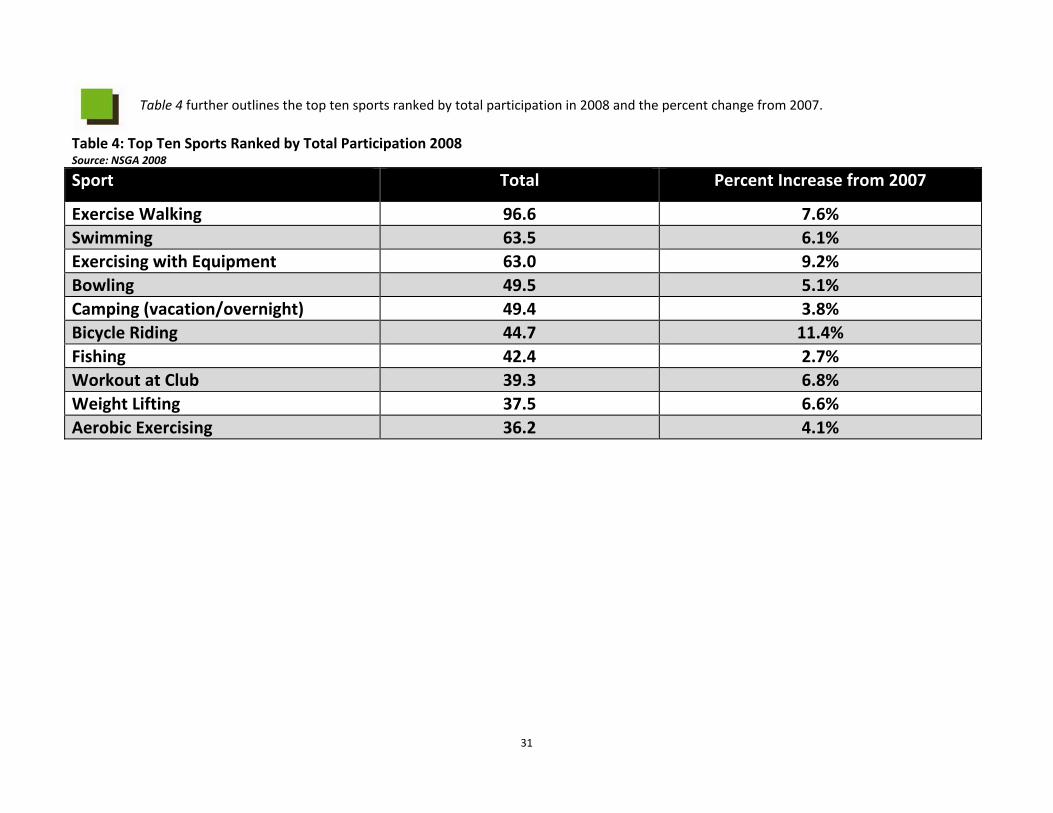
Table 4 further outlines the top ten sports ranked by total participation in 2008 and the percent change from 2007.
Table 4: Top Ten Sports Ranked by Total Participation 2008 Source: NSGA 2008
Sport Total Percent Increase from 2007
Exercise Walking 96.6 7.6%Swimming 63.5 6.1%Exercising with Equipment 63.0 9.2%Bowling 49.5 5.1%Camping (vacation/overnight) 49.4 3.8%Bicycle Riding 44.7 11.4%Fishing 42.4 2.7%Workout at Club 39.3 6.8%Weight Lifting 37.5 6.6%Aerobic Exercising 36.2 4.1%
32
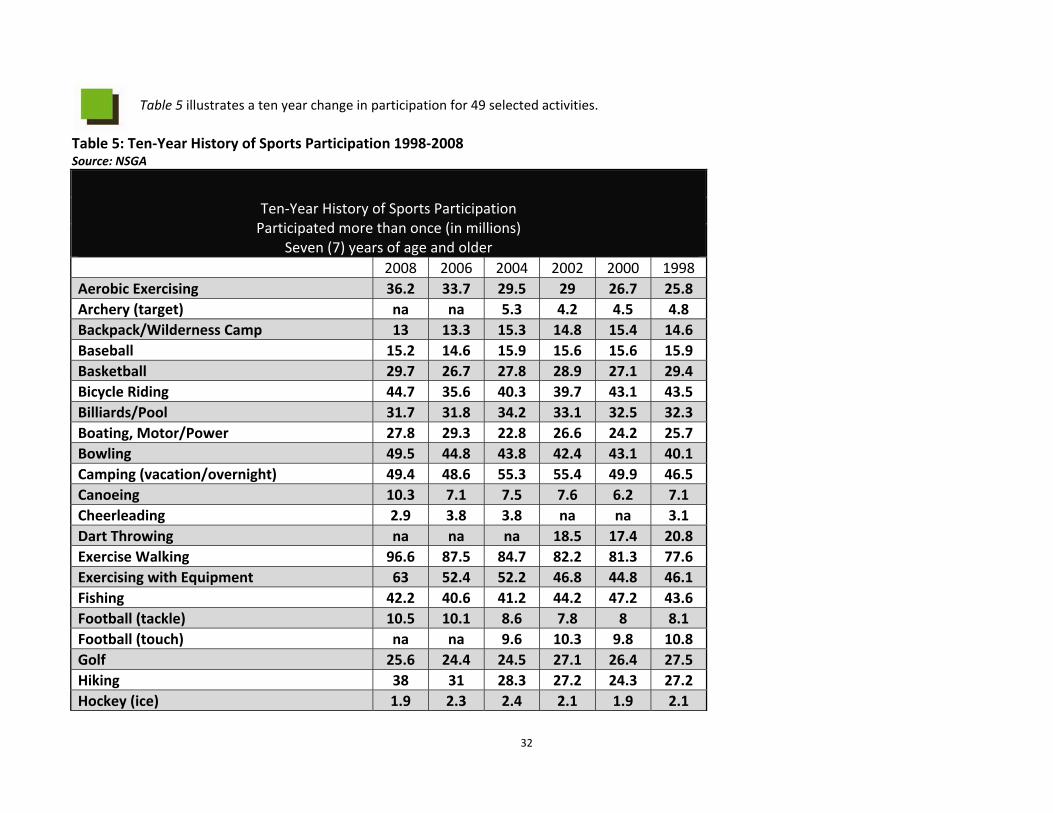
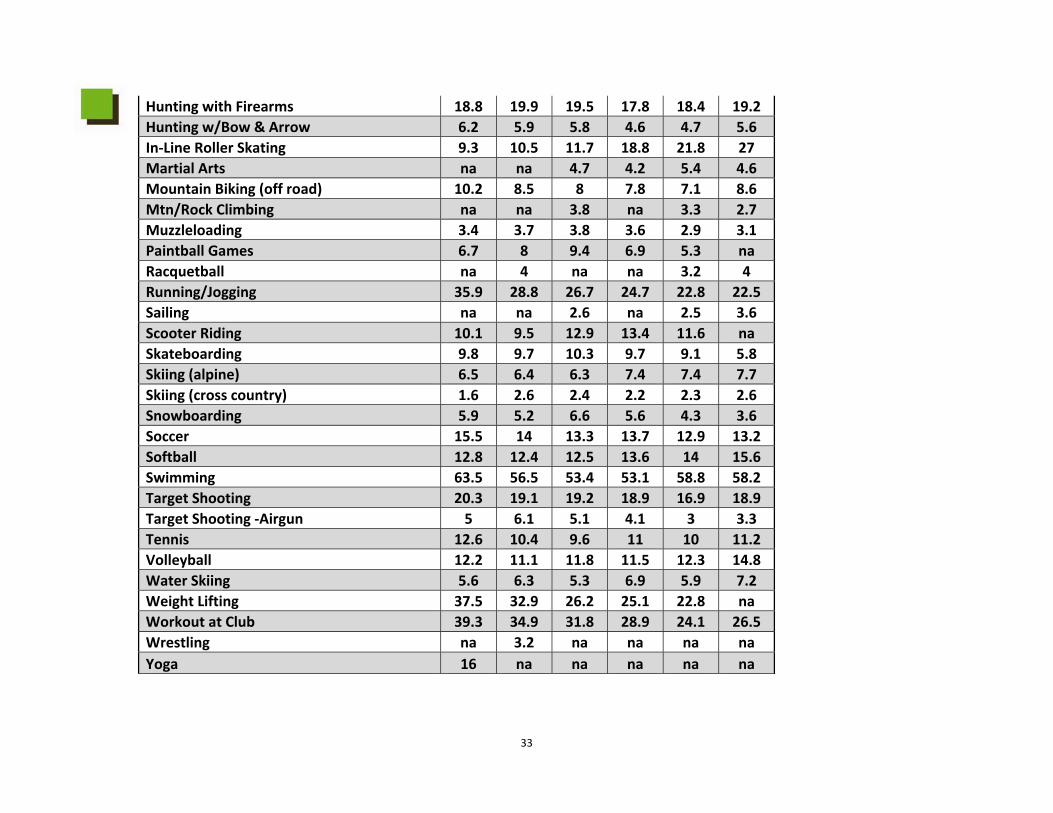
Table 5 illustrates a ten year change in participation for 49 selected activities.
Table 5: Ten‐Year History of Sports Participation 1998‐2008 Source: NSGA
Ten‐Year History of Sports Participation Participated more than once (in millions)
Seven (7) years of age and older 2008 2006 2004 2002 2000 1998 Aerobic Exercising 36.2 33.7 29.5 29 26.7 25.8 Archery (target) na na 5.3 4.2 4.5 4.8 Backpack/Wilderness Camp 13 13.3 15.3 14.8 15.4 14.6 Baseball 15.2 14.6 15.9 15.6 15.6 15.9 Basketball 29.7 26.7 27.8 28.9 27.1 29.4 Bicycle Riding 44.7 35.6 40.3 39.7 43.1 43.5 Billiards/Pool 31.7 31.8 34.2 33.1 32.5 32.3 Boating, Motor/Power 27.8 29.3 22.8 26.6 24.2 25.7 Bowling 49.5 44.8 43.8 42.4 43.1 40.1 Camping (vacation/overnight) 49.4 48.6 55.3 55.4 49.9 46.5 Canoeing 10.3 7.1 7.5 7.6 6.2 7.1 Cheerleading 2.9 3.8 3.8 na na 3.1 Dart Throwing na na na 18.5 17.4 20.8 Exercise Walking 96.6 87.5 84.7 82.2 81.3 77.6 Exercising with Equipment 63 52.4 52.2 46.8 44.8 46.1 Fishing 42.2 40.6 41.2 44.2 47.2 43.6 Football (tackle) 10.5 10.1 8.6 7.8 8 8.1 Football (touch) na na 9.6 10.3 9.8 10.8 Golf 25.6 24.4 24.5 27.1 26.4 27.5 Hiking 38 31 28.3 27.2 24.3 27.2 Hockey (ice) 1.9 2.3 2.4 2.1 1.9 2.1
33
Hunting with Firearms 18.8 19.9 19.5 17.8 18.4 19.2 Hunting w/Bow & Arrow 6.2 5.9 5.8 4.6 4.7 5.6 In‐Line Roller Skating 9.3 10.5 11.7 18.8 21.8 27 Martial Arts na na 4.7 4.2 5.4 4.6 Mountain Biking (off road) 10.2 8.5 8 7.8 7.1 8.6 Mtn/Rock Climbing na na 3.8 na 3.3 2.7 Muzzleloading 3.4 3.7 3.8 3.6 2.9 3.1 Paintball Games 6.7 8 9.4 6.9 5.3 na Racquetball na 4 na na 3.2 4 Running/Jogging 35.9 28.8 26.7 24.7 22.8 22.5 Sailing na na 2.6 na 2.5 3.6 Scooter Riding 10.1 9.5 12.9 13.4 11.6 na Skateboarding 9.8 9.7 10.3 9.7 9.1 5.8 Skiing (alpine) 6.5 6.4 6.3 7.4 7.4 7.7 Skiing (cross country) 1.6 2.6 2.4 2.2 2.3 2.6 Snowboarding 5.9 5.2 6.6 5.6 4.3 3.6 Soccer 15.5 14 13.3 13.7 12.9 13.2 Softball 12.8 12.4 12.5 13.6 14 15.6 Swimming 63.5 56.5 53.4 53.1 58.8 58.2 Target Shooting 20.3 19.1 19.2 18.9 16.9 18.9 Target Shooting ‐Airgun 5 6.1 5.1 4.1 3 3.3 Tennis 12.6 10.4 9.6 11 10 11.2 Volleyball 12.2 11.1 11.8 11.5 12.3 14.8 Water Skiing 5.6 6.3 5.3 6.9 5.9 7.2 Weight Lifting 37.5 32.9 26.2 25.1 22.8 na Workout at Club 39.3 34.9 31.8 28.9 24.1 26.5 Wrestling na 3.2 na na na na Yoga 16 na na na na na
34
Team Sports
• The typical age for participants in team sports ranges from 16 to 29 years. For males the range is 18.2 to 29.3 years compared to 16.2 to 25.3 years for females. (NSGA)
• Among team sports, football and basketball continue to grow, but less traditional activities such as lacrosse, rugby, field hockey, and cheerleading are increasing as well. (SGMA)
• Futsal is the way the world plays indoor soccer, with five people on each team, played on a hard surface. It is played on all the continents of the world, in over 100 countries, by more than 12 million players. As urban areas continue to develop and ball fields are more difficult to schedule, the United States Futsal Federation (founded in 1980) has noticed an upward trend in the sport. It is it growing in popularity in urban areas. It is versatile and can be played during winter months in indoor courts. The 40,000 member base has a diverse spectrum of ethnic backgrounds: African American, Asian, Latino/Hispanic, and Caucasian.
• Women playing team sports have also been on the increase. Females account for a significant number of softball participants: slow‐pitch 47 percent and fast‐pitch 75 percent. In court and grass volleyball, females represent the majority of participants and in beach volleyball they represent 46 percent of all players. (SGMA)
Racquet Sports Badminton, racquetball, squash, table tennis, and tennis all demonstrate gains in participation. According to the Sporting Goods Manufacturer’s Association in June of 2008, tennis participation has increased by 31 percent since 2000.
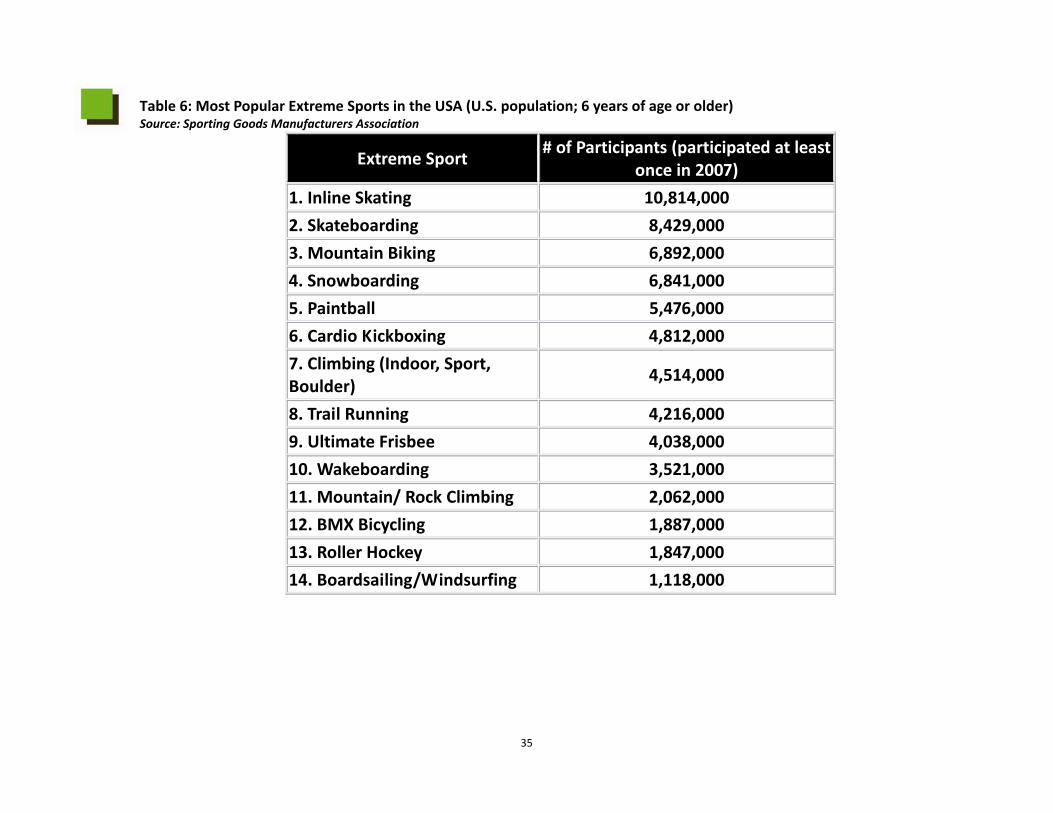
Extreme Sports According to the Sporting Goods Manufacturers Association (SGMA), extreme sports are not simply a fad. Regardless of the time of year, extreme sports are increasing in participation. A 2008 report identified participation as shown in Table 6. Important to Spokane and the surrounding region are the following facts concerning extreme sports:
• Nearly 45 percent of all inline skaters participate 13 days or more a year. • More than 3.8 million skateboarders participate 25+ days a year. • Trail running participation has been steady since 2000. • Ultimate Frisbee is more popular than lacrosse, wrestling, beach volleyball, fast‐pitch softball, rugby, field hockey, ice hockey, and roller hockey. • Roller hockey’s biggest challenge is getting access to proper venues. • Generation X and Millennials are most commonly drawn to extreme sports.
35
Table 6: Most Popular Extreme Sports in the USA (U.S. population; 6 years of age or older) Source: Sporting Goods Manufacturers Association
Extreme Sport # of Participants (participated at least
once in 2007)
1. Inline Skating 10,814,000
2. Skateboarding 8,429,000
3. Mountain Biking 6,892,000
4. Snowboarding 6,841,000
5. Paintball 5,476,000
6. Cardio Kickboxing 4,812,000
7. Climbing (Indoor, Sport, Boulder)
4,514,000
8. Trail Running 4,216,000
9. Ultimate Frisbee 4,038,000
10. Wakeboarding 3,521,000
11. Mountain/ Rock Climbing 2,062,000
12. BMX Bicycling 1,887,000
13. Roller Hockey 1,847,000
14. Boardsailing/Windsurfing 1,118,000
36
Youth Sports Specific offerings for kids’ fitness are slowly increasing in health and fitness facilities. (IDEA) Facilities are offering more youth‐specific
exercise equipment. Individualized youth sports training opportunities are becoming more popular as well. For youth ages seven to 11, bowling, bicycle riding, and fishing had the highest number of participants in 2007. (NSGA) However skateboarding, snowboarding, and tackle football saw the highest percent of increase in 2007. Important to note of the six mentioned sports above, football was the only team sport. In‐line skating experienced the largest decrease in participation followed by softball and skiing. Another noteworthy trend is the increase in ‘pick‐up’ play in team sports. In recent years, the Sporting Goods Manufacturers Association (SMGA) noticed that participation in team sports has been driven by organized/sanctioned play. However, in 2008, there were seven team sports in which ‘casual/pick‐up’ play exceeded organized/sanctioned play. Those sports were basketball, ice hockey, field hockey, touch football, lacrosse, grass volleyball, and beach volleyball. It is believed that this is the result of athletes and their families feeling the pinch of the economy. Many people are choosing less expensive ways to play sports and stay active. This is evidence of the economy’s effect on casual play. Facility Trends The City of Spokane Parks and Recreation Department does not currently own or independently operate any community recreation/community centers. Rather, the Department collaborates with a number of non‐profit groups via contractual agreements which own and operate the community’s youth and senior centers. These agreements outline a financial contribution on behalf of the City to these non‐profits in exchange for the provision of recreational services to the community, primarily youth and seniors. The intention to “partner” is a responsible way to most efficiently utilize tax dollars by avoiding duplication (e.g., the city developing facilities that “compete” with existing community facilities) and combining scarce resources for similar purposes and missions.
National Trends The current national trend is toward “one‐stop” indoor recreation facilities to serve all ages. Large, multipurpose regional centers help increase cost recovery, promote retention, and encourage cross‐use. Agencies across the U.S. are increasing revenue production and cost recovery. This is especially relevant as the City of Spokane’s demographics indicates that population by age breakdown is fairly well balanced among all ages. Multi‐use facilities verses specialized space is a trend, offering programming opportunities as well as free‐play opportunities. “One stop” facilities attract young families, teens, and adults of all ages. According to Recreation Management magazine’s “2009 State of the Industry Report,” recent economic conditions are leading many parks and recreation agencies across the country to cut their budgets, while at the same time an increase in participation may be on the rise due to the services offered at facilities. Whether people are trading in pricier health club memberships, they are taking advantage of public programs, or they are staying close to home for vacation, many citizens are looking at their public gym space to provide entertainment.
37
The report also summarized a survey that included public, private, and non‐profit agencies. The following trends were highlighted specific to facilities: • Despite crunching budgets, respondents were slightly more likely than average to be planning to build new facilities, or make additions
and renovations to their existing facilities. Although it is noted that percentages are slightly lower than previous years. • The top 10 amenities currently to be included in park facilities are:
1. Playgrounds (included by 81.4 percent of park respondents) 2. Park structures like restroom buildings and picnic shelters (80.6 percent) 3. Open spaces like natural areas and gardens (71.6 percent) 4. Outdoor sports courts for games like basketball and tennis (70.6 percent) 5. Natural turf sports fields for baseball and football (70.6 percent) 6. Trails (68.4 percent) 7. Bleachers and seating (68.3 percent) 8. Concession areas (65.4 percent) 9. Classrooms and meeting rooms (53.7 percent) 10. Community or multipurpose centers (49.3 percent)
Amenities that are still considered “alternative” but increasing in popularity include the following: • Climbing walls. • Cultural art facilities. • Green design techniques and certifications such as Leadership in Energy and Environmental Design (LEED®). A recent Building Commissioners
Association (BCA) survey indicated that 52 percent of the recreation industry survey respondents indicated they were willing to pay more for green design knowing that it would significantly reduce or eliminate the negative impact of buildings on the environment and occupants.
38
Fitness and Health Trends The Spokane Regional Health District published a series of reports based on information collected from the State Population Survey,
Washington State Department of Health, and the Healthy Youth Survey. Below are key issues that were reported. • Of Spokane County adults aged 18 years and older, 50 percent met the Healthy People 2010 recommendation for moderate or vigorous physical
activity in 2005. In 2004, 35 percent of Spokane County youth in grades 8, 10, and 12 participated in moderate physical activity and 76.4 percent participated in vigorous activity as defined in the Healthy People 2010 goals.
• In Spokane County, the proportion of adults who were obese decreased from 23 percent in 1998 to 14 percent in 2001 but increased significantly in 2002 and has remained at nearly a quarter.
• Figure 9 illustrates this in more detail. In 2005, this represented an estimated 75,050 obese adults in Spokane County. Statewide, the proportion of obese adults has also increased.
• One in four youth in Spokane County was either overweight or obese. • More than a third of youth in Spokane County reported trying to lose weight (39%). • Among 10th graders in 2008:
o Thirty (30) percent had ever smoked a whole cigarette. o Sixty‐three (63) percent had ever drunk more than a sip of alcohol. o Thirty‐two (32) percent had ever smoked marijuana. o From 2002 to 2008, teens who reported ever using marijuana decreased significantly. o One in four youth was either overweight or obese.
• Less than 20 percent of youth reported meeting the recommended level of 60 minutes of physical activity per day. State of Washington Health Trends The United Health Foundation ranked Washington 11th in the 2009 State Health Rankings, up two rankings from 2008. The State’s strengths include:
• Low prevalence of smoking. • Low rate of preventable hospitalizations. • Low percentage of children in poverty. • Low infant mortality rate.
Some of the challenges the State faces include:
• Low high school graduation rate. • High geographic disparity within the state.
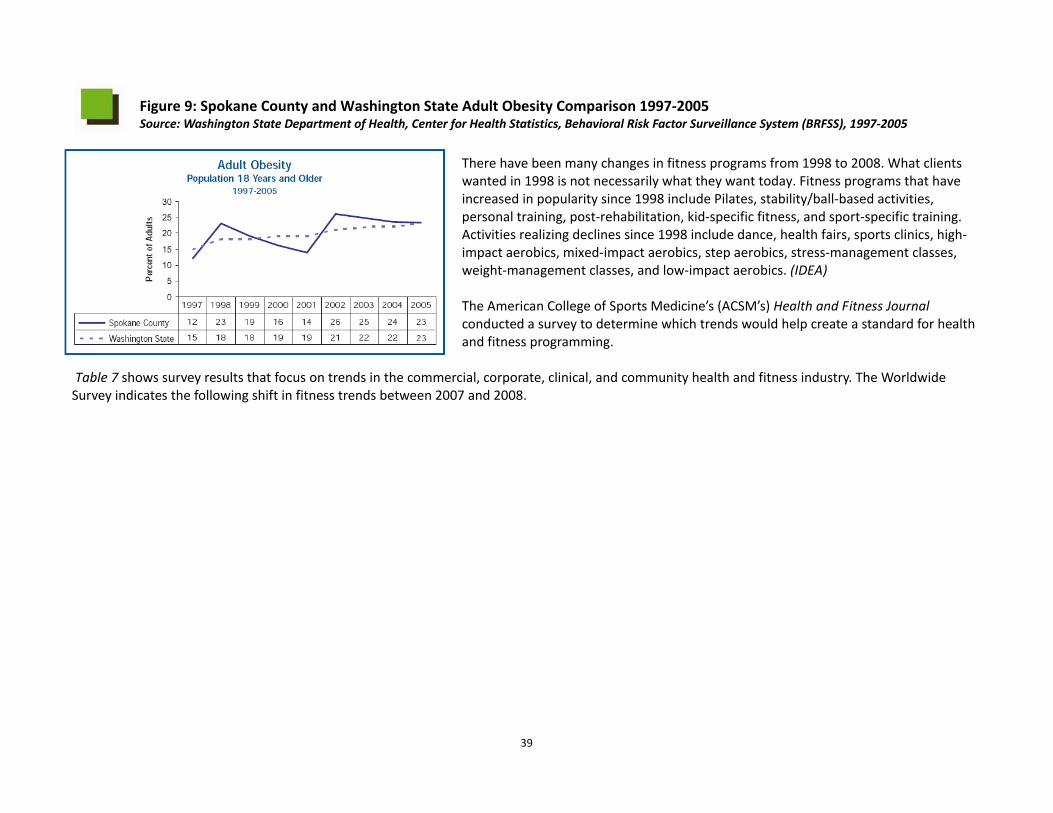
39
Figure 9: Spokane County and Washington State Adult Obesity Comparison 1997‐2005 Source: Washington State Department of Health, Center for Health Statistics, Behavioral Risk Factor Surveillance System (BRFSS), 1997‐2005
There have been many changes in fitness programs from 1998 to 2008. What clients wanted in 1998 is not necessarily what they want today. Fitness programs that have increased in popularity since 1998 include Pilates, stability/ball‐based activities, personal training, post‐rehabilitation, kid‐specific fitness, and sport‐specific training. Activities realizing declines since 1998 include dance, health fairs, sports clinics, high‐impact aerobics, mixed‐impact aerobics, step aerobics, stress‐management classes, weight‐management classes, and low‐impact aerobics. (IDEA) The American College of Sports Medicine’s (ACSM’s) Health and Fitness Journal conducted a survey to determine which trends would help create a standard for health and fitness programming.
Table 7 shows survey results that focus on trends in the commercial, corporate, clinical, and community health and fitness industry. The Worldwide Survey indicates the following shift in fitness trends between 2007 and 2008.
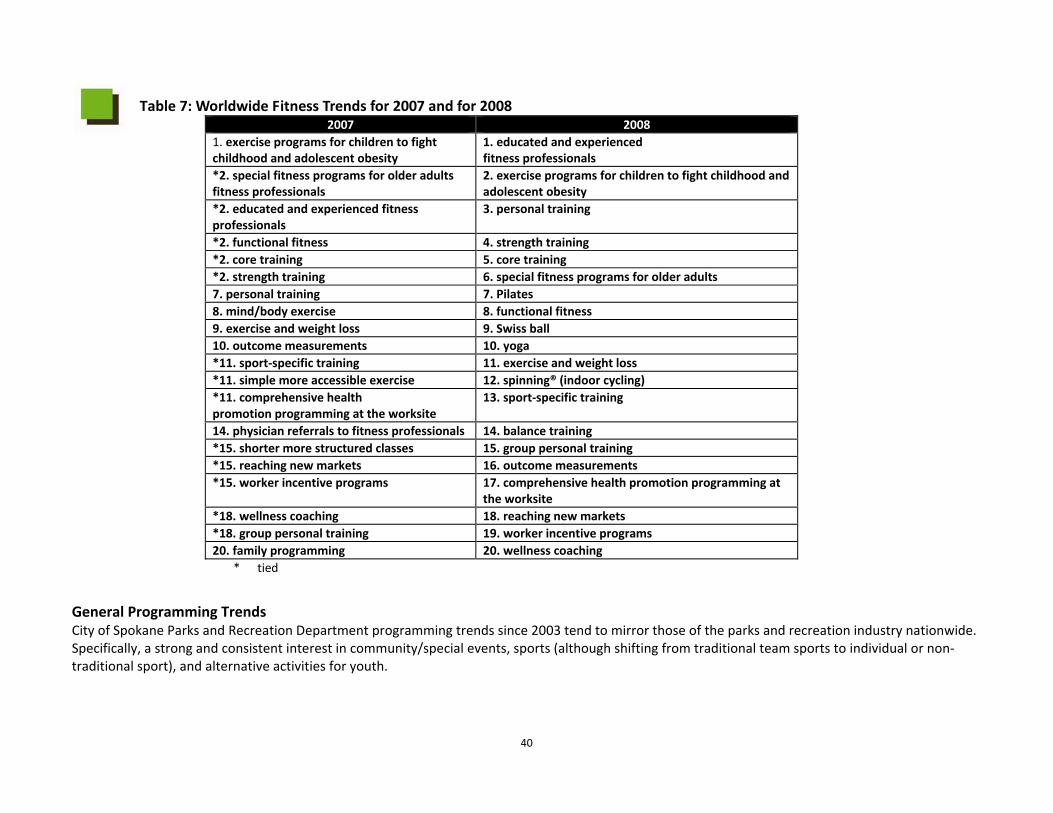
40
Table 7: Worldwide Fitness Trends for 2007 and for 2008 2007 2008
1. exercise programs for children to fight childhood and adolescent obesity
1. educated and experienced fitness professionals
*2. special fitness programs for older adults fitness professionals
2. exercise programs for children to fight childhood and adolescent obesity
*2. educated and experienced fitness professionals
3. personal training
*2. functional fitness 4. strength training*2. core training 5. core training*2. strength training 6. special fitness programs for older adults7. personal training 7. Pilates8. mind/body exercise 8. functional fitness9. exercise and weight loss 9. Swiss ball10. outcome measurements 10. yoga*11. sport‐specific training 11. exercise and weight loss *11. simple more accessible exercise 12. spinning® (indoor cycling) *11. comprehensive healthpromotion programming at the worksite
13. sport‐specific training
14. physician referrals to fitness professionals 14. balance training*15. shorter more structured classes 15. group personal training *15. reaching new markets 16. outcome measurements *15. worker incentive programs 17. comprehensive health promotion programming at
the worksite *18. wellness coaching 18. reaching new markets *18. group personal training 19. worker incentive programs 20. family programming 20. wellness coaching
* tied
General Programming Trends City of Spokane Parks and Recreation Department programming trends since 2003 tend to mirror those of the parks and recreation industry nationwide. Specifically, a strong and consistent interest in community/special events, sports (although shifting from traditional team sports to individual or non‐traditional sport), and alternative activities for youth.
41
Nationally, one of the most common concerns in the recreation industry is creating innovative programming to draw participants into facilities and services. Once in, participants recognize the benefits are indeed, endless. According to Recreation Management magazine’s June 2009 “State of the Industry Report,” the most common programs included holiday and other special events, day camps, summer camps,
and fitness programs. Other commonly offered programs include educational programs, sports tournaments, and races, swimming programs, youth sports teams, programs for active older adults, mind/body balance programs like yoga and tai chi, and adult sports teams. Recreation Management magazine’s “2009 State of the Industry Report” highlighted the following top 10 programs offered at park and recreation facilities:
1. Holidays and special events 2. Youth sports teams 3. Day camps and summer camps 4. Adult sports teams 5. Arts and crafts 6. Education 7. Sport‐specific training 8. Swimming 9. Active older adults 10. Sports tournaments or races
Marketing Trends Web 2.0 tools are becoming more and more popular for agencies to use as a means of marketing programs and services. Washington recently created new archiving laws that apply to webpages and electronic media. Popular electronic tools include:
• GoCityKids.com • Facebook • Whirl • Twitter • KaBoom! • You Tube • Flickr • LinkedIn
42
Natural Environments and Open Space The City of Spokane places a high value on natural environments and open space as shown in Figure 7, illustrating the most important needs
for programs. When asked which events and activities were the three most important, outdoor recreation activities was the top choice (16 percent of respondents listed it as their number one priority and 38 percent of respondents listed it as one of their top three priorities). The following information describes economic and health benefits of parks, nature programming, outdoor recreation and wildlife, and legislation on a national level. Economic & Health Benefits of Parks and Open Spaces There are numerous economic and health benefits of parks and open spaces, including but not limited to the following:
• Trails, parks, and playgrounds are among the five most important community amenities considered when selecting a home, according to a 2002 survey of recent homebuyers by the National Association of Home Builders and National Association of Realtors. (Pack and Schunel)
• Research from the University of Illinois shows that trees, parks, and green spaces have a profound impact on people’s health and mental outlook. (P & R Magazine) US Forest Service research indicates that when the economic benefits produced by trees are assessed, total value can be two to six times the cost for tree planting and care.
• Fifty percent of Americans regard outdoor activities as their main source of exercise. (OIA) • “There’s a direct link between a lack of exposure to nature and higher rates of attention‐deficit disorder, obesity, and depression.” In essence,
parks and recreation agencies can and are becoming the “preferred provider” for offering this preventative healthcare. – Fran P. Mainella, former director of the National Park Service and Instructor at Clemson University.
The Trust for Public Land has published a report titled: “The Benefits of Parks: Why America Needs More City Parks and Open Space.” The report makes the following observations about the health, economic, environmental, and social benefits of parks and open space:
• Physical activity makes people healthier. • Physical activity increases with access to parks. • Contact with the natural world improves physical and physiological health. • Residential and commercial property values increase. • Value is added to community and economic development sustainability. • Benefits of tourism are enhanced. • Trees are effective in improving air quality and act as natural air conditioners. • Trees assist with storm water control and erosion. • Crime and juvenile delinquency are reduced. • Recreational opportunities for all ages are provided. • Stable neighborhoods and strong communities are created.
43
Nature Programming In April 2007, the National Recreation and Park Association (NRPA) sent out a survey to member agencies in order to learn more about the
programs and facilities that public park and recreation agencies provide to connect children and their families with nature. A summary of the results follow:
• Sixty‐eight percent of public park and recreation agencies offer nature‐based programming, and 61 percent have nature‐based facilities. More than 30 percent of public agencies offer no nature programming, and slightly less than 40 percent have no nature‐based facilities.
• The most common nature programs include nature hikes, nature‐oriented arts and crafts, fishing‐related events, and nature‐based education in cooperation with local schools.
• When asked to describe the elements that directly contribute to their most successful programs, agencies listed staff training as most important followed by program content and number of staff/staff training.
• When asked what resources would be needed most to expand programming, additional staff was most important followed by funding. • Of the agencies that do not currently offer nature‐based programming, 90 percent indicated that they want to in the future. Additional staff and
funding were again the most important resources these agencies would need going forward. • The most common facilities include nature parks/preserves, self‐guided nature trails, outdoor classrooms, and nature centers. • When asked to describe the elements that directly contribute to their most successful facilities, agencies listed funding as most important
followed by presence of wildlife and community support.
Outdoor Recreation and Wildlife Local parks and recreation departments are a common place for residents to look when interested in “getting outside” for leisure activities. It is often the mission of parks and recreation agencies as well as private or non‐profit organizations to move people outdoors to play. The No Child Left Inside Coalition is becoming a popular partnership for all outdoor recreation providers across the nation. It is a broad‐based organization comprised of more than 600 member groups from across the United States. Its membership, which is growing steadily, includes environmental, educational, business, public health, outdoor recreation, and conservation groups. The Coalition’s focus is the passage of the federal No Child Left Inside Act. This legislation would authorize major funding for states to provide high‐quality, environmental instruction. Funds support outdoor learning activities in school non‐formal environmental education centers, teacher training, and the creation of state environmental literacy plans. As of the writing of this document, the bill has not yet passed into law.
44
NCLI COALITION CELEBRATES HISTORIC LEGISLATION INTRODUCED ON EARTH DAY ‐ April 22, 2009 (WASHINGTON, D.C.) – Citing the critical need to improve environmental education across the country, The No Child Left Inside Coalition today applauded Senator Jack Reed (D‐RI) and Congressman John Sarbanes (D‐MD) for introducing the Senate and House versions of the historic No Child Left Inside Act (NCLI) on Earth Day 2009. The bi‐partisan legislation, if passed, would mark the first environmental education legislation to pass Congress in more than 25 years. “Passing the No Child Left Inside Act is a key step in improving the quality of our children’s education and preparing them for the complex challenges of the future workforce,” Senator Reed said. Research shows that when environmental education is integrated into the curriculum, student achievement increases in core academic areas including science, math, and reading. Additional research finds that schools that teach the core subjects using the environment as an integrating context also demonstrate reduced discipline and classroom management problems; increased engagement and enthusiasm for learning; and greater student pride and ownership in accomplishments. The bill authorizes new funding for states to provide high‐quality, environmental instruction. Funds would support outdoor learning activities both at school and in non‐formal environmental education centers, teacher professional development, and the creation of state environmental literacy plans. The following are additional trends in outdoor recreation and environmental education for all ages.
• Environmental education programs were listed at the top of the 10 programs parks and recreation departments are planning to add within the next three years. (Recreation Management magazine)
• The most popular outdoor recreation activities are currently boating and camping. Growth areas are fishing, hiking, snowboarding, wakeboarding, and kayaking.
• More wildlife related participants are between the ages 35 to 54 years than any other age category. • The top three active outdoor recreation activities in terms of participation are bicycling, fishing, and hiking. (OIA)
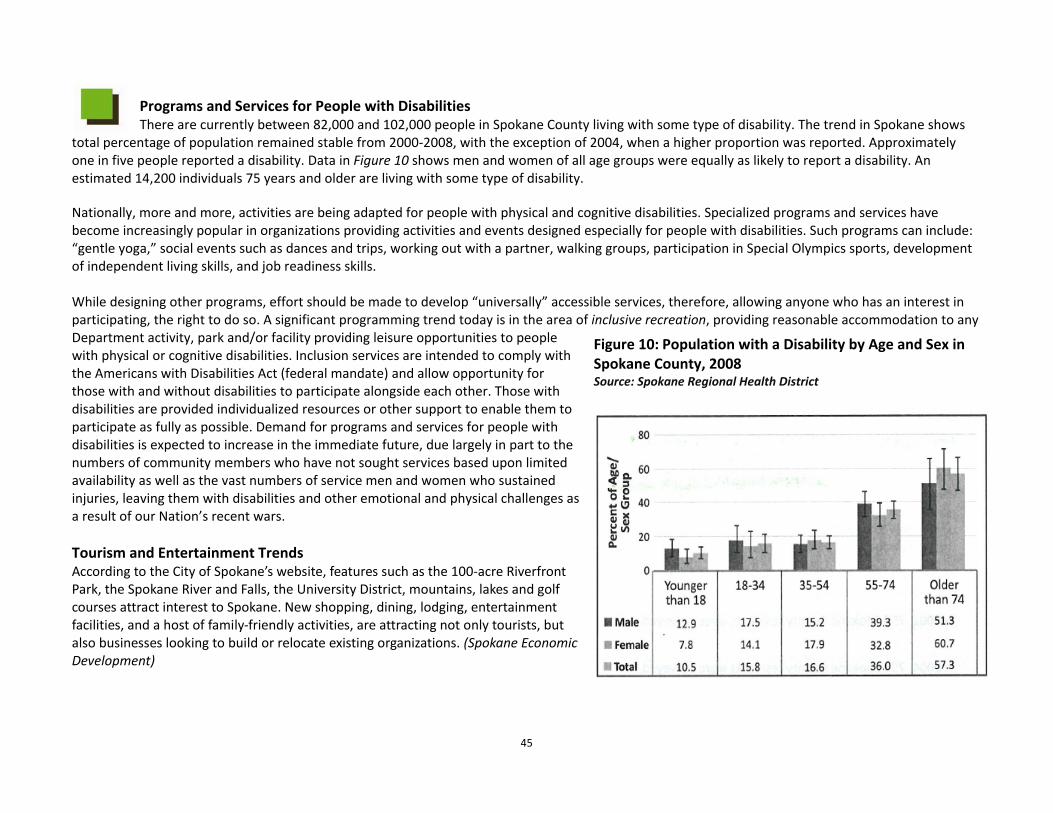
45
Programs and Services for People with Disabilities There are currently between 82,000 and 102,000 people in Spokane County living with some type of disability. The trend in Spokane shows
total percentage of population remained stable from 2000‐2008, with the exception of 2004, when a higher proportion was reported. Approximately one in five people reported a disability. Data in Figure 10 shows men and women of all age groups were equally as likely to report a disability. An estimated 14,200 individuals 75 years and older are living with some type of disability. Nationally, more and more, activities are being adapted for people with physical and cognitive disabilities. Specialized programs and services have become increasingly popular in organizations providing activities and events designed especially for people with disabilities. Such programs can include: “gentle yoga,” social events such as dances and trips, working out with a partner, walking groups, participation in Special Olympics sports, development of independent living skills, and job readiness skills. While designing other programs, effort should be made to develop “universally” accessible services, therefore, allowing anyone who has an interest in participating, the right to do so. A significant programming trend today is in the area of inclusive recreation, providing reasonable accommodation to any Department activity, park and/or facility providing leisure opportunities to people with physical or cognitive disabilities. Inclusion services are intended to comply with the Americans with Disabilities Act (federal mandate) and allow opportunity for those with and without disabilities to participate alongside each other. Those with disabilities are provided individualized resources or other support to enable them to participate as fully as possible. Demand for programs and services for people with disabilities is expected to increase in the immediate future, due largely in part to the numbers of community members who have not sought services based upon limited availability as well as the vast numbers of service men and women who sustained injuries, leaving them with disabilities and other emotional and physical challenges as a result of our Nation’s recent wars. Tourism and Entertainment Trends According to the City of Spokane’s website, features such as the 100‐acre Riverfront Park, the Spokane River and Falls, the University District, mountains, lakes and golf courses attract interest to Spokane. New shopping, dining, lodging, entertainment facilities, and a host of family‐friendly activities, are attracting not only tourists, but also businesses looking to build or relocate existing organizations. (Spokane Economic Development)
Figure 10: Population with a Disability by Age and Sex in Spokane County, 2008 Source: Spokane Regional Health District
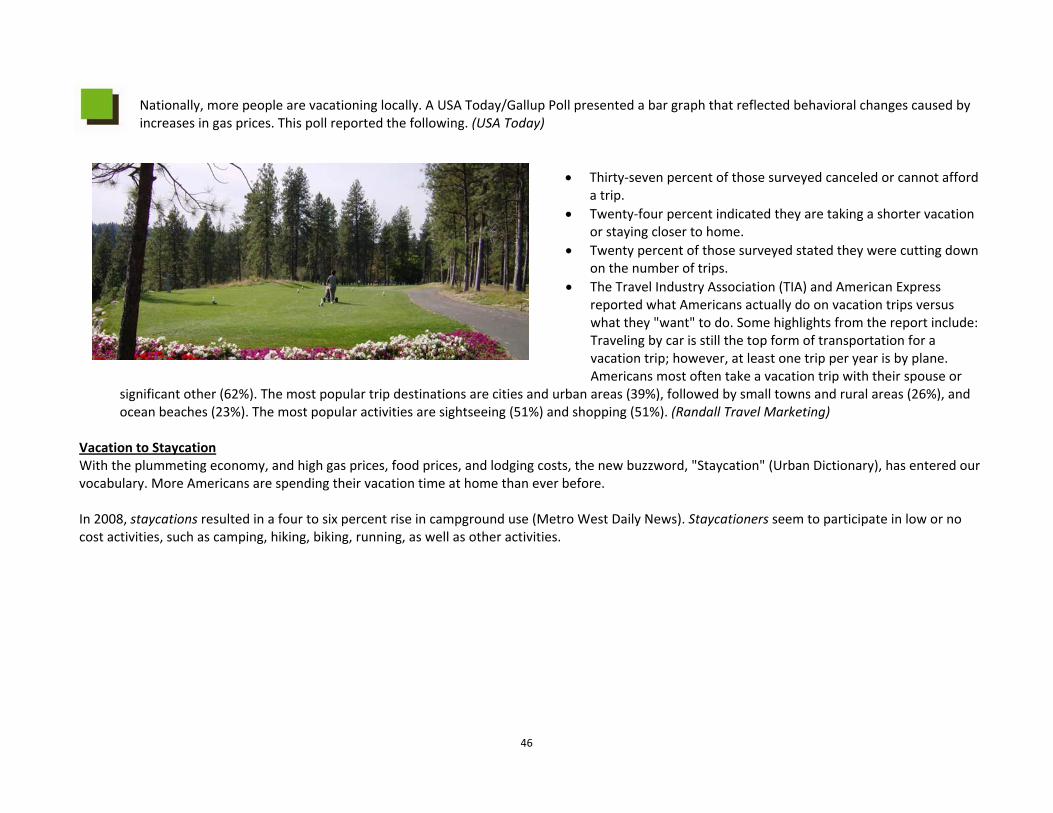
46
Nationally, more people are vacationing locally. A USA Today/Gallup Poll presented a bar graph that reflected behavioral changes caused by increases in gas prices. This poll reported the following. (USA Today)
• Thirty‐seven percent of those surveyed canceled or cannot afford
a trip. • Twenty‐four percent indicated they are taking a shorter vacation
or staying closer to home. • Twenty percent of those surveyed stated they were cutting down
on the number of trips. • The Travel Industry Association (TIA) and American Express
reported what Americans actually do on vacation trips versus what they "want" to do. Some highlights from the report include: Traveling by car is still the top form of transportation for a vacation trip; however, at least one trip per year is by plane. Americans most often take a vacation trip with their spouse or
significant other (62%). The most popular trip destinations are cities and urban areas (39%), followed by small towns and rural areas (26%), and ocean beaches (23%). The most popular activities are sightseeing (51%) and shopping (51%). (Randall Travel Marketing)
Vacation to Staycation With the plummeting economy, and high gas prices, food prices, and lodging costs, the new buzzword, "Staycation" (Urban Dictionary), has entered our vocabulary. More Americans are spending their vacation time at home than ever before. In 2008, staycations resulted in a four to six percent rise in campground use (Metro West Daily News). Staycationers seem to participate in low or no cost activities, such as camping, hiking, biking, running, as well as other activities.
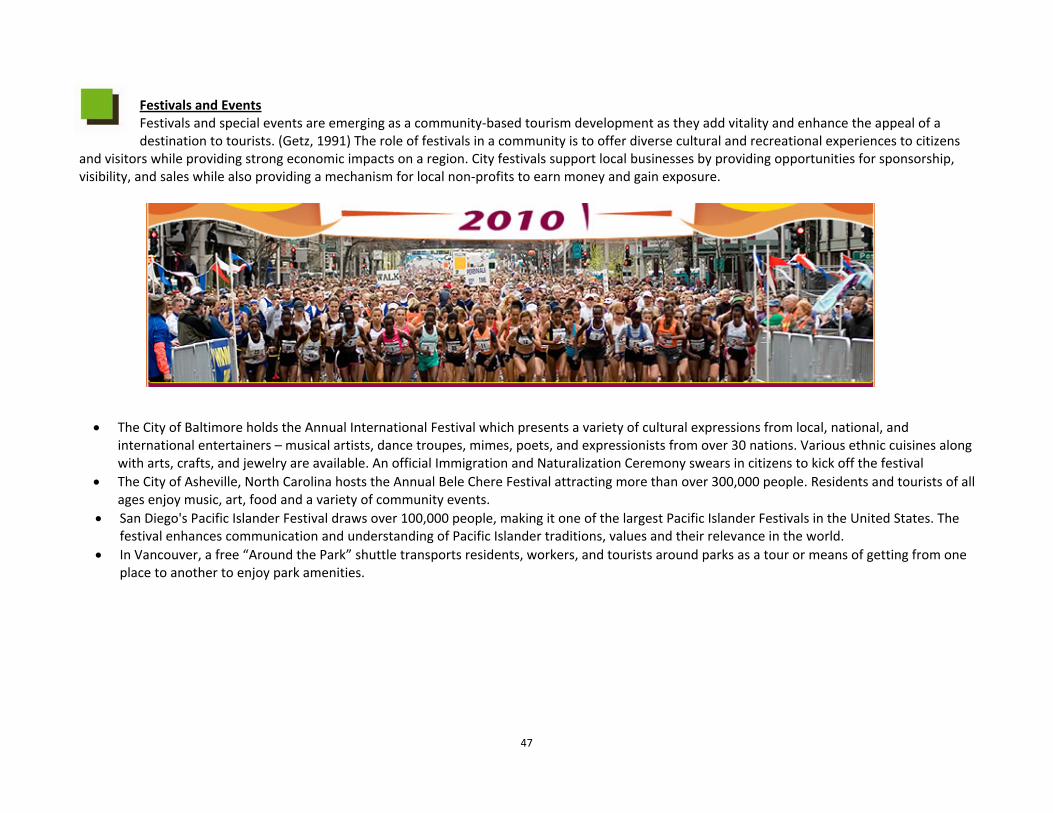
47
Festivals and Events Festivals and special events are emerging as a community‐based tourism development as they add vitality and enhance the appeal of a destination to tourists. (Getz, 1991) The role of festivals in a community is to offer diverse cultural and recreational experiences to citizens
and visitors while providing strong economic impacts on a region. City festivals support local businesses by providing opportunities for sponsorship, visibility, and sales while also providing a mechanism for local non‐profits to earn money and gain exposure. • The City of Baltimore holds the Annual International Festival which presents a variety of cultural expressions from local, national, and
international entertainers – musical artists, dance troupes, mimes, poets, and expressionists from over 30 nations. Various ethnic cuisines along with arts, crafts, and jewelry are available. An official Immigration and Naturalization Ceremony swears in citizens to kick off the festival
• The City of Asheville, North Carolina hosts the Annual Bele Chere Festival attracting more than over 300,000 people. Residents and tourists of all ages enjoy music, art, food and a variety of community events.
• San Diego's Pacific Islander Festival draws over 100,000 people, making it one of the largest Pacific Islander Festivals in the United States. The festival enhances communication and understanding of Pacific Islander traditions, values and their relevance in the world.
• In Vancouver, a free “Around the Park” shuttle transports residents, workers, and tourists around parks as a tour or means of getting from one place to another to enjoy park amenities.
48
Urban Recreation Trends With a significant population increase in urban growth expected by 2020 as indicated by Spokane’s Land Capacity Analysis, recreation trends
may take on a different look in urbanized areas. According to a Brookings Institution article, “A Much More Urban America,” cities are experiencing a ‘second life’ due to distinctive physical assets (i.e., waterfronts, mixed‐use downtowns, historic districts, pedestrian friendly neighborhoods). A growing number of the American population (83%) lives in metropolitan areas which, “together, drive and dominate the economy and house wealth generating industries, centers of research and innovation, ports of commerce and gateways of immigration.” (Katz) As the trend to move into metropolitan communities continues, park and recreation professionals will need to focus on the physical assets each area offers. Nationally some of the urban recreation trends include the following: Fishing returning to prominence in urban areas
• In addition to Baltimore’s popular fishing tournaments, turtle races and frog races are hosted as fun unique events. • New Hampshire’s Fish and Game Department partners with schools, park and recreation departments to sponsor “Let’s Go Fishing.” The
program promotes a wise use of New Hampshire's aquatic resources through responsible and ethical outdoor behavior. It teaches proper skills and informs the public about rules and regulations to ensure a future for the sport of fishing. The program also provides information and instruction necessary for the public to participate in fishing.
• Arizona's Urban Fishing Program is recognized nationally as one of the best in the country. The Program is a partnership with the Game and Fish Department and local Parks and Recreation Departments to intensively stock and manage park lakes for fishing recreation.
Spending on movies equals $9.4 billion, representing ten times more than spending at all major professional sports. Bike‐friendly cities are emerging. Cycling has become a popular mode of transportation as the cost of fuel rises.
• Boston’s Mayor announced in summer 2009 that new bike lanes were installed on more of Boston’s streets. The City also placed 250 bike racks across the city. Bike sharing has been proposed ‐ people can rent bikes, tour the City using multiple pick up, and drop off locations. Boston hosted “Bike Fridays” this summer. The Boston Police Bike Unit escorted commuters to City Hall Plaza to enjoy free food, information, and activities.
• On May 1, 2008, eleven communities were honored with the League of American Bicyclist’s prestigious Bicycle Friendly Community designation. Awarded communities realized the potential of bicycling as they addressed the challenges of climate change, traffic congestion, rising obesity rates and soaring fuel prices. There are currently 84 Bicycle Friendly Communities across the United States. Awarding cities means recognizing education, engineering, enforcement, encouragement, and an evaluation plan. The only two Platinum Bicycle Friendly Cities are Davis, CA and Portland, OR.
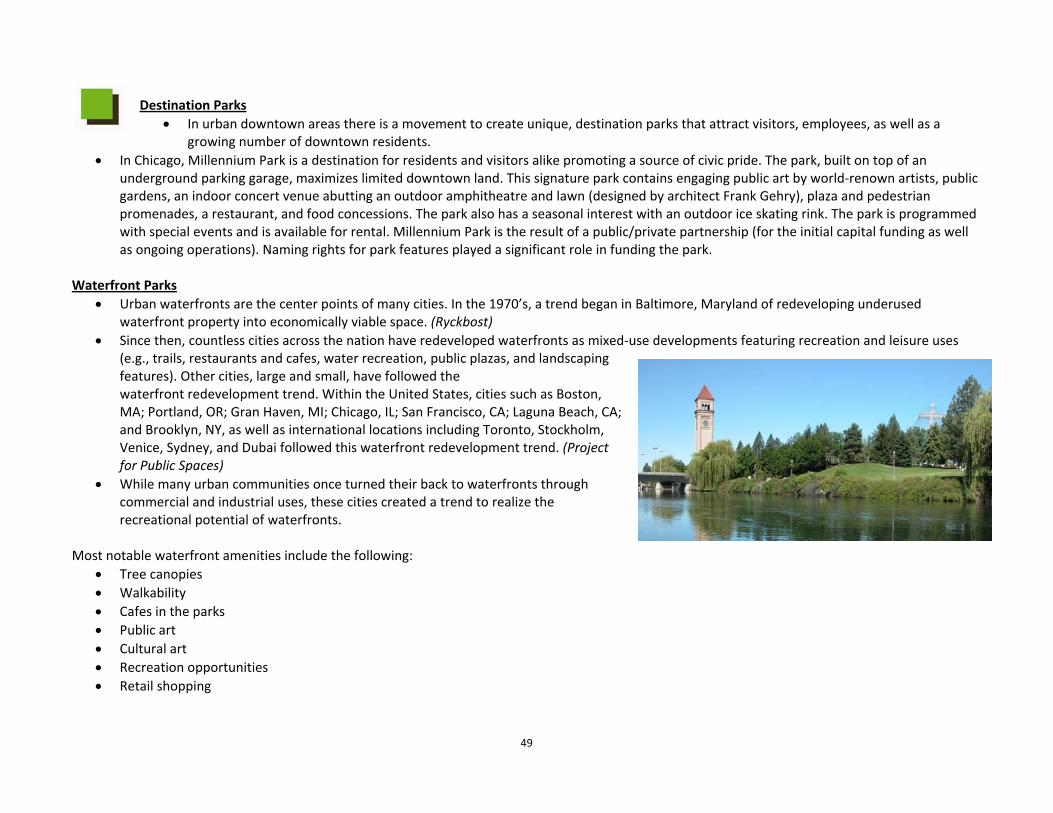
49
Destination Parks • In urban downtown areas there is a movement to create unique, destination parks that attract visitors, employees, as well as a
growing number of downtown residents. • In Chicago, Millennium Park is a destination for residents and visitors alike promoting a source of civic pride. The park, built on top of an
underground parking garage, maximizes limited downtown land. This signature park contains engaging public art by world‐renown artists, public gardens, an indoor concert venue abutting an outdoor amphitheatre and lawn (designed by architect Frank Gehry), plaza and pedestrian promenades, a restaurant, and food concessions. The park also has a seasonal interest with an outdoor ice skating rink. The park is programmed with special events and is available for rental. Millennium Park is the result of a public/private partnership (for the initial capital funding as well as ongoing operations). Naming rights for park features played a significant role in funding the park.
Waterfront Parks
• Urban waterfronts are the center points of many cities. In the 1970’s, a trend began in Baltimore, Maryland of redeveloping underused waterfront property into economically viable space. (Ryckbost)
• Since then, countless cities across the nation have redeveloped waterfronts as mixed‐use developments featuring recreation and leisure uses (e.g., trails, restaurants and cafes, water recreation, public plazas, and landscaping features). Other cities, large and small, have followed the waterfront redevelopment trend. Within the United States, cities such as Boston, MA; Portland, OR; Gran Haven, MI; Chicago, IL; San Francisco, CA; Laguna Beach, CA; and Brooklyn, NY, as well as international locations including Toronto, Stockholm, Venice, Sydney, and Dubai followed this waterfront redevelopment trend. (Project for Public Spaces)
• While many urban communities once turned their back to waterfronts through commercial and industrial uses, these cities created a trend to realize the recreational potential of waterfronts.
Most notable waterfront amenities include the following:
• Tree canopies • Walkability • Cafes in the parks • Public art • Cultural art • Recreation opportunities • Retail shopping
50
Before any of the above mentioned amenities can be incorporated into a redevelopment project, connectivity should be considered. According to Project for Public Spaces (PPS) the key to success is layering activities into a vision for improvement that is “greater than the sum of its uses.” Cities should integrate waterfronts into surrounding neighborhoods creating a variety of uses for people of all ages and
cultural make up into an active, inclusive public space. PPS identified 13 steps for creating great waterfronts. Within the 13 steps, two specifically reflect parks and recreation departments.
• Use parks to connect destinations • Integrate seasonal activities into each destination
Recreation and Park Administration Municipal parks and recreation structures and delivery systems have changed and more alternative methods of delivering services are emerging. There is more contracting out of certain services, and cooperative agreements with non‐profit groups and other public institutions. Newer partners include the health system, social services, justice, education, the corporate sector, and community service agencies. These partnerships reflect both a broader interpretation of the mandate of parks and recreation agencies, and the increased willingness of other sectors to work together to address community issues. The relationship with health is vital in promoting wellness. The traditional relationship with education to share the use of facilities through joint use agreements is evolving into cooperative planning and programming aimed at addressing youth inactivity levels and community needs. National Trends
• Partnerships and collaborations to best utilize scarce resources and diminish unnecessary duplication of service. • Level of subsidy for programs is lessening and more “enterprise” activities are being developed, thereby allowing subsidy to be used where
deemed appropriate. • Information technology allows for tracking and reporting. • Pricing is often done by peak, off‐peak, and off‐season rates. • More agencies are partnering with private, public, and non‐profit groups.
51
Key Demographic & Parks and Recreation Trend Considerations
• According to Spokane Vitals 2009, overall, Spokane is faring better than comparable metros in business growth, educational attainment, and quality of life.
• Median age for Spokane residents is 37 years, almost the same as the County (36.9 years) and the State (37 years). • Median household income for Spokane residents at $42,798 is lower than Spokane County and the State of Washington. • Owner occupied housing units is less in Spokane than in the County and State. (City of Spokane 53.4%, Spokane County 60.4%, and Washington State
69.2%) • Education attainment for Spokane residents indicates the majority of the 25 years and older cohort has a high school degree or some college. • Population in Spokane is projected to increase by 7,800 by 2014. • The United Health Foundation has ranked Washington 11th in its 2009 State Health Rankings. • Participation in out‐of‐school activities and programs offer support for youth and working families and benefit youth socially, emotionally, and
academically. [Note: Currently, the primary form of afterschool programming in Spokane is managed thought the Spokane Public School system.] • Outdoor pools in Washington are only open for approximately three months out of the year. There is an increasing trend towards indoor leisure and
therapeutic pools. Additional amenities like “spray pads” are becoming increasingly popular as well. All new and rehabilitated aquatics facilities in Spokane are currently out of doors.
• Environmental education programs were listed at the top of the 10 programs parks and recreation departments are planning to add within the next three years.
• Sixty‐eight percent of public park and recreation agencies offer nature‐based programming and 61 percent have nature‐based facilities. More than 30 percent of public agencies offer no nature programming, and slightly less than 40 percent have no nature‐based facilities. This trends reflects an interest in counter‐balancing the nationwide concern of “nature deficit disorder” popularized by the federal government and the author, Richard Louvre (technology’s impact on our loss of commitment to exercise and being out of doors).
• Trails, parks, and playgrounds are among the five most important community amenities considered when selecting a home. • National trends in the delivery of parks and recreation systems reflect more partnerships and collaborations to best use scarce resources and avoid
duplication of service provision. • The State of Washington is culturally rich. Ethnic trends in recreation are vast which requires a variety of programming. • Dense urban living near waterfront areas is emerging as a trend across the country.

Values, Mission & Vision
Answers the questions…Q: What is important to the community as it relates to parks and recreation services?Q: Where does Spokane Parks and Recreation want to be in the future?Q: What services does the Spokane Parks and Recreation Department provide?Q: How does Spokane Parks and Recreation provide services?Q: Who does the Spokane Parks and Recreation Department provide for – who is the Spokane community?

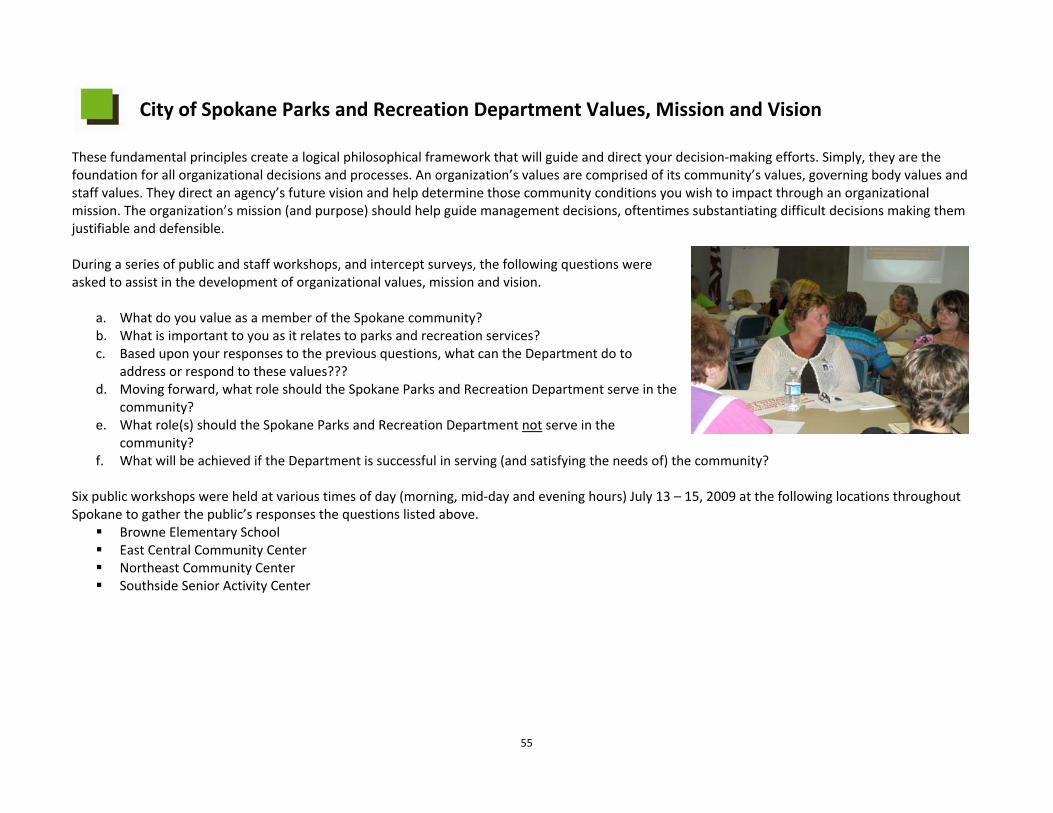
55
City of Spokane Parks and Recreation Department Values, Mission and Vision
These fundamental principles create a logical philosophical framework that will guide and direct your decision‐making efforts. Simply, they are the foundation for all organizational decisions and processes. An organization’s values are comprised of its community’s values, governing body values and staff values. They direct an agency’s future vision and help determine those community conditions you wish to impact through an organizational mission. The organization’s mission (and purpose) should help guide management decisions, oftentimes substantiating difficult decisions making them justifiable and defensible. During a series of public and staff workshops, and intercept surveys, the following questions were asked to assist in the development of organizational values, mission and vision.
a. What do you value as a member of the Spokane community? b. What is important to you as it relates to parks and recreation services? c. Based upon your responses to the previous questions, what can the Department do to
address or respond to these values??? d. Moving forward, what role should the Spokane Parks and Recreation Department serve in the
community? e. What role(s) should the Spokane Parks and Recreation Department not serve in the
community? f. What will be achieved if the Department is successful in serving (and satisfying the needs of) the community?
Six public workshops were held at various times of day (morning, mid‐day and evening hours) July 13 – 15, 2009 at the following locations throughout Spokane to gather the public’s responses the questions listed above.
Browne Elementary School East Central Community Center Northeast Community Center Southside Senior Activity Center
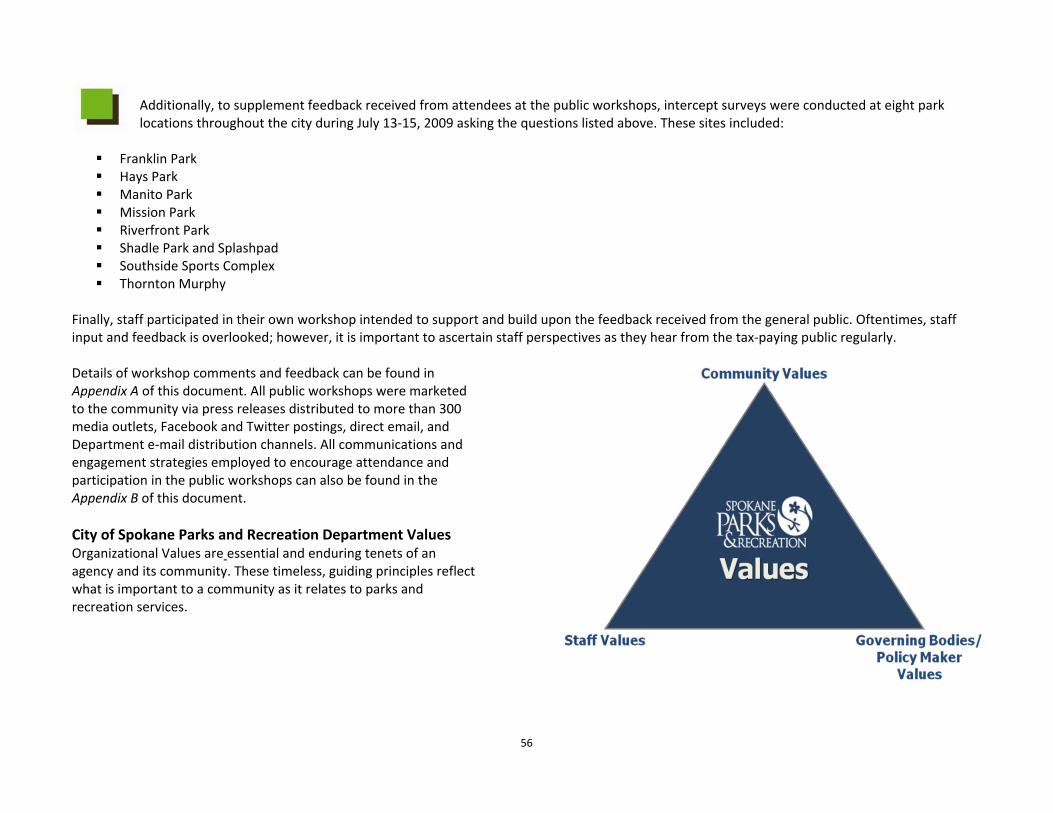
56
Additionally, to supplement feedback received from attendees at the public workshops, intercept surveys were conducted at eight park locations throughout the city during July 13‐15, 2009 asking the questions listed above. These sites included:
Franklin Park Hays Park Manito Park Mission Park Riverfront Park Shadle Park and Splashpad Southside Sports Complex Thornton Murphy
Finally, staff participated in their own workshop intended to support and build upon the feedback received from the general public. Oftentimes, staff input and feedback is overlooked; however, it is important to ascertain staff perspectives as they hear from the tax‐paying public regularly. Details of workshop comments and feedback can be found in Appendix A of this document. All public workshops were marketed to the community via press releases distributed to more than 300 media outlets, Facebook and Twitter postings, direct email, and Department e‐mail distribution channels. All communications and engagement strategies employed to encourage attendance and participation in the public workshops can also be found in the Appendix B of this document. City of Spokane Parks and Recreation Department Values Organizational Values are essential and enduring tenets of an agency and its community. These timeless, guiding principles reflect what is important to a community as it relates to parks and recreation services.
57
The City of Spokane Parks and Recreation’s Organizational Values are currently as follows.
The City of Spokane Parks and Recreation Department…
…provides and promotes a parks and recreation system which advocates healthy lifestyles and the value of play. …stimulates the local economy through the provision of venues, events and activities which draws visitors and keeps local citizens close to home; well‐maintained and managed greenspaces that enhance property values; and the creation of employment opportunities. …directs the acquisition and stewardship of properties for parks and recreation purposes while balancing active recreation and environmental interests. …promotes community safety through the development, maintenance, and management of the parks and recreation system. …ensures reasonable access to opportunities within a diverse parks and recreation system. …honors the history and legacy of the Spokane parks system through celebration, preservation and restoration efforts. …innovatively develops and manages the responsible, efficient and equitable use of resources leading to the sustainability of a strong and viable parks and recreation system.
...demonstrates accountability and a collaborative culture through open communication, stakeholder participation, and transparent management practices. ...continues to encourage a sense of community and pride through the provision of a parks and recreation system that affords citizens social gathering places and spaces.
58
City of Spokane Parks and Recreation Department Mission An organizational mission statement is a concise statement of the organization’s reason for being that is perpetual in nature. A mission
statement is intended to lead to the realization of the organization’s vision based upon the organizational values. The mission statement must address who is served; what services are provided; how services are provided; and why they are provided in order to be effective. The City of Spokane Parks and Recreation Department Mission Statement currently is as follows. The City of Spokane Parks and Recreation Department will collaboratively provide the following services for the benefit of a community of people who live, work and visit the city of Spokane.
clean, safe and eco‐friendly parks, trails, conservation lands, and recreation facilities accessible leisure and recreational opportunities an enhanced urban forest
These services will be facilitated and delivered through passionate, professional and proactive response to community issues, interests, and identified values. City of Spokane Parks and Recreation Department Vision An organizational vision is a 5‐10 year achievable ideal that describes what the organization seeks to become in the future. A vision is an audacious goal that is tangible, energizing, and highly focused.
“A vision articulates a view of a realistic, credible, desirable, positive future for the organization – a condition that is better in some way than what now exists”.
‐ McLean & Russell
59
The City of Spokane Parks and Recreation Vision Statement currently is currently as follows.
Leading the community to healthy activities, and in stewardship of public parks through responsive innovation.
Key Values, Mission and Vision Considerations
• The Department’s values statements are rich and varied. There is a strong sense of history and legacy that many other parks and recreation organizations do not have and therefore, the City of Spokane pride itself on this unique characteristic.
• A strong commitment and passion for the community’s urban forest has been addressed in the mission. The Department may find value in incorporating that into its organizational values.
• The mission clearly articulates that the community is defined as those “people who live, work and visit the city of Spokane” as the system is supported in large part by sales tax dollars.

Spokane Community Issues & Interests
Answers the questions…Q: What are the community issues, problems and challenges facing the Spokane community today that parks and recreation services can help resolve or impact?Q: What are the interests of the community as they relate to parks and recreation services?

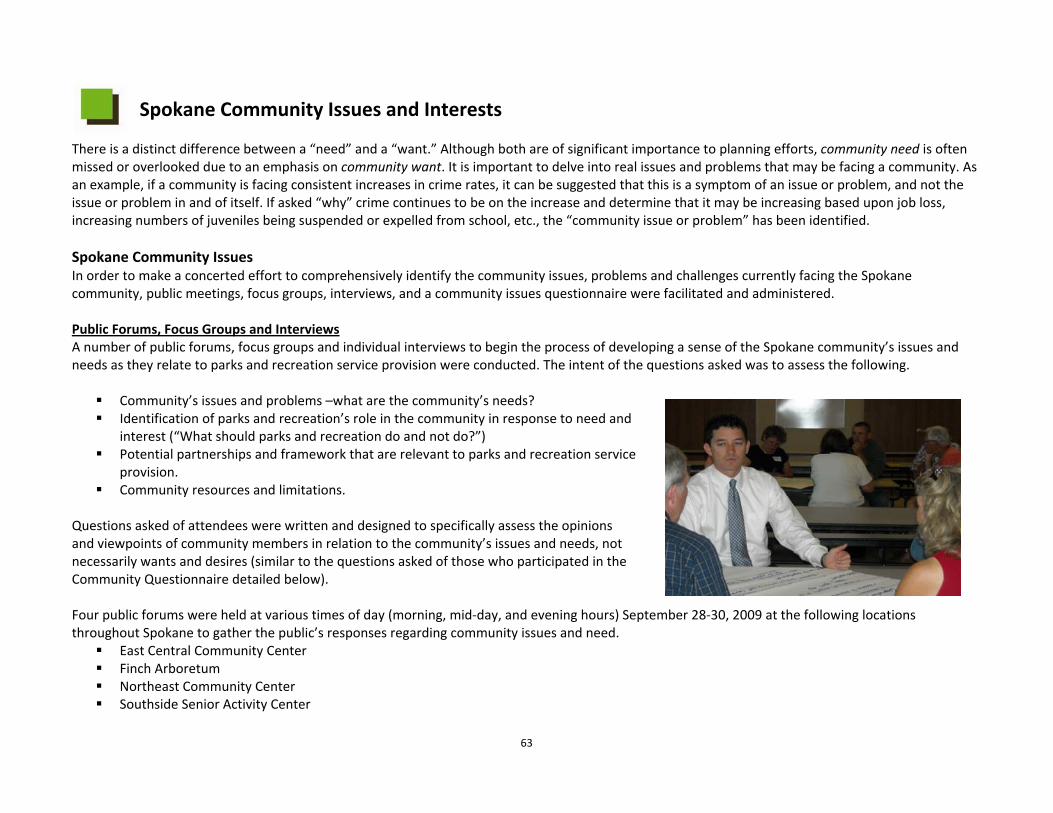
63
Spokane Community Issues and Interests
There is a distinct difference between a “need” and a “want.” Although both are of significant importance to planning efforts, community need is often missed or overlooked due to an emphasis on community want. It is important to delve into real issues and problems that may be facing a community. As an example, if a community is facing consistent increases in crime rates, it can be suggested that this is a symptom of an issue or problem, and not the issue or problem in and of itself. If asked “why” crime continues to be on the increase and determine that it may be increasing based upon job loss, increasing numbers of juveniles being suspended or expelled from school, etc., the “community issue or problem” has been identified. Spokane Community Issues In order to make a concerted effort to comprehensively identify the community issues, problems and challenges currently facing the Spokane community, public meetings, focus groups, interviews, and a community issues questionnaire were facilitated and administered. Public Forums, Focus Groups and Interviews A number of public forums, focus groups and individual interviews to begin the process of developing a sense of the Spokane community’s issues and needs as they relate to parks and recreation service provision were conducted. The intent of the questions asked was to assess the following.
Community’s issues and problems –what are the community’s needs? Identification of parks and recreation’s role in the community in response to need and
interest (“What should parks and recreation do and not do?”) Potential partnerships and framework that are relevant to parks and recreation service
provision. Community resources and limitations.
Questions asked of attendees were written and designed to specifically assess the opinions and viewpoints of community members in relation to the community’s issues and needs, not necessarily wants and desires (similar to the questions asked of those who participated in the Community Questionnaire detailed below). Four public forums were held at various times of day (morning, mid‐day, and evening hours) September 28‐30, 2009 at the following locations throughout Spokane to gather the public’s responses regarding community issues and need.
East Central Community Center Finch Arboretum Northeast Community Center Southside Senior Activity Center
64
Additionally, to supplement feedback received from attendees at the public forums, 14 focus groups were scheduled during various times of day (morning, mid‐day and evening hours) September 28‐30, 2009 at the Finch Arboretum. Focus groups were designed to provide for focused discussion with special interest groups or organizations. The following groups were invited to participate in focus group workshops.
Schools Neighborhood associations Service organizations Season pass holders Business community representatives Department partners Non‐profit organizations Other city department representatives Staff
A number of individual interviews were scheduled September 28‐30, 2009 with Project Team members (staff), Parks and Recreation Board members, City Council members, and the Mayor. These interviews were intended to further supplement the feedback received from participating community members who attended the public forums and those who participated in the focus groups. Details of the workshops, focus groups and interview comments and feedback can be found in Appendix C of this document. All communications and engagement strategies employed to encourage attendance and participation in the public forums can also be found in Appendix B of this document. Community Issues Questionnaire To continue the pattern of building upon what was communicated by the community, city leadership and staff during public forums, focus group workshops and interviews, a Community Issues Questionnaire was developed and distributed. The questionnaire was distributed via the Department’s website beginning on December 2, 2009. The questionnaire remained on the website though January 15, 2010 and was marketed to the community via press releases distributed to more than 300 media outlets, Facebook and Twitter postings, direct email, the Department’s direct e‐mail channels, and the library’s e‐newsletter (50,000 distribution).
As mentioned above in reference to the public forums, focus groups and interviews, questions asked as part of the Community Issues Questionnaire were written and designed to specifically assess the opinions and viewpoints of community members in relation to the community’s issues and needs, not necessarily wants and desires. Questions asked included the following.
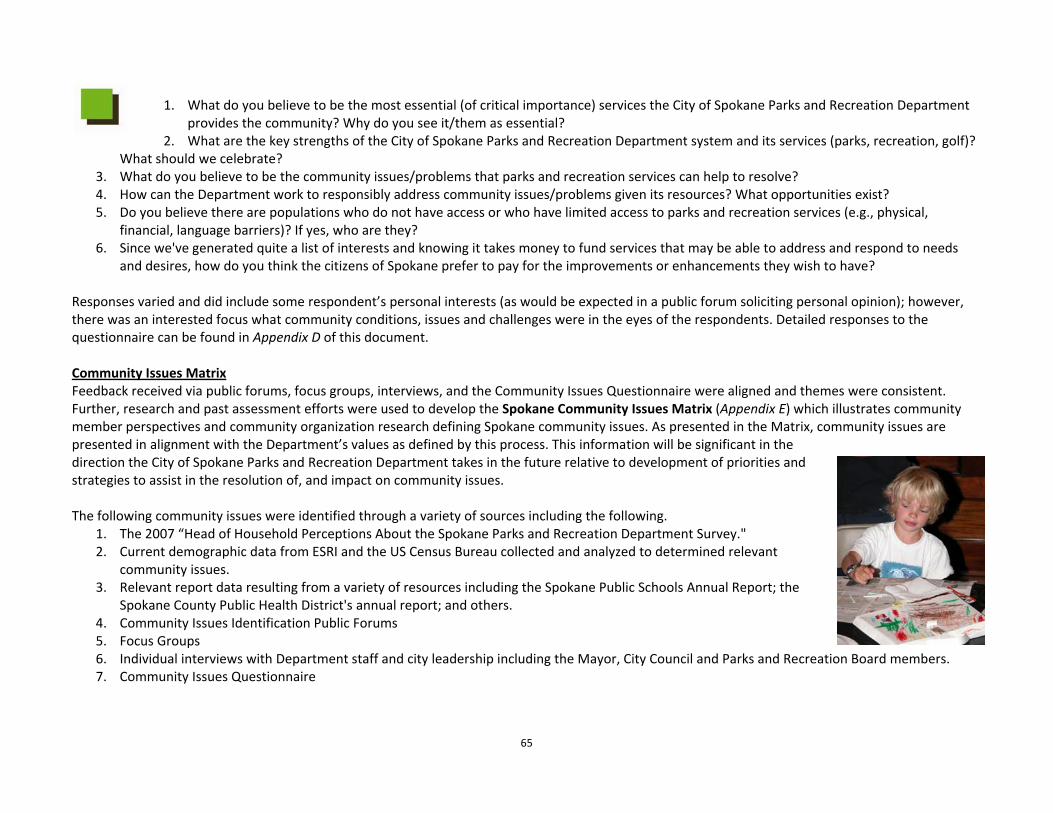
65
1. What do you believe to be the most essential (of critical importance) services the City of Spokane Parks and Recreation Department provides the community? Why do you see it/them as essential?
2. What are the key strengths of the City of Spokane Parks and Recreation Department system and its services (parks, recreation, golf)? What should we celebrate?
3. What do you believe to be the community issues/problems that parks and recreation services can help to resolve? 4. How can the Department work to responsibly address community issues/problems given its resources? What opportunities exist? 5. Do you believe there are populations who do not have access or who have limited access to parks and recreation services (e.g., physical,
financial, language barriers)? If yes, who are they? 6. Since we've generated quite a list of interests and knowing it takes money to fund services that may be able to address and respond to needs
and desires, how do you think the citizens of Spokane prefer to pay for the improvements or enhancements they wish to have? Responses varied and did include some respondent’s personal interests (as would be expected in a public forum soliciting personal opinion); however, there was an interested focus what community conditions, issues and challenges were in the eyes of the respondents. Detailed responses to the questionnaire can be found in Appendix D of this document. Community Issues Matrix Feedback received via public forums, focus groups, interviews, and the Community Issues Questionnaire were aligned and themes were consistent. Further, research and past assessment efforts were used to develop the Spokane Community Issues Matrix (Appendix E) which illustrates community member perspectives and community organization research defining Spokane community issues. As presented in the Matrix, community issues are presented in alignment with the Department’s values as defined by this process. This information will be significant in the direction the City of Spokane Parks and Recreation Department takes in the future relative to development of priorities and strategies to assist in the resolution of, and impact on community issues. The following community issues were identified through a variety of sources including the following.
1. The 2007 “Head of Household Perceptions About the Spokane Parks and Recreation Department Survey." 2. Current demographic data from ESRI and the US Census Bureau collected and analyzed to determined relevant
community issues. 3. Relevant report data resulting from a variety of resources including the Spokane Public Schools Annual Report; the
Spokane County Public Health District's annual report; and others. 4. Community Issues Identification Public Forums 5. Focus Groups 6. Individual interviews with Department staff and city leadership including the Mayor, City Council and Parks and Recreation Board members. 7. Community Issues Questionnaire
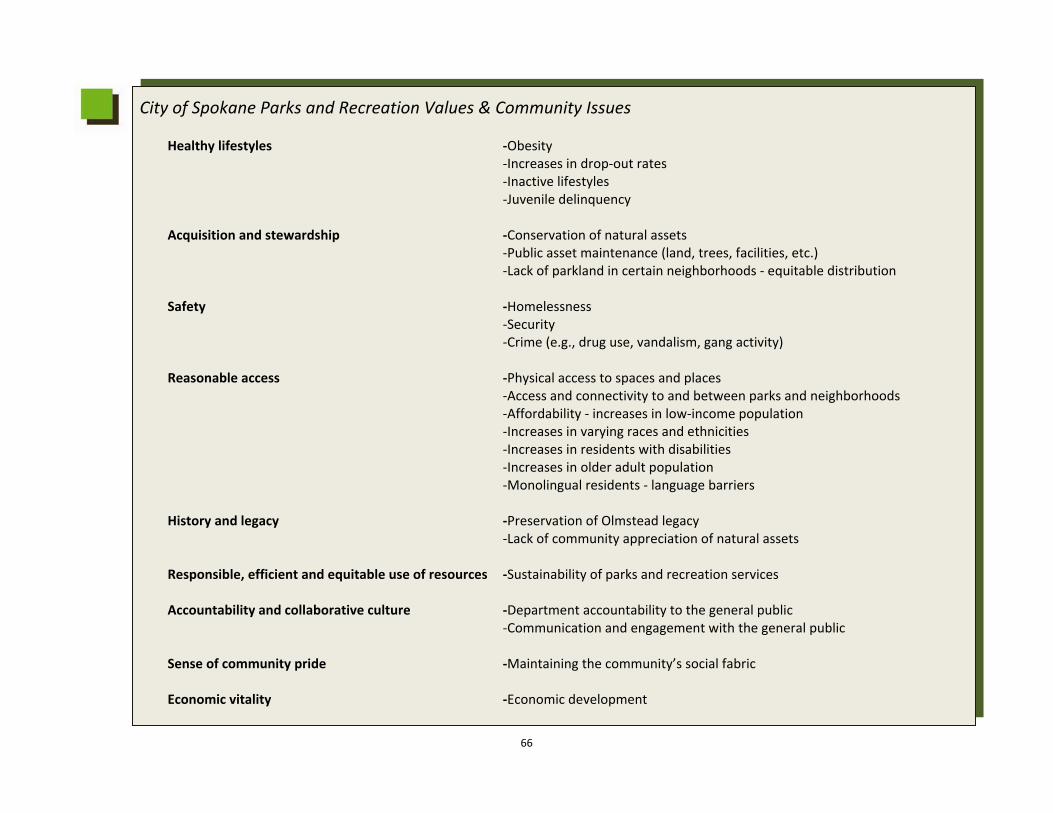
66
City of Spokane Parks and Recreation Values & Community Issues
Healthy lifestyles ‐Obesity ‐Increases in drop‐out rates ‐Inactive lifestyles ‐Juvenile delinquency
Acquisition and stewardship ‐Conservation of natural assets
‐Public asset maintenance (land, trees, facilities, etc.) ‐Lack of parkland in certain neighborhoods ‐ equitable distribution
Safety ‐Homelessness
‐Security ‐Crime (e.g., drug use, vandalism, gang activity)
Reasonable access ‐Physical access to spaces and places
‐Access and connectivity to and between parks and neighborhoods ‐Affordability ‐ increases in low‐income population ‐Increases in varying races and ethnicities ‐Increases in residents with disabilities ‐Increases in older adult population ‐Monolingual residents ‐ language barriers
History and legacy ‐Preservation of Olmstead legacy
‐Lack of community appreciation of natural assets Responsible, efficient and equitable use of resources ‐Sustainability of parks and recreation services
Accountability and collaborative culture ‐Department accountability to the general public
‐Communication and engagement with the general public Sense of community pride ‐Maintaining the community’s social fabric Economic vitality ‐Economic development
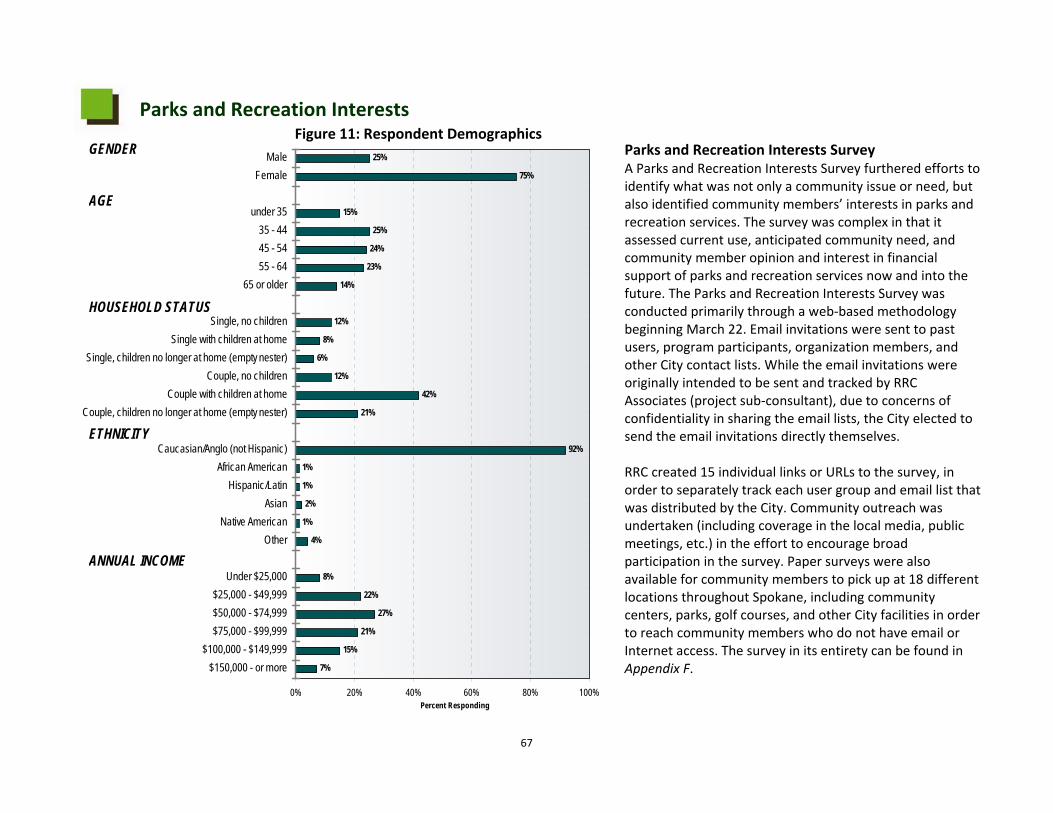
67
Parks and Recreation Interests
Parks and Recreation Interests Survey A Parks and Recreation Interests Survey furthered efforts to identify what was not only a community issue or need, but also identified community members’ interests in parks and recreation services. The survey was complex in that it assessed current use, anticipated community need, and community member opinion and interest in financial support of parks and recreation services now and into the future. The Parks and Recreation Interests Survey was conducted primarily through a web‐based methodology beginning March 22. Email invitations were sent to past users, program participants, organization members, and other City contact lists. While the email invitations were originally intended to be sent and tracked by RRC Associates (project sub‐consultant), due to concerns of confidentiality in sharing the email lists, the City elected to send the email invitations directly themselves. RRC created 15 individual links or URLs to the survey, in order to separately track each user group and email list that was distributed by the City. Community outreach was undertaken (including coverage in the local media, public meetings, etc.) in the effort to encourage broad participation in the survey. Paper surveys were also available for community members to pick up at 18 different locations throughout Spokane, including community centers, parks, golf courses, and other City facilities in order to reach community members who do not have email or Internet access. The survey in its entirety can be found in Appendix F.
25%
75%
15%
25%
24%
23%
14%
12%
8%
6%
12%
42%
21%
92%
1%
1%
2%
1%
4%
8%
22%
27%
21%
15%
7%
0% 20% 40% 60% 80% 100%
MaleFemale
under 3535 - 4445 - 5455 - 64
65 or older
Single, no childrenSingle with children at home
Single, children no longer at home (empty nester)Couple, no children
Couple with children at homeCouple, children no longer at home (empty nester)
Caucasian/Anglo (not Hispanic)African American
Hispanic/LatinAsian
Native AmericanOther
Under $25,000$25,000 - $49,999$50,000 - $74,999$75,000 - $99,999
$100,000 - $149,999$150,000 - or more
Percent Responding
GENDER
AGE
HOUSEHOLD STATUS
ANNUAL INCOME
ETHNICITY
Figure 11: Respondent Demographics
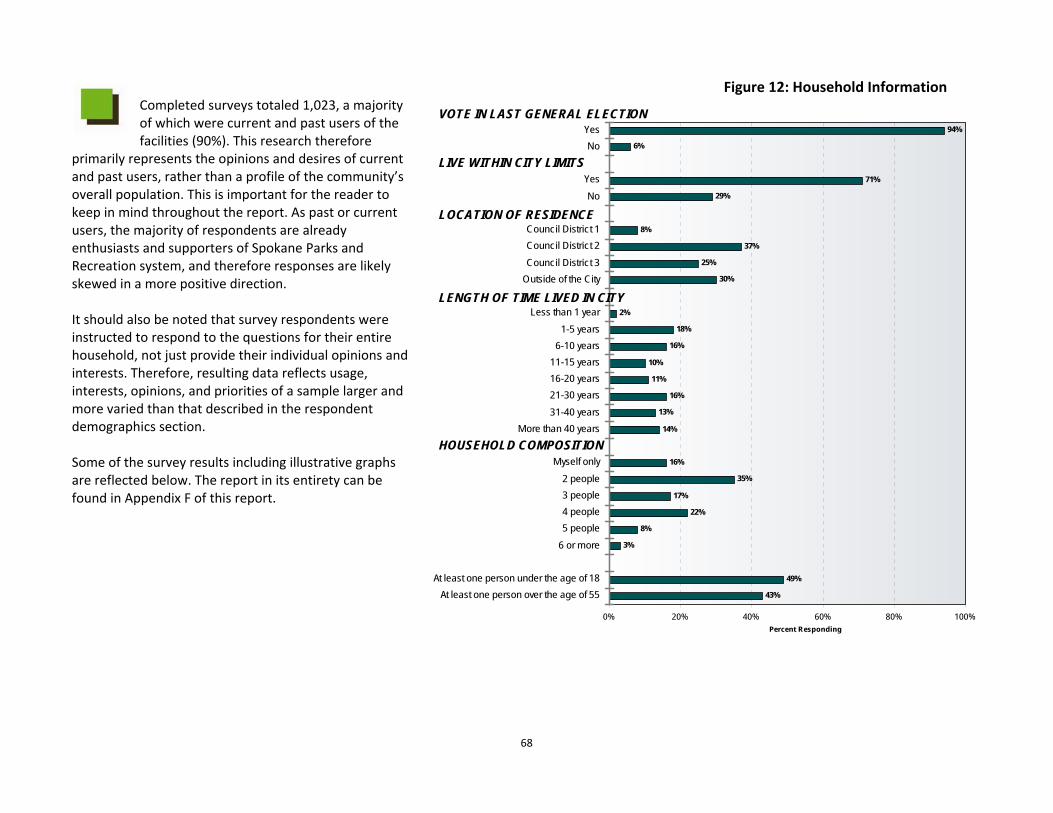
68
Completed surveys totaled 1,023, a majority of which were current and past users of the facilities (90%). This research therefore
primarily represents the opinions and desires of current and past users, rather than a profile of the community’s overall population. This is important for the reader to keep in mind throughout the report. As past or current users, the majority of respondents are already enthusiasts and supporters of Spokane Parks and Recreation system, and therefore responses are likely skewed in a more positive direction. It should also be noted that survey respondents were instructed to respond to the questions for their entire household, not just provide their individual opinions and interests. Therefore, resulting data reflects usage, interests, opinions, and priorities of a sample larger and more varied than that described in the respondent demographics section. Some of the survey results including illustrative graphs are reflected below. The report in its entirety can be found in Appendix F of this report.
94%
6%
71%
29%
8%
37%
25%
30%
2%
18%
16%
10%
11%
16%
13%
14%
16%
35%
17%
22%
8%
3%
49%
43%
0% 20% 40% 60% 80% 100%
YesNo
YesNo
Council District 1Council District 2Council District 3
Outside of the City
Less than 1 year1-5 years
6-10 years11-15 years16-20 years21-30 years31-40 years
More than 40 years
Myself only2 people3 people4 people5 people
6 or more
At least one person under the age of 18At least one person over the age of 55
Percent Responding
VOTE IN LAST GENERAL ELECTION
LIVE WITHIN CITY LIMITS
LOCATION OF RESIDENCE
HOUSEHOLD COMPOSITION
LENGTH OF TIME LIVED IN CITY
Figure 12: Household Information
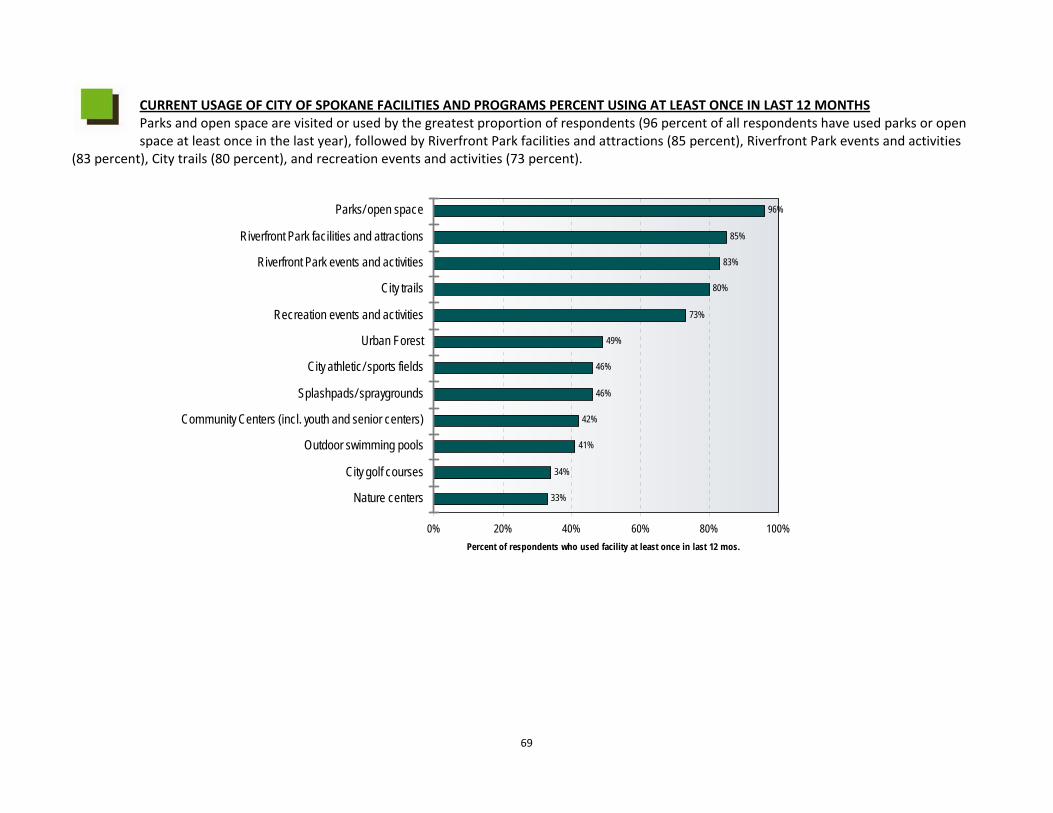
69
CURRENT USAGE OF CITY OF SPOKANE FACILITIES AND PROGRAMS PERCENT USING AT LEAST ONCE IN LAST 12 MONTHS Parks and open space are visited or used by the greatest proportion of respondents (96 percent of all respondents have used parks or open space at least once in the last year), followed by Riverfront Park facilities and attractions (85 percent), Riverfront Park events and activities
(83 percent), City trails (80 percent), and recreation events and activities (73 percent).
96%
85%
83%
80%
73%
49%
46%
46%
42%
41%
34%
33%
0% 20% 40% 60% 80% 100%
Parks/ open space
Riverfront Park facilities and attractions
Riverfront Park events and activities
City trails
Recreation events and activities
Urban Forest
City athletic/ sports fields
Splashpads/ spraygrounds
Community Centers (incl. youth and senior centers)
Outdoor swimming pools
City golf courses
Nature centers
Percent of respondents who used facility at least once in last 12 mos.
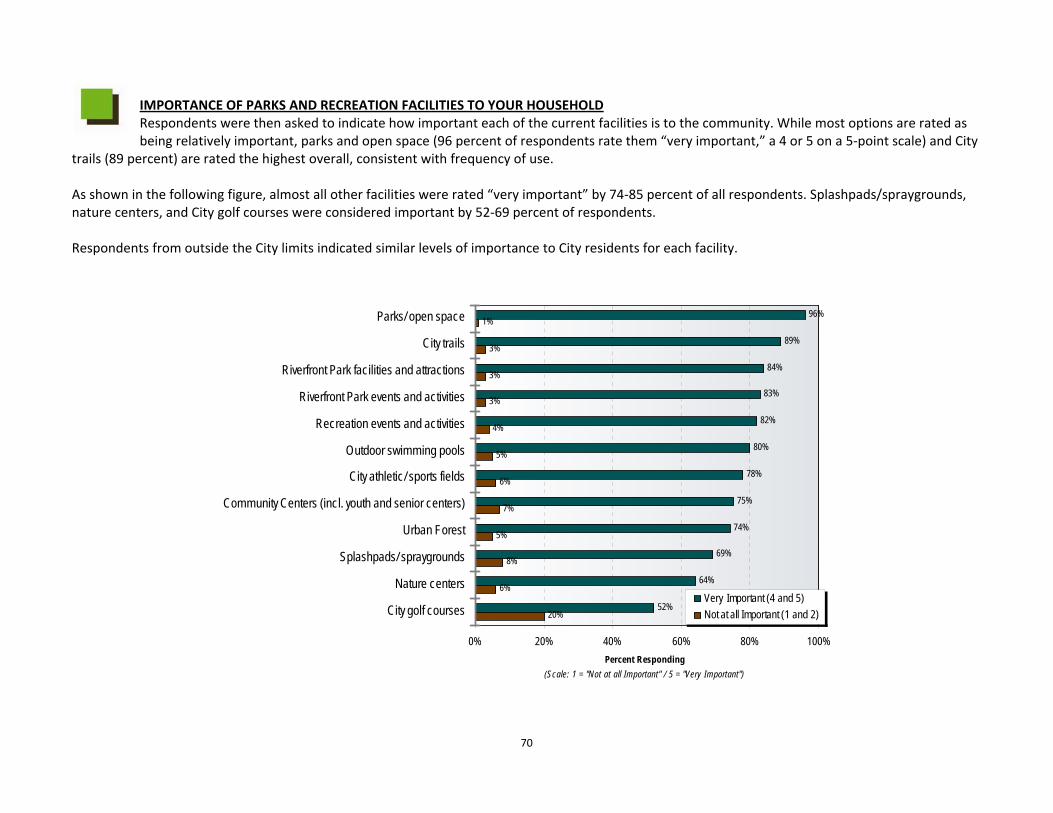
70
IMPORTANCE OF PARKS AND RECREATION FACILITIES TO YOUR HOUSEHOLD Respondents were then asked to indicate how important each of the current facilities is to the community. While most options are rated as being relatively important, parks and open space (96 percent of respondents rate them “very important,” a 4 or 5 on a 5‐point scale) and City
trails (89 percent) are rated the highest overall, consistent with frequency of use. As shown in the following figure, almost all other facilities were rated “very important” by 74‐85 percent of all respondents. Splashpads/spraygrounds, nature centers, and City golf courses were considered important by 52‐69 percent of respondents. Respondents from outside the City limits indicated similar levels of importance to City residents for each facility.
96%
89%
84%
83%
82%
80%
78%
75%
74%
69%
64%
52%
1%
3%
3%
3%
4%
5%
6%
7%
5%
8%
6%
20%
0% 20% 40% 60% 80% 100%
Parks/ open space
City trails
Riverfront Park facilities and attractions
Riverfront Park events and activities
Recreation events and activities
Outdoor swimming pools
City athletic/ sports fields
Community Centers (incl. youth and senior centers)
Urban Forest
Splashpads/ spraygrounds
Nature centers
City golf courses
Percent Responding(Scale: 1 = "Not at all Important" / 5 = "Very Important")
Very Important (4 and 5)Not at all Important (1 and 2)
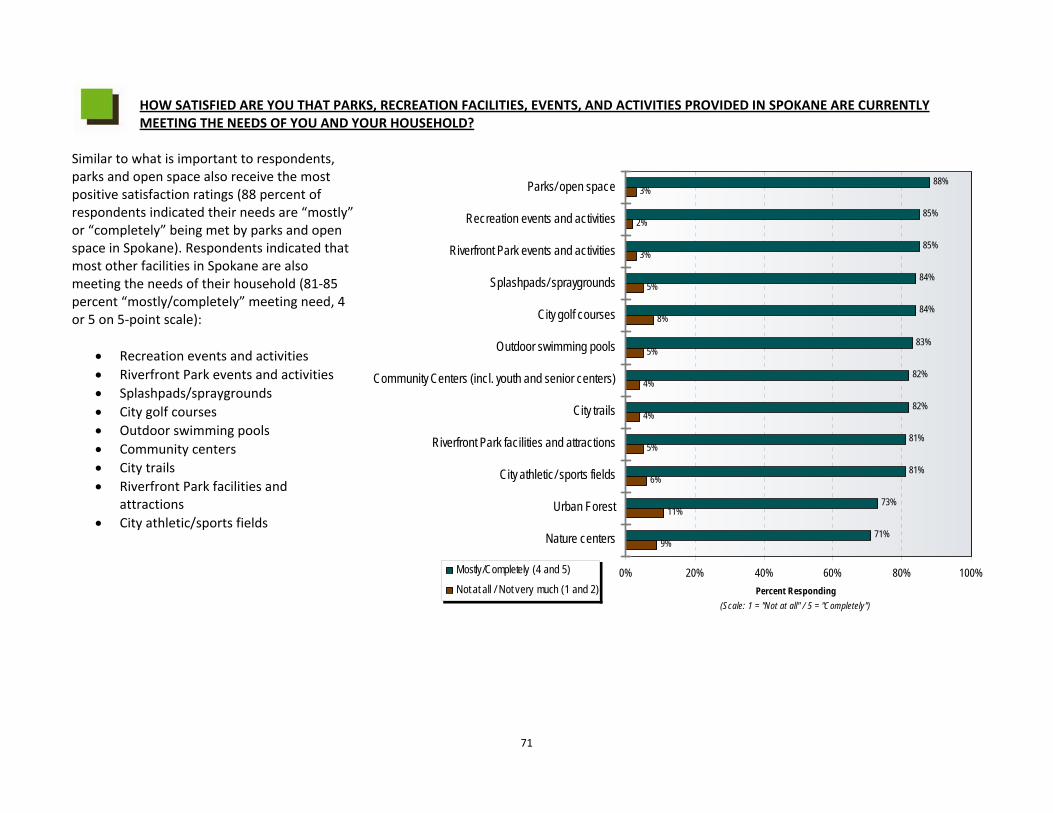
71
HOW SATISFIED ARE YOU THAT PARKS, RECREATION FACILITIES, EVENTS, AND ACTIVITIES PROVIDED IN SPOKANE ARE CURRENTLY MEETING THE NEEDS OF YOU AND YOUR HOUSEHOLD?
Similar to what is important to respondents, parks and open space also receive the most positive satisfaction ratings (88 percent of respondents indicated their needs are “mostly” or “completely” being met by parks and open space in Spokane). Respondents indicated that most other facilities in Spokane are also meeting the needs of their household (81‐85 percent “mostly/completely” meeting need, 4 or 5 on 5‐point scale):
• Recreation events and activities • Riverfront Park events and activities • Splashpads/spraygrounds • City golf courses • Outdoor swimming pools • Community centers • City trails • Riverfront Park facilities and
attractions • City athletic/sports fields
88%
85%
85%
84%
84%
83%
82%
82%
81%
81%
73%
71%
3%
2%
3%
5%
8%
5%
4%
4%
5%
6%
11%
9%
0% 20% 40% 60% 80% 100%
Parks/ open space
Recreation events and activities
Riverfront Park events and activities
Splashpads/ spraygrounds
City golf courses
Outdoor swimming pools
Community Centers (incl. youth and senior centers)
City trails
Riverfront Park facilities and attractions
City athletic/ sports fields
Urban Forest
Nature centers
Percent Responding(Scale: 1 = "Not at all" / 5 = "Completely")
Mostly/Completely (4 and 5)
Not at all / Not very much (1 and 2)
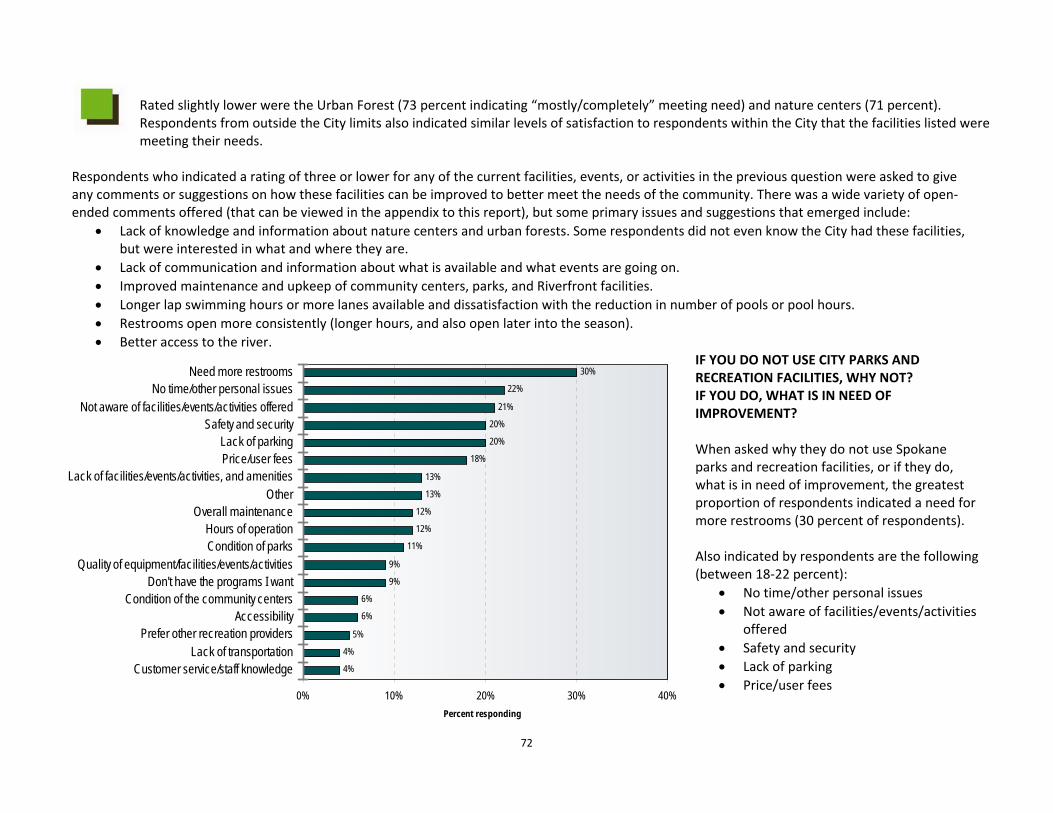
72
Rated slightly lower were the Urban Forest (73 percent indicating “mostly/completely” meeting need) and nature centers (71 percent). Respondents from outside the City limits also indicated similar levels of satisfaction to respondents within the City that the facilities listed were meeting their needs.
Respondents who indicated a rating of three or lower for any of the current facilities, events, or activities in the previous question were asked to give any comments or suggestions on how these facilities can be improved to better meet the needs of the community. There was a wide variety of open‐ended comments offered (that can be viewed in the appendix to this report), but some primary issues and suggestions that emerged include:
• Lack of knowledge and information about nature centers and urban forests. Some respondents did not even know the City had these facilities, but were interested in what and where they are.
• Lack of communication and information about what is available and what events are going on. • Improved maintenance and upkeep of community centers, parks, and Riverfront facilities. • Longer lap swimming hours or more lanes available and dissatisfaction with the reduction in number of pools or pool hours. • Restrooms open more consistently (longer hours, and also open later into the season). • Better access to the river.
IF YOU DO NOT USE CITY PARKS AND RECREATION FACILITIES, WHY NOT? IF YOU DO, WHAT IS IN NEED OF IMPROVEMENT? When asked why they do not use Spokane parks and recreation facilities, or if they do, what is in need of improvement, the greatest proportion of respondents indicated a need for more restrooms (30 percent of respondents). Also indicated by respondents are the following (between 18‐22 percent):
• No time/other personal issues • Not aware of facilities/events/activities
offered • Safety and security • Lack of parking • Price/user fees
30%
22%
21%
20%
20%
18%
13%
13%
12%
12%
11%
9%
9%
6%
6%
5%
4%
4%
0% 10% 20% 30% 40%
Need more restroomsNo time/other personal issues
Not aware of facilities/events/activities offeredSafety and security
Lack of parkingPrice/user fees
Lack of facilities/events/activities, and amenitiesOther
Overall maintenanceHours of operationCondition of parks
Quality of equipment/facilities/events/activitiesDon't have the programs I want
Condition of the community centersAccessibility
Prefer other recreation providersLack of transportation
Customer service/staff knowledge
Percent responding
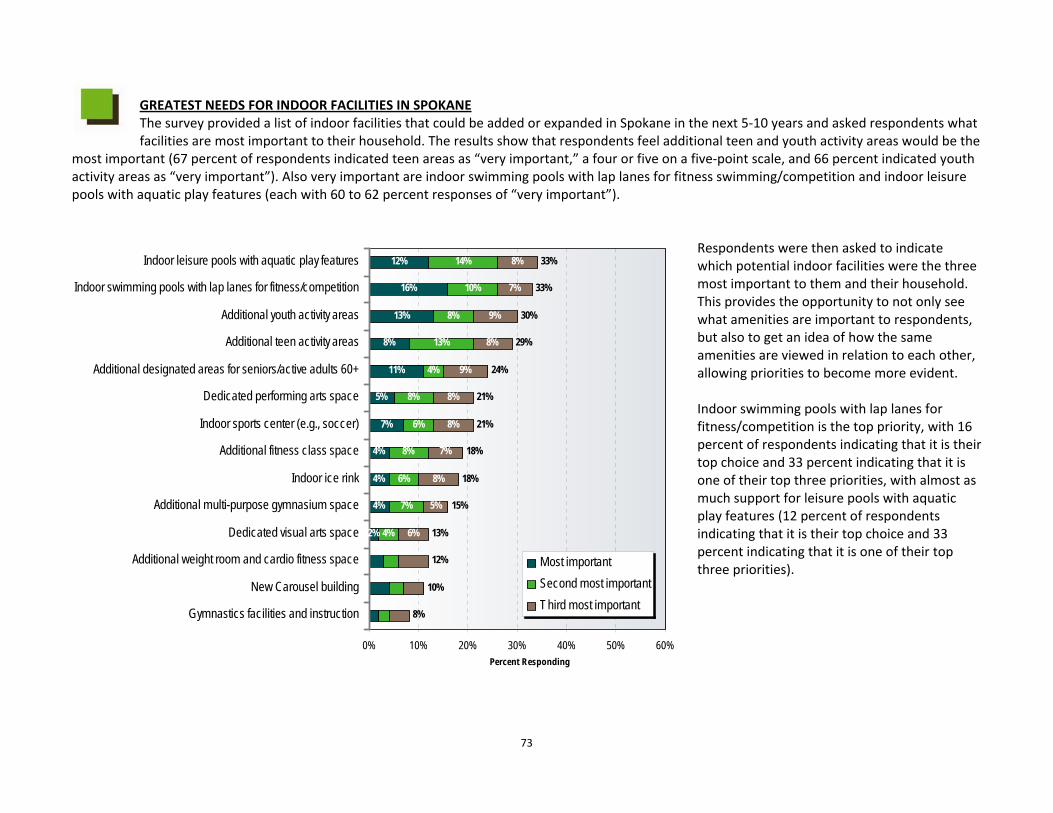
73
GREATEST NEEDS FOR INDOOR FACILITIES IN SPOKANE The survey provided a list of indoor facilities that could be added or expanded in Spokane in the next 5‐10 years and asked respondents what facilities are most important to their household. The results show that respondents feel additional teen and youth activity areas would be the
most important (67 percent of respondents indicated teen areas as “very important,” a four or five on a five‐point scale, and 66 percent indicated youth activity areas as “very important”). Also very important are indoor swimming pools with lap lanes for fitness swimming/competition and indoor leisure pools with aquatic play features (each with 60 to 62 percent responses of “very important”).
Respondents were then asked to indicate which potential indoor facilities were the three most important to them and their household. This provides the opportunity to not only see what amenities are important to respondents, but also to get an idea of how the same amenities are viewed in relation to each other, allowing priorities to become more evident. Indoor swimming pools with lap lanes for fitness/competition is the top priority, with 16 percent of respondents indicating that it is their top choice and 33 percent indicating that it is one of their top three priorities, with almost as much support for leisure pools with aquatic play features (12 percent of respondents indicating that it is their top choice and 33 percent indicating that it is one of their top three priorities).
12%
16%
13%
8%
11%
5%
7%
4%
4%
4%
2%
14%
10%
8%
13%
4%
8%
6%
8%
6%
7%
4%
8%
7%
9%
8%
9%
8%
8%
7%
8%
5%
6%
33%
33%
30%
29%
24%
21%
21%
18%
18%
15%
13%
12%
10%
8%
0% 10% 20% 30% 40% 50% 60%
Indoor leisure pools with aquatic play features
Indoor swimming pools with lap lanes for fitness/competition
Additional youth activity areas
Additional teen activity areas
Additional designated areas for seniors/active adults 60+
Dedicated performing arts space
Indoor sports center (e.g., soccer)
Additional fitness class space
Indoor ice rink
Additional multi-purpose gymnasium space
Dedicated visual arts space
Additional weight room and cardio fitness space
New Carousel building
Gymnastics facilities and instruction
Percent Responding
Most importantSecond most importantThird most important
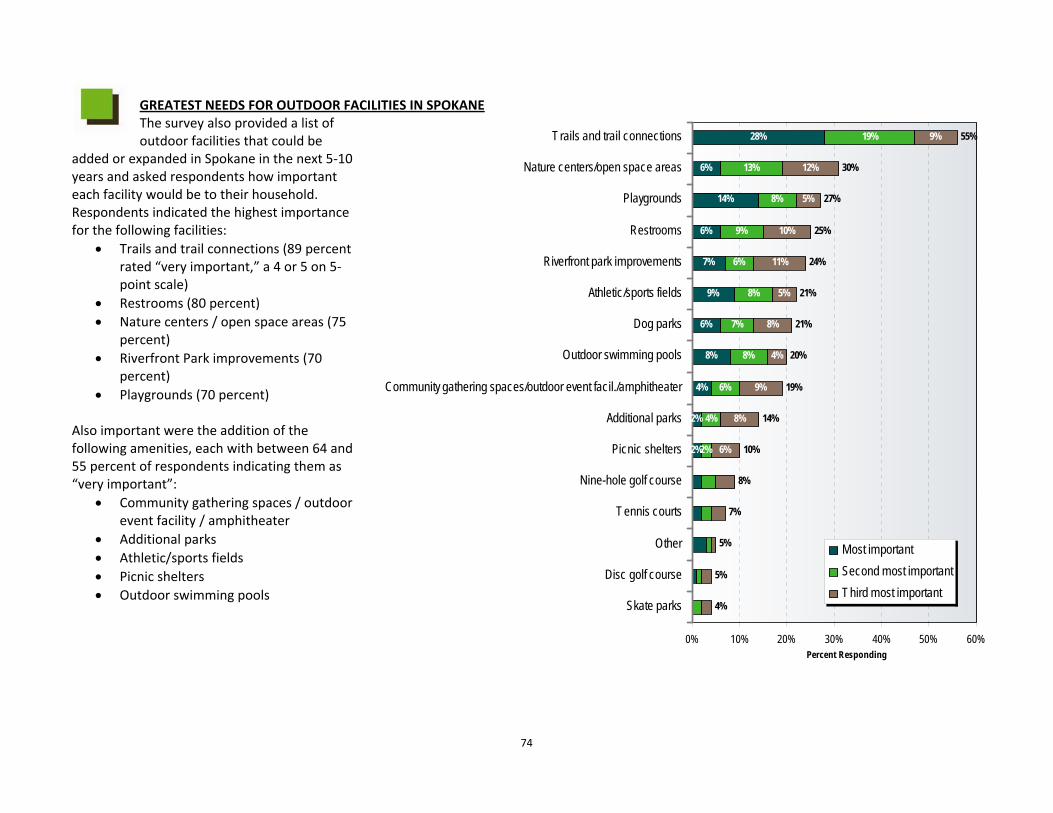
74
GREATEST NEEDS FOR OUTDOOR FACILITIES IN SPOKANE The survey also provided a list of outdoor facilities that could be
added or expanded in Spokane in the next 5‐10 years and asked respondents how important each facility would be to their household. Respondents indicated the highest importance for the following facilities:
• Trails and trail connections (89 percent rated “very important,” a 4 or 5 on 5‐point scale)
• Restrooms (80 percent) • Nature centers / open space areas (75
percent) • Riverfront Park improvements (70
percent) • Playgrounds (70 percent)
Also important were the addition of the following amenities, each with between 64 and 55 percent of respondents indicating them as “very important”:
• Community gathering spaces / outdoor event facility / amphitheater
• Additional parks • Athletic/sports fields • Picnic shelters • Outdoor swimming pools
28%
6%
14%
6%
7%
9%
6%
8%
4%
2%
2%
19%
13%
8%
9%
6%
8%
7%
8%
6%
4%
2%
9%
12%
5%
10%
11%
5%
8%
4%
9%
8%
6%
55%
30%
27%
25%
24%
21%
21%
20%
19%
14%
10%
8%
7%
5%
5%
4%
0% 10% 20% 30% 40% 50% 60%
Trails and trail connections
Nature centers/open space areas
Playgrounds
Restrooms
Riverfront park improvements
Athletic/sports fields
Dog parks
Outdoor swimming pools
Community gathering spaces/outdoor event facil./amphitheater
Additional parks
Picnic shelters
Nine-hole golf course
Tennis courts
Other
Disc golf course
Skate parks
Percent Responding
Most importantSecond most importantThird most important
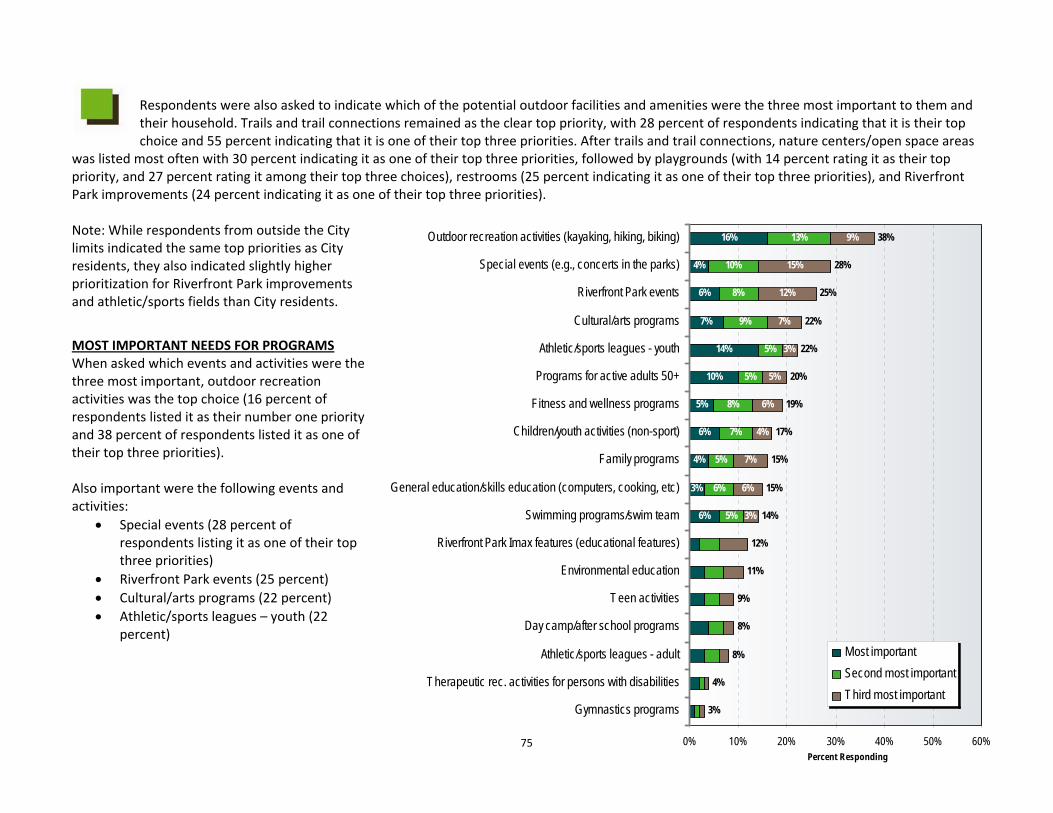
75
Respondents were also asked to indicate which of the potential outdoor facilities and amenities were the three most important to them and their household. Trails and trail connections remained as the clear top priority, with 28 percent of respondents indicating that it is their top choice and 55 percent indicating that it is one of their top three priorities. After trails and trail connections, nature centers/open space areas
was listed most often with 30 percent indicating it as one of their top three priorities, followed by playgrounds (with 14 percent rating it as their top priority, and 27 percent rating it among their top three choices), restrooms (25 percent indicating it as one of their top three priorities), and Riverfront Park improvements (24 percent indicating it as one of their top three priorities). Note: While respondents from outside the City limits indicated the same top priorities as City residents, they also indicated slightly higher prioritization for Riverfront Park improvements and athletic/sports fields than City residents.
MOST IMPORTANT NEEDS FOR PROGRAMS When asked which events and activities were the three most important, outdoor recreation activities was the top choice (16 percent of respondents listed it as their number one priority and 38 percent of respondents listed it as one of their top three priorities). Also important were the following events and activities:
• Special events (28 percent of respondents listing it as one of their top three priorities)
• Riverfront Park events (25 percent) • Cultural/arts programs (22 percent) • Athletic/sports leagues – youth (22
percent)
16%
4%
6%
7%
14%
10%
5%
6%
4%
3%
6%
13%
10%
8%
9%
5%
5%
8%
7%
5%
6%
5%
9%
15%
12%
7%
3%
5%
6%
4%
7%
6%
3%
38%
28%
25%
22%
22%
20%
19%
17%
15%
15%
14%
12%
11%
9%
8%
8%
4%
3%
0% 10% 20% 30% 40% 50% 60%
Outdoor recreation activities (kayaking, hiking, biking)
Special events (e.g., concerts in the parks)
Riverfront Park events
Cultural/arts programs
Athletic/sports leagues - youth
Programs for active adults 50+
Fitness and wellness programs
Children/youth activities (non-sport)
Family programs
General education/skills education (computers, cooking, etc)
Swimming programs/swim team
Riverfront Park Imax features (educational features)
Environmental education
Teen activities
Day camp/after school programs
Athletic/sports leagues - adult
Therapeutic rec. activities for persons with disabilities
Gymnastics programs
Percent Responding
Most importantSecond most importantThird most important
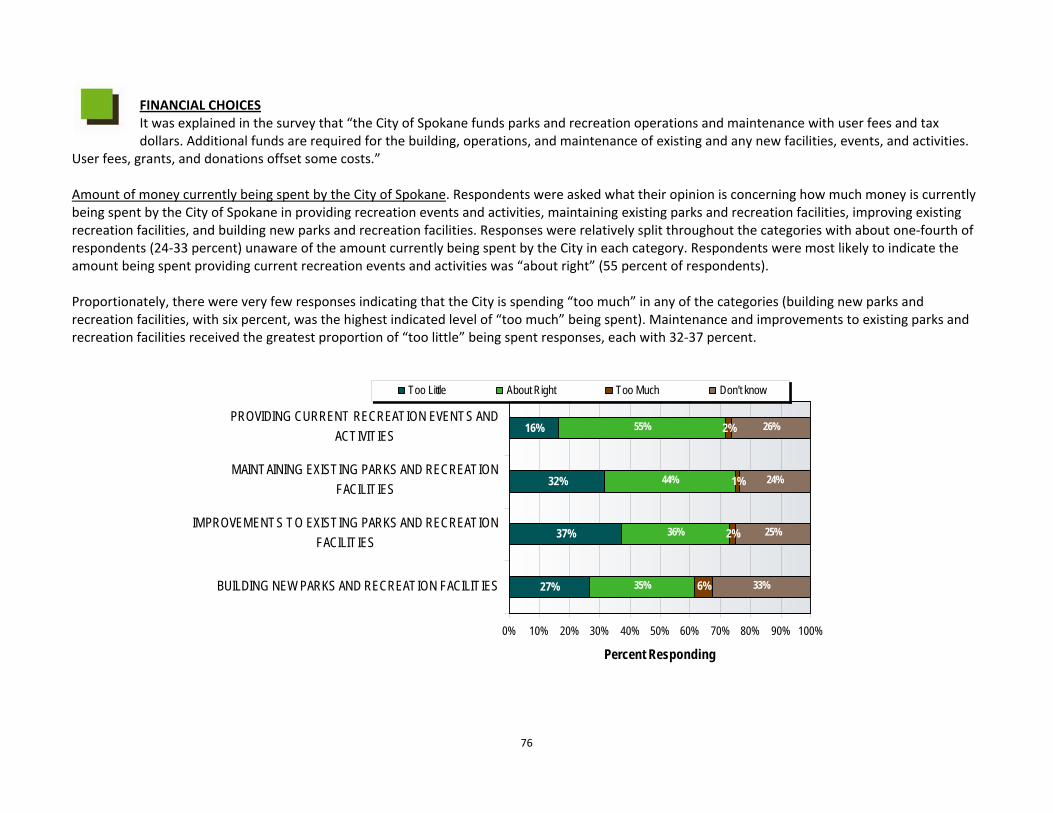
76
FINANCIAL CHOICES It was explained in the survey that “the City of Spokane funds parks and recreation operations and maintenance with user fees and tax dollars. Additional funds are required for the building, operations, and maintenance of existing and any new facilities, events, and activities.
User fees, grants, and donations offset some costs.” Amount of money currently being spent by the City of Spokane. Respondents were asked what their opinion is concerning how much money is currently being spent by the City of Spokane in providing recreation events and activities, maintaining existing parks and recreation facilities, improving existing recreation facilities, and building new parks and recreation facilities. Responses were relatively split throughout the categories with about one‐fourth of respondents (24‐33 percent) unaware of the amount currently being spent by the City in each category. Respondents were most likely to indicate the amount being spent providing current recreation events and activities was “about right” (55 percent of respondents). Proportionately, there were very few responses indicating that the City is spending “too much” in any of the categories (building new parks and recreation facilities, with six percent, was the highest indicated level of “too much” being spent). Maintenance and improvements to existing parks and recreation facilities received the greatest proportion of “too little” being spent responses, each with 32‐37 percent.
16%
32%
37%
27%
55%
44%
36%
35%
2%
1%
2%
26%
24%
25%
33%6%
0% 10% 20% 30% 40% 50% 60% 70% 80% 90% 100%
PROVIDING CURRENT RECREATION EVENTS ANDACTIVIT IES
MAINTAINING EXISTING PARKS AND RECREATIONFACILIT IES
IMPROVEMENTS TO EXISTING PARKS AND RECREATIONFACILIT IES
BUILDING NEW PARKS AND RECREATION FACILIT IES
Percent Responding
Too Little About Right Too Much Don't know
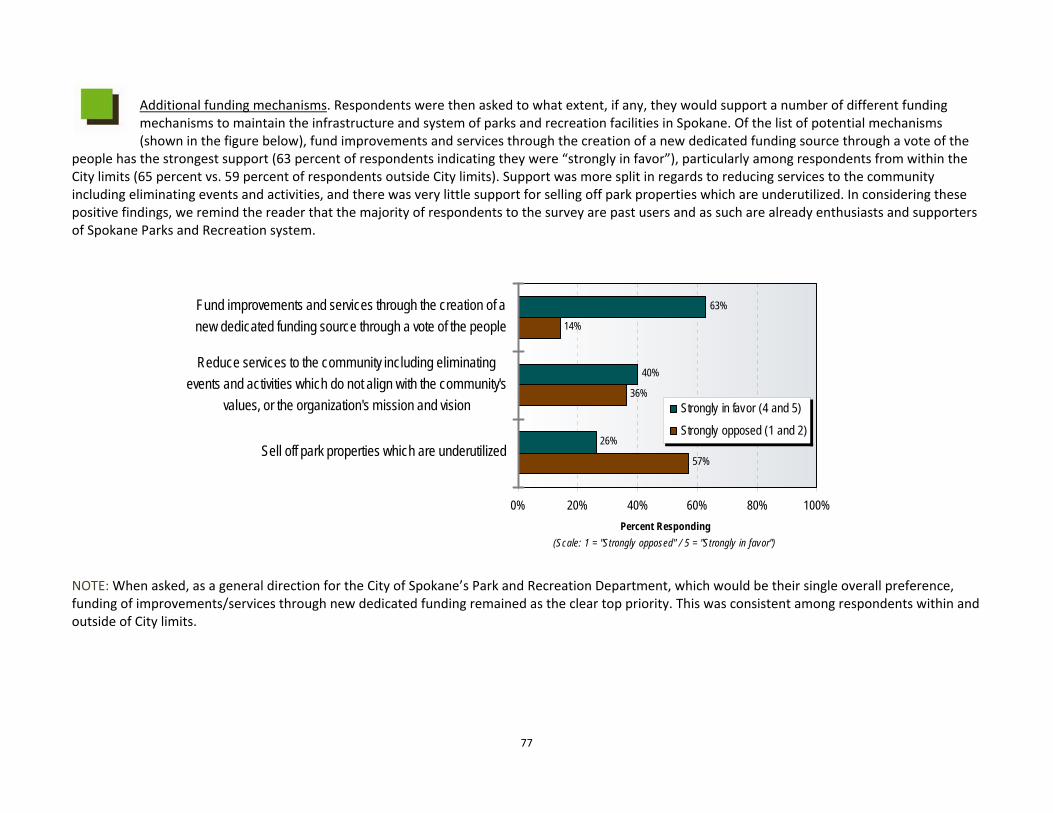
77
Additional funding mechanisms. Respondents were then asked to what extent, if any, they would support a number of different funding mechanisms to maintain the infrastructure and system of parks and recreation facilities in Spokane. Of the list of potential mechanisms (shown in the figure below), fund improvements and services through the creation of a new dedicated funding source through a vote of the
people has the strongest support (63 percent of respondents indicating they were “strongly in favor”), particularly among respondents from within the City limits (65 percent vs. 59 percent of respondents outside City limits). Support was more split in regards to reducing services to the community including eliminating events and activities, and there was very little support for selling off park properties which are underutilized. In considering these positive findings, we remind the reader that the majority of respondents to the survey are past users and as such are already enthusiasts and supporters of Spokane Parks and Recreation system.
NOTE: When asked, as a general direction for the City of Spokane’s Park and Recreation Department, which would be their single overall preference, funding of improvements/services through new dedicated funding remained as the clear top priority. This was consistent among respondents within and outside of City limits.
63%
40%
26%
14%
36%
57%
0% 20% 40% 60% 80% 100%
Fund improvements and services through the creation of anew dedicated funding source through a vote of the people
Reduce services to the community including eliminatingevents and activities which do not align with the community's
values, or the organization's mission and vision
Sell off park properties which are underutilized
Percent Responding(Scale: 1 = "Strongly opposed" / 5 = "Strongly in favor")
Strongly in favor (4 and 5)
Strongly opposed (1 and 2)
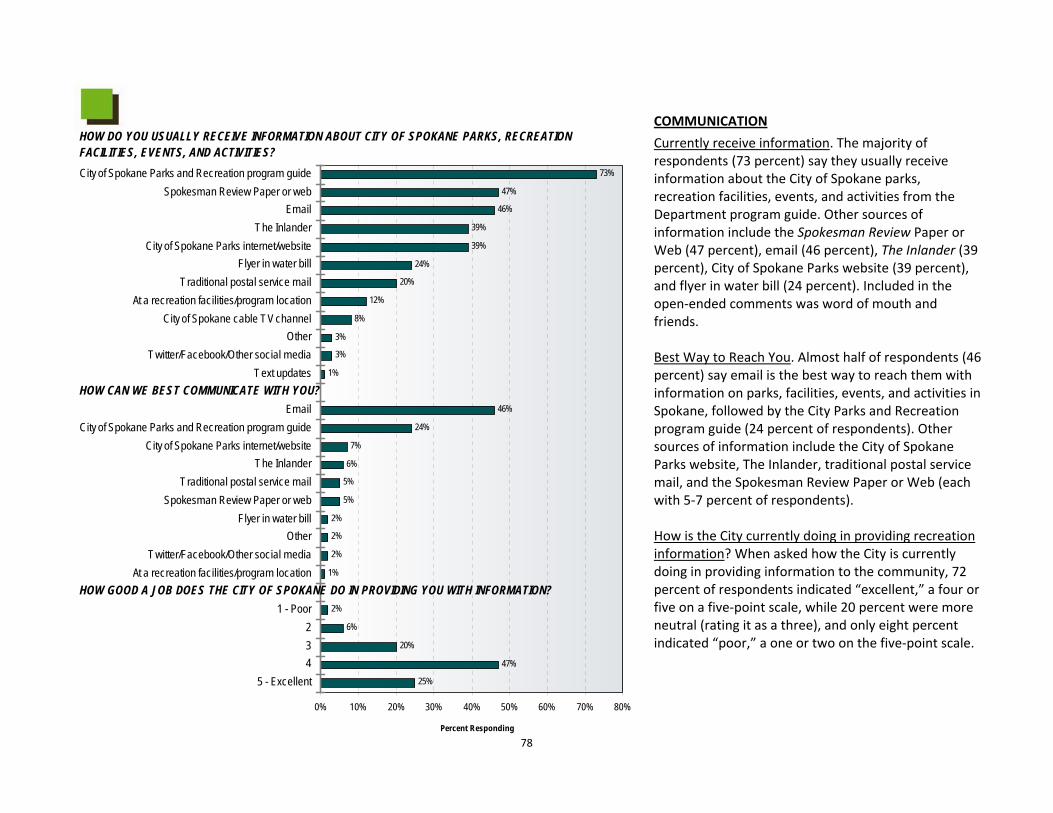
78
COMMUNICATION
Currently receive information. The majority of respondents (73 percent) say they usually receive information about the City of Spokane parks, recreation facilities, events, and activities from the Department program guide. Other sources of information include the Spokesman Review Paper or Web (47 percent), email (46 percent), The Inlander (39 percent), City of Spokane Parks website (39 percent), and flyer in water bill (24 percent). Included in the open‐ended comments was word of mouth and friends. Best Way to Reach You. Almost half of respondents (46 percent) say email is the best way to reach them with information on parks, facilities, events, and activities in Spokane, followed by the City Parks and Recreation program guide (24 percent of respondents). Other sources of information include the City of Spokane Parks website, The Inlander, traditional postal service mail, and the Spokesman Review Paper or Web (each with 5‐7 percent of respondents). How is the City currently doing in providing recreation information? When asked how the City is currently doing in providing information to the community, 72 percent of respondents indicated “excellent,” a four or five on a five‐point scale, while 20 percent were more neutral (rating it as a three), and only eight percent indicated “poor,” a one or two on the five‐point scale.
73%
47%
46%
39%
39%
24%
20%
12%
8%
3%
3%
1%
46%
24%
7%
6%
5%
5%
2%
2%
2%
1%
2%
6%
20%
47%
25%
0% 10% 20% 30% 40% 50% 60% 70% 80%
City of Spokane Parks and Recreation program guideSpokesman Review Paper or web
EmailThe Inlander
City of Spokane Parks internet/websiteFlyer in water bill
Traditional postal service mailAt a recreation facilities/program location
City of Spokane cable TV channelOther
Twitter/Facebook/Other social mediaText updates
EmailCity of Spokane Parks and Recreation program guide
City of Spokane Parks internet/websiteThe Inlander
Traditional postal service mailSpokesman Review Paper or web
Flyer in water billOther
Twitter/Facebook/Other social mediaAt a recreation facilities/program location
1 - Poor234
5 - Excellent
Percent Responding
HOW DO YOU USUALLY RECEIVE INFORMATION ABOUT CITY OF SPOKANE PARKS, RECREATION FACILITIES, EVENTS, AND ACTIVITIES?
HOW CAN WE BEST COMMUNICATE WITH YOU?
HOW GOOD A JOB DOES THE CITY OF SPOKANE DO IN PROVIDING YOU WITH INFORMATION?
79
Key Community Issues and Interests Considerations
• Most who attend or participate in forums/surveys tend to have a special interest. An on‐going challenge for public organizations is engaging as many community members with varying interests as possible in public processes to develop a global sense of community issues and interests.
• Identified community issues were consistently heard and observed in all engagement efforts including public forums, focus groups, interviews and questionnaires, as well as reports generated by Spokane community organizations such as Spokane Public Schools and the Spokane Regional Health District and others. The Department’s focus may be on how services can affect, influence or impact community issues as they cannot be solely responsible for satisfying or resolving issues independent of other organizations.
• According to survey data, parks and trails are the most important service the Department provides and have the highest current use and satisfaction rates amongst those surveyed.
• According to survey data, the greatest future need for outdoor facilities are trails and trail connections. • According to survey data, outdoor recreation is the primary recreation interest among survey respondents. • According to survey data, the greatest future need for indoor facilities is indoor aquatics facilities. • According to survey data, a dedicated funding source would be the preferred method for future parks and recreation funding including how best
to address the Department’s current deferred maintenance.

Parks & Recreation Services – Evaluation & Analysis
Answers the questions…Q: What services should the City of Spokane Parks and Recreation Department be in the business of providing?Q: Do parks and recreation services align with the values of the community?Q: What other providers are providing similar or like parks and recreation services?Q: Are existing services financially viable in the immediate and projected longer-term? Q: What is the “market position” for each parks and recreation service?Q: Where are the current parks and recreation related physical properties in relation to the population?Q: Where are the gaps in parks and recreation services in relation to the current and projected Spokane population?

83
Parks & Recreation Policy Framework
Comprehensive Plan The City of Spokane Comprehensive Plan provides the policy framework for parks and recreation services. The Comprehensive Plan, initially adopted in 2001, was updated in 2006 as a response to the Washington State Growth Management Act (GMA). The GMA identifies the following Open Space and Recreation goal:
“Retain open space, enhance recreational opportunities, conserve fish and wildlife habitat, increase access to natural resource lands and water, and develop parks and recreation facilities.”
The Parks, Recreation, and Open Spaces Chapter 12 of the Comprehensive Plan addresses goals and policies dealing with: preservation and conservation, parks and open space system, bicycle and pedestrian circulation, park preventative maintenance program, recreation program, agency coordination and cooperation, and service quality. As a result of this Roadmap to the Future project, some revisions to this chapter of the Comprehensive Plan have been proposed and are addressed in a separate document. Other parks and open space related chapters of the City of Spokane’s Comprehensive Plan include: Natural Environment – Chapter 9 and Neighborhoods – Chapter 11. Other Plans While there are many Spokane plans, the following two plans are highlighted due to their specific policy implications and impact on the Parks and Recreation Department. Shoreline Master Program Update The Shoreline Restoration Plan (July 2008) identifies policies and site specific opportunities for restoring the Spokane River and Latah Creek shoreline within the Spokane city limits. The development of this plan was mandated by the Washington State Shoreline Management Act in order to maintain and improve the overall condition of habitat and resources of important shorelines within the state. The Parks and Recreation Department owns a lot of park property within the shoreline. Shoreline topics pertaining to these properties include providing river access for kayaking, rafting, and fishing; managing incompatible uses; and identifying resources for shoreline restoration and maintenance.
84
Spokane County Regional Trails Plan The Spokane County Regional Trails Plan (2008) provides a countywide framework for trails planning. The plan identifies several policies
under the following goals: • Develop a comprehensive, interconnected system of trails that will serve as vital components of our region’s transportation and recreation
network. • Ensure adequate maintenance of the region’s trail system. • Ensure that road and trails standards for new construction incorporate safe, efficient and ecologically sound provisions for development of
regional trails. • Promote the regional trail system as an economic tool to promote tourism and for its contribution to active, healthy living.
The plan details specific trail strategies that include:
• Centennial Trail Improvements • Fish Lake Trail Connection • Urban Connections • Rails to Trails • Connecting Parks and Neighborhoods
The City developed the Fish Lake Trail in southwest Spokane, owns and maintains the Ben Burr Trail, and participates in the maintenance of the regional Centennial Trail. There are also several loop trails within parks in Spokane.
Parks and Recreation Service Assessment An assessment of parks and recreation services allows for an intensive review of all organizational services including recreation activities, events, and facilities, and physical properties including parks. The assessment inevitably leads to the development of the agency’s Service Portfolio illustrating each service and recommended operational strategies. Results of the assessment process indicate whether a Department service is “core to the organization’s values and vision,” and provides provision (operational) strategies that can include, but are not limited to enhancement of service (advance market position); reduction of service (divestment); or collaboration. This assessment begins to provide a nexus relative to which services are central to the organization’s purpose. The process includes an analysis of each service’s relevance and alignment with the organization’s values and vision; the organization’s position in the community relative to target market; other service providers in the service area including quantity and quality of provider; and the economic viability of the service. Ultimately, this assessment also provides most insights into the development of the organization’s mission statement (mission statements tend to be determined in advance of assessing services – this premature approach does not allow the organization the information necessary then to be able to define an accurate statement).
85
Service Assessment Matrix Based on the MacMillan Matrix for Competitive Analysis of Programs1, the Service Assessment Matrix is an extraordinarily valuable tool that
is specifically adapted to help public agencies assess their services. The MacMillan Matrix realized significant success in the non‐profit environment and has led to application in the public sector. The Service Assessment is based on the assumption that duplication of existing comparable services (unnecessary competition) among public and non‐profit organizations can fragment limited resources available, leaving all providers too weak to increase the quality and cost‐effectiveness of customer services. This is also true for public agencies. The Service Assessment assumes that trying to be all things to all people can result in mediocre or low‐quality service. Instead, agencies should focus on delivering higher‐quality service in a more focused (and perhaps limited) way. The Matrix helps organizations think about some very pragmatic questions such as:
Q: Is the agency the best or most appropriate organization to provide the service? Q: Is the agency spreading its resources too thin without the capacity to sustain core services and the system in general? Q: Are there opportunities to work with another organization to provide services in a more efficient and responsible manner?
Public agencies have not traditionally been thought of as organizations needing to be competitively oriented. Unlike private and commercial enterprises which compete for customers and whose very survival depends on satisfying paying customers, many public and non‐profit organizations operate in a non‐market, or grants economy – one in which services may not be commercially viable. In other words, the marketplace may not supply sufficient and adequate resources.
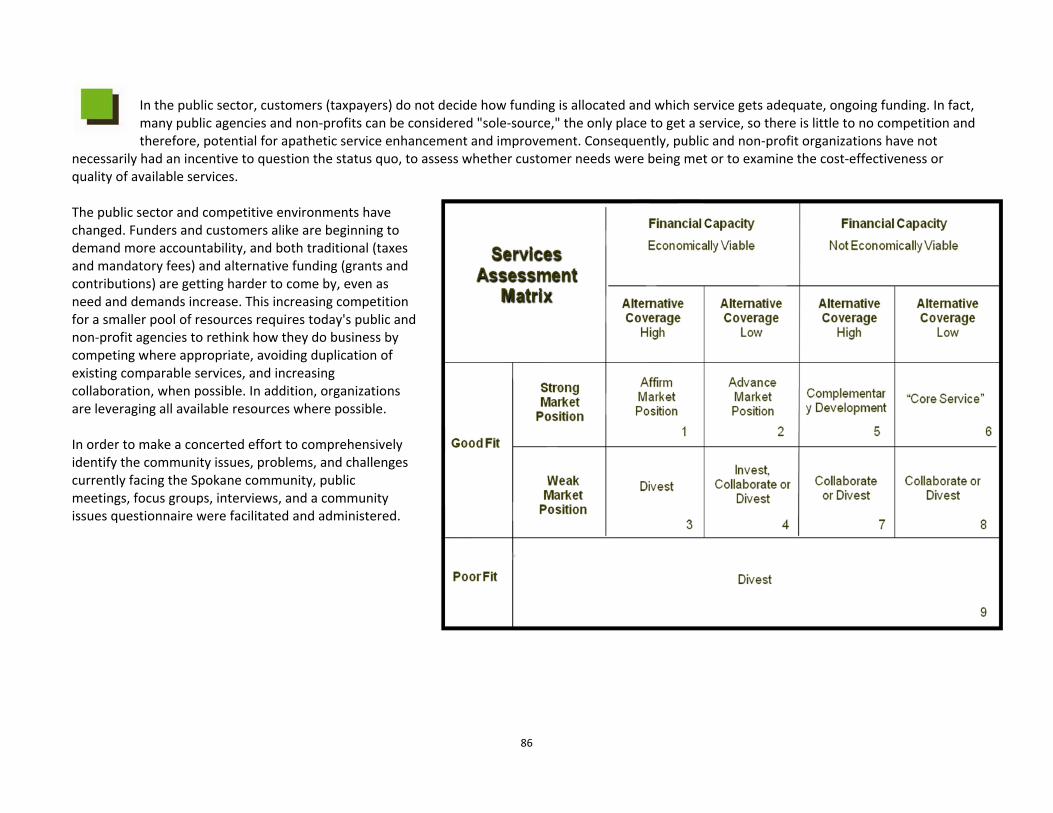
86
In the public sector, customers (taxpayers) do not decide how funding is allocated and which service gets adequate, ongoing funding. In fact, many public agencies and non‐profits can be considered "sole‐source," the only place to get a service, so there is little to no competition and therefore, potential for apathetic service enhancement and improvement. Consequently, public and non‐profit organizations have not
necessarily had an incentive to question the status quo, to assess whether customer needs were being met or to examine the cost‐effectiveness or quality of available services. The public sector and competitive environments have changed. Funders and customers alike are beginning to demand more accountability, and both traditional (taxes and mandatory fees) and alternative funding (grants and contributions) are getting harder to come by, even as need and demands increase. This increasing competition for a smaller pool of resources requires today's public and non‐profit agencies to rethink how they do business by competing where appropriate, avoiding duplication of existing comparable services, and increasing collaboration, when possible. In addition, organizations are leveraging all available resources where possible. In order to make a concerted effort to comprehensively identify the community issues, problems, and challenges currently facing the Spokane community, public meetings, focus groups, interviews, and a community issues questionnaire were facilitated and administered.
87
Service Assessment – The Process The Service Assessment process included a series of staff workshops designed to teach staff about the assessment itself, and have staff filter
all organizational services through a series of questions, that were held November 30 through December 3, 2010. The process began with an all staff workshop to inform and educate staff about the assessment process and concluded with an all staff meeting to review and de‐brief the assessment process, addressing any questions or comments. Between the all staff workshop and meeting were four separate workshops designed for each of the four major work units of the Department (golf, recreation, Riverfront Park, and parks). During the four work unit workshops, staff was instructed to filter each of their area services by addressing the following: Fit Fit is the degree to which a service aligns with the agency’s values and vision, reflecting the community’s interests. If a service aligns with the agency’s values and vision, and it contributes to the overall enhancement of the community, it is classified as “good fit.” If not, the service is considered a “poor fit.”
• Does the service align with agency values and vision? • Does the service provide community‐wide return on investment ( i.e., community, individual, environmental, or economic benefits and
outcomes that align with agency values such as crime prevention, improved health and well‐being, enhancement of property values)? Financial Capacity Financial Capacity is the degree to which a service (including a program, facility or land asset is currently or potentially attractive as an investment of current and future resources to an agency from an economic perspective. No program should be classified as “highly attractive” unless it is ranked as attractive on a substantial majority of the criteria below.
• Does the service have the capacity to sustain itself (break even) independent of General Fund or taxpayer subsidy/support? • Can the service reasonably generate at least 50% of costs from fees and charges? • Can the service reasonably generate excess revenues over direct expenditures through the assessment of fees and charges? • Are there consistent and stable alternative funding sources such as donations, sponsorships, grants and/or volunteer contributions for this
service? • Can the service reasonably generate at least 50% of the costs of service from alternative funding sources? • Is there demand for this service from a significant/large portion of the service’s target market? • Can the user self‐direct or operate/maintain the service without agency support?
88
Market Position Market Position is the degree to which the organization has a stronger capability and potential to deliver the service than other agencies – a combination of the agency’s effectiveness, quality, credibility, and market share dominance. No service should be classified as being in a
“strong market position” unless it has some clear basis for declaring superiority over all providers in that service category and is ranked as affirmative on a substantial majority of the criteria below.
• Does the agency have the adequate resources necessary to effectively operate and maintain the service? • Is the service provided at a convenient or good location in relation to the target market? • Does the agency have a superior track record of quality service delivery? • Does the agency own a large share of the target market currently served? • Is the agency currently gaining momentum or growing its customer base in relation to other providers? (e.g., Is there a consistent waiting list for
the service? • Can you clearly define the community, individual, environmental, and/or economic benefits realized as a result of the service? • Does agency staff have superior technical skills needed for quality service delivery? • Does the agency have the ability to conduct necessary research, pre and post participation assessments, and/or properly monitor and evaluate
service performance therefore justifying the agency’s continued provision of the service? (Benchmarking performance or impact to community issues, values, or vision)
• Are marketing efforts and resources effective in reaching and engaging the target market? Alternative Coverage Alternative Coverage is the extent to which like or similar services are provided in the service area to meet customer demand and need. If there are no other large (significant), or very few small agencies producing or providing comparable services in the same region or service area, the service should be classified as "low coverage." Otherwise, coverage is "high." An abbreviated example of a portion of the Parks Service Portfolio (a few services within District 1) is illustrated below. Please note that each Service Portfolio is a comprehensive management tool which includes results of the financial resource allocation work (i.e., cost recovery goals) which was conducted later in the process and detailed in the next section of this report.
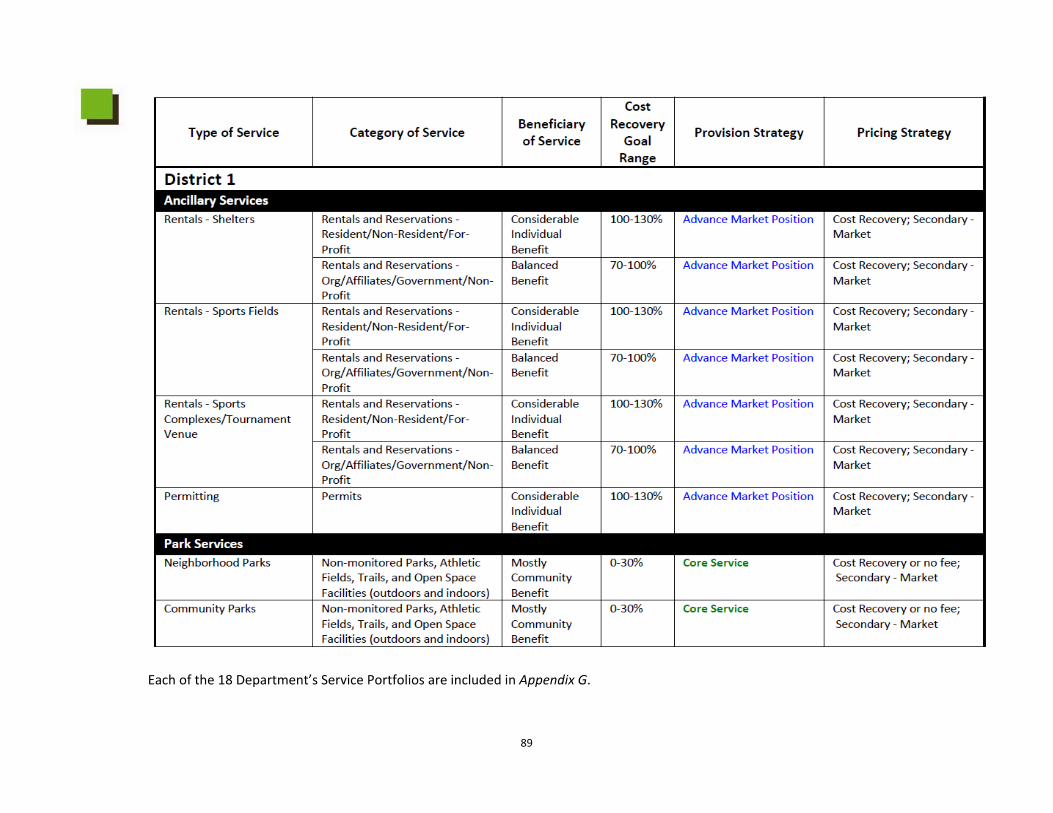
89
Each of the 18 Department’s Service Portfolios are included in Appendix G.
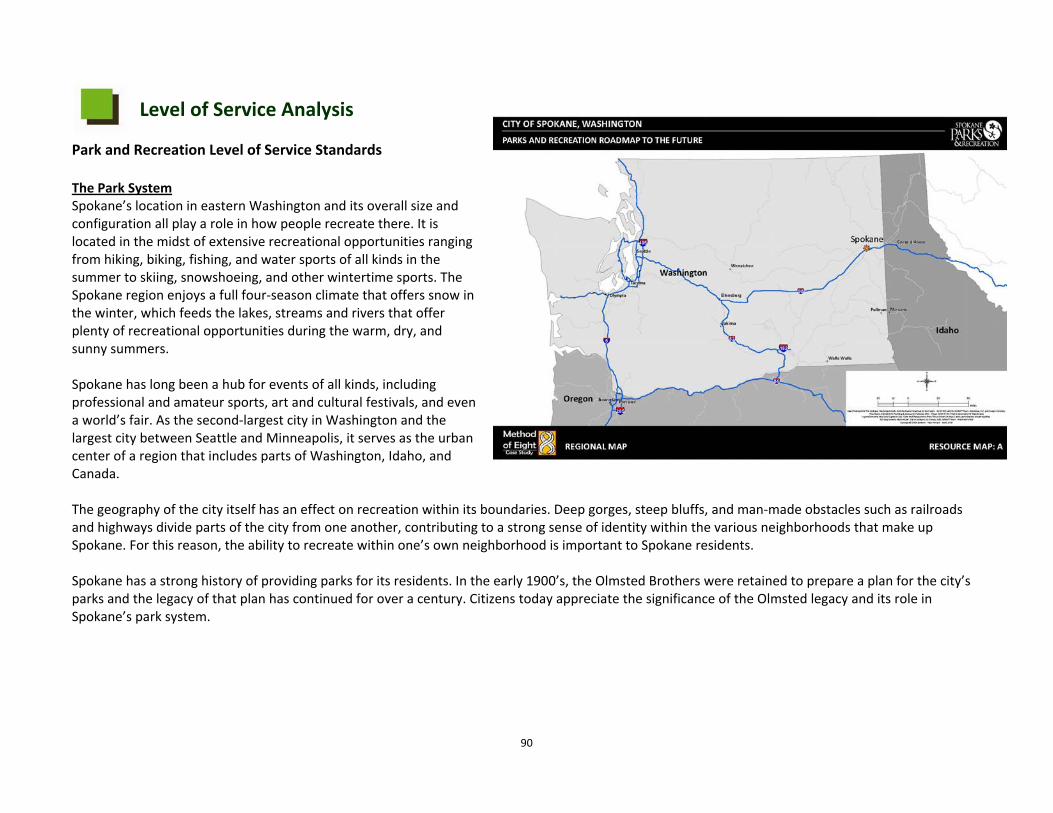
90
Level of Service Analysis
Park and Recreation Level of Service Standards The Park System Spokane’s location in eastern Washington and its overall size and configuration all play a role in how people recreate there. It is located in the midst of extensive recreational opportunities ranging from hiking, biking, fishing, and water sports of all kinds in the summer to skiing, snowshoeing, and other wintertime sports. The Spokane region enjoys a full four‐season climate that offers snow in the winter, which feeds the lakes, streams and rivers that offer plenty of recreational opportunities during the warm, dry, and sunny summers. Spokane has long been a hub for events of all kinds, including professional and amateur sports, art and cultural festivals, and even a world’s fair. As the second‐largest city in Washington and the largest city between Seattle and Minneapolis, it serves as the urban center of a region that includes parts of Washington, Idaho, and Canada. The geography of the city itself has an effect on recreation within its boundaries. Deep gorges, steep bluffs, and man‐made obstacles such as railroads and highways divide parts of the city from one another, contributing to a strong sense of identity within the various neighborhoods that make up Spokane. For this reason, the ability to recreate within one’s own neighborhood is important to Spokane residents. Spokane has a strong history of providing parks for its residents. In the early 1900’s, the Olmsted Brothers were retained to prepare a plan for the city’s parks and the legacy of that plan has continued for over a century. Citizens today appreciate the significance of the Olmsted legacy and its role in Spokane’s park system.

91
Level of Service Levels of Service (LOS) are typically defined in parks and recreation plans as the capacity of the system’s components to meet the needs of the public. The traditional method used in parks and recreation planning is to compare the quantity or capacity of various elements within
the park and recreation system to the population it is intended to serve. Traditional methods also include an analysis of the distribution of elements across the system to determine the proximity of those elements to the intended service population. For this planning study, an enhanced tool was utilized to examine Levels of Service (LOS) in a more detailed and sophisticated way. This tool uses computer technology to allow the elements of the park and recreation system to be looked at in greater detail than traditionally used. The park and recreation system can be broken into smaller components and more detailed information about these can be incorporated into the analysis. Qualitative as well as quantitative information about the system can be incorporated. Using a technique called Composite Values Methodology, analytical maps can be generated that show LOS from a variety of “perspectives.” This approach is referred to as Geo‐Referenced Amenities Standards Process (GRASP®). A more detailed description of the history of GRASP® and its relationship to traditional park and recreation planning can be found in Appendix H: GRASP® History and Methodology. The LOS analysis starts with a solid inventory and evaluation of assets. Inventory The purpose of the inventory is to get as complete and accurate a picture as possible of the recreational opportunities available to the residents of Spokane. Towards this end, information was collected on the locations of indoor and outdoor facilities as described below. The information includes the location of the facilities and the components at each location. For the purposes of this inventory, components are generally described as amenities provided for the purpose of a recreational experience for visitors. This includes fields, courts, and other amenities used for organized activities, as well as open lawns, natural areas, and features that offer passive or non‐programmed recreational experiences. The inventory also includes an assessment of the functionality of each component. Spokane has over 1,500 acres of developed park land and over 3,000 acres in the entire system including conservation and conservation futures lands. According to the inventory, Spokane’s system includes 117 park locations and other sites, as well as 14 indoor facilities. Overall, the system has over 800 components listed in the database. Among these are unique parks such as Manito Park, a beautiful and historic urban park that is home to the city’s botanical gardens, and Riverfront Park, which was the site of the 1974 Expo World’s Fair, and which now provides a wide variety of experiences for residents and visitors alike, including gondola rides across the Spokane River gorge, an IMAX theater, and a hand‐carved carousel. Riverfront Park also offers a wonderfully attractive green space right in the midst of downtown. Throughout Spokane are numerous other parks that serve the neighborhoods with places to play, relax, and enjoy being outside. Nearly 19 miles of recreational trails are also available for hiking, biking, and alternative transportation.
92
Outdoor Facilities Spokane’s parks offer a wide variety of features and activities. These range from undeveloped parks with natural stands of forest to very urban parks such as Riverfront Park, and from numerous small neighborhood parks with a playground and picnic shelter to the larger
multipurpose parks like Manito Park. There are also a variety of specialty parks like the Dwight Merkel Sports Complex, and unique one‐of‐a‐kind parks like Cliff Park and Finch Arboretum. Spokane is also proud of its high quality municipal golf courses. Spokane’s historic parks legacy includes many parks that were originated in the very early 1900’s, when the Olmsted Brothers were retained to provide a plan for the park system. Cannon Hill is one of the best examples of these picturesque parks, with its duck pond, stone bridge, Arts and Crafts style restroom building, and open glades of large shade trees and lawn. Such features can be found throughout many of Spokane’s parks. In fact, a large number of Spokane’s parks trace their origins back to the pre‐WWI era, and still retain much of the character of that time in history, as do the neighborhoods they serve. While there are many unique things to be said about Spokane’s parks, there are also certain commonalities that are typical of parks found throughout the city. The “typical” park in Spokane has a playground, spray pad, and picnic grounds set within open areas of grass punctuated with shade trees. One noticeable thing about these parks that is different from parks in most other parts of the country is the lack of picnic shelters. This is a reflection of Spokane’s climate. Because of the dry summers, there is little need for rain protection, and the large shade trees so abundant in most of Spokane’s parks provide plenty of shade. These “typical” parks are designed to serve the neighborhoods around them, which is typically an area of about one square mile in size. Throughout most of the developed part of Spokane, the current spacing of parks is about ¾ to one mile apart, although there are a few areas where the spacing is greater or smaller. Overall, parks are very well‐distributed throughout the city. Indoor Facilities Spokane has a total of 14 indoor recreation facilities that vary in size, function and services provided. Two of the community centers have gymnasiums and there are approximately 47 multi‐purpose rooms available throughout the system facilities. Kitchen facilities, while varied in size and function, exist in each indoor facility. Trails Spokane has approximately 19 miles of trails, and some of these connect to places beyond the city limits, offering the opportunity for extensive hiking and biking. However, other than along the river, which bisects the city from east to west, there are relatively few well‐connected networks of trails. Loop walks can be found within several of the parks, which allow for strolling and exercise, but do not provide a longer, interconnected trail experience.
93
Existing Infrastructure The parks and recreation system can be thought of as an infrastructure that serves the health and well‐being of people. This infrastructure is made up of parts that are combined in various ways to provide service. On a larger scale, parks, greenways, and indoor facilities form the
basic building blocks of the system. But each of these can be broken down as well into individual components, such as playing fields, interpretive features, or meeting rooms. For this project, a very complete and thorough database of amenities related to the provision of parks and recreation facilities in Spokane was conducted. All of the individual components within the system were evaluated and recorded into the inventory dataset. The inventory was conducted in the fall of 2009. The inventory for this project includes Spokane municipal facilities, and facilities belonging to several alternative providers. Alternative providers include elementary and middle schools in Spokane Public School District, private schools, County parks and State parks. Spokane Public Schools were given an assumed score. St. Aloysius and St. Patrick Private Schools were included in the inventory based on their adjacency to existing park land. State and County Parks are displayed but not factored into the LOS as are Meade School District facilities. The inventory process was conducted by the consulting team, and included visits to a vast majority of all sites. Information on a few sites was provided by City of Spokane Parks and Recreation staff, who also reviewed the final dataset to verify its completeness and accuracy. The information collected includes site boundaries for the inventoried sites, as obtained from the City’s Geographic Information System (GIS). Also included are aerial photographs of each site, on which all of the existing components are identified. The photos are linked to the GIS, as are the components shown on the photos. Each site was evaluated for its design, ambience, comfort, and convenience. Each component was evaluated on its functionality, based on whether or not it met expectations for its intended purpose at its specific location. In order to eventually make recommendations about what needs to be added to or changed in the system and the funding required, included in this inventory and level of service (LOS) analysis are facilities and/or improvements that are planned and currently funded. Alternative provider inventory data was collected by several methods, including contacting the agency, reviewing school district websites, using GIS aerial photography, referring to directories and similar documents, and using information provided by City of Spokane Parks and Recreation staff. For each City‐owned site or facility, an assessment was also made of factors that enhance or detract from the functionality of the components. These are “comfort and convenience” elements, including the availability of adequate shade, seating, parking, restrooms, etc. The overall design and ambience of the site or facility was also assessed, including such things as good design, pleasing surroundings, etc.
94
The GRASP® LOS Methodology A methodology known as Geo‐referenced Amenities Standards Process (GRASP®) was used to compile the inventory and assess the level of service provided by the current park system. A detailed explanation of this methodology can be found in the Appendix I of this report.
Each component was located, counted, and assessed for the functionality of its primary intended use. A GRASP® score was assigned to the component as a measure of its functionality as follows:
⎯ Below Expectations (BE) – The component does not meet the expectations of its intended primary function. Factors leading to this may include size, age, accessibility, or others. Each such component was given a score of one (1) in the inventory.
⎯ Meeting Expectations (ME) – The component meets expectations for its intended function. Such components were given scores of two (2). ⎯ Exceeding Expectations (EE) – The component exceeds expectations, due to size, configuration, or unique qualities. Such components were given
scores of three (3). ⎯ If the feature exists but is not useable because it is unsafe, obsolete, or dysfunctional, it may be listed in the inventory, and assigned a score of
zero (0). Components were evaluated according to this scale from two perspectives: first, the value of the component in serving the immediate neighborhood, and second, its value to the entire community. In some cases, components were counted cumulatively within a park or facility. In such cases the component was evaluated according to the experiences provided. For example, rather than recording each individual piece of art within a park, a single value was given for art as an experience within the park. This was also done for historical, cultural, and educational experiences offered within parks. Next, amenities that relate to and enhance the component were evaluated. The setting for a component and the conditions around it affect how well it functions, so in addition to scoring the components, each park site or indoor facility was given a set of scores to rate its comfort and convenience to the user. This includes such things as the availability of restrooms, drinking water, shade, scenery, etc. Lastly, the overall design and ambiance of the facility or park was recorded as a part of the inventory. Characteristics such as overall layout, attention to design, and functionality inform the design and ambiance score. The assessment findings from each location were entered into a master inventory database/spreadsheet (see Appendix J: Park and Facility Inventory). The database serves as a record of the inventory and was also used to perform the GRASP® analysis that follows.
95
GRASP® Scoring for Trails Some trails serve as independent parks or greenways, and are recreational destinations within themselves. Others serve as individual components within a park. For purposes of assigning scores, the former type of trail receives its own set of scores for modifiers and design
and ambiance. Trails within parks take on the modifiers and design and ambiance of the larger parks in which they reside. Trails are assumed to consist of three (3) components including one active component, one passive component, and the parcel itself. GRASP® Scoring for Alternative Providers Alternative providers included in the inventory include Spokane Public School District, two private schools, county parks, and state parks. In each, the GRASP® scoring system is used and assumptions are made based on the typical condition and accessibility of the item. The information below describes the scoring system and explains the assumptions that were made to arrive at the GRASP® score.
GRASP® scoring system: Component Below expectations = 1 Meets expectations = 2 Exceeds expectations = 3 Comfort and convenience Below expectations = 1.1 Meets expectations = 1.2 Exceeds expectations = 1.3 Design and Ambiance Below expectations = 1 Meets expectations = 2 Exceeds expectations = 3
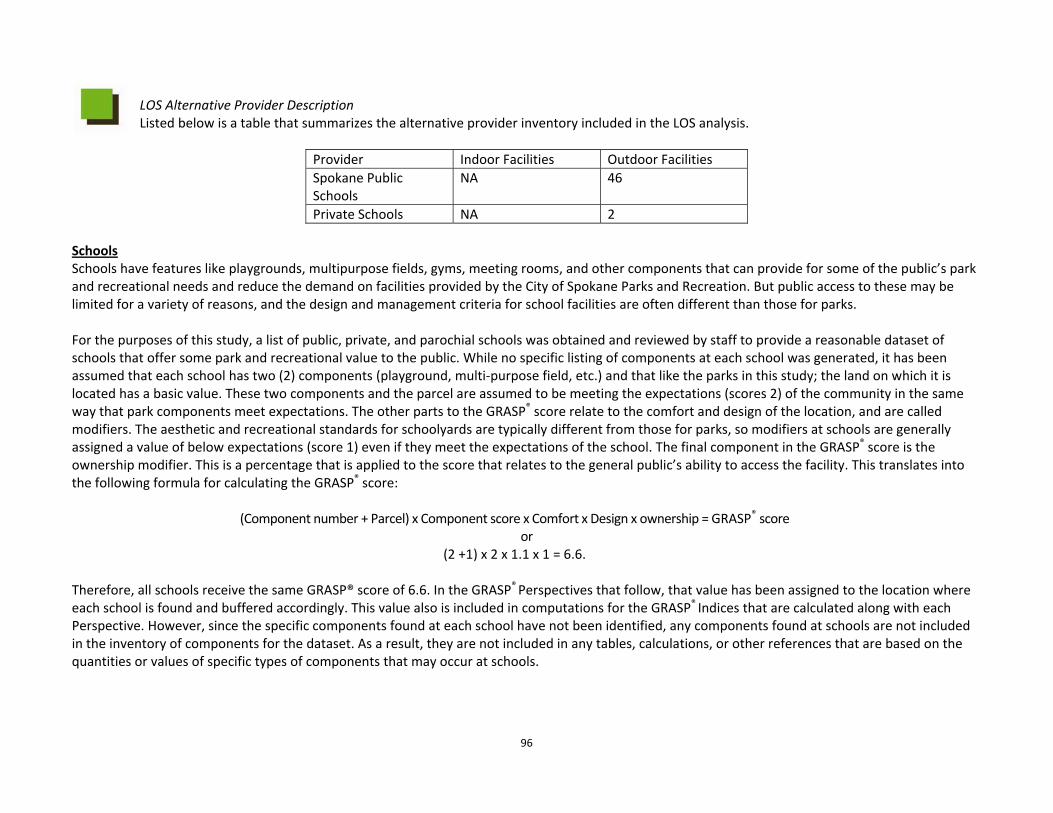
96
LOS Alternative Provider Description Listed below is a table that summarizes the alternative provider inventory included in the LOS analysis.
Provider Indoor Facilities Outdoor Facilities Spokane Public Schools
NA 46
Private Schools NA 2 Schools Schools have features like playgrounds, multipurpose fields, gyms, meeting rooms, and other components that can provide for some of the public’s park and recreational needs and reduce the demand on facilities provided by the City of Spokane Parks and Recreation. But public access to these may be limited for a variety of reasons, and the design and management criteria for school facilities are often different than those for parks. For the purposes of this study, a list of public, private, and parochial schools was obtained and reviewed by staff to provide a reasonable dataset of schools that offer some park and recreational value to the public. While no specific listing of components at each school was generated, it has been assumed that each school has two (2) components (playground, multi‐purpose field, etc.) and that like the parks in this study; the land on which it is located has a basic value. These two components and the parcel are assumed to be meeting the expectations (scores 2) of the community in the same way that park components meet expectations. The other parts to the GRASP® score relate to the comfort and design of the location, and are called modifiers. The aesthetic and recreational standards for schoolyards are typically different from those for parks, so modifiers at schools are generally assigned a value of below expectations (score 1) even if they meet the expectations of the school. The final component in the GRASP® score is the ownership modifier. This is a percentage that is applied to the score that relates to the general public’s ability to access the facility. This translates into the following formula for calculating the GRASP® score:
(Component number + Parcel) x Component score x Comfort x Design x ownership = GRASP® score or
(2 +1) x 2 x 1.1 x 1 = 6.6.
Therefore, all schools receive the same GRASP® score of 6.6. In the GRASP® Perspectives that follow, that value has been assigned to the location where each school is found and buffered accordingly. This value also is included in computations for the GRASP® Indices that are calculated along with each Perspective. However, since the specific components found at each school have not been identified, any components found at schools are not included in the inventory of components for the dataset. As a result, they are not included in any tables, calculations, or other references that are based on the quantities or values of specific types of components that may occur at schools.
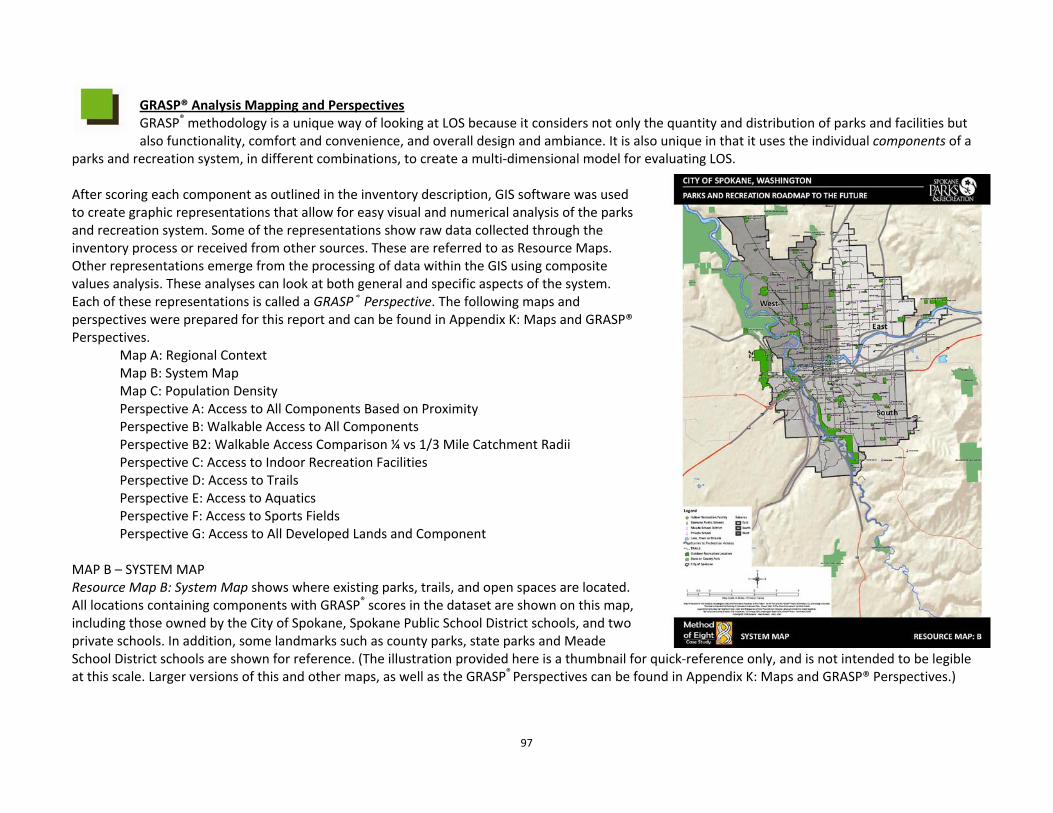
97
GRASP® Analysis Mapping and Perspectives GRASP® methodology is a unique way of looking at LOS because it considers not only the quantity and distribution of parks and facilities but also functionality, comfort and convenience, and overall design and ambiance. It is also unique in that it uses the individual components of a
parks and recreation system, in different combinations, to create a multi‐dimensional model for evaluating LOS. After scoring each component as outlined in the inventory description, GIS software was used to create graphic representations that allow for easy visual and numerical analysis of the parks and recreation system. Some of the representations show raw data collected through the inventory process or received from other sources. These are referred to as Resource Maps. Other representations emerge from the processing of data within the GIS using composite values analysis. These analyses can look at both general and specific aspects of the system. Each of these representations is called a GRASP® Perspective. The following maps and perspectives were prepared for this report and can be found in Appendix K: Maps and GRASP® Perspectives.
Map A: Regional Context Map B: System Map Map C: Population Density Perspective A: Access to All Components Based on Proximity Perspective B: Walkable Access to All Components Perspective B2: Walkable Access Comparison ¼ vs 1/3 Mile Catchment Radii Perspective C: Access to Indoor Recreation Facilities Perspective D: Access to Trails Perspective E: Access to Aquatics Perspective F: Access to Sports Fields Perspective G: Access to All Developed Lands and Component
MAP B – SYSTEM MAP Resource Map B: System Map shows where existing parks, trails, and open spaces are located. All locations containing components with GRASP® scores in the dataset are shown on this map, including those owned by the City of Spokane, Spokane Public School District schools, and two private schools. In addition, some landmarks such as county parks, state parks and Meade School District schools are shown for reference. (The illustration provided here is a thumbnail for quick‐reference only, and is not intended to be legible at this scale. Larger versions of this and other maps, as well as the GRASP® Perspectives can be found in Appendix K: Maps and GRASP® Perspectives.)
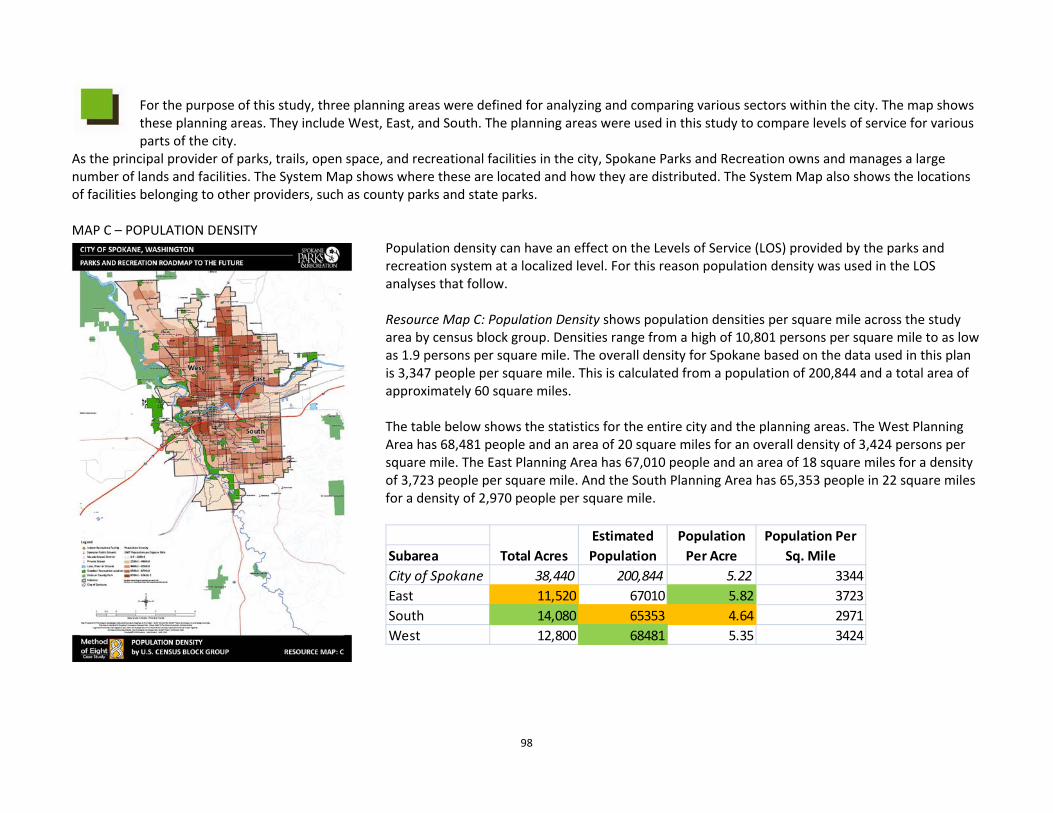
98
For the purpose of this study, three planning areas were defined for analyzing and comparing various sectors within the city. The map shows these planning areas. They include West, East, and South. The planning areas were used in this study to compare levels of service for various parts of the city.
As the principal provider of parks, trails, open space, and recreational facilities in the city, Spokane Parks and Recreation owns and manages a large number of lands and facilities. The System Map shows where these are located and how they are distributed. The System Map also shows the locations of facilities belonging to other providers, such as county parks and state parks. MAP C – POPULATION DENSITY
Population density can have an effect on the Levels of Service (LOS) provided by the parks and recreation system at a localized level. For this reason population density was used in the LOS analyses that follow. Resource Map C: Population Density shows population densities per square mile across the study area by census block group. Densities range from a high of 10,801 persons per square mile to as low as 1.9 persons per square mile. The overall density for Spokane based on the data used in this plan is 3,347 people per square mile. This is calculated from a population of 200,844 and a total area of approximately 60 square miles. The table below shows the statistics for the entire city and the planning areas. The West Planning Area has 68,481 people and an area of 20 square miles for an overall density of 3,424 persons per square mile. The East Planning Area has 67,010 people and an area of 18 square miles for a density of 3,723 people per square mile. And the South Planning Area has 65,353 people in 22 square miles for a density of 2,970 people per square mile.
SubareaCity of Spokane 38,440 200,844 5.22 3344East 11,520 67010 5.82 3723South 14,080 65353 4.64 2971West 12,800 68481 5.35 3424
Estimated PopulationTotal Acres
Population Per Acre
Population Per Sq. Mile

99
Perspectives For each GRASP® Perspective, the GRASP® scores for components in the inventory relevant to that Perspective are applied to a radius around each component. This radius represents the service area, (sometimes also referred to as the catchment area or buffer), within which the
score for that component is effective. Catchment areas may vary from one Perspective to the next, depending on the assumptions and parameters on which the Perspective is based. The typical approach is to apply the components’ qualitative score to both one mile and 1/4 mile radii. One mile radii represent a distance from which convenient access to the component can be achieved by normal means such as driving or bicycling. The 1/4 mile radius is an assumed distance from which a resident can reasonably walk to the component. By plotting both sets of radii for each component on a map, scores are effectively doubled within the 1/4 mile radius. This is done to place a premium on walking and reflect the added accessibility of walking, since almost anyone can reach the location on their own by walking, even if they don’t drive or ride a bicycle. When catchment areas from multiple components with associated scores are plotted on a map, a picture emerges that represents the cumulative LOS. Where catchment areas for multiple components overlap, a darker shade results and indicates locations that are “served” by a combination of more components and/or higher quality ones. In other words, where there are darker shades, the level of service is higher for that particular Perspective. It is important to note that the shade overlaying any given point on the map represents the cumulative value offered by the surrounding park system to an individual situated in that specific location, rather than the service being provided by components at a location to the areas around it. GRASP® Threshold Values Analysis For some of the GRASP® Perspectives, the catchment areas and associated scores are presented in two ways – with infinite tone ranges (orange) and in two tones based on Threshold Values (purple and yellow). The infinite tone map for each Perspective shows the GRASP® LOS with a tone range that portrays the nuance of services that are being provided to the community. Note: The complete Perspective series is set to the same tone scale so that different Perspectives can be compared side‐by‐side. A particular shade on one Perspective will have the same numerical value on all other Perspectives. The Threshold Values maps show GRASP® score ranges bracketed into categories that represent the following: No Service, Service Below Threshold Value or Service Above Threshold Value. Threshold scores represent the score that would be achieved if a determined set of components, along with the appropriate modifiers, were accessible from a given location. The combination of components is based on the set of needs being evaluated, and varies for each Perspective. Unless otherwise noted, the threshold score is appropriate for a typical developed suburban residential area. For this reason, it should not be implied that all parts of the city should attain this score. In some areas, no service or a level of service below the threshold score is completely appropriate.
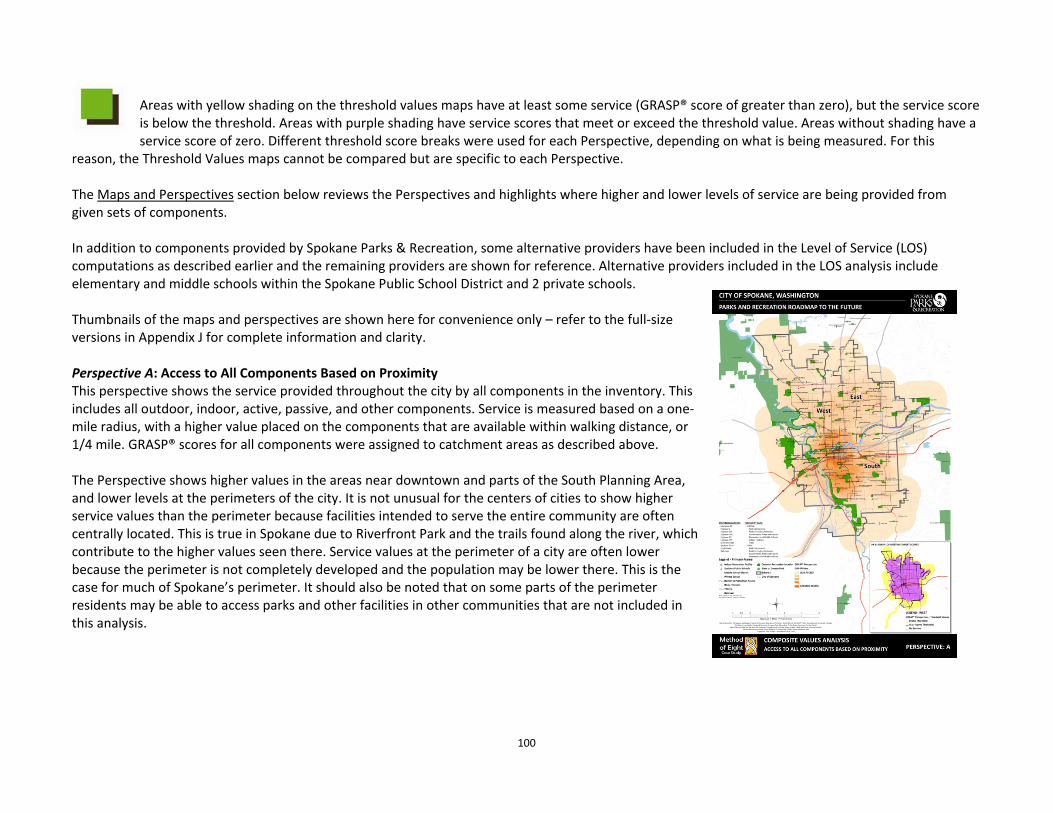
100
Areas with yellow shading on the threshold values maps have at least some service (GRASP® score of greater than zero), but the service score is below the threshold. Areas with purple shading have service scores that meet or exceed the threshold value. Areas without shading have a service score of zero. Different threshold score breaks were used for each Perspective, depending on what is being measured. For this
reason, the Threshold Values maps cannot be compared but are specific to each Perspective. The Maps and Perspectives section below reviews the Perspectives and highlights where higher and lower levels of service are being provided from given sets of components. In addition to components provided by Spokane Parks & Recreation, some alternative providers have been included in the Level of Service (LOS) computations as described earlier and the remaining providers are shown for reference. Alternative providers included in the LOS analysis include elementary and middle schools within the Spokane Public School District and 2 private schools. Thumbnails of the maps and perspectives are shown here for convenience only – refer to the full‐size versions in Appendix J for complete information and clarity. Perspective A: Access to All Components Based on Proximity This perspective shows the service provided throughout the city by all components in the inventory. This includes all outdoor, indoor, active, passive, and other components. Service is measured based on a one‐mile radius, with a higher value placed on the components that are available within walking distance, or 1/4 mile. GRASP® scores for all components were assigned to catchment areas as described above. The Perspective shows higher values in the areas near downtown and parts of the South Planning Area, and lower levels at the perimeters of the city. It is not unusual for the centers of cities to show higher service values than the perimeter because facilities intended to serve the entire community are often centrally located. This is true in Spokane due to Riverfront Park and the trails found along the river, which contribute to the higher values seen there. Service values at the perimeter of a city are often lower because the perimeter is not completely developed and the population may be lower there. This is the case for much of Spokane’s perimeter. It should also be noted that on some parts of the perimeter residents may be able to access parks and other facilities in other communities that are not included in this analysis.
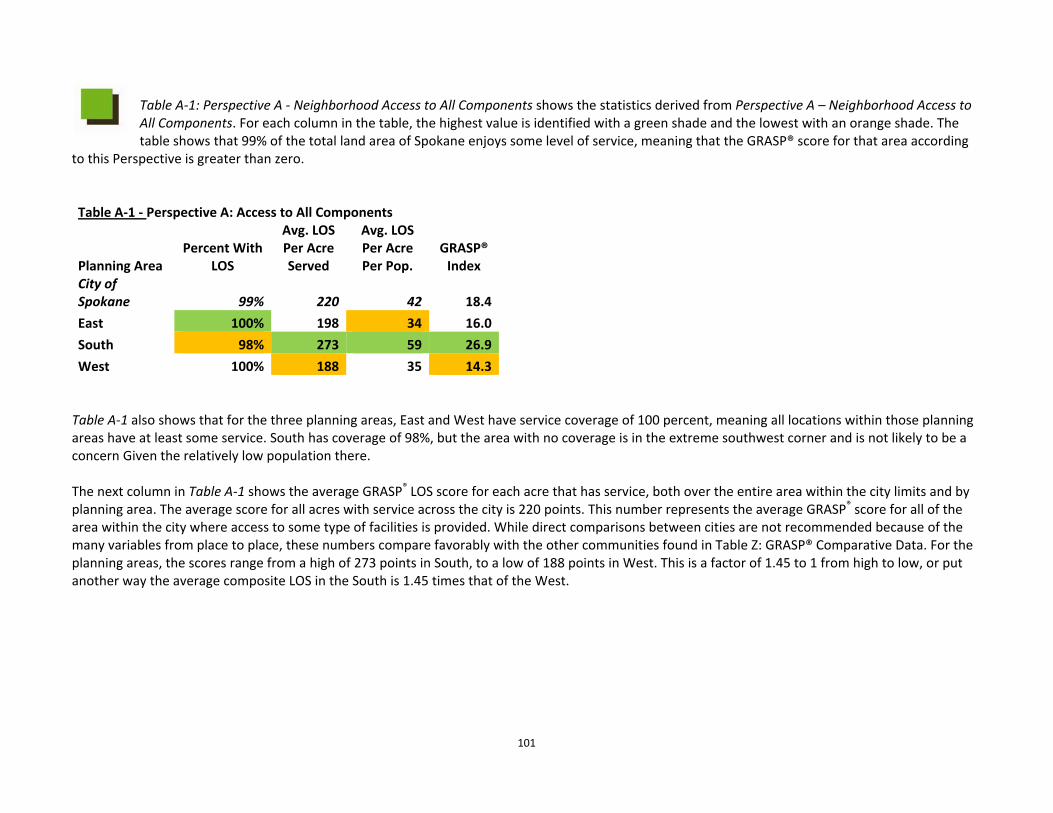
101
Table A‐1: Perspective A ‐ Neighborhood Access to All Components shows the statistics derived from Perspective A – Neighborhood Access to All Components. For each column in the table, the highest value is identified with a green shade and the lowest with an orange shade. The table shows that 99% of the total land area of Spokane enjoys some level of service, meaning that the GRASP® score for that area according
to this Perspective is greater than zero.
Table A‐1 ‐ Perspective A: Access to All Components
Percent With
LOS
Avg. LOS Per Acre Served
Avg. LOS Per Acre Per Pop.
GRASP® Index
Planning Area
City of Spokane 99% 220 42 18.4
East 100% 198 34 16.0
South 98% 273 59 26.9
West 100% 188 35 14.3 Table A‐1 also shows that for the three planning areas, East and West have service coverage of 100 percent, meaning all locations within those planning areas have at least some service. South has coverage of 98%, but the area with no coverage is in the extreme southwest corner and is not likely to be a concern Given the relatively low population there. The next column in Table A‐1 shows the average GRASP® LOS score for each acre that has service, both over the entire area within the city limits and by planning area. The average score for all acres with service across the city is 220 points. This number represents the average GRASP® score for all of the area within the city where access to some type of facilities is provided. While direct comparisons between cities are not recommended because of the many variables from place to place, these numbers compare favorably with the other communities found in Table Z: GRASP® Comparative Data. For the planning areas, the scores range from a high of 273 points in South, to a low of 188 points in West. This is a factor of 1.45 to 1 from high to low, or put another way the average composite LOS in the South is 1.45 times that of the West.
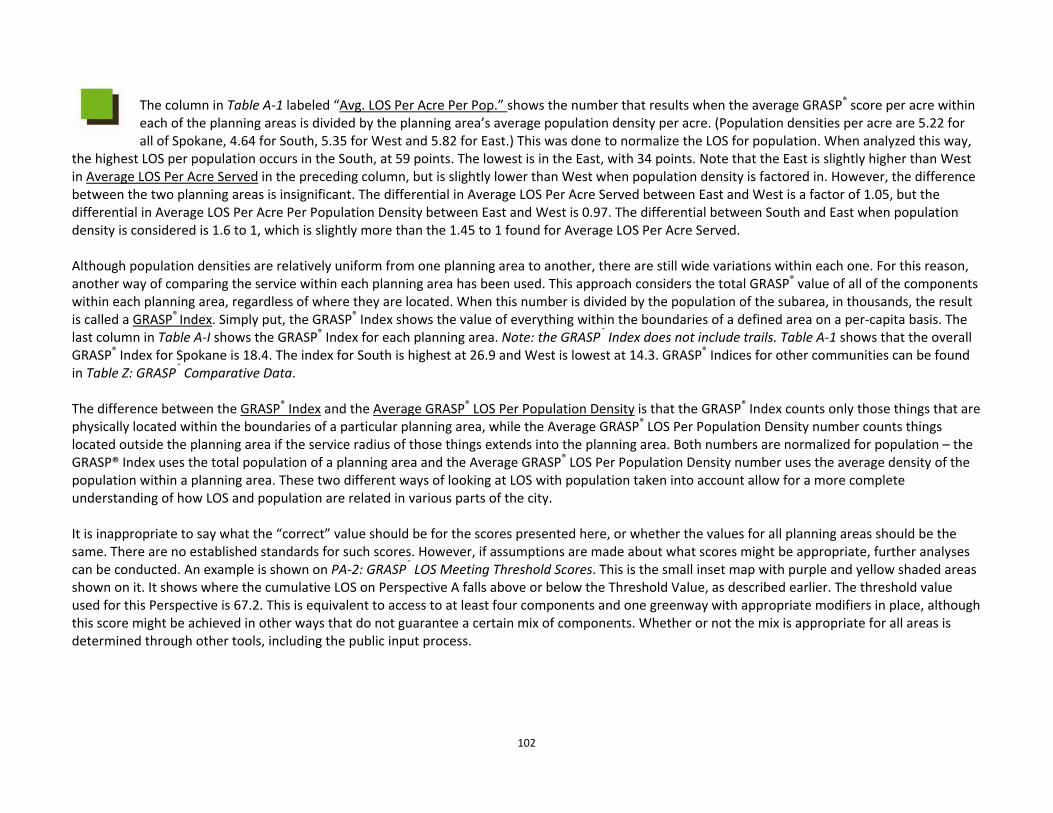
102
The column in Table A‐1 labeled “Avg. LOS Per Acre Per Pop.” shows the number that results when the average GRASP® score per acre within each of the planning areas is divided by the planning area’s average population density per acre. (Population densities per acre are 5.22 for all of Spokane, 4.64 for South, 5.35 for West and 5.82 for East.) This was done to normalize the LOS for population. When analyzed this way,
the highest LOS per population occurs in the South, at 59 points. The lowest is in the East, with 34 points. Note that the East is slightly higher than West in Average LOS Per Acre Served in the preceding column, but is slightly lower than West when population density is factored in. However, the difference between the two planning areas is insignificant. The differential in Average LOS Per Acre Served between East and West is a factor of 1.05, but the differential in Average LOS Per Acre Per Population Density between East and West is 0.97. The differential between South and East when population density is considered is 1.6 to 1, which is slightly more than the 1.45 to 1 found for Average LOS Per Acre Served. Although population densities are relatively uniform from one planning area to another, there are still wide variations within each one. For this reason, another way of comparing the service within each planning area has been used. This approach considers the total GRASP® value of all of the components within each planning area, regardless of where they are located. When this number is divided by the population of the subarea, in thousands, the result is called a GRASP® Index. Simply put, the GRASP® Index shows the value of everything within the boundaries of a defined area on a per‐capita basis. The last column in Table A‐I shows the GRASP® Index for each planning area. Note: the GRASP® Index does not include trails. Table A‐1 shows that the overall GRASP® Index for Spokane is 18.4. The index for South is highest at 26.9 and West is lowest at 14.3. GRASP® Indices for other communities can be found in Table Z: GRASP® Comparative Data. The difference between the GRASP® Index and the Average GRASP® LOS Per Population Density is that the GRASP® Index counts only those things that are physically located within the boundaries of a particular planning area, while the Average GRASP® LOS Per Population Density number counts things located outside the planning area if the service radius of those things extends into the planning area. Both numbers are normalized for population – the GRASP® Index uses the total population of a planning area and the Average GRASP® LOS Per Population Density number uses the average density of the population within a planning area. These two different ways of looking at LOS with population taken into account allow for a more complete understanding of how LOS and population are related in various parts of the city. It is inappropriate to say what the “correct” value should be for the scores presented here, or whether the values for all planning areas should be the same. There are no established standards for such scores. However, if assumptions are made about what scores might be appropriate, further analyses can be conducted. An example is shown on PA‐2: GRASP® LOS Meeting Threshold Scores. This is the small inset map with purple and yellow shaded areas shown on it. It shows where the cumulative LOS on Perspective A falls above or below the Threshold Value, as described earlier. The threshold value used for this Perspective is 67.2. This is equivalent to access to at least four components and one greenway with appropriate modifiers in place, although this score might be achieved in other ways that do not guarantee a certain mix of components. Whether or not the mix is appropriate for all areas is determined through other tools, including the public input process.
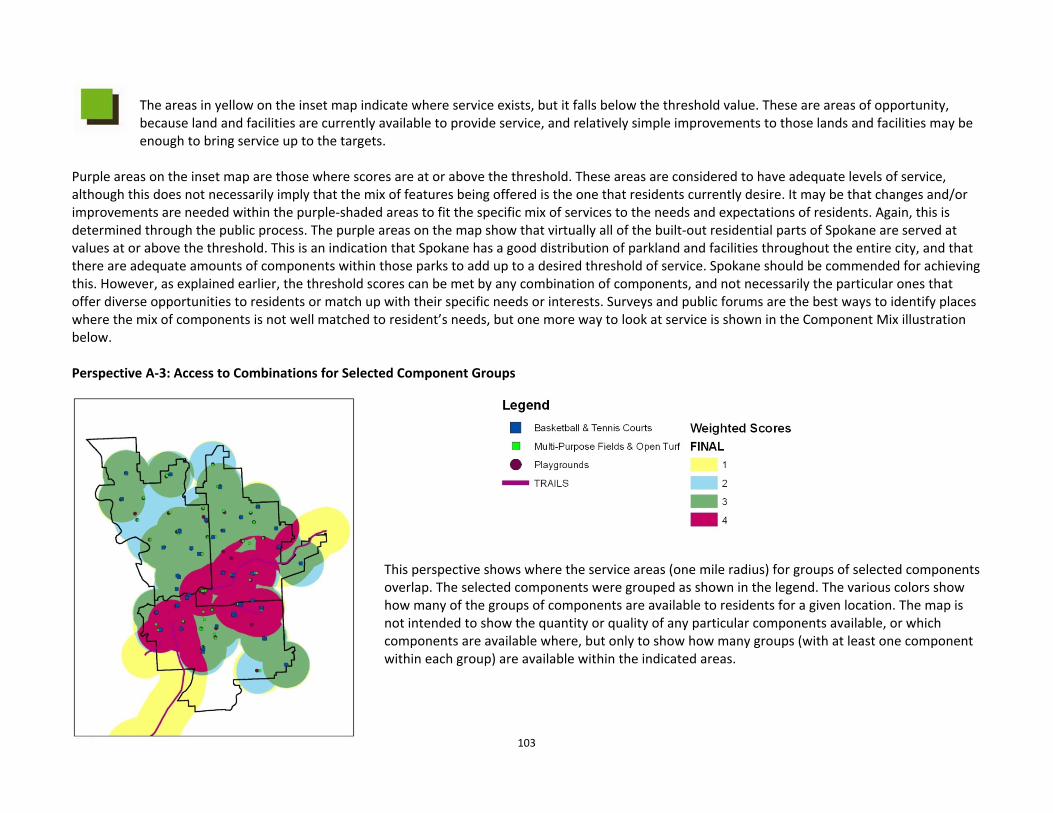
103
The areas in yellow on the inset map indicate where service exists, but it falls below the threshold value. These are areas of opportunity, because land and facilities are currently available to provide service, and relatively simple improvements to those lands and facilities may be enough to bring service up to the targets.
Purple areas on the inset map are those where scores are at or above the threshold. These areas are considered to have adequate levels of service, although this does not necessarily imply that the mix of features being offered is the one that residents currently desire. It may be that changes and/or improvements are needed within the purple‐shaded areas to fit the specific mix of services to the needs and expectations of residents. Again, this is determined through the public process. The purple areas on the map show that virtually all of the built‐out residential parts of Spokane are served at values at or above the threshold. This is an indication that Spokane has a good distribution of parkland and facilities throughout the entire city, and that there are adequate amounts of components within those parks to add up to a desired threshold of service. Spokane should be commended for achieving this. However, as explained earlier, the threshold scores can be met by any combination of components, and not necessarily the particular ones that offer diverse opportunities to residents or match up with their specific needs or interests. Surveys and public forums are the best ways to identify places where the mix of components is not well matched to resident’s needs, but one more way to look at service is shown in the Component Mix illustration below.
Perspective A‐3: Access to Combinations for Selected Component Groups
This perspective shows where the service areas (one mile radius) for groups of selected components overlap. The selected components were grouped as shown in the legend. The various colors show how many of the groups of components are available to residents for a given location. The map is not intended to show the quantity or quality of any particular components available, or which components are available where, but only to show how many groups (with at least one component within each group) are available within the indicated areas.
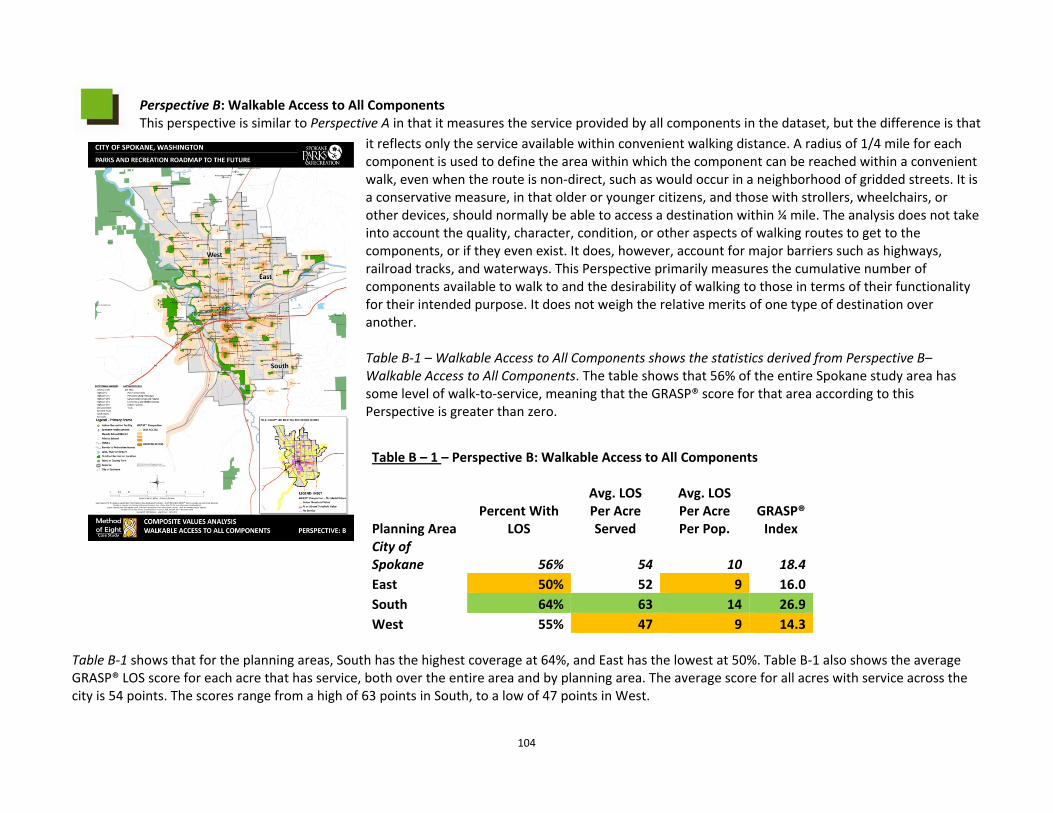
104
Perspective B: Walkable Access to All Components This perspective is similar to Perspective A in that it measures the service provided by all components in the dataset, but the difference is that
it reflects only the service available within convenient walking distance. A radius of 1/4 mile for each component is used to define the area within which the component can be reached within a convenient walk, even when the route is non‐direct, such as would occur in a neighborhood of gridded streets. It is a conservative measure, in that older or younger citizens, and those with strollers, wheelchairs, or other devices, should normally be able to access a destination within ¼ mile. The analysis does not take into account the quality, character, condition, or other aspects of walking routes to get to the components, or if they even exist. It does, however, account for major barriers such as highways, railroad tracks, and waterways. This Perspective primarily measures the cumulative number of components available to walk to and the desirability of walking to those in terms of their functionality for their intended purpose. It does not weigh the relative merits of one type of destination over another. Table B‐1 – Walkable Access to All Components shows the statistics derived from Perspective B–Walkable Access to All Components. The table shows that 56% of the entire Spokane study area has some level of walk‐to‐service, meaning that the GRASP® score for that area according to this Perspective is greater than zero.
Table B – 1 – Perspective B: Walkable Access to All Components
Percent With LOS
Avg. LOS Per Acre Served
Avg. LOS Per Acre Per Pop.
GRASP® Index Planning Area
City of Spokane 56% 54 10 18.4 East 50% 52 9 16.0 South 64% 63 14 26.9 West 55% 47 9 14.3
Table B‐1 shows that for the planning areas, South has the highest coverage at 64%, and East has the lowest at 50%. Table B‐1 also shows the average GRASP® LOS score for each acre that has service, both over the entire area and by planning area. The average score for all acres with service across the city is 54 points. The scores range from a high of 63 points in South, to a low of 47 points in West.
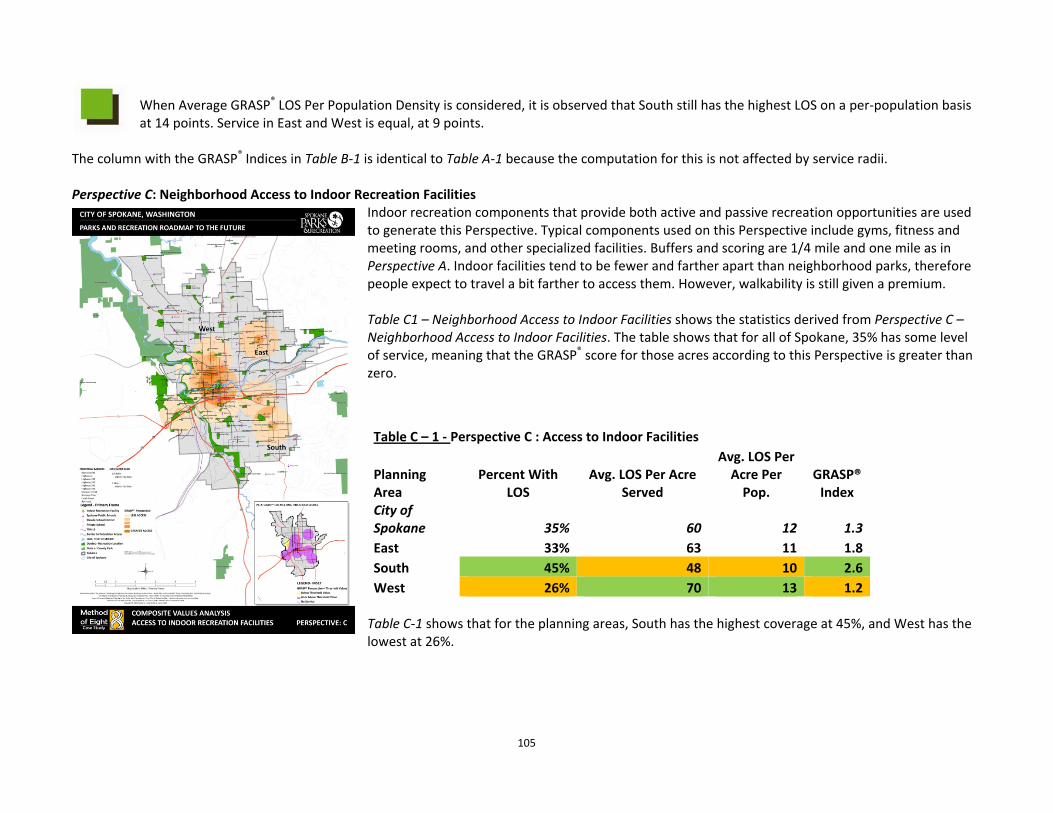
105
When Average GRASP® LOS Per Population Density is considered, it is observed that South still has the highest LOS on a per‐population basis at 14 points. Service in East and West is equal, at 9 points.
The column with the GRASP® Indices in Table B‐1 is identical to Table A‐1 because the computation for this is not affected by service radii. Perspective C: Neighborhood Access to Indoor Recreation Facilities
Indoor recreation components that provide both active and passive recreation opportunities are used to generate this Perspective. Typical components used on this Perspective include gyms, fitness and meeting rooms, and other specialized facilities. Buffers and scoring are 1/4 mile and one mile as in Perspective A. Indoor facilities tend to be fewer and farther apart than neighborhood parks, therefore people expect to travel a bit farther to access them. However, walkability is still given a premium. Table C1 – Neighborhood Access to Indoor Facilities shows the statistics derived from Perspective C – Neighborhood Access to Indoor Facilities. The table shows that for all of Spokane, 35% has some level of service, meaning that the GRASP® score for those acres according to this Perspective is greater than zero.
Table C – 1 ‐ Perspective C : Access to Indoor Facilities
Percent With LOS
Avg. LOS Per Acre Served
Avg. LOS Per Acre Per Pop.
GRASP® Index
Planning Area
City of Spokane 35% 60 12 1.3
East 33% 63 11 1.8
South 45% 48 10 2.6
West 26% 70 13 1.2 Table C‐1 shows that for the planning areas, South has the highest coverage at 45%, and West has the lowest at 26%.
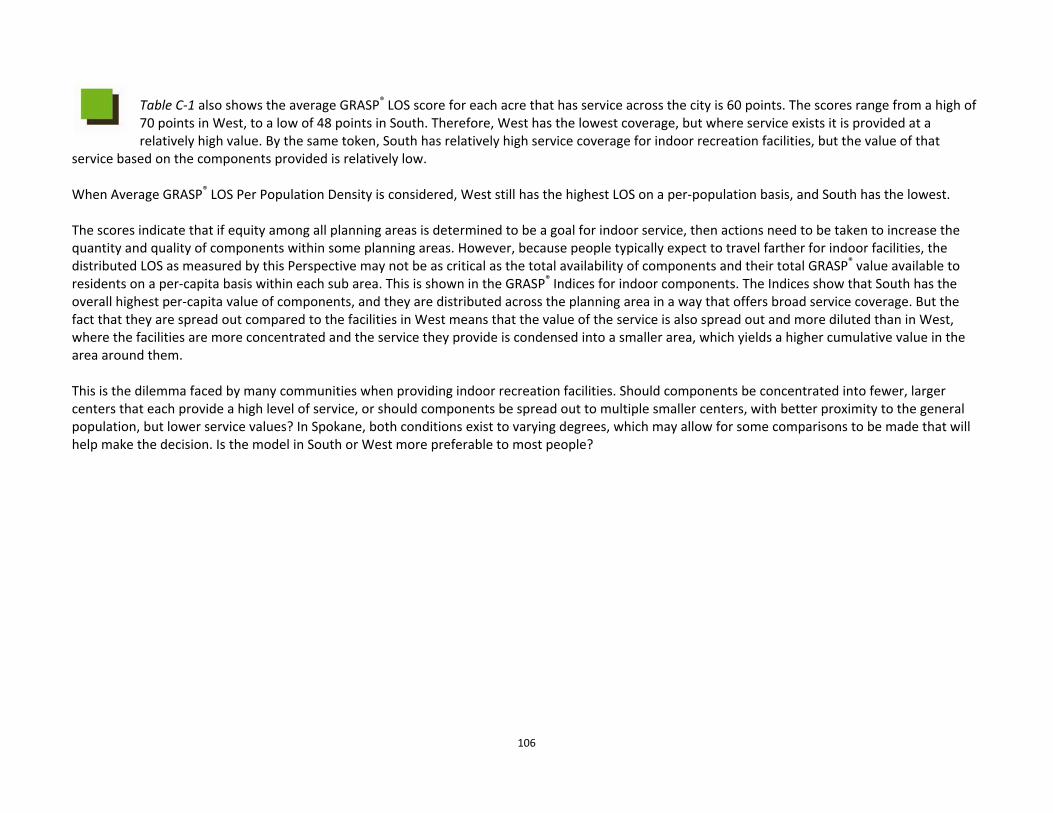
106
Table C‐1 also shows the average GRASP® LOS score for each acre that has service across the city is 60 points. The scores range from a high of 70 points in West, to a low of 48 points in South. Therefore, West has the lowest coverage, but where service exists it is provided at a relatively high value. By the same token, South has relatively high service coverage for indoor recreation facilities, but the value of that
service based on the components provided is relatively low. When Average GRASP® LOS Per Population Density is considered, West still has the highest LOS on a per‐population basis, and South has the lowest. The scores indicate that if equity among all planning areas is determined to be a goal for indoor service, then actions need to be taken to increase the quantity and quality of components within some planning areas. However, because people typically expect to travel farther for indoor facilities, the distributed LOS as measured by this Perspective may not be as critical as the total availability of components and their total GRASP® value available to residents on a per‐capita basis within each sub area. This is shown in the GRASP® Indices for indoor components. The Indices show that South has the overall highest per‐capita value of components, and they are distributed across the planning area in a way that offers broad service coverage. But the fact that they are spread out compared to the facilities in West means that the value of the service is also spread out and more diluted than in West, where the facilities are more concentrated and the service they provide is condensed into a smaller area, which yields a higher cumulative value in the area around them. This is the dilemma faced by many communities when providing indoor recreation facilities. Should components be concentrated into fewer, larger centers that each provide a high level of service, or should components be spread out to multiple smaller centers, with better proximity to the general population, but lower service values? In Spokane, both conditions exist to varying degrees, which may allow for some comparisons to be made that will help make the decision. Is the model in South or West more preferable to most people?
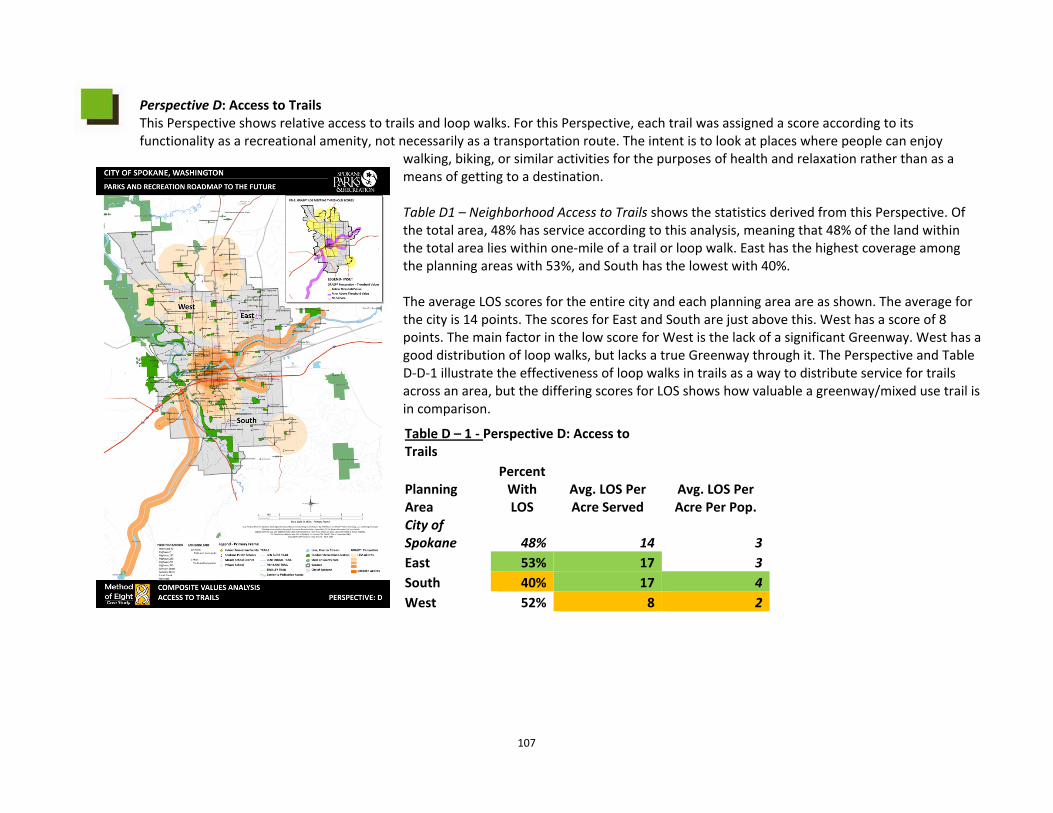
107
Perspective D: Access to Trails This Perspective shows relative access to trails and loop walks. For this Perspective, each trail was assigned a score according to its functionality as a recreational amenity, not necessarily as a transportation route. The intent is to look at places where people can enjoy
walking, biking, or similar activities for the purposes of health and relaxation rather than as a means of getting to a destination. Table D1 – Neighborhood Access to Trails shows the statistics derived from this Perspective. Of the total area, 48% has service according to this analysis, meaning that 48% of the land within the total area lies within one‐mile of a trail or loop walk. East has the highest coverage among the planning areas with 53%, and South has the lowest with 40%. The average LOS scores for the entire city and each planning area are as shown. The average for the city is 14 points. The scores for East and South are just above this. West has a score of 8 points. The main factor in the low score for West is the lack of a significant Greenway. West has a good distribution of loop walks, but lacks a true Greenway through it. The Perspective and Table D‐D‐1 illustrate the effectiveness of loop walks in trails as a way to distribute service for trails across an area, but the differing scores for LOS shows how valuable a greenway/mixed use trail is in comparison.
Table D – 1 ‐ Perspective D: Access to Trails Percent
With LOS
Avg. LOS Per Acre Served
Avg. LOS Per Acre Per Pop.
Planning Area
City of Spokane 48% 14 3
East 53% 17 3
South 40% 17 4
West 52% 8 2
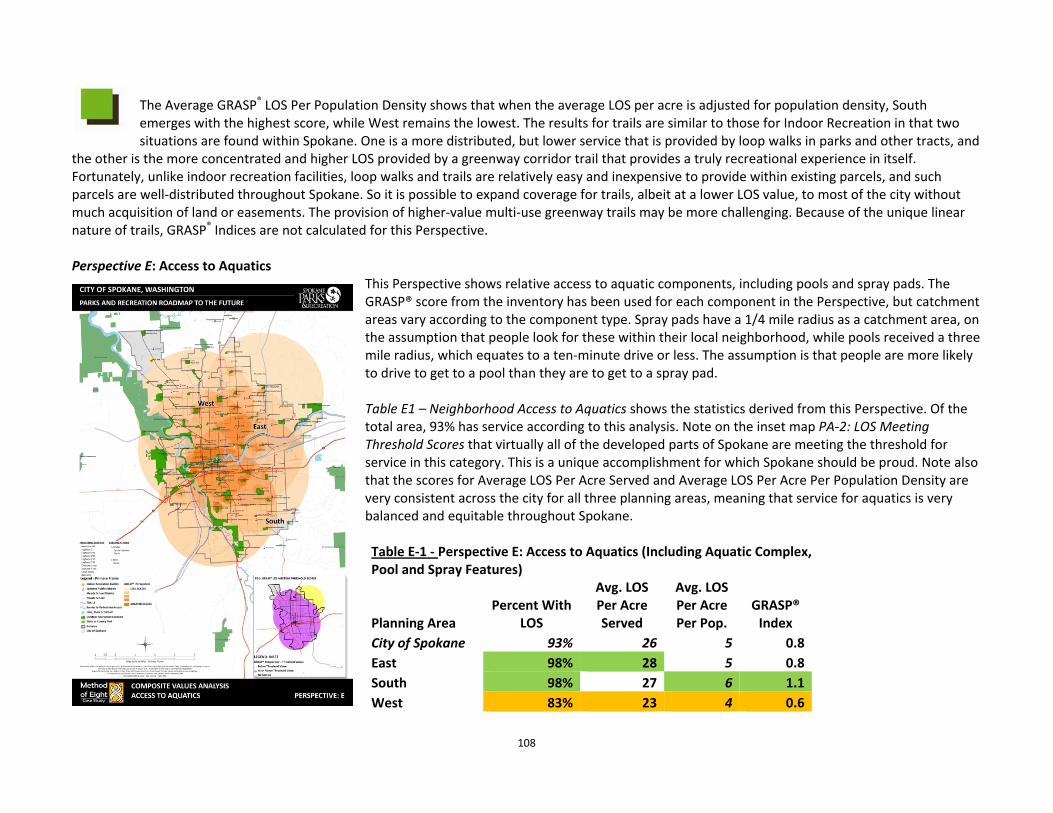
108
The Average GRASP® LOS Per Population Density shows that when the average LOS per acre is adjusted for population density, South emerges with the highest score, while West remains the lowest. The results for trails are similar to those for Indoor Recreation in that two situations are found within Spokane. One is a more distributed, but lower service that is provided by loop walks in parks and other tracts, and
the other is the more concentrated and higher LOS provided by a greenway corridor trail that provides a truly recreational experience in itself. Fortunately, unlike indoor recreation facilities, loop walks and trails are relatively easy and inexpensive to provide within existing parcels, and such parcels are well‐distributed throughout Spokane. So it is possible to expand coverage for trails, albeit at a lower LOS value, to most of the city without much acquisition of land or easements. The provision of higher‐value multi‐use greenway trails may be more challenging. Because of the unique linear nature of trails, GRASP® Indices are not calculated for this Perspective. Perspective E: Access to Aquatics
This Perspective shows relative access to aquatic components, including pools and spray pads. The GRASP® score from the inventory has been used for each component in the Perspective, but catchment areas vary according to the component type. Spray pads have a 1/4 mile radius as a catchment area, on the assumption that people look for these within their local neighborhood, while pools received a three mile radius, which equates to a ten‐minute drive or less. The assumption is that people are more likely to drive to get to a pool than they are to get to a spray pad. Table E1 – Neighborhood Access to Aquatics shows the statistics derived from this Perspective. Of the total area, 93% has service according to this analysis. Note on the inset map PA‐2: LOS Meeting Threshold Scores that virtually all of the developed parts of Spokane are meeting the threshold for service in this category. This is a unique accomplishment for which Spokane should be proud. Note also that the scores for Average LOS Per Acre Served and Average LOS Per Acre Per Population Density are very consistent across the city for all three planning areas, meaning that service for aquatics is very balanced and equitable throughout Spokane. Table E‐1 ‐ Perspective E: Access to Aquatics (Including Aquatic Complex, Pool and Spray Features)
Percent With LOS
Avg. LOS Per Acre Served
Avg. LOS Per Acre Per Pop.
GRASP® Index
Planning Area
City of Spokane 93% 26 5 0.8
East 98% 28 5 0.8
South 98% 27 6 1.1
West 83% 23 4 0.6
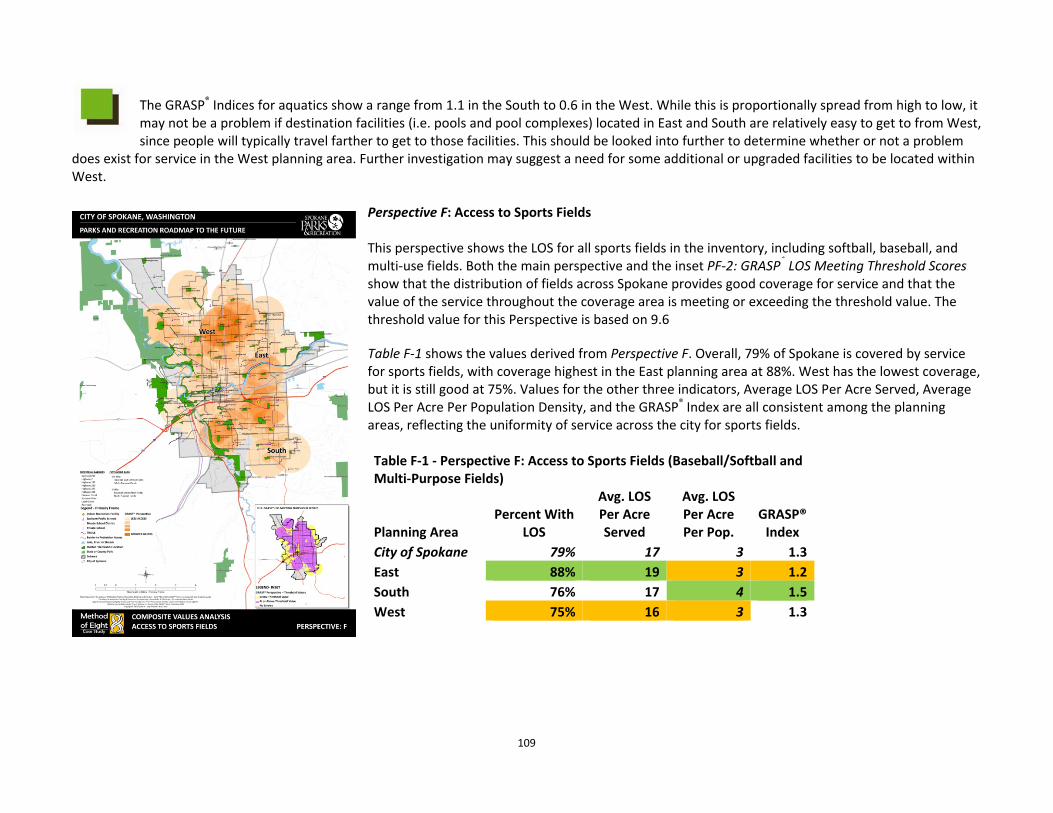
109
The GRASP® Indices for aquatics show a range from 1.1 in the South to 0.6 in the West. While this is proportionally spread from high to low, it may not be a problem if destination facilities (i.e. pools and pool complexes) located in East and South are relatively easy to get to from West, since people will typically travel farther to get to those facilities. This should be looked into further to determine whether or not a problem
does exist for service in the West planning area. Further investigation may suggest a need for some additional or upgraded facilities to be located within West.
Perspective F: Access to Sports Fields This perspective shows the LOS for all sports fields in the inventory, including softball, baseball, and multi‐use fields. Both the main perspective and the inset PF‐2: GRASP® LOS Meeting Threshold Scores show that the distribution of fields across Spokane provides good coverage for service and that the value of the service throughout the coverage area is meeting or exceeding the threshold value. The threshold value for this Perspective is based on 9.6 Table F‐1 shows the values derived from Perspective F. Overall, 79% of Spokane is covered by service for sports fields, with coverage highest in the East planning area at 88%. West has the lowest coverage, but it is still good at 75%. Values for the other three indicators, Average LOS Per Acre Served, Average LOS Per Acre Per Population Density, and the GRASP® Index are all consistent among the planning areas, reflecting the uniformity of service across the city for sports fields. Table F‐1 ‐ Perspective F: Access to Sports Fields (Baseball/Softball and Multi‐Purpose Fields)
Percent With LOS
Avg. LOS Per Acre Served
Avg. LOS Per Acre Per Pop.
GRASP® Index
Planning Area
City of Spokane 79% 17 3 1.3
East 88% 19 3 1.2
South 76% 17 4 1.5
West 75% 16 3 1.3
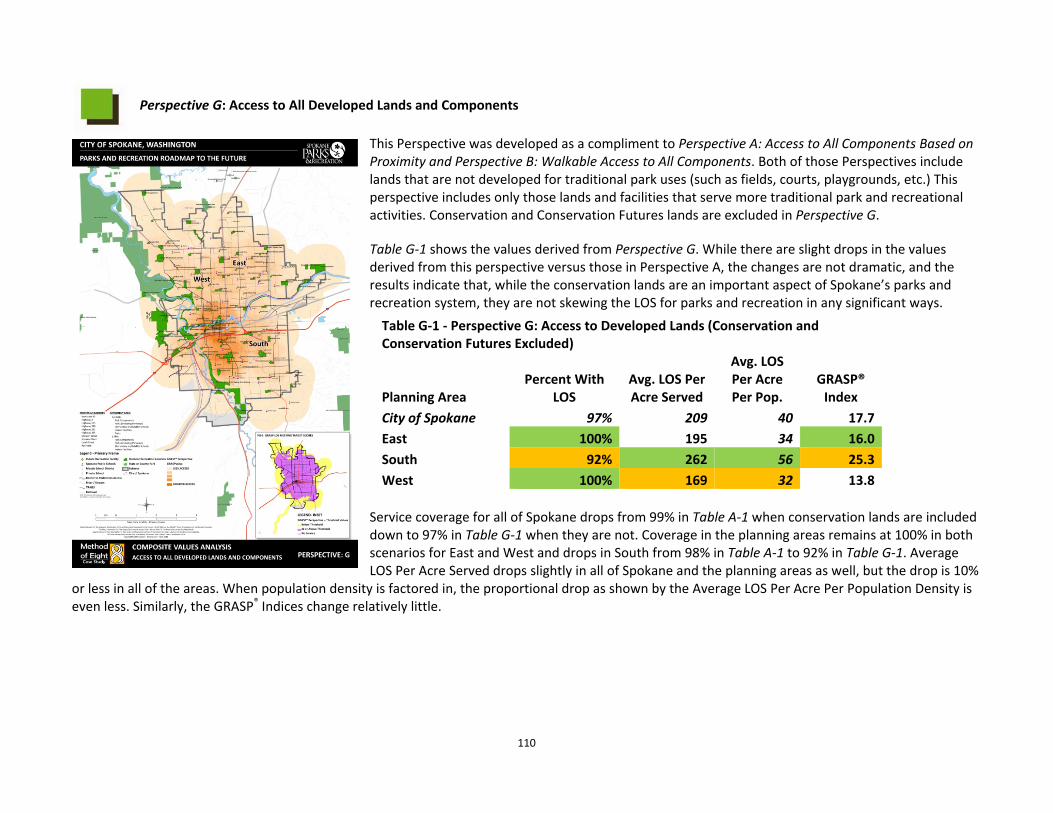
110
Perspective G: Access to All Developed Lands and Components
This Perspective was developed as a compliment to Perspective A: Access to All Components Based on Proximity and Perspective B: Walkable Access to All Components. Both of those Perspectives include lands that are not developed for traditional park uses (such as fields, courts, playgrounds, etc.) This perspective includes only those lands and facilities that serve more traditional park and recreational activities. Conservation and Conservation Futures lands are excluded in Perspective G. Table G‐1 shows the values derived from Perspective G. While there are slight drops in the values derived from this perspective versus those in Perspective A, the changes are not dramatic, and the results indicate that, while the conservation lands are an important aspect of Spokane’s parks and recreation system, they are not skewing the LOS for parks and recreation in any significant ways.
Service coverage for all of Spokane drops from 99% in Table A‐1 when conservation lands are included down to 97% in Table G‐1 when they are not. Coverage in the planning areas remains at 100% in both scenarios for East and West and drops in South from 98% in Table A‐1 to 92% in Table G‐1. Average LOS Per Acre Served drops slightly in all of Spokane and the planning areas as well, but the drop is 10%
or less in all of the areas. When population density is factored in, the proportional drop as shown by the Average LOS Per Acre Per Population Density is even less. Similarly, the GRASP® Indices change relatively little.
Table G‐1 ‐ Perspective G: Access to Developed Lands (Conservation and Conservation Futures Excluded)
Percent With LOS
Avg. LOS Per Acre Served
Avg. LOS Per Acre Per Pop.
GRASP® Index
Planning Area
City of Spokane 97% 209 40 17.7
East 100% 195 34 16.0
South 92% 262 56 25.3
West 100% 169 32 13.8
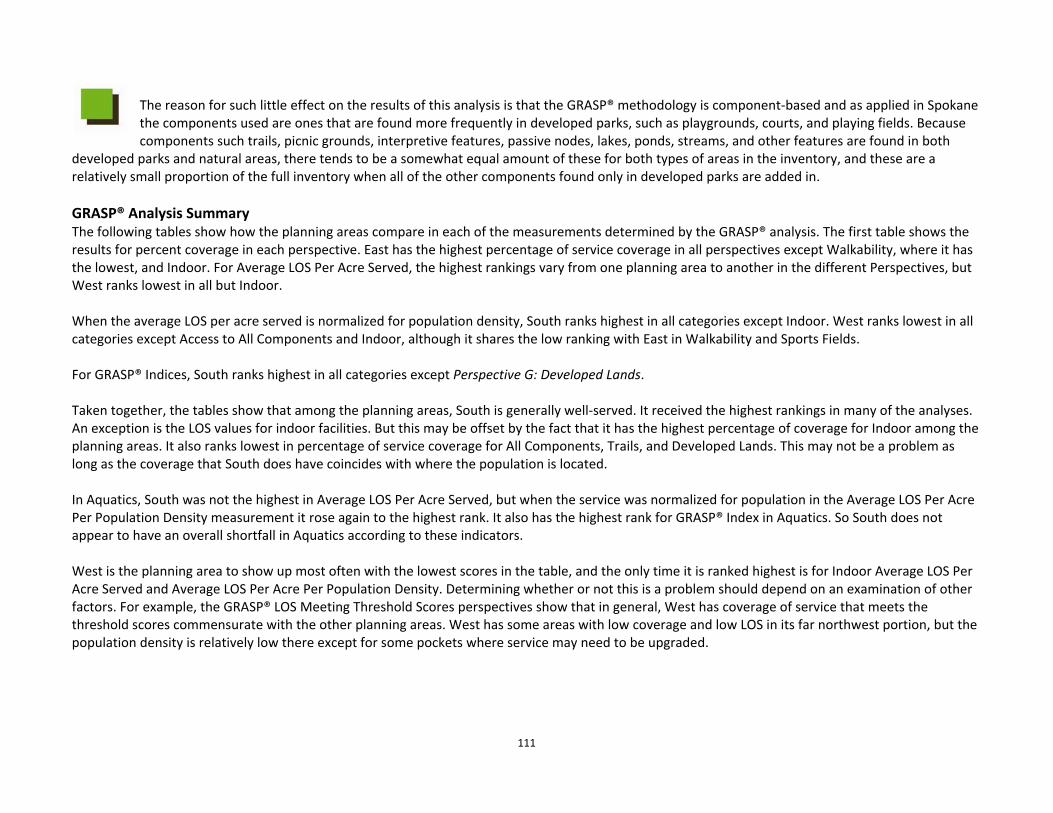
111
The reason for such little effect on the results of this analysis is that the GRASP® methodology is component‐based and as applied in Spokane the components used are ones that are found more frequently in developed parks, such as playgrounds, courts, and playing fields. Because components such trails, picnic grounds, interpretive features, passive nodes, lakes, ponds, streams, and other features are found in both
developed parks and natural areas, there tends to be a somewhat equal amount of these for both types of areas in the inventory, and these are a relatively small proportion of the full inventory when all of the other components found only in developed parks are added in. GRASP® Analysis Summary The following tables show how the planning areas compare in each of the measurements determined by the GRASP® analysis. The first table shows the results for percent coverage in each perspective. East has the highest percentage of service coverage in all perspectives except Walkability, where it has the lowest, and Indoor. For Average LOS Per Acre Served, the highest rankings vary from one planning area to another in the different Perspectives, but West ranks lowest in all but Indoor. When the average LOS per acre served is normalized for population density, South ranks highest in all categories except Indoor. West ranks lowest in all categories except Access to All Components and Indoor, although it shares the low ranking with East in Walkability and Sports Fields. For GRASP® Indices, South ranks highest in all categories except Perspective G: Developed Lands. Taken together, the tables show that among the planning areas, South is generally well‐served. It received the highest rankings in many of the analyses. An exception is the LOS values for indoor facilities. But this may be offset by the fact that it has the highest percentage of coverage for Indoor among the planning areas. It also ranks lowest in percentage of service coverage for All Components, Trails, and Developed Lands. This may not be a problem as long as the coverage that South does have coincides with where the population is located. In Aquatics, South was not the highest in Average LOS Per Acre Served, but when the service was normalized for population in the Average LOS Per Acre Per Population Density measurement it rose again to the highest rank. It also has the highest rank for GRASP® Index in Aquatics. So South does not appear to have an overall shortfall in Aquatics according to these indicators. West is the planning area to show up most often with the lowest scores in the table, and the only time it is ranked highest is for Indoor Average LOS Per Acre Served and Average LOS Per Acre Per Population Density. Determining whether or not this is a problem should depend on an examination of other factors. For example, the GRASP® LOS Meeting Threshold Scores perspectives show that in general, West has coverage of service that meets the threshold scores commensurate with the other planning areas. West has some areas with low coverage and low LOS in its far northwest portion, but the population density is relatively low there except for some pockets where service may need to be upgraded.
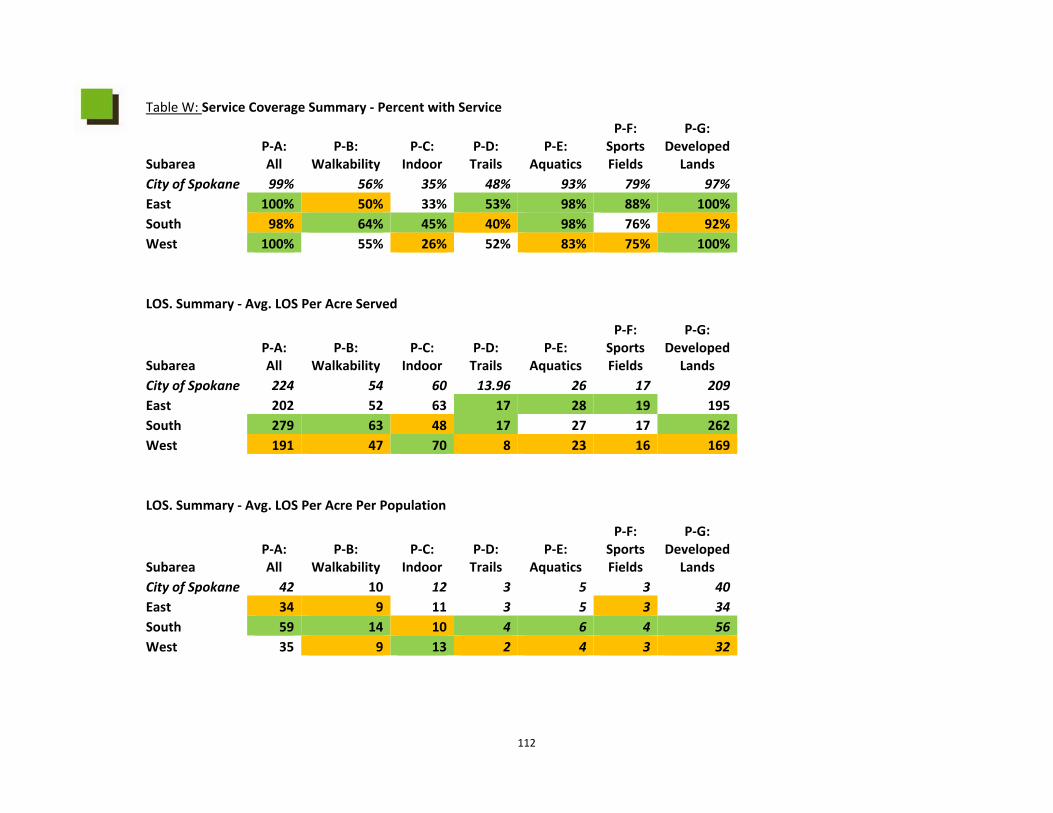
112
Table W: Service Coverage Summary ‐ Percent with Service
P‐A: All
P‐B: Walkability
P‐C: Indoor
P‐D: Trails
P‐E: Aquatics
P‐F: Sports Fields
P‐G: Developed
Lands Subarea City of Spokane 99% 56% 35% 48% 93% 79% 97%East 100% 50% 33% 53% 98% 88% 100%South 98% 64% 45% 40% 98% 76% 92%West 100% 55% 26% 52% 83% 75% 100% LOS. Summary ‐ Avg. LOS Per Acre Served
P‐A: All
P‐B: Walkability
P‐C: Indoor
P‐D: Trails
P‐E: Aquatics
P‐F: Sports Fields
P‐G: Developed
Lands Subarea City of Spokane 224 54 60 13.96 26 17 209East 202 52 63 17 28 19 195South 279 63 48 17 27 17 262West 191 47 70 8 23 16 169 LOS. Summary ‐ Avg. LOS Per Acre Per Population
P‐A: All
P‐B: Walkability
P‐C: Indoor
P‐D: Trails
P‐E: Aquatics
P‐F: Sports Fields
P‐G: Developed
Lands Subarea City of Spokane 42 10 12 3 5 3 40East 34 9 11 3 5 3 34South 59 14 10 4 6 4 56West 35 9 13 2 4 3 32
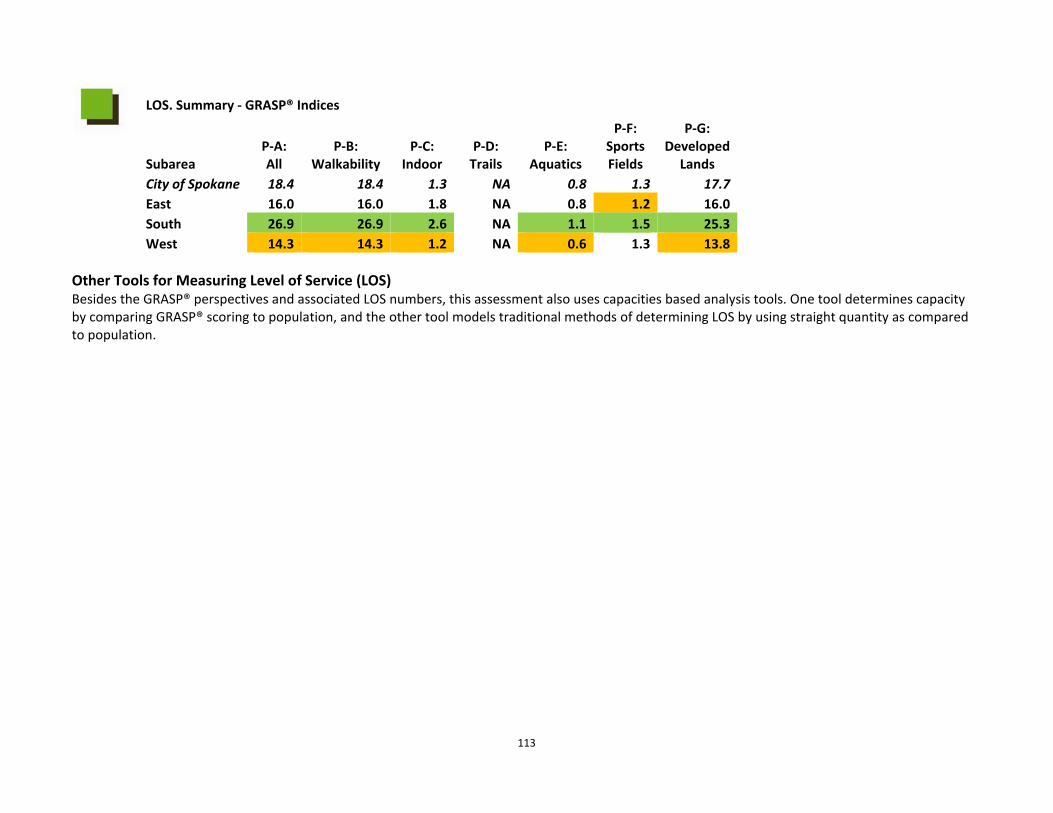
113
LOS. Summary ‐ GRASP® Indices
P‐A: All
P‐B: Walkability
P‐C: Indoor
P‐D: Trails
P‐E: Aquatics
P‐F: Sports Fields
P‐G: Developed
Lands Subarea City of Spokane 18.4 18.4 1.3 NA 0.8 1.3 17.7East 16.0 16.0 1.8 NA 0.8 1.2 16.0South 26.9 26.9 2.6 NA 1.1 1.5 25.3West 14.3 14.3 1.2 NA 0.6 1.3 13.8
Other Tools for Measuring Level of Service (LOS) Besides the GRASP® perspectives and associated LOS numbers, this assessment also uses capacities based analysis tools. One tool determines capacity by comparing GRASP® scoring to population, and the other tool models traditional methods of determining LOS by using straight quantity as compared to population.
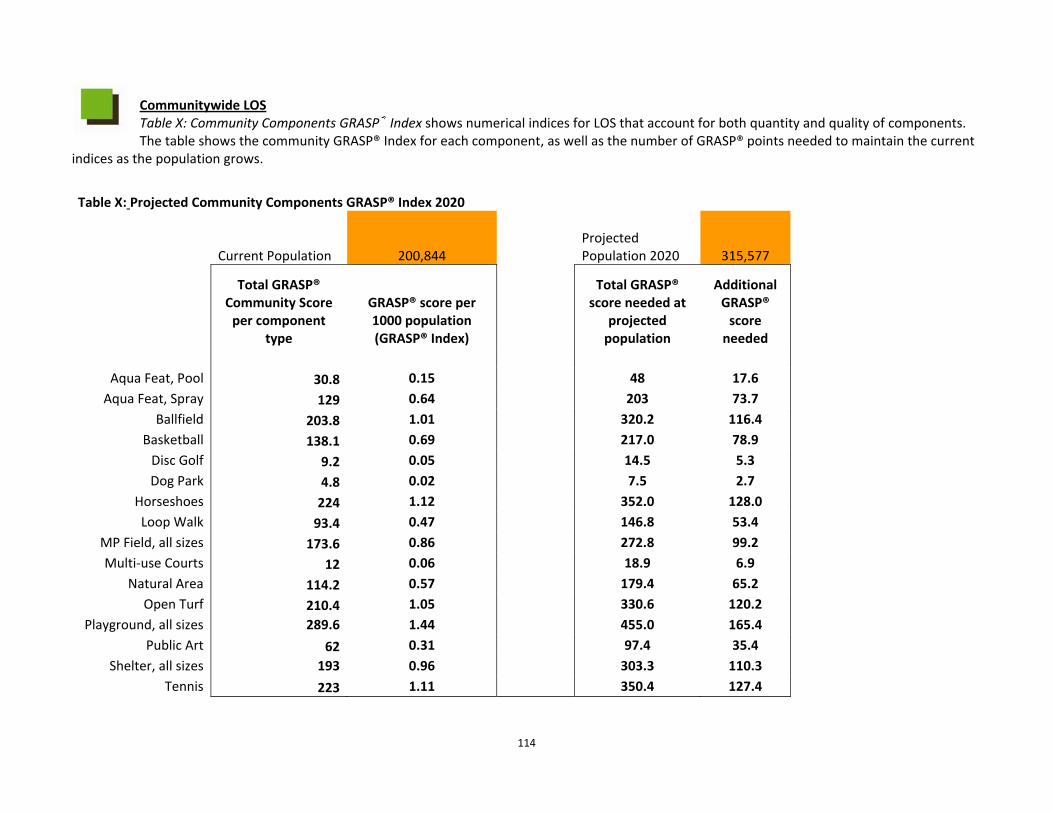
114
Communitywide LOS Table X: Community Components GRASP® Index shows numerical indices for LOS that account for both quantity and quality of components. The table shows the community GRASP® Index for each component, as well as the number of GRASP® points needed to maintain the current
indices as the population grows.
Table X: Projected Community Components GRASP® Index 2020
Current Population 200,844 Projected Population 2020 315,577
Total GRASP® Community Score per component
type
GRASP® score per 1000 population (GRASP® Index)
Total GRASP® score needed at
projected population
Additional GRASP® score needed
Aqua Feat, Pool 30.8 0.15 48 17.6 Aqua Feat, Spray 129 0.64 203 73.7
Ballfield 203.8 1.01 320.2 116.4 Basketball 138.1 0.69 217.0 78.9 Disc Golf 9.2 0.05 14.5 5.3 Dog Park 4.8 0.02 7.5 2.7
Horseshoes 224 1.12 352.0 128.0 Loop Walk 93.4 0.47 146.8 53.4
MP Field, all sizes 173.6 0.86 272.8 99.2 Multi‐use Courts 12 0.06 18.9 6.9
Natural Area 114.2 0.57 179.4 65.2 Open Turf 210.4 1.05 330.6 120.2
Playground, all sizes 289.6 1.44 455.0 165.4 Public Art 62 0.31 97.4 35.4
Shelter, all sizes 193 0.96 303.3 110.3 Tennis 223 1.11 350.4 127.4
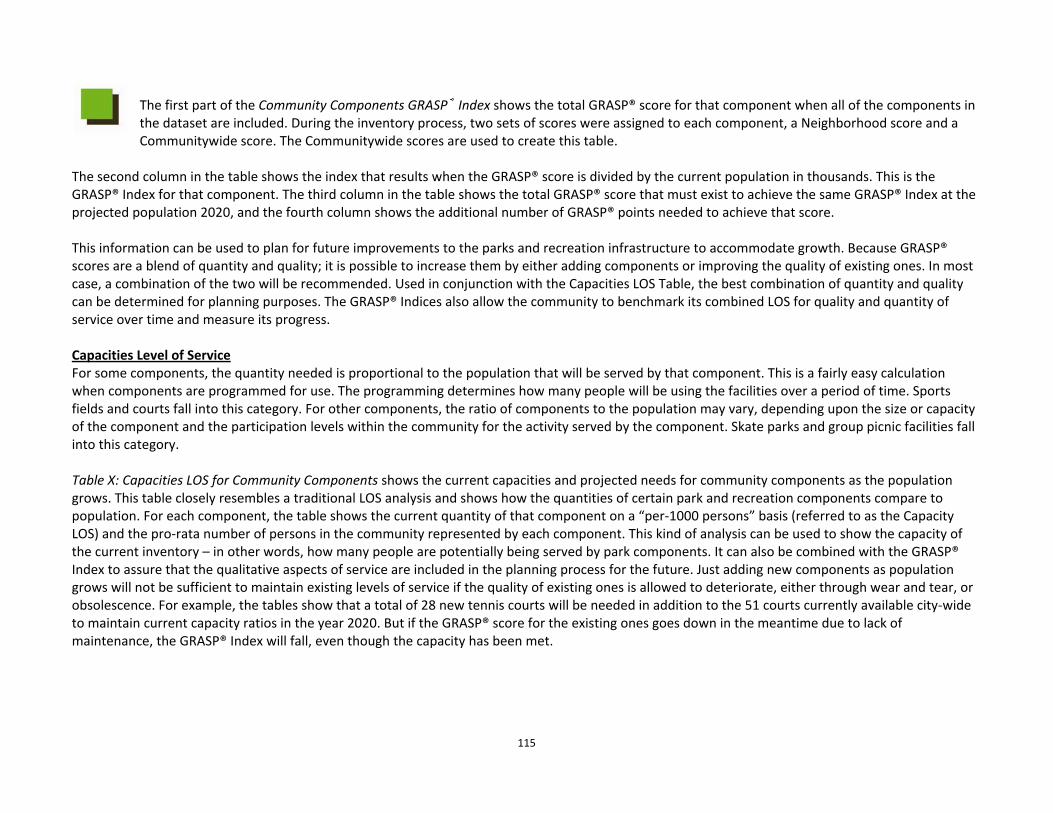
115
The first part of the Community Components GRASP® Index shows the total GRASP® score for that component when all of the components in the dataset are included. During the inventory process, two sets of scores were assigned to each component, a Neighborhood score and a Communitywide score. The Communitywide scores are used to create this table.
The second column in the table shows the index that results when the GRASP® score is divided by the current population in thousands. This is the GRASP® Index for that component. The third column in the table shows the total GRASP® score that must exist to achieve the same GRASP® Index at the projected population 2020, and the fourth column shows the additional number of GRASP® points needed to achieve that score. This information can be used to plan for future improvements to the parks and recreation infrastructure to accommodate growth. Because GRASP® scores are a blend of quantity and quality; it is possible to increase them by either adding components or improving the quality of existing ones. In most case, a combination of the two will be recommended. Used in conjunction with the Capacities LOS Table, the best combination of quantity and quality can be determined for planning purposes. The GRASP® Indices also allow the community to benchmark its combined LOS for quality and quantity of service over time and measure its progress. Capacities Level of Service For some components, the quantity needed is proportional to the population that will be served by that component. This is a fairly easy calculation when components are programmed for use. The programming determines how many people will be using the facilities over a period of time. Sports fields and courts fall into this category. For other components, the ratio of components to the population may vary, depending upon the size or capacity of the component and the participation levels within the community for the activity served by the component. Skate parks and group picnic facilities fall into this category. Table X: Capacities LOS for Community Components shows the current capacities and projected needs for community components as the population grows. This table closely resembles a traditional LOS analysis and shows how the quantities of certain park and recreation components compare to population. For each component, the table shows the current quantity of that component on a “per‐1000 persons” basis (referred to as the Capacity LOS) and the pro‐rata number of persons in the community represented by each component. This kind of analysis can be used to show the capacity of the current inventory – in other words, how many people are potentially being served by park components. It can also be combined with the GRASP® Index to assure that the qualitative aspects of service are included in the planning process for the future. Just adding new components as population grows will not be sufficient to maintain existing levels of service if the quality of existing ones is allowed to deteriorate, either through wear and tear, or obsolescence. For example, the tables show that a total of 28 new tennis courts will be needed in addition to the 51 courts currently available city‐wide to maintain current capacity ratios in the year 2020. But if the GRASP® score for the existing ones goes down in the meantime due to lack of maintenance, the GRASP® Index will fall, even though the capacity has been met.
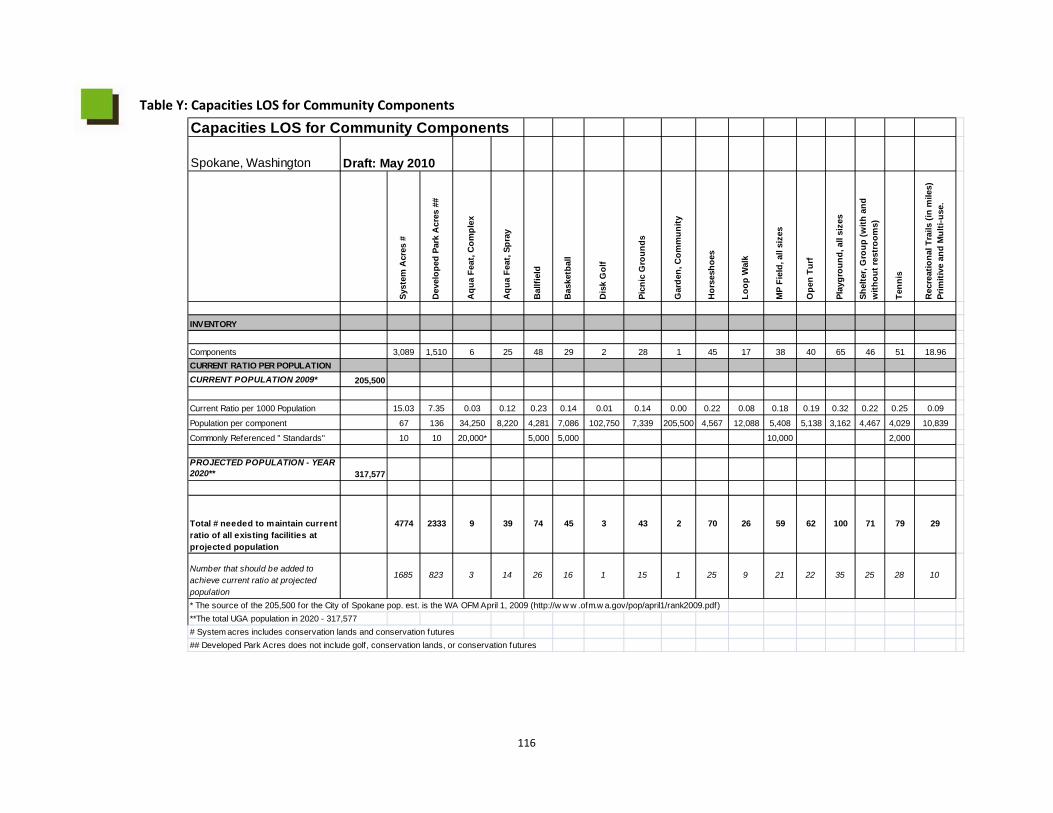
116
Table Y: Capacities LOS for Community Components
Capacities LOS for Community Components
Spokane, Washington Draft: May 2010
Syst
em A
cres
#
Dev
elop
ed P
ark
Acr
es #
#
Aqu
a Fe
at, C
ompl
ex
Aqu
a Fe
at, S
pray
Bal
lfiel
d
Bas
ketb
all
Dis
k G
olf
Picn
ic G
roun
ds
Gar
den,
Com
mun
ity
Hor
sesh
oes
Loop
Wal
k
MP
Fiel
d, a
ll si
zes
Ope
n Tu
rf
Play
grou
nd, a
ll si
zes
Shel
ter,
Gro
up (w
ith a
nd
with
out r
estr
oom
s)
Tenn
is
Rec
reat
iona
l Tra
ils (i
n m
iles)
Pr
imiti
ve a
nd M
ulti-
use.
INVENTORY
Components 3,089 1,510 6 25 48 29 2 28 1 45 17 38 40 65 46 51 18.96CURRENT RATIO PER POPULATIONCURRENT POPULATION 2009* 205,500
Current Ratio per 1000 Population 15.03 7.35 0.03 0.12 0.23 0.14 0.01 0.14 0.00 0.22 0.08 0.18 0.19 0.32 0.22 0.25 0.09
Population per component 67 136 34,250 8,220 4,281 7,086 102,750 7,339 205,500 4,567 12,088 5,408 5,138 3,162 4,467 4,029 10,839
Commonly Referenced " Standards" 10 10 20,000* 5,000 5,000 10,000 2,000
PROJECTED POPULATION - YEAR 2020** 317,577
Total # needed to maintain current ratio of all existing facilities at projected population
4774 2333 9 39 74 45 3 43 2 70 26 59 62 100 71 79 29
Number that should be added to achieve current ratio at projected population
1685 823 3 14 26 16 1 15 1 25 9 21 22 35 25 28 10
* The source of the 205,500 for the City of Spokane pop. est. is the WA OFM April 1, 2009 (http://w w w .ofm.w a.gov/pop/april1/rank2009.pdf)**The total UGA population in 2020 - 317,577# System acres includes conservation lands and conservation futures## Developed Park Acres does not include golf, conservation lands, or conservation futures
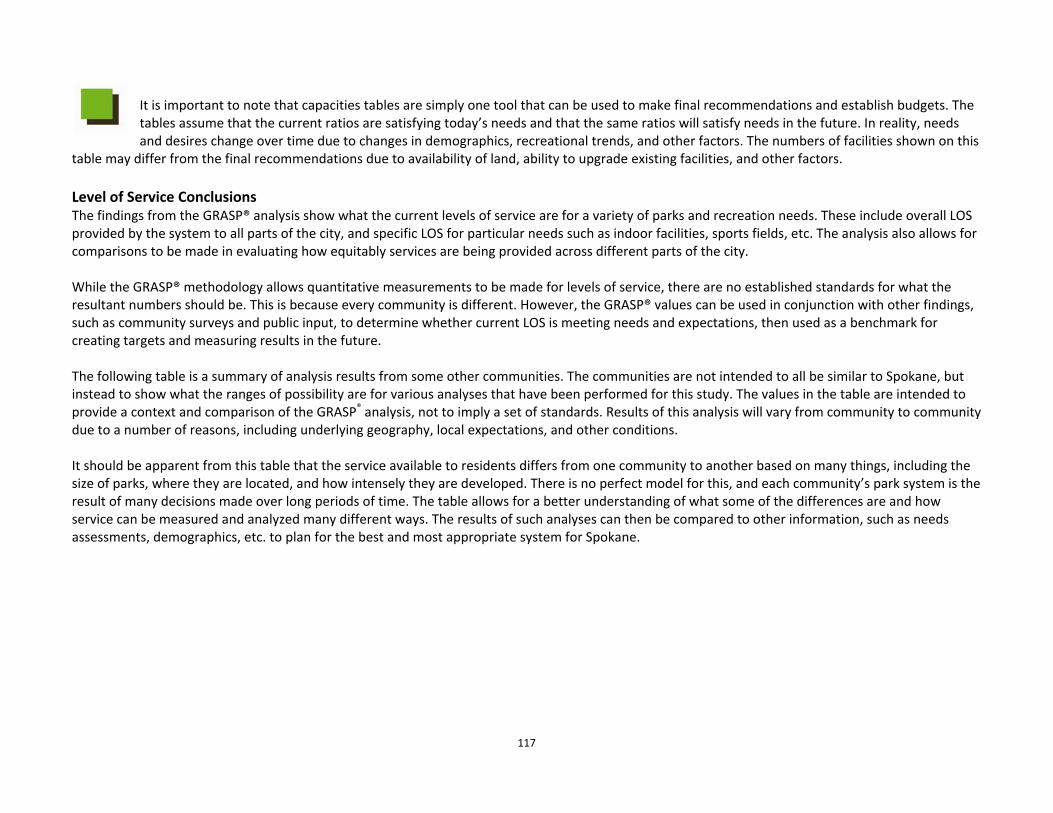
117
It is important to note that capacities tables are simply one tool that can be used to make final recommendations and establish budgets. The tables assume that the current ratios are satisfying today’s needs and that the same ratios will satisfy needs in the future. In reality, needs and desires change over time due to changes in demographics, recreational trends, and other factors. The numbers of facilities shown on this
table may differ from the final recommendations due to availability of land, ability to upgrade existing facilities, and other factors. Level of Service Conclusions The findings from the GRASP® analysis show what the current levels of service are for a variety of parks and recreation needs. These include overall LOS provided by the system to all parts of the city, and specific LOS for particular needs such as indoor facilities, sports fields, etc. The analysis also allows for comparisons to be made in evaluating how equitably services are being provided across different parts of the city. While the GRASP® methodology allows quantitative measurements to be made for levels of service, there are no established standards for what the resultant numbers should be. This is because every community is different. However, the GRASP® values can be used in conjunction with other findings, such as community surveys and public input, to determine whether current LOS is meeting needs and expectations, then used as a benchmark for creating targets and measuring results in the future. The following table is a summary of analysis results from some other communities. The communities are not intended to all be similar to Spokane, but instead to show what the ranges of possibility are for various analyses that have been performed for this study. The values in the table are intended to provide a context and comparison of the GRASP® analysis, not to imply a set of standards. Results of this analysis will vary from community to community due to a number of reasons, including underlying geography, local expectations, and other conditions. It should be apparent from this table that the service available to residents differs from one community to another based on many things, including the size of parks, where they are located, and how intensely they are developed. There is no perfect model for this, and each community’s park system is the result of many decisions made over long periods of time. The table allows for a better understanding of what some of the differences are and how service can be measured and analyzed many different ways. The results of such analyses can then be compared to other information, such as needs assessments, demographics, etc. to plan for the best and most appropriate system for Spokane.
118
Table Z: GRASP® Comparative Data
In general, the findings show that Spokane has a well‐distributed system of parks and recreation facilities that is meeting a wide range of needs. Overall, Spokane is providing its residents with parks and recreation amenities that are reasonably located in proximity to homes and which include enough components within them at a level of quality sufficient to meet targeted thresholds for service. The mix of components in most parts of the city offers residents a good choice of opportunities for a variety of activities. The per‐capita value of service (GRASP® Index) is comparable to places like Asheville, North Carolina, which is recognized for its high quality of life, and Prince George’s County, Maryland, which has received many awards for parks and recreation. In summary, Spokane has a park system that lives up to, and is a legacy of, its early commitment to parks and recreation a century ago. The system includes both an adequate supply of well‐planned and maintained parks throughout the city to serve residents at their local level, along with a collection of truly unique and wonderful “destination” parks that delight not only local residents, but visitors from around the world as well.
STATE CITY POPULATION
STUDY AREA SIZE (Acres)
# OF SITES (Parks, Facilties, etc.)
TOTAL # OF COMPONENTS
AVG. # COMPONENTS
per SITE
TOTAL GRASP® VALUE (Entire System)
GRASP® INDEX
AVG. SCORE/SITE
% of TOTAL AREA
w/LOS >0
AVG. LOS PER ACRE SERVED
CO FORT COLLINS 130,681 33,388 45 619 13.76 2675 20 59.44 83.3 217
CO LAKEWOOD 144,369 27,494 105 738 7 6476.3 45 61.68 99.8 NA
CO LONE TREE 10,134 1,382 49 219 4.5 560.5 55 11.43 75.8 225.7
FL FT LAUDERDALE 181,095 23,230 91 483 4.5 2661.9 15 29.25 97.8 221.4
FL WINTER HAVEN 100,000 42,191 31 230 7.4 328 3 10.58 37.2 174.9
IA CEDAR RAPIDS 143,788 45,987 98 759 7.4 2467 17 25.17 86 299.6
IL LISLE 32,200 6,239 39 171.5 4.4 733.5 23 18.81 100 262
IN BLOOMINGTON 72,032 15,001 45 258 5.7 2125.4 30 47.23 99.2 197.4
OK TULSAS 384,037 356,383 186 1588 8.5 5535.5 14.5 29.76 86.8 111.3
MA BROOKLINE 60,000 NA 74 128 1.8 551 9 7.45 NA NA
MD M‐NCPPC 828,770 318,926 526 2369 4.5 11,800 14 22.43 93 168.8
NC ASHEVILLE 75,948 27,027 58 378 7.1 1043.2 14 17.99 77 322.9
UT SOUTH JORDAN 44,276 14,081 48 172 3.6 1578.4 36 32.88 44 29.75
VA ARLINGTON 190,000 NA 225 494 2.2 NA NA NA NA NA
WA SPOKANE 200,844 38,440 107 673 6.29 3705.2 18.4 34.63 99 220
WA TACOMA 203,984 34,133 104 488 4.7 NA NA NA NA NA
119
Current Policies and Practices According to the Capital Facilities Element of the Comprehensive Plan regarding future park needs, the city measures Level of Service (LOS) by comparing the acres of parks per every thousand residents.
“The proposed level of service for neighborhood parks is 1.17 acres per one thousand residents, 1.49 acres for community parks, 2.59 acres for major parks, and .03 acres for neighborhood mini‐parks. For projecting future need, the LOS for each park type is totaled to 5.28 parks per thousand residents. The City is about 6 acres below the low NRPA guideline of 11.25 acres per thousand residents. The City does not measure LOS for conservation land, parkways, or trails. These park types are typically purchased and developed on an opportunity basis. The city seeks to purchase and designate conservation land each year. The primary funding source is the Conservation Futures Program, which is administered by Spokane County. Parkways are designated as part of the arterial street plan.”
According to the inventory and level of service analysis conducted for the Roadmap to the Future project, the current total developed and undeveloped/conservation park acreage (excluding public golf courses) per population is 15 acres per 1000 population. Taking only the developed parkland (such as a typical neighborhood park with a playground, shelter, and athletic field) there is 7.35 acres per 1000. (Calculations are based on a Washington State Office of Financial Management April 1, 2009 population estimate of 205,500.)
Planning Coordination Current Policies and Practices The Parks, Recreation, and Open Spaces chapter of the Comprehensive Plan includes a goal and policies on agency coordination and cooperation. In addition, several of the Countywide Planning Policies (CWPP) on parks and open space address coordination between municipalities and Spokane County to comprehensively plan for open space corridors. One specific policy, CWPP 1.15, states:
“ Jurisdictions should work together to develop and implement regionally consistent, incentive‐based programs to protect open space with Urban Growth Areas (UGAs).”
120
Key Parks and Recreation Services – Evaluation & Analysis Considerations
• A number of parks and recreation services including, but not limited to some senior center services did not align with the Department’s values or vision. Although these services are expectedly important to certain community members, the fundamental question is whether they are “parks and recreation services” or “social services,” therefore, supported by another city department with relevant mission(s).
• The City has committed resources to local non‐profit youth and senior centers to assist in the provision of recreation and other social services on behalf of Parks and Recreation. Additionally, the Parks and Recreation Department engages in contractual agreements for golf personnel services. These agreements are inconsistent in expectations and fund allocation, and require consistent evaluation to ensure responsible distribution of financial resources and that service delivery expectations are being met.
• As a result of the assessment, many services seem to have the capacity to generate additional revenues through advancing or affirming the services’ market position.
• Few formal collaborative efforts and partnerships exist between the City of Spokane Parks and Recreation Department and other public, non‐profit or private organizations. Collaborations and partnerships are critical to reducing or eliminating duplication of services, and the most responsible utilization of scarce resources.
• As a result of the assessment, a number of services were identified which seem to have great potential for collaboration or partnerships with other public entities, non‐profit organizations or the private sector.
• There were a few Department services, including neighborhood, community, and regional/major parks; trails; conservation lands; and inclusion services which were deemed “core” in relation to their alignment with Department values and vision, and therefore, are labeled “core services.”
• Maintain the quality and character of the current system in light of shrinking resources. • Assure that the system evolves to stay current with trends and needs while preserving and respecting strong historic aspects. This could include
adding more recreational trails and enhancing opportunities for indoor recreation. • Grow the system efficiently and sustainably to accommodate projected increases in population. • Improve the walkability of Spokane’s park system to enhance the city as a healthy place to live. • Leverage Spokane’s park system to strengthen the city’s tradition of strong neighborhood identities and enhance its overall image as a desirable
place to live, work, and visit. • Better planning collaboration and coordination between the Park Board, City Council, department staff, other City departments, and community
stakeholder groups. • There are many different, fragmented planning efforts and plans that need to be tied together, especially related to the downtown area,
including Riverfront Park. • Parks and Recreation Department representatives should be at the table for City initiatives such as the Green Team and the Sustainability Task
Force and the Water Stewardship Program. • Collaboration and coordination with other public agencies that own land that serves parks and recreation functions such as stormwater
detention land that functions as a park to adjacent neighborhoods.

121
• The City of Spokane has a broad and well‐distributed system of parks and conversation lands. In order to maintain this system as Spokane grows it will be imperative to identify new policies and strategies to guide the creation of new parks and open space.

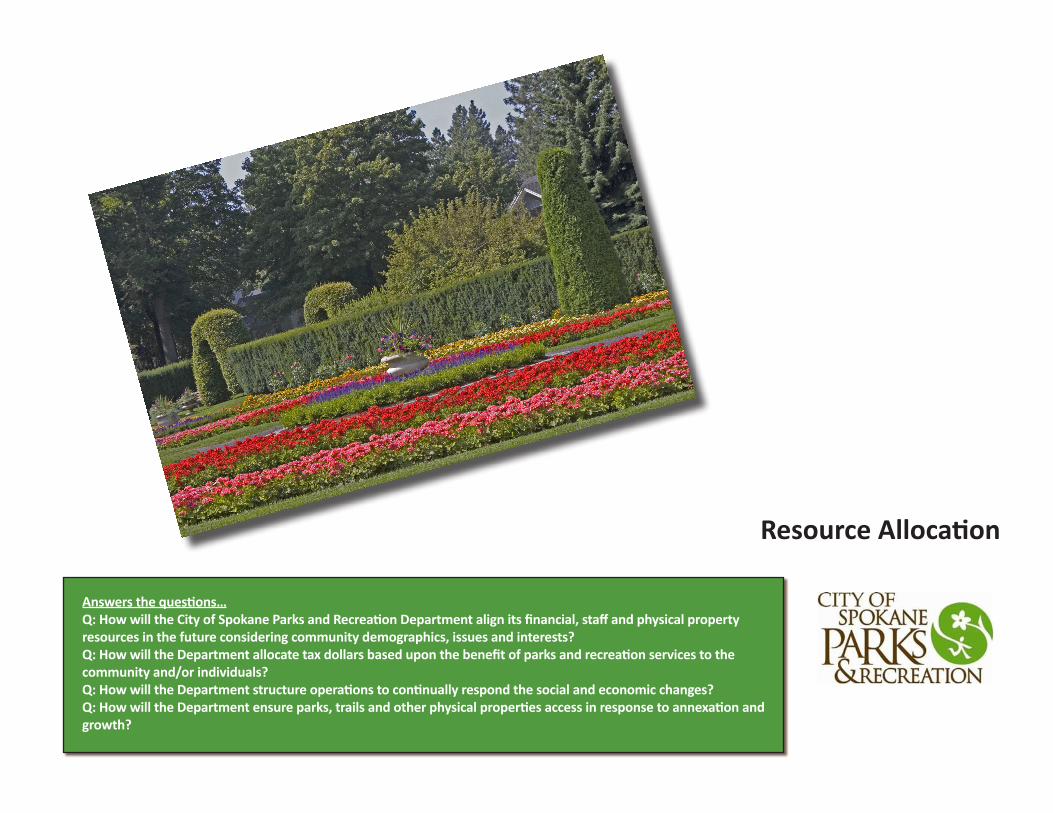
Resource Allocation
Answers the questions…Q: How will the City of Spokane Parks and Recreation Department align its financial, staff and physical property resources in the future considering community demographics, issues and interests?Q: How will the Department allocate tax dollars based upon the benefit of parks and recreation services to the community and/or individuals?Q: How will the Department structure operations to continually respond the social and economic changes?Q: How will the Department ensure parks, trails and other physical properties access in response to annexation and growth?

125
Financial Resource Allocation The development of a Financial Resource Allocation Philosophy directly affects the establishment of future cost recovery and subsidy
allocation goals, and future pricing strategies and methods. A comprehensive review and analysis of the Department’s past and current financial position as well as the development of a financial resource allocation philosophy will assist the Department as it moves forward in efforts to sustain services over both the short and long‐term. Having a Financial Resource Allocation Model which includes cost recovery goals and a pricing strategy can help the City of Spokane Parks and Recreation Department answer challenging questions from its stakeholders. Such questions include:
Does the City of Spokane Parks and Recreation Department provide services that align with the community’s values, the project vision, and mission of the organization?
How will the Spokane Parks and Recreation Department fund services related to budget constraints in the future? Is the City of Spokane Parks and Recreation Department utilizing funding in a responsible manner and maintaining a high level of
governmental accountability? Are the Spokane Parks and Recreation Department services priced in a justifiable and defensible way?
Cost Recovery and Subsidy Cost recovery is the degree to which the operational and maintenance costs of parks and recreation services are financially supported by user fees and/or other alternative funding mechanisms such as grants, partnerships, donations, sponsorships, volunteers or other funding sources. In contrast, subsidy includes designated General Fund sources such as sales taxes, property taxes, or other taxing mechanisms that financially support operations and maintenance of services. Subsidy dollars provide for service costs that are not recovered by either user fees or other forms of alternative funding. Essentially, subsidy is the community’s investment in parks and recreation. Currently, the City of Spokane Parks and Recreation Department is operating at an approximate 30 percent cost recovery level (this includes all park and recreation revenues and expenses, and the relevant portion of the fleet cost allocations). This translates to 70 percent of operations subsidized by the General Fund. The Department desires striving for an increased goal of 40 percent cost recovery. This is due to the current economic conditions, recent significant capital development without ongoing operations and maintenance identified, and several deferred maintenance issues. This increased goal would result in lessening dependence on the general fund to a 60 percent subsidy.
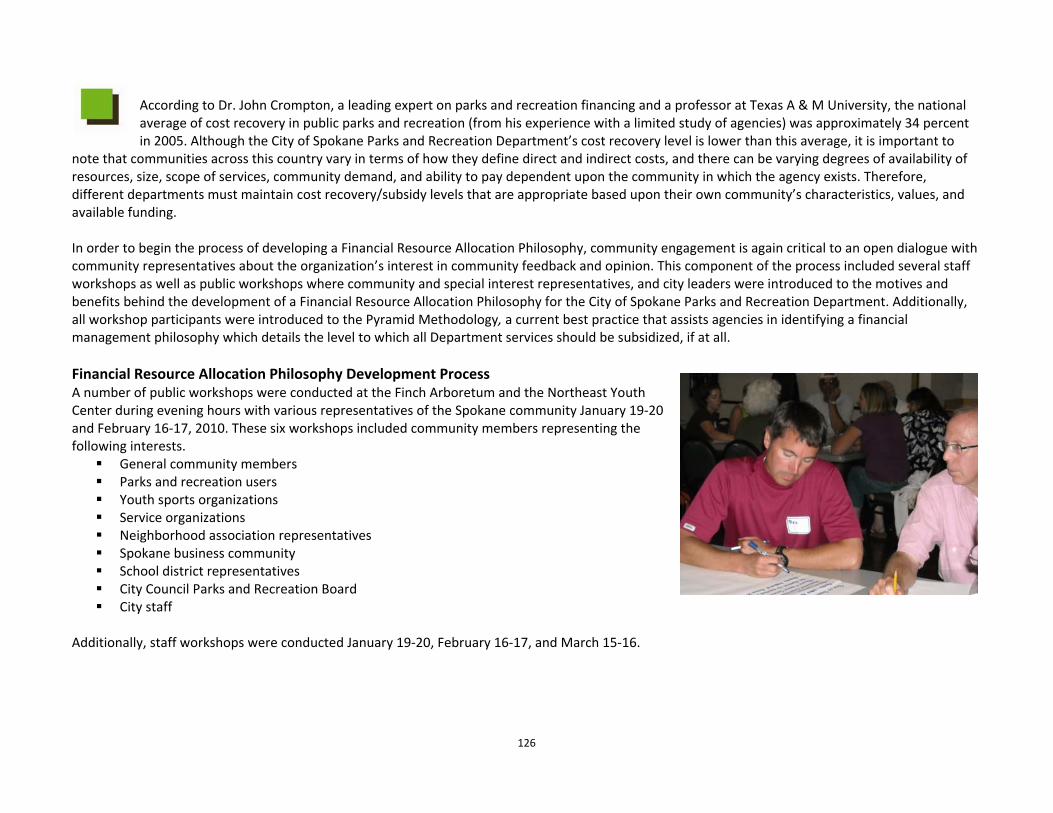
126
According to Dr. John Crompton, a leading expert on parks and recreation financing and a professor at Texas A & M University, the national average of cost recovery in public parks and recreation (from his experience with a limited study of agencies) was approximately 34 percent in 2005. Although the City of Spokane Parks and Recreation Department’s cost recovery level is lower than this average, it is important to
note that communities across this country vary in terms of how they define direct and indirect costs, and there can be varying degrees of availability of resources, size, scope of services, community demand, and ability to pay dependent upon the community in which the agency exists. Therefore, different departments must maintain cost recovery/subsidy levels that are appropriate based upon their own community’s characteristics, values, and available funding. In order to begin the process of developing a Financial Resource Allocation Philosophy, community engagement is again critical to an open dialogue with community representatives about the organization’s interest in community feedback and opinion. This component of the process included several staff workshops as well as public workshops where community and special interest representatives, and city leaders were introduced to the motives and benefits behind the development of a Financial Resource Allocation Philosophy for the City of Spokane Parks and Recreation Department. Additionally, all workshop participants were introduced to the Pyramid Methodology, a current best practice that assists agencies in identifying a financial management philosophy which details the level to which all Department services should be subsidized, if at all. Financial Resource Allocation Philosophy Development Process A number of public workshops were conducted at the Finch Arboretum and the Northeast Youth Center during evening hours with various representatives of the Spokane community January 19‐20 and February 16‐17, 2010. These six workshops included community members representing the following interests.
General community members Parks and recreation users Youth sports organizations Service organizations Neighborhood association representatives Spokane business community School district representatives City Council Parks and Recreation Board City staff
Additionally, staff workshops were conducted January 19‐20, February 16‐17, and March 15‐16.
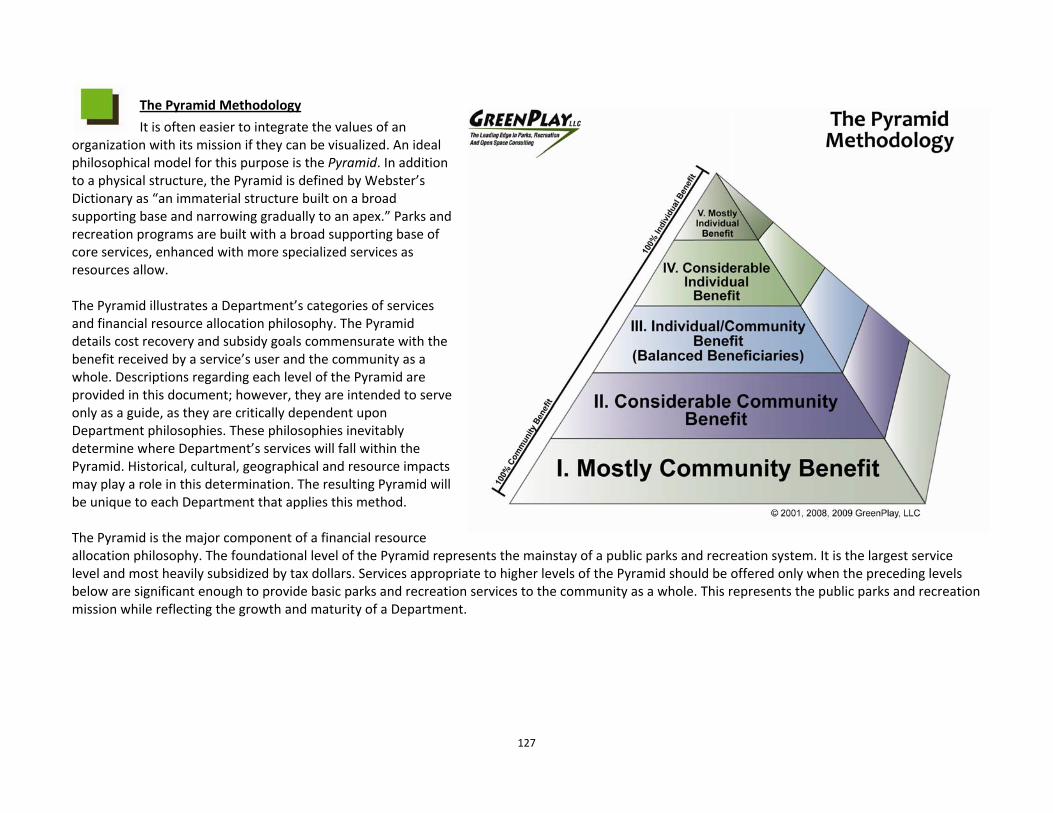
127
The Pyramid Methodology
It is often easier to integrate the values of an organization with its mission if they can be visualized. An ideal philosophical model for this purpose is the Pyramid. In addition to a physical structure, the Pyramid is defined by Webster’s Dictionary as “an immaterial structure built on a broad supporting base and narrowing gradually to an apex.” Parks and recreation programs are built with a broad supporting base of core services, enhanced with more specialized services as resources allow. The Pyramid illustrates a Department’s categories of services and financial resource allocation philosophy. The Pyramid details cost recovery and subsidy goals commensurate with the benefit received by a service’s user and the community as a whole. Descriptions regarding each level of the Pyramid are provided in this document; however, they are intended to serve only as a guide, as they are critically dependent upon Department philosophies. These philosophies inevitably determine where Department’s services will fall within the Pyramid. Historical, cultural, geographical and resource impacts may play a role in this determination. The resulting Pyramid will be unique to each Department that applies this method. The Pyramid is the major component of a financial resource allocation philosophy. The foundational level of the Pyramid represents the mainstay of a public parks and recreation system. It is the largest service level and most heavily subsidized by tax dollars. Services appropriate to higher levels of the Pyramid should be offered only when the preceding levels below are significant enough to provide basic parks and recreation services to the community as a whole. This represents the public parks and recreation mission while reflecting the growth and maturity of a Department.
128
Application of the Pyramid Methodology begins with the values, mission and vision of the Department, but must also address the following questions and issues:
Who benefits from the service, the Spokane community in general, the individual, or the group receiving the service? Does the individual or group receiving the service generate the need and therefore, the cost of providing the service? An example of this type of
service is a permitted activity in a park that requires police presence beyond the norm. Will imposing the fee pose an economic hardship on specific users? If the ability to pay does not align with the benefit and value of a service, consideration of this dynamic should be addressed during the
implementation phase of pricing and marketing. Do community values support taxpayer subsidy of the cost of service for individuals with special needs (e.g. specialized programs for people with
disabilities or services for low‐income families)? Are services federally mandated like inclusionary services as instituted by the American’s with Disabilities Act (ADA)? Will the level of the fee affect the demand for the service?
o Is it possible and desirable to manage demand for a service by changing the level of the fee? o Are there competing providers of the service in the public, nonprofit or private sector?
The creation of a financial resource allocation philosophy and policy is a key component to maintaining an agency’s financial control in the short and long term. Critical to this philosophical undertaking is the support and buy‐in of elected officials and advisory boards, staff, and ultimately, the community. Whether or not significant changes are called for, the Department should be certain that it philosophically aligns with its constituents. The development of a financial resource allocation philosophy and policy is built upon a very logical foundation, based upon the theory that those who benefit from parks and recreation services ultimately pay for services. The development of a financial resource allocation philosophy includes the following steps:
Step 1 ‐ Building on Spokane’s Parks and Recreation Department’s Values, Mission, and Vision Step 2 ‐ Understanding the Pyramid, the Benefits Filter, and Secondary Filters Step 3 ‐ Developing City of Spokane Parks and Recreation Department’s Categories of Service Step 4 ‐ Sorting City of Spokane Parks and Recreation Department’s Categories of Service onto the Pyramid Step 5 ‐ Determining (or Confirming) Current Subsidy/Cost Recovery Levels Step 6 ‐ Define Direct and Indirect Costs Step 7 ‐ Establishing Subsidy/Cost Recovery Goals Step 8 ‐ Understanding and Preparing for Influential Factors and Considerations Step 9 ‐ Implementation Step 10 ‐Evaluation
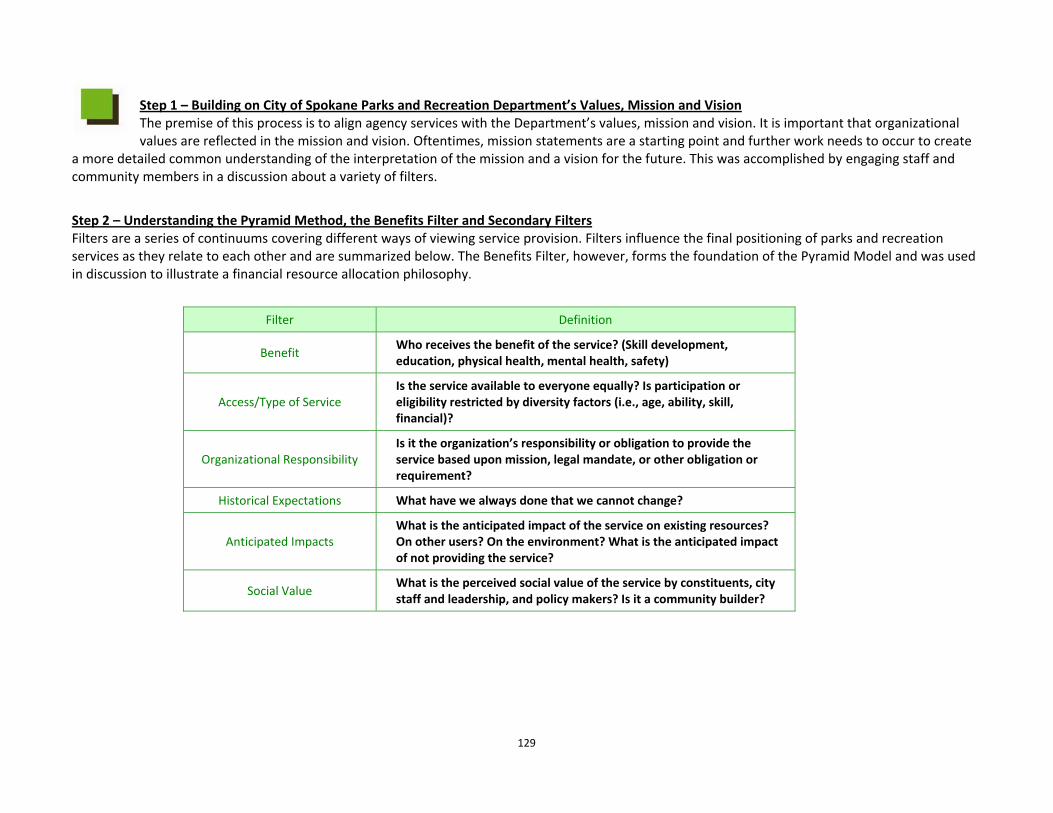
129
Step 1 – Building on City of Spokane Parks and Recreation Department’s Values, Mission and Vision The premise of this process is to align agency services with the Department’s values, mission and vision. It is important that organizational values are reflected in the mission and vision. Oftentimes, mission statements are a starting point and further work needs to occur to create
a more detailed common understanding of the interpretation of the mission and a vision for the future. This was accomplished by engaging staff and community members in a discussion about a variety of filters.
Step 2 – Understanding the Pyramid Method, the Benefits Filter and Secondary Filters Filters are a series of continuums covering different ways of viewing service provision. Filters influence the final positioning of parks and recreation services as they relate to each other and are summarized below. The Benefits Filter, however, forms the foundation of the Pyramid Model and was used in discussion to illustrate a financial resource allocation philosophy.
Filter Definition
Benefit Who receives the benefit of the service? (Skill development, education, physical health, mental health, safety)
Access/Type of Service Is the service available to everyone equally? Is participation or eligibility restricted by diversity factors (i.e., age, ability, skill, financial)?
Organizational Responsibility Is it the organization’s responsibility or obligation to provide the service based upon mission, legal mandate, or other obligation or requirement?
Historical Expectations What have we always done that we cannot change?
Anticipated Impacts What is the anticipated impact of the service on existing resources? On other users? On the environment? What is the anticipated impact of not providing the service?
Social Value What is the perceived social value of the service by constituents, city staff and leadership, and policy makers? Is it a community builder?
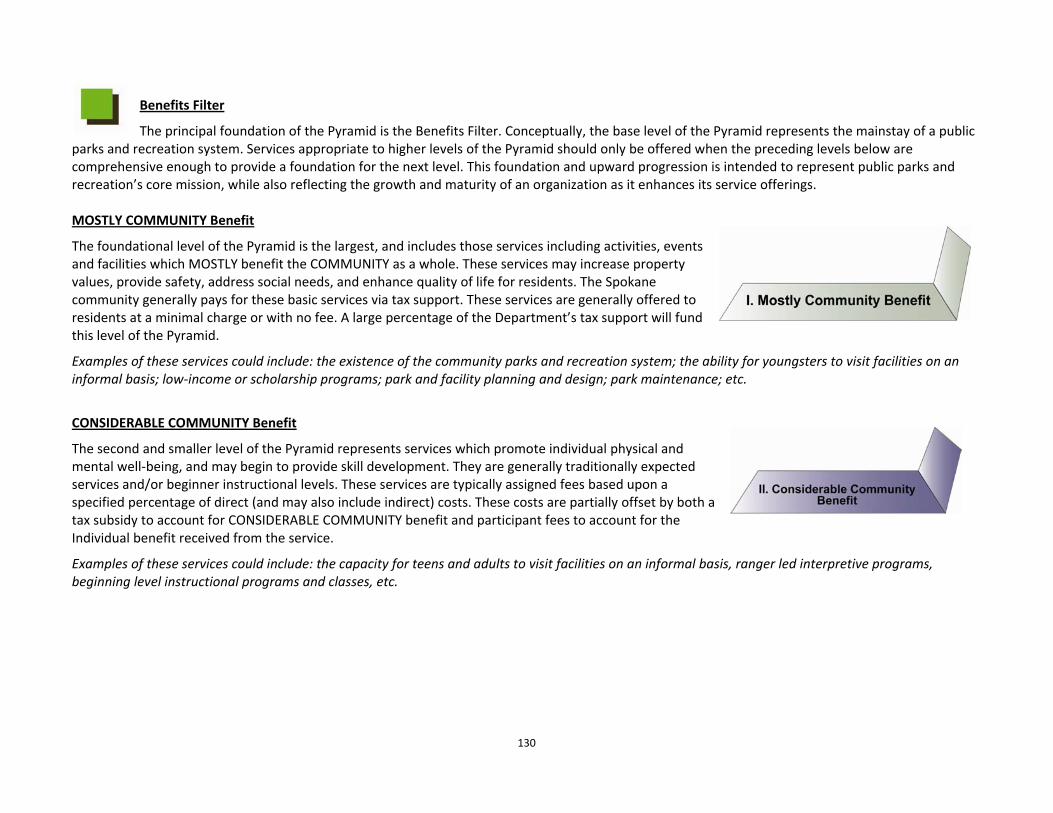
130
Benefits Filter
The principal foundation of the Pyramid is the Benefits Filter. Conceptually, the base level of the Pyramid represents the mainstay of a public parks and recreation system. Services appropriate to higher levels of the Pyramid should only be offered when the preceding levels below are comprehensive enough to provide a foundation for the next level. This foundation and upward progression is intended to represent public parks and recreation’s core mission, while also reflecting the growth and maturity of an organization as it enhances its service offerings. MOSTLY COMMUNITY Benefit
The foundational level of the Pyramid is the largest, and includes those services including activities, events and facilities which MOSTLY benefit the COMMUNITY as a whole. These services may increase property values, provide safety, address social needs, and enhance quality of life for residents. The Spokane community generally pays for these basic services via tax support. These services are generally offered to residents at a minimal charge or with no fee. A large percentage of the Department’s tax support will fund this level of the Pyramid.
Examples of these services could include: the existence of the community parks and recreation system; the ability for youngsters to visit facilities on an informal basis; low‐income or scholarship programs; park and facility planning and design; park maintenance; etc.
CONSIDERABLE COMMUNITY Benefit
The second and smaller level of the Pyramid represents services which promote individual physical and mental well‐being, and may begin to provide skill development. They are generally traditionally expected services and/or beginner instructional levels. These services are typically assigned fees based upon a specified percentage of direct (and may also include indirect) costs. These costs are partially offset by both a tax subsidy to account for CONSIDERABLE COMMUNITY benefit and participant fees to account for the Individual benefit received from the service.
Examples of these services could include: the capacity for teens and adults to visit facilities on an informal basis, ranger led interpretive programs, beginning level instructional programs and classes, etc.
131
BALANCED INIDIVIDUAL/COMMUNITY Benefit
The third and even smaller level of the Pyramid represents services that promote individual physical and mental well‐being, and provide an intermediate level of skill development. This level provides balanced INDIVIDUAL and COMMUNITY benefit and should be priced accordingly. The individual fee is set to recover a higher percentage of cost than those services that fall within lower Pyramid levels.
Examples of these services could include: summer recreational day camp, summer sports leagues, year‐round swim team, etc.
CONSIDERABLE INDIVIDUAL Benefit
The fourth and still smaller Pyramid level represents specialized services generally for specific groups, and those which may have a competitive focus. Services in this level may be priced to recover full cost, including all direct and indirect expenses. Examples of these services could include: specialty classes, golf, and outdoor adventure programs MOSTLY INDIVIDUAL Benefit
At the top of the Pyramid, the fifth and smallest level represents services which have profit center potential, may be in an enterprise fund, may be in the same market space as the private sector, or may fall outside the core mission of the agency. In this level, services should be priced to recover full cost in addition to a designated profit percentage. Examples of these activities could include: elite diving teams, golf lessons, food concessions, company picnic rentals, facility rentals such as for weddings or other services. Step 3 – Developing the City of Spokane Parks and Recreation Department’s Categories of Service
In order to avoid trying to determine cost recovery or subsidy allocation levels for each individual agency service including every program, facility or property, it is advantageous to categorize Department services into like categories. This step also includes the development of category definitions that detail and define each category; and service inventory “checks and balance” to ensure that all Department services belong within a developed category.
132
The City of Spokane Parks and Recreation Department’s Categories of Service are as follows.
City of Spokane Parks and Recreation Department ‐ Categories of Service 1. Instructional Programs – classes, workshops, lessons, and clinics which focus on skill or ability development, providing direct facilitation, supervision,
or leadership. • Introductory/Basic • Intermediate • Advanced/Competitive (Examples: cross country skiing, snowshoeing, piano, dance, fencing, wine making, language)
2. Private/Semi‐private Instruction – highly structured, individualized or personalized instruction‐based recreation, scheduled on demand and intended
to meet the needs of one or two individuals. (Examples: private or semi‐private swim, cross country ski, tennis, golf lessons, skating)
3. Teams/Leagues –organized sports activities that are typically officiated and scored, providing an individual and/or team experience for participants with the intent to play a game/match‐format or to compete. • Non‐competitive/Developmental • Competitive/Advanced (Examples: softball, basketball, soccer, swimming)
4. Licensed Camps and Afterschool Programs – licensed preschool and youth development services that must meet minimum standards as defined by
the Department of Public Health and Department of Early Learning (DEL) licensing. (Examples: camps and afterschool programs)
5. Non‐Licensed Camps – youth day camps ranging in length from four hours to all day and operated during the school year during school conference
days; curriculum days; holidays; and winter/spring/summer break. (Examples: art camps, sports, camps, music camps, tumbling camps, themed camps, outdoor camps)
6. Community Events – special events planned for the Spokane community. These services typically occur on an annual basis and may or may not
require pre‐registration. These events may be designed for any or all ages and could be a fundraiser. (Examples: Spokane Bridge Walk, 4th of July, Community Appreciation Day, Summer Parkways, Sekani Adventure Day)

133
7. Trips and Tours – supervised and structured travel services which provide opportunities to visit select destinations requiring pre‐registration. (Examples: day trips, overnight trips, outdoor adventures)
8. Therapeutic Recreation Services – leisure opportunities for people with physical or cognitive disabilities designed and managed to be specific to the
physical, cognitive, social, and affective needs of these populations. 9. Inclusion Services – provides for reasonable accommodation and programs to any Department activity, park and/or facility providing leisure
opportunities to people with physical or cognitive disabilities. Inclusion services are intended to comply with the Americans with Disabilities Act (ADA federal mandate).
10. Adult Day Services – state‐monitored program for eligible older adults.
(Examples: cognitive exercise, physical exercise class, arts and crafts, health monitoring, and supervision of vulnerable clients) 11. Personal Health Care (Community Wellness Services) – services intended to provide for the wellness needs of the community.
(Examples: senior nutrition, podiatry care, information and referral, massage therapy, vaccinations) 12. Private Programs and Parties – tailored programs for groups of people which are not open to the public and facilitated specifically for a group. These
can range from a few hours to multiple weeks and include exclusive use of a space and can include services such as led activities and food. (Examples: art parties, carousel parties, canoe trips, kayak trips, art classes for home school groups/daycares, birthday parties, picnic activities for private picnics)
13. Permits – permitted use of parks and recreation properties in compliance with City ordinances.
(Examples: commercial film production, still photography, metal detecting, special events) 14. Rentals and Reservations – the exclusive use of a facility, or space made available to both residents and non‐residents.
• Spokane Resident – individual (e.g., resident household member) • Organization/Affiliates (e.g., friends of groups, senior centers, public schools and PTO’s which have MOU’s in place) • Government Organizations (e.g., Police, other City Departments, County) • Non‐Spokane resident – individual (e.g., non‐resident household member) • For‐profit organization (e.g., business, conventions )
134
• Non‐profit organization (e.g., scout groups, youth sport teams, church groups with 501 (c)(3) status) (Examples: community center rental, shelter rental, tee‐time, parking – use of land assets)
15. Equipment Rentals – Department‐owned equipment available to renters.
(Examples: skates, golf clubs and carts) 16. Merchandise for Resale – non‐consumable goods available for purchase at various facilities.
(Examples: golf, souvenirs, aquatic merchandise) 17. Concessions/Vending – consumable goods sold at various Department facilities and events.
(Examples include snack bars and beverages, amusement games) 18. Non‐monitored parks, athletic fields, trails, and open space facilities outdoors and indoors –open access to parks and facilities not including
staff/volunteer supervision or oversight. (Examples: soccer, disc golf, basketball, sledding, hard court tennis, splashpads, playgrounds, historical markers, gardens, the Conservatory, public art, trails)
19. Drop‐in monitored access (non‐instructional) – activities that are non‐registered and non‐instructed, and include staff/volunteer supervision or
oversight. (Examples: public swim, public skating, walk‐on golf, tennis, board games, billiards, open basketball, amusement rides/attractions, miniature golf, Skyride, Imax, ice rink, pet therapy)
20. Urban Forestry – maintenance, preservation, and improvement of street and public tree environments. This includes tree permit issuance for work
done on public and street trees. (Examples: public education efforts, street and public tree inventory, street tree planting/removal, hazardous tree removal, planting plan implementation, Heritage Tree Program, maintain Tree City USA status)
21. Volunteer Opportunities – opportunities for individuals or groups to donate their time and energies to a structured or scheduled experience (adopt a park, adopt a field, trail maintenance, museum, etc.)
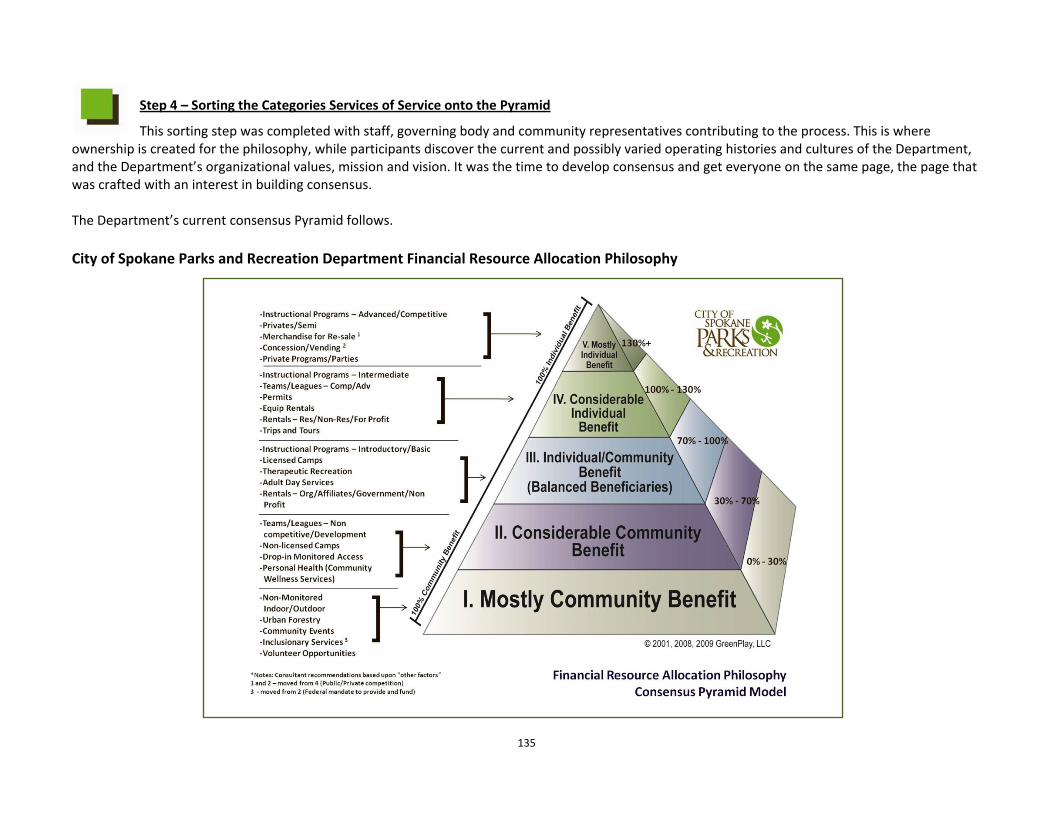
135
Step 4 – Sorting the Categories Services of Service onto the Pyramid
This sorting step was completed with staff, governing body and community representatives contributing to the process. This is where ownership is created for the philosophy, while participants discover the current and possibly varied operating histories and cultures of the Department, and the Department’s organizational values, mission and vision. It was the time to develop consensus and get everyone on the same page, the page that was crafted with an interest in building consensus. The Department’s current consensus Pyramid follows. City of Spokane Parks and Recreation Department Financial Resource Allocation Philosophy
136
Step 5 – Determining (or Confirming) Current Subsidy/Cost Recovery Levels This step established the expectation that the Department will confirm or determine current cost recovery and subsidy allocation levels by service area. This included the consideration of revenues sources and services costs (expenses). Typically, public parks and recreation
organizations do not have consistent cost accounting practices and these inconsistencies become apparent and can be problematic. Results of this step identify whether staff members know what it costs to provide services to the community; whether staff have the capacity or resources necessary to account for and track costs; whether accurate cost recovery levels can be identified; and whether cost centers or general ledger line items align with how the Department may want to track these costs in the future. Step 6 – Defining Direct and Indirect Costs The definition of direct and indirect costs can vary from agency to agency. What is important is that all costs associated with directly operating and/or maintaining a service are identified and consistently applied across the system. Direct costs typically include all the specific, identifiable expenses (fixed and variable) associated with providing a service. These expenses would not exist without the service and may be variable in nature. Defining direct costs, along with examples and relative formulas is necessary during this step. Indirect costs typically encompass overhead (fixed and variable) including the administrative costs of the agency. These costs would exist without any specific service but may also be attributed to a specific agency operation (in which case they are direct expenses of that operation). If desired, all or a portion of indirect costs can be allocated, in which case they become a direct cost allocation. Once all costs have been defined, these definitions will be used to conduct cost accounting and determine accurate cost recovery/subsidy allocation levels moving forward. The City of Spokane Parks and Recreation Department direct and indirect costs definitions can be found in Appendix G of this document. Step 7 – Establishing Cost Recovery/Subsidy Goals Subsidy and cost recovery are complementary. If a service is subsidized by 75%, it then has a 25% cost recovery level, and vice‐versa. In some organizations, it may be more powerful and politically correct to work through this exercise thinking first about where tax subsidy should be used rather than cost recovery goals. Afterwards, thinking can be reversed to articulate the “cost recovery philosophy,” as necessary. The Department’s overall subsidy/cost recovery level is comprised of the average of all services in all of the levels of the Pyramid. This step identifies what the cost recovery/subsidy allocation goals are for each of the Categories of Service within each Pyramid level. There is a cost recovery/subsidy goal range for each Category of Service; however, each individual service’s cost recovery/subsidy allocation goal must lie within its Category of Service’s cost recovery/subsidy allocation goal. This step reflected the Department’s current cost recovery/subsidy allocation level of 70% subsidy (General Fund)/30% cost recovery as a baseline from which to work. The new goals for the Department moving forward include an interest in achieving a 60% subsidy (General Fund)/40% cost recovery within the next three to five years.
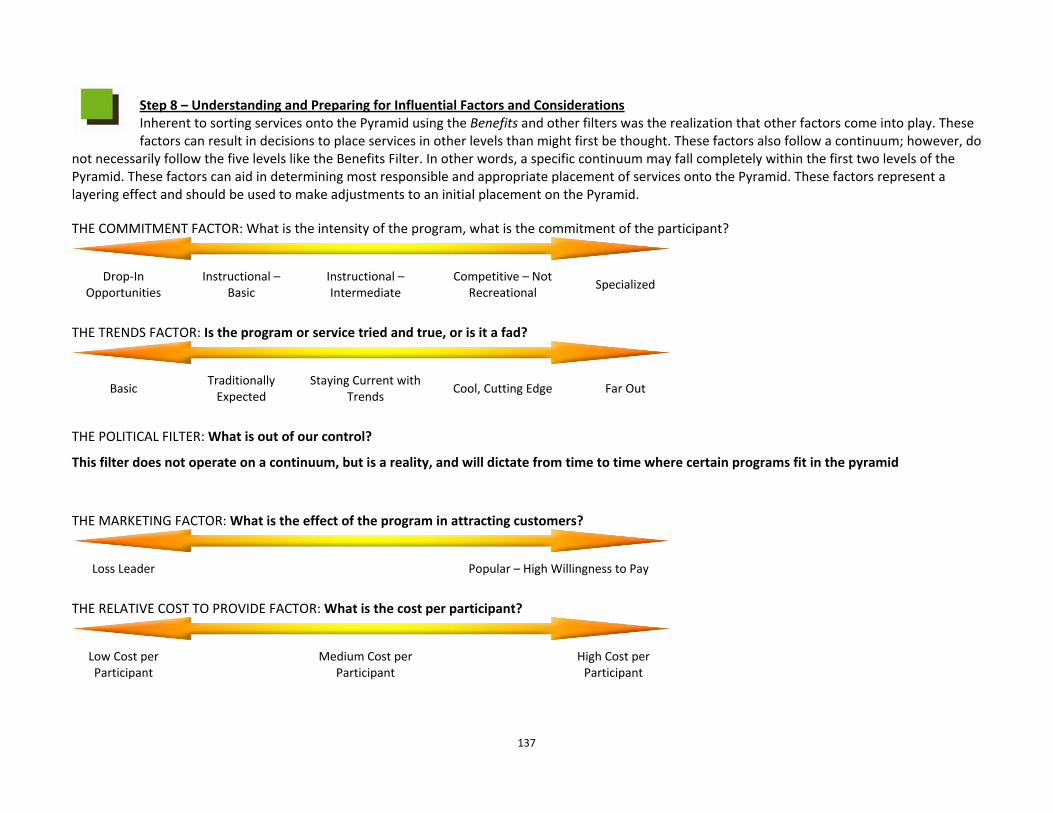
137
Step 8 – Understanding and Preparing for Influential Factors and Considerations Inherent to sorting services onto the Pyramid using the Benefits and other filters was the realization that other factors come into play. These factors can result in decisions to place services in other levels than might first be thought. These factors also follow a continuum; however, do
not necessarily follow the five levels like the Benefits Filter. In other words, a specific continuum may fall completely within the first two levels of the Pyramid. These factors can aid in determining most responsible and appropriate placement of services onto the Pyramid. These factors represent a layering effect and should be used to make adjustments to an initial placement on the Pyramid. THE COMMITMENT FACTOR: What is the intensity of the program, what is the commitment of the participant?
Drop‐In Opportunities
Instructional – Basic
Instructional – Intermediate
Competitive – Not Recreational
Specialized
THE TRENDS FACTOR: Is the program or service tried and true, or is it a fad?
Basic Traditionally Expected
Staying Current with Trends
Cool, Cutting Edge Far Out
THE POLITICAL FILTER: What is out of our control?
This filter does not operate on a continuum, but is a reality, and will dictate from time to time where certain programs fit in the pyramid
THE MARKETING FACTOR: What is the effect of the program in attracting customers?
Loss Leader Popular – High Willingness to Pay
THE RELATIVE COST TO PROVIDE FACTOR: What is the cost per participant?
Low Cost per Participant
Medium Cost per
Participant
High Cost per Participant
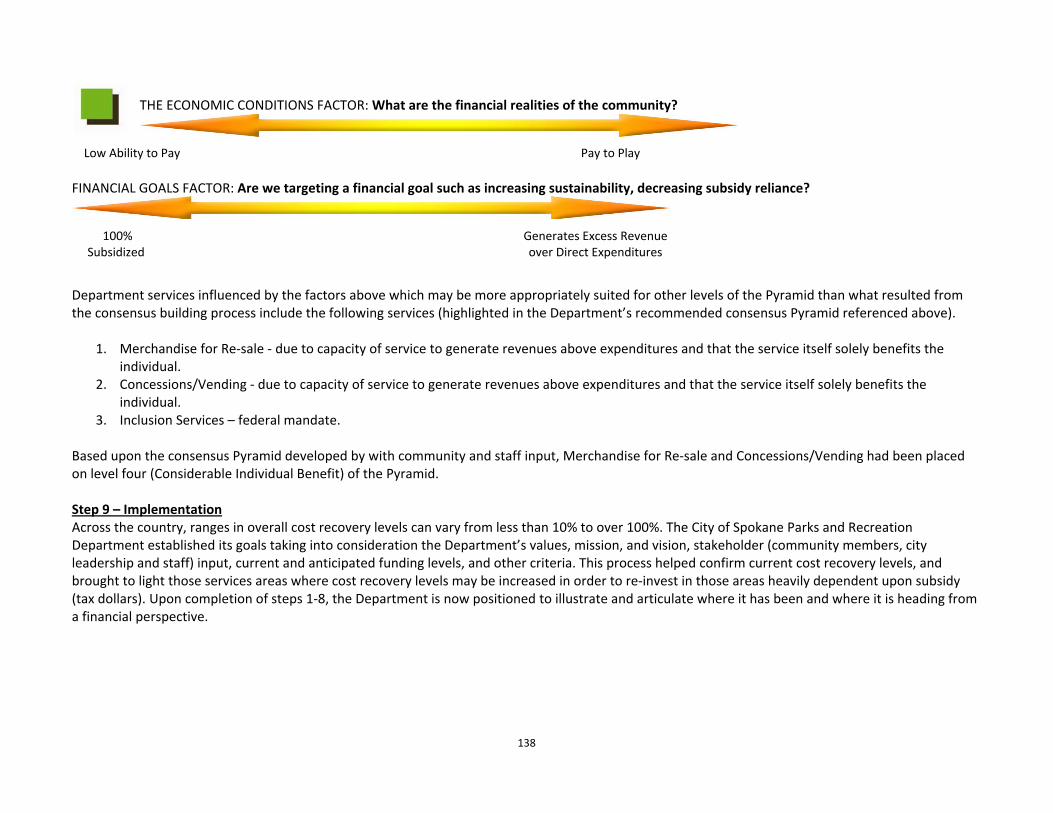
138
THE ECONOMIC CONDITIONS FACTOR: What are the financial realities of the community?
Low Ability to Pay Pay to Play FINANCIAL GOALS FACTOR: Are we targeting a financial goal such as increasing sustainability, decreasing subsidy reliance?
100% Subsidized
Generates Excess Revenue over Direct Expenditures
Department services influenced by the factors above which may be more appropriately suited for other levels of the Pyramid than what resulted from the consensus building process include the following services (highlighted in the Department’s recommended consensus Pyramid referenced above).
1. Merchandise for Re‐sale ‐ due to capacity of service to generate revenues above expenditures and that the service itself solely benefits the individual.
2. Concessions/Vending ‐ due to capacity of service to generate revenues above expenditures and that the service itself solely benefits the individual.
3. Inclusion Services – federal mandate. Based upon the consensus Pyramid developed by with community and staff input, Merchandise for Re‐sale and Concessions/Vending had been placed on level four (Considerable Individual Benefit) of the Pyramid. Step 9 – Implementation Across the country, ranges in overall cost recovery levels can vary from less than 10% to over 100%. The City of Spokane Parks and Recreation Department established its goals taking into consideration the Department’s values, mission, and vision, stakeholder (community members, city leadership and staff) input, current and anticipated funding levels, and other criteria. This process helped confirm current cost recovery levels, and brought to light those services areas where cost recovery levels may be increased in order to re‐invest in those areas heavily dependent upon subsidy (tax dollars). Upon completion of steps 1‐8, the Department is now positioned to illustrate and articulate where it has been and where it is heading from a financial perspective.
139
Step 10 – Evaluation The results of this process can be used to:
Articulate and illustrate the City of Spokane Parks and Recreation Department’s comprehensive financial resource allocation philosophy. Train staff on pricing methods that are justifiable and consistently applied across the system. Shift subsidy to where is it most appropriately needed base upon the Pyramid. Benchmark future financial performance. Enhance financial sustainability. Recommend service reductions to meet budget subsidy targets, or show how revenues can be increased as an alternative.
The resulting Pyramid model including cost recovery and subsidy allocation goals is intended to account for all direct and indirect costs, while working toward increasing cost recovery levels for some services. The intent is to help the City of Spokane Parks and Recreation Department adjust to the current economic climate, including budget stabilization and/or future reductions, while sustaining critical parks and recreation services. Therefore, a significant reliance on alternative funding sources, as well as pricing strategies will be warranted (as outlined in each Service Portfolio). Pricing Methodology As a last step in the financial resources allocation process, staff participated in a Pricing Workshop intended to create a consistent, fair, and equitable approach to the development of service fees and charges based upon established financial resource allocation goals. This Pricing 101 Workshop was conducted for Department staff that included the following topic areas:
1. Understanding financial trends The increasing complexity and resulting shifts of our society’s economy have led to what can be deemed as constant fiscal change in government. Public sector administrators and managers must be prepared to respond to the fiscal realities that have resulted from these economic shifts. Trends that have impacted fiscal and pricing decisions include: • Increased governmental accountability • Increased demand for people’s “leisure dollar” • On‐going or increased demand for services with no/limited additional funding • Disinterest in service reductions or increased fees and charges • Increased operating expenses (e.g., utilities, fuel, personnel, supplies)
2. Understanding the Department’s budget process and fiscal year cycle Budgets are viewed as annual financial plans and include planning and forecasting, establishing priorities, and a way to monitor fiscal process. This overview allowed for an abbreviated look at the City of Spokane Parks and Recreation Department’s process and how it impacts and is impacted by pricing.
140
3. Understanding the costs of service provision Prior to making pricing decisions, is it important to understand the different types of service provision costs. Having a grounded knowledge of the various types of costs allows staff to make better informed pricing decisions. The different types of service provision costs are as follows: • Direct costs
o Fixed costs o Changing fixed costs o Variable costs
• Indirect Costs Refer to Appendix H where these definitions are found.
4. Understanding the purpose of pricing There are many reasons to develop service fees and charges. These include, but are not limited to the following.
• Recovering costs • Creating new resources • Establishing value • Influencing consumer behavior • Promoting efficiency
5. Pricing strategies ‐ differential pricing Differential pricing is grounded in the notion that different fees are charged for the same service when there is no real difference in the cost of providing the service. There may be many reasons the Department may wish to consider this pricing strategy including:
• To stimulate demand for a service during a specified time • To reach underserved populations • To shift demand to another place, date or time
141
6. Alternative funding sources In general, there has been a decrease in the amount of tax support available to public parks and recreation departments. As such, the need to look at alternative funding sources as a way to financially support services has become commonplace. Alternative funding sources are vast
and can include: • Gifts • Grants • Donations • Sponsorships • Collaborations • Volunteer contributions
7. Examining the psychological dimensions of pricing In addition to the social and environmental issues that surround pricing, the human elements of pricing must be considered. Regardless of how logical a price may seem, customer reactions and responses are their own and can be vastly different than what one might expect. The psychological dimensions of pricing include:
• Protection of self‐esteem (pricing in such a way as to not offend certain users) • Price‐quality relationship (value received for every dollar spent) • Establishing a reference point (worth of service in comparison to others) • Objective price (price has a basis in fact, is real and impartial) • Subjective price (price is not biased or prejudiced) • Consistency of image (perception of the brand and identification with product or service) • Odd pricing (perception of arbitrary or incongruent pricing)
8. Establishing initial price
Establishing an actual price for a service can be based upon a variety of strategies. Arbitrary pricing is not encouraged as it is impossible to justify. Pricing strategies include:
• Arbitrary pricing − a fee based on nothing rational like raising all fees $.25 to meet budget goals; ignores market conditions and cost recovery goals.
• Market pricing – a fee based on demand for a service or facility or what the target market is willing to pay for a service. The private and commercial sectors commonly utilize this strategy. One consideration for establishing a market rate fee is determined by identifying all providers of an identical service (i.e. private sector providers, other municipalities, etc.), and setting the highest fee. Another consideration is setting the fee at the highest level the market will bear.
142
• Competitive pricing − a fee based on what similar service providers or close proximity competitors are charging for services. One consideration for establishing a competitive fee is determined by identifying all providers of an identical service (i.e. private sector providers, other municipalities, etc.), and setting the mid‐point or lowest fee.
• Cost recovery pricing − a fee based on cost recovery goals within market pricing ranges.
9. Understanding price revisions Once a price is established, there may be the need to periodically review the price and examine the need for revision. In some cases, “revised” may be viewed as “increased,” therefore, a systematic approach to pricing revision is important. Factors to consider in pricing revision include:
• Customer tolerance − the degree to which small increases in price will not encounter client resistance. • Adjustment period − the period of time where the value of the service is assessed by the customer in relation to the price increase. The
value of the service from the customer’s perspective must meet or exceed the impact of the increased cost. Adjustment periods may lead to diminished participation or termination of participation altogether based upon customer loyalty and other factors.
• Customer’s perceived value of the service − the degree to which services including programs, facilities and parks impact the public (individual and community), or in other words, the results or outcomes of services. Value is the judgment or perception of worth or the degree of usefulness or importance placed on a service by personal opinion. The intent or intention of a service is the purpose, aim, or end.
10. The pricing process – developing a method
Staff participating in this workshop engaged in interactive pricing exercises that applied the cost recovery goals of their respective service areas. The workshop prompted discussion leading to changes to current pricing practices with the intention of attaining recommended cost recovery and subsidy allocation goals and establishing a new method for setting fees and charges. This method is based upon using cost recovery goals as a primary pricing strategy, followed by either market pricing (for services with low alternative coverage – few if any alternative providers) or competitive pricing (for services with high alternative coverage ‐ other alternative providers offer similar or like services). These recommended pricing strategies are detailed in the Department’s Service Portfolios (Appendix G)
The outcome of this component in the process resulted in a proposed Financial Resource Allocation Model with cost recovery goals as represented in both the Model itself (page94) and in each Service Portfolio (Appendix F). The Model illustrates the Department’s intended financial resource allocation philosophy and policy which will guide the development and management of the Department’s operational budget into the future. The primary goal of the City of Spokane Parks and Recreation Department’s Financial Resource Allocation Model is to establish organizational sustainability through a logical and thoughtful philosophy that supports the values, mission and vision of the Department and the Spokane community.
143
Property Resource Allocation
Parkland Acquisition Current Policies and Practices The Parks and Recreation Department does not have specific acquisition criteria. However, the Conservation Futures Program, that has funded most recent conservation land acquisitions, does have acquisition criteria. Acquisition Criteria and Funding Conservation Futures Program: The main funding source for acquisition of parkland by the Parks and Recreation Department for the last several years has been the “Conservation Futures” program. Spokane County adopted this property tax in 1994 to “protect, preserve, maintain, enhance, restore, limit the future use of or otherwise conserve selected open space land, farmland, forests, wetlands, wildlife habitats, and other lands having significant recreational, social, scenic or aesthetic values within the boundaries of Spokane County.” Acquired properties using Conservation Futures funds are to be kept in an enhanced natural state and developed as a typical park. In 2005, State Law was amended to allow for 15% of the revenue generated through the tax to be allocated for the maintenance and operations of Conservation Futures properties. Nominations are submitted by the public for review and consideration by the Conservation Futures Land Evaluation Committee. This Committee is comprised of citizen volunteers serving as members of the Spokane County Parks Advisory Committee and representatives of the City of Spokane and the City of Spokane Valley. The evaluation criteria for nominations consider the size of the property, its riparian/wetland habitat and/or corridor values or critical links to the same, along with the ability for the public to access other systems (e.g. water ways, trails, natural areas, etc.) via the site. Other criteria include the degree of demonstrated public support, ease of access to the public, and whether it is likely to be a destination for various types of passive public recreational uses. Acquisition Criteria: While the Comprehensive Plan identifies broad parks and recreation goals and policies, the department currently lacks specific parkland acquisition criteria to proactively plan for the growth of the system.

144
Municipal Code Currently there is not an overall parkland dedication ordinance. However, Planned Unit Developments (PUD’s) and multifamily developments are required to provide some open space to serve that development. It is not mandated that this land be dedicated to the City, but it is an
option in the case of a PUD. (See below.) The Municipal Code includes a minimum amount of outdoor space (either private or common open space) for both PUD’s and multifamily developments.
Planned Unit Development (PUD): “Common Open Space: 17G.070.030.E In exchange for the approval of more intense residential development, higher densities, smaller lots, and relaxed development standards, the developer of a planned unit development is required to provide common open space for the active and passive recreational activities of residents, employees and visitors. Such space shall be aggregated wherever feasible and shall consist of a combination of landscaped and hard‐scaped areas. Such common open space shall include some combination of the following: plazas, arbors, sitting areas, picnic areas, playing fields, and trails to accommodate a variety of active and passive activities and promote visual interest.
1. In planned unit developments, the following requirements shall apply:
a. At least ten percent of the gross area of the site must be devoted to such open space. Such space must be fully accessible to the residents, employees, visitors, and/or other users of the site. Reduction of this standard in PUDs is prohibited and a variance cannot be sought to reduce this requirement.
b. Fenced yards associated with buildings immediately adjacent to designated open space, landscaping in parking lots, or fenced stormwater facilities shall not count toward the total open space requirement.
c. Environmentally‐constrained land within the planned unit development, including wetlands, geologically hazardous areas, fish and wildlife habitats, and frequently flooded areas may be used to meet up to fifty percent of the total requirement specified in subsection (E)(1) above, provided that these areas are either accessible to pedestrians to the extent practical or are visually accessible from adjacent and adjoining common open space.
2. The common open space designated to meet this requirement shall be permanently maintained by and conveyed to one of the following: a. A homeowners’ or property owners’ association as regulated by state law. b. A public agency that agrees to maintain the common open space and any buildings, structures, or improvements placed within
it.”
145
For example, the Kendall Yards PUD in downtown Spokane will include new parkland. A proposal to dedicate the parkland to the City and have the homeowners association maintain the park was underway at the time of this report.
Multi‐family Development: The Outdoors Spaces section (17C.110.420) of the Land Use Standards Title (17C) of the City of Spokane Municipal Code specifies the following:
“Each multifamily development shall provide a minimum of forty‐eight square feet of outdoor open space area for each living unit in the complex, including those units occupied by the owner or building management personnel. Private outdoor spaces can count towards this outdoor common space provision.” (17C.110.420.B)
The Code specifies that common outdoor spaces “shall provide at least three of the following amenities to accommodate a variety of ages and activities. Amenities include:
o Site furnishings (benches, tables, bike racks). o Picnic areas. o Patios, plazas or courtyards. o Tot lots. o Gardens. o Open lawn. o Play fields. o Sports courts, such as tennis or basketball courts (no more than fifty percent of required outdoor common space), equipped interior
fitness areas, or pools.” Parkland Development
Current Policies and Practices The Washington State Growth Management Act (GMA) allows local jurisdictions to levy impact fees for open space and parks and recreation (in addition to streets and roads, school facilities, and fire protection). These impact fees must “reasonably” benefit the new development.

146
Parkland Disposal
Current Policies and Practices According to the City of Spokane Charter, Article V, Section 48, Park Board – Powers:
“Neither the park board nor the city council shall have the power to sell or exchange any existing park or portion thereof without the prior approval of the electorate given by a majority vote at the next ensuing general municipal election or special municipal election, as the case may be.” Effective Date: November 1987 ORD C28870 Section 1
Land owned and managed by the Department of Parks and Recreation can be classified a developed park (a neighborhood park, for example), a conservation park (a natural area with limited to no development), and other property. An example of property that fits in the “other” category is the North Bank properties adjacent to Riverside Park that is largely undeveloped. Approximately 40 acres were purchased by the Park Board based on a 1999 park bond voted on by the public with the intent of developing a revenue generating attraction, the Science Center. This proposal is no longer viable and an alternate plan for this site is needed. Since this site is not a “park,” but an undeveloped property with no current park use or plan, the question is whether this property should be sold for another use, and what are the procedures for this potential sale to take place.
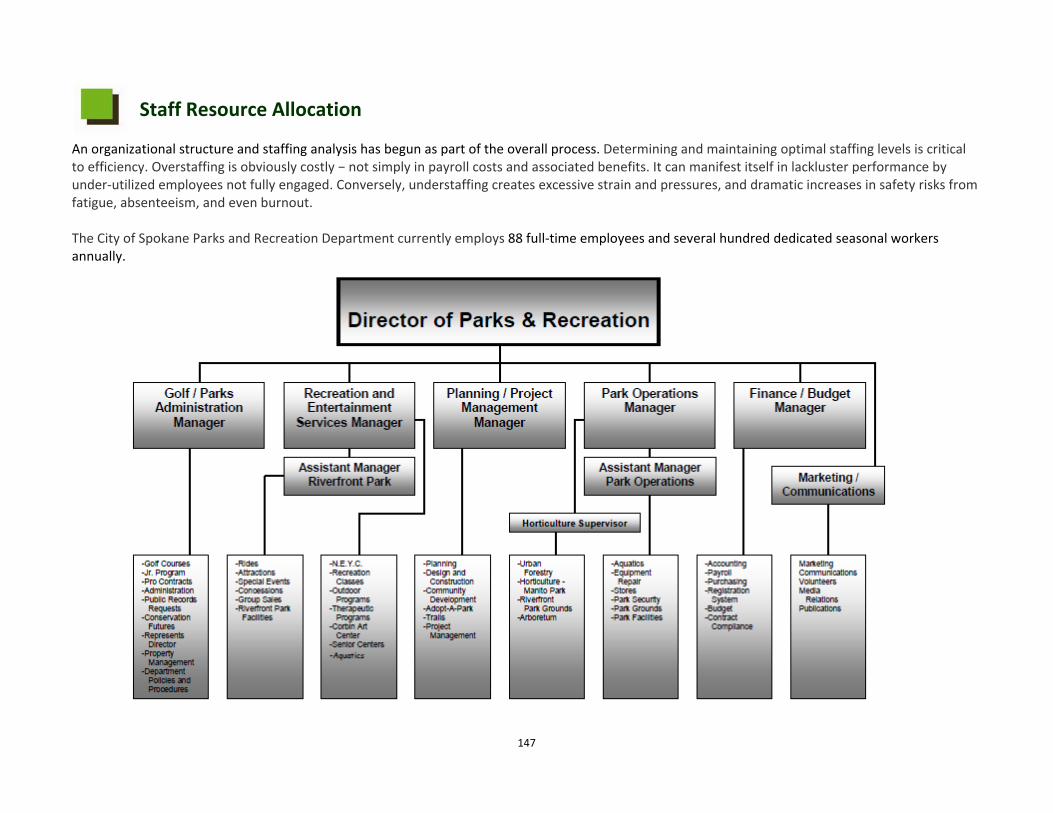
147
Staff Resource Allocation
An organizational structure and staffing analysis has begun as part of the overall process. Determining and maintaining optimal staffing levels is critical to efficiency. Overstaffing is obviously costly − not simply in payroll costs and associated benefits. It can manifest itself in lackluster performance by under‐utilized employees not fully engaged. Conversely, understaffing creates excessive strain and pressures, and dramatic increases in safety risks from fatigue, absenteeism, and even burnout. The City of Spokane Parks and Recreation Department currently employs 88 full‐time employees and several hundred dedicated seasonal workers annually.
148
As part of the organizational analysis, the current staffing structure is assessed based upon size and scope of agency, scope of responsibilities by work unit, and service delivery requirements by work unit/division. The analysis thus far has included staff’s perspectives about the following.
• Functional responsibilities and alignment with the Department’s values, mission, and vision. • Productivity and efficiency levels. • Whether skill sets and capabilities are best utilized. • Consistency and clarity of internal communication.
It is abundantly clear that the organization has significant demands and that these demands have increased due to recent development and enhancement projects within the system. With the recent approval of the $42.9 million Parks Improvement Bond intended to fund the construction and development of a variety of aquatics and youth sports projects throughout the City of Spokane, staff from each work unit/division have realized increased workloads. This demand has been compounded by the fact that there is no complementary funding for operations and maintenance. Simply, the capital development funds and resulting projects were not accompanied by the operational and maintenance dollars needed to support the projects from a staffing perspective (or otherwise). Additionally, it is important to note that the Department can expect (based upon anticipated retirements alone) there to be an approximate 26% turnover in staff within the next three to five years. Succession planning or similar operational strategies will be important for the Department to employ moving into the future.
149
Key Resource Allocation Considerations
• The financial resource allocation philosophy includes a shift from a current 70 percent subsidy (General Fund)/30 percent cost recovery level to an overall Department goal of 60 percent subsidy (General Fund)/40 percent cost recovery. Given these conditions, a minimum of two to three years may be necessary to meet the new goal.
• A formal policy addressing financial resource allocation does not currently exist. • The new direct and indirect cost definitions will require an adjustment to the current general ledger. • It is important to ensure that all Department staff are pricing services consistently, following the same methodology. • Existing deferred maintenance coupled with new recreation facility construction (resulting from the 2008 $42.9 million bond) has placed a
significant burden on the operating and maintenance budget of the department. The short and long term maintenance requirements of recreation facilities, parks and other physical properties in the system will continue to compound on the existing total deferred maintenance costs which are currently in excess of $35 million.
• Spokane Parks and Recreation receives a dedicated eight percent funding source from the City’s General Fund. Although this is a dedicated funding source, it has and is expected to be unstable due to the volatility of the economy. Additionally, it is questionably insufficient based upon existing demands, including the current $35 million in deferred maintenance which already exists.
• The organization is positioned to lose approximately 26 percent of its full‐time workforce over the next five years to retirements. While this provides an opportunity for new staff with different ideas and energy, it also leads to a significant loss of institutional knowledge.
• There are no formal strategies such as a parkland dedication ordinance to provide a consistent level of service for parks, recreation, and open space to serve growth areas.
• Parks and recreation level of service standards and proactively planning for parkland to serve new residential communities needs to be clarified. • Without clear acquisition criteria the City runs the risk of receiving parkland that is not appropriate for active park recreation or is not ideally
located. • If the City adopts a parkland dedication requirement for private residential developments, funds to develop and operate this new parkland will
also be needed. • There is a need to further clarify the details in the City of Spokane Charter regarding the sale of “other property” not determined to fulfill a
current or planned future parks and recreation purpose.

2010-2012 Action Plan
Answers the questions…Q: As a result of the planning process, what are the Department’s organizational priorities for the next two years? Q: What specific actions will the Department take to address the identified organizational priorities?

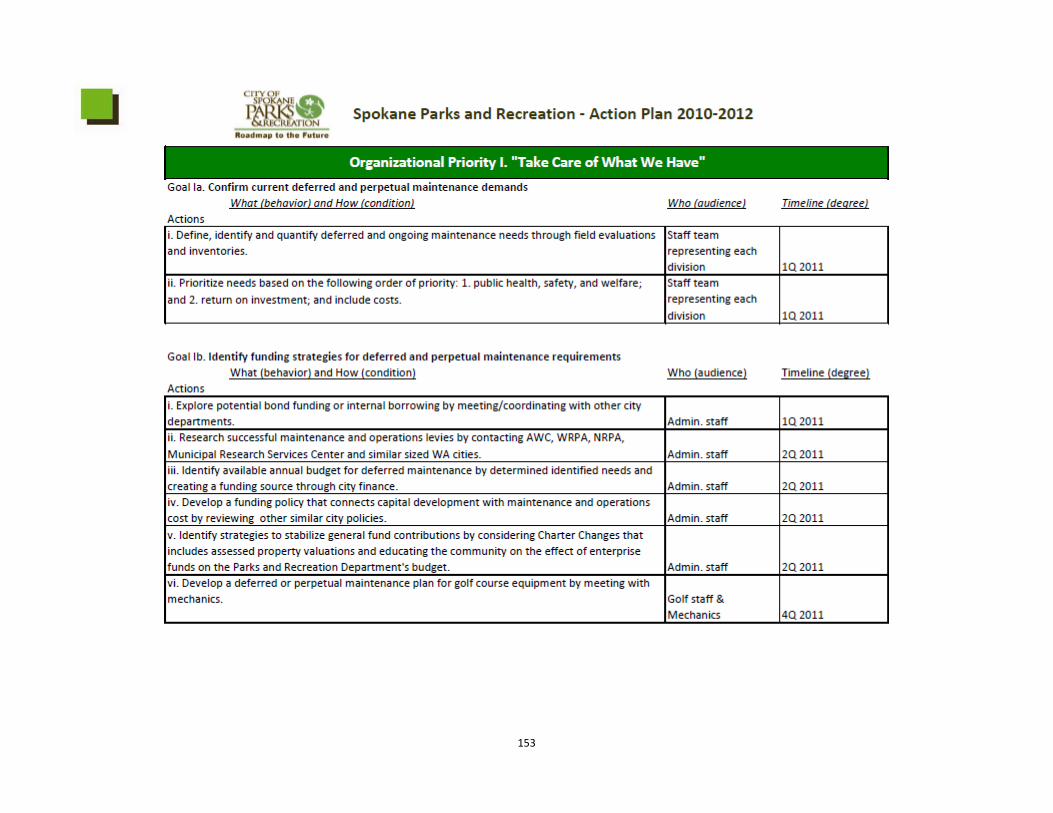
153
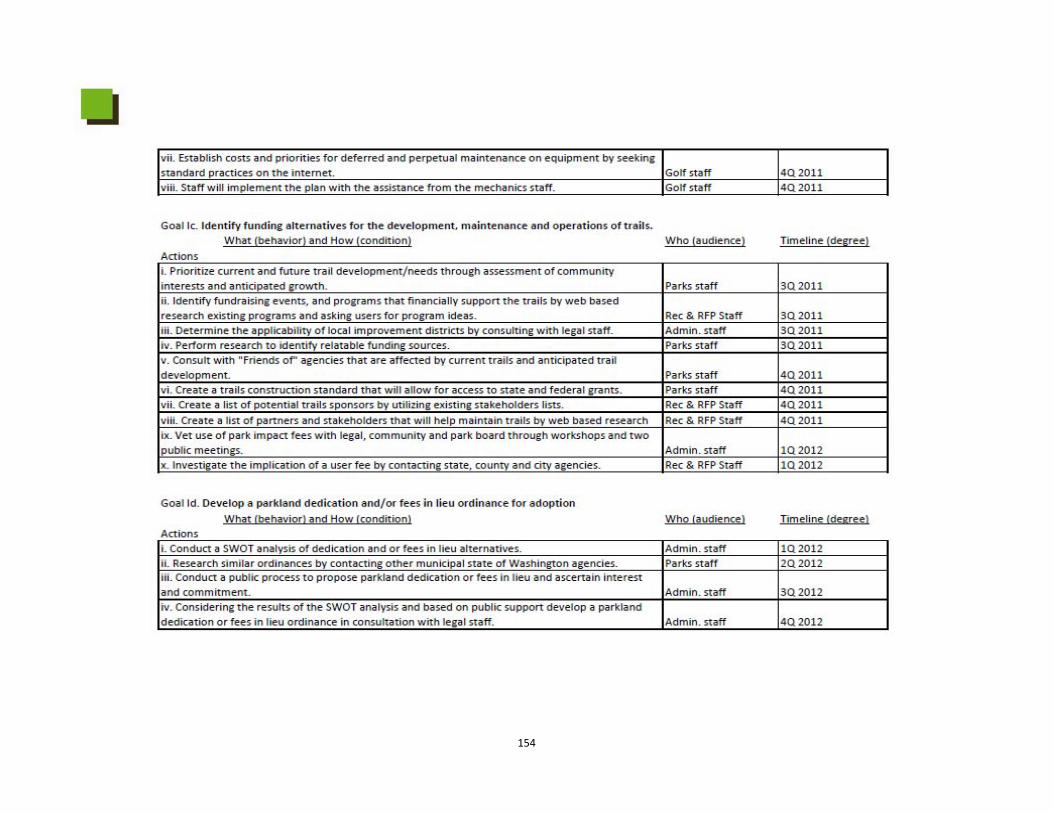
154
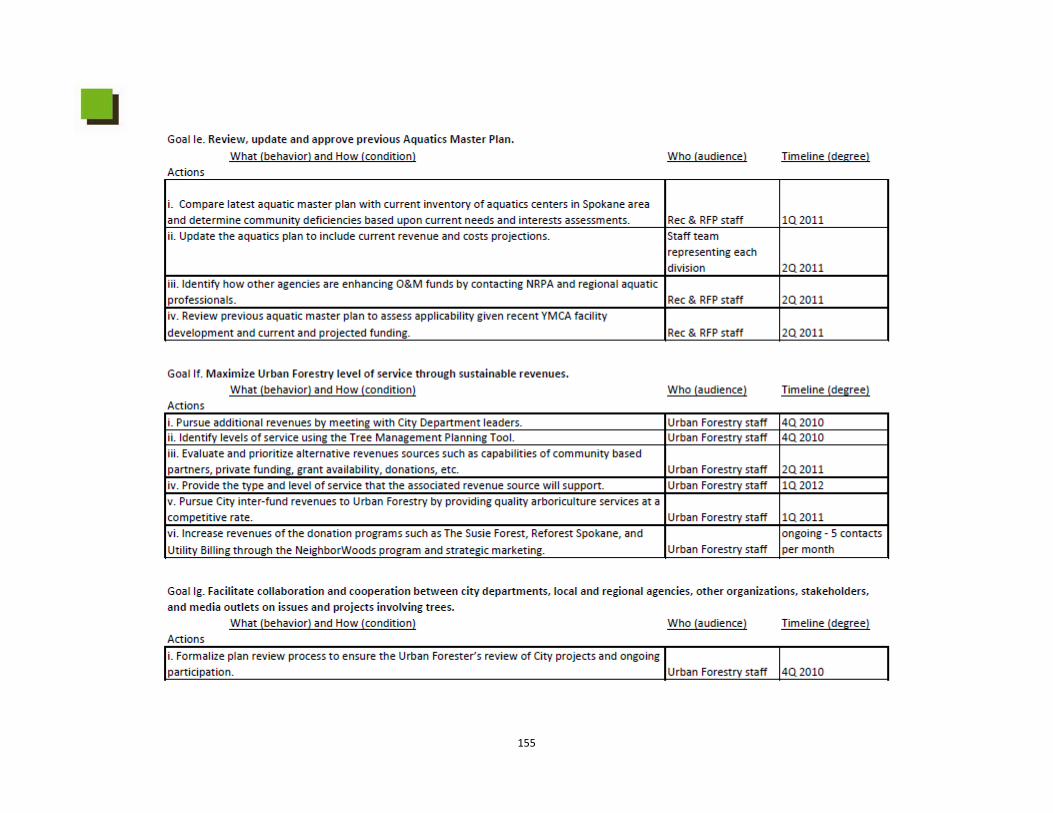
155
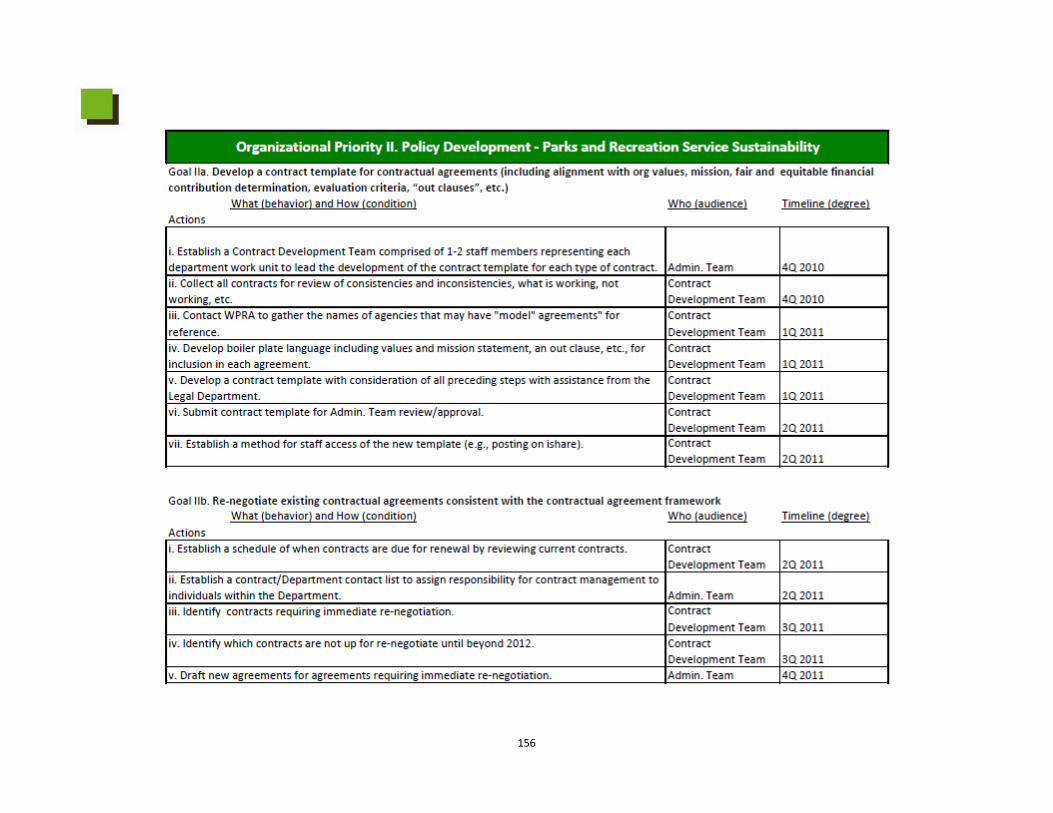
156
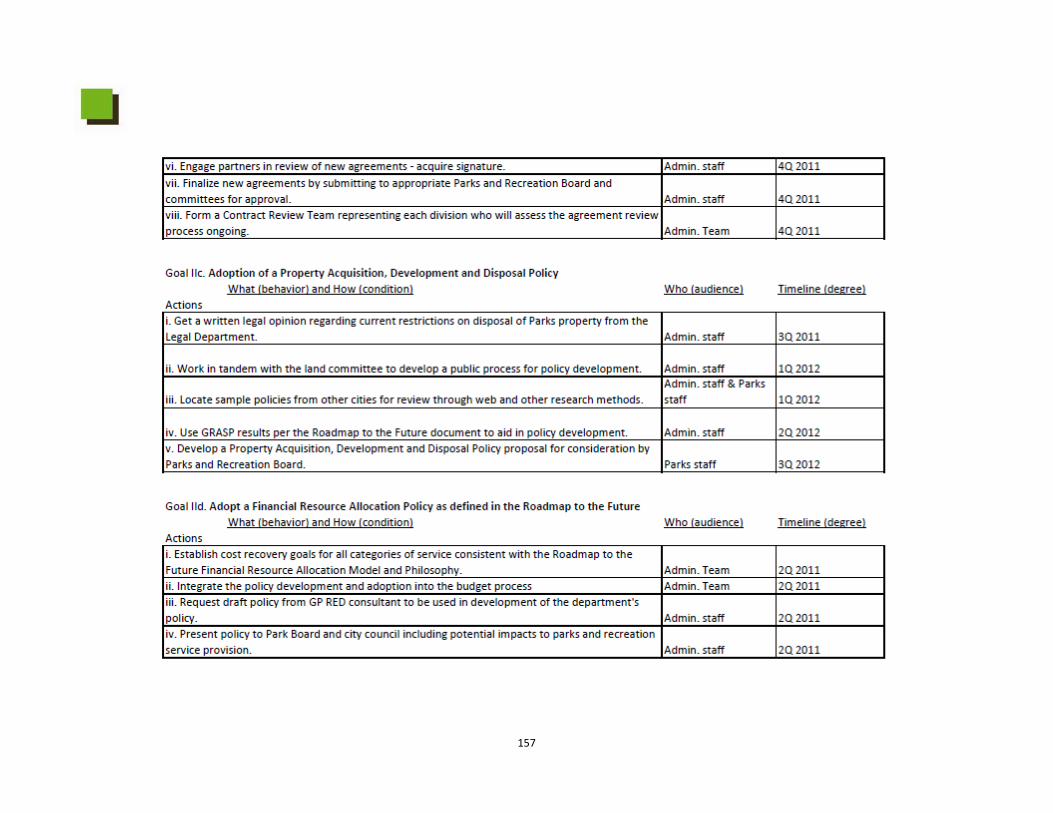
157
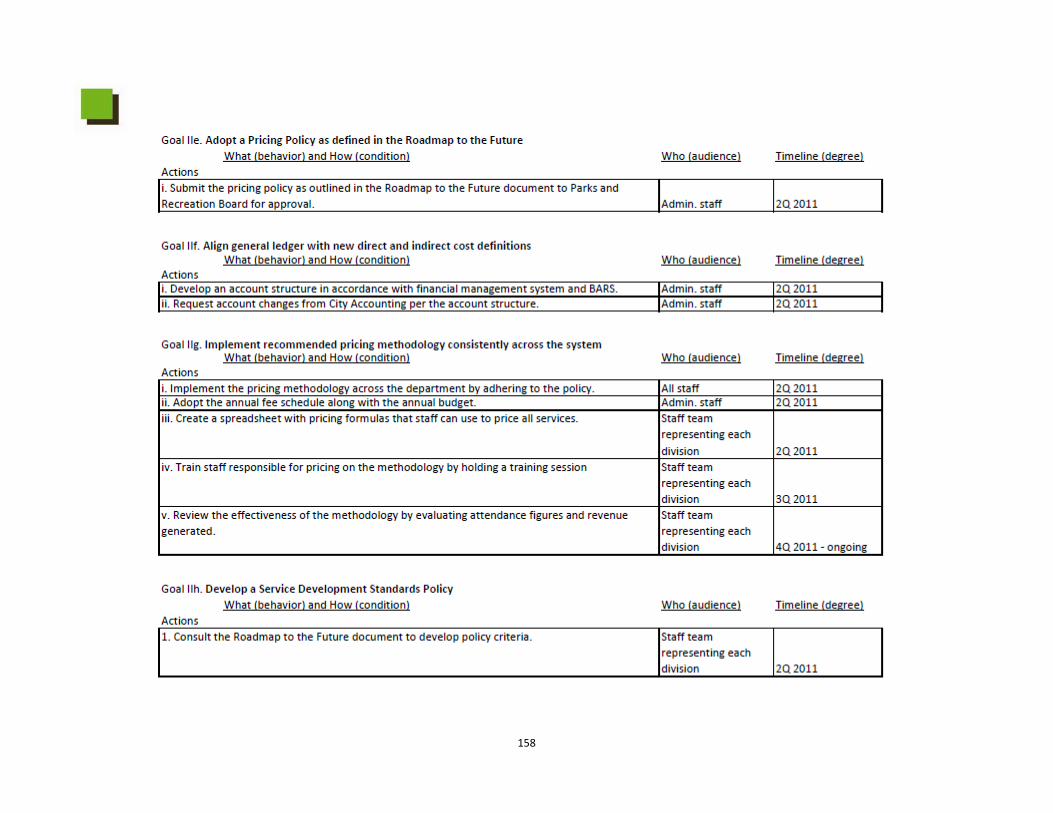
158
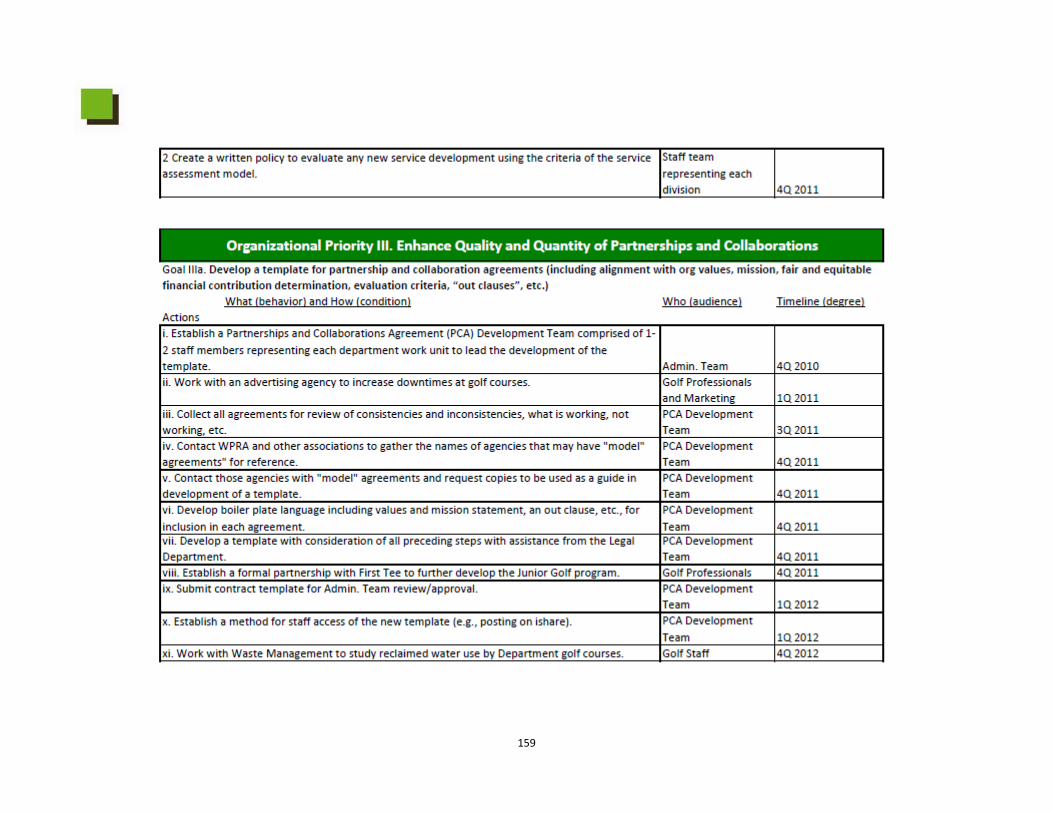
159
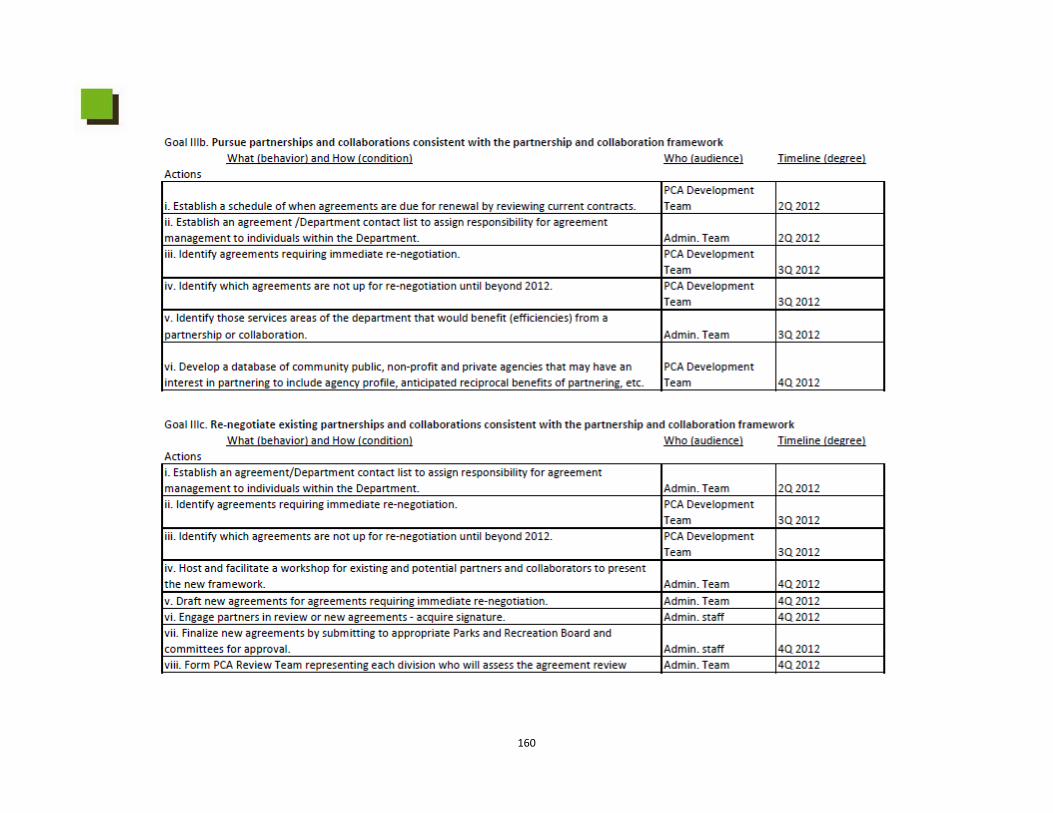
160
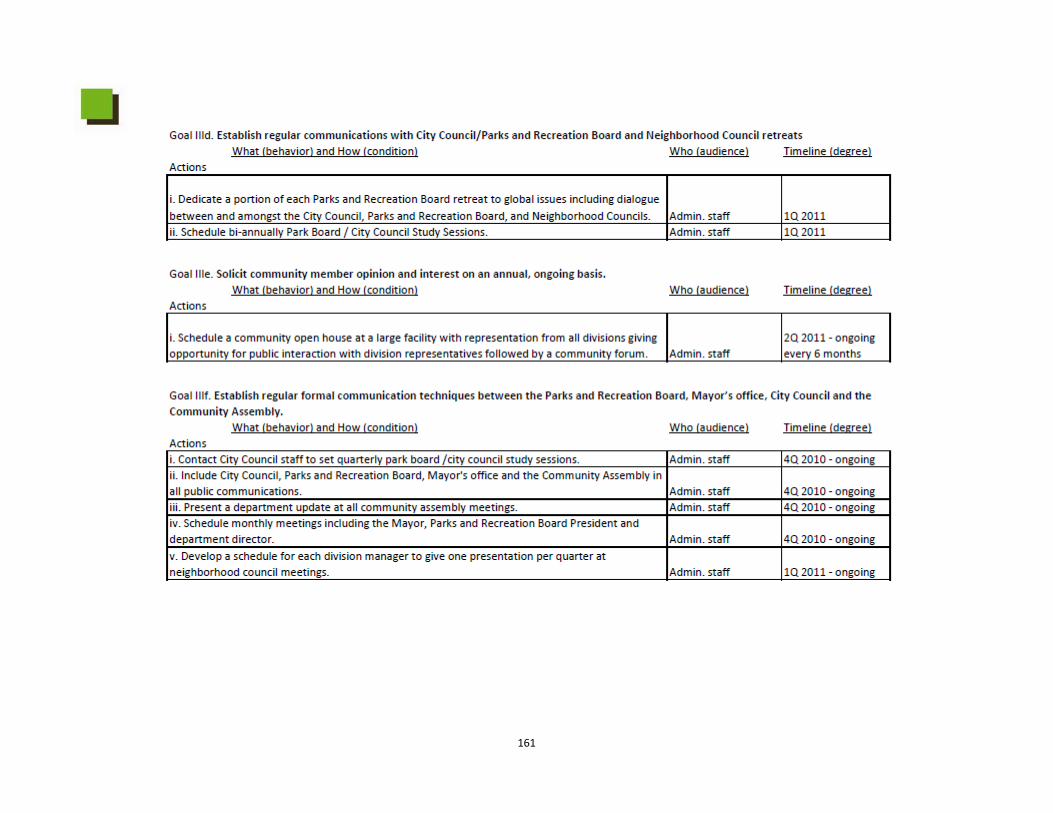
161
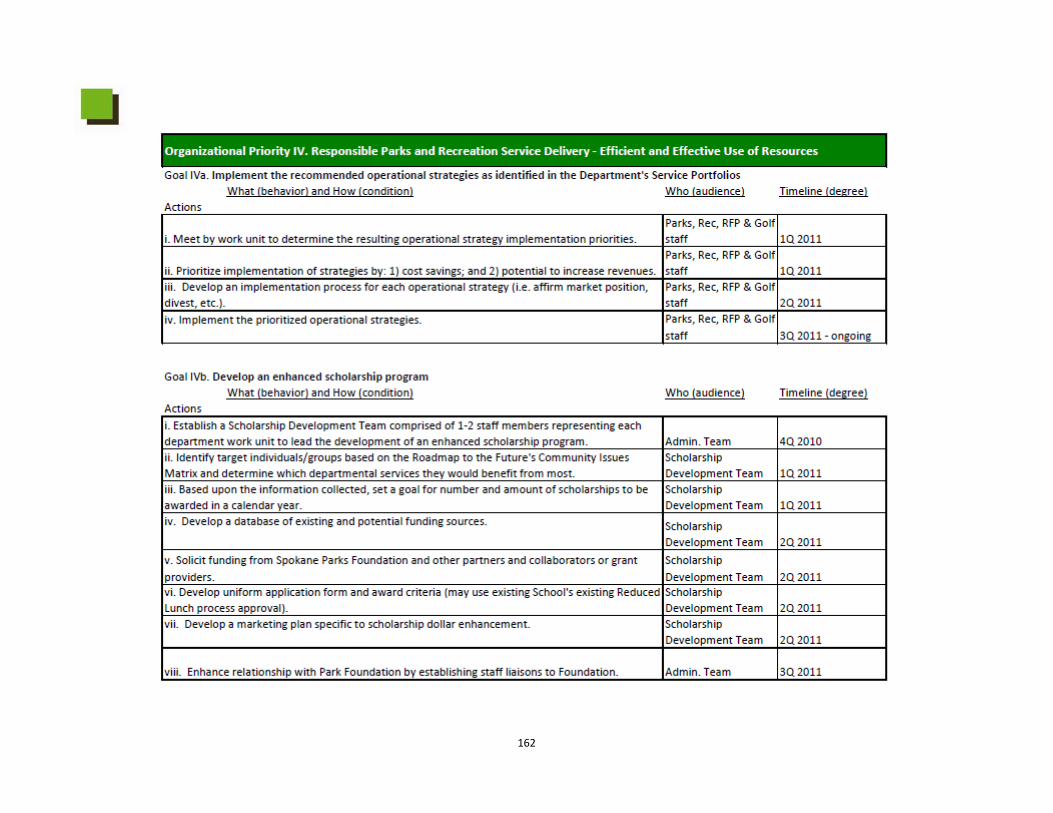
162
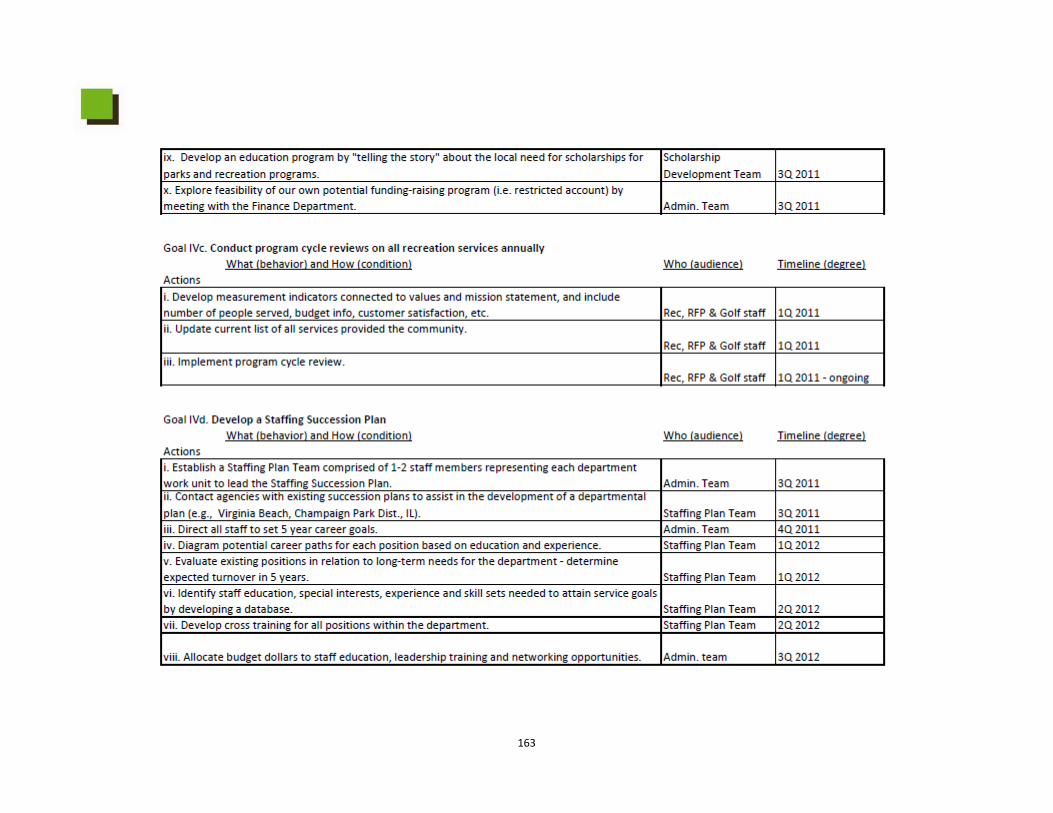
163
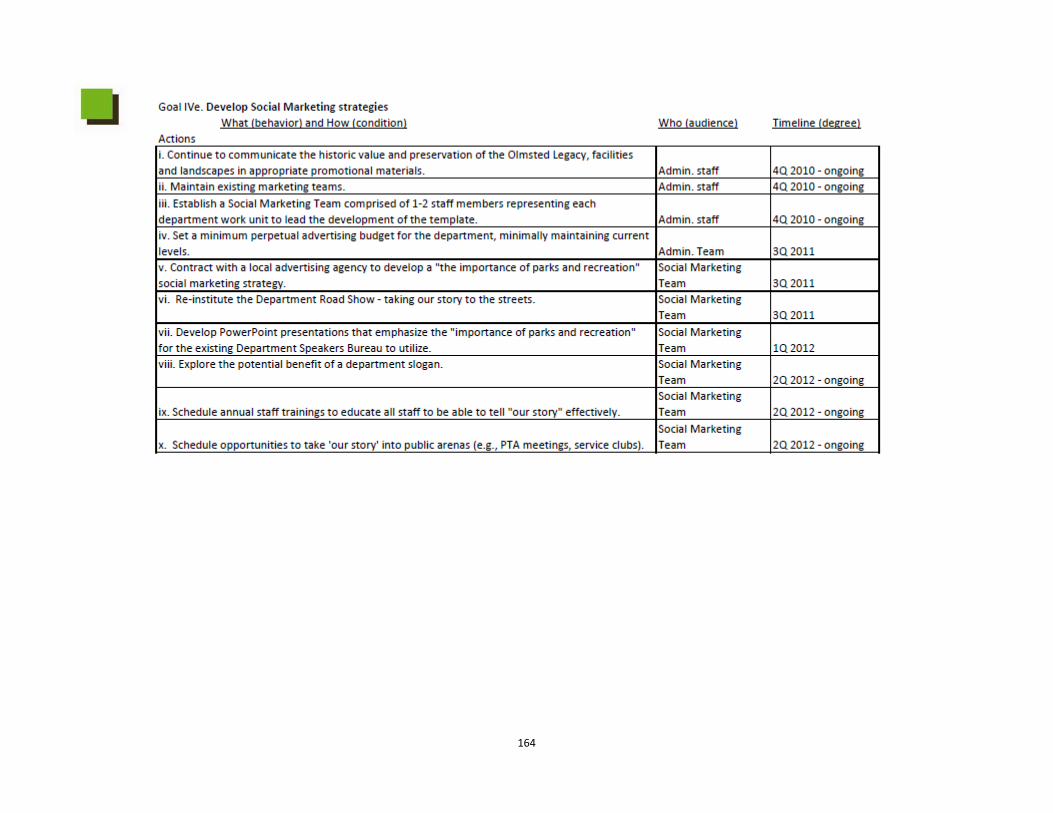
164
Answers the questions...Q: What are the general recommendations for the Department beyond what is included in the 2010-2012 Action Plan? Q: What should the Department consider in order to be able to respond to the community’s interests and needs
beyond 2012?
General Recommendations and Considerations for the 2013-2014 Action Plan

167
General Recommendations and Considerations for the 2013‐2014 Action Plan
The comprehensive planning process unveiled the most significant organizational priorities that the Department should dedicate its resources to addressing and resolving over the course of the next five years. These priorities create the framework and direction of the 2010‐2012 Action Plan and include:
Organizational Priority I – Take Care of What We Have Organizational Priority II – Sustain Parks and Recreation Services that Address Community Need Organizational Priority III – Enhance Quantity and Quality of Partnerships and Collaborations Organizational Priority IV‐ Efficiently and Effectively Using Resources
The 2010‐2012 Action Plan focuses on identified issues that resulted from the comprehensive planning process that can practically be addressed and accomplished by Department staff and governance through the end of 2012. However, there are supplemental actions the Department should consider beyond 2012 that may provide for an improved parks and recreation system. These general recommended operational strategies as determined throughout the planning process are listed below and are intended to lead the development of the 2013‐2014 Action Plan.
The Department continues to consider the notion of a thorough and comprehensive analysis of the merits of becoming a district rather than
a municipal function. This will require extensive analysis and a significant amount of support from city and county governance. This effort should be a part of the agency’s 2013‐2014 Action Plan.
The Department’s values statements, mission statement, and vision statement were thoughtfully and methodically developed. The Department is strongly encouraged to elevate the statements in the public eye, and ensure connectivity between values, mission, and vision when making organizational decisions relative to service production and provision.
168
The Department’s staffing loads do not meet existing work demands and expectations. With the approval of the $42.9 million Parks Improvement Bond in 2008 intended to fund the construction and development of a variety of aquatics and youth sports projects throughout the City of Spokane, staff from each work unit/division have realized increased workloads. These capital
development funds and resulting projects were not accompanied by the operational and maintenance dollars needed to support the projects from a staffing perspective (or otherwise). The Departments is encouraged to request additional staff (both FTE and part‐time seasonal to compensate for these deficiencies.
Recreation and Riverfront Park divisions should be managed separately due to scope and size of operations. Consideration of Riverfront Park
as a quasi‐enterprise operation may be of both financial as well as functional benefit.
Participation in out‐of‐school activities and programs offer support for youth and working families and benefit youth socially, emotionally, and academically. Currently, the primary form of afterschool programming in Spokane is managed thought the Spokane Public School system. Given the significant number of youth in the community who would benefit from some form of recreational activity during after school and out of school hours, the Department should continue to pursue enhanced partnership opportunities with the public school system to enhance these types of youth services.
Environmental education programs were listed at the top of the 10 programs parks and recreation departments are planning to add within the next three years. Sixty‐eight percent of public park and recreation agencies offer nature‐based programming and 61 percent have nature‐based facilities. More than 30 percent of public agencies offer no nature programming, and slightly less than 40 percent have no nature‐based facilities. This trends reflects an interest in counter‐balancing the nationwide concern of “nature deficit disorder” popularized by the federal government and the author, Richard Louvre (technology’s impact on our loss of commitment to exercise and being out of doors). The Department has the inherent ability and capacity to build upon environmental and outdoor recreation opportunities. With significant nature‐based facilities and a strong community interest in the environment and outdoor recreation, the Department should take advantage of these factors and further develop relevant parks and recreation services.
Although addressed in the Action Plan, the Department is encouraged to assertively pursue potential partnerships and collaborations to best
use scarce resources and avoid duplication of service provision.
The Department’s mission statement clearly articulates that the community is defined as those “people who live, work and visit the city of Spokane” as the system is supported in large part by sales tax dollars. This should always be considered when the Department defines its customer base relative to pricing, customer service and other relevant issues.
169
Most attending or participating in public forums and surveys throughout the process tended to have a special interest. An on‐going challenge for the Department will be to engage as many community members with varying interests as possible in public processes to develop a global sense of community issues and interests. This should include regularly scheduled public open
houses including scheduling at locations that are atypical (e.g., religious institutions, schools).
The Department’s focus should be on measuring how parks and recreation services affect, influence or impact community issues. Developing or acquiring available measurement tools and methods will assist staff in this process.
According to survey data, parks and trails are the most important service the Department provides and have the highest current use and
satisfaction rates amongst those surveyed. These statistics should be affirmed or challenged every three to five years.
According to survey data, the greatest future need for outdoor facilities are trails and trail connections. These statistics should be affirmed or challenged every three to five years.
According to survey data, outdoor recreation is the primary recreation interest among survey respondents. These statistics should be
affirmed or challenged every three to five years.
According to survey data, the greatest future need for indoor facilities was indoor aquatics facilities. Considering the recent indoor aquatic facility development (i.e., downtown YMCA), this statistic should be challenged as circumstances have changed since the initiation of this planning process.
According to survey data, a dedicated funding source would be the preferred method for future parks and recreation funding including how
best to address the Department’s current deferred maintenance demands and burden. This issue should remain a significant priority and assessed based upon any progress or productivity resulting from the related goals and actions listed in the 2010‐2012 Action Plan.
A number of parks and recreation services including, but not limited to some senior center services did not align with the Department’s
values or vision as the process unfolded. Although these services are important or critical to certain community members, the fundamental question is whether they are “parks and recreation services” or “social services,” therefore, supported by another city department with relevant mission(s). This “divestment” will allow for the reallocation of Department resources to “true” parks and recreation services, thereby removing the Department form becoming the default for the management and provision of non‐parks and recreation services. Beyond the Department’s implementation of the recommended provision strategies as detailed in the Service Portfolios (Appendix G) as directed in the 2010‐2012 Action Plan, this issue will require on‐going Department attention and diligence connecting the dots between the issue and the Department’s values, mission and vision. Essentially, divesting of services that are not parks and recreation services.