Embed Size (px)
Citation preview

arX
iv:a
stro
-ph/
0606
740v
1 2
9 Ju
n 20
06
Spitzer IRS Spectra of Optically Faint Infrared Sources with
Weak Spectral Features
D. W. Weedman1, B. T. Soifer2,8, Lei Hao1, J. L. Higdon1, S. J. U. Higdon1, J. R. Houck1,
E. Le Floc’h5, M. J. I. Brown3,4, A. Dey4, B. T. Jannuzi4, M. Rieke5, V. Desai8, C. Bian8,
D. Thompson8, L. Armus2, H. Teplitz2, P. Eisenhardt6, S.P. Willner7
ABSTRACT
Spectra have been obtained with the low-resolution modules of the Infrared
Spectrograph (IRS) on the Spitzer Space Telescope (Spitzer) for 58 sources hav-
ing fν(24µm ) > 0.75mJy. Sources were chosen from a survey of 8.2 deg2 within
the NOAO Deep Wide-Field Survey region in Bootes (NDWFS) using the Multi-
band Imaging Photometer (MIPS) on Spitzer. Most sources are optically very
faint (I > 24mag). Redshifts have previously been determined for 34 sources,
based primarily on the presence of a deep 9.7µm silicate absorption feature,
with a median z of 2.2. Spectra are presented for the remaining 24 sources for
which we were previously unable to determine a confident redshift because the
IRS spectra show no strong features. Optical photometry from the NDWFS
and infrared photometry with MIPS and the Infrared Array Camera on Spitzer
(IRAC) are given, with K photometry from the Keck I telescope for some ob-
jects. The sources without strong spectral features have overall spectral energy
distributions (SEDs) and distributions among optical and infrared fluxes which
are similar to those for the sources with strong absorption features. Nine of the
24 sources are found to have feasible redshift determinations based on fits of a
weak silicate absorption feature. Results confirm that the ”1 mJy” population
1Astronomy Department, Cornell University, Ithaca, NY 14853; [email protected]
2Spitzer Science Center, California Institute of Technology, 220-6, Pasadena, CA 91125
3Department of Astrophysical Sciences, Princeton University, Peyton Hall, Princeton, NJ 08544-1001
4National Optical Astronomy Observatory, Tucson, AZ 85726
5Steward Observatory, University of Arizona, Tucson, AZ 85721
6Jet Propulsion Laboratory, 4800 Oak Grove Dr., 169-327, Pasadena, CA 91109
7Smithsonian Astrophysical Observatory, 60 Garden St., Cambridge, MA 02138
8Division of Physics, Mathematics and Astronomy, 320-47, California Institute of Technology, Pasadena,
CA 91125

– 2 –
of 24µm Spitzer sources which are optically faint is dominated by dusty sources
with spectroscopic indicators of an obscured AGN rather than a starburst. There
remain 14 of the 58 sources observed in Bootes for which no redshift could be
estimated, and 5 of these sources are invisible at all optical wavelengths.
Subject headings: dust, extinction — galaxies: high-redshift – infrared: galaxies
— galaxies: starburst— galaxies: AGN
1. Introduction
Imaging surveys at infrared wavelengths with the Spitzer Space Telescope (Spitzer) have
the potential to reveal populations of sources that were previously unknown. In particular,
surveys with the Multiband Imaging Photometer for Spitzer (MIPS) (Rieke et al. 2004) at
24µm should reveal sources which are luminous because of emission from dust, and which
may contain sufficient dust to make them very faint or invisible optically. The Infrared
Spectrograph on Spitzer (IRS)1 (Houck et al. 2004) is sufficiently sensitive to obtain low-
resolution spectra of these MIPS sources at flux density levels of fν(24µm ) < 1 mJy.
As part of initial efforts to characterise this ”1 mJy” population, we surveyed 8.2 deg2
within the Bootes field of the NOAO Deep Wide-Field Survey (NDWFS) (Jannuzi and Dey
1999) with MIPS to produce a catalog of mid-infrared sources. The MIPS data were obtained
with an effective integration time at 24µm of ∼90 s per sky pixel, reaching a 5 σ detection
limit of ∼ 0.3mJy for unresolved sources. This field was chosen because the deep and well
calibrated optical imagery in BW , R, and I bands makes possible the identification of infrared
sources with very faint optical counterparts and allows confident selection of infrared sources
lacking optical counterparts to very deep optical limits.
We then selected for subsequent spectroscopic observations with Spitzer those sources
which are the faintest optically (typically I > 24) while also bright enough (> 0.75mJy
at 24µm ) for spectroscopy with the IRS within integration times of ∼ 1 h. Other than
the mid-infrared flux limit, the only selection criterion was optical faintness, because we
were primarily interested in understanding sources which would not have been identified in
previous optical studies. Our first results reported the discovery of a significant population
of optically obscured, high redshift sources (Houck et al (2005); hereinafter H05). To date,
we have observed 58 Bootes sources with the IRS. Continuum was detected in all 58 objects
1The IRS was a collaborative venture between Cornell University and Ball Aerospace Corporation funded
by NASA through the Jet Propulsion Laboratory and the Ames Research Center.

– 3 –
observed, confirming that all mid-infrared sources are real even when they have no optical
counterparts and also demonstrating that the MIPS-derived positional uncertainties are less
than ∼ 0.5” rms. Redshifts for 17 sources determined by fitting templates of known local
objects were reported in H05; an additional 17 sources with redshifts include 14 in Higdon
et al. (in preparation), 2 in Desai et al. (2006), and one in Dey et al. (2005). The most
important result is that these sources are generally at high redshift. Of the 34 sources with
redshifts, the median redshift (z) is 2.2. The spectra of these sources with redshifts are
dominated by strong silicate absorption centered at rest frame 9.7 µm. Only two sources
are best fit by strong PAH emission features not requiring silicate absorption. There remain
24 spectra which we have observed with the IRS but for which redshifts have not yet been
reported because there are no strong spectral features. We discuss these sources in the
present paper.
All Bootes sources with 1.9 < z < 2.7 from IRS redshifts have measurable redshifts
because of the deep silicate absorption feature centered at rest frame 9.7µm . Because of
the accessible wavelength range of the IRS, redshifts beyond about 2.8 could not be measured
because this absorption feature would be longward of the IRS wavelength limit. This allows
two possible interpretations of the 24 sources for which we have not been able to derive
redshifts: either they are a category of sources at redshifts z . 2.8 having weak spectral
features, or they are at z & 2.8. It is crucial to know which conclusion is more representative
of the ”no-z” sample. If features are weak, that is important for interpreting the nature of
the sources, and for understanding why they are optically faint. If the ”no-z” sources are
at higher redshifts than for the measured sources, this would be evidence for an obscured
population at even higher redshifts and luminosities than the sources already identified.
Because this population of optically-faint infrared sources would not have been selected
using criteria available before Spitzer, it is necessary to consider whether all of the targets
do indeed represent a distant, extragalactic population, as we have assumed. Our initial se-
lection ruled out Solar System objects by verifying that the infrared source showed no proper
motion between the two epochs of the MIPS observations; the selection at 24µm insures that
any Solar System objects would be in the main asteroid belt or closer and hence would have
measurable proper motion between Spitzer observations. All sources were also detected at
the same positions with the Spitzer Infrared Array Camera (IRAC) (Fazio et al. 2004) with
observations obtained at a different epoch. Known stellar populations are ruled out because
the extreme infrared to optical flux ratios imply very cool source temperatures for a black
body. In addition, we report new K band observations with high spatial resolution which
resolve at least 4 of the 24 sources. All indications, therefore, are that these sources are an
extragalactic population, but locating them in the universe requires the determination of
redshifts.

– 4 –
In this paper, we give all available data for the 24 sources with ”featureless” spectra
and compare the overall spectral energy distributions for this sample of sources to those
sources with previously determined redshifts. We illustrate all of the spectra in order to
discuss which ones might have weak features and suggest new redshifts for 9 sources based
on possible but weak spectral absorption features.
2. Observations and Data Reduction
Our initial selection for spectroscopic targets in the Bootes field was to use the MIPS
and optical surveys to inspect all sources within the 8.2 deg2 portion of the MIPS survey
field overlapping the NDWFS which have fν(24µm ) > 0.75 mJy and I ≥ 24mag. There are
4273 MIPS 24µm sources brighter than 0.75mJy, of which 114 met this optical magnitude
criterion. (Magnitudes in the NDWFS Data Release 3 are slightly modified from those in the
initial version from which we worked, so these statistics would not be exactly correct using
the released version.) There are 65 sources of the 114 having fν (24µm ) > 1.0mJy and I >
24mag. To define a sample based on specific infrared and optical flux limits, we observed 35
of the 65 sources with fν(24µm ) > 1.0mJy and I > 24mag. We also included 23 sources
with extreme values of infrared to optical flux ratio even if they did not meet these specific
selection criteria. (In the remainder of this paper, we define the infrared to optical flux ratio
as IR/opt = νfν(24µm )/νfν(I).) These remaining 23 targets are primarily sources with
fν(24µm ) < 1.0mJy and I > 24mag, but a few sources with optical magnitudes I < 24mag
were also included.
Spectroscopic observations were made with the IRS Short Low module in order 1 only
(SL1) and with the Long Low module in orders 1 and 2 (LL1 and LL2), described in Houck
et al. (2004). These give low resolution spectral coverage from ∼8µm to ∼35µm . Sources
were normally placed on the slits by offsetting from nearby 2MASS stars; in a few cases with
no sufficiently nearby 2MASS stars, direct pointing without offsets was used successfully.
All images when the source was in one of the two nod positions on each slit were coadded
to obtain the source spectrum. The background which was subtracted for LL1 and LL2
included coadded background images that added both nod positions with the source in the
other slit together with the alternative nod position in the same slit, yielding a background
observation with three times the integration time as for the source, in order to reduce noise in
the background. The differenced source-minus-background image was used for the spectral
extraction, giving independent extractions of the spectrum at the two positions on the slit
for each LL order. The two independent spectra were compared to reject any highly outlying
pixels in either spectrum, and a final mean spectrum was produced. For SL1, there was no

– 5 –
separate background observation with the source in the SL2 slit, so background subtraction
was done between coadded images of the two nod positions in SL1. Observed images were
processed with version 11.0 of the SSC pipeline. Extraction of source spectra was done with
the SMART analysis package (Higdon et al. 2004). All spectra discussed in this paper are
shown in Figures 1 and 2; displayed spectra have been boxcar-smoothed to the approximate
resolution of the different IRS modules (0.2µm for SL1, 0.3µm for LL2, and 0.4µm for LL1).
It can be seen from comparison of the spectral flux densities with the MIPS fluxes (Figures
1 and 2) that the extracted spectra typically agree at 24µm to within 10 % of the MIPS
flux.
Table 1 summarizes the MIPS and IRS observations and resulting characteristics for
the 24 sources, giving the name (with full coordinates) and the MIPS 24µm flux density.
Sources are ordered by declination. Even when spectral features cannot be seen, the IRS
spectra yield a slope of the continuum. To record this information, the power-law slopes of
the continua are determined by using SMART to find the best linear fit to the continuum
when displayed in log-log units. On occasion with various IRS spectra, the SL continuum
does not perfectly stitch to the LL continuum, and this is attributed primarily to slight
mispointing, which can cause significant effects in the SL slit. With spectra having poor
signal-to-noise ratios (S/N), poor stitching might not be obvious, so the formal measures of
the power law index listed in Table 1 use only LL spectra, with λ > 14µm . Fits are cut
at 33µm because of the increased noise in the spectra that appears beyond this wavelength.
The resulting power law index for 14µm < λ < 33µm is given in Table 1. We have also
combined IRAC fluxes with the MIPS results to determine the slope of the power law which
would connect the MIPS 24µm and IRAC 8µm fluxes as well as the power law connecting
IRAC 8µm and 3.6µm fluxes. These slopes are also given in Table 1.
To quantify the quality of the spectra, we measure the S/N of the LL1 spectra. This is
done by determining within SMART the best-fit continuum to the LL1 spectrum of either
linear, quadratic, or cubic fit and then measuring the RMS about this continuum. The S/N
in Table 1 is the ratio S/N = (flux density at wavelength midpoint/RMS for full continuum
fit). Table 1 also includes any new redshift estimates that can be determined from all of the
available data, as are discussed below.
More details of near-infrared fluxes and optical magnitudes of the sources are in Table
2, including the IRAC flux measurements of these sources, observed in Bootes as described
by Eisenhardt et al. (2004), along with K band magnitudes.
The K band data for 7 objects were obtained on UT 2005 June 19 and 20 with the Near
Infrared Camera (NIRC) (Matthews and Soifer 1994) on the Keck I Telescope. The NIRC
instrument has a 38.4” field of view and a pixel scale of 0.15”. The seeing was in the range

– 6 –
0.7” to 0.9” for all observations. Five objects were observed under photometric conditions
on June 20, each for a total exposure time of 20 minutes. Objects number 4 and 24 were
observed on June 19 under non-photometric conditions for 16 and 21 minutes, respectively.
They were each observed for an additional 200 seconds under photometric conditions on
June 20.
The individual dithered images for each target were dark-subtracted, flat-fielded, masked,
aligned, and stacked using the IRAF2 NIRCtools package. The data were placed on the Vega
magnitude scale using standard stars (Persson et al. 1998) observed at a range of air masses
to correct for extinction. For objects 4 and 24, the individual frames from June 19 were
scaled to match the photometry from June 20, and all frames were then combined using
variance weighting.
All seven objects were detected, with 18.6 < K < 20.9 mag. The photometric uncer-
tainties range from 0.1 to 0.3 mag and are dominated by the source flux measurement, but
include the zero point uncertainties from the standard stars. Sources 4, 9, 16 and 17 are
clearly resolved.
3. Discussion
3.1. Characteristics of the Bootes Sample
Understanding the full extragalactic population of mid-infrared sources is crucial to de-
termining the evolution of dusty, obscured sources in the universe and to determining how
those sources compare in number and evolution to optically visible sources. Already there
are indications from IRS results for the Bootes sources that the high redshift population
of luminous, dusty galaxies which are optically obscured exceeds the population previously
known from optical surveys. H05 argue that the obscured sources with IRS redshifts deter-
mined from silicate absorption derive their mid-infrared luminosity primarily from an AGN,
based on the high luminosities required, the similarity to infrared spectra of known local
AGN, and the occasional presence of strong radio sources. These IRS observations indicate
that for redshifts z & 2, the obscured quasars already discovered are a comparable population
to unobscured quasars. This conclusion derives from comparison with quasars discovered in
the same Bootes survey at similar 24µm fluxes but which are optically bright.
2IRAF is distributed by the National Optical Astronomy Observatory, which is operated by the Associa-
tion of Universities for Research in Astronomy, Inc., under cooperative agreement with the National Science
Foundation.

– 7 –
Using optically-determined spectroscopic redshifts, Brown et al. (2005) derive the
redshift distribution and luminosity function of optically classifiable quasars discovered in
the MIPS 24µm Bootes survey. This result includes 87% of the Bootes sources having fν(24µm ) > 1 mJy and R < 21.7 (for type 1 quasars, the I mag limit would be similar). This
comprehensive sample has, therefore, a very similar 24µm selection criterion as our sample
but much brighter optical magnitudes; the IR/opt for the Brown et al. sample is what is
expected for unobscured, type 1 quasars. Brown et al. conclude quantitatively that the
shape of the rest-frame 8µm infrared luminosity function is the same as derived from optical
surveys and that the redshift peak of quasar space density is at the same redshift. In sum,
selection of unobscured quasars based on 24µm fluxes gives the same result for comparable
optical magnitude limits as a sample based on optical criteria alone. There are 35 quasars
in the full Bootes field with 1.9 < z < 2.7 in their nearly-complete sample.
These numbers can be compared directly with the characteristics of our optically ob-
scured sample within the same redshift interval by considering only those sources with 1.9 <
z < 2.7 selected to the same infrared limit, having fν(24µm ) > 1 mJy, but with I > 24 mag.
There are 14 sources with IRS spectra observed in Bootes which meet these redshift and flux
criteria. There are a total of 65 objects in the full Bootes field satisfying both of these optical
and infrared flux criteria, and 35 of these 65 were observed with the IRS. Approximately,
therefore, the 14 sources with redshifts 1.9 < z < 2.7, fν(24µm ) > 1 mJy, and I > 24 mag
derive from 35/65, or ∼ 54%, of a complete sample defined by fν(24µm ) > 1 mJy and I
> 24. Correcting for this factor of ∼ 2 incompleteness, there should be ∼ 27 optically-faint
sources (I > 24 mag) having 1.9 < z < 2.7 in the full Bootes field. This number is com-
parable to the 35 unobscured, type 1 quasars within this redshift range which are known
in the field from Brown et al. (2005). This comparison gives an empirical indication that
optically obscured sources already identified at these high redshifts are similar in number
to the classical, optically discoverable type 1 AGN. This is only a lower limit to the actual
number of obscured sources, because the 24 objects in the Bootes sample without redshifts
are not included, and partially obscured sources having fν(24µm ) > 1 mJy in the interme-
diate magnitude range 22 . I . 24 have not been counted in this tally of obscured AGN.
Our result that the number density of obscured quasars exceeds that of unobscured quasars
at high redshifts is also consistent with estimates of obscured AGN derived using Spitzer
infrared colors compared with optical or radio classifications of AGN (Alonso-Herrero et al.
2006; Martinez-Sanigre et al. 2005).
To refine our measures of the obscured population, it is necessary to understand whether
the 24 sources without IRS redshifts are also high redshift, obscured sources. There are two
alternative explanations for why strong spectral features are not visible in these 24 sources.
The first is that the redshifts are so high that features are shifted out of the range of the IRS.

– 8 –
The highest redshift for which the silicate absorption feature is measured in the initial results
of H05 is 2.73. If sources have redshifts above 2.8, the silicate absorption feature would be
centered at observed wavelength of 37µm , so even the beginning of this feature could not
be confidently identified in IRS spectra of poor S/N. There is one observed example already
of a source with known redshift higher than this limit which shows a featureless spectrum
within the IRS wavelengths. This is the gravitationally lensed quasar APM 08279+5255,
having z = 3.91, which shows a featureless power law over the full IRS range, corresponding
to rest wavelengths of 1.7µm to 7µm (Soifer et al. 2004), with a power law slope of 1.5.
By comparison to this source, we would not expect to see features in sources with z & 2.8.
The alternative explanation is that sources have redshifts which place the 9.7µm silicate
absorption feature within our spectral range, but that this feature is too weak to be detected.
The S/N required to see such features depends on the strength of the feature, so we can never
rule out the presence of sufficiently weak features in our spectra. However, we had already
determined that features at the level of the weakest silicate absorption feature in any of
the AGN templates used for the redshift determinations in H05 are not present. Templates
used were Arp 220, IRAS F00183-7111, and Markarian 231; the weakest 9.7µm absorption
feature within these templates is Markarian 231. For Markarian 231, the absorption depth
is 50% (the IRS spectrum is in Weedman et al. (2005)); i.e., the absorption has removed
50% of the unabsorbed continuum which would otherwise be present at the wavelength of
maximum absorption. The absorption depth, defined as ABS = [1 - f(9.7)/f(CONT)], is
estimated by comparing the observed flux density at 9.7µm , f(9.7), with the continuum flux
density, f(CONT), predicted for an unabsorbed continuum as determined from a linear fit
to the continuum level on either side of the silicate feature. The fraction of the continuum
which is absorbed relates to the optical depth as ABS = 1 − e−τ , for τ the maximum optical
depth in the 9.7µm silicate absorption feature. The six sources with the weakest features in
H05 are fit with the Markarian 231 template which has ABS = 0.5; the remaining 11 sources
have ABS > 0.5.
The detectability of silicate absorption depends on the value of ABS. Of the 58 sources
in Bootes observed in our faint-source sample, the 24 sources discussed in the present paper,
or 41%, are those with ABS < 0.5; they did not have sufficient absorption to be fit with a
template which would yield a confident redshift. The sample of Bootes sources was chosen
because of the extreme IR/opt, and we do not have a control sample of objects with known
redshifts selected in the same way to determine what fraction of such sources would be
expected to have deep silicate absorption. The best set of such comparison sources currently
available is a large sample of ultra-luminous infrared galaxies (ULIRGS) observed by the
IRS (Spoon et al. 2006). We have examined IRS low resolution spectra of 80 ULIRGS
in this sample to estimate the depth of the 9.7µm silicate absorption feature (or height

– 9 –
of any broad emission features, if present). Of the 80 sources, 60 (75%) show the silicate
absorption feature with absorption depth ABS > 0.5 (Hao et al., in preparation). This result
emphasizes the prevalance of deep absorption among ULIRGS and implies that absorption
should be characteristic of dusty sources. If the Bootes sources are all at redshifts such that
the 9.7µm absorption feature is accessible to the IRS, we expect them to show absorption
as frequently as do ULIRGS, given the Bootes selection designed to favor obscured sources.
That only 60% of the Bootes sources show ABS > 0.5 compared to 75% of ULIRGS is not
a statistically significant difference given the sizes of the two samples, so this comparison is
consistent with (although does not prove) the interpretation that all of the Bootes sources
are sources similar to absorbed ULIRGS.
Because Markarian 231 is being used as a comparison template for these sources, it is
useful to ask how it would appear if at z = 2. The redshift is 0.0422, and the observed
fν(8.4µm ) = 1080 mJy (Rieke 1976), so the observed fν(24µm ) if at z = 2 would be 0.4
mJy. The IR/optical is more uncertain because a total magnitude is not available at rest-
frame 0.27µm for comparison to the observed I band at z = 2. The observed flux density
at rest-frame 0.34µm is 4 mJy (Surace and Sanders 2000); the rest-frame flux density at
0.27µm for the nucleus alone, without correction for a total galaxy magnitude, is 0.5 mJy
(Smith et al. 1995). These results bracket the true total magnitude at 0.27µm so yield
that Markarian 231 would have 9 < IR/opt < 72 if at z = 2. For scaling, a source of I
= 24 and fν(24µm ) = 1 mJy has IR/opt of 60. The sources in table 1 have IR/opt ≥
40, and 75% of these sources have IR/opt greater than the maximum value that Markarian
231 could have. Overall, therefore, Markarian 231 if at z = 2 would be too faint for our
flux selection criterion for Bootes but might meet the IR/optical criterion. It is sufficiently
similar, however, to indicate that it is a valid comparison source.
3.2. Comparison of Bootes Sources with and without Strong Spectral Features
To consider whether the Bootes sources with weak spectral features are systematically
different from the heavily absorbed sources with previously measured redshifts, we compare
the samples and look more closely at detailed spectral characteristics including overall SEDs.
The first test is to consider whether there are any obvious systematic differences between
the Bootes sources with redshifts determined from deep absorption (ABS > 0.5) compared
to those sources in the present paper without strong spectral features. Figure 3 shows the
distributions of IR/opt and fν(24µm ) for the ”no-redshift” sample in the present paper
compared to the objects in H05 with redshifts. The median fν(24µm ) is 1.1 mJy for those
with redshifts and 1.3 mJy for those without. These flux limits are similar, implying that the

– 10 –
ability to determine a redshift does not depend on flux. (In fact, observations were designed
with the goal of having similar S/N at all fluxes, so that shorter integrations were used on
brighter sources.) Counting the limits, sources with redshifts have median IR/opt of 145 and
those without have 115. This slight difference in the distributions for IR/opt implies that
the sources without redshift may be somewhat less obscured optically compared to those
with deep silicate features that allowed redshift determinations. However, the difference
would correspond to an optical magnitude difference of only 0.25 mag, which is not a large
difference compared to magnitude uncertainties. In any case, the no-redshift sources are
much more optically obscured than type 1 AGN, which is the category of AGN that does
not typically show silicate absorption; the optically bright, type 1 quasars in the 1 mJy
sample in Brown et al. (2005) have 1 . IR/opt . 10. The no-redshift sample remains
puzzling, therefore. How can sources which are seemingly very obscured optically have no
strong absorption feature in the infrared?
Another comparison of the samples with and without redshifts is through the near-
infrared colors. Such colors have been used to preselect targets based on models of how
colors derive for starbursts and AGN at various redshifts (Yan et al. 2005) and in empirical
comparisons of AGN and starbursts as classified by other criteria (Brand et al. 2006). Figure
4 shows the distributions of colors among MIPS 24µm and IRAC 8µm and 3.6µm fluxes.
There is little difference between the Bootes samples with and without redshifts. The median
log[fν (24µm )/fν (8µm )] is 1.0 for sources with redshifts, and 0.85 for sources without,
indicating similar mid-infrared continuum slopes for both samples, which implies similar
distributions of dust temperatures among the samples.
While this result does not distinguish the two samples, the slopes for both samples are
steep enough to expect that many sources should be starbursts based on the spectral slopes.
Yan et al. (2005) considered a value of log[fν(24µm )/fν(8µm )]= 1.0 as dividing sources
with starburst spectra (> 1.0) from those with AGN spectra (< 1.0). By this criterion,
about half of the objects in Figure 4 should be starbursts. As previously noted, however,
only 1 of the 24 Bootes sources in Figures 1 and 2 possibly shows PAH features, and it is
these features which are associated with starbursts (Genzel et al. 1998).
Brand et al. (2006) have recently demonstrated that AGN identified because of X-
ray luminosity have a different distribution of mid-infrared colors compared to other mid-
infrared sources. They compare the IRAC and MIPS fluxes for all sources in the Bootes
survey with the ∼ 5% of sources detected by a Chandra X-Ray Observatory survey within
the Bootes field. Brand et al. show that the X-ray sources are distributed around a value of
log[fν(24µm )/fν(8µm )] = 0.5, with a 1 σ of 0.16 for the width of the distribution, whereas
the remaining sources are distributed about a value of 1.0. With this criterion, only half of

– 11 –
the Bootes sources in Figure 4 fall within the 3 σ distribution for an X-ray luminous AGN.
This again raises the question of why the Bootes sources with spectral slopes steeper than
those of AGN rarely show evidence in the IRS spectra of the PAH features from starbursts.
One explanation might be that these Bootes sources with steep slopes but no PAH
features are AGN which have low X-ray luminosity and systematically cooler dust than
the AGN associated with detectable X-ray sources. An alternative explanation is that the
sources with steep slopes but no PAH emission are not powered by AGN, but are powered by
a starburst even though there is no PAH emission. In this circumstance, the starburst would
have to be so embedded in dust or of sufficiently low metallicity that the PAH emission is
absorbed or not produced, as suggested by Hunt and Maiolino (2005) to be characteristic of
primordial starbursts, and as observed for the Blue Compact Galaxy SBS 0335-052 (Thuan
et al. 1999; Houck et al. 2004b). Regardless of the explanation, the empirical conclusion
is that the fν(24µm )/fν(8µm ) does not give a consistent classification compared to mid-
infrared spectral features for determining whether sources have their mid-infrared luminosity
derived from an AGN or from a starburst.
Using the photometry from the NDWFS together with the IRAC and MIPS fluxes, the
overall SEDs of the sources can be examined. Most of the sources in the Bootes sample
have SEDs that are monotonically decreasing from the MIPS 24µm flux density through
all four IRAC bands and the optical bands. For such sources, these photometric continuum
fluxes can be fit by a single power law or by a power law that becomes steeper at shorter
wavelengths. For the entire Bootes sample of 58 sources, 41 sources (71%) have power-
law spectra and so can be interpreted as having all infrared fluxes dominated by a dust
continuum. The remaining 17 sources show inflections among the IRAC points, indicating
the possible presence of a stellar component. For the 34 sources with redshifts, 25 are power
laws. For the 24 no-redshift sources in the present paper, 16 are power laws. In this respect,
the two samples are also similar.
These comparisons of IR/opt, mid-infrared colors, and SEDs do not indicate any differ-
ences in characteristics between the Bootes sources with strong absorption features and those
with weak features. Consequently, these comparisons do not indicate a conclusion regarding
whether the no-z sources are at z . 2.8 or z & 2.8.
Even though sources do not have sufficiently strong silicate absorption to be detected in
our spectra, sources with weak silicate absorption could have sufficient optical absorption to
produce large values of IR/opt. As previously emphasized, the sources in the Bootes samples
were selected to be optically faint, I ≥ 24mag, and to have extreme values of IR/opt. At
redshift of 2, the rest-frame ultraviolet at 0.27µm observed in the I band is heavily extincted
compared to the extinction required to produce the 9.7µm absorption feature. Using the

– 12 –
grain model of Li and Draine (2001), the ratio of extinctions is A(0.27µm )/A(9.7µm ) =
24, for A the extinction in magnitudes. A silicate absorption feature with ABS = 0.10, or
optical depth of 0.1 in the 9.7µm feature, has A(9.7µm ) = 0.11 mag, so A(0.27µm ) = 2.7
mag. This means that an unobscured, type 1 quasar of I = 22 mag would be extincted to
I > 24 mag if the ultraviolet continuum were absorbed by the same dust which produces a
9.7µm absorption feature of ABS = 0.10.
A source with ABS = 0.10 would not have a sufficiently strong absorption feature to have
been measured within the available Bootes spectra. That such a source could nevertheless
have significant optical extinction is consistent with explaining all of the Bootes sources as
being obscured sources with large values of IR/opt arising from dust extinction, even though
the 9.7µm feature was not detected in all of the IRS spectra. This interpretation would
also explain why the IR/opt does not correlate with the detection of 9.7µm absorption;
a source with negligible ABS can still have sufficient ultraviolet extinction to fall within a
sample having I > 24mag. This conclusion indicates that properties of the sources with weak
silicate features are consistent with obscured AGN, but it is not proof of that classification. It
remains crucial to detect any weak absorption features within the spectra, which is discussed
in the next section.
3.3. Possible New Spectroscopic Redshifts
To examine the spectra more carefully in a search for the possible presence of weak
spectral features, we fit the power law that would connect the IRAC (8µm ) and MIPS
(24µm ) photometry, and display this continuum in Figures 1 and 2. By seeking departures
from this power law, we can attempt to determine whether or not real spectral features are
present. As previously emphasized, none of these sources are characterized by the readily
visible, strong absorption features that allowed redshift measurements for other sources with
similar S/N in H05.
Sources are divided into Figure 1 and Figure 2 by placing in Figure 1 those which appear
to have weak features that might be real. The 12 spectra in Figure 1 have been fit with
varying combinations of a power law and a silicate absorption profile (Li and Draine 2001).
Initially, the best fitting power law to the entire IRS spectrum is determined by adopting
the least squares fit with the minimum residuals. Then, the best fitting combination of a
power law of varying slope with a silicate profile of varying depth is fit by stepping through
all redshifts 1 < z < 3 in increments of 0.1. Results are compared for goodness of fit between
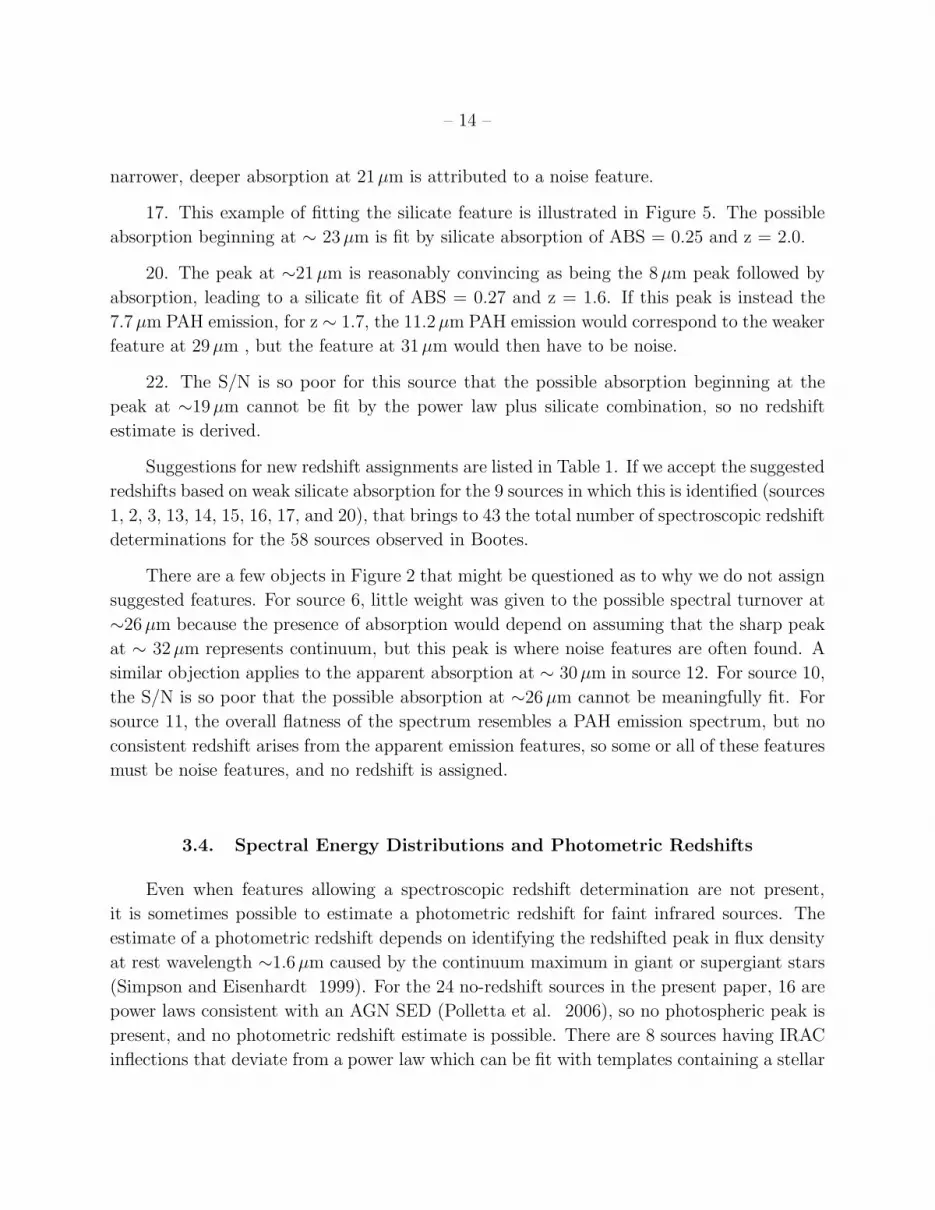
the power-law fits and the power law plus absorption fits. For ten of the 12 sources in Figure
1, the fit containing absorption is quantitatively better. An example is shown in Figure 5,

– 13 –
for source 17. The absorption fit shown has a redshift of 2.0 and ABS = 0.25.
The sources in Figure 1 are now discussed individually, including comments on this
absorption fit, and redshifts are listed in Table 1 when the fit using a weak silicate feature
is statistically better than a power-law fit.
1. The spectral turnover starting at ∼25µm could be weak silicate absorption following
the spectral peak at rest frame 8µm that is characteristic of absorbed sources; as seen in
Markarian 231 and other absorbed ULIRGS, this spectral peak is not emission but arises
because of absorption at longer and shorter wavelengths. Fitting the spectrum with a power
law and the silicate feature yields an optimum fit with ABS = 0.28 at z = 2.4.
2. The spectral turnover starting at ∼23µm could be absorption, which can be fit by a
silicate feature of ABS = 0.45 at z = 2.0, but the photometric z (discussed below) is 1.2. The
photometric z would be consistent with the broad peak centered at ∼20µm being silicate
emission at rest frame 10µm instead of the 8µm peak, but this would raise the puzzle of
why an optically obscured source shows the silicate emission primarily found in unobscured,
type 1 AGN.
3. The possible absorption beyond ∼22µm can be fit by a silicate feature of ABS =
0.34 at z = 1.9.
7. The possible absorption beyond ∼21µm can be fit by a silicate feature of ABS = 0.15
at z = 1.8, but this fit is not statistically better than a power-law fit without absorption, so
a possible redshift is not listed in Table 1.
9. The peak at ∼20µm could be the 8µm peak, enhanced by noise, followed by very
noisy absorption. The ∼20µm peak could also be 7.7µm PAH emission at z ∼ 1.6, but
we should then see the 11.2µm PAH feature at 29µm , which is not present. A formal fit
restricted to silicate absorption gives z ∼ 1.0. This spectrum is so noisy that no weight is
given to this result, and the redshift of this object is considered as indeterminate.
13. There is a reasonably convincing 8µm peak at ∼24µm followed by absorption, and
this can be fit by a silicate feature of ABS = 0.30 at z = 2.2.
14. The peak at ∼20µm could be the 8µm peak, and the absorption can be fit by a
silicate feature of ABS = 0.39 at z = 1.4.
15. The peak at ∼17µm could be the 8µm peak, and the absorption can be fit by a
silicate feature of ABS = 0.37 at z = 1.1.
16. The fit with the standard silicate absorption profile fits the broader absorption
beginning at 24µm , for a silicate depth of ABS = 0.29 and z = 2.0. In this case, the
– 14 –
narrower, deeper absorption at 21µm is attributed to a noise feature.
17. This example of fitting the silicate feature is illustrated in Figure 5. The possible
absorption beginning at ∼ 23µm is fit by silicate absorption of ABS = 0.25 and z = 2.0.
20. The peak at ∼21µm is reasonably convincing as being the 8µm peak followed by
absorption, leading to a silicate fit of ABS = 0.27 and z = 1.6. If this peak is instead the
7.7µm PAH emission, for z ∼ 1.7, the 11.2µm PAH emission would correspond to the weaker
feature at 29µm , but the feature at 31µm would then have to be noise.
22. The S/N is so poor for this source that the possible absorption beginning at the
peak at ∼19µm cannot be fit by the power law plus silicate combination, so no redshift
estimate is derived.
Suggestions for new redshift assignments are listed in Table 1. If we accept the suggested
redshifts based on weak silicate absorption for the 9 sources in which this is identified (sources
1, 2, 3, 13, 14, 15, 16, 17, and 20), that brings to 43 the total number of spectroscopic redshift
determinations for the 58 sources observed in Bootes.
There are a few objects in Figure 2 that might be questioned as to why we do not assign
suggested features. For source 6, little weight was given to the possible spectral turnover at
∼26µm because the presence of absorption would depend on assuming that the sharp peak
at ∼ 32µm represents continuum, but this peak is where noise features are often found. A
similar objection applies to the apparent absorption at ∼ 30µm in source 12. For source 10,
the S/N is so poor that the possible absorption at ∼26µm cannot be meaningfully fit. For
source 11, the overall flatness of the spectrum resembles a PAH emission spectrum, but no
consistent redshift arises from the apparent emission features, so some or all of these features
must be noise features, and no redshift is assigned.
3.4. Spectral Energy Distributions and Photometric Redshifts
Even when features allowing a spectroscopic redshift determination are not present,
it is sometimes possible to estimate a photometric redshift for faint infrared sources. The
estimate of a photometric redshift depends on identifying the redshifted peak in flux density
at rest wavelength ∼1.6µm caused by the continuum maximum in giant or supergiant stars
(Simpson and Eisenhardt 1999). For the 24 no-redshift sources in the present paper, 16 are
power laws consistent with an AGN SED (Polletta et al. 2006), so no photospheric peak is
present, and no photometric redshift estimate is possible. There are 8 sources having IRAC
inflections that deviate from a power law which can be fit with templates containing a stellar

– 15 –
photospheric component. SEDs of these 8 sources are shown in Figure 6, with template fits
which yield a photometric redshift. The template SEDs which are shown are intended only
to be representative and to illustrate photometric estimates of redshift based on the 1.6u
peak. We did not attempt to determine models which optimize the SED fit or provide a
quantitative separation of stellar luminosity and dust luminosity.
For most of the sources in Figure 8, the photospheric component is not conspicuous,
presumably because a power-law component of dust continuum contributes to the flux at
the wavelengths of the IRAC points and dilutes the photospheric component. This is seen
in Figure 6 for sources 1, 4, 6, 8, 11, and 16 for which the observed photometry at longer
wavelengths exceeds the template. Only for sources 2 and 12 do the observed fluxes at all
wavelengths fit a full template including the photospheric component, so a photometric red-
shift estimate is more reliable for these two sources and is given in Table 1. However, source
2 also has a redshift from a weak silicate feature (discussed above), which does not agree with
the photometric redshift. For the remaining 6 sources with evidence of a photospheric com-
ponent, the redshift of the 1.6µm peak is much more uncertain, and photometric redshifts
are not adopted. Both of the photometric redshift assignments are at redshifts sufficiently
low that the silicate absorption would be accessible to the IRS spectral window if present.
There is another interesting result regarding the 8 sources for which there is evidence
for photospheric emission in the IRAC bands. All sources except source 8 have a ratio of
fν(24µm )/fν(8µm ) > 9.5, and these 7 sources represent 7 of the 9 sources in the entire
sample of 24 having fν(24µm )/fν(8µm ) > 9.5. This limiting ratio is that used by Yan et al.
(2005) with the intention of locating starburst sources. While the SED fits are consistent
with a substantial starburst component, we have already noted that only one of these sources
(source 11) has an IRS spectrum that might conceivably show PAH emission.
4. Summary and Conclusions
We present IRS spectra and optical and infrared photometric data for 24 optically faint
sources with fν (24µm ) > 0.8mJy selected from within the 8.2 deg2 Spitzer Bootes survey
within the NOAO Deep Wide-Field Survey. The Bootes sample with IRS spectra comprises
a set of 58 sources with high infrared to optical ratios (νfν(24 µm)/νfν(I) = IR/opt > 50)
and typical fν(24µm ) = 1 mJy. Redshifts have been previously determined for 34 of the
58 sources, with a median z = 2.2. The 24 sources discussed in the present paper are the
remaining sources which do not show sufficiently strong spectral features in the IRS low-
resolution spectra for confident redshift determination by fitting with templates containing
either strong silicate absorption or strong PAH emission.

– 16 –
There are no significant systematic differences in overall SEDs or fluxes for the sample
with redshifts (usually having strong silicate absorption at rest frame 9.7µm ) and the
sample without redshifts (having weak or no absorption or emission features). 16 of the
24 sources show power-law SEDs determined from photometry through infrared and optical
wavelengths. Sources could be at z . 2.8 with weak spectral features, or could show no
features in the spectrum because z & 2.8 and features are redshifted out of the IRS spectral
range. 10 of the 24 sources have log [fν(24 µm)/fν(8 µm)] > 1.0, a value expected for
starbursts, but none of the sources show PAH emission features in the infrared spectra
normally associated with a luminous starburst.
Possible redshifts are suggested for 9 of the 24 sources based on fitting a profile of
weak silicate absorption. Photometric redshift estimates are given for 2 sources whose SEDs
show evidence of a stellar component exceeding the dust continuum, although neither of
these sources shows PAH emission, and the photometric redshift does not agree with the
weak-silicate redshift for the one source with both measured. These suggested new redshifts
provide evidence in favor of the explanation for the majority of the ”no-redshift” sources
that they are similar in nature and luminosity to the more heavily absorbed sources, but
with weaker absorption features, and would bring the total number of redshifts determined
for faint Bootes sources to 44 of the 58 sources observed, counting one photometric redshift.
Even if the suggested new redshifts are correct, there remain 14 sources from the Bootes
sample of 58 with no redshift estimates. With our present data, it is not possible to reach
any conclusions regarding the nature of these remaining sources. Five of these 14 sources
without redshifts are not detected at any optical wavelength in the NDWFS. Whether these
represent a dusty population at redshifts higher than previously measured, or whether they
represent a population of optically-obscured sources at z < 2.8 with weak spectral features
remains ambiguous. Because such sources are a significant fraction of the optically faint
sources in the Spitzer ”1 mJy” population of 24µm sources, continued efforts to determine
their nature are important.
We thank D. Devost, G. Sloan and P. Hall for help in improving our IRS spectral
analysis. We thank the staff of the Keck Observatory for their assistance with obtaining the
2.2 micron observations. The W.M. Keck Observatory is operated as a scientific partnership
between the California Institute of Technology, the University of California and NASA. It was
made possible by the generous financial support of the W.M.Keck Foundation. We extend
special thanks to those of Hawaiian ancestry on whose sacred mountain we are priveleged to
be guests. Without their generous hospitality, none of the Keck observations presented herein
would have been possible. We thank NOAO for supporting the NOAO Deep Wide-Field
Survey; AD and BJ acknowledge support from NOAO, which is operated by the Association

– 17 –
of Universities for Research in Astronomy (AURA), Inc., under a cooperative agreement with
the National Science Foundation. This work is based primarily on observations made with
the Spitzer Space Telescope, which is operated by the Jet Propulsion Laboratory, California
Institute of Technology under NASA contract 1407. Support for this work by the IRS GTO
team at Cornell University was provided by NASA through Contract Number 1257184 issued
by JPL/Caltech.
REFERENCES
Alonso-Herrero, A. et al. 2006, ApJ, 640, 167
Brand, K. et al 2006, ApJ, in press
Brown, M. et al. 2005, ApJ, 638, 88
Desai, V. et al. 2006, ApJ, in press
Dey, A. et al. 2005, ApJ, 629, 654
Eisenhardt, P. et al. 2004, ApJS, 154, 48
Fazio, G. et al. 2004, ApJS, 154, 10
Genzel, R. et al. 1998, ApJ, 498, 579
Higdon, S.J.U., et al. 2004, PASP, 116, 975
Houck, J. R., et al. 2004, ApJS, 154, 18
Houck, J.R., et al. 2004b, ApJS, 154, 211
Houck, J.R., et al. 2005, ApJ, 622, L105 (H05)
Hunt, L., and Maiolino, R. 2005, ApJ, 626, L15
Jannuzi, B. T., and Dey, A., 1999, in ”Photometric Redshifts and the Detection of High
Redshift Galaxies”, ASP Conference Series, Vol. 191, Edited by R. Weymann, L.
Storrie-Lombardi, M. Sawicki, and R. Brunner. ISBN: 158381-017-X, p. 111
Li, A. and Draine, B. 2001, ApJ, 554, 778
Martinez-Sanigre, A., Rawlings, S., Lacy, M., Fadda, D., Marleau, F.R., Simpson, C.,
Willott, C.J., and Jarvis, M.J. (2005), Nature, 436, 666.

– 18 –
Matthews, K. and Soifer, B.T. 1994, Experimental Astronomy, 3, 77
Persson, S. E., Murphy, D. C., Krzeminski, W., Roth, M., and Rieke, M. J. 1998, AJ, 116,
2475
Polletta, M. et al. 2006, ApJ, in press
Rieke, G.H. 1976, ApJ, 210, L5
Rieke, G.H. et al. 2004, ApJS, 154, 25
Simpson, C. and Eisenhardt, P. 1999, PASP, 111, 760
Smith, P.S., Schmidt, G.D., Allen, R.G., and Angel, J.R.P. 1995, ApJ, 444, 146
Soifer, B.T. et al. 2004, ApJS, 154, 151
Spoon, H.W.W. et al. 2006, ApJ, 638, 759
Surace, J.A., and Sanders, D.B. 2000, AJ, 120, 604
Thuan, T.X., Sauvage, M., and Madden, S. 1999, ApJ, 516, 783
Weedman, D.W., et al. 2005, ApJ, 633, 706
Yan, L., et al. 2005, ApJ, 628, 604
This preprint was prepared with the AAS LATEX macros v5.2.

– 19 –
Table 1. Observations and Properties of Sources
Source Namea fν(24µm)b timec IR/optd αe zf S/Ng
(mJy) (sec)
1. SST24 J142936.71+323857.1 1.27 1200,240 140 2.5, 2.2, 1.7 2.4, · · · 3.6
2. SST24 J143102.26+325152.3 1.34 1200,240 >180 0.9, 2.5, 1.4 2.0,[1.2] 5.1
3. SST24 J143026.05+331516.4 1.83 960,240 60 2.4, 1.0, 0.9 1.9, · · · 4.5
4. SST24 J143318.59+332127.0 0.91 1680,240 >120 3.0, 2.4, 1.0 · · · , · · · 4.1
5. SST24 J142644.34+333052.0 1.12 1440,240 50 2.2, 1.1, 1.3 · · · , · · · 4.5
6. SST24 J143308.62+333401.7 2.40 720,240 270 2.7, 2.9, 1.8 · · · , · · · 6.8
7. SST24 J143053.14+334332.3 0.87 1680,240 >120 1.9, 1.6, −0.6 · · · , · · · 1.8
8. SST24 J142920.47+334400.7 0.92 1680,240 >120 3.3, 1.5, 1.7 · · · , · · · 4.1
9. SST24 J143424.50+334543.3 0.88 1680,240 50 2.4, 1.9, 1.7 · · · , · · · 2.8
10. SST24 J142827.95+334550.3 0.82 1920,240 100 2.0, 1.1, 0.9 · · · , · · · 2.9
11. SST24 J143253.39+334844.3 1.40 1200,240 >190 3.8, 2.1, 0.4 · · · , · · · 4.0
12. SST24 J143004.77+340929.9 1.36 720,240 40 −0.9, 3.2, 2.9 · · · ,[0.8] 4.1
13. SST24 J143807.96+341612.5 2.19 720,180 >300 2.6, 2.3, 1.8 2.2, · · · 4.7
14. SST24 J142745.88+342209.0 1.52 1680,240 110 3.0, 1.8, 1.8 1.4, · · · 5.8
15. SST24 J142842.96+342409.9 3.09 480,120 80 2.1, 1.2, 1.0 1.1, · · · 7.7
16. SST24 J143429.56+343633.1 2.29 720,240 110 3.1, 2.8, 2.0 2.0, · · · 6.5
17. SST24 J142940.85+344048.7 1.02 1440,240 80 2.7, 2.2, 1.3 2.0, · · · 5.0
18. SST24 J142748.47+344851.3 2.10 720,180 50 4.2, 1.4, 1.5 · · · , · · · 5.8
19. SST24 J143213.40+350802.1 1.24 1200,240 >170 2.1, 1.2, 1.2 · · · , · · · 1.8
20. SST24 J142611.38+351218.0 1.55 1200,240 50 2.5, 1.4, 0.7 1.6, · · · 3.1
21. SST24 J142759.92+351243.5 1.45 720,0 >200 2.4, 1.0, 1.1 · · · , · · · 4.8
22. SST24 J143546.13+352447.2 0.99 1440,240 >130 2.1, 0.8, 1.0 · · · , · · · 2.8
23. SST24 J142850.94+353146.6 0.98 1440,240 >130 3.2, 1.6, 1.4 · · · , · · · 4.5
24. SST24 J142939.18+353558.4 1.05 1440,240 >140 2.7, 0.9, −0.1 · · · , · · · 3.9
aSST24 source name derives from discovery with the MIPS 24µm images; coordinates listed are J2000 24µm
positions with typical 3 σ uncertainty of ± 1.2′′.
bValues of fν(24 µm) are for an unresolved point source, measured from MIPS images.
cFirst number is total integration time for each order of the Long Low spectrum; second number is total
integration time in Short Low order 1.
dIR/opt = νfν(24 µm)/νfν(I). For Vega magnitudes, zero magnitude in I band corresponds to 2450 Jy.
Limits are based on assumed I > 25. Values of I are listed in Table 2.
eα is the power law index for different portions of the continuum of form fν ∝ ν−α; first number is the power
law index that would connect the IRAC fν(8 µm) with the IRAC fν(3.6 µm); second number is the power law

– 20 –
index that would connect the MIPS fν(24 µm) with the IRAC fν(8 µm); third number is the α(14-33) for the
continuum as determined from the best fit to the IRS spectra from 14µm to 33µm .
fRedshifts are possible redshifts derived from fits of a weak silicate feature in the IRS spectra. Redshifts in
brackets are estimated from a photometric z based on inflection among the IRAC fluxes that can be fit with a
template SED containing the 1.6µm peak in the spectrum of an evolved stellar component, shown in Figure 6.
gSignal to noise as measured in LL1 from the best-fit continuum longward of 20µm by S/N = [fν(27
µm)/RMS], for RMS the 1σ noise about the best-fit continuum.

– 21 –
Table 2. Near-Infrared Flux Densities and Optical Magnitudes for Sources
SST24 Source Name fν(3.6µm)a fν(4.5µm)a fν(5.8µm)a fν(8µm)a BWb R b I b K c
(µJy) (µJy) (µJy) (µJy) (mag) (mag) (mag) (mag)
1. J142936.71+323857.1 15.8 27.6 33.4 114 26.5 25.2 24.8 · · ·
2. J143102.26+325152.3 43.7 41.2 65 90 · · · · · · · · · · · ·
3. J143026.05+331516.4 91 162 358 622 24.7: 24.3: 23.4: · · ·
4. J143318.59+332127.0 6.0 7.3 33.1 68.4 · · · · · · · · · · · ·
5. J142644.34+333052.0 60.4 84 161 353 26.4: 24.5: 23.8: 18.6
6. J143308.62+333401.7 11.1 14.3 52.1 96 · · · 25.3 24.8 20.2
7. J143053.14+334332.3 31.7 48.4 84.6 142 26.4 · · · · · · · · ·
8. J142920.47+334400.7 12.2 22.9 8.3 170 · · · · · · · · · 20.9
9. J143424.50+334543.3 15.7 21.1 79 107 · · · · · · 24.0: 19.8
10. J142827.95+334550.3 54.0 83 139 257 25.4 25.5 24.9 · · ·
11. J143253.39+334844.3 6.5 6.6 21.5 133 · · · · · · · · · · · ·
12. J143004.77+340929.9 85 50.6 38.7 39.8 26.0 23.9 23.2 · · ·
13. J143807.96+341612.5 21.0 28.1 72 168 · · · 25.5 · · · · · ·
14. J142745.88+342209.0 18.6 39.9 98 212 24.8 24.2 24.3 · · ·
15. J142842.96+342409.9 155 222 413 850 24.5 23.5 23.2 · · ·
16. J143429.56+343633.1 8.6 8.8 11.8 106 26.4: · · · 23.9: 20.7
17. J142940.85+344048.7 10.2 16.5 83 89 · · · · · · 24.4 20.7
18. J142748.47+344851.3 16.1 59.5 157 458 23.4 23.3 23.1 · · ·
19. J143213.40+350802.1 58.7 95 188 323 26.4 · · · · · · · · ·
20. J142611.38+351218.0 48.0 76 172 350 25.1 23.8 23.3 · · ·
21. J142759.92+351243.5 67 111 239 463 25.1 24.4 · · · · · ·
22. J143546.13+352447.2 71 111 188 395 25.4 26.0 · · · · · ·
23. J142850.94+353146.6 13.9 29.4 87 179 · · · · · · · · · · · ·
24. J142939.18+353558.4 43 85 168 371 · · · · · · · · · 20.1
aFluxes from IRAC measures, assuming a point source.
bSources with an optical counterpart appear in NDWFS catalogs with prefix NDWFS and the optical source
position; NDWFS Data Release 3 (DR3) is available at http://www.archive.noao.edu/ndwfs/. Magnitudes are
Vega magnitudes for an unresolved source, measured from images in NDWFS DR3 by smoothing all images to
a PSF of FWHM 1.35” and applying photometry at the 24µm source position with an aperture of 4” diameter,
except for objects with magnitudes followed by colon which use 3” apertures because of proximity to a brighter
source. The aperture photometry has been corrected to the total magnitude for an unresolved source by a
correction of 0.1 mag brighter for the 4” aperture and 0.3 mag brighter for the 3” aperture.
cK magnitudes are total magnitudes.

– 22 –
Fig. 1.— Observed spectra of sources in Table 1 which have possible spectral features dis-
cussed in the text (histogram). Spectra are smoothed to approximate resolution of individual
IRS orders; dashed curve: power law that would connect MIPS fν(24 µm) with the IRAC
fν(8 µm).

– 23 –
Fig. 2.— Observed IRS spectra of featureless sources in Table 1 (histogram). Spectra are
smoothed to approximate resolution of individual IRS orders; dashed curve: power law that
would connect MIPS fν(24 µm) with the IRAC fν(8 µm).

– 24 –
Fig. 3.— Values of fν(24µm ) and IR/opt = νfν(24µm )/νfν(I) for sources in Table 1;
measured IR/opt shown as open circles and lower limits on IR/opt shown as open squares.
For comparison, 24µm flux densities and IR/opt are also shown for sources in H05, which
have redshifts; measured IR/opt shown as filled circles and lower limits on IR/opt as filled
squares.

– 25 –
Fig. 4.— Distributions of log[fν(8µm )/fν(3.6µm )] and log[fν (24µm )/fν(8µm )] for sources
in Table 1 (open circles); shown for comparison are sources with redshifts in H05 (filled
circles).
– 26 –
Fig. 5.— Left panel: IRS spectrum of source 17 (solid curve) with power-law fit (dashed
curve); Right panel: IRS spectrum of source 17(solid curve) with power-law fit plus a silicate
absorption feature and redshift 2.0 (dashed curve).

– 27 –lo
g F
( µ
Jy )
νlo
g F
( µ
Jy )
νlo
g F
( µ
Jy )
νlo
g F
( µ
Jy )
ν
#6 z = 1.8 Template: Arp2206
4
2
0
#4 z = 1.8 Template: Arp2206
4
2
0
-2
4
2
0
-2
#11 z = 1.2 Template: UGC 5101
6
4
2
0
-2
#1 z = 1.9 Template: Arp220 6
4
2
0
-2
#2 z = 1.2 Template: Arp220
Wavelength ( µm )
4
2
0
#12 z = 0.8 Template: M82
1 10 100 1000Wavelength ( µm )
6
4
2
0
#16 z = 1.2 Template: Arp220
-21 10 100 1000
4
2
0
-2
#8 z = 1.7 Template: M82
Fig. 6.— Spectral energy distributions for sources in Table 2 which show IRAC fluxes
consistent with a photospheric bump that allows a photometric redshift estimate; filled
circles: observed photometric data points; solid curve: template fit which leads to value of
photometric redshift shown in panel.


