Embed Size (px)
Citation preview
Seediscussions,stats,andauthorprofilesforthispublicationat:https://www.researchgate.net/publication/220057011
Speech/Non-SpeechSegmentationBasedonPhonemeRecognitionFeatures
ArticleinEURASIPjournalonadvancesinsignalprocessing·January2006
Source:DBLP
CITATIONS
3
READS
14
3authors:
JanezZibert
UniversityofPrimorska
32PUBLICATIONS114CITATIONS
SEEPROFILE
NikolaPavesic
UniversityofLjubljana
145PUBLICATIONS905CITATIONS
SEEPROFILE
FranceMihelic
UniversityofLjubljana
126PUBLICATIONS429CITATIONS
SEEPROFILE
AllcontentfollowingthispagewasuploadedbyNikolaPavesicon30November2016.
Theuserhasrequestedenhancementofthedownloadedfile.Allin-textreferencesunderlinedinbluearelinkedtopublicationsonResearchGate,lettingyouaccessandreadthemimmediately.
Hindawi Publishing CorporationEURASIP Journal on Applied Signal ProcessingVolume 2006, Article ID 90495, Pages 1–13DOI 10.1155/ASP/2006/90495
Speech/Non-Speech Segmentation Based onPhoneme Recognition Features
Janez Zibert, Nikola Pavesic, and France Mihelic
Faculty of Electrical Engineering, University of Ljubljana, Trzaska 25, Ljubljana, 1000, Slovenia
Received 16 September 2005; Revised 7 February 2006; Accepted 18 February 2006
Recommended for Publication by Hugo Van hamme
This work assesses different approaches for speech and non-speech segmentation of audio data and proposes a new, high-levelrepresentation of audio signals based on phoneme recognition features suitable for speech/non-speech discrimination tasks. Un-like previous model-based approaches, where speech and non-speech classes were usually modeled by several models, we de-velop a representation where just one model per class is used in the segmentation process. For this purpose, four measuresbased on consonant-vowel pairs obtained from different phoneme speech recognizers are introduced and applied in two differ-ent segmentation-classification frameworks. The segmentation systems were evaluated on different broadcast news databases. Theevaluation results indicate that the proposed phoneme recognition features are better than the standard mel-frequency cepstral co-efficients and posterior probability-based features (entropy and dynamism). The proposed features proved to be more robust andless sensitive to different training and unforeseen conditions. Additional experiments with fusion models based on cepstral andthe proposed phoneme recognition features produced the highest scores overall, which indicates that the most suitable method forspeech/non-speech segmentation is a combination of low-level acoustic features and high-level recognition features.
Copyright © 2006 Janez Zibert et al. This is an open access article distributed under the Creative Commons Attribution License,which permits unrestricted use, distribution, and reproduction in any medium, provided the original work is properly cited.
1. INTRODUCTION
Speech/non-speech (SNS) segmentation is the task of parti-tioning audio streams into speech and non-speech segments.While speech segments can be easily defined as regions inaudio signals where somebody is speaking, non-speech seg-ments represent everything that is not speech, and as suchconsist of data from various acoustical sources, for example,music, human noises, silences, machine noises, and so forth.
A good segmentation of continuous audio streams intospeech and non-speech has many practical applications. It isusually applied as a preprocessing step in real-world systemsfor automatic speech recognition (ASR) [28], like broadcastnews (BN) transcription [4, 7, 34], automatic audio indexingand summarization [17, 18], audio and speaker diarization[12, 20, 24, 30, 37], and all other applications where efficientspeech detection helps to greatly reduce computational com-plexity and generate more understandable and accurate out-puts. Accordingly, a segmentation has to be easily integratedinto such systems and should not increase the overall com-putational load.
Earlier work on the separation of speech and non-speechmainly addressed the problem of classifying known homoge-neous segments as speech or music and not as a non-speechclass in general. The research focused more on developingand evaluating characteristic features for classification, andsystems were designed to work on already-segmented data.
Saunders [26] designed one such system using featurespointed out by Greenberg [8] to successfully discriminatespeech/music in radio broadcasting. He used time-domainfeatures, mostly derived from zero crossing rates. Samouelianet al. [25] also used time-domain features, combined withtwo frequency features. Scheirer and Slaney [27] investigatedfeatures for speech/music discrimination that are closely re-lated to the nature of human speech. The proposed features,that is, spectral centroid, spectral flux, zero-crossing rate,4 Hz modulation energy (related to the syllable rate ofspeech), and the percentage of low-energy frames were ex-plored in the task of discriminating between speech andvarious types of music. The most commonly used featuresfor discriminating between speech, music, and other soundsources are the cepstrum coefficients. Mel-frequency cepstral
2 EURASIP Journal on Applied Signal Processing
coefficients (MFCCs) [21] and perceptual linear predic-tion (PLPs) cepstral coefficients [11] are extensively used inspeaker-and speech recognition tasks. Although these signalrepresentations were originally designed to model the short-term spectral information of speech events, they were alsosuccessfully applied in SNS discrimination systems [2, 4, 7, 9]in combination with Gaussian mixture models (GMMs) orhidden Markov models (HMMs) for separating differentsound sources (broadband speech, telephone speech, music,noise, silence, etc.). The use of these representations is a natu-ral choice in the systems based on ASR, since the same featureset can be used later for speech recognition.
These representations and approaches focused on theacoustic properties of data that are manifested in eitherthe time and frequency or spectral (cepstral) domains. Allthe representations tend to characterize speech in compar-ison to other non-speech sources (mainly music). Anotherview of the speech produced and recognized by humans isto see it as a sequence of recognizable units. Speech pro-duction can thus be considered as a state machine, wherethe states are phoneme classes [1]. Since other non-speechsources do not possess such properties, features based onthese characteristics can be usefully applied in SNS classi-fication. The first attempt in this direction was made byGreenberg [8], who proposed features based on the spectralshapes associated with the expected syllable rate in speech.Karneback [13] produced low frequency modulation fea-tures in the same way and showed that in combination withthe MFCC features they constitute a robust representationfor speech/music discrimination tasks. A different approachbased on this idea was presented by Williams and Ellis [33].They built a phoneme speech recognizer and studied its be-havior on different speech and music signals. From the be-havior of a recognizer, they proposed posterior probability-based features, that is, entropy and dynamism. In our work,we explore this idea even further in a way to analyze the out-put transcriptions of such phoneme recognizers.
While almost all the mentioned studies focused moreon discriminating between speech and non-speech (mainlymusic) data on separate audio segments, we explore theserepresentations in the task of segmenting continuous audiostreams where the speech and non-speech parts are interleav-ing randomly. Such kinds of data are expected in most prac-tical applications of ASR. In our research, we focus mainlyon BN data. Most recent research in this field addresses thisproblem as part of a complete ASR system for BN transcrip-tion [4, 7, 29, 34] and speaker diarization or tracking in BNdata [12, 20, 30, 36, 37]. In most of these works, cepstralcoefficients (mainly MFCCs) are used for segmenting, andGMMs or HMMs are used for classifying the segments intospeech and different non-speech classes. An alternative ap-proach was investigated in [16], where the audio classifica-tion and segmentation was made by using support vectormachines (SVMs). Another approach was presented in [1],where speech/music segmentation was achieved by incorpo-rating GMMs into the HMM framework. This approach isalso followed in our work. In addition, we use it as a baselinesegmentation-classification method when comparing it with
another method based on acoustic segmentation obtainedwith the Bayesian information criterion (BIC) [5] followedby SNS classification.
This paper is organized as follows: in Section 2 thephoneme recognition features are proposed. We give the ba-sic ideas behind introducing such a representation of au-dio signals for SNS segmentation and define four featuresbased on consonant-vowel pairs produced by a phoneme rec-ognizer. Section 3 describes the two SNS segmentation ap-proaches used in our evaluations, one of which was speciallydesigned for the proposed feature representation. In the eval-uation section, we present results from a wide range of exper-iments on several different BN databases. We try to assess theperformance of the proposed representation in a comparisonwith existing approaches and propose fusion of the selectedrepresentations in order to improve the evaluation results.
2. PHONEME RECOGNITION FEATURES
2.1. Basic concepts and motivations
The basic SNS classification systems typically include statis-tical models representing speech data, music, silence, noise,and so forth. They are usually derived from training mate-rial and then a partitioning method detects speech and non-speech segments according to these models. The main prob-lem in such systems is the non-speech data, which are pro-duced by various acoustic sources and therefore possess dif-ferent acoustic characteristics. Thus, for each type of suchaudio signals, one should build a separate class (typicallyrepresented as a model) and include it into a system. Thisrepresents a serious drawback in SNS segmentation systems,which need to be data independent and robust to differenttypes of speech and non-speech acoustic sources.
On the other hand, the SNS segmentation systems aremeant to detect speech in audio signals and should discardnon-speech parts regardless of their different acoustic prop-erties. Such systems can be interpreted as two-class classifiers,where the first class represents speech samples and the sec-ond class everything else that is not speech. In that case, thespeech class defines non-speech. Following this basic con-cept, one should find and use those characteristics or fea-tures of audio signals that better emphasize and characterizespeech and exhibit the expected behavior on all other non-speech audio data.
While most commonly used acoustic features (MFCCs,PLPs, etc.) performed well when discriminating between dif-ferent speech and non-speech signals [14], they still only op-erate on an acoustic level. Hence, the data produced by thevarious sources with different acoustic properties should bemodeled by several different classes and should be repre-sented in the training process of such systems. To avoid this,we decided to design an audio representation, which shouldbetter determine speech and perform significantly differentlyon all other non-speech data. One possible way to achievethis is to see speech as a sequence of basic speech units con-veying some meaning. This rather broad definition of speech
Janez Zibert et al. 3
Acoustic featureextraction (MFCCs)
Phoneme recognizer(HMM)
Transcriptionanalysis
Input signal Featurevectors
Phonemerecognition output
CVSfeatures
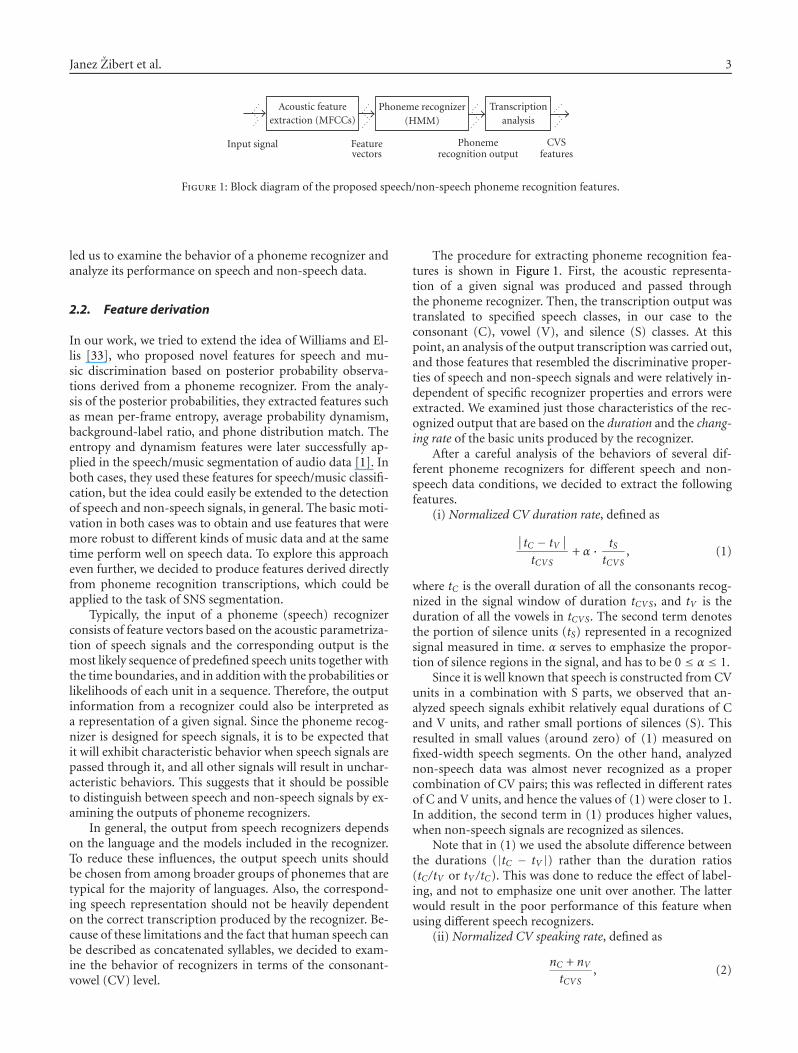
Figure 1: Block diagram of the proposed speech/non-speech phoneme recognition features.
led us to examine the behavior of a phoneme recognizer andanalyze its performance on speech and non-speech data.
2.2. Feature derivation
In our work, we tried to extend the idea of Williams and El-lis [33], who proposed novel features for speech and mu-sic discrimination based on posterior probability observa-tions derived from a phoneme recognizer. From the analy-sis of the posterior probabilities, they extracted features suchas mean per-frame entropy, average probability dynamism,background-label ratio, and phone distribution match. Theentropy and dynamism features were later successfully ap-plied in the speech/music segmentation of audio data [1]. Inboth cases, they used these features for speech/music classifi-cation, but the idea could easily be extended to the detectionof speech and non-speech signals, in general. The basic moti-vation in both cases was to obtain and use features that weremore robust to different kinds of music data and at the sametime perform well on speech data. To explore this approacheven further, we decided to produce features derived directlyfrom phoneme recognition transcriptions, which could beapplied to the task of SNS segmentation.
Typically, the input of a phoneme (speech) recognizerconsists of feature vectors based on the acoustic parametriza-tion of speech signals and the corresponding output is themost likely sequence of predefined speech units together withthe time boundaries, and in addition with the probabilities orlikelihoods of each unit in a sequence. Therefore, the outputinformation from a recognizer could also be interpreted asa representation of a given signal. Since the phoneme recog-nizer is designed for speech signals, it is to be expected thatit will exhibit characteristic behavior when speech signals arepassed through it, and all other signals will result in unchar-acteristic behaviors. This suggests that it should be possibleto distinguish between speech and non-speech signals by ex-amining the outputs of phoneme recognizers.
In general, the output from speech recognizers dependson the language and the models included in the recognizer.To reduce these influences, the output speech units shouldbe chosen from among broader groups of phonemes that aretypical for the majority of languages. Also, the correspond-ing speech representation should not be heavily dependenton the correct transcription produced by the recognizer. Be-cause of these limitations and the fact that human speech canbe described as concatenated syllables, we decided to exam-ine the behavior of recognizers in terms of the consonant-vowel (CV) level.
The procedure for extracting phoneme recognition fea-tures is shown in Figure 1. First, the acoustic representa-tion of a given signal was produced and passed throughthe phoneme recognizer. Then, the transcription output wastranslated to specified speech classes, in our case to theconsonant (C), vowel (V), and silence (S) classes. At thispoint, an analysis of the output transcription was carried out,and those features that resembled the discriminative proper-ties of speech and non-speech signals and were relatively in-dependent of specific recognizer properties and errors wereextracted. We examined just those characteristics of the rec-ognized output that are based on the duration and the chang-ing rate of the basic units produced by the recognizer.
After a careful analysis of the behaviors of several dif-ferent phoneme recognizers for different speech and non-speech data conditions, we decided to extract the followingfeatures.
(i) Normalized CV duration rate, defined as
∣∣tC − tV
∣∣
tCVS+ α · tS
tCVS, (1)
where tC is the overall duration of all the consonants recog-nized in the signal window of duration tCVS, and tV is theduration of all the vowels in tCVS. The second term denotesthe portion of silence units (tS) represented in a recognizedsignal measured in time. α serves to emphasize the propor-tion of silence regions in the signal, and has to be 0 ≤ α ≤ 1.
Since it is well known that speech is constructed from CVunits in a combination with S parts, we observed that an-alyzed speech signals exhibit relatively equal durations of Cand V units, and rather small portions of silences (S). Thisresulted in small values (around zero) of (1) measured onfixed-width speech segments. On the other hand, analyzednon-speech data was almost never recognized as a propercombination of CV pairs; this was reflected in different ratesof C and V units, and hence the values of (1) were closer to 1.In addition, the second term in (1) produces higher values,when non-speech signals are recognized as silences.
Note that in (1) we used the absolute difference betweenthe durations (|tC − tV |) rather than the duration ratios(tC/tV or tV /tC). This was done to reduce the effect of label-ing, and not to emphasize one unit over another. The latterwould result in the poor performance of this feature whenusing different speech recognizers.
(ii) Normalized CV speaking rate, defined as
nC + nVtCVS
, (2)
4 EURASIP Journal on Applied Signal Processing
where nC and nV are the number of C and V units recognizedin the signal in the time duration tCVS. Note that the silenceunits are not taken into account.
Since phoneme recognizers are trained on speech data,they should detect changes when normal speech moves be-tween phones every few tens of milliseconds. Of course,speaking rate in general depends heavily on the speaker andthe speaking style. Actually, this feature is often used in sys-tems for speaker recognition [23]. To reduce the effect ofspeaking style, particularly spontaneous speech, we decidednot to count the S units. Even though the CV speakingrate (2) changes with different speakers and speaking styles,it varies less for non-speech data. In the analyzed signals,speech tended to change (in terms of phoneme recognizer)much less frequently and they varied greatly among differentnon-speech data types.
This feature is closely related to the average probabilitydynamism proposed in [33].
(iii) Normalized CVS changes, defined as
c(C,V , S)tCVS
, (3)
where c(C,V , S) counts how many times the C, V , and Sunits exchange in the signal in the time duration tCVS.
This feature is related to the CV speaking rate, but withone important difference. Here, just the changes between theunits that emphasize pairs and not just single units are takeninto account. As speech consists of such CV combinationsone should expect higher values when speech signals are de-coded and lower values in the case of non-speech data.
This approach could be extended even further to observehigher-order combinations of C, V, and S units to constructn-gram CVS models (like in statistical language modeling),which could be estimated from the speech and non-speechdata.
(iv) Normalized average CV duration rate, defined as∣∣tC − tV
∣∣
tCV, (4)
where tC and tV represent the average time duration of the Cand V units in a given segment of a recognized signal, whiletCV is the average duration of all the recognized (C,V) unitsin the same segment.
This feature was constructed to measure the differencein the average duration of consonants and the average dura-tion of vowels. It is well known that in speech the vowels arein general longer in duration than the consonants. Hence,this was reflected in the analyzed recognized speech. On theother hand, it was observed that non-speech signals did notexhibit such properties. Therefore, we found this feature tobe discriminative enough to distinguish between speech andnon-speech data.
This feature correlates with the normalized CV rate de-fined in (1). Note that in both cases, the differences were usedinstead of the ratios between the C and V units. The reasonis the same as in the case of (1).
As can be seen from the above definitions, all the pro-posed features measure the properties of recognized data on
the segments of a processing signal. The segments should belarge enough to provide reliable estimations of the proposedmeasurements. The typical segment sizes used in our experi-ments were between 2.0 and 5.0 seconds or were defined by anumber of recognized units. They depended on the size ofthe portions of speech and non-speech data that were ex-pected in the processing signals. Another issue was how tocalculate features to be time aligned. In order to make a deci-sion as to which portion of the signal belongs to one or otherclass, we should calculate the features on a frame-by-framebasis. The natural choice would be to compute features onmoving segments between successive recognized units, butin our experiments, we decided to keep a fixed frame skip,since we also used them in combination with the cepstral fea-tures.
In the next sections, we describe how we experimentedwith frame rates and segment sizes as well as calculated fea-tures on already presegmented audio signals.
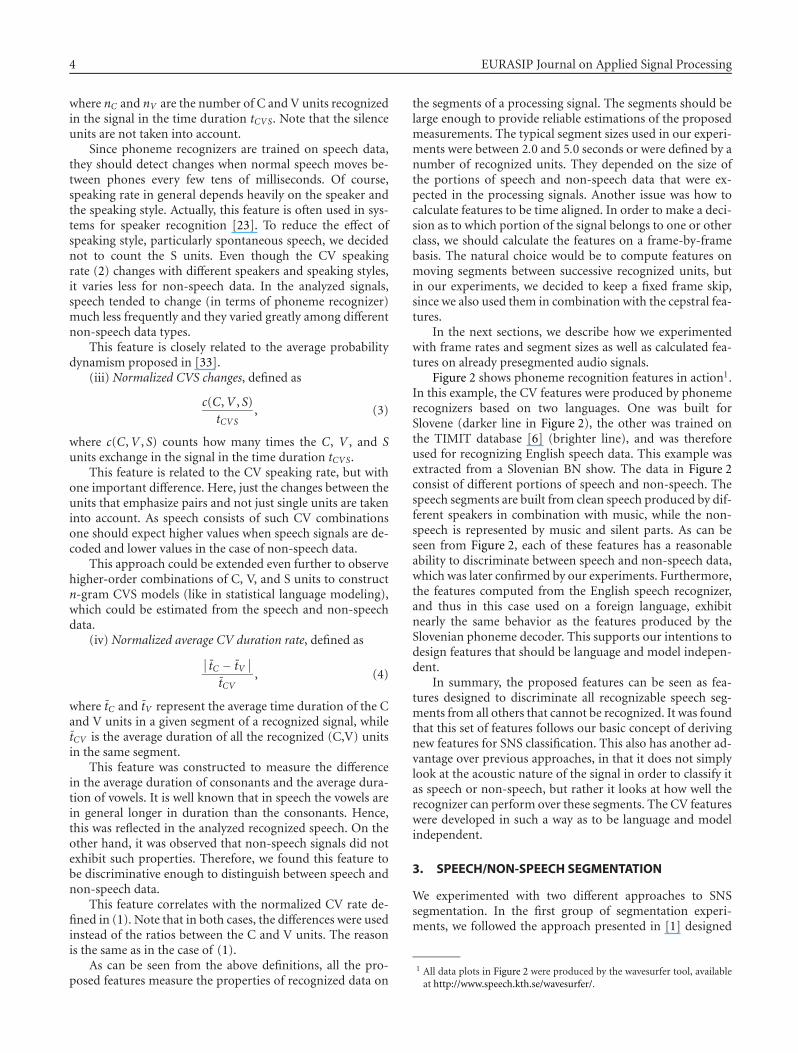
Figure 2 shows phoneme recognition features in action1.In this example, the CV features were produced by phonemerecognizers based on two languages. One was built forSlovene (darker line in Figure 2), the other was trained onthe TIMIT database [6] (brighter line), and was thereforeused for recognizing English speech data. This example wasextracted from a Slovenian BN show. The data in Figure 2consist of different portions of speech and non-speech. Thespeech segments are built from clean speech produced by dif-ferent speakers in combination with music, while the non-speech is represented by music and silent parts. As can beseen from Figure 2, each of these features has a reasonableability to discriminate between speech and non-speech data,which was later confirmed by our experiments. Furthermore,the features computed from the English speech recognizer,and thus in this case used on a foreign language, exhibitnearly the same behavior as the features produced by theSlovenian phoneme decoder. This supports our intentions todesign features that should be language and model indepen-dent.
In summary, the proposed features can be seen as fea-tures designed to discriminate all recognizable speech seg-ments from all others that cannot be recognized. It was foundthat this set of features follows our basic concept of derivingnew features for SNS classification. This also has another ad-vantage over previous approaches, in that it does not simplylook at the acoustic nature of the signal in order to classify itas speech or non-speech, but rather it looks at how well therecognizer can perform over these segments. The CV featureswere developed in such a way as to be language and modelindependent.
3. SPEECH/NON-SPEECH SEGMENTATION
We experimented with two different approaches to SNSsegmentation. In the first group of segmentation experi-ments, we followed the approach presented in [1] designed
1 All data plots in Figure 2 were produced by the wavesurfer tool, availableat http://www.speech.kth.se/wavesurfer/.
Janez Zibert et al. 5
Figure 2: Phoneme recognition CVS features. Top/first pane shows the normalized CV duration; second, the normalized CV speaking rate;third, the normalized CVS changes; and fourth, the normalized average CV duration rate. All the panes consist of two lines. The black(darker) line represents the features obtained from a phoneme-based speech recognizer build for Slovene, while the gray (brighter) linedisplays the features obtained from the phoneme recognizer for English. Bottom pane displays the audio signal with the correspondingmanual transcription.
HMM
Featurevectors
Classifiedsegmentation
(a)
BIC GMM
Featurevectors
Acousticsegments
Classifiedsegmentation
(b)
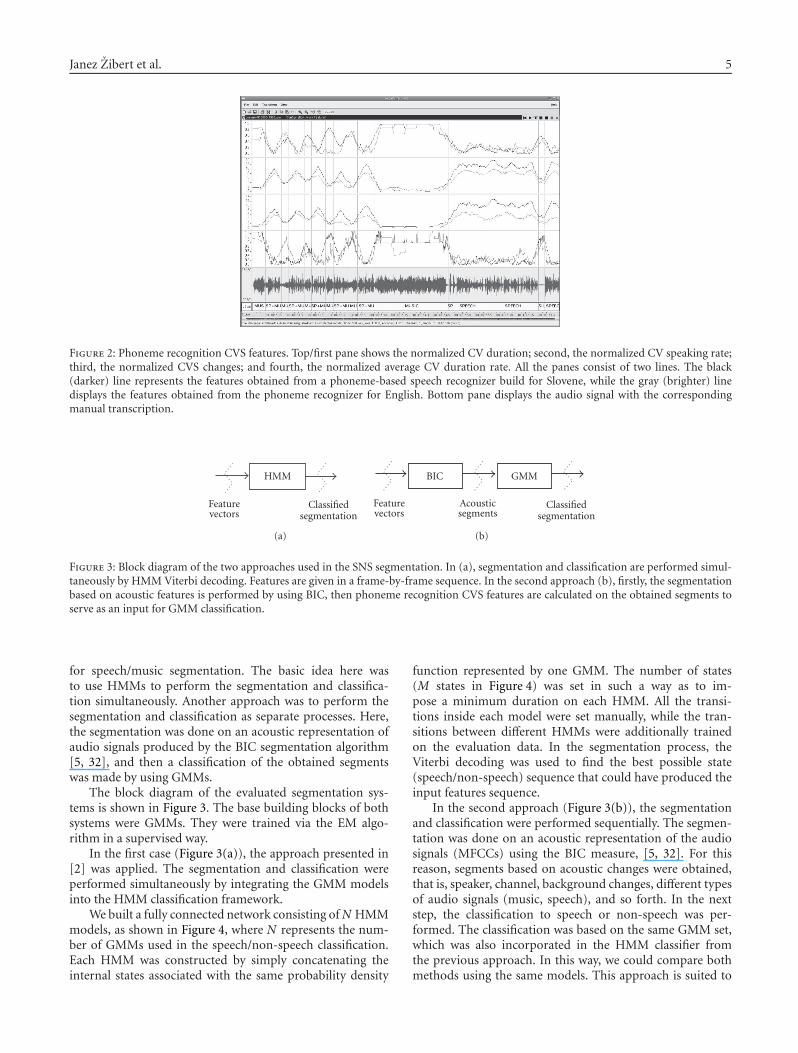
Figure 3: Block diagram of the two approaches used in the SNS segmentation. In (a), segmentation and classification are performed simul-taneously by HMM Viterbi decoding. Features are given in a frame-by-frame sequence. In the second approach (b), firstly, the segmentationbased on acoustic features is performed by using BIC, then phoneme recognition CVS features are calculated on the obtained segments toserve as an input for GMM classification.
for speech/music segmentation. The basic idea here wasto use HMMs to perform the segmentation and classifica-tion simultaneously. Another approach was to perform thesegmentation and classification as separate processes. Here,the segmentation was done on an acoustic representation ofaudio signals produced by the BIC segmentation algorithm[5, 32], and then a classification of the obtained segmentswas made by using GMMs.
The block diagram of the evaluated segmentation sys-tems is shown in Figure 3. The base building blocks of bothsystems were GMMs. They were trained via the EM algo-rithm in a supervised way.
In the first case (Figure 3(a)), the approach presented in[2] was applied. The segmentation and classification wereperformed simultaneously by integrating the GMM modelsinto the HMM classification framework.
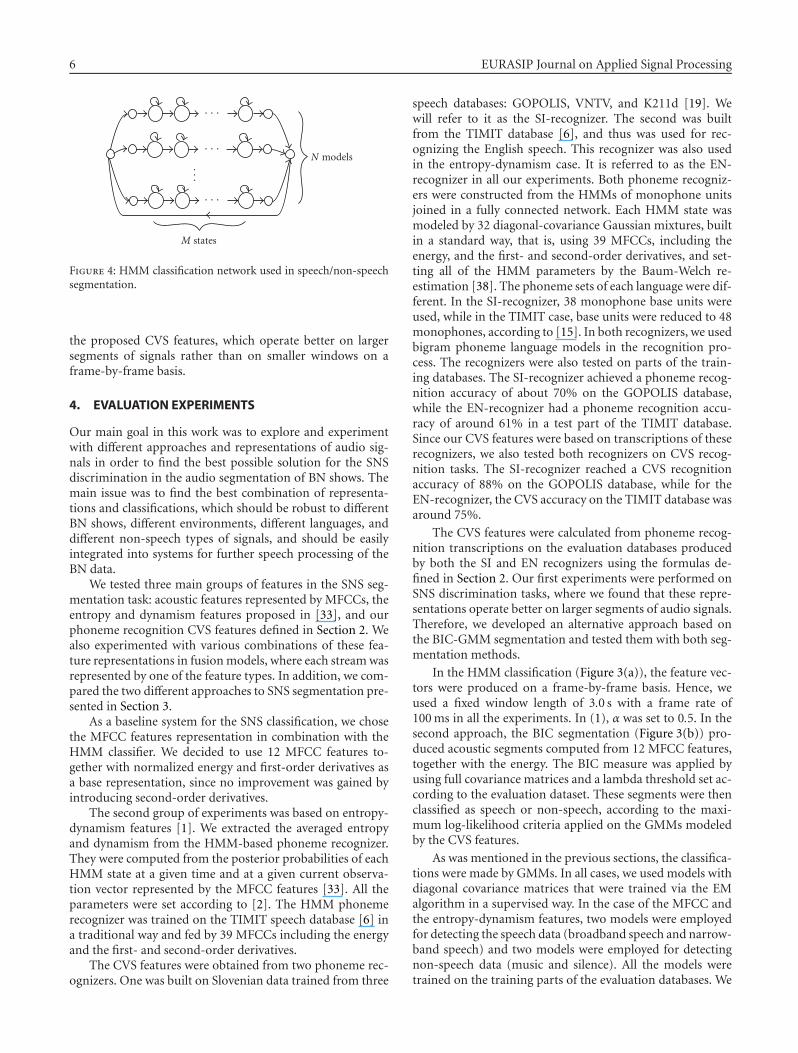
We built a fully connected network consisting of N HMMmodels, as shown in Figure 4, where N represents the num-ber of GMMs used in the speech/non-speech classification.Each HMM was constructed by simply concatenating theinternal states associated with the same probability density
function represented by one GMM. The number of states(M states in Figure 4) was set in such a way as to im-pose a minimum duration on each HMM. All the transi-tions inside each model were set manually, while the tran-sitions between different HMMs were additionally trainedon the evaluation data. In the segmentation process, theViterbi decoding was used to find the best possible state(speech/non-speech) sequence that could have produced theinput features sequence.
In the second approach (Figure 3(b)), the segmentationand classification were performed sequentially. The segmen-tation was done on an acoustic representation of the audiosignals (MFCCs) using the BIC measure, [5, 32]. For thisreason, segments based on acoustic changes were obtained,that is, speaker, channel, background changes, different typesof audio signals (music, speech), and so forth. In the nextstep, the classification to speech or non-speech was per-formed. The classification was based on the same GMM set,which was also incorporated in the HMM classifier fromthe previous approach. In this way, we could compare bothmethods using the same models. This approach is suited to
6 EURASIP Journal on Applied Signal Processing
· · ·
· · ·
· · ·
...
N models
M states
Figure 4: HMM classification network used in speech/non-speechsegmentation.
the proposed CVS features, which operate better on largersegments of signals rather than on smaller windows on aframe-by-frame basis.
4. EVALUATION EXPERIMENTS
Our main goal in this work was to explore and experimentwith different approaches and representations of audio sig-nals in order to find the best possible solution for the SNSdiscrimination in the audio segmentation of BN shows. Themain issue was to find the best combination of representa-tions and classifications, which should be robust to differentBN shows, different environments, different languages, anddifferent non-speech types of signals, and should be easilyintegrated into systems for further speech processing of theBN data.
We tested three main groups of features in the SNS seg-mentation task: acoustic features represented by MFCCs, theentropy and dynamism features proposed in [33], and ourphoneme recognition CVS features defined in Section 2. Wealso experimented with various combinations of these fea-ture representations in fusion models, where each stream wasrepresented by one of the feature types. In addition, we com-pared the two different approaches to SNS segmentation pre-sented in Section 3.
As a baseline system for the SNS classification, we chosethe MFCC features representation in combination with theHMM classifier. We decided to use 12 MFCC features to-gether with normalized energy and first-order derivatives asa base representation, since no improvement was gained byintroducing second-order derivatives.
The second group of experiments was based on entropy-dynamism features [1]. We extracted the averaged entropyand dynamism from the HMM-based phoneme recognizer.They were computed from the posterior probabilities of eachHMM state at a given time and at a given current observa-tion vector represented by the MFCC features [33]. All theparameters were set according to [2]. The HMM phonemerecognizer was trained on the TIMIT speech database [6] ina traditional way and fed by 39 MFCCs including the energyand the first- and second-order derivatives.
The CVS features were obtained from two phoneme rec-ognizers. One was built on Slovenian data trained from three
speech databases: GOPOLIS, VNTV, and K211d [19]. Wewill refer to it as the SI-recognizer. The second was builtfrom the TIMIT database [6], and thus was used for rec-ognizing the English speech. This recognizer was also usedin the entropy-dynamism case. It is referred to as the EN-recognizer in all our experiments. Both phoneme recogniz-ers were constructed from the HMMs of monophone unitsjoined in a fully connected network. Each HMM state wasmodeled by 32 diagonal-covariance Gaussian mixtures, builtin a standard way, that is, using 39 MFCCs, including theenergy, and the first- and second-order derivatives, and set-ting all of the HMM parameters by the Baum-Welch re-estimation [38]. The phoneme sets of each language were dif-ferent. In the SI-recognizer, 38 monophone base units wereused, while in the TIMIT case, base units were reduced to 48monophones, according to [15]. In both recognizers, we usedbigram phoneme language models in the recognition pro-cess. The recognizers were also tested on parts of the train-ing databases. The SI-recognizer achieved a phoneme recog-nition accuracy of about 70% on the GOPOLIS database,while the EN-recognizer had a phoneme recognition accu-racy of around 61% in a test part of the TIMIT database.Since our CVS features were based on transcriptions of theserecognizers, we also tested both recognizers on CVS recog-nition tasks. The SI-recognizer reached a CVS recognitionaccuracy of 88% on the GOPOLIS database, while for theEN-recognizer, the CVS accuracy on the TIMIT database wasaround 75%.
The CVS features were calculated from phoneme recog-nition transcriptions on the evaluation databases producedby both the SI and EN recognizers using the formulas de-fined in Section 2. Our first experiments were performed onSNS discrimination tasks, where we found that these repre-sentations operate better on larger segments of audio signals.Therefore, we developed an alternative approach based onthe BIC-GMM segmentation and tested them with both seg-mentation methods.
In the HMM classification (Figure 3(a)), the feature vec-tors were produced on a frame-by-frame basis. Hence, weused a fixed window length of 3.0 s with a frame rate of100 ms in all the experiments. In (1), α was set to 0.5. In thesecond approach, the BIC segmentation (Figure 3(b)) pro-duced acoustic segments computed from 12 MFCC features,together with the energy. The BIC measure was applied byusing full covariance matrices and a lambda threshold set ac-cording to the evaluation dataset. These segments were thenclassified as speech or non-speech, according to the maxi-mum log-likelihood criteria applied on the GMMs modeledby the CVS features.
As was mentioned in the previous sections, the classifica-tions were made by GMMs. In all cases, we used models withdiagonal covariance matrices that were trained via the EMalgorithm in a supervised way. In the case of the MFCC andthe entropy-dynamism features, two models were employedfor detecting the speech data (broadband speech and narrow-band speech) and two models were employed for detectingnon-speech data (music and silence). All the models weretrained on the training parts of the evaluation databases. We
Janez Zibert et al. 7
did not use models trained from a combination of music andspeech, even though they were expected in the evaluationdata. The number of mixtures in the GMMs was set to 128 inthe MFCC case, while in the entropy-dynamism case, 4 mix-tures were used (in [1], just 2-mixture GMMs were applied).In the CVS case, only two models were used: speech and non-speech. Here, GMMs with 2 mixtures were constructed. Thenumber of mixtures for each representation was chosen tomaximize the overall performance of the SNS segmentationon the evaluation dataset.
In the HMM classification case, the number of statesused to impose the minimum duration constraint in theHMMs was fixed. This was done according to [1]. Since inour evaluation data experiments speech or non-speech seg-ments shorter than 1.4 s were not annotated, we set the min-imum duration constraint to 1.4 s. This means that in theMFCC and in the entropy-dynamism cases, 140 states werechosen, which corresponded to the feature vectors framerate of 10 ms. However, in the case of the CVS features,the number was set to 14 states, which corresponds to afeature rate of 100 ms. All the transition probabilities (in-cluding self-loop transitions) inside the HMM were fixed to0.5.
In all cases, we additionally experimented with differentcombinations of the threshold probability weights to favorspeech or non-speech models in the classification system inorder to optimize the performance of a segmentation on theevaluation dataset.
We also experimented with combinations of two differentfeature representations modeled by fusion models. The fu-sion was achieved by using a state synchronous two-streamHMMs, [22]. In these experiments, audio data signals wererepresented by two separate streams of features: in one casewith the MFCC stream and the entropy-dynamism stream,and in the second with the MFCC and the CVS stream.For each stream, separate GMMs were trained using theEM method. For the SNS segmentation purposes a similarHMM classification network was built to that in nonfusioncases, where in each state, the fusion was made by com-puting the product of the weighted observation likelihoodsproduced by the GMMs from each stream. Additionally, wehad to set the product stream weights, which were empiri-cally obtained to optimize the performance on the evaluationdataset.
The HMM classification based on the Viterbi algorithmwas accomplished with the HTK Toolkit [38], while we pro-vided our own tools for the BIC segmentation and the GMMclassification and training.
Note that incorporating phoneme recognizers into SNSsegmentation in the entropy-dynamism and in the CVScase increased the computational complexity of the segmen-tation systems. Additional computational time caused byspeech recognizers can be reduced by using simple versionsof phoneme recognizers. In our case, monophone speech rec-ognizers were applied in both cases, even though in the CVScase a simpler recognizer, which would detect just CVS units,could be applied.
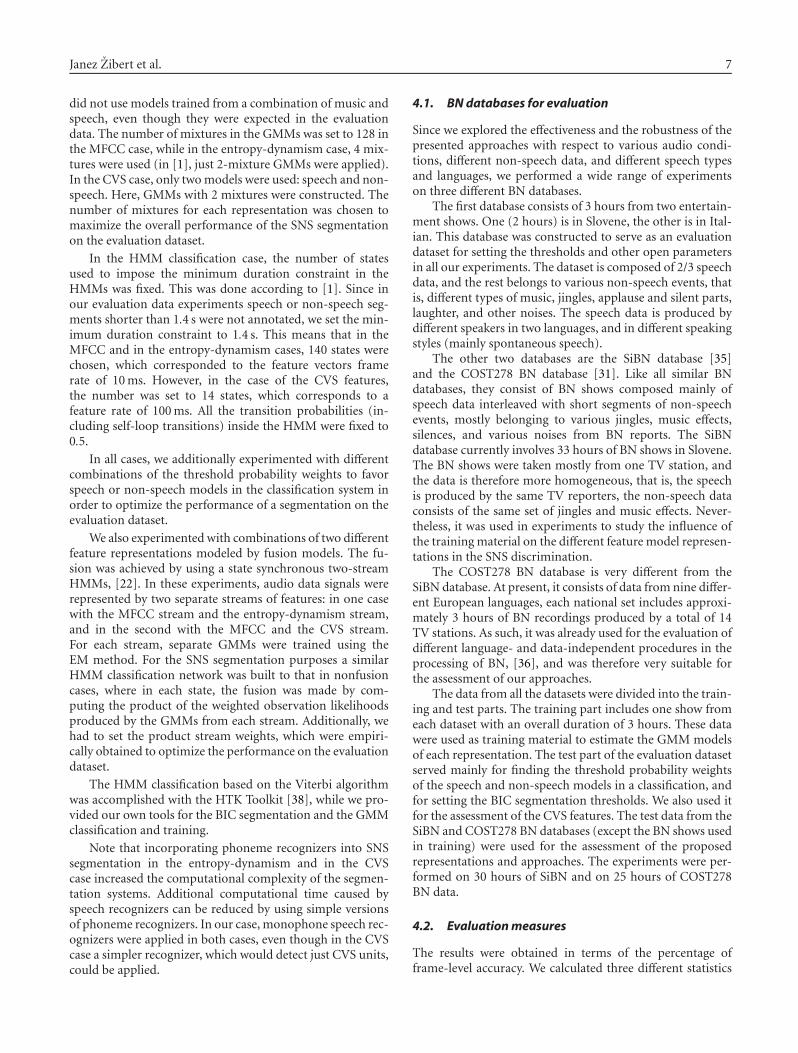
4.1. BN databases for evaluation
Since we explored the effectiveness and the robustness of thepresented approaches with respect to various audio condi-tions, different non-speech data, and different speech typesand languages, we performed a wide range of experimentson three different BN databases.
The first database consists of 3 hours from two entertain-ment shows. One (2 hours) is in Slovene, the other is in Ital-ian. This database was constructed to serve as an evaluationdataset for setting the thresholds and other open parametersin all our experiments. The dataset is composed of 2/3 speechdata, and the rest belongs to various non-speech events, thatis, different types of music, jingles, applause and silent parts,laughter, and other noises. The speech data is produced bydifferent speakers in two languages, and in different speakingstyles (mainly spontaneous speech).
The other two databases are the SiBN database [35]and the COST278 BN database [31]. Like all similar BNdatabases, they consist of BN shows composed mainly ofspeech data interleaved with short segments of non-speechevents, mostly belonging to various jingles, music effects,silences, and various noises from BN reports. The SiBNdatabase currently involves 33 hours of BN shows in Slovene.The BN shows were taken mostly from one TV station, andthe data is therefore more homogeneous, that is, the speechis produced by the same TV reporters, the non-speech dataconsists of the same set of jingles and music effects. Never-theless, it was used in experiments to study the influence ofthe training material on the different feature model represen-tations in the SNS discrimination.
The COST278 BN database is very different from theSiBN database. At present, it consists of data from nine differ-ent European languages, each national set includes approxi-mately 3 hours of BN recordings produced by a total of 14TV stations. As such, it was already used for the evaluation ofdifferent language- and data-independent procedures in theprocessing of BN, [36], and was therefore very suitable forthe assessment of our approaches.
The data from all the datasets were divided into the train-ing and test parts. The training part includes one show fromeach dataset with an overall duration of 3 hours. These datawere used as training material to estimate the GMM modelsof each representation. The test part of the evaluation datasetserved mainly for finding the threshold probability weightsof the speech and non-speech models in a classification, andfor setting the BIC segmentation thresholds. We also used itfor the assessment of the CVS features. The test data from theSiBN and COST278 BN databases (except the BN shows usedin training) were used for the assessment of the proposedrepresentations and approaches. The experiments were per-formed on 30 hours of SiBN and on 25 hours of COST278BN data.
4.2. Evaluation measures
The results were obtained in terms of the percentage offrame-level accuracy. We calculated three different statistics
8 EURASIP Journal on Applied Signal Processing
in each case: the percentage of true speech frames identifiedas speech, the percentage of true non-speech frames iden-tified as non-speech, and the overall percentage of speechand non-speech frames identified correctly (the overall ac-curacy).
Note that in cases where one class dominates in the data(e.g., speech in the SiBN and COST278 databases), the over-all accuracy depends heavily on the accuracy of that class, andin such a case it cannot provide enough information on theperformance of such a classification by itself. Therefore, inorder to correctly assess classification methods, one shouldprovide all three statistics. Nevertheless, we chose to maxi-mize the overall accuracy to find the optimal set of parame-ters on the evaluation dataset, since the proportion of speechand non-speech data in that database is less biased.
4.3. Evaluation data experiments
The evaluation dataset (the test part) was used in two groupsof experiments.
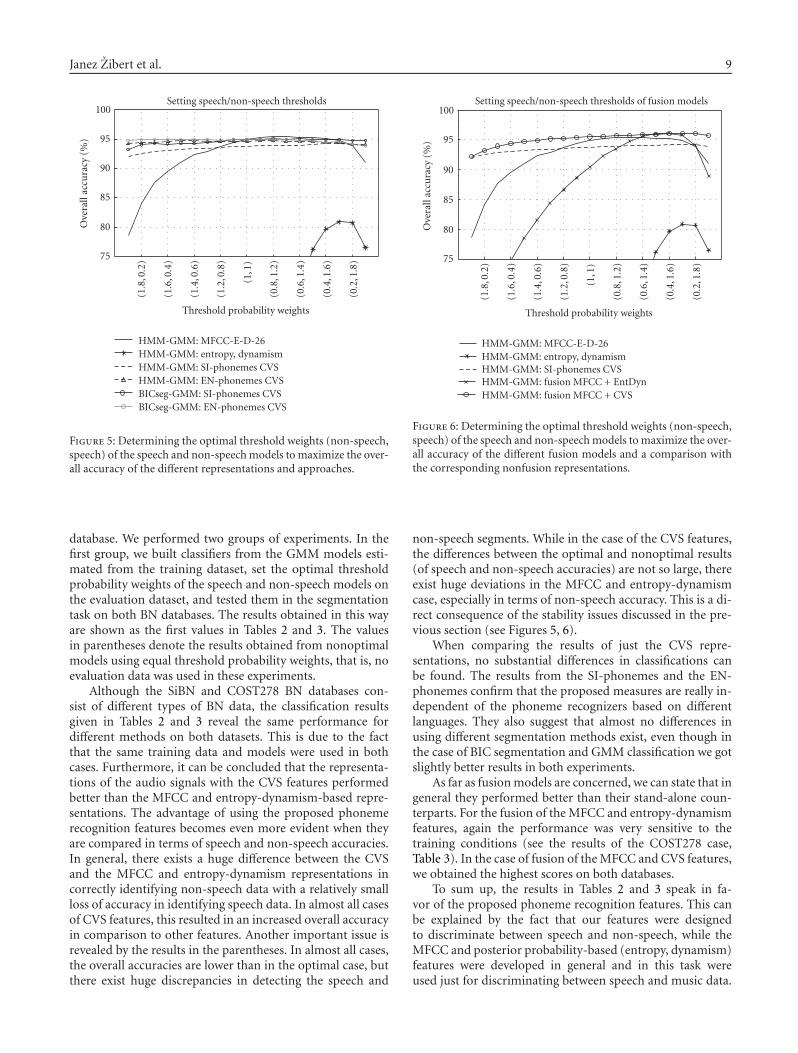
We used it to set all the thresholds and open parame-ters of the representations and the models to obtain opti-mal performance on the evaluation data. These models werelater employed in the SiBN and COST278 BN dataset experi-ments and are referred to as the optimal models. The perfor-mance of several different classification methods and fusionmodels is shown in Figures 5 and 6, respectively. In both fig-ures, the overall accuracies are plotted against a combinationof non-speech and speech threshold probability weights. Foreach classification method the best possible pair of speechand non-speech weights was chosen, where the maximum inthe overall accuracy was achieved.
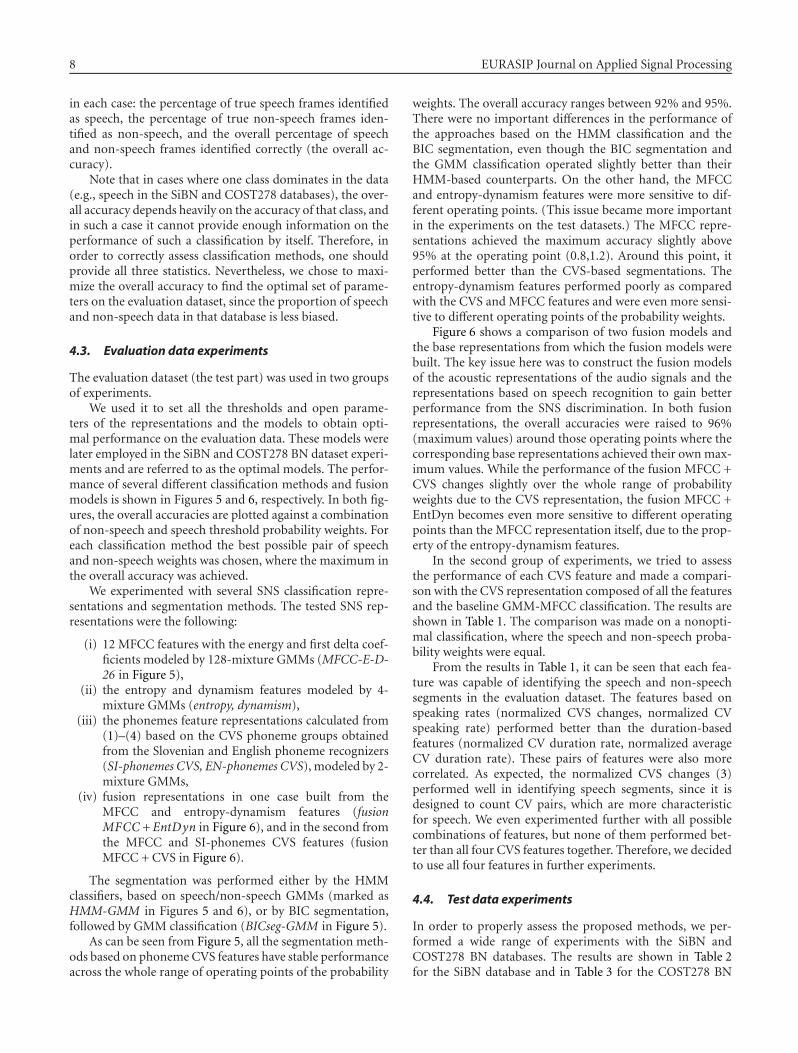
We experimented with several SNS classification repre-sentations and segmentation methods. The tested SNS rep-resentations were the following:
(i) 12 MFCC features with the energy and first delta coef-ficients modeled by 128-mixture GMMs (MFCC-E-D-26 in Figure 5),
(ii) the entropy and dynamism features modeled by 4-mixture GMMs (entropy, dynamism),
(iii) the phonemes feature representations calculated from(1)–(4) based on the CVS phoneme groups obtainedfrom the Slovenian and English phoneme recognizers(SI-phonemes CVS, EN-phonemes CVS), modeled by 2-mixture GMMs,
(iv) fusion representations in one case built from theMFCC and entropy-dynamism features (fusionMFCC +EntDyn in Figure 6), and in the second fromthe MFCC and SI-phonemes CVS features (fusionMFCC + CVS in Figure 6).
The segmentation was performed either by the HMMclassifiers, based on speech/non-speech GMMs (marked asHMM-GMM in Figures 5 and 6), or by BIC segmentation,followed by GMM classification (BICseg-GMM in Figure 5).
As can be seen from Figure 5, all the segmentation meth-ods based on phoneme CVS features have stable performanceacross the whole range of operating points of the probability
weights. The overall accuracy ranges between 92% and 95%.There were no important differences in the performance ofthe approaches based on the HMM classification and theBIC segmentation, even though the BIC segmentation andthe GMM classification operated slightly better than theirHMM-based counterparts. On the other hand, the MFCCand entropy-dynamism features were more sensitive to dif-ferent operating points. (This issue became more importantin the experiments on the test datasets.) The MFCC repre-sentations achieved the maximum accuracy slightly above95% at the operating point (0.8,1.2). Around this point, itperformed better than the CVS-based segmentations. Theentropy-dynamism features performed poorly as comparedwith the CVS and MFCC features and were even more sensi-tive to different operating points of the probability weights.
Figure 6 shows a comparison of two fusion models andthe base representations from which the fusion models werebuilt. The key issue here was to construct the fusion modelsof the acoustic representations of the audio signals and therepresentations based on speech recognition to gain betterperformance from the SNS discrimination. In both fusionrepresentations, the overall accuracies were raised to 96%(maximum values) around those operating points where thecorresponding base representations achieved their own max-imum values. While the performance of the fusion MFCC +CVS changes slightly over the whole range of probabilityweights due to the CVS representation, the fusion MFCC +EntDyn becomes even more sensitive to different operatingpoints than the MFCC representation itself, due to the prop-erty of the entropy-dynamism features.
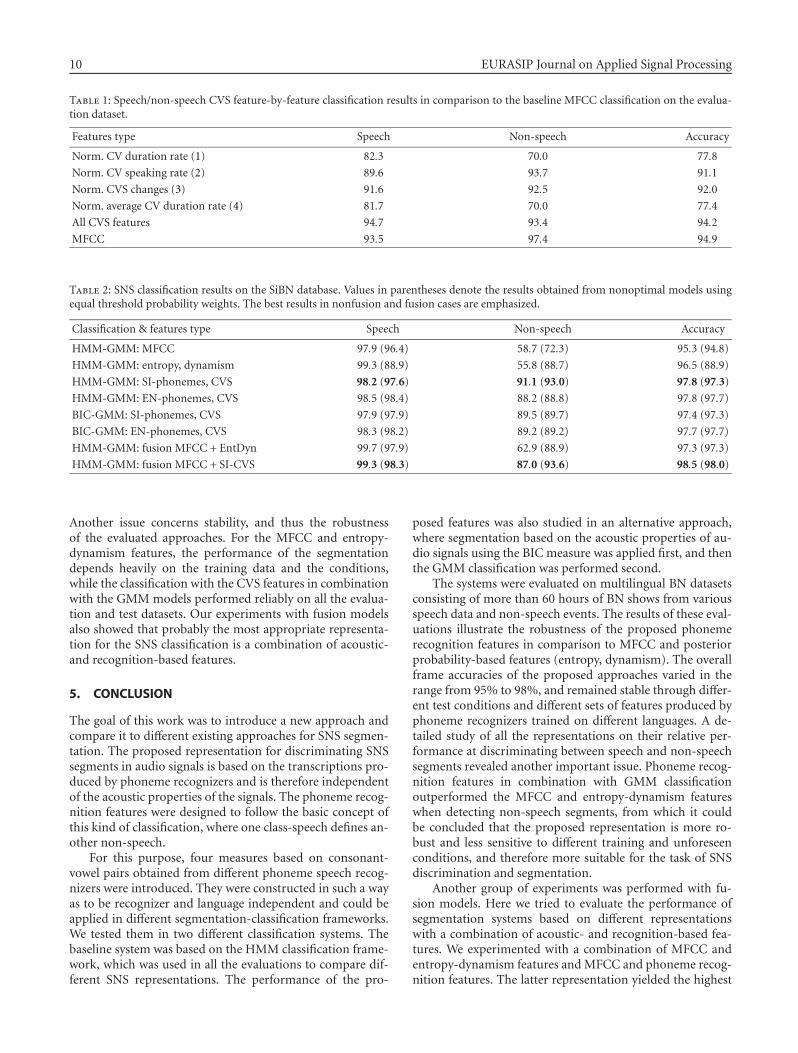
In the second group of experiments, we tried to assessthe performance of each CVS feature and made a compari-son with the CVS representation composed of all the featuresand the baseline GMM-MFCC classification. The results areshown in Table 1. The comparison was made on a nonopti-mal classification, where the speech and non-speech proba-bility weights were equal.
From the results in Table 1, it can be seen that each fea-ture was capable of identifying the speech and non-speechsegments in the evaluation dataset. The features based onspeaking rates (normalized CVS changes, normalized CVspeaking rate) performed better than the duration-basedfeatures (normalized CV duration rate, normalized averageCV duration rate). These pairs of features were also morecorrelated. As expected, the normalized CVS changes (3)performed well in identifying speech segments, since it isdesigned to count CV pairs, which are more characteristicfor speech. We even experimented further with all possiblecombinations of features, but none of them performed bet-ter than all four CVS features together. Therefore, we decidedto use all four features in further experiments.
4.4. Test data experiments
In order to properly assess the proposed methods, we per-formed a wide range of experiments with the SiBN andCOST278 BN databases. The results are shown in Table 2for the SiBN database and in Table 3 for the COST278 BN
Janez Zibert et al. 9
(1.8
,0.2
)
(1.6
,0.4
)
(1.4
,0.6
)
(1.2
,0.8
)
(1,1
)
(0.8
,1.2
)
(0.6
,1.4
)
(0.4
,1.6
)
(0.2
,1.8
)
Threshold probability weights
75
80
85
90
95
100
Ove
rall
accu
racy
(%)
HMM-GMM: MFCC-E-D-26HMM-GMM: entropy, dynamismHMM-GMM: SI-phonemes CVSHMM-GMM: EN-phonemes CVSBICseg-GMM: SI-phonemes CVSBICseg-GMM: EN-phonemes CVS
Setting speech/non-speech thresholds
Figure 5: Determining the optimal threshold weights (non-speech,speech) of the speech and non-speech models to maximize the over-all accuracy of the different representations and approaches.
database. We performed two groups of experiments. In thefirst group, we built classifiers from the GMM models esti-mated from the training dataset, set the optimal thresholdprobability weights of the speech and non-speech models onthe evaluation dataset, and tested them in the segmentationtask on both BN databases. The results obtained in this wayare shown as the first values in Tables 2 and 3. The valuesin parentheses denote the results obtained from nonoptimalmodels using equal threshold probability weights, that is, noevaluation data was used in these experiments.
Although the SiBN and COST278 BN databases con-sist of different types of BN data, the classification resultsgiven in Tables 2 and 3 reveal the same performance fordifferent methods on both datasets. This is due to the factthat the same training data and models were used in bothcases. Furthermore, it can be concluded that the representa-tions of the audio signals with the CVS features performedbetter than the MFCC and entropy-dynamism-based repre-sentations. The advantage of using the proposed phonemerecognition features becomes even more evident when theyare compared in terms of speech and non-speech accuracies.In general, there exists a huge difference between the CVSand the MFCC and entropy-dynamism representations incorrectly identifying non-speech data with a relatively smallloss of accuracy in identifying speech data. In almost all casesof CVS features, this resulted in an increased overall accuracyin comparison to other features. Another important issue isrevealed by the results in the parentheses. In almost all cases,the overall accuracies are lower than in the optimal case, butthere exist huge discrepancies in detecting the speech and
(1.8
,0.2
)
(1.6
,0.4
)
(1.4
,0.6
)
(1.2
,0.8
)
(1,1
)
(0.8
,1.2
)
(0.6
,1.4
)
(0.4
,1.6
)
(0.2
,1.8
)
Threshold probability weights
75
80
85
90
95
100
Ove
rall
accu
racy
(%)
HMM-GMM: MFCC-E-D-26HMM-GMM: entropy, dynamismHMM-GMM: SI-phonemes CVSHMM-GMM: fusion MFCC + EntDynHMM-GMM: fusion MFCC + CVS
Setting speech/non-speech thresholds of fusion models
Figure 6: Determining the optimal threshold weights (non-speech,speech) of the speech and non-speech models to maximize the over-all accuracy of the different fusion models and a comparison withthe corresponding nonfusion representations.
non-speech segments. While in the case of the CVS features,the differences between the optimal and nonoptimal results(of speech and non-speech accuracies) are not so large, thereexist huge deviations in the MFCC and entropy-dynamismcase, especially in terms of non-speech accuracy. This is a di-rect consequence of the stability issues discussed in the pre-vious section (see Figures 5, 6).
When comparing the results of just the CVS repre-sentations, no substantial differences in classifications canbe found. The results from the SI-phonemes and the EN-phonemes confirm that the proposed measures are really in-dependent of the phoneme recognizers based on differentlanguages. They also suggest that almost no differences inusing different segmentation methods exist, even though inthe case of BIC segmentation and GMM classification we gotslightly better results in both experiments.
As far as fusion models are concerned, we can state that ingeneral they performed better than their stand-alone coun-terparts. For the fusion of the MFCC and entropy-dynamismfeatures, again the performance was very sensitive to thetraining conditions (see the results of the COST278 case,Table 3). In the case of fusion of the MFCC and CVS features,we obtained the highest scores on both databases.
To sum up, the results in Tables 2 and 3 speak in fa-vor of the proposed phoneme recognition features. This canbe explained by the fact that our features were designedto discriminate between speech and non-speech, while theMFCC and posterior probability-based (entropy, dynamism)features were developed in general and in this task wereused just for discriminating between speech and music data.
10 EURASIP Journal on Applied Signal Processing
Table 1: Speech/non-speech CVS feature-by-feature classification results in comparison to the baseline MFCC classification on the evalua-tion dataset.
Features type Speech Non-speech Accuracy
Norm. CV duration rate (1) 82.3 70.0 77.8
Norm. CV speaking rate (2) 89.6 93.7 91.1
Norm. CVS changes (3) 91.6 92.5 92.0
Norm. average CV duration rate (4) 81.7 70.0 77.4
All CVS features 94.7 93.4 94.2
MFCC 93.5 97.4 94.9
Table 2: SNS classification results on the SiBN database. Values in parentheses denote the results obtained from nonoptimal models usingequal threshold probability weights. The best results in nonfusion and fusion cases are emphasized.
Classification & features type Speech Non-speech Accuracy
HMM-GMM: MFCC 97.9 (96.4) 58.7 (72.3) 95.3 (94.8)
HMM-GMM: entropy, dynamism 99.3 (88.9) 55.8 (88.7) 96.5 (88.9)
HMM-GMM: SI-phonemes, CVS 98.2 (97.6) 91.1 (93.0) 97.8 (97.3)
HMM-GMM: EN-phonemes, CVS 98.5 (98.4) 88.2 (88.8) 97.8 (97.7)
BIC-GMM: SI-phonemes, CVS 97.9 (97.9) 89.5 (89.7) 97.4 (97.3)
BIC-GMM: EN-phonemes, CVS 98.3 (98.2) 89.2 (89.2) 97.7 (97.7)
HMM-GMM: fusion MFCC + EntDyn 99.7 (97.9) 62.9 (88.9) 97.3 (97.3)
HMM-GMM: fusion MFCC + SI-CVS 99.3 (98.3) 87.0 (93.6) 98.5 (98.0)
Another issue concerns stability, and thus the robustnessof the evaluated approaches. For the MFCC and entropy-dynamism features, the performance of the segmentationdepends heavily on the training data and the conditions,while the classification with the CVS features in combinationwith the GMM models performed reliably on all the evalua-tion and test datasets. Our experiments with fusion modelsalso showed that probably the most appropriate representa-tion for the SNS classification is a combination of acoustic-and recognition-based features.
5. CONCLUSION
The goal of this work was to introduce a new approach andcompare it to different existing approaches for SNS segmen-tation. The proposed representation for discriminating SNSsegments in audio signals is based on the transcriptions pro-duced by phoneme recognizers and is therefore independentof the acoustic properties of the signals. The phoneme recog-nition features were designed to follow the basic concept ofthis kind of classification, where one class-speech defines an-other non-speech.
For this purpose, four measures based on consonant-vowel pairs obtained from different phoneme speech recog-nizers were introduced. They were constructed in such a wayas to be recognizer and language independent and could beapplied in different segmentation-classification frameworks.We tested them in two different classification systems. Thebaseline system was based on the HMM classification frame-work, which was used in all the evaluations to compare dif-ferent SNS representations. The performance of the pro-
posed features was also studied in an alternative approach,where segmentation based on the acoustic properties of au-dio signals using the BIC measure was applied first, and thenthe GMM classification was performed second.
The systems were evaluated on multilingual BN datasetsconsisting of more than 60 hours of BN shows from variousspeech data and non-speech events. The results of these eval-uations illustrate the robustness of the proposed phonemerecognition features in comparison to MFCC and posteriorprobability-based features (entropy, dynamism). The overallframe accuracies of the proposed approaches varied in therange from 95% to 98%, and remained stable through differ-ent test conditions and different sets of features produced byphoneme recognizers trained on different languages. A de-tailed study of all the representations on their relative per-formance at discriminating between speech and non-speechsegments revealed another important issue. Phoneme recog-nition features in combination with GMM classificationoutperformed the MFCC and entropy-dynamism featureswhen detecting non-speech segments, from which it couldbe concluded that the proposed representation is more ro-bust and less sensitive to different training and unforeseenconditions, and therefore more suitable for the task of SNSdiscrimination and segmentation.
Another group of experiments was performed with fu-sion models. Here we tried to evaluate the performance ofsegmentation systems based on different representationswith a combination of acoustic- and recognition-based fea-tures. We experimented with a combination of MFCC andentropy-dynamism features and MFCC and phoneme recog-nition features. The latter representation yielded the highest
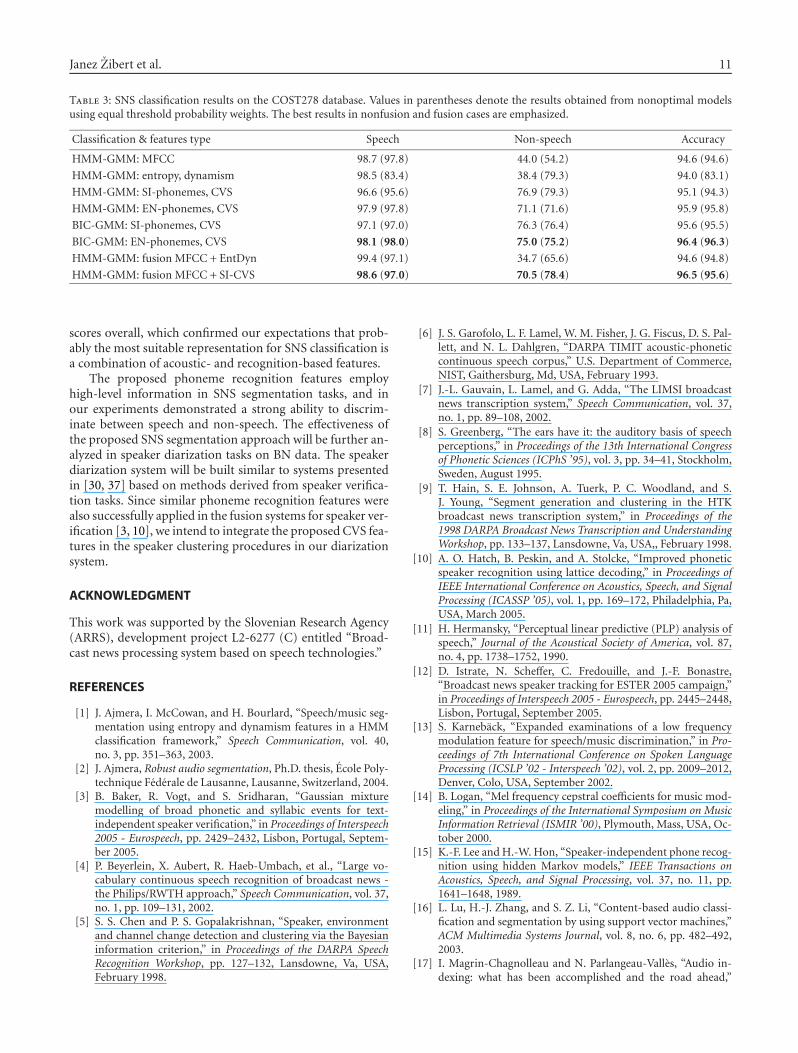
Janez Zibert et al. 11
Table 3: SNS classification results on the COST278 database. Values in parentheses denote the results obtained from nonoptimal modelsusing equal threshold probability weights. The best results in nonfusion and fusion cases are emphasized.
Classification & features type Speech Non-speech Accuracy
HMM-GMM: MFCC 98.7 (97.8) 44.0 (54.2) 94.6 (94.6)
HMM-GMM: entropy, dynamism 98.5 (83.4) 38.4 (79.3) 94.0 (83.1)
HMM-GMM: SI-phonemes, CVS 96.6 (95.6) 76.9 (79.3) 95.1 (94.3)
HMM-GMM: EN-phonemes, CVS 97.9 (97.8) 71.1 (71.6) 95.9 (95.8)
BIC-GMM: SI-phonemes, CVS 97.1 (97.0) 76.3 (76.4) 95.6 (95.5)
BIC-GMM: EN-phonemes, CVS 98.1 (98.0) 75.0 (75.2) 96.4 (96.3)
HMM-GMM: fusion MFCC + EntDyn 99.4 (97.1) 34.7 (65.6) 94.6 (94.8)
HMM-GMM: fusion MFCC + SI-CVS 98.6 (97.0) 70.5 (78.4) 96.5 (95.6)
scores overall, which confirmed our expectations that prob-ably the most suitable representation for SNS classification isa combination of acoustic- and recognition-based features.
The proposed phoneme recognition features employhigh-level information in SNS segmentation tasks, and inour experiments demonstrated a strong ability to discrim-inate between speech and non-speech. The effectiveness ofthe proposed SNS segmentation approach will be further an-alyzed in speaker diarization tasks on BN data. The speakerdiarization system will be built similar to systems presentedin [30, 37] based on methods derived from speaker verifica-tion tasks. Since similar phoneme recognition features werealso successfully applied in the fusion systems for speaker ver-ification [3, 10], we intend to integrate the proposed CVS fea-tures in the speaker clustering procedures in our diarizationsystem.
ACKNOWLEDGMENT
This work was supported by the Slovenian Research Agency(ARRS), development project L2-6277 (C) entitled “Broad-cast news processing system based on speech technologies.”
REFERENCES
[1] J. Ajmera, I. McCowan, and H. Bourlard, “Speech/music seg-mentation using entropy and dynamism features in a HMMclassification framework,” Speech Communication, vol. 40,no. 3, pp. 351–363, 2003.
[2] J. Ajmera, Robust audio segmentation, Ph.D. thesis, Ecole Poly-technique Federale de Lausanne, Lausanne, Switzerland, 2004.
[3] B. Baker, R. Vogt, and S. Sridharan, “Gaussian mixturemodelling of broad phonetic and syllabic events for text-independent speaker verification,” in Proceedings of Interspeech2005 - Eurospeech, pp. 2429–2432, Lisbon, Portugal, Septem-ber 2005.
[4] P. Beyerlein, X. Aubert, R. Haeb-Umbach, et al., “Large vo-cabulary continuous speech recognition of broadcast news -the Philips/RWTH approach,” Speech Communication, vol. 37,no. 1, pp. 109–131, 2002.
[5] S. S. Chen and P. S. Gopalakrishnan, “Speaker, environmentand channel change detection and clustering via the Bayesianinformation criterion,” in Proceedings of the DARPA SpeechRecognition Workshop, pp. 127–132, Lansdowne, Va, USA,February 1998.
[6] J. S. Garofolo, L. F. Lamel, W. M. Fisher, J. G. Fiscus, D. S. Pal-lett, and N. L. Dahlgren, “DARPA TIMIT acoustic-phoneticcontinuous speech corpus,” U.S. Department of Commerce,NIST, Gaithersburg, Md, USA, February 1993.
[7] J.-L. Gauvain, L. Lamel, and G. Adda, “The LIMSI broadcastnews transcription system,” Speech Communication, vol. 37,no. 1, pp. 89–108, 2002.
[8] S. Greenberg, “The ears have it: the auditory basis of speechperceptions,” in Proceedings of the 13th International Congressof Phonetic Sciences (ICPhS ’95), vol. 3, pp. 34–41, Stockholm,Sweden, August 1995.
[9] T. Hain, S. E. Johnson, A. Tuerk, P. C. Woodland, and S.J. Young, “Segment generation and clustering in the HTKbroadcast news transcription system,” in Proceedings of the1998 DARPA Broadcast News Transcription and UnderstandingWorkshop, pp. 133–137, Lansdowne, Va, USA,, February 1998.
[10] A. O. Hatch, B. Peskin, and A. Stolcke, “Improved phoneticspeaker recognition using lattice decoding,” in Proceedings ofIEEE International Conference on Acoustics, Speech, and SignalProcessing (ICASSP ’05), vol. 1, pp. 169–172, Philadelphia, Pa,USA, March 2005.
[11] H. Hermansky, “Perceptual linear predictive (PLP) analysis ofspeech,” Journal of the Acoustical Society of America, vol. 87,no. 4, pp. 1738–1752, 1990.
[12] D. Istrate, N. Scheffer, C. Fredouille, and J.-F. Bonastre,“Broadcast news speaker tracking for ESTER 2005 campaign,”in Proceedings of Interspeech 2005 - Eurospeech, pp. 2445–2448,Lisbon, Portugal, September 2005.
[13] S. Karneback, “Expanded examinations of a low frequencymodulation feature for speech/music discrimination,” in Pro-ceedings of 7th International Conference on Spoken LanguageProcessing (ICSLP ’02 - Interspeech ’02), vol. 2, pp. 2009–2012,Denver, Colo, USA, September 2002.
[14] B. Logan, “Mel frequency cepstral coefficients for music mod-eling,” in Proceedings of the International Symposium on MusicInformation Retrieval (ISMIR ’00), Plymouth, Mass, USA, Oc-tober 2000.
[15] K.-F. Lee and H.-W. Hon, “Speaker-independent phone recog-nition using hidden Markov models,” IEEE Transactions onAcoustics, Speech, and Signal Processing, vol. 37, no. 11, pp.1641–1648, 1989.
[16] L. Lu, H.-J. Zhang, and S. Z. Li, “Content-based audio classi-fication and segmentation by using support vector machines,”ACM Multimedia Systems Journal, vol. 8, no. 6, pp. 482–492,2003.
[17] I. Magrin-Chagnolleau and N. Parlangeau-Valles, “Audio in-dexing: what has been accomplished and the road ahead,”
12 EURASIP Journal on Applied Signal Processing
in Proceedings of Joint Conference on Information Sciences(JCIS ’02), pp. 911–914, Durham, NC, USA, March 2002.
[18] J. Makhoul, F. Kubala, T. Leek, et al., “Speech and languagetechnologies for audio indexing and retrieval,” Proceedings ofthe IEEE, vol. 88, no. 8, pp. 1338–1353, 2000.
[19] F. Mihelic, J. Gros, S. Dobrisek, J. Zibert, and N. Pavesic, “Spo-ken language resources at LUKS of the university of Ljubljana,”International Journal of Speech Technology, vol. 6, no. 3, pp.221–232, 2003.
[20] D. Moraru, M. Ben, and G. Gravier, “Experiments on speakertracking and segmentation in radio broadcast news,” in Pro-ceedings of Interspeech 2005 - Eurospeech, pp. 3049–3052, Lis-bon, Portugal, September 2005.
[21] J. W. Picone, “Signal modeling techniques in speech recogni-tion,” Proceedings of the IEEE, vol. 81, no. 9, pp. 1215–1247,1993.
[22] G. Potamianos, C. Neti, J. Luettin, and I. Matthews, “Audio-visual automatic speech recognition: an overview,” in Issuesin Visual and Audio-Visual Speech Processing, G. Bailly, E.Vatikiotis-Bateson, and P. Perrier, Eds., MIT Press, Cambridge,Mass, USA, 2004.
[23] D. A. Reynolds, J. P. Campbell, and W. M. Campbell, “Beyondcepstra: exploiting high-level information in speaker recogni-tion,” in Proceedings of the Workshop on Multimodal User Au-thentication, pp. 223–229, Santa Barbara, Calif, USA, Decem-ber 2003.
[24] D. A. Reynolds and P. A. Torres-Carrasquillo, “Approaches andapplications of audio diarization,” in Proceedings of IEEE In-ternational Conference on Acoustics, Speech, and Signal Process-ing (ICASSP ’05), vol. 5, pp. 953–956, Philadelphia, Pa, USA,March 2005.
[25] A. Samouelian, J. Robert-Ribes, and M. Plumpe, “Speech, si-lence, music and noise classification of TV broadcast mate-rial,” in Proceedings of International Conference on Spoken Lan-guage Processing (ICSLP ’98), vol. 3, pp. 1099–1102, Sydney,Australia, November-December 1998.
[26] J. Saunders, “Real-time discrimination of broadcast speech/music,” in Proceedings of International Conference on Acoustics,Speech, and Signal Processing (ICASSP ’96), vol. 2, pp. 993–996,Atlanta, Ga, USA, May 1996.
[27] E. Scheirer and M. Slaney, “Construction and evaluation of arobust multifeature speech/music discriminator,” in Proceed-ings of International Conference on Acoustics, Speech, and Sig-nal Processing (ICASSP ’97), vol. 2, pp. 1331–1334, Munich,Germany, April 1997.
[28] I. Shafran and R. Rose, “Robust speech detection and segmen-tation for real-time ASR applications,” in Proceedings of Inter-national Conference on Acoustics, Speech, and Signal Processing(ICASSP ’03), vol. 1, pp. 432–435, Hong Kong, April 2003.
[29] M. Siegler, U. Jain, B. Raj, and R. Stern, “Automatic segmen-tation, classification and clustering of broadcast news data,”in Proceedings of the DARPA Speech Recognition Workshop, pp.97–99, Chantilly, Va, USA, February 1997.
[30] R. Sinha, S. E. Tranter, M. J. F. Gales, and P. C. Woodland,“The Cambridge University March 2005 speaker diarisationsystem,” in Proceedings of Interspeech 2005 - Eurospeech, pp.2437–2440, Lisbon, Portugal, September 2005.
[31] A. Vandecatseye, J. P. Martens, J. Neto, et al., “The COST278pan-European broadcast news database,” in Proceedings of theInternational Conference on Language Resources and Evaluation(LREC ’04), pp. 873–876, Lisbon, Portugal, May 2004.
[32] A. Tritschler and R. Gopinath, “Improved speaker segmenta-tion and segments clustering using the Bayesian information
criterion,” in Proceedings of Eurospeech ’99, vol. 2, pp. 679–682,Budapest, Hungary, September 1999.
[33] G. Williams and D. P. W. Ellis, “Speech/music discriminationbased on posterior probabilities,” in Proceedings of Eurospeech’99, vol. 2, pp. 687–690, Budapest, Hungary, September 1999.
[34] P. C. Woodland, “The development of the HTK broadcastnews transcription system: an overview,” Speech Communica-tion, vol. 37, no. 1, pp. 47–67, 2002.
[35] J. Zibert and F. Mihelic, “Development of Slovenian broadcastnews speech database,” in Proceedings of the International Con-ference on Language Resources and Evaluation (LREC ’04), pp.2095–2098, Lisbon, Portugal, May 2004.
[36] J. Zibert, F. Mihelic, J.-P. Martens, et al., “The COST278broadcast news segmentation and speaker clustering evalua-tion - overview, methodology, systems, results,” in Proceedingsof Interspeech 2005 - Eurospeech, pp. 629–632, Lisbon, Portu-gal, September 2005.
[37] X. Zhu, C. Barras, S. Meignier, and J.-L. Gauvain, “Combin-ing speaker identification and BIC for speaker diarization,” inProceedings of Interspeech 2005 - Eurospeech, pp. 2441–2444,Lisbon, Portugal, September 2005.
[38] S. Young, G. Evermann, M. Gales, et al., The HTK Book (forHTK Version 3.2), Cambridge University Engineering Depart-ment, Cambridge, UK, 2004.
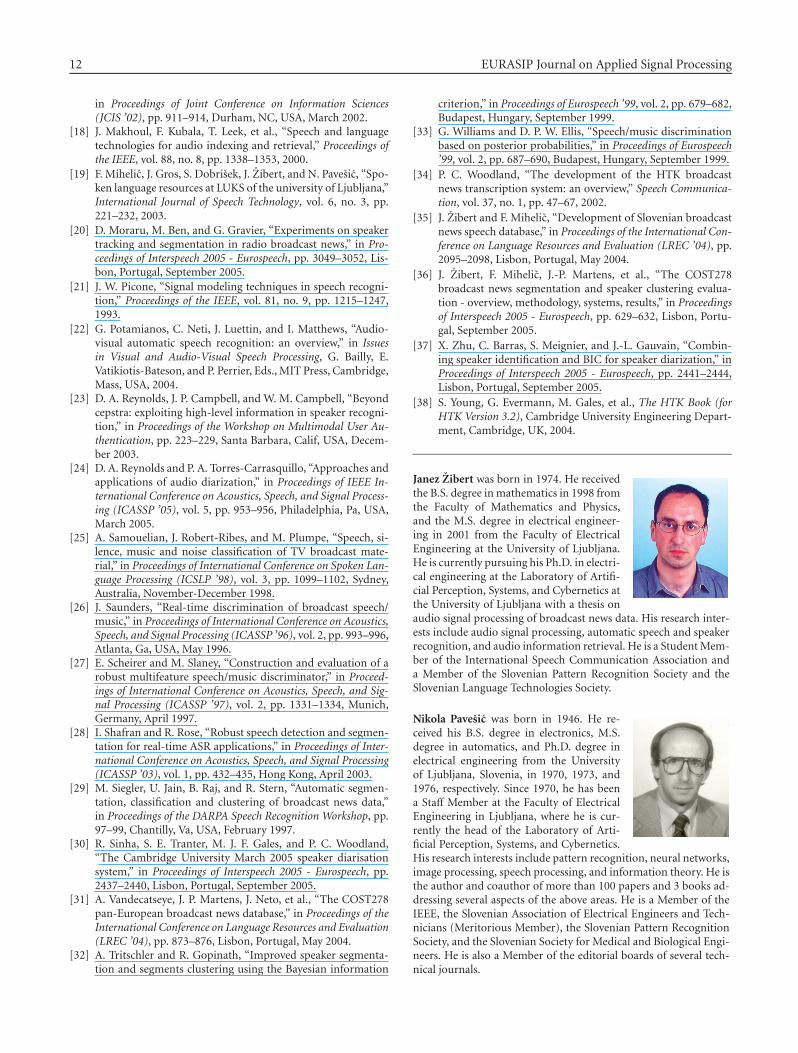
Janez Zibert was born in 1974. He receivedthe B.S. degree in mathematics in 1998 fromthe Faculty of Mathematics and Physics,and the M.S. degree in electrical engineer-ing in 2001 from the Faculty of ElectricalEngineering at the University of Ljubljana.He is currently pursuing his Ph.D. in electri-cal engineering at the Laboratory of Artifi-cial Perception, Systems, and Cybernetics atthe University of Ljubljana with a thesis onaudio signal processing of broadcast news data. His research inter-ests include audio signal processing, automatic speech and speakerrecognition, and audio information retrieval. He is a Student Mem-ber of the International Speech Communication Association anda Member of the Slovenian Pattern Recognition Society and theSlovenian Language Technologies Society.
Nikola Pavesic was born in 1946. He re-ceived his B.S. degree in electronics, M.S.degree in automatics, and Ph.D. degree inelectrical engineering from the Universityof Ljubljana, Slovenia, in 1970, 1973, and1976, respectively. Since 1970, he has beena Staff Member at the Faculty of ElectricalEngineering in Ljubljana, where he is cur-rently the head of the Laboratory of Arti-ficial Perception, Systems, and Cybernetics.His research interests include pattern recognition, neural networks,image processing, speech processing, and information theory. He isthe author and coauthor of more than 100 papers and 3 books ad-dressing several aspects of the above areas. He is a Member of theIEEE, the Slovenian Association of Electrical Engineers and Tech-nicians (Meritorious Member), the Slovenian Pattern RecognitionSociety, and the Slovenian Society for Medical and Biological Engi-neers. He is also a Member of the editorial boards of several tech-nical journals.
Janez Zibert et al. 13
France Mihelic was born in 1952. He stud-ied at the Faculty of Natural Sciences, theFaculty of Economics, and the Faculty ofElectrical Engineering all at the Universityof Ljubljana. There he received the B.S. de-gree in technical mathematics, the M.S. de-gree in operational research, and the Ph.D.degree in electrotechnical sciences in 1976,1979, and 1991, respectively. Since 1978, hehas been a Staff Member at the Faculty ofElectrical and Computer Engineering in Ljubljana, where he is cur-rently an Associate Professor. His research interests include patternrecognition, speech recognition and understanding, speech synthe-sis, and signal processing. He has authored and coauthored severalpapers and 2 books addressing several aspects of the above areas.He is a Member of the IEEE, International Speech Communica-tion Association, the Slovenian Mathematician’s, Physicist’s, andAstronomer’s Society, Slovenian Pattern Recognition Society, andthe Slovenian Language Technologies Society.