Embed Size (px)
Citation preview
Icarus 223 (2013) 850–877
Contents lists available at SciVerse ScienceDirect
Icarus
journal homepage: www.elsevier .com/ locate/ icarus
Spectral reflectance properties of HED meteorites + CM2 carbonaceouschondrites: Comparison to HED grain size and compositional variationsand implications for the nature of low-albedo features on Asteroid 4 Vesta
E.A. Cloutis a,⇑, M.R.M. Izawa a, L. Pompilio b, V. Reddy c,d, H. Hiesinger e, A. Nathues d, P. Mann a,L. Le Corre d, E. Palomba f, J.F. Bell III g
a Department of Geography, University of Winnipeg, 515 Portage Avenue, Winnipeg, MB, Canada R3B 2E9b Department of Psychological, Humanistic and Earth Sciences, University D’Annunzio, Via Dei Vestini, 30-I, 66013, Chieti Scalo, Italyc Department of Space Studies, Box 9008, University of North Dakota, Grand Forks, ND 58202, USAd Max-Planck-Institute for Solar System Research, Katlenburg-Lindau, Germanye Institut für Planetologie, Westfälische Wilhelms-Universität, Wilhelm-Klemm-Str. 10, 48149 Münster, Germanyf Instituto di Fisica dello Spazio Interplanetario, Via del Fosso del Cavaliere, INAF, 00133 Roma, Italyg School of Earth and Space Exploration, Box 871404, Arizona State University, Tempe, AZ 85287-1404, USA
a r t i c l e i n f o a b s t r a c t
Article history:Received 14 June 2012Revised 4 February 2013Accepted 5 February 2013Available online 16 February 2013
Keywords:Asteroid VestaMeteoritesMineralogySpectroscopyAsteroids, Surfaces
0019-1035/$ - see front matter � 2013 Elsevier Inc. Ahttp://dx.doi.org/10.1016/j.icarus.2013.02.003
⇑ Corresponding author. Fax: +1 204 774 4134.E-mail addresses: [email protected] (E.A. Clo
(L. Pompilio), [email protected] (V. Reddy), hiesingsinger), [email protected] (A. Nathues), [email protected] (E. Palomba), Jim.Bell@asu.
We have studied the spectral reflectance properties of the CM2 xenolith-bearing howardite PRA 04401, inti-mate and areal mixtures of a eucrite (Millbillillie) and a CM2 chondrite (Murchison), and a mineralogicallydiverse suite of 12 HED meteorites. The main goal is to ascertain whether the presence of CM2-type materialcan be discriminated from grain size variations in HEDs. This project was motivated by the presence of CM2material in a number of howardites. This study is of high relevance to Vesta because of the detection of low-albedo features on its surface by the Framing Camera (FC) aboard NASA’s Dawn spacecraft. The addition ofCM2 material and increasing HED grain size both lead to decreasing overall albedo. However these two pro-cesses can be recognized by how they affect pyroxene band depths and shapes and, to a lesser extent, bandwidths. Pyroxene band depths and widths decrease with increasing CM2 abundance and increase withincreasing HED grain size, as do various FC reflectance ratios. HED pyroxene absorption bands appear toreach saturation when grain size is in the region of 60–170 lm, with band I saturating at smaller grain sizesthan band II. Band I centers are largely insensitive to CM2 abundances or HED grain size variations, whileBand II center positions increase by up to 40 nm with increasing CM2 abundance, and vary non-systemat-ically by up to 22 nm as a function of grain size. The variation with CM2 abundance is probably due to thered-sloped nature of the CM2 spectrum and the broad and shallow nature of the pyroxene band II absorp-tion. Band area ratios show less consistent behavior, likely due to CM2-induced slope changes in the mix-tures and band saturation effects in the HEDs. Because HED pyroxene is so strongly featured, CM2abundances must be well in excess of 80 wt.% to allow for the appearance of their much weaker CM2 phyl-losilicate absorption bands. CM2 material may also cause a reddening of spectral slope and a shifting ofpyroxene band minima to shorter wavelengths, although CM2 chondrites can exhibit a range of spectralslopes. The presence of submicron opaques (specifically chromite) in HED pyroxenes can lead to large vari-ations in all spectral parameters. Discriminating the spectrum-altering effects of CM2 material from HEDgrain size variations is possible, with the confidence in the interpretation increasing as a larger range ofspectral parameters are applied to the analysis.
� 2013 Elsevier Inc. All rights reserved.
1. Introduction ferentiated asteroid (Russell et al., 2007; Russell and Raymond,
The Dawn spacecraft, which spent many months in orbitaround Asteroid 4 Vesta provided our first detailed look at a dif-
ll rights reserved.
utis), [email protected]@uni-muenster.de (H. [email protected] (L. Le Corre),edu (J.F. Bell III).
2011; Reddy et al., 2012a). Vesta has long been recognized ashaving a mafic silicate-dominated surface assemblage, consistentwith its having undergone melting and differentiation (e.g.,McCord et al., 1970). The Howardite–Eucrite–Diogenite (HED)meteorite clan is also mafic silicate-rich (Mittlefehldt et al.,1998), and Vesta has been suggested as the most likely HED par-ent body on the basis of a number of criteria (recently summa-rized in McSween et al., 2011).
E.A. Cloutis et al. / Icarus 223 (2013) 850–877 851
HEDs are a mineralogically diverse group of meteorites, con-taining variable amounts of low-Ca pyroxene and pigeonite,high-Ca pyroxene, olivine, and plagioclase feldspar, as well as anumber of minor phases (e.g., Mittlefehldt et al., 1998; Bunchet al., 2010; Shearer et al., 2010; Garber and Righter, 2011). Previ-ous spectroscopic studies of Vesta have demonstrated that it has ageologically diverse surface, with an average surface compositionanalogous to howardites and/or polymict eucrites, and with oliv-ine- and diogenite-rich areas (Gaffey, 1997; Thomas et al., 1997;Li et al., 2010; Reddy et al., 2010). Much of the spectroscopic diver-sity seen on Vesta is consistent with the mineralogic diversity ofHEDs (e.g., Gaffey, 1997).
In addition to the variations in silicate chemistry and end mem-ber abundances of HEDs, a number contain xenoliths of other mete-orite types. The most widespread type of xenoliths in HEDs are CM2type carbonaceous chondrites, although other types of carbona-ceous chondrite clasts (e.g., CR, C1, C2) have also been identified(e.g., Chou et al., 1976; Buchanan et al., 1993; Zolensky et al.,1996; Buchanan and Mittlefehldt, 2003; Gounelle et al., 2003; Lor-enz et al., 2007; McCoy and Reynolds, 2007; Herrin et al., 2010,2011; Janots et al., 2012; Paniello et al., 2012). This exogenous mate-rial is present at a variety of spatial scales ranging from intimatelymixed (submicron) to macroscopic clasts (e.g., Chou et al., 1976;Herrin et al., 2010, 2011). The presence of CM2 type materials onthe surface of Vesta is suggested by the presence of many dark-tonedfeatures on the surface that have been imaged by the Dawn space-craft’s Framing Camera (FC) (Fig. 1) (Reddy et al., 2012a,c; McCordet al., 2012). The evidence that this darkening agent is carbonaceouschondrite material is discussed in more detail below.
The spectroscopic properties of the HED clan have been the sub-ject of a number of studies (e.g., Hiroi et al., 1995, 2001; Sunshineet al., 2004; Duffard et al., 2005; Burbine et al., 2007; DonaldsonHanna and Sprague, 2009; Moskovitz et al., 2010; Mayne et al.,2010, 2011; Beck et al., 2011; Reddy et al., 2012b). In the presentstudy we examine the spectral reflectance properties of intimateand areal mixtures of the Millbillillie eucrite and the MurchisonCM2 carbonaceous chondrite, as well as multiple grain size pow-ders and slabs of the CM2-bearing howardite PRA 04401, and amineralogically diverse suite of HEDs, most of which have not been
Fig. 1. Dawn FC image of a portion of the surface of Vesta showing regions of darkermaterial (http://dawn.jpl.nasa.gov/multimedia/imageoftheday/image.asp?-date=20111118). Image Credit: NASA/ JPL-Caltech/UCLA/MPS/ DLR/IDA.
previously characterized. We included both intimate and arealmixtures in our analysis because carbonaceous chondrite-typexenoliths in HEDs range from macroscopic clasts to ‘‘invisible’’inclusions, where the presence of carbonaceous chondrite materi-als is only evident from elemental abundances (Chou et al., 1976;Herrin et al., 2010, 2011). Our main goal is to determine how thespectrum-altering effects of the presence of CM2 material can bediscriminated from HED grain size variations. A secondary goal isto better ascertain the spectral diversity of HEDs, as our samplesuite includes a shocked eucrite and olivine-rich diogenites. Thespectral variability of some of these samples deconvolved to DawnFC band passes was the subject of earlier papers (Le Corre et al.,2011; Reddy et al., 2012c). As HEDs are examined in more detailed,greater petrologic diversity is being revealed in this meteoritegroup (e.g., Barrat et al., 2012).
2. Mineralogy and spectroscopy of HED constituents
HEDs contain a variety of pyroxenes, including low-calciumortho- and clinopyroxenes, pigeonites, and high-calcium clinopy-roxenes (Mittlefehldt et al., 1998). Abundant plagioclase feldsparis present in eucrites, and olivine is present in some diogenites(e.g., Krawczynski et al., 2008; Beck and McSween, 2010). Opaqueminerals are rare in HEDs, generally occurring at the <1% level. Thediversity of HEDs, and similarities in oxygen isotopes suggests thatthe bulk of them derived from a single geologically differentiatedand diverse body (e.g., Drake, 2001; Beck et al., 2011).
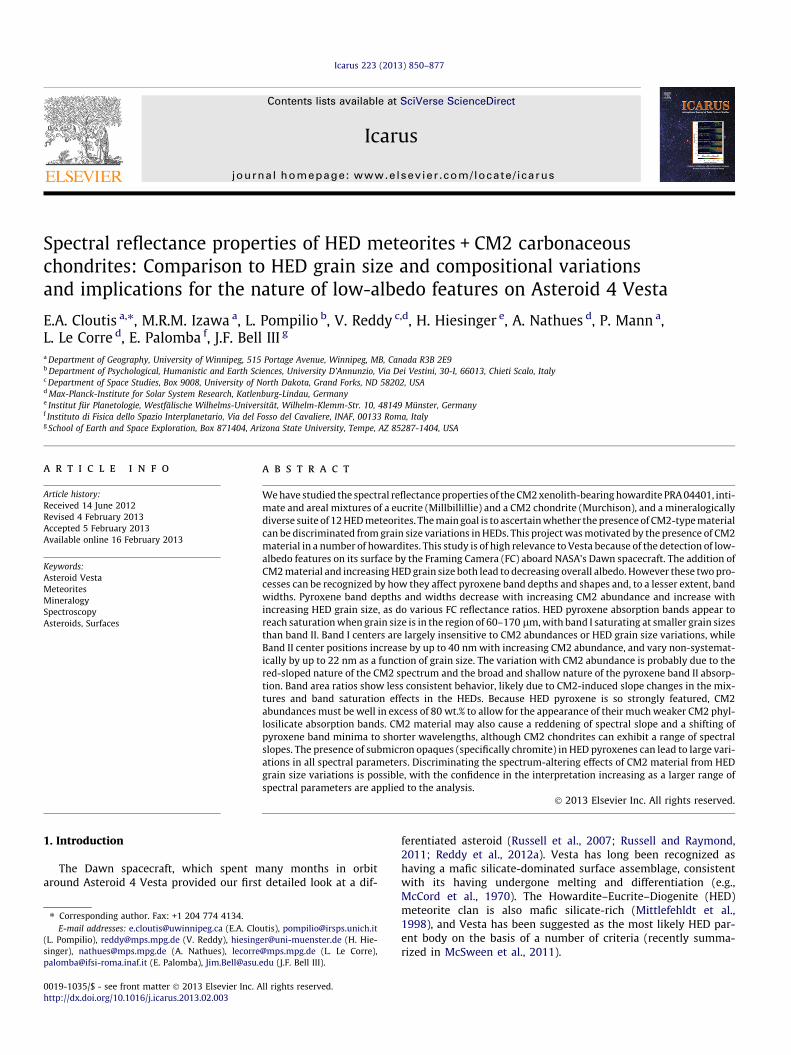
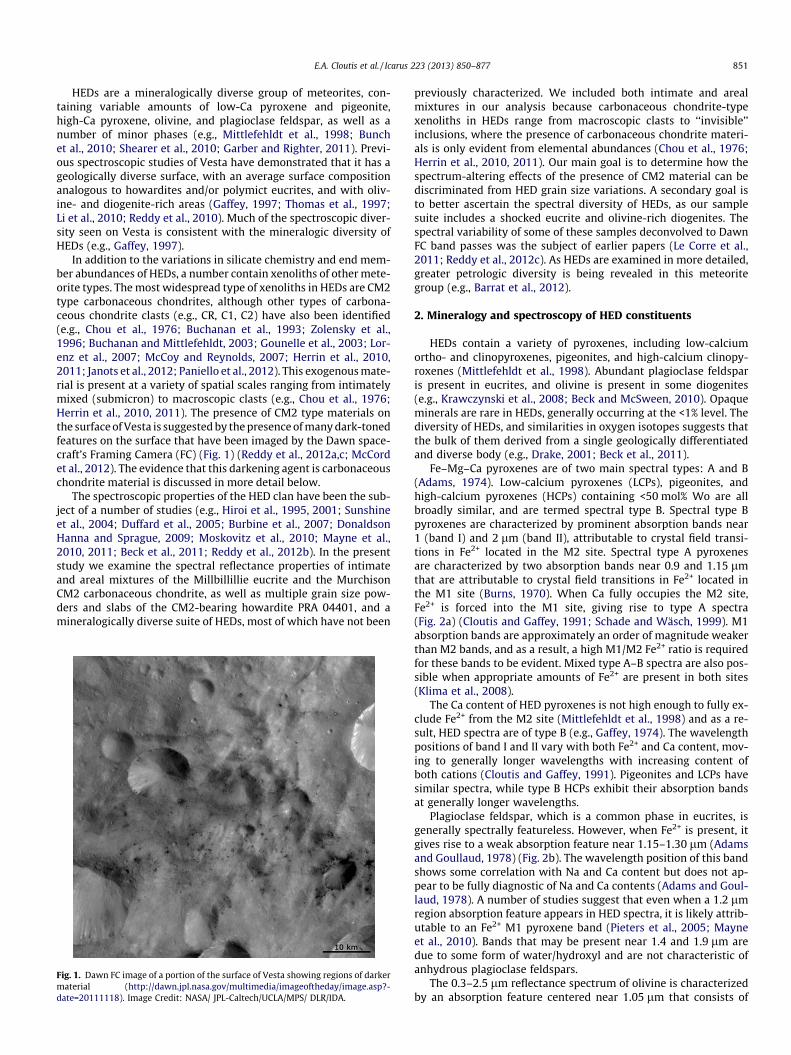
Fe–Mg–Ca pyroxenes are of two main spectral types: A and B(Adams, 1974). Low-calcium pyroxenes (LCPs), pigeonites, andhigh-calcium pyroxenes (HCPs) containing <50 mol% Wo are allbroadly similar, and are termed spectral type B. Spectral type Bpyroxenes are characterized by prominent absorption bands near1 (band I) and 2 lm (band II), attributable to crystal field transi-tions in Fe2+ located in the M2 site. Spectral type A pyroxenesare characterized by two absorption bands near 0.9 and 1.15 lmthat are attributable to crystal field transitions in Fe2+ located inthe M1 site (Burns, 1970). When Ca fully occupies the M2 site,Fe2+ is forced into the M1 site, giving rise to type A spectra(Fig. 2a) (Cloutis and Gaffey, 1991; Schade and Wäsch, 1999). M1absorption bands are approximately an order of magnitude weakerthan M2 bands, and as a result, a high M1/M2 Fe2+ ratio is requiredfor these bands to be evident. Mixed type A–B spectra are also pos-sible when appropriate amounts of Fe2+ are present in both sites(Klima et al., 2008).
The Ca content of HED pyroxenes is not high enough to fully ex-clude Fe2+ from the M2 site (Mittlefehldt et al., 1998) and as a re-sult, HED spectra are of type B (e.g., Gaffey, 1974). The wavelengthpositions of band I and II vary with both Fe2+ and Ca content, mov-ing to generally longer wavelengths with increasing content ofboth cations (Cloutis and Gaffey, 1991). Pigeonites and LCPs havesimilar spectra, while type B HCPs exhibit their absorption bandsat generally longer wavelengths.
Plagioclase feldspar, which is a common phase in eucrites, isgenerally spectrally featureless. However, when Fe2+ is present, itgives rise to a weak absorption feature near 1.15–1.30 lm (Adamsand Goullaud, 1978) (Fig. 2b). The wavelength position of this bandshows some correlation with Na and Ca content but does not ap-pear to be fully diagnostic of Na and Ca contents (Adams and Goul-laud, 1978). A number of studies suggest that even when a 1.2 lmregion absorption feature appears in HED spectra, it is likely attrib-utable to an Fe2+ M1 pyroxene band (Pieters et al., 2005; Mayneet al., 2010). Bands that may be present near 1.4 and 1.9 lm aredue to some form of water/hydroxyl and are not characteristic ofanhydrous plagioclase feldspars.
The 0.3–2.5 lm reflectance spectrum of olivine is characterizedby an absorption feature centered near 1.05 lm that consists of
Fig. 2. Reflectance spectra of HED constituent minerals. (a) Low-calcium pyroxene, pigeonite, and high-calcium type A and type B pyroxenes. (b) Plagioclase feldspars. (c)Olivines. (d) Chromite, ilmenite, meteoritic metal, and meteoritic troilite.
Table 1HEDs and other meteorites used in this study.
Meteorite name Type
JaH 626 Shocked polymict eucriteMillbillillie Polymict eucriteMurchison CM2.5/2.7 carbonaceous chondriteNWA 1836 Cumulate monomict eucriteNWA 1942 HowarditeNWA 1943 HowarditeNWA 2968 Dunitic diogeniteNWA 5748 HowarditeNWA 5751 HowarditeNWA 6013 Olivine-rich diogeniteNWA 6477 EucritePRA 04401 CM2-bearing howarditeTalampaya Cumulate eucriteTatahouine Diogenite
852 E.A. Cloutis et al. / Icarus 223 (2013) 850–877
three bands attributable to crystal field transitions in Fe2+ locatedin the M2 site (band near 1.05 lm), and in the M1 site (bands near0.85 and 1.3 lm) (Burns, 1970). With increasing Fe2+ content, thesebands become deeper and move to longer wavelengths (Fig. 2c),with the combined band center located between �1.045 and�1.085 lm (King and Ridley, 1987; Sunshine and Pieters, 1998).Olivine spectra also commonly exhibit a weak absorption featurenear 0.6 lm of uncertain cause (Sunshine and Pieters, 1998).
The major opaque minerals in HEDs are chromite, ilmenite, Fe–Ni metal, and troilite (Mittlefehldt et al., 1998). Chromite is charac-terized by rising reflectance to �1.4 and a deep Fe2+ crystal fieldtransition band in the 2.1–2.3 lm region (Cloutis et al., 2004).Ilmenite is characterized by low overall reflectance, an absorptionband near 0.5 lm (charge transfer) and a broad absorption featurenear 1.4 lm (Fe2+ crystal field transition) (Hunt et al., 1971). Metaland troilite are both red-sloped and spectrally featureless (Brittand Pieters, 1988; Britt et al., 1992; Cloutis et al., 2010) (Fig 2d).It is expected that HED opaques are at too low abundances to con-tribute distinct spectral features (Mayne et al., 2010). However,Moroz et al. (2011) suggest that finely-dispersed chromite (andilmenite), which may result from thermal metamorphism, isresponsible for changing the spectral shape, band area ratios, andband II position of a Millbillillie ‘‘cloudy’’ pyroxene separate.
3. Experimental procedure
To discriminate the effects of HED grain size variations from thepresence of CM2 material, and to better understand the spectraldiversity of HEDs, we spectrally characterized a suite of 12 HEDs,
a CM2 chondrite-bearing howardite, PRA 04401, and mixtures ofthe Millbillillie eucrite + the Murchison CM2 carbonaceous chon-drite (described below). The samples used in this study are listedin Table 1 and described in Appendix A.
Mineral abundances in the <45 lm fractions of the sampleswere determined by Rietveld refinement of their X-ray diffractionpatterns. The X-ray diffraction analysis involved acquiring contin-uous scan data from 5� to 100� 2h on a Bruker D8 Advance with aDaVinci automated powder diffractometer. A Bragg–Brentanogoniometer with a theta–theta setup was equipped with a 2.5�incident Soller slit, 1.0 mm divergence slit, a 2.0 mm scatter slit,a 0.2 mm receiving slit, a curved secondary graphite monochroma-
E.A. Cloutis et al. / Icarus 223 (2013) 850–877 853
tor, and a scintillation counter collecting at an increment of 0.02�.The line focus Co X-ray tube was operated at 40 kV and 40 mA,using a take-off angle of 6�.
Rietveld refinement uses a model of the incident radiation, theinstrument, and the structure and composition of the scatteringmatter to create a simulated diffraction pattern. The simulated dif-fraction pattern is then compared with the measured X-ray diffrac-togram for that sample, and nonlinear least-squares optimizationof the model parameters (instrumental parameters, abundanceand crystallographic parameters of the mineral(s) present) carriedout to find the best fit of the model parameters to the X-ray diffrac-togram (Rietveld, 1969; Shankland, 2004; Young, 1993; Younget al., 1977). Rietveld refinement is capable of accurately quantify-ing the modal mineralogy of complex mixtures (e.g., Bish and Post,1993; Gualtieri, 2000; Shankland, 2004; Wilson et al., 2006).
Rietveld refinement of the sample X-ray diffraction patternswas performed using BrukerAXS TOPAS4 version 4.2 software, infundamental parameters (FP) mode. Because the purpose of Riet-veld refinement in this study is the quantification of the mineral-ogy of the meteorite samples, the atomic co-ordinates andcompositions of the minerals were not refined. Instead, ‘standard’crystal structures and compositions were used, with chemicalcompositions fixed to average values for the meteorites in questionwhere available, or to reasonable values for the class of meteoritewhere average values were not available. Starting structural mod-els were created using published crystal structures as follows:anorthite – Angel (1988) and Facchinelli et al. (1979); pigeonite(clinopyroxene in space group P21/c) – Morimoto and Güven(1970); augite (clinopyroxene in space group C2/c) – Gualtieri(2000); orthopyroxene (low-Ca pyroxene in space group Pbca) –Hugh-Jones and Angel (1994); olivine – Smyth and Hazen(1973); ilmenite – Wechsler and Prewitt (1984); chromite – Lenazet al. (2004); troilite – Skála et al. (2006); a-cristobalite – Downsand Palmer (1994); anatase – Howard et al. (1991).
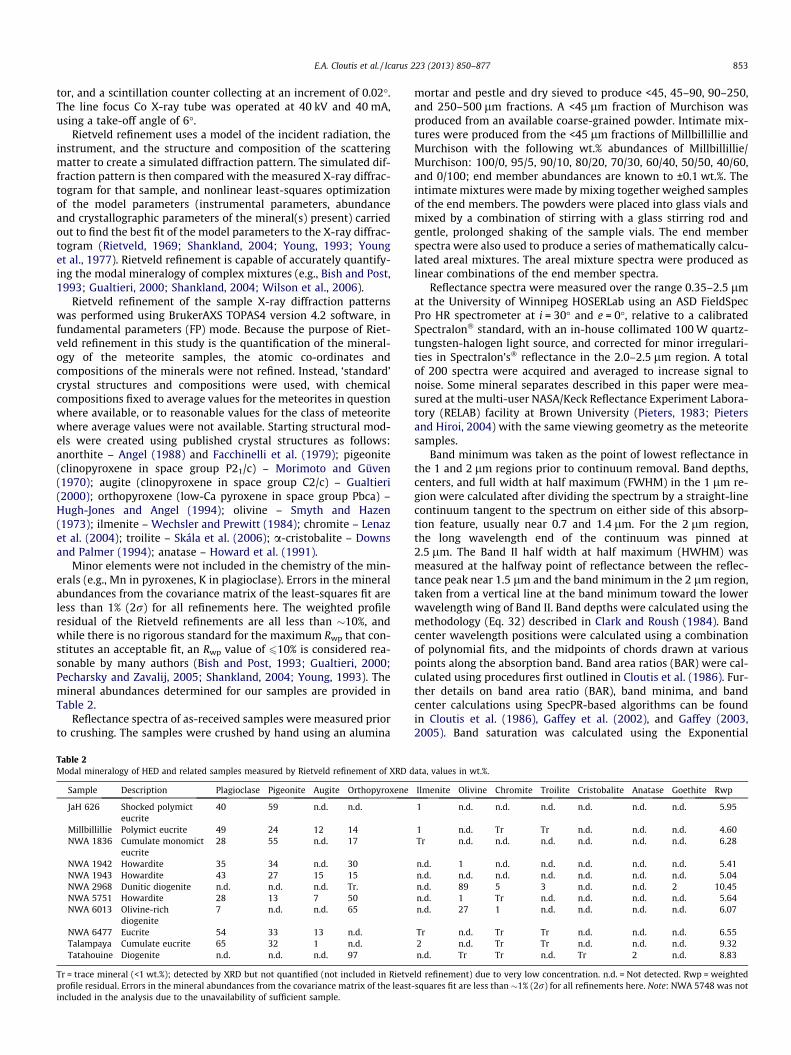
Minor elements were not included in the chemistry of the min-erals (e.g., Mn in pyroxenes, K in plagioclase). Errors in the mineralabundances from the covariance matrix of the least-squares fit areless than 1% (2r) for all refinements here. The weighted profileresidual of the Rietveld refinements are all less than �10%, andwhile there is no rigorous standard for the maximum Rwp that con-stitutes an acceptable fit, an Rwp value of 610% is considered rea-sonable by many authors (Bish and Post, 1993; Gualtieri, 2000;Pecharsky and Zavalij, 2005; Shankland, 2004; Young, 1993). Themineral abundances determined for our samples are provided inTable 2.
Reflectance spectra of as-received samples were measured priorto crushing. The samples were crushed by hand using an alumina
Table 2Modal mineralogy of HED and related samples measured by Rietveld refinement of XRD d
Sample Description Plagioclase Pigeonite Augite Orthopyroxene
JaH 626 Shocked polymicteucrite
40 59 n.d. n.d.
Millbillillie Polymict eucrite 49 24 12 14NWA 1836 Cumulate monomict
eucrite28 55 n.d. 17
NWA 1942 Howardite 35 34 n.d. 30NWA 1943 Howardite 43 27 15 15NWA 2968 Dunitic diogenite n.d. n.d. n.d. Tr.NWA 5751 Howardite 28 13 7 50NWA 6013 Olivine-rich
diogenite7 n.d. n.d. 65
NWA 6477 Eucrite 54 33 13 n.d.Talampaya Cumulate eucrite 65 32 1 n.d.Tatahouine Diogenite n.d. n.d. n.d. 97
Tr = trace mineral (<1 wt.%); detected by XRD but not quantified (not included in Rietveprofile residual. Errors in the mineral abundances from the covariance matrix of the leastincluded in the analysis due to the unavailability of sufficient sample.
mortar and pestle and dry sieved to produce <45, 45–90, 90–250,and 250–500 lm fractions. A <45 lm fraction of Murchison wasproduced from an available coarse-grained powder. Intimate mix-tures were produced from the <45 lm fractions of Millbillillie andMurchison with the following wt.% abundances of Millbillillie/Murchison: 100/0, 95/5, 90/10, 80/20, 70/30, 60/40, 50/50, 40/60,and 0/100; end member abundances are known to ±0.1 wt.%. Theintimate mixtures were made by mixing together weighed samplesof the end members. The powders were placed into glass vials andmixed by a combination of stirring with a glass stirring rod andgentle, prolonged shaking of the sample vials. The end memberspectra were also used to produce a series of mathematically calcu-lated areal mixtures. The areal mixture spectra were produced aslinear combinations of the end member spectra.
Reflectance spectra were measured over the range 0.35–2.5 lmat the University of Winnipeg HOSERLab using an ASD FieldSpecPro HR spectrometer at i = 30� and e = 0�, relative to a calibratedSpectralon� standard, with an in-house collimated 100 W quartz-tungsten-halogen light source, and corrected for minor irregulari-ties in Spectralon’s� reflectance in the 2.0–2.5 lm region. A totalof 200 spectra were acquired and averaged to increase signal tonoise. Some mineral separates described in this paper were mea-sured at the multi-user NASA/Keck Reflectance Experiment Labora-tory (RELAB) facility at Brown University (Pieters, 1983; Pietersand Hiroi, 2004) with the same viewing geometry as the meteoritesamples.
Band minimum was taken as the point of lowest reflectance inthe 1 and 2 lm regions prior to continuum removal. Band depths,centers, and full width at half maximum (FWHM) in the 1 lm re-gion were calculated after dividing the spectrum by a straight-linecontinuum tangent to the spectrum on either side of this absorp-tion feature, usually near 0.7 and 1.4 lm. For the 2 lm region,the long wavelength end of the continuum was pinned at2.5 lm. The Band II half width at half maximum (HWHM) wasmeasured at the halfway point of reflectance between the reflec-tance peak near 1.5 lm and the band minimum in the 2 lm region,taken from a vertical line at the band minimum toward the lowerwavelength wing of Band II. Band depths were calculated using themethodology (Eq. 32) described in Clark and Roush (1984). Bandcenter wavelength positions were calculated using a combinationof polynomial fits, and the midpoints of chords drawn at variouspoints along the absorption band. Band area ratios (BAR) were cal-culated using procedures first outlined in Cloutis et al. (1986). Fur-ther details on band area ratio (BAR), band minima, and bandcenter calculations using SpecPR-based algorithms can be foundin Cloutis et al. (1986), Gaffey et al. (2002), and Gaffey (2003,2005). Band saturation was calculated using the Exponential
ata, values in wt.%.
Ilmenite Olivine Chromite Troilite Cristobalite Anatase Goethite Rwp
1 n.d. n.d. n.d. n.d. n.d. n.d. 5.95
1 n.d. Tr Tr n.d. n.d. n.d. 4.60Tr n.d. n.d. n.d. n.d. n.d. n.d. 6.28
n.d. 1 n.d. n.d. n.d. n.d. n.d. 5.41n.d. n.d. n.d. n.d. n.d. n.d. n.d. 5.04n.d. 89 5 3 n.d. n.d. 2 10.45n.d. 1 Tr n.d. n.d. n.d. n.d. 5.64n.d. 27 1 n.d. n.d. n.d. n.d. 6.07
Tr n.d. Tr Tr n.d. n.d. n.d. 6.552 n.d. Tr Tr n.d. n.d. n.d. 9.32n.d. Tr Tr n.d. Tr 2 n.d. 8.83
ld refinement) due to very low concentration. n.d. = Not detected. Rwp = weighted-squares fit are less than �1% (2r) for all refinements here. Note: NWA 5748 was not
854 E.A. Cloutis et al. / Icarus 223 (2013) 850–877
Gaussian Optimization (EGO) algorithm of Pompilio et al. (2009).When referring to blue or red spectral slopes, blue slopes are thosethat show decreasing reflectance with increasing wavelength overa specified wavelength interval or a value of <1 when slope is mea-sured using the ratio of reflectance at a longer wavelength to ashorter wavelength; red slope is the opposite of the definition ofblue slope.
3.1. Description of Millbillillie, Murchison, and PRA 04401
Millbillillie has been described as a metamorphosed (equili-brated) polymict eucrite that contains coarse- and fine-grainedclasts, as well as granulitic breccias and impact melts (Masonet al., 1979; Fitzgerald, 1980; Yamaguchi et al., 1994). Its hostpigeonite and augite lamellae are homogenous and show partialinversion to orthopyroxene. Pyroxene compositions fall along atie line from Ca2Mg32Fe66 to Ca45Mg29Fe26, while plagioclase feld-spar ranges from �An81 to An94 (Yamaguchi et al., 1994). Minorminerals include submicron chromite, ilmenite, and troilite (Yam-aguchi et al., 1994). Its modal mineralogy includes 57.2% pyroxeneand 37.1% plagioclase feldspar (Kitts and Lodders, 1998). We deter-mined end member abundances of 24% pigeonite, 12% augite, 14%orthopyroxene, 49% plagioclase, and <1% of other phases (Table 2).
Murchison is a CM2 carbonaceous chondrite, of subtype 2.5 (Ru-bin et al., 2007) or 2.7 (Trigo-Rodriguez et al., 2006). XRD modalanalysis indicates that the Murchison CM2 chondrite consists of15.1 vol.% olivine, 8.3 vol.% enstatite, 1.2 vol.% calcite, 1.1 vol.% mag-netite, 0.7 vol.% pentlandite, 1.2 vol.% pyrrhotite, 50.3 vol.% Fe-cron-stedtite, and 22.2 vol.% Mg-serpentine (Howard et al., 2009).
To supplement these mixtures, we spectrally characterized asample of PRA 04401: a howardite that contains �60% CM2 clasts(McCoy and Reynolds, 2007; Herrin et al., 2010, 2011). The originaldescription of PRA 04401 is ‘‘a groundmass of comminuted pyrox-ene and plagioclase (up to 0.5 mm) with fine- to coarse-grainedbasaltic clasts ranging up to 5 mm’’ (McCoy and Reynolds, 2007).Its orthopyroxene is compositionally diverse (Fs16–60Wo1–3) andplagioclase feldspar composition is An87–90 (McCoy and Reynolds,2007). Our sample of PRA 04401 contained �40% visible CM2clasts, ranging in size up to �4 mm. The largest provided PRA04401 chip was spectrally characterized prior to crushing, andfor the following grain sizes: <45, 45–90, and 90–250 lm; insuffi-cient sample was available to produce a 250–500 lm fraction.
4. HED spectral diversity (<45 lm grain size spectra)
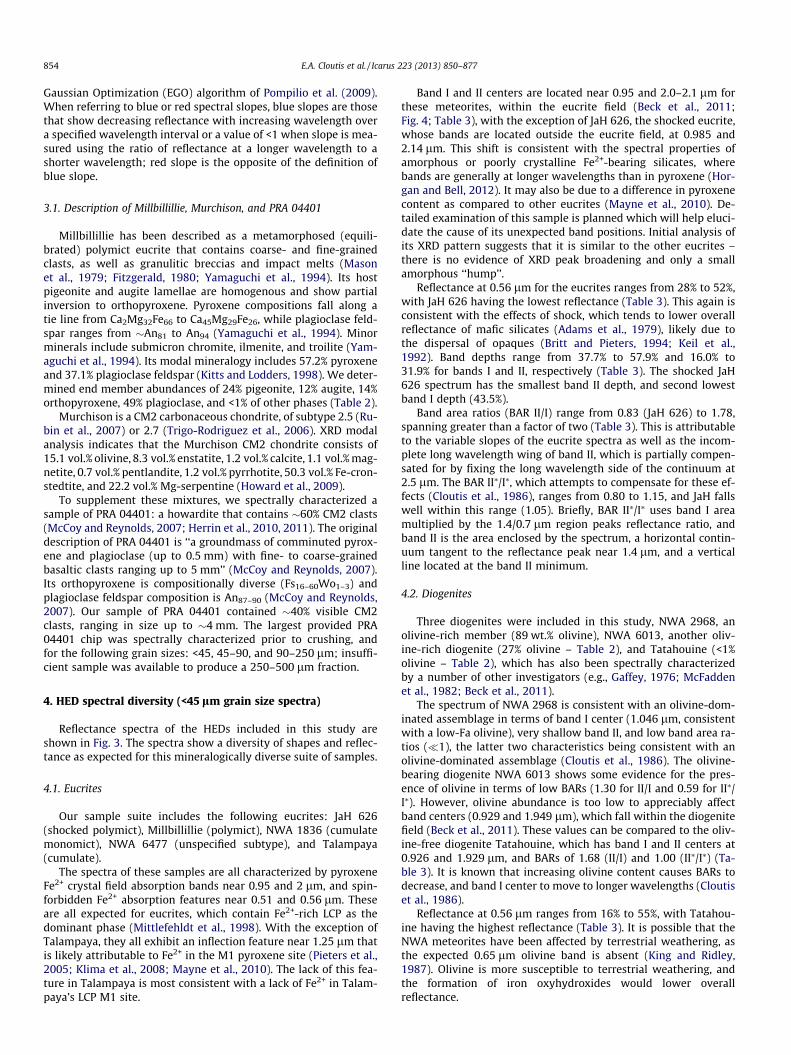
Reflectance spectra of the HEDs included in this study areshown in Fig. 3. The spectra show a diversity of shapes and reflec-tance as expected for this mineralogically diverse suite of samples.
4.1. Eucrites
Our sample suite includes the following eucrites: JaH 626(shocked polymict), Millbillillie (polymict), NWA 1836 (cumulatemonomict), NWA 6477 (unspecified subtype), and Talampaya(cumulate).
The spectra of these samples are all characterized by pyroxeneFe2+ crystal field absorption bands near 0.95 and 2 lm, and spin-forbidden Fe2+ absorption features near 0.51 and 0.56 lm. Theseare all expected for eucrites, which contain Fe2+-rich LCP as thedominant phase (Mittlefehldt et al., 1998). With the exception ofTalampaya, they all exhibit an inflection feature near 1.25 lm thatis likely attributable to Fe2+ in the M1 pyroxene site (Pieters et al.,2005; Klima et al., 2008; Mayne et al., 2010). The lack of this fea-ture in Talampaya is most consistent with a lack of Fe2+ in Talam-paya’s LCP M1 site.
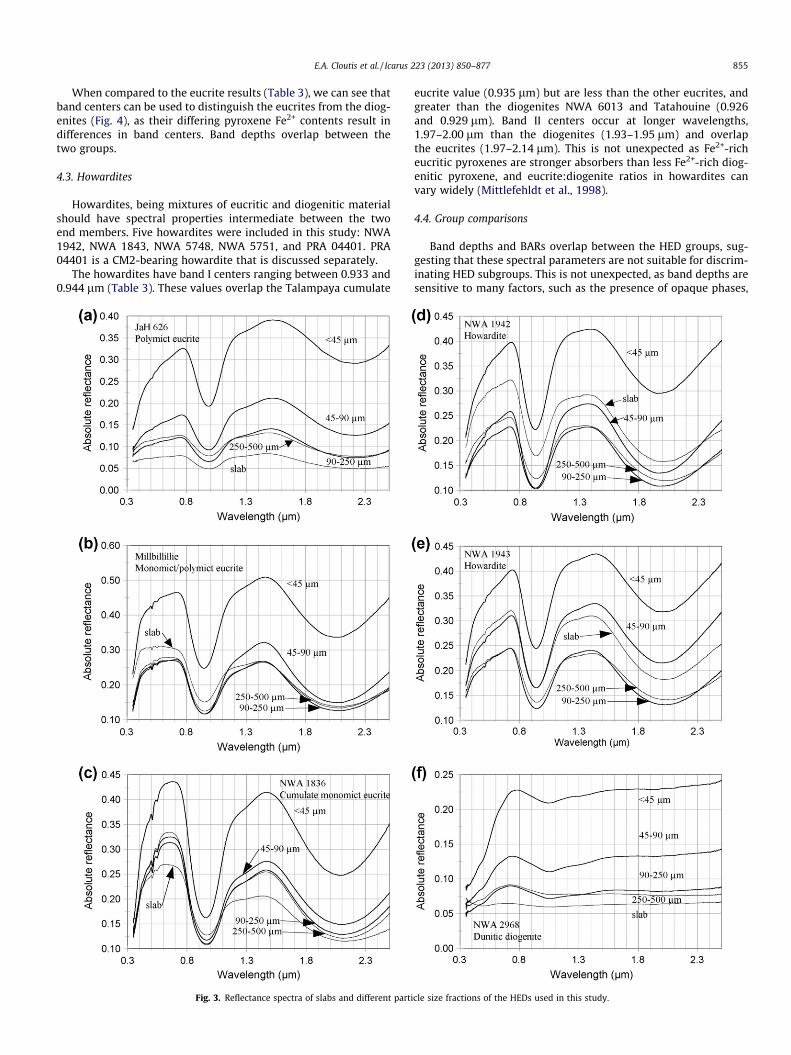
Band I and II centers are located near 0.95 and 2.0–2.1 lm forthese meteorites, within the eucrite field (Beck et al., 2011;Fig. 4; Table 3), with the exception of JaH 626, the shocked eucrite,whose bands are located outside the eucrite field, at 0.985 and2.14 lm. This shift is consistent with the spectral properties ofamorphous or poorly crystalline Fe2+-bearing silicates, wherebands are generally at longer wavelengths than in pyroxene (Hor-gan and Bell, 2012). It may also be due to a difference in pyroxenecontent as compared to other eucrites (Mayne et al., 2010). De-tailed examination of this sample is planned which will help eluci-date the cause of its unexpected band positions. Initial analysis ofits XRD pattern suggests that it is similar to the other eucrites –there is no evidence of XRD peak broadening and only a smallamorphous ‘‘hump’’.
Reflectance at 0.56 lm for the eucrites ranges from 28% to 52%,with JaH 626 having the lowest reflectance (Table 3). This again isconsistent with the effects of shock, which tends to lower overallreflectance of mafic silicates (Adams et al., 1979), likely due tothe dispersal of opaques (Britt and Pieters, 1994; Keil et al.,1992). Band depths range from 37.7% to 57.9% and 16.0% to31.9% for bands I and II, respectively (Table 3). The shocked JaH626 spectrum has the smallest band II depth, and second lowestband I depth (43.5%).
Band area ratios (BAR II/I) range from 0.83 (JaH 626) to 1.78,spanning greater than a factor of two (Table 3). This is attributableto the variable slopes of the eucrite spectra as well as the incom-plete long wavelength wing of band II, which is partially compen-sated for by fixing the long wavelength side of the continuum at2.5 lm. The BAR II⁄/I⁄, which attempts to compensate for these ef-fects (Cloutis et al., 1986), ranges from 0.80 to 1.15, and JaH fallswell within this range (1.05). Briefly, BAR II⁄/I⁄ uses band I areamultiplied by the 1.4/0.7 lm region peaks reflectance ratio, andband II is the area enclosed by the spectrum, a horizontal contin-uum tangent to the reflectance peak near 1.4 lm, and a verticalline located at the band II minimum.
4.2. Diogenites
Three diogenites were included in this study, NWA 2968, anolivine-rich member (89 wt.% olivine), NWA 6013, another oliv-ine-rich diogenite (27% olivine – Table 2), and Tatahouine (<1%olivine – Table 2), which has also been spectrally characterizedby a number of other investigators (e.g., Gaffey, 1976; McFaddenet al., 1982; Beck et al., 2011).
The spectrum of NWA 2968 is consistent with an olivine-dom-inated assemblage in terms of band I center (1.046 lm, consistentwith a low-Fa olivine), very shallow band II, and low band area ra-tios (�1), the latter two characteristics being consistent with anolivine-dominated assemblage (Cloutis et al., 1986). The olivine-bearing diogenite NWA 6013 shows some evidence for the pres-ence of olivine in terms of low BARs (1.30 for II/I and 0.59 for II⁄/I⁄). However, olivine abundance is too low to appreciably affectband centers (0.929 and 1.949 lm), which fall within the diogenitefield (Beck et al., 2011). These values can be compared to the oliv-ine-free diogenite Tatahouine, which has band I and II centers at0.926 and 1.929 lm, and BARs of 1.68 (II/I) and 1.00 (II⁄/I⁄) (Ta-ble 3). It is known that increasing olivine content causes BARs todecrease, and band I center to move to longer wavelengths (Cloutiset al., 1986).
Reflectance at 0.56 lm ranges from 16% to 55%, with Tatahou-ine having the highest reflectance (Table 3). It is possible that theNWA meteorites have been affected by terrestrial weathering, asthe expected 0.65 lm olivine band is absent (King and Ridley,1987). Olivine is more susceptible to terrestrial weathering, andthe formation of iron oxyhydroxides would lower overallreflectance.
E.A. Cloutis et al. / Icarus 223 (2013) 850–877 855
When compared to the eucrite results (Table 3), we can see thatband centers can be used to distinguish the eucrites from the diog-enites (Fig. 4), as their differing pyroxene Fe2+ contents result indifferences in band centers. Band depths overlap between thetwo groups.
4.3. Howardites
Howardites, being mixtures of eucritic and diogenitic materialshould have spectral properties intermediate between the twoend members. Five howardites were included in this study: NWA1942, NWA 1843, NWA 5748, NWA 5751, and PRA 04401. PRA04401 is a CM2-bearing howardite that is discussed separately.
The howardites have band I centers ranging between 0.933 and0.944 lm (Table 3). These values overlap the Talampaya cumulate
Fig. 3. Reflectance spectra of slabs and different parti
eucrite value (0.935 lm) but are less than the other eucrites, andgreater than the diogenites NWA 6013 and Tatahouine (0.926and 0.929 lm). Band II centers occur at longer wavelengths,1.97–2.00 lm than the diogenites (1.93–1.95 lm) and overlapthe eucrites (1.97–2.14 lm). This is not unexpected as Fe2+-richeucritic pyroxenes are stronger absorbers than less Fe2+-rich diog-enitic pyroxene, and eucrite:diogenite ratios in howardites canvary widely (Mittlefehldt et al., 1998).
4.4. Group comparisons
Band depths and BARs overlap between the HED groups, sug-gesting that these spectral parameters are not suitable for discrim-inating HED subgroups. This is not unexpected, as band depths aresensitive to many factors, such as the presence of opaque phases,
cle size fractions of the HEDs used in this study.

Fig. 3. (continued)
856 E.A. Cloutis et al. / Icarus 223 (2013) 850–877
while BARs can vary widely depending on the presence of opaques(Moroz and Arnold, 1999), and LCP BARs do not vary appreciablywith Fe content (Cloutis and Gaffey, 1991). Band centers appearto be the most reliable discriminators of diogenites from eucrites,with howardites straddling the regions occupied by these groups.
5. HED grain size effects
The HEDs included in this study were spectrally characterizedas whole rocks and four grain size ranges: <45, 45–90, 90–250,and 250–500 lm. These spectra enable us to assess how HED spec-tra vary as a function of grain size. In the ensuing discussion, wechose to retain numbering of the HED spectra in alphabetical orderto match Table 3.
5.1. Eucrites
The five eucrite sample spectra are shown in Fig. 3a (JaH 626),Fig. 3b (Millbillillie), Fig. 3c (NWA 1836), Fig. 3j (NWA 6477), andFig. 3l (Talampaya). The most noticeable difference in the eucritespectra involves the <45 versus larger grain size spectra. Whengoing from the <45 lm spectra to larger grain sizes, we see a de-crease in reflectance, and increase in 1 and 2 lm region banddepths, most noticeably from the <45 to 45–90 lm spectra (Table 3and Fig. 3a–c, j, and l). The 90–250 and 250–500 lm spectra gener-ally have similar reflectance. In some cases (most noticeably NWA1836: Fig. 3c, and NWA 6477: Fig. 3j) the 45–90, 90–250, and 250–500 lm spectra have similar reflectance in the visible region andband depths, but the 45–90 lm spectra are invariably brighter in

Fig. 4. Band I versus band II centers for HEDs from Beck et al. (2011), showing fieldsoccupied by majority of HEDs, as well as ranges for powders of the diogenites (blackellipses), howardites (gray ellipses), and eucrites (open ellipses). The shockedeucrite JaH 626 and dunitic diogenite NWA 2968 fall well outside the HED fields.
Fig. 3. (continued)
E.A. Cloutis et al. / Icarus 223 (2013) 850–877 857
the region of the local reflectance maximum near 1.4 lm. In somecases (JaH 626 Band I, NWA 6477 Band I, Millbillillie Band I and II,Talampaya Bands I and II: Table 3), band depths decrease whengoing from the 90–250 to the 250–500 lm fraction. Band depthsfor this largest fraction can be comparable to or less than for the<45 lm fraction, although overall reflectance is much lower (e.g.,Band I in JaH 626 and Talampaya: Table 3). Band I centers varyby up to 6 nm as a function of grain size in a non-systematicway. Band II centers vary by up to 22 nm, again non-systematically,and this larger range of variation is likely due to its broader andshallower nature (Table 3). For any one eucrite, the II⁄/I⁄ BAR in-creases with increasing grain size by up to 27%; the II/I BAR showsless systematic change, and can vary by up to 45% (Table 3).
5.2. Diogenites
The three diogenite sample spectra are shown in Fig. 3f (NWA2968), Fig. 3i (NWA 6013), and Fig. 3m (Tatahouine). The dioge-nites show the same type of behavior as the eucrites: band I cen-ters vary by less than 7 nm for band I and 17 nm for band IIcenters, again non-systematically (Table 3); band depths increasemost dramatically from the <45 to the 45–90 lm fraction (Table 3),and then may increase slightly (e.g., Band II in Tatahouine) or de-crease with larger grain sizes; reflectance also decreases withincreasing grain size (Table 3). For any one diogenite, BAR increases
with increasing grain size, varying by up to 25% for the II/I BAR, and80% for the II⁄/I⁄ BAR (Table 3).
5.3. Howardites
The four howardite spectra are shown in Fig. 3d (NWA 1942),Fig. 3e (NWA 1943), Fig. 3g (NWA 5748), and Fig. 3h (NWA5751). The howardite spectra also generally follow the trendsfound for the eucrites and diogenites. Reflectance decreases mostdramatically from the <45 to the 45–90 lm size spectra (e.g.,NWA 5748; Fig. 3g), and the 90–250 and 250–500 lm size spectraare comparable to (e.g., NWA 5748; Fig. 3g), or darker than, the 45–90 lm spectra in the visible and 1.4 lm regions (e.g., NWA 1943;Fig. 3e). Band depths increase from the <45 to 45–90 lm spectraand decrease thereafter (Table 3). Band centers are largely invari-ant, varying by <6 nm for band I and <13 nm for band II. The II/IBAR varies by up to 29% for any one howardite, generally increas-ing with increasing grain size (Table 3). The II⁄/I⁄ BAR varies by upto 48% and also generally increases with increasing grain size(Table 3).
5.4. HED slab spectra
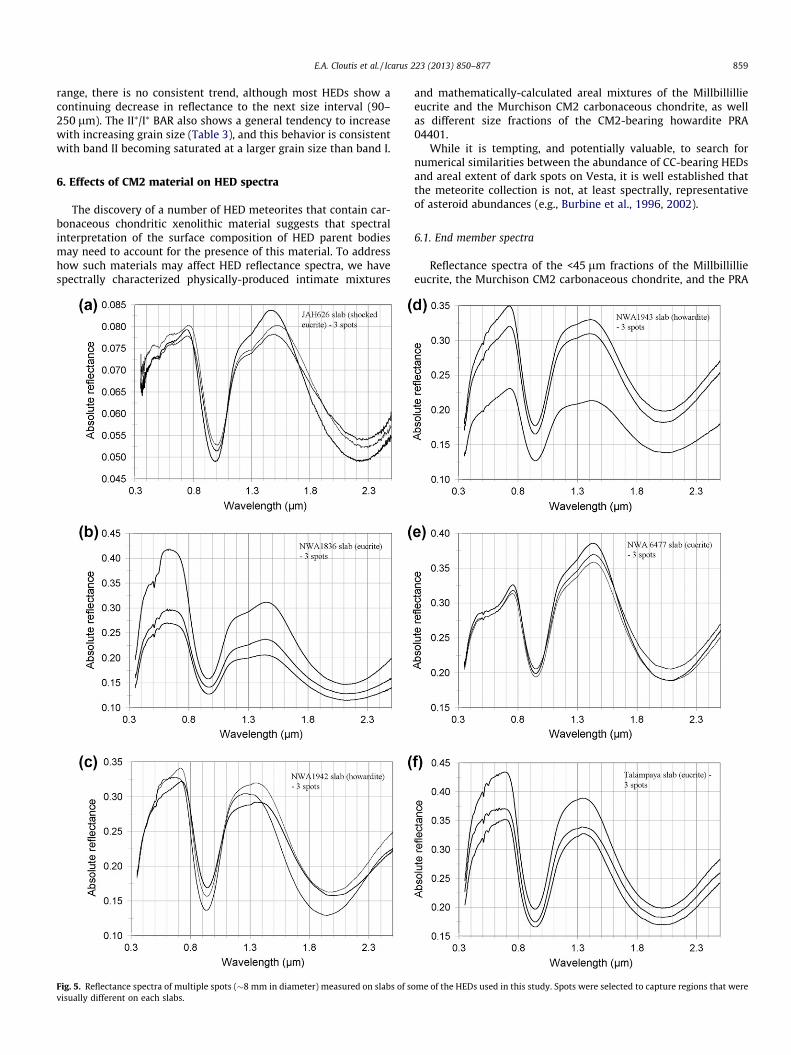
Prior to crushing the samples to produce the various size frac-tions, spot spectra were acquired for each sample at one or threespots based on visual differences, if any. Each spot was �8 mm indiameter. We did not alter the as-received surfaces for the spectralmeasurements. The spot spectra for each slab (Figs. 3 and 5) showthat reflectance, band minima, slope, and shape can vary within asingle sample. Reflectance differences can be attributable to varia-tions in grain size, opaque abundances, or surface roughness. Bandminima variations (e.g., NWA 1942) can be attributable to mineral-ogic variations within a sample, and are expected to be most pre-valent in howardites (Table 3). Spectral shape and slope variationscan be attributable to all of the above factors. What is notable isthat slab reflectance is always lower than reflectance of the<45 lm powders (with the exception of PRA 04401), but can bebrighter than the 45–90 lm powder spectra. Slab spectra are alsoalways more blue-sloped than the <45 lm powder spectra, andusually more blue-sloped than the other powder spectra, as mea-sured by the 1.4/0.7 lm peaks reflectance ratio.
5.5. Group comparisons
The HEDs in this study show some common features as a func-tion of grain size. Both the band I and band II depths increase whengrain size increases from <45 to 45–90 lm (Fig. 6). Band depth is ata maximum for one of the larger grain sizes (45–90, 90–250, or250–500 lm), but no one grain size consistently has the greatestband depth. Band depths for the slab spectra can vary widely com-pared to the powders. Similarly, absolute reflectance of the slabsvaries widely.
From these spectra, it appears that the pyroxene absorptionbands become saturated at different grain sizes: close to an aver-age grain size of 67 lm (45–90 lm) for band I and 148 lm (aver-age of 45–90 and 90–250 lm) for band II, consistent withprevious studies of the behavior of pyroxene absorption bands(Crown and Pieters, 1987; Craig et al., 2007, 2008; Pompilioet al., 2009). Band centers appear to be largely unaffected bychanges in grain size, although the Band II center is almost alwaysdetermined to be at longer wavelengths than for the powders (Ta-ble 3). We believe that this is due to the fact that because the longwavelength wing of band II is incomplete, our continuum does notadequately capture how the long wavelength wing varies betweenslabs and powders. BAR and band width all peak in the intermedi-ate grain sizes (45–90 and 90–250 lm).
Table 3Selected spectral parameters of HEDs included in this study.
Sample Grain size(lm)
Band I center(lm)
Band II center(lm)
Reflectance at 0.56 lm(%)
Band I depth(%)
Band II depth(%)
II/IBAR
II⁄/I⁄BAR
1.4/0.7 lmratio
EucritesJaH 626 <45 0.985 2.141 28 43.5 16.0 0.83 1.04 1.20
45–90 0.989 2.132 15 49.8 26.4 1.09 1.12 1.2490–250 0.991 2.119 11 50.6 33.4 1.32 1.19 1.17250–500 0.991 2.125 12 40.3 24.8 1.25 1.33 1.03Slab 0.988 2.064 8 32.3 18.1 1.21 1.54 1.05
NWA 1836 <45 0.959 2.063 41 57.9 29.1 0.96 0.80 0.9545–90 0.961 2.057 30 62.7 37.2 1.05 0.91 0.8490–250 0.962 2.056 29 61.7 37.3 1.07 0.93 0.84250–500 0.957 2.050 31 63.3 40.4 1.12 0.97 0.77Slab 0.959 2.038 26 47.8 29.6 1.23 1.21 0.76
NWA 6477 <45 0.950 2.021 32 37.7 25.6 1.78 1.15 1.2645–90 0.955 2.011 18 49.5 43.8 2.20 1.31 1.3990–250 0.956 2.013 17 47.7 37.2 1.87 1.34 1.28250–500 0.956 2.003 20 41.6 38.4 2.21 1.52 1.15Slab 0.954 2.022 29 41.0 25.4 1.44 1.99 1.19
Millbillillie <45 0.948 2.027 44 48.3 28.2 1.29 0.88 1.1345–90 0.949 2.021 26 59.7 44.3 1.55 0.94 1.2290–250 0.949 2.024 26 57.4 42.3 1.51 0.90 1.00250–500 0.947 2.021 27 52.3 38.1 1.51 0.80 1.04Slab 0.948 2.022 31 47.5 37.9 1.75 1.49 0.87
Talampaya <45 0.935 1.973 52 48.6 31.9 1.62 1.08 1.0145–90 0.935 1.980 40 62.0 49.1 1.76 1.07 0.9490–250 0.938 1.976 31 66.5 56.6 1.88 1.18 0.85250–500 0.938 1.974 33 43.4 51.2 1.77 1.18 0.85Slab 0.938 1.965 42 52.9 39.8 1.74 1.25 0.90
DiogenitesNWA 2968 <45 1.046 �1.93 16 8.0 2.2 0.15 �0.02 1.00
45–90 1.050 �1.93 11 15.6 2.6 0.10 �0.02 1.0090–250 1.055 �1.95 8 15.0 2.3 �0.1 �0.02 0.95250–500 1.053 �2.05 8 10.1 2.3 �0.1 �0.02 0.86Slab 1.055 �1.95 6 6.9 �0 �0.1 �0.02 0.98
NWA 6013 <45 0.929 1.949 31 42.1 23.4 1.30 0.59 1.0045–90 0.927 1.943 22 66.1 46.3 1.47 0.71 0.9090–250 0.928 1.947 16 56.2 45.2 1.66 0.83 0.88250–500 0.928 1.947 12 49.2 39.3 1.681 1.07 0.84Slab 0.927 1.935 11 24.6 18.3 1.65 1.87 0.67
Tatahouine <45 0.926 1.929 56 63.0 40.8 1.68 1.00 1.0045–90 0.925 1.926 40 80.7 64.7 1.89 1.13 1.0090–250 0.921 1.916 31 80.8 73.4 2.10 1.13 1.00250–500 0.925 1.912 22 78.6 72.0 2.11 1.11 1.06Slab 0.931 1.849 25 63.2 58.0 2.27 1.49 0.96
HowarditesNWA 1942 <45 0.936 1.971 36 45.4 27.9 1.59 0.90 1.06
45–90 0.937 1.966 23 61.0 47.5 1.85 0.98 1.0690–250 0.941 1.973 21 54.7 45.9 2.03 1.12 1.00250–500 0.940 1.969 23 51.4 43.2 2.05 1.10 0.86Slab 0.940 1.969 30 49.6 42.8 2.28 1.43 0.91
NWA 1943 <45 0.944 2.003 36 40.6 24.1 1.49 0.85 1.0745–90 0.944 1.993 27 53.5 38.3 1.62 0.89 1.0890–250 0.945 1.991 22 49.3 38.0 1.78 1.06 1.00250–500 0.947 1.997 23 45.5 34.3 1.75 0.97 0.97Slab 0.942 1.995 29 47.4 34.1 1.73 1.21 0.97
NWA 5748 <45 0.941 1.990 42 40.4 24.9 1.56 1.00 1.0645–90 0.942 1.992 28 55.8 42.8 1.76 1.05 1.0690–250 0.943 1.990 27 49.8 40.5 1.90 1.15 0.98250–500 0.943 2.000 29 43.6 34.4 1.90 1.47 0.96Slab 0.939 1.969 28 40.3 32.2 1.95 1.45 0.91
NWA 5751 <45 0.933 1.954 37 55.0 38.4 1.87 1.12 1.1245–90 0.936 1.952 22 68.1 57.3 2.12 1.10 1.1790–250 0.937 1.955 20 64.1 57.5 2.27 1.45 1.10250–500 0.938 1.953 20 57.1 52.0 2.34 1.45 1.08Slab 0.928 1.893 16 60.1 50.7 2.24 2.07 1.06
858 E.A. Cloutis et al. / Icarus 223 (2013) 850–877
There is also a general tendency for the HED spectra to becomebluer with increasing grain size, as measured by the reflectance ra-tio of the local peaks located near 0.7 and 1.4 lm (Fig. 7), particu-
larly for the eucrites and howardites. Reflectance, as measured at0.56 lm, also shows that this value consistently decreases whengoing from <45 to 45–90 lm size powders (Fig. 8). Beyond this size
E.A. Cloutis et al. / Icarus 223 (2013) 850–877 859
range, there is no consistent trend, although most HEDs show acontinuing decrease in reflectance to the next size interval (90–250 lm). The II⁄/I⁄ BAR also shows a general tendency to increasewith increasing grain size (Table 3), and this behavior is consistentwith band II becoming saturated at a larger grain size than band I.
6. Effects of CM2 material on HED spectra
The discovery of a number of HED meteorites that contain car-bonaceous chondritic xenolithic material suggests that spectralinterpretation of the surface composition of HED parent bodiesmay need to account for the presence of this material. To addresshow such materials may affect HED reflectance spectra, we havespectrally characterized physically-produced intimate mixtures
Fig. 5. Reflectance spectra of multiple spots (�8 mm in diameter) measured on slabs of sovisually different on each slabs.
and mathematically-calculated areal mixtures of the Millbillillieeucrite and the Murchison CM2 carbonaceous chondrite, as wellas different size fractions of the CM2-bearing howardite PRA04401.
While it is tempting, and potentially valuable, to search fornumerical similarities between the abundance of CC-bearing HEDsand areal extent of dark spots on Vesta, it is well established thatthe meteorite collection is not, at least spectrally, representativeof asteroid abundances (e.g., Burbine et al., 1996, 2002).
6.1. End member spectra
Reflectance spectra of the <45 lm fractions of the Millbillillieeucrite, the Murchison CM2 carbonaceous chondrite, and the PRA
me of the HEDs used in this study. Spots were selected to capture regions that were
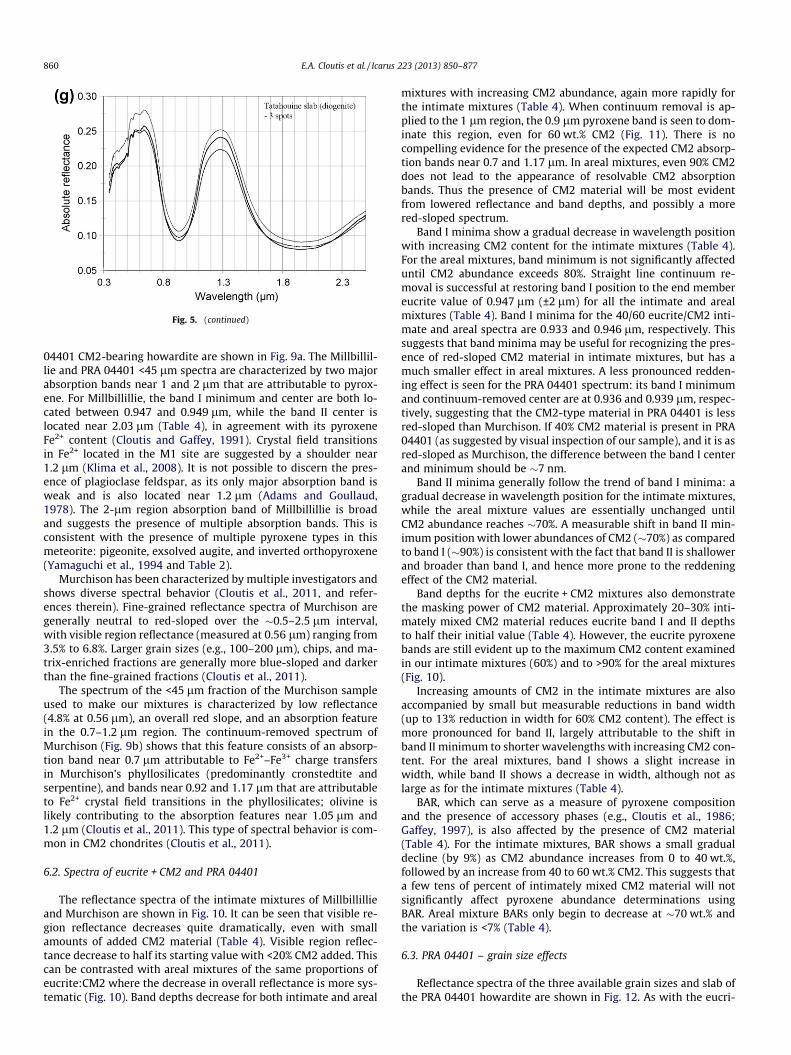
Fig. 5. (continued)
860 E.A. Cloutis et al. / Icarus 223 (2013) 850–877
04401 CM2-bearing howardite are shown in Fig. 9a. The Millbillil-lie and PRA 04401 <45 lm spectra are characterized by two majorabsorption bands near 1 and 2 lm that are attributable to pyrox-ene. For Millbillillie, the band I minimum and center are both lo-cated between 0.947 and 0.949 lm, while the band II center islocated near 2.03 lm (Table 4), in agreement with its pyroxeneFe2+ content (Cloutis and Gaffey, 1991). Crystal field transitionsin Fe2+ located in the M1 site are suggested by a shoulder near1.2 lm (Klima et al., 2008). It is not possible to discern the pres-ence of plagioclase feldspar, as its only major absorption band isweak and is also located near 1.2 lm (Adams and Goullaud,1978). The 2-lm region absorption band of Millbillillie is broadand suggests the presence of multiple absorption bands. This isconsistent with the presence of multiple pyroxene types in thismeteorite: pigeonite, exsolved augite, and inverted orthopyroxene(Yamaguchi et al., 1994 and Table 2).
Murchison has been characterized by multiple investigators andshows diverse spectral behavior (Cloutis et al., 2011, and refer-ences therein). Fine-grained reflectance spectra of Murchison aregenerally neutral to red-sloped over the �0.5–2.5 lm interval,with visible region reflectance (measured at 0.56 lm) ranging from3.5% to 6.8%. Larger grain sizes (e.g., 100–200 lm), chips, and ma-trix-enriched fractions are generally more blue-sloped and darkerthan the fine-grained fractions (Cloutis et al., 2011).
The spectrum of the <45 lm fraction of the Murchison sampleused to make our mixtures is characterized by low reflectance(4.8% at 0.56 lm), an overall red slope, and an absorption featurein the 0.7–1.2 lm region. The continuum-removed spectrum ofMurchison (Fig. 9b) shows that this feature consists of an absorp-tion band near 0.7 lm attributable to Fe2+–Fe3+ charge transfersin Murchison’s phyllosilicates (predominantly cronstedtite andserpentine), and bands near 0.92 and 1.17 lm that are attributableto Fe2+ crystal field transitions in the phyllosilicates; olivine islikely contributing to the absorption features near 1.05 lm and1.2 lm (Cloutis et al., 2011). This type of spectral behavior is com-mon in CM2 chondrites (Cloutis et al., 2011).
6.2. Spectra of eucrite + CM2 and PRA 04401
The reflectance spectra of the intimate mixtures of Millbillillieand Murchison are shown in Fig. 10. It can be seen that visible re-gion reflectance decreases quite dramatically, even with smallamounts of added CM2 material (Table 4). Visible region reflec-tance decrease to half its starting value with <20% CM2 added. Thiscan be contrasted with areal mixtures of the same proportions ofeucrite:CM2 where the decrease in overall reflectance is more sys-tematic (Fig. 10). Band depths decrease for both intimate and areal
mixtures with increasing CM2 abundance, again more rapidly forthe intimate mixtures (Table 4). When continuum removal is ap-plied to the 1 lm region, the 0.9 lm pyroxene band is seen to dom-inate this region, even for 60 wt.% CM2 (Fig. 11). There is nocompelling evidence for the presence of the expected CM2 absorp-tion bands near 0.7 and 1.17 lm. In areal mixtures, even 90% CM2does not lead to the appearance of resolvable CM2 absorptionbands. Thus the presence of CM2 material will be most evidentfrom lowered reflectance and band depths, and possibly a morered-sloped spectrum.
Band I minima show a gradual decrease in wavelength positionwith increasing CM2 content for the intimate mixtures (Table 4).For the areal mixtures, band minimum is not significantly affecteduntil CM2 abundance exceeds 80%. Straight line continuum re-moval is successful at restoring band I position to the end membereucrite value of 0.947 lm (±2 lm) for all the intimate and arealmixtures (Table 4). Band I minima for the 40/60 eucrite/CM2 inti-mate and areal spectra are 0.933 and 0.946 lm, respectively. Thissuggests that band minima may be useful for recognizing the pres-ence of red-sloped CM2 material in intimate mixtures, but has amuch smaller effect in areal mixtures. A less pronounced redden-ing effect is seen for the PRA 04401 spectrum: its band I minimumand continuum-removed center are at 0.936 and 0.939 lm, respec-tively, suggesting that the CM2-type material in PRA 04401 is lessred-sloped than Murchison. If 40% CM2 material is present in PRA04401 (as suggested by visual inspection of our sample), and it is asred-sloped as Murchison, the difference between the band I centerand minimum should be �7 nm.
Band II minima generally follow the trend of band I minima: agradual decrease in wavelength position for the intimate mixtures,while the areal mixture values are essentially unchanged untilCM2 abundance reaches �70%. A measurable shift in band II min-imum position with lower abundances of CM2 (�70%) as comparedto band I (�90%) is consistent with the fact that band II is shallowerand broader than band I, and hence more prone to the reddeningeffect of the CM2 material.
Band depths for the eucrite + CM2 mixtures also demonstratethe masking power of CM2 material. Approximately 20–30% inti-mately mixed CM2 material reduces eucrite band I and II depthsto half their initial value (Table 4). However, the eucrite pyroxenebands are still evident up to the maximum CM2 content examinedin our intimate mixtures (60%) and to >90% for the areal mixtures(Fig. 10).
Increasing amounts of CM2 in the intimate mixtures are alsoaccompanied by small but measurable reductions in band width(up to 13% reduction in width for 60% CM2 content). The effect ismore pronounced for band II, largely attributable to the shift inband II minimum to shorter wavelengths with increasing CM2 con-tent. For the areal mixtures, band I shows a slight increase inwidth, while band II shows a decrease in width, although not aslarge as for the intimate mixtures (Table 4).
BAR, which can serve as a measure of pyroxene compositionand the presence of accessory phases (e.g., Cloutis et al., 1986;Gaffey, 1997), is also affected by the presence of CM2 material(Table 4). For the intimate mixtures, BAR shows a small gradualdecline (by 9%) as CM2 abundance increases from 0 to 40 wt.%,followed by an increase from 40 to 60 wt.% CM2. This suggests thata few tens of percent of intimately mixed CM2 material will notsignificantly affect pyroxene abundance determinations usingBAR. Areal mixture BARs only begin to decrease at �70 wt.% andthe variation is <7% (Table 4).
6.3. PRA 04401 – grain size effects
Reflectance spectra of the three available grain sizes and slab ofthe PRA 04401 howardite are shown in Fig. 12. As with the eucri-
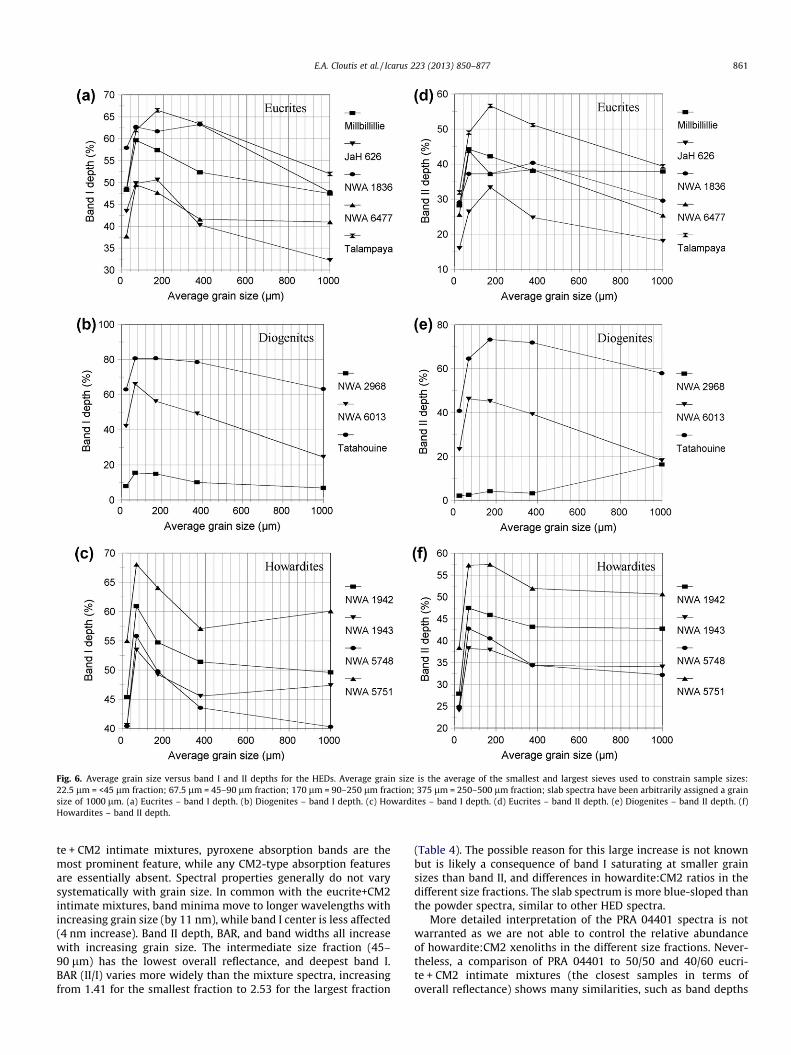
Fig. 6. Average grain size versus band I and II depths for the HEDs. Average grain size is the average of the smallest and largest sieves used to constrain sample sizes:22.5 lm = <45 lm fraction; 67.5 lm = 45–90 lm fraction; 170 lm = 90–250 lm fraction; 375 lm = 250–500 lm fraction; slab spectra have been arbitrarily assigned a grainsize of 1000 lm. (a) Eucrites – band I depth. (b) Diogenites – band I depth. (c) Howardites – band I depth. (d) Eucrites – band II depth. (e) Diogenites – band II depth. (f)Howardites – band II depth.
E.A. Cloutis et al. / Icarus 223 (2013) 850–877 861
te + CM2 intimate mixtures, pyroxene absorption bands are themost prominent feature, while any CM2-type absorption featuresare essentially absent. Spectral properties generally do not varysystematically with grain size. In common with the eucrite+CM2intimate mixtures, band minima move to longer wavelengths withincreasing grain size (by 11 nm), while band I center is less affected(4 nm increase). Band II depth, BAR, and band widths all increasewith increasing grain size. The intermediate size fraction (45–90 lm) has the lowest overall reflectance, and deepest band I.BAR (II/I) varies more widely than the mixture spectra, increasingfrom 1.41 for the smallest fraction to 2.53 for the largest fraction
(Table 4). The possible reason for this large increase is not knownbut is likely a consequence of band I saturating at smaller grainsizes than band II, and differences in howardite:CM2 ratios in thedifferent size fractions. The slab spectrum is more blue-sloped thanthe powder spectra, similar to other HED spectra.
More detailed interpretation of the PRA 04401 spectra is notwarranted as we are not able to control the relative abundanceof howardite:CM2 xenoliths in the different size fractions. Never-theless, a comparison of PRA 04401 to 50/50 and 40/60 eucri-te + CM2 intimate mixtures (the closest samples in terms ofoverall reflectance) shows many similarities, such as band depths
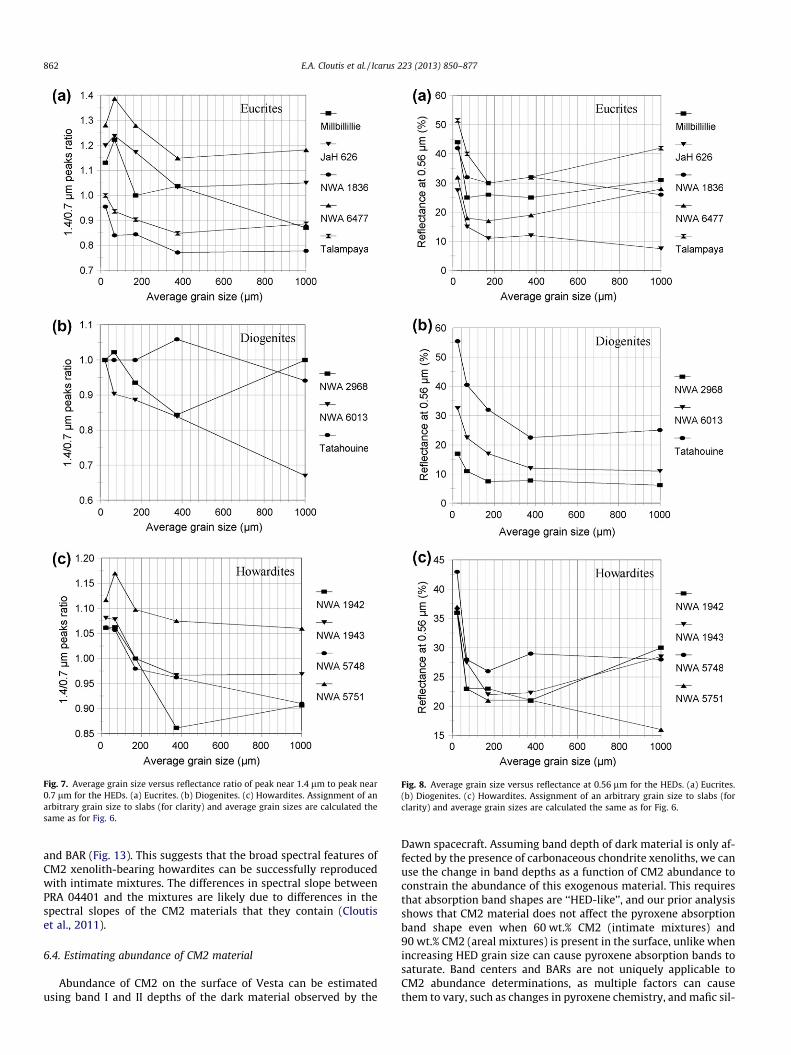
Fig. 7. Average grain size versus reflectance ratio of peak near 1.4 lm to peak near0.7 lm for the HEDs. (a) Eucrites. (b) Diogenites. (c) Howardites. Assignment of anarbitrary grain size to slabs (for clarity) and average grain sizes are calculated thesame as for Fig. 6.
Fig. 8. Average grain size versus reflectance at 0.56 lm for the HEDs. (a) Eucrites.(b) Diogenites. (c) Howardites. Assignment of an arbitrary grain size to slabs (forclarity) and average grain sizes are calculated the same as for Fig. 6.
862 E.A. Cloutis et al. / Icarus 223 (2013) 850–877
and BAR (Fig. 13). This suggests that the broad spectral features ofCM2 xenolith-bearing howardites can be successfully reproducedwith intimate mixtures. The differences in spectral slope betweenPRA 04401 and the mixtures are likely due to differences in thespectral slopes of the CM2 materials that they contain (Cloutiset al., 2011).
6.4. Estimating abundance of CM2 material
Abundance of CM2 on the surface of Vesta can be estimatedusing band I and II depths of the dark material observed by the
Dawn spacecraft. Assuming band depth of dark material is only af-fected by the presence of carbonaceous chondrite xenoliths, we canuse the change in band depths as a function of CM2 abundance toconstrain the abundance of this exogenous material. This requiresthat absorption band shapes are ‘‘HED-like’’, and our prior analysisshows that CM2 material does not affect the pyroxene absorptionband shape even when 60 wt.% CM2 (intimate mixtures) and90 wt.% CM2 (areal mixtures) is present in the surface, unlike whenincreasing HED grain size can cause pyroxene absorption bands tosaturate. Band centers and BARs are not uniquely applicable toCM2 abundance determinations, as multiple factors can causethem to vary, such as changes in pyroxene chemistry, and mafic sil-
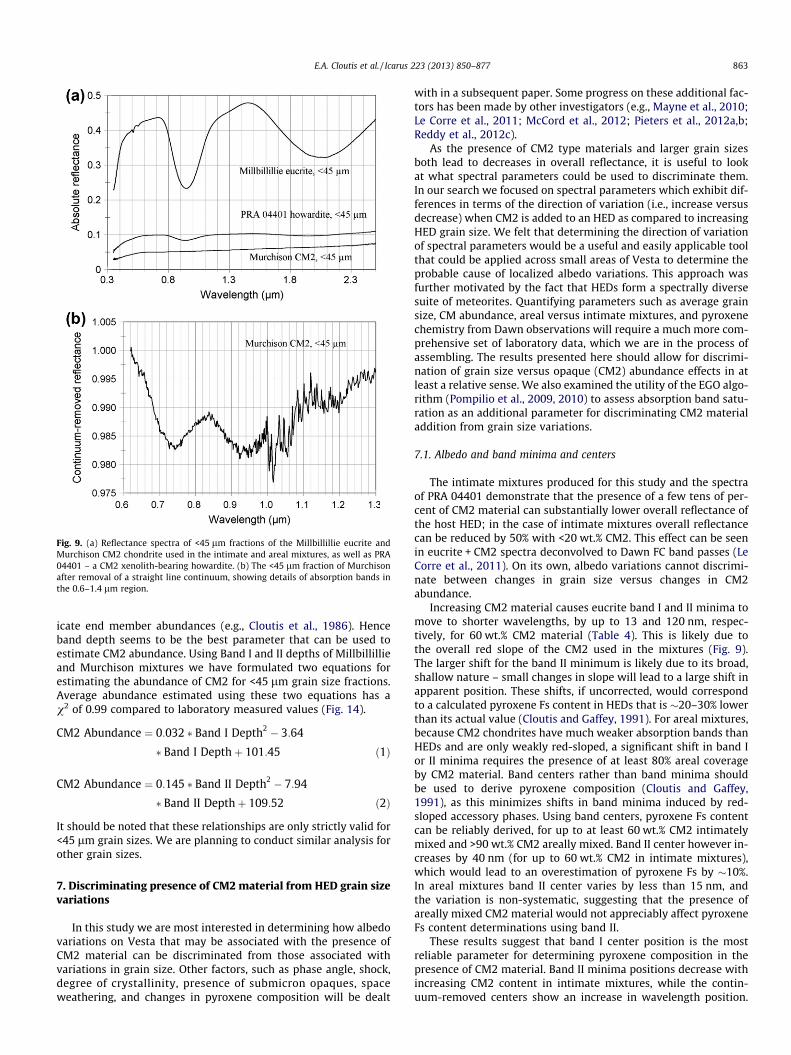
Fig. 9. (a) Reflectance spectra of <45 lm fractions of the Millbillillie eucrite andMurchison CM2 chondrite used in the intimate and areal mixtures, as well as PRA04401 – a CM2 xenolith-bearing howardite. (b) The <45 lm fraction of Murchisonafter removal of a straight line continuum, showing details of absorption bands inthe 0.6–1.4 lm region.
E.A. Cloutis et al. / Icarus 223 (2013) 850–877 863
icate end member abundances (e.g., Cloutis et al., 1986). Henceband depth seems to be the best parameter that can be used toestimate CM2 abundance. Using Band I and II depths of Millbillillieand Murchison mixtures we have formulated two equations forestimating the abundance of CM2 for <45 lm grain size fractions.Average abundance estimated using these two equations has av2 of 0.99 compared to laboratory measured values (Fig. 14).
CM2 Abundance ¼ 0:032 � Band I Depth2 � 3:64
� Band I Depthþ 101:45 ð1Þ
CM2 Abundance ¼ 0:145 � Band II Depth2 � 7:94
� Band II Depthþ 109:52 ð2Þ
It should be noted that these relationships are only strictly valid for<45 lm grain sizes. We are planning to conduct similar analysis forother grain sizes.
7. Discriminating presence of CM2 material from HED grain sizevariations
In this study we are most interested in determining how albedovariations on Vesta that may be associated with the presence ofCM2 material can be discriminated from those associated withvariations in grain size. Other factors, such as phase angle, shock,degree of crystallinity, presence of submicron opaques, spaceweathering, and changes in pyroxene composition will be dealt
with in a subsequent paper. Some progress on these additional fac-tors has been made by other investigators (e.g., Mayne et al., 2010;Le Corre et al., 2011; McCord et al., 2012; Pieters et al., 2012a,b;Reddy et al., 2012c).
As the presence of CM2 type materials and larger grain sizesboth lead to decreases in overall reflectance, it is useful to lookat what spectral parameters could be used to discriminate them.In our search we focused on spectral parameters which exhibit dif-ferences in terms of the direction of variation (i.e., increase versusdecrease) when CM2 is added to an HED as compared to increasingHED grain size. We felt that determining the direction of variationof spectral parameters would be a useful and easily applicable toolthat could be applied across small areas of Vesta to determine theprobable cause of localized albedo variations. This approach wasfurther motivated by the fact that HEDs form a spectrally diversesuite of meteorites. Quantifying parameters such as average grainsize, CM abundance, areal versus intimate mixtures, and pyroxenechemistry from Dawn observations will require a much more com-prehensive set of laboratory data, which we are in the process ofassembling. The results presented here should allow for discrimi-nation of grain size versus opaque (CM2) abundance effects in atleast a relative sense. We also examined the utility of the EGO algo-rithm (Pompilio et al., 2009, 2010) to assess absorption band satu-ration as an additional parameter for discriminating CM2 materialaddition from grain size variations.
7.1. Albedo and band minima and centers
The intimate mixtures produced for this study and the spectraof PRA 04401 demonstrate that the presence of a few tens of per-cent of CM2 material can substantially lower overall reflectance ofthe host HED; in the case of intimate mixtures overall reflectancecan be reduced by 50% with <20 wt.% CM2. This effect can be seenin eucrite + CM2 spectra deconvolved to Dawn FC band passes (LeCorre et al., 2011). On its own, albedo variations cannot discrimi-nate between changes in grain size versus changes in CM2abundance.
Increasing CM2 material causes eucrite band I and II minima tomove to shorter wavelengths, by up to 13 and 120 nm, respec-tively, for 60 wt.% CM2 material (Table 4). This is likely due tothe overall red slope of the CM2 used in the mixtures (Fig. 9).The larger shift for the band II minimum is likely due to its broad,shallow nature – small changes in slope will lead to a large shift inapparent position. These shifts, if uncorrected, would correspondto a calculated pyroxene Fs content in HEDs that is �20–30% lowerthan its actual value (Cloutis and Gaffey, 1991). For areal mixtures,because CM2 chondrites have much weaker absorption bands thanHEDs and are only weakly red-sloped, a significant shift in band Ior II minima requires the presence of at least 80% areal coverageby CM2 material. Band centers rather than band minima shouldbe used to derive pyroxene composition (Cloutis and Gaffey,1991), as this minimizes shifts in band minima induced by red-sloped accessory phases. Using band centers, pyroxene Fs contentcan be reliably derived, for up to at least 60 wt.% CM2 intimatelymixed and >90 wt.% CM2 areally mixed. Band II center however in-creases by 40 nm (for up to 60 wt.% CM2 in intimate mixtures),which would lead to an overestimation of pyroxene Fs by �10%.In areal mixtures band II center varies by less than 15 nm, andthe variation is non-systematic, suggesting that the presence ofareally mixed CM2 material would not appreciably affect pyroxeneFs content determinations using band II.
These results suggest that band I center position is the mostreliable parameter for determining pyroxene composition in thepresence of CM2 material. Band II minima positions decrease withincreasing CM2 content in intimate mixtures, while the contin-uum-removed centers show an increase in wavelength position.
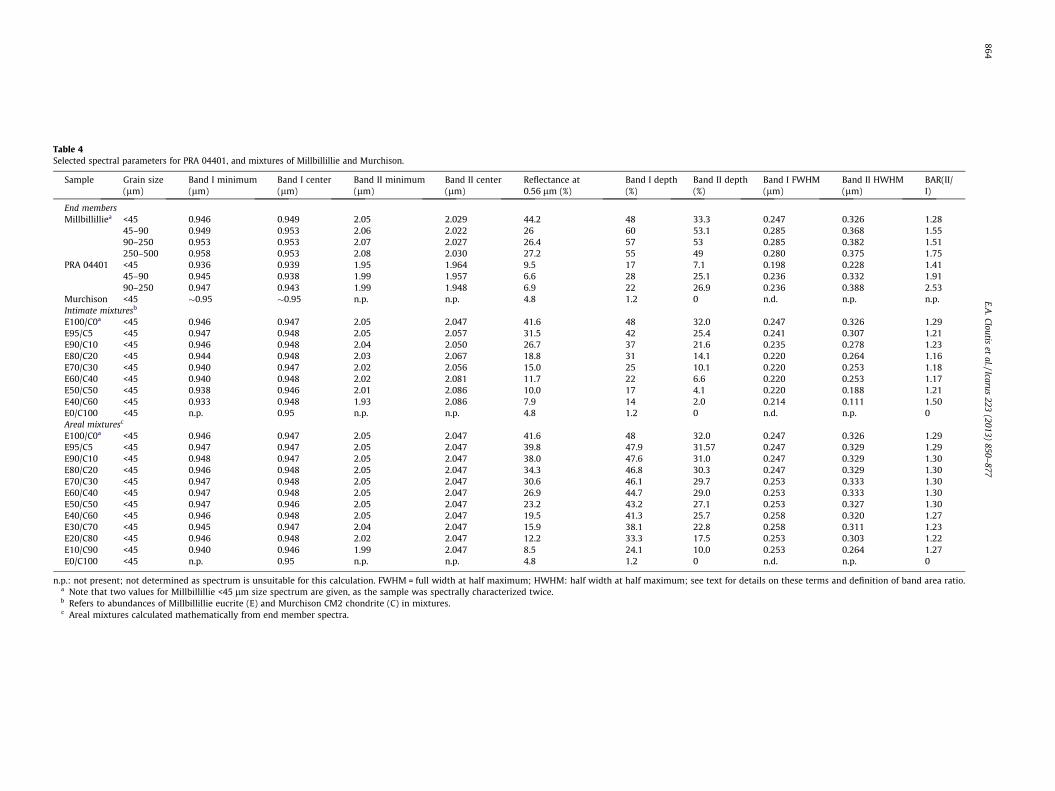
Table 4Selected spectral parameters for PRA 04401, and mixtures of Millbillillie and Murchison.
Sample Grain size(lm)
Band I minimum(lm)
Band I center(lm)
Band II minimum(lm)
Band II center(lm)
Reflectance at0.56 lm (%)
Band I depth(%)
Band II depth(%)
Band I FWHM(lm)
Band II HWHM(lm)
BAR(II/I)
End membersMillbillilliea <45 0.946 0.949 2.05 2.029 44.2 48 33.3 0.247 0.326 1.28
45–90 0.949 0.953 2.06 2.022 26 60 53.1 0.285 0.368 1.5590–250 0.953 0.953 2.07 2.027 26.4 57 53 0.285 0.382 1.51250–500 0.958 0.953 2.08 2.030 27.2 55 49 0.280 0.375 1.75
PRA 04401 <45 0.936 0.939 1.95 1.964 9.5 17 7.1 0.198 0.228 1.4145–90 0.945 0.938 1.99 1.957 6.6 28 25.1 0.236 0.332 1.9190–250 0.947 0.943 1.99 1.948 6.9 22 26.9 0.236 0.388 2.53
Murchison <45 �0.95 �0.95 n.p. n.p. 4.8 1.2 0 n.d. n.p. n.p.Intimate mixturesb
E100/C0a <45 0.946 0.947 2.05 2.047 41.6 48 32.0 0.247 0.326 1.29E95/C5 <45 0.947 0.948 2.05 2.057 31.5 42 25.4 0.241 0.307 1.21E90/C10 <45 0.946 0.948 2.04 2.050 26.7 37 21.6 0.235 0.278 1.23E80/C20 <45 0.944 0.948 2.03 2.067 18.8 31 14.1 0.220 0.264 1.16E70/C30 <45 0.940 0.947 2.02 2.056 15.0 25 10.1 0.220 0.253 1.18E60/C40 <45 0.940 0.948 2.02 2.081 11.7 22 6.6 0.220 0.253 1.17E50/C50 <45 0.938 0.946 2.01 2.086 10.0 17 4.1 0.220 0.188 1.21E40/C60 <45 0.933 0.948 1.93 2.086 7.9 14 2.0 0.214 0.111 1.50E0/C100 <45 n.p. 0.95 n.p. n.p. 4.8 1.2 0 n.d. n.p. 0Areal mixturesc
E100/C0a <45 0.946 0.947 2.05 2.047 41.6 48 32.0 0.247 0.326 1.29E95/C5 <45 0.947 0.947 2.05 2.047 39.8 47.9 31.57 0.247 0.329 1.29E90/C10 <45 0.948 0.947 2.05 2.047 38.0 47.6 31.0 0.247 0.329 1.30E80/C20 <45 0.946 0.948 2.05 2.047 34.3 46.8 30.3 0.247 0.329 1.30E70/C30 <45 0.947 0.948 2.05 2.047 30.6 46.1 29.7 0.253 0.333 1.30E60/C40 <45 0.947 0.948 2.05 2.047 26.9 44.7 29.0 0.253 0.333 1.30E50/C50 <45 0.947 0.946 2.05 2.047 23.2 43.2 27.1 0.253 0.327 1.30E40/C60 <45 0.946 0.948 2.05 2.047 19.5 41.3 25.7 0.258 0.320 1.27E30/C70 <45 0.945 0.947 2.04 2.047 15.9 38.1 22.8 0.258 0.311 1.23E20/C80 <45 0.946 0.948 2.02 2.047 12.2 33.3 17.5 0.253 0.303 1.22E10/C90 <45 0.940 0.946 1.99 2.047 8.5 24.1 10.0 0.253 0.264 1.27E0/C100 <45 n.p. 0.95 n.p. n.p. 4.8 1.2 0 n.d. n.p. 0
n.p.: not present; not determined as spectrum is unsuitable for this calculation. FWHM = full width at half maximum; HWHM: half width at half maximum; see text for details on these terms and definition of band area ratio.a Note that two values for Millbillillie <45 lm size spectrum are given, as the sample was spectrally characterized twice.b Refers to abundances of Millbillillie eucrite (E) and Murchison CM2 chondrite (C) in mixtures.c Areal mixtures calculated mathematically from end member spectra.
864E.A
.Cloutiset
al./Icarus223
(2013)850–
877
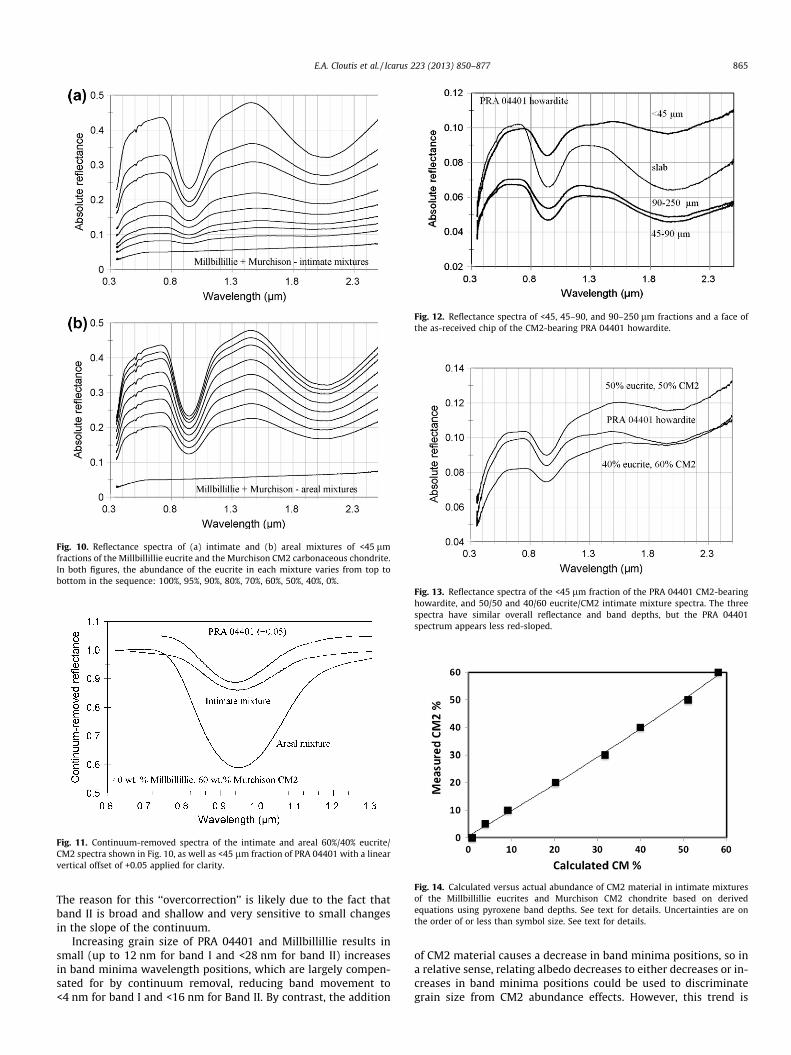
Fig. 10. Reflectance spectra of (a) intimate and (b) areal mixtures of <45 lmfractions of the Millbillillie eucrite and the Murchison CM2 carbonaceous chondrite.In both figures, the abundance of the eucrite in each mixture varies from top tobottom in the sequence: 100%, 95%, 90%, 80%, 70%, 60%, 50%, 40%, 0%.
Fig. 11. Continuum-removed spectra of the intimate and areal 60%/40% eucrite/CM2 spectra shown in Fig. 10, as well as <45 lm fraction of PRA 04401 with a linearvertical offset of +0.05 applied for clarity.
Fig. 12. Reflectance spectra of <45, 45–90, and 90–250 lm fractions and a face ofthe as-received chip of the CM2-bearing PRA 04401 howardite.
Fig. 14. Calculated versus actual abundance of CM2 material in intimate mixturesof the Millbillillie eucrites and Murchison CM2 chondrite based on derivedequations using pyroxene band depths. See text for details. Uncertainties are onthe order of or less than symbol size. See text for details.
Fig. 13. Reflectance spectra of the <45 lm fraction of the PRA 04401 CM2-bearinghowardite, and 50/50 and 40/60 eucrite/CM2 intimate mixture spectra. The threespectra have similar overall reflectance and band depths, but the PRA 04401spectrum appears less red-sloped.
E.A. Cloutis et al. / Icarus 223 (2013) 850–877 865
The reason for this ‘‘overcorrection’’ is likely due to the fact thatband II is broad and shallow and very sensitive to small changesin the slope of the continuum.
Increasing grain size of PRA 04401 and Millbillillie results insmall (up to 12 nm for band I and <28 nm for band II) increasesin band minima wavelength positions, which are largely compen-sated for by continuum removal, reducing band movement to<4 nm for band I and <16 nm for Band II. By contrast, the addition
of CM2 material causes a decrease in band minima positions, so ina relative sense, relating albedo decreases to either decreases or in-creases in band minima positions could be used to discriminategrain size from CM2 abundance effects. However, this trend is
866 E.A. Cloutis et al. / Icarus 223 (2013) 850–877
likely restricted to carbonaceous chondrite xenoliths that are redsloped. Comparison of the PRA 04401 spectrum to that of the eucri-te + CM2 mixtures that are closest in terms of overall reflectance(Fig. 13) shows that PRA 04401 appears less red-sloped than themixtures, suggesting that the carbonaceous material in PRA04401 is less red-sloped than our sample of Murchison. This ismost evident in the 1.5–2.5 lm region of Fig. 13.
7.2. Absorption band depths and widths
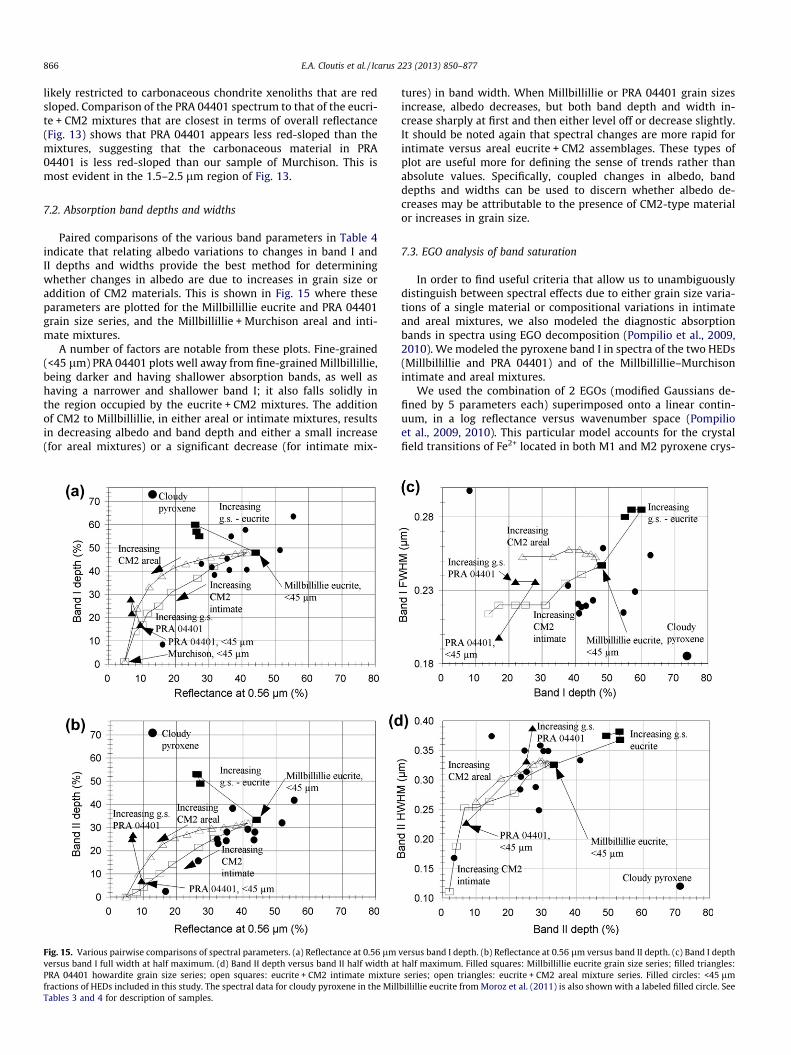
Paired comparisons of the various band parameters in Table 4indicate that relating albedo variations to changes in band I andII depths and widths provide the best method for determiningwhether changes in albedo are due to increases in grain size oraddition of CM2 materials. This is shown in Fig. 15 where theseparameters are plotted for the Millbillillie eucrite and PRA 04401grain size series, and the Millbillillie + Murchison areal and inti-mate mixtures.
A number of factors are notable from these plots. Fine-grained(<45 lm) PRA 04401 plots well away from fine-grained Millbillillie,being darker and having shallower absorption bands, as well ashaving a narrower and shallower band I; it also falls solidly inthe region occupied by the eucrite + CM2 mixtures. The additionof CM2 to Millbillillie, in either areal or intimate mixtures, resultsin decreasing albedo and band depth and either a small increase(for areal mixtures) or a significant decrease (for intimate mix-
Fig. 15. Various pairwise comparisons of spectral parameters. (a) Reflectance at 0.56 lmversus band I full width at half maximum. (d) Band II depth versus band II half width atPRA 04401 howardite grain size series; open squares: eucrite + CM2 intimate mixturefractions of HEDs included in this study. The spectral data for cloudy pyroxene in the MillTables 3 and 4 for description of samples.
tures) in band width. When Millbillillie or PRA 04401 grain sizesincrease, albedo decreases, but both band depth and width in-crease sharply at first and then either level off or decrease slightly.It should be noted again that spectral changes are more rapid forintimate versus areal eucrite + CM2 assemblages. These types ofplot are useful more for defining the sense of trends rather thanabsolute values. Specifically, coupled changes in albedo, banddepths and widths can be used to discern whether albedo de-creases may be attributable to the presence of CM2-type materialor increases in grain size.
7.3. EGO analysis of band saturation
In order to find useful criteria that allow us to unambiguouslydistinguish between spectral effects due to either grain size varia-tions of a single material or compositional variations in intimateand areal mixtures, we also modeled the diagnostic absorptionbands in spectra using EGO decomposition (Pompilio et al., 2009,2010). We modeled the pyroxene band I in spectra of the two HEDs(Millbillillie and PRA 04401) and of the Millbillillie–Murchisonintimate and areal mixtures.
We used the combination of 2 EGOs (modified Gaussians de-fined by 5 parameters each) superimposed onto a linear contin-uum, in a log reflectance versus wavenumber space (Pompilioet al., 2009, 2010). This particular model accounts for the crystalfield transitions of Fe2+ located in both M1 and M2 pyroxene crys-
versus band I depth. (b) Reflectance at 0.56 lm versus band II depth. (c) Band I depthhalf maximum. Filled squares: Millbillillie eucrite grain size series; filled triangles:series; open triangles: eucrite + CM2 areal mixture series. Filled circles: <45 lm
billillie eucrite from Moroz et al. (2011) is also shown with a labeled filled circle. See
E.A. Cloutis et al. / Icarus 223 (2013) 850–877 867
tallographic sites in the Millbillillie eucrite. The pyroxene band I inPRA 04401 has been modeled using a single EGO superimposedonto a linear continuum since there is no evidence of Fe2+ M1 sitecrystal field transitions. The continua were fixed tangent to the twomaxima around the main absorption features to be modeled, whilethe EGO’s parameters were allowed to change during the optimiza-tion routine.
We did not model pyroxene band II because none of the mea-sured spectra show the band termination toward longer wave-lengths (Fig. 10). This condition limits the modeling because wecannot correctly define the continuum, and in turn the model accu-racy is compromised. In addition, the spectrum of the fine-grainedMurchison CM2 carbonaceous chondrite has not been modeled be-cause it does not show the diagnostic bands of pyroxene. There-fore, the results listed in Table 5 show the behavior of pyroxeneband I as a function of grain size and composition of the mixtures.We list only the parameters retrieved for the component attribut-able to Fe2+ in M2 sites.
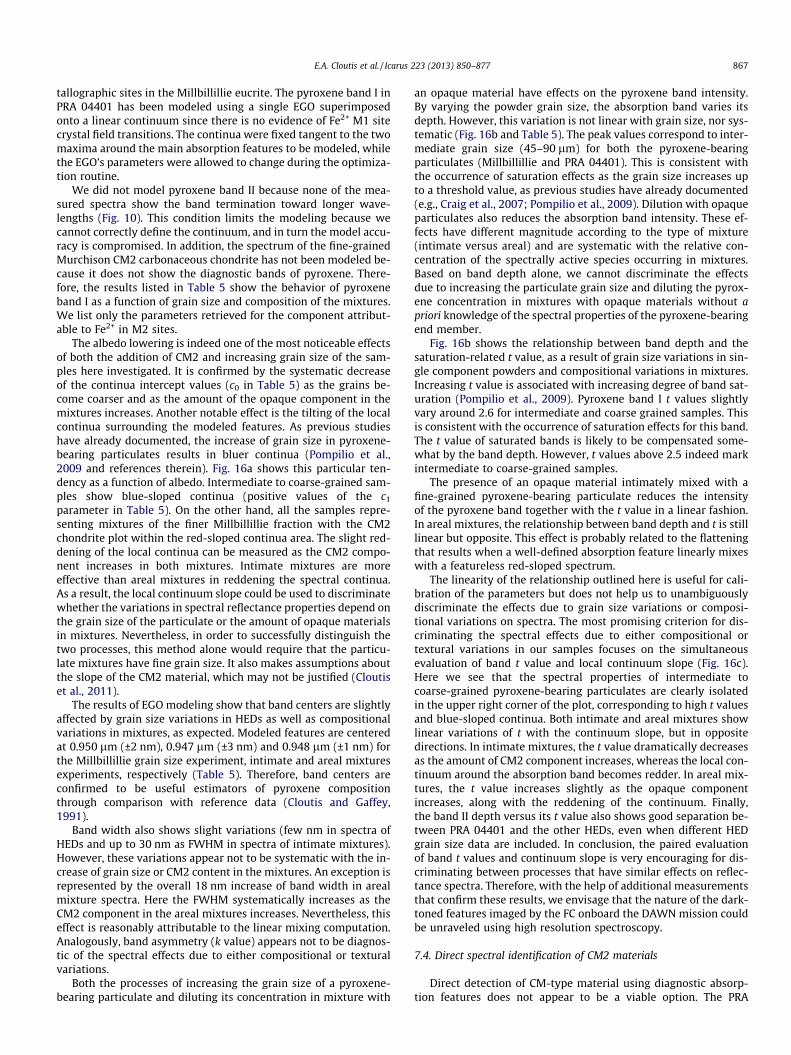
The albedo lowering is indeed one of the most noticeable effectsof both the addition of CM2 and increasing grain size of the sam-ples here investigated. It is confirmed by the systematic decreaseof the continua intercept values (c0 in Table 5) as the grains be-come coarser and as the amount of the opaque component in themixtures increases. Another notable effect is the tilting of the localcontinua surrounding the modeled features. As previous studieshave already documented, the increase of grain size in pyroxene-bearing particulates results in bluer continua (Pompilio et al.,2009 and references therein). Fig. 16a shows this particular ten-dency as a function of albedo. Intermediate to coarse-grained sam-ples show blue-sloped continua (positive values of the c1
parameter in Table 5). On the other hand, all the samples repre-senting mixtures of the finer Millbillillie fraction with the CM2chondrite plot within the red-sloped continua area. The slight red-dening of the local continua can be measured as the CM2 compo-nent increases in both mixtures. Intimate mixtures are moreeffective than areal mixtures in reddening the spectral continua.As a result, the local continuum slope could be used to discriminatewhether the variations in spectral reflectance properties depend onthe grain size of the particulate or the amount of opaque materialsin mixtures. Nevertheless, in order to successfully distinguish thetwo processes, this method alone would require that the particu-late mixtures have fine grain size. It also makes assumptions aboutthe slope of the CM2 material, which may not be justified (Cloutiset al., 2011).
The results of EGO modeling show that band centers are slightlyaffected by grain size variations in HEDs as well as compositionalvariations in mixtures, as expected. Modeled features are centeredat 0.950 lm (±2 nm), 0.947 lm (±3 nm) and 0.948 lm (±1 nm) forthe Millbillillie grain size experiment, intimate and areal mixturesexperiments, respectively (Table 5). Therefore, band centers areconfirmed to be useful estimators of pyroxene compositionthrough comparison with reference data (Cloutis and Gaffey,1991).
Band width also shows slight variations (few nm in spectra ofHEDs and up to 30 nm as FWHM in spectra of intimate mixtures).However, these variations appear not to be systematic with the in-crease of grain size or CM2 content in the mixtures. An exception isrepresented by the overall 18 nm increase of band width in arealmixture spectra. Here the FWHM systematically increases as theCM2 component in the areal mixtures increases. Nevertheless, thiseffect is reasonably attributable to the linear mixing computation.Analogously, band asymmetry (k value) appears not to be diagnos-tic of the spectral effects due to either compositional or texturalvariations.
Both the processes of increasing the grain size of a pyroxene-bearing particulate and diluting its concentration in mixture with
an opaque material have effects on the pyroxene band intensity.By varying the powder grain size, the absorption band varies itsdepth. However, this variation is not linear with grain size, nor sys-tematic (Fig. 16b and Table 5). The peak values correspond to inter-mediate grain size (45–90 lm) for both the pyroxene-bearingparticulates (Millbillillie and PRA 04401). This is consistent withthe occurrence of saturation effects as the grain size increases upto a threshold value, as previous studies have already documented(e.g., Craig et al., 2007; Pompilio et al., 2009). Dilution with opaqueparticulates also reduces the absorption band intensity. These ef-fects have different magnitude according to the type of mixture(intimate versus areal) and are systematic with the relative con-centration of the spectrally active species occurring in mixtures.Based on band depth alone, we cannot discriminate the effectsdue to increasing the particulate grain size and diluting the pyrox-ene concentration in mixtures with opaque materials without apriori knowledge of the spectral properties of the pyroxene-bearingend member.
Fig. 16b shows the relationship between band depth and thesaturation-related t value, as a result of grain size variations in sin-gle component powders and compositional variations in mixtures.Increasing t value is associated with increasing degree of band sat-uration (Pompilio et al., 2009). Pyroxene band I t values slightlyvary around 2.6 for intermediate and coarse grained samples. Thisis consistent with the occurrence of saturation effects for this band.The t value of saturated bands is likely to be compensated some-what by the band depth. However, t values above 2.5 indeed markintermediate to coarse-grained samples.
The presence of an opaque material intimately mixed with afine-grained pyroxene-bearing particulate reduces the intensityof the pyroxene band together with the t value in a linear fashion.In areal mixtures, the relationship between band depth and t is stilllinear but opposite. This effect is probably related to the flatteningthat results when a well-defined absorption feature linearly mixeswith a featureless red-sloped spectrum.
The linearity of the relationship outlined here is useful for cali-bration of the parameters but does not help us to unambiguouslydiscriminate the effects due to grain size variations or composi-tional variations on spectra. The most promising criterion for dis-criminating the spectral effects due to either compositional ortextural variations in our samples focuses on the simultaneousevaluation of band t value and local continuum slope (Fig. 16c).Here we see that the spectral properties of intermediate tocoarse-grained pyroxene-bearing particulates are clearly isolatedin the upper right corner of the plot, corresponding to high t valuesand blue-sloped continua. Both intimate and areal mixtures showlinear variations of t with the continuum slope, but in oppositedirections. In intimate mixtures, the t value dramatically decreasesas the amount of CM2 component increases, whereas the local con-tinuum around the absorption band becomes redder. In areal mix-tures, the t value increases slightly as the opaque componentincreases, along with the reddening of the continuum. Finally,the band II depth versus its t value also shows good separation be-tween PRA 04401 and the other HEDs, even when different HEDgrain size data are included. In conclusion, the paired evaluationof band t values and continuum slope is very encouraging for dis-criminating between processes that have similar effects on reflec-tance spectra. Therefore, with the help of additional measurementsthat confirm these results, we envisage that the nature of the dark-toned features imaged by the FC onboard the DAWN mission couldbe unraveled using high resolution spectroscopy.
7.4. Direct spectral identification of CM2 materials
Direct detection of CM-type material using diagnostic absorp-tion features does not appear to be a viable option. The PRA
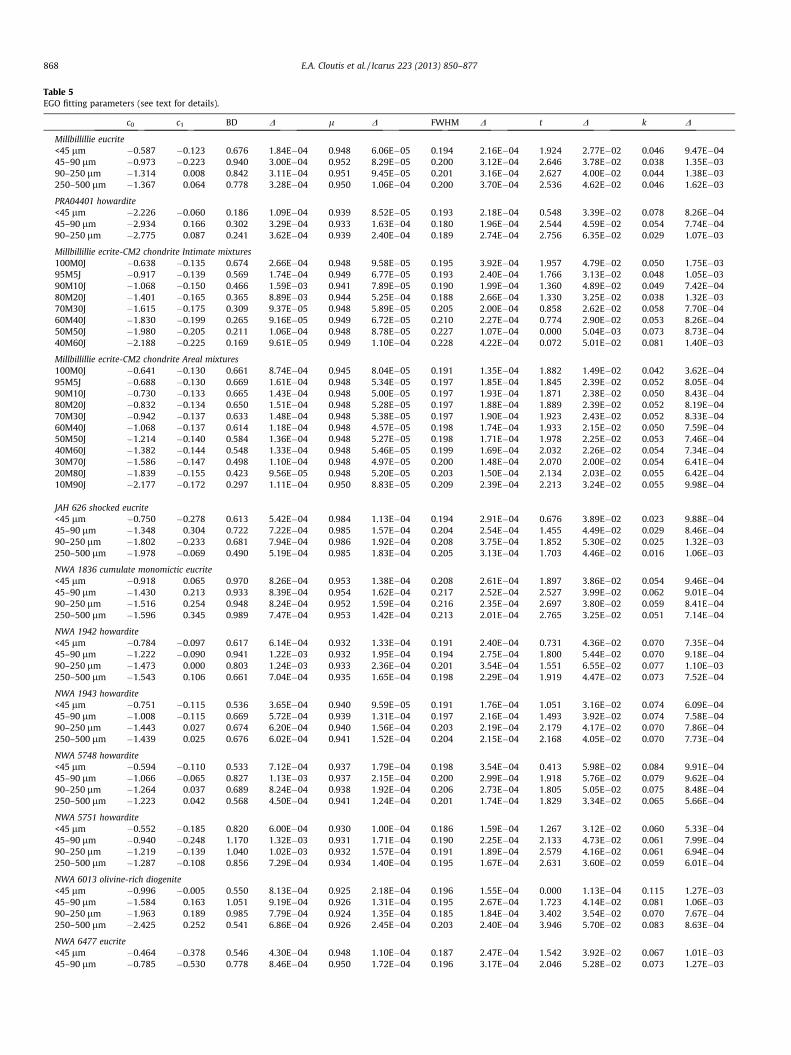
Table 5EGO fitting parameters (see text for details).
c0 c1 BD D l D FWHM D t D k D
Millbillillie eucrite<45 lm �0.587 �0.123 0.676 1.84E�04 0.948 6.06E�05 0.194 2.16E�04 1.924 2.77E�02 0.046 9.47E�0445–90 lm �0.973 �0.223 0.940 3.00E�04 0.952 8.29E�05 0.200 3.12E�04 2.646 3.78E�02 0.038 1.35E�0390–250 lm �1.314 0.008 0.842 3.11E�04 0.951 9.45E�05 0.201 3.16E�04 2.627 4.00E�02 0.044 1.38E�03250–500 lm �1.367 0.064 0.778 3.28E�04 0.950 1.06E�04 0.200 3.70E�04 2.536 4.62E�02 0.046 1.62E�03
PRA04401 howardite<45 lm �2.226 �0.060 0.186 1.09E�04 0.939 8.52E�05 0.193 2.18E�04 0.548 3.39E�02 0.078 8.26E�0445–90 lm �2.934 0.166 0.302 3.29E�04 0.933 1.63E�04 0.180 1.96E�04 2.544 4.59E�02 0.054 7.74E�0490–250 lm �2.775 0.087 0.241 3.62E�04 0.939 2.40E�04 0.189 2.74E�04 2.756 6.35E�02 0.029 1.07E�03
Millbillillie ecrite-CM2 chondrite Intimate mixtures100M0J �0.638 �0.135 0.674 2.66E�04 0.948 9.58E�05 0.195 3.92E�04 1.957 4.79E�02 0.050 1.75E�0395M5J �0.917 �0.139 0.569 1.74E�04 0.949 6.77E�05 0.193 2.40E�04 1.766 3.13E�02 0.048 1.05E�0390M10J �1.068 �0.150 0.466 1.59E�03 0.941 7.89E�05 0.190 1.99E�04 1.360 4.89E�02 0.049 7.42E�0480M20J �1.401 �0.165 0.365 8.89E�03 0.944 5.25E�04 0.188 2.66E�04 1.330 3.25E�02 0.038 1.32E�0370M30J �1.615 �0.175 0.309 9.37E�05 0.948 5.89E�05 0.205 2.00E�04 0.858 2.62E�02 0.058 7.70E�0460M40J �1.830 �0.199 0.265 9.16E�05 0.949 6.72E�05 0.210 2.27E�04 0.774 2.90E�02 0.053 8.26E�0450M50J �1.980 �0.205 0.211 1.06E�04 0.948 8.78E�05 0.227 1.07E�04 0.000 5.04E�03 0.073 8.73E�0440M60J �2.188 �0.225 0.169 9.61E�05 0.949 1.10E�04 0.228 4.22E�04 0.072 5.01E�02 0.081 1.40E�03
Millbillillie ecrite-CM2 chondrite Areal mixtures100M0J �0.641 �0.130 0.661 8.74E�04 0.945 8.04E�05 0.191 1.35E�04 1.882 1.49E�02 0.042 3.62E�0495M5J �0.688 �0.130 0.669 1.61E�04 0.948 5.34E�05 0.197 1.85E�04 1.845 2.39E�02 0.052 8.05E�0490M10J �0.730 �0.133 0.665 1.43E�04 0.948 5.00E�05 0.197 1.93E�04 1.871 2.38E�02 0.050 8.43E�0480M20J �0.832 �0.134 0.650 1.51E�04 0.948 5.28E�05 0.197 1.88E�04 1.889 2.39E�02 0.052 8.19E�0470M30J �0.942 �0.137 0.633 1.48E�04 0.948 5.38E�05 0.197 1.90E�04 1.923 2.43E�02 0.052 8.33E�0460M40J �1.068 �0.137 0.614 1.18E�04 0.948 4.57E�05 0.198 1.74E�04 1.933 2.15E�02 0.050 7.59E�0450M50J �1.214 �0.140 0.584 1.36E�04 0.948 5.27E�05 0.198 1.71E�04 1.978 2.25E�02 0.053 7.46E�0440M60J �1.382 �0.144 0.548 1.33E�04 0.948 5.46E�05 0.199 1.69E�04 2.032 2.26E�02 0.054 7.34E�0430M70J �1.586 �0.147 0.498 1.10E�04 0.948 4.97E�05 0.200 1.48E�04 2.070 2.00E�02 0.054 6.41E�0420M80J �1.839 �0.155 0.423 9.56E�05 0.948 5.20E�05 0.203 1.50E�04 2.134 2.03E�02 0.055 6.42E�0410M90J �2.177 �0.172 0.297 1.11E�04 0.950 8.83E�05 0.209 2.39E�04 2.213 3.24E�02 0.055 9.98E�04
JAH 626 shocked eucrite<45 lm �0.750 �0.278 0.613 5.42E�04 0.984 1.13E�04 0.194 2.91E�04 0.676 3.89E�02 0.023 9.88E�0445–90 lm �1.348 0.304 0.722 7.22E�04 0.985 1.57E�04 0.204 2.54E�04 1.455 4.49E�02 0.029 8.46E�0490–250 lm �1.802 �0.233 0.681 7.94E�04 0.986 1.92E�04 0.208 3.75E�04 1.852 5.30E�02 0.025 1.32E�03250–500 lm �1.978 �0.069 0.490 5.19E�04 0.985 1.83E�04 0.205 3.13E�04 1.703 4.46E�02 0.016 1.06E�03
NWA 1836 cumulate monomictic eucrite<45 lm �0.918 0.065 0.970 8.26E�04 0.953 1.38E�04 0.208 2.61E�04 1.897 3.86E�02 0.054 9.46E�0445–90 lm �1.430 0.213 0.933 8.39E�04 0.954 1.62E�04 0.217 2.52E�04 2.527 3.99E�02 0.062 9.01E�0490–250 lm �1.516 0.254 0.948 8.24E�04 0.952 1.59E�04 0.216 2.35E�04 2.697 3.80E�02 0.059 8.41E�04250–500 lm �1.596 0.345 0.989 7.47E�04 0.953 1.42E�04 0.213 2.01E�04 2.765 3.25E�02 0.051 7.14E�04
NWA 1942 howardite<45 lm �0.784 �0.097 0.617 6.14E�04 0.932 1.33E�04 0.191 2.40E�04 0.731 4.36E�02 0.070 7.35E�0445–90 lm �1.222 �0.090 0.941 1.22E�03 0.932 1.95E�04 0.194 2.75E�04 1.800 5.44E�02 0.070 9.18E�0490–250 lm �1.473 0.000 0.803 1.24E�03 0.933 2.36E�04 0.201 3.54E�04 1.551 6.55E�02 0.077 1.10E�03250–500 lm �1.543 0.106 0.661 7.04E�04 0.935 1.65E�04 0.198 2.29E�04 1.919 4.47E�02 0.073 7.52E�04
NWA 1943 howardite<45 lm �0.751 �0.115 0.536 3.65E�04 0.940 9.59E�05 0.191 1.76E�04 1.051 3.16E�02 0.074 6.09E�0445–90 lm �1.008 �0.115 0.669 5.72E�04 0.939 1.31E�04 0.197 2.16E�04 1.493 3.92E�02 0.074 7.58E�0490–250 lm �1.443 0.027 0.674 6.20E�04 0.940 1.56E�04 0.203 2.19E�04 2.179 4.17E�02 0.070 7.86E�04250–500 lm �1.439 0.025 0.676 6.02E�04 0.941 1.52E�04 0.204 2.15E�04 2.168 4.05E�02 0.070 7.73E�04
NWA 5748 howardite<45 lm �0.594 �0.110 0.533 7.12E�04 0.937 1.79E�04 0.198 3.54E�04 0.413 5.98E�02 0.084 9.91E�0445–90 lm �1.066 �0.065 0.827 1.13E�03 0.937 2.15E�04 0.200 2.99E�04 1.918 5.76E�02 0.079 9.62E�0490–250 lm �1.264 0.037 0.689 8.24E�04 0.938 1.92E�04 0.206 2.73E�04 1.805 5.05E�02 0.075 8.48E�04250–500 lm �1.223 0.042 0.568 4.50E�04 0.941 1.24E�04 0.201 1.74E�04 1.829 3.34E�02 0.065 5.66E�04
NWA 5751 howardite<45 lm �0.552 �0.185 0.820 6.00E�04 0.930 1.00E�04 0.186 1.59E�04 1.267 3.12E�02 0.060 5.33E�0445–90 lm �0.940 �0.248 1.170 1.32E�03 0.931 1.71E�04 0.190 2.25E�04 2.133 4.73E�02 0.061 7.99E�0490–250 lm �1.219 �0.139 1.040 1.02E�03 0.932 1.57E�04 0.191 1.89E�04 2.579 4.16E�02 0.061 6.94E�04250–500 lm �1.287 �0.108 0.856 7.29E�04 0.934 1.40E�04 0.195 1.67E�04 2.631 3.60E�02 0.059 6.01E�04
NWA 6013 olivine-rich diogenite<45 lm �0.996 �0.005 0.550 8.13E�04 0.925 2.18E�04 0.196 1.55E�04 0.000 1.13E�04 0.115 1.27E�0345–90 lm �1.584 0.163 1.051 9.19E�04 0.926 1.31E�04 0.195 2.67E�04 1.723 4.14E�02 0.081 1.06E�0390–250 lm �1.963 0.189 0.985 7.79E�04 0.924 1.35E�04 0.185 1.84E�04 3.402 3.54E�02 0.070 7.67E�04250–500 lm �2.425 0.252 0.541 6.86E�04 0.926 2.45E�04 0.203 2.40E�04 3.946 5.70E�02 0.083 8.63E�04
NWA 6477 eucrite<45 lm �0.464 �0.378 0.546 4.30E�04 0.948 1.10E�04 0.187 2.47E�04 1.542 3.92E�02 0.067 1.01E�0345–90 lm �0.785 �0.530 0.778 8.46E�04 0.950 1.72E�04 0.196 3.17E�04 2.046 5.28E�02 0.073 1.27E�03
868 E.A. Cloutis et al. / Icarus 223 (2013) 850–877
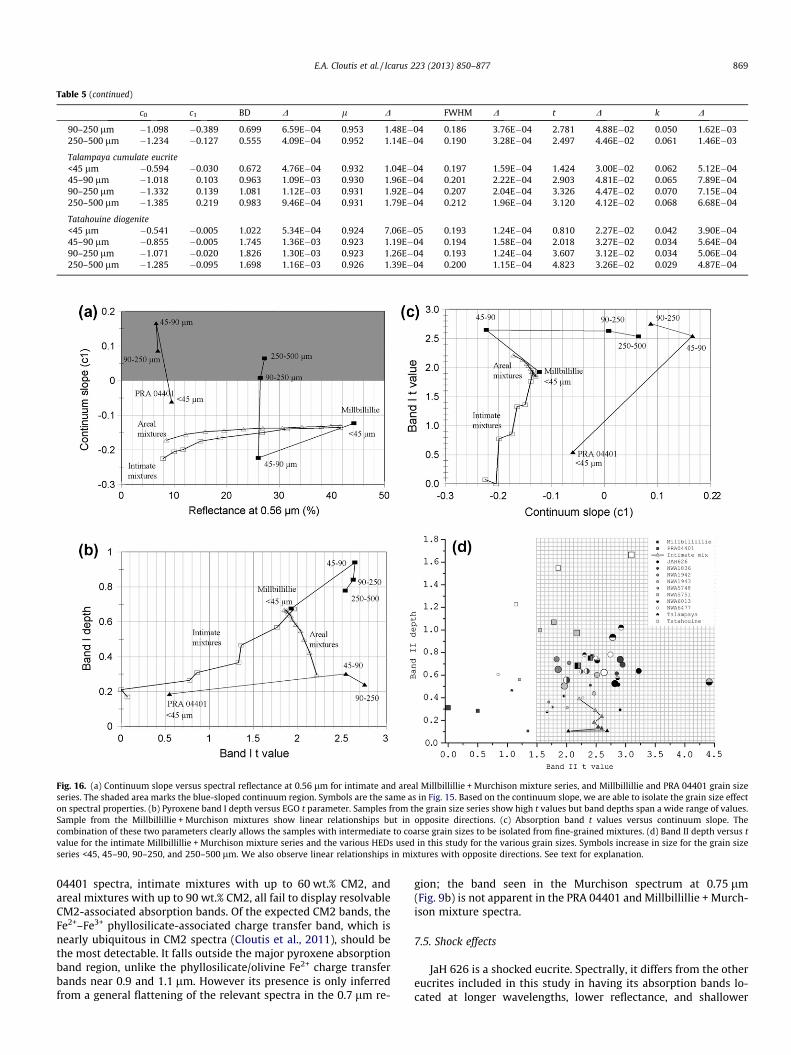
Table 5 (continued)
c0 c1 BD D l D FWHM D t D k D
90–250 lm �1.098 �0.389 0.699 6.59E�04 0.953 1.48E�04 0.186 3.76E�04 2.781 4.88E�02 0.050 1.62E�03250–500 lm �1.234 �0.127 0.555 4.09E�04 0.952 1.14E�04 0.190 3.28E�04 2.497 4.46E�02 0.061 1.46E�03
Talampaya cumulate eucrite<45 lm �0.594 �0.030 0.672 4.76E�04 0.932 1.04E�04 0.197 1.59E�04 1.424 3.00E�02 0.062 5.12E�0445–90 lm �1.018 0.103 0.963 1.09E�03 0.930 1.96E�04 0.201 2.22E�04 2.903 4.81E�02 0.065 7.89E�0490–250 lm �1.332 0.139 1.081 1.12E�03 0.931 1.92E�04 0.207 2.04E�04 3.326 4.47E�02 0.070 7.15E�04250–500 lm �1.385 0.219 0.983 9.46E�04 0.931 1.79E�04 0.212 1.96E�04 3.120 4.12E�02 0.068 6.68E�04
Tatahouine diogenite<45 lm �0.541 �0.005 1.022 5.34E�04 0.924 7.06E�05 0.193 1.24E�04 0.810 2.27E�02 0.042 3.90E�0445–90 lm �0.855 �0.005 1.745 1.36E�03 0.923 1.19E�04 0.194 1.58E�04 2.018 3.27E�02 0.034 5.64E�0490–250 lm �1.071 �0.020 1.826 1.30E�03 0.923 1.26E�04 0.193 1.24E�04 3.607 3.12E�02 0.034 5.06E�04250–500 lm �1.285 �0.095 1.698 1.16E�03 0.926 1.39E�04 0.200 1.15E�04 4.823 3.26E�02 0.029 4.87E�04
Fig. 16. (a) Continuum slope versus spectral reflectance at 0.56 lm for intimate and areal Millbillillie + Murchison mixture series, and Millbillillie and PRA 04401 grain sizeseries. The shaded area marks the blue-sloped continuum region. Symbols are the same as in Fig. 15. Based on the continuum slope, we are able to isolate the grain size effecton spectral properties. (b) Pyroxene band I depth versus EGO t parameter. Samples from the grain size series show high t values but band depths span a wide range of values.Sample from the Millbillillie + Murchison mixtures show linear relationships but in opposite directions. (c) Absorption band t values versus continuum slope. Thecombination of these two parameters clearly allows the samples with intermediate to coarse grain sizes to be isolated from fine-grained mixtures. (d) Band II depth versus tvalue for the intimate Millbillillie + Murchison mixture series and the various HEDs used in this study for the various grain sizes. Symbols increase in size for the grain sizeseries <45, 45–90, 90–250, and 250–500 lm. We also observe linear relationships in mixtures with opposite directions. See text for explanation.
E.A. Cloutis et al. / Icarus 223 (2013) 850–877 869
04401 spectra, intimate mixtures with up to 60 wt.% CM2, andareal mixtures with up to 90 wt.% CM2, all fail to display resolvableCM2-associated absorption bands. Of the expected CM2 bands, theFe2+–Fe3+ phyllosilicate-associated charge transfer band, which isnearly ubiquitous in CM2 spectra (Cloutis et al., 2011), should bethe most detectable. It falls outside the major pyroxene absorptionband region, unlike the phyllosilicate/olivine Fe2+ charge transferbands near 0.9 and 1.1 lm. However its presence is only inferredfrom a general flattening of the relevant spectra in the 0.7 lm re-
gion; the band seen in the Murchison spectrum at 0.75 lm(Fig. 9b) is not apparent in the PRA 04401 and Millbillillie + Murch-ison mixture spectra.
7.5. Shock effects
JaH 626 is a shocked eucrite. Spectrally, it differs from the othereucrites included in this study in having its absorption bands lo-cated at longer wavelengths, lower reflectance, and shallower
870 E.A. Cloutis et al. / Icarus 223 (2013) 850–877
absorption bands; however its BARs fall within the field occupiedby the other eucrites (Table 3). Lower overall reflectance and shal-lower absorption bands have been documented in shocked ensta-tite (Adams et al., 1979) and shock-blackened chondrites (Brittand Pieters, 1994). The movement of the absorption bands to long-er-than-expected wavelengths is consistent with the amorphiza-tion of pyroxene, as Fe2+-associated absorption bands in glassymafic materials are found at wavelengths longward of the pyrox-ene field. Other shocked eucrites examined by Burbine et al.(2001) do not appear to exhibit a shift in band positions but maybe darker than comparable unshocked eucrites. The spectralparameters for JaH 626 suggest that shocked materials, if presenton Vesta, will be most recognizable by a combination of band cen-ters and BARs. The XRD data for JaH 626 indicate that it containsboth crystalline and glassy materials, but the amount of amor-phous or poorly crystalline material cannot be quantified fromour existing data.
8. Evidence for carbonaceous chondrite material on Vesta
In addition to the direct identification of carbonaceous chon-drite xenoliths in a number of HEDs (discussed above), there isobservational evidence for the presence of carbonaceous chondritematerial on Vesta. Elemental mapping of hydrogen distributionacross Vesta shows that the highest distributions coincide withlower albedo regions. Younger terrains, such as the Rheasilvia ba-sin, show the lowest hydrogen concentrations. This areal distribu-tion is most consistent with the gradual accumulation of hydrogenby infalling carbonaceous chondrites, and subsequent removal orburial of this material by large impacts (Prettyman et al., 2012).
More indirect evidence also comes from the presence of pittedterrains in and around impact craters on Vesta. These terrains arethought to form from degassing of volatile-bearing materialsheated by the impact. One possible source of the volatiles isimpacting carbonaceous chondrites (Denevi et al., 2012).
9. ‘‘Cloudy’’ pyroxene
Cloudy pyroxenes, found in Millbillillie, contain submicroninclusions of opaque minerals, such as chromite. Their origin isnot well-defined at present, but may be indicators of thermalmetamorphism (Moroz et al., 2011). Cloudy pyroxenes are darker,more red-sloped below �1.5 lm, and more blue-sloped beyond1.5 lm than opaque-free pyroxenes (Moroz et al., 2011). Fig. 15shows the spectral parameters for the cloudy pyroxene in Millbil-lillie measured by Moroz et al. (2011). It can be seen that eventhough it is dark, its absorption bands are both narrower and dee-per than bulk Millbillillie, different than the trends seen forincreasing grain size or increasing CM2 abundance. A narrow anddeep absorption band is consistent with a compositionally re-stricted, well-ordered pyroxene. In contrast, bulk Millbillillie con-tains compositionally diverse pyroxenes (which would result in awider absorption band), shocked and poorly crystalline materials(leading to shallower and wider absorption bands), and plagioclasefeldspar (causing shallower pyroxene absorption bands) (e.g.,Fitzgerald, 1980; Yamaguchi et al., 1994).
Moroz et al. (2011) found that cloudy pyroxene has a similarband I center to bulk Millbillillie, but will shift apparent band IIcenters to shorter wavelengths. As discussed below, abundantcloudy pyroxenes may explain the offset of band I versus band IIcenters of HEDs compared to some V-type asteroids, although Ves-ta falls within the eucrite field for these spectral parameters(Moskovitz et al., 2010). While the relationship and importanceof cloudy pyroxenes to bulk HED spectra, and the larger issue ofspace weathering are outside the scope of this paper, they may
prove important for understanding the spectral properties andimportance of space weathering for Vesta and V-type asteroids(e.g., Moskovitz et al., 2010; Pieters et al., 2012a,b).
10. Spectral offsets between HEDs and V-asteroids
Moskovitz et al. (2010) examined a large number of HED and V-type asteroid spectra. He found that the V-type asteroids weresomewhat offset from the HEDs in terms of having longer bandcenters and higher BARs. They speculated that the larger than ex-pected BARs and band I or II centers in the V-asteroids are consis-tent with space weathering. They also found that the BAR of largergrain size HEDs (Duffard et al., 2005) does not match the mean va-lue of the V-asteroids.
The effects of space weathering on HEDs are not well under-stood (Gaffey, 2010; Pieters et al., 2012a,b). Different studies sug-gest that space weathering of HEDs may lead to increases(Vernazza et al., 2006) or decreases (Wasson et al., 1997, 1998)in BARs; band I centers generally increase in wavelength, whileband II centers decrease in wavelength (Moskovitz et al., 2010).In addition, Li et al. (2011) found little evidence in the ultravioletspectrum of Vesta to suggest that space weathering has been per-vasive. Preliminary observational evidence suggests that spaceweathering as experienced by Vesta does not involve the accumu-lation of nanophase iron but rather appears to be limited to a gen-eral overall darkening and ‘‘fading’’ of distinctive spectra into thebackground, consistent with regolith gardening being a dominantprocess (Pieters et al., 2012a,b). Remnant magnetization of theALH 81001 eucrite, presumed to originate from Vesta, suggeststhat Vesta may have had a sufficiently strong magnetic field to lar-gely minimize solar wind ion-generated space weathering on itssurface (Fu et al., 2012).
In our study, we have found that a simultaneous increase in BARand one or both band centers is consistent with a small increase inaverage HED grain size, but not with increasing CM2 content; it isalso consistent with space weathering of HEDs as determined bysome investigators (Vernazza et al., 2006; Moskovitz et al., 2010).The coarsest-grained PRA 04401 sample (90–250 lm) has thehighest BAR, with a value of 2.5 (Table 3), consistent with the fieldoccupied by V-asteroids, but its band depths are consistently lowerthan those of the V-asteroids (Moskovitz et al., 2010). This suggeststhat CM2-rich HED assemblages among V-asteroids are not wide-spread and cannot account for the offset between HED and V-aster-oid spectra. A more detailed analysis of this offset is currently inprogress.
11. Eucrite–diogenite mixing and relationships to howardites
Beck et al. (2011) examined the spectral properties of HEDs,including newly identified olivine diogenites. They found thathowardites exhibit band I and/or band II centers at values higherthan expected based on simple mixing relationships between diog-enites and eucrites. They speculated that this could be due to thepresence of impact melts or exogenous material. As CM chon-drite-type material is the most common type of exogenous mate-rial in howardites, our results can help address this question. Wefind that the addition of CM2 material to a eucrite causes band cen-ters to move in a direction inconsistent with the apparent offset ofthe howardites (Fig. 17). This suggests that other factors likely ac-count for the spectral offset. Using JaH 626 as an example of howshock affects HEDs, its Band I and II centers are located well be-yond the other eucrites (0.985 versus 0.959 lm and 2.141 versus2.063 lm). The difference between the highest wavelength eucritein this study and JaH 626 is greater for band II (78 nm) than forband I (26 nm), suggesting that while shock would move eucrite

Fig. 17. Band I versus band II� position of average eucrites, howardites anddiogenites from Beck et al. (2011). Tie lines show the offset of the howardites fromaverage eucrite and diogenite points. Data for the eucrite + CM2 intimate seriesspectra and for JaH 626 are also shown with direction of movement of the bandpositions with increasing CM2 content.
Fig. 18. Reflectance at 0.56 lm versus 0.749/0.917 lm reflectance ratio forMillbillillie eucrite grain size series (filled squares), PRA 04401 howardite grainsize series (filled triangles), eucrite + CM2 intimate mixture series (open squares),and eucrite + CM2 areal mixture series (open triangles). The spectral data for cloudypyroxene in the Millbillillie eucrite from Moroz et al. (2011) is also shown. SeeTable 4 for description of samples.
Fig. 19. Reflectance at 0.75 lm versus 0.75/0.92 lm reflectance ratio. The threepolygons with heavy outlining are representative data for (from left to right) dark,average, and bright terrains on Vesta from McCord et al. (2012). The polygon with athinner outline is the region occupied by spectra of dark material in Cornelia crater(Reddy et al., 2012c). Filled squares are the data points for the <45 lm fractions ofour HEDs, open squares are for the various >45 lm fractions and slabs; theconnected open triangles are for our intimate <45 lm Millbillillie + Murchisonseries, with pure Millbillillie at the rightmost point, and pure Murchison at theleftmost point. The large filled triangle is the point for the <45 lm fraction of PRA04401, and smaller filled triangles are for the larger grain sizes and slab of thismeteorite.
E.A. Cloutis et al. / Icarus 223 (2013) 850–877 871
points to the upper right in Fig. 17, there may be a greater shift inband II causing shocked materials to preferentially move upwards,possibly accounting for some of the apparent offset of the howar-dites from the diogenite–eucrite join.
12. Dawn FC band passes
Le Corre et al. (2011) deconvolved the eucrite + CM2 mixturesto Dawn FC band passes to search for spectral differences com-pared to HEDs, but HED grain size effects and PRA 04401 werenot included in their analysis. They found that the presence of inti-mately mixed CM2 material exponentially lowers reflectance in allFC bands and reduces band depth in the 1 lm region. They alsosuggested that albedo alone is not a sufficient criterion to recog-nize the presence of CM2 material on Vesta.
The results of the current study suggest that the seven FC bandpasses alone may be sufficient to discriminate the effects ofincreasing HED grain size from increasing CM2 content, sinceincreasing HED grain size results in deeper absorption bands, whileincreasing CM2 content leads to shallower absorption bands; thelongest wavelength FC bands (F3, F6, F4, and F5), which coverthe 1 lm pyroxene absorption band, are most useful in this regard.As an example, Fig. 18 shows the relationship between albedo,grain size, and CM2 abundance. As expected, the trajectories forCM2 abundance and grain size are different. Increasing CM2 abun-dance leads to lower albedo and lower 0.749/0.917 lm reflectanceratio (as a proxy for band depth). Increasing HED grain size leads tolower albedo and higher 0.749/0.917 lm ratios, until band satura-tion occurs. Also, PRA 04401 plots within the field occupied by eu-crite + CM2 mixtures.
McCord et al. (2012) and Reddy et al. (2012c) examined the nat-ure of dark material on Vesta using Dawn FC and VIR data. Model-ing of the VIR data by McCord et al. (2012) suggested that the darkspectral end member has reflectance <11% across the 1.1–2.3 lmwavelength interval and is somewhat red-sloped, with a 2.3/1.1 lm reflectance ratio of �2 and with no resolvable absorptionbands. CM chondrites are generally darker (usually by a few per-cent) and less red-sloped (usually by about 30%) than this darkend member; however, these differences are not considered signif-icant, given the spectral diversity of CM chondrites (Cloutis et al.,2011).
Using FC data, McCord et al. (2012) also found that pyroxeneabsorption strengths (as measured by the 0.75/0.92 lm reflectanceratio) correlated with material brightness as measured by reflec-tance at 0.75 lm. Both McCord et al. (2012) and Reddy et al.
(2012c) determined that the dark material is most consistent spec-trally with carbonaceous chondrites. The Vesta dark terrains havelower 0.75 lm reflectance and 0.75/0.92 lm ratioed reflectancethan bright and intermediate terrains, which all lie along a trend,suggesting a mixing line.
We plotted the data for our HEDs and HED + Murchison mix-tures using these same spectral parameters (Fig. 19). As noted byMcCord et al. (2012), the data that they present are representativeand the full global data set would show a continuum of pointsalong this trend; Reddy et al. (2012c) defined a cluster of pointsfor dark terrains in Cornelia crater. We find that our <45 lm HEDspectra fall outside the fields defined by the Vesta points, includingbright terrains, but generally along the same trend; specificallythey are brighter and have a deeper absorption feature. The pres-ence of HED data points outside the bright terrain region of thisspectral field probably reflects the fact that pyroxenes on the sur-
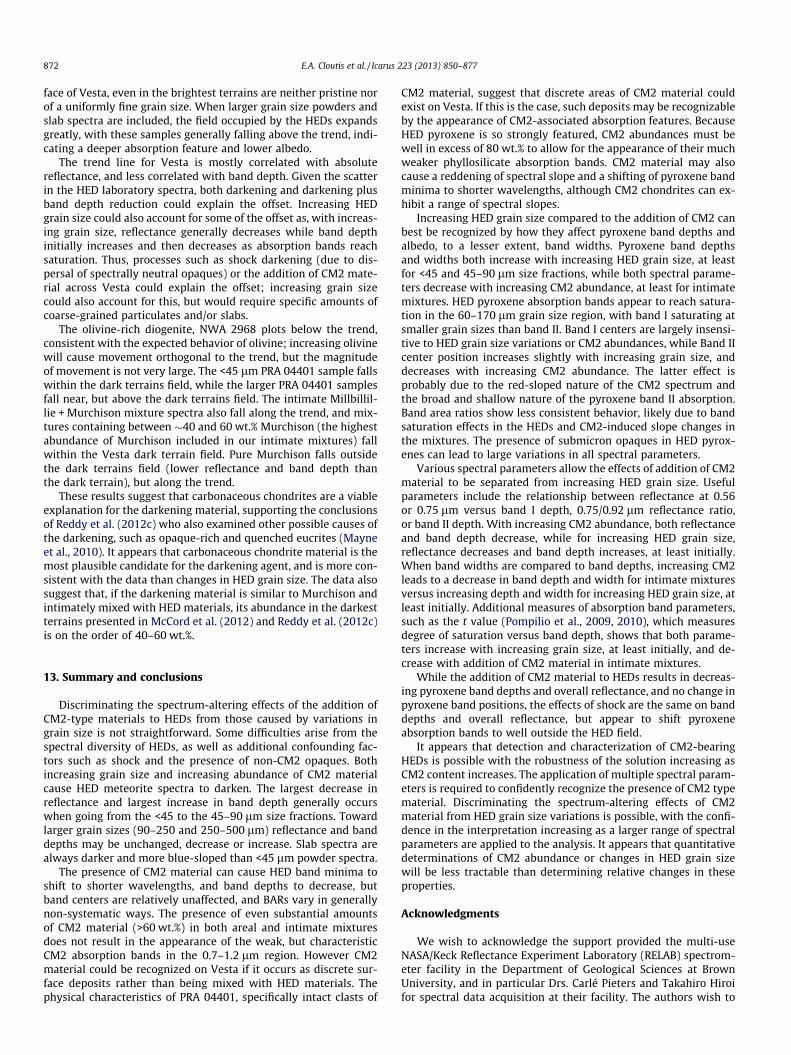
872 E.A. Cloutis et al. / Icarus 223 (2013) 850–877
face of Vesta, even in the brightest terrains are neither pristine norof a uniformly fine grain size. When larger grain size powders andslab spectra are included, the field occupied by the HEDs expandsgreatly, with these samples generally falling above the trend, indi-cating a deeper absorption feature and lower albedo.
The trend line for Vesta is mostly correlated with absolutereflectance, and less correlated with band depth. Given the scatterin the HED laboratory spectra, both darkening and darkening plusband depth reduction could explain the offset. Increasing HEDgrain size could also account for some of the offset as, with increas-ing grain size, reflectance generally decreases while band depthinitially increases and then decreases as absorption bands reachsaturation. Thus, processes such as shock darkening (due to dis-persal of spectrally neutral opaques) or the addition of CM2 mate-rial across Vesta could explain the offset; increasing grain sizecould also account for this, but would require specific amounts ofcoarse-grained particulates and/or slabs.
The olivine-rich diogenite, NWA 2968 plots below the trend,consistent with the expected behavior of olivine; increasing olivinewill cause movement orthogonal to the trend, but the magnitudeof movement is not very large. The <45 lm PRA 04401 sample fallswithin the dark terrains field, while the larger PRA 04401 samplesfall near, but above the dark terrains field. The intimate Millbillil-lie + Murchison mixture spectra also fall along the trend, and mix-tures containing between �40 and 60 wt.% Murchison (the highestabundance of Murchison included in our intimate mixtures) fallwithin the Vesta dark terrain field. Pure Murchison falls outsidethe dark terrains field (lower reflectance and band depth thanthe dark terrain), but along the trend.
These results suggest that carbonaceous chondrites are a viableexplanation for the darkening material, supporting the conclusionsof Reddy et al. (2012c) who also examined other possible causes ofthe darkening, such as opaque-rich and quenched eucrites (Mayneet al., 2010). It appears that carbonaceous chondrite material is themost plausible candidate for the darkening agent, and is more con-sistent with the data than changes in HED grain size. The data alsosuggest that, if the darkening material is similar to Murchison andintimately mixed with HED materials, its abundance in the darkestterrains presented in McCord et al. (2012) and Reddy et al. (2012c)is on the order of 40–60 wt.%.
13. Summary and conclusions
Discriminating the spectrum-altering effects of the addition ofCM2-type materials to HEDs from those caused by variations ingrain size is not straightforward. Some difficulties arise from thespectral diversity of HEDs, as well as additional confounding fac-tors such as shock and the presence of non-CM2 opaques. Bothincreasing grain size and increasing abundance of CM2 materialcause HED meteorite spectra to darken. The largest decrease inreflectance and largest increase in band depth generally occurswhen going from the <45 to the 45–90 lm size fractions. Towardlarger grain sizes (90–250 and 250–500 lm) reflectance and banddepths may be unchanged, decrease or increase. Slab spectra arealways darker and more blue-sloped than <45 lm powder spectra.
The presence of CM2 material can cause HED band minima toshift to shorter wavelengths, and band depths to decrease, butband centers are relatively unaffected, and BARs vary in generallynon-systematic ways. The presence of even substantial amountsof CM2 material (>60 wt.%) in both areal and intimate mixturesdoes not result in the appearance of the weak, but characteristicCM2 absorption bands in the 0.7–1.2 lm region. However CM2material could be recognized on Vesta if it occurs as discrete sur-face deposits rather than being mixed with HED materials. Thephysical characteristics of PRA 04401, specifically intact clasts of
CM2 material, suggest that discrete areas of CM2 material couldexist on Vesta. If this is the case, such deposits may be recognizableby the appearance of CM2-associated absorption features. BecauseHED pyroxene is so strongly featured, CM2 abundances must bewell in excess of 80 wt.% to allow for the appearance of their muchweaker phyllosilicate absorption bands. CM2 material may alsocause a reddening of spectral slope and a shifting of pyroxene bandminima to shorter wavelengths, although CM2 chondrites can ex-hibit a range of spectral slopes.
Increasing HED grain size compared to the addition of CM2 canbest be recognized by how they affect pyroxene band depths andalbedo, to a lesser extent, band widths. Pyroxene band depthsand widths both increase with increasing HED grain size, at leastfor <45 and 45–90 lm size fractions, while both spectral parame-ters decrease with increasing CM2 abundance, at least for intimatemixtures. HED pyroxene absorption bands appear to reach satura-tion in the 60–170 lm grain size region, with band I saturating atsmaller grain sizes than band II. Band I centers are largely insensi-tive to HED grain size variations or CM2 abundances, while Band IIcenter position increases slightly with increasing grain size, anddecreases with increasing CM2 abundance. The latter effect isprobably due to the red-sloped nature of the CM2 spectrum andthe broad and shallow nature of the pyroxene band II absorption.Band area ratios show less consistent behavior, likely due to bandsaturation effects in the HEDs and CM2-induced slope changes inthe mixtures. The presence of submicron opaques in HED pyrox-enes can lead to large variations in all spectral parameters.
Various spectral parameters allow the effects of addition of CM2material to be separated from increasing HED grain size. Usefulparameters include the relationship between reflectance at 0.56or 0.75 lm versus band I depth, 0.75/0.92 lm reflectance ratio,or band II depth. With increasing CM2 abundance, both reflectanceand band depth decrease, while for increasing HED grain size,reflectance decreases and band depth increases, at least initially.When band widths are compared to band depths, increasing CM2leads to a decrease in band depth and width for intimate mixturesversus increasing depth and width for increasing HED grain size, atleast initially. Additional measures of absorption band parameters,such as the t value (Pompilio et al., 2009, 2010), which measuresdegree of saturation versus band depth, shows that both parame-ters increase with increasing grain size, at least initially, and de-crease with addition of CM2 material in intimate mixtures.
While the addition of CM2 material to HEDs results in decreas-ing pyroxene band depths and overall reflectance, and no change inpyroxene band positions, the effects of shock are the same on banddepths and overall reflectance, but appear to shift pyroxeneabsorption bands to well outside the HED field.
It appears that detection and characterization of CM2-bearingHEDs is possible with the robustness of the solution increasing asCM2 content increases. The application of multiple spectral param-eters is required to confidently recognize the presence of CM2 typematerial. Discriminating the spectrum-altering effects of CM2material from HED grain size variations is possible, with the confi-dence in the interpretation increasing as a larger range of spectralparameters are applied to the analysis. It appears that quantitativedeterminations of CM2 abundance or changes in HED grain sizewill be less tractable than determining relative changes in theseproperties.
Acknowledgments
We wish to acknowledge the support provided the multi-useNASA/Keck Reflectance Experiment Laboratory (RELAB) spectrom-eter facility in the Department of Geological Sciences at BrownUniversity, and in particular Drs. Carlé Pieters and Takahiro Hiroifor spectral data acquisition at their facility. The authors wish to
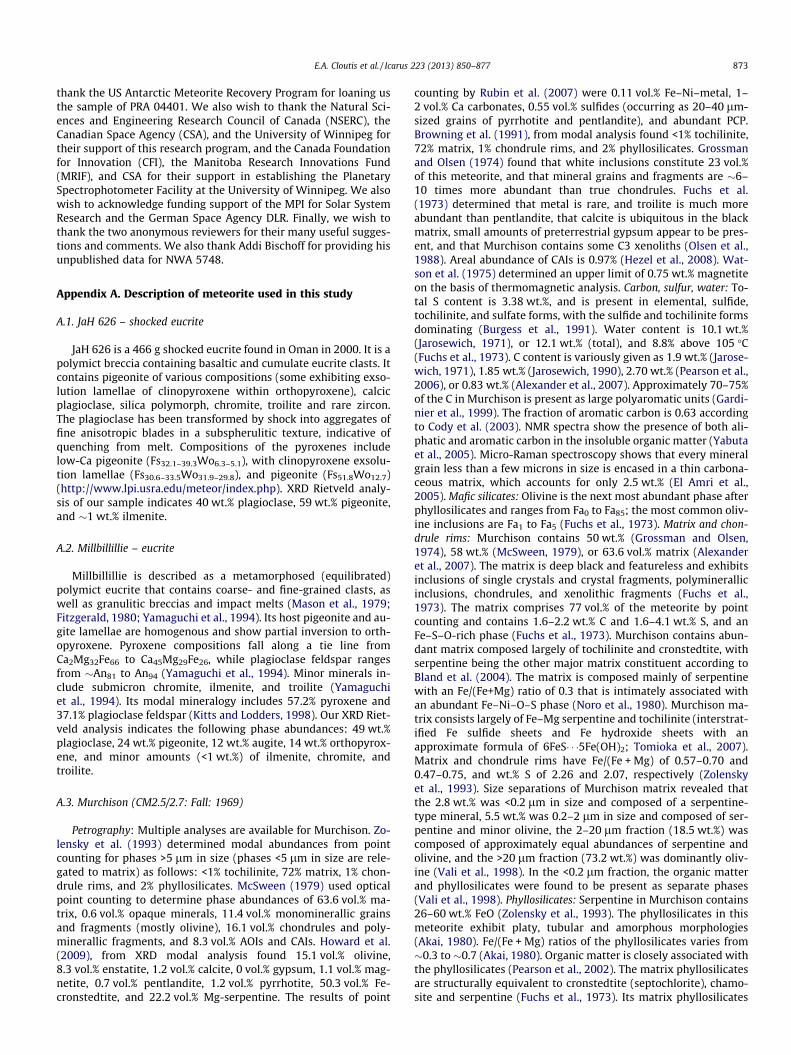
E.A. Cloutis et al. / Icarus 223 (2013) 850–877 873
thank the US Antarctic Meteorite Recovery Program for loaning usthe sample of PRA 04401. We also wish to thank the Natural Sci-ences and Engineering Research Council of Canada (NSERC), theCanadian Space Agency (CSA), and the University of Winnipeg fortheir support of this research program, and the Canada Foundationfor Innovation (CFI), the Manitoba Research Innovations Fund(MRIF), and CSA for their support in establishing the PlanetarySpectrophotometer Facility at the University of Winnipeg. We alsowish to acknowledge funding support of the MPI for Solar SystemResearch and the German Space Agency DLR. Finally, we wish tothank the two anonymous reviewers for their many useful sugges-tions and comments. We also thank Addi Bischoff for providing hisunpublished data for NWA 5748.
Appendix A. Description of meteorite used in this study
A.1. JaH 626 – shocked eucrite
JaH 626 is a 466 g shocked eucrite found in Oman in 2000. It is apolymict breccia containing basaltic and cumulate eucrite clasts. Itcontains pigeonite of various compositions (some exhibiting exso-lution lamellae of clinopyroxene within orthopyroxene), calcicplagioclase, silica polymorph, chromite, troilite and rare zircon.The plagioclase has been transformed by shock into aggregates offine anisotropic blades in a subspherulitic texture, indicative ofquenching from melt. Compositions of the pyroxenes includelow-Ca pigeonite (Fs32.1–39.3Wo6.3–5.1), with clinopyroxene exsolu-tion lamellae (Fs30.6–33.5Wo31.9–29.8), and pigeonite (Fs51.8Wo12.7)(http://www.lpi.usra.edu/meteor/index.php). XRD Rietveld analy-sis of our sample indicates 40 wt.% plagioclase, 59 wt.% pigeonite,and �1 wt.% ilmenite.
A.2. Millbillillie – eucrite
Millbillillie is described as a metamorphosed (equilibrated)polymict eucrite that contains coarse- and fine-grained clasts, aswell as granulitic breccias and impact melts (Mason et al., 1979;Fitzgerald, 1980; Yamaguchi et al., 1994). Its host pigeonite and au-gite lamellae are homogenous and show partial inversion to orth-opyroxene. Pyroxene compositions fall along a tie line fromCa2Mg32Fe66 to Ca45Mg29Fe26, while plagioclase feldspar rangesfrom �An81 to An94 (Yamaguchi et al., 1994). Minor minerals in-clude submicron chromite, ilmenite, and troilite (Yamaguchiet al., 1994). Its modal mineralogy includes 57.2% pyroxene and37.1% plagioclase feldspar (Kitts and Lodders, 1998). Our XRD Riet-veld analysis indicates the following phase abundances: 49 wt.%plagioclase, 24 wt.% pigeonite, 12 wt.% augite, 14 wt.% orthopyrox-ene, and minor amounts (<1 wt.%) of ilmenite, chromite, andtroilite.
A.3. Murchison (CM2.5/2.7: Fall: 1969)
Petrography: Multiple analyses are available for Murchison. Zo-lensky et al. (1993) determined modal abundances from pointcounting for phases >5 lm in size (phases <5 lm in size are rele-gated to matrix) as follows: <1% tochilinite, 72% matrix, 1% chon-drule rims, and 2% phyllosilicates. McSween (1979) used opticalpoint counting to determine phase abundances of 63.6 vol.% ma-trix, 0.6 vol.% opaque minerals, 11.4 vol.% monominerallic grainsand fragments (mostly olivine), 16.1 vol.% chondrules and poly-minerallic fragments, and 8.3 vol.% AOIs and CAIs. Howard et al.(2009), from XRD modal analysis found 15.1 vol.% olivine,8.3 vol.% enstatite, 1.2 vol.% calcite, 0 vol.% gypsum, 1.1 vol.% mag-netite, 0.7 vol.% pentlandite, 1.2 vol.% pyrrhotite, 50.3 vol.% Fe-cronstedtite, and 22.2 vol.% Mg-serpentine. The results of point
counting by Rubin et al. (2007) were 0.11 vol.% Fe–Ni–metal, 1–2 vol.% Ca carbonates, 0.55 vol.% sulfides (occurring as 20–40 lm-sized grains of pyrrhotite and pentlandite), and abundant PCP.Browning et al. (1991), from modal analysis found <1% tochilinite,72% matrix, 1% chondrule rims, and 2% phyllosilicates. Grossmanand Olsen (1974) found that white inclusions constitute 23 vol.%of this meteorite, and that mineral grains and fragments are �6–10 times more abundant than true chondrules. Fuchs et al.(1973) determined that metal is rare, and troilite is much moreabundant than pentlandite, that calcite is ubiquitous in the blackmatrix, small amounts of preterrestrial gypsum appear to be pres-ent, and that Murchison contains some C3 xenoliths (Olsen et al.,1988). Areal abundance of CAIs is 0.97% (Hezel et al., 2008). Wat-son et al. (1975) determined an upper limit of 0.75 wt.% magnetiteon the basis of thermomagnetic analysis. Carbon, sulfur, water: To-tal S content is 3.38 wt.%, and is present in elemental, sulfide,tochilinite, and sulfate forms, with the sulfide and tochilinite formsdominating (Burgess et al., 1991). Water content is 10.1 wt.%(Jarosewich, 1971), or 12.1 wt.% (total), and 8.8% above 105 �C(Fuchs et al., 1973). C content is variously given as 1.9 wt.% (Jarose-wich, 1971), 1.85 wt.% (Jarosewich, 1990), 2.70 wt.% (Pearson et al.,2006), or 0.83 wt.% (Alexander et al., 2007). Approximately 70–75%of the C in Murchison is present as large polyaromatic units (Gardi-nier et al., 1999). The fraction of aromatic carbon is 0.63 accordingto Cody et al. (2003). NMR spectra show the presence of both ali-phatic and aromatic carbon in the insoluble organic matter (Yabutaet al., 2005). Micro-Raman spectroscopy shows that every mineralgrain less than a few microns in size is encased in a thin carbona-ceous matrix, which accounts for only 2.5 wt.% (El Amri et al.,2005). Mafic silicates: Olivine is the next most abundant phase afterphyllosilicates and ranges from Fa0 to Fa85; the most common oliv-ine inclusions are Fa1 to Fa5 (Fuchs et al., 1973). Matrix and chon-drule rims: Murchison contains 50 wt.% (Grossman and Olsen,1974), 58 wt.% (McSween, 1979), or 63.6 vol.% matrix (Alexanderet al., 2007). The matrix is deep black and featureless and exhibitsinclusions of single crystals and crystal fragments, polyminerallicinclusions, chondrules, and xenolithic fragments (Fuchs et al.,1973). The matrix comprises 77 vol.% of the meteorite by pointcounting and contains 1.6–2.2 wt.% C and 1.6–4.1 wt.% S, and anFe–S–O-rich phase (Fuchs et al., 1973). Murchison contains abun-dant matrix composed largely of tochilinite and cronstedtite, withserpentine being the other major matrix constituent according toBland et al. (2004). The matrix is composed mainly of serpentinewith an Fe/(Fe+Mg) ratio of 0.3 that is intimately associated withan abundant Fe–Ni–O–S phase (Noro et al., 1980). Murchison ma-trix consists largely of Fe–Mg serpentine and tochilinite (interstrat-ified Fe sulfide sheets and Fe hydroxide sheets with anapproximate formula of 6FeS� � �5Fe(OH)2; Tomioka et al., 2007).Matrix and chondrule rims have Fe/(Fe + Mg) of 0.57–0.70 and0.47–0.75, and wt.% S of 2.26 and 2.07, respectively (Zolenskyet al., 1993). Size separations of Murchison matrix revealed thatthe 2.8 wt.% was <0.2 lm in size and composed of a serpentine-type mineral, 5.5 wt.% was 0.2–2 lm in size and composed of ser-pentine and minor olivine, the 2–20 lm fraction (18.5 wt.%) wascomposed of approximately equal abundances of serpentine andolivine, and the >20 lm fraction (73.2 wt.%) was dominantly oliv-ine (Vali et al., 1998). In the <0.2 lm fraction, the organic matterand phyllosilicates were found to be present as separate phases(Vali et al., 1998). Phyllosilicates: Serpentine in Murchison contains26–60 wt.% FeO (Zolensky et al., 1993). The phyllosilicates in thismeteorite exhibit platy, tubular and amorphous morphologies(Akai, 1980). Fe/(Fe + Mg) ratios of the phyllosilicates varies from�0.3 to �0.7 (Akai, 1980). Organic matter is closely associated withthe phyllosilicates (Pearson et al., 2002). The matrix phyllosilicatesare structurally equivalent to cronstedtite (septochlorite), chamo-site and serpentine (Fuchs et al., 1973). Its matrix phyllosilicates

874 E.A. Cloutis et al. / Icarus 223 (2013) 850–877
have an Fe/(Fe + Mg) ratio of 0.50 and an Fe2+/(Fe2+ + Fe3+) ratio of0.57; �7 vol.% of the chondrule volume is altered according toBrowning et al. (1996). Mössbauer analysis indicates 14.4% and13.8% of the total Fe in this meteorite is present as tochiliniteand cronstedtite, respectively (Burns and Fisher, 1994). On the ba-sis of electron microprobe analysis, stoichiometry, and XRD, Bunchand Chang (1980) concluded that the phyllosilicates in Murchisoninclude cronstedtite. Petrology and alteration: Murchison is in-cluded in the intermediate Fe-content serpentine (intermediatelyaltered) CM2 group of Browning et al. (1991). Its matrix phyllosili-cate compositions and abundance indicate a low degree of aqueousalteration; �7 vol.% of the chondrule volume is altered, among thelowest for CM2 chondrites (Browning et al., 1996). It was assignedto petrologic subtype CM2.5 by Rubin et al. (2007) and subtype 2.7by Trigo-Rodriguez et al. (2006). It was identified as a stage I (un-heated or very weakly heated, <300 �C) sample by Nakamura et al.(2006). Mössbauer analysis was used to demonstrate that Fe3+/Fe2+
ratios and cronstedtite proportions decrease in the order: ColdBokkeveld > Murchison > Murray > ALH 83100, while tochilinite ispresent in comparable amounts in each of these meteorites (Burnsand Fisher, 1991).
A.4. NWA 1836 – cumulate monomict eucrite
NWA 1836 is a very fresh-appearing 1102 g cumulate monom-ict eucrite found in Morocco in 2002. The eucrite clasts have con-torted shapes and are surrounded by cataclastic zones that are inturn covered by mantles of partially melted to recrystallized mate-rial. Compositions: clast orthopyroxene, Fs56.4–59Wo2.5–4; exsolu-tion lamellae, Fs43.4–46.3Wo23–25.6; recrystallized zone, Fs54.5–
57.5Wo8.4–13.5; plagioclase, An91–93.6. Shock levels range from S1 toS5 (Russell et al., 2005). Our XRD Rietveld analysis indicates28 wt.% plagioclase, 55 wt.% pigeonite, 17 wt.% orthopyroxene,and minor ilmenite.
A.5. NWA 1942 – howardite
NWA 1942 is a 457 g howardite found in northwest Africa in2002. It is coarse-grained with diogenite clasts up to 12 mm. Theclast mode is: diogenites, 83 vol.%; granular eucrites, 8 vol.%; basal-tic eucrites, 2 vol.%; and shocked clasts, 7 vol.%. The diogenitepyroxenes are Fs16.8–41.3Wo1.2–9.8, and the plagioclase clasts areAn92. It was characterized as shock level S2, and is slightly weath-ered (Russell et al., 2004). Our XRD Rietveld analysis shows 35 wt.%pigeonite, 34 wt.% pigeonite, 30 wt.% orthopyroxene, and minorolivine.
A.6. NWA 1943 – howardite
NWA 1943 is a 1220 g howardite found in Morocco in 2001. It ismostly fine-grained with rare, large clasts of fine-grained eucritebreccias. The mode of the clasts is: diogenites, 44 vol.%; basaltic eu-crites, 17 vol.%; cumulate eucrites, 13 vol.%; basaltic breccias,6 vol.%; and shocked clasts, 20 vol.%. The diogenite pyroxenes areFs22.5–57.3Wo3–13.5. The meteorite appears very fresh with no oxida-tion apparent on the metal grains (Russell et al., 2004). Our Riet-veld XRD analysis shows 43 wt.% plagioclase, 27 wt.% pigeonite,15 wt.% augite, and 15 wt.% orthopyroxene.
A.7. NWA 2968 – dunitic diogenite
NWA 2968 consists of a total mass of 268 g and was obtained inMorocco in 2005 and classified as an ungrouped achondrite. It is amassive olivine-rich rock of very large grain size (17 to >25 mm),with curved to linear compression and shear fractures. Olivine ac-counts for >95 vol.% with small amounts of tiny grains (<0.03 mm)
of orthopyroxene, metal, troilite, and pyrrhotite commonly foundwithin fractures and as rare inclusions in olivine. Large domain off-set, isolated mosaicism, and undulatory extinction are prevalent inolivine. The olivine is equilibrated (Fa7.5±0.2), and orthopyroxene isFs6.7Wo1.5 (Connolly et al., 2007). Our XRD Rietveld analysis indi-cated 89 wt.% olivine, 5 wt.% chromite, 3 wt.% troilite, 2 wt.% goe-thite (likely the result of terrestrial weathering), and a traceamount of orthopyroxene.
A.8. NWA 5748 – howardite
NWA 5748 (provisional name) is a 37 g howardite obtained innorthwest Africa in 2008. No published compositional informationis available. It has been tentatively categorized as a howardite ofshock stage S2, a weathering grade of W1, a pyroxene compositionof Fs31.5±9, and a plagioclase composition of An90.5±4.5 (A. Bischoff,personal communication, 2013).
A.9. NWA 5751 – howardite
NWA 5751 (provisional name) is a 30 g howardite obtained innorthwest Africa in 2008. No published compositional informationis available. XRD Rietveld analysis of our sample gave the followingmineral abundances: 28 wt.% plagioclase, 13 wt.% pigeonite, 7 wt.%augite, 50 wt.% orthopyroxene, and minor olivine and chromite.
A.10. NWA 6013 – olivine-rich diogenite
NWA 6013 (provisional name) is a 357 g olivine-rich diogeniteobtained in northwest Africa in 2009. No published compositionalinformation is available. Our XRD Rietveld analysis found 7 wt.%plagioclase, 65 wt.% orthopyroxene, 27 wt.% olivine, and �1 wt.%chromite in this sample.
A.11. NWA 6477 – eucrite
NWA 6477 is a 385 g eucrite found in 2010. This is a provisionalname, and no published description is available. Our XRD Rietveldanalysis found the following mineral abundances: 54 wt.% plagio-clase, 33 wt.% pigeonite, 13 wt.% augite, and minor ilmenite, chro-mite, and troilite.
A.12. PRA 04401 – CM2-bearing howardite
PRA 04401 is a howardite that contains �60% CM2 clasts(McCoy and Reynolds, 2007; Herrin et al., 2010, 2011). The originaldescription of PRA 04401 is ‘‘a groundmass of comminuted pyrox-ene and plagioclase (up to 0.5 mm) with fine- to coarse-grainedbasaltic clasts ranging up to 5 mm’’ (McCoy and Reynolds, 2007).Its orthopyroxene is compositionally diverse (Fs16–60Wo1–3) andplagioclase feldspar composition is An87–90 (McCoy and Reynolds,2007). Our sample of PRA 04401 contains �40% visible CM2 clasts,ranging in size up to �4 mm.
A.13. Talampaya – cumulate eucrite
Talampaya is a 1421 g cumulate eucrite that fell in Argentina in1995. It is a monomict breccia with a cataclastic texture, contain-ing some millimeter-sized unbrecciated clasts. Pyroxene composi-tions are En58.6–60.0Wo1.2–1.6 and En40.5Wo45.7; plagioclasecomposition is An89–95, mean An92 (Grossman, 1999). Our XRDRietveld analysis found 65 wt.% plagioclase, 32 wt.% pigeonite,1 wt.% augite, 2 wt.% ilmenite, and trace chromite and troilite.
E.A. Cloutis et al. / Icarus 223 (2013) 850–877 875
A.14. Tatahouine – diogenite
The Tatahouine diogenite consists of fragments with a totalmass of 12 kg that fell in Tunisia in 1931. Tatahouine consistsmostly of unbrecciated othropyroxene crystals that are green tolight olive-gray. It has fractures and dark bands (up to 2 mm wide)running through the material. The texture is similar to that of someterrestrial cumulates. Most pyroxene crystals are >5 mm. Thinchromite patches (<3 mm in diameter) are often observed on clastsurfaces. Pyroxene composition is uniform, clustering aroundEn75.0Wo1.5. Tatahouine contains many inclusions (<6% of the vol-ume) of silica, troilite, chromite, and metal. Recently collected sam-ples show evidence of alteration: Fe stains replace metal or troilite,and yellowish to light orange calcitic aggregates (Barrat et al.,2008). Our XRD Rietveld analysis found 97% orthopyroxene, 2%anatase, and trace amounts of olivine, chromite, and cristobalite.
References
Adams, J.B., 1974. Visible and near-infrared diffuse reflectance spectra of pyroxenesas applied to remote sensing of solid objects in the Solar System. J. Geophys.Res. 79, 4829–4836.
Adams, J.B., Goullaud, L.H., 1978. Plagioclase feldspars: Visible and near infrareddiffuse reflectance spectra as applied to remote sensing. Proc. Lunar Planet. Sci.9, 2901–2909.
Adams, J.B., Hörz, F., Gibbons, R.V., 1979. Effects of shock-loading on the reflectancespectra of plagioclase, pyroxene, and glass. Lunar Planet. Sci. 10, 1–3.
Akai, J., 1980. Tubular form of interstratified mineral consisting of a serpentine-likelayer plus two brucite-like sheets newly found in the Murchison (C2) meteorite.Proc. NIPR Symp. Antarctic Meteorit. 5, 299–310.
Alexander, C.M.O.’.D., Fogel, M., Yabuta, H., Cody, G.D., 2007. The origin andevolution of chondrites recorded in the elemental and isotopic compositions oftheir macromolecular organic matter. Geochim. Cosmochim. Acta 71, 4380–4403.
Angel, R.J., 1988. High-pressure structure of anorthite. Am. Miner. 73, 1114–1119.Barrat, J.A. et al., 2008. Geochemistry of diogenites: Still more diversity in their
parental melts. Meteorit. Planet. Sci. 43, 1759–1775.Barrat, J.A., Yamaguchi, A., Jambon, A., Bollinger, C., Boudouma, O., 2012. Low-Mg
rock debris in howardites: Evidence for KREEPy lithologies on Vesta? Geochim.Cosmochim. Acta 99, 193–205.
Beck, A.W., McSween, H.Y., 2010. Diogenites as polymict breccias composed oforthopyroxenite and harzburgite. Meteorit. Planet. Sci. 45, 850–872.
Beck, P., Barrat, J.-A., Grisolle, F., Quirico, E., Schmitt, B., Moynier, F., Gillet, P., Beck,C., 2011. NIR spectral trends of HED meteorites: Can we discriminate betweenmagmatic evolution, mechanical mixing and observation geometry effects?Icarus 216, 560–571.
Bish, D.L., Post, J.E., 1993. Quantitative mineralogical analysis using the Rietveldfull-pattern fitting method. Am. Miner. 78, 932–940.
Bland, P.A., Cressey, G., Menzies, O.N., 2004. Modal mineralogy of carbonaceouschondrites by X-ray diffraction and Mössbauer spectroscopy. Meteorit. Planet.Sci. 39, 3–16.
Britt, D.T., Pieters, C.M., 1988. Bidirectional reflectance properties of iron–nickelmeteorites. Proc. Lunar Planet. Sci. 18, 503–512.
Britt, D.T., Pieters, C.M., 1994. Darkening in black and gas-rich ordinary chondrites:The spectral effects of opaque morphology and distribution. Geochim.Cosmochim. Acta 18, 3905–3919.
Britt, D.T., Bell, J.F., Hacck, H., Scott, E.R.D., 1992. The reflectance spectrum of troilite.Lunar Planet. Sci. 23, 167–168.
Browning, L., Zolensky, M., Barrett, R., 1991. Serpentine and modal compositions ofCM chondrites. Lunar Planet. Sci. 22, 145–146 (abstract).
Browning, L.B., McSween Jr., H.Y., Zolensky, M.E., 1996. Correlated alteration effectsin CM carbonaceous chondrites. Geochim. Cosmochim. Acta 60, 2621–2633.
Buchanan, P.C., Mittlefehldt, D.W., 2003. Lithic components in the pairedhowardites EET 87503 and EET 87513: Characterization of the regolith of 4Vesta. Antarct. Meteorite Res. 16, 128–151.
Buchanan, P.C., Zolensky, M.E., Reid, A.M., 1993. Carbonaceous chondrite clasts inthe howardites Bholghati and EET 87513. Meteoritics 28, 659–682.
Bunch, T.E., Chang, S., 1980. Carbonaceous chondrites – II. Carbonaceous chondritephyllosilicates and light element geochemistry as indicators of parent bodyprocesses and surface conditions. Geochim. Cosmochim. Acta 44, 1543–1578.
Bunch, T.E., Irving, A.J., Wittke, J.H., Kuehner, S.M., Rumble III, D., Sipiera, P.P., 2010.Northwest Africa 5784, Northwest Africa 5968 and Northwest Africa 6157:More Vestan dunites and olivine diogenites. Meteorit. Planet. Sci. 45. Abstract#5315.
Burbine, T.H., Meibom, A., Binzel, R.P., 1996. Mantle material in the main belt:Battered to bits? Meteorit. Planet. Sci. 31, 607–620.
Burbine, T.H. et al., 2001. Vesta, Vestoids, and the howardite, eucrite, diogenitegroup: Relationships and the origin of spectral differences. Meteorit. Planet. Sci.36, 761–781.
Burbine, T.H., McCoy, T.J., Meibom, A., Gladman, B., Keil, K., 2002. Meteorite parentbodies: Their number and identification. In: Bottke, W.F., Jr., Cellino, A.,Paolicchi, P., Binzel, R.P. (Eds.), Asteroids III. Univ. Arizona Press, Tucson, pp.653–667.
Burbine, T.H., Buchanan, P.C., Binzel, R.P., 2007. Deriving formulas from HED spectrafor determining the pyroxene mineralogy of Vesta and vestoids. Lunar Planet.Sci. 38. Abstract #2117.
Burgess, R., Wright, I.P., Pillinger, C.T., 1991. Determination of sulphur-bearingcomponents in C1 and C2 carbonaceous chondrites by stepped combustion.Meteoritics 26, 55–64.
Burns, R.G., 1970. Mineralogical Applications of Crystal Field Theory. CambridgeUniv. Press, Cambridge, UK, 224pp.
Burns, R.G., Fisher, D.S., 1991. Clay minerals in carbonaceous chondrites:Characterization by cryogenic Mössbauer spectroscopy. In: Clay MineralsSociety 28th Annual Meeting, Houston, TX, LPI Contrib. 773. Abstract 23.
Burns, R.G., Fisher, D.S., 1994. Nanophase mixed-valence iron minerals inmeteorites identified by cryogenic Mössbauer spectroscopy. HyperfineInteract. 91, 571–576.
Chou, C.-L., Boynton, W.V., Bild, R.W., Kimberlin, J., Wasson, J.T., 1976. Trace elementevidence regarding a chondritic component in howardite meteorites. Proc.Lunar Sci. Conf. 3501–3518.
Clark, R.N., Roush, T.L., 1984. Reflectance spectroscopy: Quantitative analysistechniques for remote sensing applications. J. Geophys. Res. 89, 6329–6340.
Cloutis, E.A., Gaffey, M.J., 1991. Pyroxene spectroscopy revisited: Spectral–compositional correlations and relationship to geothermometry. J. Geophys.Res. 96, 22809–22826.
Cloutis, E.A., Gaffey, M.J., Jackowski, T.L., Reed, K.L., 1986. Calibration of phaseabundance, composition and particle size distribution for olivine–orthopyroxene mixtures from reflectance spectra. J. Geophys. Res. 91, 11641–11653.
Cloutis, E.A., Sunshine, J.M., Morris, R.V., 2004. Spectral reflectance-compositionalproperties of spinels and chromites: Implications for planetary remote sensingand geothermometry. Meteorit. Planet. Sci. 39, 545–565.
Cloutis, E.A., Hardersen, P.S., Bish, D.L., Bailey, D.T., Gaffey, M.J., Craig, M.A., 2010.Reflectance spectra of iron meteorites: Implications for spectral identification oftheir parent bodies. Meteorit. Planet. Sci. 45, 304–332.
Cloutis, E.A., Hudon, P., Hiroi, T., Gaffey, M.J., Mann, P., 2011. Spectral reflectanceproperties of carbonaceous chondrites: 2. CM chondrites. Icarus 216, 309–346.
Cody, G.D., Alexander, C.M. O’D., Tera, F., 2003. Compositional trends in chondriticorganic solids within and between meteorite groups. Lunar Planet. Sci. 34.Abstract #1822.
Connolly Jr., H.C. et al., 2007. The Meteoritical Bulletin, No. 91, 2007 March.Meteorit. Planet. Sci. 42, 413–466.
Craig, M.A., Cloutis, E.A., Bailey, D.T., 2007. The effects of grain size, <45–1000 lm,on the reflectance spectrum of planetary analogs from 0.35–2.5 lm. LunarPlanet. Sci. 38. Abstract #1356.
Craig, M.A., Cloutis, E.A., Reddy, V., Bailey, D.T., Gaffey, M.J., 2008. The effects ofgrain size, <10 lm–4.75 mm, on the reflectance spectrum of planetary analogsfrom 0.35–2.5 lm. Lunar Planet. Sci. 39. Abstract #2082.
Crown, D.A., Pieters, C.M., 1987. Spectral properties of plagioclase and pyroxenemixtures and the interpretation of lunar soil spectra. Icarus 72, 492–506.
Denevi, B.W. et al., 2012. Pitted terrain on Vesta and implications for the presence ofvolatiles. Science 338, 246–249.
Donaldson Hanna, K., Sprague, A.L., 2009. Vesta and the HED meteorites: Mid-infrared modeling of minerals and their abundances. Meteorit. Planet. Sci. 44,1755–1770.
Downs, R.T., Palmer, D.C., 1994. The pressure behavior of alpha cristobalite. Am.Miner. 79, 9–14.
Drake, M.J., 2001. The eucrite/Vesta story. Meteorit. Planet. Sci. 36, 501–513.Duffard, R., Lazzaro, D., De León, J., 2005. Revisiting spectral parameters of silicate-
bearing meteorites. Meteorit. Planet. Sci. 40, 445–459.El Amri, C., Maurel, M.-C., Sagon, G., Baron, M.-H., 2005. The micro-distribution of
carbonaceous matter in the Murchison meteorite as investigated by Ramanimaging. Spectrochim. Acta A 61, 2049–2056.
Facchinelli, A., Bruno, E., Chiari, G., 1979. The structure of bytownite quenched from1723 K. Acta Crystallogr. B 35, 34–42.
Fitzgerald, M.J., 1980. Muckera and millbillillie – Australian achondritic meteorites.Trans. R. Soc. South Austr. 104, 201–209.
Fu, R.R. et al., 2012. An ancient core dynamo in Asteroid Vesta. Science 338, 238–241.
Fuchs, L.H., Olsen, E., Jensen, K.J., 1973. Mineralogy, mineral-chemistry, andcomposition of the Murchison (C2) meteorite. Smithsonian Contrib. Earth Sci.10, 1–39.
Gaffey, M.J., 1974. A Systematic Study of the Spectral Reflectivity Characteristics ofthe Meteorite Classes with Applications to the Interpretation of AsteroidSpectra for Mineralogical and Petrological Information. PhD dissertation.Massachusetts Institute of Technology, Cambridge, Massachusetts. 355pp.
Gaffey, M.J., 1976. Spectral reflectance characteristics of the meteorite classes. J.Geophys. Res. 81, 905–920.
Gaffey, M.J., 1997. Surface lithologic heterogeneity of Asteroid 4 Vesta. Icarus 127,130–157.
Gaffey, M.J., 2003. Observational and data reduction techniques to optimizemineralogical characterizations of asteroid surface materials. Lunar Planet.Sci. 36. Abstract #1602.
Gaffey, M.J., 2005. The critical importance of data reduction calibrations in theinterpretability of S-type asteroid spectra. Lunar Planet. Sci. 36. Abstract #1916.
876 E.A. Cloutis et al. / Icarus 223 (2013) 850–877
Gaffey, M.J., 2010. Space weathering and the interpretation of asteroid reflectancespectra. Icarus 209, 564–574.
Gaffey, M.J., Cloutis, E.A., Kelley, M.S., Reed, K.L., 2002. Mineralogy of asteroids. In:Bottke, W.F., Cellino, A., Paolicchi, P., Binzel, R.P. (Eds.), Asteroids III. Universityof Arizona Press, Tucson, pp. 183–204.
Garber, J.M., Righter, K., 2011. A howardite–eucrite–diogenite (HED) meteoritecompendium: Summarizing samples of Asteroid 4 Vesta in preparation for theDawn mission. Lunar Planet. Sci. 42. Abstract #2141.
Gardinier, A., Robert, F., Derenne, S., Behar, F., Largeau, C., 1999. Geochemical studyof the insoluble organic matter of Orgueil and Murchison meteorites. Meteorit.Planet. Sci. 34, A40–A41 (abstract).
Gounelle, M., Zolensky, M.E., Liou, C.-L., Bland, P.A., Alard, O., 2003. Mineralogy ofcarbonaceous chondritic microclasts in howardites: Identification of C2 fossilmicrometeorites. Geochim. Cosmochim. Acta 67, 507–527.
Grossman, J.N., 1999. The Meteoritical Bulletin, No. 83, 1999 July. Meteorit. Planet.Sci. 34, A169–A186.
Grossman, L., Olsen, E., 1974. Origin of the high-temperature fraction of C2chondrites. Geochim. Cosmochim. Acta 38, 173–187.
Gualtieri, A.F., 2000. Accuracy of XRPD QPA using the combined Rietveld-RIRmethod. J. Appl. Crystallogr. 33, 267–278.
Herrin, J.S., Zolensky, M.E., Mittlefehldt, D.W., 2010. A carbonaceous chondrite-richlithology from the HED parent asteroid. PRA 04401. Meteorit. Planet. Sci. 45.Abstract #5438.
Herrin, J.S., Zolensky, M.E., Cartwright, J.A., Mittlefehldt, D.W., Ross, D.K., 2011.Carbonaceous chondrite-rich howardites: The potential for hydrous lithologieson the HED parent. Lunar Planet. Sci. 42. Abstract #2806.
Hezel, D.C., Russell, S.S., Ross, A.J., Kearsley, A.T., 2008. Modal abundances of CAIs:Implications for bulk chondrite element abundances and fractionations.Meteorit. Planet. Sci. 43, 1879–1894.
Hiroi, T., Binzel, R.P., Sunshine, J.M., Pieters, C.M., Takeda, H., 1995. Grain sizes andmineral compositions of surface regoliths of Vesta-like asteroids. Icarus 115,374–386.
Hiroi, T., Pieters, C.M., Vilas, F., Sasaki, S., Hamabe, Y., Kurahashi, E., 2001. Themystery of 506.5 nm feature of reflectance spectra of Vesta and Vestoids:Evidence for space weathering? Earth Planets Space 53, 1071–1075.
Horgan, B., Bell III, J.F., 2012. Widespread weathered glass on the surface of Mars.Geology 40, 391–394.
Howard, C.J., Sabine, T.M., Dickson, F., 1991. Structural and thermal parameters forrutile and anatase. Acta Crystallogr. B 47, 462–468.
Howard, K.T., Benedix, G.K., Bland, P.A., Cressey, G., 2009. Modal mineralogy of CM2chondrites by X-ray diffraction (PSD-XRD). Part 1: Total phyllosilicateabundance and degree of aqueous alteration. Geochim. Cosmochim. Acta 73,4576–4589.
Hugh-Jones, D.A., Angel, R.J., 1994. A compressional study of MgSiO3 orthoenstatiteup to 8.5 GPa. Am. Miner. 79, 405–410.
Hunt, G.R., Salisbury, J.W., Lenhoff, C.J., 1971. Visible and near-infrared spectra ofminerals and rocks: III. Oxides and hydroxides. Mod. Geol. 2, 195–205.
Janots, E. et al., 2012. Jiddat al Harasis 556: A howardite impact melt breccia with anH chondrite component. Meteorit. Plant. Sci. 47, 1558–1574.
Jarosewich, E., 1971. Chemical analysis of the Murchison meteorite. Meteoritics 6,49–52.
Jarosewich, E., 1990. Chemical analyses of meteorites: A compilation of stony andiron meteorite analyses. Meteoritics 25, 323–337.
Keil, K., Bell, J.F., Britt, D.T., 1992. Reflection spectra of shocked ordinary chondritesand their relationship to asteroids. Icarus 98, 43–53.
King, T.V.V., Ridley, I.W., 1987. Relation of the spectroscopic reflectance of olivine tomineral chemistry and some remote sensing implications. J. Geophys. Res. 92,11457–11469.
Kitts, K., Lodders, K., 1998. Survey and evaluation of eucrite bulk compositions.Meteorit. Planet. Sci. 33, A197–A213.
Klima, R.L., Pieters, C.M., Carby, M.D., 2008. Characterization of the 1.2 lm M1pyroxene band: Extracting cooling history from near-IR spectra of pyroxenesand pyroxene-dominated rocks. Meteorit. Planet. Sci. 43, 1591–1604.
Krawczynski, M.J., Elkins-Tanton, L.T., Grove, T.L., 2008. Petrology of olivine–diogenite MIL034439: Constraints on eucrite parent body bulk composition andmagmatic processes. Lunar Planet. Sci. 39. Abstract #1229.
Le Corre, L., Reddy, V., Nathues, A., Cloutis, E.A., 2011. How to characterize terrainson 4 Vesta using Dawn Framing Camera color bands? Icarus 216, 376–386.
Lenaz, D., Skogby, H., Princivalle, F., Halenius, U., 2004. Structural changes andvalence states in the MgCr2O4–FeCr2O4 solid solution series. Phys. Chem. Miner.31, 633–642.
Li, J.-Y., McFadden, L.A., Thomas, P.C., Mutchler, M.J., Parker, J.W., Young, E.F.,Russell, C.T., Sykes, M.V., Schmidt, B.E., 2010. Photometric mapping of Asteroid(4) Vesta’s southern hemisphere with Hubble Space Telescope. Icarus 208, 238–251.
Li, J.-Y., Bodewits, D., Feaga, L.M., Landsman, W., A’Hearn, M.F., Mutchler, M.J.,Russell, C.T., McFadden, L.A., Raymond, C.A., 2011. Ultraviolet spectroscopy ofAsteroid (4) Vesta. Icarus 216, 640–649.
Lorenz, K.A., Nazarov, M.A., Kurat, G., Brandstaetter, F., Ntaflos, Th., 2007. Foreignmeteoritic material of howardites and polymict eucrites. Petrology 15, 109–125.
Mason, B., Jarosewich, E., Nelen, J.A., 1979. The pyroxene-plagioclase achondrites.Smithsonian Contrib. Earth Sci. 22, 27–45.
Mayne, R.G., Sunshine, J.M., McSween, H.Y., McCoy, T.J., Corrigan, C.M., Gale, A., 2010.Petrologic insights from the spectra of the unbrecciated eucrites: Implications forVesta and basaltic asteroids. Meteorit. Planet. Sci. 45, 1074–1092.
Mayne, R.G., Sunshine, J.M., McSween Jr., H.Y., Bus, S.J., McCoy, T.J., 2011. Origins ofVesta’s crust: Insights from spectroscopy of the Vestoids. Icarus 214, 147–160.
McCord, T.B., Adams, J.B., Johnson, T.V., 1970. Asteroid Vesta: Spectral reflectivityand compositional implications. Science 168, 1445–1447.
McCord, T.B. et al., 2012. Dark material on Vesta from the infall of carbonaceousvolatile-rich material. Nature 491, 83–86.
McCoy, T., Reynolds, V., 2007. PRA 04401; PRA 04402. Antarct. Meteorite Newsl. 30.McFadden, L.A., Gaffey, M.J., Takeda, H., Jackowski, T.L., Reed, K.L., 1982. Reflectance
spectroscopy of diogenite meteorite types from Antarctica and theirrelationship to asteroids. Proc. Symp. Antarct. Meteorit. 7, 188–206.
McSween Jr., H.Y., 1979. Alteration in CM carbonaceous chondrites inferred frommodal and chemical variations in matrix. Geochim. Cosmochim. Acta 43, 1761–1770.
McSween Jr., H.Y., Mittlefehldt, D.W., Beck, A.W., Mayne, R.G., McCoy, T.J., 2011.HED meteorites and their relationship to the geology of Vesta and the Dawnmission. Space Sci. Rev. 163, 141–174.
Mittlefehldt, D.W., McCoy, T.J., Goodrich, C.A., Kracher, A., 1998. Non-chondriticmeteorites from asteroidal bodies. In: Papike, J.J. (Ed.), Planetary Materials.Reviews in Mineralogy 36. Mineralogical Society of America, Washington, DC(chapter 4).
Morimoto, N., Güven, N., 1970. Refinement of the crystal structure of pigeonite. Am.Miner. 55, 1195–1209.
Moroz, L., Arnold, G., 1999. Influence of neutral components on relative bandcontrasts in reflectance spectra of intimate mixtures: Implications for remotesensing 1. Nonlinear mixing modeling. J. Geophys. Res. 104, 14109–14121.
Moroz, L.V., Schade, U., Rout, S.S., Bischoff, A., 2011. Reflectance spectroscopy ofcloudy pyroxenes from Millbillillie eucrite. Eur. Planet. Sci. Conf. 6. Abstract#1826.
Moskovitz, N.A., Willman, M., Burbine, T.H., Binzel, R.P., Bus, S.J., 2010. Aspectroscopic comparison of HED meteorites and V-type asteroids in theinner main-belt. Icarus 208, 773–788.
Nakamura, T., Okazaki, R., Huss, G.R., 2006. Thermal metamorphism of CMcarbonaceous chondrites: Effects on phyllosilicate mineralogy and presolargrain abundance. Lunar Planet. Sci. 37, abstract #1633.
Noro, H., Nagasawa, K., Tokonami, M., 1980. Major element composition of clayminerals in the Murchison (C2) carbonaceous chondrite matrix. Proc. NIPRSymp. Antarctic Meteorites 5, 311–317.
Olsen, E.J., Davis, A.M., Hutcheon, I.D., Clayton, R.N., Mayeda, T.K., Grossman, L.,1988. Murchison xenoliths. Geochim. Cosmochim. Acta 52, 1615–1626.
Paniello, R.C., Moynier, F., Beck, P., Barrat, J.-A., Podosek, F.A., Pichat, S., 2012. Zincisotopes in HEDs: Clues to the formation of 4-Vesta, and the uniquecomposition of Pecora Escarpment 82502. Geochim. Cosmochim. Acta 86, 76–87.
Pearson, V.K., Sephton, M.A., Kearsley, A.T., Bland, P.A., Franchi, I.A., Gilmour, I.,2002. Clay mineral–organic matter relationships in the early Solar System.Meteorit. Planet. Sci. 37, 1829–1833.
Pearson, V.K., Sephton, M.A., Franchi, I.A., Gibson, J.M., Gilmour, I., 2006. Carbon andnitrogen in carbonaceous chondrites: Elemental abundances and stable isotopecompositions. Meteorit. Planet. Sci. 41, 1899–1918.
Pecharsky, V.K., Zavalij, P.Y., 2005. Fundamentals of Powder Diffraction andStructural Characterization of Materials. Springer, New York.
Pieters, C.M., 1983. Strength of mineral absorption features in the transmittedcomponent of near-infrared light: First results from RELAB. J. Geophys. Res. 88,9534–9544.
Pieters, C.M., Hiroi, T., 2004. RELAB (Reflectance Experiment Laboratory): A NASAmulti-use spectroscopy facility. Lunar Planet. Sci. 35. Abstract #1720.
Pieters, C.M. ET AL., 2005. Asteroid–meteorite links: The Vesta conundrum(s). In:Lazzaro, D., Ferraz-Mello, S., Fernandez, J.A. (Eds.), Asteroids, Comets, Meteors.Proc. IAU Symp., vol. 229, pp. 273–288.
Pieters, C.M. et al., 2010a. Space weathering on 4 Vesta: Processes and products.Lunar Planet. Sci. 43. Abstract #1254.
Pieters, C.M. et al., 2012b. Distinctive space weathering on Vesta from regolithmixing processes. Nature 491, 79–82.
Pompilio, L., Pedrazzi, G., Sgavetti, M., Cloutis, E.A., Craig, M.A., Roush, T.L., 2009.Exponential Gaussian approach for spectral modeling: The EGO algorithm, I.Band saturation. Icarus 201, 781–794.
Pompilio, L., Pedrazzi, G., Cloutis, E.A., Craig, M.A., Roush, T.L., 2010. ExponentialGaussian approach for spectral modeling: The EGO algorithm II. Bandasymmetry. Icarus 208, 811–823.
Prettyman, T.H. et al., 2012. Elemental mapping by Dawn reveals exogenic H inVesta’s regolith. Science 338, 242–246.
Reddy, V., Gaffey, M.J., Kelley, M.S., Nathues, A., Li, J.-Y., Yarbrough, R., 2010.Compositional heterogeneity of Asteroid 4 Vesta’s southern hemisphere:Implications for the Dawn mission. Icarus 210, 693–706.
Reddy, V. et al., 2012a. Color and albedo heterogeneity of Vesta from Dawn. Science336, 700–704.
Reddy, V., Sanchez, J.A., Nathues, A., Moskovitz, N.A., Li, J.Y., Cloutis, E.A., Archer, K.,Tucker, R.A., Gaffey, M.J., Mann, J.P., Sierks, H., Schade, U., 2012b. Photometric,spectral phase and temperature effects on Vesta and HED meteorites:Implications for Dawn mission. Icarus 217, 153–168.
Reddy, V., Le Corre, L., O’Brien, D.P., Nathues, A., Cloutis, E.A., Durda, D.D., Bottke,W.F., Bhatt, M.U., Nesvorny, D., Buczkowski, D., Scully, J.E.C., Palmer, E.M.,Sierks, H., Mann, P.J., Becker, K.J., Beck, A.W., Mittlefehldt, D., Li, J.-Y., Gaskell, R.,Russell, C.T., Gaffey, M.J., McSween, H.Y., McCord, T.B., Combe, J.-P., Blewett, D.,2012c. Delivery of dark material to Vesta via carbonaceous chondritic impacts.Icarus 221, 544–559.
E.A. Cloutis et al. / Icarus 223 (2013) 850–877 877
Rietveld, H.M., 1969. A profile refinement method for nuclear and magneticstructures. J. Appl. Crystallogr. 2, 65–71.
Rubin, A.E., Trigo-Rodriguez, J.M., Huber, H., Wasson, J.T., 2007. Progressive aqueousalteration of CM carbonaceous chondrites. Geochim. Cosmochim. Acta 71,2361–2382.
Russell, C.T., Raymond, C.A., 2011. The Dawn mission to Vesta and Ceres. Space Sci.Rev. 163, 3–23.
Russell, S.S. et al., 2004. The Meteoritical Bulletin, No. 88, 2004 July. Meteorit.Planet. Sci. 39, A215–A272.
Russell, S.S. et al., 2005. The Meteoritical Bulletin, No. 89, 2005 September. Meteorit.Planet. Sci. 40, A201–A263.
Russell, C.T. et al., 2007. Dawn mission to Vesta and Ceres: Symbiosis betweenterrestrial observations and robotic exploration. Earth Moon Planets 101, 65–91.
Schade, U., Wäsch, R., 1999. NIR reflectance spectroscopy of mafic minerals in thetemperature range between 80 and 473 K. Adv. Space Res. 23, 1253–1256.
Shankland, K., 2004. Global Rietveld refinement. J. Res. Natl. Inst. Standards Technol.109, 143–154.
Shearer, C.K., Burger, P., Papike, J.J., 2010. Petrogenetic relationships betweendiogenites and olivine diogenites: Implications for magmatism on the HEDparent body. Geochim. Cosmochim. Acta 74, 4865–4880.
Skála, R. et al., 2006. Inversion twinning in troilite. Am. Miner. 91, 917–921.Smyth, J.R., Hazen, R.M., 1973. The crystal structures of forsterite and hortonolite at
several temperatures up to 900 �C. Am. Miner. 58, 588–593.Sunshine, J.M., Pieters, C.M., 1998. Determining the composition of olivine from
reflectance spectroscopy. J. Geophys. Res. 103, 13675–13688.Sunshine, J.M., Bus, S.J., McCoy, T.J., Burbine, T.H., Corrigan, C.M., Binzel, R.P., 2004.
High-calcium pyroxene as an indicator of igneous differentiation in asteroidsand meteorites. Meteorit. Planet. Sci. 39, 1343–1357.
Thomas, P.C., Binzel, R.P., Gaffey, M.J., Storrs, A.D., Wells, E.N., Zellner, B.H., 1997.Impact excavation on Asteroid 4 Vesta: Hubble Space Telescope results. Science277, 1492–1495.
Tomioka, N., Tomeoka, K., Nakamura-Messenger, K., Sekine, T., 2007. Heating effectsof the matrix of experimentally shocked Murchison CM chondrite: Comparisonwith micrometeorites. Meteorit. Planet. Sci. 42, 19–30.
Trigo-Rodriguez, J.M., Rubin, A.E., Wasson, J.T., 2006. Non-nebular origin of darkmantles around chondrules and inclusions in CM meteorites. Geochim.Cosmochim. Acta 70, 1271–1290.
Vali, H. et al., 1998. Association of phyllosilicates and organic mater in the fine-grained matrix of Murchison meteorite. Lunar Planet. Sci. 29. Abstract #1835.
Vernazza, P. et al., 2006. Asteroid colors: A novel tool for magnetic field detection?The case of Vesta. Astron. Astrophys. 451, L43–L46.
Wasson, J.T., Pieters, C.M., Fisenko, A.V., Semjonova, L.F., Moroz, L.V., Warren, P.H.,1997. Simulation of space weathering of HED meteorites by laser impulseirradiation. Lunar Planet. Sci. 28. Abstract #1505.
Wasson, J.T., Pieters, C.M., Fisenko, A.V., Semjonova, L.F., Warren, P.H., 1998.Simulation of space weathering of eucrites by laser impulse irradiation. LunarPlanet. Sci. 29. Abstract #1940.
Watson, D.E., Larson, E.E., Herndon, J.M., Rowe, M.W., 1975. Thermomagneticanalysis of meteorites, 2. C2 chondrites. Earth Planet. Sci. Lett. 27, 101–107.
Wechsler, B.A., Prewitt, C.T., 1984. Crystal structure of ilmenite (FeTiO3) at hightemperature and high pressure. Am. Miner. 69, 176–185.
Wilson, S.A., Raudsepp, M., Dipple, G.M., 2006. Verifying and quantifying carbonfixation in minerals from serpentine-rich mine tailings using the Rietveldmethod with X-ray powder diffraction data. Am. Miner. 91, 1331–1341.
Yabuta, H., Naraoka, H., Sakanishi, K., Kawashima, H., 2005. Solid state 13C NMRcharacterization of insoluble organic matter from Antarctic CM2 chondrites:Evaluation of the meteoritic alteration level. Meteorit. Planet. Sci. 40, 779–787.
Yamaguchi, A., Takeda, H., Bogard, D.D., Garrison, D., 1994. Textural variations andimpact history of the Millbillillie eucrite. Meteorit. Planet. Sci. 29, 237–245.
Young, R.A., 1993. Introduction to the Rietveld method. In: Young, R.A. (Ed.), TheRietveld Method. International Union of Crystallography, London, pp. 1–39.
Young, R.A., Mackie, P.E., von Dreele, R.B., 1977. Application of the pattern-fittingstructure-refinement method of X-ray powder diffractometer patterns. J. Appl.Crystallogr. 10, 262–269.
Zolensky, M., Barrett, R., Browning, L., 1993. Mineralogy and composition of matrixand chondrule rims in carbonaceous chondrites. Geochim. Cosmochim. Acta 57,3123–3148.
Zolensky, M.E., Weisberg, M.K., Buchanan, P.C., Mittlefehldt, D.W., 1996. Mineralogyof carbonaceous chondrite clasts in HED achondrites and the Moon. Meteorit.Planet. Sci. 31, 518–537.