Embed Size (px)
Citation preview
ISSN 1812–5123. Russian Journal of Biomechanics. 2013. Vol. 17, No. 1 (59): 57–68
© Kruchinin P.A., Lebedev A.V., Kholmogorova N.V., 2013 Pavel A. Kruchinin, Ph.D., Associate Professor of Department of Applied Mechanics and Control, Moscow Anton V. Lebedev, Ph.D., Senior Researcher of Laboratory of Software of Imitating Dynamic Systems, Moscow Nataliya V. Kholmogorova, Ph.D., Associate Professor of Department of Anatomy and Physiology of Human and Animals, Moscow
SPECIFIC CHARACTERISTICS OF FREQUENCY ANALYSIS OF FORCE-TORQUE SENSORS DATA IN THE PHYSIOLOGICAL TREMOR
RESEARCH
P.A. Kruchinin1,2, A.V. Lebedev1, N.V. Kholmogorova2,3 1Faculty of Mechanics and Mathematics, Moscow Lomonosov State University, Leninskie Gory, Moscow, 119992, Russia, e-mail: [email protected] 2Moscow State University of Psychology and Education, 29 Sretenka Street, Moscow, 127051, Russia, e-mail: [email protected] 3Moscow State Pedagogical University, 1/1 M. Pirogovskaya Street, Moscow, 119991, Russia, e-mail: [email protected]
Abstract. The hardware & software packages with force-torque sensors are widely used for assessment of the functional status, neurologic and orthopedic pathologies of a person. Application of these sensors allows us to make noninvasive examinations without any measuring sensitive elements, electrodes or markers fastened on a human body. The hardware & software package "Multifunctional chair" presents an example of system allowing such examinations. The hardware & software package includes a special chair which is supplied with a set of uniaxial force plates mounted in a seat, in the back and in the bottom, and two three-component force-torque sensors located in arm-rests. The signal measured by the force-torque sensor interacting with the human body or its segments is integrative. It includes mechanical components due to motion of the control system, as well as respiration, heart rate, etc. These components are reflected in frequency spectrum of the data from the force-torque sensor. The article discusses the problem of allocation of the oscillatory components (tremor) due to contraction of human skeletal muscles. The character of peaks of the spectrum power of the measured signal depending on the oscillation source that generated this peak is under study. We compared the spectrum data from the force-torque sensors with the spectrum data from the alternative measuring instruments: respiration sensor, measurements of markers coordinates by motion capture system, indications of microelectromechanical sensors of acceleration and angular rate. It has been shown that the frequency analysis of data of the force-torque sensors interacting with the human body or its segments allows us to allocate in most cases the micromovements caused by vegetative components (respiration, cardiorhythm) and the motion control system, in particular the tremulous components generated by skeletal muscles activity.
Key words: force-torque sensor, tremor, spectral analysis, oscillation frequency.
INTRODUCTION A rhythmic oscillatory motion of at least one functional area of the body is known as tremor. Tremor can take many forms. The main reason for the tremor seems to be regarded the self-oscillating circuit control of muscle activity [4, 5]. At the same time, there is significant diversity of the tremor manifestations in people due to the individual characteristics of their neurological condition [5, 12]. The frequency analysis of tremor is one of the important tasks, the solution of this problemis is necessary for the early diagnostics of neurological disorders.
P.A. Kruchinin, A.V. Lebedev, N.V. Kholmogorova
ISSN 1812–5123. Russian Journal of Biomechanics. 2013. Vol. 17, No. 1 (59): 57–68 58
Traditional survey methods: accelerometer measurement, electromyographic studies as well as other methods to distinguish tremor, such as motion capture and goniometry, require attachment of the measuring sensors, electrodes or markers to the body of the subject. This fact increases time of the comprehensive examination, which examines not only the fact of the tremor of a functional body region, but also requires the identification of tremor locus that has no obvious visual manifestations [7]. Use of force-torque sensors for this purpose seems to be more advantageous. We can apply, for example, force sensors used in modern practice. These sensors are used in all kinds of force plates [14, 15], chairs [8, 13], and beds [2]. These sensors are mounted in bearings of seat or bed. There are ways to detect high-amplitude tremor by means of such sensors [2, 3]. More informative is the situation in which a large number of such sensors have mounted on a surface in contact with a large part of the patient’s body and limbs [11]. An example of such a surface gives a hardware & software package "Multifunctional chair" that is a joint development of the Moscow State University of Psychology and Education, and Experimental Design Bureau "RITM" from Taganrog (Russia) [9].
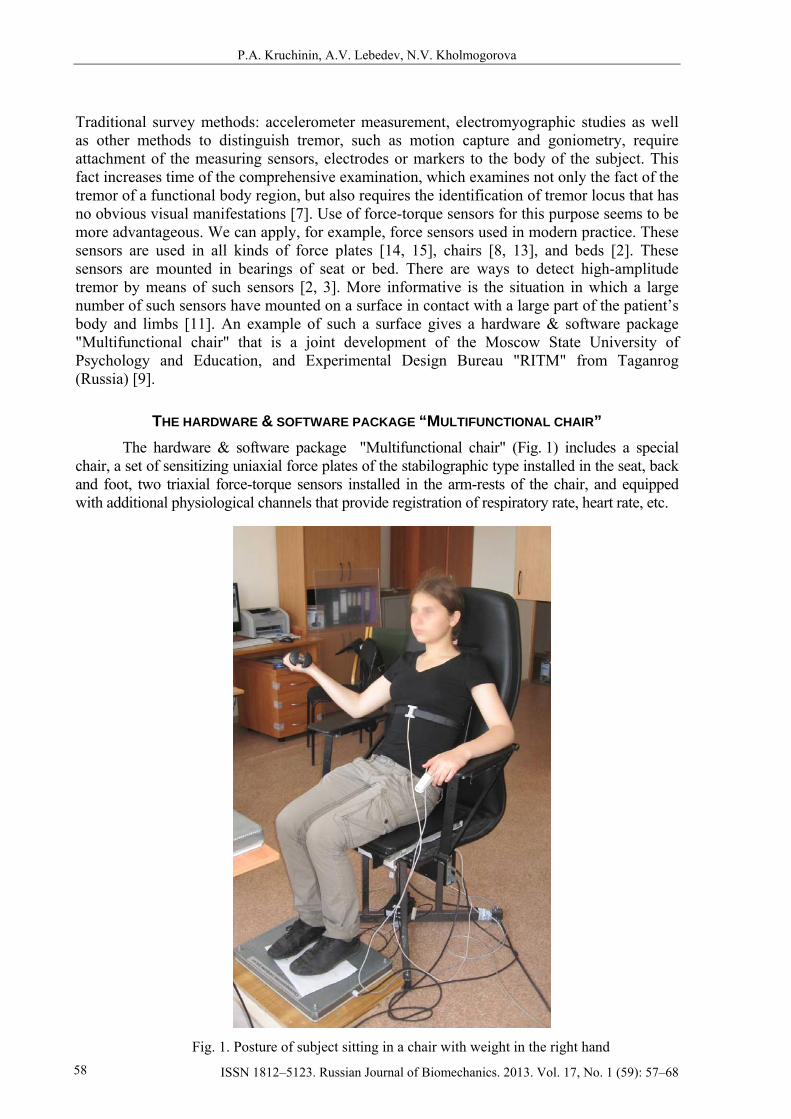
THE HARDWARE & SOFTWARE PACKAGE “MULTIFUNCTIONAL CHAIR” The hardware & software package "Multifunctional chair" (Fig. 1) includes a special
chair, a set of sensitizing uniaxial force plates of the stabilographic type installed in the seat, back and foot, two triaxial force-torque sensors installed in the arm-rests of the chair, and equipped with additional physiological channels that provide registration of respiratory rate, heart rate, etc.
Fig. 1. Posture of subject sitting in a chair with weight in the right hand
Specific characteristics of frequency analysis of the force-torque sensors data in the tremor research
ISSN 1812–5123. Russian Journal of Biomechanics. 2013. Vol. 17, No. 1 (59): 57–68 59
There are two significant advantages of "Multifunctional chair". First, it allows the simultaneous detection of postural micromotions of the various body parts. Second, in contrast to known analogs, the sensors of "Multifunctional chair" are distributed in parts of the body of the subject. We have more accurate information about the source of the observed vibration processes, this reduces the distortions caused by the characteristics of wave propagation in anisotropic media of human body and, thus, we can analyse the dynamics of the excitation source [9].
Signal of force-torque sensors contacting with the human body is inherently integrative and includes both the "muscle" and vegetative components (respiration, heart rate). It is reflected in the frequency spectrum of this signal. The degree of manifestation of a particular component in the frequency spectrum can depend on the method of the signal measurement and the characteristics of posture synergy.
Earlier in [6], the preliminary results of the pilot studies have been discussed. We can see man sitting quietly with different weights in the right hand and obtained sensor data records before, during and immediately after the weight hold. The increasing of oscillations of recorded force-torque sensors on the respiratory frequency have be seen. Technical possibilities of the complex allow us to consider the allocating oscillatory components in force-torque sensor signal, and formulate the task of investigating the spectral properties of respiratory and cardiovascular activity. All of this allowed approaching the problem of analysis of oscillations generated by the motion control system action (conventionally called "muscle" component). The purpose of this publication is to discuss the possible allocation of "muscle" components of the oscillations and their implications for limb tremor with sensors of "Multifunctional chair".
DESCRIPTION OF THE SUBJECT INSPECTION AND PRELIMINARY ANALYSIS OF THE SPECTRA OF FORCE-TORQUE SENSOR DATA
We inspected volunteers in Moscow City Psychological-Educational University by "Multifunctional chair". In the study, subject sat quietly in an armchair in the position shown in Fig. 1. He/she performed a static work in order to intensify the muscle components of oscillations, which was to hold the different masses in the right hand, resting the elbow on the fixed support – arm-rest with built-in sensor. The weight was held in the hand before the onset of fatigue, on the average of 2–4 min. The choice of weight value was determined by the needs and desires of the subject. The interval between two consecutive inspections of one subject was at least 20 minutes. The study involved 75 volunteers of both sexes aged 18 to 60 years without neurological diseases and two persons with Parkinson’s disease. Most of the subjects were students and graduates aged 18–25. 120 records with weights whose masses ranged from 1 to 5.5 kg with a step of 0.5 kg were produced. For the nine subjects, we used removable wrist joint–immobilizer capturing the forearm of loading arm. For these additional tests, the oscillations of the right hand were limited.
The basic method of data processing for "Multifunctional chair" was spectral analysis. We estimated the power spectrum of the signal by MATLAB using a nonparametric Welch method [16]. For the calculations, time intervals were selected the length of which reached 60 sec at the sampling rate of 50 Hz. We used window length ~ 20 sec with overlapping 1 sec. Analysis of spectrum signals of "Multifunctional chair" sensors for healthy subjects allowed us to conclude that spectra have multifrequency character and contain considerable components which are divisible to frequences of breathing and palpitation.
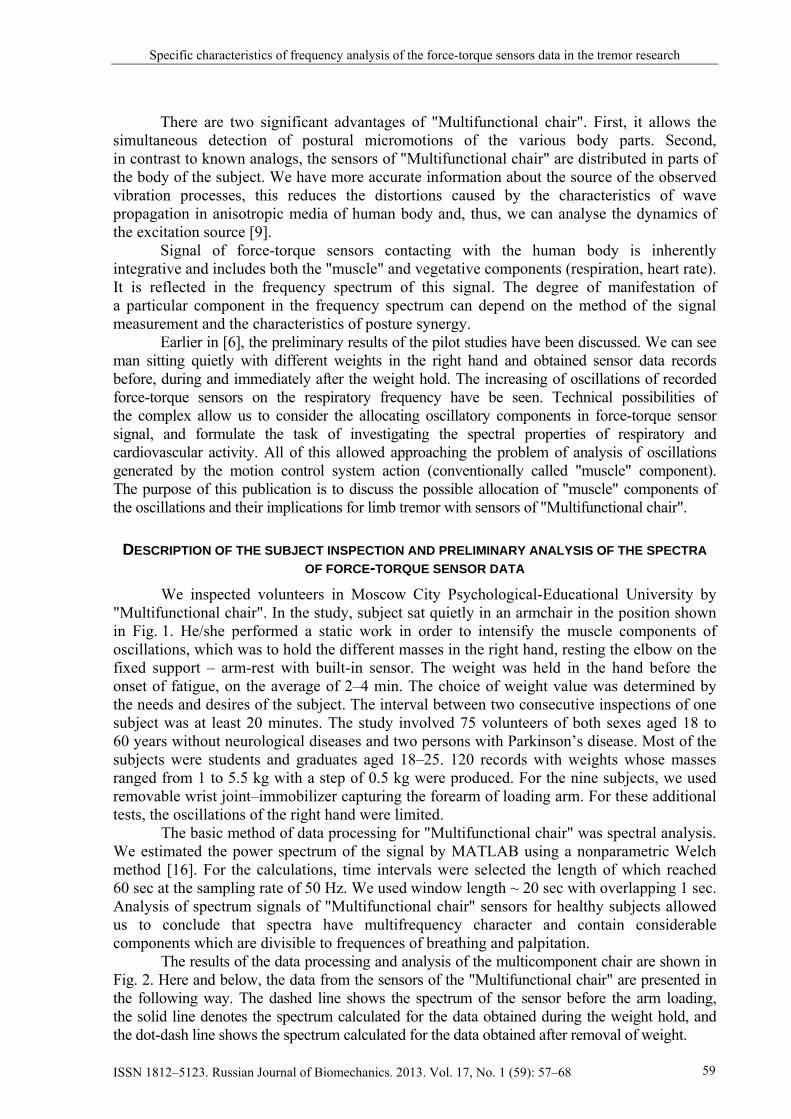
The results of the data processing and analysis of the multicomponent chair are shown in Fig. 2. Here and below, the data from the sensors of the "Multifunctional chair" are presented in the following way. The dashed line shows the spectrum of the sensor before the arm loading, the solid line denotes the spectrum calculated for the data obtained during the weight hold, and the dot-dash line shows the spectrum calculated for the data obtained after removal of weight.
P.A. Kruchinin, A.V. Lebedev, N.V. Kholmogorova
ISSN 1812–5123. Russian Journal of Biomechanics. 2013. Vol. 17, No. 1 (59): 57–68 60
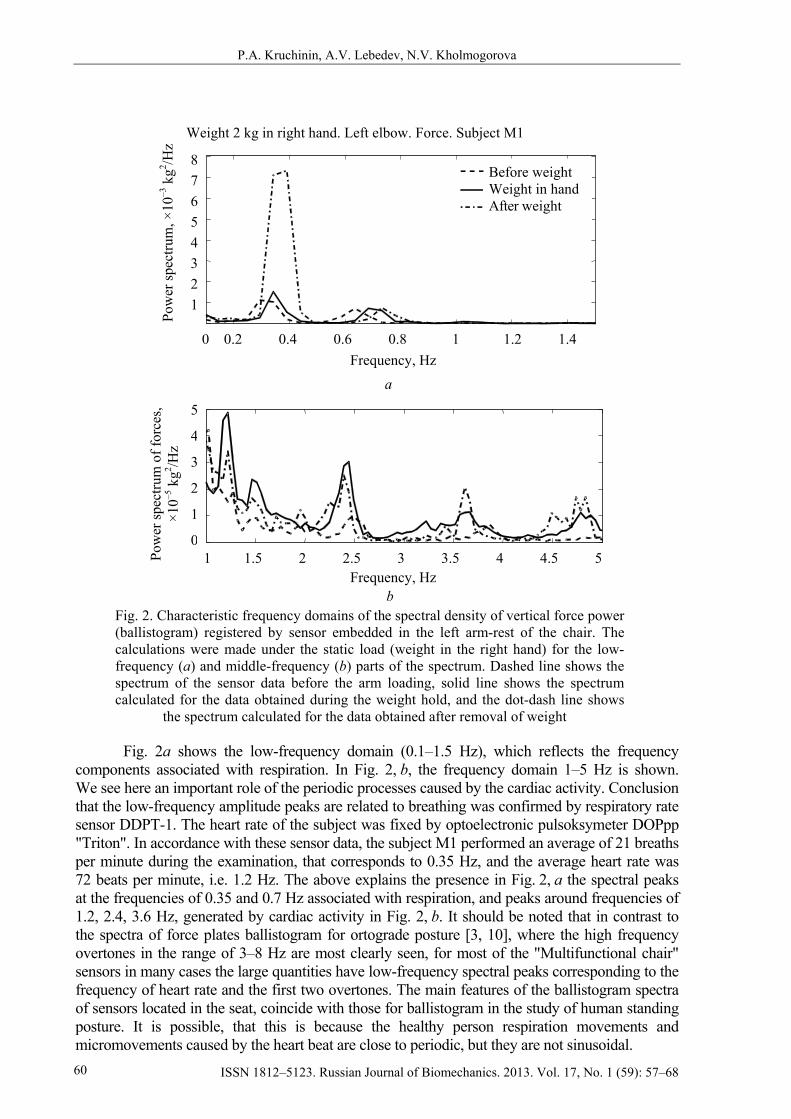
Fig. 2a shows the low-frequency domain (0.1–1.5 Hz), which reflects the frequency components associated with respiration. In Fig. 2, b, the frequency domain 1–5 Hz is shown. We see here an important role of the periodic processes caused by the cardiac activity. Conclusion that the low-frequency amplitude peaks are related to breathing was confirmed by respiratory rate sensor DDPT-1. The heart rate of the subject was fixed by optoelectronic pulsoksymeter DOPpp "Triton". In accordance with these sensor data, the subject M1 performed an average of 21 breaths per minute during the examination, that corresponds to 0.35 Hz, and the average heart rate was 72 beats per minute, i.e. 1.2 Hz. The above explains the presence in Fig. 2, a the spectral peaks at the frequencies of 0.35 and 0.7 Hz associated with respiration, and peaks around frequencies of 1.2, 2.4, 3.6 Hz, generated by cardiac activity in Fig. 2, b. It should be noted that in contrast to the spectra of force plates ballistogram for ortograde posture [3, 10], where the high frequency overtones in the range of 3–8 Hz are most clearly seen, for most of the "Multifunctional chair" sensors in many cases the large quantities have low-frequency spectral peaks corresponding to the frequency of heart rate and the first two overtones. The main features of the ballistogram spectra of sensors located in the seat, coincide with those for ballistogram in the study of human standing posture. It is possible, that this is because the healthy person respiration movements and micromovements caused by the heart beat are close to periodic, but they are not sinusoidal.
Frequency, Hz 0 0.2 0.4 0.6 0.8 1 1.2 1.4
Before weight Weight in hand After weight
Pow
er sp
ectru
m, ×
10–3
kg2 /H
z 8 7 6 5 4 3 2 1
Weight 2 kg in right hand. Left elbow. Force. Subject М1 Po
wer
spec
trum
of f
orce
s, ×1
0–5 k
g2 /Hz
1 1.5 2 2.5 3 3.5 4 4.5 5
Fig. 2. Characteristic frequency domains of the spectral density of vertical force power (ballistogram) registered by sensor embedded in the left arm-rest of the chair. The calculations were made under the static load (weight in the right hand) for the low-frequency (a) and middle-frequency (b) parts of the spectrum. Dashed line shows the spectrum of the sensor data before the arm loading, solid line shows the spectrum calculated for the data obtained during the weight hold, and the dot-dash line shows the spectrum calculated for the data obtained after removal of weight
Frequency, Hzb
а
5
4
3
2
1
0
Specific characteristics of frequency analysis of the force-torque sensors data in the tremor research
ISSN 1812–5123. Russian Journal of Biomechanics. 2013. Vol. 17, No. 1 (59): 57–68 61
It should be noted that the amplitudes for frequencies above 1 Hz for ballistogram data do not exceed a few deciles Newton, and they have the order of magnitude, which is comparable to the magnitude of the sensor errors. A similar effect of multiple frequencies manifestation can also be observed at signal passing through a nonlinear element and can be the result of the distortion by nonlinear sensor, or the result of the friction forces in the contact area of the body of the subject and the sensor surface. In order to eliminate the decisive influence of these effects on force-torque sensor data, we analysed the measurements of alternative measuring devices: sensor of respiratory system, videoanalysis system, micromechanical accelerometer and angular velocity sensor.
THE RESULTS OF DATA PROCESSING IN THE ALTERNATIVE MEASUREMENTS Fig. 3 shows the power spectrum of the respiration sensor data that is a part of the
"Multifunctional chair". As can be seen from the spectrum of data of this sensor, it is similar to the spectrum of
the sensor in chair elbow-rest shown in Fig. 2, а. It should be noted, the respiration sensor uses the same tensometric measurement principle that is used in force-torque sensors too.
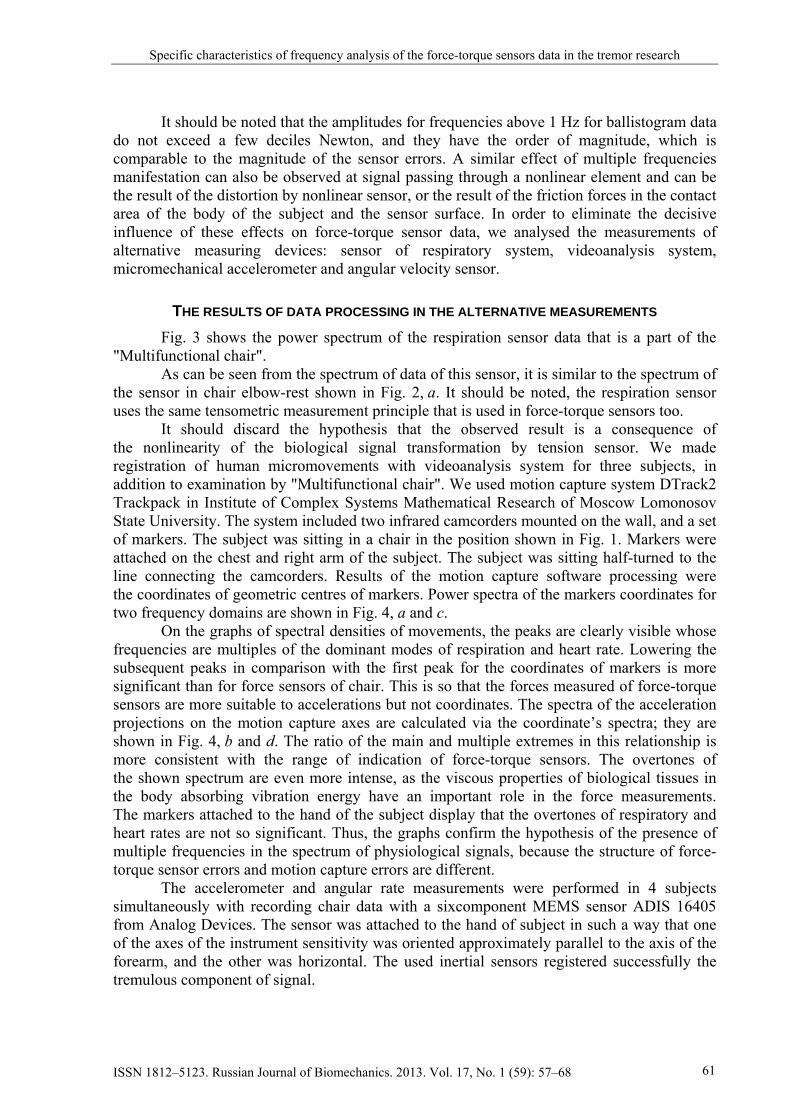
It should discard the hypothesis that the observed result is a consequence of the nonlinearity of the biological signal transformation by tension sensor. We made registration of human micromovements with videoanalysis system for three subjects, in addition to examination by "Multifunctional chair". We used motion capture system DTrack2 Trackpack in Institute of Complex Systems Mathematical Research of Moscow Lomonosov State University. The system included two infrared camcorders mounted on the wall, and a set of markers. The subject was sitting in a chair in the position shown in Fig. 1. Markers were attached on the chest and right arm of the subject. The subject was sitting half-turned to the line connecting the camcorders. Results of the motion capture software processing were the coordinates of geometric centres of markers. Power spectra of the markers coordinates for two frequency domains are shown in Fig. 4, а and c.
On the graphs of spectral densities of movements, the peaks are clearly visible whose frequencies are multiples of the dominant modes of respiration and heart rate. Lowering the subsequent peaks in comparison with the first peak for the coordinates of markers is more significant than for force sensors of chair. This is so that the forces measured of force-torque sensors are more suitable to accelerations but not coordinates. The spectra of the acceleration projections on the motion capture axes are calculated via the coordinate’s spectra; they are shown in Fig. 4, b and d. The ratio of the main and multiple extremes in this relationship is more consistent with the range of indication of force-torque sensors. The overtones of the shown spectrum are even more intense, as the viscous properties of biological tissues in the body absorbing vibration energy have an important role in the force measurements. The markers attached to the hand of the subject display that the overtones of respiratory and heart rates are not so significant. Thus, the graphs confirm the hypothesis of the presence of multiple frequencies in the spectrum of physiological signals, because the structure of force-torque sensor errors and motion capture errors are different.
The accelerometer and angular rate measurements were performed in 4 subjects simultaneously with recording chair data with a sixcomponent MEMS sensor ADIS 16405 from Analog Devices. The sensor was attached to the hand of subject in such a way that one of the axes of the instrument sensitivity was oriented approximately parallel to the axis of the forearm, and the other was horizontal. The used inertial sensors registered successfully the tremulous component of signal.
P.A. Kruchinin, A.V. Lebedev, N.V. Kholmogorova
ISSN 1812–5123. Russian Journal of Biomechanics. 2013. Vol. 17, No. 1 (59): 57–68 62
Motion capture.Coordinates. Subject М1 50
40
30
20
10
Pow
er sp
ectru
m, m
m2 /H
z
0 0.5 1 1.5
а
X Y Z
Frequency, Hz
Motion capture. Acceleration estimation
b
0 0.2 0.4 0.6 0.8 1 1.2
4
3
2
1
Acc
eler
atio
n po
wer
spec
trum
, m
2 /s4 H
z
2 3 4 5 6 7 8 9 10
X Y Z
0.01
0.008
0.006
0.002
0
Pow
er sp
ectru
m, m
m2 /H
z
сFrequency, Hz
2 3 4 5 6 7 8 9 10
dFrequency, Hz
0.030.0250.02
0.0150.01
0.0050
Acc
eler
atio
n po
wer
spec
trum
, m
2 /s4 /H
z
Motion capture. Acceleration estimation
Fig. 4. Characteristic frequency domains of the spectral density of motion capture data. The marker is set on the chest of the subject. Low-frequency spectrum of coordinates (a) and acceleration (b) of marker, spectrum of coordinates (c) and acceleration (d) of marker for the frequencies 1–5 Hz
Frequency, Hz
Motion capture.Coordinates. Subject М1
Specific characteristics of frequency analysis of the force-torque sensors data in the tremor research
ISSN 1812–5123. Russian Journal of Biomechanics. 2013. Vol. 17, No. 1 (59): 57–68 63
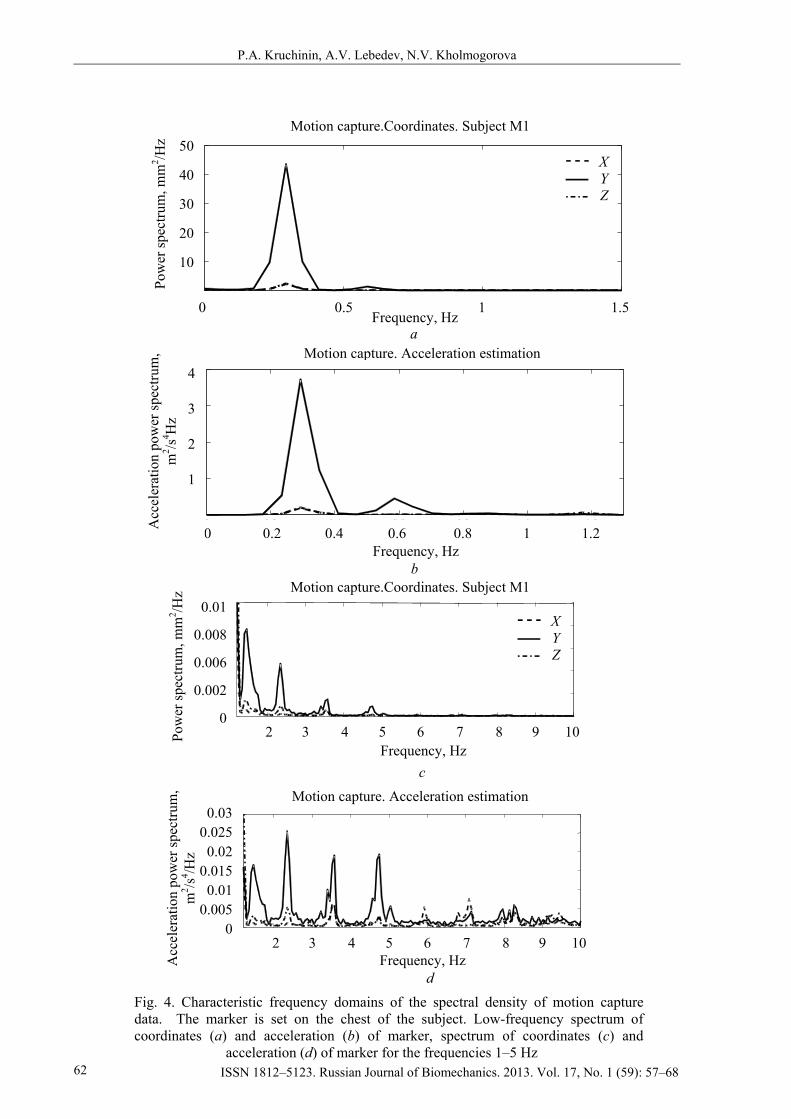
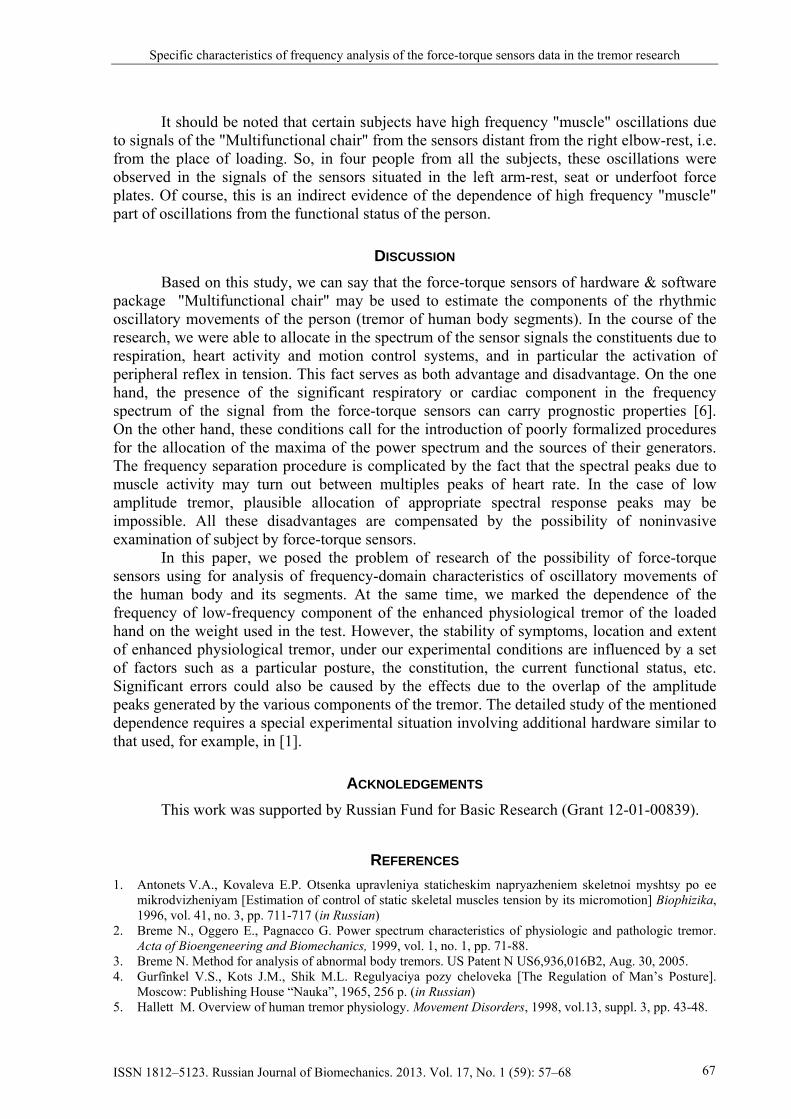
Fig. 5 shows the spectra of accelerometer mounted on the upper arm of the subjects.
The spectrum for an axis orthogonal to the sensitivity axis in the plane formed by the shoulder and the upper arm is shown. On the graph, we can view the oscillation increase for tremor of healthy subjects (for frequencies 2–4 Hz and 8–12 Hz at accomplishment of static work – hold of 2 kg weight). Marks of heart rate in accelerometers and angular rate sensors data are small and they occur only in the first two peaks. Apparently, the increased sensitivity of the force-torque sensors to cardiosignal is the result of the fact that these data are significantly affected by the unevenness of blood circulation in the limbs. Significant displacements of the limb movements are probably not caused which greatly facilitates the traditional accelerometer survey tremor.
ALLOCATION OF FREQUENCIES OF OSCILLATION CAUSED BY ARM MUSCLE TENSION The analysis of "Multifunctional chair" signals and the exclusion of specific
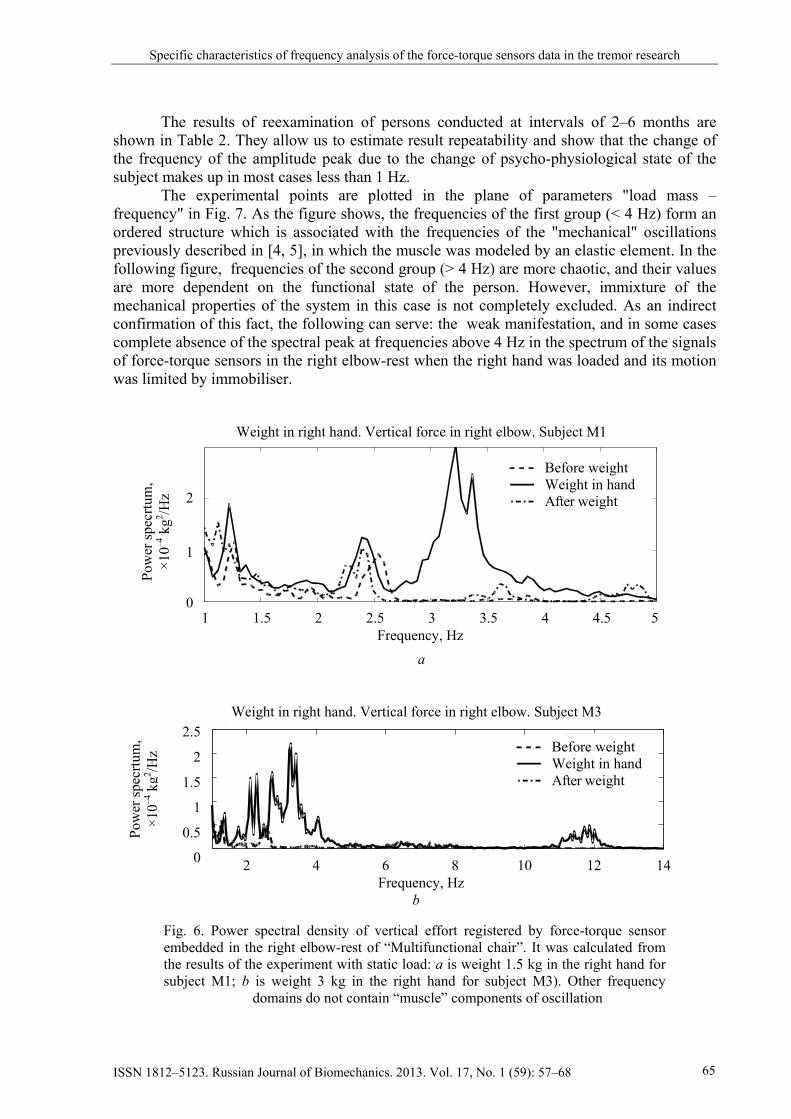
components of respiratory and cardiac rhythms can separate components of oscillations caused by muscle tension in the hand with the load. The distinctive feature of signal “muscle” component in force – torque sensors is non concordance of spectrum peak frequency and one of the multiple of the palpitation frequency. In the case of their concordance, the muscle signal can be selected by significant increase of its width in comparison with width of appropriate heart peaks produced by palpitation. Frequency components of the oscillation caused by the muscle tension in arm that holds the weight are shown in Figs. 6, 7. Within the time period of weight holding, a manifestation of the local maximum in the frequency region of 2 – 3.5 Hz was observed at ballistogram and sagittal torque of the right arm in almost all the subjects. In some of them, along with this maximum, also another peak takes place in the high-frequency domain of the spectrum (6–12 Hz). The amplitudes of the peaks exceed in the several times the baseline level of the spectrum in the same frequency domain, while subject keeps the hands empty (i.e. without static load). Note that during the examination of two patients with diagnosed Parkinson's disease, the value of high-amplitude peak is many times more than the level of the spectral peaks generated by cardiosignal [7].
The frequencies of the peaks for characteristic sample of subjects are shown in Table 1. None of the healthy subjects has not specified frequency multiples. This allows us to select two sets of frequencies in the spectral characteristic of oscillations caused by muscle tension in the arm that holds the weight. Those oscillations have apparently independent sources of excitement.
Before weight Weight in right hand
Accelerometer measurement. Weight 1 kg in right hand. Subject М3
1
0.8
0.6
0.4
0.2
Acc
eler
atio
n po
wer
spec
trum
, ×1
0–5 m
2 /s4 /H
z
Frequency, Hz
0 2 4 6 8 10 12 14
Fig. 5. Power spectral density of accelerometer data. Accelerometer mounted on the right forearm of the subject (weight 2 kg in the right hand)
P.A. Kruchinin, A.V. Lebedev, N.V. Kholmogorova
ISSN 1812–5123. Russian Journal of Biomechanics. 2013. Vol. 17, No. 1 (59): 57–68 64
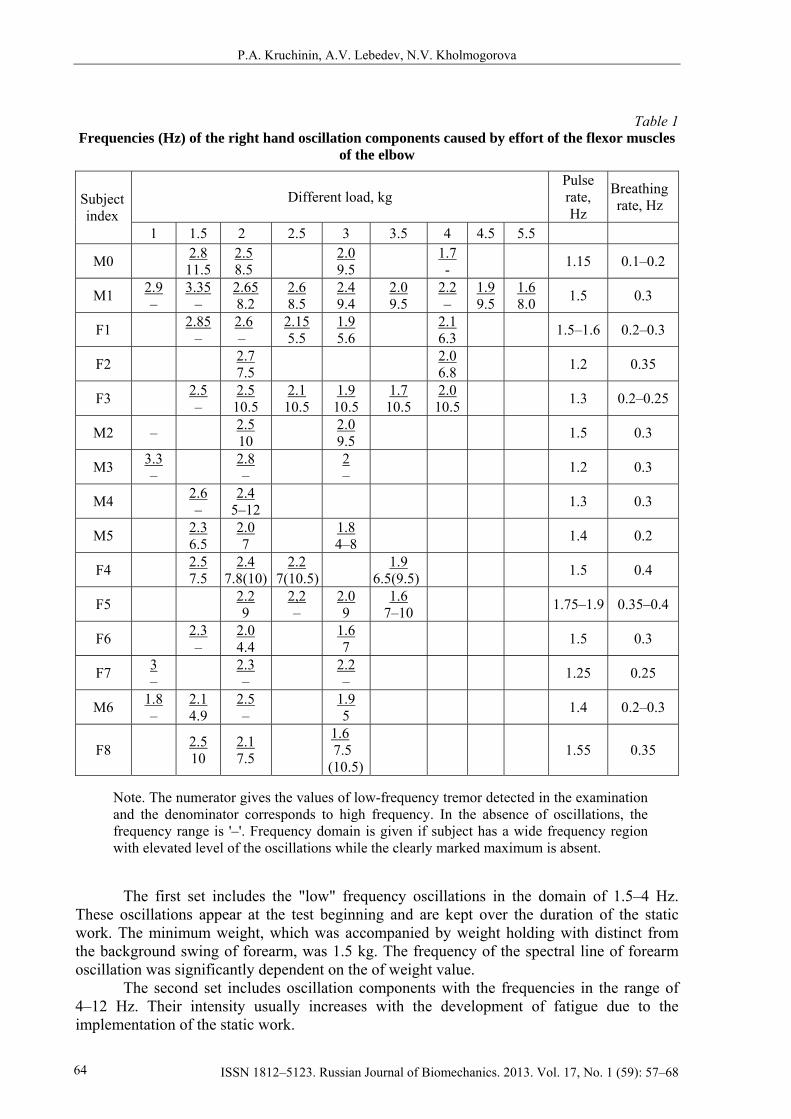
Table 1 Frequencies (Hz) of the right hand oscillation components caused by effort of the flexor muscles
of the elbow
Different load, kg Pulse rate, Hz
Breathing rate, Hz Subject
index 1 1.5 2 2.5 3 3.5 4 4.5 5.5
M0 2.8 11.5
2.5 8.5 2.0
9.5 1.7 - 1.15 0.1–0.2
M1 2.9 –
3.35 –
2.65 8.2
2.6 8.5
2.4 9.4
2.0 9.5
2.2 –
1.9 9.5
1.6 8.0 1.5 0.3
F1 2.85 –
2.6 –
2.15 5.5
1.9 5.6 2.1
6.3 1.5–1.6 0.2–0.3
F2 2.7 7.5 2.0
6.8 1.2 0.35
F3 2.5 –
2.5 10.5
2.1 10.5
1.9 10.5
1.7 10.5
2.0 10.5 1.3 0.2–0.25
M2 – 2.5 10 2.0
9.5 1.5 0.3
M3 3.3 – 2.8
– 2 – 1.2 0.3
M4 2.6 –
2.4 5–12 1.3 0.3
M5 2.3 6.5
2.0 7 1.8
4–8 1.4 0.2
F4 2.5 7.5
2.4 7.8(10)
2.2 7(10.5) 1.9
6.5(9.5) 1.5 0.4
F5 2.2 9
2,2 –
2.0 9
1.6 7–10 1.75–1.9 0.35–0.4
F6 2.3 –
2.0 4.4 1.6
7 1.5 0.3
F7 3 – 2.3
– 2.2 – 1.25 0.25
M6 1.8 –
2.1 4.9
2.5 – 1.9
5 1.4 0.2–0.3
F8 2.5 10
2.1 7.5
1.6 7.5
(10.5) 1.55 0.35
Note. The numerator gives the values of low-frequency tremor detected in the examination and the denominator corresponds to high frequency. In the absence of oscillations, the frequency range is '–'. Frequency domain is given if subject has a wide frequency region with elevated level of the oscillations while the clearly marked maximum is absent.
The first set includes the "low" frequency oscillations in the domain of 1.5–4 Hz.
These oscillations appear at the test beginning and are kept over the duration of the static work. The minimum weight, which was accompanied by weight holding with distinct from the background swing of forearm, was 1.5 kg. The frequency of the spectral line of forearm oscillation was significantly dependent on the of weight value.
The second set includes oscillation components with the frequencies in the range of 4–12 Hz. Their intensity usually increases with the development of fatigue due to the implementation of the static work.
Specific characteristics of frequency analysis of the force-torque sensors data in the tremor research
ISSN 1812–5123. Russian Journal of Biomechanics. 2013. Vol. 17, No. 1 (59): 57–68 65
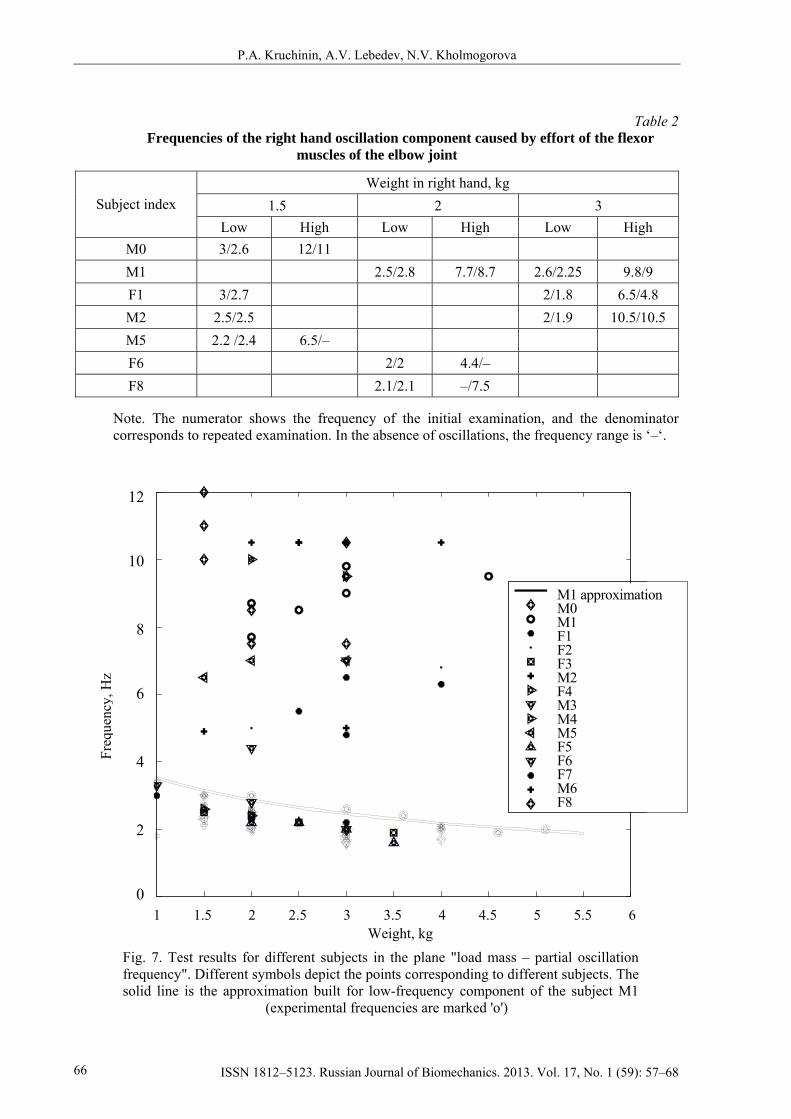
The results of reexamination of persons conducted at intervals of 2–6 months are shown in Table 2. They allow us to estimate result repeatability and show that the change of the frequency of the amplitude peak due to the change of psycho-physiological state of the subject makes up in most cases less than 1 Hz.
The experimental points are plotted in the plane of parameters "load mass – frequency" in Fig. 7. As the figure shows, the frequencies of the first group (< 4 Hz) form an ordered structure which is associated with the frequencies of the "mechanical" oscillations previously described in [4, 5], in which the muscle was modeled by an elastic element. In the following figure, frequencies of the second group (> 4 Hz) are more chaotic, and their values are more dependent on the functional state of the person. However, immixture of the mechanical properties of the system in this case is not completely excluded. As an indirect confirmation of this fact, the following can serve: the weak manifestation, and in some cases complete absence of the spectral peak at frequencies above 4 Hz in the spectrum of the signals of force-torque sensors in the right elbow-rest when the right hand was loaded and its motion was limited by immobiliser.
1 1.5 2 2.5 3 3.5 4 4.5 5
Before weight Weight in hand After weight
Pow
er sp
ecrtu
m,
×10–4
kg2 /H
z
2
1
0
Weight in right hand. Vertical force in right elbow. Subject М1
а
Weight in right hand. Vertical force in right elbow. Subject М3 2.5
2
1.5
1
0.5
0
Pow
er sp
ecrtu
m,
×10–4
kg2 /H
z
2 4 6 8 10 12 14
b Frequency, Hz
Fig. 6. Power spectral density of vertical effort registered by force-torque sensor embedded in the right elbow-rest of “Multifunctional chair”. It was calculated from the results of the experiment with static load: a is weight 1.5 kg in the right hand for subject M1; b is weight 3 kg in the right hand for subject M3). Other frequency domains do not contain “muscle” components of oscillation
Frequency, Hz
Before weight Weight in hand After weight
P.A. Kruchinin, A.V. Lebedev, N.V. Kholmogorova
ISSN 1812–5123. Russian Journal of Biomechanics. 2013. Vol. 17, No. 1 (59): 57–68 66
Table 2 Frequencies of the right hand oscillation component caused by effort of the flexor
muscles of the elbow joint
Weight in right hand, kg 1.5 2 3 Subject index
Low High Low High Low High M0 3/2.6 12/11 M1 2.5/2.8 7.7/8.7 2.6/2.25 9.8/9 F1 3/2.7 2/1.8 6.5/4.8 M2 2.5/2.5 2/1.9 10.5/10.5 M5 2.2 /2.4 6.5/– F6 2/2 4.4/– F8 2.1/2.1 –/7.5
Note. The numerator shows the frequency of the initial examination, and the denominator corresponds to repeated examination. In the absence of oscillations, the frequency range is ‘–‘.
12
10
8
6
4
2
0
Freq
uenc
y, H
z
1 1.5 2 2.5 3 3.5 4 4.5 5 5.5 6 Weight, kg
Fig. 7. Test results for different subjects in the plane "load mass – partial oscillation frequency". Different symbols depict the points corresponding to different subjects. The solid line is the approximation built for low-frequency component of the subject M1 (experimental frequencies are marked 'o')
М1 approximationМ0 М1 F1 F2 F3 M2 F4 M3 M4 M5 F5 F6 F7 M6 F8
Specific characteristics of frequency analysis of the force-torque sensors data in the tremor research
ISSN 1812–5123. Russian Journal of Biomechanics. 2013. Vol. 17, No. 1 (59): 57–68 67
It should be noted that certain subjects have high frequency "muscle" oscillations due to signals of the "Multifunctional chair" from the sensors distant from the right elbow-rest, i.e. from the place of loading. So, in four people from all the subjects, these oscillations were observed in the signals of the sensors situated in the left arm-rest, seat or underfoot force plates. Of course, this is an indirect evidence of the dependence of high frequency "muscle" part of oscillations from the functional status of the person.
DISCUSSION Based on this study, we can say that the force-torque sensors of hardware & software
package "Multifunctional chair" may be used to estimate the components of the rhythmic oscillatory movements of the person (tremor of human body segments). In the course of the research, we were able to allocate in the spectrum of the sensor signals the constituents due to respiration, heart activity and motion control systems, and in particular the activation of peripheral reflex in tension. This fact serves as both advantage and disadvantage. On the one hand, the presence of the significant respiratory or cardiac component in the frequency spectrum of the signal from the force-torque sensors can carry prognostic properties [6]. On the other hand, these conditions call for the introduction of poorly formalized procedures for the allocation of the maxima of the power spectrum and the sources of their generators. The frequency separation procedure is complicated by the fact that the spectral peaks due to muscle activity may turn out between multiples peaks of heart rate. In the case of low amplitude tremor, plausible allocation of appropriate spectral response peaks may be impossible. All these disadvantages are compensated by the possibility of noninvasive examination of subject by force-torque sensors.
In this paper, we posed the problem of research of the possibility of force-torque sensors using for analysis of frequency-domain characteristics of oscillatory movements of the human body and its segments. At the same time, we marked the dependence of the frequency of low-frequency component of the enhanced physiological tremor of the loaded hand on the weight used in the test. However, the stability of symptoms, location and extent of enhanced physiological tremor, under our experimental conditions are influenced by a set of factors such as a particular posture, the constitution, the current functional status, etc. Significant errors could also be caused by the effects due to the overlap of the amplitude peaks generated by the various components of the tremor. The detailed study of the mentioned dependence requires a special experimental situation involving additional hardware similar to that used, for example, in [1].
ACKNOLEDGEMENTS This work was supported by Russian Fund for Basic Research (Grant 12-01-00839).
REFERENCES 1. Antonets V.A., Kovaleva E.P. Otsenka upravleniya staticheskim napryazheniem skeletnoi myshtsy po ee
mikrodvizheniyam [Estimation of control of static skeletal muscles tension by its micromotion] Biophizika, 1996, vol. 41, no. 3, pp. 711-717 (in Russian)
2. Breme N., Oggero E., Pagnacco G. Power spectrum characteristics of physiologic and pathologic tremor. Acta of Bioengeneering and Biomechanics, 1999, vol. 1, no. 1, pp. 71-88.
3. Breme N. Method for analysis of abnormal body tremors. US Patent N US6,936,016B2, Aug. 30, 2005. 4. Gurfînkel V.S., Kots J.M., Shik M.L. Regulyaciya pozy cheloveka [The Regulation of Man’s Posture].
Moscow: Publishing House “Nauka”, 1965, 256 p. (in Russian) 5. Hallett M. Overview of human tremor physiology. Movement Disorders, 1998, vol.13, suppl. 3, pp. 43-48.
P.A. Kruchinin, A.V. Lebedev, N.V. Kholmogorova
ISSN 1812–5123. Russian Journal of Biomechanics. 2013. Vol. 17, No. 1 (59): 57–68 68
6. Kholmogorova N.V., Kruchinin P.A., Shlikov V.Yu., Sliva S.S. Diagnostika funktsionalnyh sostoyanii cheloveka na osnove silokoordinatnyh apparatno-programmnyh kompleksov [Diagnostics of functional states of the person by hardware & software systems] Izvestiya YuFU. Tehnicheskie Nauki, 2010, no. 10, pp. 130-137 (in Russian)
7. Kholmogorova N.V., Kruchinin P.A., Levik Yu.S., Sliva S.S., Shlikov V.Yu. Diagnostika rannih nevrologicheskih narushenii s pomoshchyu silomomentnyh apparatno-programmnyh kompleksov [Early diagnosis of neurological disorders using force-torque hardware & software systems] Izvestiya YuFU. Tehnicheskie Nauki, 2012, no. 9 (134), pp. 256-261 (in Russian).
8. Kononov A.F., Hlabustin B.I. Silomomentnoe kreslo. Teoreticheskie aspekty i printsip deistviya [Force-torque sensing chair. Theoretical aspects and operation principle] Izvestiya YuFU. Tehnicheskie Nauki, 2008, no. 6, pp. 199-201 (in Russian).
9. Kruchinin P.A., Kholmogorova N.V., Sliva S.S., Levik Yu.S., Shlikov V.Yu., Pisarenko O.A. Apparatno-programmnyi stabilograficheskii kompleks dlya diagnostiki funkcionalnyh i premorbidnyh sostoyanii cheloveka [Force plate based hardware & software package for diagnosis functional and premorbid human states] Izvestiya YuFU. Tehnicheskie nauki, 2009, no. 10, pp. 117-121 (in Russian).
10. Kruchinin P.A., Kholmogorova N.V., Kruchinina A.P. Ispolzovanie komponentov ballistogramm, obuslovlennyh serdechnoi deyatelnostyu, pri issledovanii uderzhaniya chelovekom zadannoi pozy [Using components ballistogramm caused cardiac activity to study of a human given posture holding] Inzhenernyi vestnik Dona, 2012, vol. 1, no. 4 (http://www.ivdon.ru/magazine/archive/n4t1y2012/1105) (in Russian).
11. Manoilov V.V., Romanov S.P. Sposob otsenki funkcionalnogo sostoyaniya centralnoi nervnoi sistemy cheloveka i ustroystvo dlya ego realizacii [Process of assessing the functional state of the central nervous system and device for its implementation] RF Patent № RU2195869, 2000.11.08 (in Russian).
12. McAuley J.H., Marsden C.D. Physiological and pathological tremors and rhythmic central motor control. Brain, 2000, vol. 123, pp. 1545-1567.
13. Nadeau S., Desjardins P., Brière A., Roy G., Gravel D. A chair with a platform setup to measure the forces under each thigh when sitting, rising from a chair and sitting down. Medical & Biological Engineering & Computing, 2008, vol. 46, pp. 299-306.
14. Skvortsov D.V. Klinicheskii analiz dvizhenii. Stabilometriya [Clinical analysis of motions. Stabilometry]. Moscow: Publishing House “MBN. Antidor”, 2000, 188 p. (in Russian).
15. Sliva S.S. Domestic computer stabilography: engineering standards, functional capabilities, and fields of application. Biomedical Engeneering, 2005, no. 1, pp. 32-36.
16. Welch P.D. The Use of Fast Fourier Transform for the Estimation of Power Spectra: A Method Based on Time Averaging Over Short, Modified Periodograms. IEEE Trans. Audio Electroacoust, 1967, vol. AU-15, pp. 70-73.
Received 15 August 2012