Embed Size (px)
Citation preview
Nuclear Instruments and Methods in Physics Research B 235 (2005) 120–125
www.elsevier.com/locate/nimb
Spatially resolved X-ray spectroscopy of an ECRplasma – indication for evaporative cooling
E. Takacs a,b, B. Radics a, C.I. Szabo a,b,*, S. Biri c, L.T. Hudson b, J. Imrek a,B. Juhasz c, T. Suta a, A. Valek c, J. Palinkas a
a Experimental Physics Department, University of Debrecen, Bem ter 18/a, Debrecen H-4026, Hungaryb National Institute of Standards and Technology, Gaithersburg, MD 20899, United States
c Institute of Nuclear Research of the Hungarian Academy of Sciences (ATOMKI), Bem ter 18/c, Debrecen H-4026, Hungary
Available online 25 May 2005
Abstract
We have used an X-ray CCD camera in single photon counting mode and a pinhole to obtain spatially and spectrally
resolved images of the plasma of an electron cyclotron resonance ion source. Software based on the CERN ROOT
package was developed to process and analyse the data. Comparison of plasma images from trapped xenon to that from
a xenon–argon mixture provides evidence for evaporative cooling of the ion cloud in ECR ion sources. This results in
more localised and highly charged ion clouds when lighter-mass argon gas is added to a heavy-ion xenon plasma. This
observation can have implications on the thermodynamics and charge state balance in astrophysical and other labora-
tory plasmas.
� 2005 Published by Elsevier B.V.
PACS: 32.30.Rj; 52.25.Jm
Keywords: Spectroscopic imaging; ECR plasma; X-ray spectroscopy; Evaporative cooling; Highly charged ions
1. Introduction
X-ray imaging techniques combined with spec-
tral pulse-height analysis can provide details on
0168-583X/$ - see front matter � 2005 Published by Elsevier B.V.
doi:10.1016/j.nimb.2005.03.157
* Corresponding author. Address: Experimental Physics
Department, University of Debrecen, Bem ter 18/a, Debrecen
H-4026, Hungary. Tel.: +36 52 415 222; fax: +36 52 315 087.
E-mail address: [email protected] (C.I. Szabo).
the spatial dependence of plasma parameters. Ele-
mental abundances, ion charge state compositions,
plasma densities, and temperatures can be deter-
mined locally by spectral filtering of images of
various plasma environments. Examples includeastrophysical sources imaged with modern X-ray
observatories like Chandra and Newton-XMM
[1] and laboratory plasmas like in Tokamak fusion
devices [2].
E. Takacs et al. / Nucl. Instr. and Meth. in Phys. Res. B 235 (2005) 120–125 121
We have recently reported a new effort in our
laboratory to image an electron cyclotron reso-
nance (ECR) ion source plasma with an X-ray
CCD camera [3]. Our measurements and data
analysis methods are motivated by our interest toinvestigate the applicability of this technique to
other environments and to add a new kind of
experiment to our other ECR plasma diagnostic
measurements. These include Langmuir probes
[4] and spectroscopic measurements in the X-ray
and visible [5] ranges. Imaging work on other
ECR ion sources in the X-ray [6–8], UV [9] and
visible [5] regions have provided important infor-mation on the structure of ECR plasmas, but de-
tailed analysis of the spatial dependence of the
different spectral components has been missing.
Our method employs energy-dispersive spectro-
scopy of our X-ray CCD camera images acquired
in single photon counting mode. The energy resolu-
tion is comparable to traditional non-imaging solid
state X-ray detectors. We have developed softwareto analyse the local X-ray spectra and to determine
the spatial dependence of various spectral compo-
nents. This technique allowed us to obtain and com-
pare spatial parameter maps of images taken under
different plasma conditions. This paper provides de-
tails of our imaging and spectral filtering method.
Based on this technique we present experimental re-
sults where we investigated the effects of the addi-tion of a secondary work-gas to the ECR plasma.
The injection of lighter gas atoms to heavy ion plas-
mas is a broadly used procedure in optimising the
performance of ECR ion sources. We have found
that the addition of argon atoms to xenon plasma
makes the xenon ions more localised and more
highly charged. We attribute this effect to evapora-
tive cooling of higher charge-state xenon ions by thelower-charged argon ions [10]. This is also known to
be effective in other electromagnetic confinement
devices, like EBITs [11], and can have important
implications in other laboratory and astrophysical
environments.
2. Experimental setup
A 70 lm gold plated lead X-ray pinhole was
placed at a distance of 910 mm and an X-ray
CCD camera at 1240 mm from the centre of the
plasma chamber. The setup provided an average
demagnification of 0.27. Demagnification was nec-
essary because of the diameter of the plasma cham-
ber (58 mm) and the pixel array size of the1152 · 1242 CCD chip (25.9 mm · 27.5 mm with
22.5 lm pixel size) had to be considered. Some
modifications of the ion source [3] were necessary
in order to provide an access view for the camera.
The injection side end cap was cut in two; the miss-
ing region (�65% of the end cap surface) was cov-
ered with a fine stainless steel mesh in order to keep
the microwave cavity closed for running the source.The rest of the end cap (35%) was kept intact to
support the microwave inlet guide and a vaporizing
crucible (no imaging possible in this region).
The X-ray CCD was operated with exposure
times so that no more than each pixel registered
either 0 or 1 X-ray events. Under these conditions,
most of the pixels were empty after an exposure,
but the ones that experienced an event collecteda charge that was proportional to the energy of
the photon. Average exposure times varied from
3 ms to 0.5 s. The experiments consisted of 500
to 1000 exposures to provide local spectral infor-
mation. To improve statistics for the dimmer
regions we divided our CCD into 20 · 20 pixel
regions. This provided enough counting statistics
with sufficient spatial resolution to clearly see thestructure of the plasma.
3. Analysis
Our analysis consisted of two basic parts: image
manipulation and spectral fits. The programming
was done in the CERN ROOT environment thatallowed the easy manipulation of data, fits, and
plots. In a first step all the exposures were treated
separately, and cosmic rays and electronic noise
were removed from each image. Events that passed
this discrimination received two labels, the first re-
flected the coordinates on the CCD and the second
a quantity that was proportional to the X-ray pho-
tons energy. This method later allowed easy spatialand spectral filtering of the images.
In the second part of the analysis, 20 · 20 pixel
regions were combined to obtain spectra that were
122 E. Takacs et al. / Nucl. Instr. and Meth. in Phys. Res. B 235 (2005) 120–125
fit. In our selected energy region (from about
3.5 keV to 10 keV) the CCD pixels had known effi-
ciency and the beryllium in front of the CCD cam-
era had close to 100% transmission.
The fits included continuum and characteristicline emission components. Continuum radiation
originated from the bremsstrahlung radiation gen-
erated by energetic electrons colliding with heavy
ions in the plasma and with the plasma walls.
We have found that in the 3.5–10 keV region the
continuum part of our spectra could not be fit by
a single exponential function indicating that the
electron component of the plasma could not bedescribed by a single temperature. This is in accor-
dance with previous studies indicating the pres-
ence of hot and cold components of the electron
gas in ECR sources [5]. Although we have found
systematic changes in the spatial distribution of
the hot and cold components of the continuum
spectrum this is beyond the scope of the present
paper.Characteristic line emission originates from
electronic transitions between ions excited by ener-
getic electron collisions and bound levels of atoms.
In spatial regions where energetic electrons were
leaving the plasma along magnetic field lines and
were colliding with the stainless steel walls, line
emission was observed due to constituent elements
of the material (mainly iron). In other regions, theline emission was characteristic of the components
of the working gas injected into the plasma. In the
experiments presented in this paper this was
mainly xenon; although argon gas was also in-
jected into the ECR in some cases, the argon char-
acteristic lines appeared below the low energy
cutoff of our spectra.
Strong xenon emission lines appeared between4 keV and 5 keV originating from many L shell
transitions (n = 3 to n = 2 bound state transitions)
in different charge states of xenon. The �200 eV
energy resolution of our CCD detector did not
permit the separation of transitions from different
charge states. However, the general trend of
increasingly energetic L band spectral emission
from increasing charge states could be observed.To facilitate the study of the changing charge
states, the xenon emission lines were fit with three
Gaussian functions with fixed separations, but
allowing their overall energy to be varied in the fit-
ting procedure. The xenon L line emission consists
of transitions that come from the excited 3s, 3p,
and 3d states decaying into either 2s or 2p vacan-
cies. In plasmas where there is a narrower chargestate distribution than in ECR sources (for exam-
ple in electron beam ion traps, EBIT) the obser-
vation of xenon X-rays with moderate energy
resolution solid state detectors reveals three main
emission features in the 4–5 keV region of the
spectra [12]. Therefore our xenon emission struc-
ture was also fit with three Gaussian peaks.
In summary, the spectrum from each 20 · 20pixel region was fit by a model function that in-
cluded a double exponential background, fixed-
position Gaussian peaks accounting for emission
from the walls, and relatively-fixed-position Gaus-
sians for the previously described xenon L struc-
ture. The results of the fits provided parameter
map images that represented spatial changes in
the different spectral components across the image.
4. Results
In order to determine the spatial distribution of
the xenon ions inside the source we used the sum
of the intensity parameters of the three xenon
peaks. This accounted for the intensity underneaththe xenon emission structure without the contin-
uum background. Fig. 1 shows a spatial distribu-
tion map of xenon from the unobstructed view
of the plasma. It is important to note that since
the lifetimes of the transitions involved are usually
short, line emission only occurs where energetic
electrons are also present to excite the ions. The
emission from xenon ions is the strongest wherethe overlap between the electron and ion clouds
is large. Since the ions are not only excited but also
confined locally by the plasma electrons, the emis-
sion intensity should increase more than linearly
with the local density of electrons. The high inten-
sity regions in Fig. 1 represent areas where the
electron densities are high enough to trap and ex-
cite the ions. It is interesting that the radial inten-sity drop is very sharp and more than two orders
of magnitude on the outside of the image. This
indicates an at least one order of magnitude
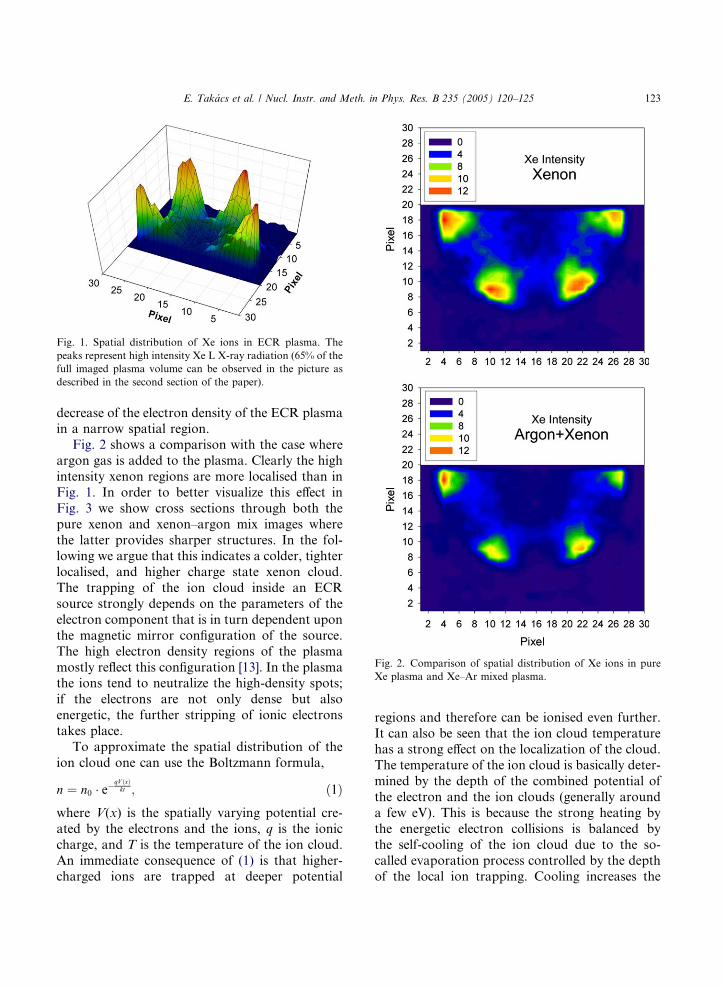
Fig. 2. Comparison of spatial distribution of Xe ions in pure
Xe plasma and Xe–Ar mixed plasma.
Fig. 1. Spatial distribution of Xe ions in ECR plasma. The
peaks represent high intensity Xe L X-ray radiation (65% of the
full imaged plasma volume can be observed in the picture as
described in the second section of the paper).
E. Takacs et al. / Nucl. Instr. and Meth. in Phys. Res. B 235 (2005) 120–125 123
decrease of the electron density of the ECR plasmain a narrow spatial region.
Fig. 2 shows a comparison with the case where
argon gas is added to the plasma. Clearly the high
intensity xenon regions are more localised than in
Fig. 1. In order to better visualize this effect in
Fig. 3 we show cross sections through both the
pure xenon and xenon–argon mix images where
the latter provides sharper structures. In the fol-lowing we argue that this indicates a colder, tighter
localised, and higher charge state xenon cloud.
The trapping of the ion cloud inside an ECR
source strongly depends on the parameters of the
electron component that is in turn dependent upon
the magnetic mirror configuration of the source.
The high electron density regions of the plasma
mostly reflect this configuration [13]. In the plasmathe ions tend to neutralize the high-density spots;
if the electrons are not only dense but also
energetic, the further stripping of ionic electrons
takes place.
To approximate the spatial distribution of the
ion cloud one can use the Boltzmann formula,
n ¼ n0 � e�qV ðxÞkt ; ð1Þ
where V(x) is the spatially varying potential cre-
ated by the electrons and the ions, q is the ionic
charge, and T is the temperature of the ion cloud.
An immediate consequence of (1) is that higher-charged ions are trapped at deeper potential
regions and therefore can be ionised even further.
It can also be seen that the ion cloud temperaturehas a strong effect on the localization of the cloud.
The temperature of the ion cloud is basically deter-
mined by the depth of the combined potential of
the electron and the ion clouds (generally around
a few eV). This is because the strong heating by
the energetic electron collisions is balanced by
the self-cooling of the ion cloud due to the so-
called evaporation process controlled by the depthof the local ion trapping. Cooling increases the
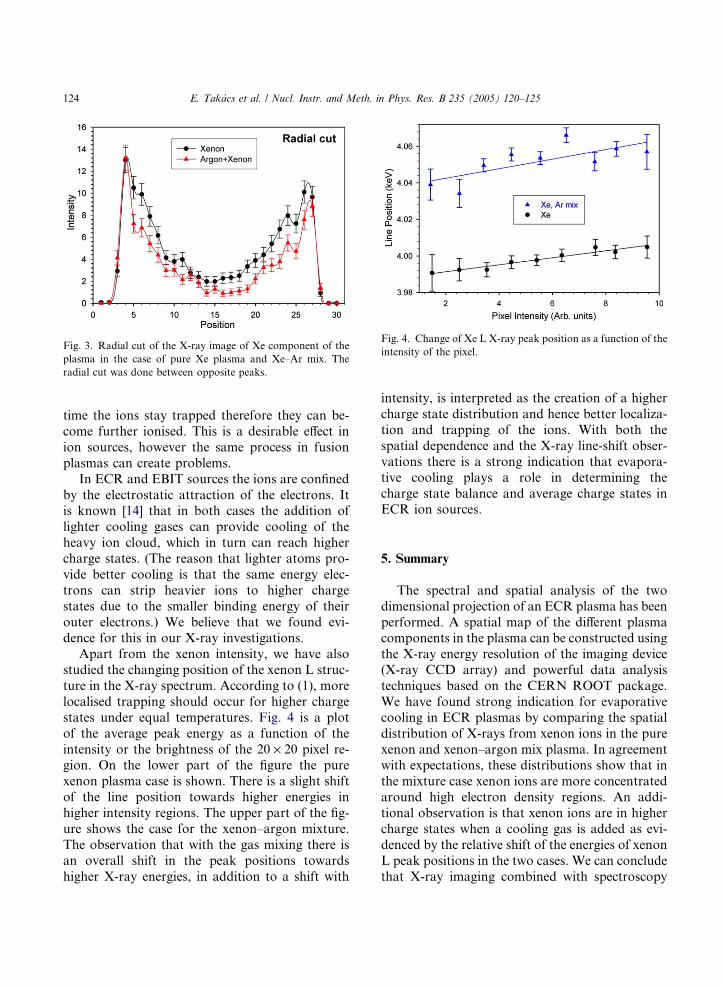
Fig. 3. Radial cut of the X-ray image of Xe component of the
plasma in the case of pure Xe plasma and Xe–Ar mix. The
radial cut was done between opposite peaks.
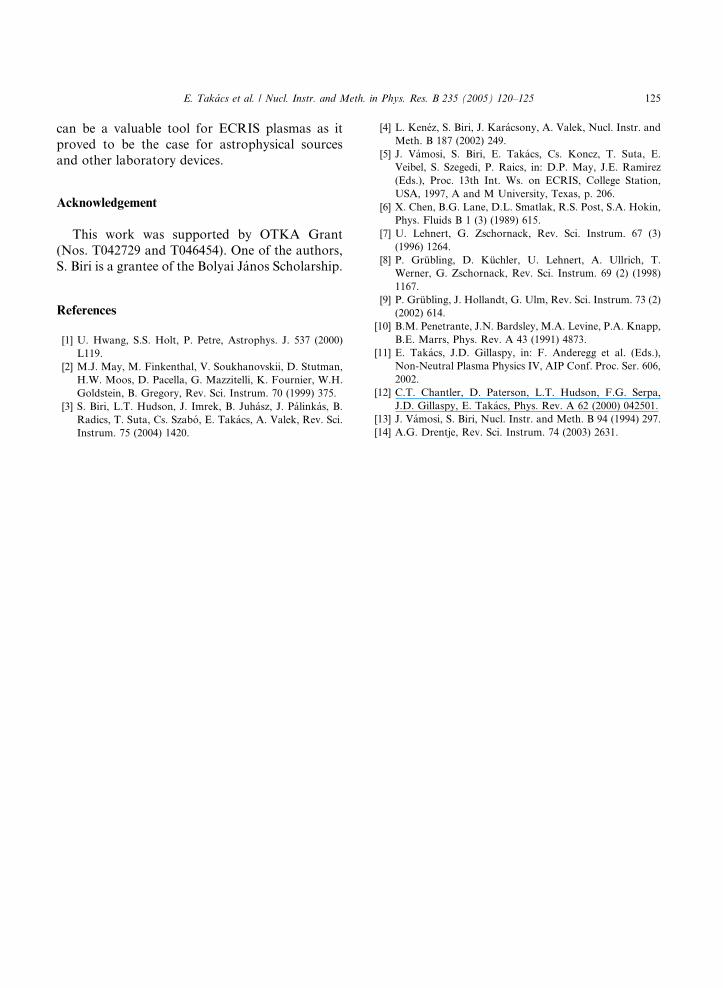
Fig. 4. Change of Xe L X-ray peak position as a function of the
intensity of the pixel.
124 E. Takacs et al. / Nucl. Instr. and Meth. in Phys. Res. B 235 (2005) 120–125
time the ions stay trapped therefore they can be-
come further ionised. This is a desirable effect in
ion sources, however the same process in fusion
plasmas can create problems.
In ECR and EBIT sources the ions are confined
by the electrostatic attraction of the electrons. Itis known [14] that in both cases the addition of
lighter cooling gases can provide cooling of the
heavy ion cloud, which in turn can reach higher
charge states. (The reason that lighter atoms pro-
vide better cooling is that the same energy elec-
trons can strip heavier ions to higher charge
states due to the smaller binding energy of their
outer electrons.) We believe that we found evi-dence for this in our X-ray investigations.
Apart from the xenon intensity, we have also
studied the changing position of the xenon L struc-
ture in the X-ray spectrum. According to (1), more
localised trapping should occur for higher charge
states under equal temperatures. Fig. 4 is a plot
of the average peak energy as a function of the
intensity or the brightness of the 20 · 20 pixel re-gion. On the lower part of the figure the pure
xenon plasma case is shown. There is a slight shift
of the line position towards higher energies in
higher intensity regions. The upper part of the fig-
ure shows the case for the xenon–argon mixture.
The observation that with the gas mixing there is
an overall shift in the peak positions towards
higher X-ray energies, in addition to a shift with
intensity, is interpreted as the creation of a higher
charge state distribution and hence better localiza-
tion and trapping of the ions. With both the
spatial dependence and the X-ray line-shift obser-
vations there is a strong indication that evapora-
tive cooling plays a role in determining the
charge state balance and average charge states inECR ion sources.
5. Summary
The spectral and spatial analysis of the two
dimensional projection of an ECR plasma has been
performed. A spatial map of the different plasmacomponents in the plasma can be constructed using
the X-ray energy resolution of the imaging device
(X-ray CCD array) and powerful data analysis
techniques based on the CERN ROOT package.
We have found strong indication for evaporative
cooling in ECR plasmas by comparing the spatial
distribution of X-rays from xenon ions in the pure
xenon and xenon–argon mix plasma. In agreementwith expectations, these distributions show that in
the mixture case xenon ions are more concentrated
around high electron density regions. An addi-
tional observation is that xenon ions are in higher
charge states when a cooling gas is added as evi-
denced by the relative shift of the energies of xenon
L peak positions in the two cases. We can conclude
that X-ray imaging combined with spectroscopy
E. Takacs et al. / Nucl. Instr. and Meth. in Phys. Res. B 235 (2005) 120–125 125
can be a valuable tool for ECRIS plasmas as it
proved to be the case for astrophysical sources
and other laboratory devices.
Acknowledgement
This work was supported by OTKA Grant
(Nos. T042729 and T046454). One of the authors,
S. Biri is a grantee of the Bolyai Janos Scholarship.
References
[1] U. Hwang, S.S. Holt, P. Petre, Astrophys. J. 537 (2000)
L119.
[2] M.J. May, M. Finkenthal, V. Soukhanovskii, D. Stutman,
H.W. Moos, D. Pacella, G. Mazzitelli, K. Fournier, W.H.
Goldstein, B. Gregory, Rev. Sci. Instrum. 70 (1999) 375.
[3] S. Biri, L.T. Hudson, J. Imrek, B. Juhasz, J. Palinkas, B.
Radics, T. Suta, Cs. Szabo, E. Takacs, A. Valek, Rev. Sci.
Instrum. 75 (2004) 1420.
[4] L. Kenez, S. Biri, J. Karacsony, A. Valek, Nucl. Instr. and
Meth. B 187 (2002) 249.
[5] J. Vamosi, S. Biri, E. Takacs, Cs. Koncz, T. Suta, E.
Veibel, S. Szegedi, P. Raics, in: D.P. May, J.E. Ramirez
(Eds.), Proc. 13th Int. Ws. on ECRIS, College Station,
USA, 1997, A and M University, Texas, p. 206.
[6] X. Chen, B.G. Lane, D.L. Smatlak, R.S. Post, S.A. Hokin,
Phys. Fluids B 1 (3) (1989) 615.
[7] U. Lehnert, G. Zschornack, Rev. Sci. Instrum. 67 (3)
(1996) 1264.
[8] P. Grubling, D. Kuchler, U. Lehnert, A. Ullrich, T.
Werner, G. Zschornack, Rev. Sci. Instrum. 69 (2) (1998)
1167.
[9] P. Grubling, J. Hollandt, G. Ulm, Rev. Sci. Instrum. 73 (2)
(2002) 614.
[10] B.M. Penetrante, J.N. Bardsley, M.A. Levine, P.A. Knapp,
B.E. Marrs, Phys. Rev. A 43 (1991) 4873.
[11] E. Takacs, J.D. Gillaspy, in: F. Anderegg et al. (Eds.),
Non-Neutral Plasma Physics IV, AIP Conf. Proc. Ser. 606,
2002.
[12] C.T. Chantler, D. Paterson, L.T. Hudson, F.G. Serpa,
J.D. Gillaspy, E. Takacs, Phys. Rev. A 62 (2000) 042501.
[13] J. Vamosi, S. Biri, Nucl. Instr. and Meth. B 94 (1994) 297.
[14] A.G. Drentje, Rev. Sci. Instrum. 74 (2003) 2631.


