Embed Size (px)
Citation preview
Spartan StudentUser’s Guide
Wavefunction, Inc.18401 Von Karman Avenue, Suite 370
Irvine, CA 92612 U.S.A.www.wavefun.com
Wavefunction, Inc., Japan Branch Office3-5-2, Kouji-machi, Suite 608
Chiyoda-ku, Tokyo, Japan [email protected] • www.wavefun.com/japan
WAVEFUNCTION
TM
A Quantum Leap Into the Future of Chemistr y
Q-CHEM, INC.6601 Owens Drive, Suite 105
Pleasanton, CA 94588
Spartan Student is a collaboration with Q-Chem, Inc.
December 19, 2019
Copyright © 2019 by Wavefunction, Inc.
All rights reserved in all countries. No part of this book may be reproduced in any form or by any electronic or mechanical means including information storage and retrieval systems without permission in writing from the publisher, except by a reviewer who may quote brief passages in a review.
Table of Contents i
Table of ContentsChapter 1 Spartan Student ................................................... 1
Chapter 2 Operating Spartan Student ................................ 5 Opening and Quitting Spartan Student ............... 5 Menus and Icons .................................................. 5 File ..................................................................... 6 Edit .................................................................... 7 Model ................................................................ 7 Geometry ........................................................... 8 Build .................................................................. 8 Setup .................................................................. 8 Display .............................................................. 9 Options .............................................................. 9 Activities ........................................................... 9 Help ................................................................... 10 Additional Icons ................................................... 10 Tabs ...................................................................... 10 Mouse/Keyboard Operations ............................... 11 Selection ............................................................ 11 Manipulation ..................................................... 12 Touch-Screen Operations ..................................... 14 Selecting Molecules ............................................. 14 Database ............................................................... 15 Stereo Displays .................................................... 16 Changing Colors and Setting Preferences ........... 16 Monitoring and Terminating Jobs ........................ 16
Chapter 3 The File Menu .................................................... 17 New Build ............................................................ 17 New Sketch .......................................................... 17 Delete Molecule ................................................... 18 Build New Molecule ............................................ 18 Sketch New Molecule .......................................... 18 Append Molecule(s) ............................................ 18
ii Table of Contents
Open ..................................................................... 18 Open Recent Documents ..................................... 19 Save ...................................................................... 19 Save As ................................................................ 19 Save Image As ..................................................... 19 Print ...................................................................... 20 Access Database by Name ................................... 20 Access PDB Online ............................................. 21 Start/Stop QuickTime Recording (Macintosh Only) .................................................................... 22 Close .................................................................... 22 Exit ....................................................................... 22
Chapter 4 The Edit Menu ................................................... 23 Undo .................................................................... 23 Cut, Copy, Paste ................................................... 23 Select All .............................................................. 24 Find..., Find Next ................................................. 24 Center ................................................................... 24 Clear ..................................................................... 24
Chapter 5 The Model Menu ................................................ 25 Wire ...................................................................... 26 Ball and Wire ....................................................... 26 Tube ..................................................................... 28 Ball and Spoke ..................................................... 28 Space Filling ........................................................ 29 Hide ...................................................................... 29 Global Model ....................................................... 29 Coupled ................................................................ 30 Hydrogens ............................................................ 30 Labels ................................................................... 30 Ribbons ................................................................ 30 Ramachandran Plot .............................................. 30 Hydrogen Bonds .................................................. 31 R/S Chirality ........................................................ 31 Configure... .......................................................... 31
Table of Contents iii
Configure Labels ............................................... 31 Configure Objects .............................................. 32 Configure Ribbons ............................................ 33
Chapter 6 The Geometry Menu .......................................... 34 Measure Distance ................................................. 34 Measure Angle ..................................................... 34 Measure Dihedral ................................................. 34 Freeze Center ....................................................... 35 Constrain Distance ............................................... 36 Constrain Angle ................................................... 36 Constrain Dihedral ............................................... 36 Define Point ......................................................... 38 Define Ligand Point ............................................. 39 Define Plane ......................................................... 39 Align .................................................................... 40
Chapter 7 The Build Menu ................................................. 41 2D Sketch Palette ................................................. 41 Defined Atoms ................................................... 41 Element/Functional Group Library ................... 42 Common Rings .................................................. 42 Common Carbonyl Groups ............................... 42 Stereochemical Markers .................................... 42 Charge/Radical Markers .................................... 42 Reaction Arrows ................................................ 43 Drawing Tools ................................................... 43 Making a Sketch .................................................. 44 Manipulating a Sketch ......................................... 44 Sketch Operations ................................................ 45 Add an Atom, Ring, or Carbonyl Group ........... 45 Add Multiple Bonds .......................................... 45 Fuse Rings ......................................................... 45 Replace an Atom with Another ......................... 45 Access an Element or Functional Group from the Library ......................................................... 45 Add a Stereochemical Marker (Dash or Wedge). 47
iv Table of Contents
Add an Axial or Equatorial Marker .................. 47 Assign Charges and Radical Sites ..................... 48 Undo the Last Action ........................................ 48 Clean Up a Drawing .......................................... 49 Remove an Atom or Bond ................................. 49 Remove a Multiple Bond .................................. 49 Remove a Stereochemical Marker .................... 49 Change or Remove an Axial or Equatorial Label from a Stereochemical Marker ................ 49 Remove a Charge or Radical Marker ................ 49 Clear the Screen ................................................ 49 3D Model Kits ..................................................... 50 Organic Model Kit ............................................ 50 Groups ............................................................ 52 Rings ............................................................... 52 More ................................................................ 53 Clipboard ........................................................ 54 Inorganic Model Kit .......................................... 54 Ligands ........................................................... 56 Peptide Model Kit ............................................. 57 Specify Amino Acid Sequence ....................... 59 Specify Macroscopic Structure ....................... 59 Terminate ........................................................ 59 Nucleotide Model Kit ........................................ 60 Specify Base Sequence ................................... 62 Specify Helical Structure ................................ 62 General Molecule Building Functionality. ........... 63 Multiple Fragments ........................................... 63 Rotate/Stretch Bonds ......................................... 63 Replace Atom/Fragment .................................... 64 Invert Chirality .................................................. 64 Building/Editing Menu Functions ....................... 65 View .................................................................. 65 Edit Build .......................................................... 65 Edit Sketch ........................................................ 66 Delete ................................................................ 66
Table of Contents v
Make Bond ........................................................ 67 Break Bond ........................................................ 67 Minimize ........................................................... 68 Transition State .................................................... 68 Examples ........................................................... 70
Chapter 8 The Setup Menu ................................................. 72 Calculations ......................................................... 72 Calculate ............................................................ 73 Spectra ............................................................... 76 IR .................................................................... 76 NMR ............................................................... 76 QSAR .............................................................. 77 Total Charge ...................................................... 77 Unpaired Electrons ............................................ 77 Print ................................................................... 77 Orbitals & Energies ........................................ 77 Vibrational Modes .......................................... 77 Charges and Bond Orders ............................... 77 Global Calculations.............................................. 78 Calibrate/Est. Time .............................................. 78 Surfaces ................................................................ 78 Common Surfaces and Property Maps .............. 84 More Surfaces ................................................. 84 Surface ............................................................ 85 Property .......................................................... 85 Resolution ....................................................... 86 Isovalue ........................................................... 86 Global Surfaces ................................................. 87 Submit .................................................................. 87
Chapter 9 The Display Menu .............................................. 89 Output .................................................................. 89 Properties ............................................................. 90 Molecule Properties .......................................... 91 Molecule ......................................................... 92 QSAR .............................................................. 92 Thermodynamics ............................................ 93
vi Table of Contents
2D Drawing .................................................... 94 Molecule Utilities ................................................ 95 Atom Properties ................................................... 95 Bond Properties ................................................... 96 Constraint Properties............................................ 96 Point and Plane Properties ................................... 97 Surface Properties ................................................ 98 Regression Properties .......................................... 99 Orbital Energies ................................................... 100 Surfaces ................................................................ 101 Spectra ................................................................. 101 Spreadsheet .......................................................... 105 From the Add Dialog ......................................... 106 From Post ( ) Buttons .................................... 111 Copy/Paste ......................................................... 112 Numerical Data ................................................. 112 User-Defined Expressions ................................. 113 Plots ..................................................................... 117 Reactions... .......................................................... 120
Chapter 10 The Options Menu ............................................. 122 Preferences ........................................................... 122 Settings .............................................................. 123 Molecule ............................................................ 126 VDW Radii ........................................................ 128 Databases ........................................................... 129 Miscellaneous .................................................... 130 Icons .................................................................. 132 URLs ................................................................. 133 Colors ................................................................... 133 Fonts/Graphics Fonts ........................................... 134 Monitor ................................................................ 135 Calculator ............................................................. 136 Icons ..................................................................... 136
Chapter 11 The Activities Menu ........................................... 137 Tutorials, Topics and Labs ................................... 137
Table of Contents vii
Lookup in Wikipedia ........................................... 137
Chapter 12 The Help Menu .................................................. 139 Spartan Student v8 Help ..................................... 139 Spartan Student v8 Manual ................................ 139 License Utility... ................................................... 139 About Spartan Student v8 ................................... 140
Appendix A Capabilities and Limitations ............................. 140 Molecular Mechanics Models .............................. 140 Semi-Empirical Models ....................................... 140 Hartree-Fock Models ........................................... 140 Density Functional Models .................................. 140 MP2 Møller-Plesset Models ................................ 141 T1 Thermochemical Recipe ................................. 141 Solvent Models .................................................... 141 Properties and Spectra ......................................... 141 Graphical Models ................................................. 142 Database ............................................................... 142
Appendix B Menus .................................................................. 144 Spartan Student Screen ....................................... 144 Contextual ............................................................ 150
Appendix C Units .................................................................... 152
Appendix D Citation ............................................................... 154
Appendix E Accessing ChemDraw (Windows Only) ........... 155
Chapter 1 1
Chapter 1Spartan Student
This chapter describes the architecture of Spartan Student, focusing on the connectivity of computational, graphical and database components to the user interface. Available molecular mechanics and quantum chemical methods are enumerated and their utility and applicability assessed.
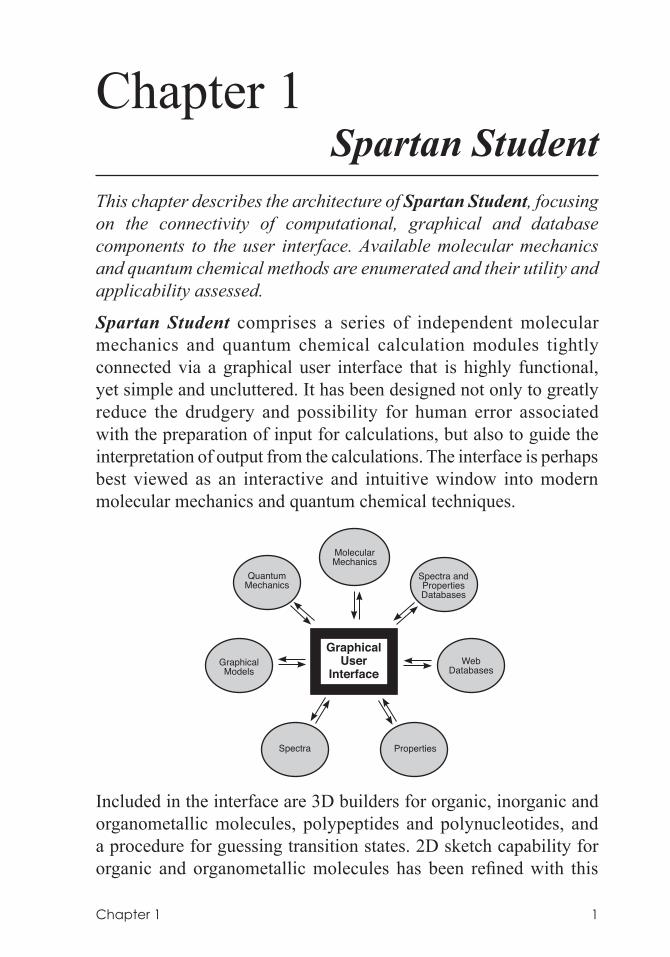
Spartan Student comprises a series of independent molecular mechanics and quantum chemical calculation modules tightly connected via a graphical user interface that is highly functional, yet simple and uncluttered. It has been designed not only to greatly reduce the drudgery and possibility for human error associated with the preparation of input for calculations, but also to guide the interpretation of output from the calculations. The interface is perhaps best viewed as an interactive and intuitive window into modern molecular mechanics and quantum chemical techniques.
Included in the interface are 3D builders for organic, inorganic and organometallic molecules, polypeptides and polynucleotides, and a procedure for guessing transition states. 2D sketch capability for organic and organometallic molecules has been refined with this
Spectra and Properties Databases
QuantumMechanics
PropertiesSpectra
Graphical Models
Molecular Mechanics
Web Databases
Graphical User
Interface
2 Chapter 1
version of Spartan Student. Additionally, access to ChemDraw1 is provided without having to exit the interface. A ≈6,000 molecule subset of the Spartan Spectra and Properties Database (SSPD) contains structures, infrared and NMR spectra as well as a wide variety of molecular properties obtained from the EDF2/6-31G* density functional model. The wavefunction is included, allowing quick access to a variety of graphical surfaces and property maps. On-line access to the Protein Data Bank (PDB)2, a collection of >158,000 biological macromolecular structures, is provided. Experimental infrared spectra for ≈2,000 molecules are available from the NIST website3 and experimental NMR spectra for ≈43,000 molecules are available from NMRShiftDB website.4
Spartan Student’s interface provides the gateway to a range of modern computational methods5. The simplest of these is the MMFF molecular mechanics model, available to determine equilibrium geometries and equilibrium conformers of molecules comprising upwards of several thousand atoms. It is the only computational technique that is applicable to biopolymers.
Quantum chemical models are required to account for the geometries of transition states as well as for reaction and activation energies.7 The simplest of these are semi-empirical molecular orbital models. The PM3 model, supported in Spartan Student, has proven successful for determining equilibrium geometries including the geometries of transition-metal compounds, but it is not reliable for the calculation of the reaction or activation energies.
Hartree-Fock molecular orbital models are a mainstay of quantum chemical techniques, in particular, for determining equilibrium and transition-state geometries and reaction energies, and are supported in Spartan Student with the STO-3G, 3-21G, 6-31G* and 6-311+G** basis sets. Hartree-Fock models generally provide suitable descriptions of many types of reactions, but are not adequate for thermochemical comparisons where bonds are broken or formed. In addition, they do not provide a proper account of the geometries of molecules incorporating transition metals. Supported in Spartan Student are the B3LYP, EDF2, and new to version 8, wB97X-D density functional
Chapter 1 3
models and the MP2 Møller-Plesset model. All properly account for the energies of reactions that involve bond making and breaking and both density functional models (but not the MP2 model) properly account for the geometries of molecules incorporating transition metals. B3LYP, EDF2 and MP2 models are supported with the 6-31G* and 6-311+G** basis sets. Also new in Spartan Student version 8 is the T16 thermochemical recipe, providing high accuracy heats of formation for uncharged, closed-shell systems containing H, C, N, O, F, Si, P, S, Cl and Br.
Spartan Student provides access to infrared spectra (MMFF, PM3, Hartree-Fock, B3LYP, EDF2, wB97X-D and MP2 models) and NMR spectra7 (Hartree-Fock, B3LYP, EDF2, wB97X-D models only). These are available both as numerical data (vibrational frequencies, chemical shifts) as well as spectral plots. Spartan Student provides internet access to experimental IR and NMR databases3,4, allowing direct comparison with calculated spectra. Infrared spectra from density functional models has been corrected using both a multiplicative scale of calculated frequencies and peak width at half height as parameters. Proton and 13C chemical shifts obtained from B3LYP/6-31G* and wB97X-D/6-31G* as well as proton, 13C and 19F chemical shifts obtained from the EDF2/6-31G* density functional model have been empirically corrected to account for local environment.
Also available are energy, equilibrium and transition state geometry, and frequency calculations using the C-PCM solvation model in conjunction with Hartree-Fock and density functional models only. The model depends only on the dielectric constant of the solvent and preset values are available for typical non-polar and polar solvents as well as water.
Spartan Student provides a variety of graphical tools to assist in interpreting the results of calculations. These include molecular orbitals, electron and spin densities, local ionization potentials and electrostatic potentials that can be displayed as surfaces, slices and property maps. Spartan Student provides the ability to distinguish accessible and inaccessible regions on a density surface and on property maps based on this surface. Animations can be created and
4 Chapter 1
1. ChemDraw is not included with Spartan Student, but may be obtained from CambridgeSoft (www.cambridgesoft.com). Seamless access to ChemDraw is not available in the Macintosh version although both Windows and Macintosh versions are able to read ChemDraw files.
2. PDB web reference: https://www.rcsb.org.3. NIST web reference: https://webbook.nist.gov4. NMRShiftDB web reference: https://nmrshiftdb.ice.mpg.de5. Full discussion and assessment of the specific molecular mechanics and quantum chemical
models available in Spartan Student is provided in: W.J. Hehre, A Guide to Molecular Mechanics and Quantum Chemical Calculations, Wavefunction, Irvine, 2003. This is available as a PDF on Wavefunction’s website (www.wavefun.com). See also: W.J. Hehre, L. Radom, P.v.R. Schleyer and J.A. Pople, Ab Initio Molecular Orbital Theory, Wiley, New York, 1986; Y. Shao, L.F. Molnar, Y. Jung, J. Kussmann, C. Ochsenfeld, S.T. Brown, A.T.B. Gilbert, L.V. Slipchenko, S.V. Levchenko, D.P. O’Neill, R.A. DiStasio Jr., R.C. Lochan, T. Wang, G.J.O. Beran, N.A. Besley, J.M. Herbert, C.Y. Lin, T. Van Voorhis, S.H. Chien, A. Sodt, R.P. Steele, V.A. Rassolov, P.E. Maslen, P.P. Korambath, R.D. Adamson, B. Austin, J. Baker, E.F.C. Byrd, H. Dachsel, R.J. Doerksen, A. Dreuw, B.D., Dunietz, A.D. Dutoi, T.R. Furlani, S.R. Gwaltney, A. Heyden, S. Hirata, C-P. Hsu, G. Kedziora, R.Z. Khalliulin, P. Klunzinger, A.M. Lee, M.S. Lee, W.Z. Liang, I. Lotan, N. Nair, B. Peters, E.I. Proynov, P.A. Pieniazek, Y.M. Rhee, J. Ritchie, E. Rosta, C.D. Sherrill, A.C. Simmonett, J.E. Subotnik, H.L. Woodcock III, W. Zhang, A.T. Bell, A.K. Chakraborty, D.M. Chipman, F.J. Keil, A.Warshel, W.J. Hehre, H.F. Schaefer, J. Kong, A.I. Krylov, P.M.W. Gill and M. Head-Gordon, Phys. Chem. Chem. Phys., 8, 3172 (2006).
6. W.S. Ohlinger, P.E. Klunzinger, B.J. Deppmeier, W.J. Hehre, J. Phys.Chem. A, 103, 10, 2165 (2009).7. Chemical shifts only. HH coupling constants and splitting patterns are evaluated empirically.
used to depict conformational changes or the progress of chemical reactions.
Chapter 2 5
Chapter 2Operating Spartan Student
This chapter describes the general operating features of Spartan Student.
Opening and Quitting Spartan Student
To open on Windows, click on the Start button, then click on All Programs, and finally click on Spartan Student (or double click on the Spartan Student icon on your desktop). To open on Macintosh, double click on the Spartan Student icon in the Applications Folder. To exit, select Exit from the File menu (select Quit Spartan Student from the Spartan Student menu on Mac), or click the Close button ( ) at the top right ( top left on Mac) of the Spartan Student interface.
Menus and Icons
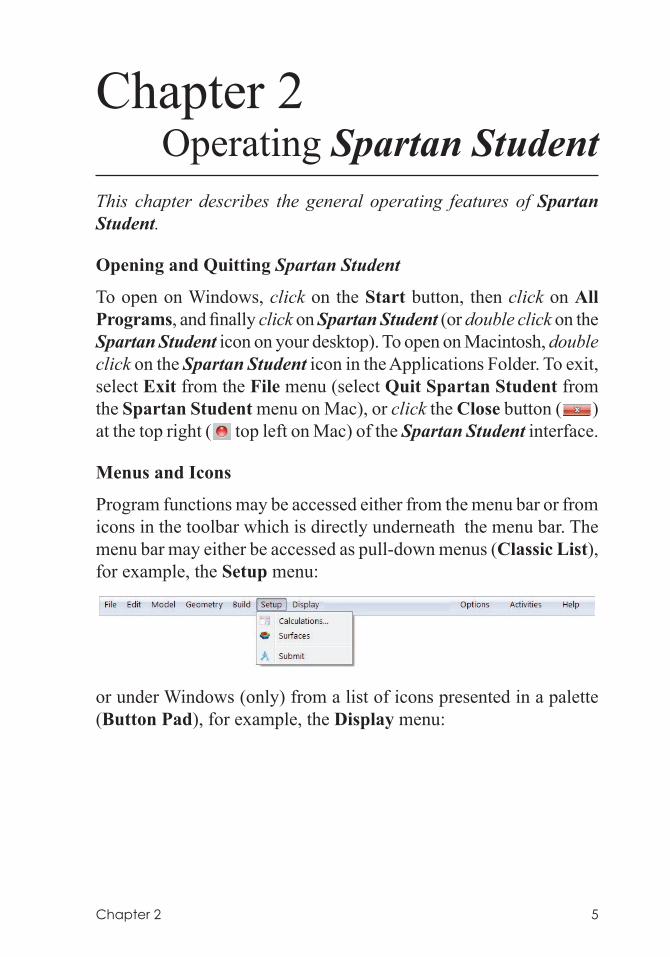
Program functions may be accessed either from the menu bar or from icons in the toolbar which is directly underneath the menu bar. The menu bar may either be accessed as pull-down menus (Classic List), for example, the Setup menu:
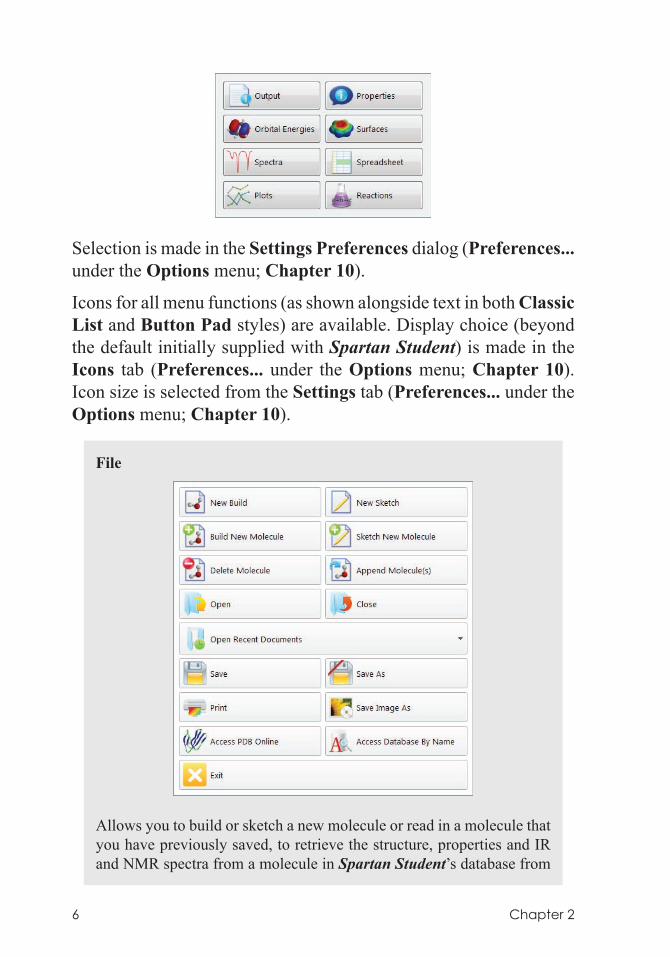
or under Windows (only) from a list of icons presented in a palette (Button Pad), for example, the Display menu:
6 Chapter 2
Selection is made in the Settings Preferences dialog (Preferences... under the Options menu; Chapter 10).
Icons for all menu functions (as shown alongside text in both Classic List and Button Pad styles) are available. Display choice (beyond the default initially supplied with Spartan Student) is made in the Icons tab (Preferences... under the Options menu; Chapter 10). Icon size is selected from the Settings tab (Preferences... under the Options menu; Chapter 10).
File
Allows you to build or sketch a new molecule or read in a molecule that you have previously saved, to retrieve the structure, properties and IR and NMR spectra from a molecule in Spartan Student’s database from
Chapter 2 7
its name, to retrieve a protein structure from the Protein Data Bank, to print what is on screen or save it as an image file, and to make QuickTime movies (Macintosh only).
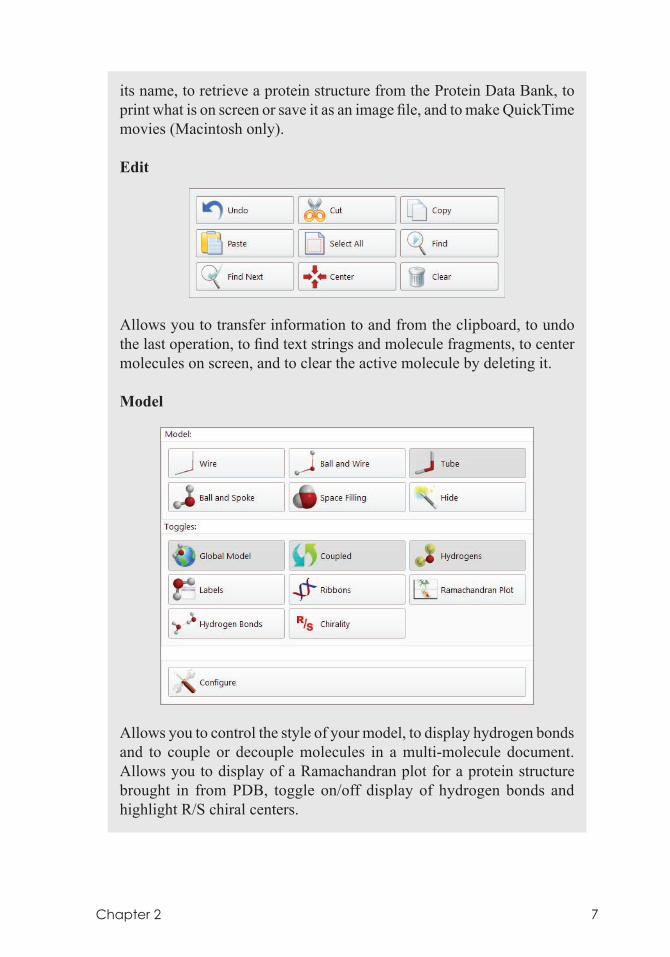
Edit
Allows you to transfer information to and from the clipboard, to undo the last operation, to find text strings and molecule fragments, to center molecules on screen, and to clear the active molecule by deleting it.
Model
Allows you to control the style of your model, to display hydrogen bonds and to couple or decouple molecules in a multi-molecule document. Allows you to display of a Ramachandran plot for a protein structure brought in from PDB, toggle on/off display of hydrogen bonds and highlight R/S chiral centers.
8 Chapter 2
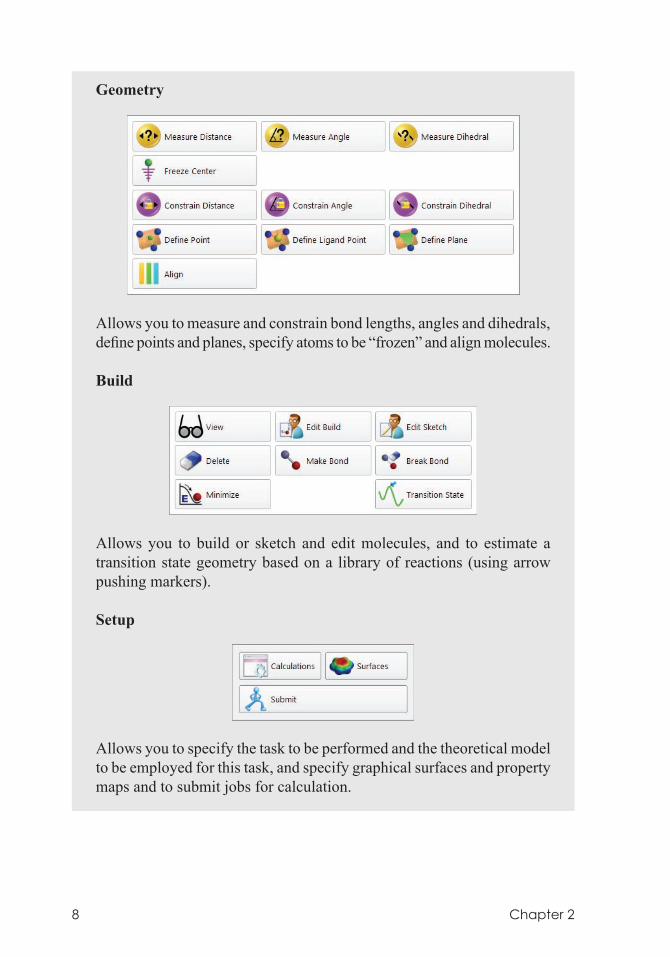
Geometry
Allows you to measure and constrain bond lengths, angles and dihedrals, define points and planes, specify atoms to be “frozen” and align molecules.
Build
Allows you to build or sketch and edit molecules, and to estimate a transition state geometry based on a library of reactions (using arrow pushing markers).
Setup
Allows you to specify the task to be performed and the theoretical model to be employed for this task, and specify graphical surfaces and property maps and to submit jobs for calculation.
Chapter 2 9
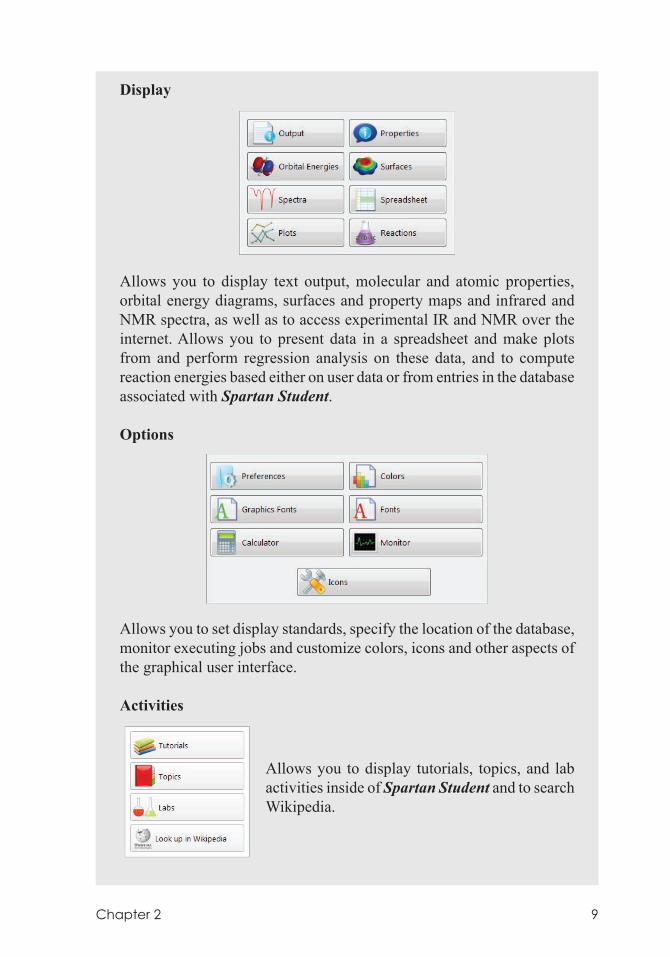
Display
Allows you to display text output, molecular and atomic properties, orbital energy diagrams, surfaces and property maps and infrared and NMR spectra, as well as to access experimental IR and NMR over the internet. Allows you to present data in a spreadsheet and make plots from and perform regression analysis on these data, and to compute reaction energies based either on user data or from entries in the database associated with Spartan Student.
Options
Allows you to set display standards, specify the location of the database, monitor executing jobs and customize colors, icons and other aspects of the graphical user interface.
Activities
Allows you to display tutorials, topics, and lab activities inside of Spartan Student and to search Wikipedia.
10 Chapter 2
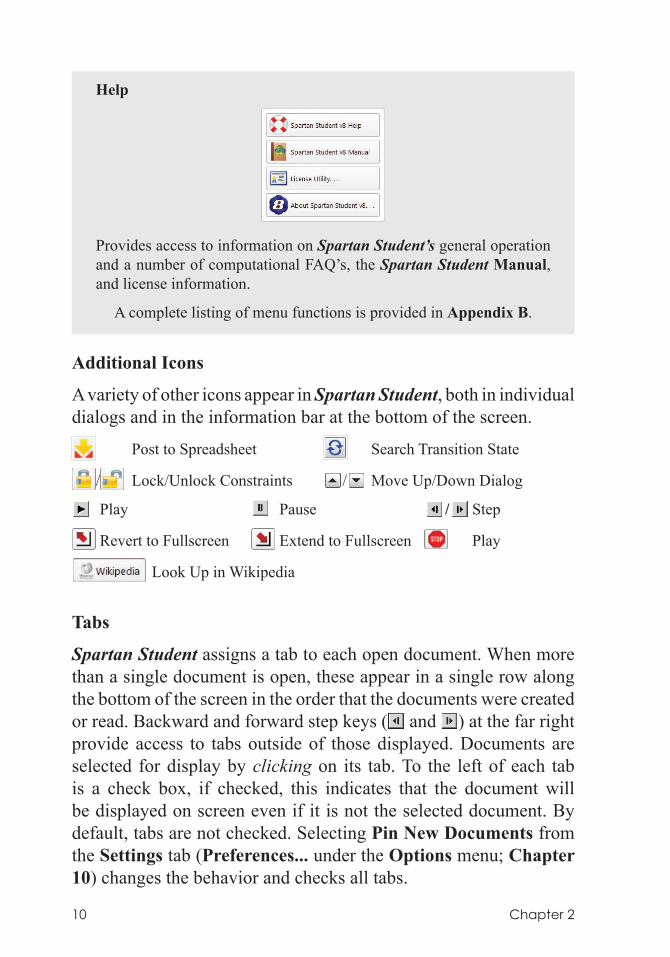
Help
Provides access to information on Spartan Student’s general operation and a number of computational FAQ’s, the Spartan Student Manual, and license information.
A complete listing of menu functions is provided in Appendix B.
Additional Icons
A variety of other icons appear in Spartan Student, both in individual dialogs and in the information bar at the bottom of the screen.
Post to Spreadsheet Search Transition State
/ Lock/Unlock Constraints / Move Up/Down Dialog
Play Pause / Step
Revert to Fullscreen Extend to Fullscreen Play
Look Up in Wikipedia
Tabs
Spartan Student assigns a tab to each open document. When more than a single document is open, these appear in a single row along the bottom of the screen in the order that the documents were created or read. Backward and forward step keys ( and ) at the far right provide access to tabs outside of those displayed. Documents are selected for display by clicking on its tab. To the left of each tab is a check box, if checked, this indicates that the document will be displayed on screen even if it is not the selected document. By default, tabs are not checked. Selecting Pin New Documents from the Settings tab (Preferences... under the Options menu; Chapter 10) changes the behavior and checks all tabs.
Chapter 2 11
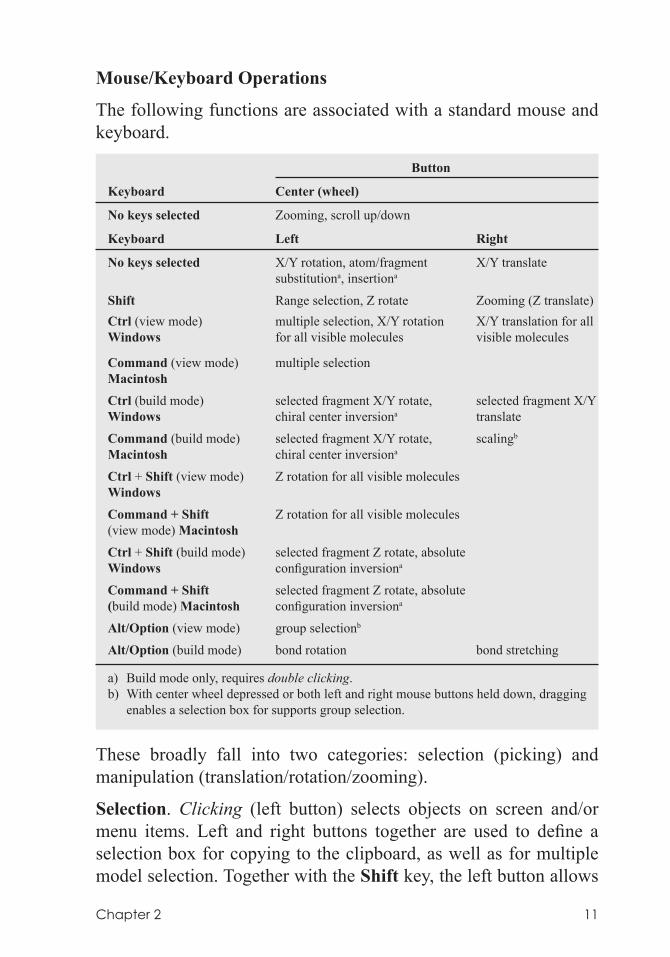
Mouse/Keyboard Operations
The following functions are associated with a standard mouse and keyboard.
Button
Keyboard Center (wheel)
No keys selected Zooming, scroll up/down
Keyboard Left Right
No keys selected X/Y rotation, atom/fragment X/Y translate substitutiona, insertiona
Shift Range selection, Z rotate Zooming (Z translate) Ctrl (view mode) multiple selection, X/Y rotation X/Y translation for all Windows for all visible molecules visible molecules
Command (view mode) multiple selection Macintosh Ctrl (build mode) selected fragment X/Y rotate, selected fragment X/Y Windows chiral center inversiona translate
Command (build mode) selected fragment X/Y rotate, scalingb
Macintosh chiral center inversiona
Ctrl + Shift (view mode) Z rotation for all visible molecules Windows
Command + Shift Z rotation for all visible molecules (view mode) Macintosh Ctrl + Shift (build mode) selected fragment Z rotate, absolute Windows configuration inversiona
Command + Shift selected fragment Z rotate, absolute (build mode) Macintosh configuration inversiona
Alt/Option (view mode) group selectionb
Alt/Option (build mode) bond rotation bond stretching
a) Build mode only, requires double clicking.b) With center wheel depressed or both left and right mouse buttons held down, dragging
enables a selection box for supports group selection.
These broadly fall into two categories: selection (picking) and manipulation (translation/rotation/zooming).
Selection. Clicking (left button) selects objects on screen and/or menu items. Left and right buttons together are used to define a selection box for copying to the clipboard, as well as for multiple model selection. Together with the Shift key, the left button allows
12 Chapter 2
for selection over a range. Together with the Ctrl (Control) key, the left button allows for multiple selection. Both range and multiple selection apply not only to text items in lists, but to atoms and bonds in molecules as well. Together with the Alt key (option key for Mac), the left button allows for selection of an entire group (detached molecular fragment).
In Edit Build mode (only), double clicking (left button) on an atom exchanges it with the atom or atomic fragment selected in the model kit. Double clicking on an atom while holding down the Ctrl key leads to inversion in chirality of the atom and double clicking on a molecule while holding down both the Ctrl and Shift keys inverts the absolute configuration of the molecule. These operations are not available in the 2D sketcher (Edit Sketch mode). Once an initial fragment, group or ring has been drawn, double clicking on the background will insert it alongside (but not bonded to) whatever fragments currently exist on screen.
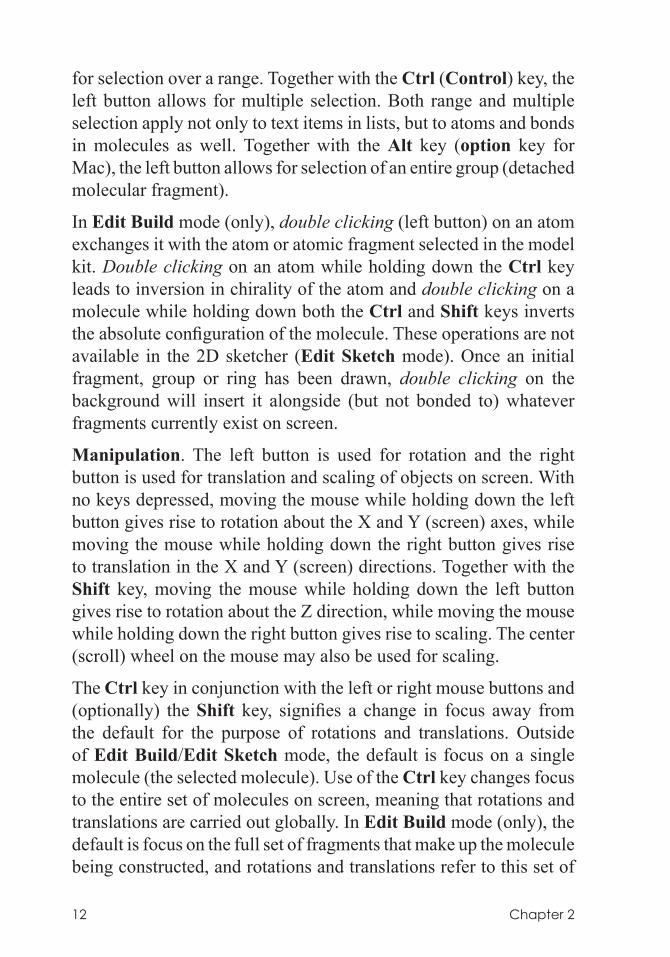
Manipulation. The left button is used for rotation and the right button is used for translation and scaling of objects on screen. With no keys depressed, moving the mouse while holding down the left button gives rise to rotation about the X and Y (screen) axes, while moving the mouse while holding down the right button gives rise to translation in the x and Y (screen) directions. Together with the Shift key, moving the mouse while holding down the left button gives rise to rotation about the z direction, while moving the mouse while holding down the right button gives rise to scaling. The center (scroll) wheel on the mouse may also be used for scaling.
The Ctrl key in conjunction with the left or right mouse buttons and (optionally) the Shift key, signifies a change in focus away from the default for the purpose of rotations and translations. Outside of Edit Build/Edit Sketch mode, the default is focus on a single molecule (the selected molecule). Use of the Ctrl key changes focus to the entire set of molecules on screen, meaning that rotations and translations are carried out globally. In Edit Build mode (only), the default is focus on the full set of fragments that make up the molecule being constructed, and rotations and translations refer to this set of
Chapter 2 13
fragments as a whole. Use of the Ctrl key changes focus to a single fragment (the selected fragment), and rotations and translations now refer only to this fragment (does not apply to Edit Sketch mode).
In Edit Build mode (only), moving the mouse while holding down the Alt key (option key for Mac) together with the left mouse button rotates about the selected bond and, with the right mouse button, changes the length of the selected bond. Bond rotation (only) may also be accomplished by moving the mouse up and down inside the demarked area at the left of the screen while holding down the left button (does not apply to Edit Sketch mode).
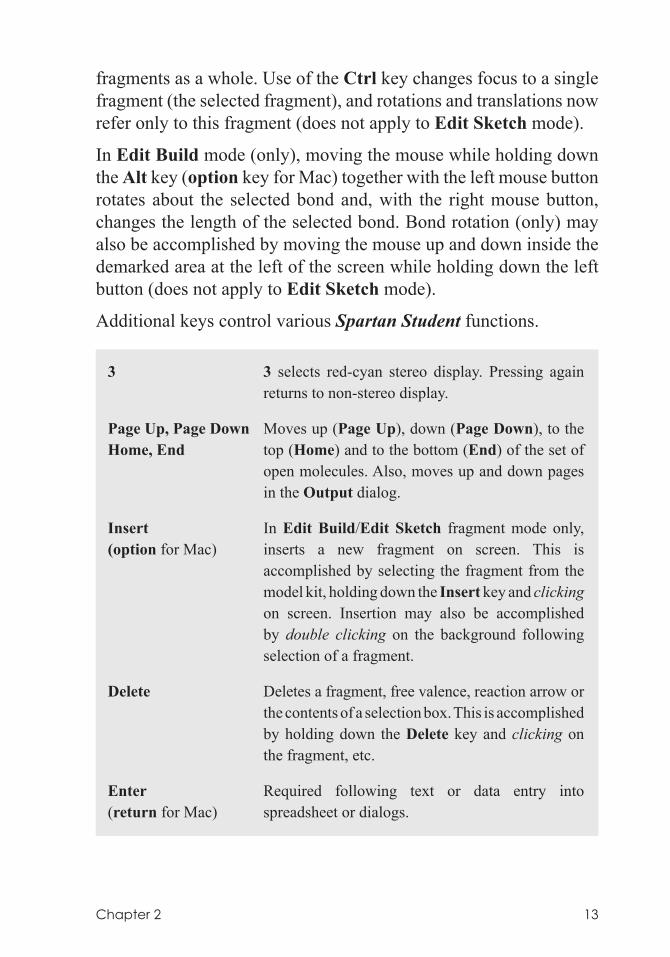
Additional keys control various Spartan Student functions.
3 3 selects red-cyan stereo display. Pressing again returns to non-stereo display.
Page Up, Page Down Moves up (Page Up), down (Page Down), to the Home, End top (Home) and to the bottom (End) of the set of
open molecules. Also, moves up and down pages in the Output dialog.
Insert In Edit Build/Edit Sketch fragment mode only,(option for Mac) inserts a new fragment on screen. This is accomplished by selecting the fragment from the
model kit, holding down the Insert key and clicking on screen. Insertion may also be accomplished by double clicking on the background following selection of a fragment.
Delete Deletes a fragment, free valence, reaction arrow or the contents of a selection box. This is accomplished by holding down the Delete key and clicking on the fragment, etc.
Enter Required following text or data entry into(return for Mac) spreadsheet or dialogs.
14 Chapter 2
Touch-Screen Operations
Tapping is equivalent to clicking and double tapping is equivalent to double clicking. Touch commands for range and multiple selection have not been implemented. One finger motions on screen are equivalent to left button motions (object and bond rotation). Two finger motions are equivalent to right button motions (object translation). Two finger pinching is equivalent to scroll wheel operations (zooming).
Selecting Molecules
While two or more molecules may be simultaneously displayed in Spartan Student’s window (see Tabs earlier in this chapter), only one molecule may be selected. Only the selected molecule has access to all capabilities. Molecule selection occurs by clicking on its structure model or on any of its associated graphical surfaces. The previously selected molecule is deselected.
Where the molecule belongs to a document with more than a single molecule, selection from among the different molecules may be made using either the and buttons or the scroll bar at the bottom left of the screen. Clicking on at the bottom left of the screen animates the display of molecules in the document, that is, steps through them sequentially. Animation speed is controlled from the Settings tab (Preferences... under the Options menu; Chapter 10). Clicking on
(that replaces ) stops the animation. If the spreadsheet associated with the document is open (Spreadsheet under the Display menu; Chapter 9), selection can also be made by clicking on the molecule label at the left of the spreadsheet.
Two or more molecules from the same document may be displayed at once (although only one may be selected). Molecules are marked for display by checking the box immediately to the left of the molecule label in the spreadsheet.
Chapter 2 15
Database
Included with Spartan Student is a ≈6,000 molecule subset of the Spartan Spectra and Properties Database (SSPD).* This provides infrared and NMR spectra in addition to a variety of molecular properties obtained from the EDF2/6-31G* or wB97X-D/6-31G* density functional model. The database may be accessed either by molecule name (see Chapter 3) or by molecule structure (see below).
The existence of the selected molecule in the database is signaled by its name being displayed at the bottom of the screen.
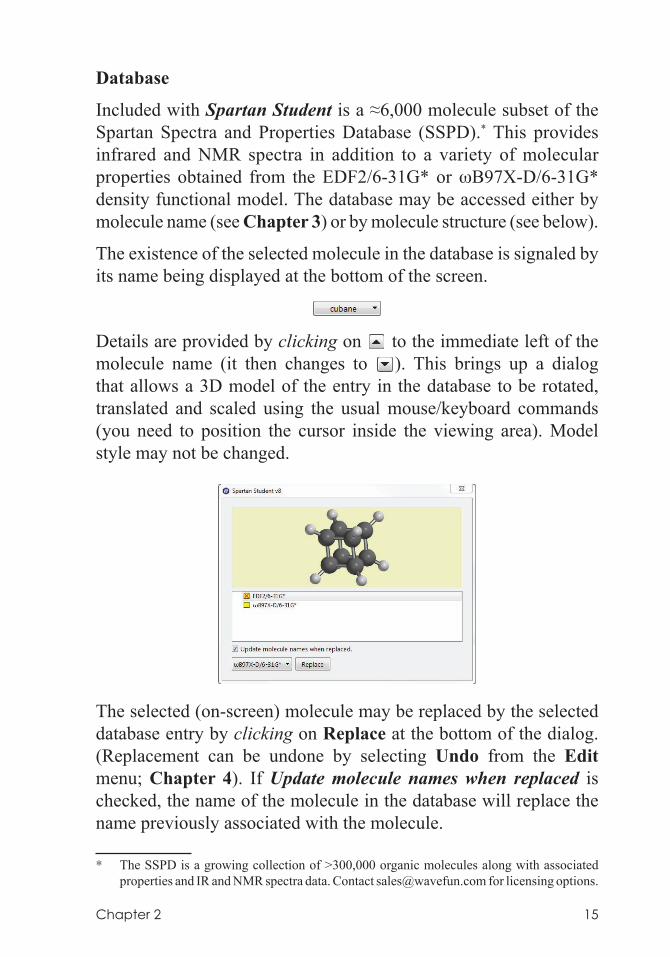
Details are provided by clicking on to the immediate left of the molecule name (it then changes to ). This brings up a dialog that allows a 3D model of the entry in the database to be rotated, translated and scaled using the usual mouse/keyboard commands (you need to position the cursor inside the viewing area). Model style may not be changed.
The selected (on-screen) molecule may be replaced by the selected database entry by clicking on Replace at the bottom of the dialog. (Replacement can be undone by selecting Undo from the Edit menu; Chapter 4). If Update molecule names when replaced is checked, the name of the molecule in the database will replace the name previously associated with the molecule.
* The SSPD is a growing collection of >300,000 organic molecules along with associated properties and IR and NMR spectra data. Contact [email protected] for licensing options.
16 Chapter 2
In the event that the selected (on-screen) molecule belongs to a multi-molecule document, it is possible to replace all molecules in the document for which database entries are available. In this case, clicking on Replace will give rise to a second dialog. Clicking on All will replace all the molecules in the document, while clicking on Current will replace only the selected molecule.
Stereo DisplaysSpartan Student supports red-cyan stereo. Red/blue glasses must be worn. To enter stereo mode, press the 3 key. Press again to return to non-stereo mode, not applicable to the 2D sketcher.
Changing Colors and Setting Preferences
Colors and Preferences... under the Options menu (Chapter 10) allow for changing default background and graphical object colors, and for setting (and resetting) program defaults, respectively.
Monitoring and Terminating Jobs
Monitor under the Options menu (Chapter 10) allows for monitoring of executing jobs as well as for terminating jobs.
Chapter 3 17
Chapter 3The File Menu
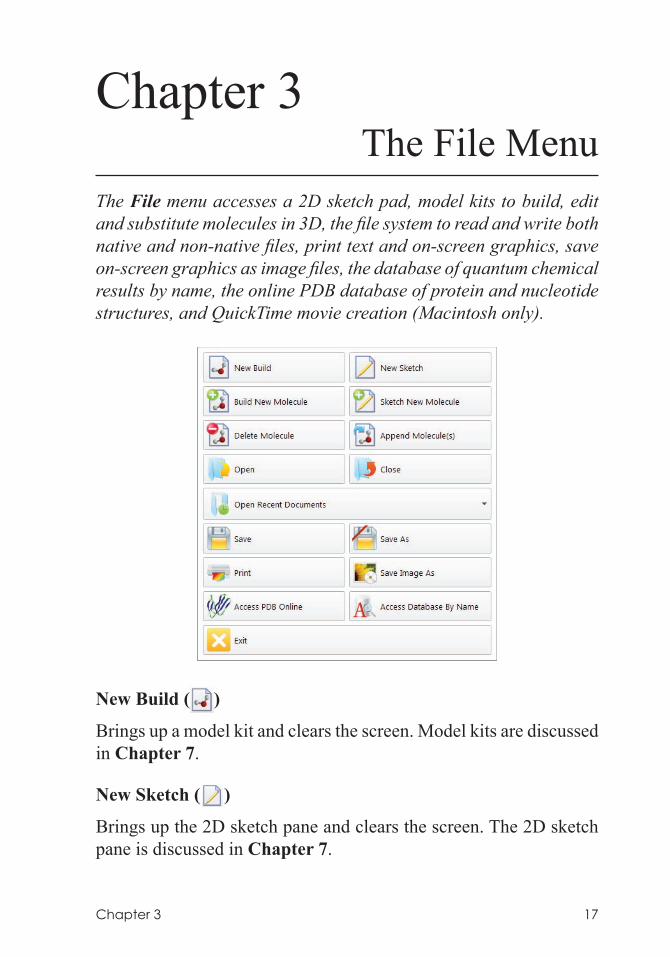
The File menu accesses a 2D sketch pad, model kits to build, edit and substitute molecules in 3D, the file system to read and write both native and non-native files, print text and on-screen graphics, save on-screen graphics as image files, the database of quantum chemical results by name, the online PDB database of protein and nucleotide structures, and QuickTime movie creation (Macintosh only).
New Build ( )
Brings up a model kit and clears the screen. Model kits are discussed in Chapter 7.
New Sketch ( )
Brings up the 2D sketch pane and clears the screen. The 2D sketch pane is discussed in Chapter 7.
18 Chapter 3
Build New Molecule ( )
Brings up a model kit and clears the screen. Build New Molecule differs from New Build, in that the resulting molecule is appended to the end of the document associated with the molecule (or sketch) that is presently selected.
Sketch New Molecule ( )
Brings up the 2D sketch pane and clears the screen. The menu bar is still accessible, but only the View ( ) and Sketch New Molecule ( ) icons are available. Sketch New Molecule differs from New Sketch in that the resulting sketch is appended to the end of the document associated with the molecule (or sketch) that is presently selected.
Delete Molecule ( )
Deletes the selected molecule(s) from a document. Deleting the last molecule leads to an empty document.
Append Molecule(s)... ( )
Appends one or more documents onto the end of the document that contains the selected molecule. Append Molecule(s)... leads to a file browser from which one or more documents need to be selected.*
Open... ( )
Opens a file that contains all information associated with a particular
* Alternatively, molecules may be appended onto an existing document either by copy/paste operations using the clipboard or by dragging from an external window. Both require that the spreadsheet associated with the destination document be open on screen.
To copy a molecule open on screen onto the clipboard, first select (click on) it, and then select Copy from the Edit menu. Alternatively, click on its label in its spreadsheet (in the leftmost column), and then select Copy from the Edit menu. The latter permits several molecules to be selected (and copied) at once using the Shift and Ctrl keys in the usual manner. Once on the clipboard, the molecule or molecules may be moved to the destination list by clicking on an empty row header in the spreadsheet (for the destination document), and then selecting Paste from the Edit menu.
To copy a document from an external window, drag it onto the open spreadsheet (associated with the destination document) inside of Spartan Student. Several documents can be dragged at once using the Shift and Ctrl keys in the usual manner.
Chapter 3 19
molecule (or list of molecules). In addition to native (.spartan) files (documents) including 2D sketch files, supported are files containing 2D drawings, 3D structures and 1D strings. Also supported are file formats for experimental IR and NMR spectra. Non-native files are normally hidden from view, but may be seen by selecting All Files from the Files of type menu at the bottom of the dialog.
Open Recent Documents ( )
Brings up a list of (at most) ten recent documents. Clicking on one opens the document.
Save ( )Save As... ( )Save Image As... ( )
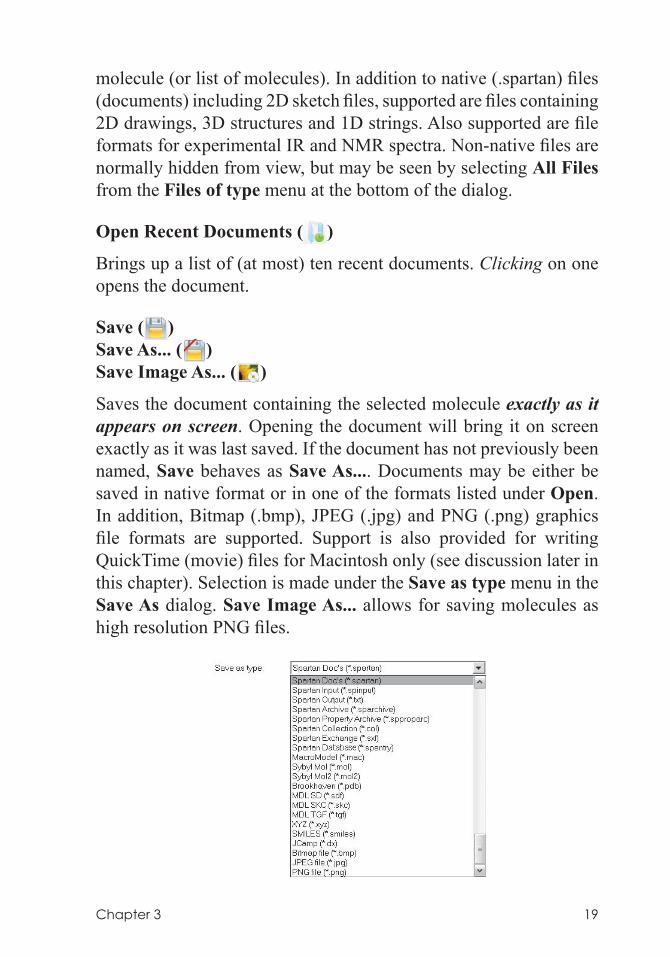
Saves the document containing the selected molecule exactly as it appears on screen. Opening the document will bring it on screen exactly as it was last saved. If the document has not previously been named, Save behaves as Save As.... Documents may be either be saved in native format or in one of the formats listed under Open. In addition, Bitmap (.bmp), JPEG (.jpg) and PNG (.png) graphics file formats are supported. Support is also provided for writing QuickTime (movie) files for Macintosh only (see discussion later in this chapter). Selection is made under the Save as type menu in the Save As dialog. Save Image As... allows for saving molecules as high resolution PNG files.
20 Chapter 3
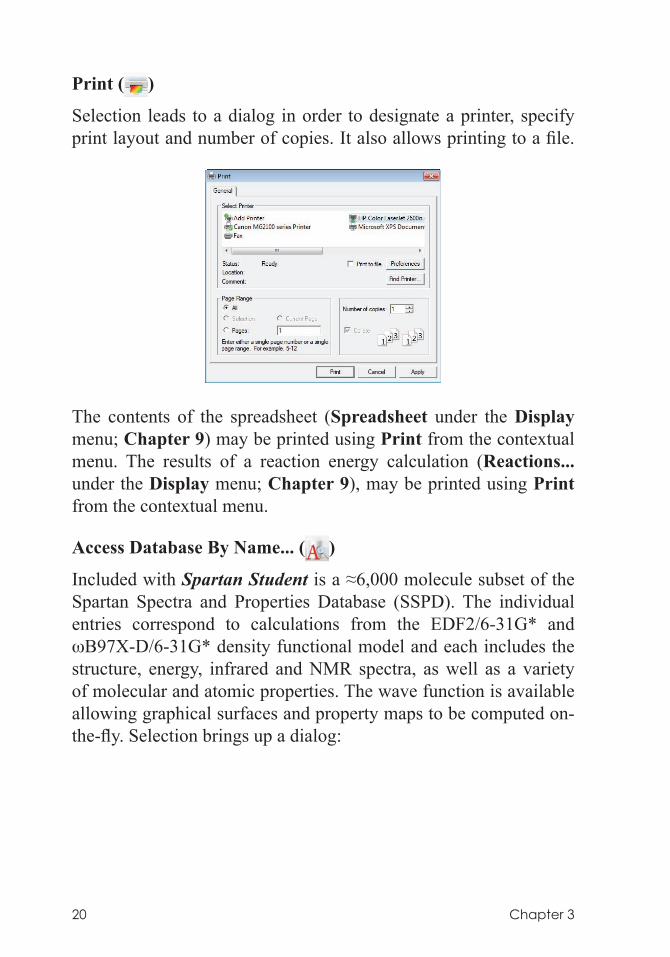
Print ( )
Selection leads to a dialog in order to designate a printer, specify print layout and number of copies. It also allows printing to a file.
The contents of the spreadsheet (Spreadsheet under the Display menu; Chapter 9) may be printed using Print from the contextual menu. The results of a reaction energy calculation (Reactions... under the Display menu; Chapter 9), may be printed using Print from the contextual menu.
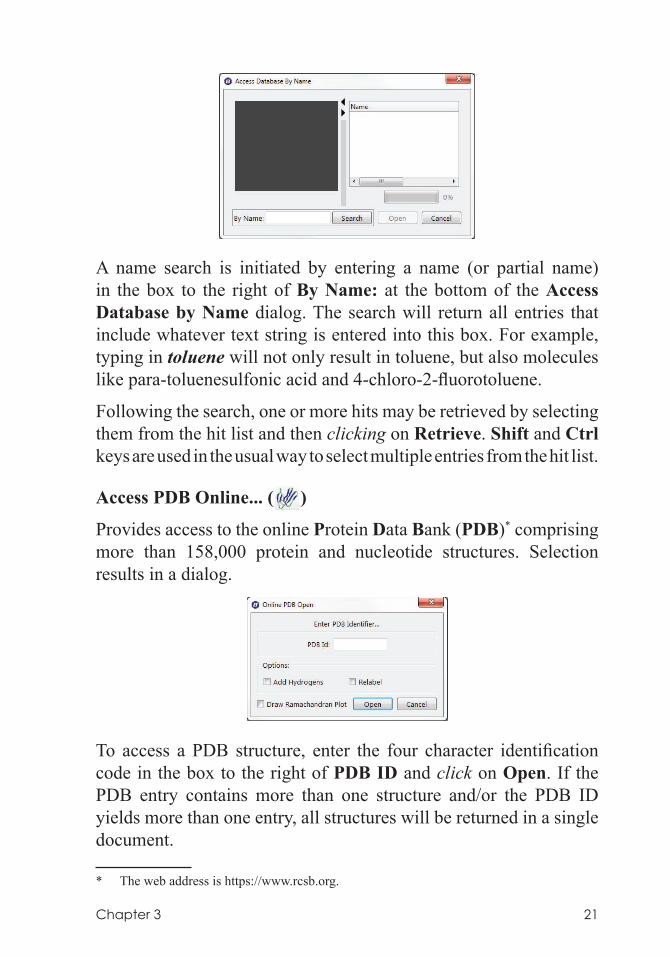
Access Database By Name... ( )
Included with Spartan Student is a ≈6,000 molecule subset of the Spartan Spectra and Properties Database (SSPD). The individual entries correspond to calculations from the EDF2/6-31G* and wB97X-D/6-31G* density functional model and each includes the structure, energy, infrared and NMR spectra, as well as a variety of molecular and atomic properties. The wave function is available allowing graphical surfaces and property maps to be computed on-the-fly. Selection brings up a dialog:
Chapter 3 21
A name search is initiated by entering a name (or partial name) in the box to the right of By Name: at the bottom of the Access Database by Name dialog. The search will return all entries that include whatever text string is entered into this box. For example, typing in toluene will not only result in toluene, but also molecules like para-toluenesulfonic acid and 4-chloro-2-fluorotoluene.
Following the search, one or more hits may be retrieved by selecting them from the hit list and then clicking on Retrieve. Shift and Ctrl keys are used in the usual way to select multiple entries from the hit list.
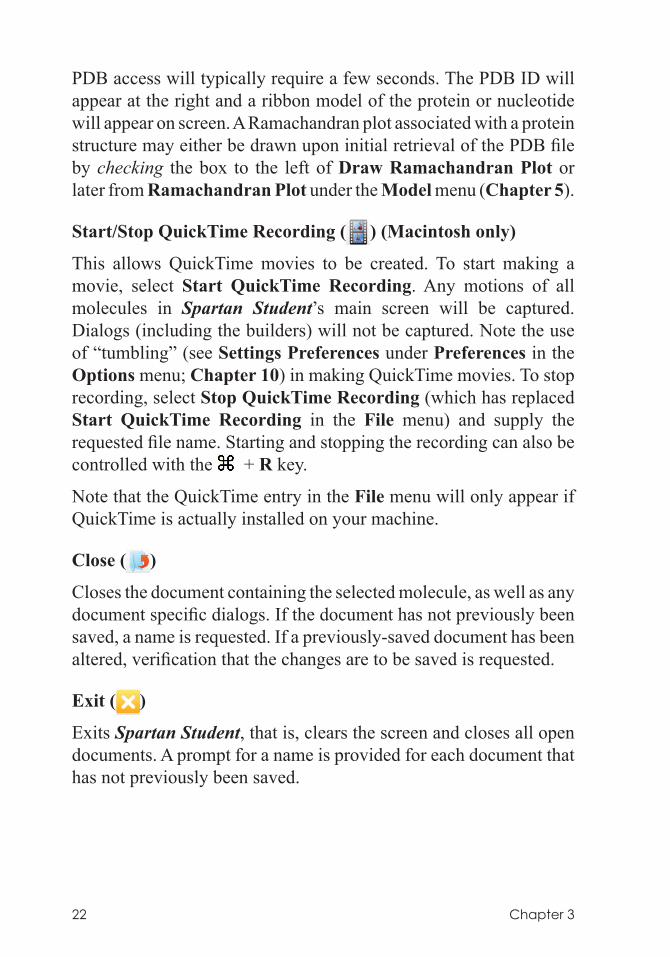
Access PDB Online... ( )
Provides access to the online Protein Data Bank (PDB)* comprising more than 158,000 protein and nucleotide structures. Selection results in a dialog.
To access a PDB structure, enter the four character identification code in the box to the right of PDB ID and click on Open. If the PDB entry contains more than one structure and/or the PDB ID yields more than one entry, all structures will be returned in a single document.
* The web address is https://www.rcsb.org.
22 Chapter 3
PDB access will typically require a few seconds. The PDB ID will appear at the right and a ribbon model of the protein or nucleotide will appear on screen. A Ramachandran plot associated with a protein structure may either be drawn upon initial retrieval of the PDB file by checking the box to the left of Draw Ramachandran Plot or later from Ramachandran Plot under the Model menu (Chapter 5).
Start/Stop QuickTime Recording ( ) (Macintosh only)
This allows QuickTime movies to be created. To start making a movie, select Start QuickTime Recording. Any motions of all molecules in Spartan Student’s main screen will be captured. Dialogs (including the builders) will not be captured. Note the use of “tumbling” (see Settings Preferences under Preferences in the Options menu; Chapter 10) in making QuickTime movies. To stop recording, select Stop QuickTime Recording (which has replaced Start QuickTime Recording in the File menu) and supply the requested file name. Starting and stopping the recording can also be controlled with the + R key.
Note that the QuickTime entry in the File menu will only appear if QuickTime is actually installed on your machine.
Close ( )
Closes the document containing the selected molecule, as well as any document specific dialogs. If the document has not previously been saved, a name is requested. If a previously-saved document has been altered, verification that the changes are to be saved is requested.
Exit ( )
Exits Spartan Student, that is, clears the screen and closes all open documents. A prompt for a name is provided for each document that has not previously been saved.
Chapter 4 23
Chapter 4The Edit Menu
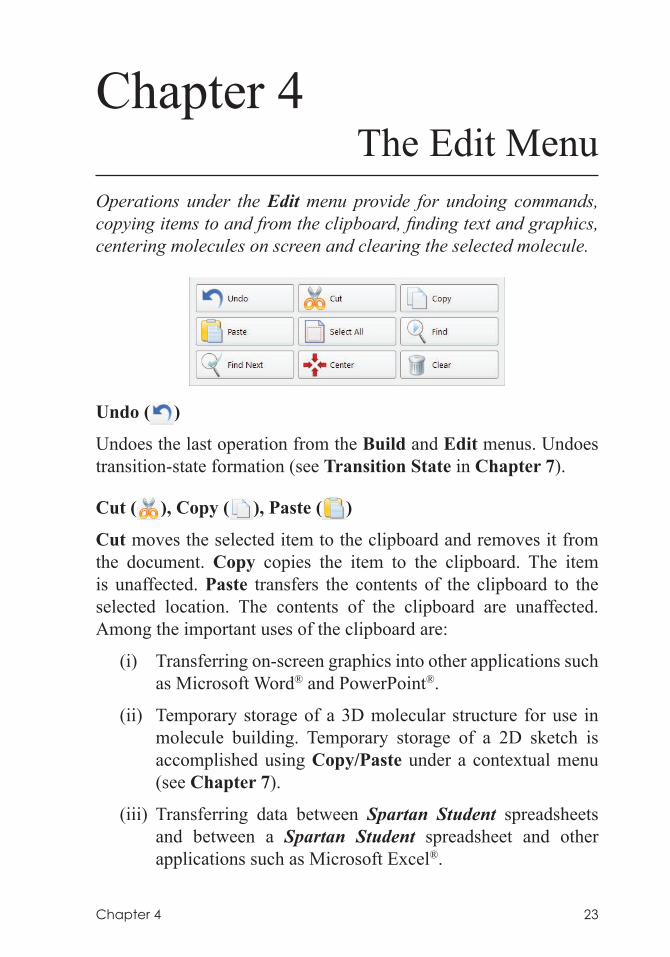
Operations under the Edit menu provide for undoing commands, copying items to and from the clipboard, finding text and graphics, centering molecules on screen and clearing the selected molecule.
Undo ( )
Undoes the last operation from the Build and Edit menus. Undoes transition-state formation (see Transition State in Chapter 7).
Cut ( ), Copy ( ), Paste ( )
Cut moves the selected item to the clipboard and removes it from the document. Copy copies the item to the clipboard. The item is unaffected. Paste transfers the contents of the clipboard to the selected location. The contents of the clipboard are unaffected. Among the important uses of the clipboard are:
(i) Transferring on-screen graphics into other applications such as Microsoft Word® and PowerPoint®.
(ii) Temporary storage of a 3D molecular structure for use in molecule building. Temporary storage of a 2D sketch is accomplished using Copy/Paste under a contextual menu (see Chapter 7).
(iii) Transferring data between Spartan Student spreadsheets and between a Spartan Student spreadsheet and other applications such as Microsoft Excel®.
24 Chapter 4
(iv) Making multi-molecule documents and/or transferring molecules between documents.
Cut operations for (i) and (ii) require drawing a selection box. Position the cursor slightly above and slightly to the left of the item to be transferred, hold down both buttons and drag the mouse to a location slightly below and slightly to the right of the item to be transferred and release both buttons. Copy operations for (i) and (ii) also refer to the contents of a selection box if one has been drawn, but to the selected molecule if a box has not been drawn. Copy operations from a spreadsheet refer to all information associated with a molecule if selection is made on the header cell of the leftmost column, but only to the selected (text) information if selection is made on any other column. Further discussion relating to use of the clipboard in molecule building is provided in Chapter 7 and for moving data in and out of the spreadsheet in Chapter 9.
Select All ( )
Selects all atoms in the selected molecule.
Find...( ), Find Next ( )
Find locates a text string defined in the Find dialog if an output window or a spreadsheet is selected, or a structure sequence defined on the clipboard if an on-screen model is selected. Find Next locates the next occurrence of a text string or a structure sequence.
Center ( )
Centers on screen all molecules in the document for which the selected molecule is a member (only the selected molecule is displayed).
Clear ( )
Clears (deletes) the structure and other information for the selected molecule, and brings up a model kit. Information is not removed from the file system until the document is saved.
Chapter 5 25
Chapter 5The Model Menu
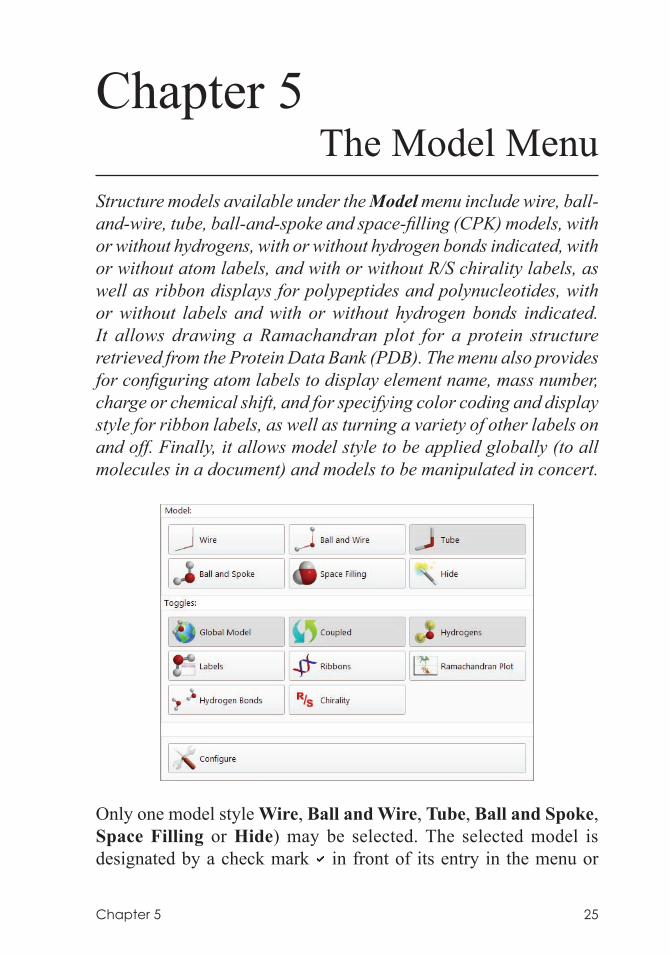
Structure models available under the Model menu include wire, ball-and-wire, tube, ball-and-spoke and space-filling (CPK) models, with or without hydrogens, with or without hydrogen bonds indicated, with or without atom labels, and with or without R/S chirality labels, as well as ribbon displays for polypeptides and polynucleotides, with or without labels and with or without hydrogen bonds indicated. It allows drawing a Ramachandran plot for a protein structure retrieved from the Protein Data Bank (PDB). The menu also provides for configuring atom labels to display element name, mass number, charge or chemical shift, and for specifying color coding and display style for ribbon labels, as well as turning a variety of other labels on and off. Finally, it allows model style to be applied globally (to all molecules in a document) and models to be manipulated in concert.
Only one model style Wire, Ball and Wire, Tube, Ball and Spoke, Space Filling or Hide) may be selected. The selected model is designated by a check mark in front of its entry in the menu or
26 Chapter 5
by a highlighted button in the case of the button pad option. Global Model, Coupled, Hydrogens, Labels, Ribbons and Hydrogen Bonds operate as toggle switches. A in front of the entry in the menu indicates that it is selected.
All structure models and graphics may be displayed either in orthogonal or perspective projections. The latter may be valuable in helping to visualize large molecules. Selection is done in the Settings tab (Preferences... under the Options menu; Chapter 10). Both structure models and graphics may be presented in 3D stereo. This is also controlled from the Settings tab as well as from the 3 key. Stereographic displays require perspective projections.
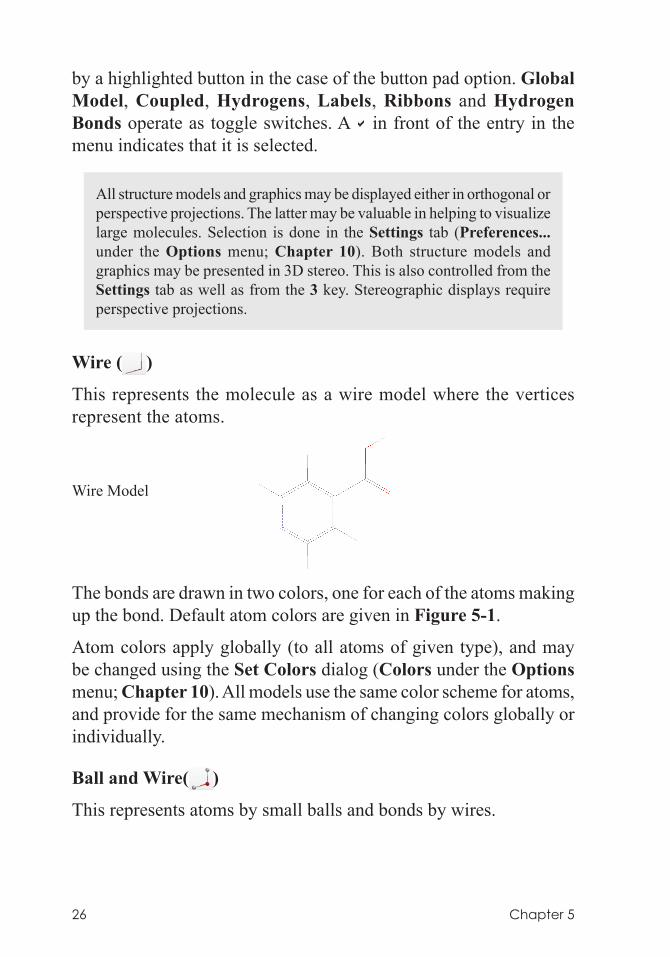
Wire ( )
This represents the molecule as a wire model where the vertices represent the atoms.
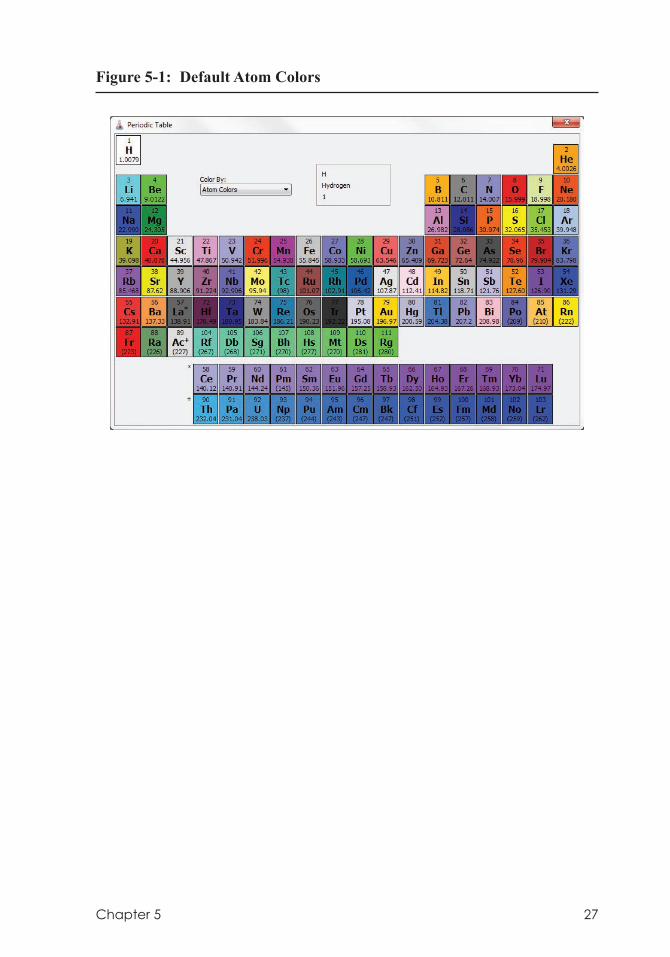
The bonds are drawn in two colors, one for each of the atoms making up the bond. Default atom colors are given in Figure 5-1.
Atom colors apply globally (to all atoms of given type), and may be changed using the Set Colors dialog (Colors under the Options menu; Chapter 10). All models use the same color scheme for atoms, and provide for the same mechanism of changing colors globally or individually.
Ball and Wire( )
This represents atoms by small balls and bonds by wires.
Wire Model
Chapter 5 27
Figure 5-1: Default Atom Colors
28 Chapter 5
Ball-and-Spoke Model
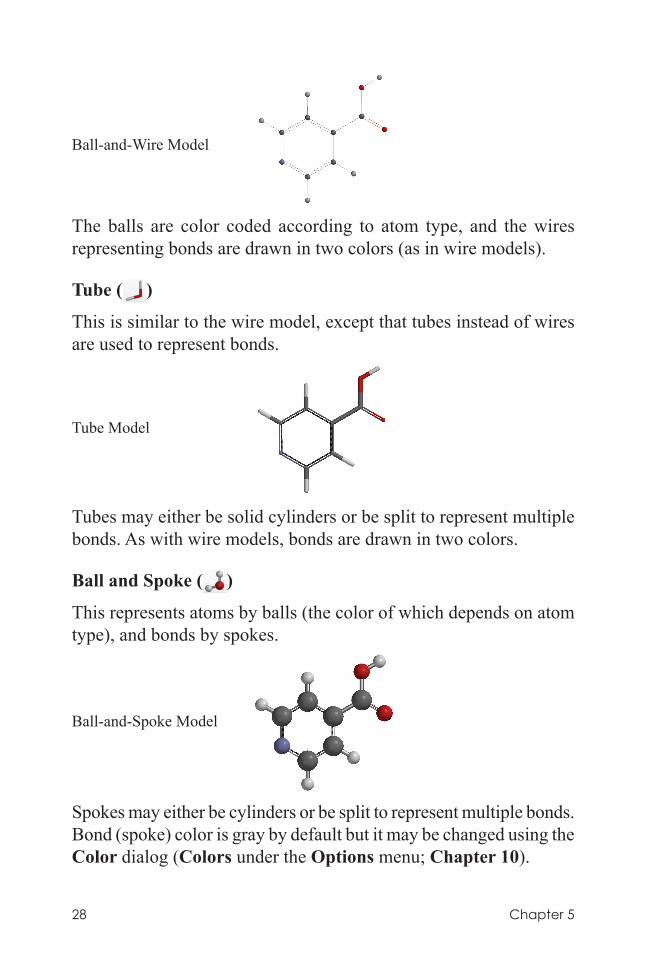
The balls are color coded according to atom type, and the wires representing bonds are drawn in two colors (as in wire models).
Tube ( )
This is similar to the wire model, except that tubes instead of wires are used to represent bonds.
Tubes may either be solid cylinders or be split to represent multiple bonds. As with wire models, bonds are drawn in two colors.
Ball and Spoke ( )
This represents atoms by balls (the color of which depends on atom type), and bonds by spokes.
Spokes may either be cylinders or be split to represent multiple bonds. Bond (spoke) color is gray by default but it may be changed using the Color dialog (Colors under the Options menu; Chapter 10).
Tube Model
Ball-and-Wire Model
Chapter 5 29
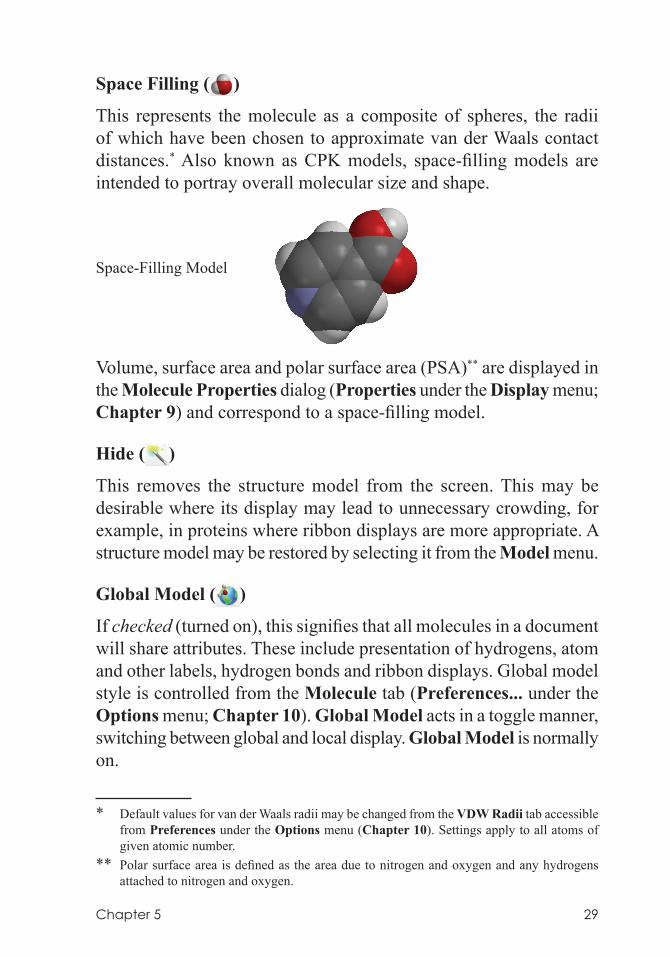
Space Filling ( )
This represents the molecule as a composite of spheres, the radii of which have been chosen to approximate van der Waals contact distances.* Also known as CPK models, space-filling models are intended to portray overall molecular size and shape.
Volume, surface area and polar surface area (PSA)** are displayed in the Molecule Properties dialog (Properties under the Display menu; Chapter 9) and correspond to a space-filling model.
Hide ( )
This removes the structure model from the screen. This may be desirable where its display may lead to unnecessary crowding, for example, in proteins where ribbon displays are more appropriate. A structure model may be restored by selecting it from the Model menu.
Global Model ( )
If checked (turned on), this signifies that all molecules in a document will share attributes. These include presentation of hydrogens, atom and other labels, hydrogen bonds and ribbon displays. Global model style is controlled from the Molecule tab (Preferences... under the Options menu; Chapter 10). Global Model acts in a toggle manner, switching between global and local display. Global Model is normally on.
* Default values for van der Waals radii may be changed from the VDW Radii tab accessible from Preferences under the Options menu (Chapter 10). Settings apply to all atoms of given atomic number.
** Polar surface area is defined as the area due to nitrogen and oxygen and any hydrogens attached to nitrogen and oxygen.
Space-Filling Model
30 Chapter 5
Coupled ( )
If checked (turned on), this signifies that all molecules in a document selected for simultaneous display will be moved together. Coupled is turned on following molecule alignment (see Align under the Geometry menu; Chapter 6). Coupled acts in a toggle manner, that is, repeated selection couples and decouples the molecules.
Hydrogens ( )
If checked, this signifies that hydrogens are to be included in the model. Hydrogens acts in a toggle manner, that is, repeated selection turns the display of hydrogens on and off.
Labels ( )
If checked, this signifies that labels associated with atoms, ribbons and bonds as well as with other attributes specified in Configure... (see discussion later in this chapter) are to be displayed in the model. Labels acts in a toggle manner, that is, repeated selection turns display of labels on and off. Labels is automatically turned on following selection of Apply or OK in the Configure dialog.
Ribbons ( )
If checked, this signifies that ribbons are to be displayed along with the selected model. (If only ribbons are desired, for example, in proteins, select Hide for the model.) Ribbons acts in a toggle manner, that is, repeated selection turns display of ribbons on and off.
Ramachandran Plot ( )
If checked, this draws a Ramachandran plot for a protein input from the Protein Data Bank (see Access PDB Online under the File menu; Chapter 3). Ramachandran Plot acts in a toggle manner, that is, repeated selection turns the plot on and off. Note that coloring of the points on the plot (red for a-helices, blue for b-sheets, green otherwise) is not based on the actual 3D geometry but rather on assignments in the PDB file.
Chapter 5 31
Hydrogen Bonds ( )
If checked, this signifies that hydrogen bonds are to be drawn as part of the model. Hydrogen Bonds acts in a toggle manner, that is, repeated selection turns display of hydrogen bonds on and off.
R/S Chirality ( )
If selected, this adds R/S chirality labels to the model. R/S Chirality acts in a toggle manner, that is, repeated selection turns R/S labels on and off.
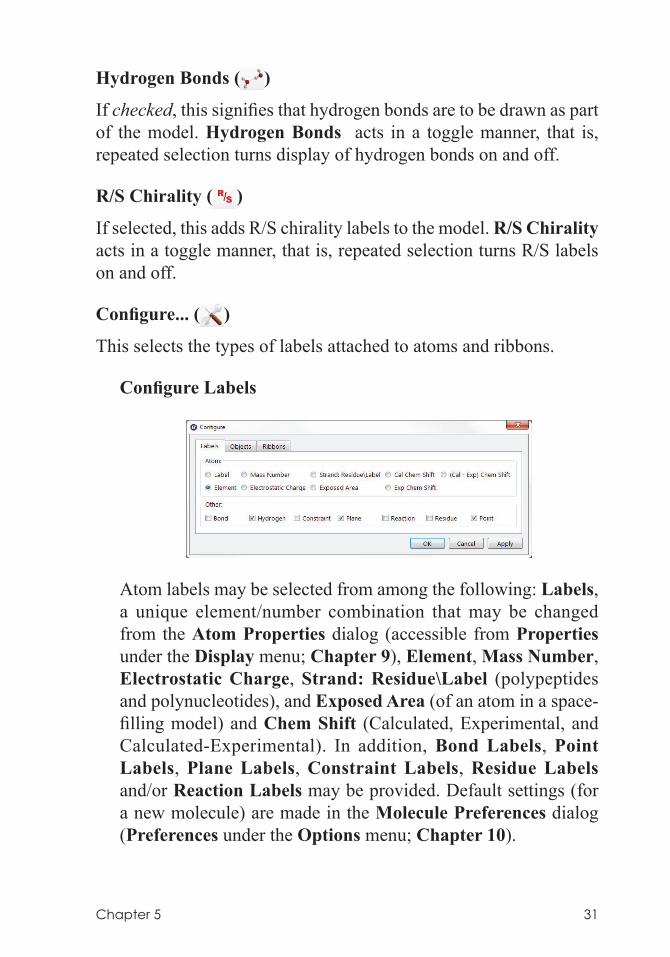
Configure... ( )
This selects the types of labels attached to atoms and ribbons.
Configure Labels
Atom labels may be selected from among the following: Labels, a unique element/number combination that may be changed from the Atom Properties dialog (accessible from Properties under the Display menu; Chapter 9), Element, Mass Number, Electrostatic Charge, Strand: Residue\Label (polypeptides and polynucleotides), and Exposed Area (of an atom in a space-filling model) and Chem Shift (Calculated, Experimental, and Calculated-Experimental). In addition, Bond Labels, Point Labels, Plane Labels, Constraint Labels, Residue Labels and/or Reaction Labels may be provided. Default settings (for a new molecule) are made in the Molecule Preferences dialog (Preferences under the Options menu; Chapter 10).
32 Chapter 5
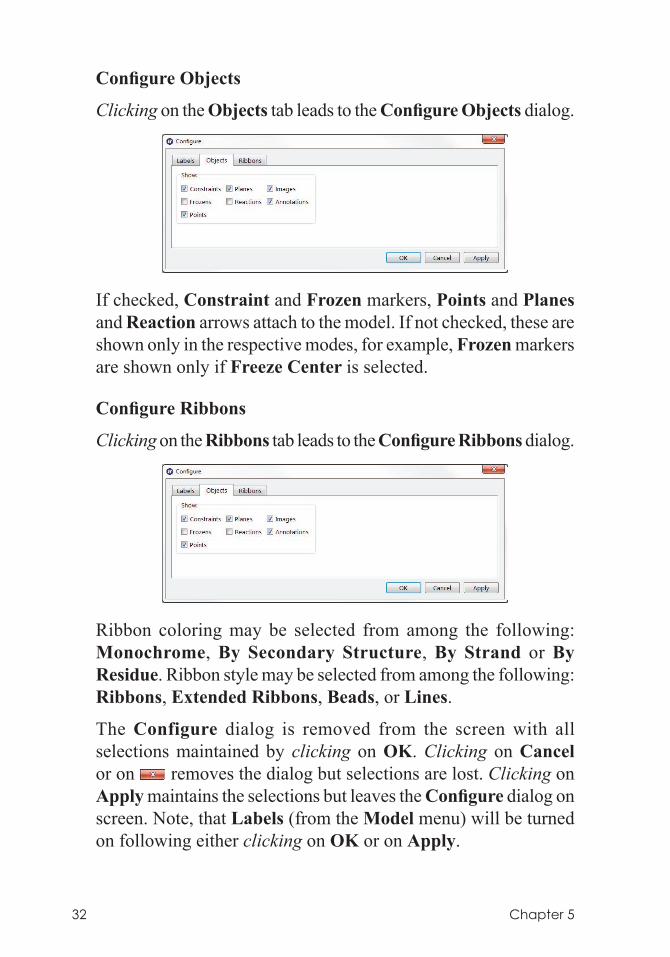
Configure Objects
Clicking on the Objects tab leads to the Configure Objects dialog.
If checked, Constraint and Frozen markers, Points and Planes and Reaction arrows attach to the model. If not checked, these are shown only in the respective modes, for example, Frozen markers are shown only if Freeze Center is selected.
Configure Ribbons
Clicking on the Ribbons tab leads to the Configure Ribbons dialog.
Ribbon coloring may be selected from among the following: Monochrome, By Secondary Structure, By Strand or By Residue. Ribbon style may be selected from among the following: Ribbons, Extended Ribbons, Beads, or Lines.
The Configure dialog is removed from the screen with all selections maintained by clicking on OK. Clicking on Cancel or on removes the dialog but selections are lost. Clicking on Apply maintains the selections but leaves the Configure dialog on screen. Note, that Labels (from the Model menu) will be turned on following either clicking on OK or on Apply.
Chapter 6 33
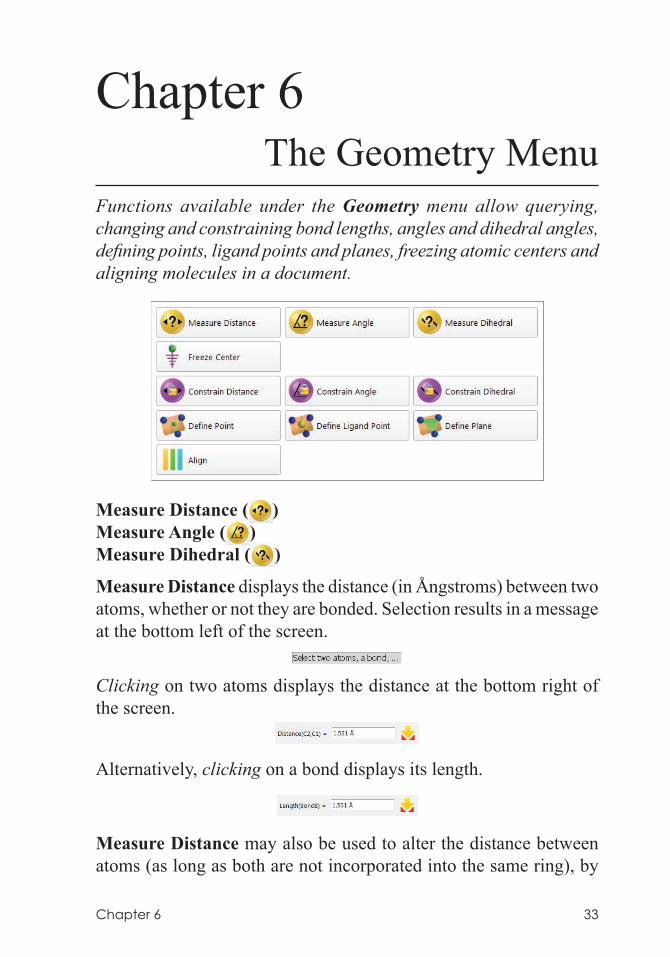
Chapter 6The Geometry Menu
Functions available under the Geometry menu allow querying, changing and constraining bond lengths, angles and dihedral angles, defining points, ligand points and planes, freezing atomic centers and aligning molecules in a document.
Measure Distance ( )Measure Angle ( ) Measure Dihedral ( )
Measure Distance displays the distance (in Ångstroms) between two atoms, whether or not they are bonded. Selection results in a message at the bottom left of the screen.
Clicking on two atoms displays the distance at the bottom right of the screen.
Alternatively, clicking on a bond displays its length.
Measure Distance may also be used to alter the distance between atoms (as long as both are not incorporated into the same ring), by
34 Chapter 6
altering the contents of the box to the right of Distance (A,B) = or Length (A)=, and then pressing the Enter key (return key on Mac). The distance (length) may be entered into the spreadsheet by clicking on to the right of its display (see Spreadsheet under the Display menu; Chapter 9). Alternatively, the label “Distance (A,B)=” or “Length (A)=” may be dragged into the spreadsheet.
Angle and dihedral angle queries are handled in a similar manner. Angles require that three atoms or two bonds be identified in the proper order while dihedral angles require that four atoms or three bonds be identified in the proper order.
Freeze Center ( )
This forces atoms to be held in place during minimization (in the 3D builder) or during equilibrium or transition-state geometry optimization, conformational searching, or energy profile generation using methods specified in the Calculations dialog (Calculations... from the Setup menu; Chapter 8).
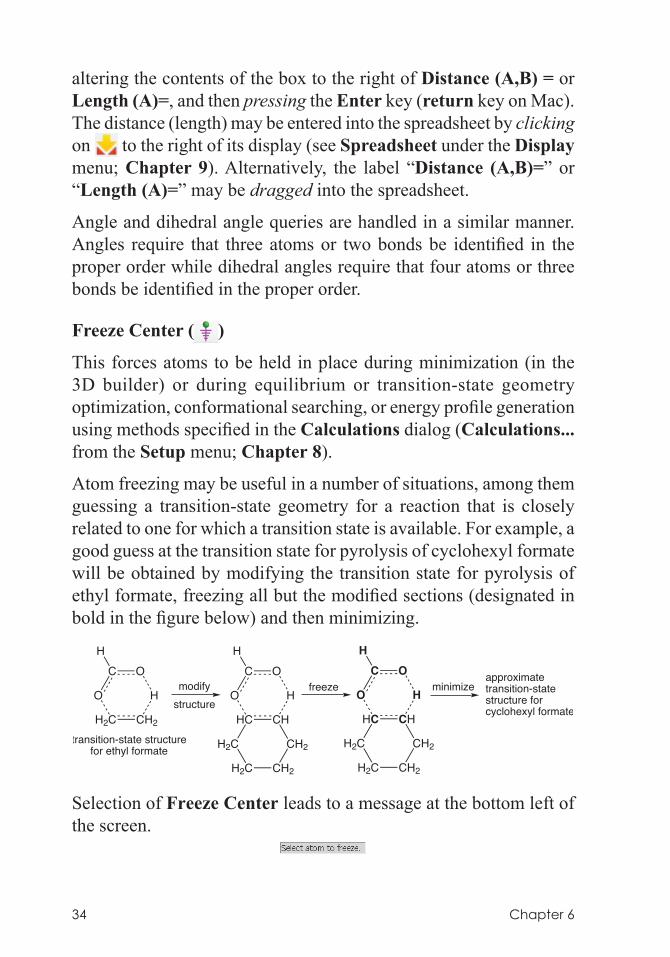
Atom freezing may be useful in a number of situations, among them guessing a transition-state geometry for a reaction that is closely related to one for which a transition state is available. For example, a good guess at the transition state for pyrolysis of cyclohexyl formate will be obtained by modifying the transition state for pyrolysis of ethyl formate, freezing all but the modified sections (designated in bold in the figure below) and then minimizing.
H2C CH2
H
OC
O
HC CH
H
OC
O
H2C
H2C CH2
CH2
HC CH
H
OC
O
H2C
H2C CH2
CH2
H H H
modifystructure
freeze minimize
transition-state structure for ethyl formate
approximate transition-statestructure for cyclohexyl formate
Selection of Freeze Center leads to a message at the bottom left of the screen.
Chapter 6 35
Clicking on an atom or free valence*, freezes it; clicking again thaws it. Buttons at the bottom right of the screen allow for freezing all atoms (Freeze All), freezing all heavy (non-hydrogen) atoms (Freeze Heavy) and for thawing all atoms (Thaw All).
Frozen atoms are indicated by magenta colored markers ( ). Whether or not these are included with the model (outside of freeze center mode) is controlled from the Molecule Preferences dialog under Preferences... in the Options menu (Chapter 10).
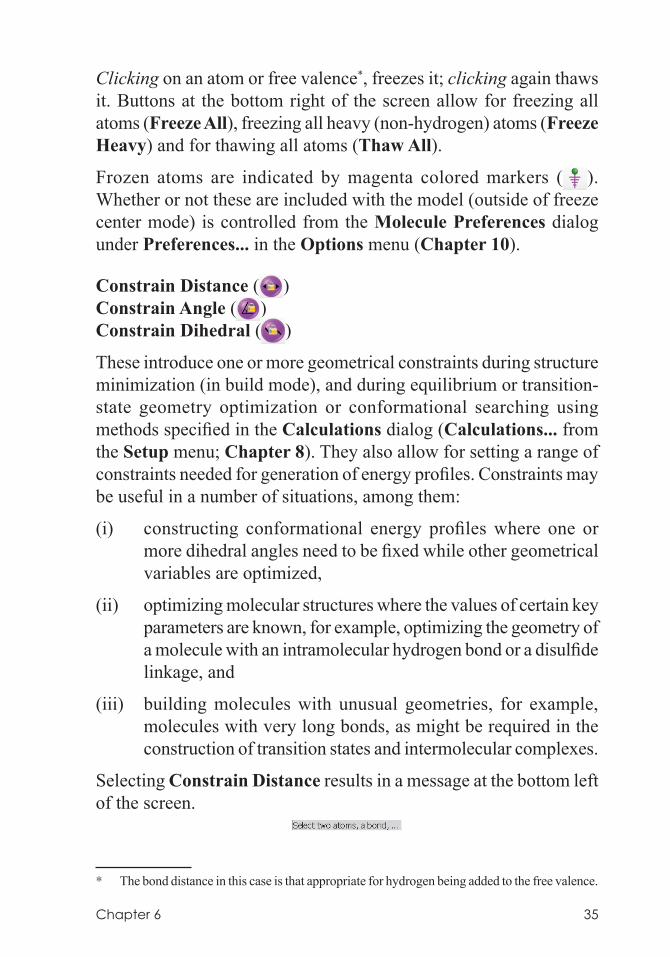
Constrain Distance ( )Constrain Angle ( )Constrain Dihedral ( )
These introduce one or more geometrical constraints during structure minimization (in build mode), and during equilibrium or transition-state geometry optimization or conformational searching using methods specified in the Calculations dialog (Calculations... from the Setup menu; Chapter 8). They also allow for setting a range of constraints needed for generation of energy profiles. Constraints may be useful in a number of situations, among them:
(i) constructing conformational energy profiles where one or more dihedral angles need to be fixed while other geometrical variables are optimized,
(ii) optimizing molecular structures where the values of certain key parameters are known, for example, optimizing the geometry of a molecule with an intramolecular hydrogen bond or a disulfide linkage, and
(iii) building molecules with unusual geometries, for example, molecules with very long bonds, as might be required in the construction of transition states and intermolecular complexes.
Selecting Constrain Distance results in a message at the bottom left of the screen.
* The bond distance in this case is that appropriate for hydrogen being added to the free valence.
36 Chapter 6
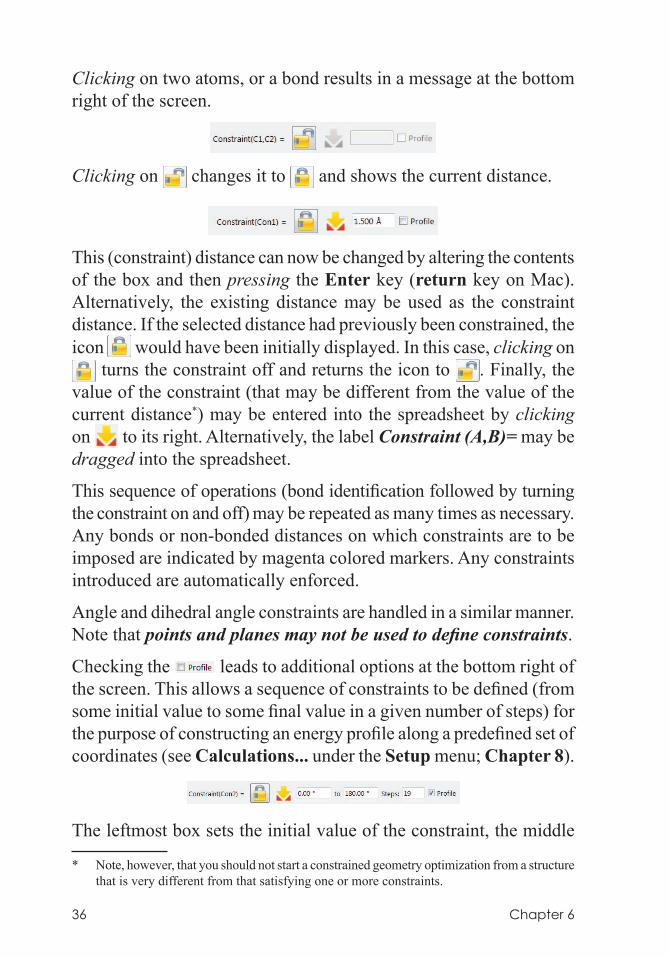
Clicking on two atoms, or a bond results in a message at the bottom right of the screen.
Clicking on changes it to and shows the current distance.
This (constraint) distance can now be changed by altering the contents of the box and then pressing the Enter key (return key on Mac). Alternatively, the existing distance may be used as the constraint distance. If the selected distance had previously been constrained, the icon would have been initially displayed. In this case, clicking on
turns the constraint off and returns the icon to . Finally, the value of the constraint (that may be different from the value of the current distance*) may be entered into the spreadsheet by clicking on to its right. Alternatively, the label Constraint (A,B)= may be dragged into the spreadsheet.
This sequence of operations (bond identification followed by turning the constraint on and off) may be repeated as many times as necessary. Any bonds or non-bonded distances on which constraints are to be imposed are indicated by magenta colored markers. Any constraints introduced are automatically enforced.
Angle and dihedral angle constraints are handled in a similar manner. Note that points and planes may not be used to define constraints.
Checking the leads to additional options at the bottom right of the screen. This allows a sequence of constraints to be defined (from some initial value to some final value in a given number of steps) for the purpose of constructing an energy profile along a predefined set of coordinates (see Calculations... under the Setup menu; Chapter 8).
The leftmost box sets the initial value of the constraint, the middle
* Note, however, that you should not start a constrained geometry optimization from a structure that is very different from that satisfying one or more constraints.
Chapter 6 37
box to the right of to sets the final value, and the rightmost box to the right of Steps: sets the number of steps. For example, were the initial value set to 0°, the final value to 180° and the number of steps to 10, then a series of ten constraints (0°, 20°, 40°, ... 180°) would be specified. This can also be accomplished using the Constraint Properties dialog, (see Properties under the Display menu; Chapter 9) and the value of the constraint posted to the spreadsheet.
Whether or not constraint markers are included as part of the model (outside of constrain distance, constrain angle or constrain dihedral mode) is controlled from the Molecule Preferences dialog (Preferences... under the Options menu; Chapter 10).
Define Point ( )
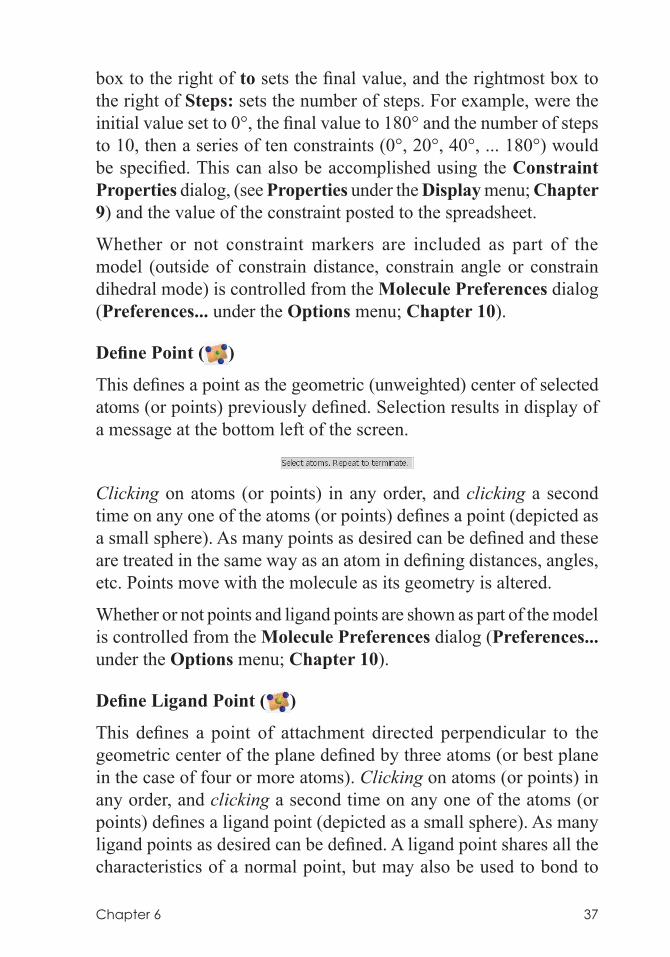
This defines a point as the geometric (unweighted) center of selected atoms (or points) previously defined. Selection results in display of a message at the bottom left of the screen.
Clicking on atoms (or points) in any order, and clicking a second time on any one of the atoms (or points) defines a point (depicted as a small sphere). As many points as desired can be defined and these are treated in the same way as an atom in defining distances, angles, etc. Points move with the molecule as its geometry is altered.
Whether or not points and ligand points are shown as part of the model is controlled from the Molecule Preferences dialog (Preferences... under the Options menu; Chapter 10).
Define Ligand Point ( )
This defines a point of attachment directed perpendicular to the geometric center of the plane defined by three atoms (or best plane in the case of four or more atoms). Clicking on atoms (or points) in any order, and clicking a second time on any one of the atoms (or points) defines a ligand point (depicted as a small sphere). As many ligand points as desired can be defined. A ligand point shares all the characteristics of a normal point, but may also be used to bond to
38 Chapter 6
atomic fragments, functional groups, etc. See Make Bond under the Build menu (Chapter 7) for a discussion. Ligand points move with the molecule as geometry is altered.
Delete from the Build menu ( ) or the Delete key may be used to remove a point or ligand point.
Whether or not points and ligand points are shown as part of the model is controlled from the Molecule Preferences dialog (Preferences... under the Options menu; Chapter 10).
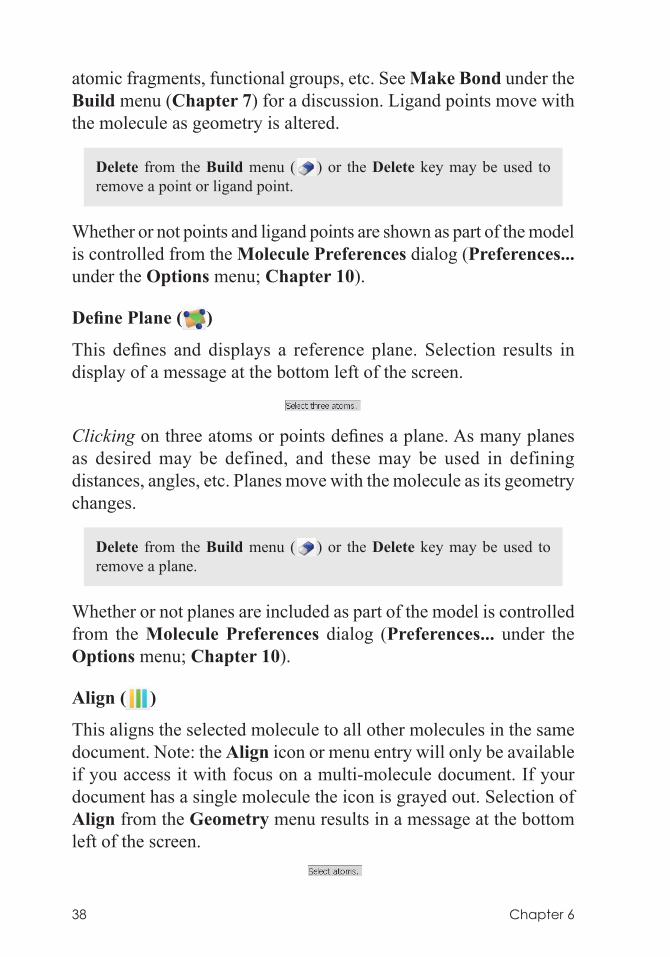
Define Plane ( )
This defines and displays a reference plane. Selection results in display of a message at the bottom left of the screen.
Clicking on three atoms or points defines a plane. As many planes as desired may be defined, and these may be used in defining distances, angles, etc. Planes move with the molecule as its geometry changes.
Delete from the Build menu ( ) or the Delete key may be used to remove a plane.
Whether or not planes are included as part of the model is controlled from the Molecule Preferences dialog (Preferences... under the Options menu; Chapter 10).
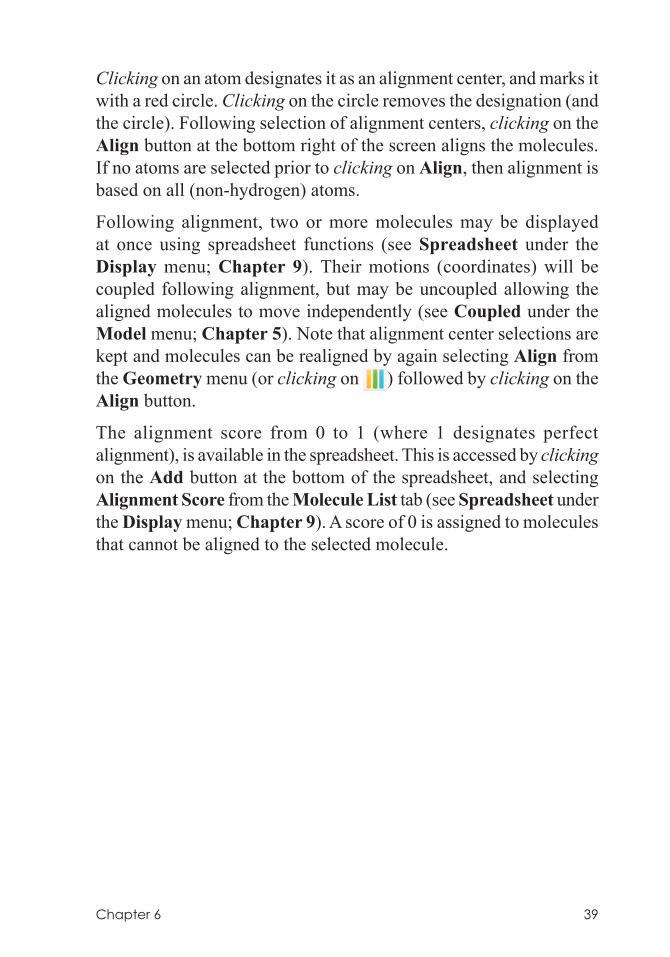
Align ( )
This aligns the selected molecule to all other molecules in the same document. Note: the Align icon or menu entry will only be available if you access it with focus on a multi-molecule document. If your document has a single molecule the icon is grayed out. Selection of Align from the Geometry menu results in a message at the bottom left of the screen.
Chapter 6 39
Clicking on an atom designates it as an alignment center, and marks it with a red circle. Clicking on the circle removes the designation (and the circle). Following selection of alignment centers, clicking on the Align button at the bottom right of the screen aligns the molecules. If no atoms are selected prior to clicking on Align, then alignment is based on all (non-hydrogen) atoms.
Following alignment, two or more molecules may be displayed at once using spreadsheet functions (see Spreadsheet under the Display menu; Chapter 9). Their motions (coordinates) will be coupled following alignment, but may be uncoupled allowing the aligned molecules to move independently (see Coupled under the Model menu; Chapter 5). Note that alignment center selections are kept and molecules can be realigned by again selecting Align from the Geometry menu (or clicking on ) followed by clicking on the Align button.
The alignment score from 0 to 1 (where 1 designates perfect alignment), is available in the spreadsheet. This is accessed by clicking on the Add button at the bottom of the spreadsheet, and selecting Alignment Score from the Molecule List tab (see Spreadsheet under the Display menu; Chapter 9). A score of 0 is assigned to molecules that cannot be aligned to the selected molecule.
40 Chapter 7
Chapter 7The Build Menu
The Build menu provides a sketch palette for drawing molecules in 2D, model kits and associated tools for building and editing organic, inorganic and organometallic molecules as well as polypeptides and polynucleotides in 3D, 2D to 3D conversion and 3D structure refinement using molecular mechanics.
Spartan Student provides a variety of tools for specification of 3D molecular structure, a necessary first step to any molecular mechanics or quantum chemical calculation. Molecules can either be rendered as 2D sketches and later brought into 3D*, or directly constructed from 3D fragments. Polypeptides and polynucleotides need to be built in 3D.
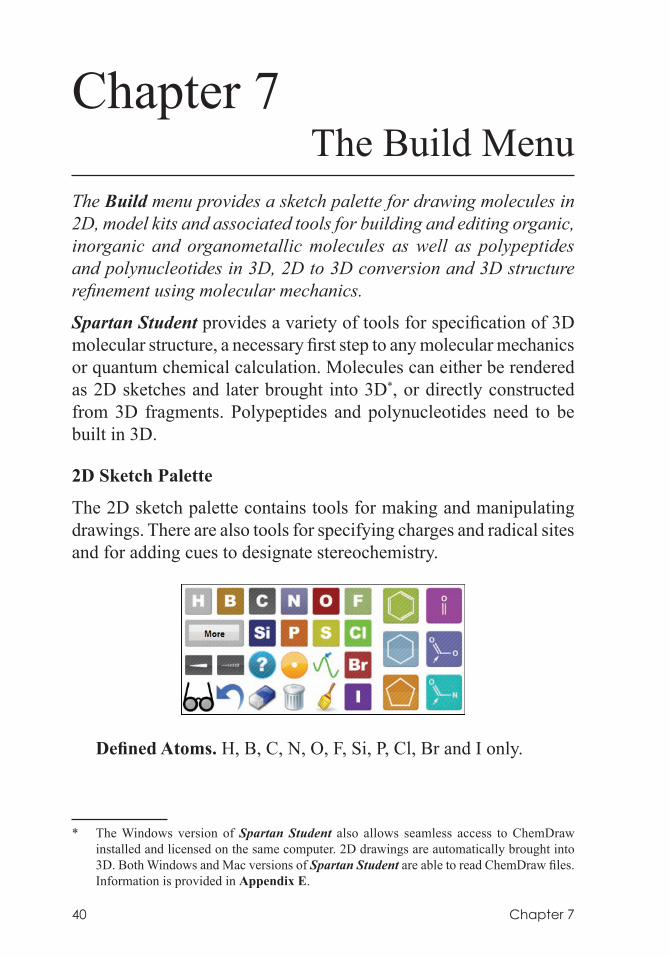
2D Sketch Palette
The 2D sketch palette contains tools for making and manipulating drawings. There are also tools for specifying charges and radical sites and for adding cues to designate stereochemistry.
Defined Atoms. H, B, C, N, O, F, Si, P, Cl, Br and I only.
* The Windows version of Spartan Student also allows seamless access to ChemDraw installed and licensed on the same computer. 2D drawings are automatically brought into 3D. Both Windows and Mac versions of Spartan Student are able to read ChemDraw files. Information is provided in Appendix E.
Chapter 7 41
Periodic Table, Groups, Ligands. A “More” icon which appears below the H and B icons allows any atom as well as a variety of common functional groups and a selection of common ligands to be specified.
Common Rings. Three icons facilitate the rapid addition of benzene ( ), cyclohexane ( ) and cyclopropane ( ), cyclobutane ( ), cyclopentane ( ) and cycloheptane ( ).
Common Carbonyl Groups. Three icons facilitate the rapid addition of carbonyl ( ), carboxylic acid/ester ( ) and amide ( ) groups to drawings.
Stereochemical Markers. Wedges and dashes, represented by and , can be used to designate in-out stereochemistry. Once a stereochemical marker has been added to a drawing, it is possible to designate the orientation of hydrogen atoms and/or substituents bonded to six-member rings as ax(ial) or eq(uatorial) (ax and eq labels appear only on the drawing, not in the palette).
Charge/Radical Markers. Conventional bonding rules (neutral C makes 4 bonds, neutral N makes 3 bonds, and so on) are enforced when 2D perspective drawings are converted into 3D models. This is accomplished by adding hydrogen atoms to the drawing. For example, a single carbon on screen will give methane, a single line, ethane, and a double line, ethylene. (Hydrogen atoms are added to nitrogen, oxygen, phosphorous and sulfur in the 2D drawings.) When another outcome is desired, for example, for an ion or free radical, charge or radical markers must be added to the drawing.
Two icons, and , are used to label atoms that bear formal charges. is used to label atoms that are neutral, open-shell radicals. Each of these markers affects the number of electrons and the number of hydrogen atoms added to the 3D model. For example, O will produce a 3D model of water, H2O. However, adding the appropriate marker will result in 3D models of H3O+ ( ), HO– ( ), or HO radical ( ), respectively. Only one charge/radical marker can be assigned to an atom.
42 Chapter 7
Only one charge/radical marker is displayed on the palette, but clicking on the icon will cause each marker to appear in turn.
Reaction Arrows. designates one ore more curved arrows allowing access to Spartan’s automated search transition state procedure. The tail of the arrow corresponds to the source of the electron pair. If the source is a lone pair, then select the atom that holds the lone pair. If the source is a bond, then select the bond. Clicking on an atom or bond highlights (colors gold) the atom or bond. Clicking again on the same atom (or same bond) removes the highlighting. The head of the arrow corresponds to the destination of the electron pair. If the destination is an atom (leading to a lone pair), then select the atom that will hold the lone pair by clicking on it two times. If the destination is an existing bond (leading to an increase in bond order from single → double or double → triple), then select (click on) the bond. If no bond presently exists, select (click on) the two atoms that will become bonded upon reaction. These operations result in a curved arrow being drawn on the reactant structure. This extends from an atom, or the center of a bond to an atom, or the center of a bond, or the center of a dotted line that has been drawn between atoms that are to be bonded.
Note that the head and tail do not need to reside on atoms or bonds on the same fragment. Also the tail may involve atoms of two detached fragments.
The process (tail selection followed by head selection) is repeated as necessary to fully define the reaction. Incorrect reaction arrows may be removed by clicking on from the palette and clicking on the arrow. You then need to select to continue arrow specification.
Once defined, reaction queries can be used to provide a guess at a transition state based on its similarity to an entry in an internal database* of transition states for a variety of common reactions.
Drawing Tools. Undoes the most recent drawing operation. Removes or modifies parts of a drawing. Deletes an entire
* This collection presently consists of more than 2000 named reactions.
Chapter 7 43
drawing (a warning is provided). Improve the readability of a drawing by applying various “clean up” procedures.
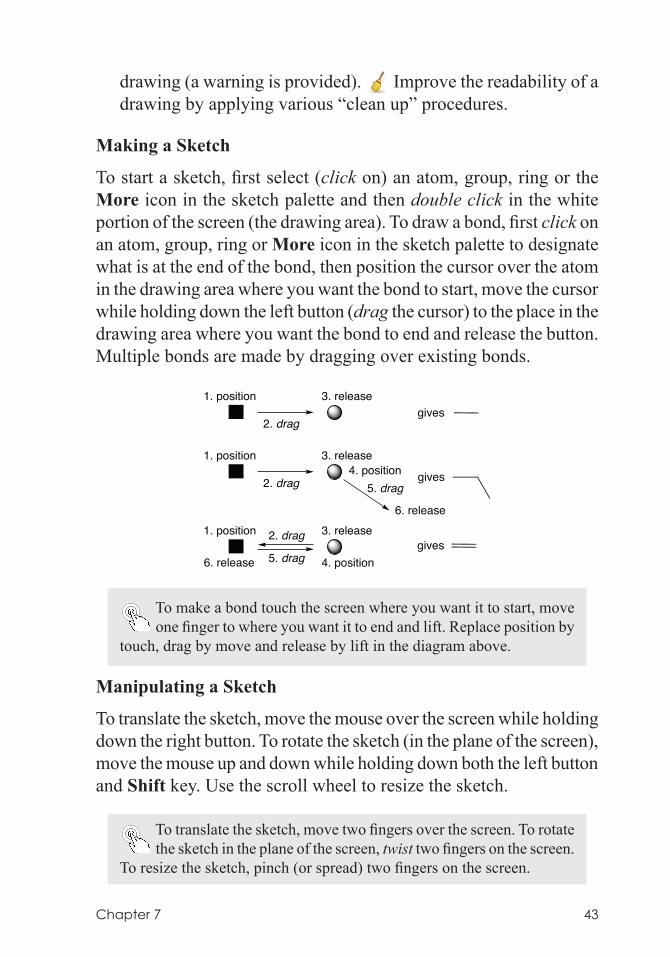
Making a Sketch
To start a sketch, first select (click on) an atom, group, ring or the More icon in the sketch palette and then double click in the white portion of the screen (the drawing area). To draw a bond, first click on an atom, group, ring or More icon in the sketch palette to designate what is at the end of the bond, then position the cursor over the atom in the drawing area where you want the bond to start, move the cursor while holding down the left button (drag the cursor) to the place in the drawing area where you want the bond to end and release the button. Multiple bonds are made by dragging over existing bonds.
1. position
2. drag
3. releasegives
1. position
2. drag
3. release
gives4. position5. drag
6. release1. position 2. drag 3. release
gives5. drag 4. position6. release
To make a bond touch the screen where you want it to start, move one finger to where you want it to end and lift. Replace position by
touch, drag by move and release by lift in the diagram above.
Manipulating a Sketch
To translate the sketch, move the mouse over the screen while holding down the right button. To rotate the sketch (in the plane of the screen), move the mouse up and down while holding down both the left button and Shift key. Use the scroll wheel to resize the sketch.
To translate the sketch, move two fingers over the screen. To rotate the sketch in the plane of the screen, twist two fingers on the screen.
To resize the sketch, pinch (or spread) two fingers on the screen.
44 Chapter 7
Sketch Operations
Add an Atom, Ring, or Carbonyl Group. To add an atom, click on that atom’s icon. Position the cursor over the atom in the drawing that will connect to the new atom, drag it away and release the button. To add a common ring or carbonyl group, click on that ring’s (group’s) icon, position the cursor over the atom in the drawing that will connect to the new ring (group) and drag it away and release the button. The carboxylic acid/ester and amide icons contain an arrow that shows which atom in these groups will be connected to the existing drawing. To change the location of this connection point (arrow), click on the group’s icon until the arrow reaches the desired location.
Add Multiple Bonds. To add a multiple bond, first draw a single bond at the location where the multiple bond is needed, then redraw this line once to make a double bond, and redraw it again to make a triple bond (in other words, position the cursor over one end of the bond, drag to the other end, and release the button).
Fuse Rings. Click on an icon for the first ring and double click on the screen. Next, click on the icon for the second ring and double tap the bond that the rings will share. This will create a drawing with a fused bicyclic ring system. Note that the (cis or trans) stereochemistry of the ring juncture is ill-defined. This will be addressed later (Add Stereochemical Markers).
This technique can also be used to add rings to an existing bond in any drawing. Click on the icon for the ring to be added and double click on the bond that will become part of the ring.
Replace an Atom with Another. If a drawing contains atom A where atom B is needed, click on the icon for B, then double click on A in the drawing. This allows the drawing of heterocycles. First, draw an all-carbon ring and then replace specific carbons with heteroatoms.
Access an Element, Functional Group, or Ligand. Click on the icon underneath H and B (this icon will initially be labeled with the name of the group that was previously selected (or with
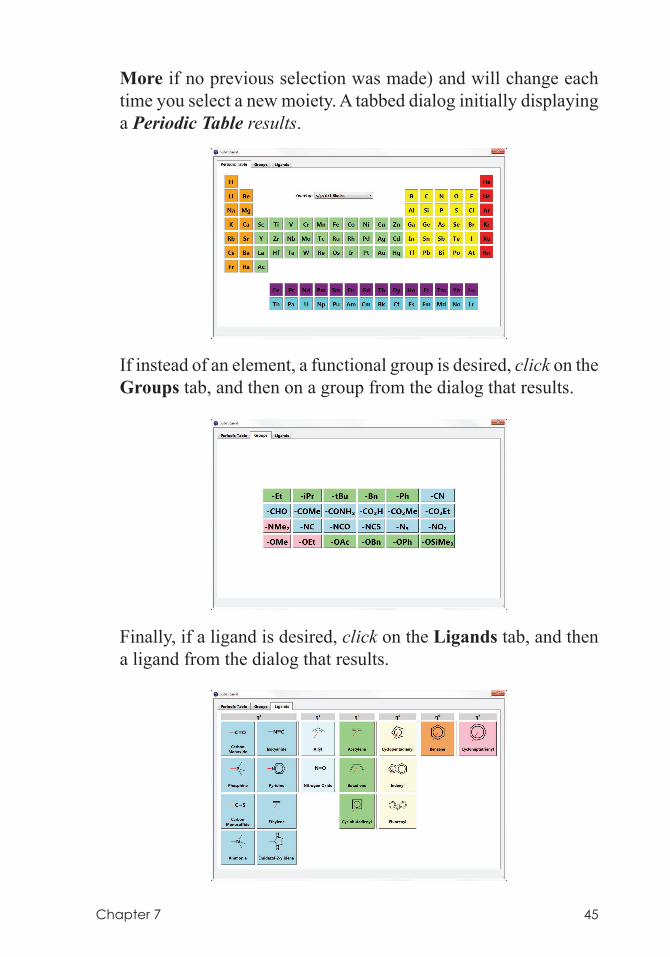
Chapter 7 45
More if no previous selection was made) and will change each time you select a new moiety. A tabbed dialog initially displaying a Periodic Table results.
If instead of an element, a functional group is desired, click on the Groups tab, and then on a group from the dialog that results.
Finally, if a ligand is desired, click on the Ligands tab, and then a ligand from the dialog that results.
46 Chapter 7
An element, group or ligand defined in this way can be added to a drawing, replaced, or removed using the same drawing techniques used for standard atoms.
Add a Stereochemical Marker (Dash or Wedge). 3D information can be added to a drawing by replacing single bonds with stereochemical markers: dashes or wedges. The single bond must be drawn before a marker can be added.
To replace a single bond with a marker, click either or , then re-draw the single bond. To reverse the orientation of the marker, re-draw the bond or marker in the opposite direction. One type of marker can be replaced directly by the other. Click on the desired marker and then re-draw the existing marker. Markers can also be converted back into single bonds. Click on , then double click on the marker.
For best results during 2D-to-3D conversion, all substituent bonds to rings should be drawn with stereochemical markers.
Add an Axial or Equatorial Marker (6-member rings only). The orientation of a hydrogen/substituent on a 6-member ring can be specified by marking one ring substituent as either ax(ial) or eq(uatorial). If the molecule contains multiple rings, the conformation of each ring can be specified by marking one substituent per ring. Axial or equatorial markers can only be added to stereochemical markers (dashes, wedge) so the bond connecting the substituent to the ring must be drawn with a stereochemical marker first.
To add an axial or equatorial marker to a stereochemical marker, click on either or , then double click on the stereochemical marker. ax will appear on top of the stereochemical marker. To replace ax with eq, double click on the stereochemical marker again. To remove the marker, double click on the marker again.
Although it is possible to produce a drawing in which several bonds are marked as axial or equatorial, only one marker is used when converting a 2D ring drawing into a 3D model.
Chapter 7 47
Assign Charges and Radical Sites. Formal charges and unpaired electrons can be assigned to individual atoms using charge/unpaired electron markers. To assign a positive formal charge to an atom, click on and double click on the atom in the drawing. To assign a negative formal charge or unpaired electron, click on the charge/unpaired electron marker until the desired icon appears (tapping the marker rotates it through three possibilities: , , and ) and double tap the atom in the drawing.
To replace a charge/unpaired electron marker on an atom with a different marker, click on the desired charge/unpaired electron icon and double click the marked atom. To remove a marker, click on
and double click on the marker.
Charge/unpaired electron markers play an important role during the conversion of 2D drawings into 3D models in that they determine the number of hydrogens that need to be added to the model (it is usually unnecessary to draw hydrogens unless they are needed to mark stereochemistry).
Hydrogens are not shown in 2D perspective drawings unless they have been drawn explicitly (exceptions: hydrogens attached to neutral N, O, P, and S are shown). When a drawing is converted into a 3D model, hydrogens are added to the model according to conventional bonding rules. A neutral carbon atom is assumed to form four bonds, nitrogen three bonds, oxygen two bonds, and so on. Analogous logic is used for atoms that carry a formal charge or unpaired electron marker.
Charge and unpaired electron markers are carried over into specification of quantum chemical calculations (Calculations... from the Setup menu; Chapter 8). The total charge is set equal to the sum of the formal charges in the 2D drawing. A model with one unpaired electron is treated as a free radical (drawings that contain more than one unpaired electron may give unanticipated results).
Undo the Last Action. Click on to return to the drawing as it existed before the last action.
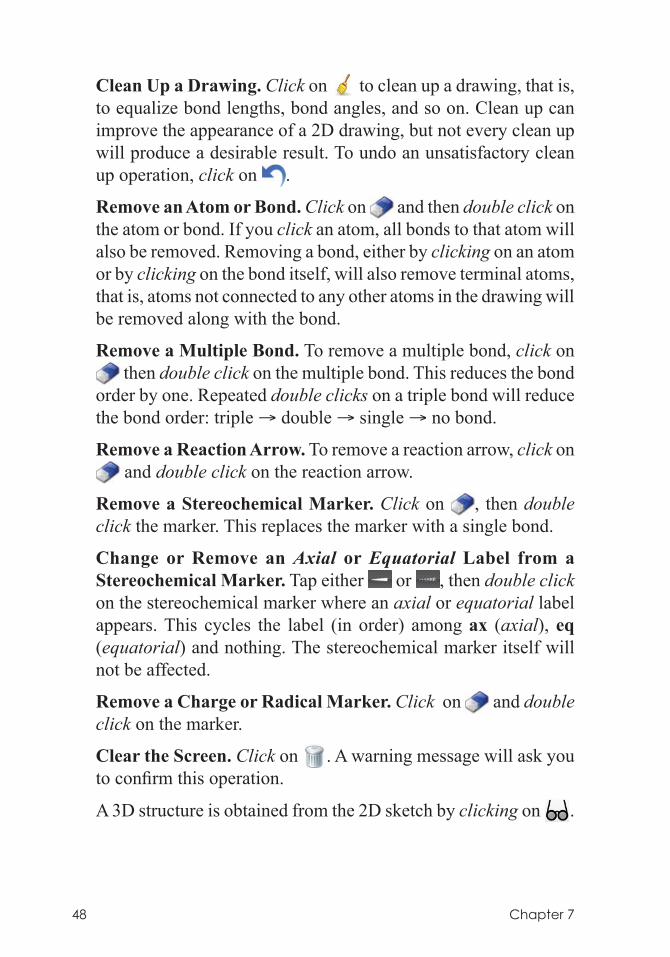
48 Chapter 7
Clean Up a Drawing. Click on to clean up a drawing, that is, to equalize bond lengths, bond angles, and so on. Clean up can improve the appearance of a 2D drawing, but not every clean up will produce a desirable result. To undo an unsatisfactory clean up operation, click on .
Remove an Atom or Bond. Click on and then double click on the atom or bond. If you click an atom, all bonds to that atom will also be removed. Removing a bond, either by clicking on an atom or by clicking on the bond itself, will also remove terminal atoms, that is, atoms not connected to any other atoms in the drawing will be removed along with the bond.
Remove a Multiple Bond. To remove a multiple bond, click on then double click on the multiple bond. This reduces the bond
order by one. Repeated double clicks on a triple bond will reduce the bond order: triple → double → single → no bond.
Remove a Reaction Arrow. To remove a reaction arrow, click on and double click on the reaction arrow.
Remove a Stereochemical Marker. Click on , then double click the marker. This replaces the marker with a single bond.
Change or Remove an Axial or Equatorial Label from a Stereochemical Marker. Tap either or , then double click on the stereochemical marker where an axial or equatorial label appears. This cycles the label (in order) among ax (axial), eq (equatorial) and nothing. The stereochemical marker itself will not be affected.
Remove a Charge or Radical Marker. Click on and double click on the marker.
Clear the Screen. Click on . A warning message will ask you to confirm this operation.
A 3D structure is obtained from the 2D sketch by clicking on .
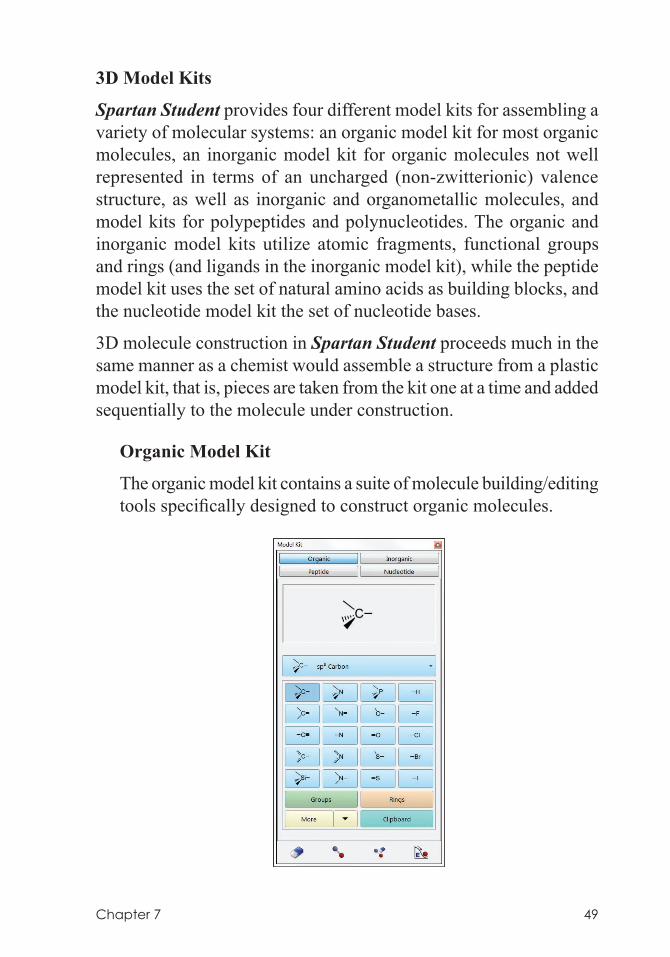
Chapter 7 49
3D Model Kits
Spartan Student provides four different model kits for assembling a variety of molecular systems: an organic model kit for most organic molecules, an inorganic model kit for organic molecules not well represented in terms of an uncharged (non-zwitterionic) valence structure, as well as inorganic and organometallic molecules, and model kits for polypeptides and polynucleotides. The organic and inorganic model kits utilize atomic fragments, functional groups and rings (and ligands in the inorganic model kit), while the peptide model kit uses the set of natural amino acids as building blocks, and the nucleotide model kit the set of nucleotide bases.
3D molecule construction in Spartan Student proceeds much in the same manner as a chemist would assemble a structure from a plastic model kit, that is, pieces are taken from the kit one at a time and added sequentially to the molecule under construction.
Organic Model Kit
The organic model kit contains a suite of molecule building/editing tools specifically designed to construct organic molecules.
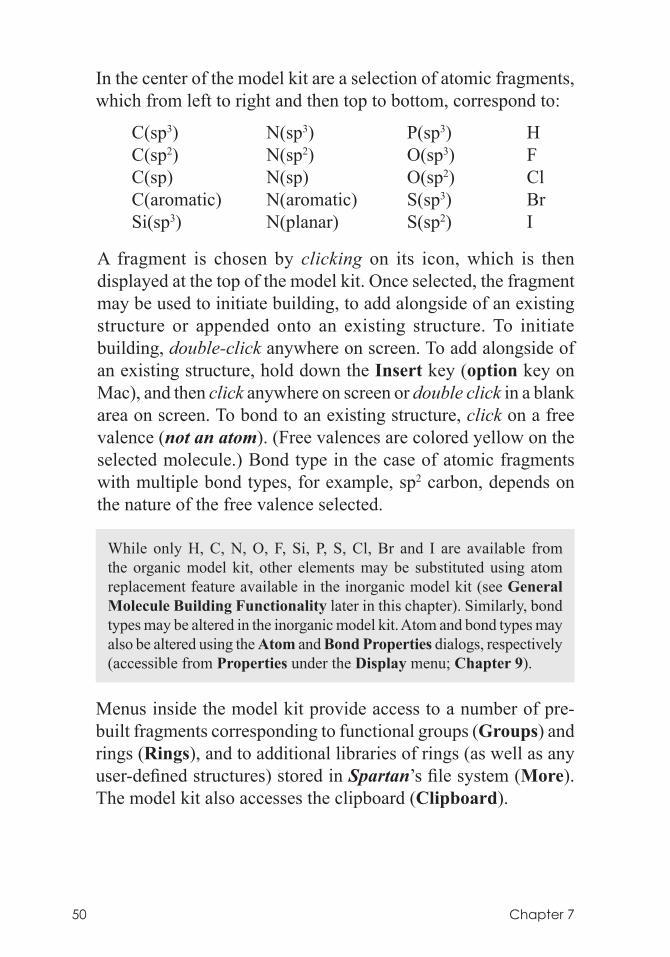
50 Chapter 7
In the center of the model kit are a selection of atomic fragments, which from left to right and then top to bottom, correspond to:
C(sp3) N(sp3) P(sp3) H C(sp2) N(sp2) O(sp3) F C(sp) N(sp) O(sp2) Cl C(aromatic) N(aromatic) S(sp3) Br Si(sp3) N(planar) S(sp2) I
A fragment is chosen by clicking on its icon, which is then displayed at the top of the model kit. Once selected, the fragment may be used to initiate building, to add alongside of an existing structure or appended onto an existing structure. To initiate building, double-click anywhere on screen. To add alongside of an existing structure, hold down the Insert key (option key on Mac), and then click anywhere on screen or double click in a blank area on screen. To bond to an existing structure, click on a free valence (not an atom). (Free valences are colored yellow on the selected molecule.) Bond type in the case of atomic fragments with multiple bond types, for example, sp2 carbon, depends on the nature of the free valence selected.
While only H, C, N, O, F, Si, P, S, Cl, Br and I are available from the organic model kit, other elements may be substituted using atom replacement feature available in the inorganic model kit (see General Molecule Building Functionality later in this chapter). Similarly, bond types may be altered in the inorganic model kit. Atom and bond types may also be altered using the Atom and Bond Properties dialogs, respectively (accessible from Properties under the Display menu; Chapter 9).
Menus inside the model kit provide access to a number of pre-built fragments corresponding to functional groups (Groups) and rings (Rings), and to additional libraries of rings (as well as any user-defined structures) stored in Spartan’s file system (More). The model kit also accesses the clipboard (Clipboard).
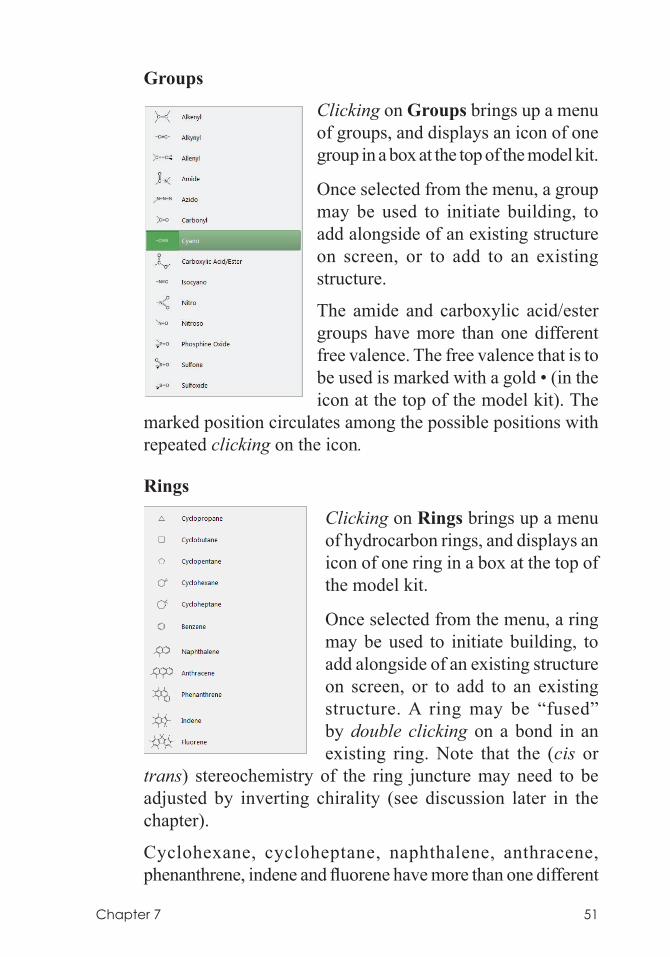
Chapter 7 51
Groups
Clicking on Groups brings up a menu of groups, and displays an icon of one group in a box at the top of the model kit.
Once selected from the menu, a group may be used to initiate building, to add alongside of an existing structure on screen, or to add to an existing structure.
The amide and carboxylic acid/ester groups have more than one different free valence. The free valence that is to be used is marked with a gold • (in the icon at the top of the model kit). The
marked position circulates among the possible positions with repeated clicking on the icon.
Rings
Clicking on Rings brings up a menu of hydrocarbon rings, and displays an icon of one ring in a box at the top of the model kit.
Once selected from the menu, a ring may be used to initiate building, to add alongside of an existing structure on screen, or to add to an existing structure. A ring may be “fused” by double clicking on a bond in an existing ring. Note that the (cis or
trans) stereochemistry of the ring juncture may need to be adjusted by inverting chirality (see discussion later in the chapter).
Cyclohexane, cycloheptane, naphthalene, anthracene, phenanthrene, indene and fluorene have more than one different
52 Chapter 7
free valence. The one that is to be used is marked with a gold • (in the icon). The marked position circulates among the available positions with repeated clicking on the icon. Selection of an axial or equatorial free valence in cyclohexane and cycloheptane is indicated by the label ax or eq appearing alongside the icon. All rings in this menu are hydrocarbons, but heteroatoms may be substituted (see General Molecule Building Functionality later in this chapter).
More
This provides access to a broader selection of rings as well as to access user-defined entities (rings, groups, ligands, etc.). Upon initial entry, the menu to the right of More will be empty. It can be populated, by clicking on to the far right. This brings up a file browser that has been set to point toward a Library directory containing documents of common rings.
nitrogen heterocycles saturated nitrogen rings oxygen heterocycles saturated oxygen rings sulfur heterocycles saturated sulfur rings mixed heterocycles saturated mixed rings
Clicking on a document followed by clicking on Open or double clicking on a document fills the menu to the right of More. Menu entries are selected in the usual way. In response, a ball-and-wire model of the selected ring will appear in a box at the top of the model kit. This may be manipulated (rotated, translated, zoomed) using the usual mouse/keyboard commands (you need to position the cursor inside the box) or with the usual one and two-finger touch commands. The ring may be used to initiate building, to add alongside of an existing structure, or to add to an existing structure. In the latter case, the attachment point (on the ring in the window) needs to be identified by clicking on the appropriate free valence.
Documents containing ligands, chelates and high-coordination fragments intended for use with the inorganic model kit (discussed in the next section) are also available. In addition,
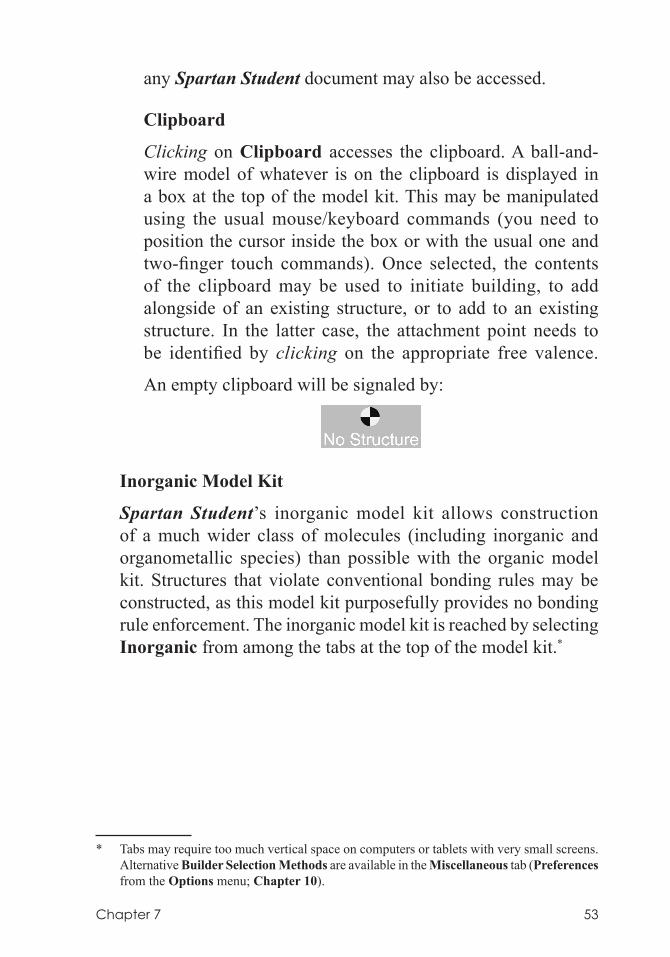
Chapter 7 53
any Spartan Student document may also be accessed.
Clipboard
Clicking on Clipboard accesses the clipboard. A ball-and-wire model of whatever is on the clipboard is displayed in a box at the top of the model kit. This may be manipulated using the usual mouse/keyboard commands (you need to position the cursor inside the box or with the usual one and two-finger touch commands). Once selected, the contents of the clipboard may be used to initiate building, to add alongside of an existing structure, or to add to an existing structure. In the latter case, the attachment point needs to be identified by clicking on the appropriate free valence.
An empty clipboard will be signaled by:
Inorganic Model Kit
Spartan Student’s inorganic model kit allows construction of a much wider class of molecules (including inorganic and organometallic species) than possible with the organic model kit. Structures that violate conventional bonding rules may be constructed, as this model kit purposefully provides no bonding rule enforcement. The inorganic model kit is reached by selecting Inorganic from among the tabs at the top of the model kit.*
* Tabs may require too much vertical space on computers or tablets with very small screens. Alternative Builder Selection Methods are available in the Miscellaneous tab (Preferences from the Options menu; Chapter 10).
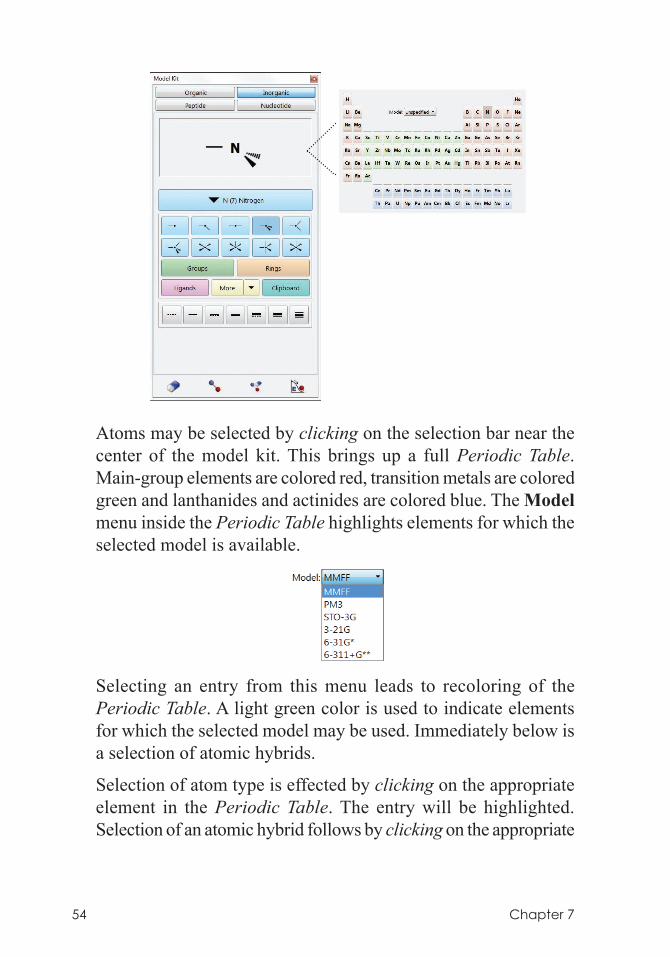
54 Chapter 7
Atoms may be selected by clicking on the selection bar near the center of the model kit. This brings up a full Periodic Table. Main-group elements are colored red, transition metals are colored green and lanthanides and actinides are colored blue. The Model menu inside the Periodic Table highlights elements for which the selected model is available.
Selecting an entry from this menu leads to recoloring of the Periodic Table. A light green color is used to indicate elements for which the selected model may be used. Immediately below is a selection of atomic hybrids.
Selection of atom type is effected by clicking on the appropriate element in the Periodic Table. The entry will be highlighted. Selection of an atomic hybrid follows by clicking on the appropriate
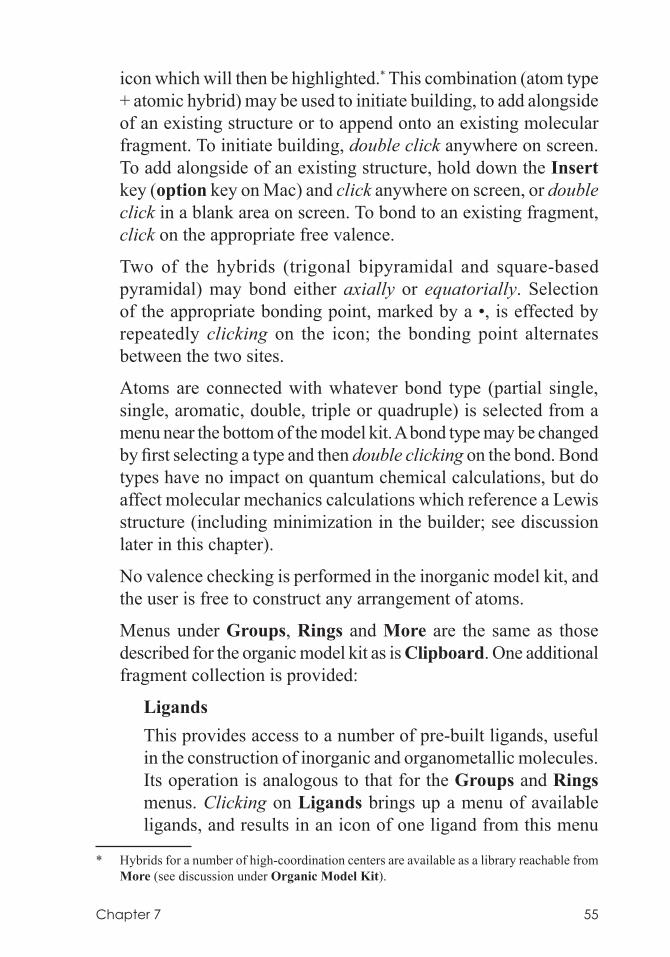
Chapter 7 55
icon which will then be highlighted.* This combination (atom type + atomic hybrid) may be used to initiate building, to add alongside of an existing structure or to append onto an existing molecular fragment. To initiate building, double click anywhere on screen. To add alongside of an existing structure, hold down the Insert key (option key on Mac) and click anywhere on screen, or double click in a blank area on screen. To bond to an existing fragment, click on the appropriate free valence.
Two of the hybrids (trigonal bipyramidal and square-based pyramidal) may bond either axially or equatorially. Selection of the appropriate bonding point, marked by a •, is effected by repeatedly clicking on the icon; the bonding point alternates between the two sites.
Atoms are connected with whatever bond type (partial single, single, aromatic, double, triple or quadruple) is selected from a menu near the bottom of the model kit. A bond type may be changed by first selecting a type and then double clicking on the bond. Bond types have no impact on quantum chemical calculations, but do affect molecular mechanics calculations which reference a Lewis structure (including minimization in the builder; see discussion later in this chapter).
No valence checking is performed in the inorganic model kit, and the user is free to construct any arrangement of atoms.
Menus under Groups, Rings and More are the same as those described for the organic model kit as is Clipboard. One additional fragment collection is provided:
Ligands This provides access to a number of pre-built ligands, useful
in the construction of inorganic and organometallic molecules. Its operation is analogous to that for the Groups and Rings menus. Clicking on Ligands brings up a menu of available ligands, and results in an icon of one ligand from this menu
* Hybrids for a number of high-coordination centers are available as a library reachable from More (see discussion under Organic Model Kit).
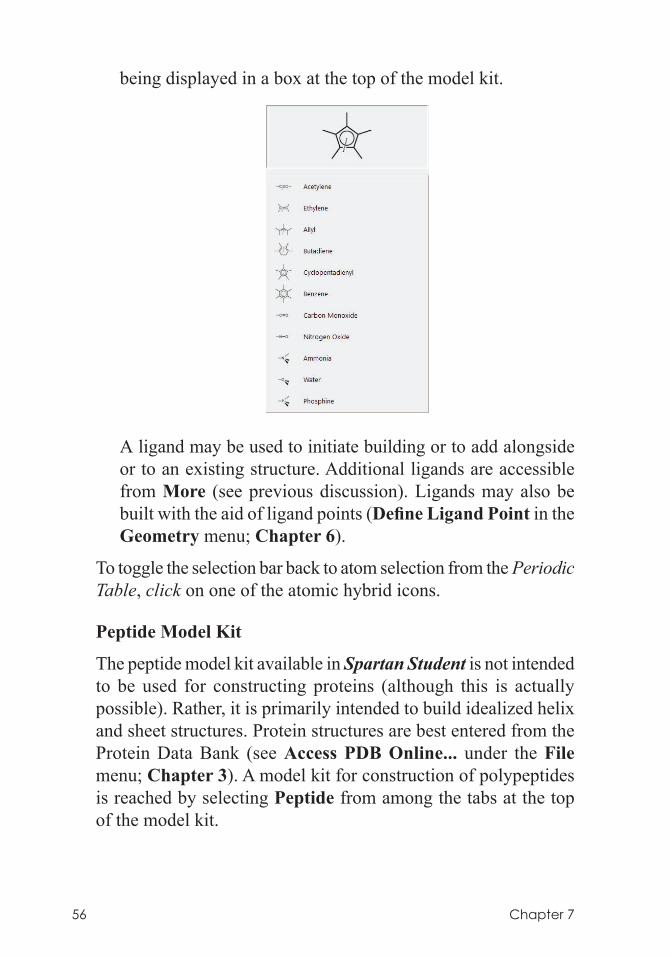
56 Chapter 7
being displayed in a box at the top of the model kit.
A ligand may be used to initiate building or to add alongside or to an existing structure. Additional ligands are accessible from More (see previous discussion). Ligands may also be built with the aid of ligand points (Define Ligand Point in the Geometry menu; Chapter 6).
To toggle the selection bar back to atom selection from the Periodic Table, click on one of the atomic hybrid icons.
Peptide Model Kit
The peptide model kit available in Spartan Student is not intended to be used for constructing proteins (although this is actually possible). Rather, it is primarily intended to build idealized helix and sheet structures. Protein structures are best entered from the Protein Data Bank (see Access PDB Online... under the File menu; Chapter 3). A model kit for construction of polypeptides is reached by selecting Peptide from among the tabs at the top of the model kit.
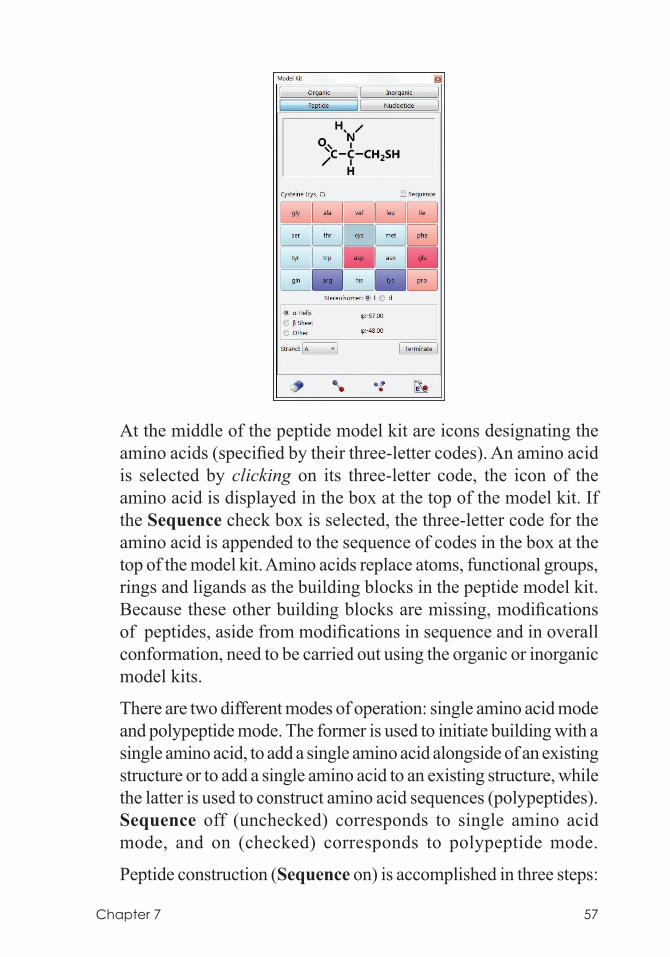
Chapter 7 57
At the middle of the peptide model kit are icons designating the amino acids (specified by their three-letter codes). An amino acid is selected by clicking on its three-letter code, the icon of the amino acid is displayed in the box at the top of the model kit. If the Sequence check box is selected, the three-letter code for the amino acid is appended to the sequence of codes in the box at the top of the model kit. Amino acids replace atoms, functional groups, rings and ligands as the building blocks in the peptide model kit. Because these other building blocks are missing, modifications of peptides, aside from modifications in sequence and in overall conformation, need to be carried out using the organic or inorganic model kits.
There are two different modes of operation: single amino acid mode and polypeptide mode. The former is used to initiate building with a single amino acid, to add a single amino acid alongside of an existing structure or to add a single amino acid to an existing structure, while the latter is used to construct amino acid sequences (polypeptides). Sequence off (unchecked) corresponds to single amino acid mode, and on (checked) corresponds to polypeptide mode.
Peptide construction (Sequence on) is accomplished in three steps:
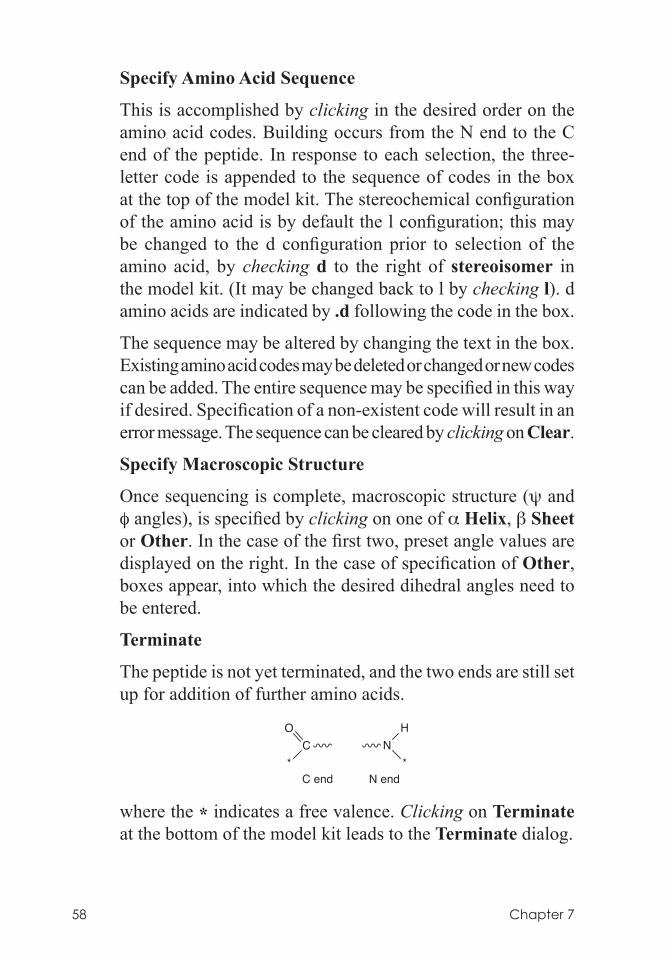
58 Chapter 7
Specify Amino Acid Sequence
This is accomplished by clicking in the desired order on the amino acid codes. Building occurs from the N end to the C end of the peptide. In response to each selection, the three-letter code is appended to the sequence of codes in the box at the top of the model kit. The stereochemical configuration of the amino acid is by default the l configuration; this may be changed to the d configuration prior to selection of the amino acid, by checking d to the right of stereoisomer in the model kit. (It may be changed back to l by checking l). d amino acids are indicated by .d following the code in the box.
The sequence may be altered by changing the text in the box. Existing amino acid codes may be deleted or changed or new codes can be added. The entire sequence may be specified in this way if desired. Specification of a non-existent code will result in an error message. The sequence can be cleared by clicking on Clear.
Specify Macroscopic Structure
Once sequencing is complete, macroscopic structure (ψ and φ angles), is specified by clicking on one of α Helix, β Sheet or Other. In the case of the first two, preset angle values are displayed on the right. In the case of specification of Other, boxes appear, into which the desired dihedral angles need to be entered.
Terminate
The peptide is not yet terminated, and the two ends are still set up for addition of further amino acids.
OC
*C end
NH
*N end
where the * indicates a free valence. Clicking on Terminate at the bottom of the model kit leads to the Terminate dialog.
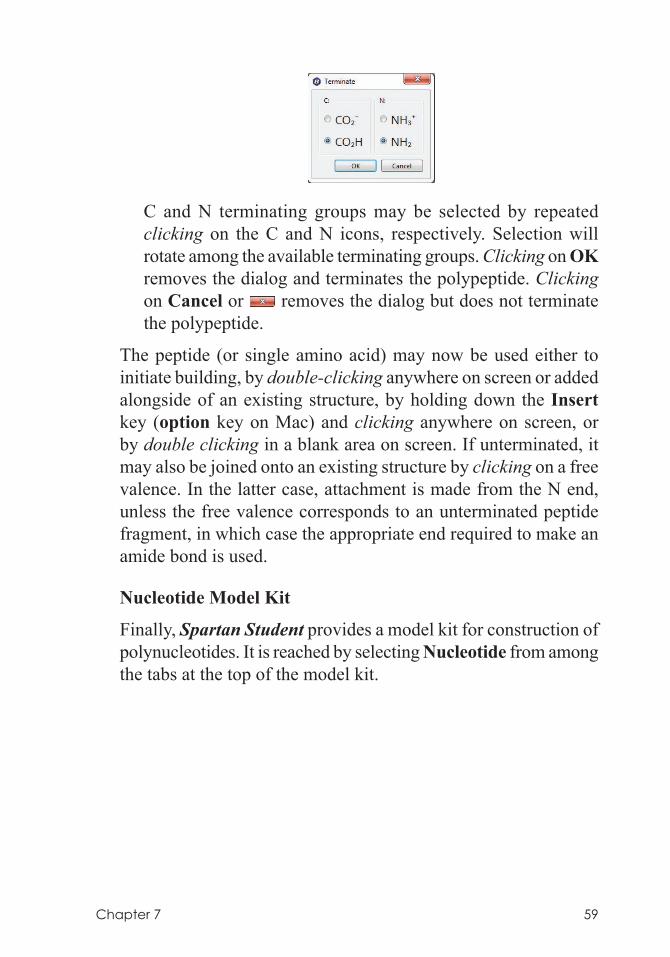
Chapter 7 59
C and N terminating groups may be selected by repeated
clicking on the C and N icons, respectively. Selection will rotate among the available terminating groups. Clicking on OK removes the dialog and terminates the polypeptide. Clicking on Cancel or removes the dialog but does not terminate the polypeptide.
The peptide (or single amino acid) may now be used either to initiate building, by double-clicking anywhere on screen or added alongside of an existing structure, by holding down the Insert key (option key on Mac) and clicking anywhere on screen, or by double clicking in a blank area on screen. If unterminated, it may also be joined onto an existing structure by clicking on a free valence. In the latter case, attachment is made from the N end, unless the free valence corresponds to an unterminated peptide fragment, in which case the appropriate end required to make an amide bond is used.
Nucleotide Model Kit
Finally, Spartan Student provides a model kit for construction of polynucleotides. It is reached by selecting Nucleotide from among the tabs at the top of the model kit.
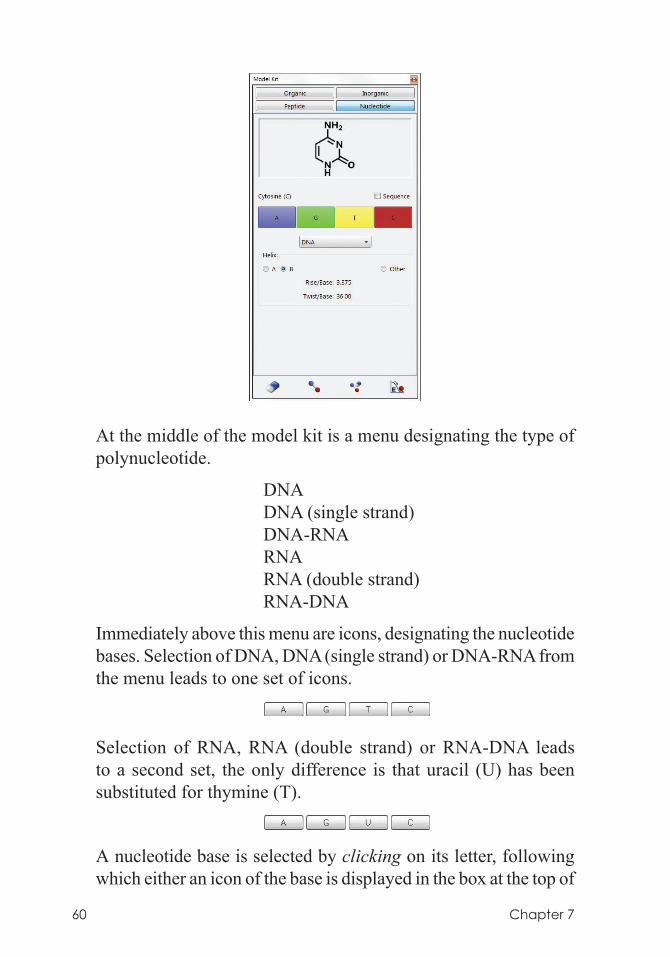
60 Chapter 7
At the middle of the model kit is a menu designating the type of polynucleotide.
DNA DNA (single strand) DNA-RNA RNA RNA (double strand) RNA-DNA
Immediately above this menu are icons, designating the nucleotide bases. Selection of DNA, DNA (single strand) or DNA-RNA from the menu leads to one set of icons.
Selection of RNA, RNA (double strand) or RNA-DNA leads to a second set, the only difference is that uracil (U) has been substituted for thymine (T).
A nucleotide base is selected by clicking on its letter, following which either an icon of the base is displayed in the box at the top of
Chapter 7 61
the model kit, or the letter for the base is appended to the sequence of letters in the box. Nucleotide bases replace atomic fragments, functional groups, rings and ligands as the building blocks in the nucleotide model kit. Because these other building blocks are missing, modifications of nucleotides, aside from modifications in sequence and helical structure, need to be carried out using either the organic or inorganic model kits.
There are two different modes of operation: single base mode and polynucleotide mode. The former is used to place a single base or base pair on screen, to add a single base or base pair alongside of an existing structure, or to add a single base or base pair to an existing structure, while the latter is used to construct strands of DNA or RNA (or mixed strands). Sequence off (unchecked) corresponds to single base (base pair) mode and on (checked) corresponds to polynucleotide mode.
Polynucleotide construction (Sequence on) is accomplished in two steps:
Specify Base Sequence
This is accomplished by clicking in order on the base codes. In response to each selection, the letter code is appended to the sequence of codes in the box at the top of the model kit. The sequence may be altered by editing the contents of the box. Existing base codes may be deleted or changed or new codes added. The entire sequence can be specified in this way if desired. The sequence may be cleared by clicking on Clear.
Specify Helical Structure
Once sequencing is complete, a helical structure may be specified by clicking on A or B. These correspond to A and B helices, respectively. Selecting Other allows user modification of the rise (in Å) per base (Rise/Base) and twist (in degrees) per base (Twist/Base).
Note that the polynucleotide is not yet terminated, and the two ends are still set up for addition of further bases or base pairs.
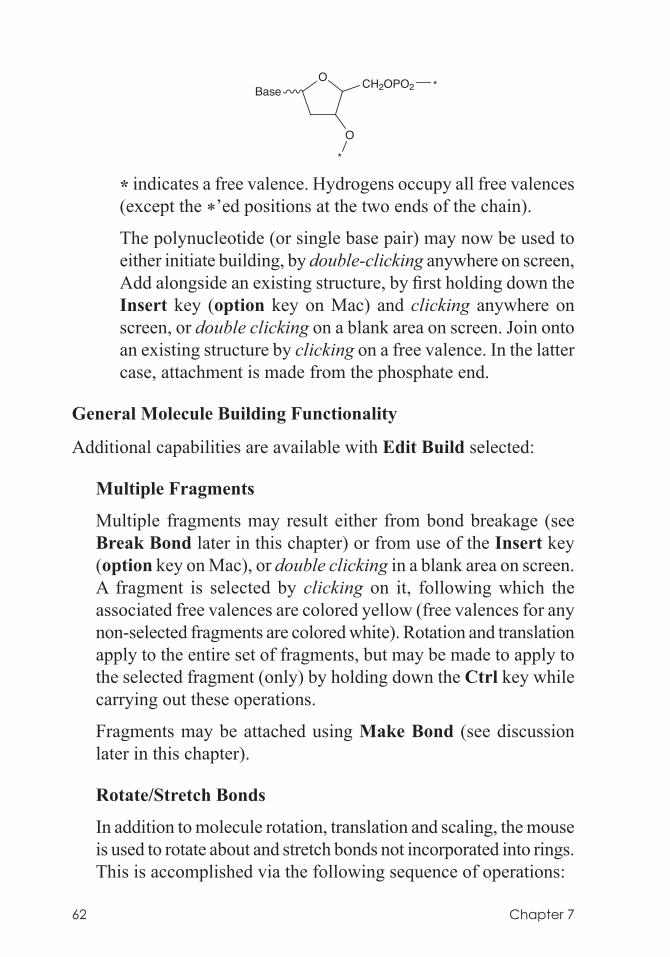
62 Chapter 7
O
O
CH2OPO2
*
Base *
* indicates a free valence. Hydrogens occupy all free valences (except the *’ed positions at the two ends of the chain).
The polynucleotide (or single base pair) may now be used to either initiate building, by double-clicking anywhere on screen, Add alongside an existing structure, by first holding down the Insert key (option key on Mac) and clicking anywhere on screen, or double clicking on a blank area on screen. Join onto an existing structure by clicking on a free valence. In the latter case, attachment is made from the phosphate end.
General Molecule Building Functionality
Additional capabilities are available with Edit Build selected:
Multiple Fragments
Multiple fragments may result either from bond breakage (see Break Bond later in this chapter) or from use of the Insert key (option key on Mac), or double clicking in a blank area on screen. A fragment is selected by clicking on it, following which the associated free valences are colored yellow (free valences for any non-selected fragments are colored white). Rotation and translation apply to the entire set of fragments, but may be made to apply to the selected fragment (only) by holding down the Ctrl key while carrying out these operations.
Fragments may be attached using Make Bond (see discussion later in this chapter).
Rotate/Stretch Bonds
In addition to molecule rotation, translation and scaling, the mouse is used to rotate about and stretch bonds not incorporated into rings. This is accomplished via the following sequence of operations:
Chapter 7 63
(i) Clicking on the bond, which is then marked by a red cylindrical arrow. (The bond connecting the last atom, group, ring or substituent added to the molecule is automatically selected.)
(ii) Simultaneously holding down the Alt key (option key on Mac) and the left mouse button while dragging the mouse up and down, for bond rotation, or the Alt (option) key and the right mouse button for bond stretching. Bond rotation (only) also follows from moving the cursor up and down inside the demarked area at the left of the screen while holding down the left button.
Replace Atom/Fragment
Another function of the mouse is atom replacement. This behaves differently in the organic and inorganic model kits. Double clicking on an atom (not a free valence) while an atomic fragment in the organic model is highlighted, replaces the atom by selected fragment. Free valences are adjusted to accommodate the replacement, for example, replacement of sp3 carbon by sp3 oxygen results in two free valences being removed. Atom replacements that violate valence rules or that would disrupt substituents are not permitted. Double clicking on an atom (not a free valence) while an element in the Periodic Table from the inorganic model kit is selected, replaces the atom by the selected element, that is, changes the atomic number. No changes in the number or arrangement of free valences is made, and no checking is done. Atom replacement is not applicable to the peptide or nucleotide model kits.
Invert Chirality
In the Edit Build mode, double clicking on a chiral atom with the Ctrl key (Command key on Mac) depressed inverts the chirality of the atom (R→S or S→R). Double clicking on any atom with both Ctrl (Command key on Mac) and Shift keys depressed inverts the absolute configuration of the molecule.
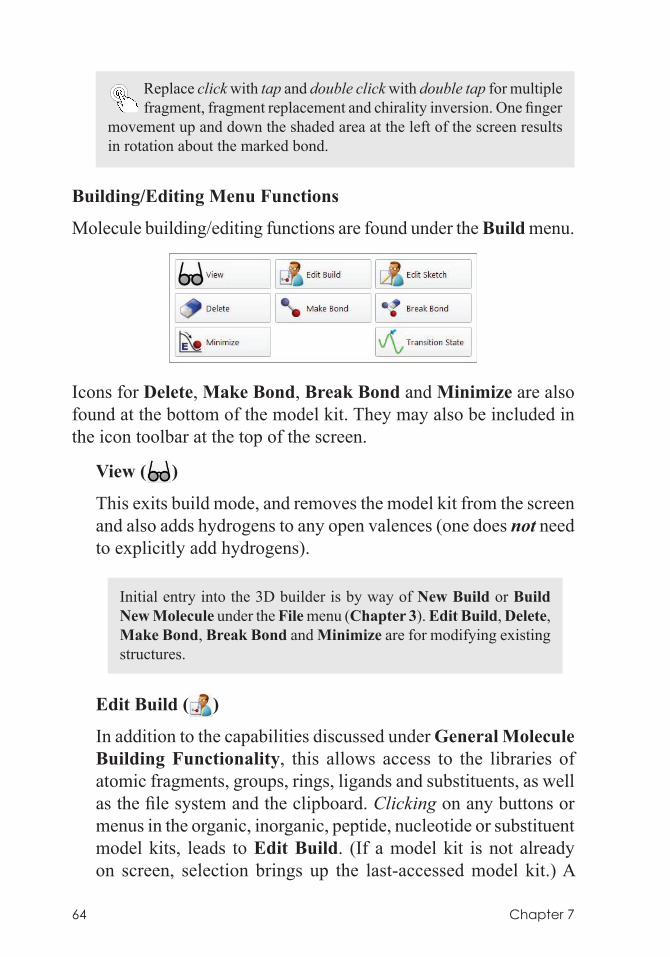
64 Chapter 7
Replace click with tap and double click with double tap for multiple fragment, fragment replacement and chirality inversion. One finger
movement up and down the shaded area at the left of the screen results in rotation about the marked bond.
Building/Editing Menu Functions
Molecule building/editing functions are found under the Build menu.
Icons for Delete, Make Bond, Break Bond and Minimize are also found at the bottom of the model kit. They may also be included in the icon toolbar at the top of the screen.
View ( )
This exits build mode, and removes the model kit from the screen and also adds hydrogens to any open valences (one does not need to explicitly add hydrogens).
Initial entry into the 3D builder is by way of New Build or Build New Molecule under the File menu (Chapter 3). Edit Build, Delete, Make Bond, Break Bond and Minimize are for modifying existing structures.
Edit Build ( )
In addition to the capabilities discussed under General Molecule Building Functionality, this allows access to the libraries of atomic fragments, groups, rings, ligands and substituents, as well as the file system and the clipboard. Clicking on any buttons or menus in the organic, inorganic, peptide, nucleotide or substituent model kits, leads to Edit Build. (If a model kit is not already on screen, selection brings up the last-accessed model kit.) A
Chapter 7 65
fragment may be used to initiate building by double-clicking anywhere on screen, to add alongside an existing structure on screen by holding down the Insert key (option key on Mac) and by clicking anywhere on screen, or by double clicking in a blank area on screen, or be added to an existing structure by clicking on the appropriate free valence. Fragment addition can be terminated by selection of any other function.
Edit Sketch ( )
This allows a 2D sketch to be modified in the 2D sketcher after it has been converted to a 3D structure. Edit Sketch is unavailable when the existing 3D molecule contains more than 250 atoms.
Delete ( )This allows atom and free valence removal from a structure. Selection leads to a message at the bottom left of the screen.
Subsequent clicking on an atom or free valence results in its deletion. Deletion of an atom results in deletion of all of its associated free valences. Free valences for any atoms to which the deleted atom was previously connected are restored. Note that atom deletion may result in one or more detached fragments. Selection of Delete does not bring up a model kit nor does it remove a model kit that is present on screen. Delete is (by default) a one-time operation. Double-clicking on the Delete icon will hold the delete mode open until the user selects another mode (for example to View, or
to return to Edit Build).
Delete is also used to delete points and planes.
Deletion may also be accomplished by holding down on the Delete key (on the keyboard) while clicking on the item to be deleted. This mode (also) allows multiple deletions.
66 Chapter 7
Make Bond ( )This allows bonds to be drawn between free valences and/or atoms. Selection leads to a message at the bottom left of the screen.
Clicking on two free valences (on different atoms) will cause these atoms to be linked by a single bond. Alternatively, double clicking on each of two atoms will bond them, and clicking on a free valence on one atom and double clicking on a different atom will bond the two atoms. Note that available free valences are consumed as a result of bond formation, irrespective of whether free valences or atoms are selected.* If the selected atoms are already bonded, this will result in the bond order being increased by one, that is, single → double, double → triple. Selection of Make Bond does not bring up a model kit nor does it remove a model kit that is already present on screen. Make Bond may be terminated by selection of any other function.
Break Bond ( )This allows breaking an existing bond resulting in free valences. Selection leads to a message at the bottom left of the screen.
Clicking on a bond breaks it and restores free valences. Note that bond breaking may result in detached fragments. Selection of Break Bond does not bring up a model kit nor does it remove a model kit that is present on screen. Break Bond may be terminated by selection of any other function.
Replace click with tap and double click with double tap for delete, make bond and break bond operations.
* Free valences can be protected without altering the molecule by adding hydrogens to them ( from the organic model kit).
Chapter 7 67
Minimize ( )
This uses molecular mechanics to refine the geometry. Selection leads to a message at the bottom left of the screen.
The molecular mechanics energy* in kJ/mol, displayed at the bottom right of the screen, is continually updated during the minimization process. Minimization may be stopped at any time by clicking on the icon at the bottom right of the screen. Any geometrical constraints imposed on the structure (see Constrain Distance, Constrain Angle, Constrain Dihedral under the Geometry menu; Chapter 6) are enforced during minimization. Also, any frozen atoms in the structure (see Freeze Center under the Geometry menu; Chapter 6) remain frozen.
Transition State ( )
Spartan Student provides a facility for automatically guessing the geometries of transition states based on the similarity of the reaction of interest with one or more entries in Spartan Student’s reaction database. Where an exact match is not available, Spartan Student will attempt to provide as close a match as possible. This will generally involve a less substituted system or one in which substituents differ. Here, the procedure is to use those parts of the structure of the transition state in the database that are common, and to optimize the remaining parts (using molecular mechanics).
It may be essential for the reactants to be properly oriented to reflect the desired stereochemical outcome of the reaction.
Where a reaction is completely unknown to the database, a fallback technique (the linear synchronous transit method) is automatically invoked.
* The mechanics energy is a combination of the strain energy which is either zero or positive and the non-bonded or intramolecular interaction energy which can be either positive or negative. It will most commonly be a positive quantity, although it can be slightly negative.
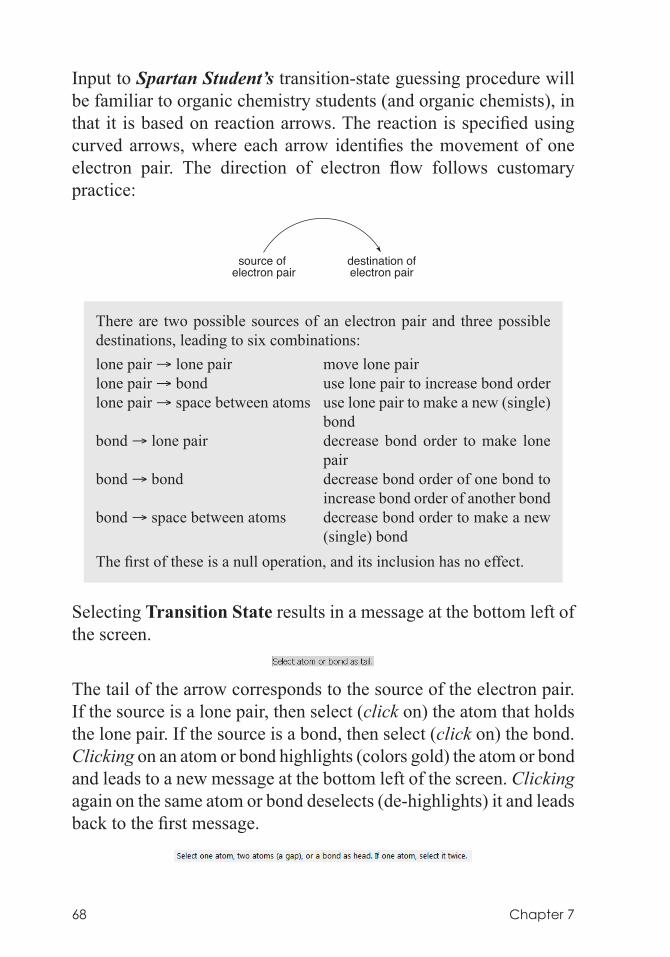
68 Chapter 7
Input to Spartan Student’s transition-state guessing procedure will be familiar to organic chemistry students (and organic chemists), in that it is based on reaction arrows. The reaction is specified using curved arrows, where each arrow identifies the movement of one electron pair. The direction of electron flow follows customary practice:
source of electron pair
destination ofelectron pair
There are two possible sources of an electron pair and three possible destinations, leading to six combinations:lone pair → lone pair move lone pairlone pair → bond use lone pair to increase bond orderlone pair → space between atoms use lone pair to make a new (single)
bondbond → lone pair decrease bond order to make lone
pairbond → bond decrease bond order of one bond to
increase bond order of another bondbond → space between atoms decrease bond order to make a new
(single) bondThe first of these is a null operation, and its inclusion has no effect.
Selecting Transition State results in a message at the bottom left of the screen.
The tail of the arrow corresponds to the source of the electron pair. If the source is a lone pair, then select (click on) the atom that holds the lone pair. If the source is a bond, then select (click on) the bond. Clicking on an atom or bond highlights (colors gold) the atom or bond and leads to a new message at the bottom left of the screen. Clicking again on the same atom or bond deselects (de-highlights) it and leads back to the first message.
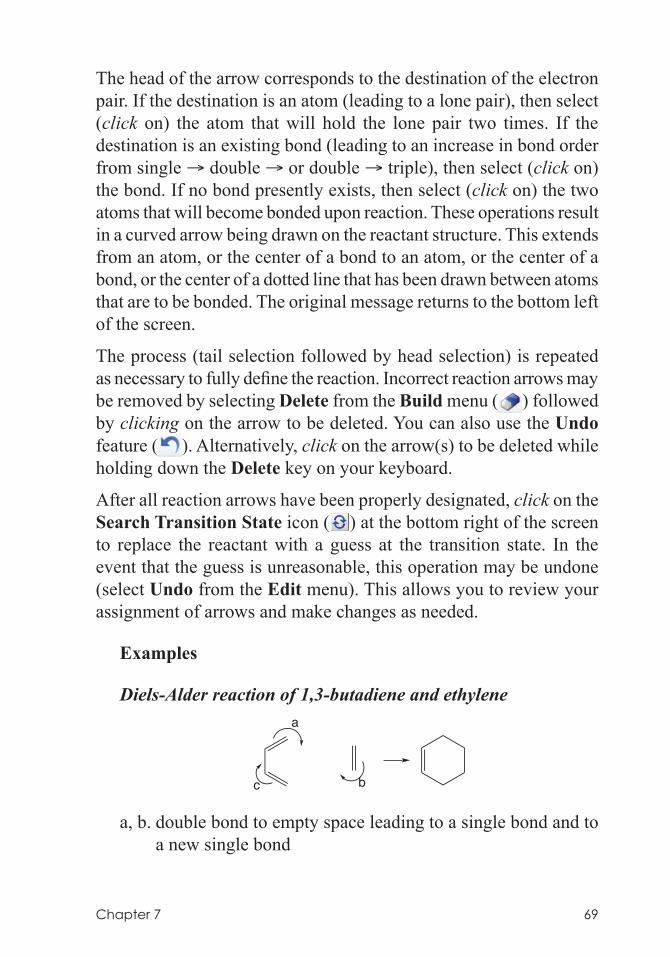
Chapter 7 69
The head of the arrow corresponds to the destination of the electron pair. If the destination is an atom (leading to a lone pair), then select (click on) the atom that will hold the lone pair two times. If the destination is an existing bond (leading to an increase in bond order from single → double → or double → triple), then select (click on) the bond. If no bond presently exists, then select (click on) the two atoms that will become bonded upon reaction. These operations result in a curved arrow being drawn on the reactant structure. This extends from an atom, or the center of a bond to an atom, or the center of a bond, or the center of a dotted line that has been drawn between atoms that are to be bonded. The original message returns to the bottom left of the screen.
The process (tail selection followed by head selection) is repeated as necessary to fully define the reaction. Incorrect reaction arrows may be removed by selecting Delete from the Build menu ( ) followed by clicking on the arrow to be deleted. You can also use the Undo feature ( ). Alternatively, click on the arrow(s) to be deleted while holding down the Delete key on your keyboard.
After all reaction arrows have been properly designated, click on the Search Transition State icon ( ) at the bottom right of the screen to replace the reactant with a guess at the transition state. In the event that the guess is unreasonable, this operation may be undone (select Undo from the Edit menu). This allows you to review your assignment of arrows and make changes as needed.
Examples
Diels-Alder reaction of 1,3-butadiene and ethylene
c
a
b
a, b. double bond to empty space leading to a single bond and to a new single bond
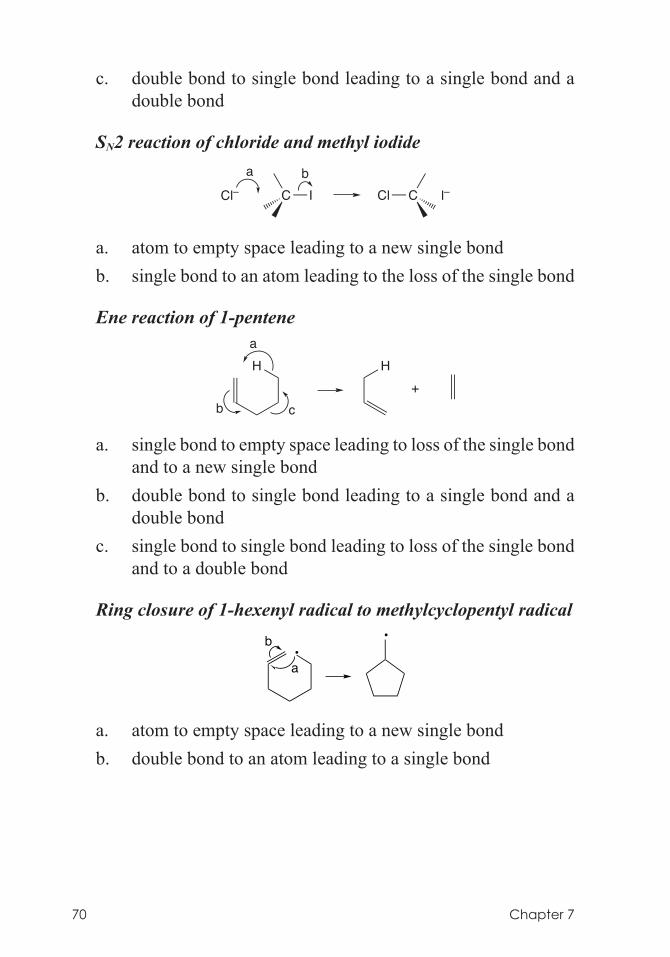
70 Chapter 7
c. double bond to single bond leading to a single bond and a double bond
SN2 reaction of chloride and methyl iodidea b
C I Cl C l–Cl–
a. atom to empty space leading to a new single bond b. single bond to an atom leading to the loss of the single bond
Ene reaction of 1-penteneaH H
+cb
a. single bond to empty space leading to loss of the single bond and to a new single bond
b. double bond to single bond leading to a single bond and a double bond
c. single bond to single bond leading to loss of the single bond and to a double bond
Ring closure of 1-hexenyl radical to methylcyclopentyl radicalb
a•
•
a. atom to empty space leading to a new single bondb. double bond to an atom leading to a single bond
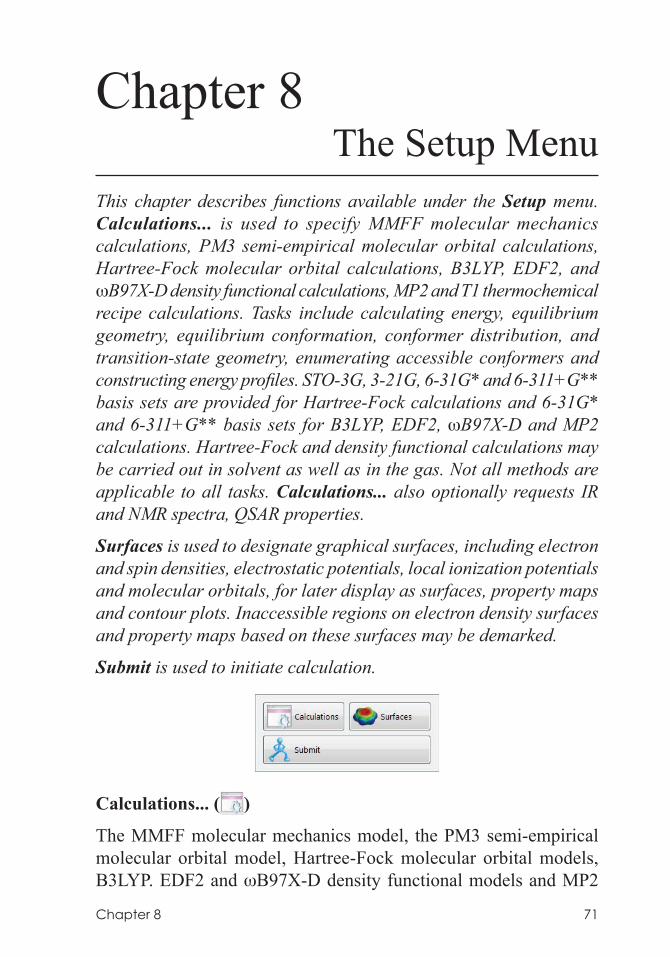
Chapter 8 71
Chapter 8The Setup Menu
This chapter describes functions available under the Setup menu. Calculations... is used to specify MMFF molecular mechanics calculations, PM3 semi-empirical molecular orbital calculations, Hartree-Fock molecular orbital calculations, B3LYP, EDF2, and wB97X-D density functional calculations, MP2 and T1 thermochemical recipe calculations. Tasks include calculating energy, equilibrium geometry, equilibrium conformation, conformer distribution, and transition-state geometry, enumerating accessible conformers and constructing energy profiles. STO-3G, 3-21G, 6-31G* and 6-311+G** basis sets are provided for Hartree-Fock calculations and 6-31G* and 6-311+G** basis sets for B3LYP, EDF2, wB97X-D and MP2 calculations. Hartree-Fock and density functional calculations may be carried out in solvent as well as in the gas. Not all methods are applicable to all tasks. Calculations... also optionally requests IR and NMR spectra, QSAR properties.
Surfaces is used to designate graphical surfaces, including electron and spin densities, electrostatic potentials, local ionization potentials and molecular orbitals, for later display as surfaces, property maps and contour plots. Inaccessible regions on electron density surfaces and property maps based on these surfaces may be demarked.
Submit is used to initiate calculation.
Calculations... ( )
The MMFF molecular mechanics model, the PM3 semi-empirical molecular orbital model, Hartree-Fock molecular orbital models, B3LYP. EDF2 and wB97X-D density functional models and MP2
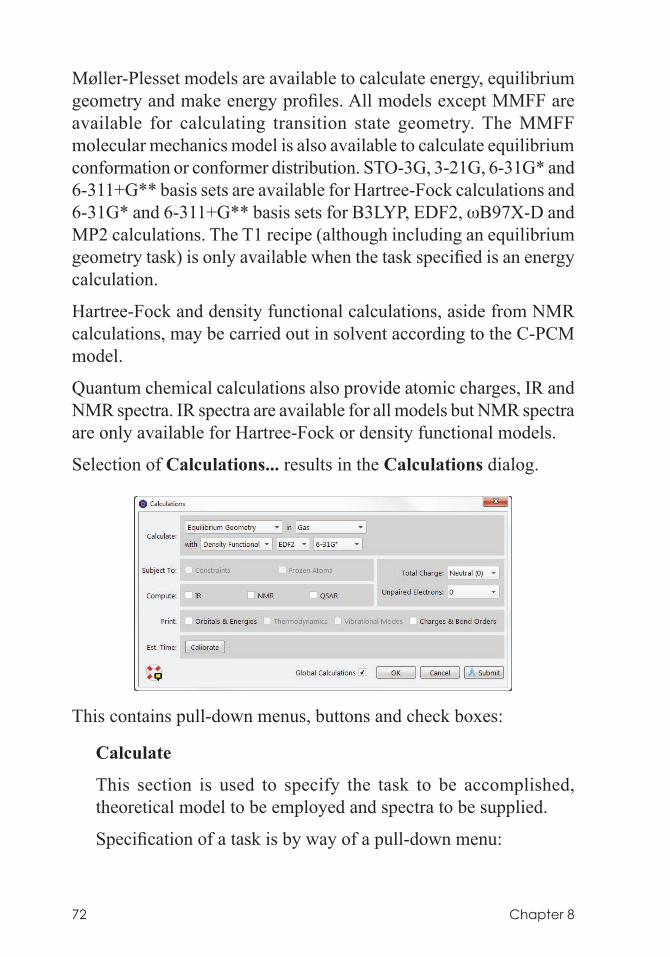
72 Chapter 8
Møller-Plesset models are available to calculate energy, equilibrium geometry and make energy profiles. All models except MMFF are available for calculating transition state geometry. The MMFF molecular mechanics model is also available to calculate equilibrium conformation or conformer distribution. STO-3G, 3-21G, 6-31G* and 6-311+G** basis sets are available for Hartree-Fock calculations and 6-31G* and 6-311+G** basis sets for B3LYP, EDF2, wB97X-D and MP2 calculations. The T1 recipe (although including an equilibrium geometry task) is only available when the task specified is an energy calculation.
Hartree-Fock and density functional calculations, aside from NMR calculations, may be carried out in solvent according to the C-PCM model.
Quantum chemical calculations also provide atomic charges, IR and NMR spectra. IR spectra are available for all models but NMR spectra are only available for Hartree-Fock or density functional models.
Selection of Calculations... results in the Calculations dialog.
This contains pull-down menus, buttons and check boxes:
Calculate
This section is used to specify the task to be accomplished, theoretical model to be employed and spectra to be supplied.
Specification of a task is by way of a pull-down menu:
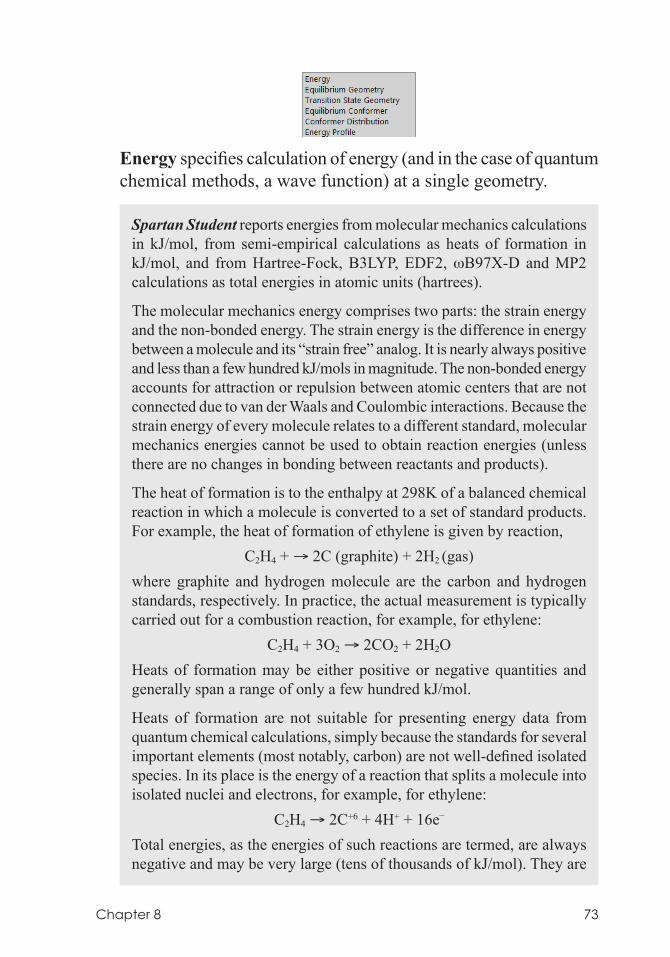
Chapter 8 73
Energy specifies calculation of energy (and in the case of quantum chemical methods, a wave function) at a single geometry.
Spartan Student reports energies from molecular mechanics calculations in kJ/mol, from semi-empirical calculations as heats of formation in kJ/mol, and from Hartree-Fock, B3LYP, EDF2, wB97X-D and MP2 calculations as total energies in atomic units (hartrees).
The molecular mechanics energy comprises two parts: the strain energy and the non-bonded energy. The strain energy is the difference in energy between a molecule and its “strain free” analog. It is nearly always positive and less than a few hundred kJ/mols in magnitude. The non-bonded energy accounts for attraction or repulsion between atomic centers that are not connected due to van der Waals and Coulombic interactions. Because the strain energy of every molecule relates to a different standard, molecular mechanics energies cannot be used to obtain reaction energies (unless there are no changes in bonding between reactants and products).
The heat of formation is to the enthalpy at 298K of a balanced chemical reaction in which a molecule is converted to a set of standard products. For example, the heat of formation of ethylene is given by reaction,
C2H4 + → 2C (graphite) + 2H2 (gas)where graphite and hydrogen molecule are the carbon and hydrogen standards, respectively. In practice, the actual measurement is typically carried out for a combustion reaction, for example, for ethylene:
C2H4 + 3O2 → 2CO2 + 2H2OHeats of formation may be either positive or negative quantities and generally span a range of only a few hundred kJ/mol.
Heats of formation are not suitable for presenting energy data from quantum chemical calculations, simply because the standards for several important elements (most notably, carbon) are not well-defined isolated species. In its place is the energy of a reaction that splits a molecule into isolated nuclei and electrons, for example, for ethylene:
C2H4 → 2C+6 + 4H+ + 16e–
Total energies, as the energies of such reactions are termed, are always negative and may be very large (tens of thousands of kJ/mol). They are
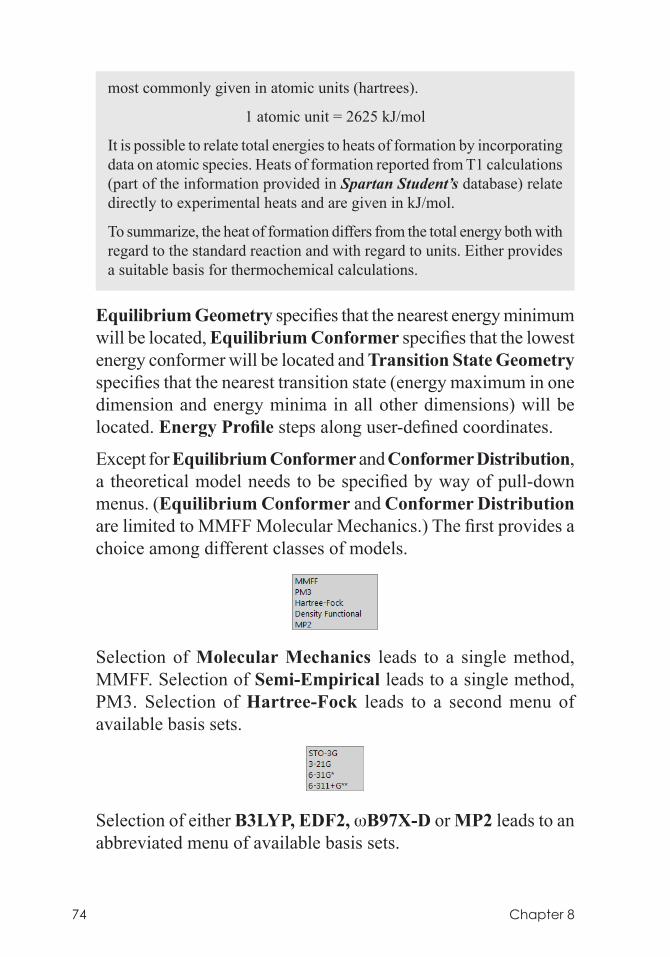
74 Chapter 8
most commonly given in atomic units (hartrees).
1 atomic unit = 2625 kJ/mol
It is possible to relate total energies to heats of formation by incorporating data on atomic species. Heats of formation reported from T1 calculations (part of the information provided in Spartan Student’s database) relate directly to experimental heats and are given in kJ/mol.
To summarize, the heat of formation differs from the total energy both with regard to the standard reaction and with regard to units. Either provides a suitable basis for thermochemical calculations.
Equilibrium Geometry specifies that the nearest energy minimum will be located, Equilibrium Conformer specifies that the lowest energy conformer will be located and Transition State Geometry specifies that the nearest transition state (energy maximum in one dimension and energy minima in all other dimensions) will be located. Energy Profile steps along user-defined coordinates.
Except for Equilibrium Conformer and Conformer Distribution, a theoretical model needs to be specified by way of pull-down menus. (Equilibrium Conformer and Conformer Distribution are limited to MMFF Molecular Mechanics.) The first provides a choice among different classes of models.
Selection of Molecular Mechanics leads to a single method, MMFF. Selection of Semi-Empirical leads to a single method, PM3. Selection of Hartree-Fock leads to a second menu of available basis sets.
Selection of either B3LYP, EDF2, wB97X-D or MP2 leads to an abbreviated menu of available basis sets.
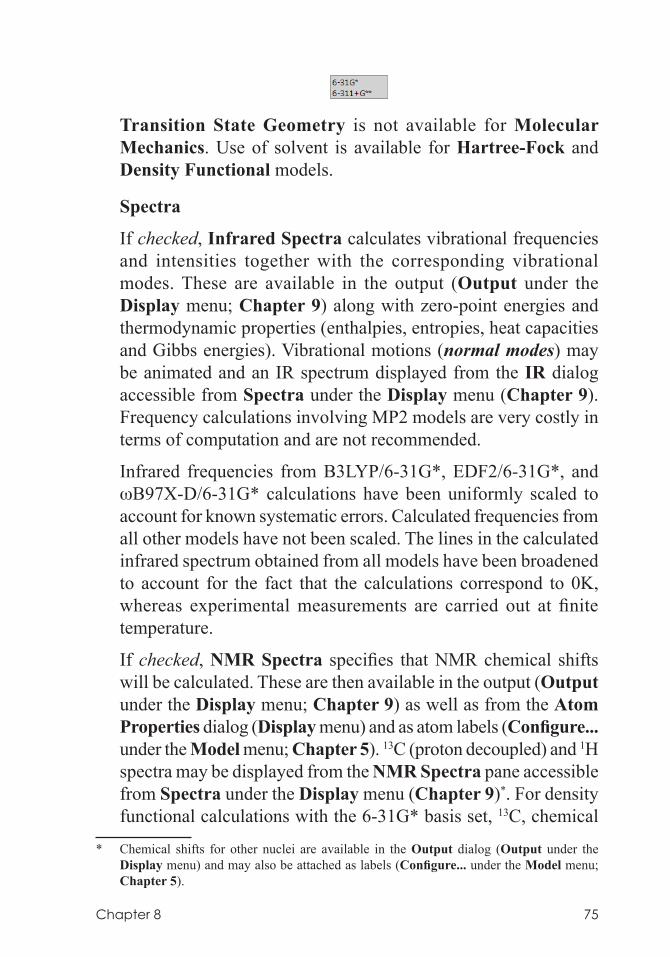
Chapter 8 75
Transition State Geometry is not available for Molecular Mechanics. Use of solvent is available for Hartree-Fock and Density Functional models.
Spectra
If checked, Infrared Spectra calculates vibrational frequencies and intensities together with the corresponding vibrational modes. These are available in the output (Output under the Display menu; Chapter 9) along with zero-point energies and thermodynamic properties (enthalpies, entropies, heat capacities and Gibbs energies). Vibrational motions (normal modes) may be animated and an IR spectrum displayed from the IR dialog accessible from Spectra under the Display menu (Chapter 9). Frequency calculations involving MP2 models are very costly in terms of computation and are not recommended.
Infrared frequencies from B3LYP/6-31G*, EDF2/6-31G*, and wB97X-D/6-31G* calculations have been uniformly scaled to account for known systematic errors. Calculated frequencies from all other models have not been scaled. The lines in the calculated infrared spectrum obtained from all models have been broadened to account for the fact that the calculations correspond to 0K, whereas experimental measurements are carried out at finite temperature.
If checked, NMR Spectra specifies that NMR chemical shifts will be calculated. These are then available in the output (Output under the Display menu; Chapter 9) as well as from the Atom Properties dialog (Display menu) and as atom labels (Configure... under the Model menu; Chapter 5). 13C (proton decoupled) and 1H spectra may be displayed from the NMR Spectra pane accessible from Spectra under the Display menu (Chapter 9)*. For density functional calculations with the 6-31G* basis set, 13C, chemical
* Chemical shifts for other nuclei are available in the Output dialog (Output under the Display menu) and may also be attached as labels (Configure... under the Model menu; Chapter 5).
76 Chapter 8
shifts have been empirically corrected for local environment. Line intensities are assumed to be proportional to the number of equivalent carbons or hydrogens. Three-bond HH coupling constants for 1H spectra are estimated empirically and these have been used to simulate splitting patterns.
QSAR
If checked, calculates a number of wave function-based properties accessible from the QSAR tab in the Molecular Properties dialog (Chapter 9).
Total Charge
Total charge. The default setting (Neutral) may be changed either by clicking on , and selecting Anion, Dianion, -3, etc. from the menu, or by typing a number in the. Total Charge is ignored for molecular mechanics calculations.
Unpaired Electrons
The number of unpaired electrons. The default setting (0) may be changed either by clicking on , and selecting 1 or 2 from the menu, or by typing in the menu. Unpaired Electrons is ignored for molecular mechanics calculations.
Global Calculations
If checked, signifies that settings in the Calculations dialog are to be applied to all molecules in the document.
The Calculations dialog may be exited by clicking on Submit, Cancel or OK at the bottom right of the dialog, or on at the top. (Submit and OK are not available if the job is already executing.) Clicking on OK or on Submit overwrites any previous information. Additionally, Submit enters the job in the execution queue (see discussion later this chapter). Clicking on Cancel or on
exits the Calculations dialog without saving any changes.
Chapter 8 77
Calibrate/Est. Time
The Calibrate feature runs a single back-end calculation that should take no more than 30 seconds. This is compared against a reference calculation and is used to provide an estimate of how long a specified calculation will take. Once calibrated, all future specified calculations will include an Est. Time.
Surfaces ( )
Spartan Student allows graphical display of the HOMO and LUMO among other molecular orbitals, the electron density, the spin density for molecules with unpaired electrons, the electrostatic potential and the local ionization potential.
The electron density is the number of electrons found at a point in space. It is the quantity measured in an X-ray diffraction experiment that is then used to locate atomic positions, that is, most electrons are closely associated with atoms. While the electron density is non-zero everywhere, it is possible to define surfaces of constant density. The most important of these contains most of a molecule’s electrons and that roughly corresponds to a space-filling model, that is, a van der Waals surface. We will refer to this as the electron density. It is interesting because it reveals overall molecular size and shape and demarks the steric barrier seen by encroaching molecules. Another important surface, that we will refer to as the bond density, contains fewer electrons in total and demarks atomic connectivity.
The spin density is the difference in the number of electrons of α and β spin at a point in space. It indicates the location of the unpaired electron in a radical or unpaired electrons in a triplet.
The electrostatic potential is the energy of interaction of a positive charge with a molecule. This assumes a fixed electron distribution for the molecule. It represents a balance between repulsive interactions involving the positively-charged nuclei and attractive interactions involving the negatively-charged electrons. Regions where the balance tips toward attraction are said to be electron rich (basic) and subject to attack by electrophiles, while regions where the balance tips toward repulsion are said to be electron poor (acidic) and subject to attack by nucleophiles. Electron-rich regions such as lone pairs are typically located outside the van der Waals surface. As such, they may be easily identified by
78 Chapter 8
constructing a surface of negative (attractive) electrostatic potential. While interesting electron-poor areas such as acidic hydrogens also lie outside the van der Waals surface, the electrostatic potential is also positive (repulsive) throughout the region inside this surface.
The local ionization potential indicates the ease or difficulty of electron removal (ionization). Like the negative regions of the electrostatic potential, regions of low local ionization potential are likely to be subject to attack by electrophiles.
Note that neither electrostatic potential nor the local ionization potential are experimental observables, although they relate to quantities that can be given clear chemical interpretation.
Additionally, any one of the quantities listed above (except the electron density) may be mapped onto any surface (except a molecular orbital surface). In practice, the only maps to have received widespread attention are those based on the electron density surface (depicting overall molecular size and shape). Most common are the electrostatic potential map, the local ionization potential map and the LUMO map. Some regions of an electron density surface are inaccessible and are not available for interaction with their environment (or with an incoming reagent). Spartan Student allows these regions to be identified.*
The electrostatic potential map paints the value of the electrostatic potential onto an electron density surface. By convention, colors toward red depict negative potential, while colors toward blue depict positive potential, and colors in between (orange, yellow, green) depict intermediate values of the potential. Thus, an electrostatic potential map for p-tert-butylphenol will show oxygen to be red, its attached (acidic) hydrogen to be blue, the π faces of benzene to be orange or yellow and the tert-butyl group to be green.
* A region on a density surface is designated as inaccessible if a sphere of radius 1.0 Å centered on a line normal to the surface and touching a point in the middle of the region, impinges on any other regions of the density surface. The sphere radius may be changed in the Settings tab (Preferences under the Options menu; Chapter 10).
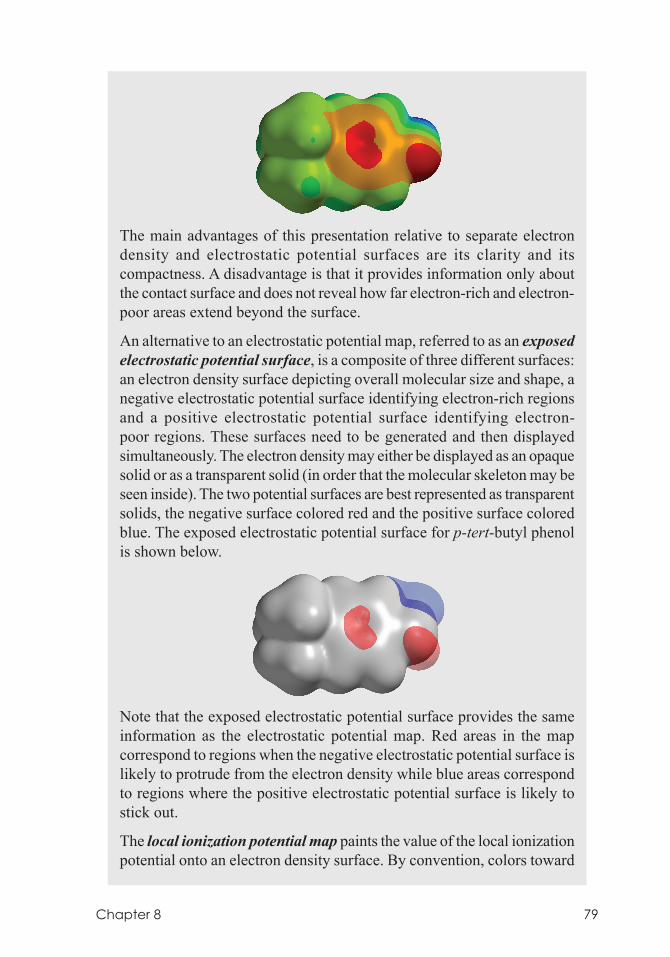
Chapter 8 79
The main advantages of this presentation relative to separate electron density and electrostatic potential surfaces are its clarity and its compactness. A disadvantage is that it provides information only about the contact surface and does not reveal how far electron-rich and electron-poor areas extend beyond the surface.
An alternative to an electrostatic potential map, referred to as an exposed electrostatic potential surface, is a composite of three different surfaces: an electron density surface depicting overall molecular size and shape, a negative electrostatic potential surface identifying electron-rich regions and a positive electrostatic potential surface identifying electron-poor regions. These surfaces need to be generated and then displayed simultaneously. The electron density may either be displayed as an opaque solid or as a transparent solid (in order that the molecular skeleton may be seen inside). The two potential surfaces are best represented as transparent solids, the negative surface colored red and the positive surface colored blue. The exposed electrostatic potential surface for p-tert-butyl phenol is shown below.
Note that the exposed electrostatic potential surface provides the same information as the electrostatic potential map. Red areas in the map correspond to regions when the negative electrostatic potential surface is likely to protrude from the electron density while blue areas correspond to regions where the positive electrostatic potential surface is likely to stick out.
The local ionization potential map paints the value of the local ionization potential onto an electron density surface. By convention, colors toward
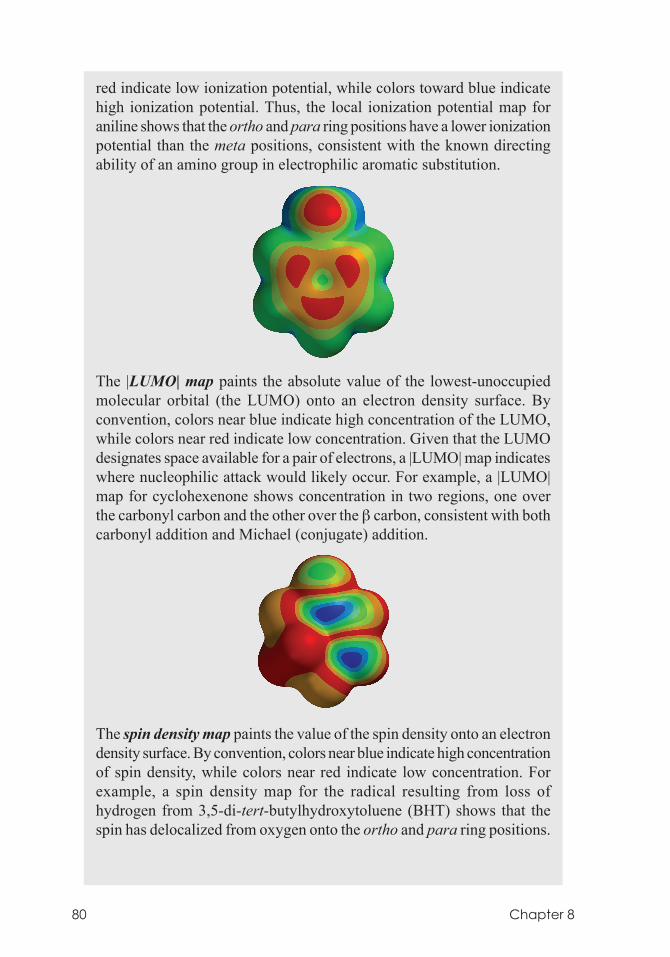
80 Chapter 8
red indicate low ionization potential, while colors toward blue indicate high ionization potential. Thus, the local ionization potential map for aniline shows that the ortho and para ring positions have a lower ionization potential than the meta positions, consistent with the known directing ability of an amino group in electrophilic aromatic substitution.
The |LUMO| map paints the absolute value of the lowest-unoccupied molecular orbital (the LUMO) onto an electron density surface. By convention, colors near blue indicate high concentration of the LUMO, while colors near red indicate low concentration. Given that the LUMO designates space available for a pair of electrons, a |LUMO| map indicates where nucleophilic attack would likely occur. For example, a |LUMO| map for cyclohexenone shows concentration in two regions, one over the carbonyl carbon and the other over the β carbon, consistent with both carbonyl addition and Michael (conjugate) addition.
The spin density map paints the value of the spin density onto an electron density surface. By convention, colors near blue indicate high concentration of spin density, while colors near red indicate low concentration. For example, a spin density map for the radical resulting from loss of hydrogen from 3,5-di-tert-butylhydroxytoluene (BHT) shows that the spin has delocalized from oxygen onto the ortho and para ring positions.
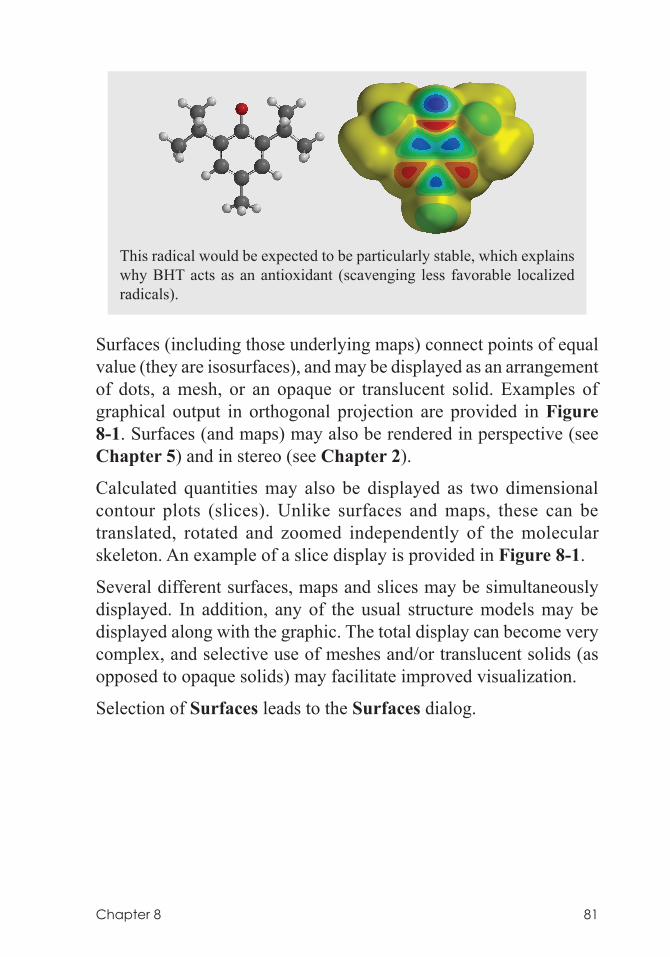
Chapter 8 81
This radical would be expected to be particularly stable, which explains why BHT acts as an antioxidant (scavenging less favorable localized radicals).
Surfaces (including those underlying maps) connect points of equal value (they are isosurfaces), and may be displayed as an arrangement of dots, a mesh, or an opaque or translucent solid. Examples of graphical output in orthogonal projection are provided in Figure 8-1. Surfaces (and maps) may also be rendered in perspective (see Chapter 5) and in stereo (see Chapter 2).
Calculated quantities may also be displayed as two dimensional contour plots (slices). Unlike surfaces and maps, these can be translated, rotated and zoomed independently of the molecular skeleton. An example of a slice display is provided in Figure 8-1.
Several different surfaces, maps and slices may be simultaneously displayed. In addition, any of the usual structure models may be displayed along with the graphic. The total display can become very complex, and selective use of meshes and/or translucent solids (as opposed to opaque solids) may facilitate improved visualization.
Selection of Surfaces leads to the Surfaces dialog.
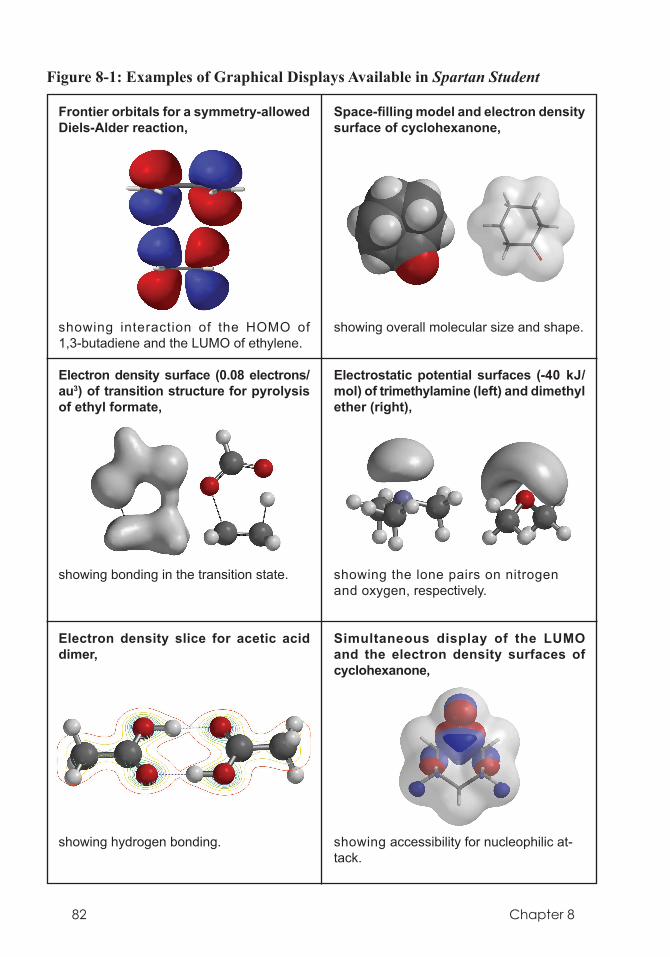
82 Chapter 8
showing bonding in the transition state.
showing hydrogen bonding.
showing interaction of the HOMO of 1,3-butadiene and the LUMO of ethylene.
showing overall molecular size and shape.
Frontier orbitals for a symmetry-allowed Diels-Alder reaction,
Space-filling model and electron density surface of cyclohexanone,
Electron density surface (0.08 electrons/au3) of transition structure for pyrolysis of ethyl formate,
Electrostatic potential surfaces (-40 kJ/mol) of trimethyl am ine (left) and dimethyl ether (right),
Electron density slice for acetic acid dimer,
Figure 8-1: Examples of Graphical Displays Available in Spartan Student
showing ac ces sibility for nucleophilic at-tack.
Simultaneous display of the LUMO and the elec tron density surfaces of cyclohexanone,
showing the lone pairs on nitrogen and oxygen, respectively.
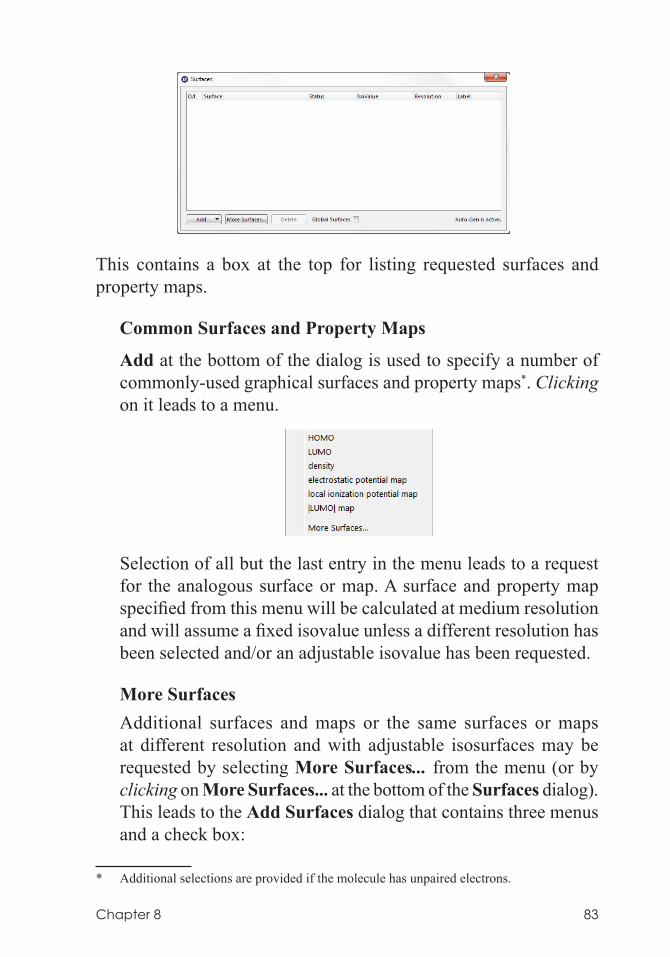
Chapter 8 83
This contains a box at the top for listing requested surfaces and property maps.
Common Surfaces and Property Maps
Add at the bottom of the dialog is used to specify a number of commonly-used graphical surfaces and property maps*. Clicking on it leads to a menu.
Selection of all but the last entry in the menu leads to a request
for the analogous surface or map. A surface and property map specified from this menu will be calculated at medium resolution and will assume a fixed isovalue unless a different resolution has been selected and/or an adjustable isovalue has been requested.
More Surfaces Additional surfaces and maps or the same surfaces or maps
at different resolution and with adjustable isosurfaces may be requested by selecting More Surfaces... from the menu (or by clicking on More Surfaces... at the bottom of the Surfaces dialog). This leads to the Add Surfaces dialog that contains three menus and a check box:
* Additional selections are provided if the molecule has unpaired electrons.
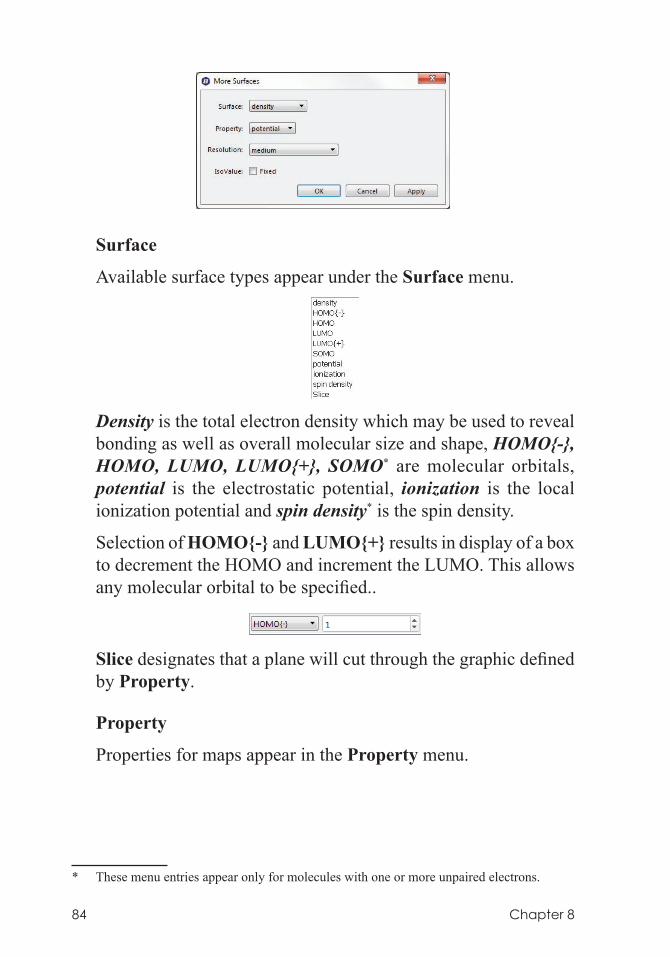
84 Chapter 8
Surface
Available surface types appear under the Surface menu.
Density is the total electron density which may be used to reveal bonding as well as overall molecular size and shape, HOMO{-}, HOMO, LUMO, LUMO{+}, SOMO* are molecular orbitals, potential is the electrostatic potential, ionization is the local ionization potential and spin density* is the spin density.
Selection of HOMO{-} and LUMO{+} results in display of a box to decrement the HOMO and increment the LUMO. This allows any molecular orbital to be specified..
Slice designates that a plane will cut through the graphic defined by Property.
Property
Properties for maps appear in the Property menu.
* These menu entries appear only for molecules with one or more unpaired electrons.
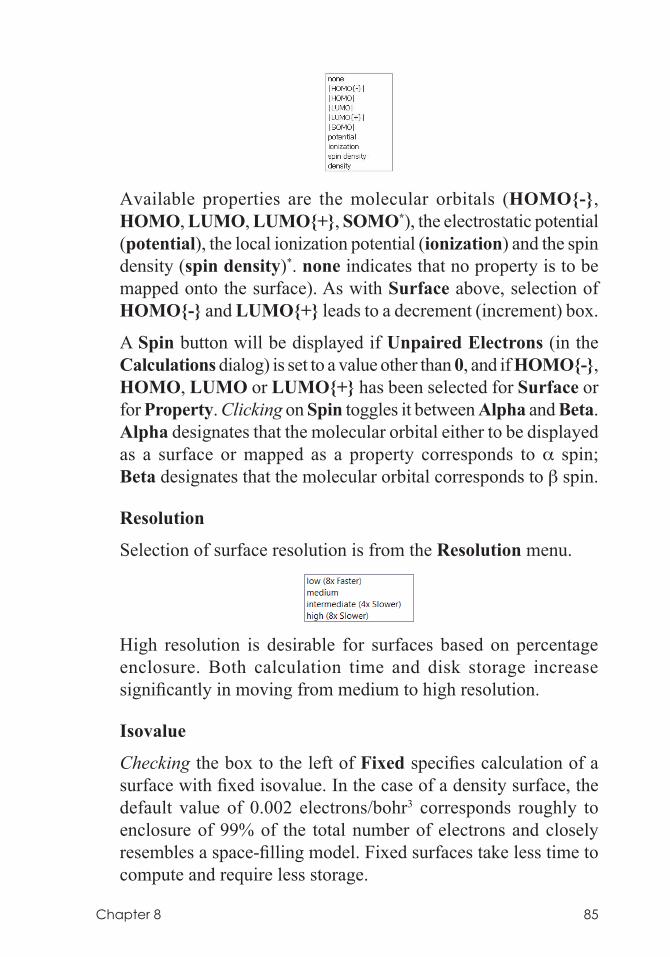
Chapter 8 85
Available properties are the molecular orbitals (HOMO{-},
HOMO, LUMO, LUMO{+}, SOMO*), the electrostatic potential (potential), the local ionization potential (ionization) and the spin density (spin density)*. none indicates that no property is to be mapped onto the surface). As with Surface above, selection of HOMO{-} and LUMO{+} leads to a decrement (increment) box.
A Spin button will be displayed if Unpaired Electrons (in the Calculations dialog) is set to a value other than 0, and if HOMO{-}, HOMO, LUMO or LUMO{+} has been selected for Surface or for Property. Clicking on Spin toggles it between Alpha and Beta. Alpha designates that the molecular orbital either to be displayed as a surface or mapped as a property corresponds to α spin; Beta designates that the molecular orbital corresponds to β spin.
Resolution
Selection of surface resolution is from the Resolution menu.
High resolution is desirable for surfaces based on percentage enclosure. Both calculation time and disk storage increase significantly in moving from medium to high resolution.
Isovalue
Checking the box to the left of Fixed specifies calculation of a surface with fixed isovalue. In the case of a density surface, the default value of 0.002 electrons/bohr3 corresponds roughly to enclosure of 99% of the total number of electrons and closely resembles a space-filling model. Fixed surfaces take less time to compute and require less storage.
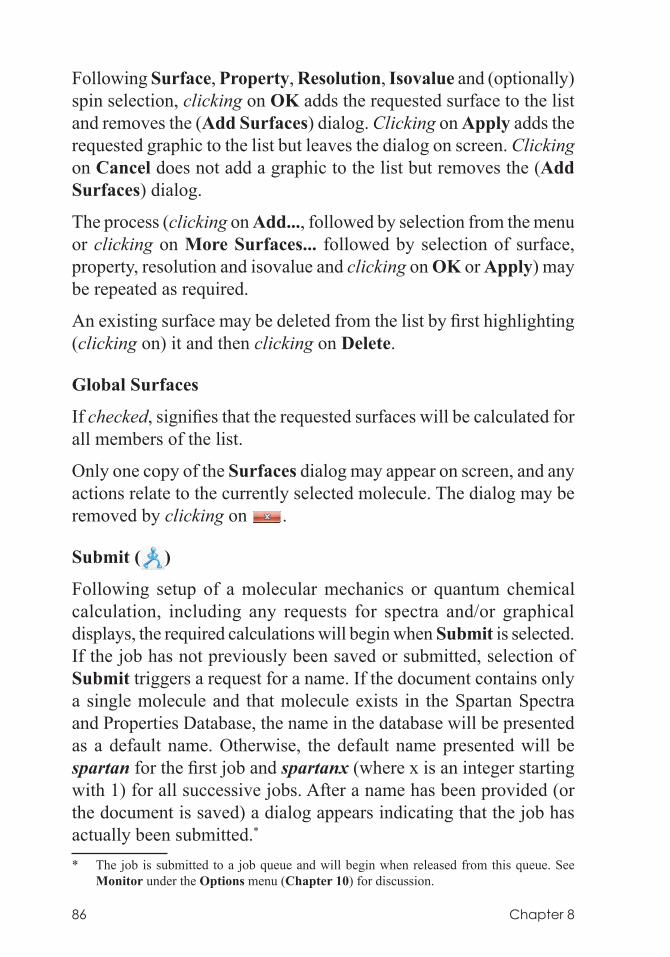
86 Chapter 8
Following Surface, Property, Resolution, Isovalue and (optionally) spin selection, clicking on OK adds the requested surface to the list and removes the (Add Surfaces) dialog. Clicking on Apply adds the requested graphic to the list but leaves the dialog on screen. Clicking on Cancel does not add a graphic to the list but removes the (Add Surfaces) dialog.
The process (clicking on Add..., followed by selection from the menu or clicking on More Surfaces... followed by selection of surface, property, resolution and isovalue and clicking on OK or Apply) may be repeated as required.
An existing surface may be deleted from the list by first highlighting (clicking on) it and then clicking on Delete.
Global Surfaces
If checked, signifies that the requested surfaces will be calculated for all members of the list.
Only one copy of the Surfaces dialog may appear on screen, and any actions relate to the currently selected molecule. The dialog may be removed by clicking on .
Submit ( )
Following setup of a molecular mechanics or quantum chemical calculation, including any requests for spectra and/or graphical displays, the required calculations will begin when Submit is selected. If the job has not previously been saved or submitted, selection of Submit triggers a request for a name. If the document contains only a single molecule and that molecule exists in the Spartan Spectra and Properties Database, the name in the database will be presented as a default name. Otherwise, the default name presented will be spartan for the first job and spartanx (where x is an integer starting with 1) for all successive jobs. After a name has been provided (or the document is saved) a dialog appears indicating that the job has actually been submitted.*
* The job is submitted to a job queue and will begin when released from this queue. See Monitor under the Options menu (Chapter 10) for discussion.
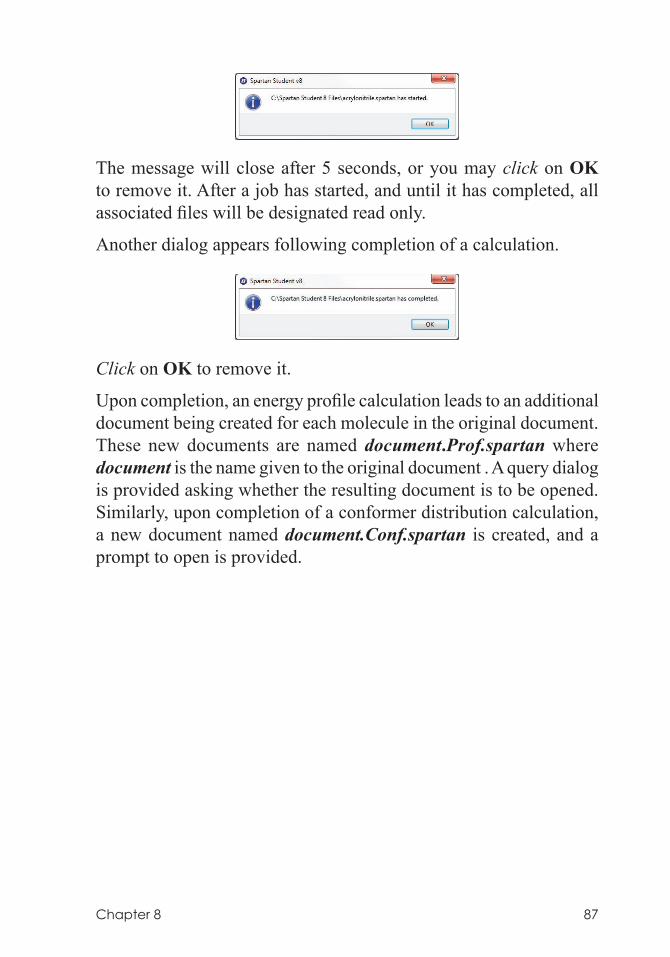
Chapter 8 87
The message will close after 5 seconds, or you may click on OK to remove it. After a job has started, and until it has completed, all associated files will be designated read only.
Another dialog appears following completion of a calculation.
Click on OK to remove it.
Upon completion, an energy profile calculation leads to an additional document being created for each molecule in the original document. These new documents are named document.Prof.spartan where document is the name given to the original document . A query dialog is provided asking whether the resulting document is to be opened. Similarly, upon completion of a conformer distribution calculation, a new document named document.Conf.spartan is created, and a prompt to open is provided.
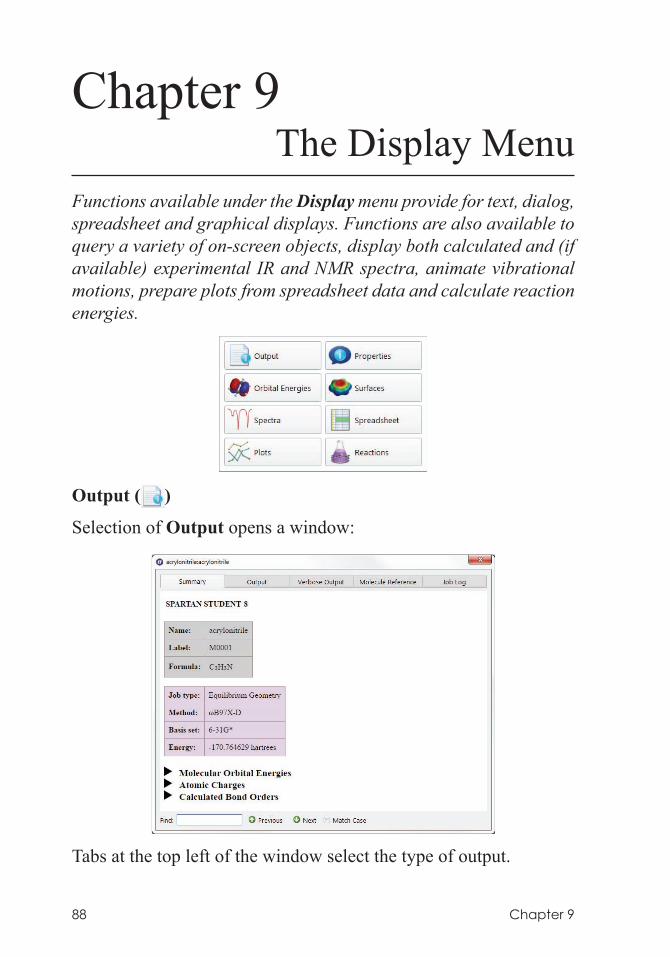
88 Chapter 9
Chapter 9The Display Menu
Functions available under the Display menu provide for text, dialog, spreadsheet and graphical displays. Functions are also available to query a variety of on-screen objects, display both calculated and (if available) experimental IR and NMR spectra, animate vibrational motions, prepare plots from spreadsheet data and calculate reaction energies.
Output ( )
Selection of Output opens a window:
Tabs at the top left of the window select the type of output.
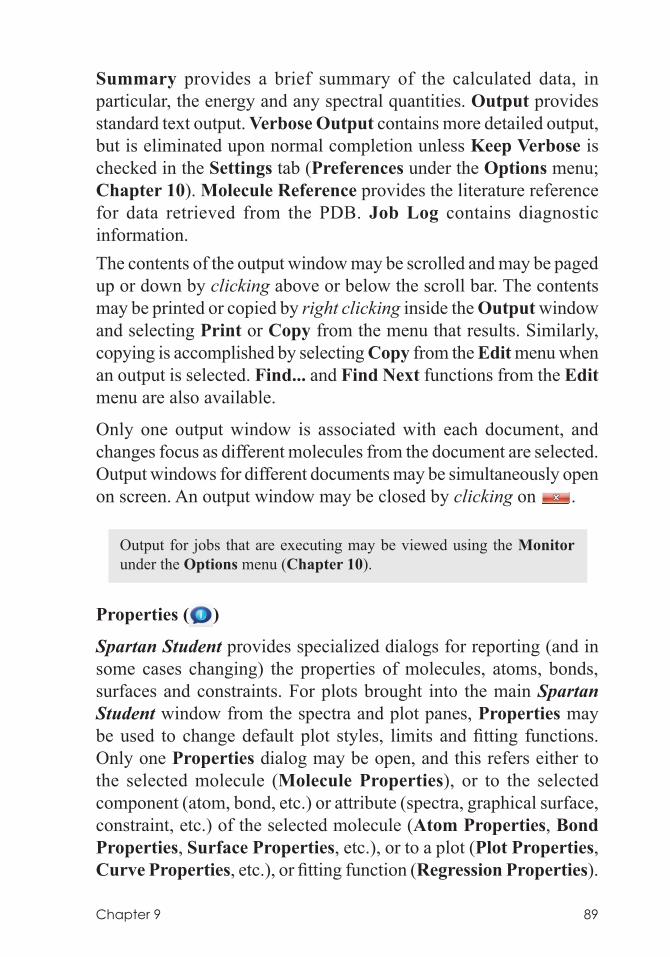
Chapter 9 89
Summary provides a brief summary of the calculated data, in particular, the energy and any spectral quantities. Output provides standard text output. Verbose Output contains more detailed output, but is eliminated upon normal completion unless Keep Verbose is checked in the Settings tab (Preferences under the Options menu; Chapter 10). Molecule Reference provides the literature reference for data retrieved from the PDB. Job Log contains diagnostic information.The contents of the output window may be scrolled and may be paged up or down by clicking above or below the scroll bar. The contents may be printed or copied by right clicking inside the Output window and selecting Print or Copy from the menu that results. Similarly, copying is accomplished by selecting Copy from the Edit menu when an output is selected. Find... and Find Next functions from the Edit menu are also available.
Only one output window is associated with each document, and changes focus as different molecules from the document are selected. Output windows for different documents may be simultaneously open on screen. An output window may be closed by clicking on .
Output for jobs that are executing may be viewed using the Monitor under the Options menu (Chapter 10).
Properties ( )
Spartan Student provides specialized dialogs for reporting (and in some cases changing) the properties of molecules, atoms, bonds, surfaces and constraints. For plots brought into the main Spartan Student window from the spectra and plot panes, Properties may be used to change default plot styles, limits and fitting functions. Only one Properties dialog may be open, and this refers either to the selected molecule (Molecule Properties), or to the selected component (atom, bond, etc.) or attribute (spectra, graphical surface, constraint, etc.) of the selected molecule (Atom Properties, Bond Properties, Surface Properties, etc.), or to a plot (Plot Properties, Curve Properties, etc.), or fitting function (Regression Properties).
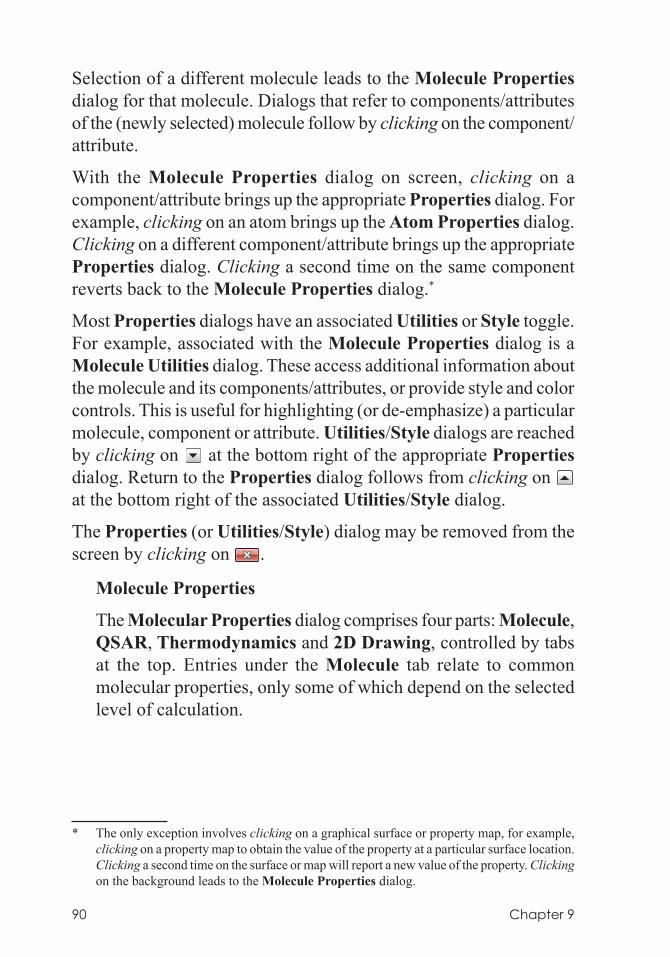
90 Chapter 9
Selection of a different molecule leads to the Molecule Properties dialog for that molecule. Dialogs that refer to components/attributes of the (newly selected) molecule follow by clicking on the component/attribute.
With the Molecule Properties dialog on screen, clicking on a component/attribute brings up the appropriate Properties dialog. For example, clicking on an atom brings up the Atom Properties dialog. Clicking on a different component/attribute brings up the appropriate Properties dialog. Clicking a second time on the same component reverts back to the Molecule Properties dialog.*
Most Properties dialogs have an associated Utilities or Style toggle. For example, associated with the Molecule Properties dialog is a Molecule Utilities dialog. These access additional information about the molecule and its components/attributes, or provide style and color controls. This is useful for highlighting (or de-emphasize) a particular molecule, component or attribute. Utilities/Style dialogs are reached by clicking on at the bottom right of the appropriate Properties dialog. Return to the Properties dialog follows from clicking on at the bottom right of the associated Utilities/Style dialog.
The Properties (or Utilities/Style) dialog may be removed from the screen by clicking on .
Molecule Properties
The Molecular Properties dialog comprises four parts: Molecule, QSAR, Thermodynamics and 2D Drawing, controlled by tabs at the top. Entries under the Molecule tab relate to common molecular properties, only some of which depend on the selected level of calculation.
* The only exception involves clicking on a graphical surface or property map, for example, clicking on a property map to obtain the value of the property at a particular surface location. Clicking a second time on the surface or map will report a new value of the property. Clicking on the background leads to the Molecule Properties dialog.
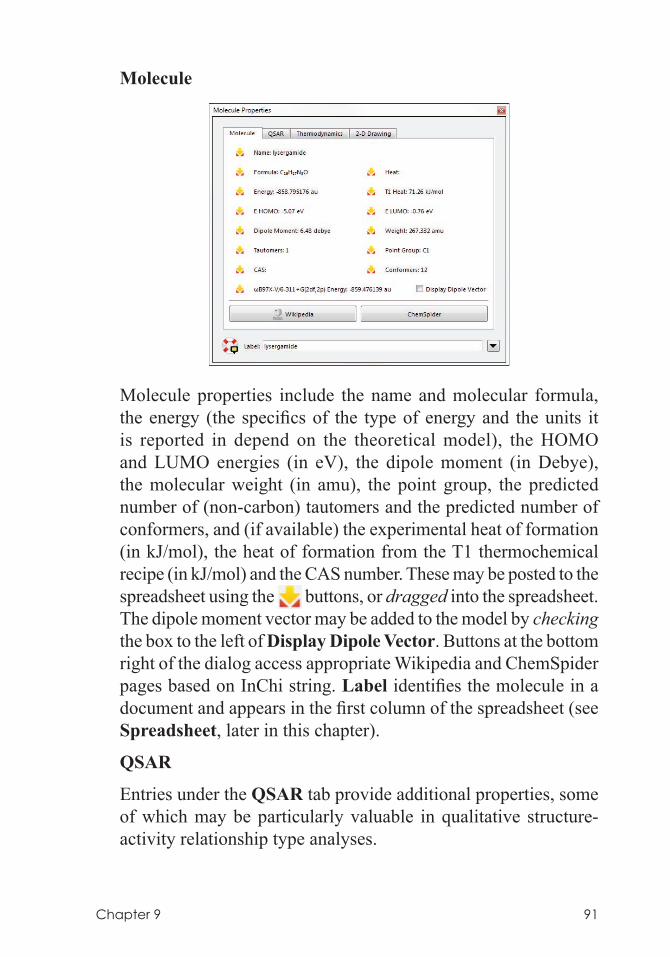
Chapter 9 91
Molecule
Molecule properties include the name and molecular formula,
the energy (the specifics of the type of energy and the units it is reported in depend on the theoretical model), the HOMO and LUMO energies (in eV), the dipole moment (in Debye), the molecular weight (in amu), the point group, the predicted number of (non-carbon) tautomers and the predicted number of conformers, and (if available) the experimental heat of formation (in kJ/mol), the heat of formation from the T1 thermochemical recipe (in kJ/mol) and the CAS number. These may be posted to the spreadsheet using the buttons, or dragged into the spreadsheet. The dipole moment vector may be added to the model by checking the box to the left of Display Dipole Vector. Buttons at the bottom right of the dialog access appropriate Wikipedia and ChemSpider pages based on InChi string. Label identifies the molecule in a document and appears in the first column of the spreadsheet (see Spreadsheet, later in this chapter).
QSAR
Entries under the QSAR tab provide additional properties, some of which may be particularly valuable in qualitative structure-activity relationship type analyses.
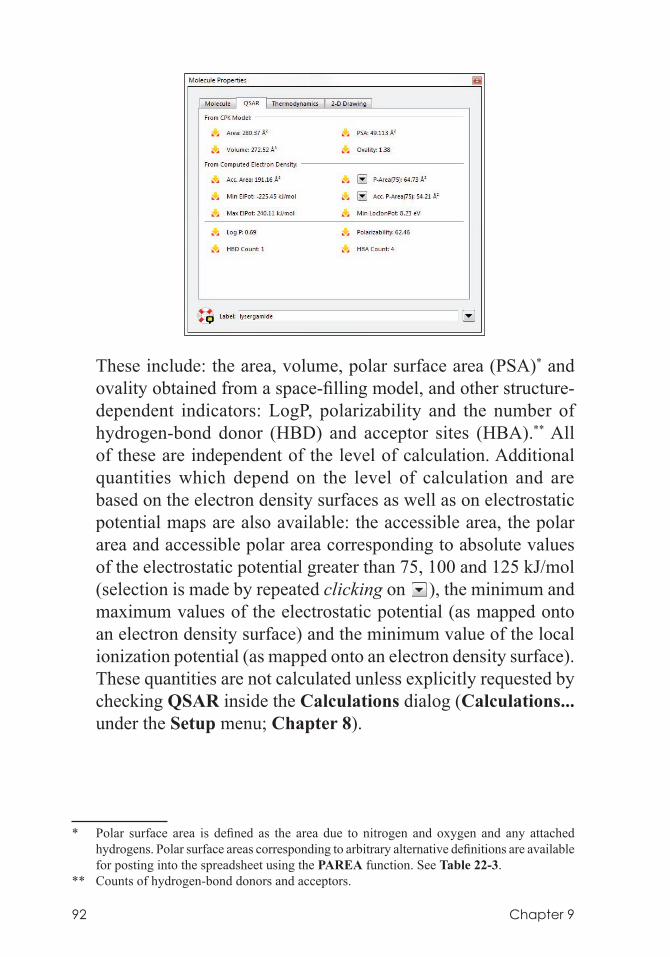
92 Chapter 9
These include: the area, volume, polar surface area (PSA)* and
ovality obtained from a space-filling model, and other structure-dependent indicators: LogP, polarizability and the number of hydrogen-bond donor (HBD) and acceptor sites (HBA).** All of these are independent of the level of calculation. Additional quantities which depend on the level of calculation and are based on the electron density surfaces as well as on electrostatic potential maps are also available: the accessible area, the polar area and accessible polar area corresponding to absolute values of the electrostatic potential greater than 75, 100 and 125 kJ/mol (selection is made by repeated clicking on ), the minimum and maximum values of the electrostatic potential (as mapped onto an electron density surface) and the minimum value of the local ionization potential (as mapped onto an electron density surface). These quantities are not calculated unless explicitly requested by checking QSAR inside the Calculations dialog (Calculations... under the Setup menu; Chapter 8).
* Polar surface area is defined as the area due to nitrogen and oxygen and any attached hydrogens. Polar surface areas corresponding to arbitrary alternative definitions are available for posting into the spreadsheet using the PAREA function. See Table 22-3.
** Counts of hydrogen-bond donors and acceptors.
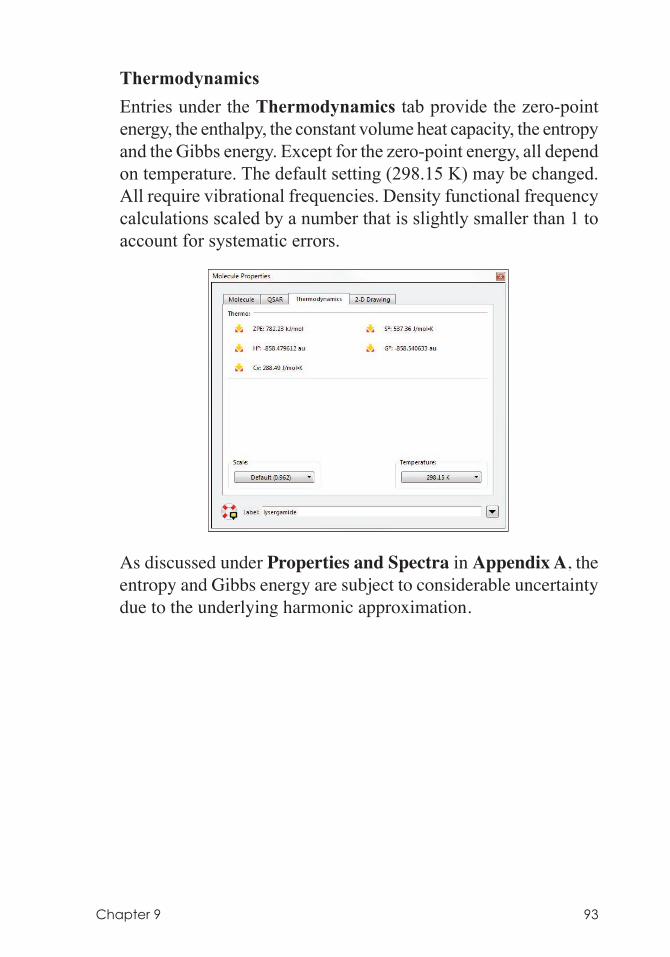
Chapter 9 93
Thermodynamics Entries under the Thermodynamics tab provide the zero-point
energy, the enthalpy, the constant volume heat capacity, the entropy and the Gibbs energy. Except for the zero-point energy, all depend on temperature. The default setting (298.15 K) may be changed. All require vibrational frequencies. Density functional frequency calculations scaled by a number that is slightly smaller than 1 to account for systematic errors.
As discussed under Properties and Spectra in Appendix A, the
entropy and Gibbs energy are subject to considerable uncertainty due to the underlying harmonic approximation.
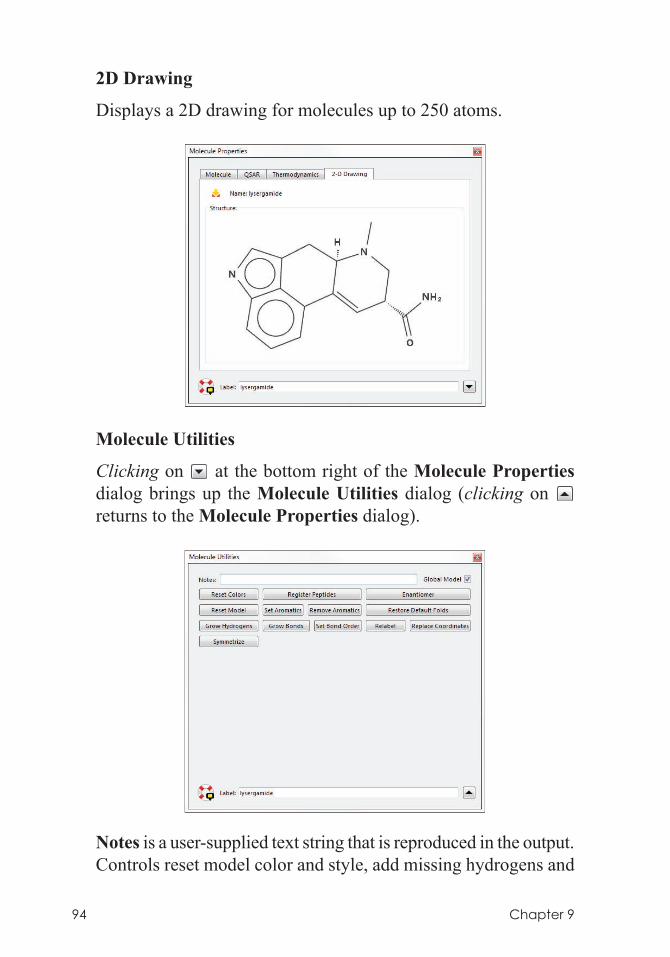
94 Chapter 9
2D Drawing
Displays a 2D drawing for molecules up to 250 atoms.
Molecule Utilities
Clicking on at the bottom right of the Molecule Properties dialog brings up the Molecule Utilities dialog (clicking on returns to the Molecule Properties dialog).
Notes is a user-supplied text string that is reproduced in the output.
Controls reset model color and style, add missing hydrogens and
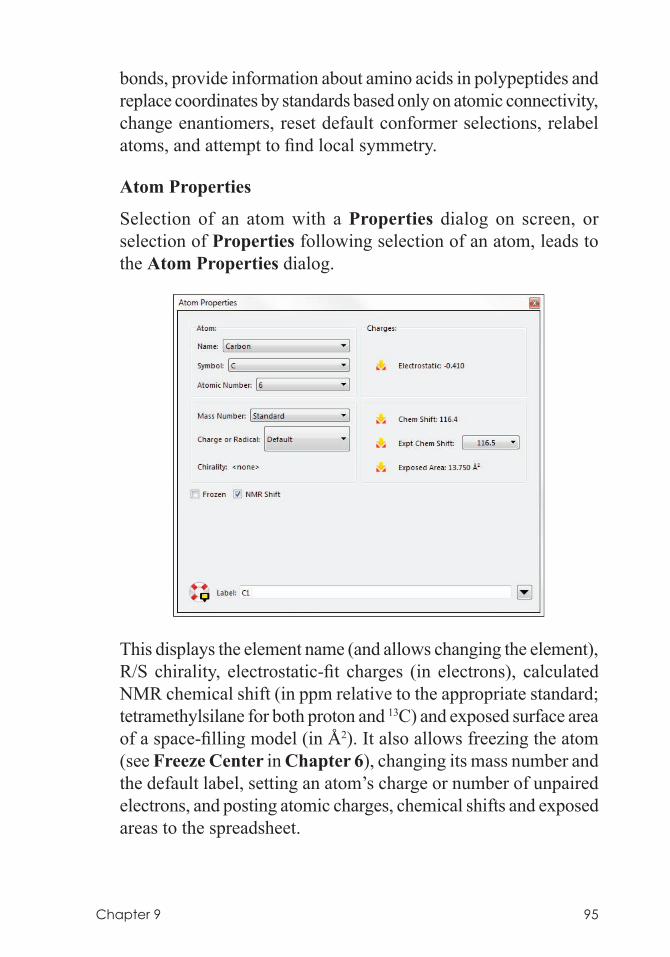
Chapter 9 95
bonds, provide information about amino acids in polypeptides and replace coordinates by standards based only on atomic connectivity, change enantiomers, reset default conformer selections, relabel atoms, and attempt to find local symmetry.
Atom Properties
Selection of an atom with a Properties dialog on screen, or selection of Properties following selection of an atom, leads to the Atom Properties dialog.
This displays the element name (and allows changing the element), R/S chirality, electrostatic-fit charges (in electrons), calculated NMR chemical shift (in ppm relative to the appropriate standard; tetramethylsilane for both proton and 13C) and exposed surface area of a space-filling model (in Å2). It also allows freezing the atom (see Freeze Center in Chapter 6), changing its mass number and the default label, setting an atom’s charge or number of unpaired electrons, and posting atomic charges, chemical shifts and exposed areas to the spreadsheet.
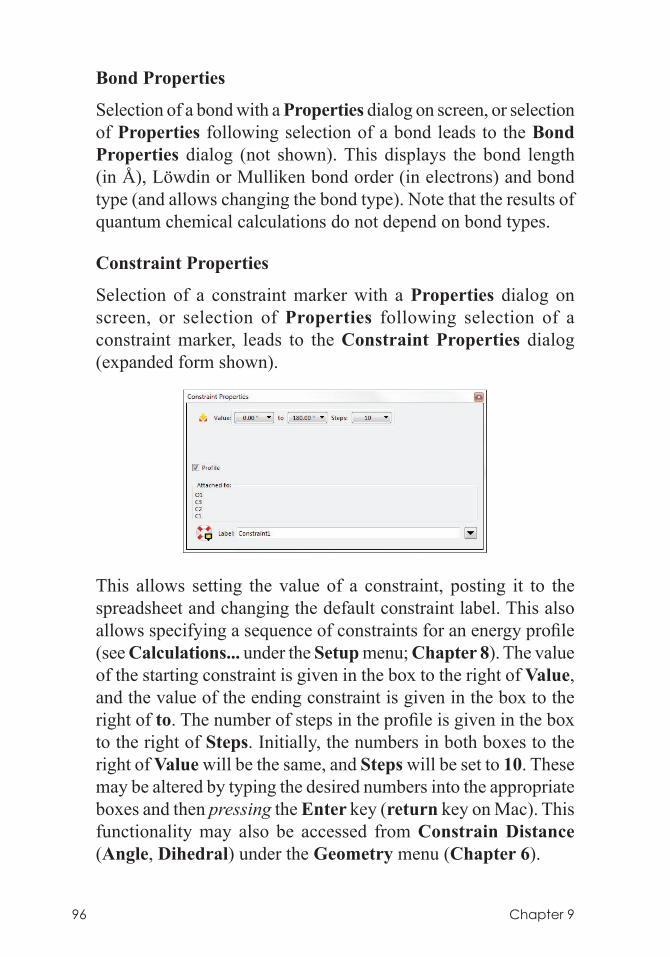
96 Chapter 9
Bond Properties
Selection of a bond with a Properties dialog on screen, or selection of Properties following selection of a bond leads to the Bond Properties dialog (not shown). This displays the bond length (in Å), Löwdin or Mulliken bond order (in electrons) and bond type (and allows changing the bond type). Note that the results of quantum chemical calculations do not depend on bond types.
Constraint Properties
Selection of a constraint marker with a Properties dialog on screen, or selection of Properties following selection of a constraint marker, leads to the Constraint Properties dialog (expanded form shown).
This allows setting the value of a constraint, posting it to the spreadsheet and changing the default constraint label. This also allows specifying a sequence of constraints for an energy profile (see Calculations... under the Setup menu; Chapter 8). The value of the starting constraint is given in the box to the right of Value, and the value of the ending constraint is given in the box to the right of to. The number of steps in the profile is given in the box to the right of Steps. Initially, the numbers in both boxes to the right of Value will be the same, and Steps will be set to 10. These may be altered by typing the desired numbers into the appropriate boxes and then pressing the Enter key (return key on Mac). This functionality may also be accessed from Constrain Distance (Angle, Dihedral) under the Geometry menu (Chapter 6).
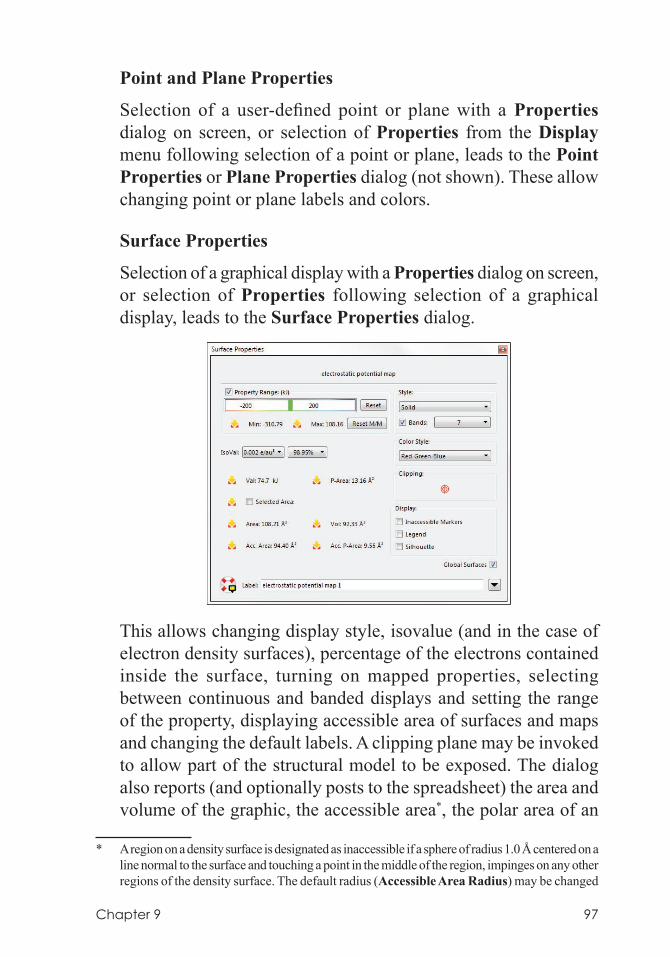
Chapter 9 97
Point and Plane Properties
Selection of a user-defined point or plane with a Properties dialog on screen, or selection of Properties from the Display menu following selection of a point or plane, leads to the Point Properties or Plane Properties dialog (not shown). These allow changing point or plane labels and colors.
Surface Properties
Selection of a graphical display with a Properties dialog on screen, or selection of Properties following selection of a graphical display, leads to the Surface Properties dialog.
This allows changing display style, isovalue (and in the case of electron density surfaces), percentage of the electrons contained inside the surface, turning on mapped properties, selecting between continuous and banded displays and setting the range of the property, displaying accessible area of surfaces and maps and changing the default labels. A clipping plane may be invoked to allow part of the structural model to be exposed. The dialog also reports (and optionally posts to the spreadsheet) the area and volume of the graphic, the accessible area*, the polar area of an
* A region on a density surface is designated as inaccessible if a sphere of radius 1.0 Å centered on a line normal to the surface and touching a point in the middle of the region, impinges on any other regions of the density surface. The default radius (Accessible Area Radius) may be changed
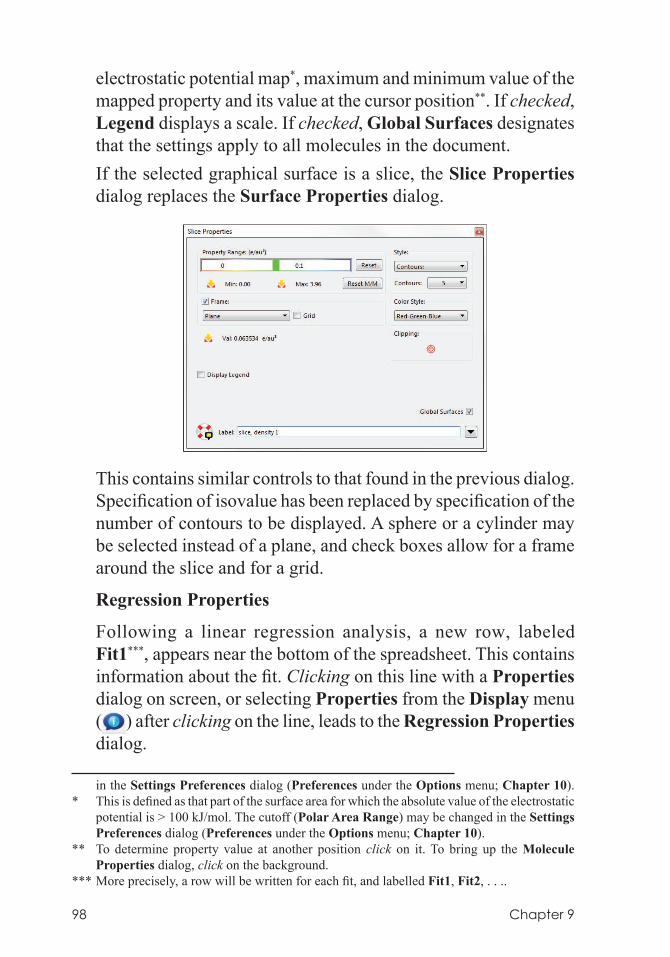
98 Chapter 9
electrostatic potential map*, maximum and minimum value of the mapped property and its value at the cursor position**. If checked, Legend displays a scale. If checked, Global Surfaces designates that the settings apply to all molecules in the document.If the selected graphical surface is a slice, the Slice Properties dialog replaces the Surface Properties dialog.
This contains similar controls to that found in the previous dialog. Specification of isovalue has been replaced by specification of the number of contours to be displayed. A sphere or a cylinder may be selected instead of a plane, and check boxes allow for a frame around the slice and for a grid.
Regression Properties
Following a linear regression analysis, a new row, labeled Fit1***, appears near the bottom of the spreadsheet. This contains information about the fit. Clicking on this line with a Properties dialog on screen, or selecting Properties from the Display menu ( ) after clicking on the line, leads to the Regression Properties dialog.
in the Settings Preferences dialog (Preferences under the Options menu; Chapter 10).* This is defined as that part of the surface area for which the absolute value of the electrostatic
potential is > 100 kJ/mol. The cutoff (Polar Area Range) may be changed in the Settings Preferences dialog (Preferences under the Options menu; Chapter 10).
** To determine property value at another position click on it. To bring up the Molecule Properties dialog, click on the background.
*** More precisely, a row will be written for each fit, and labelled Fit1, Fit2, . . ..
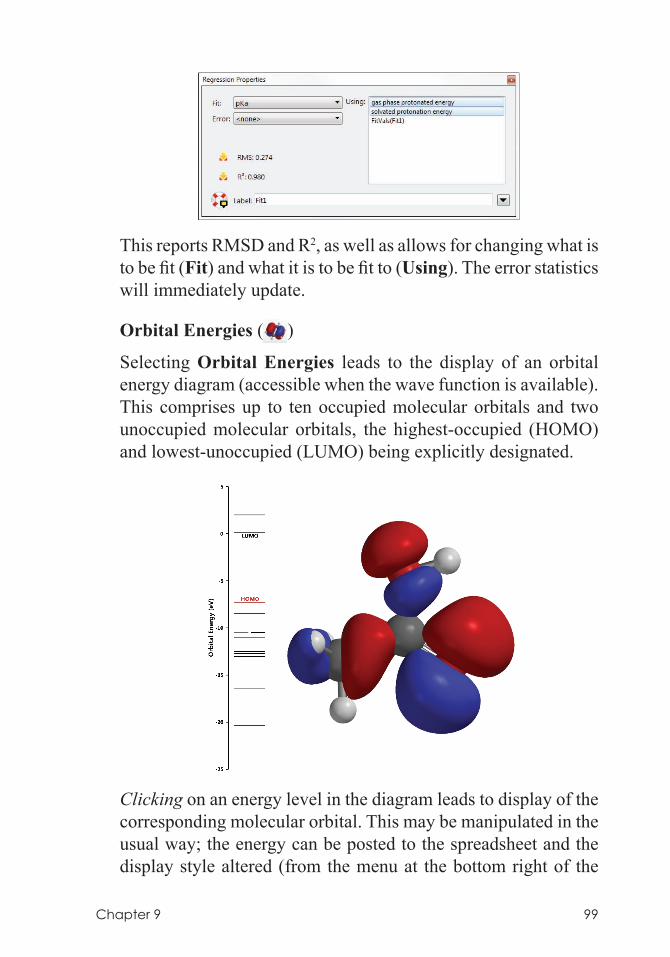
Chapter 9 99
This reports RMSD and R2, as well as allows for changing what is to be fit (Fit) and what it is to be fit to (Using). The error statistics will immediately update.
Orbital Energies ( )
Selecting Orbital Energies leads to the display of an orbital energy diagram (accessible when the wave function is available). This comprises up to ten occupied molecular orbitals and two unoccupied molecular orbitals, the highest-occupied (HOMO) and lowest-unoccupied (LUMO) being explicitly designated.
Clicking on an energy level in the diagram leads to display of the
corresponding molecular orbital. This may be manipulated in the usual way; the energy can be posted to the spreadsheet and the display style altered (from the menu at the bottom right of the
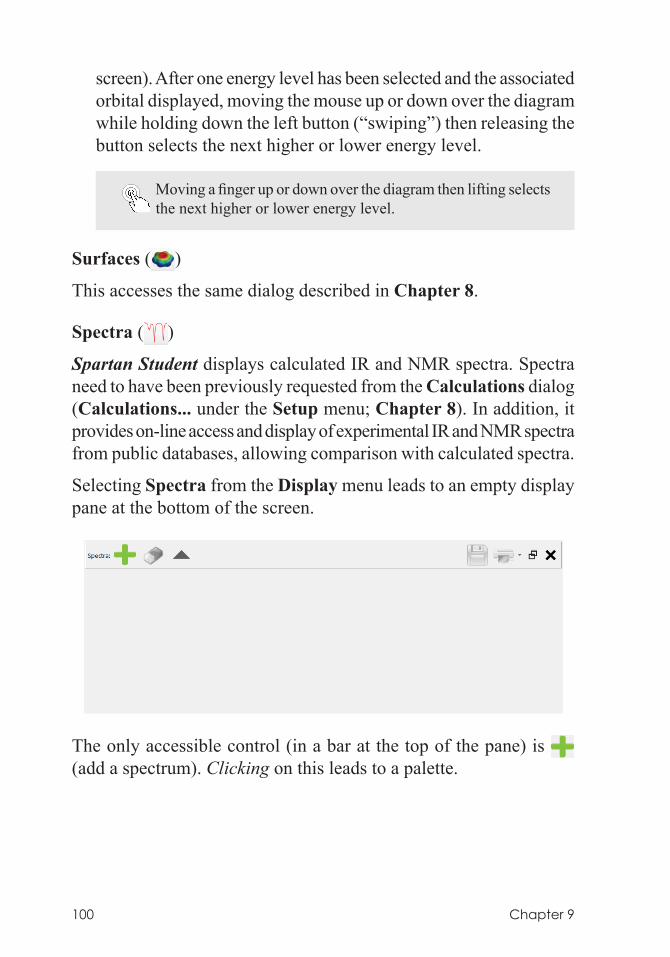
100 Chapter 9
screen). After one energy level has been selected and the associated orbital displayed, moving the mouse up or down over the diagram while holding down the left button (“swiping”) then releasing the button selects the next higher or lower energy level.
Moving a finger up or down over the diagram then lifting selects the next higher or lower energy level.
Surfaces ( )
This accesses the same dialog described in Chapter 8.
Spectra ( )
Spartan Student displays calculated IR and NMR spectra. Spectra need to have been previously requested from the Calculations dialog (Calculations... under the Setup menu; Chapter 8). In addition, it provides on-line access and display of experimental IR and NMR spectra from public databases, allowing comparison with calculated spectra.
Selecting Spectra from the Display menu leads to an empty display pane at the bottom of the screen.
The only accessible control (in a bar at the top of the pane) is (add a spectrum). Clicking on this leads to a palette.
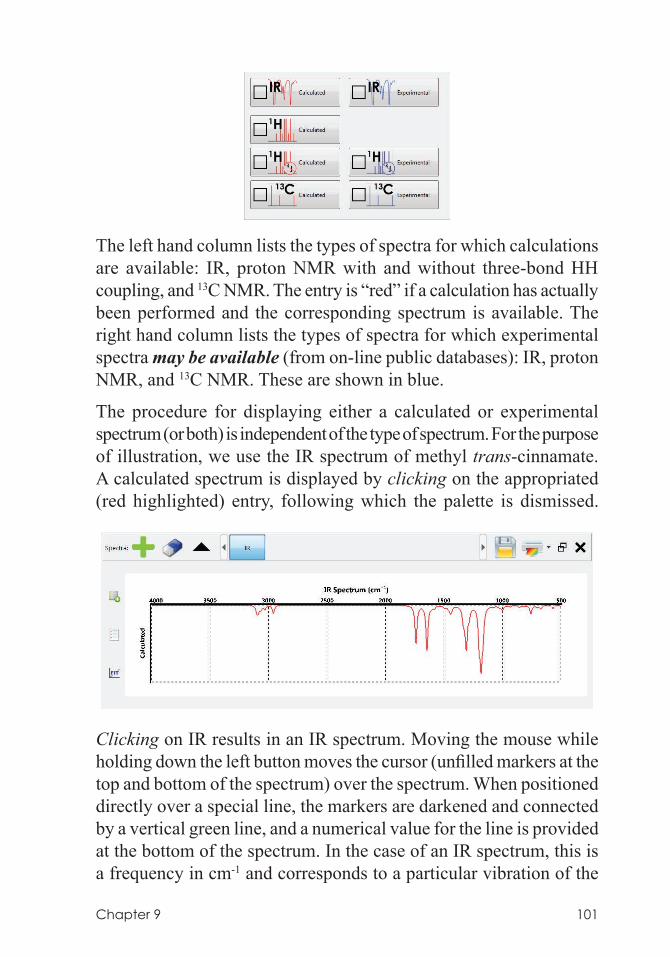
Chapter 9 101
The left hand column lists the types of spectra for which calculations are available: IR, proton NMR with and without three-bond HH coupling, and 13C NMR. The entry is “red” if a calculation has actually been performed and the corresponding spectrum is available. The right hand column lists the types of spectra for which experimental spectra may be available (from on-line public databases): IR, proton NMR, and 13C NMR. These are shown in blue.
The procedure for displaying either a calculated or experimental spectrum (or both) is independent of the type of spectrum. For the purpose of illustration, we use the IR spectrum of methyl trans-cinnamate. A calculated spectrum is displayed by clicking on the appropriated (red highlighted) entry, following which the palette is dismissed.
Clicking on IR results in an IR spectrum. Moving the mouse while holding down the left button moves the cursor (unfilled markers at the top and bottom of the spectrum) over the spectrum. When positioned directly over a special line, the markers are darkened and connected by a vertical green line, and a numerical value for the line is provided at the bottom of the spectrum. In the case of an IR spectrum, this is a frequency in cm-1 and corresponds to a particular vibration of the
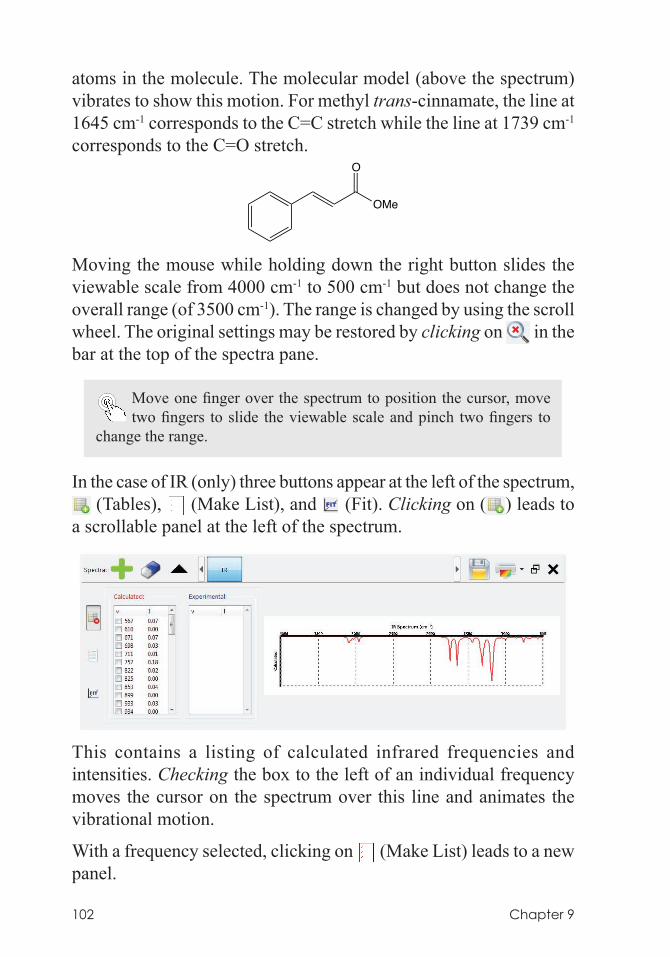
102 Chapter 9
atoms in the molecule. The molecular model (above the spectrum) vibrates to show this motion. For methyl trans-cinnamate, the line at 1645 cm-1 corresponds to the C=C stretch while the line at 1739 cm-1 corresponds to the C=O stretch.
OMe
O
Moving the mouse while holding down the right button slides the viewable scale from 4000 cm-1 to 500 cm-1 but does not change the overall range (of 3500 cm-1). The range is changed by using the scroll wheel. The original settings may be restored by clicking on in the bar at the top of the spectra pane.
Move one finger over the spectrum to position the cursor, move two fingers to slide the viewable scale and pinch two fingers to
change the range.
In the case of IR (only) three buttons appear at the left of the spectrum, (Tables), (Make List), and (Fit). Clicking on ( ) leads to
a scrollable panel at the left of the spectrum.
This contains a listing of calculated infrared frequencies and intensities. Checking the box to the left of an individual frequency moves the cursor on the spectrum over this line and animates the vibrational motion.
With a frequency selected, clicking on (Make List) leads to a new panel.
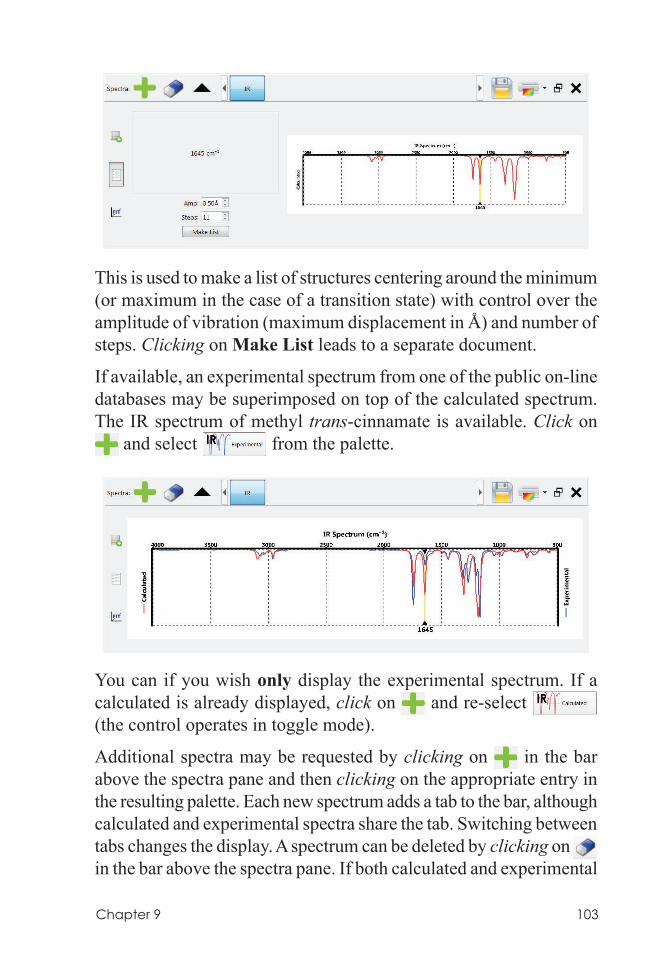
Chapter 9 103
This is used to make a list of structures centering around the minimum (or maximum in the case of a transition state) with control over the amplitude of vibration (maximum displacement in Å) and number of steps. Clicking on Make List leads to a separate document.
If available, an experimental spectrum from one of the public on-line databases may be superimposed on top of the calculated spectrum. The IR spectrum of methyl trans-cinnamate is available. Click on
and select from the palette.
You can if you wish only display the experimental spectrum. If a calculated is already displayed, click on and re-select (the control operates in toggle mode).
Additional spectra may be requested by clicking on in the bar above the spectra pane and then clicking on the appropriate entry in the resulting palette. Each new spectrum adds a tab to the bar, although calculated and experimental spectra share the tab. Switching between tabs changes the display. A spectrum can be deleted by clicking on in the bar above the spectra pane. If both calculated and experimental
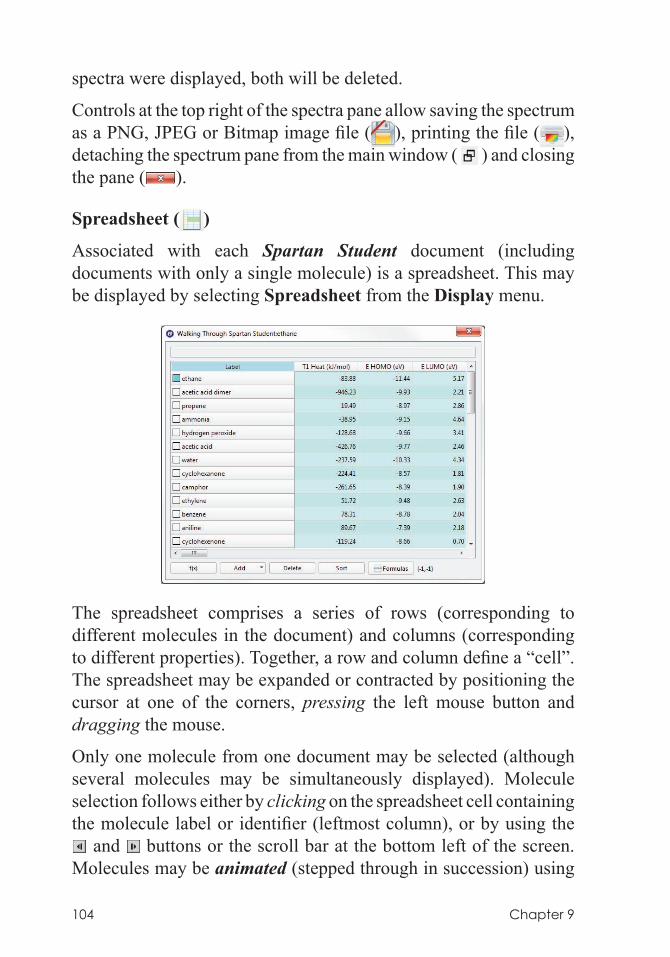
104 Chapter 9
spectra were displayed, both will be deleted.
Controls at the top right of the spectra pane allow saving the spectrum as a PNG, JPEG or Bitmap image file ( ), printing the file ( ), detaching the spectrum pane from the main window ( ) and closing the pane ( ).
Spreadsheet ( )
Associated with each Spartan Student document (including documents with only a single molecule) is a spreadsheet. This may be displayed by selecting Spreadsheet from the Display menu.
The spreadsheet comprises a series of rows (corresponding to different molecules in the document) and columns (corresponding to different properties). Together, a row and column define a “cell”. The spreadsheet may be expanded or contracted by positioning the cursor at one of the corners, pressing the left mouse button and dragging the mouse.
Only one molecule from one document may be selected (although several molecules may be simultaneously displayed). Molecule selection follows either by clicking on the spreadsheet cell containing the molecule label or identifier (leftmost column), or by using the
and buttons or the scroll bar at the bottom left of the screen. Molecules may be animated (stepped through in succession) using
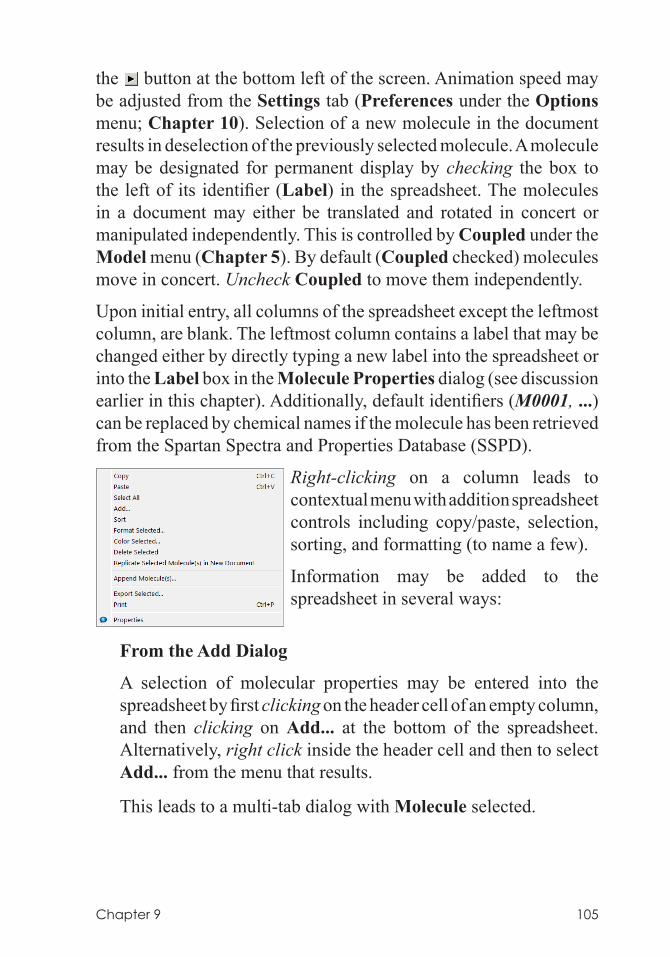
Chapter 9 105
the button at the bottom left of the screen. Animation speed may be adjusted from the Settings tab (Preferences under the Options menu; Chapter 10). Selection of a new molecule in the document results in deselection of the previously selected molecule. A molecule may be designated for permanent display by checking the box to the left of its identifier (Label) in the spreadsheet. The molecules in a document may either be translated and rotated in concert or manipulated independently. This is controlled by Coupled under the Model menu (Chapter 5). By default (Coupled checked) molecules move in concert. Uncheck Coupled to move them independently.
Upon initial entry, all columns of the spreadsheet except the leftmost column, are blank. The leftmost column contains a label that may be changed either by directly typing a new label into the spreadsheet or into the Label box in the Molecule Properties dialog (see discussion earlier in this chapter). Additionally, default identifiers (M0001, ...) can be replaced by chemical names if the molecule has been retrieved from the Spartan Spectra and Properties Database (SSPD).
Right-clicking on a column leads to contextual menu with addition spreadsheet controls including copy/paste, selection, sorting, and formatting (to name a few).
Information may be added to the spreadsheet in several ways:
From the Add Dialog
A selection of molecular properties may be entered into the spreadsheet by first clicking on the header cell of an empty column, and then clicking on Add... at the bottom of the spreadsheet. Alternatively, right click inside the header cell and then to select Add... from the menu that results.
This leads to a multi-tab dialog with Molecule selected.
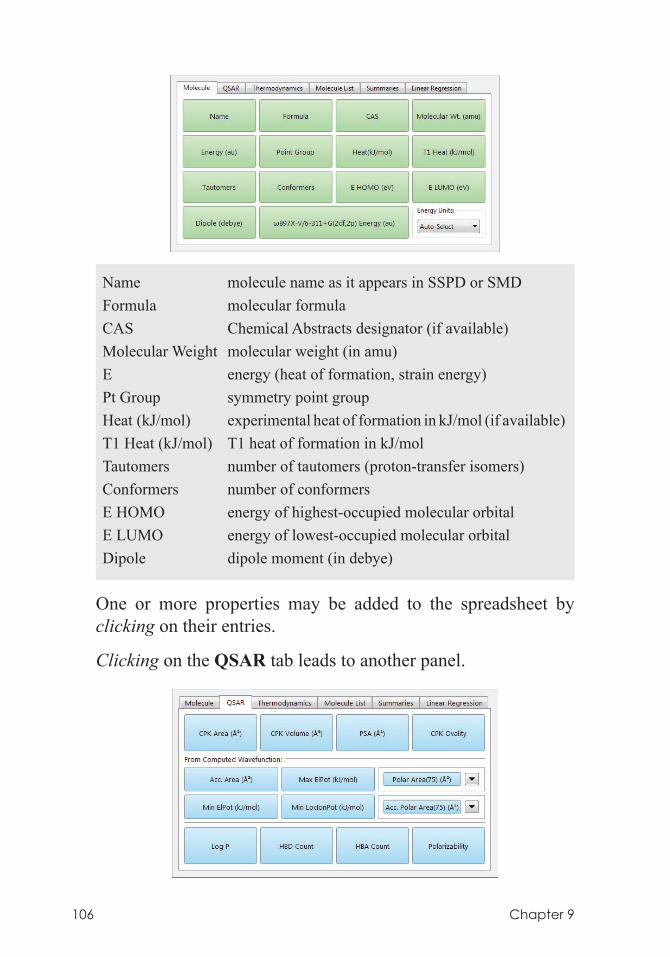
106 Chapter 9
Name molecule name as it appears in SSPD or SMDFormula molecular formulaCAS Chemical Abstracts designator (if available)Molecular Weight molecular weight (in amu)E energy (heat of formation, strain energy)Pt Group symmetry point groupHeat (kJ/mol) experimental heat of formation in kJ/mol (if available)T1 Heat (kJ/mol) T1 heat of formation in kJ/molTautomers number of tautomers (proton-transfer isomers)Conformers number of conformersE HOMO energy of highest-occupied molecular orbitalE LUMO energy of lowest-occupied molecular orbitalDipole dipole moment (in debye)
One or more properties may be added to the spreadsheet by clicking on their entries.
Clicking on the QSAR tab leads to another panel.
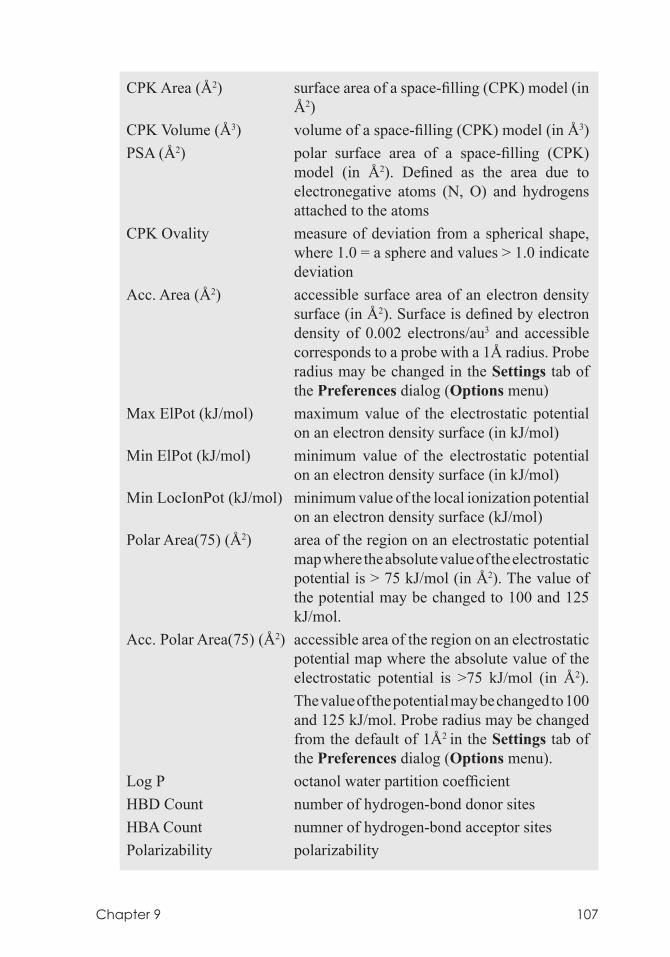
Chapter 9 107
CPK Area (Å2) surface area of a space-filling (CPK) model (in Å2)
CPK Volume (Å3) volume of a space-filling (CPK) model (in Å3)PSA (Å2) polar surface area of a space-filling (CPK)
model (in Å2). Defined as the area due to electronegative atoms (N, O) and hydrogens attached to the atoms
CPK Ovality measure of deviation from a spherical shape, where 1.0 = a sphere and values > 1.0 indicate deviation
Acc. Area (Å2) accessible surface area of an electron density surface (in Å2). Surface is defined by electron density of 0.002 electrons/au3 and accessible corresponds to a probe with a 1Å radius. Probe radius may be changed in the Settings tab of the Preferences dialog (Options menu)
Max ElPot (kJ/mol) maximum value of the electrostatic potential on an electron density surface (in kJ/mol)
Min ElPot (kJ/mol) minimum value of the electrostatic potential on an electron density surface (in kJ/mol)
Min LocIonPot (kJ/mol) minimum value of the local ionization potential on an electron density surface (kJ/mol)
Polar Area(75) (Å2) area of the region on an electrostatic potential map where the absolute value of the electrostatic potential is > 75 kJ/mol (in Å2). The value of the potential may be changed to 100 and 125 kJ/mol.
Acc. Polar Area(75) (Å2) accessible area of the region on an electrostatic potential map where the absolute value of the electrostatic potential is >75 kJ/mol (in Å2).
The value of the potential may be changed to 100 and 125 kJ/mol. Probe radius may be changed from the default of 1Å2 in the Settings tab of the Preferences dialog (Options menu).
Log P octanol water partition coefficientHBD Count number of hydrogen-bond donor sitesHBA Count numner of hydrogen-bond acceptor sitesPolarizability polarizability
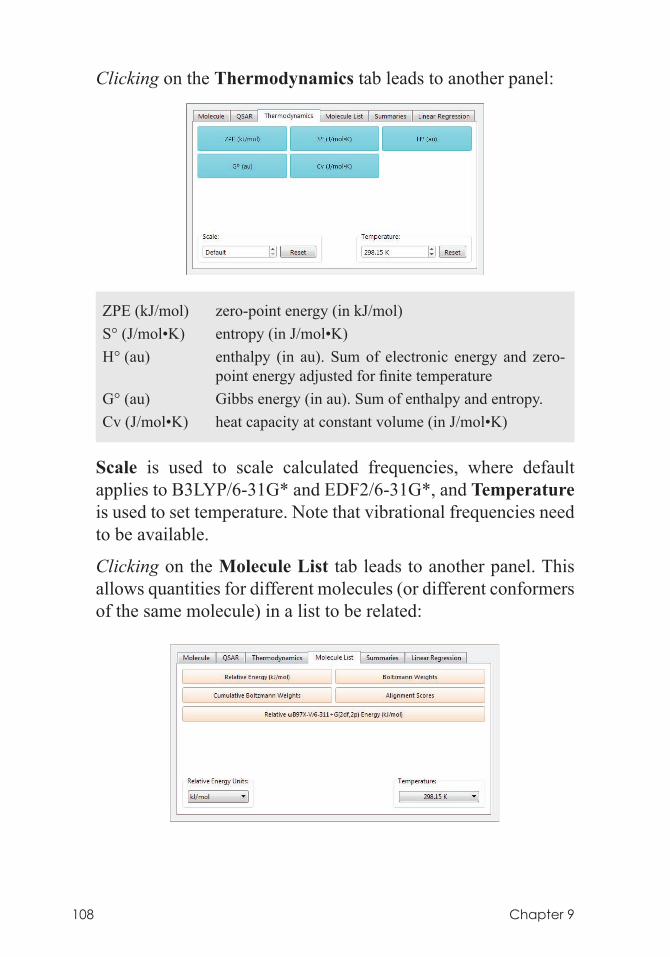
108 Chapter 9
Clicking on the Thermodynamics tab leads to another panel:
ZPE (kJ/mol) zero-point energy (in kJ/mol)S° (J/mol•K) entropy (in J/mol•K)H° (au) enthalpy (in au). Sum of electronic energy and zero-
point energy adjusted for finite temperatureG° (au) Gibbs energy (in au). Sum of enthalpy and entropy.Cv (J/mol•K) heat capacity at constant volume (in J/mol•K)
Scale is used to scale calculated frequencies, where default applies to B3LYP/6-31G* and EDF2/6-31G*, and Temperature is used to set temperature. Note that vibrational frequencies need to be available.
Clicking on the Molecule List tab leads to another panel. This allows quantities for different molecules (or different conformers of the same molecule) in a list to be related:
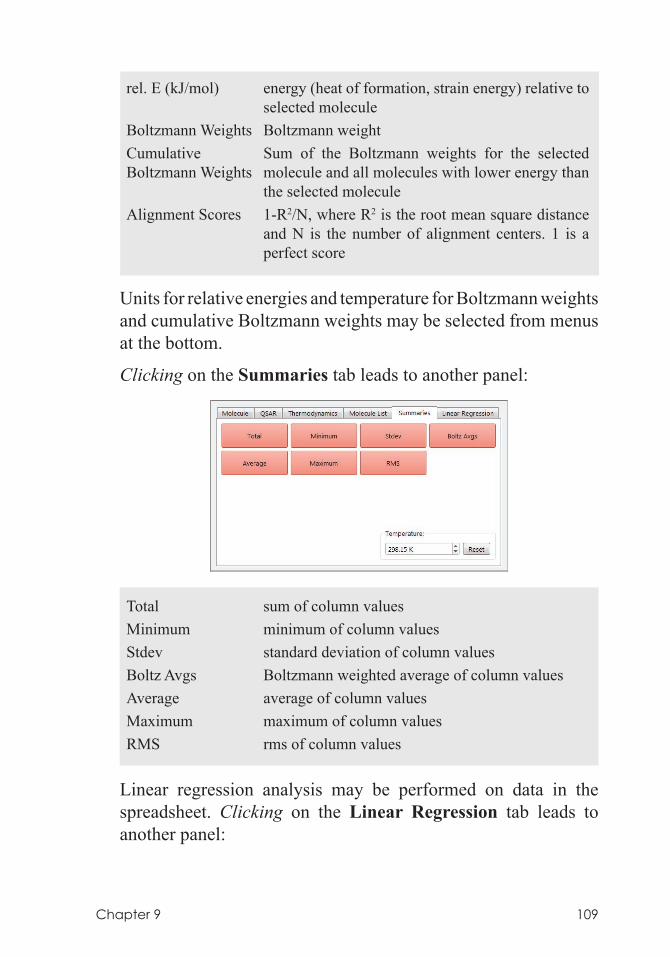
Chapter 9 109
rel. E (kJ/mol) energy (heat of formation, strain energy) relative to selected molecule
Boltzmann Weights Boltzmann weightCumulative Sum of the Boltzmann weights for the selectedBoltzmann Weights molecule and all molecules with lower energy than
the selected moleculeAlignment Scores 1-R2/N, where R2 is the root mean square distance
and N is the number of alignment centers. 1 is a perfect score
Units for relative energies and temperature for Boltzmann weights and cumulative Boltzmann weights may be selected from menus at the bottom.
Clicking on the Summaries tab leads to another panel:
Total sum of column valuesMinimum minimum of column valuesStdev standard deviation of column valuesBoltz Avgs Boltzmann weighted average of column valuesAverage average of column valuesMaximum maximum of column valuesRMS rms of column values
Linear regression analysis may be performed on data in the spreadsheet. Clicking on the Linear Regression tab leads to another panel:
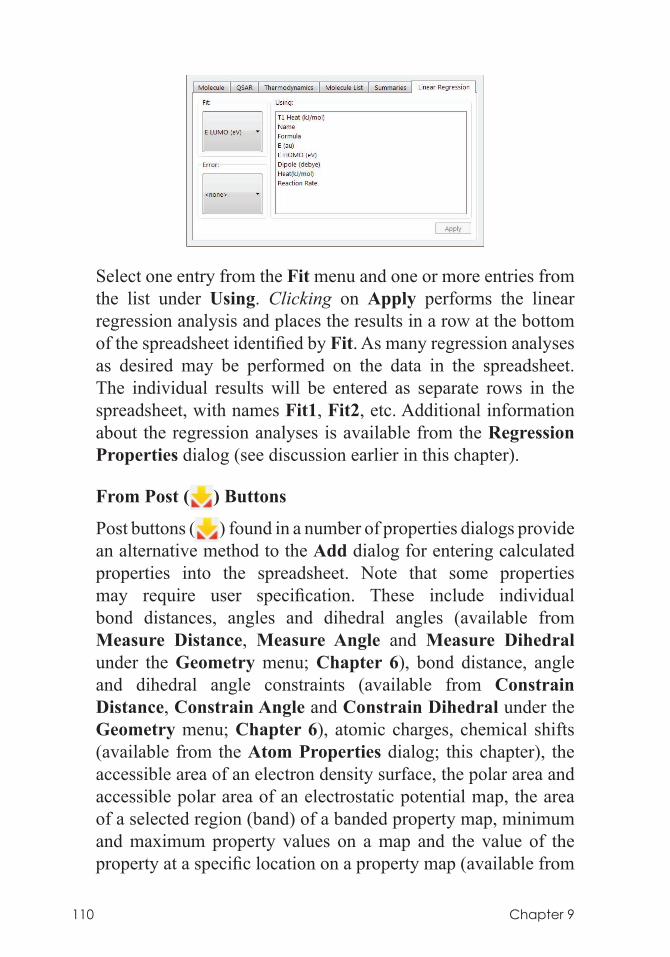
110 Chapter 9
Select one entry from the Fit menu and one or more entries from the list under Using. Clicking on Apply performs the linear regression analysis and places the results in a row at the bottom of the spreadsheet identified by Fit. As many regression analyses as desired may be performed on the data in the spreadsheet. The individual results will be entered as separate rows in the spreadsheet, with names Fit1, Fit2, etc. Additional information about the regression analyses is available from the Regression Properties dialog (see discussion earlier in this chapter).
From Post ( ) Buttons
Post buttons ( ) found in a number of properties dialogs provide an alternative method to the Add dialog for entering calculated properties into the spreadsheet. Note that some properties may require user specification. These include individual bond distances, angles and dihedral angles (available from Measure Distance, Measure Angle and Measure Dihedral under the Geometry menu; Chapter 6), bond distance, angle and dihedral angle constraints (available from Constrain Distance, Constrain Angle and Constrain Dihedral under the Geometry menu; Chapter 6), atomic charges, chemical shifts (available from the Atom Properties dialog; this chapter), the accessible area of an electron density surface, the polar area and accessible polar area of an electrostatic potential map, the area of a selected region (band) of a banded property map, minimum and maximum property values on a map and the value of the property at a specific location on a property map (available from
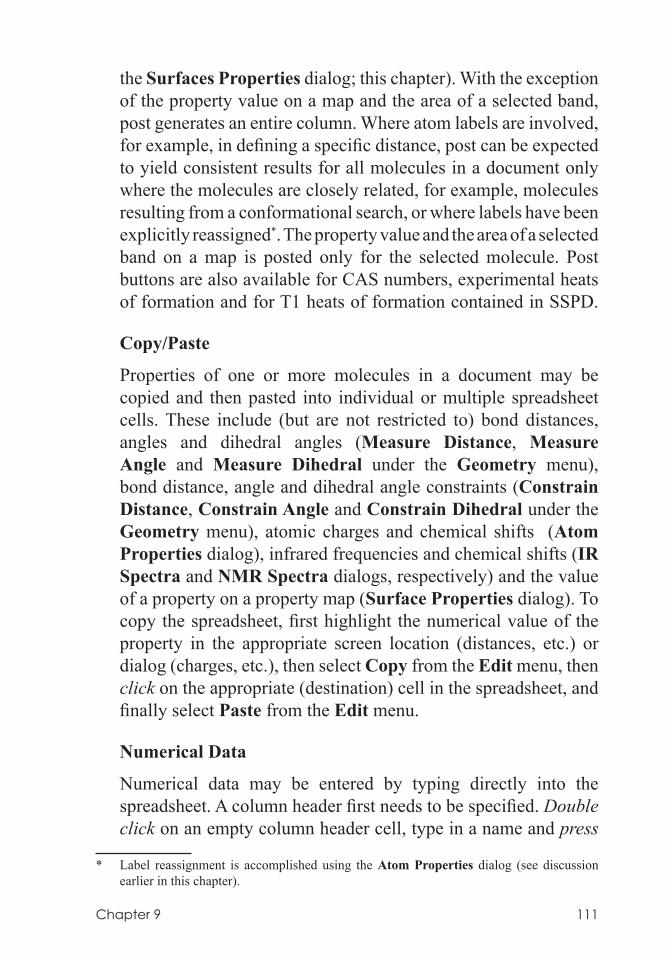
Chapter 9 111
the Surfaces Properties dialog; this chapter). With the exception of the property value on a map and the area of a selected band, post generates an entire column. Where atom labels are involved, for example, in defining a specific distance, post can be expected to yield consistent results for all molecules in a document only where the molecules are closely related, for example, molecules resulting from a conformational search, or where labels have been explicitly reassigned*. The property value and the area of a selected band on a map is posted only for the selected molecule. Post buttons are also available for CAS numbers, experimental heats of formation and for T1 heats of formation contained in SSPD.
Copy/Paste
Properties of one or more molecules in a document may be copied and then pasted into individual or multiple spreadsheet cells. These include (but are not restricted to) bond distances, angles and dihedral angles (Measure Distance, Measure Angle and Measure Dihedral under the Geometry menu), bond distance, angle and dihedral angle constraints (Constrain Distance, Constrain Angle and Constrain Dihedral under the Geometry menu), atomic charges and chemical shifts (Atom Properties dialog), infrared frequencies and chemical shifts (IR Spectra and NMR Spectra dialogs, respectively) and the value of a property on a property map (Surface Properties dialog). To copy the spreadsheet, first highlight the numerical value of the property in the appropriate screen location (distances, etc.) or dialog (charges, etc.), then select Copy from the Edit menu, then click on the appropriate (destination) cell in the spreadsheet, and finally select Paste from the Edit menu.
Numerical Data
Numerical data may be entered by typing directly into the spreadsheet. A column header first needs to be specified. Double click on an empty column header cell, type in a name and press
* Label reassignment is accomplished using the Atom Properties dialog (see discussion earlier in this chapter).
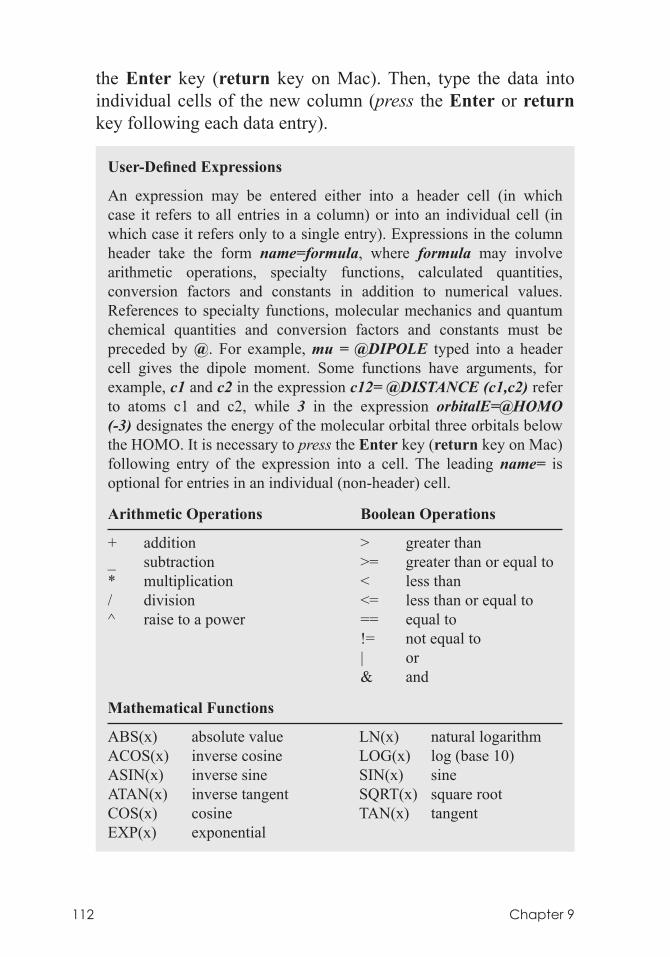
112 Chapter 9
the Enter key (return key on Mac). Then, type the data into individual cells of the new column (press the Enter or return key following each data entry).
User-Defined Expressions
An expression may be entered either into a header cell (in which case it refers to all entries in a column) or into an individual cell (in which case it refers only to a single entry). Expressions in the column header take the form name=formula, where formula may involve arithmetic operations, specialty functions, calculated quantities, conversion factors and constants in addition to numerical values. References to specialty functions, molecular mechanics and quantum chemical quantities and conversion factors and constants must be preceded by @. For example, mu = @DIPOLE typed into a header cell gives the dipole moment. Some functions have arguments, for example, c1 and c2 in the expression c12= @DISTANCE (c1,c2) refer to atoms c1 and c2, while 3 in the expression orbitalE=@HOMO (-3) designates the energy of the molecular orbital three orbitals below the HOMO. It is necessary to press the Enter key (return key on Mac) following entry of the expression into a cell. The leading name= is optional for entries in an individual (non-header) cell.
Arithmetic Operations Boolean Operations
+ addition > greater than_ subtraction >= greater than or equal to* multiplication < less than/ division <= less than or equal to^ raise to a power == equal to != not equal to | or & and
Mathematical Functions
ABS(x) absolute value LN(x) natural logarithmACOS(x) inverse cosine LOG(x) log (base 10)ASIN(x) inverse sine SIN(x) sineATAN(x) inverse tangent SQRT(x) square rootCOS(x) cosine TAN(x) tangentEXP(x) exponential
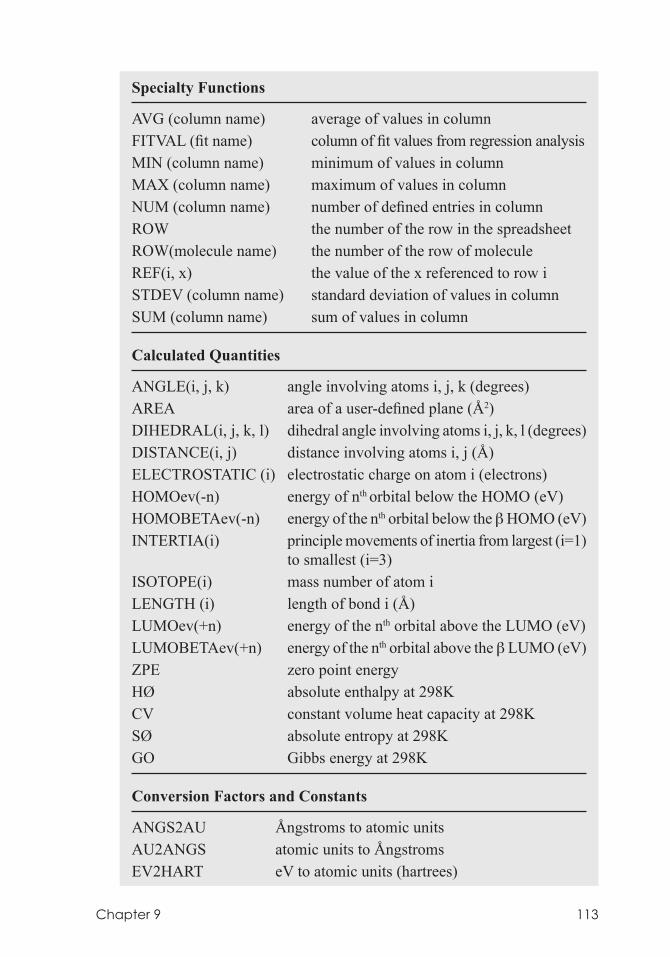
Chapter 9 113
Specialty Functions
AVG (column name) average of values in columnFITVAL (fit name) column of fit values from regression analysisMIN (column name) minimum of values in columnMAX (column name) maximum of values in columnNUM (column name) number of defined entries in columnROW the number of the row in the spreadsheetROW(molecule name) the number of the row of moleculeREF(i, x) the value of the x referenced to row iSTDEV (column name) standard deviation of values in columnSUM (column name) sum of values in column
Calculated Quantities
ANGLE(i, j, k) angle involving atoms i, j, k (degrees)AREA area of a user-defined plane (Å2)DIHEDRAL(i, j, k, l) dihedral angle involving atoms i, j, k, l (degrees)DISTANCE(i, j) distance involving atoms i, j (Å)ELECTROSTATIC (i) electrostatic charge on atom i (electrons)HOMOev(-n) energy of nth orbital below the HOMO (eV)HOMOBETAev(-n) energy of the nth orbital below the β HOMO (eV)INTERTIA(i) principle movements of inertia from largest (i=1)
to smallest (i=3) ISOTOPE(i) mass number of atom iLENGTH (i) length of bond i (Å)LUMOev(+n) energy of the nth orbital above the LUMO (eV)LUMOBETAev(+n) energy of the nth orbital above the β LUMO (eV)ZPE zero point energyHØ absolute enthalpy at 298KCV constant volume heat capacity at 298KSØ absolute entropy at 298KGO Gibbs energy at 298K
Conversion Factors and Constants
ANGS2AU Ångstroms to atomic unitsAU2ANGS atomic units to ÅngstromsEV2HART eV to atomic units (hartrees)
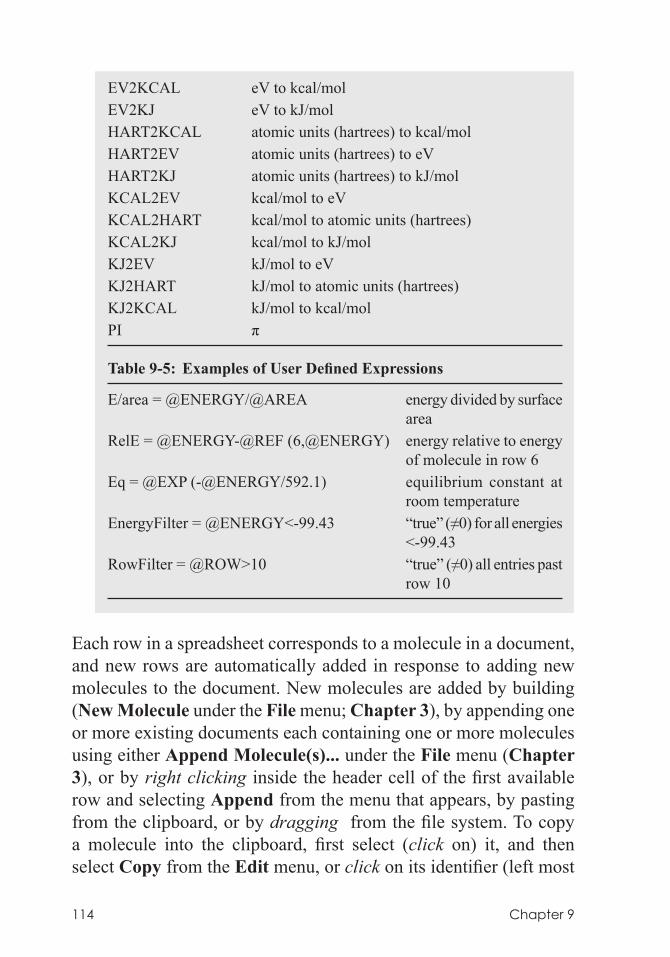
114 Chapter 9
EV2KCAL eV to kcal/molEV2KJ eV to kJ/molHART2KCAL atomic units (hartrees) to kcal/molHART2EV atomic units (hartrees) to eVHART2KJ atomic units (hartrees) to kJ/molKCAL2EV kcal/mol to eVKCAL2HART kcal/mol to atomic units (hartrees)KCAL2KJ kcal/mol to kJ/molKJ2EV kJ/mol to eVKJ2HART kJ/mol to atomic units (hartrees)KJ2KCAL kJ/mol to kcal/molPI π
Table 9-5: Examples of User Defined Expressions
E/area = @ENERGY/@AREA energy divided by surface area
RelE = @ENERGY-@REF (6,@ENERGY) energy relative to energy of molecule in row 6
Eq = @EXP (-@ENERGY/592.1) equilibrium constant at room temperature
EnergyFilter = @ENERGY<-99.43 “true” (≠0) for all energies <-99.43
RowFilter = @ROW>10 “true” (≠0) all entries past row 10
Each row in a spreadsheet corresponds to a molecule in a document, and new rows are automatically added in response to adding new molecules to the document. New molecules are added by building (New Molecule under the File menu; Chapter 3), by appending one or more existing documents each containing one or more molecules using either Append Molecule(s)... under the File menu (Chapter 3), or by right clicking inside the header cell of the first available row and selecting Append from the menu that appears, by pasting from the clipboard, or by dragging from the file system. To copy a molecule into the clipboard, first select (click on) it, and then select Copy from the Edit menu, or click on its identifier (left most
Chapter 9 115
column) in its spreadsheet, and then select Copy from the Edit menu. Alternatively right click either on the molecule or on its identifier in the spreadsheet and select Copy from the menu that appears. Use of the clipboard permits several molecules to be selected (and copied) at once using the Shift and Ctrl keys in the usual manner. To copy the contents of the clipboard to its destination, click on an empty row header in the spreadsheet (for the destination document), and then select Paste from the Edit menu. An alternative to the two-step Copy-Paste procedure is to drag the molecule or set of molecules from one spreadsheet to another.
A row (molecule) may be deleted from a spreadsheet, either by first selecting the molecule and then selecting Delete Molecule from the File menu, or by first clicking on its identifier in the spreadsheet (leftmost column) and then either clicking on the Delete button at the bottom of the spreadsheet, or by right clicking on its identifier in the spreadsheet and then selecting Delete Selected from the menu that appears. In all cases, a warning is provided prior to deletion. An entire column in the spreadsheet may be deleted by first clicking inside its header cell and then clicking on the Delete button (or Delete Selected from the menu).
Rows in the spreadsheet may be sorted according to the numerical values in any column either by first clicking inside the header cell and then clicking on the Sort button at the bottom of the spreadsheet or by right clicking inside the header cell and selecting Sort from the menu that appears. The rows are placed in ascending order, the smallest (least positive) value of the selected property at the top, largest (most positive) value at the bottom. To sort in descending order, hold down the Shift key before clicking on the Sort button or selecting Sort from the menu.
Information in one or more columns of the spreadsheet may be formatted by right clicking inside the header cell(s) and selecting Format Selected from the menu that appears.
Format as desired and click on OK to remove the dialog. The full contents of the spreadsheet may be formatted by right clicking inside the header cell for the left most column and then selecting Format
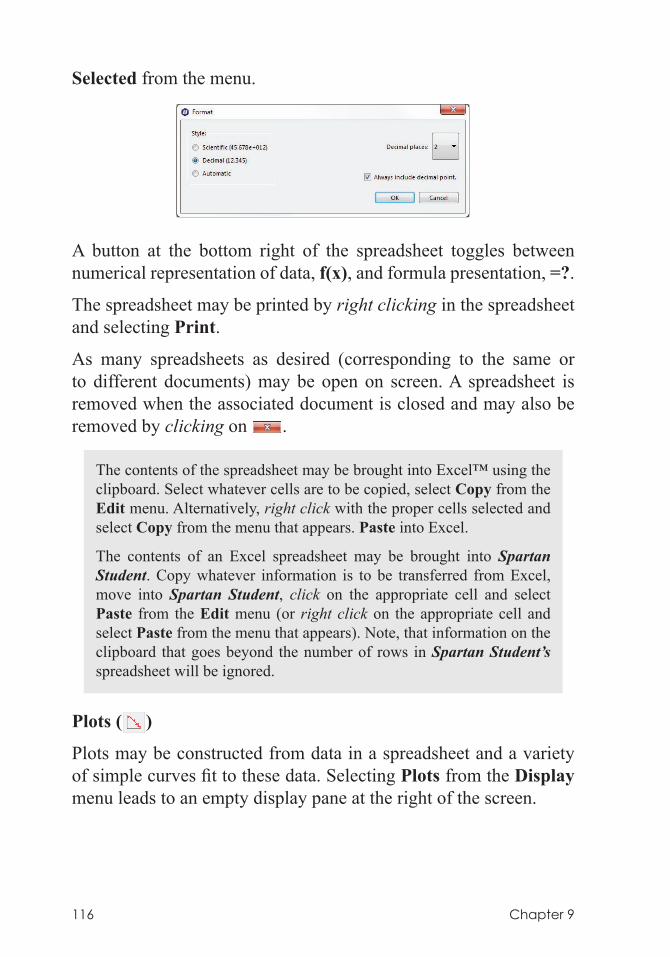
116 Chapter 9
Selected from the menu.
A button at the bottom right of the spreadsheet toggles between numerical representation of data, f(x), and formula presentation, =?.
The spreadsheet may be printed by right clicking in the spreadsheet and selecting Print.
As many spreadsheets as desired (corresponding to the same or to different documents) may be open on screen. A spreadsheet is removed when the associated document is closed and may also be removed by clicking on .
The contents of the spreadsheet may be brought into Excel™ using the clipboard. Select whatever cells are to be copied, select Copy from the Edit menu. Alternatively, right click with the proper cells selected and select Copy from the menu that appears. Paste into Excel.
The contents of an Excel spreadsheet may be brought into Spartan Student. Copy whatever information is to be transferred from Excel, move into Spartan Student, click on the appropriate cell and select Paste from the Edit menu (or right click on the appropriate cell and select Paste from the menu that appears). Note, that information on the clipboard that goes beyond the number of rows in Spartan Student’s spreadsheet will be ignored.
Plots ( )
Plots may be constructed from data in a spreadsheet and a variety of simple curves fit to these data. Selecting Plots from the Display menu leads to an empty display pane at the right of the screen.
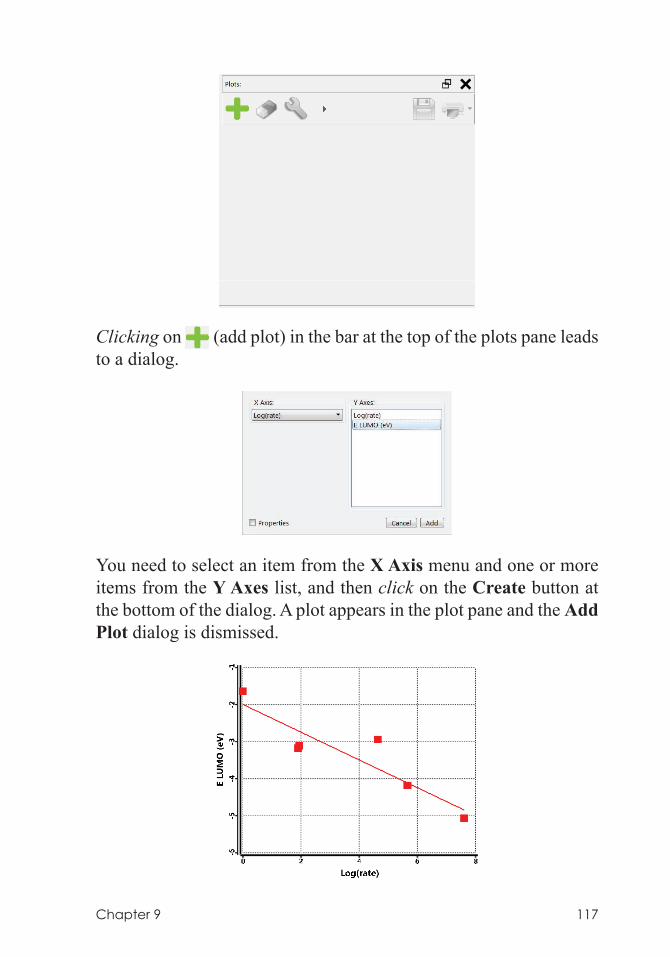
Chapter 9 117
Clicking on (add plot) in the bar at the top of the plots pane leads to a dialog.
You need to select an item from the X Axis menu and one or more items from the Y Axes list, and then click on the Create button at the bottom of the dialog. A plot appears in the plot pane and the Add Plot dialog is dismissed.
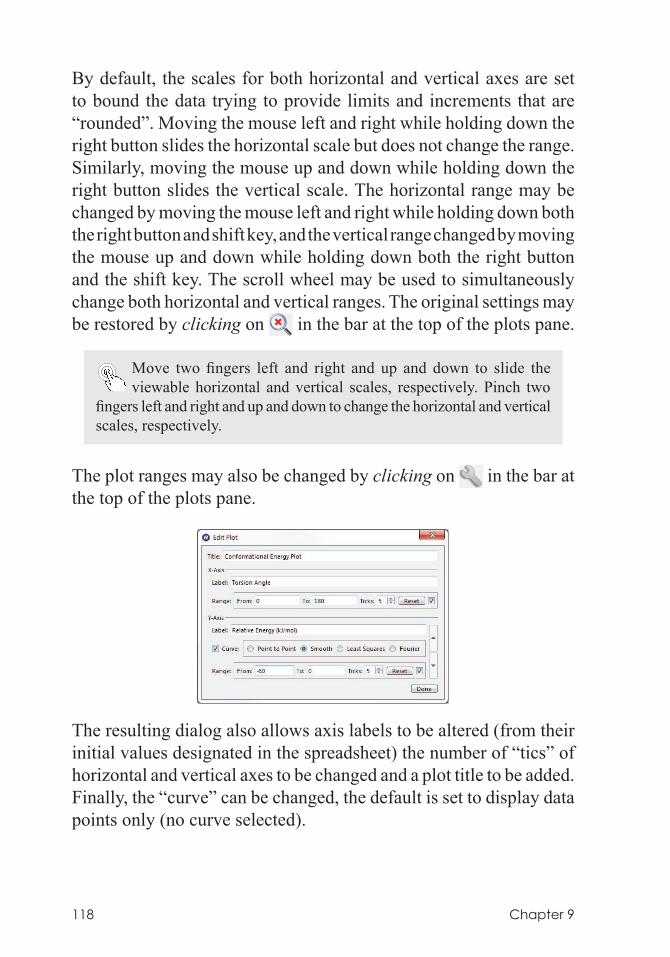
118 Chapter 9
By default, the scales for both horizontal and vertical axes are set to bound the data trying to provide limits and increments that are “rounded”. Moving the mouse left and right while holding down the right button slides the horizontal scale but does not change the range. Similarly, moving the mouse up and down while holding down the right button slides the vertical scale. The horizontal range may be changed by moving the mouse left and right while holding down both the right button and shift key, and the vertical range changed by moving the mouse up and down while holding down both the right button and the shift key. The scroll wheel may be used to simultaneously change both horizontal and vertical ranges. The original settings may be restored by clicking on in the bar at the top of the plots pane.
Move two fingers left and right and up and down to slide the viewable horizontal and vertical scales, respectively. Pinch two
fingers left and right and up and down to change the horizontal and vertical scales, respectively.
The plot ranges may also be changed by clicking on in the bar at the top of the plots pane.
The resulting dialog also allows axis labels to be altered (from their initial values designated in the spreadsheet) the number of “tics” of horizontal and vertical axes to be changed and a plot title to be added. Finally, the “curve” can be changed, the default is set to display data points only (no curve selected).
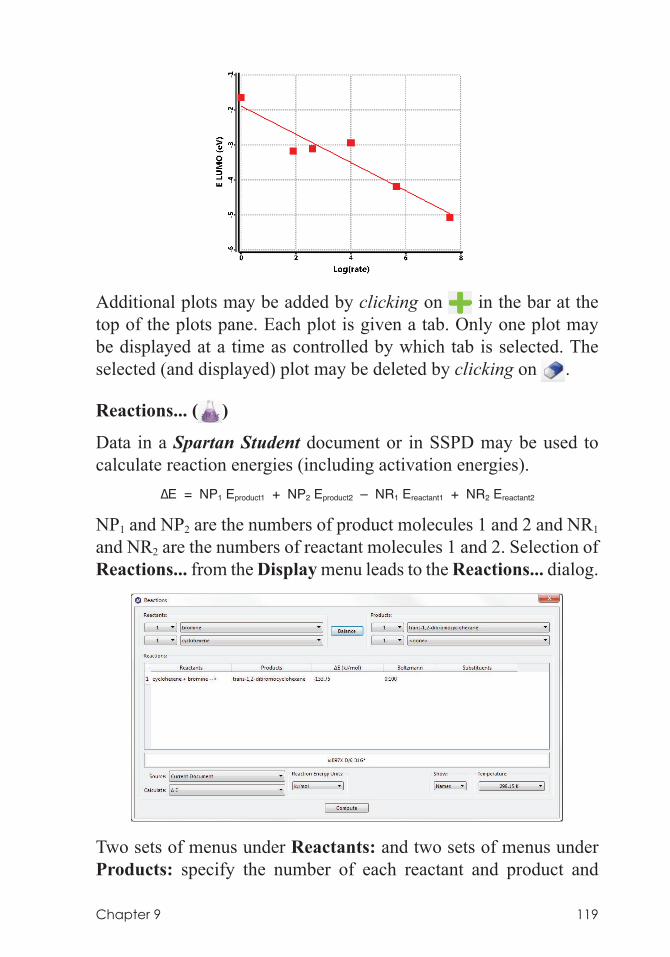
Chapter 9 119
Additional plots may be added by clicking on in the bar at the top of the plots pane. Each plot is given a tab. Only one plot may be displayed at a time as controlled by which tab is selected. The selected (and displayed) plot may be deleted by clicking on .
Reactions... ( )
Data in a Spartan Student document or in SSPD may be used to calculate reaction energies (including activation energies).
∆E = NP1 Eproduct1 + NP2 Eproduct2 – NR1 Ereactant1 + NR2 Ereactant2
NP1 and NP2 are the numbers of product molecules 1 and 2 and NR1 and NR2 are the numbers of reactant molecules 1 and 2. Selection of Reactions... from the Display menu leads to the Reactions... dialog.
Two sets of menus under Reactants: and two sets of menus under Products: specify the number of each reactant and product and
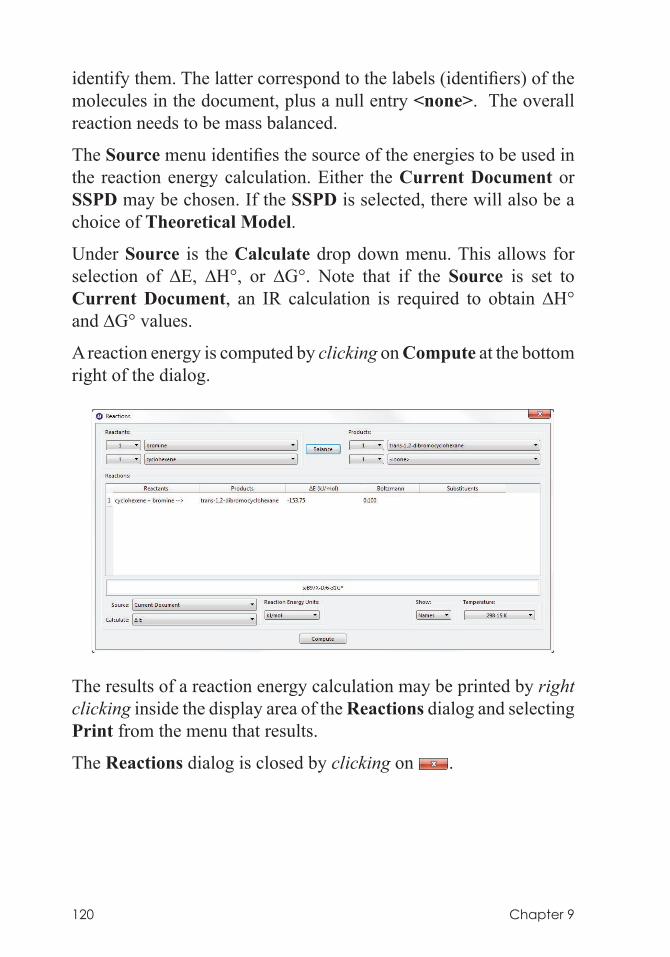
120 Chapter 9
identify them. The latter correspond to the labels (identifiers) of the molecules in the document, plus a null entry <none>. The overall reaction needs to be mass balanced.
The Source menu identifies the source of the energies to be used in the reaction energy calculation. Either the Current Document or SSPD may be chosen. If the SSPD is selected, there will also be a choice of Theoretical Model.
Under Source is the Calculate drop down menu. This allows for selection of ∆E, ∆H°, or ∆G°. Note that if the Source is set to Current Document, an IR calculation is required to obtain ∆H° and ∆G° values.
A reaction energy is computed by clicking on Compute at the bottom right of the dialog.
The results of a reaction energy calculation may be printed by right clicking inside the display area of the Reactions dialog and selecting Print from the menu that results.
The Reactions dialog is closed by clicking on .
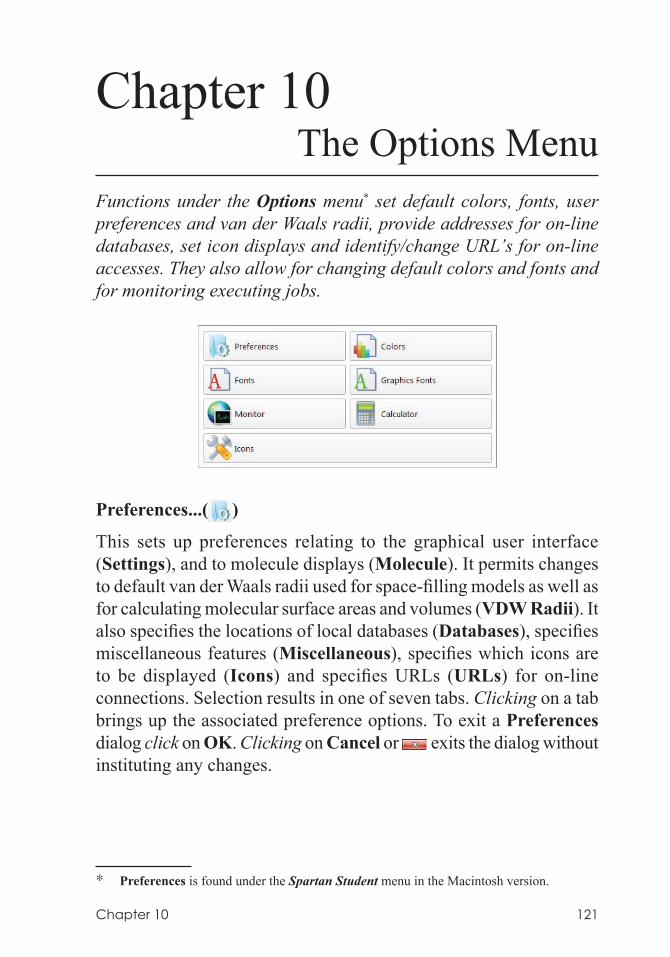
Chapter 10 121
Chapter 10The Options Menu
Functions under the Options menu* set default colors, fonts, user preferences and van der Waals radii, provide addresses for on-line databases, set icon displays and identify/change URL’s for on-line accesses. They also allow for changing default colors and fonts and for monitoring executing jobs.
Preferences...( )
This sets up preferences relating to the graphical user interface (Settings), and to molecule displays (Molecule). It permits changes to default van der Waals radii used for space-filling models as well as for calculating molecular surface areas and volumes (VDW Radii). It also specifies the locations of local databases (Databases), specifies miscellaneous features (Miscellaneous), specifies which icons are to be displayed (Icons) and specifies URLs (URLs) for on-line connections. Selection results in one of seven tabs. Clicking on a tab brings up the associated preference options. To exit a Preferences dialog click on OK. Clicking on Cancel or exits the dialog without instituting any changes.
* Preferences is found under the Spartan Student menu in the Macintosh version.
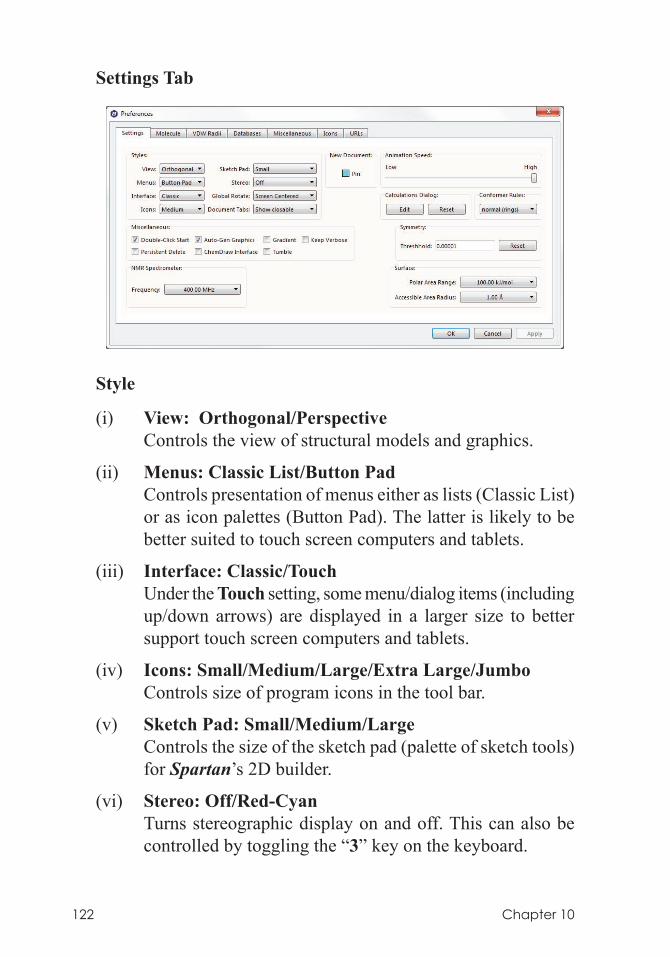
122 Chapter 10
Settings Tab
Style
(i) View: Orthogonal/Perspective Controls the view of structural models and graphics.
(ii) Menus: Classic List/Button Pad Controls presentation of menus either as lists (Classic List)
or as icon palettes (Button Pad). The latter is likely to be better suited to touch screen computers and tablets.
(iii) Interface: Classic/Touch Under the Touch setting, some menu/dialog items (including
up/down arrows) are displayed in a larger size to better support touch screen computers and tablets.
(iv) Icons: Small/Medium/Large/Extra Large/Jumbo Controls size of program icons in the tool bar.
(v) Sketch Pad: Small/Medium/Large Controls the size of the sketch pad (palette of sketch tools)
for Spartan’s 2D builder.
(vi) Stereo: Off/Red-Cyan Turns stereographic display on and off. This can also be
controlled by toggling the “3” key on the keyboard.

Chapter 10 123
(vii) Global Rotate: Screen Centered/Molecule Centered Screen Centered rotates all molecules about a common
center. Molecule Centered rotates each molecule about its own center.
(viii) Document Tabs Hide will revert display style to that of versions of Spartan
prior to Spartan’14, that is, all open documents will be visible when in View mode. If Show is checked, this displays a tab at the bottom of the screen for each open document.This allows for displaying molecules from documents other than the currently selected document by checking the box to the left of the tab. Show closable is the same as Show but includes the ability to close the document by clicking on the button at the right of the tab
(ix) New Document: Pin If checked, defaults to display of any new documents (from
building or brought in from the File menu) irrespective of whether or no they have been explicitly selected. Does not affect the status of existing open documents. Pin setting is only applicable if either Show or Show closable is selected (see Documents Tabs above).
(x) Animation Speed Slider bar controls the speed for animations.
(xi) Conformer Rules: Normal/Skeletal/Thorough Chooses between rule sets for conformational searching.
Normal is the default and should be used for Equilibrium Conformer and Conformer Distribution calculations where the Monte Carlo approach is involved. Skeletal (in prior versions this was called Trimmed) eliminates degrees of freedom and should be used for Similarity Library calculations where a systematic approach is carried out. Thorough considers twist-boat conformers of six-membered rings (in addition to chair conformers).
124 Chapter 10
(xii) Calculations Dialog Controls the default task that is displayed upon entering
Calculations... ( ) from the Setup menu. The default is Equilibrium Geometry with the ωB97X-D/6-31G* model, this can be modified by clicking the Edit button, which leads to a sample Calculations dialog. Clicking on Reset restores the default task.
Miscellaneous
(xiii) Double-Click Start If checked, double-click as opposed to single-click is
required to place the initial atom, group, ring, ligand, etc. on screen when using the 3D builder (consistent with the 2D Sketch builder behavior).
(xiv) Persistent Delete If checked, delete function is persistent. If not checked,
delete will revert to the previously selected function after a single delete operation.
(xv) Auto-Gen Graphics If checked, graphics calculations will be performed by the
graphical interface (without having to submit a calculation) as long as the information necessary to generate the surface is available (a previous calculation has been run, or the molecule has been retrieved from the SSPD). Note, however, that graphics calculations will not be auto-generated on documents containing more than 25 molecules. These will need to be submitted as a calculation.
(xvi) ChemDraw Interface (Windows only) If checked, adds ChemDraw as a tab at the top of the model
kit. This allows for use of the ChemDraw program (version 10 or newer) as an alternative for sketching molecules
(xvii) Gradient If checked, this replaces the single color background by a
color gradient background.
Chapter 10 125
(xviii) Tumble If checked, allows automatic tumbling of molecules. To
tumble a molecule, select it, press the left mouse button, move the mouse and release the button. To stop tumbling, left click.
To start tumbling, swipe one finger over the screen. To stop, tap anywhere on screen.
(xix) Keep Verbose If checked, keeps extended Q-Chem output. Normally
discarded upon successful completion of submitted calculations, this may be useful for identifying the source of problems for calculations that have not successfully completed or have led to suspicious results. (The last 100 lines of the verbose output is automatically kept for a job that has abnormally terminated). Verbose output significantly increases the size of the Spartan document.
NMR Spectrometer
(xx) Frequency The frequency of the spectrometer, used in coupling
constant calculations.
Surface
(xxi) Polar Area Range (kJ/mol) Sets the potential (in kJ/mol) for calculating polar area
from the electrostatic potential map. The range is given as a single number but represents the range between –value to +value, for example, the default range of 100 kJ/mol means a range from -100 to +100 kJ/mol. Values above and below the range are considered when determining polar area. Click inside the box and use the number pad that appears.
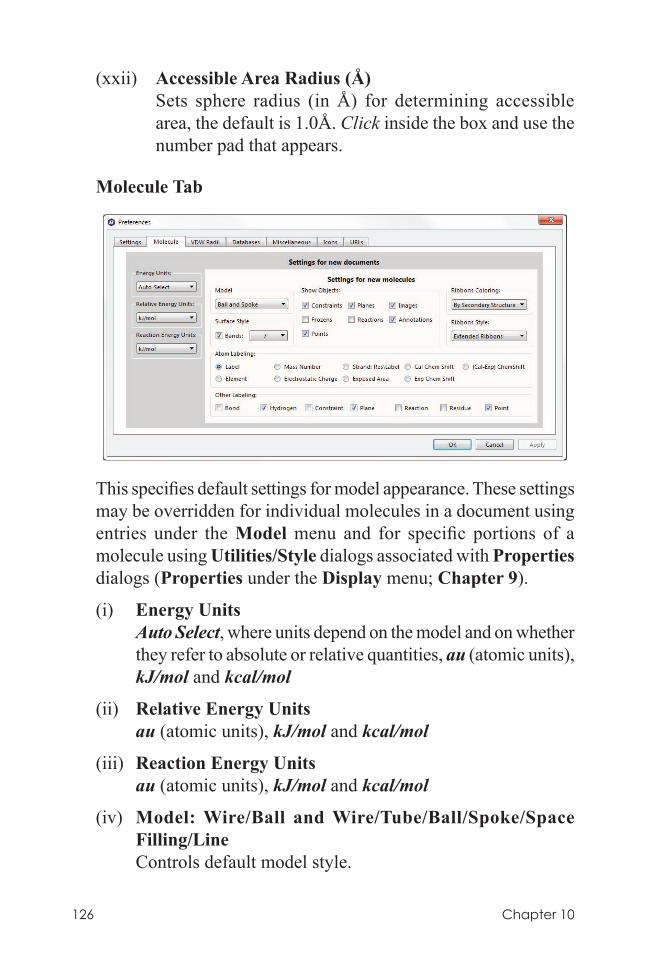
126 Chapter 10
(xxii) Accessible Area Radius (Å) Sets sphere radius (in Å) for determining accessible
area, the default is 1.0Å. Click inside the box and use the number pad that appears.
Molecule Tab
This specifies default settings for model appearance. These settings may be overridden for individual molecules in a document using entries under the Model menu and for specific portions of a molecule using Utilities/Style dialogs associated with Properties dialogs (Properties under the Display menu; Chapter 9).
(i) Energy Units Auto Select, where units depend on the model and on whether
they refer to absolute or relative quantities, au (atomic units), kJ/mol and kcal/mol
(ii) Relative Energy Units au (atomic units), kJ/mol and kcal/mol
(iii) Reaction Energy Units au (atomic units), kJ/mol and kcal/mol
(iv) Model: Wire/Ball and Wire/Tube/Ball/Spoke/Space Filling/Line
Controls default model style.
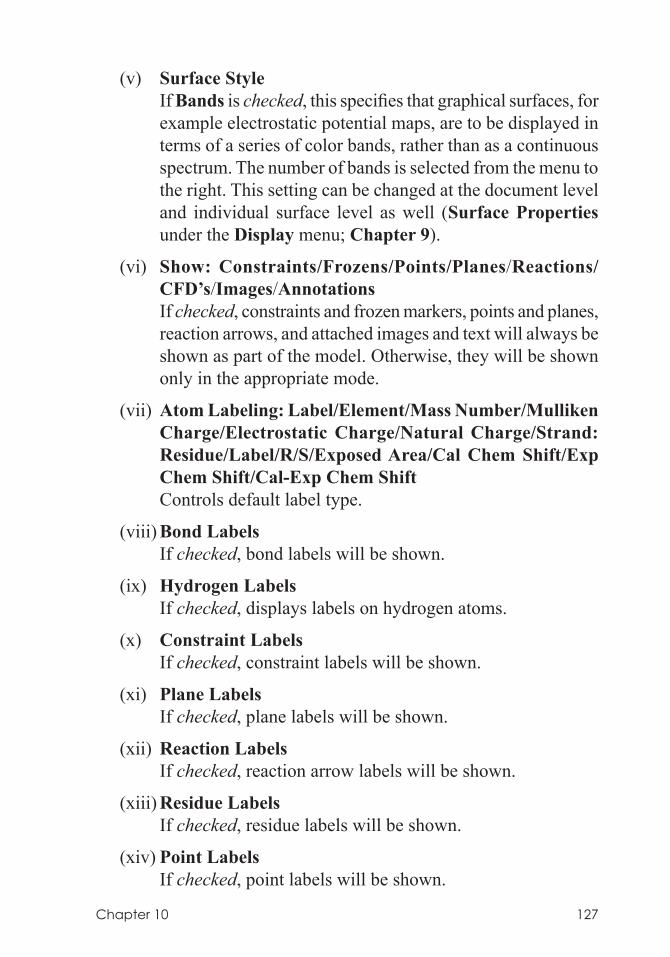
Chapter 10 127
(v) Surface Style If Bands is checked, this specifies that graphical surfaces, for
example electrostatic potential maps, are to be displayed in terms of a series of color bands, rather than as a continuous spectrum. The number of bands is selected from the menu to the right. This setting can be changed at the document level and individual surface level as well (Surface Properties under the Display menu; Chapter 9).
(vi) Show: Constraints/Frozens/Points/Planes/Reactions/CFD’s/Images/Annotations
If checked, constraints and frozen markers, points and planes, reaction arrows, and attached images and text will always be shown as part of the model. Otherwise, they will be shown only in the appropriate mode.
(vii) Atom Labeling: Label/Element/Mass Number/Mulliken Charge/Electrostatic Charge/Natural Charge/Strand: Residue/Label/R/S/Exposed Area/Cal Chem Shift/Exp Chem Shift/Cal-Exp Chem Shift
Controls default label type.
(viii) Bond Labels If checked, bond labels will be shown.
(ix) Hydrogen Labels If checked, displays labels on hydrogen atoms.
(x) Constraint Labels If checked, constraint labels will be shown.
(xi) Plane Labels If checked, plane labels will be shown.
(xii) Reaction Labels If checked, reaction arrow labels will be shown.
(xiii) Residue Labels If checked, residue labels will be shown.
(xiv) Point Labels If checked, point labels will be shown.
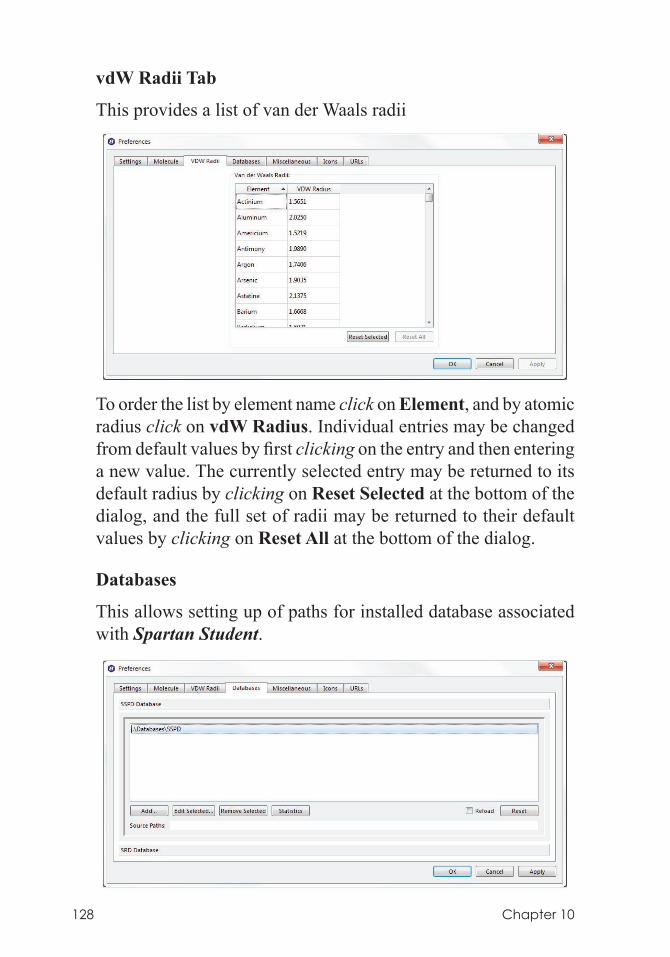
128 Chapter 10
vdW Radii Tab
This provides a list of van der Waals radii
To order the list by element name click on Element, and by atomic radius click on vdW Radius. Individual entries may be changed from default values by first clicking on the entry and then entering a new value. The currently selected entry may be returned to its default radius by clicking on Reset Selected at the bottom of the dialog, and the full set of radii may be returned to their default values by clicking on Reset All at the bottom of the dialog.
Databases
This allows setting up of paths for installed database associated with Spartan Student.
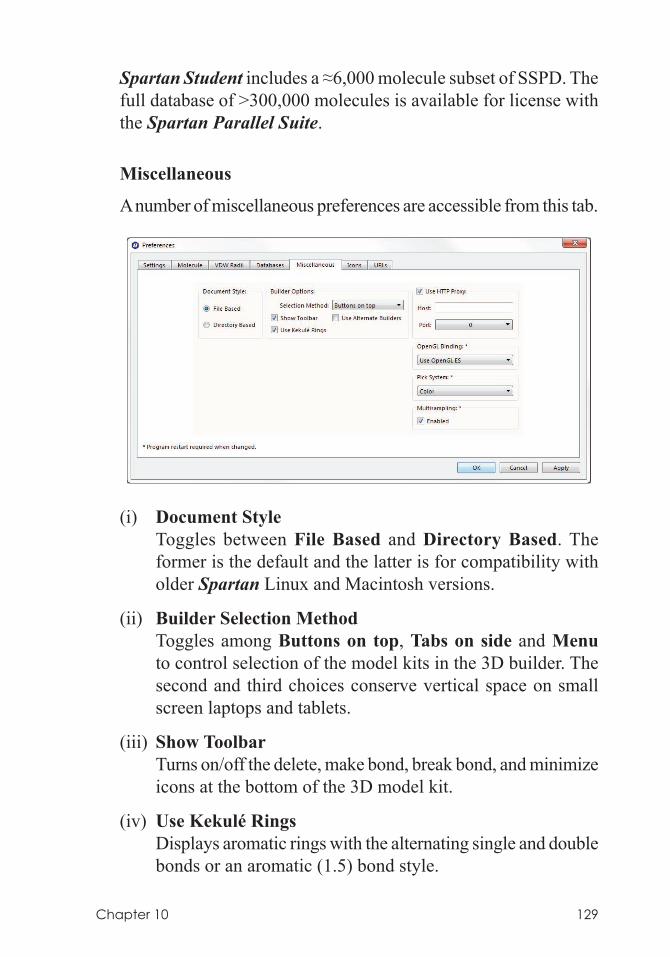
Chapter 10 129
Spartan Student includes a ≈6,000 molecule subset of SSPD. The full database of >300,000 molecules is available for license with the Spartan Parallel Suite.
Miscellaneous
A number of miscellaneous preferences are accessible from this tab.
(i) Document Style Toggles between File Based and Directory Based. The
former is the default and the latter is for compatibility with older Spartan Linux and Macintosh versions.
(ii) Builder Selection Method Toggles among Buttons on top, Tabs on side and Menu
to control selection of the model kits in the 3D builder. The second and third choices conserve vertical space on small screen laptops and tablets.
(iii) Show Toolbar Turns on/off the delete, make bond, break bond, and minimize
icons at the bottom of the 3D model kit.
(iv) Use Kekulé Rings Displays aromatic rings with the alternating single and double
bonds or an aromatic (1.5) bond style.
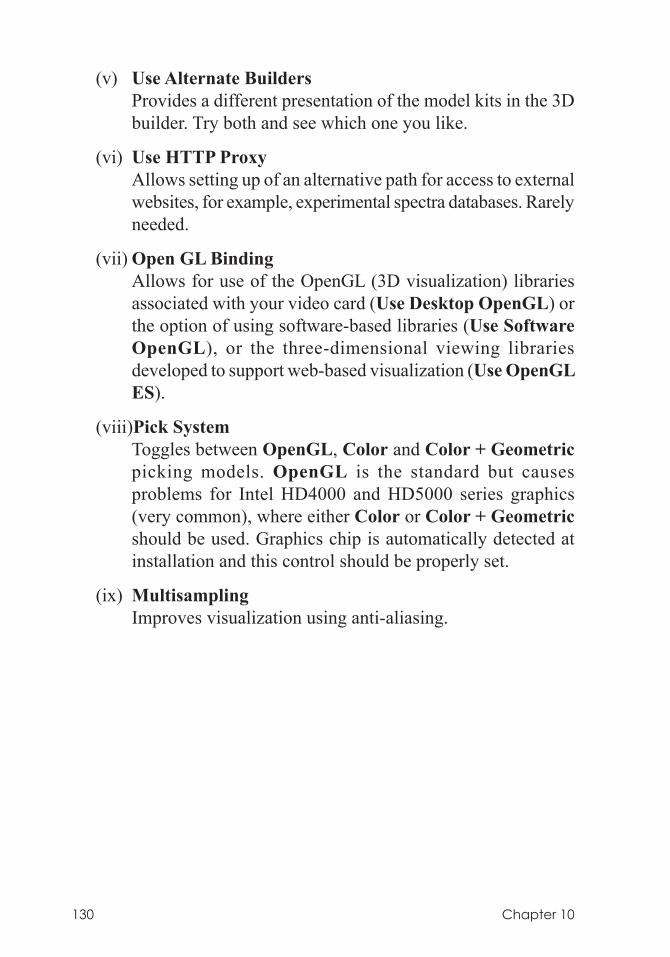
130 Chapter 10
(v) Use Alternate Builders Provides a different presentation of the model kits in the 3D
builder. Try both and see which one you like.
(vi) Use HTTP Proxy Allows setting up of an alternative path for access to external
websites, for example, experimental spectra databases. Rarely needed.
(vii) Open GL Binding Allows for use of the OpenGL (3D visualization) libraries
associated with your video card (Use Desktop OpenGL) or the option of using software-based libraries (Use Software OpenGL), or the three-dimensional viewing libraries developed to support web-based visualization (Use OpenGL ES).
(viii)Pick System Toggles between OpenGL, Color and Color + Geometric
picking models. OpenGL is the standard but causes problems for Intel HD4000 and HD5000 series graphics (very common), where either Color or Color + Geometric should be used. Graphics chip is automatically detected at installation and this control should be properly set.
(ix) Multisampling Improves visualization using anti-aliasing.
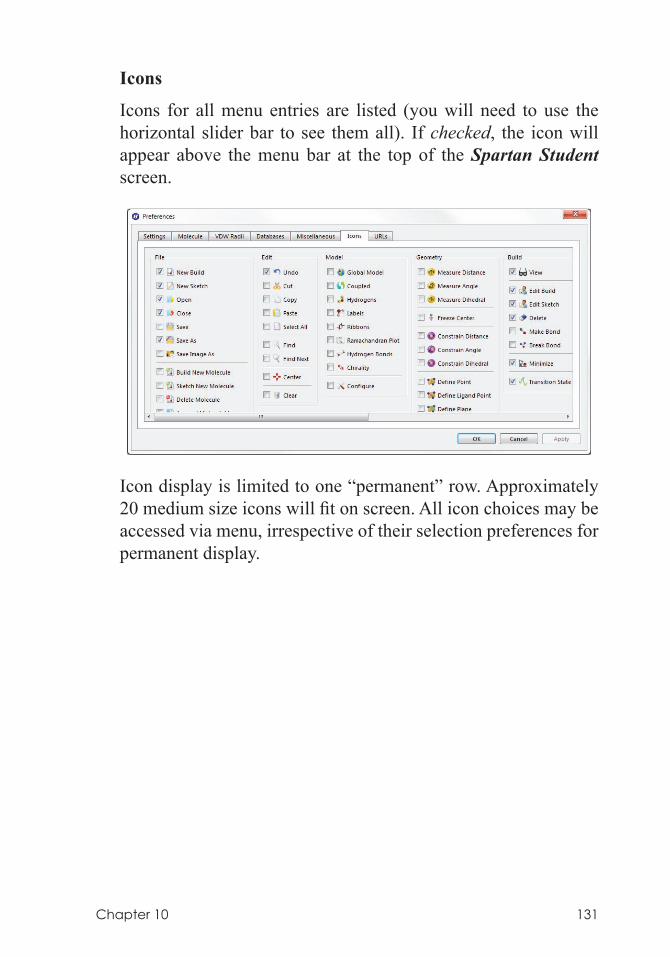
Chapter 10 131
Icons
Icons for all menu entries are listed (you will need to use the horizontal slider bar to see them all). If checked, the icon will appear above the menu bar at the top of the Spartan Student screen.
Icon display is limited to one “permanent” row. Approximately 20 medium size icons will fit on screen. All icon choices may be accessed via menu, irrespective of their selection preferences for permanent display.
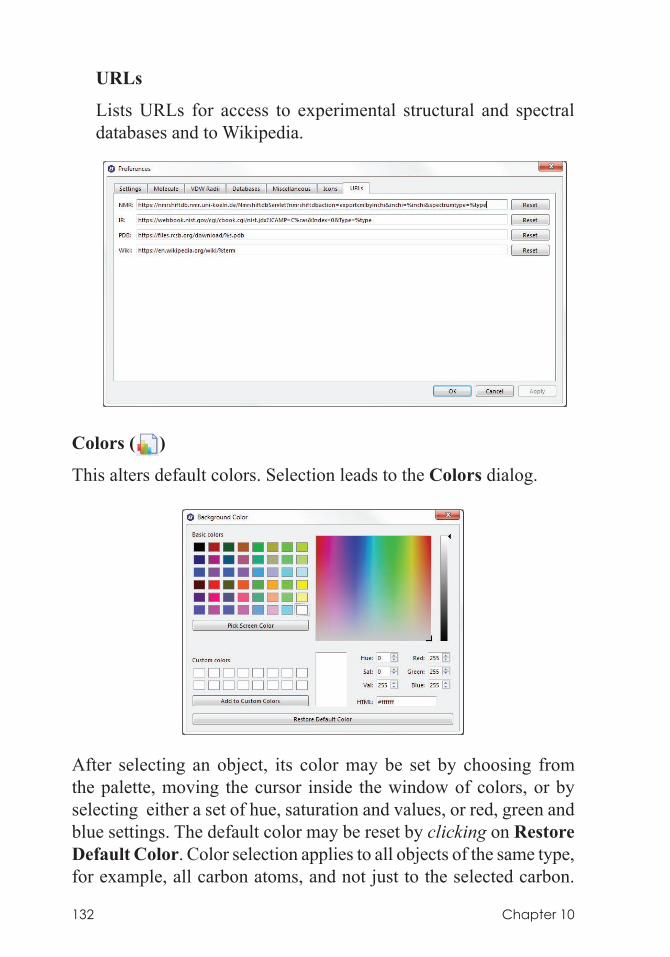
132 Chapter 10
URLs
Lists URLs for access to experimental structural and spectral databases and to Wikipedia.
Colors ( )
This alters default colors. Selection leads to the Colors dialog.
After selecting an object, its color may be set by choosing from the palette, moving the cursor inside the window of colors, or by selecting either a set of hue, saturation and values, or red, green and blue settings. The default color may be reset by clicking on Restore Default Color. Color selection applies to all objects of the same type, for example, all carbon atoms, and not just to the selected carbon.
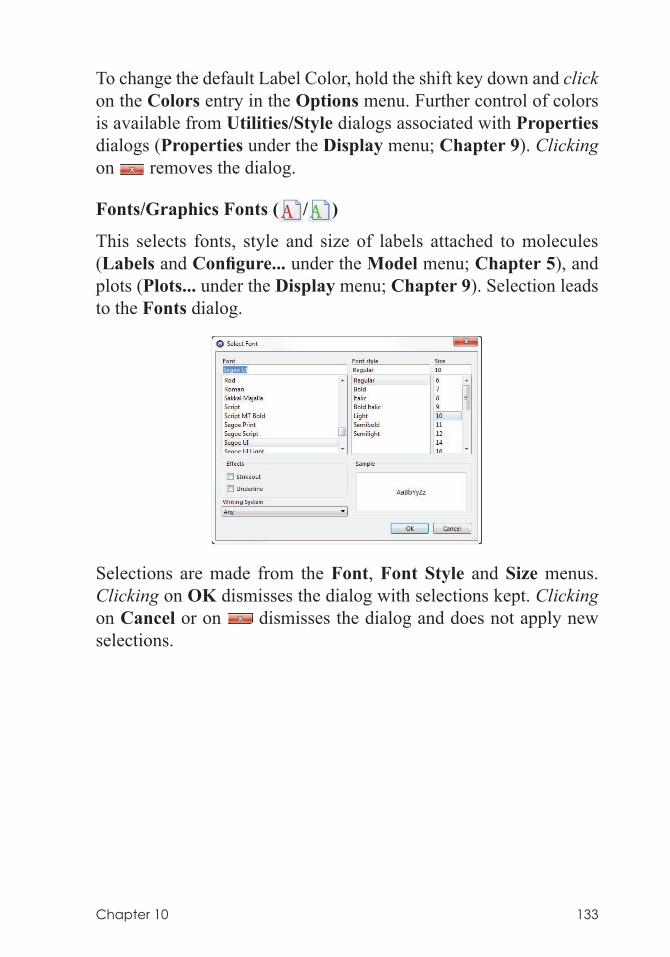
Chapter 10 133
To change the default Label Color, hold the shift key down and click on the Colors entry in the Options menu. Further control of colors is available from Utilities/Style dialogs associated with Properties dialogs (Properties under the Display menu; Chapter 9). Clicking on removes the dialog.
Fonts/Graphics Fonts ( / )
This selects fonts, style and size of labels attached to molecules (Labels and Configure... under the Model menu; Chapter 5), and plots (Plots... under the Display menu; Chapter 9). Selection leads to the Fonts dialog.
Selections are made from the Font, Font Style and Size menus. Clicking on OK dismisses the dialog with selections kept. Clicking on Cancel or on dismisses the dialog and does not apply new selections.
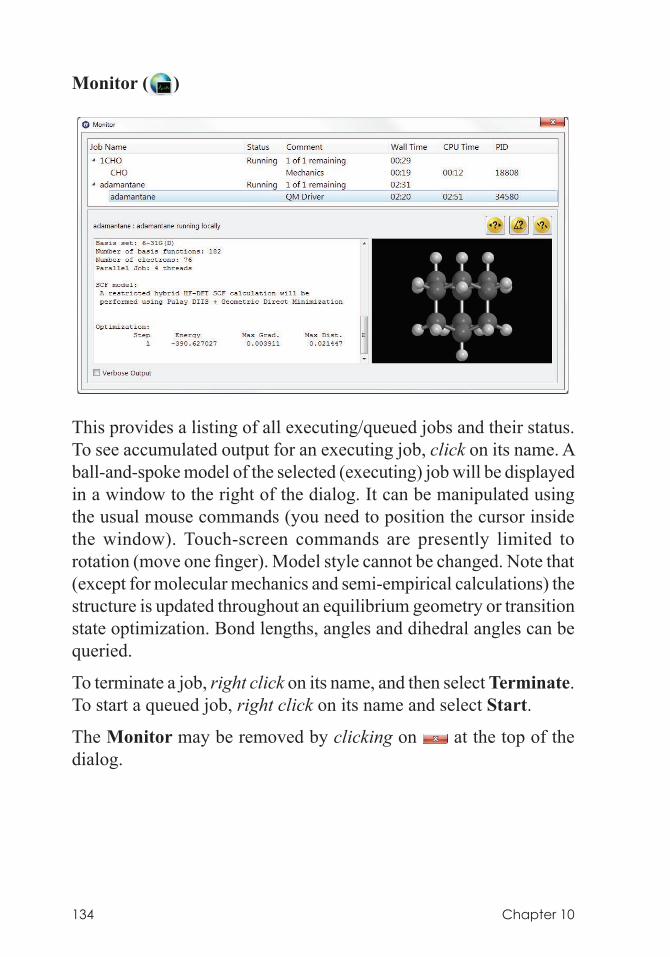
134 Chapter 10
Monitor ( )
This provides a listing of all executing/queued jobs and their status. To see accumulated output for an executing job, click on its name. A ball-and-spoke model of the selected (executing) job will be displayed in a window to the right of the dialog. It can be manipulated using the usual mouse commands (you need to position the cursor inside the window). Touch-screen commands are presently limited to rotation (move one finger). Model style cannot be changed. Note that (except for molecular mechanics and semi-empirical calculations) the structure is updated throughout an equilibrium geometry or transition state optimization. Bond lengths, angles and dihedral angles can be queried.
To terminate a job, right click on its name, and then select Terminate. To start a queued job, right click on its name and select Start.
The Monitor may be removed by clicking on at the top of the dialog.
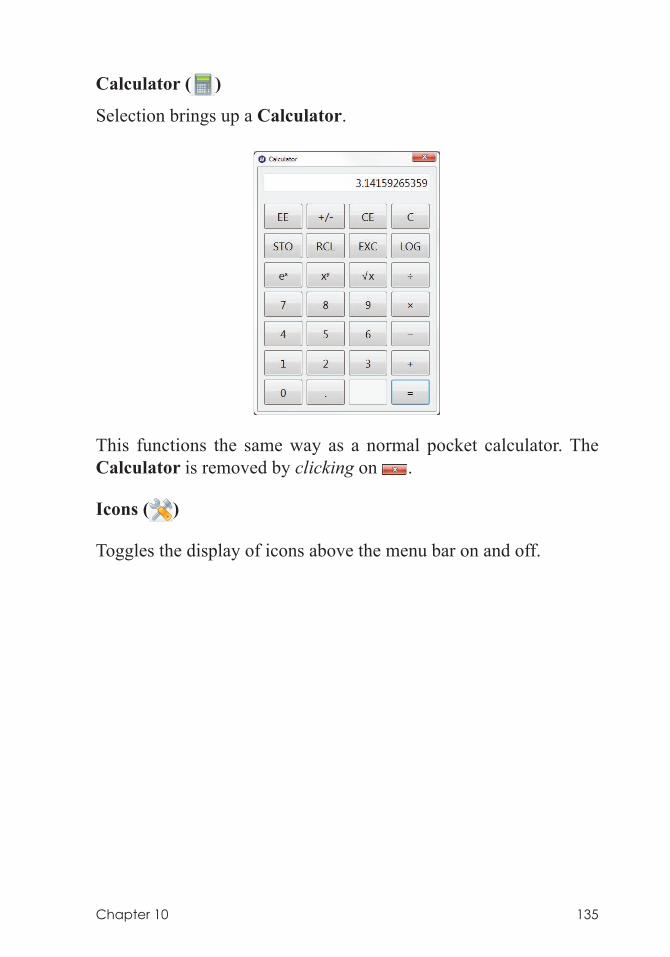
Chapter 10 135
Calculator ( )
Selection brings up a Calculator.
This functions the same way as a normal pocket calculator. The Calculator is removed by clicking on .
Icons ( )
Toggles the display of icons above the menu bar on and off.
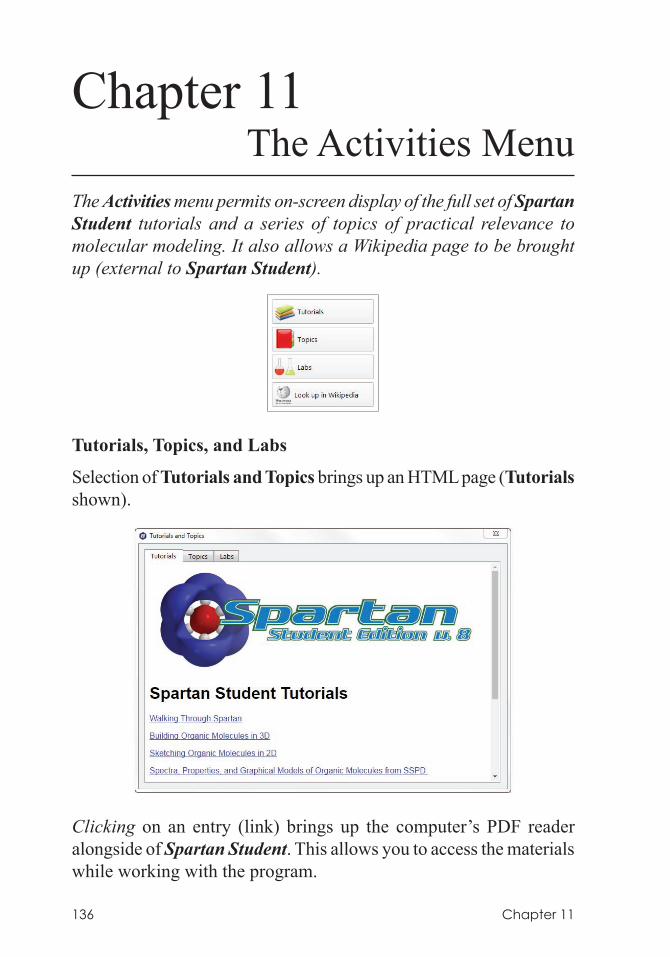
136 Chapter 11
Chapter 11The Activities Menu
The Activities menu permits on-screen display of the full set of Spartan Student tutorials and a series of topics of practical relevance to molecular modeling. It also allows a Wikipedia page to be brought up (external to Spartan Student).
Tutorials, Topics, and Labs
Selection of Tutorials and Topics brings up an HTML page (Tutorials shown).
Clicking on an entry (link) brings up the computer’s PDF reader alongside of Spartan Student. This allows you to access the materials while working with the program.
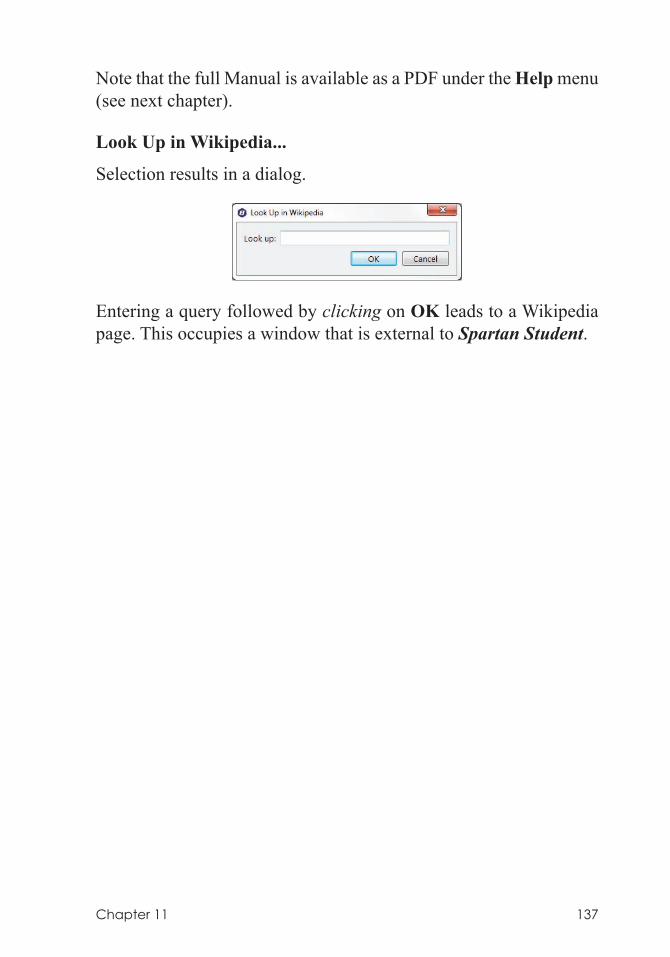
Chapter 11 137
Note that the full Manual is available as a PDF under the Help menu (see next chapter).
Look Up in Wikipedia...
Selection results in a dialog.
Entering a query followed by clicking on OK leads to a Wikipedia page. This occupies a window that is external to Spartan Student.
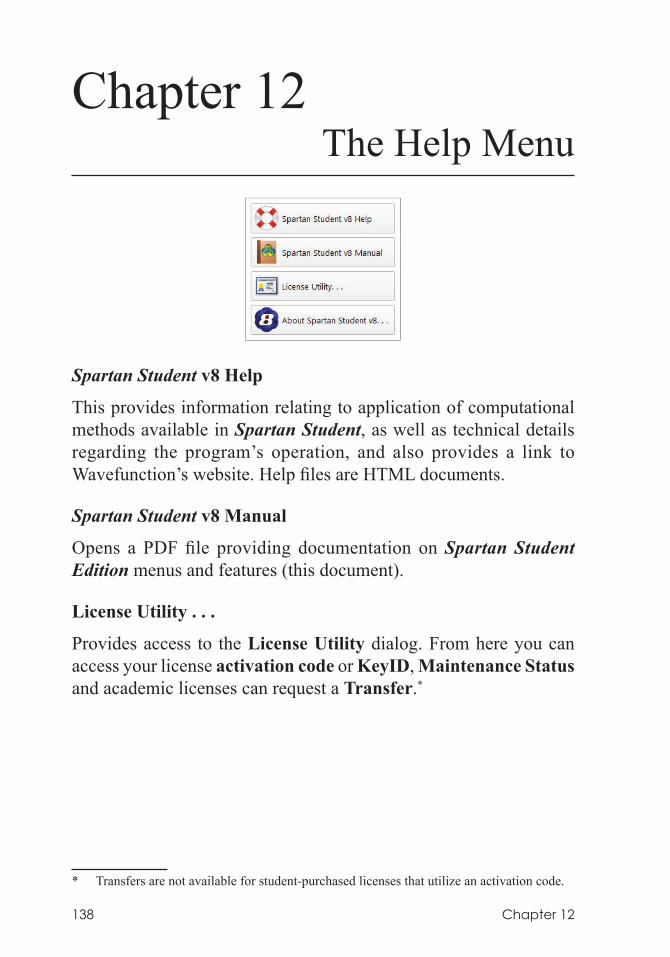
138 Chapter 12
Chapter 12The Help Menu
Spartan Student v8 Help
This provides information relating to application of computational methods available in Spartan Student, as well as technical details regarding the program’s operation, and also provides a link to Wavefunction’s website. Help files are HTML documents.
Spartan Student v8 Manual
Opens a PDF file providing documentation on Spartan Student Edition menus and features (this document).
License Utility . . .
Provides access to the License Utility dialog. From here you can access your license activation code or KeyID, Maintenance Status and academic licenses can request a Transfer.*
* Transfers are not available for student-purchased licenses that utilize an activation code.
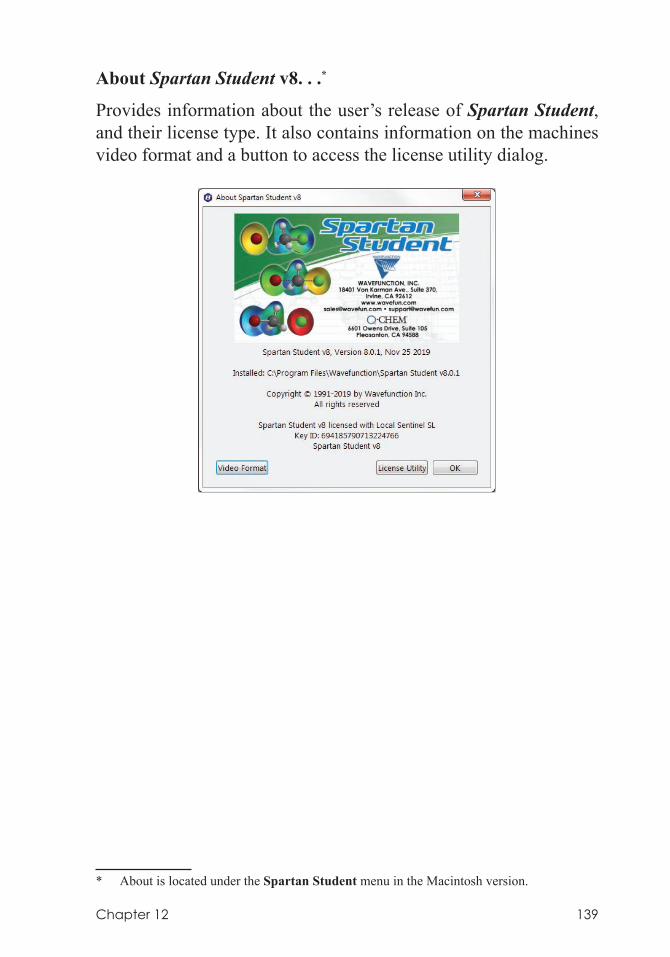
Chapter 12 139
About Spartan Student v8. . .*
Provides information about the user’s release of Spartan Student, and their license type. It also contains information on the machines video format and a button to access the license utility dialog.
* About is located under the Spartan Student menu in the Macintosh version.
140 Appendix A
Appendix ACapabilities and Limitations
Molecular Mechanics Models1
The MMFF molecular mechanics model is available for the calculation of energy (a combination of strain energy and intramolecular interaction energy), equilibrium geometries, equilibrium conformers, conformer energy distributions and vibrational frequencies. There are no atom limits for molecular mechanics calculations.
Semi-Empirical Models1
The PM3 semi-empirical model is available for calculation of heats of formation, wave functions, equilibrium and transition-state geometries and vibrational frequencies. The elements H, Li-F, Mg-Cl, Ca, Ti-Br, Zr, Mo-Pd, Cd-I, Hf-Pt and Hg-Bi and Gd are supported. PM3 calculations are limited to 75 atoms.
Hartree-Fock Models1-3
Hartree-Fock models are available for calculation of energies and wave functions, equilibrium and transition-state geometries and vibrational frequencies with STO-3G, 3-21G, 6-31G* and 6-311+G** basis sets. Hartree-Fock calculations are limited to 30 atoms.
Density Functional Models1,
B3LYP, EDF2, and wB97X-D density functional models are available for calculation of energies and wave functions, equilibrium and transition-state geometries and vibrational frequencies with both 6-31G* and 6-311+G** basis sets. Density functional calculations are limited to 30 atoms.
Appendix A 141
MP2 Møller-Plesset Models1
The MP2 Møller-Plesset model is available for calculation of energies and wave functions and equilibrium and transition-state geometries with 6-31G* and 6-311+G** basis sets. Vibrational frequencies are also available, but are very costly in terms of computation time. MP2 calculations are limited to 20 atoms.
T14 Thermochemical Recipe
The T1 recipe has been developed to closely reproduce G3(MP2) heats of formation. It makes use of an HF/6-31G* geometry, instead of the MP2/6-31G* geometry, replaces the large basis set MP2 calculation in G3(MP2) by a dual-basis set RI-MP2 calculation, eliminates both the QCISD(T) calculation and the vibrational frequency calculation (needed to obtain zero-point energy and to correct the energy for finite temperature) and introduces an empirical correction based on the atom counts and Mulliken bond orders. The result is that T1 requires 2-3 orders of magnitude less computation time than G3(MP2).
T1 is limited to closed-shell, uncharged molecules comprising H, C, N, O, F, Si, P, S, Cl and Br only and, because it incorporates parameters which depend explicitly on molecular geometry, is in practice limited to molecules that can be properly described in terms of a conventional valence structure. T1 is likely to be unsatisfactory for transition states. T1 calculations are limited to 20 atoms.
Solvent Models
Spartan Student supports SM5.0R5 for molecular mechanics calculations this estimates the aqueous solvation energy. For systems with H, C–F, S–Cl, Br and I. Hartree-Fock and density functional models support the C-PCM6,7 solvent model, allowing for calculations in water and both polar and non-polar solvents.
Properties and Spectra
The properties module (that is automatically called from the molecular mechanics module or one of the quantum chemical modules) provides for text output printing, population analyses based on fits
142 Appendix A
to electrostatic potentials), evaluation of thermodynamic quantities (enthalpy, entropy, free energy and heat capacity), and calculation of the dipole moment.
The properties module is also responsible for calculating quantities related to infrared spectra (vibrational frequencies and intensities), and NMR chemical shifts (13C chemical shifts are corrected for local environment). IR spectra calculations may be carried out with molecular mechanics models, semi-empirical models, Hartree-Fock models, B3LYP, EDF2, wB97X-D and MP2 models. NMR spectra calculations may only be carried out with Hartree-Fock, B3LYP, EDF2, and wB97X-D models.
Graphical Models
The graphics module provides for data preparation associated with the display as surfaces, property maps and slices of molecular orbitals, electron densities, spin densities, electrostatic potentials and local ionization potentials. The sizes of electron density surfaces (and of property maps based on electron density surfaces) may be chosen either using a specific value of the density or a value that encloses a specific percentage of the total number of electrons. Accessible and inaccessible regions may be distinguished for electron density surfaces and all property maps based on electron density surfaces.
Database
The database supported with Spartan Student is a subset of the Spartan Spectra and Properties Database (SSPD). It contains structures, energies, T1 heats of formation, IR and NMR spectra and diverse molecular properties for ≈6,000 molecules obtained from EDF2/ 6-31G* and wB97X-D/6-31G* calculations. In addition, it contains the wave allowing for function on-the-fly calculation and display of the full variety of graphical surfaces and property maps. The full version of SSPD (currently 300,000 molecules) may be licensed separately with the Spartan Parallel Suite (the research version of Spartan).
Appendix A 143
1. For a general discussion and assessment of the techniques and methods available in Spartan Student, see: W.J. Hehre, A Guide to Molecular Mechanics and Quantum Chemical Calculations, Wavefunction, Inc., Irvine, CA 2003. This is available from Wavefunction’s website (www.wavefun.com).
2. For a review of the quantum chemical methods utilized in Spartan Student (except for the PM3 semi-empirical method) with emphasis on recent developments, see: Y. Shao, L.F. Molnar, Y. Jung, J. Kussmann, C. Ochsenfeld, S.T. Brown, A.T.B. Gilbert, L.V. Slipchenko, S.V. Levchenko, D.P. O’Neill, R.A. DiStasio Jr., R.C. Lochan, T. Wang, G.J.O. Beran, N.A. Besley, J.M. Herbert, C.Y. Lin, T. Van Voorhis, S.H. Chien, A. Sodt, R.P. Steele, V.A. Rassolov, P.E. Maslen, P.P. Korambath, R.D. Adamson, B. Austin, J. Baker, E.F.C. Byrd, H. Dachsel, R.J. Doerksen, A. Dreuw, B.D. Dunietz, A.D. Dutoi, T.R. Furlani, S.R. Gwaltney, A. Heyden, S. Hirata, C-P. Hsu, G. Kedziora, R.Z. Khalliulin, P. Klunzinger, A.M. Lee, M.S. Lee, W.Z. Liang, I. Lotan, N. Nair, B. Peters, E.I. Proynov, P.A. Pieniazek, Y.M. Rhee, J. Ritchie, E. Rosta, C.D. Sherrill, A.C. Simmonett, J.E. Subotnik, H.L. Woodcock III, W. Zhang, A.T. Bell, A.K. Chakraborty, D.M. Chipman, F.J. Keil, A.Warshel, W.J. Hehre, H.F. Schaefer, J. Kong, A.I. Krylov, P.M.W. Gill and M. Head-Gordon, Phys. Chem. Chem. Phys., 8, 3172 (2006).
3. For an older account see: W.J. Hehre, L. Radom, P.v.R. Schleyer and J.A. Pople, Ab Initio Molecular Orbital Theory, Wiley, New York, 1986.
4. W.S. Ohlinger, P.E. Klunzinger, B.J. Deppmeier, W.J. Hehre; J. Phys. Chem. A., 113, 10, 2165 (2009).5. G.D. Hawkins, C.J. Cramer and D.G. Truhlar, J. Phys. Chem. B., 101, 7147 (1997).6. A.W. Lange, J.M. Herbert, Chem. Phys. Lett., 509, 77 (2011).7. V. Barone and M. Cossi, J. Phys. Chem. A., 102, 11,1995 (1998).
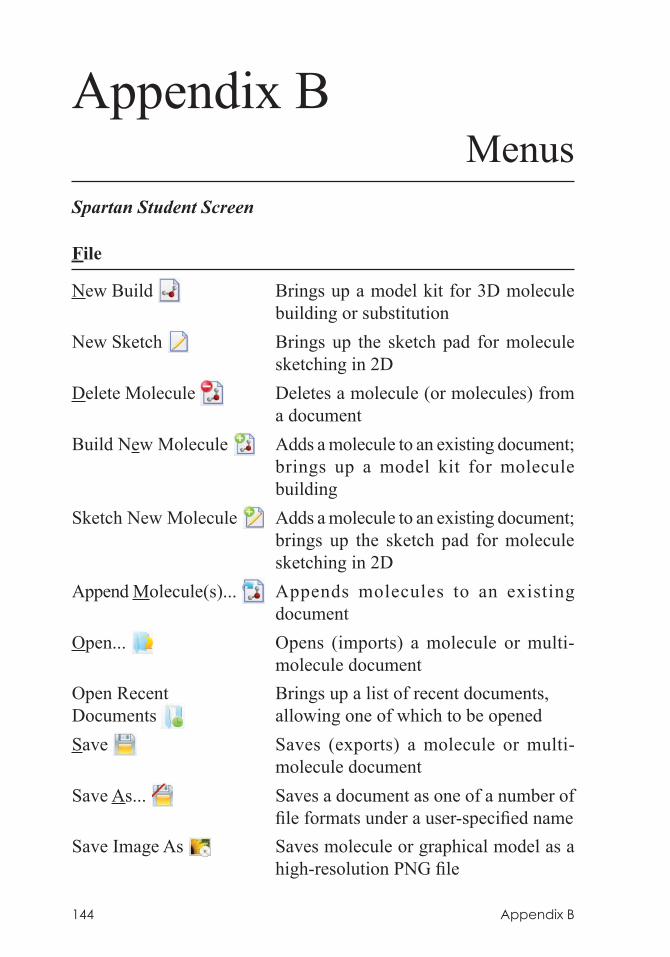
144 Appendix B
Appendix BMenus
Spartan Student Screen
File
New Build Brings up a model kit for 3D molecule building or substitution
New Sketch Brings up the sketch pad for molecule sketching in 2D
Delete Molecule Deletes a molecule (or molecules) from a document
Build New Molecule Adds a molecule to an existing document; brings up a model kit for molecule building
Sketch New Molecule Adds a molecule to an existing document; brings up the sketch pad for molecule sketching in 2D
Append Molecule(s)... Appends molecules to an existing document
Open... Opens (imports) a molecule or multi-molecule document
Open Recent Brings up a list of recent documents,Documents allowing one of which to be openedSave Saves (exports) a molecule or multi-
molecule document Save As... Saves a document as one of a number of
file formats under a user-specified nameSave Image As Saves molecule or graphical model as a
high-resolution PNG file
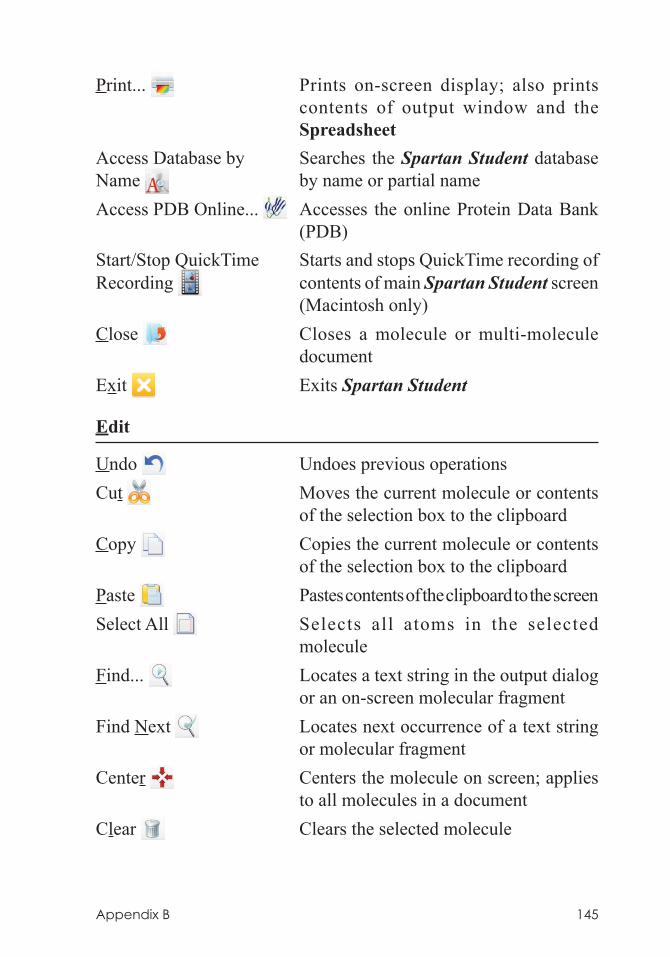
Appendix B 145
Print... Prints on-screen display; also prints contents of output window and the Spreadsheet
Access Database by Searches the Spartan Student database Name by name or partial nameAccess PDB Online... Accesses the online Protein Data Bank
(PDB)Start/Stop QuickTime Starts and stops QuickTime recording ofRecording contents of main Spartan Student screen
(Macintosh only)Close Closes a molecule or multi-molecule
documentExit Exits Spartan Student
Edit
Undo Undoes previous operationsCut Moves the current molecule or contents
of the selection box to the clipboardCopy Copies the current molecule or contents
of the selection box to the clipboardPaste Pastes contents of the clipboard to the screenSelect All Selects all atoms in the selected
moleculeFind... Locates a text string in the output dialog
or an on-screen molecular fragmentFind Next Locates next occurrence of a text string
or molecular fragmentCenter Centers the molecule on screen; applies
to all molecules in a documentClear Clears the selected molecule
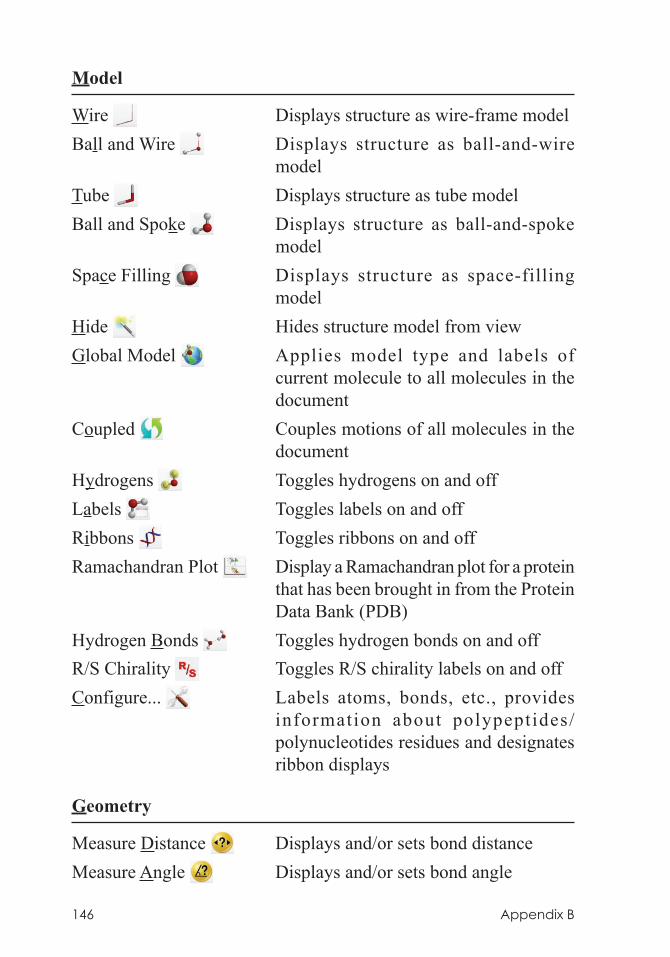
146 Appendix B
Model
Wire Displays structure as wire-frame modelBall and Wire Displays structure as ball-and-wire
modelTube Displays structure as tube modelBall and Spoke Displays structure as ball-and-spoke
modelSpace Filling Displays structure as space-filling
modelHide Hides structure model from viewGlobal Model Applies model type and labels of
current molecule to all molecules in the document
Coupled Couples motions of all molecules in the document
Hydrogens Toggles hydrogens on and offLabels Toggles labels on and offRibbons Toggles ribbons on and offRamachandran Plot Display a Ramachandran plot for a protein
that has been brought in from the Protein Data Bank (PDB)
Hydrogen Bonds Toggles hydrogen bonds on and offR/S Chirality Toggles R/S chirality labels on and off Configure... Labels atoms, bonds, etc., provides
information about polypeptides/polynucleotides residues and designates ribbon displays
Geometry
Measure Distance Displays and/or sets bond distanceMeasure Angle Displays and/or sets bond angle
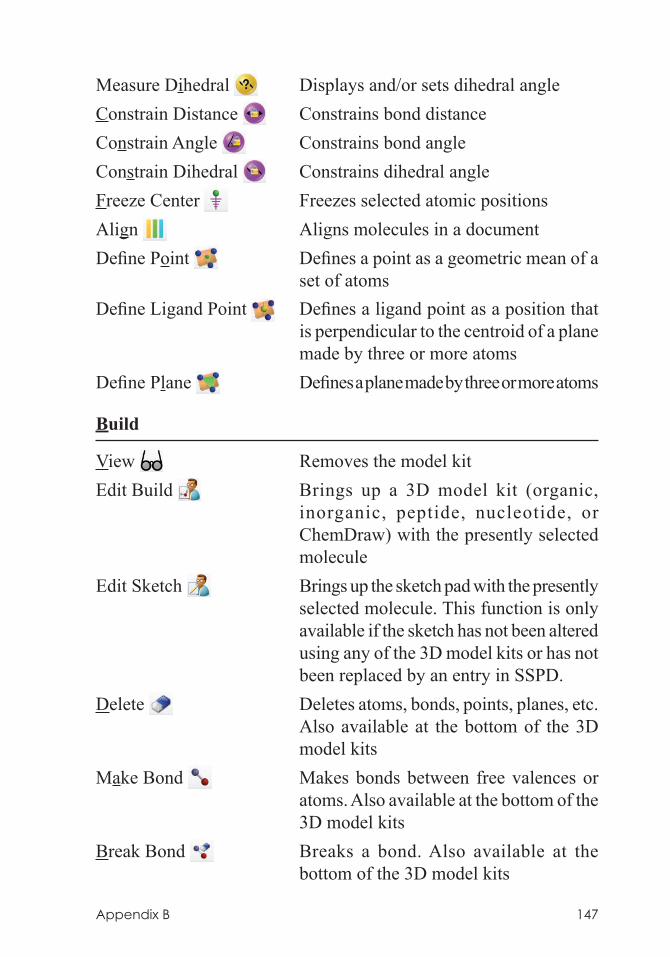
Appendix B 147
Measure Dihedral Displays and/or sets dihedral angleConstrain Distance Constrains bond distanceConstrain Angle Constrains bond angleConstrain Dihedral Constrains dihedral angleFreeze Center Freezes selected atomic positionsAlign Aligns molecules in a documentDefine Point Defines a point as a geometric mean of a
set of atomsDefine Ligand Point Defines a ligand point as a position that
is perpendicular to the centroid of a plane made by three or more atoms
Define Plane Defines a plane made by three or more atoms
Build
View Removes the model kitEdit Build Brings up a 3D model kit (organic,
inorganic, peptide, nucleotide, or ChemDraw) with the presently selected molecule
Edit Sketch Brings up the sketch pad with the presently selected molecule. This function is only available if the sketch has not been altered using any of the 3D model kits or has not been replaced by an entry in SSPD.
Delete Deletes atoms, bonds, points, planes, etc. Also available at the bottom of the 3D model kits
Make Bond Makes bonds between free valences or atoms. Also available at the bottom of the 3D model kits
Break Bond Breaks a bond. Also available at the bottom of the 3D model kits
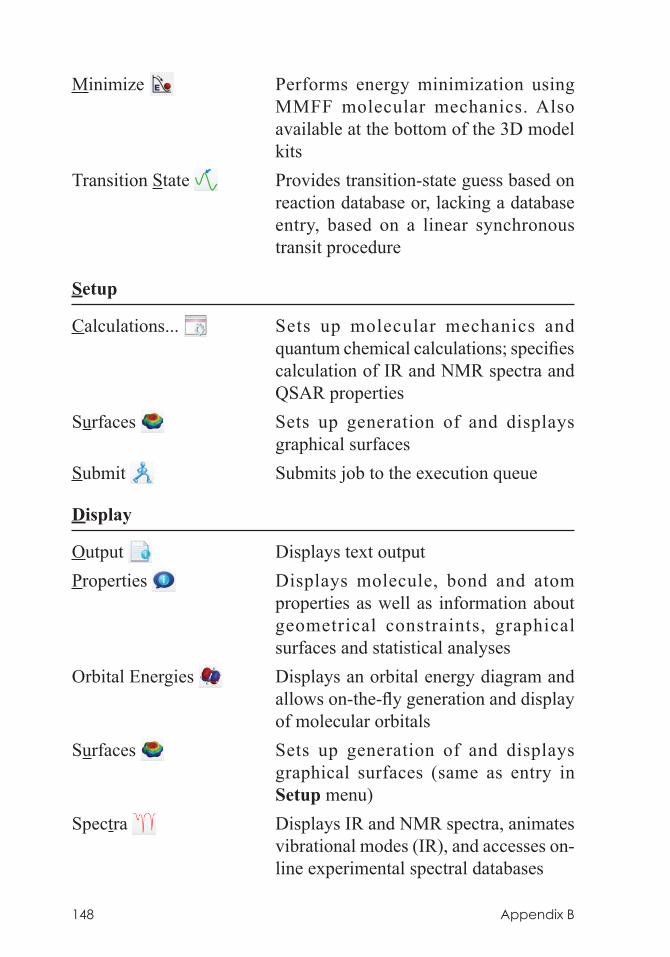
148 Appendix B
Minimize Performs energy minimization using MMFF molecular mechanics. Also available at the bottom of the 3D model kits
Transition State Provides transition-state guess based on reaction database or, lacking a database entry, based on a linear synchronous transit procedure
Setup
Calculations... Sets up molecular mechanics and quantum chemical calculations; specifies calculation of IR and NMR spectra and QSAR properties
Surfaces Sets up generation of and displays graphical surfaces
Submit Submits job to the execution queue
Display
Output Displays text outputProperties Displays molecule, bond and atom
properties as well as information about geometrical constraints, graphical surfaces and statistical analyses
Orbital Energies Displays an orbital energy diagram and allows on-the-fly generation and display of molecular orbitals
Surfaces Sets up generation of and displays graphical surfaces (same as entry in Setup menu)
Spectra Displays IR and NMR spectra, animates vibrational modes (IR), and accesses on-line experimental spectral databases
Appendix B 149
Spreadsheet Displays spreadsheetPlots... Creates 2D plots from the data in the
spreadsheetReactions Calculates reaction (and activation)
energies using data either from current document or from the Spartan Spectra and Properties Database (SSPD)
Options
Preferences... Sets various run-time and labeling preferences, icon displays, establishes URL’s for on-line access
Colors Sets screen and model colorsFonts... Sets fonts for menusGraphics Fonts... Sets fonts for graphical displaysMonitor Monitors and allows for killing jobsCalculator Pocket calculatorIcons Toggles display of icons on and off
Activities
Tutorials Brings up Spartan Student tutorials as PDF documents
Topics Brings up selection of topics relevant to calculations performed in Spartan Student as PDF documents
Labs Brings up a sample set of student lab activities
Look up in Wikipedia Brings up a Wikipedia page
150 Appendix B
Help
Spartan Student v8 Provides informat ion about theHelp performance and timing of computational
methods in Spartan Student; provides information about using graphical models in Spartan Student; bulletin board for FAQs about Spartan Student
Spartan Student v8 Opens a PDF file providing a guided tourManual through Spartan Student Edition menus
License Utility . . . Accesses information about your Spartan Student license
About Spartan Student Provides program version information forv8. . . citation and support
Contextual
Main Screen
Copy Copies selected molecule to the clipboardPaste Pastes the contents of the clipboard into
the selected documentDelete Selected Deletes selected molecule from documentProperties Brings up the Molecular Properties dialog
Spreadsheet
Copy Copies text of selected cell or cells to the clipboard. If leftmost cell (or cells) selected, copies molecule(s) to the clipboard
Paste Pastes the contents of the clipboard into selected cells. If leftmost cell (or cells) selected, either pastes text or molecule(s) depending on menu choice
Appendix B 151
Add Brings up a wide selection of calculated quantities for adding to the spreadsheet
Sort Sorts the column from low to high. Pressing the Shift key prior to menu selection sorts from high to low
Format Selected Formats selected cell(s), selected column(s) if selection is in a header cell, or entire spreadsheet if selection is header cell of leftmost column
Delete Selected Deletes selected molecule or group of molecules
Append Appends the contents of Spartan Student document(s) to the spreadsheet (corresponding to the selected document)
Rename Selected Renames selected molecule(s) with namesUsing SSPD in the Spartan Spectra and Properties
Database (SSPD)Properties Brings up the Molecular Properties dialog
Reactions
Copy Copies selected text to the clipboardPrint Prints selected text
Output Window
Copy Copies selected text to the clipboardFind/Find Next Performs text search of OutputPrint Prints selected textSave As PDF Saves output as .pdf file
152 Appendix C
Appendix CUnits
Geometries
Cartesian coordinates are given in Ångstroms (Å), and in atomic units (au).
Bond distances are given in Å and in au. Bond angles and dihedral angles are given in degrees (°).
Surface areas, accessible surface areas and polar surface areas are available in Å2 and volumes in Å3, and in au2 (au3).
1 Å = 0.1 nm=1.889762 au
Energies, Heats of Formation and Strain Energies, Zero-Point Energies, Enthalpies and Gibbs Energies and Entropies
Total energies from Hartree-Fock calculations are available in au, kcal/mol, kJ/mol and electron volts (eV).
Experimental heats of formation as well as those from semi-empirical calculations and from thermochemical recipes are available in kJ/mol, au, kcal/mol and eV.
Strain energies from molecular mechanics calculations are available in kJ/mol, au, kcal/mol and eV.
Zero-point energies, enthalpies and Gibbs energies available in kJ/mol, kcal/mol and au/mol. Entropies are available in kJ/mol•degree, kcal/mol•degree and au/mol•degree.
Orbital Energies
Orbital energies are available in eV, kcal/mol, kJ/mol and au.
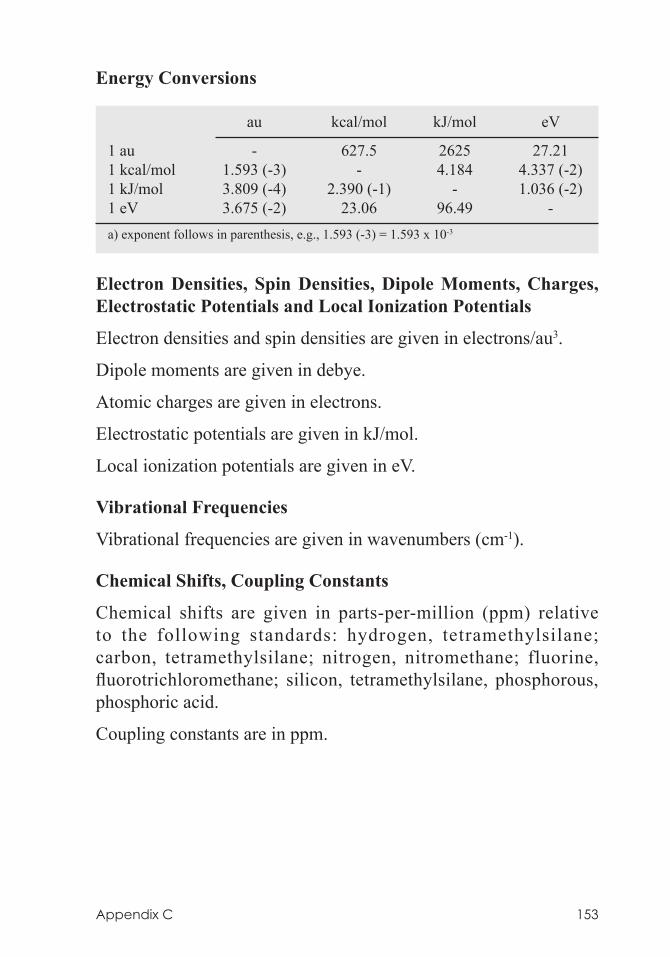
Appendix C 153
Energy Conversions
au kcal/mol kJ/mol eV
1 au - 627.5 2625 27.211 kcal/mol 1.593 (-3) - 4.184 4.337 (-2)1 kJ/mol 3.809 (-4) 2.390 (-1) - 1.036 (-2)1 eV 3.675 (-2) 23.06 96.49 -a) exponent follows in parenthesis, e.g., 1.593 (-3) = 1.593 x 10⁻³
Electron Densities, Spin Densities, Dipole Moments, Charges, Electrostatic Potentials and Local Ionization Potentials
Electron densities and spin densities are given in electrons/au3.
Dipole moments are given in debye.
Atomic charges are given in electrons.
Electrostatic potentials are given in kJ/mol.
Local ionization potentials are given in eV.
Vibrational Frequencies
Vibrational frequencies are given in wavenumbers (cm-1).
Chemical Shifts, Coupling Constants
Chemical shifts are given in parts-per-million (ppm) relative to the following standards: hydrogen, tetramethylsilane; carbon, tetramethylsilane; nitrogen, nitromethane; fluorine, fluorotrichloromethane; silicon, tetramethylsilane, phosphorous, phosphoric acid.
Coupling constants are in ppm.
154 Appendix D
Appendix DCitation
The proper citation for Spartan Student is as follows:
Spartan StudentWavefunction, Inc.
Irvine, CA
Except for molecular mechanics and semi-empirical models, the calculation methods used in Spartan Student have been documented in: Y. Shao, L.F. Molnar, Y. Jung, J. Kussmann, C. Ochsenfeld, S.T. Brown, A.T.B. Gilbert, L.V. Slipchenko, S.V. Levchenko, D.P. O’Neill, R.A. DiStasio Jr., R.C. Lochan, T. Wang, G.J.O. Beran, N.A. Besley, J.M. Herbert, C.Y. Lin, T. Van Voorhis, S.H. Chien, A. Sodt, R.P. Steele, V.A. Rassolov, P.E. Maslen, P.P. Korambath, R.D. Adamson, B. Austin, J. Baker, E.F.C. Byrd, H. Dachsel, R.J. Doerksen, A. Dreuw, B.D. Dunietz, A.D. Dutoi, T.R. Furlani, S.R. Gwaltney, A. Heyden, S. Hirata, C-P. Hsu, G. Kedziora, R.Z. Khalliulin, P. Klunzinger, A.M. Lee, M.S. Lee, W.Z. Liang, I. Lotan, N. Nair, B. Peters, E.I. Proynov, P.A. Pieniazek, Y.M. Rhee, J. Ritchie, E. Rosta, C.D. Sherrill, A.C. Simmonett, J.E. Subotnik, H.L. Woodcock III, W. Zhang, A.T. Bell, A.K. Chakraborty, D.M. Chipman, F.J. Keil, A.Warshel, W.J. Hehre, H.F. Schaefer, J. Kong, A.I. Krylov, P.M.W. Gill and M. Head-Gordon, Phys. Chem. Chem. Phys., 8, 3172 (2006).
Appendix E 155
Appendix EAccessing ChemDraw
(Windows Only)*
The ChemDraw program may be seamlessly accessed inside of Spartan Student** allowing chemical drawings to be produced in a familiar environment and then brought over as 3D structures***. The conversion is unambiguous as long as all stereochemical cues are in place in the 2D drawing. Note that the conformation implied by the 2D drawing may be ambiguous and need to be altered.
You need to check the box next to ChemDraw Interface in the Settings Preferences dialog under the Options menu (Chapter 10). This will add a ChemDraw button, tab or menu entry to the 3D builder.
To access ChemDraw, select ChemDraw from the buttons or menu at the top of the model kit, and click on Edit at the bottom of the panel that results. ChemDraw will appear. To return to Spartan Student, close ChemDraw. The 2D drawing will appear at the center of the panel and manipulable 3D structure will appear at the top of the panel. Clicking on screen will move the 3D structure into Spartan Student’s main window.
* ChemDrawfiles(.cdx)maybereadwithallversionsofSpartan.** ChemDraw is not provided with Spartan but must be obtained from Perkin Elmer.*** Transfer is one directional only. 3D structures that have been altered may not be transferred
back to ChemDraw.


