Embed Size (px)
Citation preview
Rapport till Finanspolitiska rådet
2013/4
Sovereign wealth funds for
macroeconomic purposes
Erling Steigum
BI Norwegian Business School, Oslo
The views expressed in this report are those of the author and do not necessarily represent those of the Swedish Fiscal Policy Council.
Thanks are due to Reidun Grue Nerheim and Per Halvor Vale for useful comments.
Finanspolitiska rådet är en myndighet som har till uppgift att göra en oberoende granskning av regeringens finanspolitik. Rådets uppgifter fullföljs framför allt genom publiceringen av rapporten Svensk finanspolitik som lämnas till regeringen en gång per år. Rapporten ska kunna användas som ett underlag bland annat för riksdagens granskning av regeringens politik. Som ett led i uppdraget anordnar rådet även konferenser och utger skrifter om olika aspekter på finanspolitiken. I serien Studier i finanspolitik publiceras fördjupade studier eller rapporter som härrör från externa uppdrag.
Finanspolitiska rådet Box 3273 SE-103 65 Stockholm Kungsgatan 12–14 Tel: 08-453 59 90 Fax: 08-453 59 64 [email protected] www.finanspolitiskaradet.se ISSN 1654-8000
Studier i finanspolitik 2013/4 3
Abstract Sovereign wealth funds (SWFs) have become more numerous after the turn of the century. The largest ones are older and have been set up by non-democratic countries in the Middle East and Asia. Norway’s large SWF is an exception. In democratic societies, SWFs have been established in Australia, New Zealand and Ireland to pre-fund pensions in response to expected population ageing. The management of Norway’s Fund has been index-based, with only a very small role played by active management. In most other SWFs around the world, active management is much more important, and the cost of management is significantly higher than in Norway. The academic literature suggests that although active management could be beneficial, many empirical studies do not support the belief that external active management generates excess after-fee returns. An empirical study of active management in Norges Bank finds that 70 per cent of the (small) active management results from equity can be explained by systematic market risk factors. There is no strong consensus about how a global fund should diversify its assets among asset classes and currencies. We argue that SWFs could have positive macroeconomic effects in democratic welfare states if the government runs pension programs financed on a pay-as-you-go basis, and future population ageing is significant. Still, a SWF is hardly politically feasible if there is no broad agreement in the electorate and among political parties that fiscal surpluses and a SWF are worthwhile.
4
1 Introduction After the turn of the century, the number of sovereign wealth funds (SWFs) in the world economy has grown rapidly. According to Truman (2010), nominal assets under management of SWFs (in US dollars) doubled from 2005 to 2007. The word “sovereign wealth fund” is very recent. It was coined by Andrew Rozanov (2005). Truman (2010) refers to SWFs as “large pools of government-owned funds that are invested in whole or in part outside their home country.” A more precise definition is given by the International Forum of Sovereign Wealth Funds, established in 2009:
“SWFs are defined as special purpose investment funds or arrangements, owned by the general government. Created by the general government for macroeconomic purposes, SWFs hold, manage, or administer assets to achieve financial objectives, and employ a set of investment strategies which include investing in foreign assets. The SWFs are commonly established out of balance of payments surpluses, official foreign currency operations, the proceeds of privatizations, fiscal surpluses, and/or receipts of commodity exports. These exclude inter alia, foreign currency reserve assets held by monetary authorities for the traditional balance of payments or monetary policy purposes, state-owned enterprises in the traditional sense, government-employee pension funds, or assets managed for benefits of individuals.”
In this report, we take a closer look at the recent growth of SWFs around the world, and discuss reasons why some governments have set up SWFs, and how they are organized. Particular emphasis is placed on the transparent SWFs in the four OECD countries Australia, Ireland, New Zealand and Norway. We also discuss important asset management issues and the funds’ potential macroeconomic effects, as well as ethical and political constraints relevant for investment strategy of SWFs in democratic societies, drawing in particular on Norway’s 15 years of experience with its SWF, managed by Norges Bank (Norway’s Central Bank).
Studier i finanspolitik 2013/4 5
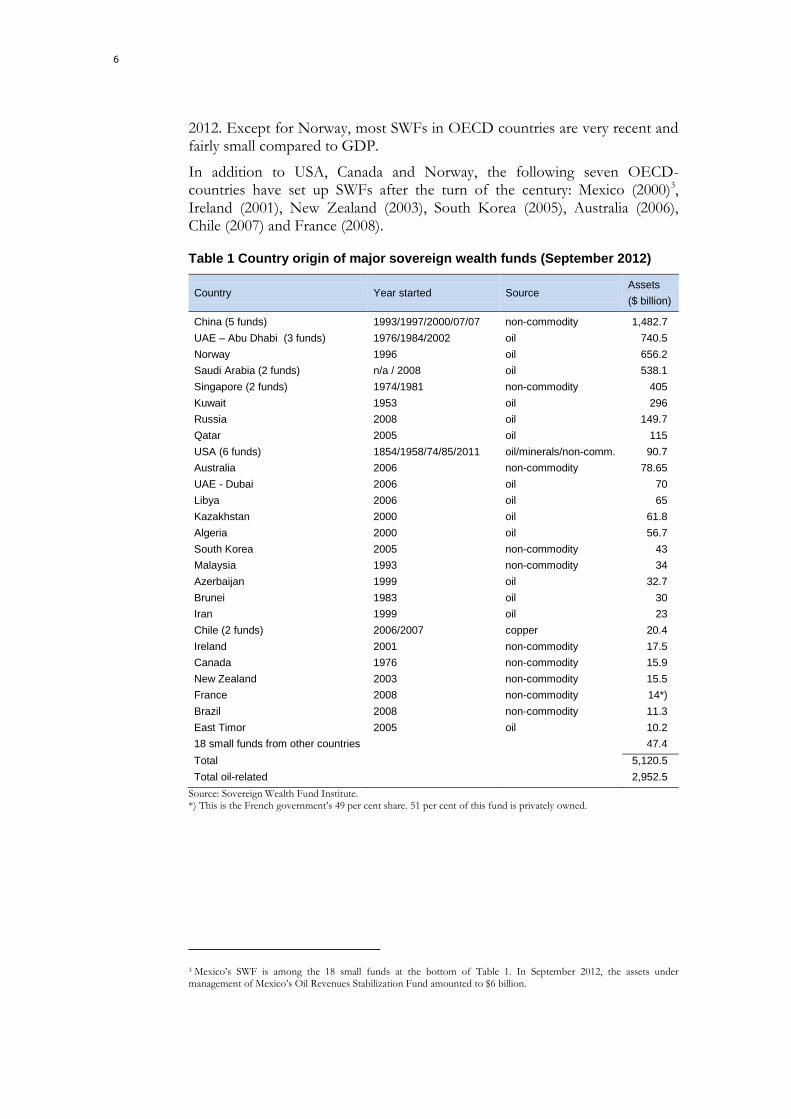
2 The rise of sovereign wealth funds Table 1 lists the country origin of major SWFs in September 2012.1 The total market value of all funds in Table 1 amounts to more than $5.1 trillion (including 18 small funds from other countries, with a total value of $47.4 billion). Some large government employee pension funds in Japan, Holland, Canada and the United States are not SWFs according to the definition referred to in Section 1, but are defined as SWFs by Truman (2010). Including those would have increased the total asset value in Table 1 by roughly $2 trillion. Observe that foreign currency reserve assets of central banks are not included in Table 1. Official currency reserves have also increased enormously in recent year. By the end of September 2012, the total foreign currency reserves of all central banks amounted to $10.8 trillion, more than 200 per cent of assets under management of SWF’s in Table 1.
About 60 per cent of the assets in Table 1 are managed by funds which have been set up to invest fiscal revenues from oil and gas (referred to as “oil funds” in Table 1), including Norway’s global SWF. In 2006, the Fund’s name was changed from The Government Petroleum Fund to The Government Pension Fund Global (GPFG). Substantial government revenues from petroleum extraction have always been the main source of the fiscal surpluses invested in the Norwegian SWF, however, and the future returns from the Fund are not going to be linked to pension benefits, see Section 3 below. Despite its new name, it is therefore appropriate to refer to Norway’s global fund in Table 1 as an “oil fund”.
About 75 per cent of the SWF assets in Table 1 are owned by governments in Asia and the Middle East. China dominates, owning six (non-commodity) funds which represent a total market value of almost $1.5 trillion (28.9 per cent of all the SWF assets in the world). China`s Central Bank also owns huge foreign currency reserves, estimated to $3.32 trillion by the IMF.
The oldest Middle East SWF is Kuwait Investment Authority, established in 1953. In September 2012, total assets under management were $296 billion. In 1974, the government of Singapore established Temasek Holdings, the size of which was $157.5 billion in September 2012.2 Another relatively old (and huge) Middle East SWF is Abu Dhabi Investment Authority (1976), with assets under management equal to $627 billion in September 2012.
There are relatively few OECD-countries in Table 1. The oldest one is the US Texas Permanent School Fund (1854), having a market value of $25.2 billion in September 2012. A bigger US fund is Alaska Permanent Fund ($42.3 billion in 2012), established in 1976. In the same year, Alberta’s Heritage Fund (another oil-based SWF) was established in Canada. Its assets amounted to $15.9 billion in
1 Source: The homepage of the Sovereign Wealth Fund Institute.
2 The second SWF of Singapore, Government of Singapore Investment Corporation (established in 1981) is larger ($247.5 billion in September 2012).
6
2012. Except for Norway, most SWFs in OECD countries are very recent and fairly small compared to GDP.
In addition to USA, Canada and Norway, the following seven OECD-countries have set up SWFs after the turn of the century: Mexico (2000)3, Ireland (2001), New Zealand (2003), South Korea (2005), Australia (2006), Chile (2007) and France (2008).
Table 1 Country origin of major sovereign wealth funds (September 2012)
Country Year started Source Assets
($ billion)
China (5 funds) 1993/1997/2000/07/07 non-commodity 1,482.7
UAE – Abu Dhabi (3 funds) 1976/1984/2002 oil 740.5
Norway 1996 oil 656.2
Saudi Arabia (2 funds) n/a / 2008 oil 538.1
Singapore (2 funds) 1974/1981 non-commodity 405
Kuwait 1953 oil 296
Russia 2008 oil 149.7
Qatar 2005 oil 115
USA (6 funds) 1854/1958/74/85/2011 oil/minerals/non-comm. 90.7
Australia 2006 non-commodity 78.65
UAE - Dubai 2006 oil 70
Libya 2006 oil 65
Kazakhstan 2000 oil 61.8
Algeria 2000 oil 56.7
South Korea 2005 non-commodity 43
Malaysia 1993 non-commodity 34
Azerbaijan 1999 oil 32.7
Brunei 1983 oil 30
Iran 1999 oil 23
Chile (2 funds) 2006/2007 copper 20.4
Ireland 2001 non-commodity 17.5
Canada 1976 non-commodity 15.9
New Zealand 2003 non-commodity 15.5
France 2008 non-commodity 14*)
Brazil 2008 non-commodity 11.3
East Timor 2005 oil 10.2
18 small funds from other countries 47.4
Total 5,120.5
Total oil-related 2,952.5
Source: Sovereign Wealth Fund Institute. *) This is the French government’s 49 per cent share. 51 per cent of this fund is privately owned.
3 Mexico’s SWF is among the 18 small funds at the bottom of Table 1. In September 2012, the assets under management of Mexico’s Oil Revenues Stabilization Fund amounted to $6 billion.
Studier i finanspolitik 2013/4 7
3 Why do some governments set up SFWs? It is natural discuss oil- and non-renewable funds separately from the rest.
3.1 Oil- and other non-renewable resource funds
Let us start with the group of oil rich countries in Table 1, where governments own large shares of the oil and natural gas resources, and/or receive considerable petroleum tax revenues. The government petroleum revenues permit a higher present value of government spending net of taxes than otherwise, but since the petroleum resources are non-renewable, it would be shortsighted to spend the revenues (or cut taxes) on a current basis and risk excessive de-industrialization (The “Dutch disease”), oil-price driven macroeconomic fluctuations, as well as a future government revenue shortfall when the natural resources are depleted.4 In economic terms, the expected present value of the future government cash flow from the natural resource (petroleum) sector is a wealth that will gradually approach zero some time in the future. Assuming a positive long-term real rate of return on financial assets larger than the population growth rate, this wealth makes it feasible for the government to earn a permanent income per capita if the petroleum wealth is gradually transformed into a permanent SWF. Clearly, this strategy requires that a considerable share of the petroleum revenues are saved and invested in a SWF. The same logic applies to countries in which the government receives revenues from other non-renewable resources like minerals (for example Chile and Botswana), but it does not apply to government revenues from renewable natural resources such as hydroelectric power.
The considerable increase in the world oil price after year 2000 is one important factor that explains the rapid growth in the assets under management by oil-related SWFs during the last 12 years.
Let us use Norway as an example. From the beginning of the 1980s until the banking crisis in 1991–1992, Norwegian governments ran fiscal surpluses, which were used to pay back government debt that had been accumulated from fiscal deficits during the rapid build-up of the petroleum sector in the 1970s. The legal framework for a SWF was established in 1990 without any political controversy, and in 1996, the Fund received its first allocation. According to the legal framework, an allocation from the central government budget cannot exceed the corresponding fiscal surplus. Moreover, if the central government runs fiscal deficits, the size of the Fund must be reduced accordingly. The idea was to prevent the government from building up the SWF without a corresponding increase in the central government’s stock of net financial assets, i.e. to exclude the possibility of financing a build-up of the Fund by for example sales of government bonds. This particular accounting
4 Venezuela is an example of an oil-rich country that has spent most of its oil revenues on a current basis.
8
framework could also increase the political cost of running fiscal deficits and “raiding the Fund”.
The main idea behind the Fund is to avoid excessive and non-sustainable government spending of petroleum revenues, which could have destroyed internationally competitive sectors and triggered oil-price driven macroeconomic instability. Another purpose of the Fund is to act as a future generations fund. As in most other OECD countries, government spending is expected to increase substantially in the future due to population ageing. This could justify that the government now spends less than the permanent income per capita from the total petroleum wealth (the sum of the estimated offshore petroleum wealth and the SWF).
In 2001 a new fiscal policy guideline was approved by the Norwegian Parliament, along with a new inflation targeting framework for monetary policy, again with little political opposition. The fiscal policy guideline stipulates that over the business cycle, the part of the government’s total petroleum revenues to be spent (or used to cut taxes) in the next year’s central government budget should amount to 4 per cent of the asset value of GPFG at the beginning of the present year. All investment returns are going to be reinvested in the Fund, in addition to the annual allocations of fiscal surpluses that follow from the fiscal policy guideline. This is a flexible fiscal policy rule that allows automatic fiscal stabilizers to work during business cycles, as well as permitting extraordinary fiscal expansion under emergency circumstances, such as during the great global recession in 2009. The number 4 is an estimate of the long-term percentage expected annual real rate of return of the GPFG (measured in terms of inflation adjusted returns in Norwegian kroner). During 1998–2012, the annual real rate of return was 2.97 per cent (geometric average), see Norges Bank Investment Management (2013). During the last 10 years, the average real rate of return has been somewhat higher (3.66 per cent per year), but still lower than 4 per cent.
Note that the Norwegian fiscal policy guideline is defined in terms of a target of government spending of petroleum revenues, not a fiscal surplus target like in Sweden. The Fund therefore acts as a shock absorber which generates a very low correlation over time between annual government petroleum revenues and annual spending of the petroleum revenues. The long-term size of the Fund will therefore be sensitive to both future oil and gas prices and realized rates of return.
As a result of huge government petroleum revenues after year 2000, the foreign assets managed by GPFG are now (March 2013) more than NOK 4.1 trillion, or more than NOK 820,000 (about $144,000) per capita. The Fund’s investment strategy is set by the Government (The Ministry of Finance) and defined in terms of global benchmark portfolios for equity and fixed income securities. Norges Bank Investment Management now employs a staff of 336 people for this task (238 employees in Oslo and 98 in the offices in London, New York, Singapore and Shanghai)5.
5 Source: Norges Bank Investment Management (2013).
Studier i finanspolitik 2013/4 9
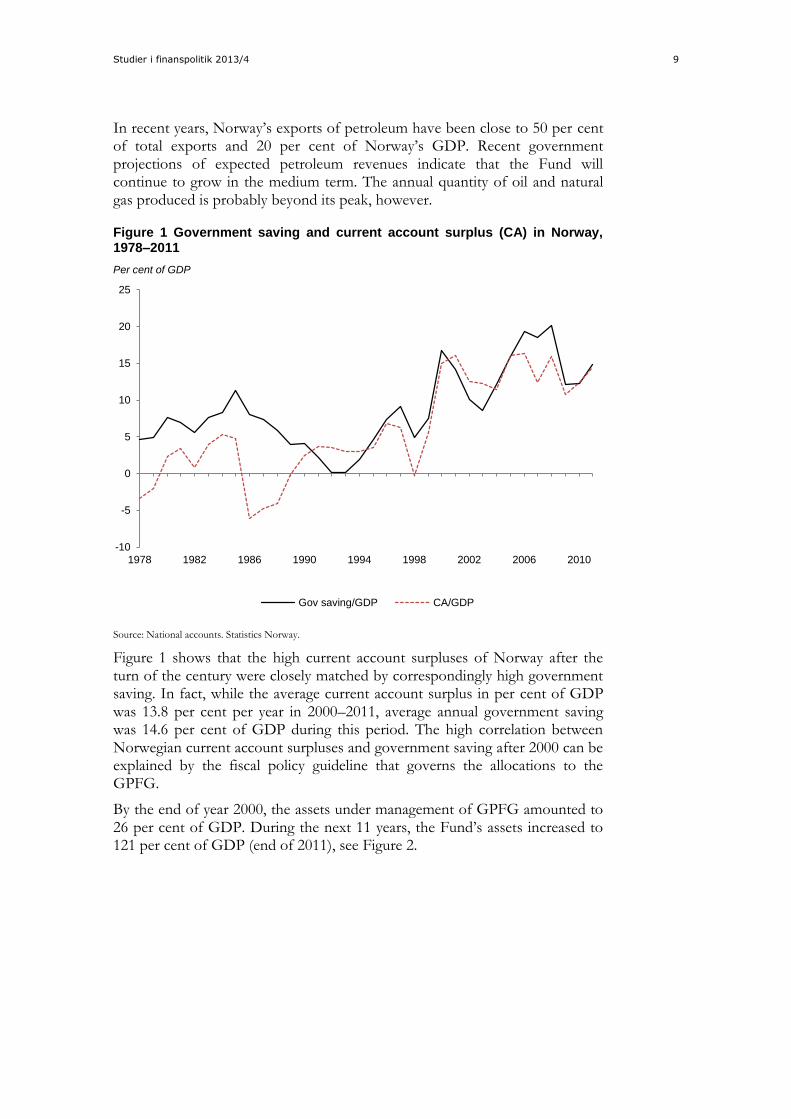
In recent years, Norway’s exports of petroleum have been close to 50 per cent of total exports and 20 per cent of Norway’s GDP. Recent government projections of expected petroleum revenues indicate that the Fund will continue to grow in the medium term. The annual quantity of oil and natural gas produced is probably beyond its peak, however.
Figure 1 Government saving and current account surplus (CA) in Norway, 1978–2011
Source: National accounts. Statistics Norway.
Figure 1 shows that the high current account surpluses of Norway after the turn of the century were closely matched by correspondingly high government saving. In fact, while the average current account surplus in per cent of GDP was 13.8 per cent per year in 2000–2011, average annual government saving was 14.6 per cent of GDP during this period. The high correlation between Norwegian current account surpluses and government saving after 2000 can be explained by the fiscal policy guideline that governs the allocations to the GPFG.
By the end of year 2000, the assets under management of GPFG amounted to 26 per cent of GDP. During the next 11 years, the Fund’s assets increased to 121 per cent of GDP (end of 2011), see Figure 2.
-10
-5
0
5
10
15
20
25
1978 1982 1986 1990 1994 1998 2002 2006 2010
Gov saving/GDP CA/GDP
Per cent of GDP
10
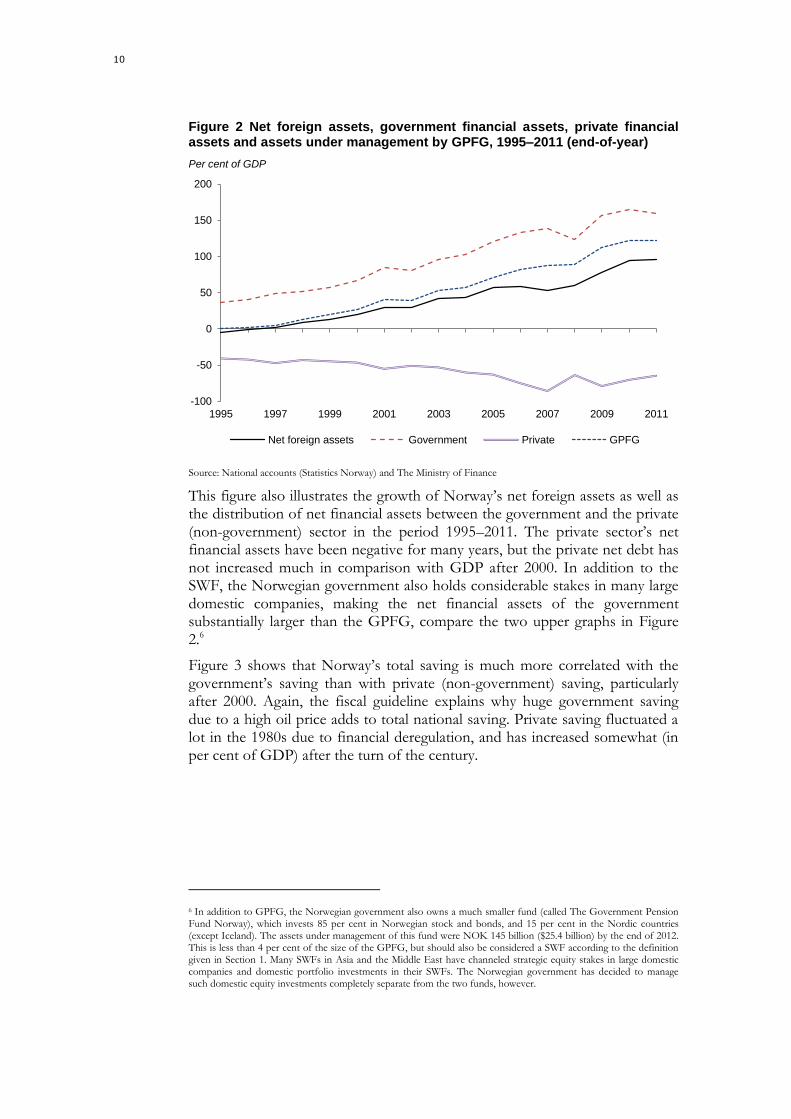
Figure 2 Net foreign assets, government financial assets, private financial assets and assets under management by GPFG, 1995–2011 (end-of-year)
Source: National accounts (Statistics Norway) and The Ministry of Finance
This figure also illustrates the growth of Norway’s net foreign assets as well as the distribution of net financial assets between the government and the private (non-government) sector in the period 1995–2011. The private sector’s net financial assets have been negative for many years, but the private net debt has not increased much in comparison with GDP after 2000. In addition to the SWF, the Norwegian government also holds considerable stakes in many large domestic companies, making the net financial assets of the government substantially larger than the GPFG, compare the two upper graphs in Figure 2.6
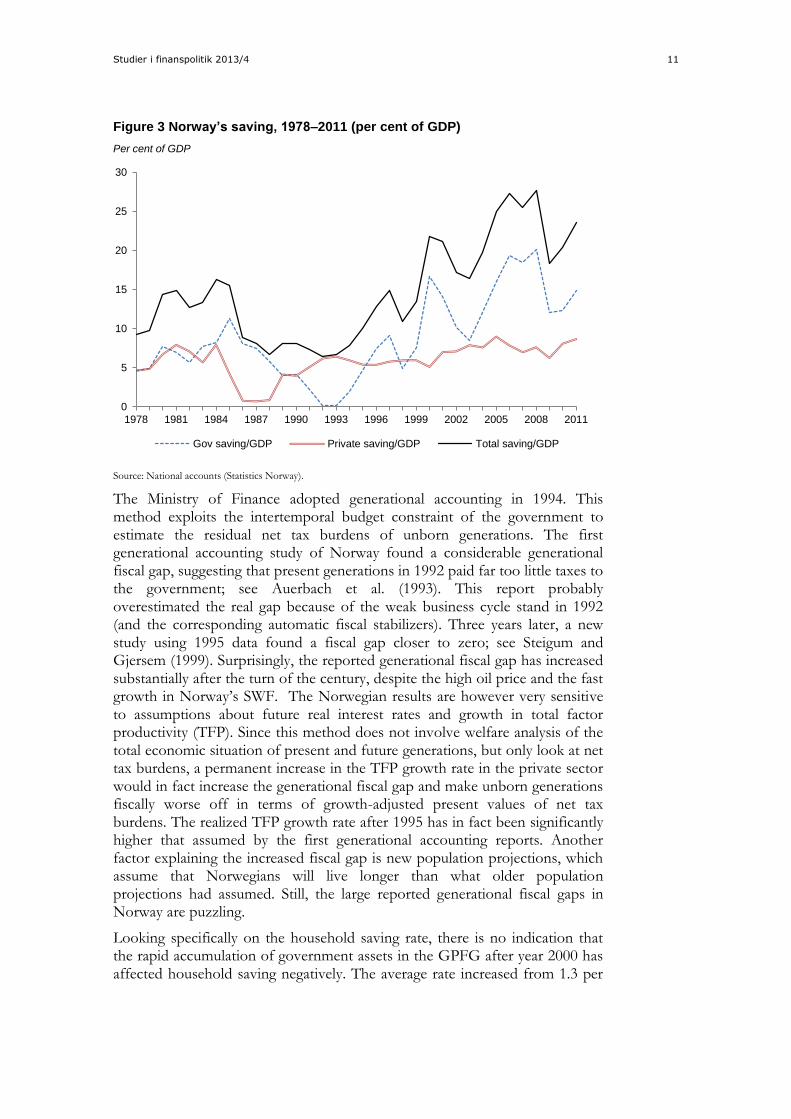
Figure 3 shows that Norway’s total saving is much more correlated with the government’s saving than with private (non-government) saving, particularly after 2000. Again, the fiscal guideline explains why huge government saving due to a high oil price adds to total national saving. Private saving fluctuated a lot in the 1980s due to financial deregulation, and has increased somewhat (in per cent of GDP) after the turn of the century.
6 In addition to GPFG, the Norwegian government also owns a much smaller fund (called The Government Pension Fund Norway), which invests 85 per cent in Norwegian stock and bonds, and 15 per cent in the Nordic countries (except Iceland). The assets under management of this fund were NOK 145 billion ($25.4 billion) by the end of 2012. This is less than 4 per cent of the size of the GPFG, but should also be considered a SWF according to the definition given in Section 1. Many SWFs in Asia and the Middle East have channeled strategic equity stakes in large domestic companies and domestic portfolio investments in their SWFs. The Norwegian government has decided to manage such domestic equity investments completely separate from the two funds, however.
-100
-50
0
50
100
150
200
1995 1997 1999 2001 2003 2005 2007 2009 2011
Net foreign assets Government Private GPFG
Per cent of GDP
Studier i finanspolitik 2013/4 11
Figure 3 Norway’s saving, 1978–2011 (per cent of GDP)
Source: National accounts (Statistics Norway).
The Ministry of Finance adopted generational accounting in 1994. This method exploits the intertemporal budget constraint of the government to estimate the residual net tax burdens of unborn generations. The first generational accounting study of Norway found a considerable generational fiscal gap, suggesting that present generations in 1992 paid far too little taxes to the government; see Auerbach et al. (1993). This report probably overestimated the real gap because of the weak business cycle stand in 1992 (and the corresponding automatic fiscal stabilizers). Three years later, a new study using 1995 data found a fiscal gap closer to zero; see Steigum and Gjersem (1999). Surprisingly, the reported generational fiscal gap has increased substantially after the turn of the century, despite the high oil price and the fast growth in Norway’s SWF. The Norwegian results are however very sensitive to assumptions about future real interest rates and growth in total factor productivity (TFP). Since this method does not involve welfare analysis of the total economic situation of present and future generations, but only look at net tax burdens, a permanent increase in the TFP growth rate in the private sector would in fact increase the generational fiscal gap and make unborn generations fiscally worse off in terms of growth-adjusted present values of net tax burdens. The realized TFP growth rate after 1995 has in fact been significantly higher that assumed by the first generational accounting reports. Another factor explaining the increased fiscal gap is new population projections, which assume that Norwegians will live longer than what older population projections had assumed. Still, the large reported generational fiscal gaps in Norway are puzzling.
Looking specifically on the household saving rate, there is no indication that the rapid accumulation of government assets in the GPFG after year 2000 has affected household saving negatively. The average rate increased from 1.3 per
0
5
10
15
20
25
30
1978 1981 1984 1987 1990 1993 1996 1999 2002 2005 2008 2011
Gov saving/GDP Private saving/GDP Total saving/GDP
Per cent of GDP
12
cent (of disposable income) in the 1980s, to 3.6 per cent in the 1990s, and to 4.3 per cent in the period 2000–2011. Still, the recent growth of the GPFG may have increased the confidence of Norwegian consumers that the Government will indeed deliver the promised pensions, health-, and other welfare services in the future. Such a confidence effect might partly explain Norwegian households’ willingness to take on mortgage debt7.
As explained above, the fiscal guideline is crucial for the strong increase in government saving and the high correlation between current account surpluses and the growth of Norway’s SWF. In regard to the other large oil-related funds in Table 1, lack of transparency makes it difficult to know how the allocations to the funds are linked to petroleum revenues and fiscal policy. In the case of the Alaska Permanent Fund, however, the government of Alaska is free to finance fiscal deficits by borrowing, without running down its SWF, a possibility that is excluded by the Norwegian legal framework. Baker, Besendorfer and Kotlikoff (2002) find that Alaska has the largest intertemporal state budget imbalance (the relative gap between the present value of projected expenditures and receipts) of all 50 US states. Therefore, there is unlikely that the Alaska Permanent Fund has added to the net financial assets by the government of Alaska.
3.2 Non-commodity SWFs
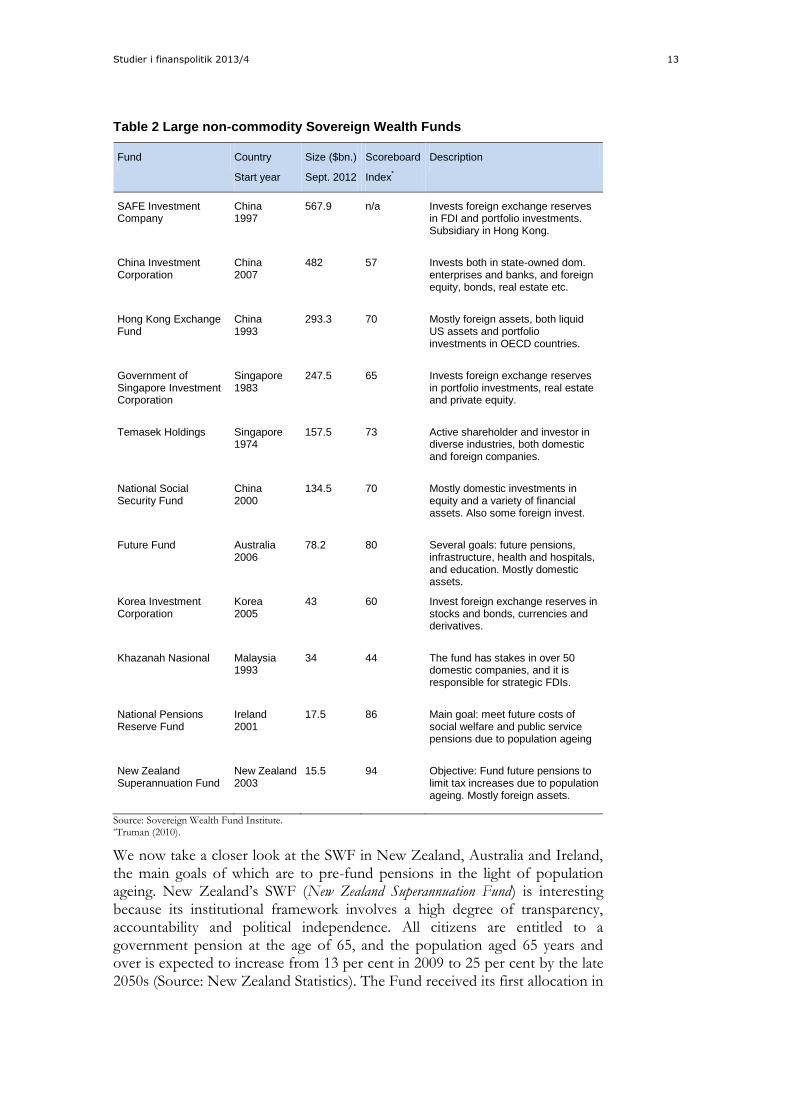
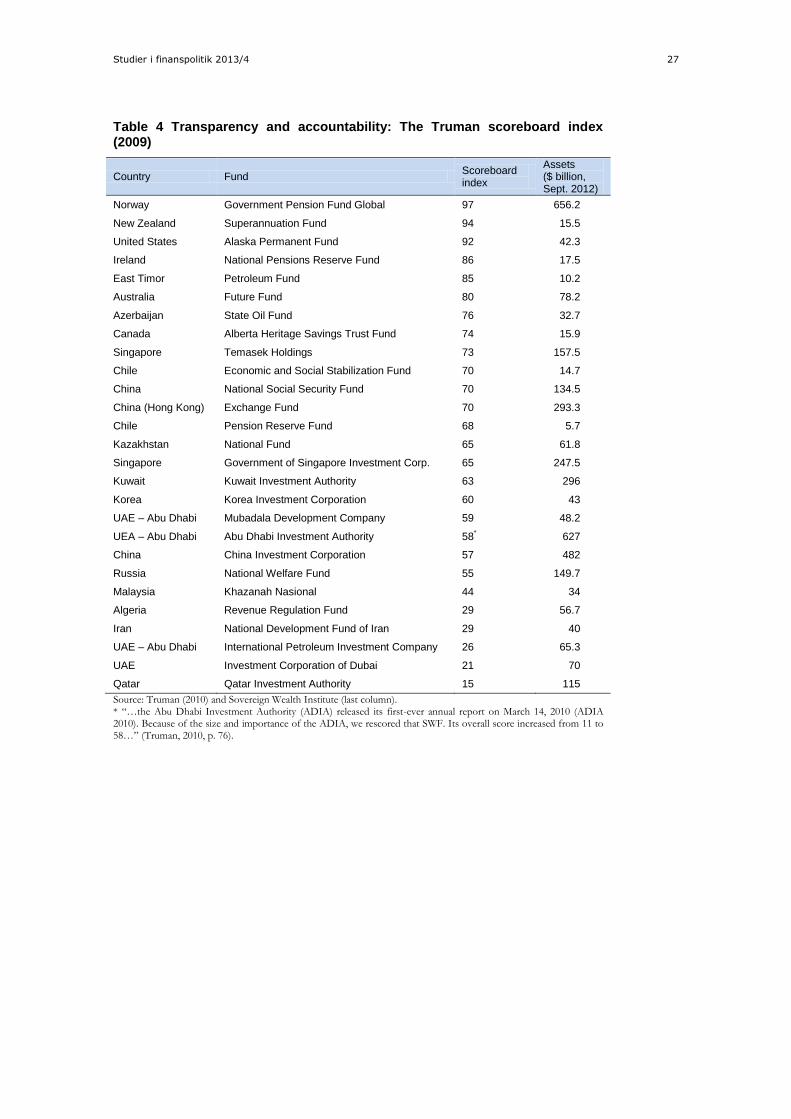
Table 2 gives a more detailed picture of the 11 largest non-commodity SWFs in the world. The table also reports the Truman (2010) “Scoreboard Index”, which is a measure of accountability and transparency. The maximum index number is 100. The scoreboard index will be discussed in Section 6 below.
Both China and Singapore have chosen very high government savings rates, the effects which have been high total saving and large current account surpluses. The alternative to SWFs would have been higher low-interest official currency reserves held by their central banks. In terms of expected long-term returns, this option is inferior to investing in long-term assets such as stock, bonds and real estate. Decades before China ventured into SWFs, the government of Singapore established Temasek Holding (1974) and Government of Singapore Investment Corporation (1983). Both funds have invested a fair share in illiquid, long-term assets (both domestic and foreign), but they are not very transparent. Even less transparent are most of the Chinese SFWs.
7 Total household debt is now above 200 per cent of disposable income. Compared to other Nordic countries, house prices in Norway are very high. Norway’s tax system involves strong incentives to borrow and invest in housing rather than save in terms of financial assets.
Studier i finanspolitik 2013/4 13
Table 2 Large non-commodity Sovereign Wealth Funds
Fund Country
Start year
Size ($bn.)
Sept. 2012
Scoreboard
Index*
Description
SAFE Investment Company
China 1997
567.9 n/a Invests foreign exchange reserves in FDI and portfolio investments. Subsidiary in Hong Kong.
China Investment Corporation
China 2007
482 57 Invests both in state-owned dom. enterprises and banks, and foreign equity, bonds, real estate etc.
Hong Kong Exchange Fund
China 1993
293.3 70 Mostly foreign assets, both liquid US assets and portfolio investments in OECD countries.
Government of Singapore Investment Corporation
Singapore 1983
247.5 65 Invests foreign exchange reserves in portfolio investments, real estate and private equity.
Temasek Holdings Singapore 1974
157.5 73 Active shareholder and investor in diverse industries, both domestic and foreign companies.
National Social Security Fund
China 2000
134.5 70 Mostly domestic investments in equity and a variety of financial assets. Also some foreign invest.
Future Fund Australia 2006
78.2 80 Several goals: future pensions, infrastructure, health and hospitals, and education. Mostly domestic assets.
Korea Investment Corporation
Korea 2005
43 60 Invest foreign exchange reserves in stocks and bonds, currencies and derivatives.
Khazanah Nasional Malaysia 1993
34 44 The fund has stakes in over 50 domestic companies, and it is responsible for strategic FDIs.
National Pensions Reserve Fund
Ireland 2001
17.5 86 Main goal: meet future costs of social welfare and public service pensions due to population ageing
New Zealand Superannuation Fund
New Zealand 2003
15.5 94 Objective: Fund future pensions to limit tax increases due to population ageing. Mostly foreign assets.
Source: Sovereign Wealth Fund Institute. *Truman (2010).
We now take a closer look at the SWF in New Zealand, Australia and Ireland, the main goals of which are to pre-fund pensions in the light of population ageing. New Zealand’s SWF (New Zealand Superannuation Fund) is interesting because its institutional framework involves a high degree of transparency, accountability and political independence. All citizens are entitled to a government pension at the age of 65, and the population aged 65 years and over is expected to increase from 13 per cent in 2009 to 25 per cent by the late 2050s (Source: New Zealand Statistics). The Fund received its first allocation in
14
2003 and the assets under management amount to 11 per cent of GDP in September 2012. The government will begin to withdraw money from the fund to help pay for pensions around 2029/2030. Until then, all investment income is going to be reinvested in the fund.
According to OECD (2005), “New Zealand has been successful in not only getting itself out of the deficit and debt spiral of the 1970s and 1980s, but also in putting in place a set of measures that have provided a role model for prudent management of public finances.”
Through the Fiscal Responsibility Act of 1994, the government succeeded in reducing fiscal spending relative to GDP, as well as running structural budget surpluses. As a result, the central government’s gross public debt declined from more than 60 per cent of GDP in 1994 to 30 per cent in 2000 and 18 per cent in 2008. By 2006, the general government’s net financial asset position was positive. In addition to reducing the burden of the public debt, considerable fiscal surpluses during the boom in 2003-2008 have been allocated to the SWF. During the boom, house prices and housing mortgage debt soared, financed by short-term inbound capital flows.
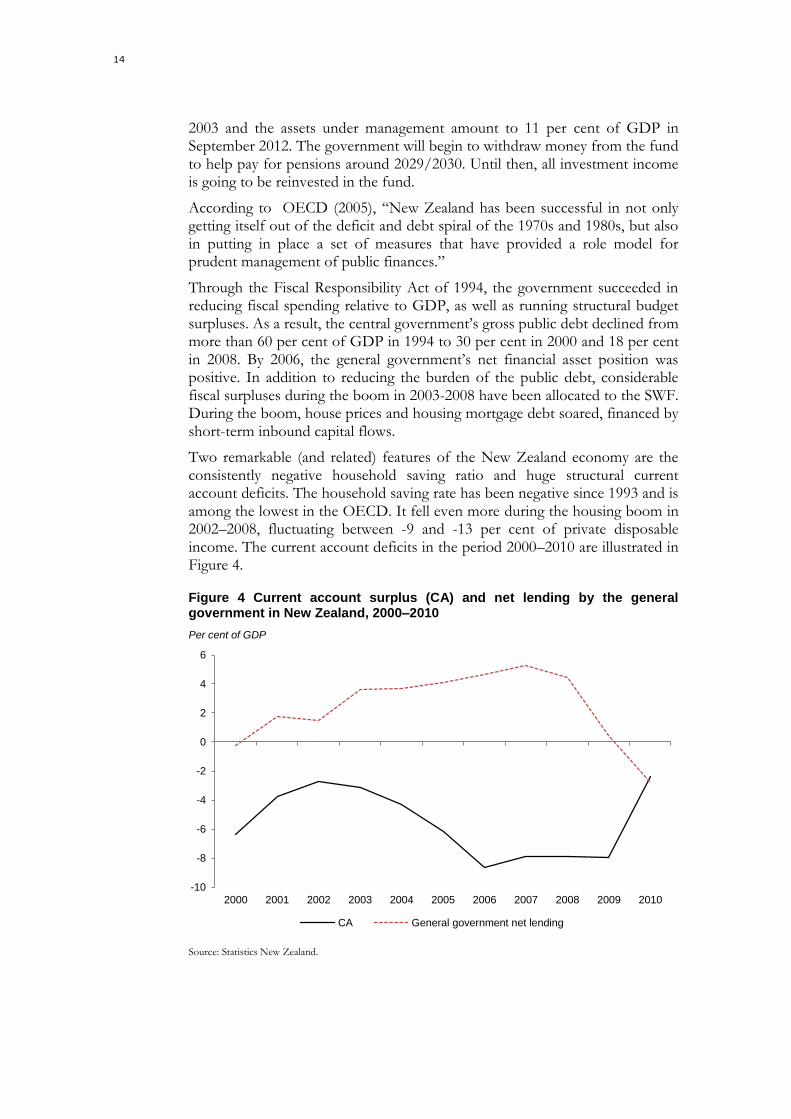
Two remarkable (and related) features of the New Zealand economy are the consistently negative household saving ratio and huge structural current account deficits. The household saving rate has been negative since 1993 and is among the lowest in the OECD. It fell even more during the housing boom in 2002–2008, fluctuating between -9 and -13 per cent of private disposable income. The current account deficits in the period 2000–2010 are illustrated in Figure 4.
Figure 4 Current account surplus (CA) and net lending by the general government in New Zealand, 2000–2010
Source: Statistics New Zealand.
-10
-8
-6
-4
-2
0
2
4
6
2000 2001 2002 2003 2004 2005 2006 2007 2008 2009 2010
CA General government net lending
Per cent of GDP
Studier i finanspolitik 2013/4 15
During the boom, general government net lending fluctuated around 4 per cent of GDP, but then became negative as a result of the recession. In 2008, house prices started to decline and the international economic crisis deteriorated New Zealand’s terms-of-trade and aggregate demand. In 2009, the government temporarily suspended allocations to the fund due to the economic crisis and the corresponding fiscal deficits. New Zealand is one of very few countries (another is Australia, see below) that have built up a SWF at the same time as the country is a huge net capital importer. Still, it is feasible for the government to smooth taxes though a SWF, but only if the government returns to fiscal surpluses to prevent an increase in the tax burden associated with the government debt.
In Australia, the government set up a SWF (The Future Fund) in 2006. The assets under management amount to $78.2 billion (September 2012). Its purpose “is to meet unfunded superannuation liabilities that will become payable during a period when an ageing population is likely to place significant pressure on Commonwealth finances.” (Future Fund, 2012). Withdrawals from the fund is planned to start in 2020.
According to OECD (2008), “public finance is in less worrisome position in Australia than in many other OECD countries”. This is both due to “less unfavorable demographic structure, but above all from the introduction in 1992 of the Superannuation Guarantee – a compulsory funded occupational pension scheme (only the first pillar (the Age Pension) operates on a pay-as-you-go basis), so that the direct budgetary impact of population ageing will be limited.” The Superannuation Guarantee is not a SWF, however, compare the definition of SWFs in Section 1.
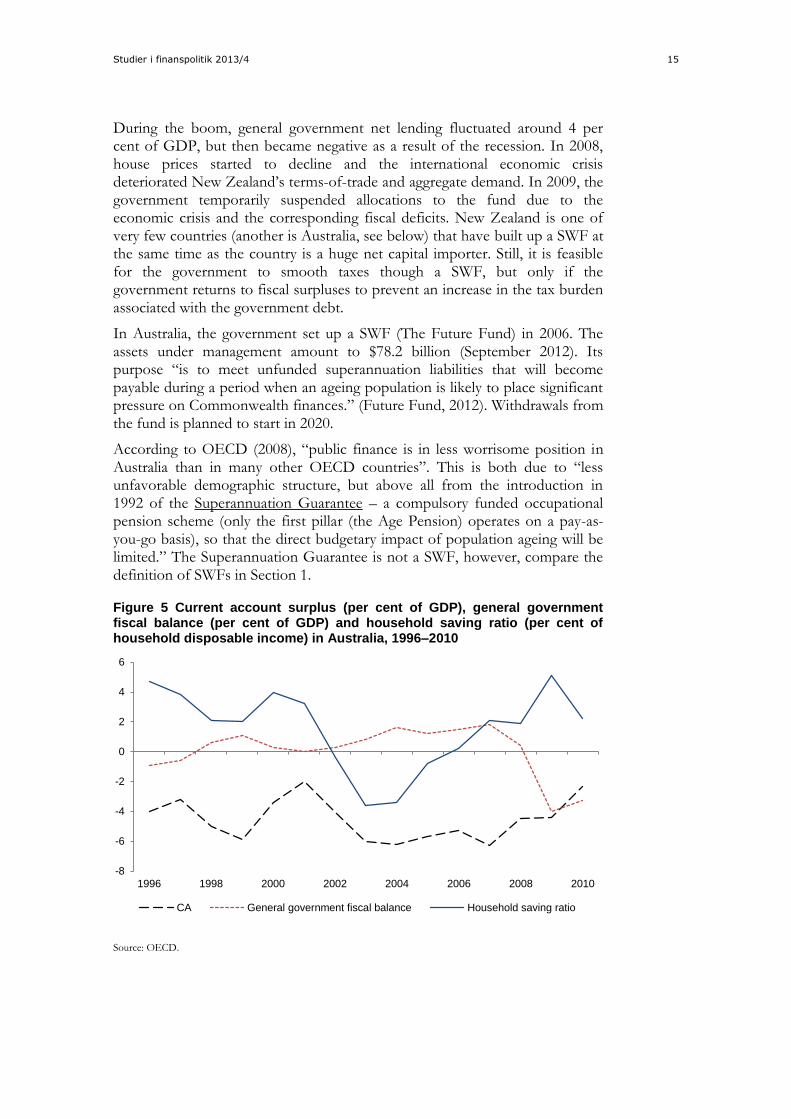
Figure 5 Current account surplus (per cent of GDP), general government fiscal balance (per cent of GDP) and household saving ratio (per cent of household disposable income) in Australia, 1996–2010
Source: OECD.
-8
-6
-4
-2
0
2
4
6
1996 1998 2000 2002 2004 2006 2008 2010
CA General government fiscal balance Household saving ratio
16
The Australian gross public debt is low, and in 2007 the net financial assets of the general government were 7 per cent of GDP in 2007. As in New Zealand, the economic crisis in 2008 triggered fiscal deficits, see Figure 5. This figure illustrates the fiscal balance of the general government as well as the current account deficits and the saving ratio of households in the period 1996 – 2001. Like New Zealand, Australia has run considerable current account deficits during the entire period. The household saving ratio has been low, but not as low as in New Zealand. During the boom in 2002–2006 the household saving ratio of Australian households was negative.
According to the government’s fiscal consolidation plan, real federal expenditure would be limited to less than 2 per cent a year until the return to a budgetary surplus of 1 per cent of GDP. If this plan is followed, projections indicate a return to fiscal surplus by 2013.
In 2009, the Board of Guardians of the Future Fund also became responsible for three small so-called “nation-building funds” (The Building Australia Fund, the Education Investment Fund and the Health and Hospitals Fund). Payments from these funds are determined by the Government, and the assets are liquid. These funds have a different purpose from the Future Fund and their macroeconomic effects are probably quite small.
Ireland set up a SWF (National Pension Reserve Fund) in 2001 with a similar purpose as those in New Zealand and Australia. It was planned to invest fiscal surpluses of 1 per cent of GDP in the fund each year, but the economic crisis in 2009 triggered legislative changes which forced the Fund to invest in Irish banks. The associated losses reduced the fund from 22.7 billion euro from 2010 to 13.4 billion euro in 2011. The new legislation gave the Ministry of Finance significant powers to direct the fund to make investments in Irish Government and Government-guaranteed securities.
Studier i finanspolitik 2013/4 17
4 Investment strategies Most SWFs diversify their asset portfolios among many asset classes and world regions for the purpose of reducing the risk of low realized portfolio returns. They also have a very long investment horizon and they are often not required to transfer wealth income back to the government in the medium run. This makes such funds well equipped to tolerate short-run volatility and illiquidity risk to a greater extent than private pension funds and university endowment funds. Therefore, many SWFs have comparative advantages that could potentially be exploited to harvest risk premia that require long verification periods.
This section deals with issues related to the investment universe, the role of active management, diversification of risk, the risk-return trade-off, other risk factors than systematic market risk and global asset allocation.
Most of the large SWF (which disclose information on their investment strategies) invest in a broad investment universe including listed equity, bonds (fixed income securities), real estate (property), private equity, infrastructure and other illiquid assets. Active management is the rule, and strategic investments in important sectors are not excluded in some funds. The investment strategy of Norway’s GPFG is more conservative and passive (index-based), however, following global benchmark portfolios of listed equity (60 per cent) and bonds (close to 40 per cent), specified by the Ministry of Finance. The Ministry decided to gradually increase the equity share from 40 to 60 per cent in 2007, based on advice from Norges Bank as well as an external Investment Strategy Council. The Fund has recently started to invest in real estate. No strategic investments are permitted and the maximum equity stake in any company is 10 per cent. The scope for active management is also very limited. This investment strategy implies very low management costs, estimated to 6 basis points (0.06 per cent of total assets) in the 2012 Annual Report of the Fund. In comparison, the management costs (in 2011) were 0.45 per cent in New Zealand, 0.68 per cent in Australia and 0.39 per cent in Ireland.
Since the expected rate of return on listed equity generates an expected market risk premium (the equity premium), most SWFs invest a considerable share in listed equity. The choice between listed equity and fixed income securities involves a risk-return trade-off: Increasing the equity share in an investment portfolio increases the expected rate of return from the portfolio, but it also increases the risk of low realized portfolio returns. Historically, the average equity premium in the US had been so high as to be referred to as a “puzzle”, but after 1996, the realized equity premium of GPFG has been close to zero. In other words, the GPFG has not yet generated higher realized returns than a portfolio of fixed-income securities only. Since the standard deviation of the equity risk premium is substantial, these observations do not statistically reject the hypothesis of a positive long-run equity risk premium of 2.5 per cent, say.
In the academic finance literature, the efficient market hypothesis (EMH) has a strong standing. Traditionally, EMH meant that no public information could
18
be used to predict excess returns. Using data up to 1970, Fama (1970) concluded that the empirical evidence supported EMH.8 If EMH is correct, costly active management is inferior to inexpensive passive index management. However, later research has been developed to account for real world “frictions” such as agency conflicts, information costs, financing constraints etc., see Ang, Goetzmann and Schaefer (2009). Including such real frictions in the theory of security prices, gives an economic role of active managers in the pricing process. Grossman and Stiglitz (1976) analyzed a theoretical model in which acquisition of information was costly. Traders who invest in research are rewarded by speculative profits, and this trading activity also pushes asset prices towards their fundamental (non-friction) values. In this model, the markets are always in disequilibrium, but prices are moving towards equilibrium in the absence of new shocks, due to active research and speculations by active managers. In another paper, Ross (1976) developed the Arbitrage Pricing Theory with similar implications for the role of active managers, and Shleifer and Vishny (1997) explored the possibility that disequilibrium could be so persistent that it became risky for arbitrageurs to try to exploit the mispricing, due to constraints on leverage (The market can stay irrational longer than you can stay solvent). Still another theoretical possibility is that active management generates excessive returns, but that the manager hired to invest captures the entire excess return:
“The most influential recent theory about this problem is Berk and Green’s (2004) model of delegation. In their model, investors fail to earn positive risk-adjusted returns, even though their rationally invest with past successful managers. Their model allows some managers to be better than others and have talent above average, it rewards managers for information production, managers earn their fees, but the investment technology has diminishing returns to scale: fund flows push successful managers beyond optimal scale. Hence, in the Berk and Green model, prices may not be efficient, but the market for management services is. While there are gains for active management, these gains do not flow to principals (investors), they are captured entirely by agents (fund managers).” (Ang, Goetzmann and Schaefer, 2009, p. 31).
In conclusion, economic theory suggests that active management could be worthwhile, but that the answer must be left to empirical analysis.
In 2009, The Ministry of Finance hired a group of three academic finance experts to survey the empirical literature of active management and evaluate the track record of Norges Bank’s active management of the SWF, see Ang, Goetzmann and Schaefer (2009). Their analysis was based on the multi-risk-factor theory which we previously referred to as the Arbitrage Pricing Theory. This theory implies that an investor like Norges Bank will be compensated by higher expected returns for taking on the risk implied by various risk factors in addition to market risk. Examples of additional risk factors that are empirically relevant are the “small cap risk factor” (small companies have generated higher
8 According to Ang, Goetzmann and Schaefer (2009), the literature distinguishes between three different levels of EMH: 1) weak form efficiency, 2) semi-strong form efficiency, and 3) strong form efficiency, where the form used above refers to semi-strong efficiency. Fama (1970) found that the evidence supported weak form and semi-strong form of market efficiency.
Studier i finanspolitik 2013/4 19
returns than large companies), volatility risk (many investors are willing to pay implicit “insurance premiums” to receive protection from high volatility) and the “value stocks versus growth stocks” risk (value stocks generate additional expected return compared to growth stocks).
The group argues that if the benchmark is a market-weighted portfolio of all traded securities, both theory and empirical evidence suggests that investors are compensated by exploiting other risk factors than market risk: “In the presence of these multiple systematic risk factors, empirical tests overwhelmingly reject that the market portfolio is efficient and other static or time-varying combinations of assets result in higher reward-to-risk ratios.” If “active management” is defined as deviations from the market portfolio, active management is therefore potentially useful in improving the performance of a SWF like GPFG. The expert group’s empirical analysis finds that Norges Bank’s active management (which historically has been very marginal) has in fact exploited such risk factors, and the group recommends that Norges Bank adopts a more systematic approach by bringing the exposures to systematic risk factors into the benchmark portfolio.
Empirical studies using information on managers and institutions have both looked at retail and non-retail funds, the latter being of more interest to SWFs. Since Norges Bank depends on many external managers, it is still of interest to consider the after-fee performance of investment intermediaries that are much smaller than the GPFG. The expert group concludes that on an after-fee risk adjusted basis, the average mutual fund underperforms a passive portfolio, but that some fund managers have succeeded in out-performing market benchmarks before fees: “However, the evidence does not support the conclusion that superior ability filters through to the ultimate investors in those funds.”
From empirical studies of the non-retail sector, the expert group finds “little convincing evidence of superior risk-adjusted returns to private equity and venture capital.” In regard to hedge funds, however, the group concludes that: “So far, the cumulated evidence suggests that hedge fund manager skill exists and that the rewards to that skill can be passed on to fund investors, depending upon a judicious manager selection process.” A problem for a SWF, however, is that many hedge fund strategies are not scalable. The group refers to a recent study by Teoh (2009) of the size/performance relationship in the hedge funds industry, which finds “strong evidence of a convex (diminishing) relationship between size and risk-adjusted returns, consistent with capacity constraints.”
The expert group’s own empirical analysis of the results of active management by Norges Bank (relative to the performance of the benchmark portfolio of GPFG) in the period 1998 – 2009 concludes that there has not been any significant active outperformance during the entire period. However, it finds that the active management of the equity portion of the Fund has yielded 0.05 per cent per month on average during this period. For fixed income securities, the corresponding rate of return has been zero. Moreover, active management has an “almost trivially small impact on the overall risk of the Fund”. Finding that about 70 per cent of the (very small) equity return to active management is linked to systematic market risk factors, “the contribution of active
20
management to the overall return that is genuinely idiosyncratic is extremely small indeed.”
An important question for investment strategy is the choice of asset allocation on currencies, countries and world regions. Most SWFs diversify significant parts of their assets by investing in many world regions, but there are considerable differences among transparent SFWs that provide such information. Due to deregulations of international capital flows and the process of globalization, the scope of international portfolio diversification has increased enormously during the last 20–25 years. As an illustration, the MSCI Global Equity Index was based on about 1,100 listed companies in 1989. By 2011, the number of companies in this index had increased to 14,600.
One obvious reason for the different investment strategies among SWFs is different investment mandates given by their respective governments. The Australian fund (The Future Fund), for example, has been given a mandate to earn a benchmark return in terms of Australian dollars (“…to receive an average annual return of at least the consumer price index plus 4.5% to 5.5% per annum over the long term with an acceptable but not excessive level of risk”.) This mandate will clearly give incentives to invest in Australia and to hedge currency risk associated with global investments. In contrast, the investment mandate of Norway’s Fund (the GPFG) states that the relevant gauge is the future international purchasing power of the Fund, an implication of which is that the value of the Fund in Norwegian kroner is irrelevant and hedging of currency risk is not necessary.
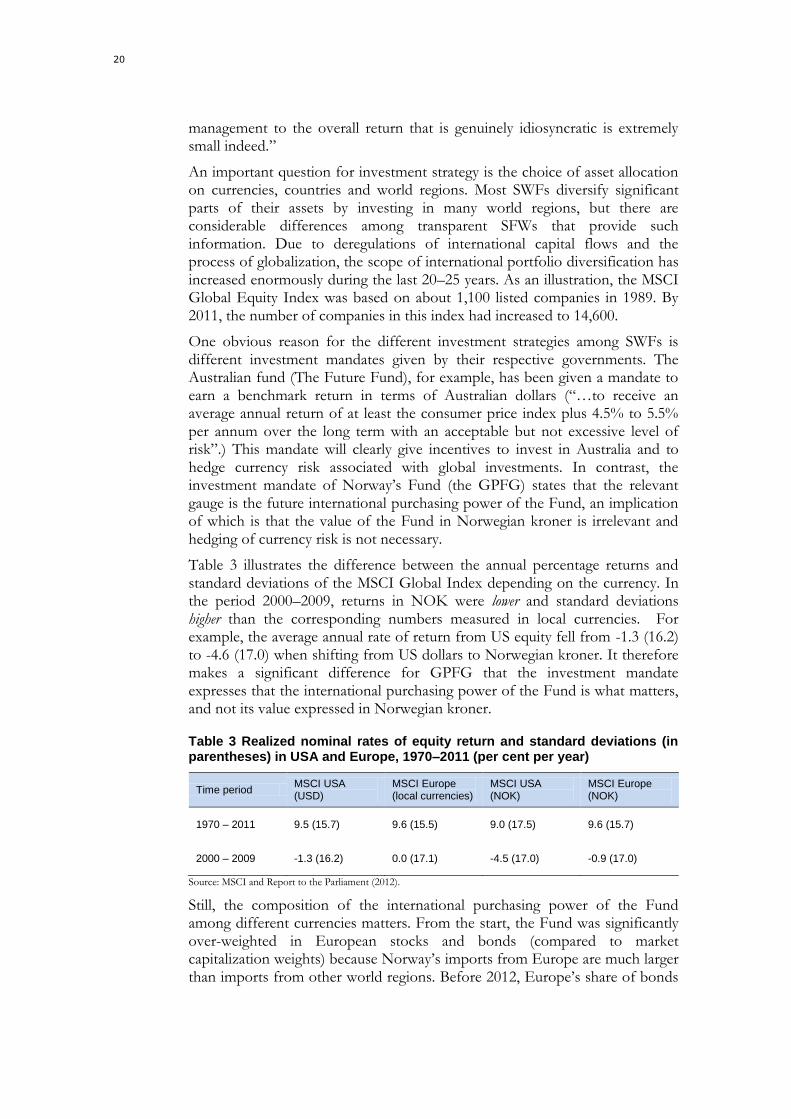
Table 3 illustrates the difference between the annual percentage returns and standard deviations of the MSCI Global Index depending on the currency. In the period 2000–2009, returns in NOK were lower and standard deviations higher than the corresponding numbers measured in local currencies. For example, the average annual rate of return from US equity fell from -1.3 (16.2) to -4.6 (17.0) when shifting from US dollars to Norwegian kroner. It therefore makes a significant difference for GPFG that the investment mandate expresses that the international purchasing power of the Fund is what matters, and not its value expressed in Norwegian kroner.
Table 3 Realized nominal rates of equity return and standard deviations (in parentheses) in USA and Europe, 1970–2011 (per cent per year)
Time period MSCI USA (USD)
MSCI Europe (local currencies)
MSCI USA (NOK)
MSCI Europe (NOK)
1970 – 2011 9.5 (15.7) 9.6 (15.5) 9.0 (17.5) 9.6 (15.7)
2000 – 2009 -1.3 (16.2) 0.0 (17.1) -4.5 (17.0) -0.9 (17.0)
Source: MSCI and Report to the Parliament (2012).
Still, the composition of the international purchasing power of the Fund among different currencies matters. From the start, the Fund was significantly over-weighted in European stocks and bonds (compared to market capitalization weights) because Norway’s imports from Europe are much larger than imports from other world regions. Before 2012, Europe’s share of bonds
Studier i finanspolitik 2013/4 21
and equity in the benchmark portfolio were 60 and 50 per cent respectively. The idea was that currency risk would be lower if currencies of the investment returns correspond to the currencies of future imports.
This argument assumes persistent deviations from purchasing power parities. To what extent such deviations are empirically important in the long run is uncertain. Moreover, modern corporations operate in many world regions and their economic activities are not confined to the country of the stock exchange where they are listed. Another argument against linking portfolio weights too close to expected import shares is that Norway’s GDP is more correlated with Europe’s GDP than with the GDP in other world regions. This involves more risk than investing in low GDP-correlated countries like emerging markets. Furthermore, Europe’s share of world GDP is trending downwards. In 2012, The Ministry of Finance changed the strategic benchmark portfolio in a way that effectively reduced Europe’s portfolio shares of listed equity and bonds.
The European debt crisis illustrates a problem with the world market portfolio of government bonds: The market weights of those countries that issue excessive amounts of government debt will automatically go up. Following international best practice, The Ministry of Finance has decided to use GDP-weights as an alternative to market weights for government bonds.
22
5 Macroeconomic effects of SWFs in small open welfare states The potential macroeconomic effects of a SWF are in most cases similar to government assets that are not defined as SWF according to the definition of the International Forum of SWFs, for example other pension funds than reserve funds and international reserves. In what follows, we will not consider an oil-rich country. We have already explained why the set-up of a SWF to transform petroleum wealth under the ground to foreign financial assets, would improve economic welfare, see Section 3 above. Unfortunately, there exist no research studies that have estimated macroeconomic effects of SWFs. Our discussion of likely macroeconomic effects is therefore bound to be qualitative and suggestive. To sharpen the discussion, we focus our attention on potential macroeconomic effects of SWFs in democratic welfare states, which are also small, open economies that do not significantly influence world market real rates of interest.
A small open economy can escape the law of diminishing return to capital by investing in net foreign assets. A problem, however, is their risk exposure to international trade shocks and other national income shocks. Small open economies need a specialized sector producing internationally tradable goods and services. In practice it is not possible for a country to obtain insurance against trade shocks in global markets. In terms of the familiar understatement of economic theorists: The set of global insurance and capital markets is “incomplete”. Therefore, the government’s fiscal policy (together with monetary policy if the exchange rate is flexible) is potentially important for reducing the adverse effects of trade shocks; see Steigum and Thøgersen (2003).
In welfare states, tax wedges on labor income are relatively high, and the social costs of tax distortions are substantial. Moreover, the governments of welfare states fill an important role as provider of social insurance to its citizens.9 Such welfare programs, like old age and disability pension systems, are usually financed on a pay-as-you-go basis and are vulnerable to population ageing. Since the governments of welfare states run universal social insurance programs, it is essential that the governments themselves have a considerable permanent risk-bearing capacity.10 The current debt crisis in Europe demonstrates the possibility that governments become financially weak and overburdened and cannot continue to fulfill their social insurance promises to their citizens.
9 In the literature of politico-economic models with rational voting, the existence of income redistribution financed by distortionary taxes can be explained even in the absence of any social insurance benefits to households, see Meltzer and Richard (1981). Extending such a model to dynamic voting in an overlapping generations framework where households are risk-neutral, Hassler et al. (2003) found that welfare state policies and their effects on income distribution are persistent in the sense that shocks to income distribution that would have negative transitory effects on income distribution if policies were exogenous may lead to a permanent increase in the demand for redistributive policies. There are, however, multiple equilibria, suggesting that welfare state institutions are “intrinsically fragile”.
10 Thus, the precautionary savings motive is relevant for rational welfare state governments, see Auerbach and Hassett (2007) and van der Ploeg (2010).
Studier i finanspolitik 2013/4 23
Can accumulation of foreign assets in a SWF have positive macroeconomic effects for a government of a welfare state? In general, the objectives of the government’s economic policy can be grouped into the following three categories:
1. Economic efficiency and sustainable economic growth
2. Macroeconomic stabilization
3. Income distribution and social insurance, including intergenerational equity and risk sharing among generations.
We will argue that a SWF could potentially be an instrument for the government to contribute positively, directly or indirectly, to all three objectives.
An example of the first objective is the tax rate smoothing effect of government asset accumulation. The combination of expected population ageing and unfunded government pension systems would otherwise necessitate higher tax rates on labor income in the future. A policy that keeps expected tax rates constant over time will reduce tax distortions and increase economic efficiency, see Barro (1979).
In regard to macroeconomic stabilization, a SWF makes it less risky for a government to increase aggregate demand through expansionary fiscal policy in the wake of adverse trade shocks or other income shocks. Examples are the economic policy in Australia, New Zealand and Norway during the great recession in 2009. All three countries have adopted flexible inflation targeting, and monetary policy (together with automatic fiscal stabilizers) is usually sufficient to reduce macroeconomic fluctuations related to aggregate demand shocks. In the economic crisis in 2009, however, monetary policy was not sufficient. In Norway, for example, the government put in place extraordinary fiscal stimulus policies. The expansionary monetary and fiscal policies in 2009 and 2010 even stopped and reversed a modest decline in housing prices, boosting consume confidence and aggregate demand. During the great international recession, Norway’s unemployment rate only increased marginally. Of course, expansionary fiscal policy is possible without a SWF, but a SWF reduces the risk that a government could become financially too weak in a crisis situation.
From economic theory it is well known that in the absence of distortionary taxation, government debt or asset accumulation would not affect the size and composition of aggregate national wealth and intergenerational distribution if the hypothesis of “Ricardian equivalence” holds. Then private households in the aggregate make inverse savings and portfolio decisions that neutralize the effects of the SWF on the nation´s saving and assets. It is likely, however, that consumers in practice are insufficiently informed or concerned about the effects of fiscal policies beyond their own lifetimes to neutralize the build-up of a SWF in this way. Insufficient household capacity to borrow and other constraints would also prevent many households from sufficiently negative saving (or going short in equities in which the SWF invests). If a government builds up a SWF and thereby keeps labor income tax rates temporarily higher
24
than otherwise, national wealth is likely to increase because workers will chose lower private consumption than otherwise. In the long run, a permanent SWF would permit permanently lower taxes, which would increase private wealth as well. Persson (1985) shows that in an overlapping generations model of a small open economy, an increase in government financial assets will crowd in private wealth in the long run. In other words, national wealth will eventually increase more than the isolated effect of the increase in government wealth. Thus, increased government wealth through a SWF is likely to increase the welfare of future generations, counteracting the negative effects of pay-as-you-go programs and population ageing.
A SWF could also contribute to better income risk sharing between generations in a way that private markets cannot do, see Gordon and Varian (1988).11 They analyzed a simple non-Keynesian model of a closed economy where the government could transfer income between generations without investing in assets or selling bonds. Clearly, in a small open economy, a SWF could facilitate such social insurance programs. If one generation is negatively affected by an income shock, fiscal policy can redistribute income between generations by running down the SWF and smoothing the cost among many generations. In an open economy, the government can also strengthen its social insurance capacity by benefitting from international risk sharing, and thus make national income better insured against trade shocks and other income shocks. Recent contributions to the international risk-sharing literature have documented that the previous “home bias” in portfolios of stocks and bonds has declined substantially and international (consumption) risk sharing has increased in the last two decades, see Lane and Milesi-Ferretti (2008), Sørensen et al. (2007) and Bai and Zhang (2012). Fratzscher and Imbs (2009) find that low transaction cost financial assets in particular, like stock and bonds, have increased international risk sharing, see also Holinski, Kool and Muysken (2012).
We have argued that a small open welfare state could potentially benefit from a SWF. Another question is whether this is politically possible. To build up a SWF, a broad agreement among political parties appears to be necessary. If only one of two opposing parties wants a SWF in a democracy, the other party would deplete the Fund as soon as it won an election (and may also dismantle the welfare state as well). In Norway and other Nordic countries, the social insurance provided by the welfare state is very popular and no political party wants to dismantle the welfare state. Norwegian voters are generally in favor of the SWF and the fiscal guideline that makes it possible to run fiscal surpluses that are invested in the Fund. In politically more divided democracies, such a fiscal rule could be impossible to agree upon, and political competition would make it infeasible to establish a SWF.
11 Markets cannot allocate risk efficiently between any generations whenever the generations are not able to sign insurance contracts prior to the occurrence of the stochastic event.
Studier i finanspolitik 2013/4 25
6 Accountability and transparency: Political and ethical constraints In a democracy, the SWF needs political legitimacy and must be accountable to the government and the general public. The investment strategy must be transparent and based on ethical (“responsible”) investment practice.
Norway’s SWF (GPFG) began to invest in listed equity in 1998, and from the start, the list of companies was published regularly by Norges Bank. The list received a lot of attention in the media and among politicians in Parliament that were skeptical to the idea of a “capitalist” public fund that should merely focus on expected financial return and risk. The government responded to this critique by excluding from the benchmark portfolio companies the produced weapons such as anti-personnel land mines, cluster munitions and nuclear arms. Exclusion on the basis of human rights violations was also permitted. In 2004, new ethical guidelines for the GPFG and The Ethical Council were established. In addition to an exclusion mechanism, the new ethical guidelines also emphasized the role of “active ownership” as a tool for complying with the ethical obligations of the Fund. The ethical guidelines were evaluated in 2009. According to the White Paper (2012): “The evaluation resulted in a more comprehensive strategy for responsible investment practice.”
Tools of active ownership include exercising shareholder voting rights, dialogue with management, collaboration with other shareholders, participation in international networks and organizations, input to regulatory authorities, contact with research institutions, and public communication of opinions and expectations. In 2011, the Bank voted in more than 11,300 general shareholder meetings, through an external voting platform.12 Although Norges Bank cannot own more than 10 per cent of any company according to its investment mandate, it is often one of the major shareholders in many companies, giving the Bank some potential influence on board compositions and nomination processes. In some few cases, Norges Bank uses legal action, such as litigation, as a tool in its active ownership structure.13
According to the Ministry of Finance´s guidelines for observation and exclusion from the GPFG’s investment universe, the criteria for exclusion are the nature of the products (tobacco and certain military weapons), selling weapons to specific countries, or “contribute to, or are themselves responsible for, grossly unethical activities” (such as corruption or causing “severe environmental damage”). Up until now, the Ministry has excluded 55 companies, on the basis of advice from the Council of Ethics. Five companies
12 The voting platform issues voting instructions on behalf of the Bank. The instructions are sent from the electronic voting platform to Norges Bank’s global custodian bank, which implements the voting in the general shareholder meetings, often assisted by local custodian banks or other representatives.
13 “In 2010, the Bank and some German investors requested a German court to examine whether the board of directors of Porsche SE had exceeded its powers and exposed the company to excessive risk in its attempt to acquire control of Volkswagen AG. In 2011, there was no longer any basis for pursuing the request after the German investors negotiated a solution that resulted in Porsche paying an extraordinary dividend to the holders of preferred shares and undertaking to improve corporate governance.” (White Paper (2012)).
26
have been allowed to return to the investment universe because their exclusions were no longer considered to be justified.
What about the financial costs to the Fund of the exclusions? An empirical study by Norges Bank compared the portfolios without and with the exclusions from August 2005 to November 2011. The results are reported in the White Paper (2012). During this period, the portfolio without exclusions was NOK 10.6 billion ($1.83 billion) higher than the portfolio with exclusions. It is mostly the exclusion of tobacco-producing companies that explains this difference.
Truman (2010) has suggested a scoreboard to assess the accountability and transparency of a number of SWFs. The score board consists of 33 elements grouped into the following four categories:
1. Structure of the fund, including its objectives, links to the government’s fiscal policy.
2. Governance of the fund, including the roles of the government, and whether the fund follows guidelines for corporate social responsibility.
3. Accountability and transparency of the fund in its investment strategy, investment activities, reporting, and audits.
4. Behavior of the fund in managing its portfolio and its risk management policies, including its use of leverage and derivatives.
Table 4 shows the results for the funds that we have previously listed in Table 1 and 2 above. As expected, the Funds from democratic countries receive the highest score.
The International working group of sovereign wealth funds (IWG) – under the aegis of IMF – established in 2008 a code of conduct, called the Generally Accepted Principles and Practices (a set of minimum best practices for SWFs, the so-called “Santiago Principles”). They consists of 30 principles and sub-principles and are strongly influenced by the Truman scoreboard, but are somewhat watered down. For example, the Santiago principles are not ambitious with respect to public disclosure of an annual report stating the size of the fund or other information that are important for transparency. For more details, see Truman (2010).
Studier i finanspolitik 2013/4 27
Table 4 Transparency and accountability: The Truman scoreboard index (2009)
Country Fund Scoreboard index
Assets ($ billion, Sept. 2012)
Norway Government Pension Fund Global 97 656.2
New Zealand Superannuation Fund 94 15.5
United States Alaska Permanent Fund 92 42.3
Ireland National Pensions Reserve Fund 86 17.5
East Timor Petroleum Fund 85 10.2
Australia Future Fund 80 78.2
Azerbaijan State Oil Fund 76 32.7
Canada Alberta Heritage Savings Trust Fund 74 15.9
Singapore Temasek Holdings 73 157.5
Chile Economic and Social Stabilization Fund 70 14.7
China National Social Security Fund 70 134.5
China (Hong Kong) Exchange Fund 70 293.3
Chile Pension Reserve Fund 68 5.7
Kazakhstan National Fund 65 61.8
Singapore Government of Singapore Investment Corp. 65 247.5
Kuwait Kuwait Investment Authority 63 296
Korea Korea Investment Corporation 60 43
UAE – Abu Dhabi Mubadala Development Company 59 48.2
UEA – Abu Dhabi Abu Dhabi Investment Authority 58* 627
China China Investment Corporation 57 482
Russia National Welfare Fund 55 149.7
Malaysia Khazanah Nasional 44 34
Algeria Revenue Regulation Fund 29 56.7
Iran National Development Fund of Iran 29 40
UAE – Abu Dhabi International Petroleum Investment Company 26 65.3
UAE Investment Corporation of Dubai 21 70
Qatar Qatar Investment Authority 15 115
Source: Truman (2010) and Sovereign Wealth Institute (last column). * “…the Abu Dhabi Investment Authority (ADIA) released its first-ever annual report on March 14, 2010 (ADIA 2010). Because of the size and importance of the ADIA, we rescored that SWF. Its overall score increased from 11 to 58…” (Truman, 2010, p. 76).
28
7 Conclusions Sovereign wealth funds (SWFs) have become more numerous after the turn of the century, but the largest ones have been built by non-democratic countries in the Middle East and Asia. Among democratic societies, Norway’s oil-related fund is an exception. Smaller SWFs have been set up in Australia, New Zealand and Ireland to pre-fund pensions in response to expected population ageing.
The management of Norway’s Fund has been index-based, with only a very small role played by active management. In most other SWFs around the world, active management is much more important, and the cost of management is much higher.
The academic literature suggests that although active management could be worthwhile, it does not lend unambiguous support to the common belief that active management generates excess risk-adjusted returns after management fees. An empirical study of active management in Norges Bank finds that 70 per cent of the active management results can be explained by systematic market risk factors.
There are no strong consensus about how a global fund should diversify its assets among asset classes and currencies. This also depends on how the investment mandate is formulated. It makes a significant difference whether the mandate requires the investment returns to be measured in local currencies or the domestic currency. In recent years, there has been a shift from market weights to GDP-weights in portfolios of sovereign government bonds.
We argue that SWFs could have positive macroeconomic effects in democratic welfare states, particularly if the government runs pension programs financed on a pay-as-you-go basis, and future population ageing is significant. Still, a SWF is hardly politically feasible if there is no broad agreement in the electorate and among political parties that fiscal surpluses and a SWF is worthwhile.
Studier i finanspolitik 2013/4 29
References ADIA (Abu Dhabi Investment Authority, 2010) ADIA Annual Review 2009.
Available at www.adia.ae (accessed on July 12, 2010).
Ang, A., W. N. Goetzman and S. M. Schafer (2009) “Evaluation of active management of the Norwegian Government Pension Fund – Global”. The Ministry of Finance, Oslo.
Auerbach, A. J., J. Gokhale, L. J. Kotlikoff, and E. Steigum (1993) Generational accounting in Norway: Is Norway overconsuming its petroleum wealth? SNF Report 75/1993, Norwegian School of Economics and Business Administration, Bergen.
Auerbach, A. and K. Hassett (2007) “Optimal long-run fiscal policy: Constraints, preferences and the resolution of uncertainty”, Journal of Economic Dynamics and Control 31, 1451 – 1472.
Bai, Y. and J. Zhang (2012) “Financial integration and international risk sharing”, Journal of International Economics 86, Issue 1, January, 17 – 32.
Baker, B, D. Besendorfer and L.J. Kotlikoff (2002) ”Intertemporal state budgeting”. www.kotlikoff.net/content/intertemporal-state-budgeting.
Berk, J. and R.C. Green (2004) “Mutual fund flows and performance in rational markets”, Journal of Political Economy 112, 1269 – 1295.
Barro, R. (1979) “On the determination of public debt”. Journal of Political Economy 87, 940 – 971.
Fama, E.F. (1970) “Efficient capital markets: A review of theory and empirical work”, Journal of Finance 25, 383 – 41.
Fratzscher, M. and J. Imbs (2009) “Risk sharing, finance and institutions in international portfolios”, Journal of Financial Economics 94, 428 – 447.
Future Fund (2012) Annual Report 2011/2012. Future Fund Board of Guardians. Melbourne.
Gordon, R.H. and H.R. Varian (1988) “Intergenerational risk sharing”, Journal of Public Economics 37, 185 – 202.
Grossman, S.J. and J.E. Stiglitz (1976) “Information and competitive price systems”, American Economic Review 66, 246 – 253.
Hassler, J., J.V. Rodriguez Mora, K. Storesletten, and F.Zilibotti (2003) “The survival of the welfare state”, American Economic Review, March, 87 – 112.
Holinski, N., C. Kool and J Muysken (2012) “The impact of international portfolio composition on consumption risk sharing”, Journal of International Money and Finance 31, issue 6, October.
Lane, P. and G.M. Milesi-Ferretti (2008) ”International investment patterns. The Review of Economics and Statistics 90 (03), 538 – 549.
Meltzer, A.H. and R.F. Scott (1981) “A rational theory of the size of government”, Journal of Political Economy 89(5), October, 914 – 927.
Norges Bank Investment Management (2013). Annual Report 2012.
New Zealand Superannuation Fund (2012). Annual Report 2012.
OECD (2005) OECD Economic Surveys. New Zealand. Vol. 2005/15, September.
30
OECD (2008) OECD Economic Surveys. Australia. Vol. 2008/18, October.
Ross, S. A. (1976) “The Arbitrage Theory of Capital Asset Pricing”, Journal of Economic Theory 13, 341 – 360.
Rozanov, A. (2005) ”Who holds the wealth of nations?” Central Banking Journal 15, No.4 (May), 52-57.
Shleifer A. and R.W. Vishny (1997) “The Limits of Arbitrage”, Journal of Finance 52, 35 – 55.
Steigum, E. and C. E. Gjersem (1999) “Generational accounting and depletable natural resources: The case of Norway”. In A. J. Auerbach, L.. J. Kotlikoff & W. Leibfritz (eds.), Generational Accounting around the World. NBER Project Report. The University of Chicago Press, Chicago.
Steigum, E. and Ø. Thøgersen (2003) “Borrow and adjust - Fiscal policy and sectoral
adjustment in an open economy.” International Economic Review 44, No 2, May.
Sørensen, B.E., Y.-T. Wu, O. Yosha, and Y. Zhu (2007) ”Home bias and international risk sharing: Twin puzzles separated at birth” Journal of International Money and Finance 26, Issue 4, June
Theo, M. (2009) “Does size matter in the hedge fund industry? SSRN Working Paper.
Truman, E. M. (2010). Sovereign Wealth Funds. Threat or Salvation? Peterson Institute for International Economics. Washington DC.
van der Ploeg, F. (2010) “Aggressive oil extraction and precautionary saving: coping with volatility.” Journal of Public Economics, 94(5-6), 421 – 433.
White Paper (2012) The Management of the Government Pension Fund in 2011, (Meld. St. 17 (2011-2012), The Ministry of Finance, Oslo.
Studier i finanspolitik 2008/1 Alan Auerbach: Long-term objectives for government debt. 2008/2 Roel Beetsma: A survey of the effects of discretionary fiscal policy. 2008/3 Frederick van der Ploeg: Structural reforms, public investment and the fiscal stance: A prudent approach. 2008/4 Anders Forslund: Den svenska jämviktsarbetslösheten: En översikt. 2008/5 Per Molander och Gert Paulsson: Vidareutveckling av det finanspolitiska regelverket. 2008/6 Andreas Westermark: Lönebildningen i Sverige 1966–2009. 2008/7 Ann Öberg: Incitamentseffekter av slopad fastighetsskatt. 2009/1 Clas Bergström: Finanskrisen och den svenska krishanteringen under hösten 2008 och vintern 2009. 2009/2 Martin Flodén: Automatic fiscal stabilizers in Sweden 1998–2009. 2009/3 Rikard Forslid och Karen Helene Ulltveit-Moe: Industripolitik för den svenska fordonsindustrin. 2009/4 Alan B. Krueger och Mikael Lindahl: An evaluation of selected reforms to education and labour market policy in Sweden. 2009/5 Per Molander: Net wealth analysis and long-term fiscal policymaking. 2009/6 Oskar Nordström Skans: Varför är den svenska ungdomsarbetslösheten så hög? 2009/7 Gabriella Sjögren Lindquist och Eskil Wadensjö: Arbetsmarknaden för de äldre. 2010/1 Michael Bergman: Hur varaktig är en förändring i arbetslösheten? 2010/2 Michael Bergman: Har finanspolitik omvända effekter under omfattande budgetsaneringar? Den svenska budgetsaneringen 1994– 1997. 2010/3 Huixin Bi och Eric M. Leeper: Sovereign debt risk premia and fiscal policy in Sweden. 2010/4 David Dreyer Lassen: Fiscal consolidations in advanced industrialized democracies: Economics, politics, and governance. 2010/5 Pathric Hägglund och Peter Skogman Thoursie: De senaste reformerna inom sjukförsäkringen: En diskussion om deras förväntade effekter.
2010/6 Christopher A Pissarides: Regular education as a tool of countercyclical employment policy. 2010/7 Per Skedinger: Hur fungerar arbetsmarknadspolitiken under olika konjunkturlägen? 2010/8 Lars Calmfors: Fiscal policy coordination in Europe. 2010/9 Lars Calmfors: The role of independent fiscal policy institutions. 2011/1 Helge Bennmarker, Lars Calmfors och Anna Larsson: Wage formation and the Swedish labour market reforms 2007–2009. 2011/2 Michael Bergman: Tidsbestämning av svensk konjunktur 1970–2010. 2011/3 Peter Fredriksson och Jonas Vlachos: Reformer och resultat: Kommer regeringens utbildningsreformer att ha någon betydelse? 2012/1 Christian Hagist, Stefan Moog och Bernd Raffelhüschen: A generational accounting
analysis of Sweden. 2012/2 Göran Hjelm och Ulla Robling: Utveckling av de offentliga finanserna till 2020 vid fem
olika makroekonomiska scenarier. 2012/3 Georg Marthin: Measuring mismatch in the Swedish labour market. 2012/4 Jesper Roine: Varför ska vi bry oss om fördelningsfrågor? En översikt om relationen
mellan ekonomi, politik och fördelning. 2012/5 Gabriella Sjögren Lindquist och Eskil Wadensjö: Inkomstfördelningen bland
pensionärer. 2012/6 Daniel Waldenström: Regeringen och ojämnlikheten: En granskning av budgetens
fördelningspolitiska redogörelser 1992–2011. 2013/1 Per Molander och Jörgen Holmquist: Reforming Sweden’s budgetary institutions –
Background, design and experiences. 2013/2 Konjunkturinstitutet: Effekter på inkomstfördelning och arbetsutbud av olika
regelförändringar simulerade med FASIT. 2013/3 Statens väg- och transportforskningsinstitut (VTI): Systemic errors in the transport
sector. 2013/4 Erling Steigum: Sovereign wealth funds for macroeconomic purposes. 2013/5 Peter Birch Sørensen: The Swedish housing market: Trends and risks.