Embed Size (px)
Citation preview
-II
The physics of sound waves is the basis of countless studies in the research journals of many fields. Here are just a few examples. Some physiologists are concerned with how speech is produced, how speech impairment might be corrected, how hearing loss can be alleviated, and even how snoring is produced. Some acoustic engineers are concerned with improving the acoustics of cathedrals and concert halls, with reducing noise near freeways and road construction, and with reproducing music by speaker systems. Some aviation engineers are concerned with the shock waves produced by supersonic aircraft and the aircraft noise produced in communities near an airport. Some medical researchers are concerned with how noises produced by the heart and lungs can signal a medical problem in a patient. Some paleontologists are concerned with how a dinosaur's fossil might reveal the dinosaur's vocalizations. Some military engineers are concerned with how the sounds of sniper fire might allow a soldier to pinpoint the sniper's location, and, on the gentler side, some biologists are concerned with how a cat purrs.
To begin our discussion of the physics of sound, we must first answer the question "What are sound waves?"
Sound Waves As we saw in Chapter 16, mechanical waves are waves that require a material medium to exist. There are two types of mechanical waves: Transverse waves involve oscillations perpendicular to the direction in which the wave travels; longitudinal waves involve oscillations parallel to the direction of wave travel.
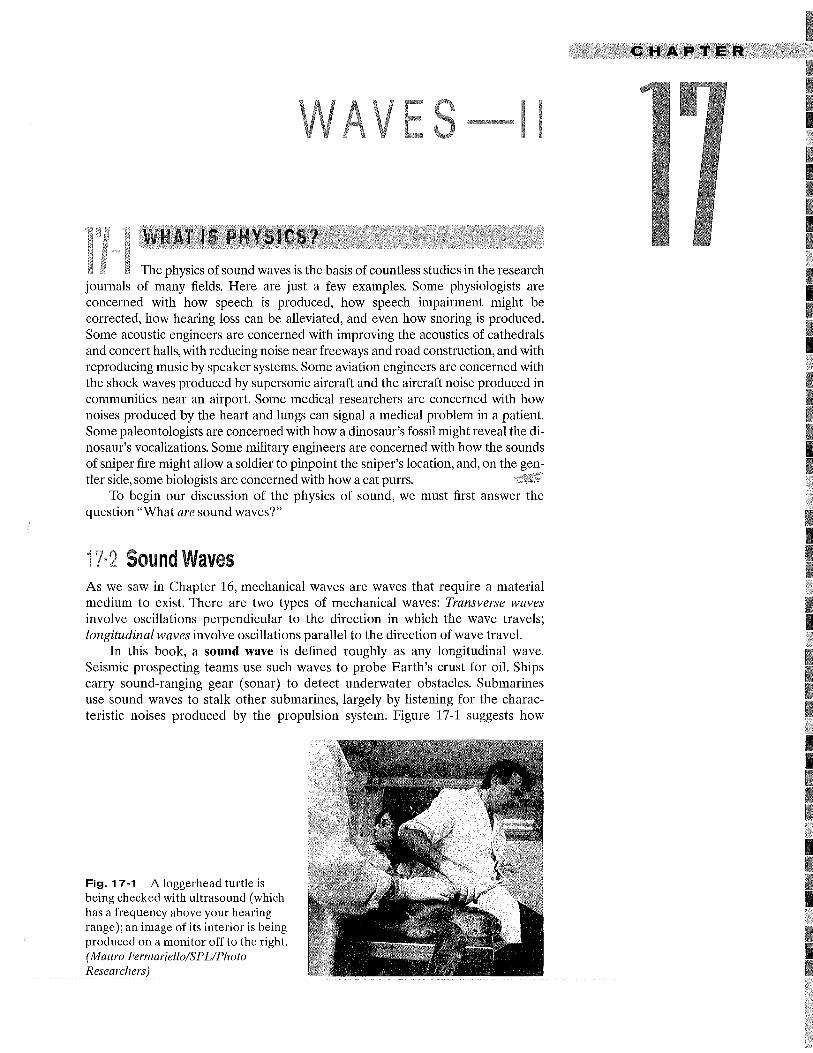
In this book, a sound wave is defined roughly as any longitudinal wave. Seismic prospecting teams use such waves to probe Earth's crust for oil. Ships carry sound-ranging gear (sonar) to detect underwater obstacles. Submarines use sound waves to stalk other submarines, largely by listening for the characteristic noises produced by the propulsion system. Figure 17-1 suggests how
Fig. 17-1 A loggerhead turtle is being checked with ultrasound (which has a frequency above your hearing range); an image of its interior is being produced on a monitor off to the right. (Mauro Fermariello/SPLIPhoto Researchers)
I I I I I
I I I II I I
II I I I I
I II I I I II
I I I I
II I
II I II II
I I II I I
I I I I
I I I

446 17 WAVES-II
Fig. 17-2 A sound wave travels from a point source S through a three-dimensional medium. The wavefronts form spheres centered on S; the rays are radial to S. The short, double-headed arrows indicate that elements of the medium oscillate parallel to the rays.
sound waves can be used to explore the soft tissues of an animal or human body. In this chapter we shall focus on sound waves that travel through the air and that are audible to people.
Figure 17-2 illustrates several ideas that we shall use in our discussions. Point S represents a tiny sound source, called a point source, that emits sound waves in all directions. The wave/rants and rays indicate the direction of travel and the spread of the sound waves. Wavefronts are surfaces over which the oscillations due to the sound wave have the same value; such surfaces are represented by whole or partial circles in a two-dimensional drawing for a point source. Rays are directed lines perpendicular to the wavefronts that indicate the direction of travel of the wavefronts. The short double arrows superimposed on the rays of Fig. 17-2 indicate that the longitudinal oscillations of the air are parallel to the rays.
Near a point source like that of Fig. 17-2, the wavefronts are spherical and spread out in three dimensions, and there the waves are said to be spherical. As the wavefronts move outward and their radii become larger, their curvature decreases. Far from the source, we approximate the wavefronts as planes (or lines on two-dimensional drawings), and the waves are said to be planar.
1 The Speed of Sound The speed of any mechanical wave, transverse or longitudinal, depends on both an inertial property of the medium (to store kinetic energy) and an elastic property of the medium (to store potential energy). Thus, we can generalize Eq. 16-26, which gives the speed of a transverse wave along a stretched string, by writing
v = r:: = elastic property (17 -1) \j ----; inertial property'
where (for transverse waves) T is the tension in the string and fL is the string's linear density. If the medium is air and the wave is longitudinal, we can guess that the inertial property, corresponding to fL, is the volume density p of air. What shall we put for the elastic property?
In a stretched string, potential energy is associated with the periodic stretching of the string elements as the wave passes through them. As a sound wave passes through air, potential energy is associated with periodic compressions and expansions of small volume elements of the air. The property that determines the extent to which an element of a medium changes in volume when the pressure (force per unit area) on it changes is the bulk modulus B, defined (from Eq.12-25) as
!J.p B = - !J.V/v (definition of bulk modulus). (17-2)
Here !J. V/V is the fractional change in volume produced by a change in pressure !J.p. As explained in Section 14-3, the SI unit for pressure is the newton per square meter, which is given a special name, the pascal (Pa). From Eq. 17-2 we see that the unit for B is also the pascal. The signs of !J.p and !J. V are always opposite: When we increase the pressure on an element (!J.p is positive), its volume decreases (!J.Vis negative). We include a minus sign in Eq.17-2 so that B is always a positive quantity. Now substituting B for T and p for fL in Eq. 17-1 yields
v=F; (speed of sound) (17-3)
as the speed of sound in a medium with bulk modulus B and density p. Table 17-1 lists the speed of sound in various media.
17 . THE S PEE 0 0 F SOU N 0 447
The density of water is almost 1000 times greater than the density of air. If this were the only relevant factor, we would expect from Eq. 17-3 that the speed of sound in water would be considerably less than the speed of sound in air. However, Table 17-1 shows us that the reverse is true. We conclude (again from Eq. 17-3) that the bulk modulus of water must be more than 1000 times greater than that of air. This is indeed the case. Water is much more incompressible than air, which (see Eq.17-2) is another way of saying that its bulk modulus is much greater.
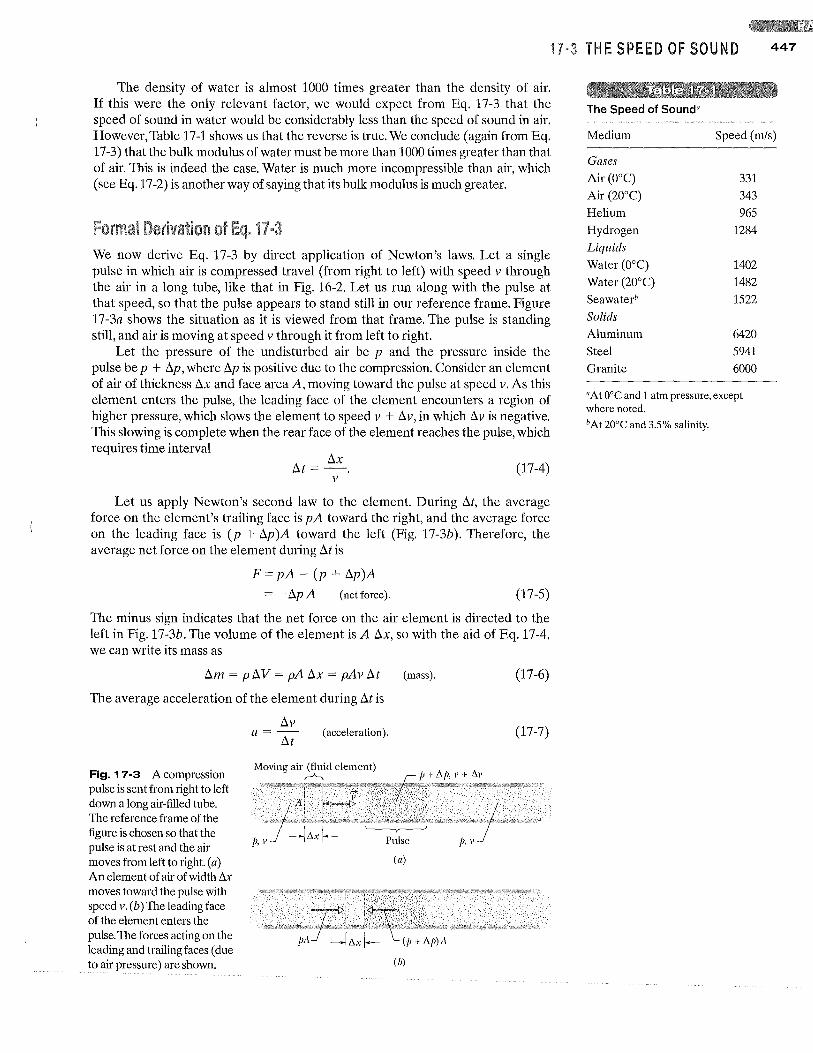
We now derive Eq. 17-3 by direct application of Newton's laws. Let a single pulse in which air is compressed travel (from right to left) with speed v through the air in a long tube, like that in Fig. 16-2. Let us run along with the pulse at that speed, so that the pulse appears to stand still in our reference frame. Figure 17-3a shows the situation as it is viewed from that frame. The pulse is standing still, and air is moving at speed v through it from left to right.
Let the pressure of the undisturbed air be p and the pressure inside the pulse be p + !:lp, where!:lp is positive due to the compression. Consider an element of air of thickness !:lx and face area A, moving toward the pulse at speed v. As this element enters the pulse, the leading face of the element encounters a region of higher pressure, which slows the element to speed v + !:lv, in which !:lv is negative. This slowing is complete when the rear face of the element reaches the pulse, which requires time interval
!:It = !:lx (17-4) v
Let us apply Newton's second law to the element. During !:It, the average force on the element's trailing face is pA toward the right, and the average force on the leading face is (p + !:lp)A toward the left (Fig. 17-3b). Therefore, the average net force on the element during !:It is
F = pA - (p + !:lp)A
= -!:lpA (net force). (17-5)
The minus sign indicates that the net force on the air element is directed to the left in Fig. 17-3b. The volume of the element is A !:lx, so with the aid of Eq. 17-4, we can write its mass as
!:lm = p!:lV = pA!:lx = pAv!:lt
The average acceleration of the element during !:It is
Fig.17-3 Acompression pulse is sent from right to left down a long air-filled tube. The reference frame of the figure is chosen so that the pulse is at rest and the air moves from left to right. (a) An element of air of width Llx moves toward the pulse with speed v. (b) The leading face of the element enters the pulse. The forces acting on the leading and trailing faces (due to air pressure) are shown.
!:lv a =--
!:It ( acceleration).
(mass). (17-6)
(17-7)
(a)
The Speed of Sound"
Medium Speed (m/s)
Gases
Air (O°C) 331
Air (20°C) 343
Helium 965
Hydrogen 1284
Liquids
Water (O°C) 1402
Water (20°C) 1482
Seawaterb 1522
Solids
Aluminum 6420
Steel 5941
Granite 6000
a At O°C and 1 atm pressure, except where noted.
bAt 20°C and 3.5 % salinity.
450 HA 17 WAVES-II
The quantity V in Eq. 17-15 is the volume of the element, given by
V= A Lix. (17-16)
The quantity LiV in Eq. 17-15 is the change in volume that occurs when the element is displaced. This volume change comes about because the displacements of the two faces of the element are not quite the same, differing by some amount Lis. Thus, we can write the change in volume as
LiV = A Lis. (17-17)
Substituting Eqs.17-16 and 17-17 into Eq.17-15 and passing to the differentiallimit yield
Lis as Lip = -B Lix = -Ba;' (17-18)
The symbols a indicate that the derivative in Eq. 17-18 is a partial derivative, which tells us how S changes with x when the time t is fixed. From Eq. 17-12 we then have, treating t as a constant,
~ = ~ [smcos(kx - wt)] = -ksmsin(kx - wt). ax ax (17-19)
Substituting this quantity for the partial derivative in Eq. 17-18 yields
Lip = Bksm sin(kx - wt).
This tells us that the pressure varies as a sinusoidal function of time and that the amplitude of the variation is equal to the terms in front of the sine function. Setting Lipm = Bksnl> this yields Eq.17-13, which we set out to prove.
Using Eq.17-3, we can now write
LiPm = (Bk)sm = (v2pk)sm·
Equation 17-14, which we also wanted to prove, follows at once if we substitute wlv for k from Eq. 16-12.
Pressure amplitude, displacement amplitude
The maximum pressure amplitude LiPIII that the human ear can tolerate in loud sounds is about 28 Pa (which is very much less than the normal air pressure of about 105 Pa). What is the displacement amplitude Sm for such a sound in air of density p = 1.21 kg/m3, at a frequency of 1000 Hz and a speed of 343 m/s?
Substituting known data then gives us
28Pa S = ---------:-------
m (343 m/s)(1.21 kg/m3)(21T)(1000 Hz)
= 1.1 X 10⁻⁵ m = 11 ;.tm. (Answer)
That is only about one-seventh the thickness of a book page. Obviously, the displacement amplitude of even the loudest sound that the ear can tolerate is very small. Temporary exposure to such loud sound produces temporary hearing loss, probably due to a decrease in blood supply to the inner ear. Prolonged exposure produces permanent damage.
The displacement amplitude Sm of a sound wave is related to the pressure amplitude LiPm of the wave according to Eq.17-14.
Calculations: Solving that equation for Sm yields
tlpm LiPm Sill = vpw = Vp(21Tf)'
The pressure amplitude LiPm for the faintest detectable sound at 1000 Hz is 2.8 X 10⁻⁵ Pa. Proceeding as above leads to Sill = 1.1 X 10⁻¹¹ m or 11 pm, which is about onetenth the radius of a typical atom. The ear is indeed a sensitive detector of sound waves.
~ros Additional examples, video, and practice available at WileyPLUS
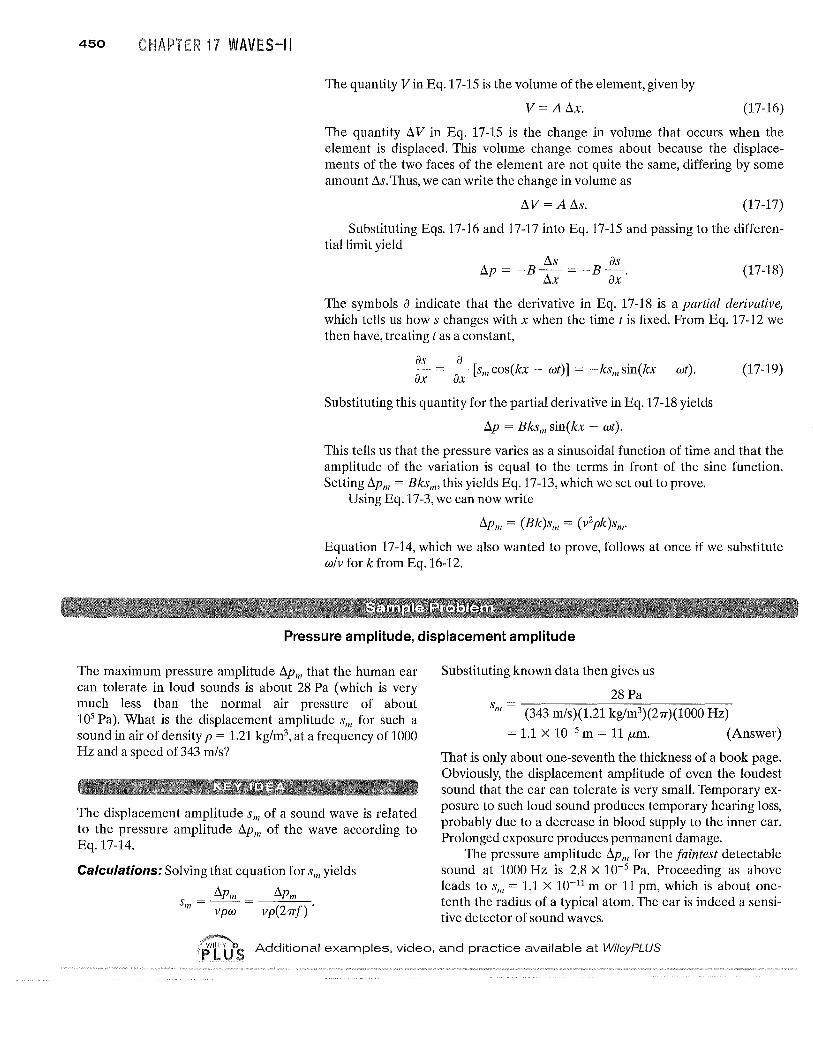
1 Interference Like transverse waves, sound waves can undergo interference. Let us consider, in particular, the interference between two identical sound waves traveling in the same direction. Figure 17-7 a shows how we can set up such a situation: Two point sources Sl and S2 emit sound waves that are in phase and of identical wavelength ..\. Thus, the sources themselves are said to be in phase; that is, as the waves emerge from the sources, their displacements are always identical. We are interested in the waves that then travel through point P in Fig. 17-7 a. We assume that the distance to P is much greater than the distance between the sources so that we can approximate the waves as traveling in the same direction at P.
If the waves traveled along paths with identical lengths to reach point P, they would be in phase there. As with transverse waves, this means that they would undergo fully constructive interference there. However, in Fig. 17-7 a, path L2 traveled by the wave from S2 is longer than path Ll traveled by the wave from Sl' The difference in path lengths means that the waves may not be in phase at point P. In other words, their phase difference cp at P depends on their path length difference!::.L = IL2 - Lll.
To relate phase difference cp to path length difference !::.L, we recall (from Section 16-4) that a phase difference of 21rrad corresponds to one wavelength. Thus, we can write the proportion
cp !::.L (17-20)
21T ..\ ' from which
!::.L cp = T 21T. (17-21)
Fully constructive interference occurs when cp is zero, 21T, or any integer multiple of21T. We can write this condition as
for m = 0,1,2, ... (fully constructive interference). (17-22)
From Eq.17-21, this occurs when the ratio !::.LI..\ is
!::.L -,.\- = 0,1,2, ... (fully constructive interference). (17-23)
For example, if the path length difference!::'L = IL2 - Ljl in Fig. 17-7a is equal to 2,,\, then !::.LI"\ = 2 and the waves undergo fully constructive interference at point P (Fig. 17-7b). The interference is fully constructive because the wave from S2 is phaseshifted relative to the wave from S 1 by 2..\, putting the two waves exactly in phase at P.
Fully destructive interference occurs when cp is an odd multiple of 1T:
cp = (2m + 1)1T, form = 0,1,2, ... (fully destructive interference). (17-24)
From Eq.17-21, this occurs when the ratio !::.LI..\ is
!::.L T = 0.5,1.5,2.5, ... (fully destructive interference). (17-25)
For example, if the path length difference !::.L = IL2 - Lli in Fig. 17-7a is equal to 2.5..\, then !::.LI..\ = 2.5 and the waves undergo fully destructive interference at point P (Fig. 17-7c). The interference is fully destructive because the wave from S2 is phase-shifted relative to the wave from Sl by 2.5 wavelengths, which puts the two waves exactly out a/phase at P.
Of course, two waves could produce intermediate interference as, say, when !::.LI..\ = 1.2. This would be closer to fully constructive interference (!::.LI..\ = 1.0) than to fully destructive interference (!::.LI..\ = 1.5).
S1
~
1 ·5 I NTER FERENCE 451
The interference at P depends on the difference in the path lengths to reach P.
(a)
0vp
If the difference is equal to, say, 2.0A, then the waves arrive exactly in phase. This is how transverse waves would look.
(b)
(jOp If the difference is equal to, say, 2.5A, then the waves arrive exactly out of phase. This is how transverse waves would look.
(c)
Fig.17-7 (a) Two point sources SI and S2 emit spherical sound waves in phase. The rays indicate that the waves pass through a common point P. The waves (represented with transverse waves) arrive at P (b) exactly in phase and (c) exactly out of phase.
452 H R 1 WAVES-II
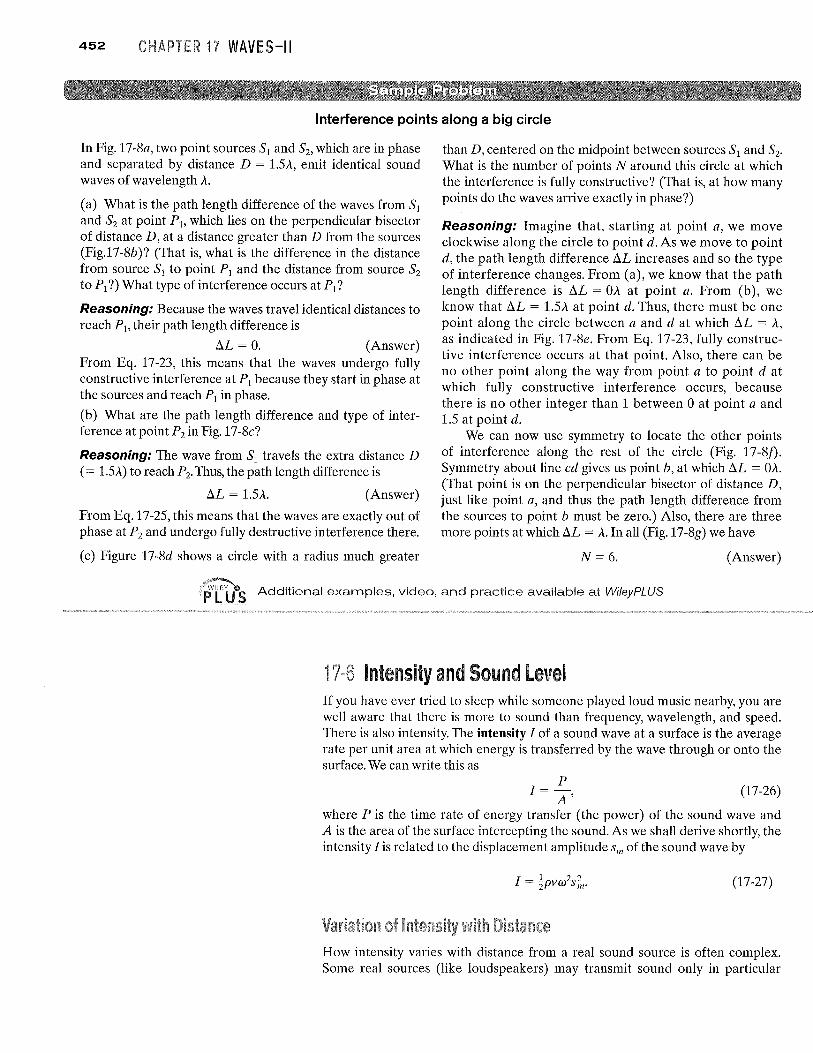
Interference points along a big circle
In Fig. 17-8a, two point sources S] and S2> which are in phase and separated by distance D = 1.5A, emit identical sound waves of wavelength A.
(a) What is the path length difference of the waves from SI and S2 at point PI> which lies on the perpendicular bisector of distance D, at a distance greater than D from the sources (Fig.17-8b)? (That is, what is the difference in the distance from source SI to point PI and the distance from source S2 to PI?) What type of interference occurs at PI?
Reasoning: Because the waves travel identical distances to reach Pj, their path length difference is
t:.L = O. (Answer) From Eq. 17-23, this means that the waves undergo fully constructive interference at PI because they start in phase at the sources and reach PI in phase.
(b) What are the path length difference and type of interference at point P2 in Fig. 17-8c?
Reasoning: The wave from SI travels the extra distance D (= l.5A) to reach P2• Thus, the path length difference is
t:.L = 1.5A. (Answer)
From Eq.17-25, this means that the waves are exactly out of phase at P2 and undergo fully destructive interference there.
(c) Figure 17-8d shows a circle with a radius much greater
than D, centered on the midpoint between sources S] and S2' What is the number of points N around this circle at which the interference is fully constructive? (That is, at how many points do the waves arrive exactly in phase?)
Reasoning: Imagine that, starting at point a, we move clockwise along the circle to point d. As we move to point d, the path length difference t:.L increases and so the type of interference changes. From (a), we know that the path length difference is t:.L = OA at point a. From (b), we know that t:.L = 1.5A at point d. Thus, there must be one point along the circle between a and d at which t:.L = A, as indicated in Fig. 17-8e. From Eq. 17-23, fully constructive interference occurs at that point. Also, there can be no other point along the way from point a to point d at which fully constructive interference occurs, because there is no other integer than 1 between 0 at point a and 1.5 at point d.
We can now use symmetry to locate the other points of interference along the rest of the circle (Fig. 17 -8f). Symmetry about line cd gives us point b, at which t:.L = OA. (That point is on the perpendicular bisector of distance D, just like point a, and thus the path length difference from the sources to point b must be zero.) Also, there are three more points at which t:.L = A. In all (Fig. 17-8g) we have
N = 6. (Answer)
irlts Additional examples, video, and practice available at WileyPLUS
Intensity and Sound Level If you have ever tried to sleep while someone played loud music nearby, you are well aware that there is more to sound than frequency, wavelength, and speed. There is also intensity. The intensity 1 of a sound wave at a surface is the average rate per unit area at which energy is transferred by the wave through or onto the surface. We can write this as
P I=A' (17-26)
where P is the time rate of energy transfer (the power) of the sound wave and A is the area of the surface intercepting the sound. As we shall derive shortly, the intensity 1 is related to the displacement amplitude Sm of the sound wave by
1 -1 2 2 - zpVW Sm' (17-27)
How intensity varies with distance from a real sound source is often complex. Some real sources (like loudspeakers) may transmit sound only in particular

1· INTENSITY AND SOUND LEVEL 453
The difference in these
SI SI path lengths equals O.
T D/[ LI
D
1 D/2 0.
~ ~ Thus, the waves arrive exactly in phase and undergo fully constructive interference.
(a) (b)
SI T The difference in these D path lengths is 0, 1 which equals 1.5..1,.
(e)
~
Thus, the waves arrive exactly out of phase and undergo fully
P2 destructive interference.
SI a\OA ------(1)-_.
~
. d . ". 1.51.,
(d)
1.51.,
We find six points of fully constructive interference.
Maximum phase difference
(e)
The difference in these path lengths equals 1.0..1,.
Thus, the waves arrive exactly in phase and undergo fully constructive interference.
e
OAh --f-----
I.OX" d
(j)
..... ~ 1.01.,
., S \~( _1 ____ Jl.<LA_. ~ '.
"'i.oA 1.51.,
Zero phase difference
(g)
Zero phase difference
Maximum phase difference
Fig. 17-8 (a) Two point sources Sl and S2,separated by distance D,emit spherical sound waves in phase. (b ) The waves travel equal distances to reach point Pl' (c) Point P2 is on the line extending through Sl and S2' (d) We move around a large circle. (e) Another point of fully constructive interference. (j) Using symmetry to determine other points. (g) The six points of fully constructive interference.
directions, and the environment usually produces echoes (reflected sound waves) that overlap the direct sound waves. In some situations, however, we can ignore echoes and assume that the sound source is a point source that emits the sound isotropically-that is, with equal intensity in all directions. The wavefronts spreading from such an isotropic point source S at a particular instant are shown in Fig. 17-9.
Let us assume that the mechanical energy of the sound waves is conserved as they spread from this source. Let us also center an imaginary sphere of radius r on the source, as shown in Fig. 17-9. All the energy emitted by the source must pass through the surface of the sphere. Thus, the time rate at which energy is transferred through the surface by the sound waves must equal the time rate at which energy is emitted by the source (that is, the power P, of the source). From Eq.17-26, the intensity I at the sphere must then be
(17-28)
where 4m,2 is the area of the sphere. Equation 17-28 tells us that the intensity of sound from an isotropic point source decreases with the square of the distance r from the source.
Fig. 17-9 A point source S emits sound waves uniformly in all directions. The waves pass through an imaginary sphere of radius r that is centered on S.
454 R 1 WAVES-II
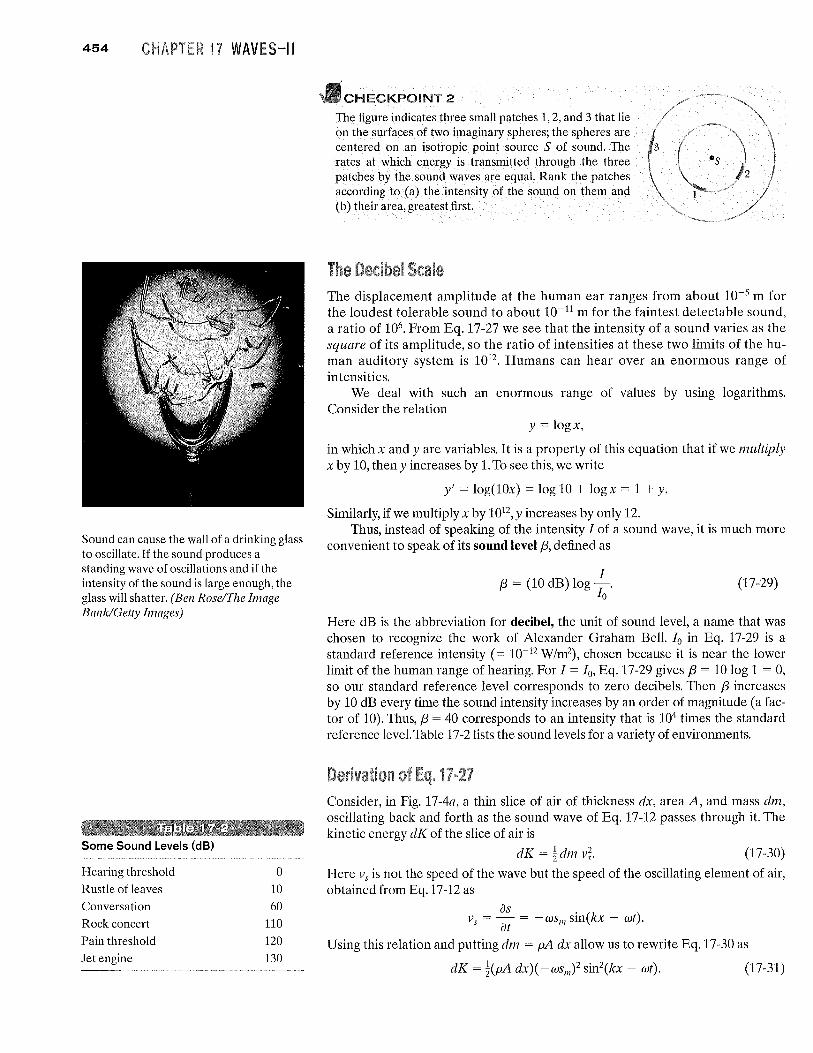
Sound can cause the wall of a drinking glass to oscillate. If the sound produces a standing wave of oscillations and if the intensity of the sound is large enough, the glass will shatter. (Ben Rose/The Image Bank/Getty Images)
Some Sound Levels (dB)
Hearing threshold
Rustle of leaves
Conversation
Rock concert
Pain threshold
Jet engine
o 10
60 110
120
130
CHECKPOINT 2
The figure indicates three small patches 1,2, and 3 that lie on the surfaces of two imaginary spheres; the spheres are centered on an isotropic point source S of sound. The rates at which energy is transmitted through the three patches by the sound waves are equal. Rank the patches according to (a) the intensity of the sound on them and (b) their area, greatest first.
The displacement amplitude at the human ear ranges from about 10-5 m for the loudest tolerable sound to about 10-11 m for the faintest detectable sound, a ratio of 106• From Eq. 17-27 we see that the intensity of a sound varies as the square of its amplitude, so the ratio of intensities at these two limits of the human auditory system is 1012• Humans can hear over an enormous range of in tensi ties.
We deal with such an enormous range of values by using logarithms. Consider the relation
y = logx,
in which x and yare variables. It is a property of this equation that if we multiply x by 10, then y increases by 1. To see this, we write
y' = log(10x) = log 10 + logx = 1 + y.
Similarly, if we multiply x by 1012,y increases by only 12. Thus, instead of speaking of the intensity 1 of a sound wave, it is much more
convenient to speak of its sound level {3, defined as
1 f3 = (10 dB) log-.
10 (17-29)
Here dB is the abbreviation for decibel, the unit of sound level, a name that was chosen to recognize the work of Alexander Graham Bell. 10 in Eq. 17-29 is a standard reference intensity (= 10- 12 W/m2), chosen because it is near the lower limit of the human range of hearing. For 1 = 10, Eq. 17-29 gives {3 = 10 log 1 = 0, so our standard reference level corresponds to zero decibels. Then {3 increases by 10 dB every time the sound intensity increases by an order of magnitude (a factor of 10). Thus, {3 = 40 corresponds to an intensity that is 104 times the standard reference level. Table 17 -2 lists the sound levels for a variety of environments.
Consider, in Fig. 17-4a, a thin slice of air of thickness dx, area A, and mass dm, oscillating back and forth as the sound wave of Eq. 17-12 passes through it. The kinetic energy dK of the slice of air is
dK = ~dm v;. (17-30)
Here Vs is not the speed of the wave but the speed of the oscillating element of air, obtained from Eq. 17-12 as
as Vs = at = WSm sin(kx - wt).
Using this relation and putting dm = pA dx allow us to rewrite Eq.17-30 as
dK = ~(pA dx)(-wsnY sin2(kx - wt). (17-31)
1· INTENSITY AND SOUND LEVEL 455
Dividing Eq. 17-31 by dt gives the rate at which kinetic energy moves along with the wave. As we saw in Chapter 16 for transverse waves, dxldt is the wave speed v,sowe have
dK _ 1 .. 7. 2 . 2() () dt - zpAvw-s m sm lex - wt . 17-32
The average rate at which kinetic energy is transported is
( dK ) _ 1 2 2 [ . 2( )] -d - zpAvw Sill sm lex - wt avg
t avg
= ~pAVW2S~,. (17-33)
To obtain this equation, we have used the fact that the average value of the square of a sine (or a cosine) function over one full oscillation is!.
We assume that potential energy is carried along with the wave at this same average rate. The wave intensity I, which is the average rate per unit area at which energy of both kinds is transmitted by the wave, is then, from Eq. 17-33,
_ 2(dKldt)avg _ 1 2 2 I - A - zpvw Sill>
which is Eq. 17-27, the equation we set out to derive.
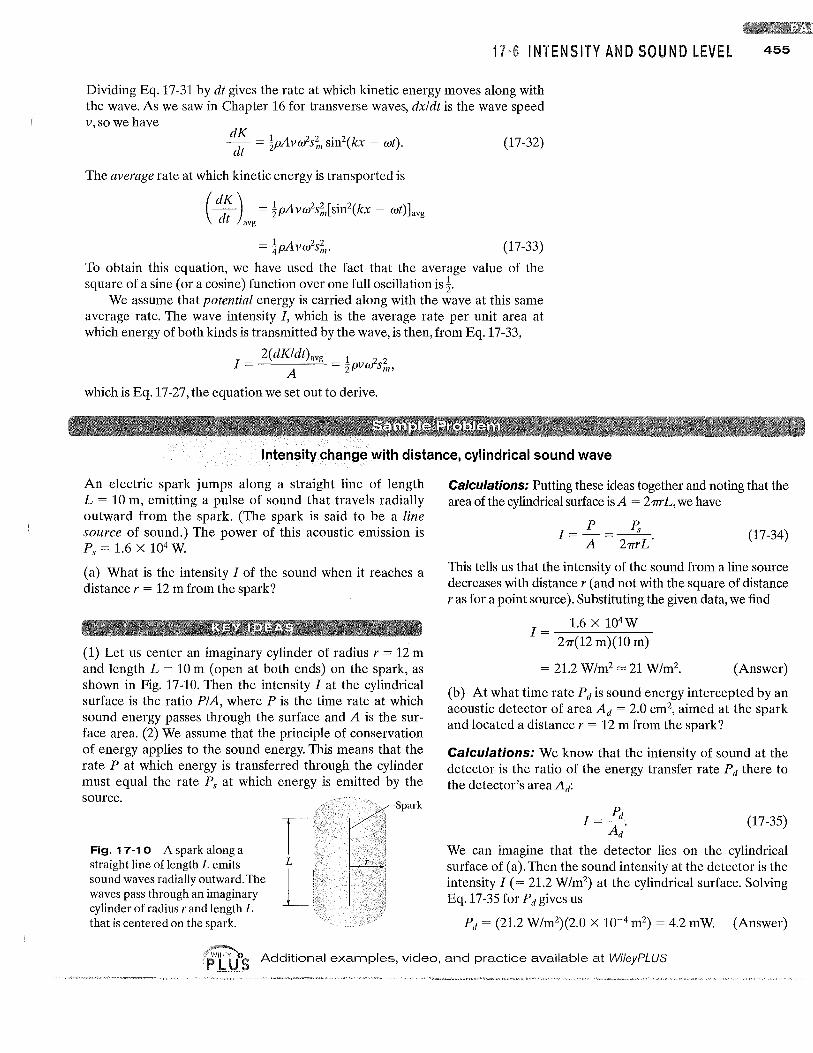
Intensity change with distance, cylindrical sound wave
An electric spark jumps along a straight line of length L = 10 m, emitting a pulse of sound that travels radially outward from the spark. (The spark is said to be a line source of sound.) The power of this acoustic emission is Ps = 1.6 X 10⁴ W.
(a) What is the intensity I of the sound when it reaches a distance r = 12 m from the spark?
(1) Let us center an imaginary cylinder of radius r = 12 m and length L = 10 m (open at both ends) on the spark, as shown in Fig. 17-10. Then the intensity I at the cylindrical surface is the ratio PIA, where P is the time rate at which sound energy passes through the surface and A is the surface area. (2) We assume that the principle of conservation of energy applies to the sound energy. This means that the rate P at which energy is transferred through the cylinder must equal the rate Ps at which energy is emitted by the source.
Fig. 17-10 A spark along a straight line of length L emits sound waves radially outward. The waves pass through an imaginary cylinder of radius r and length L that is centered on the spark.
Spark
r L
L
Calculations: Putting these ideas together and noting that the area ofthe cylindrical surface isA = 2nrL, we have
I=~=~ A 21TrL·
(17-34)
This tells us that the intensity of the sound from a line source decreases with distance r (and not with the square of distance r as for a point source). Substituting the given data, we find
1= 1.6X10⁴ W 21T(12 m)(l0 m)
= 21.2 W/m2 = 21 W/m2. (Answer)
(b) At what time rate Pd is sound energy intercepted by an acoustic detector of area Ad = 2.0 cm2, aimed at the spark and located a distance r = 12 m from the spark?
Calculations: We know that the intensity of sound at the detector is the ratio of the energy transfer rate Pd there to the detector's area Ad:
I =~. (17-35) Ad
We can imagine that the detector lies on the cylindrical surface of (a). Then the sound intensity at the detector is the intensity I (= 21.2 W/m2) at the cylindrical surface. Solving Eq.17-35 for Pd gives us
Pd = (21.2 W/m2)(2.0 X 10-4 m2) = 4.2 mW. (Answer)
Additional examples, video, and practice available at WileyPLUS
456 HA WAVES-II
Decibels, sound level, change in intensity
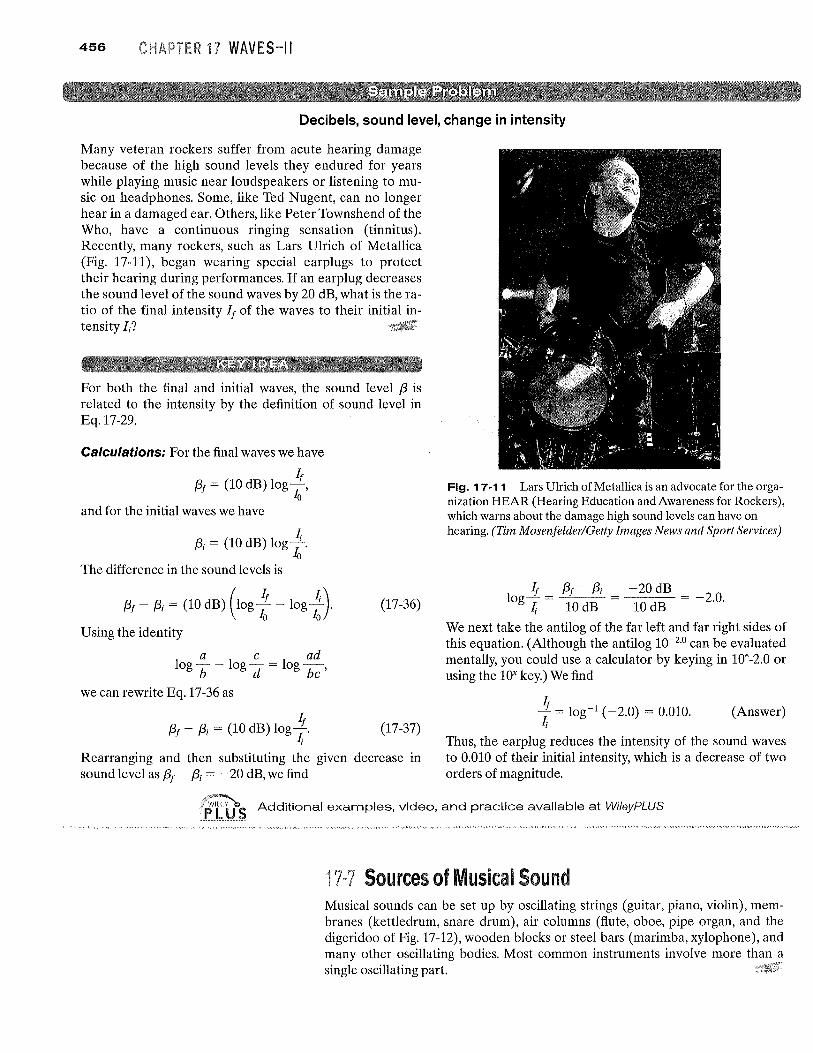
Many veteran rockers suffer from acute hearing damage because of the high sound levels they endured for years while playing music near loudspeakers or listening to music on headphones. Some, like Ted Nugent, can no longer hear in a damaged ear. Others, like Peter Townshend of the Who, have a continuous ringing sensation (tinnitus). Recently, many rockers, such as Lars Ulrich of Metallica (Fig. 17-11), began wearing special earplugs to protect their hearing during performances. If an earplug decreases the sound level of the sound waves by 20 dB, what is the ratio of the final intensity If of the waves to their initial intensity Ii?
For both the final and initial waves, the sound level {3 is related to the intensity by the definition of sound level in Eq.17-29.
Calculations: For the final waves we have
L {3f = (10 dB) log £,
and for the initial waves we have
I {3i = (10 dB) logt.
The difference in the sound levels is
{3f - {3i = (10 dB) (log t -log ~). Using the identity
a e ad log- -log- = 10g-
b d be'
we can rewrite Eq. 17-36 as
It {3f - {3i = (10 dB) 10gT' I
(17-36)
(17-37)
Rearranging and then substituting the given decrease in sound level as {3f - {3i = - 20 dB, we find
Fig. 1 7.1 1 Lars Ulrich of Metallica is an advocate for the organization HEAR (Hearing Education and Awareness for Rockers), which warns about the damage high sound levels can have on hearing. (Tim MosenfelderlGetty Images News and Sport Services)
log It = {3f - {3i - 20 dB = _ 2 0 ~ 10 dB 10 dB ..
We next take the antilog of the far left and far right sides of this equation. (Although the antilog 10-2.0 can be evaluated mentally, you could use a calculator by keying in 10A-2.0 or using the loY key.) We find
L ;, = log-l (-2.0) = 0.010.
I
(Answer)
Thus, the earplug reduces the intensity of the sound waves to 0.010 of their initial intensity, which is a decrease of two orders of magnitude.
i&s Additional examples, video, and practice available at WileyPLUS
1 Sources of Musical Sound Musical sounds can be set up by oscillating strings (guitar, piano, violin), membranes (kettledrum, snare drum), air columns (flute, oboe, pipe organ, and the digeridoo of Fig. 17-12), wooden blocks or steel bars (marimba, xylophone), and many other oscillating bodies. Most common instruments involve more than a single oscillating part.

1· SOURCES OF MUSICAL SOUND 457
Recall from Chapter 16 that standing waves can be set up on a stretched string that is fixed at both ends. They arise because waves traveling along the string are reflected back onto the string at each end. If the wavelength of the waves is suitably matched to the length of the string, the superposition of waves traveling in opposite directions produces a standing wave pattern (or oscillation mode). The wavelength required of the waves for such a match is one that corresponds to a resonant frequency of the string. The advantage of setting up standing waves is that the string then oscillates with a large, sustained amplitude, pushing back and forth against the surrounding air and thus generating a noticeable sound wave with the same frequency as the oscillations of the string. This production of sound is of obvious importance to, say, a guitarist.
We can set up standing waves of sound in an air-filled pipe in a similar way. As sound waves travel through the air in the pipe, they are reflected at each end and travel back through the pipe. (The reflection occurs even if an end is open, but the reflection is not as complete as when the end is closed.) If the wavelength of the sound waves is suitably matched to the length of the pipe, the superposition of waves traveling in opposite directions through the pipe sets up a standing wave pattern. The wavelength required of the sound waves for such a match is one that corresponds to a resonant frequency of the pipe. The advantage of such a standing wave is that the air in the pipe oscillates with a large, sustained amplitude, emitting at any open end a sound wave that has the same frequency as the oscillations in the pipe. This emission of sound is of obvious importance to, say, an organist.
Many other aspects of standing sound wave patterns are similar to those of string waves: The closed end of a pipe is like the fixed end of a string in that there must be a node (zero displacement) there, and the open end of a pipe is like the end of a string attached to a freely moving ring, as in Fig. 16-18b, in that there must be an antinode there. (Actually, the antinode for the open end of a pipe is located slightly beyond the end, but we shall not dwell on that detail.)
Antinodes (maximum oscillation) occur at the open ends.
t t I, L -I ~~' :" .. ~.'~ ).,~2L ~-f1"':'i'1t" ~."'~\1"tti"J,~
(a) A N A
(b) First harmonic
Fig. 1 7-1 3 (a) The simplest standing wave pattern of displacement for (longitudinal) sound waves in a pipe with both ends open has an antinode (A) across each end and a node (N) across the middle. (The longitudinal displacements represented by the double arrows are greatly exaggerated.) (b) The corresponding standing wave pattern for (transverse) string waves.
The simplest standing wave pattern that can be set up in a pipe with two open ends is shown in Fig. 17-13a. There is an antinode across each open end, as required. There is also a node across the middle of the pipe. An easier way of representing this standing longitudinal sound wave is shown in Fig. 17 -13b - by drawing it as a standing transverse string wave.
The standing wave pattern of Fig. 17-13a is called the fundamental mode or first harmonic. For it to be set up, the sound waves in a pipe of length L must have a wavelength given by L = Al2, so that A = 2L. Several more standing sound wave patterns for a pipe with two open ends are shown in Fig. 17-14a using string wave representations. The second harmonic requires sound waves of wavelength A = L, the third harmonic requires wavelength A = 2L/3, and so on.
Fig. 17-12 The air column within a digeridoo ("a pipe") oscillates when the instrument is played. (A/amy Images)
n~2
Second
n~3
Third
n~4
n~l
First
(a)
)., ~ 2L/2 ~ L
)., ~ 2L/3
).,~ 2L/4~ L/2
Two open endsany harmonic
).,~4L
"""""==
n ~ 3 ,""",~=""""c.....::"'"",,= )., ~ 4L/3 Third
n~5
Fifth
n~7
Seventh
~~~:;;;;;:;
(b)
)., ~ 4L/5
)., ~ 4L/7
One open endonly odd harmonic
Fig. 17-14 Standing wave patterns for string waves superimposed on pipes to represent standing sound wave patterns in the pipes. (a) With both ends of the pipe open, any harmonic can be set up in the pipe. (b) With only one end open, only odd harmonics can be set up.
458 WAVES-II
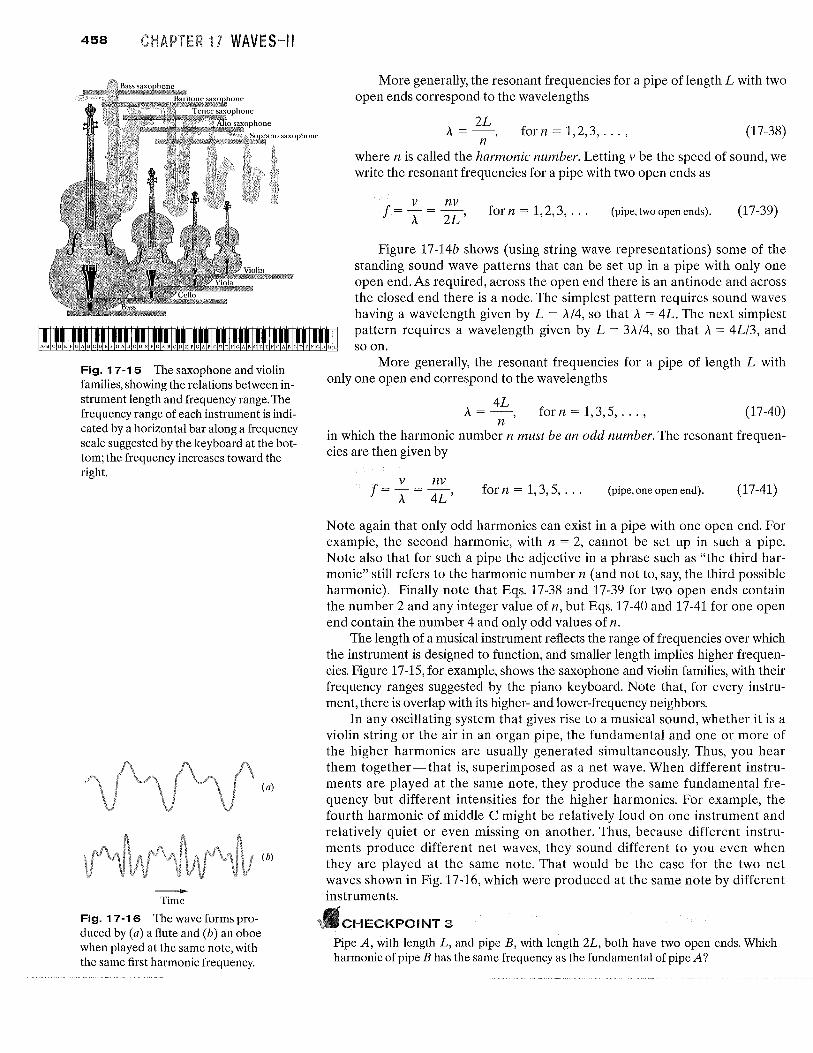
Fig. 17-15 The saxophone and violin families, showing the relations between instrument length and frequency range. The frequency range of each instrument is indicated by a horizontal bar along a frequency scale suggested by the keyboard at the bottom; the frequency increases toward the right.
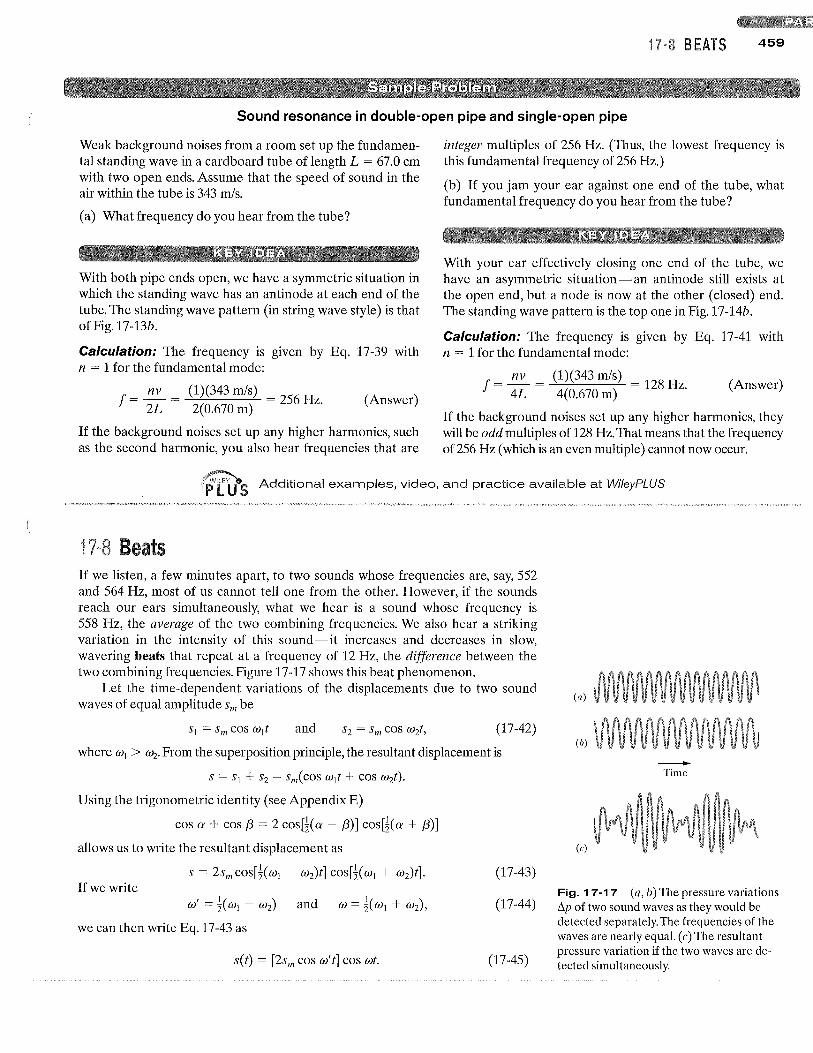
-Time
Fig. 17-16 The wave forms produced by (a) a flute and (b) an oboe when played at the same note, with the same first harmonic frequency.
(a)
(b)
More generally, the resonant frequencies for a pipe of length L with two open ends correspond to the wavelengths
2L A = -, for n = 1,2,3, ... , (17-38)
n where n is called the harmonic number. Letting v be the speed of sound, we write the resonant frequencies for a pipe with two open ends as
forn=1,2,3, ... (pipe, two open ends). (17-39)
Figure 17-14b shows (using string wave representations) some of the standing sound wave patterns that can be set up in a pipe with only one open end. As required, across the open end there is an antinode and across the closed end there is a node. The simplest pattern requires sound waves having a wavelength given by L = A/4, so that A = 4L. The next simplest pattern requires a wavelength given by L = 3A14, so that A = 4L/3, and so on.
More generally, the resonant frequencies for a pipe of length L with only one open end correspond to the wavelengths
A= 4L, forn=1,3,5, ... , (17-40) n
in which the harmonic number n must be an odd number. The resonant frequencies are then given by
for n = 1, 3, 5, ... (pipe, one open end). (17-41)
Note again that only odd harmonics can exist in a pipe with one open end. For example, the second harmonic, with n = 2, cannot be set up in such a pipe. Note also that for such a pipe the adjective in a phrase such as "the third harmonic" still refers to the harmonic number n (and not to, say, the third possible harmonic). Finally note that Eqs. 17-38 and 17-39 for two open ends contain the number 2 and any integer value of n, but Eqs. 17-40 and 17-41 for one open end contain the number 4 and only odd values of n.
The length of a musical instrument reflects the range of frequencies over which the instrument is designed to function, and smaller length implies higher frequencies. Figure 17-15, for example, shows the saxophone and violin families, with their frequency ranges suggested by the piano keyboard. Note that, for every instrument, there is overlap with its higher- and lower-frequency neighbors.
In any oscillating system that gives rise to a musical sound, whether it is a violin string or the air in an organ pipe, the fundamental and one or more of the higher harmonics are usually generated simultaneously. Thus, you hear them together-that is, superimposed as a net wave. When different instruments are played at the same note, they produce the same fundamental frequency but different intensities for the higher harmonics. For example, the fourth harmonic of middle C might be relatively loud on one instrument and relatively quiet or even missing on another. Thus, because different instruments produce different net waves, they sound different to you even when they are played at the same note. That would be the case for the two net waves shown in Fig. 17-16, which were produced at the same note by different instruments.
CHECKPOINT :3
Pipe A, with length L, and pipe B, with length 2L, both have two open ends. Which harmonic of pipe B has the same frequency as the fundamental of pipe A?
BEATS 459
Sound resonance in double-open pipe and single-open pipe
Weak background noises from a room set up the fundamental standing wave in a cardboard tube of length L = 67.0 cm with two open ends. Assume that the speed of sound in the air within the tube is 343 m/s.
(a) What frequency do you hear from the tube?
With both pipe ends open, we have a symmetric situation in which the standing wave has an antinode at each end of the tube. The standing wave pattern (in string wave style) is that of Fig. 17-13b.
Calculation: The frequency is given by Eq. 17-39 with n = 1 for the fundamental mode:
f = nv = (1)(343 m/s) = 56 2L 2(0.670 m) 2 Hz.
(Answer)
If the background noises set up any higher harmonics, such as the second harmonic, you also hear frequencies that are
integer multiples of 256 Hz. (Thus, the lowest frequency is this fundamental frequency of 256 Hz.)
(b) If you jam your ear against one end of the tube, what fundamental frequency do you hear from the tube?
With your ear effectively closing one end of the tube, we have an asymmetric situation-an antinode still exists at the open end, but a node is now at the other (closed) end. The standing wave pattern is the top one in Fig. 17-14b.
Calculation: The frequency is given by Eq. 17-41 with n = 1 for the fundamental mode:
f = nv = (1)(343 m/s) = 128 Hz. 4L 4(0.670 m)
(Answer)
If the background noises set up any higher harmonics, they will be odd multiples of 128 Hz. That means that the frequency of 256 Hz (which is an even multiple) cannot now occur.
Additional examples, video, and practice available at WileyPLUS
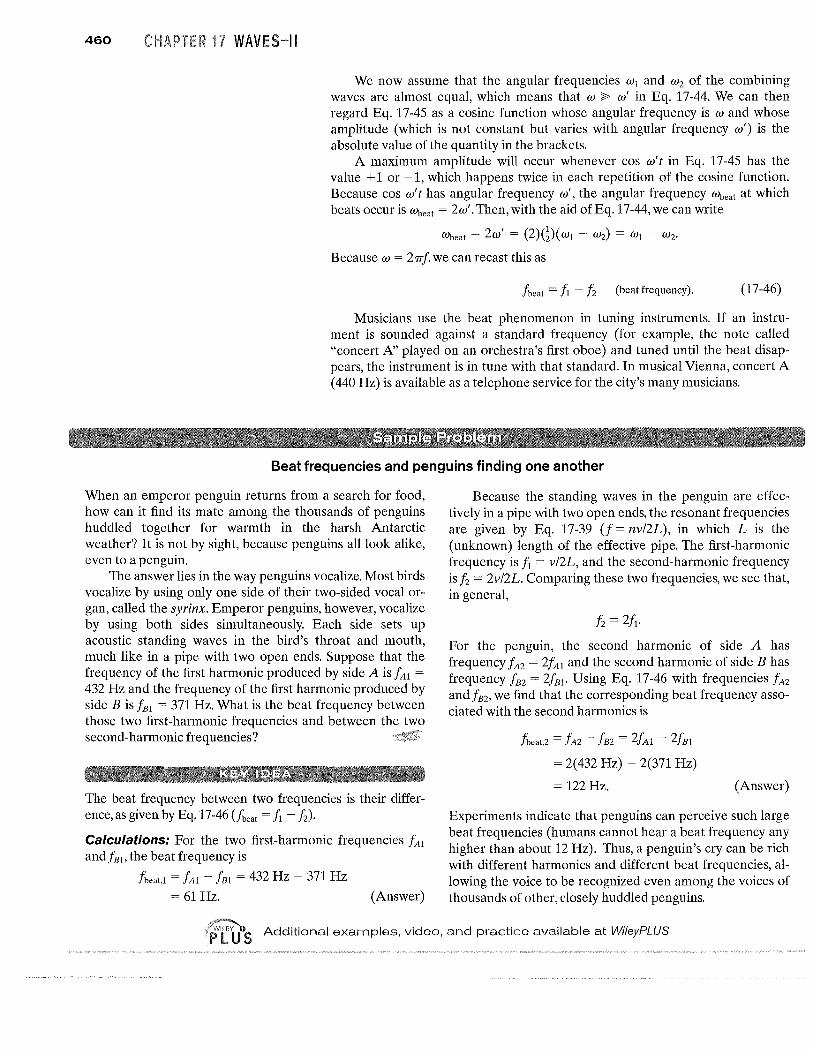
1 Beats If we listen, a few minutes apart, to two sounds whose frequencies are, say, 552 and 564 Hz, most of us cannot tell one from the other. However, if the sounds reach our ears simultaneously, what we hear is a sound whose frequency is 558 Hz, the average of the two combining frequencies. We also hear a striking variation in the intensity of this sound-it increases and decreases in slow, wavering beats that repeat at a frequency of 12 Hz, the difference between the two combining frequencies. Figure 17-17 shows this beat phenomenon.
Let the time-dependent variations of the displacements due to two sound waves of equal amplitude Sm be
and (17-42)
where Wi > ~. From the superposition principle, the resultant displacement is
S = Sl + S2 = sm(cos wIt + cos w2t).
Using the trigonometric identity (see Appendix E)
cos a + cos f3 = 2 cos[!(a - f3)] cos[!(a + f3)]
allows us to write the resultant displacement as
S = 2sm cosW Wi - (2)t] cosW Wi + (2)t]. If we write
we can then write Eq. 17-43 as
S(t) = [2sm cos w't] cos wt.
(17-43)
(17-44)
(17-45)
(a)
(b)
(c)
-Time
Fig. 17-17 (a, b) The pressure variations 6.p of two sound waves as they would be detected separately. The frequencies of the waves are nearly equal. (c) The resultant pressure variation if the two waves are detected simultaneously.
460 H WAVES-II
We now assume that the angular frequencies WI and W2 of the combining waves are almost equal, which means that W ~ w' in Eq. 17-44. We can then regard Eq. 17-45 as a cosine function whose angular frequency is wand whose amplitude (which is not constant but varies with angular frequency w') is the absolute value of the quantity in the brackets.
A maximum amplitude will occur whenever cos w't in Eq. 17-45 has the value +1 or -1, which happens twice in each repetition of the cosine function. Because cos w't has angular frequency w', the angular frequency %eat at which beats occur is %eat = 2w'. Then, with the aid ofEq.17-44, we can write
Wbeat = 2w' = (2)(~)( WI - (2) = WI - W2'
Because w = 21Tf, we can recast this as
fbeat = fl - f2 (beat frequency). (17-46)
Musicians use the beat phenomenon in tuning instruments. If an instrument is sounded against a standard frequency (for example, the note called "concert A" played on an orchestra's first oboe) and tuned until the beat disappears, the instrument is in tune with that standard. In musical Vienna, concert A (440 Hz) is available as a telephone service for the city's many musicians.
Beat frequencies and penguins finding one another
When an emperor penguin returns from a search for food, how can it find its mate among the thousands of penguins huddled together for warmth in the harsh Antarctic weather? It is not by sight, because penguins all look alike, even to a penguin.
The answer lies in the way penguins vocalize. Most birds vocalize by using only one side of their two-sided vocal organ, called the syrinx. Emperor penguins, however, vocalize by using both sides simultaneously. Each side sets up acoustic standing waves in the bird's throat and mouth, much like in a pipe with two open ends. Suppose that the frequency of the first harmonic produced by side A is fAI = 432 Hz and the frequency of the first harmonic produced by side B is fBI = 371 Hz. What is the beat frequency between those two first-harmonic frequencies and between the two second-harmonic frequencies?
The beat frequency between two frequencies is their difference, as given by Eq. 17-46 (fbeat = fl - f2)'
Calculations: For the two first-harmonic frequencies fAI and fBl> the beat frequency is
fbeat,1 = fAI fBi = 432 Hz - 371 Hz
= 61 Hz. (Answer)
Because the standing waves in the penguin are effectively in a pipe with two open ends, the resonant frequencies are given by Eq. 17-39 (f= nv/2L), in which L is the (unknown) length of the effective pipe. The first-harmonic frequency is f1 = v/2L, and the second-harmonic frequency is f2 = 2v/2L. Comparing these two frequencies, we see that, in general,
f2 =2!J,
For the penguin, the second harmonic of side A has frequency fA2 = 2fAI and the second harmonic of side B has frequency fB2 = 2fBl' Using Eq. 17-46 with frequencies fA2 and fB2' we find that the corresponding beat frequency associated with the second harmonics is
fbeat,2 = fA2 fEZ = 2fAl - 2fBl
= 2(432 Hz) - 2(371 Hz)
= 122Hz. (Answer)
Experiments indicate that penguins can perceive such large beat frequencies (humans cannot hear a beat frequency any higher than about 12 Hz). Thus, a penguin's cry can be rich with different harmonics and different beat frequencies, allowing the voice to be recognized even among the voices of thousands of other, closely huddled penguins.
Additional examples, video, and practice available at WifeyPLUS

The Doppler Effect A police car is parked by the side of the highway, sounding its 1000 Hz siren. If you are also parked by the highway, you will hear that same frequency. However, if there is relative motion between you and the police car, either toward or away from each other, you will hear a different frequency. For example, if you are driving toward the police car at 120 km/h (about 75 milh) , you will hear a higher frequency (1096 Hz, an increase of 96 Hz). If you are driving away from the police car at that same speed,you will hear a lower frequency (904 Hz, a decrease of 96 Hz).
These motion-related frequency changes are examples of the Doppler effect. The effect was proposed (although not fully worked out) in 1842 by Austrian physicist Johann Christian Doppler. It was tested experimentally in 1845 by Buys Ballot in Holland, "using a locomotive drawing an open car with several trumpeters."
The Doppler effect holds not only for sound waves but also for electromagnetic waves, including microwaves, radio waves, and visible light. Here, however, we shall consider only sound waves, and we shall take as a reference frame the body of air through which these waves travel. This means that we shall measure the speeds of a source S of sound waves and a detector D of those waves relative to that body of ail: (Unless otherwise stated, the body of air is stationary relative to the ground, so the speeds can also be measured relative to the ground.) We shall assume that Sand D move either directly toward or directly away from each other, at speeds less than the speed of sound.
If either the detector or the source is moving, or both are moving, the emitted frequency f and the detected frequency f' are related by
v ± VD
f f = f (general Doppler effect), V ± Vs
(17-47)
where v is the speed of sound through the air, VD is the detector's speed relative to the air, and Vs is the source's speed relative to the air. The choice of plus or minus signs is set by this rule:
When the motion of detector or source is toward the other, the sign on its speed must give an upward shift in frequency. When the motion of detector or source is away from the other, the sign on its speed must give a downward shift in frequency.
In short, toward means shift up, and away means shift down. Here are some examples of the rule. If the detector moves toward the
source, use the plus sign in the numerator of Eq. 17-47 to get a shift up in the frequency. If it moves away, use the minus sign in the numerator to get a shift down. If it is stationary, substitute 0 for VD' If the source moves toward the detector, use the minus sign in the denominator of Eq. 17-47 to get a shift up in the frequency. If it moves away, use the plus sign in the denominator to get a shift down. If the source is stationary, substitute 0 for Vs.
Next, we derive equations for the Doppler effect for the following two specific situations and then derive Eq.17-47 for the general situation.
1. When the detector moves relative to the air and the source is stationary relative to the air, the motion changes the frequency at which the detector intercepts wavefronts and thus changes the detected frequency of the sound wave.
2. When the source moves relative to the air and the detector is stationary relative to the air, the motion changes the wavelength of the sound wave and thus changes the detected frequency (recall that frequency is related to wavelength).
1 • TH E DOPPLER EFFECT 461
462 R1 WAVES-II
I---vt
(b)
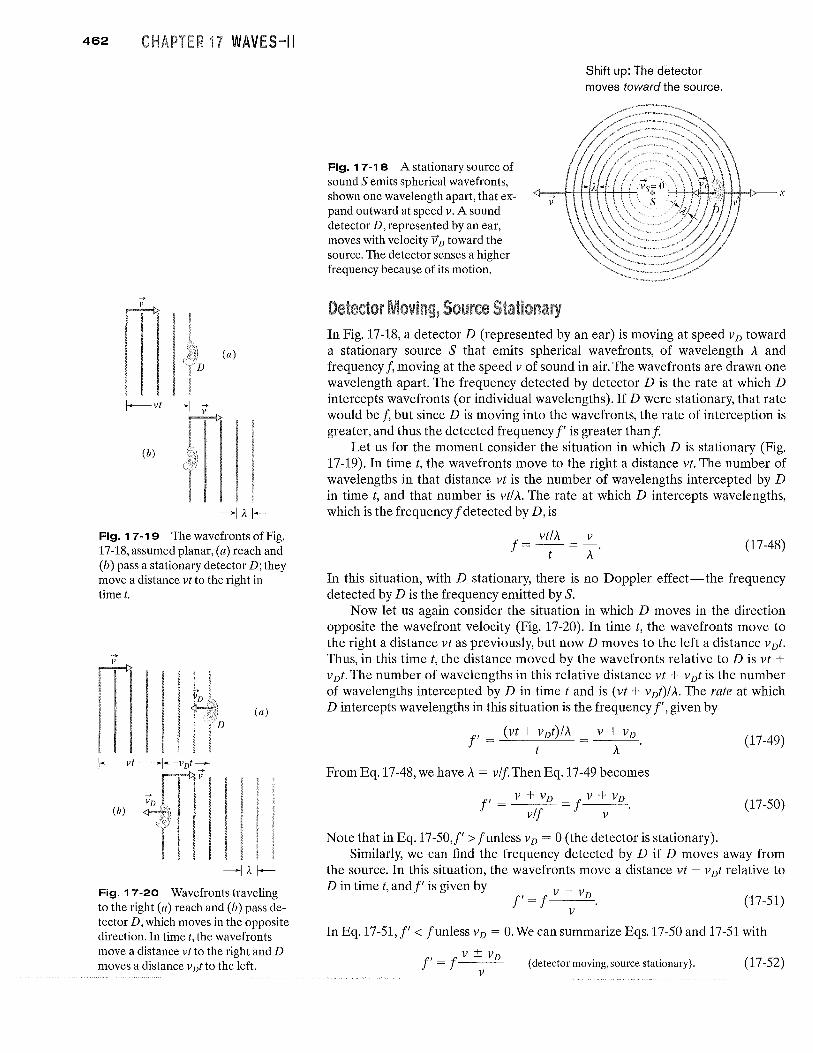
Fig.17-19 The wavefronts of Fig. 17-18, assumed planar, (a) reach and (b) pass a stationary detector D; they move a distance vt to the right in time t.
(a)
Fig. 17-20 Wavefronts traveling to the right (a) reach and (b) pass detector D, which moves in the opposite direction. In time t, the wavefronts move a distance vt to the right and D moves a distance v Dt to the left.
Fig. 17-18 A stationary source of sound S emits spherical wavefronts, shown one wavelength apart, that expand outward at speed v. A sound detector D, represented by an ear, moves with velocity 11 D toward the source. The detector senses a higher frequency because of its motion.
~
v
Shift up: The detector moves toward the source.
In Fig. 17-18, a detector D (represented by an ear) is moving at speed VD toward a stationary source S that emits spherical wavefronts, of wavelength A and frequency f, moving at the speed v of sound in air. The wavefronts are drawn one wavelength apart. The frequency detected by detector D is the rate at which D intercepts wavefronts (or individual wavelengths). If D were stationary, that rate would be f, but since D is moving into the wavefronts, the rate of interception is greater, and thus the detected frequency f' is greater thanf
Let us for the moment consider the situation in which D is stationary (Fig. 17-19). In time t, the wavefronts move to the right a distance vt. The number of wavelengths in that distance vt is the number of wavelengths intercepted by D in time t, and that number is vtl A. The rate at which D intercepts wavelengths, which is the frequency f detected by D, is
f= VtlA =~. t A
(17-48)
In this situation, with D stationary, there is no Doppler effect-the frequency detected by D is the frequency emitted by S.
Now let us again consider the situation in which D moves in the direction opposite the wavefront velocity (Fig. 17-20). In time t, the wavefronts move to the right a distance vt as previously, but now D moves to the left a distance v Dt. Thus, in this time t, the distance moved by the wavefronts relative to D is vt + v Dt. The number of wavelengths in this relative distance vt + v Dt is the number of wavelengths intercepted by D in time t and is (vt + vDt)/A. The rate at which D intercepts wavelengths in this situation is the frequency f', given by
f' = (vt + vDt)/A = v + VD. t A
From Eq.17-48, we have A = vlf Then Eq.17-49 becomes
f' = v + VD = f v + VD. vlf v
Note that in Eq.17-50,f' > funless VD = 0 (the detector is stationary).
(17-49)
(17-50)
Similarly, we can find the frequency detected by D if D moves away from the source. In this situation, the wavefronts move a distance vt - vDt relative to D in time t, and f' is given by f' = f_V __ V-,DO- (17-51)
v
InEq.17-51, f' < funless VD = O.We can summarize Eqs.17-50 and 17-51 with
f' = f v ± VD v
(detector moving, source stationary). (17-52)
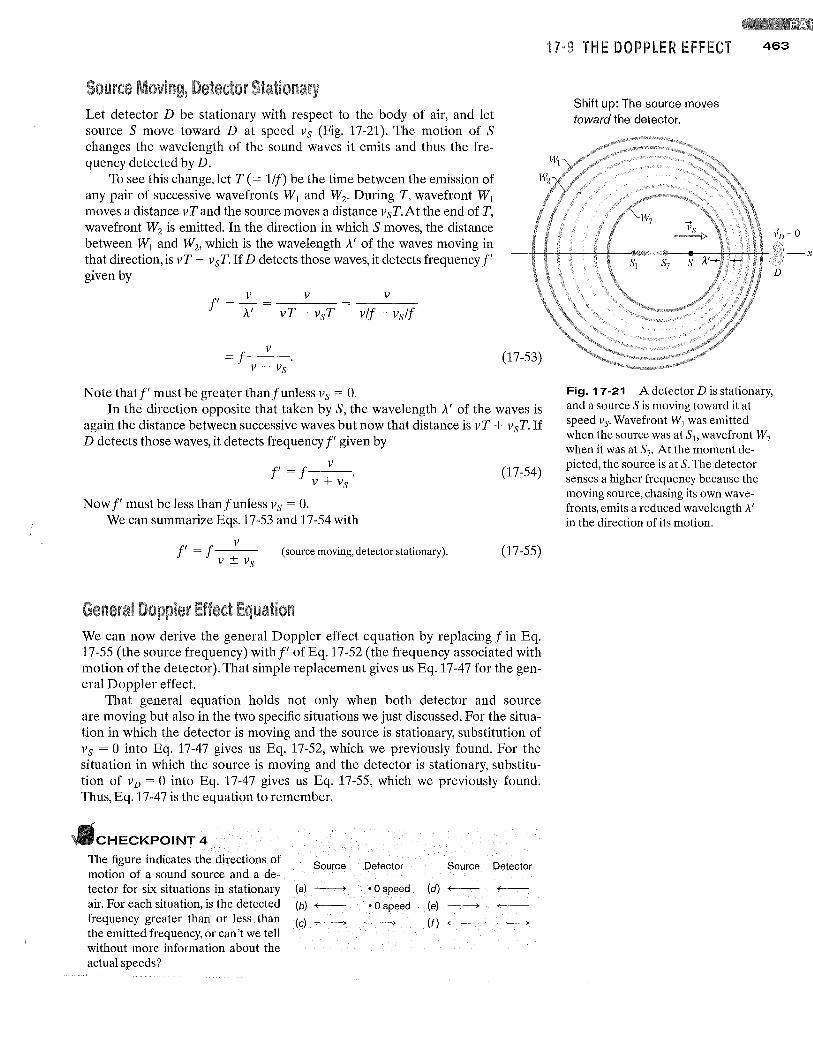
Let detector D be stationary with respect to the body of air, and let source S move toward D at speed Vs (Fig. 17-21). The motion of S changes the wavelength of the sound waves it emits and thus the frequency detected by D.
To see this change, let T (= lit) be the time between the emission of any pair of successive wavefronts WI and W2• During T, wavefront WI moves a distance vT and the source moves a distance vsT. At the end of T, wavefront W2 is emitted. In the direction in which S moves, the distance between WI and W2, which is the wavelength A' of the waves moving in that direction, is vT - vsT. If D detects those waves, it detects frequency f' given by
v v f' = 7 = vT - vsT
v vlf - vslf
v = f v - Vs
Note thatf' must be greater thanfunless Vs = O.
(17-53)
In the direction opposite that taken by S, the wavelength A' of the waves is again the distance between successive waves but now that distance is vT + vsT. If D detects those waves, it detects frequency f' given by
f ' -f v v + Vs
(17-54)
Now f' must be less thanfunless Vs = O. We can summarize Eqs.17-53 and 17-54 with
f ' -f v v ± Vs
(source moving, detector stationary). (17-55)
We can now derive the general Doppler effect equation by replacing fin Eq. 17-55 (the source frequency) withf' of Eq. 17-52 (the frequency associated with motion of the detector). That simple replacement gives us Eq.17-47 for the general Doppler effect.
That general equation holds not only when both detector and source are moving but also in the two specific situations we just discussed. For the situation in which the detector is moving and the source is stationary, substitution of Vs = 0 into Eq. 17-47 gives us Eq. 17-52, which we previously found. For the situation in which the source is moving and the detector is stationary, substitution of VD = 0 into Eq. 17-47 gives us Eq. 17-55, which we previously found. Thus, Eq. 17-47 is the equation to remember.
CHECKPOINT 4
The figure indicates the directions of motion of a sound source and a detector for six situations in stationary air. For each situation, is the detected frequency greater than or less than the emitted frequency, or can't we tell without more information about the actual speeds?
Source
(a) ----->
(b)~
(c) ------>
Detector
·0 speed
·0 speed
Source Detector
(d) ~ <-
(e) -----> <-
(f) ~ ----->
1 " TH E DOPPLER EFFECT 463
Shift up: The source moves toward the detector.
Fig. 17-21 A detector D is stationary, and a source S is moving toward it at speed V.I" Wavefront Wj was emitted when the source was at Sj, wavefront W7
when it was at S7' At the moment depicted, the source is at S. The detector senses a higher frequency because the moving source, chasing its own wavefronts, emits a reduced wavelength ;\' in the direction of its motion.
464 HA WAVES-II
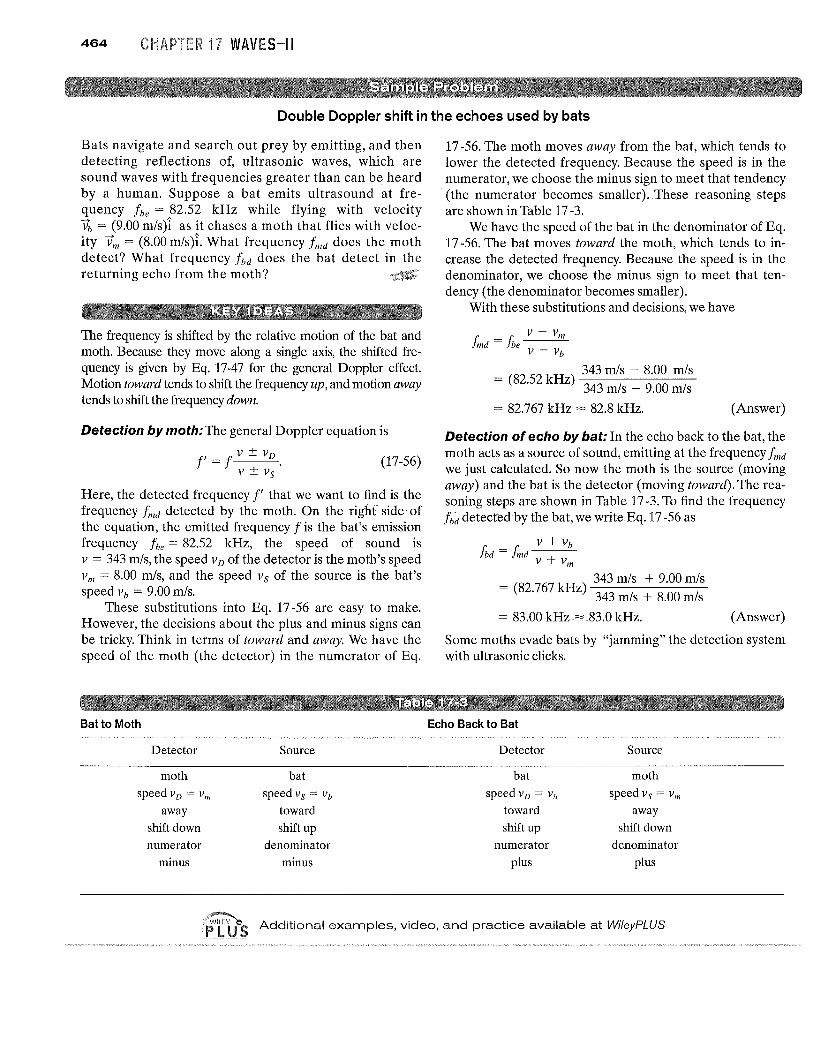
Double Doppler shift in the echoes used by bats
Bats navigate and search out prey by emitting, and then detecting reflections of, ultrasonic waves, which are sound waves with frequencies greater than can be heard by a human. Suppose a bat emits ultrasound at frequency tbe = 82.52 kHz while flying with velocity l1, = (9.00 m/s)i as it chases a moth that flies with velocity 11,11 = (8.00 m/s)i. What frequency tmd does the moth detect? What frequency tbd does the bat detect in the returning echo from the moth?
The frequency is shifted by the relative motion of the bat and moth. Because they move along a single axis, the shifted frequency is given by Eq. 17-47 for the general Doppler effect. Motion toward tends to shift the frequency up, and motion away tends to shift the frequency down.
Detection by moth: The general Doppler equation is
f' = t v ± VD.
v ± Vs (17-56)
Here, the detected frequency f' that we want to find is the frequency tmd detected by the moth. On the right side of the equation, the emitted frequency t is the bat's emission frequency tbe = 82.52 kHz, the speed of sound is v = 343 mis, the speed v D of the detector is the moth's speed Vm = 8.00 mis, and the speed Vs of the source is the bat's speed Vb = 9.00 m/s.
These substitutions into Eq. 17 -56 are easy to make. However, the decisions about the plus and minus signs can be tricky. Think in terms of toward and away. We have the speed of the moth (the detector) in the numerator of Eq.
Bat to Moth
Detector Source
moth bat speed VD = VI1l speed Vs = Vb
away toward shift down shift up numerator denominator
minus minus
17 -56. The moth moves away from the bat, which tends to lower the detected frequency. Because the speed is in the numerator, we choose the minus sign to meet that tendency (the numerator becomes smaller). These reasoning steps are shown in Table 17 -3.
We have the speed of the bat in the denominator of Eq. 17 -56. The bat moves toward the moth, which tends to increase the detected frequency. Because the speed is in the denominator, we choose the minus sign to meet that tendency (the denominator becomes smaller).
With these substitutions and decisions, we have
343 mls - 8.00 mls = (82.52 kHz) 343 mls - 9.00 mls
= 82.767 kHz = 82.8 kHz. (Answer)
Detection of echo by bat: In the echo back to the bat, the moth acts as a source of sound, emitting at the frequency tmd we just calculated. So now the moth is the source (moving away) and the bat is the detector (moving toward). The reasoning steps are shown in Table 17 -3. To find the frequency tbd detecredby the bat, we write Eq.17 -56 as
V + Vb fbd = tmd + v VIII
343 mls + 9.00 mls = (82.767 kHz) 343 mls + 8.00 mls
= 83.00 kHz"" -83.0 kHz. (Answer)
Some moths evade bats by "jamming" the detection system with ultrasonic clicks.
Echo Back to Bat
Detector Source
bat moth
speed VD = Vb speed Vs = VI1l
toward away shift up shift down
numerator denominator
plus plus
.• ~ PLUS Additional examples, video, and practice available at WileyPLUS
1 • SUPERSONIC SPEEDS, SHOCK WAVES
-----------7--r_~-7--r_~------~._·~~x
(a) (b)
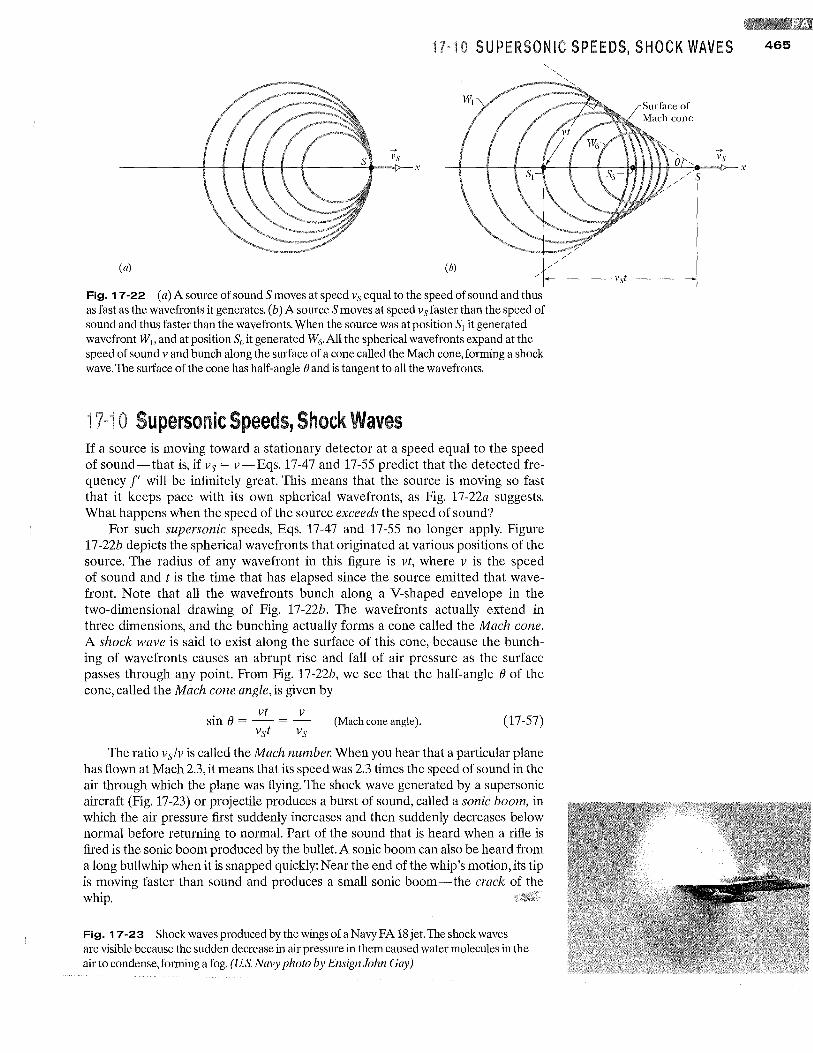
Fig. 17-22 (a) A source of sound Smoves at speed vsequal to the speed of sound and thus as fast as the wavefronts it generates. (b) A source S moves at speed Vs faster than the speed of sound and thus faster than the wave fronts. When the source was at position SI it generated wavefront Wb and at position S6 it generated W6• All the spherical wavefronts expand at the speed of sound v and bunch along the surface of a cone called the Mach cone, forming a shock wave. The surface of the cone has half-angle 8 and is tangent to all the wavefronts.
1 Supersonic Speeds, Shock Waves If a source is moving toward a stationary detector at a speed equal to the speed of sound--that is, if Vs = v--Eqs. 17-47 and 17-55 predict that the detected frequency f' will be infinitely great. This means that the source is moving so fast that it keeps pace with its own spherical wavefronts, as Fig. 17 -22a suggests. What happens when the speed of the source exceeds the speed of sound?
For such supersonic speeds, Eqs. 17-47 and 17-55 no longer apply. Figure 17 -22b depicts the spherical wavefronts that originated at various positions of the source. The radius of any wavefront in this figure is vt, where v is the speed of sound and t is the time that has elapsed since the source emitted that wavefront. Note that all the wavefronts bunch along a V-shaped envelope in the two-dimensional drawing of Fig. 17-22b. The wavefronts actually extend in three dimensions, and the bunching actually forms a cone called the Mach cone. A shock wave is said to exist along the surface of this cone, because the bunching of wavefronts causes an abrupt rise and fall of air pressure as the surface passes through any point. From Fig. 17-22b, we see that the half-angle () of the cone, called the Mach cone angle, is given by
. vt v sm () = --- =-
vst Vs (Mach cone angle). (17-57)
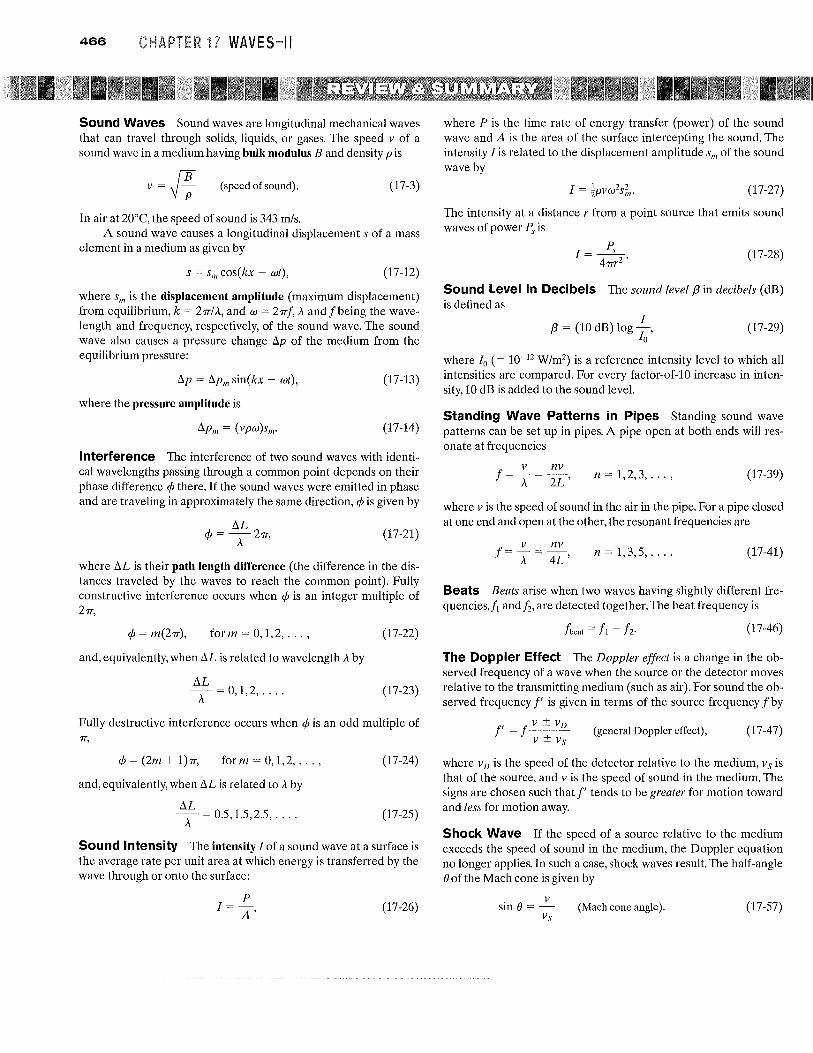
The ratio vslv is called the Mach numbel: When you hear that a particular plane has flown at Mach 2.3, it means that its speed was 2.3 times the speed of sound in the air through which the plane was flying. The shock wave generated by a supersonic aircraft (Fig. 17-23) or projectile produces a burst of sound, called a sonic boom, in which the air pressure first suddenly increases and then suddenly decreases below normal before returning to normal. Part of the sound that is heard when a rifle is fired is the sonic boom produced by the bullet. A sonic boom can also be heard from a long bullwhip when it is snapped quickly: Near the end of the whip's motion, its tip is moving faster than sound and produces a small sonic boom --the crack of the whip.
Fig. 17-23 Shock waves produced by the wings of a Navy FA 18 jet. The shock waves are visible because the sudden decrease in air pressure in them caused water molecules in the air to condense, forming a fog. (US. Navy photo by Ensign John Gay)
465
466 H R 1 WAVES-II
Sound Waves Sound waves are longitudinal mechanical waves that can travel through solids, liquids, or gases. The speed v of a sound wave in a medium having bulk modulus B and density pis
v=P; (speed of sound). (17-3)
In air at 20°C, the speed of sound is 343 mls. A sound wave causes a longitudinal displacement s of a mass
element in a medium as given by
s = Sm cos(kx - wt), (17-12)
where Sill is the displacement amplitude (maximum displacement) from equilibrium, k = 27TI A, and w = 27Tf, A and f being the wavelength and frequency, respectively, of the sound wave. The sound wave also causes a pressure change t:.p of the medium from the equilibrium pressure:
t:.p = t:.PIll sin(kx - wt),
where the pressure amplitude is
t:.pm = (vpw)sm.
(17-13)
(17-14)
Interference The interference of two sound waves with identical wavelengths passing through a common point depends on their phase difference cP there. If the sound waves were emitted in phase and are traveling in approximately the same direction, cP is given by
t:.L '" = -27T 'f' A ' (17-21)
where t:.L is their path length difference (the difference in the distances traveled by the waves to reach the common point). Fully constructive interference occurs when cP is an integer multiple of 27T,
for 111 = 0,1,2, ... , (17-22)
and, equivalently, when t:.L is related to wavelength A by
t:.L T = 0,1,2,.... (17-23)
Fully destructive interference occurs when cP is an odd mUltiple of 7T,
cP = (2111 + 1)7T, for 111 = 0,1,2, ... ,
and, equivalently, when t:.L is related to A by
t:.L T = 0.5,1.5,2.5, ....
(17-24)
(17-25)
Sound Intensity The intensity I of a sound wave at a surface is the average rate per unit area at which energy is transferred by the wave through or onto the surface:
P 1=
A' (17-26)
where P is the time rate of energy transfer (power) of the sound wave and A is the area of the surface intercepting the sound. The intensity I is related to the displacement amplitude Sm of the sound wave by
(17-27)
The intensity at a distance r from a point source that emits sound waves of power Ps is
(17-28)
Sound Level in Decibels The sound level f3 in decibels (dB) is defined as
I f3 = (10 dB) log 10' (17-29)
where 10 (= 10-]2 W/m2) is a reference intensity level to which all intensities are compared. For every factor-of-lO increase in intensity, 10 dB is added to the sound level.
Standing Wave Patterns in Pipes Standing sound wave patterns can be set up in pipes. A pipe open at both ends will resonate at frequencies
f= ~ = nv A 2L
n=1,2,3, ... , (17-39)
where v is the speed of sound in the air in the pipe. For a pipe closed at one end and open at the other, the resonant frequencies are
n = 1,3,5, .... (17-41)
Beats Beats arise when two waves having slightly different frequencies,!] and f2, are detected together. The beat frequency is
(17-46)
The Doppler Effect The Doppler effect is a change in the observed frequency of a wave when the source or the detector moves relative to the transmitting medium (such as air). For sound the observed frequency /' is given in terms of the source frequency f by
/'= (general Doppler effect), (17-47)
where VD is the speed of the detector relative to the medium, Vs is that of the source, and v is the speed of sound in the medium. The signs are chosen such that /' tends to be greater for motion toward and less for motion away.
Shock Wave If the speed of a source relative to the medium exceeds the speed of sound in the medium, the Doppler equation no longer applies. In such a case, shock waves result. The half-angle 8 of the Mach cone is given by
sin 8 = ~ Vs
(Mach cone angle). (17-57)


