Embed Size (px)
Citation preview

ARTICLE IN PRESS
Available at www.sciencedirect.com
WAT E R R E S E A R C H 4 0 ( 2 0 0 6 ) 1 1 4 3 – 1 1 5 4
0043-1354/$ - see frodoi:10.1016/j.watres
�Corresponding aE-mail addresses:
journal homepage: www.elsevier.com/locate/watres
TM
Sorption of phosphorous to Filtralite-P —The effect ofdifferent scalesKinga Adama,�, Anne Kristine Søvikb, Tore Krogstadc
aDepartment of Mathematical Sciences and Technology, Norwegian University of Life Sciences, P.O. Box 5003, 1432 As, NorwaybCentre for Soil and Environmental Research (Bioforsk), Fredrik A. Dahls vei 20, 1432 As, NorwaycDepartment of Plant and Environmental Sciences, Norwegian University of Life Sciences, P.O. Box 5003, 1432 As, Norway
a r t i c l e i n f o
Article history:
Received 26 April 2005
Received in revised form
7 January 2006
Accepted 11 January 2006
Keywords:
Constructed wetland
Filtralite-PTM
P fractionation
P sorption
SEM
nt matter & 2006 Elsevie.2006.01.009
uthor. Tel.: +47 [email protected] (K.
A B S T R A C T
Sorption of P to the filter material Filtralite-PTM was examined at a small, medium and large
scale. In the small- and meso-scale laboratory models, the sorbed amount of total
phosphorus (P) was heterogeneously distributed with more P sorbed in the inlet zone and
the bottom layers. The full-scale system had, on the other hand, the highest sorbed
concentration in the outlet region. The overall P sorption capacity of the material was 8030,
4990 and 521 mg P kg�1 Filtralite-PTM for Box 1, Box 2 and meso scale, respectively. This
equals 4.4, 2.8 and 0.29 kg P m�3 material, respectively. However, the maximum sorption
capacities found were 2500, 3887 and 4500 mg P kg�1 Filtralite-PTM for the two small-scale
box systems and the meso-scale container, respectively. In the full-scale system the overall
P sorption capacity of the material was 52 mg P kg�1 Filtralite-PTM (0.029 kg P m�3 Filtralite-
PTM) with a maximum sorbed amount of P of 249 mg P kg�1. Results from both the small-
and meso-scale system show that when a constructed wetland (CW) is saturated, i.e. when
the outlet concentration has reached its maximum allowed concentration of 1.0 mg P l�1,
only parts of the filter material will have reached the sorption capacity. Sequential
extractions of Filtralite-PTM showed that the loosely bound P, Ca–P and Al–P were the
primary P sorption pools both in the small-scale models and in the full-scale CW. However,
the proportion of these three fractions varied with time and change in pH. A white product
precipitated in the outlet zone of both the small-scale box models as well as the onsite CW.
The surface of these precipitation particles was identified by X-ray diffraction and SEM
method as CaCO3 and precipitated Ca- and Mg-phosphates.
& 2006 Elsevier Ltd. All rights reserved.
1. Introduction
Constructed wetlands (CWs) have shown their ability to
remove large amounts of phosphorous (P) (Kadlec and Knight,
1996; Jenssen et al., 2005; Vymazal, 2004) from wastewater
using special filter materials with an enhanced P sorption
capacity. The physico-chemical characteristics of different
filter material have been investigated by several scientists in
order to evaluate which parameters are the most important
r Ltd. All rights reserved.
; fax: +47 64948810.Adam), anne.sovik@biofo
for the P sorption (Drizo et al., 1997, 1999, 2002; Johansson,
1998; Arias et al., 2001; Arias and Brix 2005; Jang and Kang,
2001; Khadhraoui et al., 2002; Molle et al., 2005). Their
conclusions show that grain size distribution, pH, specific
surface area and the content of Al, Fe or Ca ions are
particularly important material properties for P sorption.
These filter substrates have to be available in large quantities
at low cost, but with long lasting P sorption capacity
(Johansson, 1998). As potential fertilizers, these filter materi-
rsk.no (A.K. Kristine Søvik), [email protected] (T. Krogstad).

ARTICLE IN PRESS
WAT E R R E S E A R C H 4 0 ( 2 0 0 6 ) 1 1 4 3 – 1 1 5 41144
als must remove P from wastewater in such a way that the P
may be recovered and available for plant uptake. Kvarnstrom
et al. (2004) showed that in Sweden 15% of the commercial
fertilizer P could be replaced by P from such filter substrates.
Filtralite-PTM, the new generation of Norwegian produced
light weight aggregate (LWA) is especially developed for P
sorption. Filtralite-PTM is an illite based clay mineral with a
high pH and high Ca and Mg content. Previous batch
experiments have shown high P sorption capacity of the
material up to 12 g P kg�1 Filtralite-PTM (6.6 kg P m�3 Filtralite-
PTM) (Jenssen and Krogstad, 2003). Drizo et al. (2002) and
Adam et al. (2005) showed that batch experiments can lead to
misinterpretation and overestimation of the P retention
capacity of the material. Cheung and Venkitachalam (2000)
suggested that the maximum sorption capacity of the
materials estimated by Langmuir isotherms may not be
accurate but it could still be useful in comparing alternative
materials. Drizo et al. (2002) also recommended that batch
experiments should be coupled with long-term investigations
of the material’s performance. The question is whether these
long-term laboratory experiments may mimic the processes
of full-scale CWs? Can we use them as representative models
of the P removal processes of full-scale systems?
In this paper experiments were conducted to determine the
long-term P sorption capacity of Filtralite-PTM in small- and
meso-scale laboratory filter systems. The results were com-
pared with data from existing full-scale CW systems. The
spatial distribution of sorbed P was measured at all scales.
Fractionation of P from the small- and the full-scale systems
was also conducted to find potential patterns and pools of P
removal. The mineralogical composition of Filtralite-PTM
before and after exposure to P (small-scale system) as well
as precipitates from the small- and full-scale systems was
examined by scanning electron microscope (SEM).
2. Material and methods
2.1. Filter medium
A filter material called Filtralite-PTM has been used in the
experiments at all three scales. The material is a commer-
cially available expanded clay product with a high pH (410)
and a high Ca and Mg content. It has a grain size in the range
0–4 mm, effective porosity of 40% (Optiroc, 2003) and particle
porosity of 68% (Suliman et al., 2005a) with a saturated
hydraulic conductivity of 100 m day�1. The uniformity coeffi-
cient (d60/d10) of the material has an average value of 2.6. Arias
et al. (2001) suggested that the uniformity coefficient should
be less than 4 in order to secure an adequate hydraulic
conductivity. Filtralite-PTM is fulfilling all the requirements to
be a good P removal agent in CW systems.
2.2. Study sites—sampling
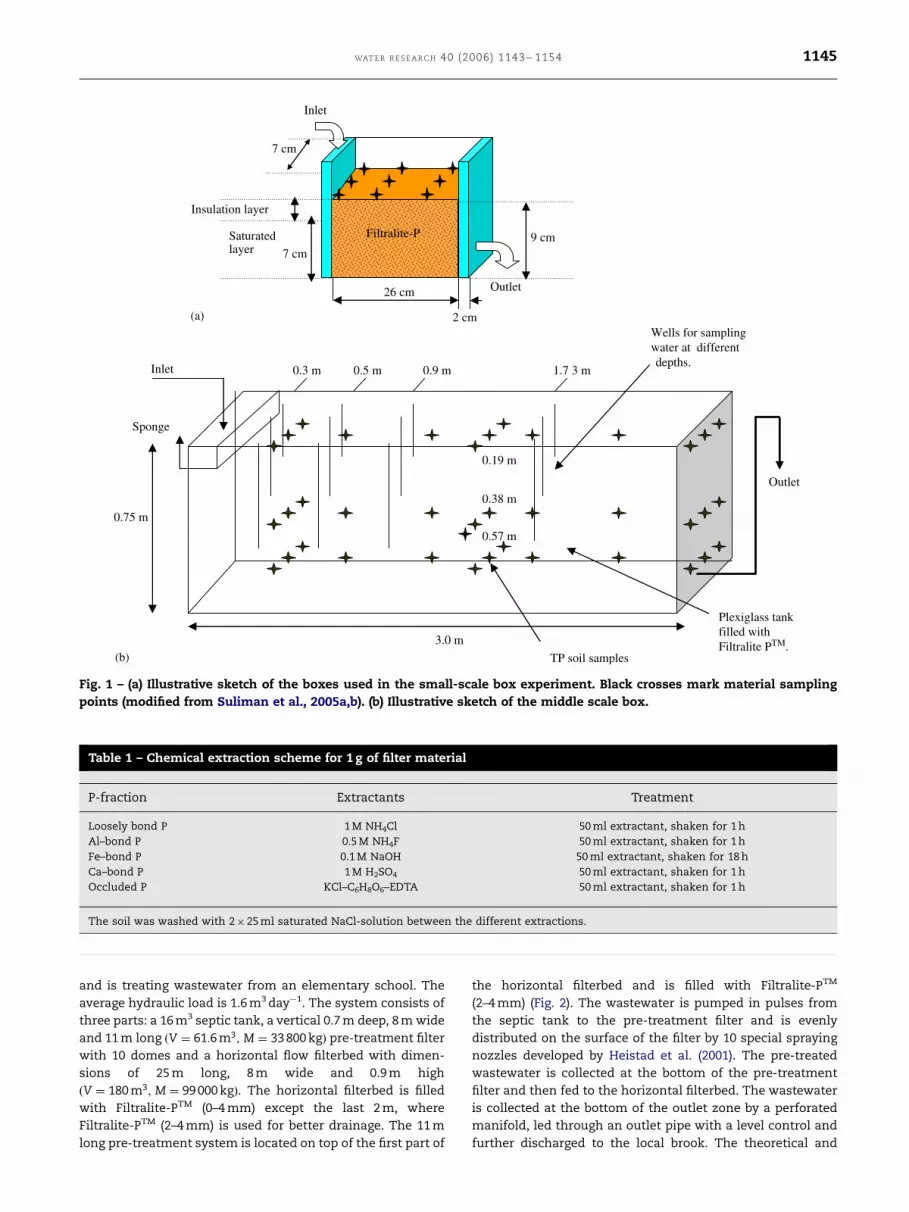
2.2.1. Small scaleTwo boxes with dimensions 26 cm long, 7 cm wide and 12 cm
high from an experiment described by Adam et al. (2005) were
used representing the small-scale system (Fig. 1a). The boxes
were filled with material up to 9 cm height but the top 2 cm of
the material was used only as an insulation layer. Each box
contained 953g of material but only about 700g was saturated
with P solution. One of the boxes was fed with 15ppm P
solution with a hydraulic loading rate (HLR) of 5 l day�1 (Box 1).
The other one was fed with the same P solution but with a HLR
of 1.25 l day�1 (Box 2). The theoretical residence time in the
boxes was 5 and 20 h in Box 1 and Box 2, respectively (Suliman
et al., 2005a). Phosphate concentrations and pH in the inlet and
outlet water were analyzed. The inlet concentration for both
boxes was kept constant at 15 ppm P for the entire experiment.
The inflow to the boxes was stopped when the boxes were
saturated with phosphorous, i.e. when the inlet concentration
was equal to the outlet concentration. When the experiment
was ended the filter material was sampled at three different
depths (top layer: 2–3 cm, middle layer: 4–5 cm and bottom
layer: 6-7 cm below the soil surface) at nine different locations
(Fig. 1) in order to measure the accumulated content of total P
(TP). Sequential extractions (Table 1) were carried out on a
composite sample from each box. The composite samples were
obtained by mixing the entire content of each box and a
representative sample was collected. During the first 2–3
months of the experiment associated with the very high pH
(11–12), white precipitate developed in the outlet draining tubes
of the boxes. The amount of precipitate was proportional to the
inlet P concentration and to the loading rate. The development
of the precipitates stopped when large amounts of Ca2+ and
Mg2+ were washed out from the system lowering the pH to
about 8–9.
2.2.2. Meso scaleThe meso-scale filter system consists of a container of
Plexiglass with the dimensions 3 m long, 0.29 m wide and
0.8 m high (Fig. 1b). The height of the filter material was 0.75 m.
The total amount of the material in the container was 653 l or
359 kg. Vertical PVC pipes were inserted at 12 locations in the
filter material (Fig. 1b) in order to examine solute concentra-
tions throughout the volume of the filter material. Solutes and
water were distributed evenly through a sponge replacing the
entire width of the top 0.14 m of the filter material. A P-solution
with a concentration of 6 ppm was entering the system as
pulse injections; every 2.75 min approximately 135 ml of
solution was applied to the inlet area. A constant head of
0.70 m was defined by the height of the outlet tube and the
head at the inlet was 0.72 m. The theoretical and measured
residence time in the system were approximately 86 and 103 h,
respectively (Suliman et al., 2005b).
The container was fed with an average concentration of
6 ppm P solution for about 1.5 years (17th March 2003–18th
October 2004). Water samples were taken from the observa-
tion wells as well as from the outlet and analyzed for PO43�–P.
Soil samples were collected after the experiment was finished
to measure the total sorbed P in the material. The samples
were taken from 13 locations at three different depths (10, 40
and 60 cm below the soil surface) marked with black crosses
in Fig. 1b. Sequential extraction of the material was not
conducted on this scale.
2.2.3. Large scaleA subsurface flow wetland system at Dal, Norway (CW1)
(Suliman et al., 2005b) has been operating since autumn 2000
ARTICLE IN PRESS
Table 1 – Chemical extraction scheme for 1 g of filter material
P-fraction Extractants Treatment
Loosely bond P 1 M NH4Cl 50 ml extractant, shaken for 1 h
Al–bond P 0.5 M NH4F 50 ml extractant, shaken for 1 h
Fe–bond P 0.1 M NaOH 50 ml extractant, shaken for 18 h
Ca–bond P 1 M H2SO4 50 ml extractant, shaken for 1 h
Occluded P KCl–C6H8O6–EDTA 50 ml extractant, shaken for 1 h
The soil was washed with 2� 25 ml saturated NaCl-solution between the different extractions.
0.3 m 0.5 m 0.9 m 1.7 3 m
0.19 m
0.38 m
0.57 m
0.75 m
3.0 m
Inlet
Outlet
Plexiglass tank filled with Filtralite PTM.
Wells for sampling water at different depths.
Sponge
TP soil samples
9 cm
2 cm
26 cm
7 cm
7 cm
Inlet
Outlet
Saturatedlayer
Insulation layer
Filtralite-P
(a)
(b)
Fig. 1 – (a) Illustrative sketch of the boxes used in the small-scale box experiment. Black crosses mark material sampling
points (modified from Suliman et al., 2005a,b). (b) Illustrative sketch of the middle scale box.
WAT E R R E S E A R C H 40 (2006) 1143– 1154 1145
and is treating wastewater from an elementary school. The
average hydraulic load is 1.6 m3 day�1. The system consists of
three parts: a 16 m3 septic tank, a vertical 0.7 m deep, 8 m wide
and 11 m long ðV ¼ 61:6 m3; M ¼ 33 800 kgÞ pre-treatment filter
with 10 domes and a horizontal flow filterbed with dimen-
sions of 25 m long, 8 m wide and 0.9 m high
ðV ¼ 180 m3; M ¼ 99 000 kgÞ. The horizontal filterbed is filled
with Filtralite-PTM (0–4 mm) except the last 2 m, where
Filtralite-PTM (2–4 mm) is used for better drainage. The 11 m
long pre-treatment system is located on top of the first part of
the horizontal filterbed and is filled with Filtralite-PTM
(2–4 mm) (Fig. 2). The wastewater is pumped in pulses from
the septic tank to the pre-treatment filter and is evenly
distributed on the surface of the filter by 10 special spraying
nozzles developed by Heistad et al. (2001). The pre-treated
wastewater is collected at the bottom of the pre-treatment
filter and then fed to the horizontal filterbed. The wastewater
is collected at the bottom of the outlet zone by a perforated
manifold, led through an outlet pipe with a level control and
further discharged to the local brook. The theoretical and

ARTICLE IN PRESS
Fig. 2 – Illustrative sketch of CW1.
WAT E R R E S E A R C H 4 0 ( 2 0 0 6 ) 1 1 4 3 – 1 1 5 41146
measured retention time of the system were 800 and 425 h,
respectively (Suliman et al., 2005b). The system has an
estimated lifetime of 15 years.
Soil and water samples from the horizontal filterbed were
collected in the autumn of 2003 when the system was about 3
years old. Water samples were taken at the inlet and outlet
zones and from the nine observation wells (Fig. 2) and
analyzed for PO4–P, while the soil samples were taken close
to these observation wells. Soil samples were collected from
nine spots (Fig. 2) at three different depths (40–50, 60–70 and
70–80 cm below the surface) to measure the content of TP.
Sequential extractions (Table 1) were carried out on samples
from two locations marked as number 2 and 5 in Fig. 2. One
soil sample was divided into two fractions (0–2 and 2–4 mm)
to examine the grain size influence on the P sorption. All
measured values of P in filter material from all three scales
were corrected for the background P concentration in
Filtralite-PTM (0.038 mg P kg�1).
Precipitates in the filter can clog the system and reduce the
hydraulic capacity of the media. For this purpose precipitate
samples were taken from a recently established full-scale
wetland system at Norderas, Norway (CW2) (Heistad et al.,
2004) that still has a high content of soluble Mg and Ca, and
fresh precipitates at the outlet zone. This system has been
operating since the winter of 2002 and receives ordinary
domestic wastewater from three family flats. Precipitate was
collected and analyzed as described below.
2.3. Chemical analysis
The soil samples were extracted for TP according to Møberg
and Pettersen (1982). Sequential extraction was conducted
according to Chang and Jackson (1957), modified by Hartikai-
nen (1979) (Table 1). Extractants were filtered through a
0.45mm membrane filter and determined by the ascorbic
acid—ammonium molybdate method of Murphy and Riley
(1962). SEM analyses were conducted in order to characterize
the microstructure and composition of the Filtralite-PTM
(0–4 mm) material before and after use, as well as the white
precipitates from the small boxes. The chemical composition
of the precipitate from CW2 was analyzed by using X-ray
diffraction (model: Philips, PW1730/10) analysis.
2.4. Statistical analyses
Statistical analyses (SAS) were run to find significant (Po0.05)
differences in the amount of sorbed P between the different
scales as well as compare each individual scale by width,
length and depth.
3. Results
3.1. Spatial distribution of P in water and soil
3.1.1. Small scaleThe inlet P concentration to both boxes was 15 ppm for
the entire experimental period. The outlet concen-
trations increased gradually in both boxes and the experi-
ment was stopped when the outlet concentrations approxi-
mately exceeded the inlet concentration. It took 150 and
538 days for Box 1 and 2, respectively, to become saturated
with P.
The total amount of P added to each box for the entire
experimental period was 7.4 and 4.8 g for Box 1 and 2,
respectively. Box 1 sorbed 76% and Box 2 sorbed 73% of the
added P. Thus the filter material in both boxes was approxi-
mately saturated at the end of the experiment. Mass balance
calculations show that the average amount sorbed was 5.6 g P/
700 g material and 3.5 g P/700 g material, resulting in overall P
sorption of 8.0 g P kg�1 (4.4 kg P m�3 material) and 5.0 g P kg�1
(2.8 kg P m�3 material) for Box 1 and 2, respectively. The

ARTICLE IN PRESS
WAT E R R E S E A R C H 40 (2006) 1143– 1154 1147
samples from the filter material were analyzed for TP, and the
results show a very heterogeneous pattern (Fig. 3a and b). The
maximum amount of P extracted from the material was 2500
and 3887 mg P kg�1 material in Box 1 and Box 2, respectively
(equal to 1.4 and 2.1 kg P m�3 material in the two boxes). In
Box 2 the amount of sorbed P decreased towards the outlet
(Fig. 3b), while in Box 1 there seemed to be an increase in the
sorbed concentration towards the outlet (Fig. 3a). In both
cases the sorbed P accumulated at the bottom of the boxes.
Still the amount of total P sorbed in the two boxes was not
significantly different (P40.05). There was also no signifi-
cantly difference between the amounts of total P in the
different layers within each box. The maximum sorption
capacity estimated by extraction of total P (2500 mg P kg�1)
and the average sorption capacity based on mass balance
calculations (8030 mg P kg�1) differed significantly in the case
of Box 1. One possible explanation could be that P was
precipitated along with Ca and Mg, followed by leaching of
Top layer
600
600
600
1600
1600
1600
1400
1400
1400
1200
1200
1200
1200
1000
1000
1000
1000
800
800
800
800
800
600
600
600
600
Width (cm)
1 3 5 6 7
Leng
th (
cm)
Leng
th (
cm)
5
10
15
20
25
Midd
800
800
800
1600
1400
1200
1200
101000
1000
1000
6
600
1400
1200
1200
1000
10001000
1000
1000
800
800800
800
800
600
600600
600
600
1000
8001600
1600
140014001400
1200
12001200
1200 1800
5
10
15
20
25
1200
1200
1000
1000
800
800
600
600
2 4
Wid
1 32
Wid
1 32
Width (cm)
1 3 5 6 72 4
1000
1000800600
1000800600
(a)
(b)
Fig. 3 – (a) Distribution of P (mg P kg�1 Filtralite-PTM) in different d
concentration of 15 ppm P). (b) Distribution of P (mg P kg�1 Filtra
loading rate of 1.25 l day�1 and an inlet concentration of 15 ppm
the boxes.
precipitates out from the system and accumulation in the
bottom of the collecting containers (Adam et al., 2005).
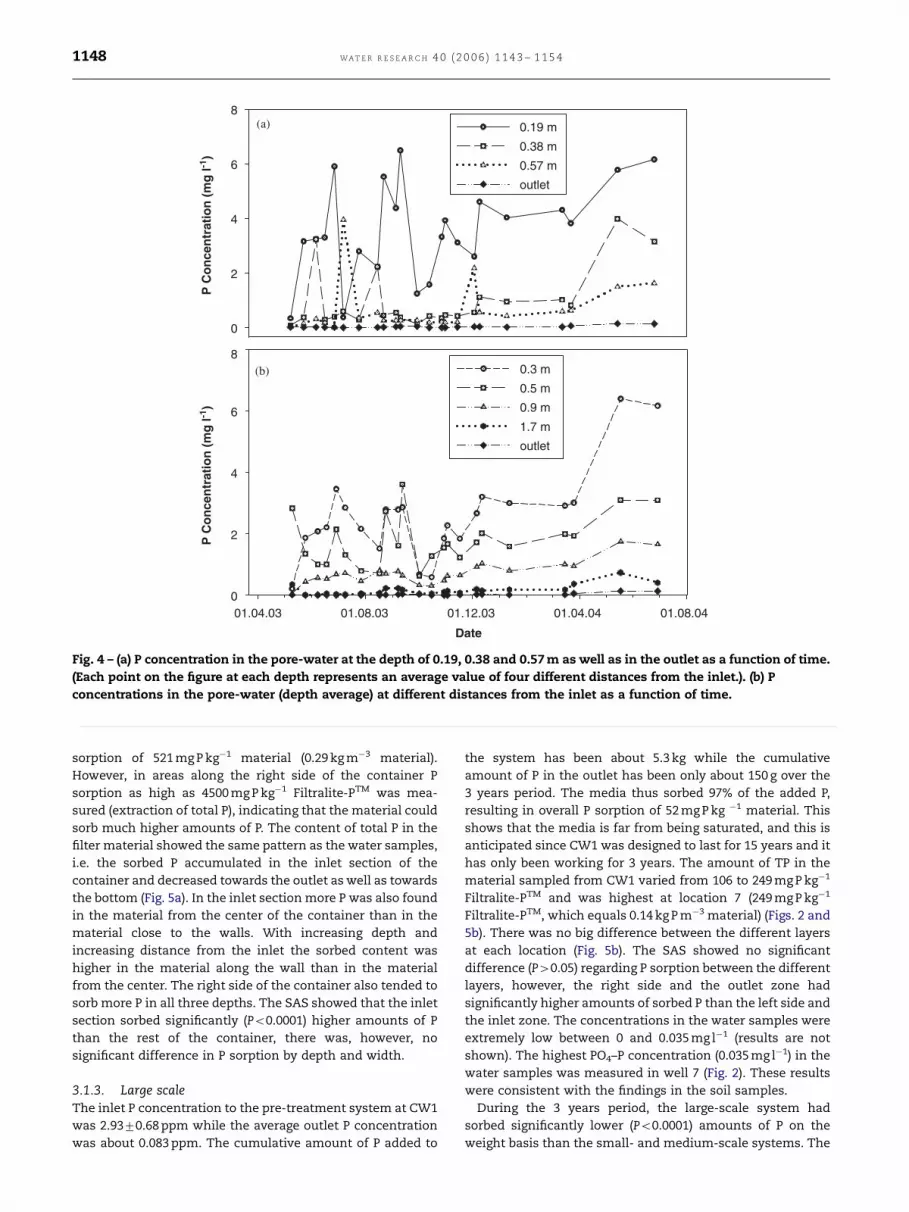
3.1.2. Meso scaleDuring the experiment, the P concentration in the outlet
reached 0.2 ppm. The average concentration in the deeper
wells (0.57 cm below the surface) was lower than the average
concentration in the upper wells (0.38 and 0.19 cm below the
surface) (Fig. 4a). Similar results were found for a Br-tracer
experiment in the same container (French et al., 2004). Thus
there seems to be a preferential flow in the upper parts of the
container. The water samples collected from the observation
wells also showed that the P concentration in the pore-water
decreased towards the outlet (Fig. 4b).
The total amount of P added to the container was 189 g for
the entire period and the total amount sorbed to the filter was
187 g. Thus according to mass balance calculations the
material sorbed 99% of the added P, resulting in overall P
le layer
800
800
800
16001400
14001200
12001000
1000
00
600
600
00
Bottom layer
2500
2500
2000
2000
2000
15002000
1500
1500
1500
1500
1500
1000
1000
1000
1000
1000
500
1600
1
1200
1200
1000
1000
1000
800
800
800
800
600600
600
600
600
1500
1000
1000
1000
1000
500
500 1000
1000
1000
1000
500
30002500
200015001500
1500
th (cm)
5 6 74
Width (cm)
1 3 5 6 72 4
Width (cm)
1 3 5 6 72 4
th (cm)
5 6 74
400
1400
2000
epths in Box 1 (hydraulic loading rate of 5 l day�1 and an inlet
lite-PTM) in different depths in Box 2 (hydraulic
P). The arrows represent the direction of the flow in
ARTICLE IN PRESS
0
2
4
6
80.3 m
0.5 m
0.9 m
1.7 m
outlet
Date
01.04.03 01.08.03 01.12.03 01.04.04 01.08.04
P C
on
cen
trat
ion
(m
g l-1
)P
Co
nce
ntr
atio
n (
mg
l-1)
0
2
4
6
80.19 m
0.38 m
0.57 m
outlet
(a)
(b)
Fig. 4 – (a) P concentration in the pore-water at the depth of 0.19, 0.38 and 0.57 m as well as in the outlet as a function of time.
(Each point on the figure at each depth represents an average value of four different distances from the inlet.). (b) P
concentrations in the pore-water (depth average) at different distances from the inlet as a function of time.
WAT E R R E S E A R C H 4 0 ( 2 0 0 6 ) 1 1 4 3 – 1 1 5 41148
sorption of 521 mg P kg�1 material (0.29 kg m�3 material).
However, in areas along the right side of the container P
sorption as high as 4500 mg P kg�1 Filtralite-PTM was mea-
sured (extraction of total P), indicating that the material could
sorb much higher amounts of P. The content of total P in the
filter material showed the same pattern as the water samples,
i.e. the sorbed P accumulated in the inlet section of the
container and decreased towards the outlet as well as towards
the bottom (Fig. 5a). In the inlet section more P was also found
in the material from the center of the container than in the
material close to the walls. With increasing depth and
increasing distance from the inlet the sorbed content was
higher in the material along the wall than in the material
from the center. The right side of the container also tended to
sorb more P in all three depths. The SAS showed that the inlet
section sorbed significantly (Po0.0001) higher amounts of P
than the rest of the container, there was, however, no
significant difference in P sorption by depth and width.
3.1.3. Large scaleThe inlet P concentration to the pre-treatment system at CW1
was 2.9370.68 ppm while the average outlet P concentration
was about 0.083 ppm. The cumulative amount of P added to
the system has been about 5.3 kg while the cumulative
amount of P in the outlet has been only about 150 g over the
3 years period. The media thus sorbed 97% of the added P,
resulting in overall P sorption of 52 mg P kg �1 material. This
shows that the media is far from being saturated, and this is
anticipated since CW1 was designed to last for 15 years and it
has only been working for 3 years. The amount of TP in the
material sampled from CW1 varied from 106 to 249 mg P kg�1
Filtralite-PTM and was highest at location 7 (249 mg P kg�1
Filtralite-PTM, which equals 0.14 kg P m�3 material) (Figs. 2 and
5b). There was no big difference between the different layers
at each location (Fig. 5b). The SAS showed no significant
difference (P40.05) regarding P sorption between the different
layers, however, the right side and the outlet zone had
significantly higher amounts of sorbed P than the left side and
the inlet zone. The concentrations in the water samples were
extremely low between 0 and 0.035 mg l�1 (results are not
shown). The highest PO4–P concentration (0.035 mg l�1) in the
water samples was measured in well 7 (Fig. 2). These results
were consistent with the findings in the soil samples.
During the 3 years period, the large-scale system had
sorbed significantly lower (Po0.0001) amounts of P on the
weight basis than the small- and medium-scale systems. The

ARTICLE IN PRESS
Top layer
500
500
500500
500
150015001500
100010001000
40003500 30003000
2500
2500
2500
2000
2000
2000
Width (cm)
5 10 15 20 25
Width (cm)
5 10 15 20 25
Width (cm)
5 10 15 20 25
Width (cm)
5 10 15 20 25
Width (cm)
5 10 15 20 25
Width (cm)
5 10 15 20 25
Leng
th (
cm)
Leng
th (
cm)
50
100
150
200
250
300Middle layer
25002500
20002000
15001500
10001000
500
500 500
500
45004000
35003000
3000
Bottom layer
500
500
500
500
500
500
500
1000
10003000
25002000
1500
1500
140140
140 160
160
150
150
150
130130130
130130
130
140140
190180
170
170
2
4
6
8
10
12
14
140
140
140
140
140
140140
150
150
150 180170
160
160
120
120
120
220200
180
180
160
160
140
140
140
40003500
(a)
(b)
Fig. 5 – (a) Distribution of P in the meso-scale container at different depths. The values are given as mg P kg�1 Filtralite-PTM. (b)
Distribution of P in the full-scale CW system. The values are given as mg P kg�1 Filtralite-PTM. The arrows represent
the direction of the flow in the boxes.
WAT E R R E S E A R C H 40 (2006) 1143– 1154 1149
average sorbed P concentrations based on mass balance
calculations were 8.03, 4.99, 0.52 and 0.052 g P kg�1 Filtralite-
PTM for Box 1, Box 2, meso-scale container and CW1,
respectively.
3.2. Sequential extraction
It was a priori assumed that Ca–P would be the main P pool
because of the high pH and Ca content of the media. The
results from the onsite system justified this hypothesis since
the Ca–P pool contributed 50–54% of the total P removal. In
the small boxes, on the other hand, only 29–41% of the P
removed was found as Ca–P (Table 2). The results for loosely
bound P were opposite, a high percentage (30–53%) in the
small boxes and a very low percentage (4–5%) in the onsite
system. The percentage of Al bound P was relatively high in
the onsite system (40–43%) and lower (16–27%) in the small
boxes. The difference in the proportion of loosely bound Ca–
and Al–P in the small boxes and the onsite system can be
caused by different operating times (Table 2). The sorbed P
was thus transformed from loosely bound P into stronger
bound Ca– and Al–P by time. Occluded P and Fe bound P were
not important P pools, this is due to the high pH and the
anaerobic conditions in the systems. These results are
consistent to the findings of Zhu (1998). Ca-bound P and
loosely bound P are the most available P sources for plant
uptake, especially in acidic soils where the solubility of Ca–P
compounds increases as the pH drops below 6 (Tisdale et al.,
1993). It was a priori expected that the smaller particles would
sorb more P based on their higher specific surface area,
however, there was no significant difference between the two
Filtralite-PTM fractions when it comes to P removal capacity
and sequential extraction. These results are consistent with
the ones found by Johansson (1998).
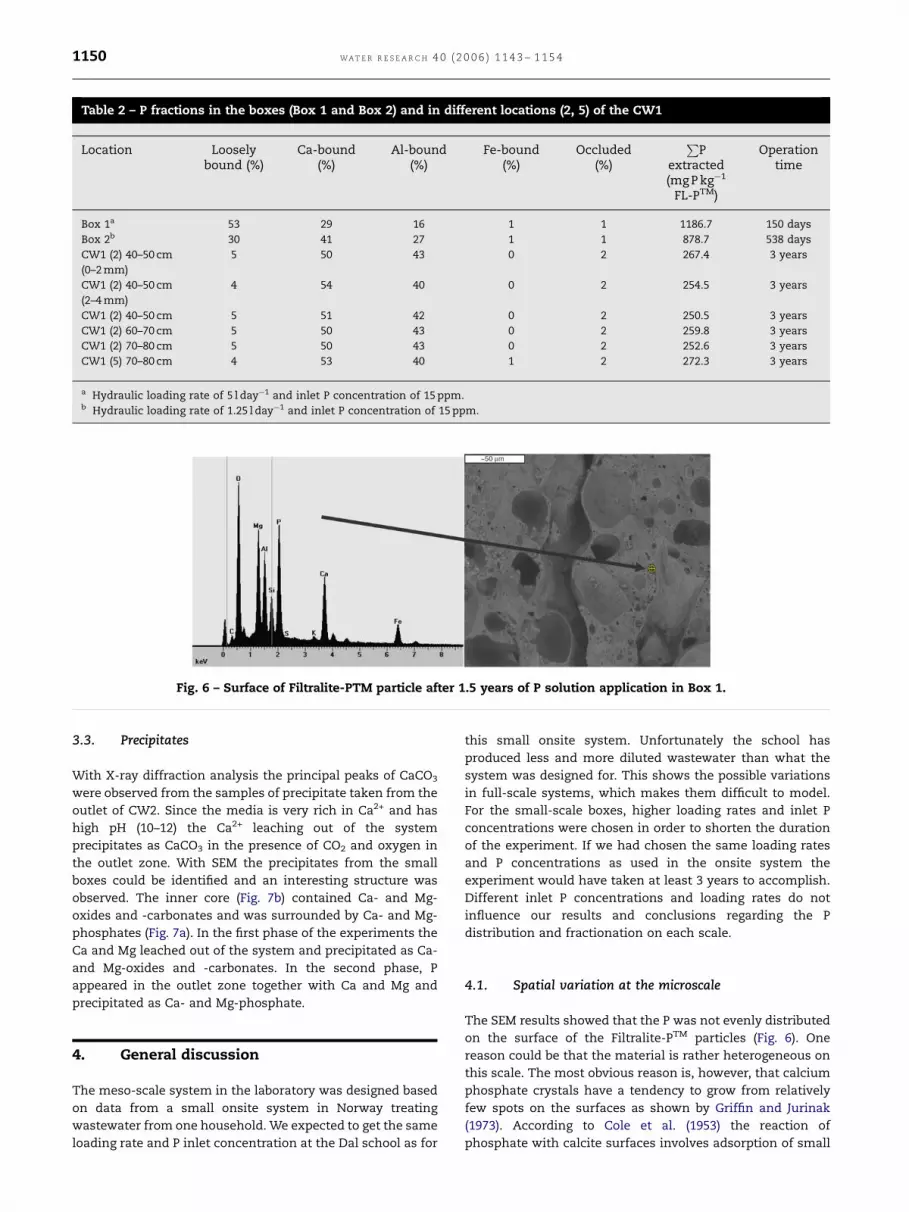
The results from the sequential extractions were supported
by SEM analysis of virgin and saturated Filtralite-PTM from the
small boxes. The results showed that there was only a
negligible amount of P in the virgin material, which is
consistent with the analytical laboratory measurements
(0.038 mg P kg�1 material). On the other hand, the P saturated
Filtralite-PTM had a high content of P connected to surfaces
where both Ca and Mg or Al were present (Fig. 6). Fe did not
seem to be important in the P accumulation process in the
system.
ARTICLE IN PRESS
Table 2 – P fractions in the boxes (Box 1 and Box 2) and in different locations (2, 5) of the CW1
Location Looselybound (%)
Ca-bound(%)
Al-bound(%)
Fe-bound(%)
Occluded(%)
PP
extracted(mg P kg�1
FL-PTM)
Operationtime
Box 1a 53 29 16 1 1 1186.7 150 days
Box 2b 30 41 27 1 1 878.7 538 days
CW1 (2) 40–50 cm
(0–2 mm)
5 50 43 0 2 267.4 3 years
CW1 (2) 40–50 cm
(2–4 mm)
4 54 40 0 2 254.5 3 years
CW1 (2) 40–50 cm 5 51 42 0 2 250.5 3 years
CW1 (2) 60–70 cm 5 50 43 0 2 259.8 3 years
CW1 (2) 70–80 cm 5 50 43 0 2 252.6 3 years
CW1 (5) 70–80 cm 4 53 40 1 2 272.3 3 years
a Hydraulic loading rate of 5 l day�1 and inlet P concentration of 15 ppm.b Hydraulic loading rate of 1.25 l day�1 and inlet P concentration of 15 ppm.
Fig. 6 – Surface of Filtralite-PTM particle after 1.5 years of P solution application in Box 1.
WAT E R R E S E A R C H 4 0 ( 2 0 0 6 ) 1 1 4 3 – 1 1 5 41150
3.3. Precipitates
With X-ray diffraction analysis the principal peaks of CaCO3
were observed from the samples of precipitate taken from the
outlet of CW2. Since the media is very rich in Ca2+ and has
high pH (10–12) the Ca2+ leaching out of the system
precipitates as CaCO3 in the presence of CO2 and oxygen in
the outlet zone. With SEM the precipitates from the small
boxes could be identified and an interesting structure was
observed. The inner core (Fig. 7b) contained Ca- and Mg-
oxides and -carbonates and was surrounded by Ca- and Mg-
phosphates (Fig. 7a). In the first phase of the experiments the
Ca and Mg leached out of the system and precipitated as Ca-
and Mg-oxides and -carbonates. In the second phase, P
appeared in the outlet zone together with Ca and Mg and
precipitated as Ca- and Mg-phosphate.
4. General discussion
The meso-scale system in the laboratory was designed based
on data from a small onsite system in Norway treating
wastewater from one household. We expected to get the same
loading rate and P inlet concentration at the Dal school as for
this small onsite system. Unfortunately the school has
produced less and more diluted wastewater than what the
system was designed for. This shows the possible variations
in full-scale systems, which makes them difficult to model.
For the small-scale boxes, higher loading rates and inlet P
concentrations were chosen in order to shorten the duration
of the experiment. If we had chosen the same loading rates
and P concentrations as used in the onsite system the
experiment would have taken at least 3 years to accomplish.
Different inlet P concentrations and loading rates do not
influence our results and conclusions regarding the P
distribution and fractionation on each scale.
4.1. Spatial variation at the microscale
The SEM results showed that the P was not evenly distributed
on the surface of the Filtralite-PTM particles (Fig. 6). One
reason could be that the material is rather heterogeneous on
this scale. The most obvious reason is, however, that calcium
phosphate crystals have a tendency to grow from relatively
few spots on the surfaces as shown by Griffin and Jurinak
(1973). According to Cole et al. (1953) the reaction of
phosphate with calcite surfaces involves adsorption of small

ARTICLE IN PRESS
Fig. 7 – SEM pictures of the same precipitate particle from the outlet tubes of the boxes. (a) The outside cover of the particle
with clear peaks of O, Mg, P and Ca. (b) The core of the particle with peaks of O and Mg.
WAT E R R E S E A R C H 40 (2006) 1143– 1154 1151
amounts of phosphate followed by precipitation of calcium
phosphate.
4.2. Spatial variation at the small, meso and large scale
The spatial distribution of P in the meso-scale system gives
valuable information regarding the sorption pattern of CWs
using Filtralite-PTM. As Fig. 4a and b as well as Fig. 5a shows
the material in the container is successively saturated with P,
i.e. there is like a P plume moving from the inlet to the outlet
and at the center of the plume the concentration in the water
is equal to the inlet concentration and the material is
saturated with P. This pattern was also observed for a similar
container using shell sand as filter material (Søvik and Kløve,
2005) as well as in a wastewater treatment system at Tveter
(south-eastern Norway) (Zhu et al., 2002). The small-scale
boxes did not show a similar pattern, which could be due to a
length of only 26 cm (Fig. 1a) while the plume in the container
is developing over a distance of 1 m from the inlet (Fig. 5a). In
CW1 this TP pattern is, however, not observed as statistical
results showed that there were no significant differences
between the various locations within the filter system. The
highest concentrations were also observed close to the outlet
where Filtralite-PTM (2–4 mm) material was used. This sug-
gests that short cuts or preferential pathways play an
important role in this particular wetland. Either chemical or
physical processes may cause the relatively high concentra-
tion of P in soil and water in the outlet zone. Ca2+ and Mg2+
ions, which are continuously leached out of the system, may
deposit in the outlet zone and thus induce P precipitation. On
the other hand the variable distribution of TP might be due to
irregularity in hydraulic parameters such as the hydraulic
conductivity, the grain size distribution or the porosity
(Suliman el al., 2005b).
4.3. Binding capacities
It is well known that most batch experiments overestimate
the P retention capacity of the material (Drizo et al., 2002).
Thus one of the questions addressed in this paper is whether
small and meso-scale flow experiments in the laboratory are
better tools for giving more reliable P sorption capacities,
which may be used for predicting the long-term behavior and
lifetime of a CW with Filtralite-PTM. Experiments with the first
generation of Filtralite showed that the maximum sorbed
concentration in the field was about half of the maximum
sorbed concentration found in batch experiments. Previous
batch experiments with Filtralite-PTM have shown a sorption
capacity of 12 g P kg�1 material (6.6 kg P m�3) (Jenssen and
Krogstad, 2003), and thus the authors assumed that the field
capacity of Filtralite-PTM would be 6 g P kg�1 material
(3.3 kg P m�3). In our experiments the maximum amount of
extracted TP obtained in the P saturated inlet section of the
meso-scale container was 4.5 g P kg�1 Filtralite-PTM with an
overall P sorption of 0.521 g P kg�1 material (Table 3). In the
small boxes the maximum amount of extracted TP was 2.5
and 3.9 g P kg�1 Filtralite-PTM with an overall P sorption of 8.03
and 4.99 g P kg�1 material in Box 1 and Box 2, respectively
(Table 3). In CW1 the maximum extracted TP concentration
was significantly lower than in the laboratory models, only
0.25 g P kg�1 with an overall P sorption of 0.052 g P kg�1
Filtralite-PTM. Thus the field sorption capacity of 6 g P kg�1
material estimated by Jenssen and Krogstad (2003) was found
in the box experiments and the inlet section of the meso-
scale experiment, where the media was almost completely
saturated with P.
By plotting the added P (g P kg�1 material) versus sorbed P
(g P kg�1 material), it is clearly seen that the total amount of P
added to the meso- and full-scale systems were lower than
the total amount added to the small-scale boxes (Fig. 8). This
gives lower overall sorbed P concentrations in the meso- and
full-scale systems. When it comes to the maximum sorbed
concentration, the small-scale boxes and the inlet zone of the
meso-scale container were close to P saturation, while the
inlet part of the full-scale system was still very far from P
saturation. The most probable reason for the low maximum
sorbed concentration in the full-scale system compared to
the laboratory system was a lower inlet concentration of P. As
already stated the school produced less and more diluted
wastewater than what was expected. Thus the intention of
comparing the laboratory experiments with the full-scale
system was not feasible. Other reasons for lower sorbed
concentrations in the full-scale system may be the loading
with real wastewater and thus the potential development of
biofilm, something which may reduce the sorption capacity of
the material compared to the lab experiments. A minimum
50% reduction in P sorption capacity of full-scale system-
s—due to the presence of solids and organic matter—was
suggested by Drizo et al. (2002). CW1 is also provided with a
pre-filter where substantial amounts (6–12 months of P

ARTICLE IN PRESS
Ta
ble
3–
Ad
ded
,m
ea
sure
da
nd
calc
ula
ted
Pin
the
dif
fere
nt
sca
les
Ma
sso
fFi
ltra
lite
-P
TM
(kg)
Vo
lum
eo
fFi
ltra
lite
-PT
M(m
3)
HR
T(h
)M
ass
of
Pa
dd
ed
(gP
kg�
1Fi
ltra
lite
-P
TM
)
Ma
sso
fP
ad
ded
(gP
m�
3Fi
ltra
lite
-P
TM
)
Mea
sure
dm
ax
imu
mso
rbed
con
cen
tra
tio
n(g
Pk
g�
1Fi
ltra
lite
-P
TM
)
Ca
lcu
late
davera
ge
sorb
ed
con
cen
tra
tio
n(g
Pk
g�1
Filt
rali
te-
PT
M)
Sm
all
-sca
leB
ox
10.7
00
1.2
7�
10�
35
10.6
5826
2.5
8.0
3
Sm
all
-sca
leB
ox
20.7
00
1.2
7�
10�
320
6.9
3779
3.8
87
4.9
9
Meso
sca
le359
0.6
53
86
0.5
26
289
4.5
0.5
21
La
rge
sca
le99
000
180
800
0.0
535
28
0.2
49
0.0
52
Large scale
Meso scale
Box 2
Box 1
0
2
4
6
8
10
12
0 4 6 8 10 12
Added P (g kg-1)
Sorb
ed P
(g
kg-1
)
2
Fig. 8 – P efficiency curve with the overall P sorption
calculated from the mass balance.
WAT E R R E S E A R C H 4 0 ( 2 0 0 6 ) 1 1 4 3 – 1 1 5 41152
sorption based on previous experience) of P may be retained,
further reducing the concentration in the water going into the
horizontal filterbed. On the other hand, the presence of plants
in CW1 may have contributed to an enhance P removal, but
might also have created cracks and pores in the material,
which could have led to preferential pathways. To sum up,
our results show that laboratory models give more reliable
estimates of the sorption capacity of the material than what
batch experiments might do and are in accordance with the
findings reported by Drizo et al. (2002). On the other hand,
even with laboratory models of this size, it may be difficult to
extrapolate the results to full-scale systems. Full-scale CWs
are more complex systems with varying inlet concentrations
as well as preferential pathways.
4.4. Estimates of lifetimes for a CW system withFiltralite P
By Norwegian guidelines a household of five persons will for a
period of 15 years need 40 m3 of filter material in order to have
an effluent concentration that does not exceed 1 mg l�1 P. This
means that there will be about 8 m3 person�1 for 15 years.
Jenssen and Krogstad (2003) have previously calculated the
lifetime of a CW by multiplying the maximum field sorption
capacity with the total mass of filter material. As previously
mentioned, the field sorption capacity was estimated to be
50% of the capacity measured with batch experiments using a
360 ppm phosphate solution, and equals 6 g P kg�1 Filtralite-
PTM (or 3.3 kg P m�3). Knowing that one person produces about
1.5 g P a day (equals 547.5 g a year) (Holtan et al., 1988), about
2.5 m3 of material is needed for one person over 15 years.
In Norway the outlet concentration from CWs treating
wastewater is not supposed to exceed 1.0 mg P l�1. The meso-
scale container was stopped before this concentration was
reached in the outlet (Fig. 4). However, some months before
the end of the experiment (middle of April, 2004) the depth
average concentration at 0.9 m from the inlet was at about
1.0 mg P l�1 (Fig. 4b). Still at the end of the experiment only
part of the material within the first 90 cm of the container had
attained the maximum sorption capacity (Fig. 5a). This shows
that not only a sorption maximum criterion is needed, but
also the average sorption concentration has to be taken into
account in the calculation of lifetime for a CW system. To
estimate the volume of the material needed for one person

ARTICLE IN PRESS
WAT E R R E S E A R C H 40 (2006) 1143– 1154 1153
over 15 years based on the meso-scale experiment’s P
extraction data we consider the first 0.9 m of the container
as a separate system. If we roughly assume that half of this
volume has attained the maximum sorption capacity of
4500 mg P kg�1 (2.5 kg P m�3), while the remaining half has
just sorbed about 1700 mg P kg�1 (equal to 0.94 kg P m�3) (Fig.
5a), then the average sorption capacity would be 1.7 kg P m�3.
Using this average P sorption capacity about 4.8 m3 of filter
material would be needed for 1 person over 15 years. This
amount is the double of the calculated amount based on the
capacity of Jenssen and Krogstad (2003), but still well within
the limits of the Norwegian guidelines.
No CWs are run to full saturation yet and no data are
available on maximum accumulation of these systems using
Filtralite-PTM. Ongoing CWs have to be followed over years to
better understand the processes going on for P accumulation
and to find laboratory systems that can be used to calculate
lifetime more accurately.
Acknowledgment
The work has been partly funded by the PRIMROSE project on
constructed wetlands (http://primrose.jordforsk.no) financed
by the European Commission contract CVK1-2000-00065.
R E F E R E N C E S
Adam, K., Krogstad, T., Suliman, F.R.D., Jenssen, P.D., 2005.Phosphorous sorption by Filtralite-PTM—small-scale box ex-periment. J. Environ. Sci. Health 40 (6–7), 1239–1250.
Arias, C.A., Brix, H., 2005. Phosphorous removal in constructedwetlands: can suitable alternative media be identified? WaterSci. Technol. 51 (9), 267–273.
Arias, C.A., Del Bubba, M., Brix, H., 2001. Phosphorous removal bysands for use as media in subsurface flow constructed reedbeds. Water Res. 35 (5), 1159–1168.
Chang, S.C., Jackson, M.L., 1957. Fractionation of soil phosphorus.Soil Sci. 84, 133–144.
Cheung, K.C., Venkitachalam, T.H., 2000. Improving phosphateremoval of sand infiltration system using alkaline fly ash.Chemosphere 41, 243–249.
Cole, C.V., Sterling, R., Scott, C.O., 1953. The nature of phosphatesorption by calcium carbonate. Soil Science Society Proceed-ings, pp. 352–356.
Drizo, A., Frost, C.A., Smith, K.A., Grace, J., 1997. Phosphate andammonium removal by constructed wetlands with horizontalsubsurface flow, using shale as a substrate. Water Sci. Technol.35 (5), 95–102.
Drizo, A., Frost, C.A., Grace, J., Smith, K.A., 1999. Physico-chemical screening of phosphate-removing substratesfor use in constructed wetland systems. Water Res. 33 (17),3595–3602.
Drizo, A., Comeau, Y., Forget, C., Chapuis, R.P., 2002. Phosphoroussaturation potential—parameters for estimating the longevityof constructed wetland systems. Environ. Sci. Technol. 36 (21),4642–4648.
French, H.K., Kløve, B., Søvik, A.K., 2004. Flow and transportpathways in small scale experimental subsurface flow con-structed wetlands. In: Proceedings to the Ninth (IWA) Inter-national Conference on Wetland Systems for WastewaterPollution Control, vol. 2. Avignon, France, 26–30 September,2004.
Griffin, R.A., Jurinak, J.J., 1973. Reaction of phosphate with calcite.Soil Sci. Soc. Am. Proc. 37, 847–850.
Hartikainen, H., 1979. Phosphorus and its reactions interrestrial soils and lake sediments. J. Sci. Agric. Soc. Finland51, 537–624.
Heistad, A., Jenssen, P.D., Frydenlund, A.S., 2001. A new combineddistribution and pretreatment unit for wastewater soil infil-tration systems. In: Manel, K. (Ed.), Onsite WastewaterTreatment, Proceedings of Ninth International Conference onIndividual and Small Community Sewage Systems. ASAE, pp.200–206.
Heistad, A., Vrale, L., Paruch, A.M., Adam, K., Jenssen, P.D., 2004.From constructed wetlands to compact filter systems. In:Proceedings to the Ninth (IWA) International Conference onWetland Systems for Wastewater Pollution Control, vol. 2.Avignon, France, 26–30 September, 2004, pp. 759–766.
Holtan, H., Kamp-Nielsen, L., Stuanes, A.O., 1988. Phosphorous insoil, water and sediment: an overview. Hydrobiologia 170,19–34.
Jang, H., Kang, S.-H., 2001. Phosphorous removal using cowbone in hydroxyapatite crystallization. Water Res. 36,1324–1330.
Jenssen, P.D., Krogstad, T., 2003. Design of constructed wetlandsusing phosphorus sorbing lightweight aggregate (LWA). In:Mander, U., Jenssen, P.D. (Eds.), Constructed Wetlands forWastewater Treatment in Cold Climates. International Serieson Advances in Ecological Sciences. WIT Press, Great Britain.
Jenssen, P.D., Mæhlum, T., Krogstad, T., Vrale, L., 2005. Highperformance constructed wetlands for cold climates. J. En-viron. Sci. Health 40 (6–7), 1343–1353.
Johansson, L., 1998. Phosphorous sorption to filter substrate-s—potential benefits for on-site wastewater treatment. De-partment of Civil and Environmental Engineering, RoyanInstitute of Technology. Kungl Tekniska Hogskolan, Stock-holm.
Kadlec, R.H., Knight, R.L., 1996. Treatment Wetlands. CRC Press,Lewis Publishers, Boca Raton, 893pp (ISBN:0-87371-930-1).
Khadhraoui, M., Watanabe, T., Kuroda, M., 2002. The effect of thephysical structure of a porous Ca-based sorbent on itsphosphorous removal capacity. Water Res. 36, 3711–3718.
Kvarnstrom, M.E., Morel, C.A.L., Krogstad, T., 2004. Plant-availability of phosphorous in filter substrates derivedfrom small-scale wastewater treatment systems. Ecol. Eng. 22(1), 1–15.
Molle, P., Lienard, A., Iwema, A., Kabbabi, A., 2005. Apatiteas an interesting seed to remove phosphorous from waste-water in constructed wetlands. Water Sci. Technol. 51 (9),193–203.
Møberg, J.P., Petersen, L., 1982. Øvelsesvejledning til geologi ogjordbundslære II (Practical lessons for geology and soilscience). Den kgl. Veterinær- og Landbbohøgskole, Købehavn.,136pp (in Danish).
Murphy, J., Riley, J.P., 1962. A modified single solution method forthe determination of phosphate in natural waters. Anal. Chim.Acta 26, 31–36.
Optiroc Group AB, 2003. Product specification of Filtralite-PTM,Oslo, Norway.
Suliman, F., Haugen, L.E., Jenssen, P.D., 2005a. Salinity effect onthe characteristics of saturated horizontal flow in small boxescontaining Filtralite-P. J. Environ. Sci. Health 40 (6–7),1403–1413.
Suliman, F., French, H., Haugen, L.E., Jenssen, P.D., Kløve, B.,2005b. The effect of scale of horizontal subsurface flowconstructed wetlands on flow and transport parameters.Water Sci. Technol. 51 (9), 259–266.
Søvik, A.K., Kløve, B., 2005. Phosphorus retention processes inshell sand filter systems treating municipal wastewater. Ecol.Eng. 25 (2), 168–182.

ARTICLE IN PRESS
WAT E R R E S E A R C H 4 0 ( 2 0 0 6 ) 1 1 4 3 – 1 1 5 41154
Tisdale, S.L., Nelson, W.L., Beaton, J.D., Havlin, J.L., 1993. SoilFertility and Fertilizers, fifth ed. Macmillan Coll Div. 634pp.
Vymazal, J., 2004. Removal of phosphorus via harvesting ofemergent vegetation in constructed wetlands for wastewatertreatment. In: Proceedings to the Ninth (IWA) InternationalConference on Wetland Systems for Wastewater PollutionControl, vol. 2. Avignon, France, 26–30 September, 2004, pp.415–422.
Zhu, T., 1998. Fate of phosphorous in a light-weight aggregate(LWA) wastewater treatment wetland. Ph.D. Thesis, NLH,Norway.
Zhu, T., Mæhlum, T., Jenssen, P., Krogstad, T., 2002. Fate ofphosphorus in a light-weight aggregate wastewater treatmentwetland. In: Proceedings to the Eighth (IWA) InternationalConference on Wetland Systems for Water Pollution Control,University of Dar Es Salaam, 16–19 September 2002.


