Embed Size (px)
Citation preview
557 Dr. Babitharani.H, Ashwini D G, Pavan siva kumar.Ch, Sindhu Shankar, Dimple Bahri, Koushik.B.
International Journal of Engineering Technology Science and Research
IJETSR
www.ijetsr.com
ISSN 2394 – 3386
Volume 4, Issue 9
September 2017
Soil Stabilization using Plastic
Dr. Babitharani.H, Ashwini D G, Pavan siva kumar.Ch, Dimple Bahri, Koushik.B, Sindhu Shankar
Department of Civil Engineering, SET, Jain University, India.
ABSTRACT
Soil stabilization is a process which improves the physical properties of the soil, such as increasing in shear strength,
bearing capacity etc. Which can be done by the use of controlled compaction or addition of suitable mixtures like
cement, lime, and waste materials like fly ash, phosphogypsum etc. The cost of introducing these additives has also
increased in recent years which opened the door widely for the other kinds of soil additives such as plastic, bamboo etc.
This new technique of soil stabilization can be effectively used to meet the challenges of the society to reduce the
quantities of waste, producing useful stabilization from plastic waste. Use of plastic products such as polythene bags,
bottles etc., is increasing day by day leading to various environmental concerns. Therefore, the disposal of plastic wastes
without causing any ecological hazards has become a real challenge. Thus, using plastic as soil stabilizer is an
ecological utilization since there is scarcity of good soil for construction. This project involves the study on the possible
use of waste plastic.
INTRODUCTION
Soil deposits in nature exist in an extremely irregular manner producing thereby an infinite variety of
combination which will affect the strength of the soil and many procedures to make it purposeful.
Soil stabilization is the process of altering some soil properties by different methods, mechanical or chemical
in order to produce an improved soil material which has all the desired engineering properties. Soils are
generally stabilized to increase their strength and durability or to prevent soil erosion. The properties of soil
vary a great deal at different places or in certain cases even at one place the success of soil stabilization
depends on soil testing. Various methods are there to stabilize soil and the method should be verified in the
lab with the soil material before applying it on the field.
Dr. A. I. Dhatrak in 2015 after reviewing performance of plastic waste mixed soil as a geotechnical material.
It was observed that for construction of flexible pavement to improve the sub grade soil of pavement using
waste plastic bottles chips is an alternative method.
AKSHAT MALHOTRA & HADI GHASEMAIN in 2014 studied the effect of HDPE plastic waste on the
UCS of soil. In a proportion of 1.5%, 3%, 4.5% and 6% of the weight of dry soil, HDPE plastic waste was
added. They concluded that the UCS of black cotton soil increased on addition of plastic waste.
CHOUDHARY, JHA & GILL in 2010 demonstrated the potential of HDPE to convert as soil reinforcement
by improving engineering properties of sub grade soil.
RAJKUMAR NAGLE in 2014 performed CBR studied for improving engineering performance of sub grade
soil. They mixed polyethylene, bottles, food packaging and shopping bags etc., as reinforcement within black
cotton soil, yellow soil and sandy soil.
MERCY JOSEPH POWETH in 2013 investigated on safe and productive disposal of quarry dust, type of
waste and wastes-plastic by using them in the pavements sub grade. In their paper, a series of CBR and SPT
test were carried out for finding the optimum percentages of waste plastics, quarry dust in soil sample.
ACHMAD FAUZI in 2016 calculated the engineering properties by mixing waste plastic High Density
Polyethylene (HDPE) and waste crushed glass as reinforcement for sub grade improvement.
CHEBET in 2014 did laboratory investigations to determine the increase in shear strength and bearing
capacity of locally available sand due to random mixing of strips of HDPE (high density polyethylene)
558 Dr. Babitharani.H, Ashwini D G, Pavan siva kumar.Ch, Sindhu Shankar, Dimple Bahri, Koushik.B.
International Journal of Engineering Technology Science and Research
IJETSR
www.ijetsr.com
ISSN 2394 – 3386
Volume 4, Issue 9
September 2017
material from plastic shopping bags.
Principles of Soil Stabilization:
• Evaluating the soil properties of the area under consideration.
• Deciding the property of soil which needs to be altered to get the design value and choose the effective and
economical method for stabilization.
• Designing the Stabilized soil mix sample and testing it in the lab for intended stability and durability values.
NEEDS AND ADVANTAGES
Soil properties vary a great deal and construction of structures depends on the bearing capacity of the soil
hence, we need to stabilize the soil which makes it easier to predict the load bearing capacity of the soil. The
gradation of the soil is also a very important property to keep in mind while working with soils. The soils may
be well-graded which is desirable as it has less number of voids or uniformly graded which though sounds
stable but has more voids. Thus, it is better to mix different types of soils together to improve the soil strength
properties.
It improves the strength of the soil, thus, increasing the soil bearing capacity.
It is more economical both in terms of cost and energy to increase the bearing.
Capacity of the soil rather than going for deep foundation or raft foundation.
Sometimes soil stabilization is also used to prevent soil erosion or formation of dust.
Which is very useful especially in dry and arid weather Stabilization is also done for soil water-proofing.
It helps in reducing the soil volume change due to change in temperature or moisture content.
Stabilization improves the workability and the durability of the soil.
MATERIALS ABD METHODS
MATERIALS
In this research work conducted various experiment to find the stabilization of the sub base using the
industrial waste and plastic waste the various test conducted to find the stabilization of the sub based on the
ASTM procedure are listed:1. Liquid Limit, 2. Plastic Limit, 3. Shrinkage limit, 4. Specific Gravity.
1. LIQUID LIMIT: Liquid limit is defined as the moisture content at which soil begins to behave as a liquid
material and begins to flow. The importance of the liquid limit test is to classify soils. Different soils have
varying liquid limits. Also, once must use the plastic limit to determine its plasticity index.
2. PLASTIC LIMIT: Plastic limit is defined as the moisture content and expressed as a percentage of the
oven dried soil at which the soil can be rolled into the threads one-eight inch in a diameter without soil
breaking into pieces. This is also the moisture content of a solid at which a soil changes from a plastic state to
a semisolid state.
3. SHRINKAGE LIMIT: This breaking point is accomplished when further loss of water from the soil does
not reduce the volume of the soil. It can be defined more precisely as the least water content at which the soil
can in any case be completely saturated.
4. SPECIFIC GRAVITY: Specific gravity is defined as the ration of the unit of soil solids unit of water. The
specific gravity is needed for various calculation purposes in soil mechanics, e.g. void ratio, density.
METHODS
MECHANICAL METHODS OF STABILIZATION
In this procedure, soils of different gradations are mixed together to obtain the desired property in the soil.
This may be done at the site or at some other place from where it can be transported easily. The last blend is
559 Dr. Babitharani.H, Ashwini D G, Pavan siva kumar.Ch, Sindhu Shankar, Dimple Bahri, Koushik.B.
International Journal of Engineering Technology Science and Research
IJETSR
www.ijetsr.com
ISSN 2394 – 3386
Volume 4, Issue 9
September 2017
then compacted by the regular strategies to get the required thickness.
ADDITIVE METHOD OF STABILIZATION
The addition of manufactured products into the soil, which in appropriate amounts improves the nature of the
soil. Materials such as cement, lime, bitumen, fly ash etc., are used as synthetic additives. Sometimes different
fibers are also used as reinforcements in the soil.
Oriented fiber reinforcement the fibers are arranged in some order and all the fibers are placed in the same
orientation. The fibers are laid layer by layer in this type of orientation. Continuous fibers in the form of
sheets, strips or bars etc. are used systematically in this type of arrangement.
It enhances the quantity of the soil hence, expanding the soil bearing limit.
Stabilization enhances the workability and the strength of the soil.
It helps in lessening the soil volume change.
METHODOLOGY
The materials which are considered are soil and plastic with chemical composition of polypropylene.
SCOPE OF WORK
The experimental work consists of the following steps,
1.Moisture content,
2.Specific gravity of the soil,
3.Determination of soil index properties (Atterberg Limits),
4.Liquid limit by Casagrande's apparatus,
5.Plastic limit,
6.Particle size distribution by sieve analysis,
7.Preparation of reinforced soil samples,
8.Determination of shear strength by:
a.Direct shear stress,
b.Unconfined compression test.
1. MOISTURE CONTENT
Soil mass is a porous structure, having void filled with water or air. Moisture content (W) is defined as the
ratio of the mass of water (Wa) in voids to the mass of soil solids(Ws) expressed as a percentage thus:
W=Wa / Ws
2. SPECFIC GRAVITY
Specific gravity of soil particles is used in determination of voids ratio, porosity, degree of saturation and
critical hydraulic gradient. It is also used in finding particle size by means of hydrometer analysis.
Acceptable Values of G -2.60-2.72 for course grained soils
-2.70-2.80 for fine grained soils
-2.30-2.50 for organic soils
3. LIQUID LIMIT BY CASAGRANE'S METHOD
The liquid limit (WL) is the minimum water content at which a part of soil is grooving tool of standard
dimensions, will flow together for a distance of 13mm under the impact of 25 blows in a standard liquid limit
apparatus, it is the water content at which the soil first shows a small shearing resistance as the water content
is reduced.
WHY PLASTIC
Plastic increases the shear strength and tensile strength of soil. It can significantly enhance the properties of
560 Dr. Babitharani.H, Ashwini D G, Pavan siva kumar.Ch, Sindhu Shankar, Dimple Bahri, Koushik.B.
International Journal of Engineering Technology Science and Research
IJETSR
www.ijetsr.com
ISSN 2394 – 3386
Volume 4, Issue 9
September 2017
the soil used in the construction of road infrastructure and available abundance.
PROPERTIES OF PLASTIC
Plastic have a numerous properties that make them superior to other materials in many applications. The
different types of properties are physical properties and chemical properties.
PHYSICAL PROPERTIES
Plastic has transparency, flexibility, elasticity, water resistant, electrical resistance and soft when it is hot. Soil
is a naturally occurring material‟s that are used for the construction of all except the surface layers of
pavements and that are subjected to classification tests to provide a general concept of their engineering
characteristics.
CHEMICAL PROPERTIES Chemical resistance, thermal resistance, reactivity with water, flammability,
heat of combustion etc., are the basic chemical properties of plastic.
RESULTS & DISCUSSIONS
Specific gravity
Soil sample - it was collected from a construction site near Banashankri III Stage
Sample number 1 2 3
Mass of empty bottle (M1) in gms 66.3 66.2 66.2
Mass of bottle + dry soil (M2) in gms 114.2 120 118
Mass of bottle + dry soil + water (M3) in gms 192.66 195.8 194.7
Mass of bottle + water (M4) in gms 165 165.1 165.2
Specific gravity 2.35 2.32 2.32
Table No: 1. Specific Gravity of Soil Sample
AVERAGE SPECIFIC GRAVITY = 2.33
Acceptable values of G = 2.60 – 2.72 for coarse grained soils
=2.70-2.80 for fine – grained soils
=2.30-2.50 for organic soils.
Since the result of the specific gravity of soil sample is 2.33. It comes under Organic Soil.
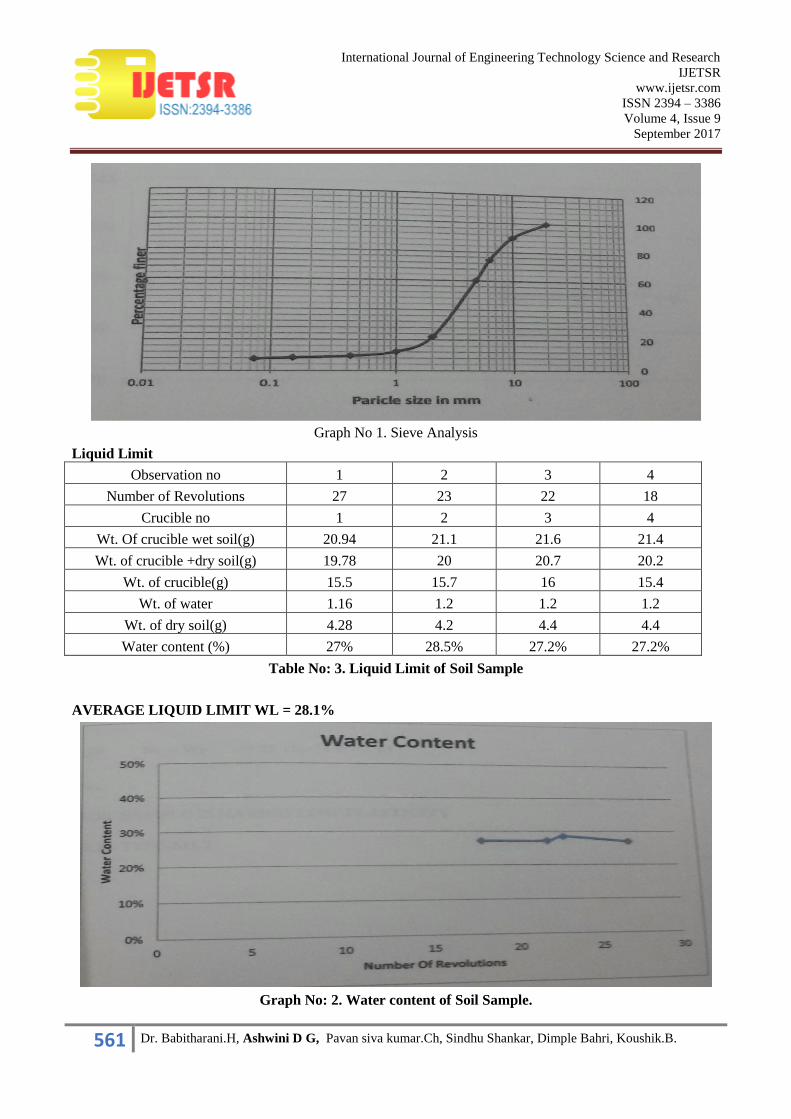
Sieve analysis
Sieve analysis observations and calculations of Soil Sample
IS sieve size Mass
retained(m/100)
Mass of soil
retained (g) %
Cumulative
retained (%)
Cumulative % finer
(N)
1 2 3 4 5
20 0 0 0 100%
10 83.98 9.94 9.94 90.06%
6.25 126.41 14.56 24.9 74.4%
4.75 64.15 7.59 32.49 60.39%
2 447.58 52.97 85.46 22%
1 18.94 2.24 87.7 12.3%
0.425 29.91 2.83 90.43 9.471%
0.15 9.76 1.16 9169 8.32%
0.075 5.96 0.7 92.39 7.61%
Pan 64 7.57 99.96 0.04%
Table NO: 2 Sieve Analysis of Soil Sample
561 Dr. Babitharani.H, Ashwini D G, Pavan siva kumar.Ch, Sindhu Shankar, Dimple Bahri, Koushik.B.
International Journal of Engineering Technology Science and Research
IJETSR
www.ijetsr.com
ISSN 2394 – 3386
Volume 4, Issue 9
September 2017
Graph No 1. Sieve Analysis
Liquid Limit
Observation no 1 2 3 4
Number of Revolutions 27 23 22 18
Crucible no 1 2 3 4
Wt. Of crucible wet soil(g) 20.94 21.1 21.6 21.4
Wt. of crucible +dry soil(g) 19.78 20 20.7 20.2
Wt. of crucible(g) 15.5 15.7 16 15.4
Wt. of water 1.16 1.2 1.2 1.2
Wt. of dry soil(g) 4.28 4.2 4.4 4.4
Water content (%) 27% 28.5% 27.2% 27.2%
Table No: 3. Liquid Limit of Soil Sample
AVERAGE LIQUID LIMIT WL = 28.1%
Graph No: 2. Water content of Soil Sample.
562 Dr. Babitharani.H, Ashwini D G, Pavan siva kumar.Ch, Sindhu Shankar, Dimple Bahri, Koushik.B.
International Journal of Engineering Technology Science and Research
IJETSR
www.ijetsr.com
ISSN 2394 – 3386
Volume 4, Issue 9
September 2017
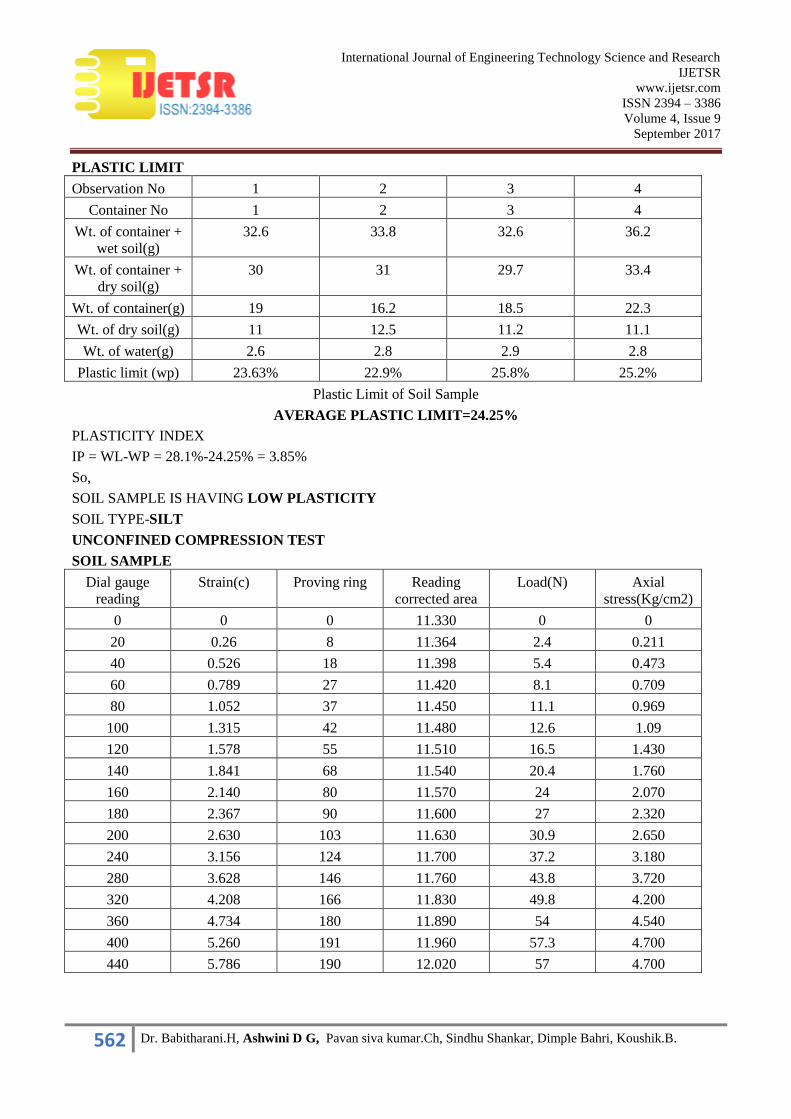
PLASTIC LIMIT
Observation No 1 2 3 4
Container No 1 2 3 4
Wt. of container +
wet soil(g)
32.6 33.8 32.6 36.2
Wt. of container +
dry soil(g)
30 31 29.7 33.4
Wt. of container(g) 19 16.2 18.5 22.3
Wt. of dry soil(g) 11 12.5 11.2 11.1
Wt. of water(g) 2.6 2.8 2.9 2.8
Plastic limit (wp) 23.63% 22.9% 25.8% 25.2%
Plastic Limit of Soil Sample
AVERAGE PLASTIC LIMIT=24.25%
PLASTICITY INDEX
IP = WL-WP = 28.1%-24.25% = 3.85%
So,
SOIL SAMPLE IS HAVING LOW PLASTICITY
SOIL TYPE-SILT
UNCONFINED COMPRESSION TEST
SOIL SAMPLE
Dial gauge
reading
Strain(c) Proving ring Reading
corrected area
Load(N) Axial
stress(Kg/cm2)
0 0 0 11.330 0 0
20 0.26 8 11.364 2.4 0.211
40 0.526 18 11.398 5.4 0.473
60 0.789 27 11.420 8.1 0.709
80 1.052 37 11.450 11.1 0.969
100 1.315 42 11.480 12.6 1.09
120 1.578 55 11.510 16.5 1.430
140 1.841 68 11.540 20.4 1.760
160 2.140 80 11.570 24 2.070
180 2.367 90 11.600 27 2.320
200 2.630 103 11.630 30.9 2.650
240 3.156 124 11.700 37.2 3.180
280 3.628 146 11.760 43.8 3.720
320 4.208 166 11.830 49.8 4.200
360 4.734 180 11.890 54 4.540
400 5.260 191 11.960 57.3 4.700
440 5.786 190 12.020 57 4.700
563 Dr. Babitharani.H, Ashwini D G, Pavan siva kumar.Ch, Sindhu Shankar, Dimple Bahri, Koushik.B.
International Journal of Engineering Technology Science and Research
IJETSR
www.ijetsr.com
ISSN 2394 – 3386
Volume 4, Issue 9
September 2017
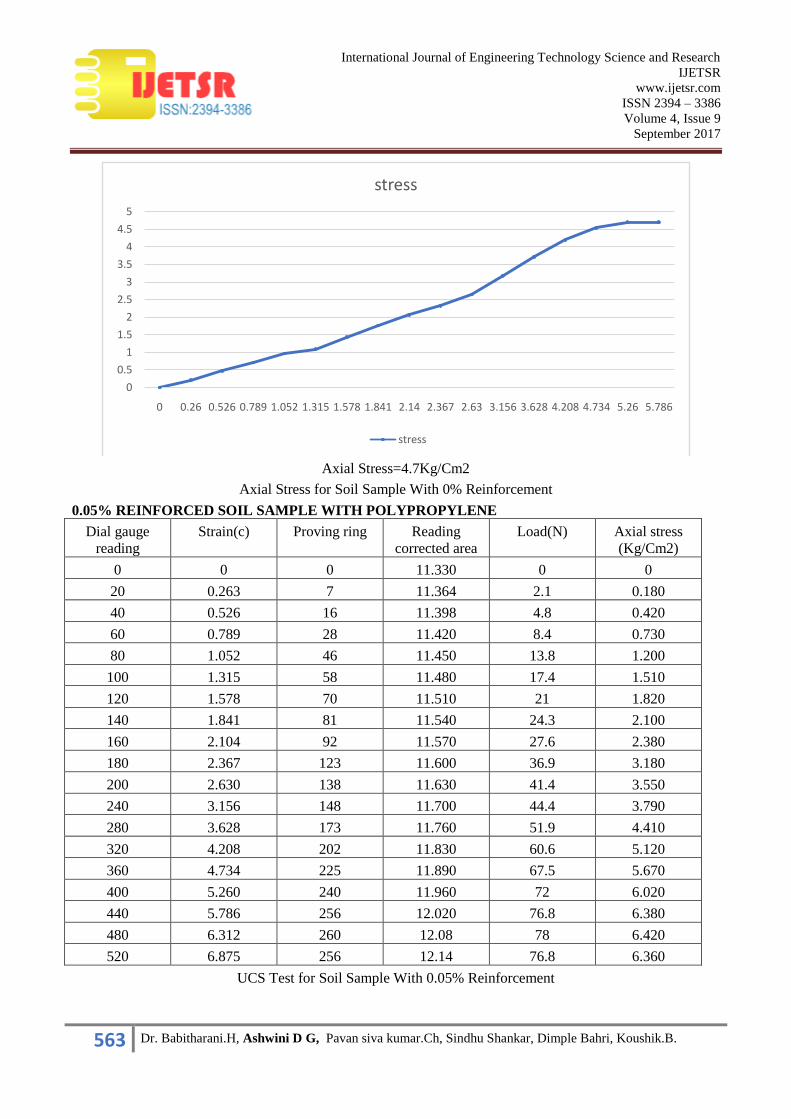
Axial Stress=4.7Kg/Cm2
Axial Stress for Soil Sample With 0% Reinforcement
0.05% REINFORCED SOIL SAMPLE WITH POLYPROPYLENE
Dial gauge
reading
Strain(c) Proving ring Reading
corrected area
Load(N) Axial stress
(Kg/Cm2)
0 0 0 11.330 0 0
20 0.263 7 11.364 2.1 0.180
40 0.526 16 11.398 4.8 0.420
60 0.789 28 11.420 8.4 0.730
80 1.052 46 11.450 13.8 1.200
100 1.315 58 11.480 17.4 1.510
120 1.578 70 11.510 21 1.820
140 1.841 81 11.540 24.3 2.100
160 2.104 92 11.570 27.6 2.380
180 2.367 123 11.600 36.9 3.180
200 2.630 138 11.630 41.4 3.550
240 3.156 148 11.700 44.4 3.790
280 3.628 173 11.760 51.9 4.410
320 4.208 202 11.830 60.6 5.120
360 4.734 225 11.890 67.5 5.670
400 5.260 240 11.960 72 6.020
440 5.786 256 12.020 76.8 6.380
480 6.312 260 12.08 78 6.420
520 6.875 256 12.14 76.8 6.360
UCS Test for Soil Sample With 0.05% Reinforcement
0
0.5
1
1.5
2
2.5
3
3.5
4
4.5
5
0 0.26 0.526 0.789 1.052 1.315 1.578 1.841 2.14 2.367 2.63 3.156 3.628 4.208 4.734 5.26 5.786
stress
stress
564 Dr. Babitharani.H, Ashwini D G, Pavan siva kumar.Ch, Sindhu Shankar, Dimple Bahri, Koushik.B.
International Journal of Engineering Technology Science and Research
IJETSR
www.ijetsr.com
ISSN 2394 – 3386
Volume 4, Issue 9
September 2017
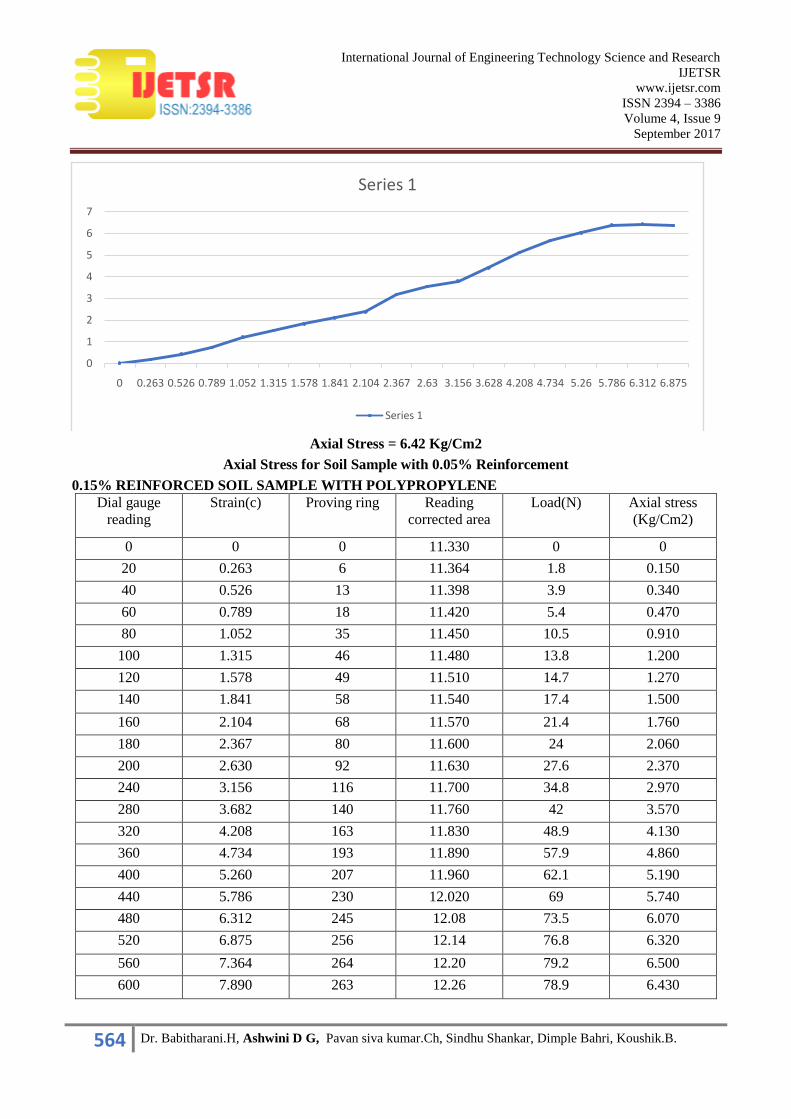
Axial Stress = 6.42 Kg/Cm2
Axial Stress for Soil Sample with 0.05% Reinforcement
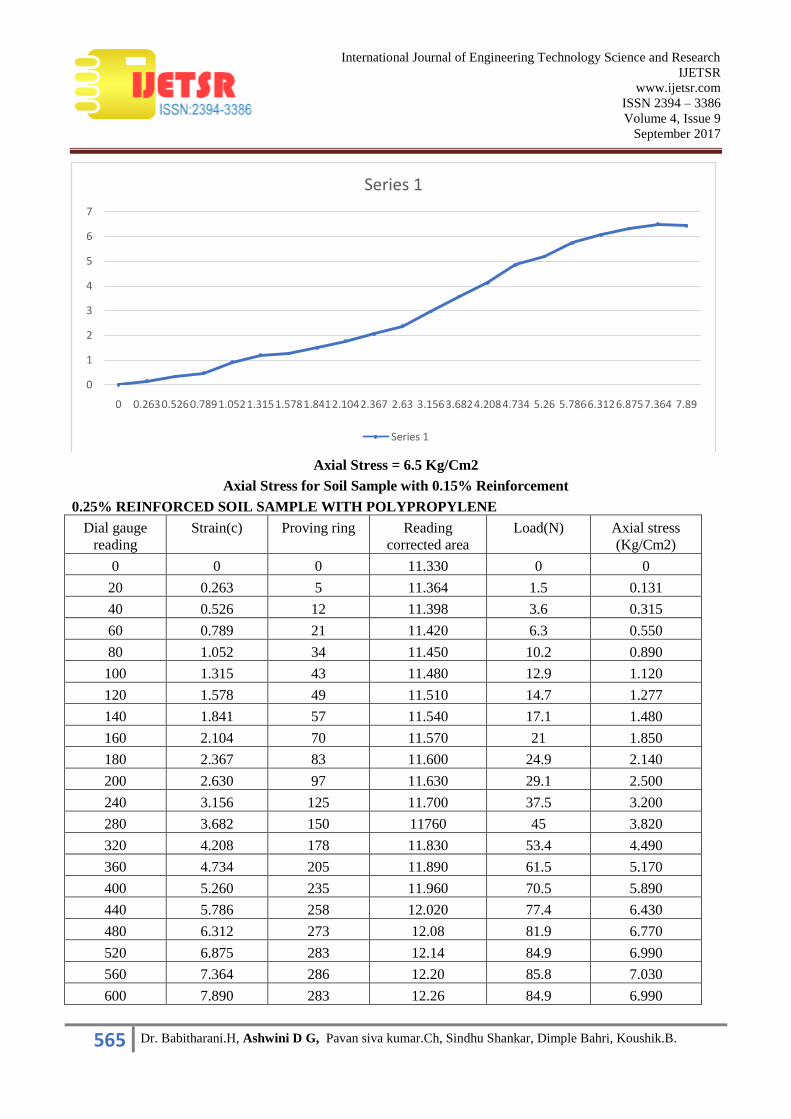
0.15% REINFORCED SOIL SAMPLE WITH POLYPROPYLENE
Dial gauge
reading
Strain(c) Proving ring Reading
corrected area Load(N) Axial stress
(Kg/Cm2)
0 0 0 11.330 0 0
20 0.263 6 11.364 1.8 0.150
40 0.526 13 11.398 3.9 0.340
60 0.789 18 11.420 5.4 0.470
80 1.052 35 11.450 10.5 0.910
100 1.315 46 11.480 13.8 1.200
120 1.578 49 11.510 14.7 1.270
140 1.841 58 11.540 17.4 1.500
160 2.104 68 11.570 21.4 1.760
180 2.367 80 11.600 24 2.060
200 2.630 92 11.630 27.6 2.370
240 3.156 116 11.700 34.8 2.970
280 3.682 140 11.760 42 3.570
320 4.208 163 11.830 48.9 4.130
360 4.734 193 11.890 57.9 4.860
400 5.260 207 11.960 62.1 5.190
440 5.786 230 12.020 69 5.740
480 6.312 245 12.08 73.5 6.070
520 6.875 256 12.14 76.8 6.320
560 7.364 264 12.20 79.2 6.500
600 7.890 263 12.26 78.9 6.430
0
1
2
3
4
5
6
7
0 0.263 0.526 0.789 1.052 1.315 1.578 1.841 2.104 2.367 2.63 3.156 3.628 4.208 4.734 5.26 5.786 6.312 6.875
Series 1
Series 1
565 Dr. Babitharani.H, Ashwini D G, Pavan siva kumar.Ch, Sindhu Shankar, Dimple Bahri, Koushik.B.
International Journal of Engineering Technology Science and Research
IJETSR
www.ijetsr.com
ISSN 2394 – 3386
Volume 4, Issue 9
September 2017
Axial Stress = 6.5 Kg/Cm2
Axial Stress for Soil Sample with 0.15% Reinforcement
0.25% REINFORCED SOIL SAMPLE WITH POLYPROPYLENE
Dial gauge
reading
Strain(c) Proving ring Reading
corrected area
Load(N) Axial stress
(Kg/Cm2)
0 0 0 11.330 0 0
20 0.263 5 11.364 1.5 0.131
40 0.526 12 11.398 3.6 0.315
60 0.789 21 11.420 6.3 0.550
80 1.052 34 11.450 10.2 0.890
100 1.315 43 11.480 12.9 1.120
120 1.578 49 11.510 14.7 1.277
140 1.841 57 11.540 17.1 1.480
160 2.104 70 11.570 21 1.850
180 2.367 83 11.600 24.9 2.140
200 2.630 97 11.630 29.1 2.500
240 3.156 125 11.700 37.5 3.200
280 3.682 150 11760 45 3.820
320 4.208 178 11.830 53.4 4.490
360 4.734 205 11.890 61.5 5.170
400 5.260 235 11.960 70.5 5.890
440 5.786 258 12.020 77.4 6.430
480 6.312 273 12.08 81.9 6.770
520 6.875 283 12.14 84.9 6.990
560 7.364 286 12.20 85.8 7.030
600 7.890 283 12.26 84.9 6.990
0
1
2
3
4
5
6
7
0 0.2630.5260.7891.0521.3151.5781.8412.1042.367 2.63 3.1563.6824.2084.734 5.26 5.7866.3126.8757.364 7.89
Series 1
Series 1
566 Dr. Babitharani.H, Ashwini D G, Pavan siva kumar.Ch, Sindhu Shankar, Dimple Bahri, Koushik.B.
International Journal of Engineering Technology Science and Research
IJETSR
www.ijetsr.com
ISSN 2394 – 3386
Volume 4, Issue 9
September 2017
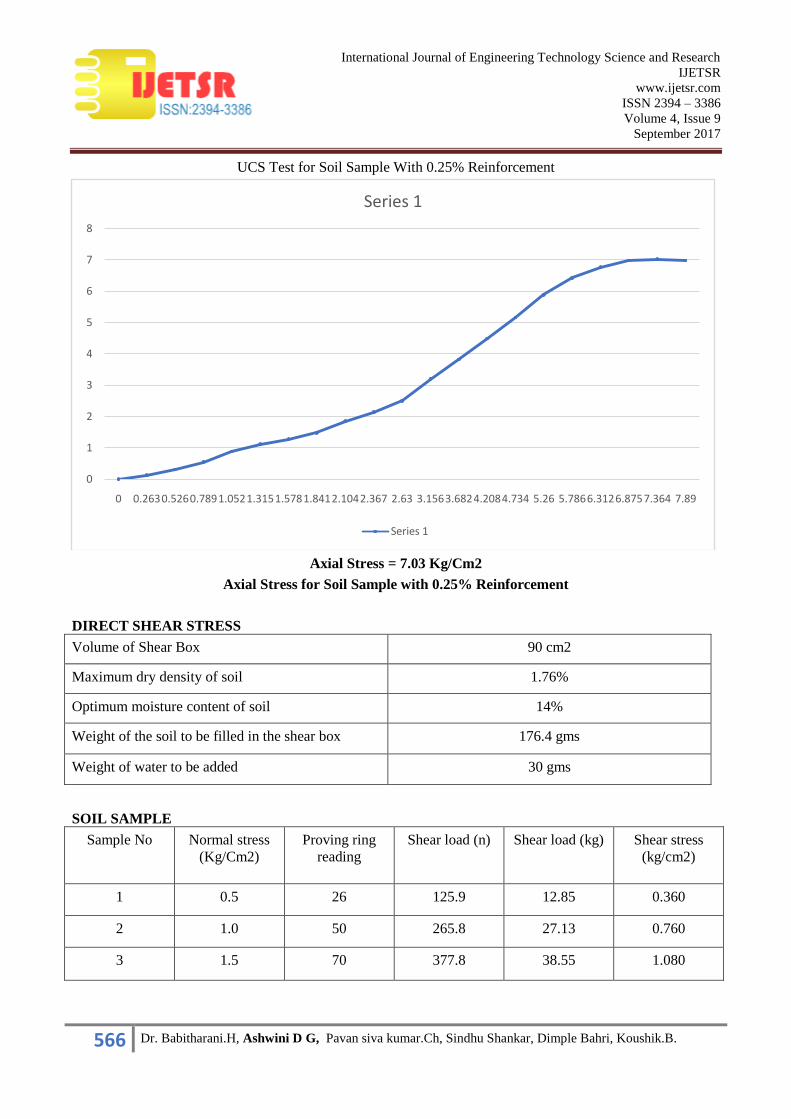
UCS Test for Soil Sample With 0.25% Reinforcement
Axial Stress = 7.03 Kg/Cm2
Axial Stress for Soil Sample with 0.25% Reinforcement
DIRECT SHEAR STRESS
Volume of Shear Box 90 cm2
Maximum dry density of soil 1.76%
Optimum moisture content of soil 14%
Weight of the soil to be filled in the shear box 176.4 gms
Weight of water to be added 30 gms
SOIL SAMPLE
Sample No Normal stress
(Kg/Cm2)
Proving ring
reading
Shear load (n) Shear load (kg) Shear stress
(kg/cm2)
1 0.5 26 125.9 12.85 0.360
2 1.0 50 265.8 27.13 0.760
3 1.5 70 377.8 38.55 1.080
0
1
2
3
4
5
6
7
8
0 0.2630.5260.7891.0521.3151.5781.8412.1042.367 2.63 3.1563.6824.2084.734 5.26 5.7866.3126.8757.364 7.89
Series 1
Series 1
567 Dr. Babitharani.H, Ashwini D G, Pavan siva kumar.Ch, Sindhu Shankar, Dimple Bahri, Koushik.B.
International Journal of Engineering Technology Science and Research
IJETSR
www.ijetsr.com
ISSN 2394 – 3386
Volume 4, Issue 9
September 2017
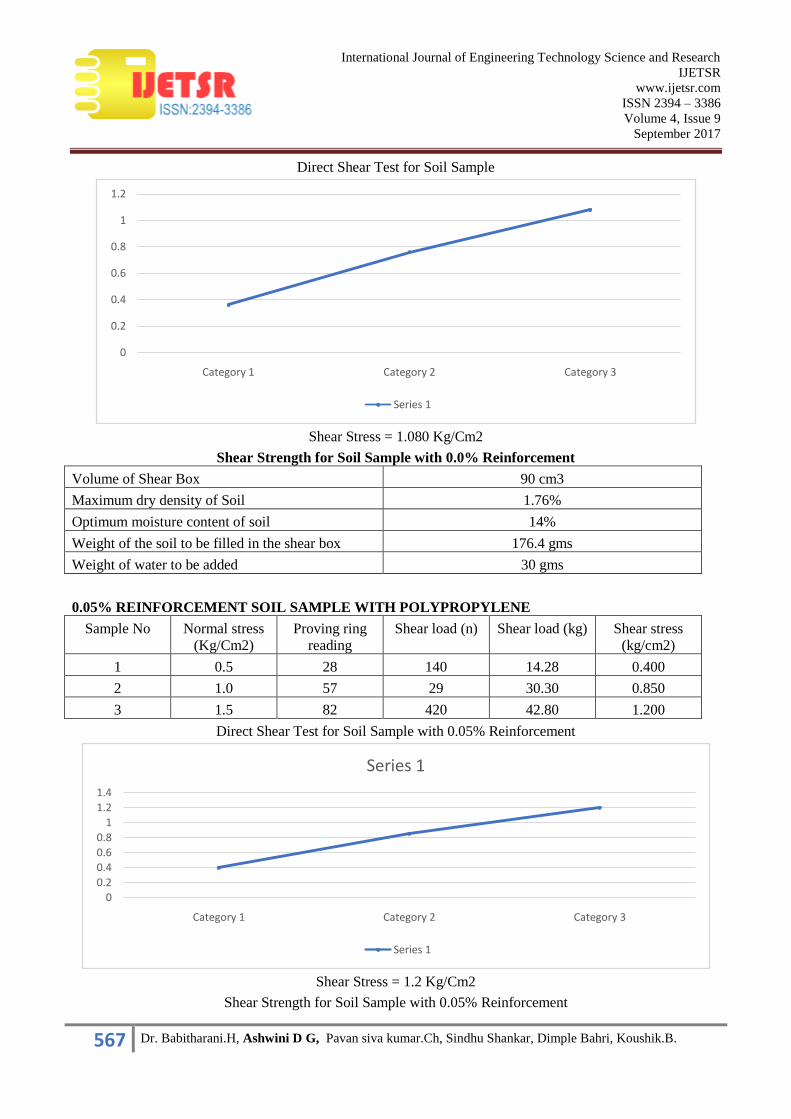
Direct Shear Test for Soil Sample
Shear Stress = 1.080 Kg/Cm2
Shear Strength for Soil Sample with 0.0% Reinforcement
Volume of Shear Box 90 cm3
Maximum dry density of Soil 1.76%
Optimum moisture content of soil 14%
Weight of the soil to be filled in the shear box 176.4 gms
Weight of water to be added 30 gms
0.05% REINFORCEMENT SOIL SAMPLE WITH POLYPROPYLENE
Sample No Normal stress
(Kg/Cm2)
Proving ring
reading
Shear load (n) Shear load (kg) Shear stress
(kg/cm2)
1 0.5 28 140 14.28 0.400
2 1.0 57 29 30.30 0.850
3 1.5 82 420 42.80 1.200
Direct Shear Test for Soil Sample with 0.05% Reinforcement
Shear Stress = 1.2 Kg/Cm2
Shear Strength for Soil Sample with 0.05% Reinforcement
0
0.2
0.4
0.6
0.8
1
1.2
Category 1 Category 2 Category 3
Series 1
0
0.2
0.4
0.6
0.8
11.2
1.4
Category 1 Category 2 Category 3
Series 1
Series 1
568 Dr. Babitharani.H, Ashwini D G, Pavan siva kumar.Ch, Sindhu Shankar, Dimple Bahri, Koushik.B.
International Journal of Engineering Technology Science and Research
IJETSR
www.ijetsr.com
ISSN 2394 – 3386
Volume 4, Issue 9
September 2017
Volume of Shear Box 90 cm3
Maximum dry density of Soil 1.76%
Optimum moisture content of soil 14%
Weight of the soil to be filled in the shear box 176.4 gms
Weight of water to be added 30 gms
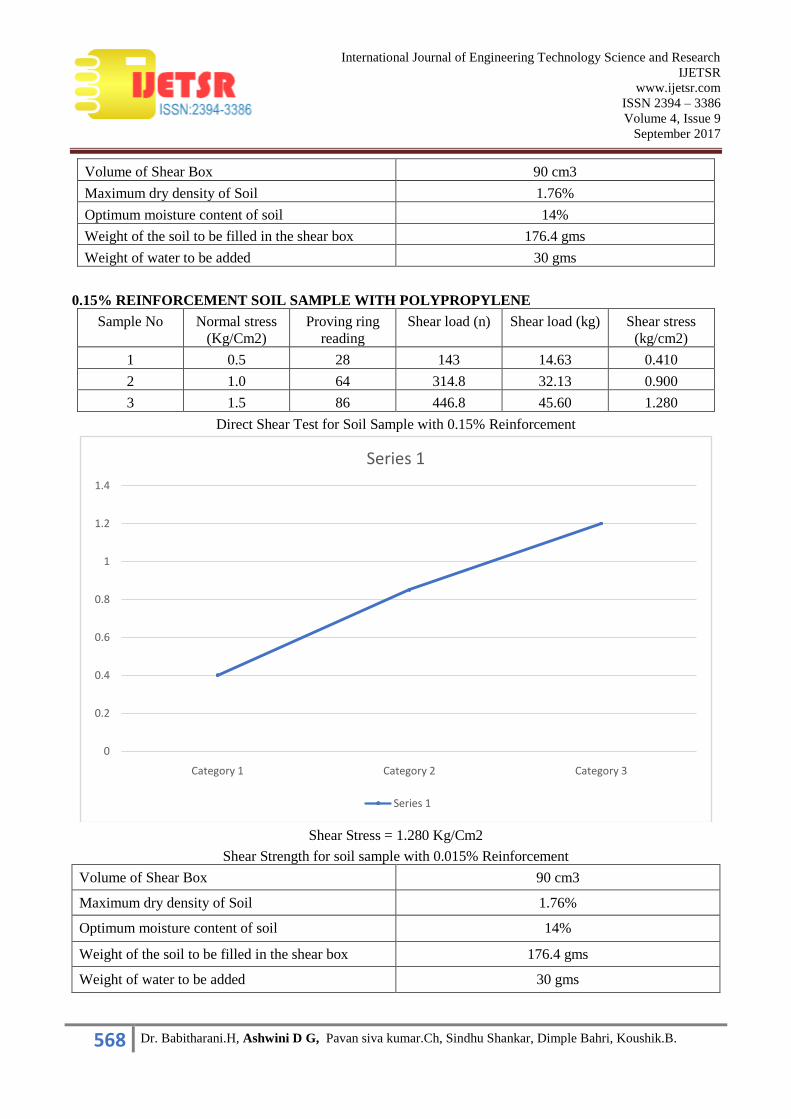
0.15% REINFORCEMENT SOIL SAMPLE WITH POLYPROPYLENE
Sample No Normal stress
(Kg/Cm2)
Proving ring
reading
Shear load (n) Shear load (kg) Shear stress
(kg/cm2)
1 0.5 28 143 14.63 0.410
2 1.0 64 314.8 32.13 0.900
3 1.5 86 446.8 45.60 1.280
Direct Shear Test for Soil Sample with 0.15% Reinforcement
Shear Stress = 1.280 Kg/Cm2
Shear Strength for soil sample with 0.015% Reinforcement
Volume of Shear Box 90 cm3
Maximum dry density of Soil 1.76%
Optimum moisture content of soil 14%
Weight of the soil to be filled in the shear box 176.4 gms
Weight of water to be added 30 gms
0
0.2
0.4
0.6
0.8
1
1.2
1.4
Category 1 Category 2 Category 3
Series 1
Series 1
569 Dr. Babitharani.H, Ashwini D G, Pavan siva kumar.Ch, Sindhu Shankar, Dimple Bahri, Koushik.B.
International Journal of Engineering Technology Science and Research
IJETSR
www.ijetsr.com
ISSN 2394 – 3386
Volume 4, Issue 9
September 2017
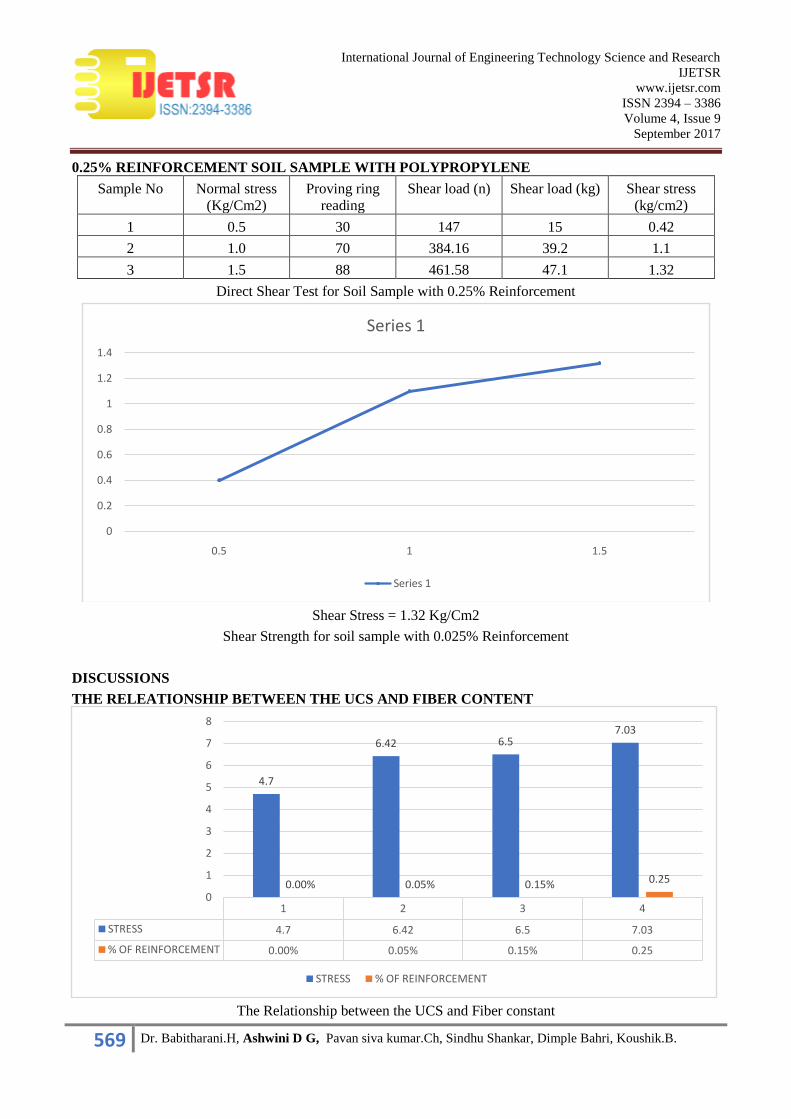
0.25% REINFORCEMENT SOIL SAMPLE WITH POLYPROPYLENE
Sample No Normal stress
(Kg/Cm2)
Proving ring
reading
Shear load (n) Shear load (kg) Shear stress
(kg/cm2)
1 0.5 30 147 15 0.42
2 1.0 70 384.16 39.2 1.1
3 1.5 88 461.58 47.1 1.32
Direct Shear Test for Soil Sample with 0.25% Reinforcement
Shear Stress = 1.32 Kg/Cm2
Shear Strength for soil sample with 0.025% Reinforcement
DISCUSSIONS
THE RELEATIONSHIP BETWEEN THE UCS AND FIBER CONTENT
The Relationship between the UCS and Fiber constant
0
0.2
0.4
0.6
0.8
1
1.2
1.4
0.5 1 1.5
Series 1
Series 1
1 2 3 4
STRESS 4.7 6.42 6.5 7.03
% OF REINFORCEMENT 0.00% 0.05% 0.15% 0.25
4.7
6.42 6.57.03
0.00% 0.05% 0.15% 0.25
0
1
2
3
4
5
6
7
8
STRESS % OF REINFORCEMENT
570 Dr. Babitharani.H, Ashwini D G, Pavan siva kumar.Ch, Sindhu Shankar, Dimple Bahri, Koushik.B.
International Journal of Engineering Technology Science and Research
IJETSR
www.ijetsr.com
ISSN 2394 – 3386
Volume 4, Issue 9
September 2017
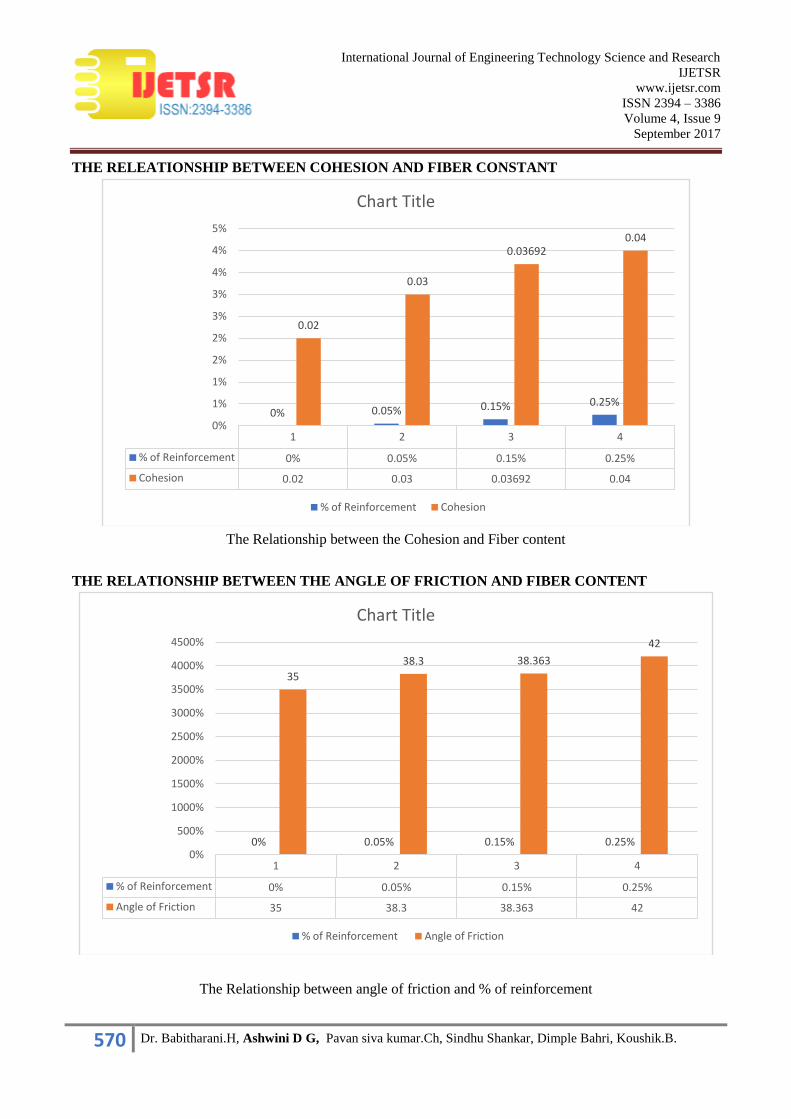
THE RELEATIONSHIP BETWEEN COHESION AND FIBER CONSTANT
The Relationship between the Cohesion and Fiber content
THE RELATIONSHIP BETWEEN THE ANGLE OF FRICTION AND FIBER CONTENT
The Relationship between angle of friction and % of reinforcement
1 2 3 4
% of Reinforcement 0% 0.05% 0.15% 0.25%
Cohesion 0.02 0.03 0.03692 0.04
0% 0.05% 0.15% 0.25%
0.02
0.03
0.036920.04
0%
1%
1%
2%
2%
3%
3%
4%
4%
5%
Chart Title
% of Reinforcement Cohesion
1 2 3 4
% of Reinforcement 0% 0.05% 0.15% 0.25%
Angle of Friction 35 38.3 38.363 42
0% 0.05% 0.15% 0.25%
35
38.3 38.363
42
0%
500%
1000%
1500%
2000%
2500%
3000%
3500%
4000%
4500%
Chart Title
% of Reinforcement Angle of Friction
571 Dr. Babitharani.H, Ashwini D G, Pavan siva kumar.Ch, Sindhu Shankar, Dimple Bahri, Koushik.B.
International Journal of Engineering Technology Science and Research
IJETSR
www.ijetsr.com
ISSN 2394 – 3386
Volume 4, Issue 9
September 2017
INFERENCES
Inferences from Direct Shear Test for Soil Sample
Cohesion value increases from 0.02kg/cm2 to 0.04kg/cm2, a net 100.0%
The increment graph for cohesion shows a gradual decline in slope.
The angle of internal friction increases from 35 to 42 degrees, a net 20.0%
The incremental graph for φ shows a variation in shape alternative raise and fall
The incremental in shear strength of soil due to reinforcement is substantial.
Inferences from UCS Test for Soil Sample
UCS value increases from 4.7kg/cm2 to 7.03kg/cm2, a net 50%.
The shape of incremental graph varies with alternative raise and fall.
CONCLUSION
On the basis of present experimental study, the following conclusions are drawn,
Based on direct shear test on soil sample, with fiber reinforcement of 0.05%,0.15% and 0.25%, the
increase in cohesion was found to be 50%, 34.6%, and 22.4%, 3.9% and 6.1% respectively. The increase in
the internal angle of friction (φ) was found to be 10%, 3.9% and 6.1% respectively.
Since the net increase in the value of c and φ were observed to be 100%, from 0.02kg/cm2 to
0.04kg/cm2 and 20%, from 35 to 42 degrees net increment respectively, for such soil, randomly distributed
polypropylene fiber reinforcement is recommended.
The result from the UCS test for soil sample are also similar, for reinforcement of 0.05%, 0.15% and
0.25%, the increase in UCS from the initial value are 35.31%, 1.1% and 8.8% respectively. This increment is
substantial and applying it for soil sample is effective.
Overall it can be concluded that fiber reinforced soil can be considered to be good ground
improvement technique specially in engineering projects on weak soil where it can act as a substitute to
deep/raft foundations, reducing the cost as well as energy.
REFERENCES 1. S. A. Naeini and S. M. Sadjadi, (2008),” Effect of Waste Polymer Materials on Shear Strength of Unsaturated Clays”,
EJGE Journal, Vol 13, Bund k,(1-12).
2. Yetimoglu, T., Inanir, M., Inanir, O.E., 2005. A study on bearing capacity of randomly distributed fiber-reinforced
sand fills overlying soft clay. Geotextiles and Geomembranes 23 (2), 174–183.
3. Chaosheng Tang, Bin Shi, Wei Gao, Fengjun Chen, Yi Cai, 2006. Strength and mechanical behavior of short
polypropylene fiber reinforced and cement stabilized clayey soil. Geotextiles and Geomembranes 25 (2007) 194–
202.
4. Mahmood R. Abdi, Ali Parsapajouh, and Mohammad A. Arjomand,(2008),” Effects of Random Fiber Inclusion on
Consolidation, Hydraulic Conductivity, Swelling, Shrinkage Limit and Desiccation Cracking of Clays”,
International Journal of Civil Engineering, Vol. 6, No. 4, (284-292).
5. Consoli, N. C., Prietto, P. D. M. and Ulbrich, L. A. (1999). „„The behavior of a fibre reinforced cemented soil.‟‟
Ground Improvement, London, 3(1), 21–30.
6. IS 2720 – part (xiii) 1980-87
7. The need for soil stabilization, April 9, 2011 by Ana [online] Available at: <
http://www.contracostalandscaping.com/the-need-for-soil-stabilization/>
8. Methods of soil stabilization, December 24, 2010 [online] Available at: <
http://www.engineeringtraining.tpub.com/14070/css/14070_424.htm >
9. Prof. Krishna Reddy, UIC, 2008, Engineering Properties of Soils Based on Laboratory Testing.
10. Understanding the Basics of Soil Stabilization: An Overview of Materials and Techniques [online] Available at:
<http://www.cat.com >
11. Punmia B.C. 2007, “Soil Mechanics & Foundations” Laxmi Publications
572 Dr. Babitharani.H, Ashwini D G, Pavan siva kumar.Ch, Sindhu Shankar, Dimple Bahri, Koushik.B.
International Journal of Engineering Technology Science and Research
IJETSR
www.ijetsr.com
ISSN 2394 – 3386
Volume 4, Issue 9
September 2017
12. Yadav Parit, Meena Kuldeep Kumar, (2011)” A comparative study in soil plasticity of Hall area and lecture
complex area of NIT Rourkela” B.tech thesis, NIT,Rourkela.
13. IS: 2720(Part-2), 1973 Methods of Test for Soils. Determination of water content.
14. IS 2720(III/SEC-I): 1980 Methods of Test for Soils. Determination of specific gravity.
15. IS 2720(VII):1980 Methods of Test for Soils. Determination of water content dry density relation using light
compaction.
16. IS 2720(XIII):1986 Methods of Test for Soils, direct shear test
17. IS 2720(X):1991 Methods of Test for Soils. Determination of unconfined compression test.
18. IS 2720(IV):1985 Methods of Test for Soils. Determination of grain size analysis.


