Embed Size (px)
Citation preview
Soil Fertility under Native Cerrado and Pasture in the Brazilian Savanna
Juliane Lilienfein, Wolfgang Wilcke,* Lourival Vilela, Miguel Angelo Ayarza,Samuel do Carmo Lima, and Wolfgang Zech
ABSTRACT dry matter production of the grass species at locationsprotected from grazing or as the liveweight gains ofIn the Brazilian savanna, there is a risk that soil fertility of pasturesthe cattle. Biomass production of fertilized Brachiariadeclines to a level below that of the native savanna because of low
fertilizer application. To evaluate biophysical pasture sustainability decumbens Stapf pastures in the Brazilian CE rangeswe compared regularly fertilized productive pasture (PP), degraded between 5.5 and 11 Mg ha�1 yr�1 and liveweight gainspasture fertilized 13 yr previously (DP), and native savanna (Cerrado, between 487 and 771 kg ha�1 at stocking rates of 2 toCE) in an on-farm experiment. We determined (i) biomass productiv- 2.5 animal units ha�1 (Kornelius et al., 1979; Cadisch etity of the pastures and (ii) nutrient concentrations in Anionic Acrus- al., 1994). The grass biomass productivity of Brachiariatoxes from three plots under each of CE, DP, and PP. From the 0- pastures in Brazil is substantially lower than in Australiato 2-m soil layer, we sampled solid phase in January 1998 and soil
where it may reach 33 Mg ha�1 yr�1 (Whiteman et al.,solution during two rainy seasons (1997-1998 and 1998-1999). The1980). Furthermore, if the soils are not regularly fertil-mean aboveground biomass production (dry weight) was 2.1 Mg ha�1
ized the productivity declines rapidly after 4 to 10 yryr�1 for DP and 4.1 Mg ha�1 yr�1 for PP. In the solid phase of the(Boddey et al., 1996).0- to 0.15-m layer, mean total N and S and exchangeable Ca and
Mg concentrations increased in the order CE � DP � PP, while The effects of forest clearing and subsequent pastureNaHCO3–extractable P was not significantly different among CE, DP, use on the fertility of the CE Oxisols has up to nowand PP. In the soil solution at 0.15-m depth, pH and concentrations only been studied by a few researchers (Lilienfein etof Ca and Mg also increased in the order CE � DP � PP. At the al., 1998, 1999, 2000b; Neufeldt, 1998; Resck et al., 2000).2-m depth, only K, Mn, and NO3–N concentrations in soil solution Lilienfein et al. (1998, 2000b) found no significant differ-were slightly higher under the pastures than under CE indicating an ences in water-stable aggregate distribution and concen-increased risk of leaching losses to below the rooting zone. Thus,
trations of total C, N, P, S, and Mo between the topsoilstopsoil fertility in both pastures is increased compared with CE, andunder native CE vegetation and pasture near the citylittle leaching occurs. Some fertility indicators in DP are still improvedof Uberlandia in the State of Minas Gerais. The distribu-compared with CE 13 yr after a single fertilization.tion of P, S, and Mo among different chemical fractionsdid not differ between pasture soils and soils undernative CE. From the same study area, Neufeldt (1998)Between 35 and 40 million ha of the savanna regionreported a strong increase in soil organic C concentra-of Brazil, locally termed “Cerrado,” are used astions in pasture soils compared with the soils underpastures. This area represents 80% of the total agricul-native CE, particularly in the 50- to 2000-�m particle-turally used area in this region. Most pastures in thesize fraction. Spain et al. (1996) found increased N con-Brazilian CE were only established in the last threecentrations under pasture than under native CE. Thedecades although there may have been some earliertemporal course of the matric potentials as a measuregrazing activity in the native CE. In general, after clear-for plant-available water and the mean water storageing of the natural savanna by harvesting the trees includ-in soil under nonfertilized DP and under PP, whiching their large roots, foreign pasture grass species werereceived maintenance fertilization were close to thosesown and fertilized at low rates (Spain et al., 1996; Lopesof soils under native CE (Lilienfein et al., 1999).et al., 1999; Resck et al., 2000). The CE pastures sup-
For the Amazonian region, which has different cli-ported a cattle herd of more than 52 million head inmate but similar soils, more studies on the effect of1993 and thus represent an important component of thepasture use on soil properties have been published.Brazilian agricultural production which may only beCerri et al. (1991) and Feigl et al. (1995) observed de-maintained or increased if pasture management is sus-creasing C concentrations in surface soil after foresttainable (Resck et al., 2000). To evaluate the biophysicalclearing in central Amazonas and Rondonia, respec-sustainability we examined the productivity and soil fer-tively, which increased again after 1 to 2 yr of pasturetility of different pastures.use, while Eden et al. (1991) did not observe a significantThe productivity of pastures may be measured as thechange in C concentrations in northern Roraima overtime. Some authors reported increased C and N storage
J. Lilienfein, Dep. of Environmental and Resource Sciences, MS 370, in surface soils after several years of pasture use com-Univ. of Nevada-Reno, Reno, NV 89557; W. Wilcke, Dep. of Soil
pared with natural forest in eastern Amazonas and Ron-Science, Institute of Ecology, Berlin Univ. of Technology, Salzuferdonia (Feigl et al., 1995; Koutika et al., 1997). In the11-12, D-10587 Berlin, Germany; W. Zech, Institute of Soil Science
and Soil Geography, Univ. of Bayreuth, D-95440 Bayreuth, Germany; upper 1 m of an Oxisol under DP in Para, Nepstad etL. Vilela, EMBRAPA-Cerrados, Caixa Postal 08223, Planaltina-DF, al. (1994), in contrast, found reduced C storage com-Brazil; M.A. Ayarza, CIAT-LADERAS, Apartado 1410, Tegucigalpa, pared with native rain forest. In the study of Eden etHonduras; S.d.C. Lima, Federal Univ. of Uberlandia, 38406-210 Uber-landia-MG, Brazil. Received 8 Sept. 2000. *Corresponding author
Abbreviations: CE, Cerrado; DP, degraded pasture; ECEC, effective([email protected]).cation-exchange capacity; HSD, honest significant difference; PP, pro-ductive pasture; TOC, total organic C.Published in Soil Sci. Soc. Am. J. 67:1195–1205 (2003).
1195
1196 SOIL SCI. SOC. AM. J., VOL. 67, JULY–AUGUST 2003
believe that they are a sensitive indicator of land-useeffects on soil fertility.
Our objective was to evaluate the productivity andsoil fertility as indicators for biophysical sustainabilityof the pastures in the CE region near the city of Uberlan-dia in an on-farm experiment. We chose the two majorpasture types of the region: a pure grass PP receivingregular maintenance fertilizing and a so-called DP,which was only fertilized at the date of establishmentand is now characterized by partly vegetation-free soiland invasive CE plants. The biophysical sustainability ofthe pastures was assessed by examining (i) the biomassproductivity, (ii) the fertility, that is, the nutrient concen-trations in soil solid phase and solution, and (iii) therisk of nutrient losses to the deeper subsoil as indicatedby the depth distribution and the temporal course ofnutrient concentrations in soil solution at various depths.We assumed that the native savanna ecosystem is sus-tainable with respect to nutrient cycles and thereforecompared the nutrient status and dynamics of the pas-ture soils with that of soils under native CE.
MATERIALS AND METHODS
Study Sites
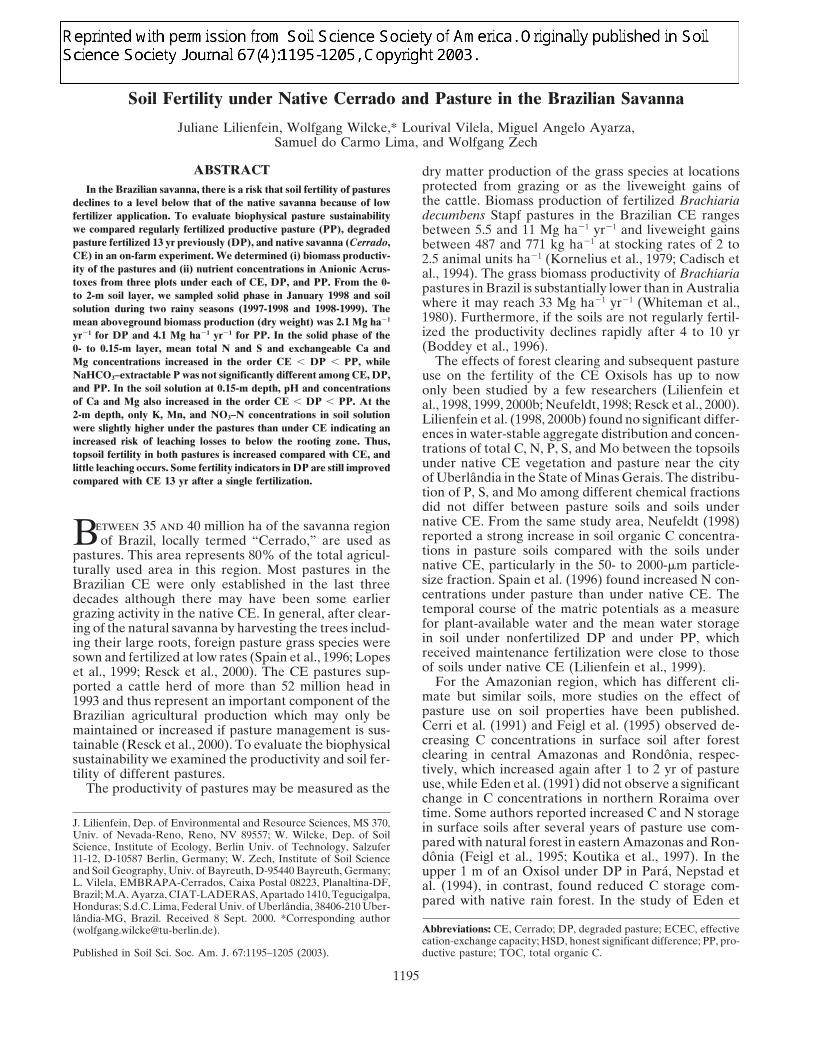
The study was performed southeast of Uberlandia (StateFig. 1. Locations of the study sites. of Minas Gerais) about 400 km south of Brasılia (19�5�S lat.,
48�7�W long.). Mean annual temperature in Uberlandia be-al. (1991), basic cation concentrations in pasture surface tween 1981 and 1990 was 22�C with only small variationssoils fell below those of the natural forest soils after 12 between the coldest (June, July: 19�C) and the warmest months
(February: 24�C). Mean annual precipitation during this pe-yr of pasture use. Nepstad et al. (1994) have shown thatriod was 1550 mm with 130 mm during the dry season betweena large part of the Amazonian rain forest relies on deepMay and September and 1420 mm during the rainy seasonroots (�8 m) for water uptake during droughts. Chang-between October and April (Rosa et al., 1991).ing the rooting depth by replacing the forest with the
Within an area of about 100 km2 , three plots of naturalless deeply rooting pastures would reduce the deep soil savanna (CE), DP, and PP were selected (Fig. 1). We triedC storage and alter the soil-water cycle. The effect would to choose independent plots to allow for statistical evaluationbe more pronounced for productive pure grass pastures with variance analysis (Lilienfein et al., 1999).than for the so-called DPs containing some woody plants The native vegetation was classified as a typical CE ac-because of decreasing rooting depth in the order, cording to the definition of Sarmiento (1984). It was character-forest � DP � pure grass pasture. These results illus- ized by an open grassland with a 15 to 40% cover of 3- to
5-m high trees. Tree density was 6487 ha�1 with only 602 treestrate that pasture use of tropical Oxisols may have con-ha�1 taller than 2 m. Dominant tree species in the layer �2 mtrasting effects on soil properties and that we are farwere Pouteria torta (Mart.) Radlk., Ouratea spectabilis (Mart.)from being able to draw generalized conclusions con-Engl., Roupala montana Aubl., Byrsonima coccolobifolia H.B.cerning the biophysical sustainability of pastures in theet K., Dalbergia miscolobium Benth., Kielmeyera coriaceaCE region. Mart., and Caryocar brasiliense Cambess, which together rep-Previous studies concerning land-use effects on the resented 70% of the biomass of the �2-m layer. In the 0.5-
nutrient status of Oxisols in the CE showed that soil to 2-m tall tree layer, many different species were found ofsolution responds more sensitively to land use than the which Ouratea hexasperma (St.-Hil.) Baill. representing 33%soil solid phase. The concentrations and chemical forms of the biomass in the 0.5- to 2-m layer was most abundant.of P, S, Mo, and metals in soil solid phase under natural The dominant shrub species were Miconia holosericea DC.,
Hortia brasiliana Vand. ex DC., Myrcia rostrata DC., Parinarisavanna vegetation, Pinus plantation, and pastures wereobtusifolia Hook. f., and Campomanesia velutina Blume, con-little affected by 10 to 20 yr of land use (Lilienfein ettributing 93% to the total shrub biomass. Among the grassal., 2000a, 2000b, 2001a). Metal concentrations in soilspecies we most frequently found Andropogon Minarumsolution under Pinus plantations, however, were signifi-Kunth, Axonopus barbigerus (Kunth) Hitchc., Tristachyacantly increased indicating the beginning of soil acidifi-chrysothrix Nees, and Echinolaena inflexa (Poir.) Chase ofcation (Lilienfein et al., 2000a). Furthermore, dissolved the family Poaceae, which comprised the highest number of
N concentrations in soil solution under Pinus were sig- species; among the herbaceous species, members of the fami-nificantly higher than under CE because of the accumu- lies Asteraceae, Rubiaceae, Fabaceae, and Mimosaceae werelation of a deep organic layer with a high N storage most abundant.(Lilienfein et al., 2001a). In the present study we exam- The most important criteria for the selection of the pasture
plots were the current visual impression and the likelihoodined soil solution properties under pastures because we
LILIENFEIN ET AL.: SOIL FERTILITY UNDER NATIVE CERRADO AND PASTURE 1197
that the pasture use followed directly the clearing of the native The pH of the soil solutions was measured in a subsampleimmediately after sampling with a standard pH electrodevegetation. The DP sites showed the characteristics Lopes et
al. (1999) described as typical for degraded pastures of the (U 402-S7, Orion, Boston, MA) in a separate aliquot, whichwas afterwards discarded. The remaining solutions were fro-CE region: decreased grass cover compared with the PPs,
followed by the invasion of CE plants. The PP, in contrast, zen for storage.The following properties were determined in the solid soilwas a pure grass pasture of Brachiaria decumbens Stapf with
a closed vegetation cover. The history of the pastures was samples: pH with a standard glass electrode in H2O and 1 MKCl, soil/solution ratio 1:2.5, total concentrations of C, N, andreconstructed by interviewing the current landowners. Be-
cause of changes in land ownership and the lack of written S by dry combustion and gas chromatographic separation witha CNS analyzer (Elementar Vario EL, Elementar Analysen-documentation, this reconstruction was not easy and may not
be entirely reliable, although we only selected the pastures systeme GmbH, Hanau, Germany), exchangeable cations byextraction with 1 M ammonium acetate (Sumner and Miller,with the best-known history. However, we do not see how
this problem may be overcome when attempting to conduct 1996). The soil water content was estimated from the matricpotentials—measured with tensiometers—with the help of thean on-farm study in a rapidly developing tropical country. All
pastures under study were established by harvesting the native soil water characteristic curve as described by Lilienfein etal. (1999).CE vegetation including the large roots. They were established
around 1985. The most common procedure was to plant upland In soil solutions and extracts, we determined the concentra-tions of Ca, Fe, K, Mg, and Na with flame atomic absorptionrice (Oryza sativa L.), which was fertilized with about 40 kg
P, 65 kg K, 32 kg N, and 1 Mg of dolomitic limestone ha�1. spectrometry (SpectrAA 400, Varian, Mulgrave, Australia).Aluminum, Mn, and Zn concentrations in soil solution wereThe fertilizer was mixed with seeds of Brachiaria decumbens,
an imported grass species from Africa. After the harvest of measured with inductively coupled plasma mass spectroscopy(VG PlasmaQuad PQ2 Turbo Plus, VG Elemental, Winds-the rice, the Brachiaria was already stabilized and grazing
began. In 1996-1997, we fertilized all PP replicates with 17 kg ford, UK) and in extracts with flame atomic absorption spec-trometry, NH4 and NO3 with a rapid flow analyzer (RFA-300,P ha�1 and 33 kg K ha�1. One of the three replicates of PP,
PP1 in Fig. 1, was an experimental pasture where the fertilizing Alpkem Corporation, Clackamas, OR), total organic C (TOC)with an automatic TOC analyzer (TOC-5050, Shimadzu Cor-rates are well known. The pasture PP1 received 17 kg P and
33 kg K ha�1 at 4-yr intervals (i.e., in 1988, 1992, and 1996). poration, Tokyo, Japan), and total S and P with inductivelycoupled plasma-atomic emission spectroscopy (ICP-AES,The other PP replicates received maintenance fertilizer appli-
cations at similar but unknown rates and application dates. GBC Integra XMP, GBC Scientific Equipment Pty, Ltd., Dan-denong, Victoria, Australia).Soils at all sites were very-fine isohyperthermic Anionic
Acrustoxes (Soil Survey Staff, 1997) or Latossolos vermelhosescuros and Latossolos vermelhos-amarelos according to the Grass Biomass ProductionBrazilian soil classification and had similar chemical and physi-cal properties before the beginning of land-use (Lilienfein et The grass biomass production of the pastures was deter-al., 1999). All soils were developed from the same geological mined by harvesting the total aboveground biomass of threeparent material, fine limnic sediments of the lower Tertiary. replicate 0.5 m2 large subplots on six dates between 29 Oct.The clay content of the soils ranged between 615 to 885 g 1997 and 12 Apr. 1999 at all pasture plots. On each samplingkg�1. Properties, which are typically not influenced by land date subplots were chosen for biomass determination. Biomassuse such as soil classification, particle-size distribution, and samples were collected at the beginning of the rainy seasonthe concentrations of dithionite-soluble Fe (Holmgren, 1967) in October or November, in January or February, and at theand oxalate-soluble Al (Schwertmann, 1964) were not signifi- end of the rainy season in April. After biomass sampling, allcantly different among the studied soils (Lilienfein et al., 1999). grass inside the fenced area was cut to the same mean height
as outside to simulate grazing. The samples were dried toconstant weight at 70�C and masses were determined gravimet-Equipment and Sampling rically. The productivity was calculated by difference of theaboveground biomass between two dates and addition of theOn each of the nine plots, a 10 by 10 m area was fenced
and equipped with five replicate tensiometers and suction cups biomass harvested per area of the subplot to simulate grazing.at each of 0.15-, 0.3-, 0.8-, 1.2-, and 2-m soil depths. The majorconstituents of the porous cups were Al2O3 (70%) and SiO2 Data Evaluation(29%) with a mean pore diameter of 1 �m. Soil solutionsamples were collected with permanent under-pressure pro- To evaluate the effect of pasture management on nutrientduced by vacuum pumps. The under-pressure was adjusted availability to plants and nutrient leaching we compared the
mean depth distribution and the temporal course of selectedweekly according to the current matric potentials measuredwith the tensiometers. The soil solutions collected with the soil solution properties between CE, DP, and PP. The exam-
ined properties include the pH and the concentration of TOCfive suction cups of a plot were combined into one samplefor each depth. Soil solution was sampled and tensiometers (�80 �m, i.e., in the solution that passed the ceramic cups
without further filtration). We consider solution TOC to bewere read weekly during two rainy seasons (14 Oct.–28 Apr.1997-1998 and 1998-1999). an index of dissolved and particulate organic matter, which
may be important nutrient carriers (Kalbitz et al., 2000), asAt all nine plots, one composite soil sample from the 0- to0.15-, 0.15- to 0.3-, 0.3- to 0.8-, 0.8- to 1.2-, 1.2- to 2-m layers well as a source of nutrients and potentially toxic Al (Savory
and Wills, 1991).was taken in January 1998. Within each plot, samples fromthe 0- to 0.15-m layer were taken from five locations and To enable data evaluation with the help of ANOVA we
tested the three following prerequisites of the statistical designcombined, while those of the deeper layers were taken fromone soil pit on each plot. Soil bulk density was determined of our study. The first prerequisite is that all study sites had
homogeneous soil properties before land use, which wegravimetrically using 100-mL soil cores taken in five-fold repli-cation per layer. All samples were dried at 40�C and sieved showed above. The second prerequisite is that the study sites
are independent. We are sure that this is the case because allto �2 mm.
1198 SOIL SCI. SOC. AM. J., VOL. 67, JULY–AUGUST 2003
study sites are separated from each other by areas with other CE, the standing biomass of the green grass layer inland use and because the distance of several 100 m between January, when the biomass had reached its maximum,the plots is larger than geostatistical ranges of the studied soil was 0.9 Mg kg�1 and that of the herbs was 0.1 Mg kg�1
properties. The third prerequisite is random location within (Lilienfein et al., 2001b). During the period of our study,the homogeneous study area. This prerequisite was most diffi- we observed little grazing activity in the CE and there-cult to meet because we had to use existing land-use systems
fore did not determine grass productivity.in our on-farm experiment. Although we may not rule outthat there were site-specific reasons for the establishment ofa given land use, the homogeneity of the soil suggests that Soil Fertility: Soil Solid Phase Propertiesrandom ownership was more important than soil quality.
Soil pH determines the plant-availability of many nu-Therefore, we concluded that the prerequisites for applyingtrients. In Oxisols, particularly the P availability is re-ANOVA were met.duced because of strong sorption to oxides at pH � 5Mean values of the soil parameters were tested for differ-
ences between CE, DP, and PP by using Tukey’s honest signifi- (Goedert, 1983; Tiessen and Moir, 1993; Friesen et al.,cant difference (HSD) mean separation test (Hartung and 1997). The pH of the study soils is controlled by theElpelt, 1989). To compare mean nutrient concentrations in buffering of Al oxides, which is typical for Oxisols (Ul-the soil solution between the systems and between the various rich, 1981; Goedert, 1983; Driessen and Dudal, 1989,depths of one system, the Wilcoxon matched-pairs test was Table 1). The mean pH (H2O and KCl) in the upperused. Significance was set at P � 0.05 for Tukey’s HSD test 0.3 m was higher under PP than under DP and CEand at P � 0.01 for the Wilcoxon matched-pairs test because
because of the higher application rate of dolomitic lime-of the high number of compared values. Correlation analysesstone. However, the differences in mean H activity ofbetween soil water content and nutrient concentrations inthe equilibrium soil extracts among the three systemssoil solution were performed using the Least Squares methodwere not significant except for that in the KCl extract(Hartung, 1989). Statistical analyses were performed with
STATISTICA for Windows 5.1 (StatSoft, 1995, Loll and Niel- at 0.3- to 0.8-m soil depth between DP and CE. In allsen, Hamburg, Germany). soils, the pH increased with depth, except the pH (H2O)
under PP, indicating the surface acidification. In thetopsoil, the pH (H2O) was higher than the pH (KCl)RESULTS AND DISCUSSIONwhile in the subsoil the reverse was true. The reason
Productivity for this observation is that in the subsoil positive chargesdominate because of low organic matter and high oxideThe mean aboveground dry grass biomass productionconcentrations (Driessen and Dudal, 1989).during the two monitored years was 2.1 � 0.4 Mg ha�1
At 0- to 0.15-m soil depth, mean C concentrationsyr�1 for DP and 4.1 � 1.6 Mg ha�1 yr�1 for PP. Thiswere higher under PP than under DP and CE, althoughwas lower than the range of productivities in new butthe differences were not significant (Lilienfein et al.,unfertilized Brazilian Brachiaria decumbens pastures of1999). Mean N and S concentrations were higher under5.5 to 12 Mg ha�1 yr�1 reported in the literature (Kornel-both pasture systems at all depths than under CE. How-ius et al., 1979; Cadisch et al., 1994). Liveweight gainsever, differences in mean N concentrations between CEwere only determined for PP1 where 414 kg ha�1 yr�1
and DP and between CE and PP were only significantat a stocking rate of 1.0 animal units ha�1 (one animalat 1.2- to 2-m depth and between CE and PP at 0.3 tounit � 450 kg liveweight, Cadisch et al., 1994) were0.8 m. Higher N concentrations under pasture than un-observed of which 324 were reached during the rainyder CE in the Brazilian savanna have also been observedseason and 90 during the dry season. This was also lowerby Spain et al. (1996). The differences in mean S concen-than the range of 487 to 771 kg ha�1 yr�1 reported intrations between CE and PP and between CE and DPthe literature (Kornelius et al., 1979; Cadisch et al.,were significant except at 0.15- to 0.3-m depth. In a1994) but corresponds well with the lower grass biomassprevious study, samples were taken from the same plotsproduction rate. Commonly, a decrease in annual live-at the end of the rainy season in April 1997. We didweight gains by 50% is observed within 3 yr after fertiliza-not detect significant differences in mean total S concen-tion (L. Vilela, Embrapa Cerrados, personal communi-trations of the 0- to 0.15-m layer between CE, DP, andcation, 1997). Therefore, we estimated that liveweightPP (Lilienfein et al., 2000b). This may be the result ofgains in the DP systems were about 50% of those ina large spatial variability or of a temporal variation inthe PP systems which was reflected by a mean stockingtotal S concentrations. In the same previous study, werate of 0.6 animal units ha�1 in the DP systems. Althoughfound that mean total P and NaHCO3–extractable Pthe PP systems were more heterogeneous with respectconcentrations in surface soil (0–0.15 m depth) were notto their grass biomass productivity as indicated by asignificantly different between the three systems (CE:coefficient of variation of 39% between the three repli-388/17.6 mg kg�1, DP: 341/16.9, PP: 333/20.9), althoughcate sites compared with the DP systems (17%), wemean P concentrations under the pastures were lower.consider the productivity of both pasture systems asThis indicates P export by grazing if the assumption ofsufficiently homogeneous among their replicates tosimilar native P concentrations in all studied soils isdraw generalized conclusions for these two typical pas-true. In all soils of the present study, C, N, and S concen-ture systems of the savanna region around Uberlandia.trations decreased with increasing depth.The similar biomass productivity among the replicates
Similar C concentrations and higher N and S concen-of the different pasture systems also indicates similarnutrient inputs into the replicate soils since 1985. In the trations in soils under pasture than under CE result in
LILIENFEIN ET AL.: SOIL FERTILITY UNDER NATIVE CERRADO AND PASTURE 1199
smaller C/N and C/S ratios under pasture than underCE. Increased N concentrations in the subsoil and nar-rowing C/N ratios were also found in soils under Pinuscaribaea Morelet plantations in the same region whencompared with soils under CE (Lilienfein et al., 2001a).However, the subsoil accumulation of N was less pro-nounced in the pasture soils than under Pinus. The resultindicates that under the pastures, like under Pinus,NO�
3 was leached from the surface soil to greater depthwhere it was stored, probably because of sorption topositively charged surfaces (Morais et al., 1976). Thus,pasture use results in the formation of a subsoil N reser-voir, which still may be recycled to the surface by plants.Similar observations have been made in the Amazonianregion by Cahn et al. (1992) for Oxisols under cornand by Schroth et al. (1999) for Oxisols under mixedtree plantations.
At the 0- to 0.3-m soil depth, the mean effective cat-ion-exchange capacity (ECEC) increased significantlyin the order, CE � DP � PP. This was the result of theincreasing pH along the same line. In the same depthlayer, mean exchangeable Ca and Mg concentrations alsofollowed the trend CE � DP � PP reflecting the differentfertilization rates. However, at soil depths �0.3 m, therewere no significant differences in mean ECEC and meanexchangeable Ca and Mg concentrations between thethree systems. Thus, the fertilizer effect was restrictedto the topsoil. Mean exchangeable Al, Fe, K, and Naconcentrations did not differ significantly between thethree systems at any depth.
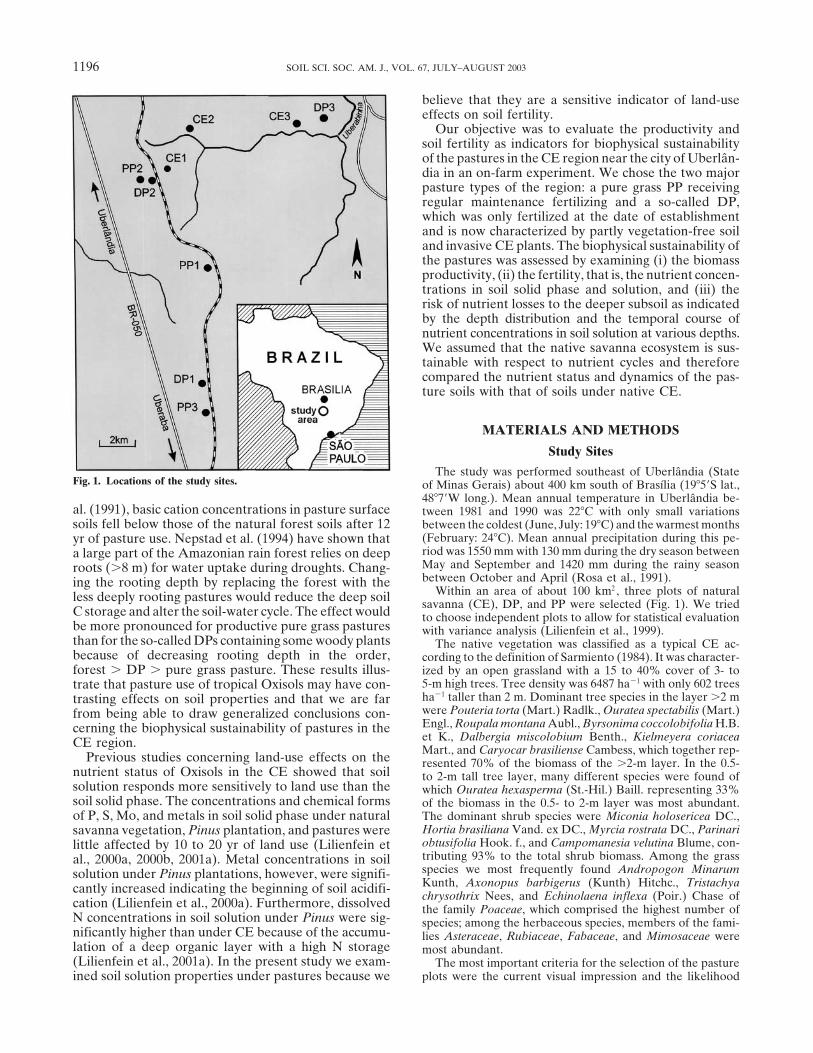
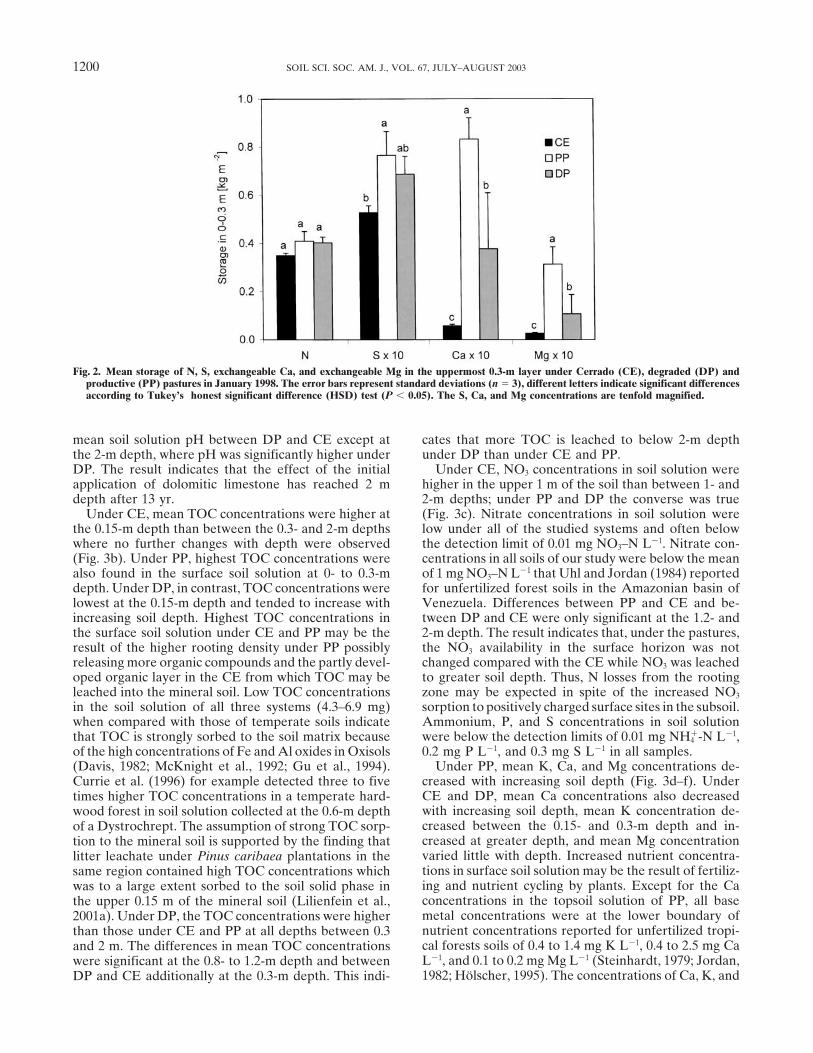
Our results indicate that 13 yr after fertilization, thefertility of the DP soils was still higher than that of theCE soils. To illustrate this, we calculated the storage ofN, S, exchangeable Ca, and exchangeable Mg in theupper 0.3-m layer of the studied systems (Fig. 2). Thus,in contrast to some pastures of the Amazonian region(Eden et al., 1991), the fertility of the DP did not dropto below that of the native system during the moni-tored period.
Soil Fertility: Soil Solution PropertiesNutrients in soil solution are readily plant-available.
Therefore, topsoil solution properties may be used asan indication of nutrient availability to plants becausemost roots are concentrated in the A horizons. Subsoilsolution properties, in contrast, are indicative of the riskof nutrient losses to below the rooting zone although itis not possible to infer nutrient fluxes directly fromnutrient concentrations because of possible differencesin soil water contents.
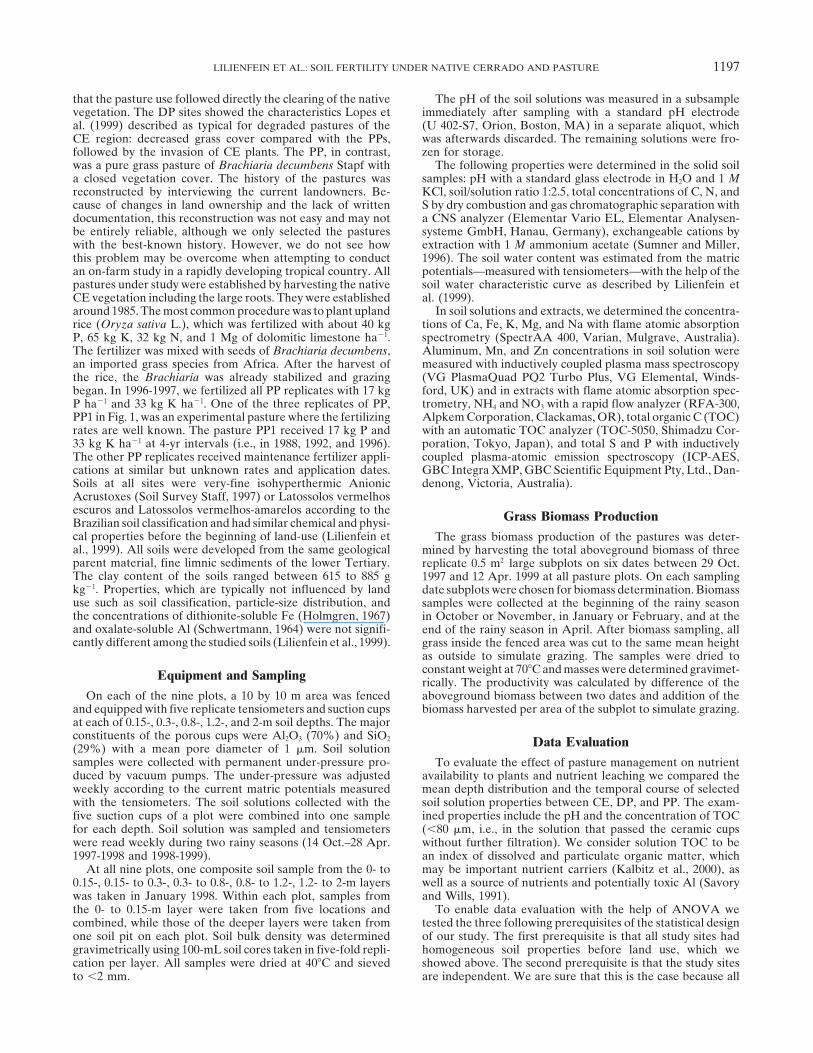
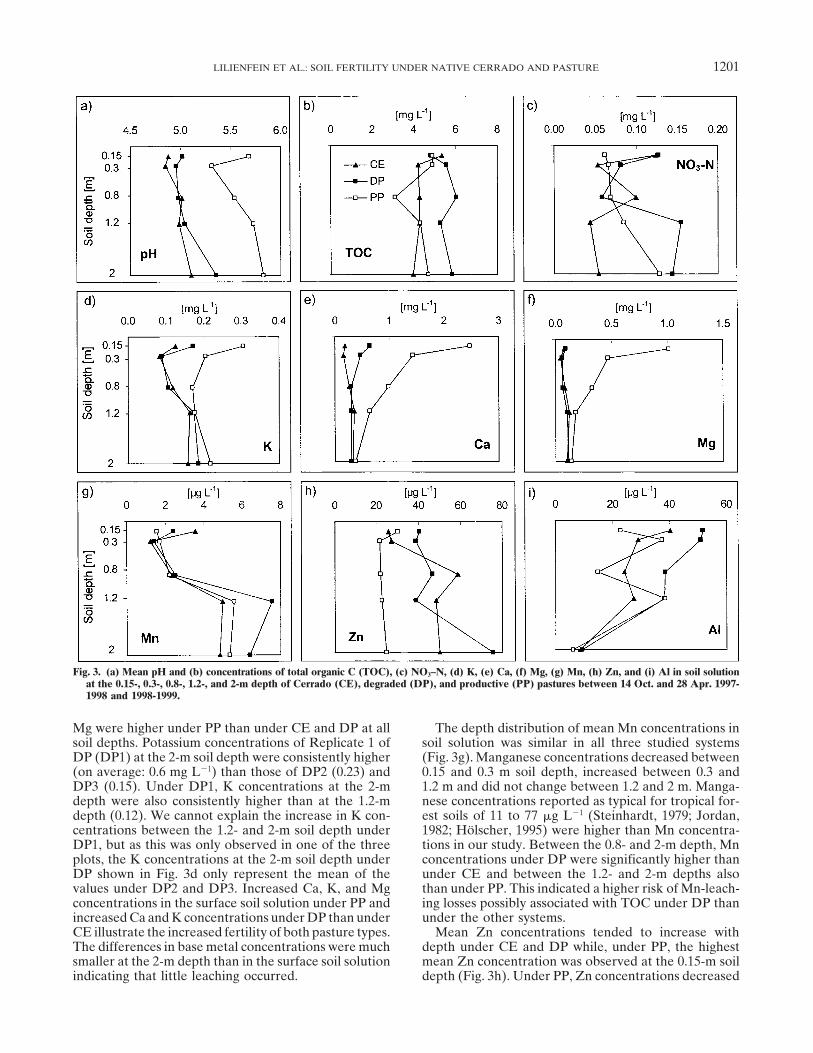
The mean soil solution pH during the two rainy sea-sons increased with increasing soil depth under CE andPP and only varied little with increasing depth underDP (Fig. 3a). Under PP, the mean soil solution pH wassignificantly higher at the 0.15-m than at the 0.3-m depth,which was the result of the recent application of dolo-mitic limestone. Furthermore, the mean soil solution pHwas significantly higher under PP than under CE andDP at all depths because of the regular maintenance
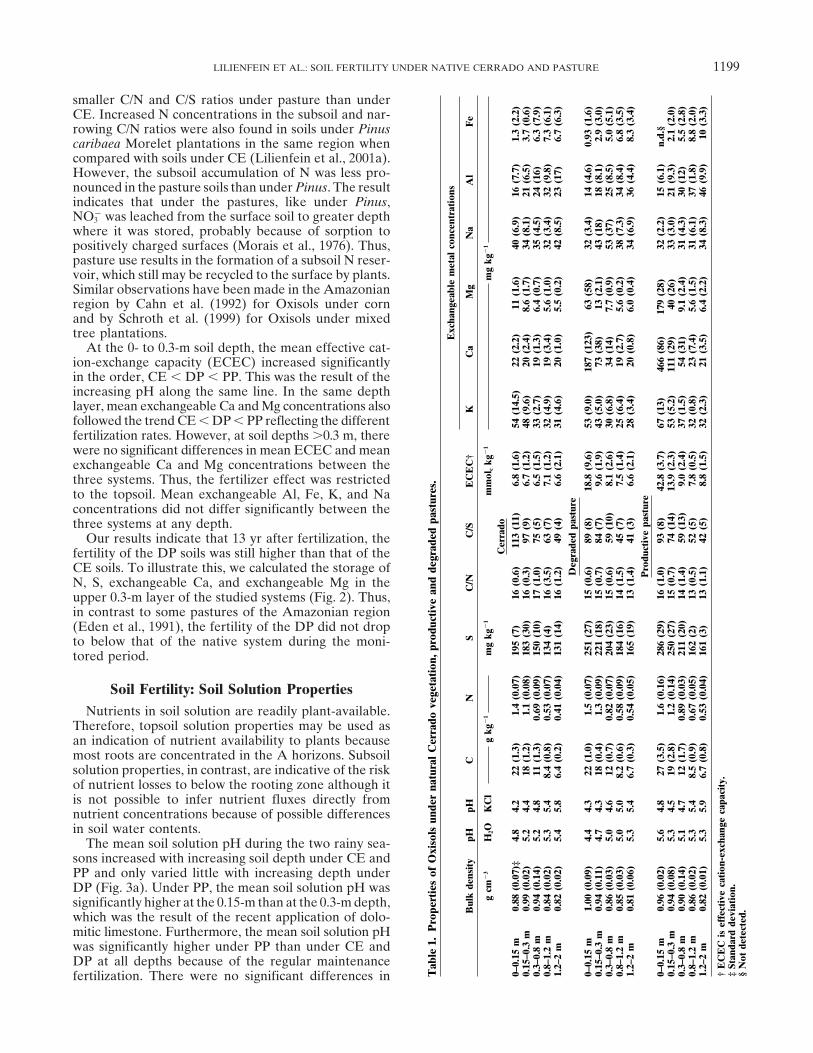
Tab
le1.
Pro
pert
ies
ofO
xiso
lsun
der
natu
ral
Cer
rado
vege
tati
on,p
rodu
ctiv
ean
dde
grad
edpa
stur
es.
Exc
hang
eabl
em
etal
conc
entr
atio
ns
Bul
kde
nsit
ypH
pHC
NS
C/N
C/S
EC
EC
†K
Ca
Mg
Na
Al
Fe
gcm
�3
H2O
KC
lg
kg�
1m
gkg
�1
mm
olc
kg�
1m
gkg
�1
Cer
rado
0–0.
15m
0.88
(0.0
7)‡
4.8
4.2
22(1
.3)
1.4
(0.0
7)19
5(7
)16
(0.6
)11
3(1
1)6.
8(1
.6)
54(1
4.5)
22(2
.2)
11(1
.6)
40(6
.9)
16(7
.7)
1.3
(2.2
)0.
15–0
.3m
0.99
(0.0
2)5.
24.
418
(1.2
)1.
1(0
.08)
183
(30)
16(0
.3)
97(9
)6.
7(1
.2)
48(9
.6)
20(2
.4)
8.6
(1.7
)34
(8.1
)21
(6.5
)3.
7(0
.6)
0.3–
0.8
m0.
94(0
.14)
5.2
4.8
11(1
.3)
0.69
(0.0
9)15
0(1
0)17
(1.0
)75
(5)
6.5
(1.5
)33
(2.7
)19
(1.3
)6.
4(0
.7)
35(4
.5)
24(1
6)6.
3(7
.9)
0.8–
1.2
m0.
84(0
.02)
5.3
5.4
8.4
(0.8
)0.
53(0
.07)
134
(4)
16(3
.5)
63(7
)7.
1(1
.2)
32(4
.9)
19(3
.4)
5.6
(1.0
)32
(3.4
)32
(9.8
)7.
3(6
.1)
1.2–
2m
0.82
(0.0
2)5.
45.
86.
4(0
.2)
0.41
(0.0
4)13
1(1
4)16
(1.2
)49
(4)
6.6
(2.1
)31
(4.6
)20
(1.0
)5.
5(0
.2)
42(8
.5)
23(1
7)6.
7(6
.3)
Deg
rade
dpa
stur
e
0–0.
15m
1.00
(0.0
9)4.
44.
322
(1.0
)1.
5(0
.07)
251
(27)
15(0
.6)
89(8
)18
.8(9
.6)
53(9
.0)
187
(123
)63
(58)
32(3
.4)
14(4
.6)
0.93
(1.6
)0.
15–0
.3m
0.94
(0.1
1)4.
74.
318
(0.4
)1.
3(0
.09)
221
(18)
15(0
.7)
84(7
)9.
6(1
.9)
43(5
.0)
73(3
8)13
(2.1
)43
(18)
18(8
.1)
2.9
(3.0
)0.
3–0.
8m
0.86
(0.0
3)5.
04.
612
(0.7
)0.
82(0
.07)
204
(23)
15(0
.6)
59(1
0)8.
1(2
.6)
30(6
.8)
34(1
4)7.
7(0
.9)
53(3
7)25
(8.5
)5.
0(5
.1)
0.8–
1.2
m0.
85(0
.03)
5.0
5.0
8.2
(0.6
)0.
58(0
.09)
184
(16)
14(1
.5)
45(7
)7.
5(1
.4)
25(6
.4)
19(2
.7)
5.6
(0.2
)38
(7.3
)34
(8.4
)6.
8(3
.5)
1.2–
2m
0.81
(0.0
6)5.
35.
46.
7(0
.3)
0.54
(0.0
5)16
5(1
9)13
(1.4
)41
(3)
6.6
(2.1
)28
(3.4
)20
(0.8
)6.
0(0
.4)
34(6
.9)
36(4
.4)
8.3
(3.4
)P
rodu
ctiv
epa
stur
e
0–0.
15m
0.96
(0.0
2)5.
64.
827
(3.5
)1.
6(0
.16)
286
(29)
16(1
.0)
93(8
)42
.8(3
.7)
67(1
3)46
6(8
6)17
9(2
8)32
(2.2
)15
(6.1
)n.
d.§
0.15
–0.3
m0.
94(0
.08)
5.3
4.5
19(2
.8)
1.2
(0.1
4)25
0(2
7)15
(0.7
)74
(14)
13.9
(2.3
)53
(5.2
)11
1(2
9)40
(26)
33(3
.0)
21(9
.3)
2.1
(2.0
)0.
3–0.
8m
0.90
(0.1
4)5.
14.
712
(1.7
)0.
89(0
.03)
211
(20)
14(1
.4)
59(1
3)9.
0(2
.4)
37(1
.5)
54(3
1)9.
1(2
.4)
31(4
.3)
30(1
2)5.
5(2
.8)
0.8–
1.2
m0.
86(0
.02)
5.3
5.4
8.5
(0.9
)0.
67(0
.05)
162
(2)
13(0
.5)
52(5
)7.
8(0
.5)
32(0
.8)
23(7
.4)
5.6
(1.5
)31
(6.1
)37
(1.8
)8.
8(2
.0)
1.2–
2m
0.82
(0.0
1)5.
35.
96.
7(0
.8)
0.53
(0.0
4)16
1(3
)13
(1.1
)42
(5)
8.8
(1.5
)32
(2.3
)21
(3.5
)6.
4(2
.2)
34(8
.3)
46(9
.9)
10(3
.3)
†E
CE
Cis
effe
ctiv
eca
tion
-exc
hang
eca
paci
ty.
‡St
anda
rdde
viat
ion.
§N
otde
tect
ed.
fertilization. There were no significant differences in
1200 SOIL SCI. SOC. AM. J., VOL. 67, JULY–AUGUST 2003
Fig. 2. Mean storage of N, S, exchangeable Ca, and exchangeable Mg in the uppermost 0.3-m layer under Cerrado (CE), degraded (DP) andproductive (PP) pastures in January 1998. The error bars represent standard deviations (n � 3), different letters indicate significant differencesaccording to Tukey’s honest significant difference (HSD) test (P � 0.05). The S, Ca, and Mg concentrations are tenfold magnified.
mean soil solution pH between DP and CE except at cates that more TOC is leached to below 2-m depthunder DP than under CE and PP.the 2-m depth, where pH was significantly higher under
DP. The result indicates that the effect of the initial Under CE, NO3 concentrations in soil solution werehigher in the upper 1 m of the soil than between 1- andapplication of dolomitic limestone has reached 2 m
depth after 13 yr. 2-m depths; under PP and DP the converse was true(Fig. 3c). Nitrate concentrations in soil solution wereUnder CE, mean TOC concentrations were higher at
the 0.15-m depth than between the 0.3- and 2-m depths low under all of the studied systems and often belowthe detection limit of 0.01 mg NO3–N L�1. Nitrate con-where no further changes with depth were observed
(Fig. 3b). Under PP, highest TOC concentrations were centrations in all soils of our study were below the meanof 1 mg NO3–N L�1 that Uhl and Jordan (1984) reportedalso found in the surface soil solution at 0- to 0.3-m
depth. Under DP, in contrast, TOC concentrations were for unfertilized forest soils in the Amazonian basin ofVenezuela. Differences between PP and CE and be-lowest at the 0.15-m depth and tended to increase with
increasing soil depth. Highest TOC concentrations in tween DP and CE were only significant at the 1.2- and2-m depth. The result indicates that, under the pastures,the surface soil solution under CE and PP may be the
result of the higher rooting density under PP possibly the NO3 availability in the surface horizon was notchanged compared with the CE while NO3 was leachedreleasing more organic compounds and the partly devel-
oped organic layer in the CE from which TOC may be to greater soil depth. Thus, N losses from the rootingzone may be expected in spite of the increased NO3leached into the mineral soil. Low TOC concentrations
in the soil solution of all three systems (4.3–6.9 mg) sorption to positively charged surface sites in the subsoil.Ammonium, P, and S concentrations in soil solutionwhen compared with those of temperate soils indicate
that TOC is strongly sorbed to the soil matrix because were below the detection limits of 0.01 mg NH4 -N L�1,
0.2 mg P L�1, and 0.3 mg S L�1 in all samples.of the high concentrations of Fe and Al oxides in Oxisols(Davis, 1982; McKnight et al., 1992; Gu et al., 1994). Under PP, mean K, Ca, and Mg concentrations de-
creased with increasing soil depth (Fig. 3d–f). UnderCurrie et al. (1996) for example detected three to fiveCE and DP, mean Ca concentrations also decreasedtimes higher TOC concentrations in a temperate hard-with increasing soil depth, mean K concentration de-wood forest in soil solution collected at the 0.6-m depthcreased between the 0.15- and 0.3-m depth and in-of a Dystrochrept. The assumption of strong TOC sorp-creased at greater depth, and mean Mg concentrationtion to the mineral soil is supported by the finding thatvaried little with depth. Increased nutrient concentra-litter leachate under Pinus caribaea plantations in thetions in surface soil solution may be the result of fertiliz-same region contained high TOC concentrations whiching and nutrient cycling by plants. Except for the Cawas to a large extent sorbed to the soil solid phase inconcentrations in the topsoil solution of PP, all basethe upper 0.15 m of the mineral soil (Lilienfein et al.,metal concentrations were at the lower boundary of2001a). Under DP, the TOC concentrations were highernutrient concentrations reported for unfertilized tropi-than those under CE and PP at all depths between 0.3cal forests soils of 0.4 to 1.4 mg K L�1, 0.4 to 2.5 mg Caand 2 m. The differences in mean TOC concentrationsL�1, and 0.1 to 0.2 mg Mg L�1 (Steinhardt, 1979; Jordan,were significant at the 0.8- to 1.2-m depth and between1982; Holscher, 1995). The concentrations of Ca, K, andDP and CE additionally at the 0.3-m depth. This indi-
LILIENFEIN ET AL.: SOIL FERTILITY UNDER NATIVE CERRADO AND PASTURE 1201
Fig. 3. (a) Mean pH and (b) concentrations of total organic C (TOC), (c) NO3–N, (d) K, (e) Ca, (f) Mg, (g) Mn, (h) Zn, and (i) Al in soil solutionat the 0.15-, 0.3-, 0.8-, 1.2-, and 2-m depth of Cerrado (CE), degraded (DP), and productive (PP) pastures between 14 Oct. and 28 Apr. 1997-1998 and 1998-1999.
Mg were higher under PP than under CE and DP at all The depth distribution of mean Mn concentrations insoil solution was similar in all three studied systemssoil depths. Potassium concentrations of Replicate 1 of
DP (DP1) at the 2-m soil depth were consistently higher (Fig. 3g). Manganese concentrations decreased between0.15 and 0.3 m soil depth, increased between 0.3 and(on average: 0.6 mg L�1) than those of DP2 (0.23) and
DP3 (0.15). Under DP1, K concentrations at the 2-m 1.2 m and did not change between 1.2 and 2 m. Manga-nese concentrations reported as typical for tropical for-depth were also consistently higher than at the 1.2-m
depth (0.12). We cannot explain the increase in K con- est soils of 11 to 77 �g L�1 (Steinhardt, 1979; Jordan,1982; Holscher, 1995) were higher than Mn concentra-centrations between the 1.2- and 2-m soil depth under
DP1, but as this was only observed in one of the three tions in our study. Between the 0.8- and 2-m depth, Mnconcentrations under DP were significantly higher thanplots, the K concentrations at the 2-m soil depth under
DP shown in Fig. 3d only represent the mean of the under CE and between the 1.2- and 2-m depths alsothan under PP. This indicated a higher risk of Mn-leach-values under DP2 and DP3. Increased Ca, K, and Mg
concentrations in the surface soil solution under PP and ing losses possibly associated with TOC under DP thanunder the other systems.increased Ca and K concentrations under DP than under
CE illustrate the increased fertility of both pasture types. Mean Zn concentrations tended to increase withdepth under CE and DP while, under PP, the highestThe differences in base metal concentrations were much
smaller at the 2-m depth than in the surface soil solution mean Zn concentration was observed at the 0.15-m soildepth (Fig. 3h). Under PP, Zn concentrations decreasedindicating that little leaching occurred.
1202 SOIL SCI. SOC. AM. J., VOL. 67, JULY–AUGUST 2003
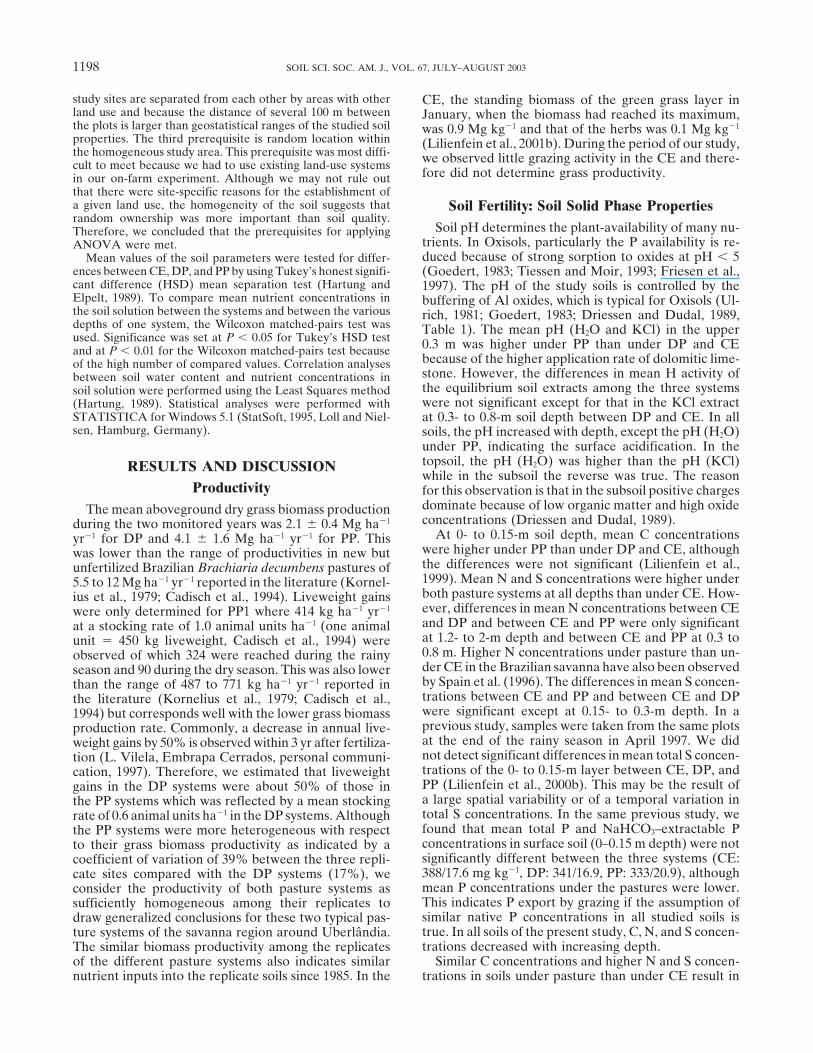
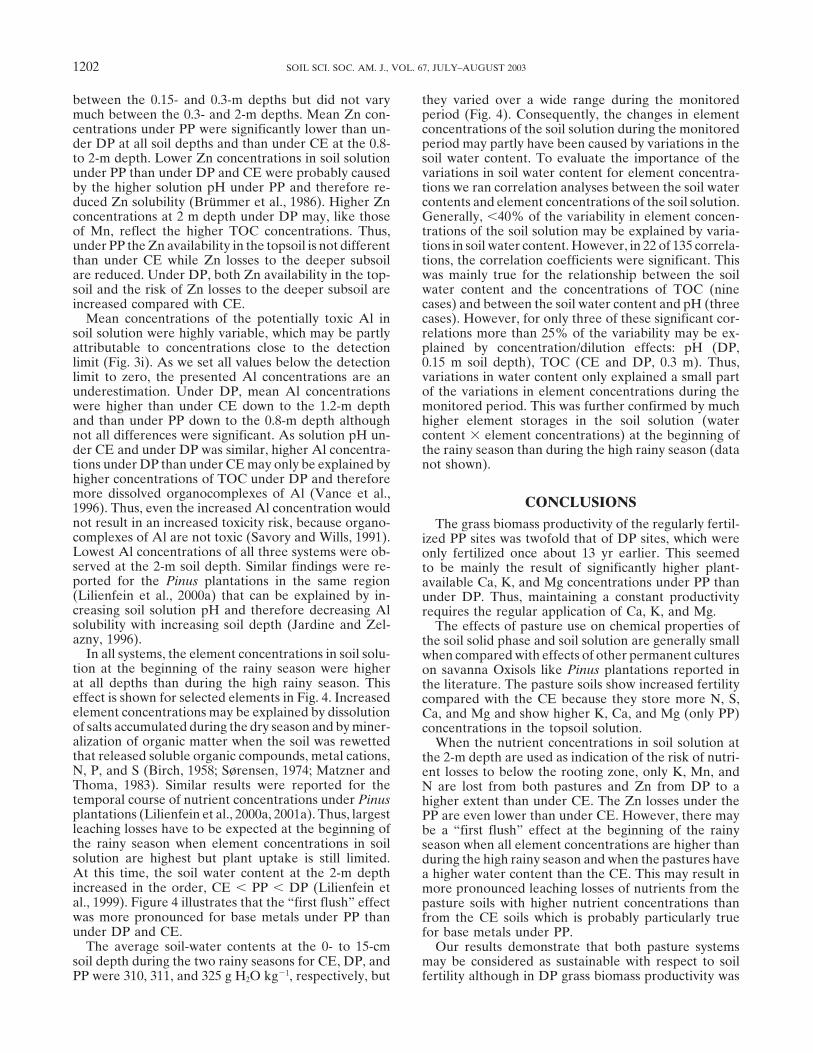
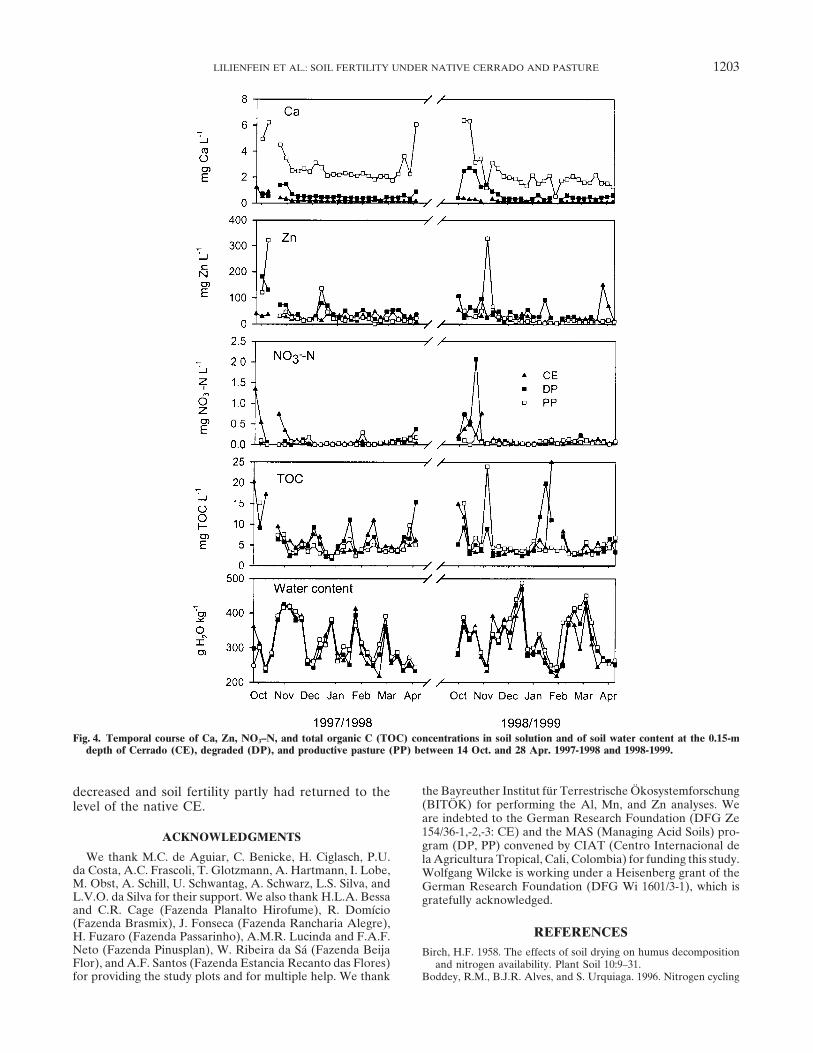
between the 0.15- and 0.3-m depths but did not vary they varied over a wide range during the monitoredperiod (Fig. 4). Consequently, the changes in elementmuch between the 0.3- and 2-m depths. Mean Zn con-
centrations under PP were significantly lower than un- concentrations of the soil solution during the monitoredperiod may partly have been caused by variations in theder DP at all soil depths and than under CE at the 0.8-
to 2-m depth. Lower Zn concentrations in soil solution soil water content. To evaluate the importance of thevariations in soil water content for element concentra-under PP than under DP and CE were probably caused
by the higher solution pH under PP and therefore re- tions we ran correlation analyses between the soil watercontents and element concentrations of the soil solution.duced Zn solubility (Brummer et al., 1986). Higher Zn
concentrations at 2 m depth under DP may, like those Generally, �40% of the variability in element concen-trations of the soil solution may be explained by varia-of Mn, reflect the higher TOC concentrations. Thus,
under PP the Zn availability in the topsoil is not different tions in soil water content. However, in 22 of 135 correla-tions, the correlation coefficients were significant. Thisthan under CE while Zn losses to the deeper subsoil
are reduced. Under DP, both Zn availability in the top- was mainly true for the relationship between the soilwater content and the concentrations of TOC (ninesoil and the risk of Zn losses to the deeper subsoil are
increased compared with CE. cases) and between the soil water content and pH (threecases). However, for only three of these significant cor-Mean concentrations of the potentially toxic Al in
soil solution were highly variable, which may be partly relations more than 25% of the variability may be ex-plained by concentration/dilution effects: pH (DP,attributable to concentrations close to the detection
limit (Fig. 3i). As we set all values below the detection 0.15 m soil depth), TOC (CE and DP, 0.3 m). Thus,variations in water content only explained a small partlimit to zero, the presented Al concentrations are an
underestimation. Under DP, mean Al concentrations of the variations in element concentrations during themonitored period. This was further confirmed by muchwere higher than under CE down to the 1.2-m depth
and than under PP down to the 0.8-m depth although higher element storages in the soil solution (watercontent element concentrations) at the beginning ofnot all differences were significant. As solution pH un-
der CE and under DP was similar, higher Al concentra- the rainy season than during the high rainy season (datanot shown).tions under DP than under CE may only be explained by
higher concentrations of TOC under DP and thereforemore dissolved organocomplexes of Al (Vance et al.,
CONCLUSIONS1996). Thus, even the increased Al concentration wouldnot result in an increased toxicity risk, because organo- The grass biomass productivity of the regularly fertil-complexes of Al are not toxic (Savory and Wills, 1991). ized PP sites was twofold that of DP sites, which wereLowest Al concentrations of all three systems were ob- only fertilized once about 13 yr earlier. This seemedserved at the 2-m soil depth. Similar findings were re- to be mainly the result of significantly higher plant-ported for the Pinus plantations in the same region available Ca, K, and Mg concentrations under PP than(Lilienfein et al., 2000a) that can be explained by in- under DP. Thus, maintaining a constant productivitycreasing soil solution pH and therefore decreasing Al requires the regular application of Ca, K, and Mg.solubility with increasing soil depth (Jardine and Zel- The effects of pasture use on chemical properties ofazny, 1996). the soil solid phase and soil solution are generally small
In all systems, the element concentrations in soil solu- when compared with effects of other permanent culturestion at the beginning of the rainy season were higher on savanna Oxisols like Pinus plantations reported inat all depths than during the high rainy season. This the literature. The pasture soils show increased fertilityeffect is shown for selected elements in Fig. 4. Increased compared with the CE because they store more N, S,element concentrations may be explained by dissolution Ca, and Mg and show higher K, Ca, and Mg (only PP)of salts accumulated during the dry season and by miner- concentrations in the topsoil solution.alization of organic matter when the soil was rewetted When the nutrient concentrations in soil solution atthat released soluble organic compounds, metal cations, the 2-m depth are used as indication of the risk of nutri-N, P, and S (Birch, 1958; Sørensen, 1974; Matzner and ent losses to below the rooting zone, only K, Mn, andThoma, 1983). Similar results were reported for the N are lost from both pastures and Zn from DP to atemporal course of nutrient concentrations under Pinus higher extent than under CE. The Zn losses under theplantations (Lilienfein et al., 2000a, 2001a). Thus, largest PP are even lower than under CE. However, there mayleaching losses have to be expected at the beginning of be a “first flush” effect at the beginning of the rainythe rainy season when element concentrations in soil season when all element concentrations are higher thansolution are highest but plant uptake is still limited. during the high rainy season and when the pastures haveAt this time, the soil water content at the 2-m depth a higher water content than the CE. This may result inincreased in the order, CE � PP � DP (Lilienfein et more pronounced leaching losses of nutrients from theal., 1999). Figure 4 illustrates that the “first flush” effect pasture soils with higher nutrient concentrations thanwas more pronounced for base metals under PP than from the CE soils which is probably particularly trueunder DP and CE. for base metals under PP.
The average soil-water contents at the 0- to 15-cm Our results demonstrate that both pasture systemssoil depth during the two rainy seasons for CE, DP, and may be considered as sustainable with respect to soil
fertility although in DP grass biomass productivity wasPP were 310, 311, and 325 g H2O kg�1, respectively, but
LILIENFEIN ET AL.: SOIL FERTILITY UNDER NATIVE CERRADO AND PASTURE 1203
Fig. 4. Temporal course of Ca, Zn, NO3–N, and total organic C (TOC) concentrations in soil solution and of soil water content at the 0.15-mdepth of Cerrado (CE), degraded (DP), and productive pasture (PP) between 14 Oct. and 28 Apr. 1997-1998 and 1998-1999.
the Bayreuther Institut fur Terrestrische Okosystemforschungdecreased and soil fertility partly had returned to the(BITOK) for performing the Al, Mn, and Zn analyses. Welevel of the native CE.are indebted to the German Research Foundation (DFG Ze154/36-1,-2,-3: CE) and the MAS (Managing Acid Soils) pro-ACKNOWLEDGMENTSgram (DP, PP) convened by CIAT (Centro Internacional de
We thank M.C. de Aguiar, C. Benicke, H. Ciglasch, P.U. la Agricultura Tropical, Cali, Colombia) for funding this study.da Costa, A.C. Frascoli, T. Glotzmann, A. Hartmann, I. Lobe, Wolfgang Wilcke is working under a Heisenberg grant of theM. Obst, A. Schill, U. Schwantag, A. Schwarz, L.S. Silva, and German Research Foundation (DFG Wi 1601/3-1), which isL.V.O. da Silva for their support. We also thank H.L.A. Bessa gratefully acknowledged.and C.R. Cage (Fazenda Planalto Hirofume), R. Domıcio(Fazenda Brasmix), J. Fonseca (Fazenda Rancharia Alegre),
REFERENCESH. Fuzaro (Fazenda Passarinho), A.M.R. Lucinda and F.A.F.Neto (Fazenda Pinusplan), W. Ribeira da Sa (Fazenda Beija Birch, H.F. 1958. The effects of soil drying on humus decompositionFlor), and A.F. Santos (Fazenda Estancia Recanto das Flores) and nitrogen availability. Plant Soil 10:9–31.
Boddey, R.M., B.J.R. Alves, and S. Urquiaga. 1996. Nitrogen cyclingfor providing the study plots and for multiple help. We thank
1204 SOIL SCI. SOC. AM. J., VOL. 67, JULY–AUGUST 2003
and sustainability of improved pastures in the Brazilian Cerrados. W. Zech. 2000a. Soil acidification in Pinus caribaea forests onBrazilian savanna Oxisols. For. Ecol. Manage. 128:145–157.p. 33–38. In R.C. Pereira and L.C.B. Nasser (ed.) Proc. 1st Interna-
tional Symposium on Tropical Savannas. Empresa Brasileira de Lilienfein, J., W. Wilcke, M.A. Ayarza, L. Vilela, S.d.C. Lima, andW. Zech. 2000b. Chemical fractionation of phosphorus, sulphur,Pesquisa Agropecuaria (EMBRAPA), Brasılia-DF, Brazil.
Brummer, G.W., J. Gerth, and U. Herms. 1986. Heavy metal species, and molybdenum in Brazilian savannah Oxisols under differentland use. Geoderma 96:31–46.mobility, and availability in soils. Z. Pflanzenernahr. Bodenkd.
149:382–398. Lilienfein, J., W. Wilcke, L. Vilela, S.d.C. Lima, R. Thomas, and W.Zech. 2001a. Effects of Pinus caribaea plantations on the C, N, P,Cadisch, G., R.M. Schunke, and K.E. Giller. 1994. Nitrogen cycling
in a pure grass pasture and a grass-legume mixture on a red latosol and S status of Brazilian savanna Oxisols. For. Ecol. Manage.147:171–182.in Brazil. Trop. Grasslands 28:43–52.
Cahn, M.D., D.R. Bouldin, and M.S. Cravo. 1992. Nitrate sorption Lilienfein, J., W. Wilcke, R. Zimmermann, P. Gerstberger, G.M. Ara-ujo, and W. Zech. 2001b. Nutrient storage in soil and biomass ofin the profile of an acid soil. Plant Soil 143:179–183.
Cerri, C.C., B. Volkoff, and F. Andreaux. 1991. Nature and behaviour native Brazilian Cerrado. J. Plant Nutr. Soil Sci. 164:487–495.Lopes, A., M. Ayarza, and R. Thomas. 1999. Sistemas agropastorilesof organic matter in soils under natural forest, and after deforesta-
tion, burning, and cultivation, near Manaus. For. Ecol. Manage. en las sabanas de America Latina tropical: Lecciones del desarolloagrıcola de los Cerrados de Brasil. (In Spanish.) p. 9–30. In E.P.38:247–257.
Currie, W.S., J.D. Aber, W.H. McDowell, R.D. Boone, and A.H. Guimaraes et al. (ed.) Sistemas agropastoriles en sabanas tropicalesde America Latina. Centro Internacional de Agricultura TropicalMagill. 1996. Vertical transport of dissolved organic N and C under
long-term amendments in Pine and hardwood forests. Bio- (CIAT), Cali, Colombia and Empresa Brasileira de Pesquisa Agro-pecuaria (EMBRAPA), Brasılia-DF, Brazil.geochemistry 35:471–506.
Davis, J.A. 1982. Adsorption of natural organic matter at the oxide/ Matzner, E., and E. Thoma. 1983. Auswirkungen eines saisonalenVersauerungsschubes im Sommer/Herbst auf den chemischen Bo-water interface. Geochim. Cosmochim. Acta 46:2381–2393.
Driessen, P.M., and R. Dudal. 1989. Lecture notes on the major soils denzustand verschiedener Waldokosysteme. (In German.) Allg.Forstz. 39:677–683.of the world. Agricultural University Wageningen, The Nether-
lands, and Catholic University Leuven, Belgium. McKnight, D.M., K.E. Bencala, G.W. Zellweger, G.R. Aiken, G.L.Feder, and K.A. Thorn. 1992. Sorption of dissolved organic carbonEden, M.J., P.A. Furley, D.F.M. McGregor, W. Miliken, and J.A.
Ratter. 1991. Effect of forest clearance and burning on soil proper- by hydrous aluminum and iron oxides occurring at the confluenceof Deer Creek with Snake River, Summit County. Colorado. Envi-ties in northern Roraima, Brazil. For. Ecol. Manage. 38:283–290.
Feigl, B.J., J. Melillo, and C.C. Cerri. 1995. Changes in the origin ron. Sci. Technol. 26:1388–1396.Morais, F.I., A.L. Page, and L.J. Lund. 1976. The effect of pH, saltand quality of soil organic matter after pasture introduction in
Rondonia (Brazil). Plant Soil 175:21–29. concentration, and nature of electrolytes on the charge characteris-tics of Brazilian tropical soils. Soil Sci. Soc. Am. J. 40:521–527.Friesen, D.K., I.M. Rao, R.J. Thomas, A. Oberson, and J.I. Sanz. 1997.
Phosphorus acquisition and cycling in crop and pasture systems in Nepstad, D.C., C.R. de Carvalho, E.A. Davidson, P.H. Jipp, P.A.Lefebvre, Gustavo H. Negreiros, E.D da Silva, T.A. Stone, S.E.low fertility tropical soils. Plant Soil 196:289–294.
Goedert, W.J. 1983. Management of the Cerrado soils in Brazil: A Trumbore, and S. Vieira. 1994. The role of deep roots in the hydro-logical and carbon cycles of Amazonian forests and pastures. Na-review. J. Soil Sci. 34:405–428.
Gu, B., J. Schmitt, Z. Chen, L. Liang, and J.F. McCarthy. 1994. Adsorp- ture 372:666–669.Neufeldt, H. 1998. Land-use effects on soil chemical and physicaltion and desorption of natural organic matter on iron oxide: Mecha-
nisms and models. Environ. Sci. Technol. 28:38–46. properties of Cerrado Oxisols. Bayreuther Bodenkundliche Be-richte 59. Institute of Soil Science and Soil Geography, UniversityHartung, J. 1989. Statistik. (In German.) Oldenbourg-Verlag, Mun-
chen, Germany. of Bayreuth, Bayreuth, Germany.Resck, D.V.S., C.A. Vasconsellos, L. Vilela, and M.C.M. Macedo.Hartung, J., and B. Elpelt. 1989. Multivariate Statistik. (In German.)
Oldenbourg-Verlag, Munchen, Germany. 2000. Impact of conversion of Brazilian Cerrados to cropland andpastureland on soil carbon pool and dynamics. p. 169–196. In R.Holmgren, G.G.S. 1967. A rapid citrate-dithionite-extractable iron
procedure. Soil Sci. Soc. Am. Proc. 31:210–211. Lal, J.M. Kimble, and B.A. Stewart (ed.) Global climate changeand tropical ecosystems. Adv. Soil Sci., CRC Press, Boca Raton, FL.Holscher, D. 1995. Wasser- und Stoffhaushalt eines Agrarokosystems
mit Waldbrache im ostlichen Amazonasgebiet. (In German.) Got- Rosa, R., S.d.C. Lima, and W.A. Assuncao. 1991. Abordagem prelimi-nar das condicoes climaticas de Uberlandia (MG). (In Portuguese.)tinger Beitrage zur Land-und Forstwirtschaft in den Tropen und
Subtropen 106:134. Federal University of Uberlandia, Uberlandia, Brazil. Sociedadee Natureza 3:91–108.Jardine, P.M., and L.W. Zelazny. 1996. Surface reactions of aqueous
aluminum species. p. 221–270. In G. Sposito (ed.) The environmen- Sarmiento, G. 1984. The ecology of neotropical savannas. HarvardUniversity Press. Cambridge.tal chemistry of aluminum. CRC Press, New York.
Jordan, C.F. 1982. The nutrient balance of an Amazonian rain forest. Savory, J., and M.R. Wills. 1991. Aluminum. p. 715–741. In E. Merian(ed.) Metals and their compounds in the environment. VCH, Wein-Ecology 63:647–654.
Kalbitz, K., S. Solinger, J.H. Park, B. Michalzik, and E. Matzner. heim, Germany.Schroth, G., L.F.d. Silva, R. Seixas, W.G. Teixeira, J.L.V. Macedo,2000. Controls on the dynamics of dissolved organic matter in soils:
A review. Soil Sci. 165:277–304. and W. Zech. 1999. Subsoil accumulation of mineral nitrogen underpolyculture and monoculture, fallow, and primary forest in a ferrali-Kornelius, E., M.G. Saueressig, and W.J. Goedert. 1979. Pastures
establishment and management in the Cerrado of Brazil. p. 147– tic Amazonian upland soil. Agric. Ecosyst. Environ. 1467:1–12.Schwertmann, U. 1964. Differenzierung der Eisenoxide des Bodens175. In P.A. Sanchez and L.E. Tergas (ed.) Pasture production in
acid soils of the tropics. Centro Internacional de Agricultura Tropi- durch Extraktion mit Ammoniumoxalat-Losung. (In German, withEnglish abstract.) Z. Pflanzenernahr. Dung. Bodenkd. 105:194–202.cal (CIAT), Cali, Columbia.
Koutika, L.-S., F. Bartoli, F. Andreux, C.C. Cerri, G. Burtin, T. Chone, Soil Survey Staff. 1997. Keys to Soil Taxonomy, 7th ed. SMSS technicalmonograph No. 19, Pocahontas Press, Blacksburg, VA.and R. Philippy. 1997. Organic matter dynamics and aggregation
in soils under rain forest and pastures of increasing age in the Sørensen, L.H. 1974. Rate of decomposition of organic matter insoil as influenced by repeated air drying-rewetting and repeatedeastern Amazon basin. Geoderma 76:87–112.
Lilienfein, J., W. Wilcke, H. Neufeldt, M.A. Ayarza, and W. Zech. additions of organic material. Soil Biol. Biochem. 6:287–292.Spain, J.M., M.A. Ayarza, and L. Vilela. 1996. Crop pasture rotations1998. Land-use effects on organic carbon, nitrogen, and sulphur
concentrations in macroaggregates of differently textured Brazilian in the Brazilian Cerrados. p. 39–45. In R.C. Pereira and L.C.B.Nasser (ed.) Proc. 1st International Symposium on Tropical Savan-Oxisols. Z. Pflanzenernahr. Bodenkd. 161:165–171.
Lilienfein, J., W. Wilcke, M.A. Ayarza, S.d.C. Lima, L. Vilela, and nas. Empresa Brasileira de Pesquisa Agropecuaria (EMBRAPA),Brasılia-DF, Brazil.W. Zech. 1999. Annual course of matric potential in differently
used savanna Oxisols in Brazil. Soil Sci. Soc. Am. J. 63:1778–1785. Steinhardt, U. 1979. Untersuchungen uber den Wasser- und Nahrstoff-haushalt eines andinen Wolkenwaldes in Venezuela. (In German.)Lilienfein, J., W. Wilcke, M.A. Ayarza, L. Vilela, S.d.C. Lima, and
LILIENFEIN ET AL.: SOIL FERTILITY UNDER NATIVE CERRADO AND PASTURE 1205
Gottinger Bodenkundliche Berichte 56, University of Gottingen, following forest cutting and burning in Amazonia. Ecology65:1476–1490.Germany.
Ulrich, B. 1981. Okologische Gruppierung von Boden nach ihremSumner, M.E., and W.P. Miller. 1996. Cation-exchange capacity andchemischen Bodenzustand. (In German, with English abstract.) Z.exchange coefficients. p. 1201–1229. In D.L Sparks et al. (ed.)Pflanzenernahr. Bodenkd. 144:289–305.Methods of Soil Analysis. Part 3. SSSA Book Ser. 5. SSSA, Madi-
Vance, G.F., F.J. Stevenson, and F.J. Sikora. 1996. Environmentalson, WI. chemistry of aluminum-organic complexes. p. 169–220. In G. Spo-Tiessen, H., and J.O. Moir. 1993. Characterization of available P by sito (ed.) The environmental chemistry of aluminum. Lewis Pub-
sequential extraction. p. 75–86. In M.R. Carter (ed.) Soil sampling lishers, Boca Raton, FL.and methods of analysis. CRC Press, Boca Raton, FL. Whiteman, P.C., S.A. Waring, E.S. Wallis, and L.C. Bruce. 1980.
Tropical pasture science. Oxford University Press, New York.Uhl, C., and C.F. Jordan. 1984. Succession and nutrient dynamics


