Embed Size (px)
Citation preview

Soft X-Ray Diffraction Microscopy of a Frozen Hydrated Yeast Cell
Xiaojing Huang1, Johanna Nelson1, Janos Kirz1,2, Enju Lima1, Stefano Marchesini2, HuijieMiao1, Aaron M. Neiman3, David Shapiro2, Jan Steinbrener1, Andrew Stewart1, Joshua J.Turner1, and Chris Jacobsen1,*1 Department of Physics & Astronomy, Stony Brook University, Stony Brook, New York 11794-3800,USA2 Advanced Light Source, Lawrence Berkeley National Laboratory, Berkeley, California 94720, USA3 Department of Biochemistry & Cell Biology, Stony Brook University, Stony Brook, New York11794-5215, USA
AbstractWe report the first image of an intact, frozen hydrated eukaryotic cell using x-ray diffractionmicroscopy, or coherent x-ray diffraction imaging. By plunge freezing the specimen in liquid ethaneand maintaining it below −170 °C, artifacts due to dehydration, ice crystallization, and radiationdamage are greatly reduced. In this example, coherent diffraction data using 520 eV x rays wererecorded and reconstructed to reveal a budding yeast cell at a resolution better than 25 nm. Thisdemonstration represents an important step towards high resolution imaging of cells in their natural,hydrated state, without limitations imposed by x-ray optics.
X-ray microscopes allow high resolution microscopy of intact, hydrated biological specimenswith thicknesses of many micrometers, beyond the limit of biological electron microscopy[1–3]. Radiation damage precludes repeated imaging of live specimens [4], but this can bemitigated by working at liquid nitrogen temperature [5,6]. In addition, single view flashimaging of cells using ultrabright sources has been proposed [7,8] as a way of capturing theimage before radiolytical and thermal damage become evident.
In recent years, there has been much progress in developing zone plate microscopy for 3Dimaging of frozen hydrated cells [9–13]. While there are demonstrations of x-ray optics withhigher resolution [14–16], scientific applications using x-ray microscopes have mainly usedFresnel zone plate optics with 25–40 nm spatial resolution. These optics typically have afocusing efficiency in the 10% range [17] and the modulation transfer function for incoherentbright field imaging decreases the efficiency of utilization of higher spatial frequencyinformation. As a result, while the practical advantages of lens-based microscopes will be thedeciding factor for most studies, it is also worthwhile to consider alternative methods for highresolution x-ray imaging.
X-ray diffraction microscopy (XDM), also called coherent x-ray diffraction imaging, wasproposed by Sayre as an imaging method that dispenses with the technological limits of lensefficiency and resolution [18]. Instead, the far-field diffraction pattern of an isolated objectilluminated by a coherent x-ray beam is recorded. If the object is finite, and the diffractionpattern is sampled finely enough, the object can be reconstructed from the measured diffractionintensities alone [19,20]. In this manner one is able to eliminate limitations due to the efficiencyand finite numerical aperture of x-ray optics [21]. Following a first demonstration by Miao et
NIH Public AccessAuthor ManuscriptPhys Rev Lett. Author manuscript; available in PMC 2010 May 11.
Published in final edited form as:Phys Rev Lett. 2009 November 6; 103(19): 198101.
NIH
-PA Author Manuscript
NIH
-PA Author Manuscript
NIH
-PA Author Manuscript
al. of imaging a nanofabricated test object [22], this and related approaches have been used bya growing number of groups, including demonstrations of imaging bacteria [23], yeast [24],herpes virions [25], malaria-infected erythrocytes [26], and chromosomes in 2D and 3D [27].
An important limitation applies to the demonstrations of x-ray diffraction microscopy of cells,chromosomes, and virions cited above: they have all involved dehydrated specimens at roomtemperature. Though Nishino et al. [27] have obtained a very exciting 3D XDM image of adehydrated chromosome, they note significant resolution degradation due to accumulatedradiation dose. In electron microscopy, stability against radiation damage has long been solvedby imaging the specimen at cryogenic temperatures [28–30]. Electron microscopy studies offixed and dried versus frozen hydrated blood platelets [31] reveal tremendous differences instructural preservation. However, because of the thickness limitations of electron microscopyon frozen hydrated specimens [1–3], to our knowledge only thin, peripheral regions of whole,unsectioned eukaryotic cells have been imaged in a frozen hydrated state using electronmicroscopy [32,33].
The benefits of cryo methods for XDM have been shown in studies by Shapiro [34] whichdemonstrate remarkable stability of the diffraction pattern out to doses well beyond the doseimparted in the work reported here (Fig. 1). In comparison, substantial specimen shrinkagewas observed at room temperature. Two separate groups have estimated that cryo XDM hasthe potential to deliver sub-10 nm resolution 3D images of whole hydrated cells within thelimits of radiation damage [35,36]. As an important step towards realizing this milestone, wereport here the first use of x-ray diffraction microscopy to image a whole, unfixed, frozenhydrated eukaryotic cell.
The strain of Saccharomyces cerevisiae studied here carries a whi5 mutation. This mutation[37] produces smaller yeast cells than the wild type (3–4 μm for whi5 versus 6–7 μm for wildtype). Following culture in a YPD solution at 30 °C, cells were rinsed and diluted with distilledwater to proper concentration, and allowed to settle on a formvar coated rectangular electronmicroscope grid. The cells were plunge-frozen in liquid ethane to minimize ice crystalformation (we did not use glycerol or other cryo protectants, though they may be helpful infuture work). Frozen hydrated specimen grids were loaded into a Gatan 630 side-entry cryospecimen holder which was then inserted into a goniometer stage in a custom-built XDMsystem [38] where specimens can be viewed in a frozen hydrated state at −170 °C.
In order to reconstruct an image from far-field or Fraunhofer coherent diffraction intensities,one must be able to supply some a priori information; in most cases this involves knowledgethat the specimen occupies only a fraction 1/σo (where σo is known as the oversampling ratio)of the field of view corresponding to the recorded diffraction pattern [19,20]. When imagingfrozen hydrated cells, this means that the cells must be surrounded by a region of sufficientlysmooth ice so as not to produce significant x-ray scattering. In order to approach this condition,considerable care had to be taken to minimize frosting of the grid.
Apart from the fact that the specimen was in a frozen hydrated state, the diffraction data wereacquired in a manner similar to what we have described previously for studies of freeze-driedyeast cells [24]. A zone plate monochromator [39] was used at undulator beam line 9.0.1 ofthe Advanced Light Source at Lawrence Berkeley National Laboratory to deliver a 520 eV x-ray beam to the experimental apparatus [38]. By using a 5 μm pinhole located 25 mm upstreamof the specimen, we were able to provide illumination with both sufficient spatial coherence[40], and the required temporal coherence of λ/Δλ ≃ 500. By working at 520 eV, we were ableto take advantage of the “water window” spectral region with low absorption in water and goodcontrast for organic materials [1,41]. For this particular specimen, photodiode measurementsof the transmitted flux through the ice near the cell, versus measurements of the incident flux
Huang et al. Page 2
Phys Rev Lett. Author manuscript; available in PMC 2010 May 11.
NIH
-PA Author Manuscript
NIH
-PA Author Manuscript
NIH
-PA Author Manuscript
with the specimen removed, indicate a transmission through the ice of about 90%,corresponding to an ice thickness of about 1 μm. Diffraction data were recorded on a RoperScientific (Trenton, NJ) MTE-2 in-vacuum CCD detector with 1340 × 1300 pixels of 20 μmsize each, located 17.5 cm downstream of the specimen. By using a movable beamstop andmultiple summed recordings, we were able to record x-ray diffraction data over a large dynamicrange spanning 5 orders of magnitude; however, we were not able to collect data from abouta 20 × 20 pixel region at the center of the diffraction pattern due to detector saturation limits.The full 2D data set was assembled from 120 exposures with a total illumination time of 215sec and an estimated total dose to the specimen of about 1.7 × 10⁸ Gray.
For diffraction data analysis and image reconstruction, a 1100 × 1100 array was extracted fromthe assembled set of diffraction recordings. The assembled diffraction pattern extends to 37μm−1 spatial frequency at corners, which corresponds to a half-period size of 14 nm. The pixelsize of the real space image reconstruction array is about 17 nm. Once the tight support wasfound by the shrink wrap algorithm [42] and manual adjustments, the final result was obtainedby averaging a total of 10 reconstructions from independent random phase starts. Each of thesereconstructions was run for 104 iterations using the difference map algorithm [43], averagingevery 20th iteration after the first 8000 iterations.
The right side of Fig. 2 shows the reconstructed complex image of a frozen hydrated yeast cellobtained using the method described above. For reference, a visible light micrograph of abudding yeast is also shown (obtained using a a Zeiss Axioplan2 microscope with a 100 ×, NA= 1.3 immersion objective with DIC optics, and a mRM Axiocam with Zeiss AXIOVISION7.1 software). In the x-ray diffraction micrograph, we see what appears to be two cell bodieslying on top of each other. Since this inner cell body is too large to be a nucleus in this celltype, we believe that the image shows a new-born bud produced as part of the division processin these cells, viewed from directly above the bud with the parent cell underneath (see theassumed illuminating beam orientation in Fig. 2 as indicated by the black arrow). We have alsocollected a limited data set with the sample rotated at 15°. While we have not obtained areconstructed image from this data set (possibly due to ice scattering, as discussed below), itprovides useful autocorrelation data (obtained by squaring the Fourier transform of therecorded data intensities and applying a high-pass Fourier filter to the result) [44]. Theautocorrelation agrees well with expectations for a budding yeast cell viewed in the assumedorientation. Additional evidence is available by “focusing through” the reconstructed image.Since we have reconstructed a complex wave field at a depth plane where the outermost edgesof the object within its support are sharpest [45,46], we are able to use Fresnel propagation togenerate the reconstructed wave field at nearby depth planes. In Fig. 3 we show a series oftransverse (abscissa) versus longitudinal (ordinate) “images” of this through-focus procedure,where one can see sharp edges at depth planes that are separated by about 2.5 μm.
The reconstructed x-ray diffraction micrograph shown in Fig. 2 does not have the sameresolution or degree of image contrast as we have been able to demonstrate when imagingfreeze-dried yeast [24]; we attribute this to the fact that the ice layer outside the cell iscontributing some weak scattering which slightly violates the conditions required forimposition of a finite support constraint [47]. As the experiment proceeded, ice buildupcontinued which precluded reconstruction at additional tilt angles; this limitation is beingaddressed for future experiments through improved vacuum conditions and the use of anelectron-microscope-type anticontaminator [48]. In spite of these limitations in our first frozenhydrated XDM demonstration, we are able to recognize subcelluar features including whatmay be a mitochondrion in the parent cell (indicated by the red arrow in Fig. 2).
The resolution can be estimated to 25 nm or better using two independent measures. While thediffraction data extend to the edge of our CCD detector at a spatial frequency of 37 μm−1, we
Huang et al. Page 3
Phys Rev Lett. Author manuscript; available in PMC 2010 May 11.
NIH
-PA Author Manuscript
NIH
-PA Author Manuscript
NIH
-PA Author Manuscript
do not claim this as representing the resolution of our reconstructed image. Instead, themagnitude ratio Mrecon/Mdata (known as the phase retrieval transfer function or PRTF [24,45,49]) provides a good metric of the resolution of the reconstructed image. It does so by measuringthe reproducibility of the phases recovered in the Fourier plane as the iterative reconstructionproceeds; phases that are reproducible lead to constructive interference when complex iteratesare added together, while less reproducible phases lead to a lower value in the average. Thespatial-frequency-dependent magnitude ratio Mrecon/Mdata plot is shown at left in Fig. 4. Theresolution cutoff is estimated at the spatial frequency where the PRTF drops below a value of0.6. This provides one estimate of the half-period resolution of 20 nm for the reconstructed x-ray diffraction micrograph.
Another measure of the resolution can be obtained by looking at the minimum width of featuresin the reconstructed image. Since the appearance of features in the image represents aconvolution of their true shape with the point spread function of the imaging system, thismeasure is imperfect. Even so, in Fig. 4 we show a plot of the reconstructed intensity across aline in its in-focus plane, along with a Gaussian fit to the sharp feature seen. The Gaussian fitexp[−0.5x2/σ2] has σ = 21 nm, again indicating that a high resolution image was obtained.
The data reported here represent the first use of x-ray diffraction microscopy to image a frozenhydrated eukaryotic cell. It was obtained using a beam line and apparatus that is far fromoptimal for this purpose. Based on this experience we are now implementing improvementsaimed at improving the apparatus, to be able to move from 2D to 3D imaging. We are alsoplanning to construct an optimized beam line that will provide the required coherent flux toallow routine collection of a 3D data set in minutes, rather than hours. While x-ray free electronlaser sources will also open up exciting new opportunities in XDM [8,50], for true 3D imagingit is necessary to acquire data from an object that remains unchanged as it is rotated so that onecan populate 3D Fourier space [49,51]; this means the exposure in each 2D view must bedelivered slowly so that the temperature of the specimen does not rise. For this reason, we feelthat cryo XDM of frozen hydrated whole cells using synchrotron sources has considerablepotential.
AcknowledgmentsWe wish to thank the National Institute for General Medical Services at the National Institutes for Health for supportof the application of XDM to biological imaging under Contract No. 5R21EB6134. We also wish to thank the Divisionof Materials Sciences and Engineering, Office of Basic Energy Sciences, at the Department of Energy for support ofXDM methods and instrumentation development under Contract No. DE-FG02-07ER46128. We thank the ALS stafffor their excellent support. The ALS is supported by the Director, Office of Science, Office of Basic Energy Sciences,of the U.S. Department of Energy under Contract No. DE-AC02-05CH11231. Finally, we thank David Sayre forhelpful suggestions and discussions, and thank Ken Downing and Eva Nogales for their help with specimen freezing.
References1. Sayre D, et al. Science 1977;196:1339. [PubMed: 867033]2. Grimm R, et al. Biophys J 1997;72:482. [PubMed: 8994635]3. Jacobsen, C., et al. X-ray Microscopy and Spectromicroscopy. Thieme, J., et al., editors. Vol. II.
Springer-Verlag; Berlin: 1998. p. 93-102.4. Kirz J, et al. Q Rev Biophys 1995;28:33. [PubMed: 7676009]5. Schneider G. Ultramicroscopy 1998;75:85. [PubMed: 9836467]6. Maser J, et al. J Microsc 2000;197:68. [PubMed: 10620150]7. Solem JC, Baldwin GC. Science 1982;218:229. [PubMed: 17838608]8. Bergh M, et al. Q Rev Biophys 2008;41:181. [PubMed: 19079804]9. Wang Y, et al. J Microsc 2000;197:80. [PubMed: 10620151]10. Weiß D, et al. Ultramicroscopy 2000;84:185. [PubMed: 10945329]
Huang et al. Page 4
Phys Rev Lett. Author manuscript; available in PMC 2010 May 11.
NIH
-PA Author Manuscript
NIH
-PA Author Manuscript
NIH
-PA Author Manuscript

11. Schneider G, et al. Surf Rev Lett 2002;9:177.12. Larabell C, Le Gros M. Mol Biol Cell 2004;15:957. [PubMed: 14699066]13. Parkinson D, et al. J Struct Biol 2008;162:380. [PubMed: 18387313]14. Chao W, et al. Nature (London) 2005;435:1210. [PubMed: 15988520]15. Jefimovs K, et al. Phys Rev Lett 2007;99:264801. [PubMed: 18233580]16. Kang H, et al. Appl Phys Lett 2008;92:221114.17. Kirz J. J Opt Soc Am 1974;64:301.18. Sayre, D. Imaging Processes and Coherence in Physics. Schlenker, M., et al., editors. Springer-Verlag;
Berlin: 1980. p. 229-235.19. Fienup J. Opt Lett 1978;3:27. [PubMed: 19684685]20. Miao J, et al. J Opt Soc Am A 1998;15:1662.21. Huang X, et al. Opt Express 2009;17:13541. [PubMed: 19654762]22. Miao J, et al. Nature (London) 1999;400:342.23. Miao J, et al. Proc Natl Acad Sci USA 2003;100:110. [PubMed: 12518059]24. Shapiro D, et al. Proc Natl Acad Sci USA 2005;102(15):343. [PubMed: 15625105]25. Song C, et al. Phys Rev Lett 2008;101:158101. [PubMed: 18999646]26. Williams G, et al. Cytometry Part A 2008;73a:949.27. Nishino Y, et al. Phys Rev Lett 2009;102:018101. [PubMed: 19257243]28. Taylor K, Glaeser R. Science 1974;186:1036. [PubMed: 4469695]29. Taylor K, Glaeser R. J Ultrastruct Res 1976;55:448. [PubMed: 933264]30. Steinbrecht, RA.; Zierold, K., editors. Cryotechniques in Biological Electron Microscopy. Springer-
Verlag; Berlin: 1987.31. O’Toole E, et al. J Struct Biol 1993;110:55. [PubMed: 8494672]32. Medalia O, et al. Science 2002;298:1209. [PubMed: 12424373]33. Lučić V, et al. J Struct Biol 2007;160:146. [PubMed: 17905597]34. Shapiro, D. PhD thesis. Stony Brook University; 2004.35. Shen Q, et al. J Synchrotron Radiat 2004;11:432. [PubMed: 15310961]36. Howells M, et al. J Electron Spectrosc Relat Phenom 2009;170:4.37. Tyers M, et al. EMBO J 1993;12:1955. [PubMed: 8387915]38. Beetz T, et al. Nucl Instrum Methods Phys Res, Sect A 2005;545:459.39. Howells, M., et al. Design and Microfabrication of Novel X-Ray Optics. Mancini, D., editor. Vol.
4783. SPIE; Bellingham, WA: 2002. p. 65-73.40. Miao, H. PhD thesis. Stony Brook University; 2008.41. Wolter H. Ann Phys (Leipzig) 1952;10:94.42. Marchesini S, et al. Phys Rev B 2003;68:140101.43. Elser V. J Opt Soc Am A 2003;20:40.44. See EPAPS Document No. E-PRLTAO-103-029941 for supplementary autocorrelation figures. For
more information on EPAPS, see http://www.aip.org/pubservs/epaps.html.45. Thibault P, et al. Acta Crystallogr Sect A 2006;62:248. [PubMed: 16788265]46. Spence J, et al. Phil Trans R Soc A 2002;360:875. [PubMed: 12804284]47. Miao H, et al. J Phys Conf Ser 2009;186:012055.48. Cheng A, et al. J Struct Biol 2006;154:303. [PubMed: 16632377]49. Chapman H, et al. J Opt Soc Am A 2006;23:1179.50. Chapman H, et al. Nature Phys 2006;2:839.51. Miao J, et al. Phys Rev Lett 2002;89:088303. [PubMed: 12190506]
Huang et al. Page 5
Phys Rev Lett. Author manuscript; available in PMC 2010 May 11.
NIH
-PA Author Manuscript
NIH
-PA Author Manuscript
NIH
-PA Author Manuscript
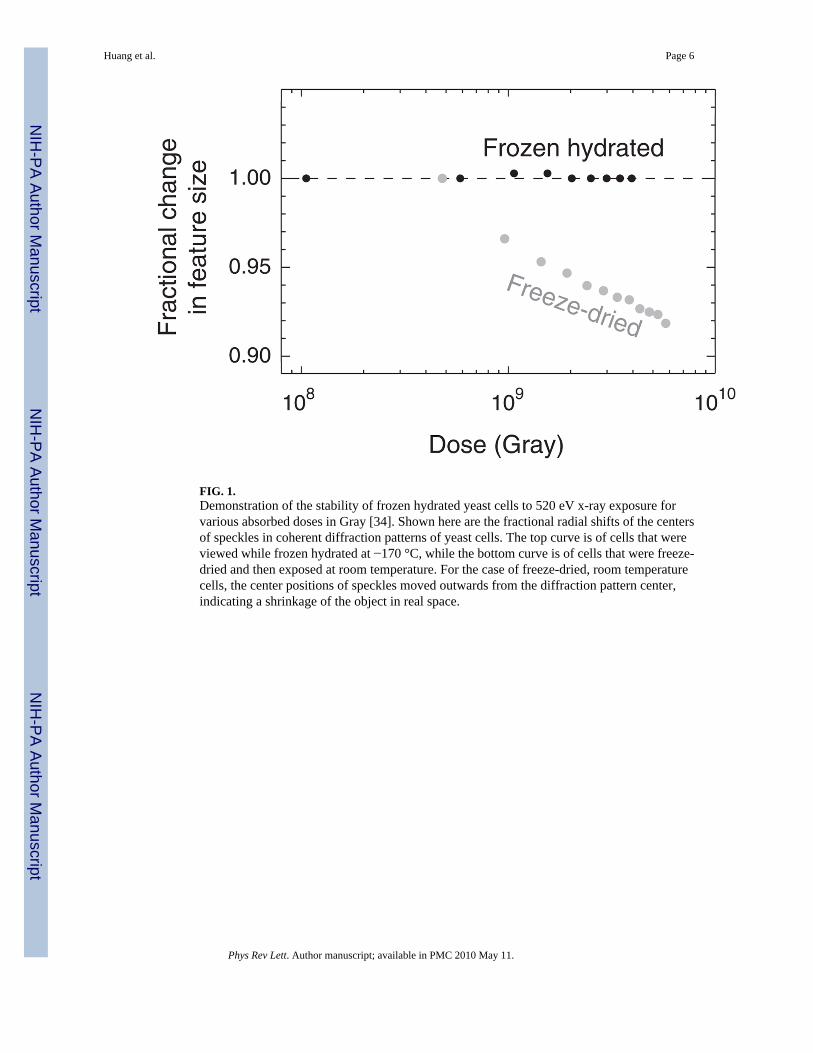
FIG. 1.Demonstration of the stability of frozen hydrated yeast cells to 520 eV x-ray exposure forvarious absorbed doses in Gray [34]. Shown here are the fractional radial shifts of the centersof speckles in coherent diffraction patterns of yeast cells. The top curve is of cells that wereviewed while frozen hydrated at −170 °C, while the bottom curve is of cells that were freeze-dried and then exposed at room temperature. For the case of freeze-dried, room temperaturecells, the center positions of speckles moved outwards from the diffraction pattern center,indicating a shrinkage of the object in real space.
Huang et al. Page 6
Phys Rev Lett. Author manuscript; available in PMC 2010 May 11.
NIH
-PA Author Manuscript
NIH
-PA Author Manuscript
NIH
-PA Author Manuscript
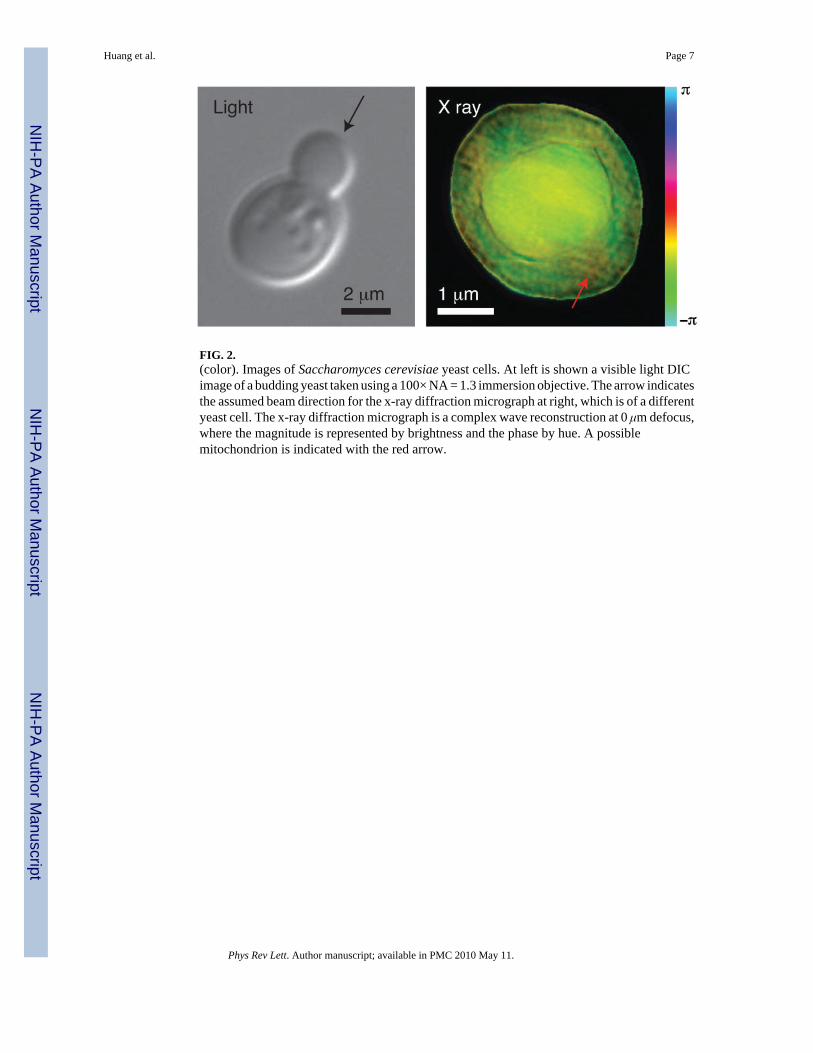
FIG. 2.(color). Images of Saccharomyces cerevisiae yeast cells. At left is shown a visible light DICimage of a budding yeast taken using a 100× NA = 1.3 immersion objective. The arrow indicatesthe assumed beam direction for the x-ray diffraction micrograph at right, which is of a differentyeast cell. The x-ray diffraction micrograph is a complex wave reconstruction at 0 μm defocus,where the magnitude is represented by brightness and the phase by hue. A possiblemitochondrion is indicated with the red arrow.
Huang et al. Page 7
Phys Rev Lett. Author manuscript; available in PMC 2010 May 11.
NIH
-PA Author Manuscript
NIH
-PA Author Manuscript
NIH
-PA Author Manuscript
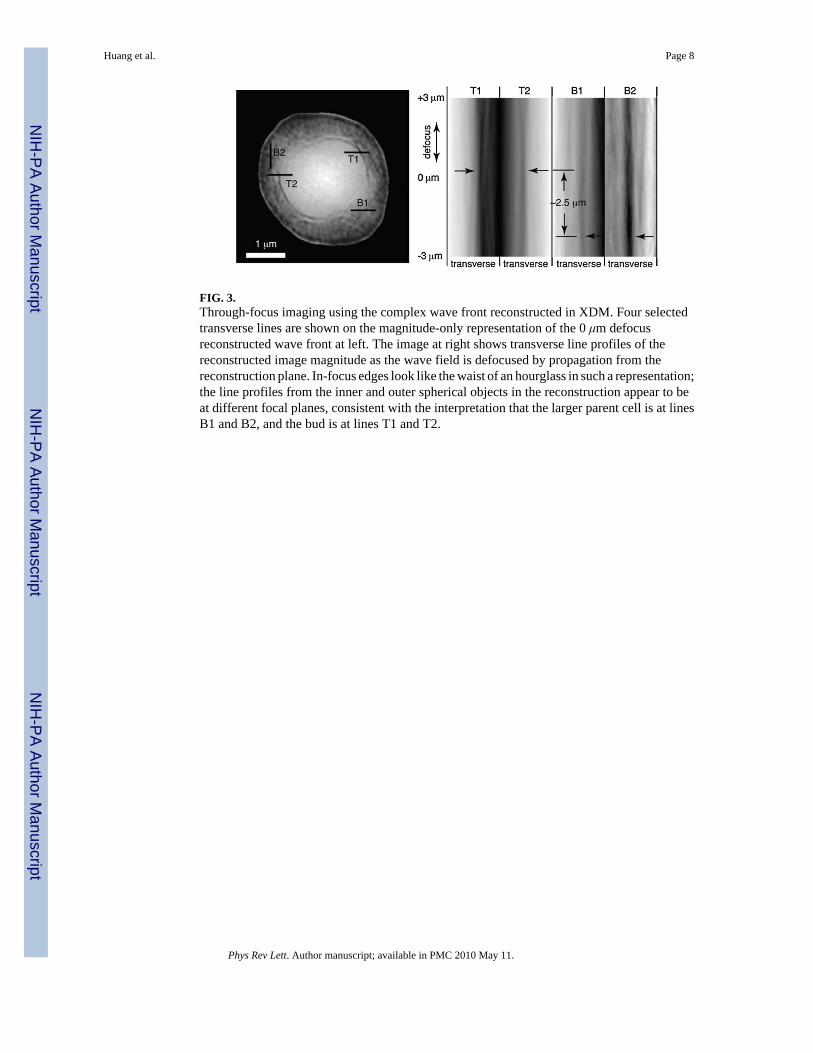
FIG. 3.Through-focus imaging using the complex wave front reconstructed in XDM. Four selectedtransverse lines are shown on the magnitude-only representation of the 0 μm defocusreconstructed wave front at left. The image at right shows transverse line profiles of thereconstructed image magnitude as the wave field is defocused by propagation from thereconstruction plane. In-focus edges look like the waist of an hourglass in such a representation;the line profiles from the inner and outer spherical objects in the reconstruction appear to beat different focal planes, consistent with the interpretation that the larger parent cell is at linesB1 and B2, and the bud is at lines T1 and T2.
Huang et al. Page 8
Phys Rev Lett. Author manuscript; available in PMC 2010 May 11.
NIH
-PA Author Manuscript
NIH
-PA Author Manuscript
NIH
-PA Author Manuscript

FIG. 4.(color). Estimation of the resolution of the x-ray diffraction micrograph. At top is shown boththe azimuthal average of the diffraction intensity signal Idata (red), and the magnitude ratio (orPRTF) Mrecon/Mdata (black). The PRTF measures the reproducibility of reconstructed pixelvalues as a function of spatial frequency; its decline at higher frequency provides an indicationof the resolution. The resolution cutoff is estimated at the spatial frequency where the PRTFdrops below a value of 0.6. This provides one estimate of the half-period resolution of 20 nm.At bottom is shown a line scan across T2 in Fig. 3 at the plane of sharpest focus of this object.Also shown is a Gaussian-smoothed fit which indicates a half width at half maximum of 25nm (or σ = 21 nm in exp[−0.5x2/σ2]) for the combination of feature size and imaging resolution.
Huang et al. Page 9
Phys Rev Lett. Author manuscript; available in PMC 2010 May 11.
NIH
-PA Author Manuscript
NIH
-PA Author Manuscript
NIH
-PA Author Manuscript


