Embed Size (px)
Citation preview
Oct 2013. Vol. 3, No.2 ISSN 2307-227X International Journal of Research In Social Sciences © 2013 IJRSS & K.A.J. All rights reserved www.ijsk.org/ijrss
127
SOCIAL EXCLUSION AND TRANSPORTATION: PLANNING
FOR ACCESSIBILITY
Arif Keceli 1Mehmet Akif Ersoy University, Burdur, Turkey, [email protected]
ABSTRACT
In this paper, the effect of transportation based difficulties on social exclusion was studied via conducting a
survey which includes people who lived in the district of Avcilar on the European side of Istanbul, Turkey. In the
survey a questionnaire were utilized. People were asked about their regular social, cultural, sports and
voluntary activities in their leisure times and if they limited these activities due to transportation based
difficulties such as high travel (out-of-pocket) cost, long distances, travel and transfer times, low safety and
comfort. People included in the study were between 20 and 45 years old, worker and middle-income class,
living approximately 27,3 km away from the city center of Istanbul in Merkez, Ambarli and Denizkoskler
neighborhoods. The main survey question asked was whether they felt socially excluded due to transportation
related difficulties. The survey study was performed before (2005) and after (2009) when the new bus rapid
transit (BRT-called Metrobus in Istanbul) line was opened (the first section, opened in September 2007, of the
line was 18,3 km between Avcilar and Topkapi and the line was extended first to Mecidiyeköy-Zincirlikuyu and
then to Söğütlüçeşme in the Anatolian side of the city by crossing the Bosporus Strait over Bogazici Bridge in
2009). This before-after study is expected to disclose whether the new BRT line helped to ease some of the travel
discomfort along the corridor (between Avcilar and the city center, Mecidiyeköy-Zincirlikuyu).
Key Words: Social Exclusion, Transportation Difficulties, Planning, Istanbul, Turkey
1. Introduction
1.1 The Problem
Social exclusion, as one of the most important
topics in social sciences, may have some different
parameters, like cultural, economic, racial, and so
on. In this paper, the effect of transportation based
difficulties on social exclusion was studied for
people living in the district of Avcilar on the
European side of Istanbul, Turkey. The population
of Avcilar was 333.944 in 2008 census (tuik.gov.tr,
2009).
Since Avcilar was approximately 27,3 km away
from the city center of Istanbul, which is one of the
biggest metropolitan city of the World (European
Capital of Culture in 2010), it has been observed
that people are socially excluded from the entire
social life of the city because of transportation
difficulties, based on time, cost, safety and comfort.
In other words, this study presents the peoples’
current and possible future limitations in their
social activities caused by transportation.
1.2 General Information
Turkey has witnessed the movement of migration,
especially from small cities to larger ones for the
sake of joining the social and cultural facilities
easily and profiting much more from the public
services as hoping better business capabilities, and
desiring much more quality residences since 1950s
(Bayhan, 1997; Akkur, 1996). Istanbul is one of the
best examples for the areas which were affected so
much from that migration movement (Gorgulu et
al, 2006). People who live in this metropolitan area
come face to face with imperfections in the case of
social activities--which would make their lives
better-- because of the transportation difficulties.
In the study, the life standards of people who live
in the city, their hopes in connection with modern
capabilities and leisure activities were considered.
Then, cost, time, place were examined, which are
necessities for these activities, and also their
relations with transportation capabilities. There is
no doubt that transportation has both positive and
negative effects on them (Litman, 2003 (2)). In
addition to these effects, this study focused on the
living conditions of the city-dwellers, centering
their social and cultural activities, and their
attitudes. When the concept of the social activities
have been analyzed deeply, every movement can be
called as a social activity which is completely about
traveling, fun, visiting and recreation without
aiming any trade, work or study (Shepley, 2005).
The target sample population of the study is people
of worker and middle class, young and middle
Oct 2013. Vol. 3, No.2 ISSN 2307-227X International Journal of Research In Social Sciences © 2013 IJRSS & K.A.J. All rights reserved www.ijsk.org/ijrss
128
aged, without any physical disabilities, and has
enough time for social activities in their routine life
while this study was in process. Determining the
young and middle-aged group is about the interest
of joining the social activities, and it is important
influencing cause and effect relationship based on
the implementing accessibility in general and
survey results (Morwitz, 2004; ).
There are a lot of facilities for people like
advertising fun, traveling and recreation in Istanbul.
When it is thought that the people improve their
behaviors according to the existing capabilities
(Butz et al, 2003), there is no doubt that the travel
demand in big cities would be shaped according to
this situation. In the case of social activities,
transportation demands were classified as attending
theatres, movies, concerts, sports and recreational
activities, visiting historical, social, cultural places
and also visiting friends and relatives,.
The results of this study involve planning a
discipline to show importance of accessibility of
social facilities and mobility of people who live in
metropolitan area. In general, accessibility is the
ability to reach goods, services and activities
(Litman, 2008). It is obvious that those are main
purposes of most of the transportation investments.
In this study, the ability to reach goods has been
excluded from the interpretation based on
accessibility perspective. While there are many
factors which affect accessibility (Litman, 2008),
only transportation based elements are included in
this study.
1.3 Hypotheses, Research Questions and Data
Main hypotheses of the study were:
a) People, who live in at least 25 km away
from the city center of a metropolitan area,
are socially excluded because of the
transportation difficulties.
b) New public transportation system
called “bus rapid transit (BRT)” has most
likely helped society to include them into
their desired social life.
Based on these hypotheses, two main research
questions are asked:
a) How are people excluded from social
life of the city by effects of transportation?
b) How efficient is it to use the new BRT
system to support social inclusion of a part
of the society?
The study was basically built on two street surveys
which were applied to people who live in Avcilar
(as population) and age group like 20 – 45 years
old (as sample), one in 2005 (before BRT) and
second in 2009 (after BRT). As subject, people
were asked about their regular social, cultural,
sports and voluntary activities on their leisure time
and if they limit these activities due to
transportation based difficulties such as high travel
costs, long distances, travel and transfer times, low
security and comfort. The questionnaire also
included some personal questions like, age, place
of birth, car ownership and monthly income as
independent variables of the interpretations.
Some digital data of the area have been used to
identify and visualize transportation systems, how
easy or hard it is to reach public transportation lines
and stops, how much of the area is within the
walking distance from the transport lines and
finally what new system offers to society in the
case of accessibility and mobility.
2. Literature Review
The cities that were improved quickly and
crookedly connected because of the fast migration
which occurred in the metropolitan areas at the
time (Hogan et al, 2001; Yazgi and Dokmeci,
2007). The complex morphology, improved in
these cities, the difference of the social-economic
characters, the complicated and dense buildings
occurred because of the difficulties with
transportation itself (Medda et al, 2003, Church et
al, 2000). Church also mentioned that being
deprived of social activities, even if you have no
financial problems, is a situation occurring because
of the effects of unreliable transportation. Istanbul
is one of the best examples of those kinds of
metropolitan areas, since it has attracted many
national and international immigrants, especially
after 1950s (Duran et al, 2005).
2.1 Social Exclusion
Although social exclusion has existed since the
1970s, as Gleen Loury (1999) mentioned earlier,
this has become an extremely important topic in the
last decade. There are a lot of articles which have
been published about socially excluded
communities or groups of people, by reasons of
economic, cultural, racial, ethnical and gender.
However, this study focused on the effects of
transportation difficulties on social exclusion of
people. There are also many studies showing the
relationship between social exclusion and
transportation. The theory of social exclusion is
related to inequality and social rights of the people
(Schonfelder and Axhausen, 2003). In this study,
Oct 2013. Vol. 3, No.2 ISSN 2307-227X International Journal of Research In Social Sciences © 2013 IJRSS & K.A.J. All rights reserved www.ijsk.org/ijrss
129
inequalities of the people who live in the same city
but cannot get same benefit from social events and
attractions have been searched and discussed.
Being socially excluded is not completely clarified
on an academic level (Miller, 2003; Klasen, 2002).
Furthermore, the general explanation is: a person
who cannot get the benefit of social capabilities of
the area where he/she lives in geographically
because of the effects which are not under control
even he/she wants to do it. One of the other straight
and clear identification of social exclusion made by
Duffy (1995) is that “Social exclusion is a broader
concept than poverty, encompassing not only low
material means but the inability to participate
effectively in economic, social, political and
cultural life and in some characterizations
alienation and distance from mainstream society”.
Being deprived of social activities and being
excluded must not be put in the same category with
poverty and being economically inadequate
(Schonfelder and Axhausen, 2003). As we
mentioned before, being deprived of social
activities, even when you have no financial
problems, is a situation that occurred by the effects
of the transportation; eventhough very first usage
of the social exclusion as a term in the 1970s, was
standing with poverty and inequality (Evans et al,
1995).
As a figure for the subject is necessary for our
study, Istanbul is a great metropolitan area which is
hosting lots of social-cultural activities and has a
lot of functions in it, but not everyone who lives in
Istanbul can benefit from all of these activities and
opportunities on the same level. For example, even
though the historical peninsula (the Sultan Ahmet
Square and its surroundings) is in a populated area,
most of the residents can only have chance to visit
there a few times in a year. Transportation
difficulties such parking problem, accessibility and
long travel time can be listed as some of the main
reasons of this conditions.
While we are focusing on relationships between
transportation and social exclusion, literally
classified as physical, geographical, public
facilities, economic, time and fear excluded
(Church et al, 2000). Physical exclusion is used to
determine natural disabilities of people, such as
very young and old age groups, see, hearing or
movement disabled people. Geographic exclusion
is defined as existing transportation facilities of the
area and form of people’s mobility based on these
systems. Public facilities, schools, hospitals,
recreational areas, commercial places are generally
randomly distributed in developing countries.
Therefore, some certain part of the city might have
difficulties reaching those facilities when needed
because of the lack of public transportation or the
inability to handle private transport. Unlikely
general definitions, economic exclusion based on
transportation is entirely about the absence or
existence of job opportunities in a surrounding area
and working far from the home. Time based
exclusion differs based on income, but still does
matter, especially for the residents of metropolitan
areas. Fear based exclusion is directly related to
crime potential, types and frequencies of the area.
In the conclusion part, types of exclusions of our
sample population on the study area are discussed.
2.2 Transportation
Urban transportation is such an important and
intensive issue in every metropolitan city
(McGlynn, 2008). Rapidly increasing population,
urban growth and spatial development have caused
increasing demand for urban transportation
facilities and services in these areas (Qureshi,
2007). The transportation system has the duty of
providing access between a lot of different property
usages in urban areas for individuals and groups.
The important parts of the city networks are
business areas, health and education centers, and
public services (McGlynn, 2008). The
transportation services also have an important role
in providing people with service connections so
that they may meet with their relatives and friends
(Miller, 2003).
There are two types of transportation effects on
social exclusion: first is the lack of access as an
economic, social, or cultural limitation. Second is
the physical effects, such as traffic jams, accidents,
crimes, weather and noise pollution (Hine, 2003).
In this study, transportation was examined based on
cost, time, access, safety and comfort.
When examining cost, three elements need to be
present: First, cost can never be the certain index or
a measure of the transportation service afforded or
the movement capabilities supplied. Second, the
effects of cost change according to the age group
and social identity. Lastly, it does not always show
persons’ proper income level, as it does not
determine whether they can afford or not afford
transportation costs, also the different reasons may
have a role in this situation.
Time has much more importance on the daily
activities of people especially in big cities. People’s
transportation preferences change based on the
issue of time (Wu and Miller, 2001). Safety is a
factor which mostly influences elderly people, kids
and women (Evgenikos et al, 2009; FERCI/ECTRI,
2009). This is not only about the preferred vehicle
Oct 2013. Vol. 3, No.2 ISSN 2307-227X International Journal of Research In Social Sciences © 2013 IJRSS & K.A.J. All rights reserved www.ijsk.org/ijrss
130
for transportation, but also about the social crimes
which occurred over time. It has a great role on the
preferences for accessing the transportation
systems or desired places to go. There might be
some natural and human made blocks, like huge
parking lots, walls of industrial institutions or rivers
and hills between distance of walking interval and
the stations. Comfort is also taking part as a
preference, because in the places where there are
more than one transportation preferences have
close relationship with each other. They are all
dependent on one another, it is almost impossible
to interpret one of them without paying attention on
another.
In the Todd’s article (2003), elements to multi
model level of service include public transportation
with evaluation factors of service coverage,
frequency, speed (particularly compared with
driving), vehicle and waiting area comfort, user
information, price, safety, prestige. Based on these
criteria, transit level of service of new bus rapid
transit system (metrobus) of Istanbul can be
considered as “A” which refers to equal and more
than 90 percent demand met, especially in the case
of frequency, service coverage, speed and price.
In the case of the accessibility of the transit system,
according to another survey 80% of people can
walk up to 400 meter in 6 – 10 minutes which is
considered a comfortable walking distance in
mixed used urban area to reach stations and stops
of public transportation (Ewing, 2000). Dittmar
(2004) mentioned that “optimal walking distance
between a transit station or stop and a place of
employment is 500 – 1000 feet (150 to 300
meter)”. Regional Planning Association defines
transit –friendly communities as intensively
developed areas within ¼ - ½ mile (400 to 800
meter) of rail stations. I think, any other public
transportation system facility can be added into this
definition. They also mentioned that general
features of these areas are mixed used, pedestrian
based and traffic calming design. All of them make
people encourage walking, it generally takes 5-10
minutes to reach any station or stop (Regional Plan
Association, 1997).
2.3 Local Transportation Systems of the Region
and Metrobus
There are public buses belonging to Istanbul Public
Transportation Authority (IETT) and private public
buses which operate from Avcilar to Mecidiyekoy,
Taksim, Esenler Domestic Bus Station, Bakirkoy,
Yenibosna and other settlement and commercial
areas which is on this line throughout the E-5
highway, with 15-20 minutes departure frequency.
Additionally, there are minibuses lines as Avcilar -
Kucukcekmece (39 vehicles), Avcilar – Topkapi
(210 vehicles), Firuzkoy, Esenyurt and Tokat
neighborhood to Topkapi. There is also a sea bus
line between Avcilar and Bostanci. It had only one
departure early in the morning and one in evening
hours, during the week days. Currently one more
line has been added, which goes to Pendik,
however departure frequencies still remain as they
were.
Since Metrobus started to operate as a new public
transportation system all along the E-5 highway,
minibus routes have been taken from E-5 to
internal arterials. The purposes were to provide
more transits for inner areas and more places on the
road for private vehicles. Also, private public buses
have been converted to public buses by IETT to
have more organized departures and frequencies.
Metrobus is the name of a “bus rapid transit”
system which has a special route that is only used
by specific vehicles of this line between Avcilar (in
European Part of Istanbul) to Sogutlucesme (in
Anatolian part of Istanbul). The route provides easy
accessibility to many important centers in Istanbul,
such as Bakirkoy, Topkapi, Sisli, Mecidiyekoy and
Kadikoy. It provides almost an hour shorter travel
time than before, between the first station to the last
one.
Metrobus provides better opportunities to move
around the city, based on time and comfort.
Recently it has 42 km long route with 32 stations.
There are 274 special vehicles operating in the
system. Each one approximately has the capacity of
230 passengers and departure frequency is
changing from 1 minute to 30 seconds in the day
time. It is in service for 24 hours, midnight time
departure frequencies range from 30 minutes to an
hour. Approximately, 800.000 people use the
system on a daily bases (Anadolu Agency, 2009).
Therefore, it can be assumed that people who live
in Avcilar feel most comfortable and flexible to
travel all along around the city.
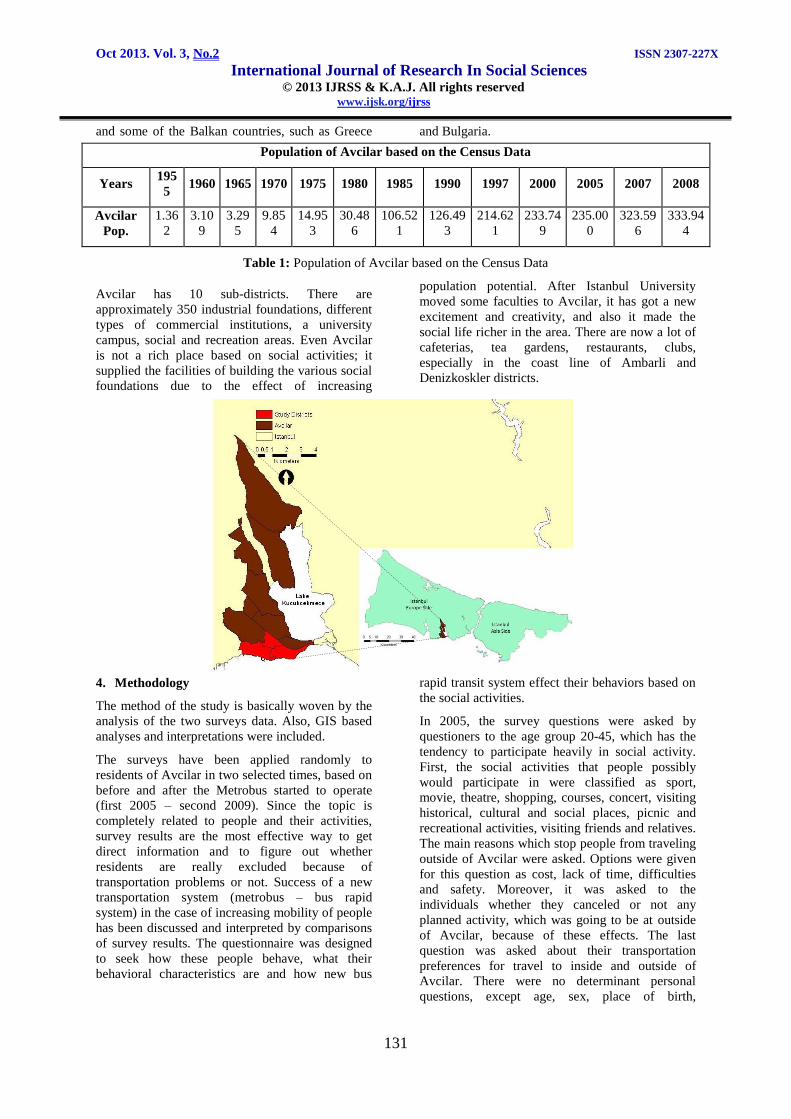
3. Study Area
Avcilar is one of the more rapidly improving and
developing areas of Istanbul, located at west bound
of the Kucukcekmece Lake, approximately 27.3 km
away from the city center (Eminonu), on the
European side of the Istanbul (Figure 1). Its
population has significantly increased in last 10-15
years. While it was 235.000 based on the 2005
census, it has now reached 333.944 in 2008 (Table
1). Its first group of residents arrived after World
War II by a population exchange between Turkey
Oct 2013. Vol. 3, No.2 ISSN 2307-227X International Journal of Research In Social Sciences © 2013 IJRSS & K.A.J. All rights reserved www.ijsk.org/ijrss
131
and some of the Balkan countries, such as Greece and Bulgaria.
Population of Avcilar based on the Census Data
Years 195
5 1960 1965 1970 1975 1980 1985 1990 1997 2000 2005 2007 2008
Avcilar
Pop.
1.36
2
3.10
9
3.29
5
9.85
4
14.95
3
30.48
6
106.52
1
126.49
3
214.62
1
233.74
9
235.00
0
323.59
6
333.94
4
Table 1: Population of Avcilar based on the Census Data
Avcilar has 10 sub-districts. There are
approximately 350 industrial foundations, different
types of commercial institutions, a university
campus, social and recreation areas. Even Avcilar
is not a rich place based on social activities; it
supplied the facilities of building the various social
foundations due to the effect of increasing
population potential. After Istanbul University
moved some faculties to Avcilar, it has got a new
excitement and creativity, and also it made the
social life richer in the area. There are now a lot of
cafeterias, tea gardens, restaurants, clubs,
especially in the coast line of Ambarli and
Denizkoskler districts.
Figure 1: Study Area
4. Methodology
The method of the study is basically woven by the
analysis of the two surveys data. Also, GIS based
analyses and interpretations were included.
The surveys have been applied randomly to
residents of Avcilar in two selected times, based on
before and after the Metrobus started to operate
(first 2005 – second 2009). Since the topic is
completely related to people and their activities,
survey results are the most effective way to get
direct information and to figure out whether
residents are really excluded because of
transportation problems or not. Success of a new
transportation system (metrobus – bus rapid
system) in the case of increasing mobility of people
has been discussed and interpreted by comparisons
of survey results. The questionnaire was designed
to seek how these people behave, what their
behavioral characteristics are and how new bus
rapid transit system effect their behaviors based on
the social activities.
In 2005, the survey questions were asked by
questioners to the age group 20-45, which has the
tendency to participate heavily in social activity.
First, the social activities that people possibly
would participate in were classified as sport,
movie, theatre, shopping, courses, concert, visiting
historical, cultural and social places, picnic and
recreational activities, visiting friends and relatives.
The main reasons which stop people from traveling
outside of Avcilar were asked. Options were given
for this question as cost, lack of time, difficulties
and safety. Moreover, it was asked to the
individuals whether they canceled or not any
planned activity, which was going to be at outside
of Avcilar, because of these effects. The last
question was asked about their transportation
preferences for travel to inside and outside of
Avcilar. There were no determinant personal
questions, except age, sex, place of birth,
Oct 2013. Vol. 3, No.2 ISSN 2307-227X International Journal of Research In Social Sciences © 2013 IJRSS & K.A.J. All rights reserved www.ijsk.org/ijrss
132
profession, education, income level, and vehicle
ownership. These were used as independent
variables of the study.
In 2009 survey questioners added three different
questions to figure out the success of Metrobus
based on the ability to support people’s
participation in social activities in addition to the
other questions that are already mentioned above.
Those three questions are directly asked: a) Is there
any increase for their social activities in the inner
part of the city after Metrobus started operating? b)
How often do they use Metrobus? c) What is their
main purpose of travel by Metrobus? The results of
these questions are providing information about
how metrobus plays a role on the mobility of
people who live in the defined area.
GIS was used as a tool to identify how much of the
residential area is within the walking distance of
public transportation route, and was also used for
visual interpretation of the new bus rapid system.
Basically, district borders, buildings and roads were
taken out of whole city database. Both metrobus
line and inner public transportation route in Avcilar
were created by the road’s and highway’s data. 250
meters buffer zone was created by using public
transportation line and area within the buffer was
analyzed based on the building’s data. 2006
IKONOS images of European and Anatolian part
of Istanbul were used as base map and digital data
adjustment. Building, district and road data were
provided by GIS Department of Istanbul
Metropolitan Municipality.
5. Results
As we mentioned before, it is obvious that there is
supposed to be more than one factor leading to the
cause and effect of social exclusion. Variety of
current capabilities in different social areas causes
occurring different behaviors for different groups
of people (Butz et all, 2003). The results of surveys
are also supporting this judgment. Results were
listed and interpreted based on two different survey
applications and comparative outputs.
In 2005, 44 percent of the people who were
involved in the study owned a car; while in 2009
the results have dropped to 42 percent. The
monthly income of 57 percent of our sample
population was equal or less than one thousand
dollars in 2005, this amount increased to 67 percent
in 2009. Only 3 percent of people mentioned that
their monthly income is more than two thousand
dollars per month in 2009, while it was 12 percent
in 2005. Education and gender distributions of
2005 survey results are 31% female, 69% males,
42% university degree or still college student, 23%
high school degree and the rest graduated from
primary schools. Based on the 2009 results, 71
percent of our population is male and 29 percent
was female; 31 percent of the people graduated
from university, 42 percent of them have high
school degree and the remainder graduated from
primary schools. Since the 2005 survey was
conducted during fall semester and 2009 survey
was in semester holiday, there is a remarkable
difference between the percentages of participants
who have earned a university degree.
\Visiting friends/relatives and recreational activities
are the most common activities done outside of the
Avcilar. Shopping based travel outside of the
county declined to 97 responses out of 188 from
149 responses out of 163 samples, which means
there is a 40 percent difference one from the other.
Visiting historical, social and cultural places’
records were excluded from the study results
because there are incoherent differences between
two survey results based on these activities
.
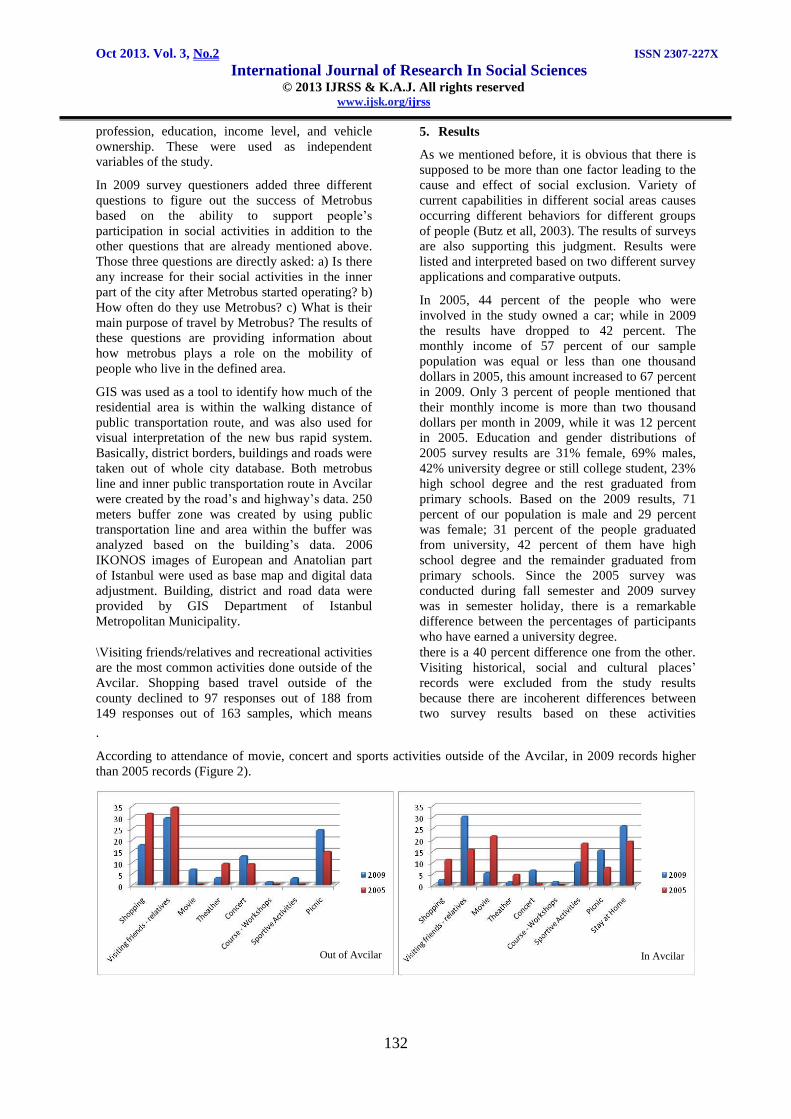
According to attendance of movie, concert and sports activities outside of the Avcilar, in 2009 records higher
than 2005 records (Figure 2).
Out of Avcilar In Avcilar
Oct 2013. Vol. 3, No.2 ISSN 2307-227X International Journal of Research In Social Sciences © 2013 IJRSS & K.A.J. All rights reserved www.ijsk.org/ijrss
133
2009 2005
Figure 2: Social activities in and outside of Avcilar
Most common social activities within the county
are sports, movie, recreation, visiting friends and
relatives. Most of the people preferred to stay at
home while they do not go outside of Avcilar for
any social activity depends on both survey results.
When we look at the 2009 survey results, it is easy
to realize decreasing of movie, theater, shopping
and sports while visiting friends and relatives,
picnic and staying at home rates are increasing.
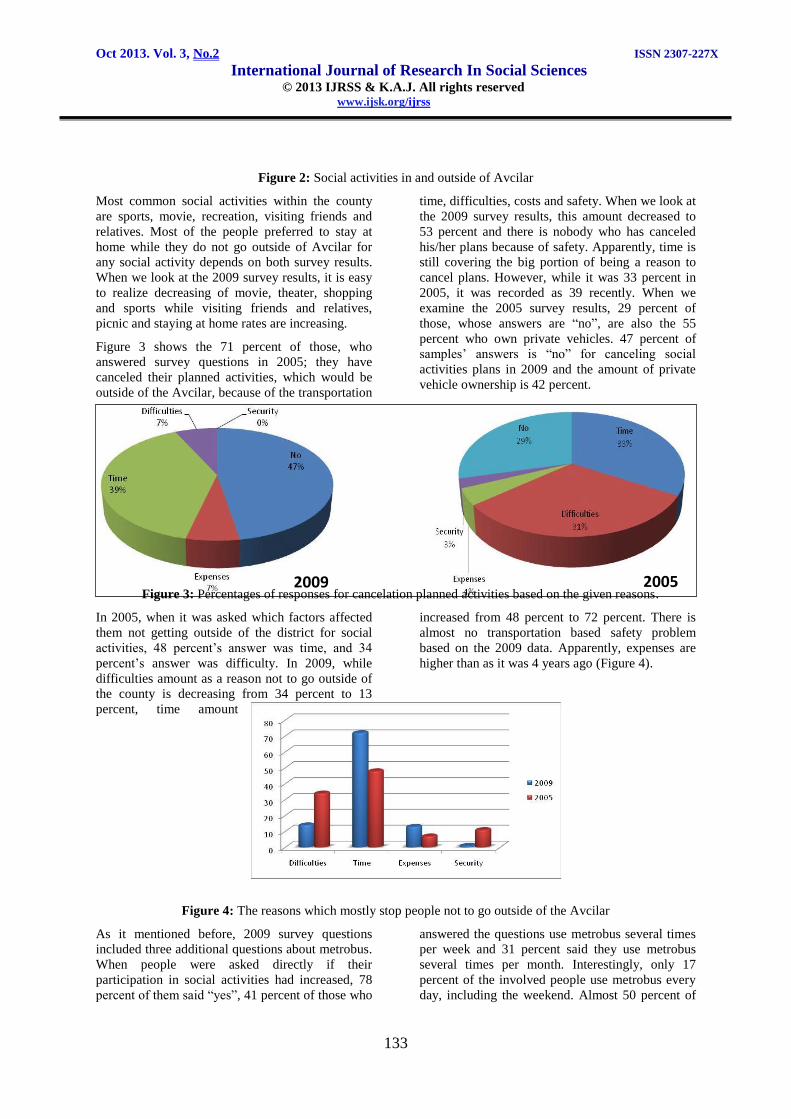
Figure 3 shows the 71 percent of those, who
answered survey questions in 2005; they have
canceled their planned activities, which would be
outside of the Avcilar, because of the transportation
time, difficulties, costs and safety. When we look at
the 2009 survey results, this amount decreased to
53 percent and there is nobody who has canceled
his/her plans because of safety. Apparently, time is
still covering the big portion of being a reason to
cancel plans. However, while it was 33 percent in
2005, it was recorded as 39 recently. When we
examine the 2005 survey results, 29 percent of
those, whose answers are “no”, are also the 55
percent who own private vehicles. 47 percent of
samples’ answers is “no” for canceling social
activities plans in 2009 and the amount of private
vehicle ownership is 42 percent.
Figure 3: Percentages of responses for cancelation planned activities based on the given reasons.
In 2005, when it was asked which factors affected
them not getting outside of the district for social
activities, 48 percent’s answer was time, and 34
percent’s answer was difficulty. In 2009, while
difficulties amount as a reason not to go outside of
the county is decreasing from 34 percent to 13
percent, time amount
increased from 48 percent to 72 percent. There is
almost no transportation based safety problem
based on the 2009 data. Apparently, expenses are
higher than as it was 4 years ago (Figure 4).
Figure 4: The reasons which mostly stop people not to go outside of the Avcilar
As it mentioned before, 2009 survey questions
included three additional questions about metrobus.
When people were asked directly if their
participation in social activities had increased, 78
percent of them said “yes”, 41 percent of those who
answered the questions use metrobus several times
per week and 31 percent said they use metrobus
several times per month. Interestingly, only 17
percent of the involved people use metrobus every
day, including the weekend. Almost 50 percent of
Oct 2013. Vol. 3, No.2 ISSN 2307-227X International Journal of Research In Social Sciences © 2013 IJRSS & K.A.J. All rights reserved www.ijsk.org/ijrss
134
the people use metrobus for back and forth travel
from home to work/school trip. 24 percent of them
use it for social activities and 17 percent of them
use it for visiting.
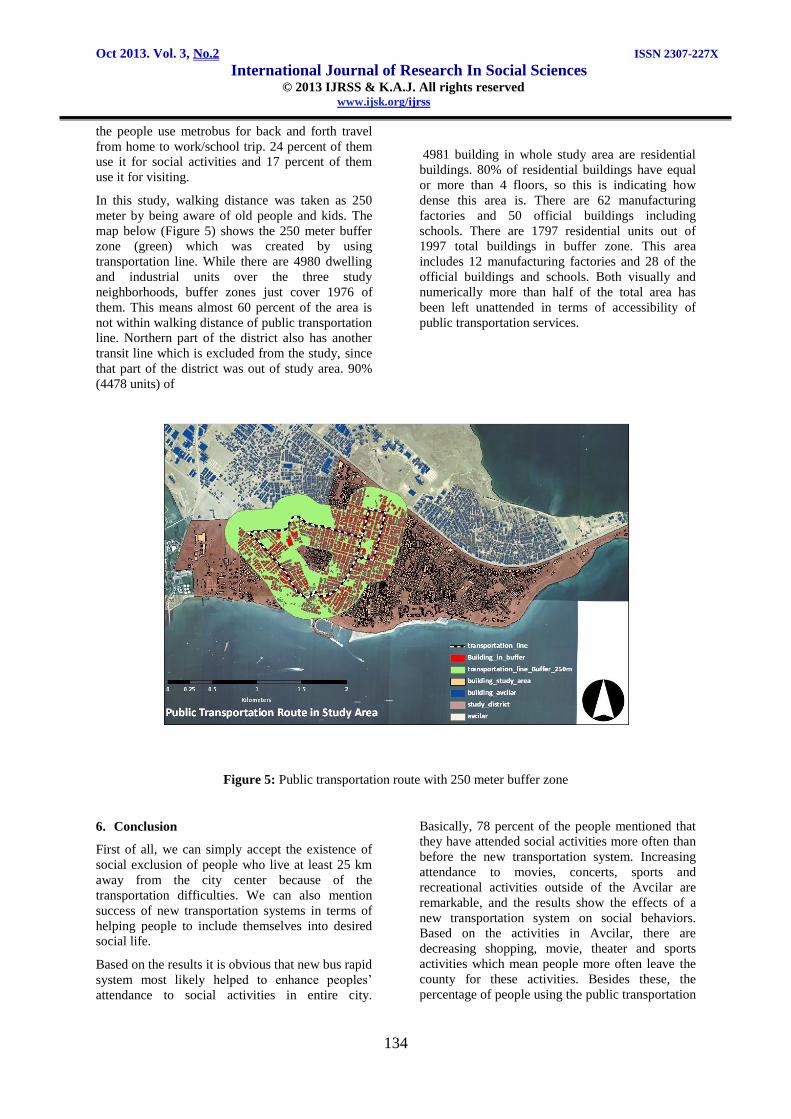
In this study, walking distance was taken as 250
meter by being aware of old people and kids. The
map below (Figure 5) shows the 250 meter buffer
zone (green) which was created by using
transportation line. While there are 4980 dwelling
and industrial units over the three study
neighborhoods, buffer zones just cover 1976 of
them. This means almost 60 percent of the area is
not within walking distance of public transportation
line. Northern part of the district also has another
transit line which is excluded from the study, since
that part of the district was out of study area. 90%
(4478 units) of
4981 building in whole study area are residential
buildings. 80% of residential buildings have equal
or more than 4 floors, so this is indicating how
dense this area is. There are 62 manufacturing
factories and 50 official buildings including
schools. There are 1797 residential units out of
1997 total buildings in buffer zone. This area
includes 12 manufacturing factories and 28 of the
official buildings and schools. Both visually and
numerically more than half of the total area has
been left unattended in terms of accessibility of
public transportation services.
Figure 5: Public transportation route with 250 meter buffer zone
6. Conclusion
First of all, we can simply accept the existence of
social exclusion of people who live at least 25 km
away from the city center because of the
transportation difficulties. We can also mention
success of new transportation systems in terms of
helping people to include themselves into desired
social life.
Based on the results it is obvious that new bus rapid
system most likely helped to enhance peoples’
attendance to social activities in entire city.
Basically, 78 percent of the people mentioned that
they have attended social activities more often than
before the new transportation system. Increasing
attendance to movies, concerts, sports and
recreational activities outside of the Avcilar are
remarkable, and the results show the effects of a
new transportation system on social behaviors.
Based on the activities in Avcilar, there are
decreasing shopping, movie, theater and sports
activities which mean people more often leave the
county for these activities. Besides these, the
percentage of people using the public transportation
Oct 2013. Vol. 3, No.2 ISSN 2307-227X International Journal of Research In Social Sciences © 2013 IJRSS & K.A.J. All rights reserved www.ijsk.org/ijrss
135
to go outside of the district increased from 58% to
76%. Cancelation planned activities percentages
also decreased by 20%. . While difficulties are 24
percent less important than 4 years ago, time is still
a remaining factor as to why the cancellation of
planned activities is at 39%
The distance of the defined area to the Istanbul’s
CBD, and the time spent to travel there, as well as
traffic jams during a specific time of the day play
an important role on people’s decision to travel.
That is why time is the most effective reason to
stop 72% of people from leaving the district. There
is another situation which plays a role, which is
being far away from the public transportation line
and stops. There are only two main roads where the
public buses can pick up and drop off the
passengers in Avcilar, and as it mentioned in
results almost 60 percent of the settlement areas are
far away from the stops when we get average
walking distance as 250 meters.
Another result shows the relationship between the
private vehicle ownership and transportation
preferences. Based on the 2005 results, the 95% of
people whose answers are “no” about the
cancellation for the plans, have private vehicles. On
the contrary, there are also the ones who cancel
their plans even if they have vehicles, but their
reasons were mostly due to the time and difficulty
based on the traffic jam rather than expenses,
comfort or safety. In 2009, 53% of people have
mentioned that they have canceled their plans and
41% of those have a private vehicle.
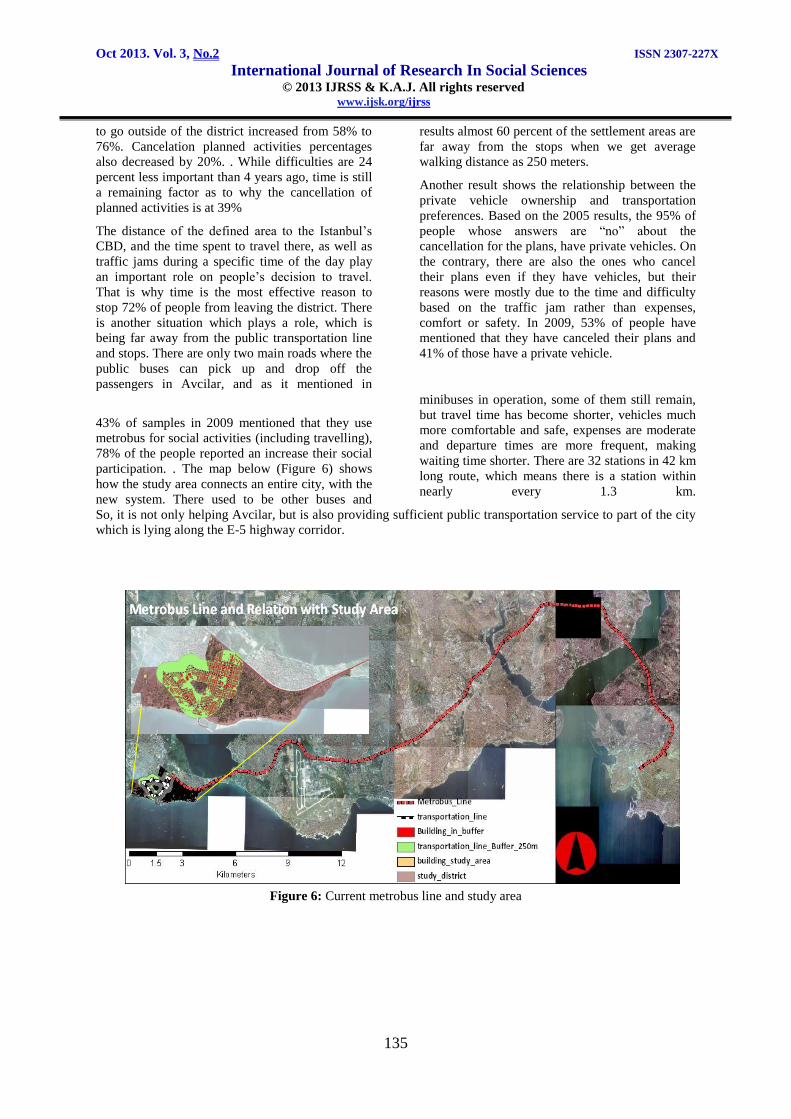
43% of samples in 2009 mentioned that they use
metrobus for social activities (including travelling),
78% of the people reported an increase their social
participation. . The map below (Figure 6) shows
how the study area connects an entire city, with the
new system. There used to be other buses and
minibuses in operation, some of them still remain,
but travel time has become shorter, vehicles much
more comfortable and safe, expenses are moderate
and departure times are more frequent, making
waiting time shorter. There are 32 stations in 42 km
long route, which means there is a station within
nearly every 1.3 km.
So, it is not only helping Avcilar, but is also providing sufficient public transportation service to part of the city
which is lying along the E-5 highway corridor.
Figure 6: Current metrobus line and study area
Oct 2013. Vol. 3, No.2 ISSN 2307-227X International Journal of Research In Social Sciences © 2013 IJRSS & K.A.J. All rights reserved www.ijsk.org/ijrss
136
7.
1. -Bibliography:
2. Akkür, Z. G., 1996 Türkiye’de Kırsal
Kesimden Kente Göç ve Bölgeler Arası
Dengesizlik (1970-1993), T.C. Kültür
Bakanlığı Yayını Kültür Eserleri Dizisi,
Ankara, Turkey
3. Bayhan, V., 1997, ‘Turkiye’de Ic Gocler ve
Anomik Kentlesme’ Toplum ve Göç, Sosyoloji
Derneği Yayınları, DIE, pp.178-191, Ankara,
Turkey
4. Butz V., M., Sigaud, O., G´erard, P., 2003,
Anticipatory Behavior: Exploiting Knowledge
About the Future to Improve Current Behavior,
Springer-Verlag Berlin Heidelberg, LNAI
2684, pp. 1–10, Germany
5. Church, A., Frost, M., Sullivan, K., 2000,
Transport and Social Exclusion in London,
Transport Policy, v. 7, issue3, p.195 – 205, UK
6. Dittmar, H., and G. Ohland, eds., 2004, The
New Transit Town: Best Practices in Transit-
Oriented Development, Island Press,
Washington, D.C. p. 120., US
7. Duffy, K, 1995: Social Exclusion and Human
Dignity in Europe, Council of Europe,
Strasbourg, France
8. Duran, Z., Akçay, O., Toz, G., Gulersoy, N. Z.,
2005, Landscape Modeling and Visualization
in Suburban Areas: A Case Study, CIPA 2005
XX International Symposium, 26 September –
01 October, Torino, Italy
9. Evgenikos, P., Yannis, G., Leitner, T.,
Hoeglinger, S., Broughton, J., Lawton, B.,
2009, Road Safety and the Elderly Europe, 4th
IRTAD Conference, Seoul, Korea
10. Ewing, R., 2000, Pedestrian- and Transit-
Friendly Design: A Primer for Smart Growth.
EPA Smart Growth Network, pp. 1-22.
11. Evans, M., Paugam, S., Prelis, J., 1995,
Chunnel Vision: Poverty, Social Exclusion and
Debate on Social Welfare in France and
Britain, LSE STICERD Discussion Paper 115
12. Filiztekin A.,, Gokhan, A., The Determinants
of Internal Migration in Turkey, Faculty of
Arts and Social Sciences, Sabanci University,
Istanbul, Turkey
13. Gorgulu, Z., Dincer, I., Enlil, Z., Ornek, E.,
Kurtarir, E., Altinok, E., 2006, mahalle
Olceginde Kentsel dfonusum Modeli
Kucukbakkalkoy ornegi, YTU, SBPB,
Istanbul, Turkey
14. Hine, J., 2003, Social Exclusion and Transport
System, Transport Policy, v. 10, issue 4, p. 263
15. Hogan, D., Berquó, E. and Costa, H.M., 2001,
Population and Environment in Brazil.
Campinas, CNPD/ABEP/NEPO, Brazil
16. Klasen, S., 2002, Social Exclusion and
Children in OECD Countries: Some
Conceptual Issues.” The School Field, 13 (5):
9-25
17. Litman, T., 2008, Evaluating Accessibility for
Transportation Planning, 87th Transportation
Research Board Annual Meeting, Victoria
Transport Policy Institute, Canada
18. Litman, T., 2003 (1), Measuring
Transportation: Traffic, Mobility and
Accessibility, ITE Journal (www.ite.org), Vol.
73, No. 10, October 2003, pp. 28-32
19. Litman, T., 2003 (2), Social Inclusion as a
Transport Planning Issue in Canada,
contribution to the FIA Foundation G&
Comparison, Canada
20. Loury, C., G., 1999, Social Exclusion and
Ethnic Groups: The Challenge to Economics,
Boston University Annual World Bank
Conference on Development Economics, USA
21. McGlynn, B., 2008, The Importance of
Transportation, University of Pittsburgh,
Swanson School of Engineering, Pennsylvania,
USA
22. Medda, F., Nijkamp, P., and Rietveld, P., 2003,
Urban Land Use for transport Systems and City
Shapes, Geographical Analysis, Vol. 35, No. 1,
The Ohio State University, US
23. Miller, J. H., 2003, Travel Changes and Social
Exclusion, International Conference on Travel
Behavior Research
24. Morwitz, V., G., 2004, The Effects of Survey
Measurement on Respondent Behavior Applied
Stochastic Models in Business and Industry,
Leonard N. Stern School of Business, NY
University, NY, USA
25. Qureshi, I., A., Lu, H., Ye, S., 2007, Urban
Transportation and Equity: A Case Study of
Beijing and Karachi, Institute of Transportation
Engineering, Tsinghua University, Beijing
100084, China
26. Schönfelder, S., Axhausen, W., 2003. Activity
Spaces: Measures of Social Exclusion,
Transport Policy, v. 10, issue 4, p. 273-286
27. Shepley, W. O., 2005, Social Exclusion and the
Theory of Equality: The Priority of Welfare
and Fairness in Policy, Centre for Transport
Studies, Department of Civil and
Environmental Engineering, University
College London, UK
Oct 2013. Vol. 3, No.2 ISSN 2307-227X International Journal of Research In Social Sciences © 2013 IJRSS & K.A.J. All rights reserved www.ijsk.org/ijrss
137
28. Yazgi, B., Dokmeci, V., 2007, Analysis of
Housing Prices in the Metropolitan Area of
Istanbul, Proceedings, 6th International Space
Syntax Symposium, Istanbul, Turkey
29. Wu, Y., Miller, J. H., 2001, Computational
Tools for Measuring Space-Time Accessibility
within Transportation Networks with Dynamic
Flow, Journal of Transportation and Statistic,
Volume 4, P. 1-14
30. FERSI/ECTRI, 2009, The Sustainable Safety
Approach to Road Transport and Mobility
31. Regional Plan Association, 1997, Building
Transit-Friendly Communities A Design and
Development Strategy for the Tri-State
Metropolitan Region, New York, New Jersey,
Connecticut
32. Istanbul Metropolitan Municipality,
Department of Transportation Coordination
33. Istanbul Metropolitan Municipality,
Department of GIS
34. Department of Istanbul Sea Buses Operations
35. Haberturk, 23rd January 2008, http://www.turkei.net/news_detail.php?id=333
50
36. Anadolu Agency, 22 June 2009,
http://www.haber34.com/topbas-274-
metrobus-yetmedi-12938-haberi.html
37. www.tuik.gov.tr


