Embed Size (px)
Citation preview
SOCIAL-ECOLOGICAL DYNAMICS OF RESIDENTIAL LANDSCAPES: HUMAN DRIVERS OF MANAGEMENT
PRACTICES AND ECOLOGICAL STRUCTURE IN AN URBAN ECOSYSTEM CONTEXT
The Final Report from an Interdisciplinary Graduate Research and Education Training (IGERT) Workshop
Fall 2008
Faculty: Kelli L. Larson1,2 Sharon J. Hall3
Students:
Elizabeth M. Cook3 Benjamin Funke2
Colleen A. Strawhacker4 V. Kelly Turner1
1School of Geographical Sciences 2School of Sustainability 3School of Life Sciences
4School of Human Evolution and Social Change Arizona State University – Tempe
Tempe, AZ 85287
Report produced by the
Global Institute of Sustainability Arizona State University-Tempe
PO Box 875402 Tempe, AZ 85287-5402

This page intentionally left blank
SOCIAL-ECOLOGICAL DYNAMICS OF RESIDENTIAL LANDSCAPES: HUMAN DRIVERS OF MANAGEMENT
PRACTICES AND ECOLOGICAL STRUCTURE IN AN URBAN ECOSYSTEM CONTEXT
The Final Report from an Interdisciplinary Graduate Research and Education Training (IGERT) Workshop
Fall 2008
Faculty: Kelli L. Larson1,2 Sharon J. Hall3
Students:
Elizabeth M. Cook3 Benjamin Funke2
Colleen A. Strawhacker4 V. Kelly Turner1
1School of Geographical Sciences
2School of Sustainability 3School of Life Sciences
4School of Human Evolution and Social Change Arizona State University – Tempe
Tempe, AZ 85287
Report produced by the Global Institute of Sustainability Arizona State University-Tempe
PO Box 875402 Tempe, AZ 85287-5402
Acknowledgements: This material is based upon work supported by the National Science Foundation (NSF)
under Grant No. DEB-0423704, Central Arizona-Phoenix Long-Term Ecological Research (CAP LTER) and Grant No. 0504248, Integrative Graduate Education Research and Training (IGERT) in Urban Ecology. Any opinions, findings and conclusions or recommendation expressed in this material are those of the author(s) and do not necessarily reflect the views of the National Science Foundation (NSF). The social survey was funded and conducted by the ASU Institute for Social Science Research, with additional support provided by the Decision Center for a Desert City (DCDC), NSF Grant No. SES-0345945. The authors would also like to thank Marcia Nation for her assistance in producing this report.
ii
Table of Contents Abstract .................................................................................................................................... iii Introduction and Conceptual Approach .....................................................................................1 Part I: Individual-Household Values, Landscape Preferences and Management Choices .......5 Part II: Broader-Scale Drivers of Residential Landscape Structure and Practices .................15 Part III: Concluding Thoughts ................................................................................................31 Works Cited .............................................................................................................................33 Appendix 1: Social Survey Questions, Spring 2007................................................................35 Appendix 2: Factor Analyses Results, Fall 2008.....................................................................37 Appendix 3: Observational Field Survey, Spring/Summer 2008 ............................................38 Appendix 4: Interview Protocol for Developers, Fall 2008.....................................................45
Note: This report may be read as a whole to gain a broader understanding of the drivers of residential landscapes at multiple scales, or in individual sections (Part I: individual-level homeowner cognitive drivers; Part II: neighborhood- and regional-scale institutional drivers), depending upon the readers’ interests.
iii
ABSTRACT Residential landscapes, including lawns and other types of vegetation, are an increasingly
important component of urban ecosystems. Turfgrass lawns are now among the largest irrigated crops in the U.S., contributing to high rates of water and fertilizer use. Yet we know little about the social and ecological dynamics of different landscape types, such as mesic lawns and xeric yards, which involve a diverse array of potential values and associated decision tradeoffs. Past research has largely focused on either social or ecological elements of residential landscapes, for example, historic and modern aesthetic preferences or the composition and diversity of species. Our ongoing project aims to advance integrated knowledge about residential landscapes as important components of urban ecosystems by examining how cognitive (cultural values, beliefs, and norms) and structural (social institutions and urban form) factors drive yard management practices, and in turn, affect biogeochemical and ecological processes at the household and neighborhood scales. Within this overarching framework, our workshop course explored two primary research objectives. First, we examined the influence of residents' values on landscape structure and the degree to which expressed preferences match actual landscape choices, and second, we assessed how neighborhood-level institutions impact landscape structure, with special focus on the legacy effects of development decisions. To address the first objective, we linked social survey data with extensive observational field surveys in four case study neighborhoods throughout Phoenix, Arizona. For the second goal, we examined the Covenants, Codes and Restrictions (CCRs) in Homeowner Associations (HOAs) that govern landscaping, in addition to conducting interviews with developers about their landscaping decisions and how they have changed over time. Our findings highlight the significance of multiple scales of human drivers (see Figure 1) in the broader context of the social-ecology of residential landscapes.
Although values were not a strong driver of yard choices, they mildly influenced both expressed preferences and manifest choices in diverse Phoenix neighborhoods, particularly domain-specific values embodied in environmentally-oriented yard maintenance priorities. Meanwhile, our analyses of institutional forces highlights the role of broader structural forces that influence residential landscape structure and management. As developers respond to market conditions and broader constraints in producing residential landscapes over time, the effects may last long into the future since original development decisions establish the built context and become institutionalized in HOA CCRs. Our analysis of a sample of Covenants, Codes, and Restrictions for Phoenix-area subdivisions specifically indicated the potential for neighborhood-level private institutions to dictate landscape maintenance and structure, topography and water management, and species composition, with potentially significant impacts on the ecosystem services provided. In sum, further interdisciplinary analysis of the human drivers of yard structure and management at multiple scales (see Figure 1)—from households and neighborhoods to municipalities and broader regional forces—will reveal the complex dynamics involved in the production of residential landscapes and their social and ecological consequences for current and future generations.
1
INTRODUCTION AND CONCEPTUAL APPROACH Residential landscapes are the fastest-growing land use within urban areas of the United
States. Although they cover a smaller land area globally than agriculture, residential landscapes similarly receive intense human management, including the addition and removal of species and the application of water, fertilizers, and herbicides (Robbins et al. 2001). Turfgrass lawns in particular now cover 10-16 million hectares, replacing corn as the largest irrigated crop in the United States (Milesi et al. 2005). Two recent alternatives to the high water use, grassy mesic lawns are water-efficient, gravel yards with drought-tolerant vegetation (xeric) and yards with a mix of both grass and gravel ground cover (oasis).1 These xeric and oasis yard types are widespread in western US cities, but they also represent highly managed landscapes with productive plant species that are often densely spaced, drip-irrigated, raked, and pruned (Martin 2001). While the ecological outcomes of large-scale agricultural management have been well studied (Matson et al. 1997), far less research has focused upon the consequences of residential lawns and landscape management in urban or suburban areas. Yet, with high rates of species imports and exports, irrigation and chemical inputs in residential landscapes (Robbins et al. 2001, Wentz and Gober 2007, Cheng et al. 2008), the choices that residents make in their yard maintenance practices may impact ecological structure and functioning of cities. In this report, we examine the social-ecological dynamics of residential landscapes in the desert metropolis of Phoenix, Arizona, with a particular focus on the drivers of land-management choices and the resultant ecological structure of yards at the household and neighborhood scales.
This research report is the outcome of an interdisciplinary workshop course held in the Fall of 2008 at Arizona State University. Led by a human-environment geographer (Larson) and an ecosystem ecologist (Hall), a group of graduate students in life sciences (Cook), sustainability (Funke), anthropology (Strawhacker), and geography (Turner) undertook a series of analyses to achieve specific objectives aimed at addressing the following overarching research question: What factors drive residents’ landscape management decisions, and how do these practices affect the ecological structure of yards and associated ecosystem functions? As described below, our conceptual approach embodies a multi-scalar perspective on the human, institutional, and structural determinants of landscape management, ranging from the individual household and neighborhood through to broader regional scales. Then, the empirical findings of the semester-long workshop focusing on the household and regional levels are presented in two parts. Part I focuses on how individuals’ values influence household yard preferences and choices across diverse neighborhoods. Part II undertakes a broader neighborhood- and regional-scale assessment of how past decisions are made and codified in residential subdivisions and Homeowner Association (HOA) Covenants, Codes and Restrictions (CC&Rs). In Section 3, we conclude by reflecting on the significance of our findings as well as the future directions for this ongoing research initiative.
1Mesic (wet) yards primarily include turfgrass groundcover with high water-use vegetation and shade trees commonly watered with sprinkler systems (Martin et al. 2003). In contrast, xeric (dry) yards include a crushed stone groundcover with drought tolerant plants that are typically watered by drip irrigation. In this report, we avoid the related term “xeriscape,” a specific type of water conserving landscape defined by seven design principles (for more information, see www.xeriscape.org.). Finally, the term oasis (mixed) refers to yards with a combination of turfgrass and crushed stone groundcover with different types of plants and possibly different watering systems.
2
CONCEPTUAL FRAMEWORK
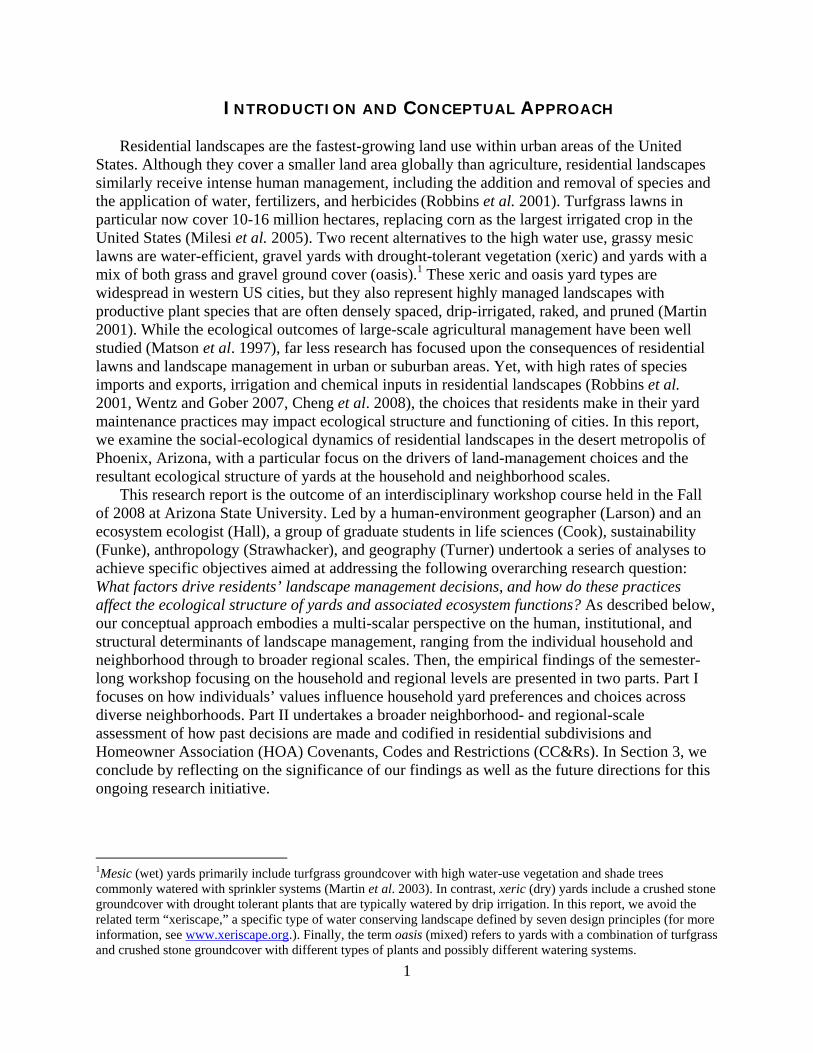
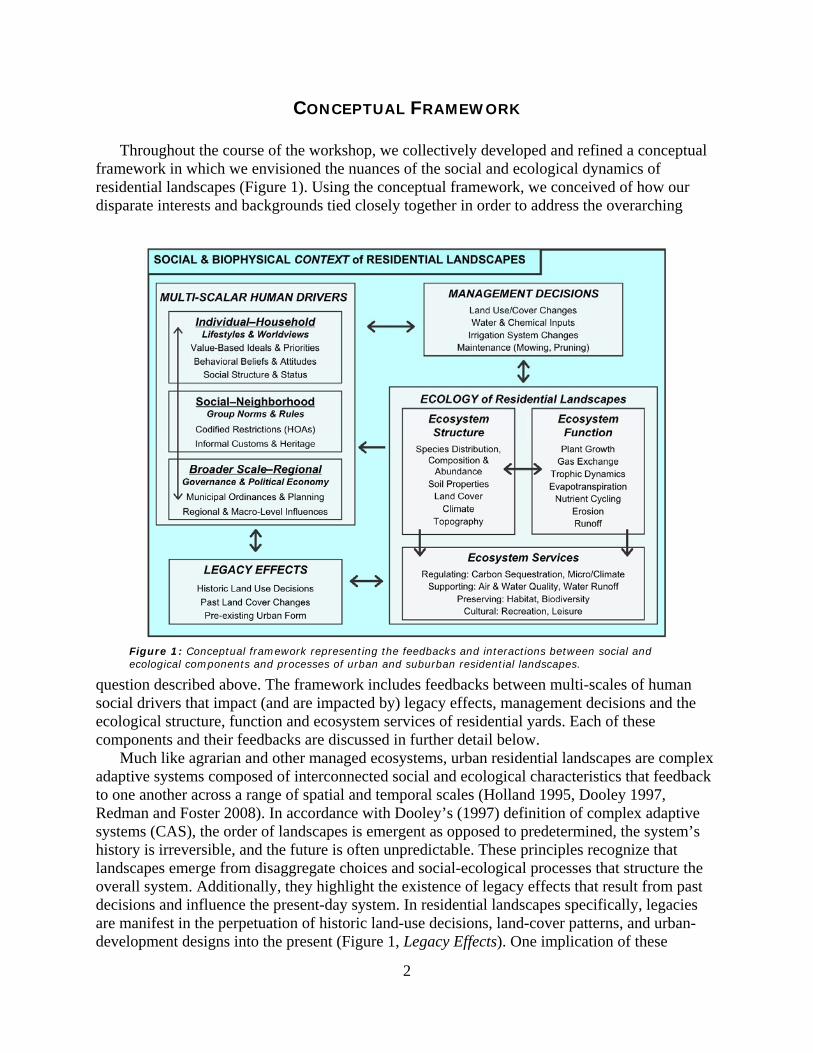
Throughout the course of the workshop, we collectively developed and refined a conceptual framework in which we envisioned the nuances of the social and ecological dynamics of residential landscapes (Figure 1). Using the conceptual framework, we conceived of how our disparate interests and backgrounds tied closely together in order to address the overarching
question described above. The framework includes feedbacks between multi-scales of human social drivers that impact (and are impacted by) legacy effects, management decisions and the ecological structure, function and ecosystem services of residential yards. Each of these components and their feedbacks are discussed in further detail below.
Much like agrarian and other managed ecosystems, urban residential landscapes are complex adaptive systems composed of interconnected social and ecological characteristics that feedback to one another across a range of spatial and temporal scales (Holland 1995, Dooley 1997, Redman and Foster 2008). In accordance with Dooley’s (1997) definition of complex adaptive systems (CAS), the order of landscapes is emergent as opposed to predetermined, the system’s history is irreversible, and the future is often unpredictable. These principles recognize that landscapes emerge from disaggregate choices and social-ecological processes that structure the overall system. Additionally, they highlight the existence of legacy effects that result from past decisions and influence the present-day system. In residential landscapes specifically, legacies are manifest in the perpetuation of historic land-use decisions, land-cover patterns, and urban-development designs into the present (Figure 1, Legacy Effects). One implication of these
Figure 1: Conceptual framework representing the feedbacks and interactions between social and ecological components and processes of urban and suburban residential landscapes.
3
legacies is that historic choices evident in current landscapes may not reflect residents’ actual preferences or modern tastes. Further, preexisting urban-ecological structure (i.e., yard/property characteristics, land cover types or amounts) may continuously shape both cultural expectations (e.g., for grass lawns) and land management practices (e.g., due to the need to irrigate lawns or other existing vegetation), thereby influencing the ecological functioning and ecosystem services of residential yards. Regarding legacy effects, we are primarily concerned in this report with past development decisions and the associated social institutions that govern residential landscape management practices and ecological structure.
Beyond recognizing the importance of legacy effects, our approach examines multiple scales of human drivers that theoretically influence landscape management decisions and the ecological structure (and ultimately, functioning and ecosystem services) of residential yards. Specifically, we envision individual-scale household factors (cognitive and structural drivers), group-level social drivers (formal and informal institutions), and broader-scale structures (governance and political-economic forces) as determinants of residential yard choices and ecological patterns in cities (Figure 1, Human Drivers). At the smallest scale, individuals’ lifestyle factors (e.g., values and interests) and personal views (e.g., beliefs about specific behaviors and environmental impacts) comprise important cognitive drivers, whereas household and property characteristics (e.g., income and home values) potentially affect landscape choices. At a broader scale, formal and informal institutions operate across social groups to impact the management choices and ecological structure of landscapes. Formal institutions involve the rules and restrictions codified in legal policies that govern neighborhoods, municipalities, or other socio-spatial units, while informal institutions involve the norms and expectations of particular social groups or neighborhoods. Finally, and most broadly, political-economic forces (e.g., markets and marketing campaigns) influence residential landscaping as significant human drivers. Herein, we primarily focus on the small-scale drivers at the household and neighborhood scales, with special attention to the value basis on land management choices. At a neighborhood and regional scale, we focus upon the nature and extent of formal landscaping rules in HOA CC&Rs and associated decisions made by the developers of residential housing units throughout metropolitan Phoenix.
Residential land management practices at the household scale are complex and multidimensional, involving numerous choices and potential behaviors in both the front and back yards. Homeowners choose a suite of structural attributes and management practices for their residences, including: the types and amount of cover (impervious and/or vegetative cover) involving the addition or removal of grass, plants, or pavement; the type, timing, amount, and frequency of chemical and water inputs, including investments in irrigation technology (automated sprinklers or drip-irrigation, for example); and, ongoing maintenance activities, such as mowing grass and pruning plants and trees (Figure 1, Management Decisions).
Current or past management decisions in turn affect the biotic and abiotic structure of yards, including the physical components of a residential landscape such as species composition, soil characteristics, topology and microclimate (Figure 1, Ecosystem Structure). Additionally, the ecological structure of yards will ultimately affect its role in ecological processes, such as movement of energy or materials within yard components, between yards in the neighborhood, or between the neighborhood and the atmosphere or watershed (Figure 1, Ecosystem Function). These processes include actions from non-human organisms that inhabit residential landscapes, such as pollination of yard plants by insects, use of trees by birds, transpiration by plants, and nutrient cycling by soil microorganisms. While these functions occur for the benefit of the organisms that perform them, they have additional benefits that are enjoyed by humans, which
4
we call ecosystem services (Figure 1, Ecosystem Services). Ecosystem services are the benefits humans receive from the surrounding environment through climate regulation (e.g., carbon sequestration and microclimates), support of life requirements (e.g., air quality and water quality), preservation of genetic diversity (e.g. habitat, biodiversity) and cultural amenities (e.g., recreation). All three of these ecological components of yards can alter other factors that comprise the dynamic, residential landscape system. For example, species planted in yards can survive over time to become legacies of former management decisions, and ecosystem services derived from yards can feedback to affect human drivers of management practices. In our workshop research, we focused on understanding the structural attributes of yards and land-cover choices in relation to the individual-household and regional-neighborhood scale drivers.
STUDY AREA: METROPOLITAN PHOENIX, ARIZONA
Phoenix, Arizona is the fifth largest city in the U.S., with approximately three and a half
million residents (Gober 2006). Situated in the Sonoran Desert ecosystem, the area receives less than eight inches of rainfall annually during two rainy seasons. Yet the presence of surface and groundwater resources, along with historic resource development projects, have allowed the existence of well-watered grass lawns, green turfgrass golf courses, and numerous artificial lakes common throughout the region today. The legacies of past human management are evident from the prehistoric Hohokam, who pioneered 1,000 miles of irrigation canals on which the current water distribution system is based. More recently, the development of dams in the early 1900s and the 336-mile Central-Arizona Project canal in the late 1990s are a testament to human modification of the regional landscape, wherein water has been redistributed to households for irrigating grass and plants in yards, among other uses. This tradition of watering the desert has resulted in a lush “oasis” environment that negates the native ecosystem, a notion formally promoted with historic and modern campaigns claiming “the desert is a myth” (Larson et al. in review).
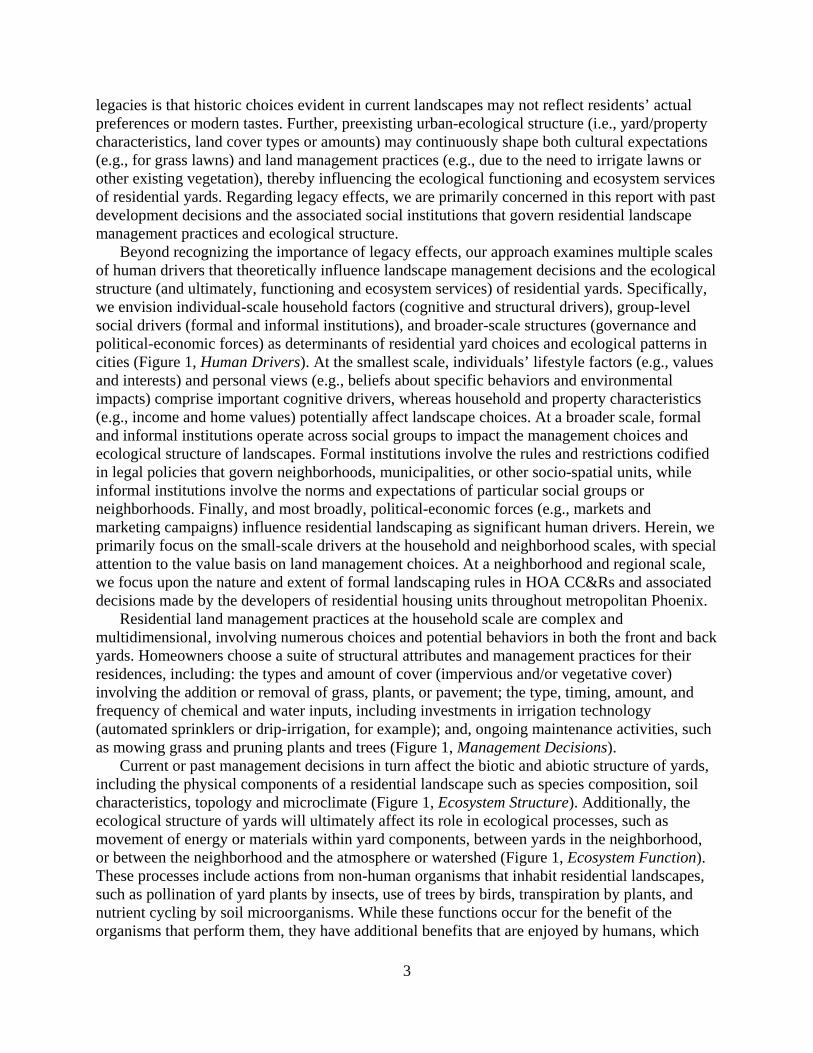
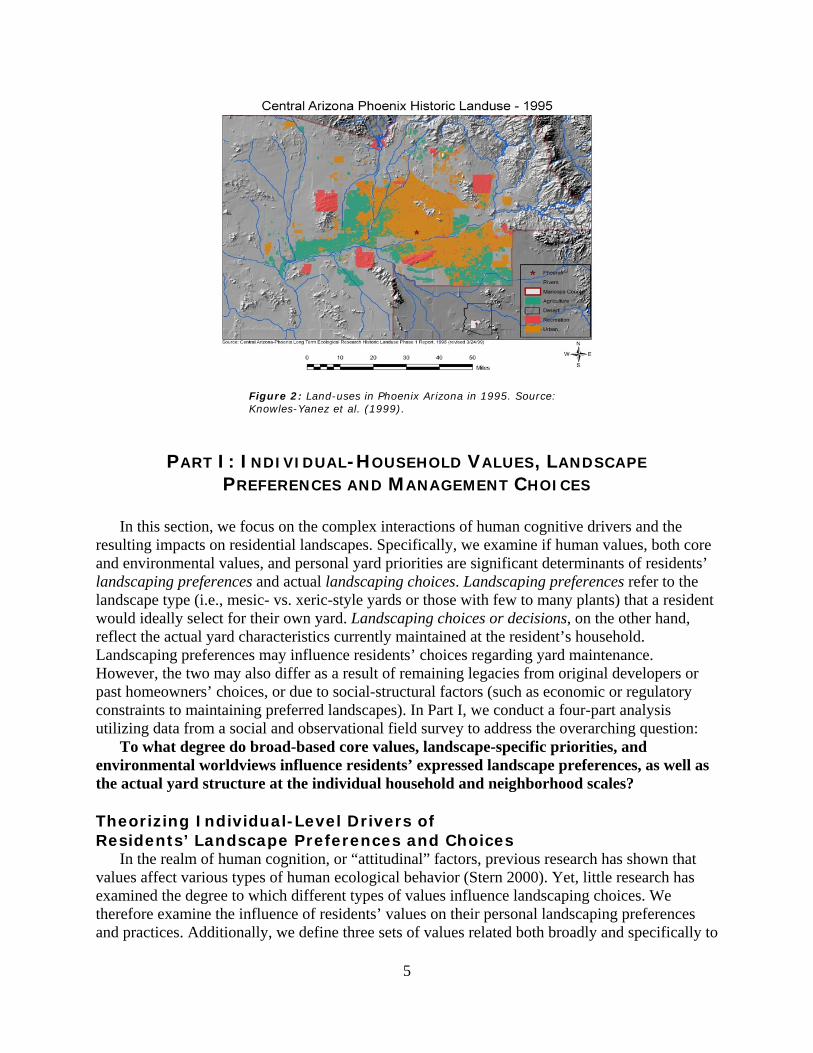
With vast amounts of desert land in all directions and few natural barriers to outward expansion, the Phoenix metropolitan region is an attractive area for real estate investment and development. Municipalities eagerly annex new land and compete with neighboring cities by offering tax incentives to attract new development. The extent to which the local economy depends on growth has been quantified in a number of studies. One such study estimates that 20 percent of local jobs depend upon the development industry in some respect, ranging from construction workers to real estate speculators (Laing 1988). A major newspaper, The Arizona Republic, calculated that of the regions $140 billion local economy, approximately one of every three dollars comes from transactions in the housing industry (Banking on Growth 2004). Other scholars quantify Phoenix’s penchant for growth in terms of land-use change, where mass conversions of previously agricultural and desert lands have resulted in close to a tripling of the urban land in the region, from 273 square miles in 1975 to 732 in 1995 (Figure 2; Knowles-Yanez et al. 1999, Waits 2000). With the expansion of residential and other urban land uses in the region, the vegetative and impervious cover in these areas has important implications for biodiversity, water use and flows, and other ecological patterns and processes.
5
Figure 2: Land-uses in Phoenix Arizona in 1995. Source: Knowles-Yanez et al. (1999).
PART I: INDIVIDUAL-HOUSEHOLD VALUES, LANDSCAPE
PREFERENCES AND MANAGEMENT CHOICES
In this section, we focus on the complex interactions of human cognitive drivers and the resulting impacts on residential landscapes. Specifically, we examine if human values, both core and environmental values, and personal yard priorities are significant determinants of residents’ landscaping preferences and actual landscaping choices. Landscaping preferences refer to the landscape type (i.e., mesic- vs. xeric-style yards or those with few to many plants) that a resident would ideally select for their own yard. Landscaping choices or decisions, on the other hand, reflect the actual yard characteristics currently maintained at the resident’s household. Landscaping preferences may influence residents’ choices regarding yard maintenance. However, the two may also differ as a result of remaining legacies from original developers or past homeowners’ choices, or due to social-structural factors (such as economic or regulatory constraints to maintaining preferred landscapes). In Part I, we conduct a four-part analysis utilizing data from a social and observational field survey to address the overarching question:
To what degree do broad-based core values, landscape-specific priorities, and environmental worldviews influence residents’ expressed landscape preferences, as well as the actual yard structure at the individual household and neighborhood scales? Theorizing Individual-Level Drivers of Residents’ Landscape Preferences and Choices
In the realm of human cognition, or “attitudinal” factors, previous research has shown that values affect various types of human ecological behavior (Stern 2000). Yet, little research has examined the degree to which different types of values influence landscaping choices. We therefore examine the influence of residents’ values on their personal landscaping preferences and practices. Additionally, we define three sets of values related both broadly and specifically to
6
the environment and landscaping priorities. Addressing the potential role of different value sets in affecting residents’ landscaping decisions and preferences will build upon past research, as well as further our understanding of the link between individual human drivers and the ecological functioning and ecosystem services of residential yards.
First, core values, as defined by Schwartz (1994), reflect what is most important to people broadly, transcending situational contexts. Schwartz has specifically categorized and tested the universality of four broad core value dimensions: altruism, selfishness, traditional, and openness-to-change. The theoretical and empirical link between values and pro-ecological behaviors has been made by Stern (2000), such that people with self-transcending altruistic values and pro-environmental orientations tend to act in environmentally friendly ways (Stern 2000). While the role of values in residential landscaping decisions has not been widely researched, similar relationships might be found to explain low water-use (xeric) yard choices or other management decisions, such as the use of pesticides. For example, a resident with conservative or individualistic values might prefer the traditional grass lawn that permeates most American residential properties and neighborhoods. Meanwhile, people who are open-to-change might embrace modern drought-tolerant xeric-type yards. Herein, we test these research expectations for the four value dimensions as defined by Schwartz.
Second, beyond core values, yard maintenance priorities, or landscape-specific values, may be another important influence of landscaping preferences and practices. Landscape-specific priorities explain what residents’ consider most important about their outdoor yard space. For example, residents may prefer and manage their yard differently depending on whether they prioritize their yard’s utilitarian usage or its aesthetic value. Scholars have identified several main reasons explaining residents’ landscaping preferences: appearance, environmental concern, maintenance, and recreation (Martin et al. 2003, Larsen and Harlan 2006, Larson et al. in review). These landscape-specific values, or yard priorities, have been hypothesized to have an observable impact in the manifestation of the residential landscape chosen by the homeowner. If residents’ value children’s play space and safety of the yard, for example, they may be more apt to choose a mesic-type landscape. Previous research has in fact shown that parents frequently choose mesic landscapes for fear that certain types of cacti will harm their children (Yabiku et al. 2008, Larson et al. in review). In a qualitative review, Larsen and Harlan (2006) found that a residents’ concern about the environment may lead to xeric landscaping preferences due to their potential for water conservation (Hurd et al. 2006). However, it is unclear if these values which influence preferences similarly affect the residents’ decisions regarding their actual landscaping choices. In our study, we quantitatively analyzed various yard management priorities in relation to both expressed yard preferences and observed landscape types.
Finally, residents’ environmental orientations or worldviews are another potential value set that could explain landscaping preferences or practices. Specifically, environmental orientation reflects ones’ ideals in terms of either valuing the environment beyond human uses (ecocentric orientation), or valuing humans over the environment (anthropocentric orientation) (Dunlap et al. 2000). Dunlap and colleagues (2000) defined how these ecological worldviews could be expressed as ecocentric or anthropocentric using the New Ecological Paradigm (NEP) scale. The questions and constructs of the NEP allow researchers to link environmental orientation with attitudes and behaviors. Many studies have reported that a pro-environmental orientation does in fact often lead to ecologically friendly behaviors, such as recycling or reducing water use (Nordlund and Garvill 2002, Corral-Verdugo et al. 2003). Residents’ environmental orientation would be expected, then, to explain eco-friendly landscaping preferences and practices. For
7
example, given the ecological impacts of landscaping choices, people with an ecocentric orientation may express preferences and undertake practices to minimize water use and match the native ecology in their yard.
The link, however, between a pro-environmental orientation and ecologically friendly landscaping preferences versus practices has not been consistently shown. For example, Yabiku and colleagues (2008) found that residents in Phoenix with strong ecocentric, pro-environmental, attitudes did not report a strong preference for desert-like xeric yards, but did report a willingness to reduce the percentage of grass in their yards. On the other hand, the residents with anthropocentric orientations tended to have a strong preferences for mesic, high water-use landscaping. Larsen and Harlan (2006) found a similar disconnect between environmental concern and landscaping preferences and practices, particularly when contrasting front and back yard preferences. Using regression techniques, the authors reported that residents’ environmental concerns do not predict their landscaping preferences. While they noted that a preference for desert-like landscaping in the front yard was explained by environmental reasons and the ease of maintenance, the association between environmental concern and backyard landscaping preferences was not as strong. This inconsistency is echoed in studies performed by Templeton et al. (1999) and Robbins et al. (2001) in which those residents who expressed more concern for the environment actually used more pesticides in their yards. Given the inconsistent results presented here, more research is needed to clarify the relationship of general (core) and specific (environmental and yard-specific) values to landscaping preferences and practices.
We seek to address these mixed findings by teasing apart the influence of broad core values, landscape-specific priorities, and environmental orientation in relation to both landscape preferences and practices. We generally expect that landscape-specific priorities may be more important than broader core values and ecological orientations for particular yard choices, while all types of values are expected to more closely influence preferences relative to actual management practices. However, the connection between values and landscaping practices may be overshadowed by the top-down influence of structural factors, such as municipal or neighborhood regulations on yard structure, or the legacy effects of past choices. Research Methods: Individual-Household Values, Landscape Preferences and Choices
We investigated the link between residents’ values and their landscaping preferences and practices by merging social and ecological data from 121 households from four neighborhoods within the City of Phoenix. Using a stratified sampling design, data were collected during the spring and summer of 2007 and 2008 in a jointly designed mail-based social survey and observational field survey. Approximately 100 homes from each of the case study neighborhoods were randomly chosen to target diverse communities in the inner city and at the city’s fringe. The four case study neighborhoods were selected to represent a range of social and ecological characteristics, such as year the neighborhood was developed, median household income, ethnicity, and typical yard type (e.g., mesic vs. xeric). Two historic neighborhoods in the urban core of Phoenix include the relatively wealthy Encanto area with flood irrigation and grass lawns, and the lower income, predominately Latino (Hispanic Core) neighborhood composed mainly of bare dirt yards. Two additional fringe neighborhoods represent newer developments in Phoenix with a predominance of xeric landscaping in the front yards, including the middle income North Phoenix neighborhood with smaller tract homes, and the wealthy Ahwatukee neighborhood in the foothills of South Phoenix.
8
The social survey was designed to obtain data on the management preferences and decisions of the homeowner’s residential landscape, including their front and backyard characteristics (Appendix 1). Social survey responses also informed the project on the resident’s values, norms, and beliefs as potential cognitive drivers of landscape decisions and management practices, among other variables collected. Overall, a 38% response rate was achieved for the social survey, or 121 responses out of approximately 400 households surveyed. Due to only seven households responding from the Hispanic Core neighborhood, this neighborhood was excluded from the neighborhood-scale analyses. These households were included, however, in the analyses performed at the household scale. For most analyses, we had a sample size (n) of 121 at the household scale and of 114 at the neighborhood scale (distributed among three neighborhoods).
The observational field survey was performed by three researchers who recorded specific data on yard quality, species composition, and percent grass, rock, and canopy cover, among other attributes (Appendix 3). Observations were recorded from the sidewalk in front of the house and included the front and side areas of the yard. Prior to data collection on the field survey, researchers calibrated their estimates on 10 yards where the percent cover was measured directly. This process allowed the field survey observers to accurately estimate percent cover. Field survey observations were taken on 440 yards (110 yards per neighborhood), but the analysis presented herein was limited to those households that responded to the social survey.
In order to accurately evaluate the values held by the homeowners, we created value indices by averaging social survey questions into composite indices to provide reliable indicators of important dimensions of values. For the core values, we used predetermined categories created by Schwartz (1994) (altruism vs. selfish, open to change vs. traditional) to create four indices of core values (using Questions 23a – i in Appendix 1). For the landscape-specific priorities (Questions 2c – h) and environmental orientation constructs (Questions 25 a – i in Appendix 1), an exploratory factor analysis was performed on each group of questions to determine the appropriate set of questions for each individual index (see Table 1 for a list of indices created from each construct, see Appendix 2 for factor analysis results).
After the questions were grouped according to the significant value factors, Cronbach’s alpha tests were performed to evaluate the reliability (or internal consistency) of these groupings. All of our indices were statistically dependable, with alpha values over 0.5 and the majority above 0.7, the more ideal criterion (Table 1). The responses for the questions categorized together were then averaged to create an index. The landscape-specific priorities produced three indices, labeled leisure, ease of care/environmental impact (eco-maintenance), and social fit. These indices provide insight into the homeowners’ desire or priorities about how and why they manage their residential landscape. For instance, if the homeowner scored high on the leisure index, having a landscape conducive to relaxing or socializing is a high priority. The environmental orientation construct produced two indices of ecocentric and anthropocentric worldviews, as described above.
9
We addressed the overarching research question through four smaller-scale questions that build
upon one another and lead to a better understanding of the overall objective. In exploring these questions at an individual homeowner level, the neighborhood scale is also indispensable in understanding how demographics and neighborhood relationships may dictate decisions and preferences. We also posed the larger, neighborhood-scale question to determine if values differ across neighborhoods. For example, values may be more clearly represented through the yard structure in some neighborhoods compared to others due to institutional factors, such as HOAs, which are the focus of Part II of this report.
Results: Individual-Household Values, Landscape Preferences and Choices Question 1: Individual and Neighborhood Differences in Values and Yard Characteristics
Question 1 asked what, if any, descriptive patterns could be found in the social and ecological data among individuals and neighborhoods. We hypothesized that variability would be lower within neighborhoods compared to that among them due to institutional factors such as neighborhood norms and Homeowner Association restrictions on landscaping decisions. With this question, we examined residents’ values (measured by the value indices defined above) and resulting landscaping choices, encompassing ecological patterns of species composition and yard cover type across households and neighborhoods. These analyses shed light on the inherent differences among households and neighborhoods, which may clarify the patterns in yard characteristics, expressed yard preferences, and values held by the homeowners.
The core social value indices (altruism, selfishness, traditional, and open-to-change) ranged only between 3.0 and 6.0 for all respondents on a 1-6 point ordinal scale, where 6 indicates a
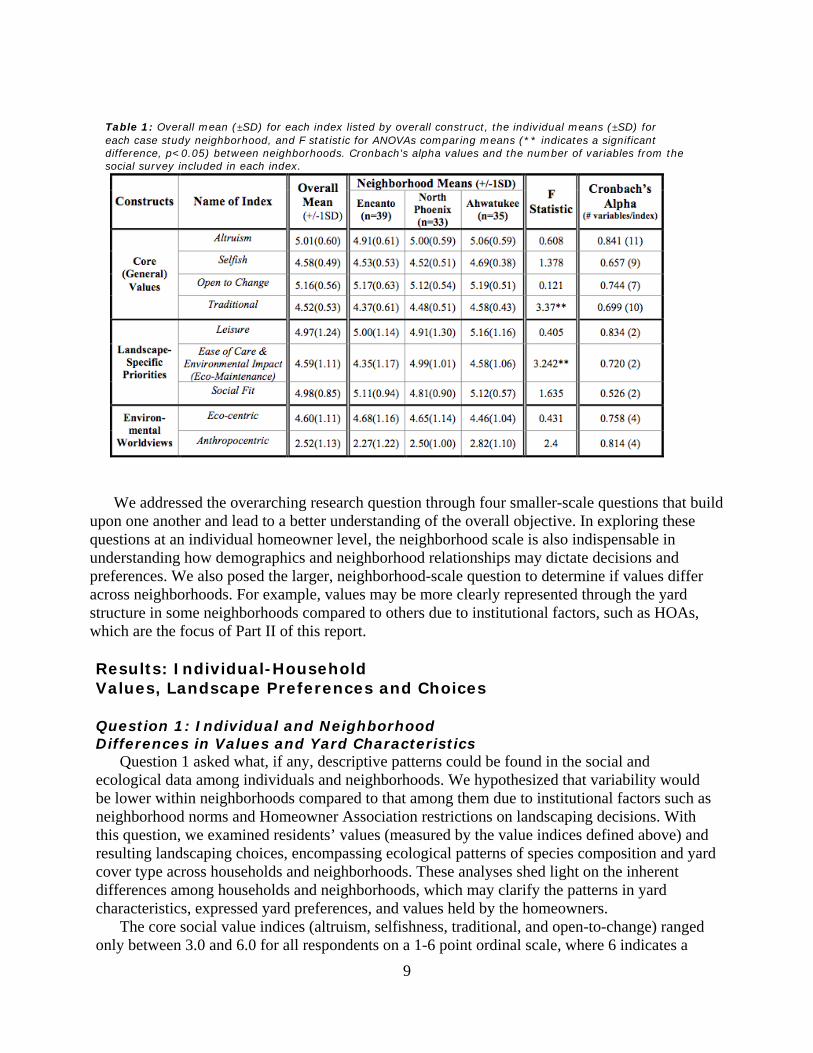
Table 1: Overall mean (±SD) for each index listed by overall construct, the individual means (±SD) for each case study neighborhood, and F statistic for ANOVAs comparing means (** indicates a significant difference, p<0.05) between neighborhoods. Cronbach's alpha values and the number of variables from the social survey included in each index.
10
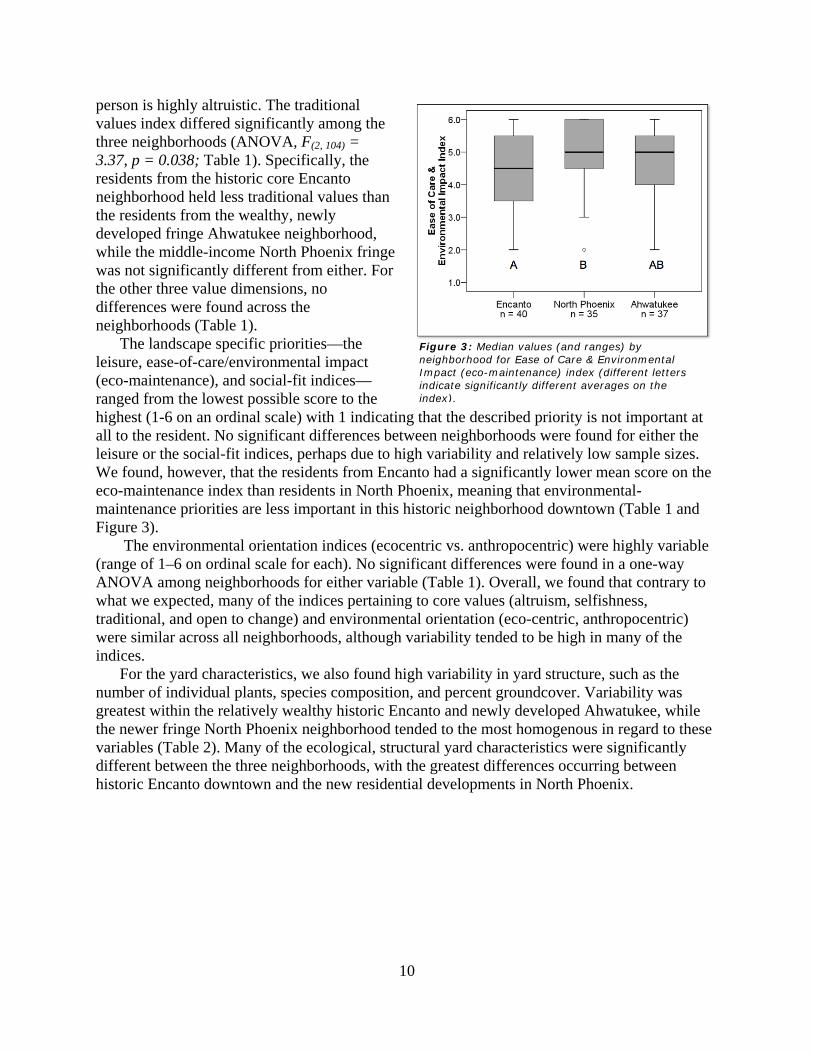
person is highly altruistic. The traditional values index differed significantly among the three neighborhoods (ANOVA, F(2, 104) = 3.37, p = 0.038; Table 1). Specifically, the residents from the historic core Encanto neighborhood held less traditional values than the residents from the wealthy, newly developed fringe Ahwatukee neighborhood, while the middle-income North Phoenix fringe was not significantly different from either. For the other three value dimensions, no differences were found across the neighborhoods (Table 1).
The landscape specific priorities—the leisure, ease-of-care/environmental impact (eco-maintenance), and social-fit indices—ranged from the lowest possible score to the highest (1-6 on an ordinal scale) with 1 indicating that the described priority is not important at all to the resident. No significant differences between neighborhoods were found for either the leisure or the social-fit indices, perhaps due to high variability and relatively low sample sizes. We found, however, that the residents from Encanto had a significantly lower mean score on the eco-maintenance index than residents in North Phoenix, meaning that environmental-maintenance priorities are less important in this historic neighborhood downtown (Table 1 and Figure 3).
The environmental orientation indices (ecocentric vs. anthropocentric) were highly variable (range of 1–6 on ordinal scale for each). No significant differences were found in a one-way ANOVA among neighborhoods for either variable (Table 1). Overall, we found that contrary to what we expected, many of the indices pertaining to core values (altruism, selfishness, traditional, and open to change) and environmental orientation (eco-centric, anthropocentric) were similar across all neighborhoods, although variability tended to be high in many of the indices.
For the yard characteristics, we also found high variability in yard structure, such as the number of individual plants, species composition, and percent groundcover. Variability was greatest within the relatively wealthy historic Encanto and newly developed Ahwatukee, while the newer fringe North Phoenix neighborhood tended to the most homogenous in regard to these variables (Table 2). Many of the ecological, structural yard characteristics were significantly different between the three neighborhoods, with the greatest differences occurring between historic Encanto downtown and the new residential developments in North Phoenix.
Figure 3: Median values (and ranges) by neighborhood for Ease of Care & Environmental Impact (eco-maintenance) index (different letters indicate significantly different averages on the index).
11
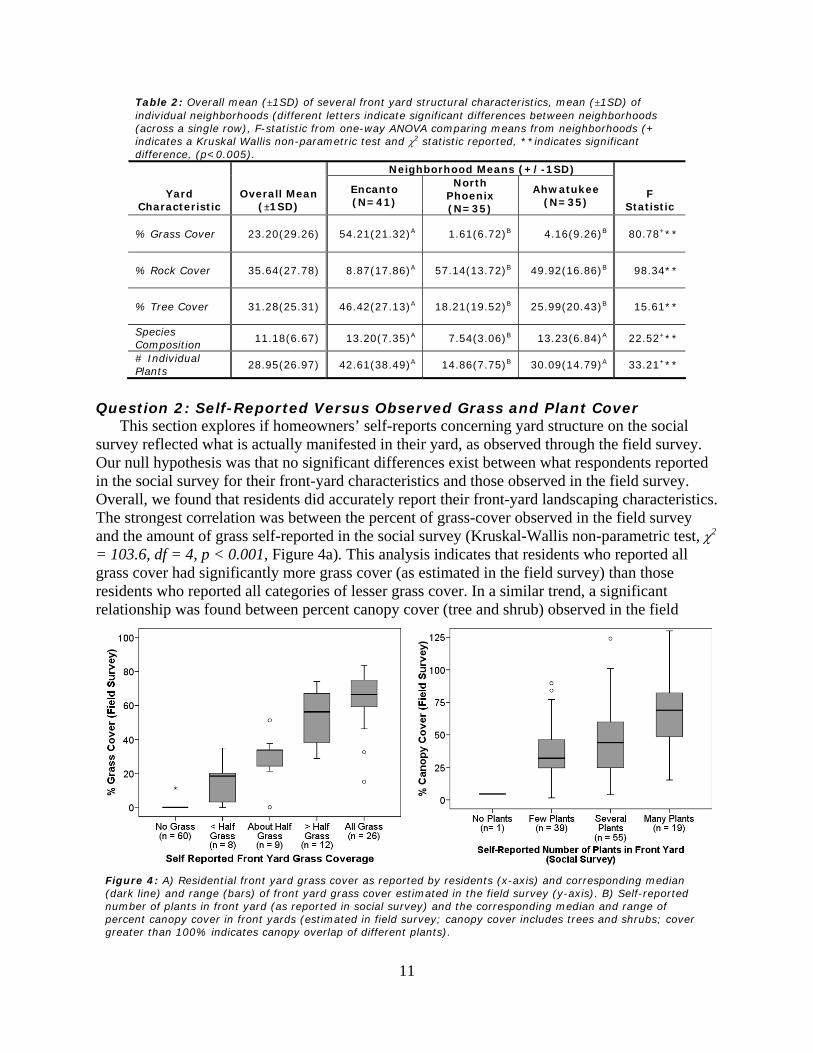
Figure 4: A) Residential front yard grass cover as reported by residents (x-axis) and corresponding median (dark line) and range (bars) of front yard grass cover estimated in the field survey (y-axis). B) Self-reported number of plants in front yard (as reported in social survey) and the corresponding median and range of percent canopy cover in front yards (estimated in field survey; canopy cover includes trees and shrubs; cover greater than 100% indicates canopy overlap of different plants).
Question 2: Self-Reported Versus Observed Grass and Plant Cover This section explores if homeowners’ self-reports concerning yard structure on the social
survey reflected what is actually manifested in their yard, as observed through the field survey. Our null hypothesis was that no significant differences exist between what respondents reported in the social survey for their front-yard characteristics and those observed in the field survey. Overall, we found that residents did accurately report their front-yard landscaping characteristics. The strongest correlation was between the percent of grass-cover observed in the field survey and the amount of grass self-reported in the social survey (Kruskal-Wallis non-parametric test, χ2 = 103.6, df = 4, p < 0.001, Figure 4a). This analysis indicates that residents who reported all grass cover had significantly more grass cover (as estimated in the field survey) than those residents who reported all categories of lesser grass cover. In a similar trend, a significant relationship was found between percent canopy cover (tree and shrub) observed in the field
Table 2: Overall mean (±1SD) of several front yard structural characteristics, mean (±1SD) of individual neighborhoods (different letters indicate significant differences between neighborhoods (across a single row), F-statistic from one-way ANOVA comparing means from neighborhoods (+ indicates a Kruskal Wallis non-parametric test and χ2 statistic reported, **indicates significant difference, (p<0.005).
Neighborhood Means (+/-1SD)
Yard Characteristic
Overall Mean (±1SD)
Encanto (N=41)
North Phoenix (N=35)
Ahwatukee (N=35)
F Statistic
% Grass Cover 23.20(29.26) 54.21(21.32)A 1.61(6.72)B 4.16(9.26)B 80.78+**
% Rock Cover 35.64(27.78) 8.87(17.86)A 57.14(13.72)B 49.92(16.86)B 98.34**
% Tree Cover 31.28(25.31) 46.42(27.13)A 18.21(19.52)B 25.99(20.43)B 15.61**
Species Composition
11.18(6.67) 13.20(7.35)A 7.54(3.06)B 13.23(6.84)A 22.52+**
# Individual Plants
28.95(26.97) 42.61(38.49)A 14.86(7.75)B 30.09(14.79)A 33.21+**
12
survey and self-reported quantity of plants in front yards (Kruskal-Wallis non-parametric test, χ2 = 16.89, df = 3, p = 0.001, Figure 4b). However, high variation was found within categories of self-reported number of plants, especially in yards reporting several plants or plants covering most of the yard.
Question 3: Landscape Preferences Versus Manifest Landscape Choices
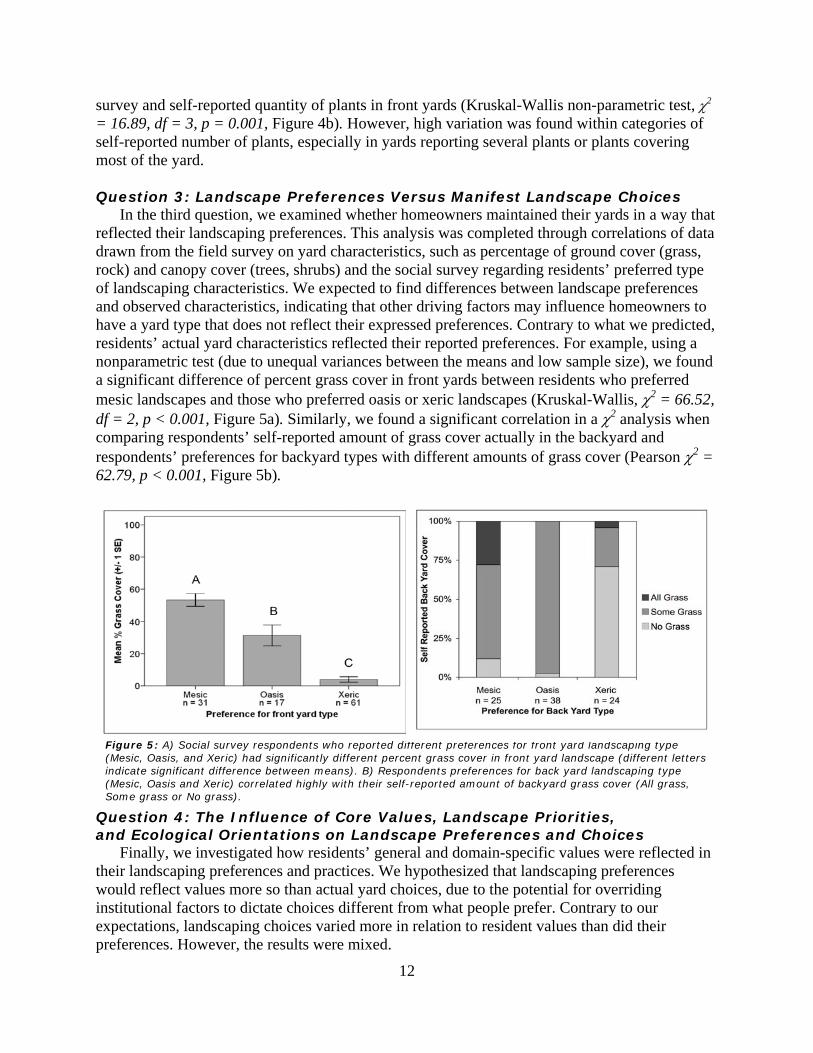
In the third question, we examined whether homeowners maintained their yards in a way that reflected their landscaping preferences. This analysis was completed through correlations of data drawn from the field survey on yard characteristics, such as percentage of ground cover (grass, rock) and canopy cover (trees, shrubs) and the social survey regarding residents’ preferred type of landscaping characteristics. We expected to find differences between landscape preferences and observed characteristics, indicating that other driving factors may influence homeowners to have a yard type that does not reflect their expressed preferences. Contrary to what we predicted, residents’ actual yard characteristics reflected their reported preferences. For example, using a nonparametric test (due to unequal variances between the means and low sample size), we found a significant difference of percent grass cover in front yards between residents who preferred mesic landscapes and those who preferred oasis or xeric landscapes (Kruskal-Wallis, χ2 = 66.52, df = 2, p < 0.001, Figure 5a). Similarly, we found a significant correlation in a χ2 analysis when comparing respondents’ self-reported amount of grass cover actually in the backyard and respondents’ preferences for backyard types with different amounts of grass cover (Pearson χ2 = 62.79, p < 0.001, Figure 5b).
Question 4: The Influence of Core Values, Landscape Priorities, and Ecological Orientations on Landscape Preferences and Choices
Finally, we investigated how residents’ general and domain-specific values were reflected in their landscaping preferences and practices. We hypothesized that landscaping preferences would reflect values more so than actual yard choices, due to the potential for overriding institutional factors to dictate choices different from what people prefer. Contrary to our expectations, landscaping choices varied more in relation to resident values than did their preferences. However, the results were mixed.
Figure 5: A) Social survey respondents who reported different preferences for front yard landscaping type (Mesic, Oasis, and Xeric) had significantly different percent grass cover in front yard landscape (different letters indicate significant difference between means). B) Respondents preferences for back yard landscaping type (Mesic, Oasis and Xeric) correlated highly with their self-reported amount of backyard grass cover (All grass, Some grass or No grass).
13
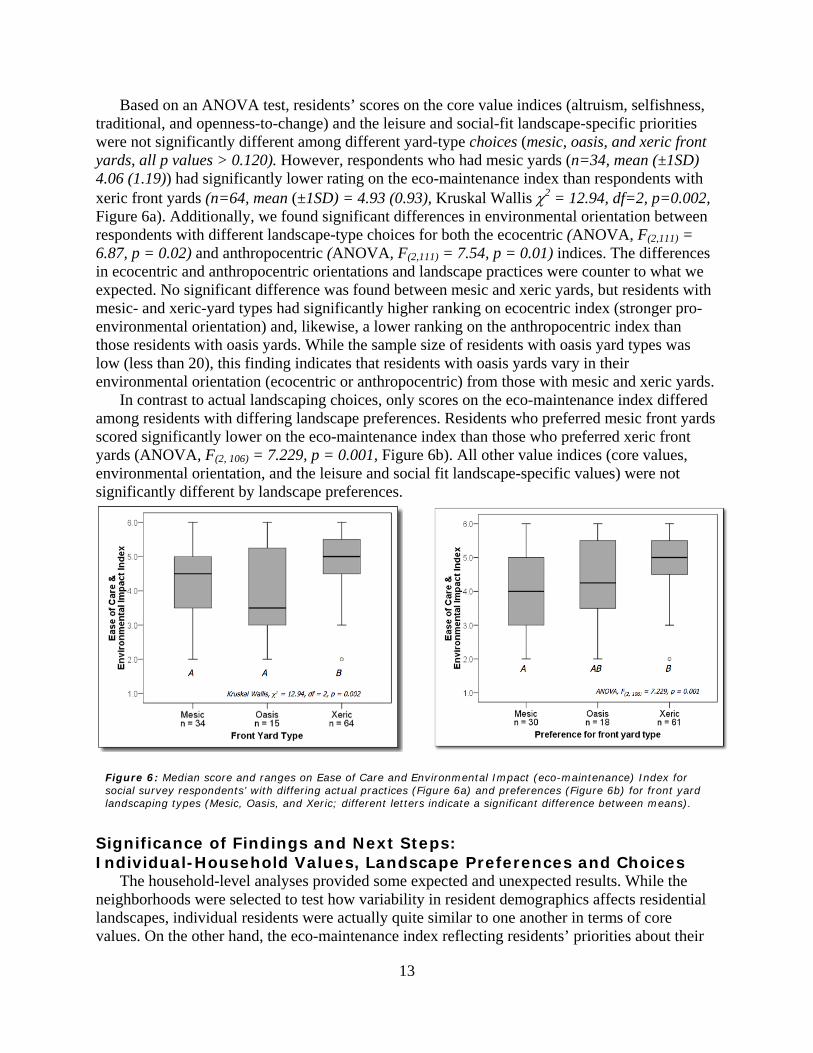
Based on an ANOVA test, residents’ scores on the core value indices (altruism, selfishness, traditional, and openness-to-change) and the leisure and social-fit landscape-specific priorities were not significantly different among different yard-type choices (mesic, oasis, and xeric front yards, all p values > 0.120). However, respondents who had mesic yards (n=34, mean (±1SD) 4.06 (1.19)) had significantly lower rating on the eco-maintenance index than respondents with xeric front yards (n=64, mean (±1SD) = 4.93 (0.93), Kruskal Wallis χ2 = 12.94, df=2, p=0.002, Figure 6a). Additionally, we found significant differences in environmental orientation between respondents with different landscape-type choices for both the ecocentric (ANOVA, F(2,111) = 6.87, p = 0.02) and anthropocentric (ANOVA, F(2,111) = 7.54, p = 0.01) indices. The differences in ecocentric and anthropocentric orientations and landscape practices were counter to what we expected. No significant difference was found between mesic and xeric yards, but residents with mesic- and xeric-yard types had significantly higher ranking on ecocentric index (stronger pro-environmental orientation) and, likewise, a lower ranking on the anthropocentric index than those residents with oasis yards. While the sample size of residents with oasis yard types was low (less than 20), this finding indicates that residents with oasis yards vary in their environmental orientation (ecocentric or anthropocentric) from those with mesic and xeric yards.
In contrast to actual landscaping choices, only scores on the eco-maintenance index differed among residents with differing landscape preferences. Residents who preferred mesic front yards scored significantly lower on the eco-maintenance index than those who preferred xeric front yards (ANOVA, F(2, 106) = 7.229, p = 0.001, Figure 6b). All other value indices (core values, environmental orientation, and the leisure and social fit landscape-specific values) were not significantly different by landscape preferences.
Significance of Findings and Next Steps: Individual-Household Values, Landscape Preferences and Choices
The household-level analyses provided some expected and unexpected results. While the neighborhoods were selected to test how variability in resident demographics affects residential landscapes, individual residents were actually quite similar to one another in terms of core values. On the other hand, the eco-maintenance index reflecting residents’ priorities about their
Figure 6: Median score and ranges on Ease of Care and Environmental Impact (eco-maintenance) Index for social survey respondents’ with differing actual practices (Figure 6a) and preferences (Figure 6b) for front yard landscaping types (Mesic, Oasis, and Xeric; different letters indicate a significant difference between means).
14
landscape was significantly lower in the relatively wealthy, historic Encanto neighborhood than the newly developed North Phoenix fringe neighborhood. This landscape-specific value index was the only to vary significantly among neighborhoods. This finding may indicate that differences in these values may not exist spatially at this scale. Moreover, other cognitive factors (i.e., norms and beliefs), as well as social-structural drivers, should be highlighted for future analyses.
Next, we found residents reliably self-reported their front-yard characteristics, such as percent grass and tree canopy cover. Statistical tests show a high correlation between the amount of grass reported in the social survey and the percent observed during the field survey. The back yard, in contrast to the front yard, may be an important sphere to understand the influence of homeowner values on the residential landscape. Previous research has shown that front yards and backyards are managed differently and are a reflection of public and private space, respectively (Martin et al. 2003, Larsen and Harlan 2006). No observations on the backyard were made during the field survey due to private property restrictions; however due to the high correlation between social survey answers and field survey observations of the front yard, we have a high-level of confidence that residents accurately self-reported back yard characteristics in their social survey answers. In future analyses, we will investigate the differences between back and front yards using social survey responses about yard characteristics.
Subsequently, residents’ landscaping preferences closely mirrored their actual yard characteristics, or landscape management decisions. This finding is somewhat counter to Larsen and Harlan’s (2006) conclusion that preferences diverge from choices for only one-third of Phoenix residents. Since their study examined categorical types of landscapes (e.g., xeric yards vs. mesic lawns), our results illustrate that residents’ may be willing to compromise on particular yard characteristics (such as the amount of lawn), as opposed to realizing particular landscape ideals (such as a fully turfgrass yard). This is consistent with other research that has found strong preferences for mixed “oasis” style landscapes, which may present a ‘best of both worlds’ option (Larson et al. in review).
Overall, the core values and environmental orientation did not have a measurable effect on the preferences or manifestations of yard types in the neighborhoods analyzed. We found, however, a consistent pattern linking eco-maintenance, as a landscape-specific priority, to both landscaping preferences and practices. Residents who either maintained desert-like yards or preferred these xeric yards prioritized easy yard maintenance and the environment in their decisions. At this point, our main hypothesis that values may be driving residential yard structure is not supported, but the relatively specific value domains (ecological and landscape-specific) were more significant than broad core values. Other avenues of analysis may help to clarify the relationships between values and other cognitive drivers (e.g., beliefs and norms) and landscape choices. For example, categorizing the homeowners in different ways (i.e., the homeowners who changed their yards vs. those who did not), as opposed to simply looking at the differences among neighborhoods, may lead to more significant findings when plotting the value indices. Additionally, we may find clearer links between values and management practices if specific management behaviors (i.e. number of times/month water or pesticides are applied to yard) are used in the analyses.
In sum, our individual-household analyses suggest that factors other than values likely drive landscape preferences and practices. While the lack of clear answers may be a function of sample size, further analyses will help to clarify our mixed findings. Moreover, the analyses presented in
15
the next section provide additional insights into how neighborhood- and regional-scale drivers influence landscape management practices and ecological structure in the Phoenix region.
PART II: BROADER-SCALE DRIVERS OF RESIDENTIAL LANDSCAPE STRUCTURE AND PRACTICES
Developers’ Decisions, Legacy Effects and Social Institutions
In order to enhance understanding of the broader-scale drivers of residential yard structure and landscape management, this research aims to explore the neighborhood- and regional-level institutional and contextual factors that shape individuals’ yard-management choices, with particular focus on the legacy of developers’ decision-making processes and homeowners’ associations’ (HOAs) rules for landscape governance. Specifically, we address the following questions:
1. What are the institutional, environmental and social-structural drivers relevant to
decision-making in the development industry, and therefore, the production of residential landscapes over time in Central Arizona-Phoenix?
2. What features of residential landscapes are governed by Homeowner Associations through Covenants, Codes, and Restrictions, and what are the implications for ecological structure and ecosystem services?
Ecological legacies result proximately from human management practices and ultimately
from relatively distal human drivers from which management practices emerge (Diamond 2005). A landowner removing native vegetation and topography to plant a mesic grass lawn is a primary example of a proximate driver of ecological legacies—a physical management practice that directly results in changes to both the structure and function of a given landscape, which may last beyond the tenure of the resident. Access to subsidized water, the promotion of the region as a lush oasis in the desert, and financial and regulatory incentives that encourage growth are ultimate drivers that could potentially result in the aforementioned management practices in Phoenix. Legacy effects in land management are not limited solely to structural changes, such as irrigation infrastructure, species composition, and topography. They also describe relatively informal changes to the ultimate drivers of management practices, such as the establishment of neighborhood norms and broader political-economic forces favoring a certain yard type.
In previous ecological research, legacy effects have been studied predominately in terms of their proximate causes, attaching measureable biogeochemical or ecological disturbances to specific management practices. For instance, the current spread of woody juniper and pine in the traditionally semi-desert environment of Chaco Canyon, New Mexico, has been attributed to overharvesting by the Ancestral Puebloan people approximately 1,000 years ago (Swetnam et al. 1999). Considerably less attention has been given to the ultimate causes of ecological legacies—as the dynamic set of human drivers from which management practices emerge—and how these have changed over time. Moreover, studies of urban ecology tend to isolate the behaviors of individuals from the multitude of economic and cultural constraints that influence human interactions within urban ecosystems (Foster 2000). As a result, scholars increasingly recognize the importance of incorporating social, political, and cultural dimensions as part of a fundamental shift in the ways landscapes are managed and human ecosystems are understood
16
(Robbins et al. 2001, Haberl et al. 2006). Following from this perspective, Part II of this report addresses human drivers of residential landscape management practices by assessing decision-making in the development industry, as well as governance by the resulting HOAs, both of which ultimately have powerful influences on modern-day landscapes in metropolitan Phoenix and elsewhere.
The development industry and HOAs represent social institutions, which emerge from the repeated interaction of individuals (Chapin 1928) and are characterized by collective action toward a common interest (Ostrom 2000), emergent norms and values (Turner 1997), and temporal endurance (Giddens 1984). Individual agents establish social networks and gain social capital through such collectives (Putnam 2000), which serve to protect a common interest. Social institutions may be formal, bound by a set of legally or otherwise enforceable rules, or informal, bound by a common understanding or a set of shared norms and values. Social institutions are important mechanisms for sustainable natural resource management (Agrawal 2001), especially considering their endurance through time (Chapin 1928). Hence, we focus in this section of our report on neighborhood-level institutional forces in relation to residents’ land management practices and associated ecological structure.
Residential landscapes emerge from the decisions of individuals operating within a network of constraints imposed by social institutions at multiple scales. In this regard, the development industry as a whole represents an informal social institution bound by the common purpose of designing, constructing, and selling housing packages, including residential landscapes that will attract homebuyers and garner profits. Developers interact repeatedly in social networks, as both colleagues and competitors, resulting in the establishment of emergent norms, values, and collective action toward a common interest. Whereas decisions by individual developers may vary, the development industry as a whole coalesces around a common objective to maximize profits. Further, the development industry exhibits the temporal endurance common to social institutions in that specific development strategies are passed down through generations and current practices are predicated on past successes.
Social institutions evolve over time as a result of changing exogenous influences and interactions between institutional actors leading to new, emergent outcomes (Ostrom 2000), potentially leading to the emergence of new institutions. To translate this into terms relevant to residential landscapes, one can imagine a scenario in which the increasing cost of water and land (exogenous variables), coupled with competition between developers to provide homeowners with amenities such as grass lawns (interaction between actors), results in the advent of increasingly large-scale developments (emergent outcome), where open space and water use are reorganized to maximize the benefits and minimize the costs to developers and, by extension, individual homeowners. Such conditions have given rise to master-planned communities—large developments distinguished by a cohesive and unified-planning process incorporating amenities such as pools and clubhouses, community open and green space, and, increasingly, mixed-use zoning to foster local sources of employment and tax revenues (Duany et al. 2000). HOAs, a social institution that has emerged from the development industry, almost always govern master-planned communities (McKenzie 1994).
HOAs are semi-private, formal social institutions operating at the neighborhood scale. Members of HOAs are formally bound by a set of rules expressed in a legal document called Covenants, Codes and Restrictions (CC&Rs). Working within the framework of local laws such as zoning ordinances, developers of master-planned communities draft CC&Rs and, often, accept bids from private management companies charged with the task of enforcement. Once properties
17
have been sold, homeowners elect representatives that work with the private management company to address community issues, simultaneously espousing a democratic process while retaining a degree of private management (McKenzie 1994). Acceptable home management is determined by both the rules and regulations of the formal HOA institution as well as the emergent norms and values that informally influence them. For example, both turfgrass and desert landscaping may be allowed by the HOA, but a prevalence of one over the other may be the outcome of group norms and values not expressly codified in the HOA rules. Ultimately, HOAs embody multiple legacies, including but not limited to the developers’ visions, residents’ interests, and municipal ordinances. Thus, historic influences may be tied to current residential landscapes but they may be challenged or adapted through the modern HOA governance structure, resulting in emergent institutional forces over time.
The HOA creates a formal collective through whom select homeowners are elected to an HOA board, which acts as a liaison between the developer, the management company, and the broader homeowner community. Individual homeowners may appeal to the HOA board if their interests diverge from the collective institutions. The board has the power to amend the CC&R document but doing so can prove difficult for several reasons. Individual homeowners presumably purchase property in a community for a particular aesthetic appeal or an espoused common interest. As a result, homeowners may resist changes that alter desirable components of the neighborhood. Additionally, developers often retain a portion of the HOA vote and may seek to maintain the integrity of their original vision (McKenzie 1994). Underpinning this resistance to change is the belief that change threatens the stability, and therefore property values, of the area. Resistance to change commonly emerges as a characteristic of HOAs, and institutions generally, contributing to their role as an enduring institution with the potential to create legacies in the residential landscapes they encompass.
Although residential landscapes are linked to a suite of ecosystem services, previous research has focused on the social ramifications of neighborhood institutions (e.g., concerning safety or property values; Low 2003, Wilson-Doenges 2000) while largely ignoring their ecological implications. To our knowledge, limited studies have addressed the ecological implications of HOAs. In particular, Martin et al. (2003) compared the residential landscapes of homes with and without CC&Rs, primarily through survey data and on-the-ground observation. They found that a larger percentage of residents in neighborhoods with CC&Rs identified their residential landscape as “desert,” as opposed to “oasis” or “mesic,” compared to those in non-HOA areas. In addition, there was a mismatch between residents’ expressed preference for mesic landscapes and their reported ownership of homes with desert landscapes. This finding suggests that HOAs may impose a xeric, desert-like yard even though residents prefer water-thirsty mesic landscapes. Although informative, this research did not codify the range and extent of landscape options and management controls in CC&Rs and, overall, research is needed to link social institutions to residential landscape management and the associated ecological implications. To address this need, our research examines HOA CC&Rs to begin unpacking exactly how they govern yard management and ecological structure. Building upon what is known about managed landscapes from primarily agricultural studies (Matson et al. 1997, Tilman et al. 2001, Tilman et al. 2002), several potential elements of residential yard management are considered: (1) plant species and vegetative diversity, (2) chemical inputs for pest and weed control, (3) water inputs to sustain vegetation, and (4) biomass removal.
18
Research Methods: Developers’ Decisions, Legacy Effects and Social Institutions
To address our research questions, we primarily rely on, 1) a textual analysis of interviews addressing developers’ decision-making process, and 2) qualitative analysis and quantitative, descriptive coding of the HOA rules pertaining to landscape management and structure. Question 1: Development Industry: Interviews
To address the first question, we engaged individual developers in a series of semi-structured interviews (n = 7) to explore the constraints and opportunities relevant to the production of residential landscapes over time. A purposive sample of developers and landscape architects working in the Phoenix region was compiled through the use of Google queries as well as personal contacts with the development industry. Initial contact was made by phone to recruit potential interviewees. We then employed a snowball sampling approach wherein participants offered referrals to other individuals in the residential development community. Of the 27 contacts made, 7 interviews were eventually completed (26% response rate). The participants represent a range of experience and development types, as well as cover a number of municipalities in the study region (Table 3).
Table 3: Experience of developers interviewed (n=7) in residential development. Years Experience Range: 3.5 to 30+ years; Average: 18 years
Municipalities Scottsdale, Gilbert, Mesa, Tempe, Buckeye, Peoria, Chandler, Paradise Valley, Phoenix, Surprise, Goodyear
Type of Development master-planned communities, single-family homes, condominiums, mixed-use
The interviews lasted 30-90 minutes and were transcribed for qualitative analysis. The
interview questions moved from general-to-specific, prompting the developers’ to describe their experience and decision-making, including the reasons why they have pursued different designs for residential subdivisions and landscapes over time. As part of the semi-structured format of the interviews (see Appendix 4 for the protocol), respondents were encouraged to elaborate on their responses. The resulting interview transcripts were primarily analyzed in an inductive manner to identify common emergent themes across the sample.
The preliminary results point to a host of factors that influence the decision-making process of developers, including municipal ordinances, the cost of water, consumer preferences, and prior land uses, to name a few. As different parcels of land are developed over time, these dynamic factors play a key role in determining the characteristics and structure of the first-generation yards installed in new residential developments, which may very well persist through HOA CC&Rs and the legacy of past decisions made by developers.
Question 2: CC&Rs: Textual Analysis
In order to address the second question (what features of residential landscapes are governed by HOAs through CC&Rs, and what are the implications for ecological structure and ecosystem services?) CC&Rs from the Phoenix metropolitan area were collected and coded. Although CC&Rs are public documents, collecting a random sample was not feasible under the time and financial constraints of the semester-long workshop. A convenience sampling approach was therefore used, following a more qualitative approach in which CC&Rs are gathered until no new landscaping restrictions are identified in the documents. While this approach is informative,
19
we cannot generalize these findings to all HOAs throughout the region since a random sample was not possible.
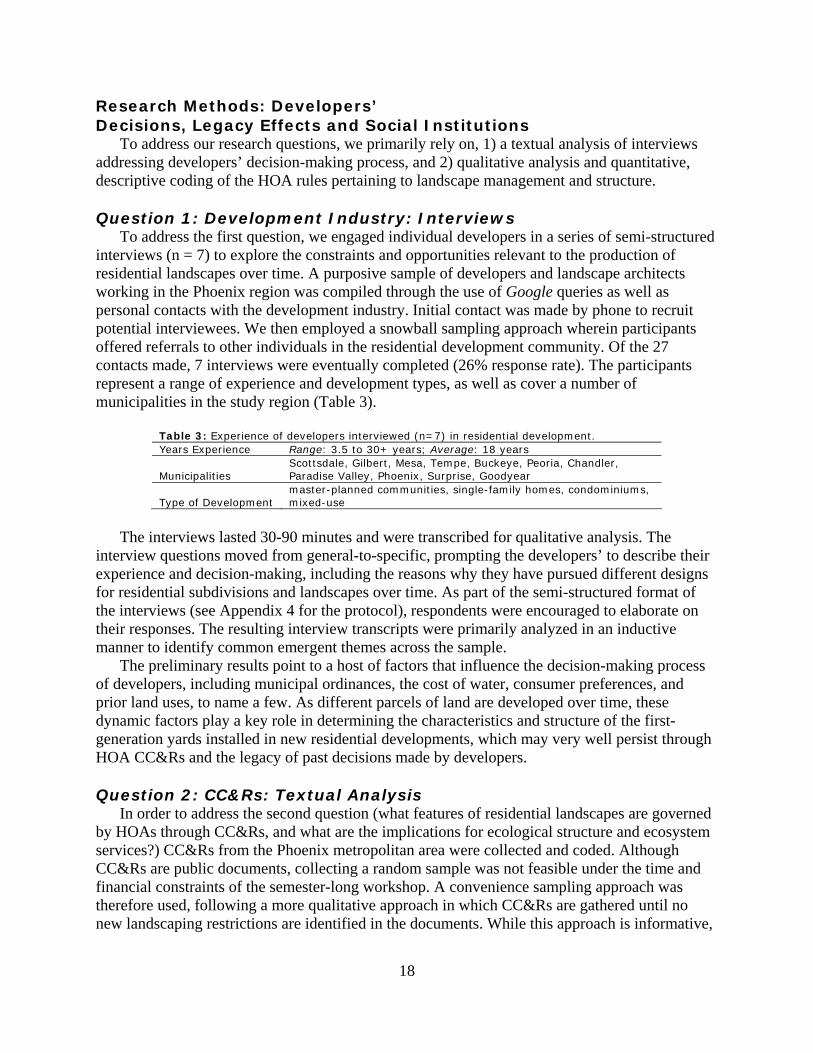
To gather HOA documents, an email requesting a copy of CC&Rs was sent to students, faculty, and friends in the Schools of Geographical Sciences, Sustainability, and Human Evolution and Social Change at Arizona State University. Additional personal contacts were made to gather as many CC&R documents as possible for this analysis. In total, 35 CC&R documents were collected from HOAs containing single-family detached homes. The sample covered ten different municipalities in the Phoenix metro-area (Table 4).
Table 4: Temporal, spatial and other characteristics of HOA CC&R sample (n=35). CC&R Year of Inception Range: 1960-2007
Municipalities Avondale, Chandler, East Mesa, Gilbert, Glendale, Higley, Maricopa, Mesa, Phoenix, Scottsdale, Tempe
Type of Document CC&Rs (n=35) Architecture and Landscaping Guidelines (ALG, n=14)
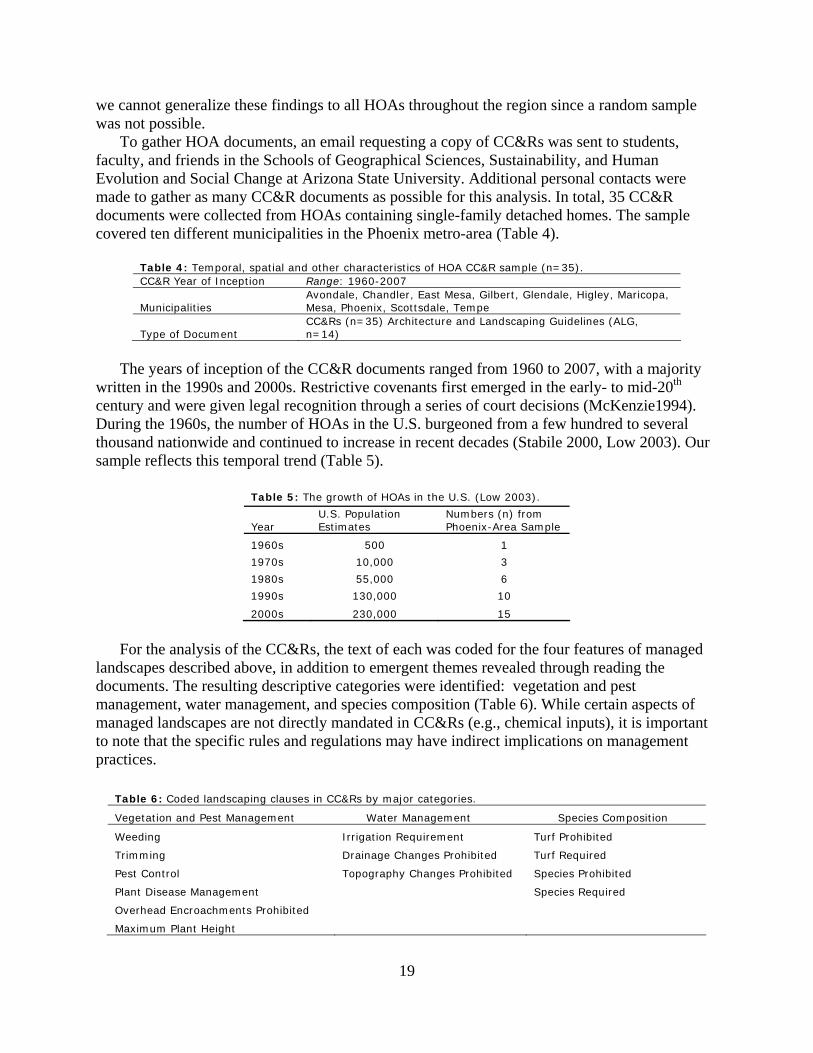
The years of inception of the CC&R documents ranged from 1960 to 2007, with a majority
written in the 1990s and 2000s. Restrictive covenants first emerged in the early- to mid-20th century and were given legal recognition through a series of court decisions (McKenzie1994). During the 1960s, the number of HOAs in the U.S. burgeoned from a few hundred to several thousand nationwide and continued to increase in recent decades (Stabile 2000, Low 2003). Our sample reflects this temporal trend (Table 5).
Table 5: The growth of HOAs in the U.S. (Low 2003).
Year U.S. Population Estimates
Numbers (n) from Phoenix-Area Sample
1960s 500 1
1970s 10,000 3
1980s 55,000 6
1990s 130,000 10
2000s 230,000 15
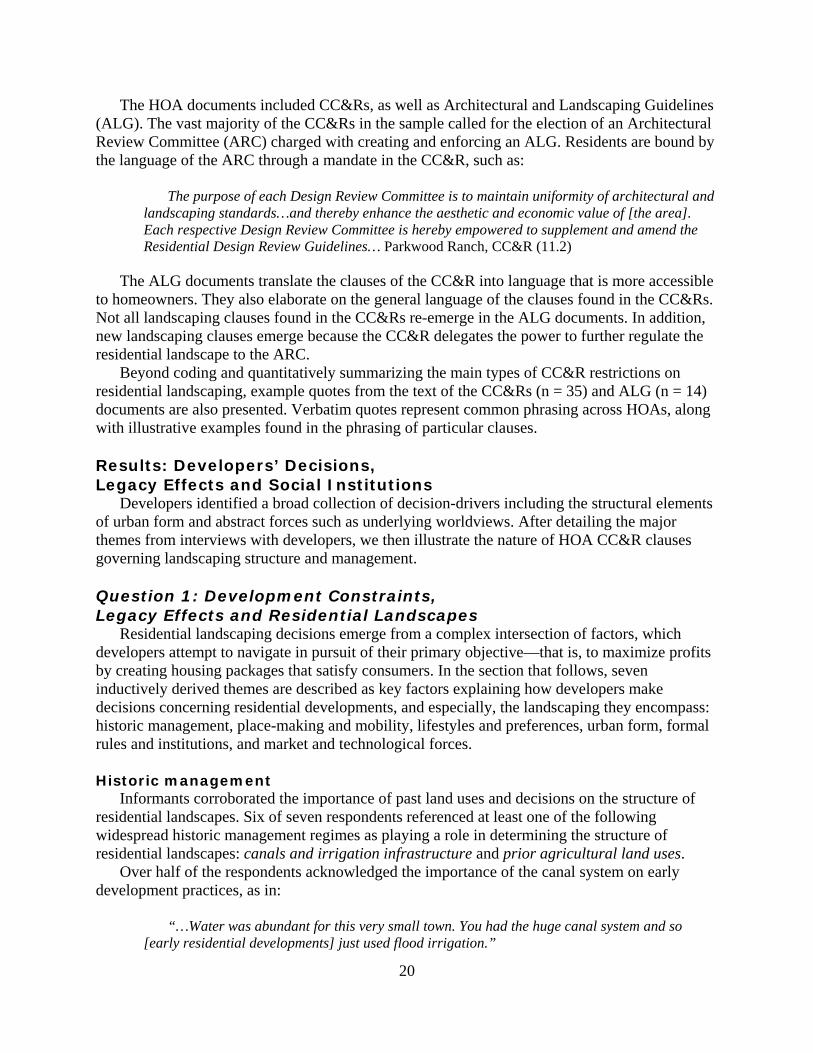
For the analysis of the CC&Rs, the text of each was coded for the four features of managed
landscapes described above, in addition to emergent themes revealed through reading the documents. The resulting descriptive categories were identified: vegetation and pest management, water management, and species composition (Table 6). While certain aspects of managed landscapes are not directly mandated in CC&Rs (e.g., chemical inputs), it is important to note that the specific rules and regulations may have indirect implications on management practices.
Table 6: Coded landscaping clauses in CC&Rs by major categories.
Vegetation and Pest Management Water Management Species Composition
Weeding Irrigation Requirement Turf Prohibited
Trimming Drainage Changes Prohibited Turf Required
Pest Control Topography Changes Prohibited Species Prohibited
Plant Disease Management Species Required
Overhead Encroachments Prohibited
Maximum Plant Height
20
The HOA documents included CC&Rs, as well as Architectural and Landscaping Guidelines (ALG). The vast majority of the CC&Rs in the sample called for the election of an Architectural Review Committee (ARC) charged with creating and enforcing an ALG. Residents are bound by the language of the ARC through a mandate in the CC&R, such as:
The purpose of each Design Review Committee is to maintain uniformity of architectural and
landscaping standards…and thereby enhance the aesthetic and economic value of [the area]. Each respective Design Review Committee is hereby empowered to supplement and amend the Residential Design Review Guidelines… Parkwood Ranch, CC&R (11.2)
The ALG documents translate the clauses of the CC&R into language that is more accessible
to homeowners. They also elaborate on the general language of the clauses found in the CC&Rs. Not all landscaping clauses found in the CC&Rs re-emerge in the ALG documents. In addition, new landscaping clauses emerge because the CC&R delegates the power to further regulate the residential landscape to the ARC.
Beyond coding and quantitatively summarizing the main types of CC&R restrictions on residential landscaping, example quotes from the text of the CC&Rs (n = 35) and ALG (n = 14) documents are also presented. Verbatim quotes represent common phrasing across HOAs, along with illustrative examples found in the phrasing of particular clauses.
Results: Developers’ Decisions, Legacy Effects and Social Institutions
Developers identified a broad collection of decision-drivers including the structural elements of urban form and abstract forces such as underlying worldviews. After detailing the major themes from interviews with developers, we then illustrate the nature of HOA CC&R clauses governing landscaping structure and management.
Question 1: Development Constraints, Legacy Effects and Residential Landscapes
Residential landscaping decisions emerge from a complex intersection of factors, which developers attempt to navigate in pursuit of their primary objective—that is, to maximize profits by creating housing packages that satisfy consumers. In the section that follows, seven inductively derived themes are described as key factors explaining how developers make decisions concerning residential developments, and especially, the landscaping they encompass: historic management, place-making and mobility, lifestyles and preferences, urban form, formal rules and institutions, and market and technological forces.
Historic management
Informants corroborated the importance of past land uses and decisions on the structure of residential landscapes. Six of seven respondents referenced at least one of the following widespread historic management regimes as playing a role in determining the structure of residential landscapes: canals and irrigation infrastructure and prior agricultural land uses.
Over half of the respondents acknowledged the importance of the canal system on early development practices, as in:
“…Water was abundant for this very small town. You had the huge canal system and so
[early residential developments] just used flood irrigation.”
21
Informants also spoke more specifically about the existence of flood irrigation infrastructure
as a logical precursor to the spread of more mesic landscapes. For example:
“You drive down [to Arcadia] and it’s flood irrigation and traditionally it was all citrus orchids—traditionally, flood irrigation. When they started building houses in there they just planted grass. You know, there was flood irrigation—it was cheap.”
Reflecting the shifting land-use development trends in the region, interview informants
reflected on the distinction between developing previously agricultural land relative to native desert areas.
“When you go to an agricultural property that’s been kind of laser-leveled and farmed,
typically…your finished product in an agricultural area is going to take on more of a designed, manufactured look.”
Developers and municipalities seem to increasingly recognize the importance of maintaining
open space. In regard to the different approaches to open space on agricultural and desert lands, one respondent joked,
“…typically you’ll have a similar amount of open space [on previously agricultural land],
but you’re not going to leave it as a piece of alfalfa field.” The participants gave the clear impression that the conversion of agricultural land to residential uses lends itself to a more mesic (lawn) yard structure, if not by virtue of the fact that the native vegetation has already been removed, then due to the added advantage of existing flood irrigation infrastructure. While the physical structure of landscapes and human infrastructure appear to significantly influence residential landscaping decisions among developers, particular landscape features conjure up a particular sense of place.
Place-making and mobility
Place-making refers to a movement in the planning community that recognizes the often intangible significance humans attach to landscapes due to the implications for health, happiness, and well-being (Schneekloth and Shibley 1995). Place-making can occur organically, drawing on community inspiration and input, but developments also may be designed to create a desired place and residential landscapes play an important role in reflecting a sense of place in neighborhoods. In this section we highlight how developers’ decisions reflect place-making in relation to: migration and sense of place.
Respondents commonly assumed that newcomers in the Phoenix region carry with them landscaping preferences from their former home regions. They especially described Midwestern and California-style landscapes as playing an influential role in housing developments throughout Phoenix. As one developer said,
“You…find people that got transferred from California or the Midwest that, when they come
here, they had grass in the front yard and that’s what they want.” Five of the seven participants perceived a strong consumer demand for lawns in Phoenix,
originating from beyond the native desert metropolis of the region.
22
Participants peppered their perspective of a historic and persistent Midwestern influence on residential landscaping decisions by describing a growing sense of the region as a desert.
“Right now what we’re really trying to do more than ever—I think the big trend is having a
sense of our own identity and celebrating that. When people come here and they know that it’s not southern California or Florida or Texas—you have a true sense of what the Sonoran Desert is.”
While many participants noted the fledgling sense of Phoenix as a desert place, the role of
residential landscapes in this phenomenon remains questionable. Some comments suggest that participants may be convoluting a growing sense of place with the reality that an increasingly large fraction of new development takes place on desert land, rather than agricultural land. Wealthy north Scottsdale, to the east of Phoenix, serves as a prime example of an area that historically had very little agricultural land and has subsequently “embraced” the Sonoran Desert. Along these lines, one participant commented on the prevalence of xeric desert-like landscapes in certain areas of metropolitan Phoenix, stating,
“Scottsdale is fortunate in a lot of ways in that its major growth has been to the North, which
is into the desert.” Shifting trends in both place-making and land uses partly reflect changing economic conditions in terms of consumer demand in the housing market and the available supply of undeveloped land on which to build.
Market and technological forces Given financial constraints on projects and the overarching profit motive, developers seek to minimize the costs of developments and therefore their landscaping. Developers adjust their strategies over time, depending on the price of commodities and homebuyer expectations. The impact of the market and technological forces on residential landscapes are seen primarily in three factors: cost-driven suburban development, water cost and reclaimed water, and plant material availability.
The majority of growth in the Phoenix area occurred in the latter half of the 20th century. To over half of the informants, this era of development represents a marked shift away from the artisan craft homes common earlier in the century to a more cost-efficient product.
“Compared to wherever you came from or whatever you were used to paying, for that money
you can come to Arizona and if you could only afford 1,000 square feet in Chicago, you can afford 2,400 square feet in Sun City. So, this big shift was away from these crafted, one-of-a-kind homes, lovely neighborhoods, lots of neighborhood infrastructure, that made those neighborhoods feel the way they did.”
A surge in the demand for housing following World War II resulted from the “baby boom”
and a variety of federal financial programs that made home ownership more obtainable. In response, ambitious developers rushed to offer an affordable product, occasionally cutting corners on quality to ensure a profit. Many of the participants interviewed harshly criticized this era of development, often accusing the early developers of profiteering and downright greed.
23
“...There’s a lot of people that come into the Valley that develop for their own selfish reasons—it’s really a boom and bust town. When all of a sudden people can see that land in Phoenix is selling and it’s getting a great price, people come in from all over to capture some of the profit of that. A lot of people don’t do it for reasons of leaving any sort of legacy to this city. They come in for their own selfish reasons—they rape and scrape.”
Interestingly, this era of cost-driven development brought some of the first widespread use of
low water-use xeric landscapes, especially in the front yards of residential developments. Rather than laud this initial shift in residential landscapes, most participants explained that this shift was primarily a matter of cost-effectiveness.
“This value driven development was in large measure… We went to these decomposed
granite front yards, which is great that its low water consumption…[but] that isn’t why they did it.”
Ostensibly, the low cost of water is one reason for the widespread installation of turf yards
throughout the region.
“The cost of water from municipal water suppliers has been cheaper here than anywhere else all through history, so there was no thought that it was like squandering a precious resource.”
Furthermore, some respondents suggested that manipulating water costs would bring about
significant transformations in terms of residential landscaping options.
“You know, cities can manipulate the cost of water. People don’t like seeing how much their spending on water and it helps you cut back a little bit.”
Increased access to and awareness of reclaimed water (that is, treated wastewater) also has
the potential to influence residential landscaping choices among developers. As one research participant noted,
“We happen to have reclaimed water available for our project…so all the low water use
standards are off because we’re getting water that, essentially, is treated effluent that the town wants us to utilize for landscaping. So, we can put a lot more turf out there, we can put trees out there that aren’t low water use.”
Yet informal social norms and stigmas regarding the use of reclaimed water may inhibit
further application of this technology for the time being.
“There is a niche right now in the use of reclaimed water to irrigate and people get like creeped out. If you run the purple pipe and you irrigate with reclaimed water it’s like dirty water and they don’t want their kids running in the lawns that have been irrigated with reclaimed water.”
Thus, while reclaimed water provides an efficient reuse of the resource, social acceptability
may hinder its use in residential landscapes. The availability of reclaimed water, however, helps in perpetuating the traditionally lush landscaping that depends upon irrigation for its survival.
In order to enable developers to produce alternative residential landscapes, such as drought-tolerant xeric yards, they need a supply of various plant materials from which to choose. The
24
interviews point to this dilemma, since historically developers and landscapes architects had very few plants to choose from in the Valley—specifically those that were low water-use, drought-adapted, or native plants. Through the 1960s, the limited availability of such plant material served as a barrier to the widespread development of xeric landscapes.
“The plant materials were, even with our local nurseries, very traditional—kind of the
California palette.”
If fact, over half of the interviewees specifically mentioned one nursery by name: Mountain States Wholesale Nursery. Mountain States was the first local grower to offer a palette of plant materials adapted to the natural conditions of the Sonoran Desert, setting off somewhat of a revolution in the world of landscape architecture.
“Nobody would have been able to design these gardens had those plants not been grown.
Mountain States was huge in that effort to get out the word about native plants.”
In short, the cost and availability of commodities including water and plant materials have significantly influenced developers’ landscaping choices in the region.
Urban form
The rapid, post-World War II development in Phoenix has resulted in numerous changes to the urban form of the region. Respondents indicated that changes in urban form often translate into different strategies regarding the development of residential properties, specifically in terms of: density and lot size and the scale of development.
Many of the historic neighborhoods in Phoenix feature single-family homes on sprawling half-acre or acre lots. As a result of rising land costs and soaring demand, the average lot size in residential developments has been steadily shrinking in the Phoenix region. Developers walk a fine line by increasing the density of their projects in order to maintain profit margins, while trying not to alienate homebuyers seeking the privacy afforded by a single-family home. The last two decades have seen dramatic shifts in the density of at least some developments.
“In 1990s era master-planned communities, high density would have been thought of as 15
dwelling units to the acre, garden style apartments and condos. If you fast forward to the new generation of projects, like the one we are doing in Mesa, we will almost certainly hit urban core areas in that project where we are at a 100 dwelling units to the acre.”
Subsequently, many respondents suggested that decreasing lot sizes required a thorough
reevaluation of front yard landscaping. Shrinking frontage was accompanied with ever expanding two- and three-car garages—the so-called “garage-scape.” Suddenly, front yards ceased to function as recreation areas even when completely covered in turf.
“It doesn’t make any difference—you can’t put enough grass in the yard to make it usable, I
mean, really that you can do anything active on it.”
With shrinking housing lots and front yard spaces, developers have concentrated turf into common areas, thereby shifting the recreational value of landscaping from private yards to collective spaces in the neighborhood.
25
“…As lots have gotten smaller, what the development community has done is focus the utility of play areas and things like that into common space, so we’ve created smaller lots.”
Meanwhile, the scale of development in the Phoenix metropolitan region has steadily
increased. Far removed from the historic one-acre builder lots familiar to Arcadia and the historic neighborhoods of downtown Phoenix, respondents point to master-planned communities (such as Verrado) that are now developed in swaths of land as large as 25,000 acres. Increasing the scale of development appeals to developers as a way to compensate for shrinking lot sizes and provide amenities to residents that would otherwise be difficult to organize through traditional smaller scale developments.
“In the late 60s and the 70s, this idea was ramped up…what we do as master developers is
say why not take it a step further? What if you aggregated 5 or 15 or 50 of these individually amenitized neighborhoods. So we are having to design a completely different mentality …we have to think about organizing new communities that really function more like cities.”
Such trends in urban form and development plans have important implications for the
structure of public and private landscaping in residential neighborhoods, along with the distribution of potential benefits they provide.
Lifestyles and consumer preferences
Developers recognize that, to a certain extent, consumers’ preferences and views change over time. The interviewees suggested that for decades few people in the development industry felt any pressure to cater to homebuyers with pro-environmental values. Environmentalists’ appeals to use more energy efficient materials and lower water-use landscaping were offset by the revealed preferences of consumers, according to participants in the study.
“The builders just about all formed the opinion that this whole environmental thing is
bullshit, because they watch all these people come in and they present the options and time and time again they always pass up the green stuff and they buy the conspicuous consumer stuff.”
However, the development community may now be seeing a shift in the behaviors and
preferences of homebuyers.
“Just in the last years, this compulsion that people feel—the environmental responsibility—is finally starting to show up in the options and upgrades process more and more.”
Accordingly, some in the development industry have adjusted their building practices,
including the structure of landscapes, to offer more environmentally sensitive options. The incentive structure surrounding “green” building practices has partly changed the way developers approach these issues—creating a new niche in marketing to environmental values.
“…We try to say to our community: this is an environmentally sensitive project. They feel
positively about things that we’ve done.”
These shifts may reflect a true change in consumer behavior and market demand, or rather, merely be an attempt by developers to market their products in a way that appeals to people’s values but does little to change the status quo.
26
Formal rules and institutions. In general, the municipalities of the greater Phoenix region
have adopted an agenda friendly to the development industry. Yet rising concerns about the chaotic leapfrog development and sustainable water use have resulted in the development of formal rules and institutions relevant to developers’ decisions regarding residential landscapes. All of the interviewees reflected on city and state ordinances that influence yard types. Some informants suggest that Scottsdale took the lead on passing ordinances to regulate landscaping.
“The pioneering ordinance along those lines was the City of Scottsdale [that] passed what
was called ESLO, the ordinance for environmentally sensitive land. What ESLO did is it said, you know in the north side of Scottsdale…we’re not going to have any more recreating elsewhere in Scottsdale. So, if you are going to build there, you are going to embrace some critical principles. One is low water-use, arid and indigenous plant material, turf limits…”
Over time, municipalities have became more involved in determining the landscape in
residential properties and subdivisions.
“I think what has happened is the municipalities have kind of driven the amount of open space as a percentage of total land area and they’ve also kind of driven the quality of that open space, but I think it affects more—a number of the developers were already doing those things. The municipalities have helped to raise the bar to bring others up that weren’t.”
While these government ordinances have influenced development decisions in particular
municipalities, the next section illuminates how neighborhood-level restrictions—embodied in HOA CC&Rs, which are largely the product of developers’ decisions—specifically govern residential landscape structure and maintenance .
Question 2: Homeowner Associations and Residential Management Practices
The HOA Covenants, Codes and Restrictions evaluated herein are primarily concerned with regulating the physical attributes of the residential landscape that contribute to the overall community aesthetic. The most common types of clauses regulating residential landscapes are: Vegetation and Pest Management, Species Composition, and Water Management (Figure 7). Vegetation and landscape maintenance clauses that regulate upkeep and appearance were most common in the CC&R documents. Species composition is secondary to an attractive, neat appearance, although this may reflect the fact that the supplementary Architectural and Landscaping Guidelines tend to contain such lists, not the CC&Rs. Even clauses regulating other aspects of residential yards, such as water drainage, have indirect links to aesthetics.
Vegetation and pest management
Vegetation and pest management clauses were dominant in both the CC&R and ALG documents. Fifty-six percent of the CC&Rs contained clauses requiring weed removal and 46% required trimming of plants. Weed removal and trimming usually appeared coupled in one clause relating to general maintenance of lawn appearance.
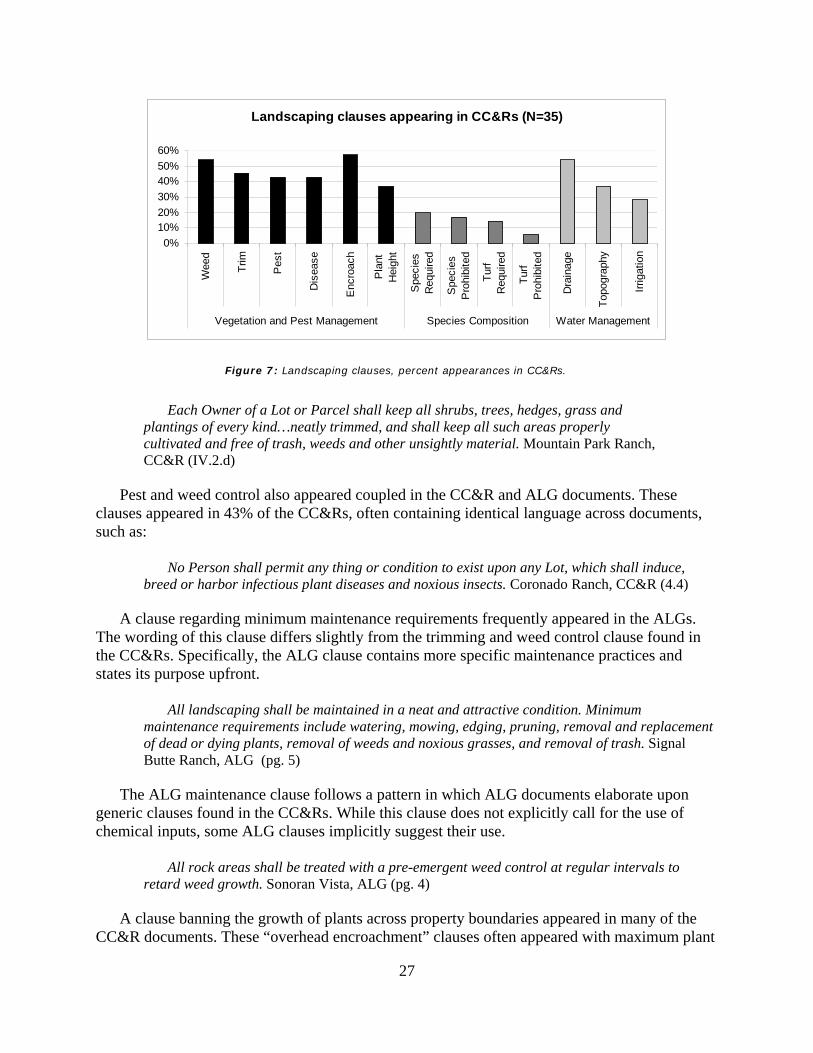
27
Each Owner of a Lot or Parcel shall keep all shrubs, trees, hedges, grass and
plantings of every kind…neatly trimmed, and shall keep all such areas properly cultivated and free of trash, weeds and other unsightly material. Mountain Park Ranch, CC&R (IV.2.d)
Pest and weed control also appeared coupled in the CC&R and ALG documents. These
clauses appeared in 43% of the CC&Rs, often containing identical language across documents, such as:
No Person shall permit any thing or condition to exist upon any Lot, which shall induce,
breed or harbor infectious plant diseases and noxious insects. Coronado Ranch, CC&R (4.4)
A clause regarding minimum maintenance requirements frequently appeared in the ALGs. The wording of this clause differs slightly from the trimming and weed control clause found in the CC&Rs. Specifically, the ALG clause contains more specific maintenance practices and states its purpose upfront.
All landscaping shall be maintained in a neat and attractive condition. Minimum
maintenance requirements include watering, mowing, edging, pruning, removal and replacement of dead or dying plants, removal of weeds and noxious grasses, and removal of trash. Signal Butte Ranch, ALG (pg. 5)
The ALG maintenance clause follows a pattern in which ALG documents elaborate upon
generic clauses found in the CC&Rs. While this clause does not explicitly call for the use of chemical inputs, some ALG clauses implicitly suggest their use.
All rock areas shall be treated with a pre-emergent weed control at regular intervals to
retard weed growth. Sonoran Vista, ALG (pg. 4)
A clause banning the growth of plants across property boundaries appeared in many of the CC&R documents. These “overhead encroachment” clauses often appeared with maximum plant
Figure 7: Landscaping clauses, percent appearances in CC&Rs.
Landscaping clauses appearing in CC&Rs (N=35)
0%10%20%30%40%50%60%
Wee
d
Trim
Pes
t
Dis
ease
Enc
roac
h
Pla
ntH
eigh
t
Spe
cies
Req
uire
d
Spe
cies
Pro
hibi
ted
Turf
Req
uire
d
Turf
Pro
hibi
ted
Dra
inag
e
Topo
grap
hy
Irrig
atio
n
Vegetation and Pest Management Species Composition Water Management
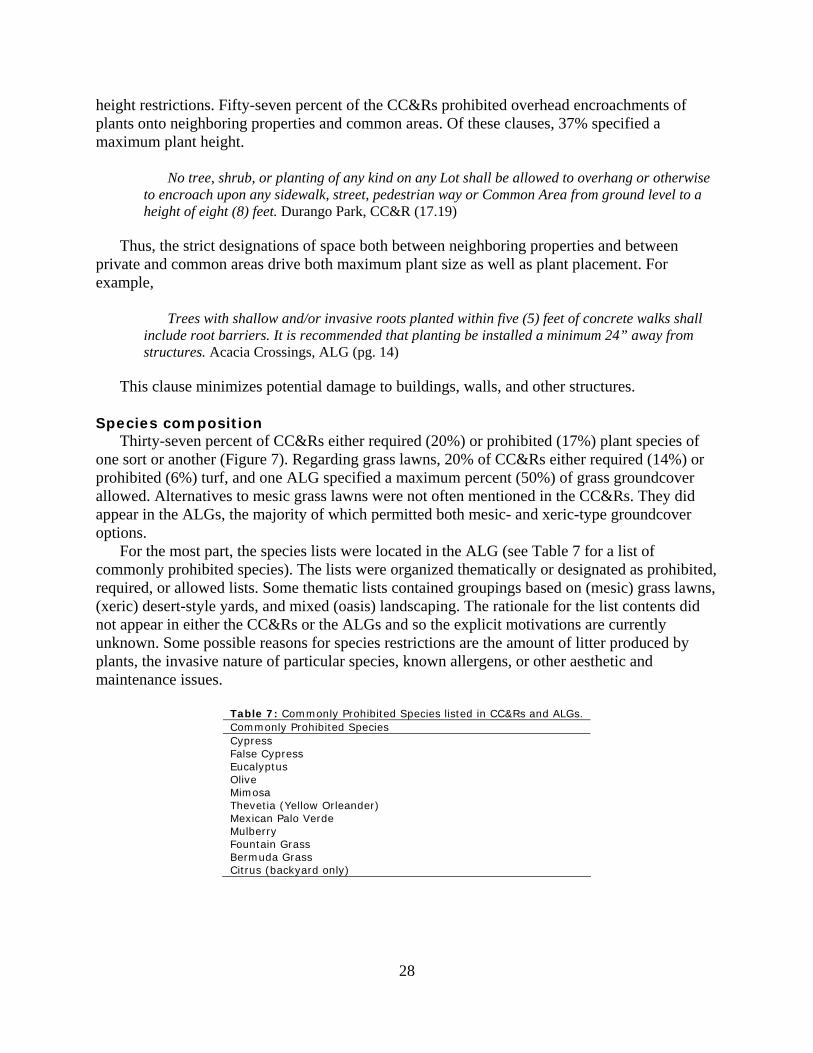
28
height restrictions. Fifty-seven percent of the CC&Rs prohibited overhead encroachments of plants onto neighboring properties and common areas. Of these clauses, 37% specified a maximum plant height.
No tree, shrub, or planting of any kind on any Lot shall be allowed to overhang or otherwise
to encroach upon any sidewalk, street, pedestrian way or Common Area from ground level to a height of eight (8) feet. Durango Park, CC&R (17.19)
Thus, the strict designations of space both between neighboring properties and between
private and common areas drive both maximum plant size as well as plant placement. For example,
Trees with shallow and/or invasive roots planted within five (5) feet of concrete walks shall
include root barriers. It is recommended that planting be installed a minimum 24” away from structures. Acacia Crossings, ALG (pg. 14)
This clause minimizes potential damage to buildings, walls, and other structures.
Species composition Thirty-seven percent of CC&Rs either required (20%) or prohibited (17%) plant species of
one sort or another (Figure 7). Regarding grass lawns, 20% of CC&Rs either required (14%) or prohibited (6%) turf, and one ALG specified a maximum percent (50%) of grass groundcover allowed. Alternatives to mesic grass lawns were not often mentioned in the CC&Rs. They did appear in the ALGs, the majority of which permitted both mesic- and xeric-type groundcover options.
For the most part, the species lists were located in the ALG (see Table 7 for a list of commonly prohibited species). The lists were organized thematically or designated as prohibited, required, or allowed lists. Some thematic lists contained groupings based on (mesic) grass lawns, (xeric) desert-style yards, and mixed (oasis) landscaping. The rationale for the list contents did not appear in either the CC&Rs or the ALGs and so the explicit motivations are currently unknown. Some possible reasons for species restrictions are the amount of litter produced by plants, the invasive nature of particular species, known allergens, or other aesthetic and maintenance issues.
Table 7: Commonly Prohibited Species listed in CC&Rs and ALGs. Commonly Prohibited Species Cypress False Cypress Eucalyptus Olive Mimosa Thevetia (Yellow Orleander) Mexican Palo Verde Mulberry Fountain Grass Bermuda Grass Citrus (backyard only)
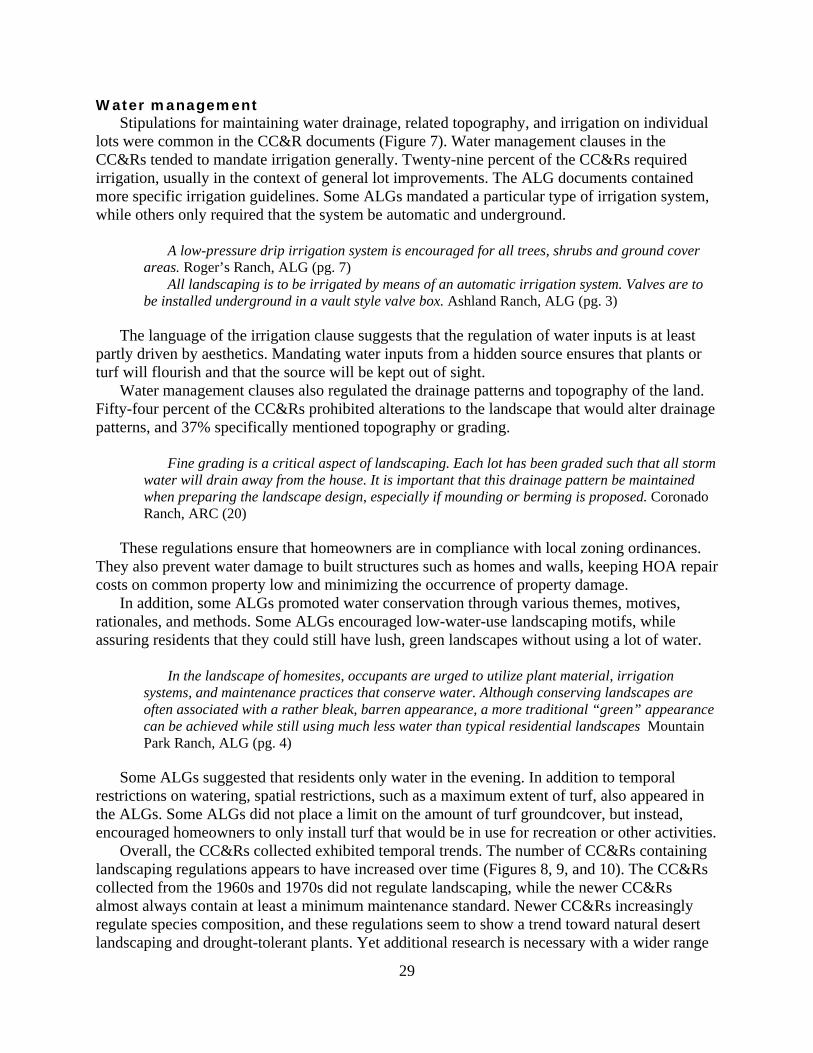
29
Water management Stipulations for maintaining water drainage, related topography, and irrigation on individual
lots were common in the CC&R documents (Figure 7). Water management clauses in the CC&Rs tended to mandate irrigation generally. Twenty-nine percent of the CC&Rs required irrigation, usually in the context of general lot improvements. The ALG documents contained more specific irrigation guidelines. Some ALGs mandated a particular type of irrigation system, while others only required that the system be automatic and underground.
A low-pressure drip irrigation system is encouraged for all trees, shrubs and ground cover
areas. Roger’s Ranch, ALG (pg. 7) All landscaping is to be irrigated by means of an automatic irrigation system. Valves are to
be installed underground in a vault style valve box. Ashland Ranch, ALG (pg. 3)
The language of the irrigation clause suggests that the regulation of water inputs is at least partly driven by aesthetics. Mandating water inputs from a hidden source ensures that plants or turf will flourish and that the source will be kept out of sight.
Water management clauses also regulated the drainage patterns and topography of the land. Fifty-four percent of the CC&Rs prohibited alterations to the landscape that would alter drainage patterns, and 37% specifically mentioned topography or grading.
Fine grading is a critical aspect of landscaping. Each lot has been graded such that all storm
water will drain away from the house. It is important that this drainage pattern be maintained when preparing the landscape design, especially if mounding or berming is proposed. Coronado Ranch, ARC (20)
These regulations ensure that homeowners are in compliance with local zoning ordinances.
They also prevent water damage to built structures such as homes and walls, keeping HOA repair costs on common property low and minimizing the occurrence of property damage.
In addition, some ALGs promoted water conservation through various themes, motives, rationales, and methods. Some ALGs encouraged low-water-use landscaping motifs, while assuring residents that they could still have lush, green landscapes without using a lot of water.
In the landscape of homesites, occupants are urged to utilize plant material, irrigation
systems, and maintenance practices that conserve water. Although conserving landscapes are often associated with a rather bleak, barren appearance, a more traditional “green” appearance can be achieved while still using much less water than typical residential landscapes Mountain Park Ranch, ALG (pg. 4)
Some ALGs suggested that residents only water in the evening. In addition to temporal
restrictions on watering, spatial restrictions, such as a maximum extent of turf, also appeared in the ALGs. Some ALGs did not place a limit on the amount of turf groundcover, but instead, encouraged homeowners to only install turf that would be in use for recreation or other activities.
Overall, the CC&Rs collected exhibited temporal trends. The number of CC&Rs containing landscaping regulations appears to have increased over time (Figures 8, 9, and 10). The CC&Rs collected from the 1960s and 1970s did not regulate landscaping, while the newer CC&Rs almost always contain at least a minimum maintenance standard. Newer CC&Rs increasingly regulate species composition, and these regulations seem to show a trend toward natural desert landscaping and drought-tolerant plants. Yet additional research is necessary with a wider range
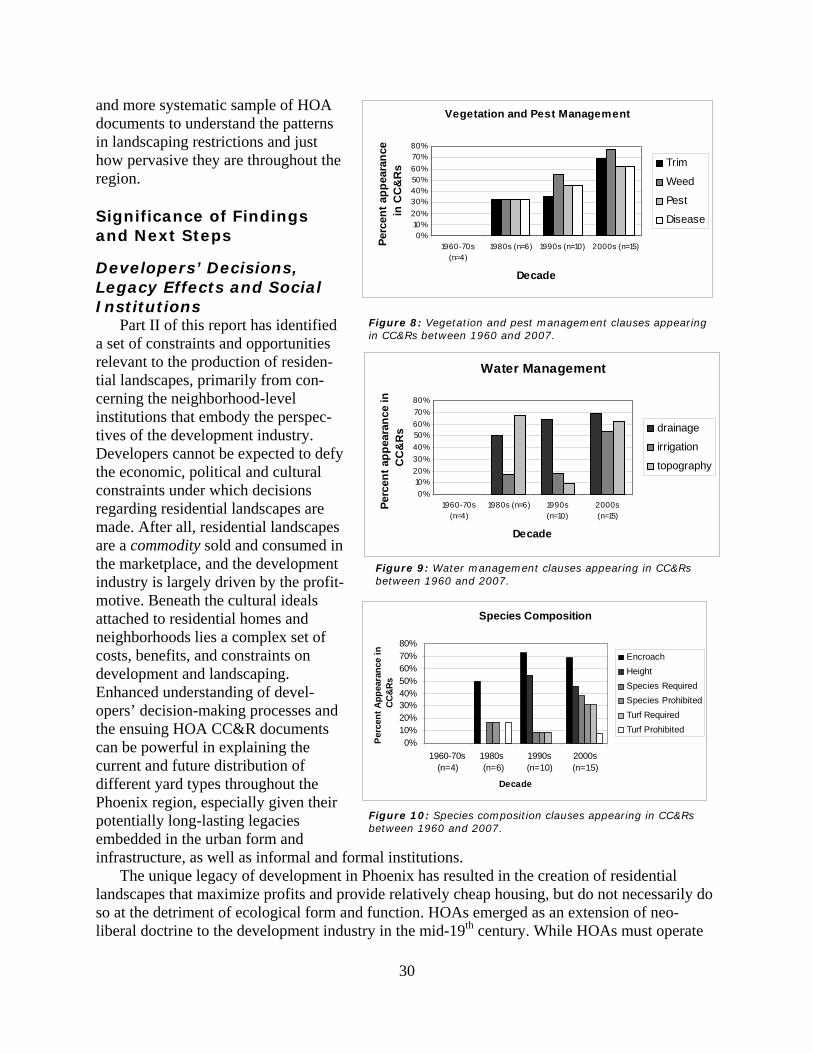
30
and more systematic sample of HOA documents to understand the patterns in landscaping restrictions and just how pervasive they are throughout the region.
Significance of Findings and Next Steps
Developers’ Decisions, Legacy Effects and Social Institutions
Part II of this report has identified a set of constraints and opportunities relevant to the production of residen-tial landscapes, primarily from con-cerning the neighborhood-level institutions that embody the perspec-tives of the development industry. Developers cannot be expected to defy the economic, political and cultural constraints under which decisions regarding residential landscapes are made. After all, residential landscapes are a commodity sold and consumed in the marketplace, and the development industry is largely driven by the profit-motive. Beneath the cultural ideals attached to residential homes and neighborhoods lies a complex set of costs, benefits, and constraints on development and landscaping. Enhanced understanding of devel-opers’ decision-making processes and the ensuing HOA CC&R documents can be powerful in explaining the current and future distribution of different yard types throughout the Phoenix region, especially given their potentially long-lasting legacies embedded in the urban form and infrastructure, as well as informal and formal institutions.
The unique legacy of development in Phoenix has resulted in the creation of residential landscapes that maximize profits and provide relatively cheap housing, but do not necessarily do so at the detriment of ecological form and function. HOAs emerged as an extension of neo-liberal doctrine to the development industry in the mid-19th century. While HOAs must operate
Figure 8: Vegetation and pest management clauses appearing in CC&Rs between 1960 and 2007.
Species Composition
0%10%20%30%40%50%60%70%80%
1960-70s(n=4)
1980s (n=6)
1990s(n=10)
2000s(n=15)
Decade
Perc
ent A
ppea
ranc
e in
CC
&Rs
EncroachHeightSpecies RequiredSpecies ProhibitedTurf RequiredTurf Prohibited
Figure 10: Species composition clauses appearing in CC&Rs between 1960 and 2007.
Vegetation and Pest Management
0%10%20%30%40%50%60%70%80%
1960-70s(n=4)
1980s (n=6) 1990s (n=10) 2000s (n=15)
Decade
Perc
ent a
ppea
ranc
e in
CC
&R
s Trim
Weed
Pest
Disease
Figure 8: Vegetation and pest management clauses appearing in CC&Rs between 1960 and 2007.
Figure 9: Water management clauses appearing in CC&Rs between 1960 and 2007.
Water Management
0%10%20%30%40%50%60%70%80%
1960-70s(n=4)
1980s (n=6) 1990s(n=10)
2000s(n=15)
Decade
Perc
ent a
ppea
ranc
e in
C
C&
Rs drainage
irrigation
topography
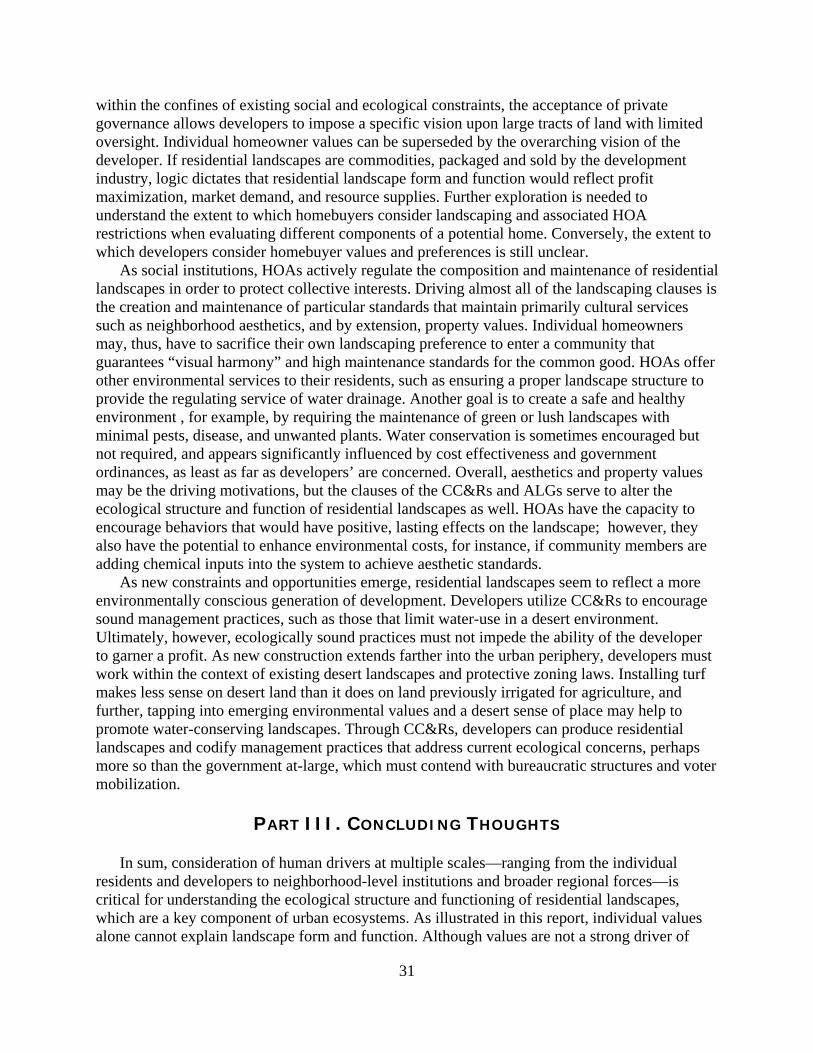
31
within the confines of existing social and ecological constraints, the acceptance of private governance allows developers to impose a specific vision upon large tracts of land with limited oversight. Individual homeowner values can be superseded by the overarching vision of the developer. If residential landscapes are commodities, packaged and sold by the development industry, logic dictates that residential landscape form and function would reflect profit maximization, market demand, and resource supplies. Further exploration is needed to understand the extent to which homebuyers consider landscaping and associated HOA restrictions when evaluating different components of a potential home. Conversely, the extent to which developers consider homebuyer values and preferences is still unclear.
As social institutions, HOAs actively regulate the composition and maintenance of residential landscapes in order to protect collective interests. Driving almost all of the landscaping clauses is the creation and maintenance of particular standards that maintain primarily cultural services such as neighborhood aesthetics, and by extension, property values. Individual homeowners may, thus, have to sacrifice their own landscaping preference to enter a community that guarantees “visual harmony” and high maintenance standards for the common good. HOAs offer other environmental services to their residents, such as ensuring a proper landscape structure to provide the regulating service of water drainage. Another goal is to create a safe and healthy environment , for example, by requiring the maintenance of green or lush landscapes with minimal pests, disease, and unwanted plants. Water conservation is sometimes encouraged but not required, and appears significantly influenced by cost effectiveness and government ordinances, as least as far as developers’ are concerned. Overall, aesthetics and property values may be the driving motivations, but the clauses of the CC&Rs and ALGs serve to alter the ecological structure and function of residential landscapes as well. HOAs have the capacity to encourage behaviors that would have positive, lasting effects on the landscape; however, they also have the potential to enhance environmental costs, for instance, if community members are adding chemical inputs into the system to achieve aesthetic standards.
As new constraints and opportunities emerge, residential landscapes seem to reflect a more environmentally conscious generation of development. Developers utilize CC&Rs to encourage sound management practices, such as those that limit water-use in a desert environment. Ultimately, however, ecologically sound practices must not impede the ability of the developer to garner a profit. As new construction extends farther into the urban periphery, developers must work within the context of existing desert landscapes and protective zoning laws. Installing turf makes less sense on desert land than it does on land previously irrigated for agriculture, and further, tapping into emerging environmental values and a desert sense of place may help to promote water-conserving landscapes. Through CC&Rs, developers can produce residential landscapes and codify management practices that address current ecological concerns, perhaps more so than the government at-large, which must contend with bureaucratic structures and voter mobilization.
PART III. CONCLUDING THOUGHTS
In sum, consideration of human drivers at multiple scales—ranging from the individual residents and developers to neighborhood-level institutions and broader regional forces—is critical for understanding the ecological structure and functioning of residential landscapes, which are a key component of urban ecosystems. As illustrated in this report, individual values alone cannot explain landscape form and function. Although values are not a strong driver of
32
yard choices, they mildly influence both landscape preferences and manifest choices in diverse Phoenix neighborhoods, especially domain-specific values embodied in ecological worldviews and yard priorities. Utilizing findings from Part II, future analyses will investigate the role of Homeowners’ Associations regulations to override individuals’ preferences and management decisions. Additionally, future research will examine the potential influence of values on a broader suite of landscape management decisions, such as human ecological behaviors involving the application of water and chemical inputs on landscapes with varying land cover types. Analyses will also be conducted to examine ecological structure and yard management in relation to other cultural (cognitive) determinants, such as behavioral beliefs and informal social norms. Meanwhile, our preliminary analyses of institutional forces highlight the role of broader structural forces that influence residential landscape structure and management.
Developers largely respond to market conditions and broader constraints to influence the nature and extent of residential landscapes over time. These effects may very well last long into the future, as they become embodied in the urban form and formal institutions that persist after subdivisions are built and homes are sold. The governing Covenants, Codes, and Restrictions in many new residential developments should be the focus of further research, given their important role in dictating landscape maintenance and structure, topography and water management, and species composition. Further analyses will help reveal the extent of various landscaping provisions as well as their distribution across space and time. Additional research could also highlight the ecological importance and social relevance of these institutions within Phoenix and other regions, including questions about their enforceability and malleability over time. While we will continue our research along these lines of inquiry, we are also moving to cross-regional comparative studies to further highlight the degree to which these social-ecological patterns and processes hold true in unique geographic contexts.
At both small and larger scales, historical legacies leave an indelible mark on the landscape. These legacies often shape the way residential landscapes are maintained and are also continuously created and recreated as landscapes evolve and new land is developed. This evolution is constrained by formal and informal institutions, which reflect a sort of social legacy linked to the commonly examined ecological effects of past decisions. Residents, developers, and HOAs act as part of those institutions, determining both the structure and maintenance practices on landscapes in particular places. Advancing knowledge about this complex set of social drivers and ecological consequences, along with their feedbacks and dynamics across multiple scales of human-environment interactions, will not only assist with sustaining particular ecosystem services but will also further integrative theories about complex social-ecological patterns and processes.
33
WORKS CITED Agrawal, A. 2001. Common property institutions and sustainable governance of resources.
World Development 29(10):1649-1672. “Banking on Growth.” 2004. Arizona Republic, November 21, 2004, A1, A24. Chapin, F. S. 1928. A new definition of social institutions. Social Forces 6(3):375-377. Cheng, Z., D. S. Richmond, S. O. Salminen, and P. S. Grewal 2008. Ecology of urban lawns
under three management programs. Urban Ecosystems 11:177-195. Corral-Verdugo V., M. Frias-Amenta, and D. Gonzalez-Lomelí. 2003. On the relationship
between antisocial and anti-environmental behaviors: An empirical study. Population and Environment 24(3):273-286.
Diamond, J. 2005. Collapse: How Societies Choose to Fail or Succeed. Penguin Books, New York.
Dooley, K. J. 1997. A complex adaptive systems model of organization change. Nonlinear Dynamics, Psychology, and Life Sciences 1(1):69-97.
Duany, A., J. Speck, and E. Plater-Zyberk. 2000. Suburban Nation: The Rise of Sprawl and the Decline of the American Dream. North Point Press, New York.
Dunlap, R. E., K. D. Van Liere, A. G. Mertig, and R. E. Jones. 2000. Measuring endorsement of the New Ecological Paradigm (NEP): A revised NEP Scale. Journal of Social Issues 56(3):425-442.
Foster, J. B. 2000. Marx’s Ecology: Materialism and Nature. Monthly Review Press, New York. Giddens, A. 1984. The Constitution of Society: Outline of the Theory of Structuration. Polity
Press, Cambridge. Gober, P. 2006. Metropolitan Phoenix: Place Making and Community Building in the Desert.
University of Pennsylvania Press, Philadelphia Haberl, H., V. Winiwarter, K. Andersson, R. U. Ayres, C. Boone, A. Castillo, G. Cunfer, M.
Fischer-Kowalski, W. R. Freudenburg, E. Furman, R. Kaufmann, F. Krausmann, E. Langthaler, H. Lotze-Campen, M. Mirtl, C. L. Redman, A. Reenberg, A. Wardell, B. Warr, and H. Zechmeister. 2006. From LTER to LTSER: conceptualizing the socioeconomic dimension of long-term socioecological research. Ecology and Society 11(2):13.
Holland, J. H. 1995. Can there be a unified theory of complex adaptive systems? In Morowitz, H.L. and J. L. Singer, eds., The Mind, The Brain, and Complex Adaptive Systems. Addison-Wesley.
Hurd, B. H., R. St. Hilaire, and J. White. 2006. Residential landscapes, homeowner attitudes, and water-wise choices in New Mexico. Horttechnology 16(2):241-246.
Knowles-Yánez, K., C. Moritz, J. Fry, C. L. Redman, M. Bucchin, and P. H. McCartney. 1999. Historic Land Use: Phase I Report on Generalized Land Use. Central Arizona - Phoenix Long-Term Ecological Research Contribution No. 1, Center for Environmental Studies, Arizona State University, Tempe.
Laing, J. 1988. Phoenix descending: Is boomtown going bust?. Barron’s 8; December 19. Larsen, L., and S. L. Harlan. 2006. Desert dreamscapes: Residential landscape preference and
behavior. Landscape and Urban Planning 78(1-2):85-100. Larson, K. L., D. Casagrande, S. L. Harlan, and S. Yabiku. In review. Residents’ yard choices
and rationales in a desert city: Social priorities, ecological impacts, and decision tradeoffs. Submitted to Environmental Management.
Low, S. 2003. Behind the Gates: Life, Security, and the Pursuit of Happiness in Fortress America. Routledge, New York and London.
34
Martin, C. 2001. Landscape water use in Phoenix Arizona. Desert Plants 17:26-31. Martin, C., K. A. Peterson, and L. B. Stabler. 2003. Residential landscaping in Phoenix, Arizona,
USA: Practices and preferences relative to covenants, codes and restrictions. Journal of Arboriculture 29(1):9-17.
Matson, P. A., W. J. Parton, A. G. Power, and M. J. Swift. 1997. Agricultural intensification and ecosystem properties. Science 277:504-509
McKenzie, E. 1994. Privatopia: Homeowners Associations and the Rise of Residential Private Government. Yale University Press, Hartford.
Milesi, C., S. W. Running, C. D. Elvidge, J.B. Dietz, B.T. Tuttle, and R.R. Nemani. 2005. Mapping and modeling the biogeochemical cycling of turf grasses in the United States. Environmental Management 36(3):426-438.
Nordlund, A., and J. Garvill. 2002. Value structures behind proenvironmental behavior. Environment and Behavior 34(6):740-756.
Ostrom, E. 2000. Collective action and the evolution of social norms. Journal of Economic Perspectives 14:137-158.
Putnam, R. 2000. Bowling Alone: The Collapse and Revival of American Community. Simon & Schuster.
Redman, C. and D. Foster. 2008. Agrarian Landscapes in Transition: Comparison of Long Term Ecological and Cultural Change. Oxford University Press, New York.
Robbins, P., A. Polderman, and T. Birkenholtz. 2001. Lawns and toxins: An ecology of the city. Cities 18(6):369-380.
Schneekloth, L. H., and R. Shibley. 1995. Placemaking: the Art and Practice of Building Communities. Wiley, New York.
Schwartz, S. 1994. Are there universal aspects in the structure and contents of human values? Journal of Social Issues 50(4):19-45.
Stabile, D. R. 2000. Community Associations: The Emergence and Acceptance of a Quiet Innovation in Housing. Greenwood Press, Westport.
Stern, P. 2000. Toward a coherent theory of environmentally significant behavior. Journal of Social Issues 56(3):407-424.
Swetnam, T. W., C. D. Allen, and J. L. Betancourt. 1999. Applied historical ecology: Using the past to manage for the future. Ecological Applications 9(4):1189-1206.
Templeton, S. R., S. J. Yoo, and D. Zilberman. 1999. An economic analysis of yard care and synthetic chemical use: The case of San Francisco. Environmental & Resource Economics 14(3): 385-397.
Tilman, D., J. Fargione, B. Wolff, C. D’Antonio, A. Dobson, R. Howarth, D. Schindler, W.H. Schlesinger, D. Simberloff and D. Swackhamer. 2001. Science 292 (5515):281-284.
Tilman, D., K. G. Cassman, P. A. Matson, R. Naylor, and S. Polasky. 2002. Agricultural sustainability and intensive production practices. Nature 418:671-677.
Waits, M. J. 2000. Hits and Misses: Fast Growth in Metropolitan Phoenix. Morrison Institute for Public Policy, Arizona State University, Tempe.
Wentz, E. A., and P. Gober. 2007. Determinants of small-area water consumption for the city of Phoenix, Arizona. Water Resources Management 21(11):1849-1863.
Wilson-Doenges, G. 2000. An exploration of sense of community and fear of crime in gated communities. Environment and Behavior 32(5):597-611.
Yabiku S., D.G. Casagrande, and E. Farley-Metzger. 2008. Preferences for landscape choice in a Southwestern desert city. Environment and Behavior 40(3):382-400.
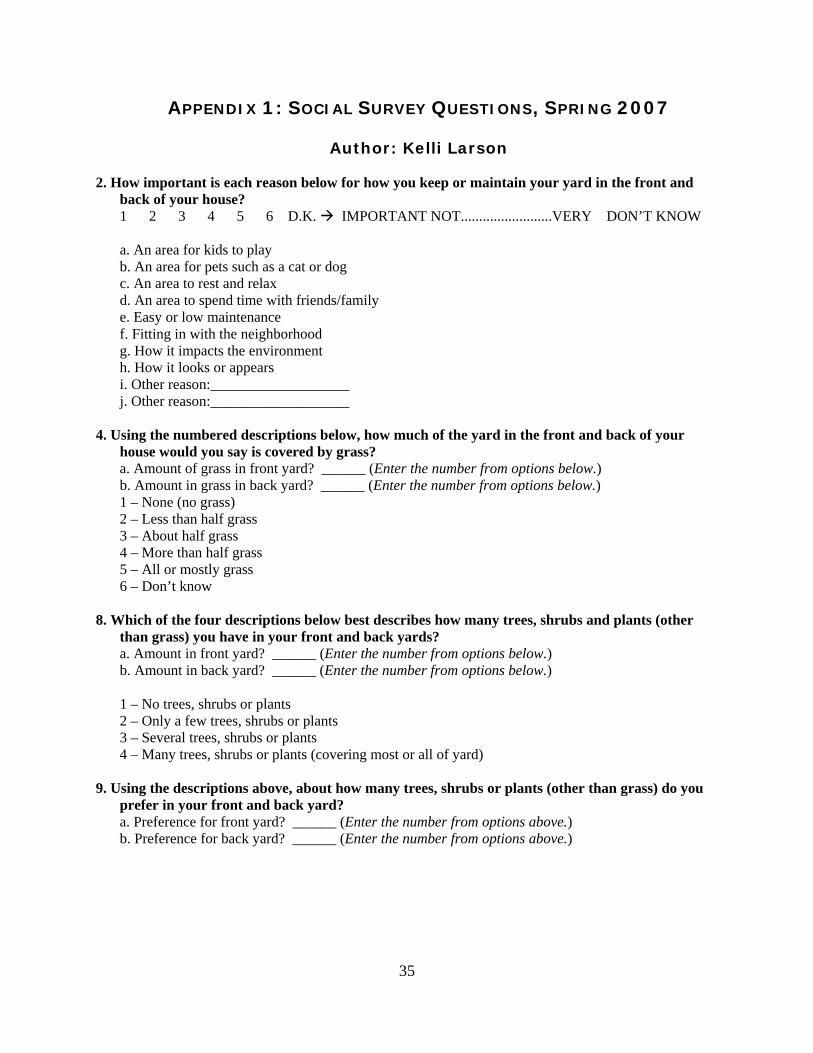
35
APPENDIX 1: SOCIAL SURVEY QUESTIONS, SPRING 2007
Author: Kelli Larson
2. How important is each reason below for how you keep or maintain your yard in the front and back of your house? 1 2 3 4 5 6 D.K. IMPORTANT NOT.........................VERY DON’T KNOW a. An area for kids to play b. An area for pets such as a cat or dog c. An area to rest and relax d. An area to spend time with friends/family e. Easy or low maintenance f. Fitting in with the neighborhood g. How it impacts the environment h. How it looks or appears i. Other reason:___________________ j. Other reason:___________________
4. Using the numbered descriptions below, how much of the yard in the front and back of your house would you say is covered by grass? a. Amount of grass in front yard? ______ (Enter the number from options below.) b. Amount in grass in back yard? ______ (Enter the number from options below.) 1 – None (no grass) 2 – Less than half grass 3 – About half grass 4 – More than half grass 5 – All or mostly grass 6 – Don’t know
8. Which of the four descriptions below best describes how many trees, shrubs and plants (other than grass) you have in your front and back yards? a. Amount in front yard? ______ (Enter the number from options below.) b. Amount in back yard? ______ (Enter the number from options below.) 1 – No trees, shrubs or plants 2 – Only a few trees, shrubs or plants 3 – Several trees, shrubs or plants 4 – Many trees, shrubs or plants (covering most or all of yard)
9. Using the descriptions above, about how many trees, shrubs or plants (other than grass) do you prefer in your front and back yard? a. Preference for front yard? ______ (Enter the number from options above.) b. Preference for back yard? ______ (Enter the number from options above.)
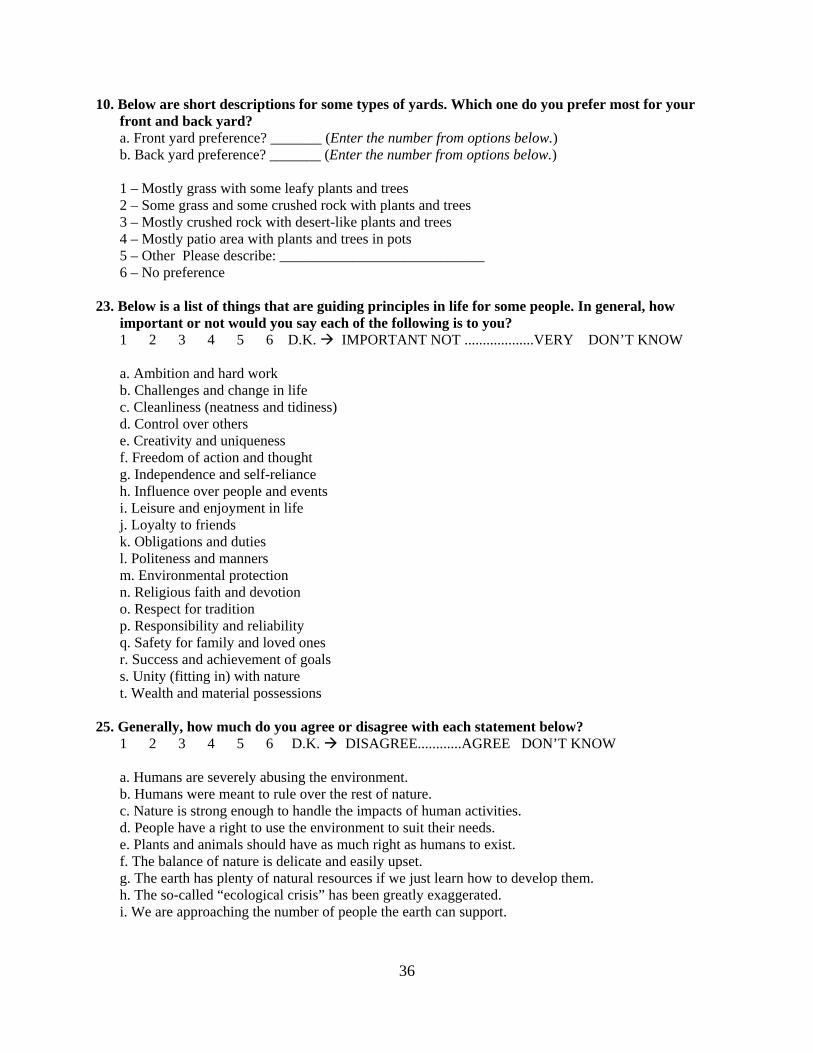
36
10. Below are short descriptions for some types of yards. Which one do you prefer most for your front and back yard? a. Front yard preference? _______ (Enter the number from options below.) b. Back yard preference? _______ (Enter the number from options below.) 1 – Mostly grass with some leafy plants and trees 2 – Some grass and some crushed rock with plants and trees 3 – Mostly crushed rock with desert-like plants and trees 4 – Mostly patio area with plants and trees in pots 5 – Other Please describe: ____________________________ 6 – No preference
23. Below is a list of things that are guiding principles in life for some people. In general, how important or not would you say each of the following is to you? 1 2 3 4 5 6 D.K. IMPORTANT NOT ...................VERY DON’T KNOW a. Ambition and hard work b. Challenges and change in life c. Cleanliness (neatness and tidiness) d. Control over others e. Creativity and uniqueness f. Freedom of action and thought g. Independence and self-reliance h. Influence over people and events i. Leisure and enjoyment in life j. Loyalty to friends k. Obligations and duties l. Politeness and manners m. Environmental protection n. Religious faith and devotion o. Respect for tradition p. Responsibility and reliability q. Safety for family and loved ones r. Success and achievement of goals s. Unity (fitting in) with nature t. Wealth and material possessions
25. Generally, how much do you agree or disagree with each statement below? 1 2 3 4 5 6 D.K. DISAGREE............AGREE DON’T KNOW a. Humans are severely abusing the environment. b. Humans were meant to rule over the rest of nature. c. Nature is strong enough to handle the impacts of human activities. d. People have a right to use the environment to suit their needs. e. Plants and animals should have as much right as humans to exist. f. The balance of nature is delicate and easily upset. g. The earth has plenty of natural resources if we just learn how to develop them. h. The so-called “ecological crisis” has been greatly exaggerated. i. We are approaching the number of people the earth can support.
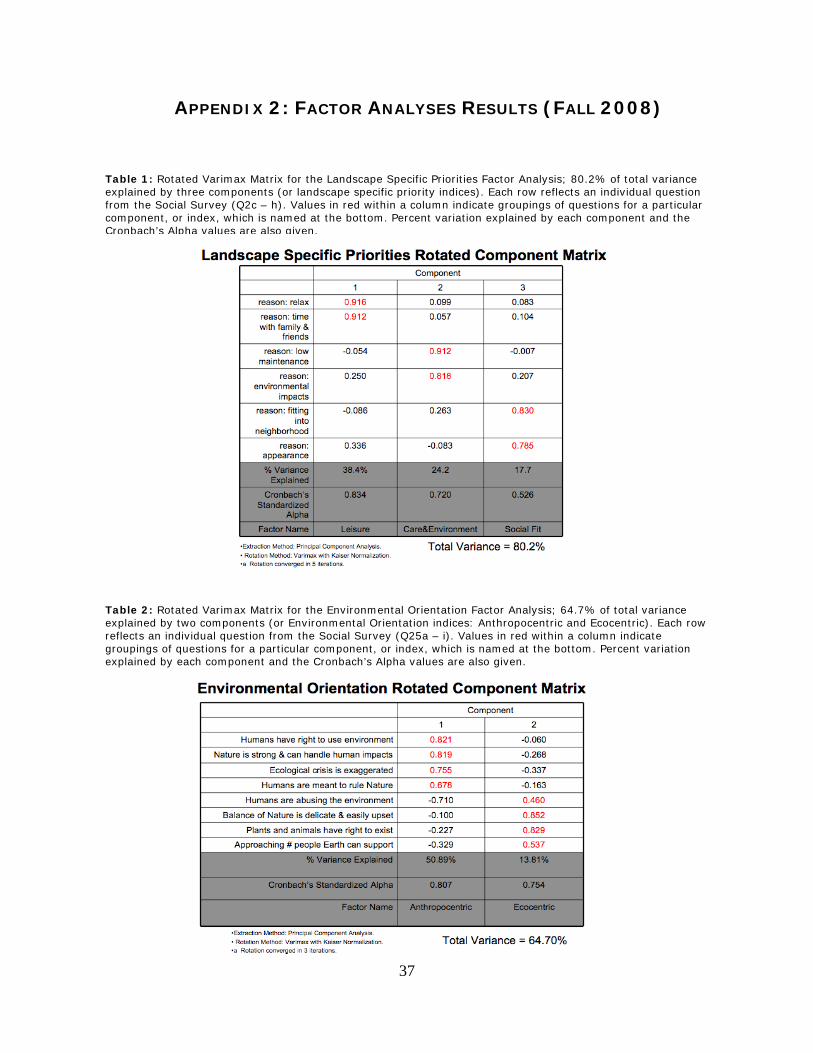
37
APPENDIX 2: FACTOR ANALYSES RESULTS (FALL 2008) Table 1: Rotated Varimax Matrix for the Landscape Specific Priorities Factor Analysis; 80.2% of total variance
explained by three components (or landscape specific priority indices). Each row reflects an individual question from the Social Survey (Q2c – h). Values in red within a column indicate groupings of questions for a particular component, or index, which is named at the bottom. Percent variation explained by each component and the Cronbach’s Alpha values are also given.
Table 2: Rotated Varimax Matrix for the Environmental Orientation Factor Analysis; 64.7% of total variance explained by two components (or Environmental Orientation indices: Anthropocentric and Ecocentric). Each row reflects an individual question from the Social Survey (Q25a – i). Values in red within a column indicate groupings of questions for a particular component, or index, which is named at the bottom. Percent variation explained by each component and the Cronbach’s Alpha values are also given.
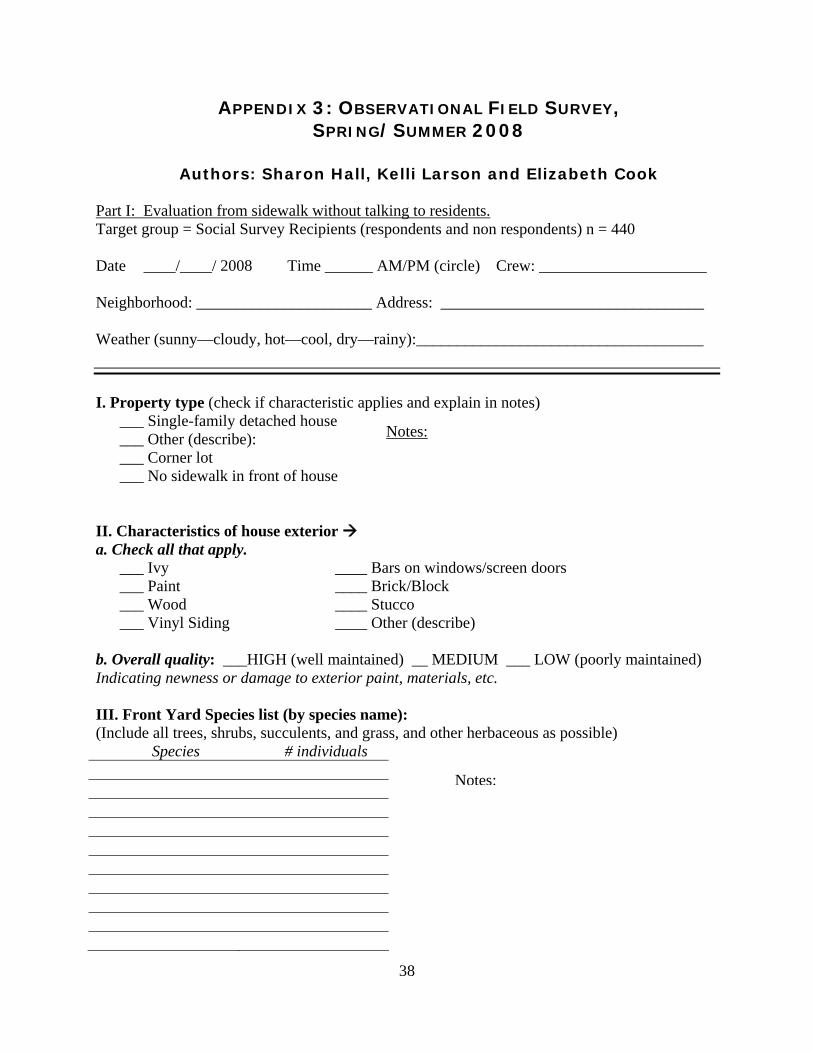
38
APPENDIX 3: OBSERVATIONAL FIELD SURVEY, SPRING/SUMMER 2008
Authors: Sharon Hall, Kelli Larson and Elizabeth Cook
Part I: Evaluation from sidewalk without talking to residents. Target group = Social Survey Recipients (respondents and non respondents) n = 440 Date ____/____/ 2008 Time ______ AM/PM (circle) Crew: _____________________ Neighborhood: ______________________ Address: _________________________________ Weather (sunny—cloudy, hot—cool, dry—rainy):____________________________________
I. Property type (check if characteristic applies and explain in notes)
___ Single-family detached house ___ Other (describe): ___ Corner lot ___ No sidewalk in front of house
II. Characteristics of house exterior a. Check all that apply.
___ Ivy ____ Bars on windows/screen doors ___ Paint ____ Brick/Block ___ Wood ____ Stucco ___ Vinyl Siding ____ Other (describe)
b. Overall quality: ___HIGH (well maintained) __ MEDIUM ___ LOW (poorly maintained) Indicating newness or damage to exterior paint, materials, etc. III. Front Yard Species list (by species name): (Include all trees, shrubs, succulents, and grass, and other herbaceous as possible)
Species # individuals
Notes:
Notes:
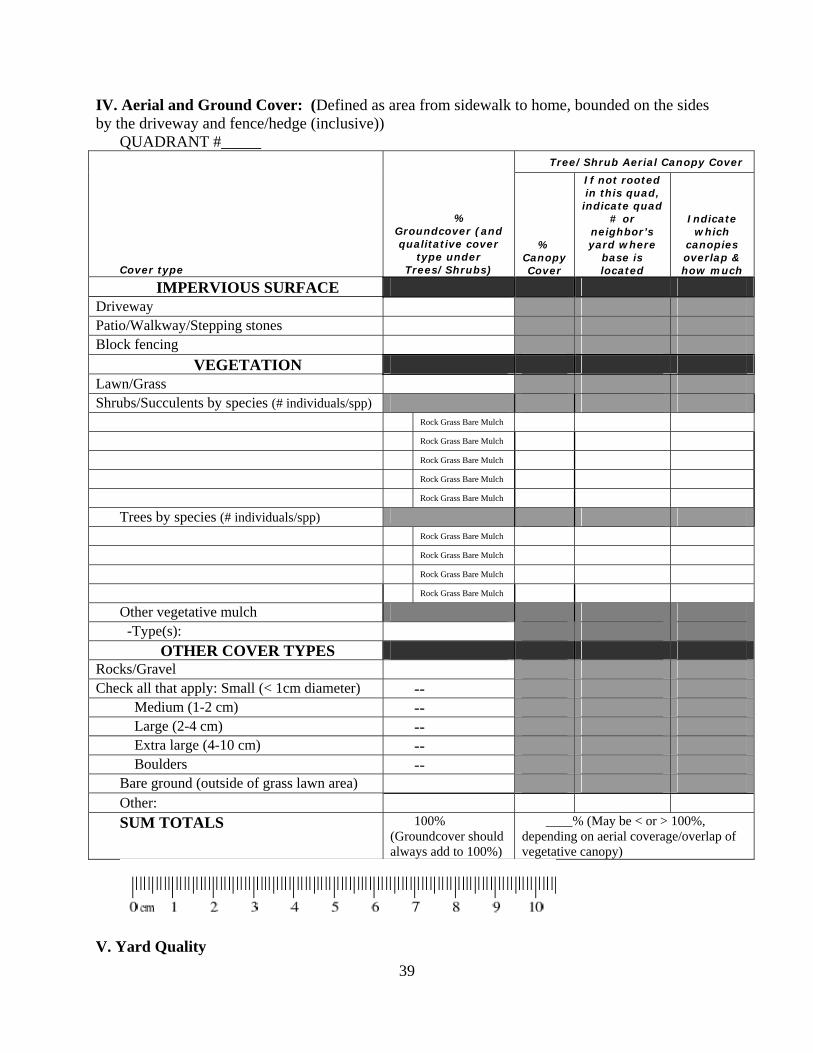
39
IV. Aerial and Ground Cover: (Defined as area from sidewalk to home, bounded on the sides by the driveway and fence/hedge (inclusive))
QUADRANT #_____ Tree/Shrub Aerial Canopy Cover
Cover type
% Groundcover (and qualitative cover
type under Trees/Shrubs)
% Canopy Cover
If not rooted in this quad, indicate quad
# or neighbor’s yard where
base is located
Indicate which
canopies overlap & how much
IMPERVIOUS SURFACE Driveway Patio/Walkway/Stepping stones Block fencing
VEGETATION Lawn/Grass Shrubs/Succulents by species (# individuals/spp)
Rock Grass Bare Mulch Rock Grass Bare Mulch Rock Grass Bare Mulch Rock Grass Bare Mulch Rock Grass Bare Mulch
Trees by species (# individuals/spp) Rock Grass Bare Mulch Rock Grass Bare Mulch Rock Grass Bare Mulch Rock Grass Bare Mulch Other vegetative mulch -Type(s):
OTHER COVER TYPES Rocks/Gravel Check all that apply: Small (< 1cm diameter) --
Medium (1-2 cm) -- Large (2-4 cm) -- Extra large (4-10 cm) -- Boulders -- Bare ground (outside of grass lawn area) Other: SUM TOTALS 100%
(Groundcover should always add to 100%)
____% (May be < or > 100%, depending on aerial coverage/overlap of vegetative canopy)
V. Yard Quality
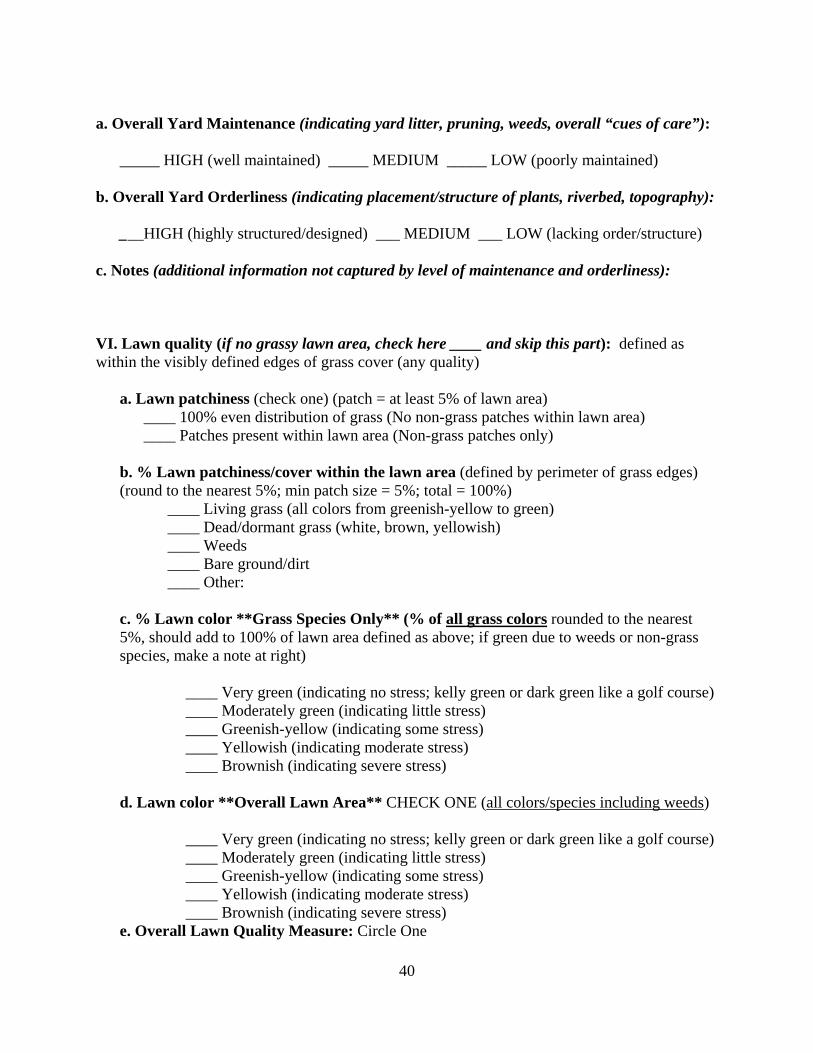
40
a. Overall Yard Maintenance (indicating yard litter, pruning, weeds, overall “cues of care”):
_____ HIGH (well maintained) _____ MEDIUM _____ LOW (poorly maintained)
b. Overall Yard Orderliness (indicating placement/structure of plants, riverbed, topography): ___HIGH (highly structured/designed) ___ MEDIUM ___ LOW (lacking order/structure)
c. Notes (additional information not captured by level of maintenance and orderliness):
VI. Lawn quality (if no grassy lawn area, check here ____ and skip this part): defined as within the visibly defined edges of grass cover (any quality)
a. Lawn patchiness (check one) (patch = at least 5% of lawn area)
____ 100% even distribution of grass (No non-grass patches within lawn area) ____ Patches present within lawn area (Non-grass patches only)
b. % Lawn patchiness/cover within the lawn area (defined by perimeter of grass edges) (round to the nearest 5%; min patch size = 5%; total = 100%)
____ Living grass (all colors from greenish-yellow to green) ____ Dead/dormant grass (white, brown, yellowish) ____ Weeds ____ Bare ground/dirt ____ Other:
c. % Lawn color **Grass Species Only** (% of all grass colors rounded to the nearest 5%, should add to 100% of lawn area defined as above; if green due to weeds or non-grass species, make a note at right)
____ Very green (indicating no stress; kelly green or dark green like a golf course) ____ Moderately green (indicating little stress) ____ Greenish-yellow (indicating some stress) ____ Yellowish (indicating moderate stress) ____ Brownish (indicating severe stress)
d. Lawn color **Overall Lawn Area** CHECK ONE (all colors/species including weeds)
____ Very green (indicating no stress; kelly green or dark green like a golf course) ____ Moderately green (indicating little stress) ____ Greenish-yellow (indicating some stress) ____ Yellowish (indicating moderate stress) ____ Brownish (indicating severe stress)
e. Overall Lawn Quality Measure: Circle One
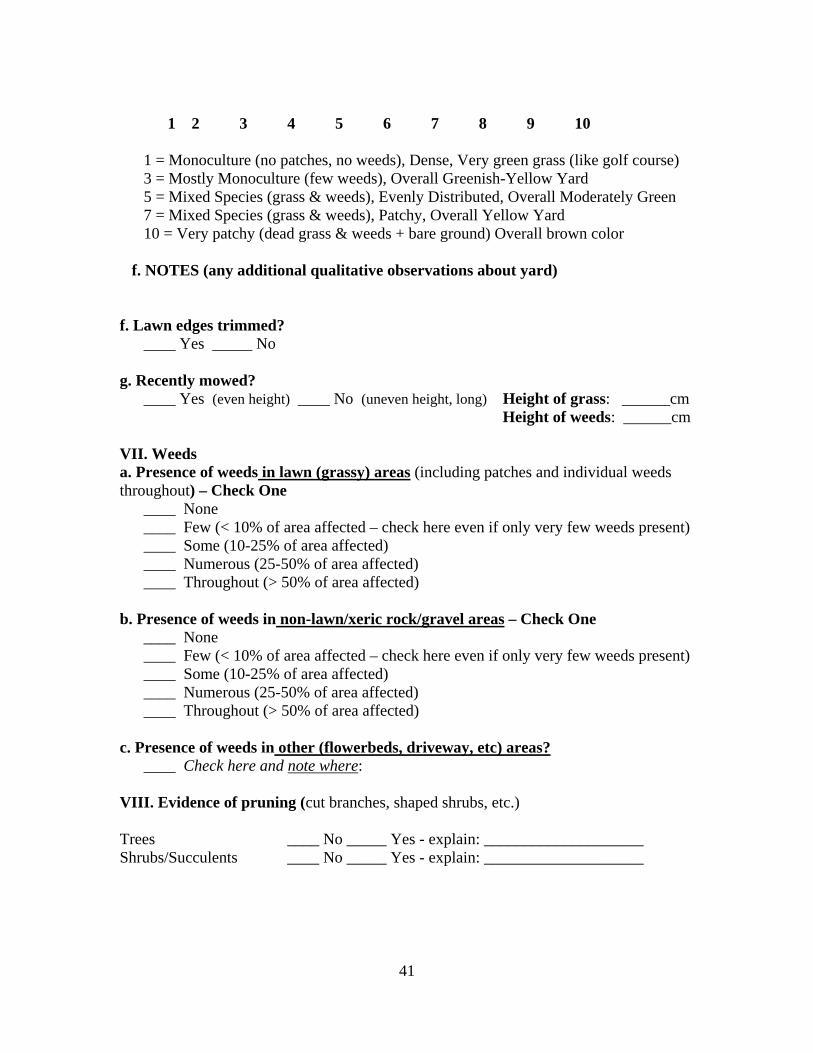
41
1 2 3 4 5 6 7 8 9 10
1 = Monoculture (no patches, no weeds), Dense, Very green grass (like golf course) 3 = Mostly Monoculture (few weeds), Overall Greenish-Yellow Yard 5 = Mixed Species (grass & weeds), Evenly Distributed, Overall Moderately Green 7 = Mixed Species (grass & weeds), Patchy, Overall Yellow Yard 10 = Very patchy (dead grass & weeds + bare ground) Overall brown color f. NOTES (any additional qualitative observations about yard) f. Lawn edges trimmed?
____ Yes _____ No
g. Recently mowed? ____ Yes (even height) ____ No (uneven height, long) Height of grass: ______cm
Height of weeds: ______cm VII. Weeds a. Presence of weeds in lawn (grassy) areas (including patches and individual weeds throughout) – Check One
____ None ____ Few (< 10% of area affected – check here even if only very few weeds present) ____ Some (10-25% of area affected) ____ Numerous (25-50% of area affected) ____ Throughout (> 50% of area affected)
b. Presence of weeds in non-lawn/xeric rock/gravel areas – Check One
____ None ____ Few (< 10% of area affected – check here even if only very few weeds present) ____ Some (10-25% of area affected) ____ Numerous (25-50% of area affected) ____ Throughout (> 50% of area affected)
c. Presence of weeds in other (flowerbeds, driveway, etc) areas?
____ Check here and note where: VIII. Evidence of pruning (cut branches, shaped shrubs, etc.) Trees ____ No _____ Yes - explain: ____________________ Shrubs/Succulents ____ No _____ Yes - explain: ____________________
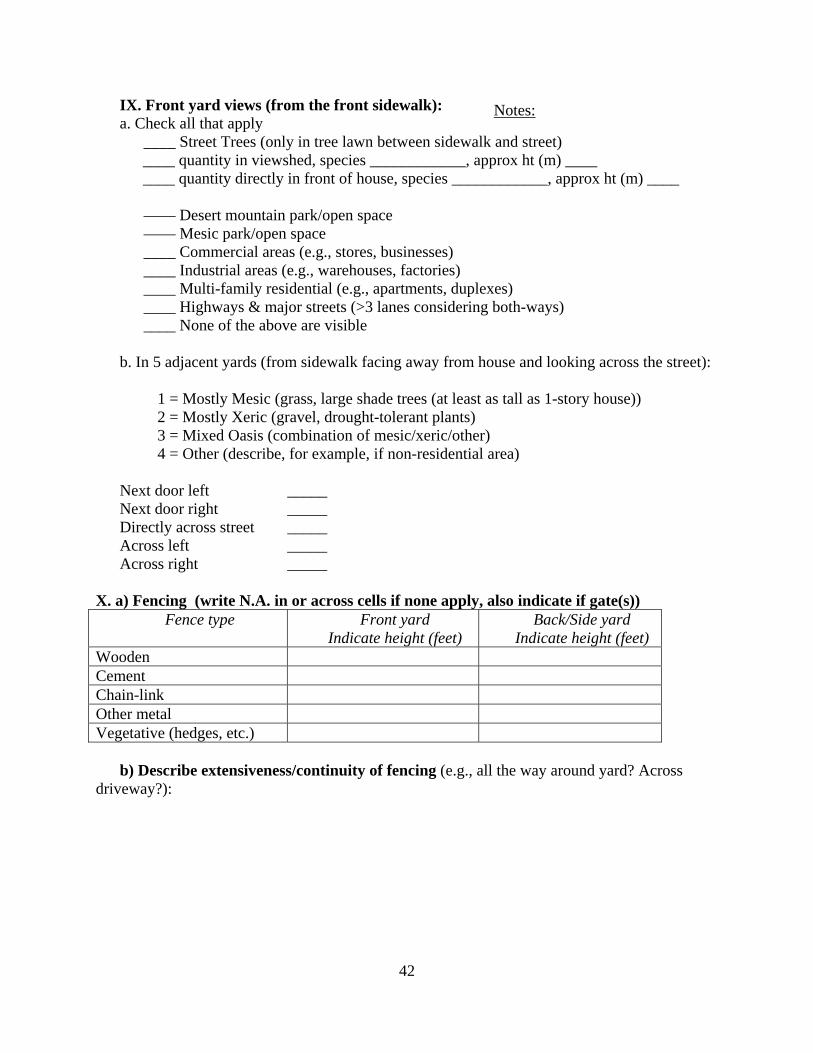
42
IX. Front yard views (from the front sidewalk): a. Check all that apply
____ Street Trees (only in tree lawn between sidewalk and street) ____ quantity in viewshed, species ____________, approx ht (m) ____ ____ quantity directly in front of house, species ____________, approx ht (m) ____
–––– Desert mountain park/open space –––– Mesic park/open space ____ Commercial areas (e.g., stores, businesses) ____ Industrial areas (e.g., warehouses, factories) ____ Multi-family residential (e.g., apartments, duplexes) ____ Highways & major streets (>3 lanes considering both-ways)
____ None of the above are visible b. In 5 adjacent yards (from sidewalk facing away from house and looking across the street):
1 = Mostly Mesic (grass, large shade trees (at least as tall as 1-story house)) 2 = Mostly Xeric (gravel, drought-tolerant plants) 3 = Mixed Oasis (combination of mesic/xeric/other) 4 = Other (describe, for example, if non-residential area)
Next door left _____ Next door right _____ Directly across street _____ Across left _____ Across right _____
X. a) Fencing (write N.A. in or across cells if none apply, also indicate if gate(s))
Fence type Front yard Indicate height (feet)
Back/Side yard Indicate height (feet)
Wooden Cement Chain-link Other metal Vegetative (hedges, etc.)
b) Describe extensiveness/continuity of fencing (e.g., all the way around yard? Across
driveway?):
Notes:
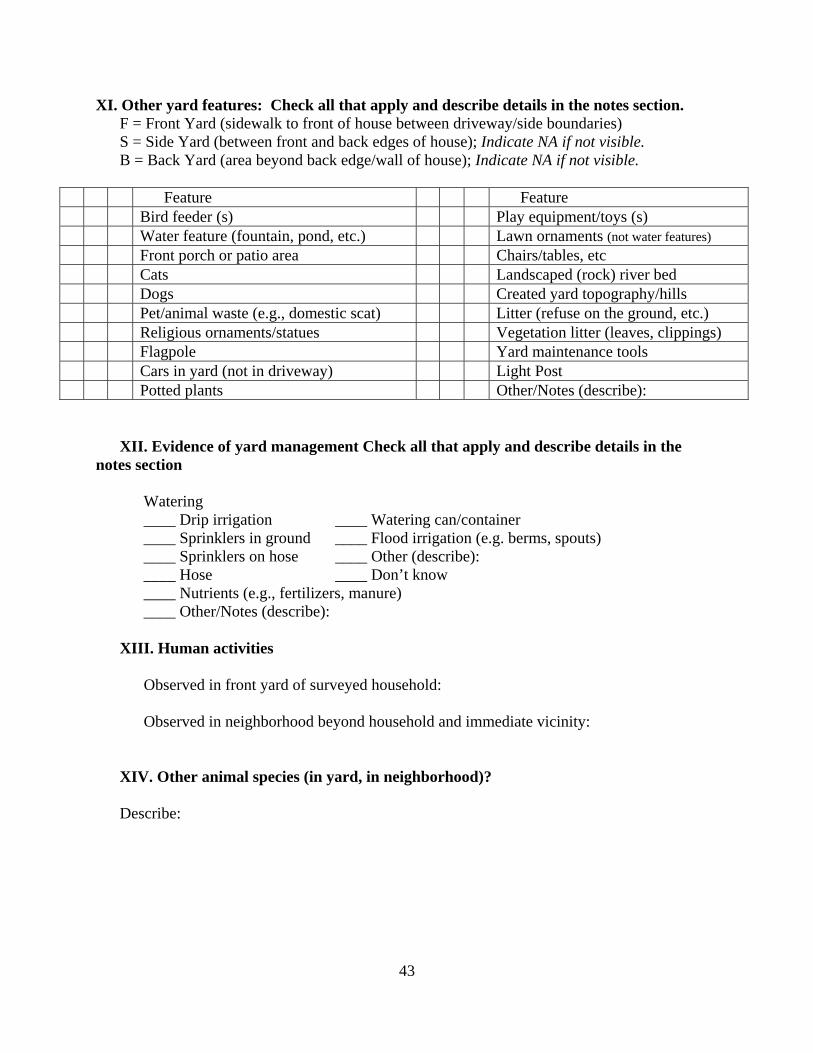
43
XI. Other yard features: Check all that apply and describe details in the notes section. F = Front Yard (sidewalk to front of house between driveway/side boundaries) S = Side Yard (between front and back edges of house); Indicate NA if not visible. B = Back Yard (area beyond back edge/wall of house); Indicate NA if not visible.
Feature Feature Bird feeder (s) Play equipment/toys (s) Water feature (fountain, pond, etc.) Lawn ornaments (not water features) Front porch or patio area Chairs/tables, etc Cats Landscaped (rock) river bed Dogs Created yard topography/hills Pet/animal waste (e.g., domestic scat) Litter (refuse on the ground, etc.) Religious ornaments/statues Vegetation litter (leaves, clippings) Flagpole Yard maintenance tools Cars in yard (not in driveway) Light Post Potted plants Other/Notes (describe):
XII. Evidence of yard management Check all that apply and describe details in the
notes section Watering ____ Drip irrigation ____ Watering can/container ____ Sprinklers in ground ____ Flood irrigation (e.g. berms, spouts) ____ Sprinklers on hose ____ Other (describe): ____ Hose ____ Don’t know ____ Nutrients (e.g., fertilizers, manure) ____ Other/Notes (describe):
XIII. Human activities
Observed in front yard of surveyed household: Observed in neighborhood beyond household and immediate vicinity:
XIV. Other animal species (in yard, in neighborhood)? Describe:
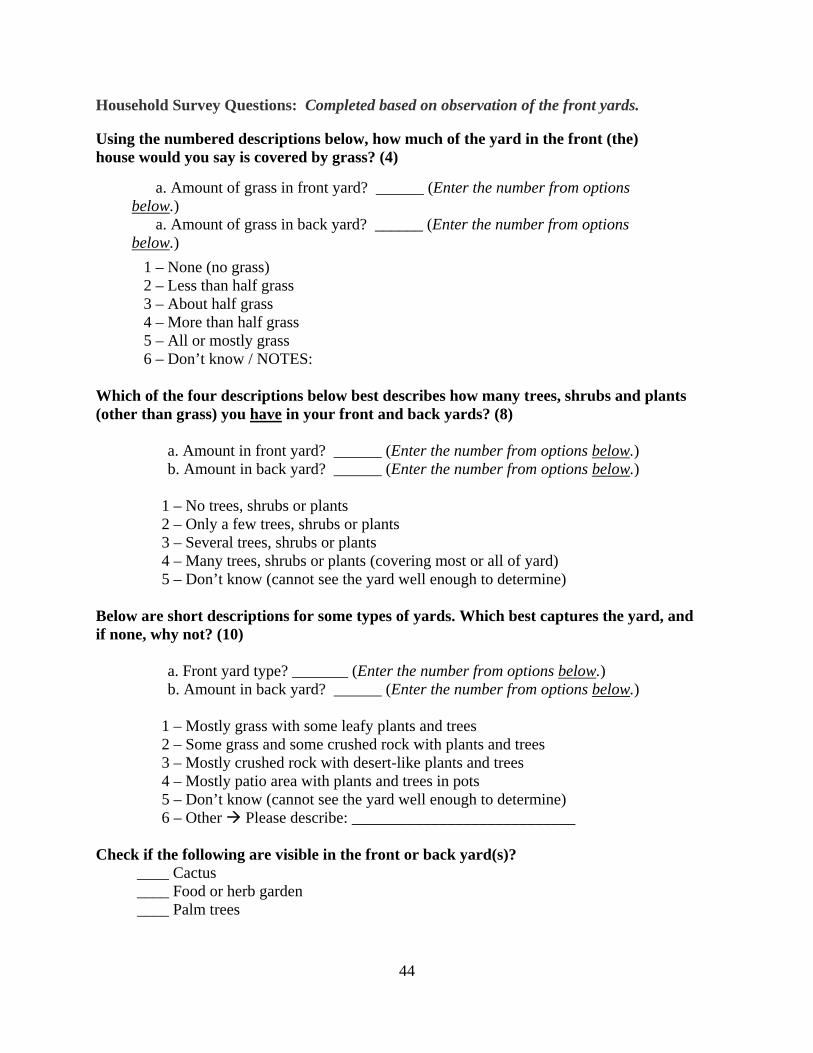
44
Household Survey Questions: Completed based on observation of the front yards.
Using the numbered descriptions below, how much of the yard in the front (the) house would you say is covered by grass? (4)
a. Amount of grass in front yard? ______ (Enter the number from options
below.) a. Amount of grass in back yard? ______ (Enter the number from options
below.)
1 – None (no grass) 2 – Less than half grass 3 – About half grass 4 – More than half grass 5 – All or mostly grass 6 – Don’t know / NOTES:
Which of the four descriptions below best describes how many trees, shrubs and plants (other than grass) you have in your front and back yards? (8)
a. Amount in front yard? ______ (Enter the number from options below.) b. Amount in back yard? ______ (Enter the number from options below.)
1 – No trees, shrubs or plants 2 – Only a few trees, shrubs or plants 3 – Several trees, shrubs or plants 4 – Many trees, shrubs or plants (covering most or all of yard) 5 – Don’t know (cannot see the yard well enough to determine)
Below are short descriptions for some types of yards. Which best captures the yard, and if none, why not? (10)
a. Front yard type? _______ (Enter the number from options below.) b. Amount in back yard? ______ (Enter the number from options below.)
1 – Mostly grass with some leafy plants and trees 2 – Some grass and some crushed rock with plants and trees 3 – Mostly crushed rock with desert-like plants and trees 4 – Mostly patio area with plants and trees in pots 5 – Don’t know (cannot see the yard well enough to determine) 6 – Other Please describe: ____________________________
Check if the following are visible in the front or back yard(s)?
____ Cactus ____ Food or herb garden ____ Palm trees
45
APPENDIX 4: INTERVIEW PROTOCOL FOR DEVELOPERS, FALL 2008
Authors: Benjamin Funke and Kelli Larson
Interview Goals: To better understand how and why residential developments have changed over time in the Phoenix area (with special attention to landscaping trends in yards).
Research Question: How have the social drivers relevant to residential landscaping on new development in the City of Phoenix changed over time?
PART I: INTRODUCTORY QUESTIONS
First I’d like to ask you a few questions about how you’ve been involved in developing residential housing in the Phoenix area. When I speak of “development” I am referring more specifically to the processes of improving unimproved land, rezoning, or substantially renovating the site plans of existing parcels for residential use. Is this is line with your conception of development?
1) A: What has your work has entailed in terms of developing residential property in the Phoenix area?
B: About how long have you been working to develop residential property in the City of Phoenix?
a. Probe: In what year did you start your first project? And your last? i. Purpose: Establish temporal range relevant to analysis.
2) A: About how many housing developments would you say you have worked on in the
Phoenix area? B: About what percentage would you say have been single-family homes versus
other types of higher density housing? i. Purpose: Establish experience of interviewee.
3) A: Other than the City of Phoenix, in what other cities or towns in the Valley or
Maricopa County have you developed residential property? B: Do you develop residential housing in other areas throughout Arizona or elsewhere?
If so, where? i. Purpose: Establish spatial range relevant to analysis
PART II: CHANGES IN HOUSING DEVELOPMENTS IN PHOENIX AREA, GENERALLY
Next, based on your knowledge and experience developing residential housing in the Phoenix area, I’d like to ask you a few questions on how and why such development projects have changed over time.
4) A: What are the major changes you’ve seen and experienced in developing residential
housing? a. Probe: What architectural or landscaping elements have changed?
B: What would you say are the main reasons for these changes?
46
b. Probe: In other words, why would you say particular changes in residential housing have occurred over time in the Phoenix area?
i. Purpose: Solicit candid response on changing social drivers (i.e., lifestyles & institutions).
PART III: CHANGES IN HOW AND WHY LANSCAPING OF RESIDENTIAL HOUSING THROUGHOUT PHOENIX AND SURROUNDING AREAS
Now thinking about the types of landscaping put into new housing units, I’d like to ask you a few questions about how the landscaping in residential yards have changed over time. In Phoenix, for example, we have seen a variety of landscaping options in both front and back yards of new developments, ranging from grass lawns to rock or desert landscapes and including different types and amounts of plants, hard surfaces and other features (Explain if necessary).
5) Based on your experience in the Phoenix area, how would you say such residential
landscaping in new housing units changed over time? a. Probe: Would you say the prevalence of grass lawns or desert motifs has shifted
over the years? i. Purpose: Establish patterns of change in residential development.
6) What were some of the reasons for these changes occurring when they did? a. Probe: In other words, why did why did these changes occur?
i. Purpose: Establish drivers of change of residential development. Specifically: 7) Regarding the planning process for residential developments, how have city and state
ordinances influenced decisions regarding how residential housing units and residential yards were developed?
a. Probe: Can you specifically talk about ordinances that have changed or been newly introduced over your career that have influenced landscaping decisions?
i. Purpose: Explore social drivers (specifically formal institutions)
8) How have social trends and lifestyle preferences (Explain if necessary) of potential buyers influenced the planning and design of your residential developments?
a. Probe: Do you carry out research to determine preferences of consumers or do you use less formal methods (like reading the newspaper or driving around residential neighborhoods to observe trends)?
i. Purpose: Explore social drivers (specifically social lifestyles)
9) In reference to the last question about social trends, how would you say consumer preferences regarding landscaping in both the front and back yards have changed since your first project and your last?
a. Probe: What factors drive this change in your opinion? What do you think homeowners look for in landscaping?
47
i. Purpose: Explore changing social drivers over time (specifically social lifestyles)
PART IV: EXTRA QUESTIONS IF TIME!?!
10) What do you see as the future direction for residential landscapes in the City of
Phoenix? a. Probe: Are these changes needed and what problems will they address?
i. Purpose: Project potential future changes to residential landscapes.
11) How has the physical environment and context of the Sonoran Desert influenced your
decisions as a developer, especially in terms of landscaping, if at all? i. Purpose: Establish importance of sense of place.
PART V: CONCLUDING QUESTIONS AND REMARKS
That’s all of the questions I have for you. Is there anything you’d like to add or discuss about
the questions I’ve asked you? One last issue: I’d like to talk to a few more people about their experience and perspectives
on how residential housing developments in the Phoenix area have changed over time. Is there anyone you’d recommend that I talk with? If so, might you be able to put me in contact with them?


