Embed Size (px)
Citation preview

ed: JLC / sa:JC, PY, CS
Cherrypicking Pro-active Leaders and Fast-Followers
Playing field across the sectors in Singapore is shifting fast
Banks are Pro-active Leaders while Aviation and Logistics incumbents
are Fast Followers
Companies we like are– Singapore Airlines, Singapore banks, iFast, ST
Engg, Singtel, SingPost, MapleTree Commercial Trust & Y Ventures.
Why should one pay attention to the playing field? We define
the playing field as a function of technological capabilities and
regulations, and it may favour either challengers or incumbents,
depending on the swing of these two factors. We looked at the
market share secured by the digital challengers so far and the
incumbents’ adaptiveness of the digital model to understand the tilt
of the playing field. In our view, there is a level playing field across
the financial, logistics, and aviation sectors now, whereas the
playing field is tilted in favour of digital challengers in the retail and
land transportation sectors.
Favor incumbents who are Pro-active Leaders or Fast Followers. Fintech players in Singapore have secured negligible market share so far with many of them adopting Business to Business (B2B) model. Singapore Banks, supported by a nimble regulator, are trying to leverage their customer base to embed banking services into e-commerce transactions, using public cloud services to cut costs and launching application programming interfaces (APIs) for third parties to transform into a platform. We like iFAST for its profitable and highly scalable wealth management platform. Meanwhile, Aviation incumbent Singapore Airlines - challenged by 100% online distribution model of budget carriers – is recovering its share supported by personalized end to end tarvel experience and productivity improvement to move passengers, baggage and cargo. In the logistics sector, there are multiple last-mile challengers such as Ninja Van, aCommerce etc. However, SingPost with regional warehouse and fulfillment capabilities in Asia seems prepared with (a) unique automated parcel sorting facility for rising e-commerce volumes, (b) a network of lockers for pickups in Singapore and (d) latest digital solutions adopted from other countries
There are also winners in sectors where incumbents are slow to adapt. We like MapleTree Commercial Trust for its largely resilient
mega-malls and Y Ventures for its data-driven ecommerce in the retail
sector. We prefer Singtel for its newer digital revenue streams
coupled with digitisation of operations to cut costs and gain market
share. We also like ST Engineering which targets to leverage its track
record in Singapore to double its Smart City revenue across the
globe by 2022.
DBS Group Research . Equity 15 May 2018
Singapore Market Focus
Singapore Digital Transformation Refer to important disclosures at the end of this report
STOCKS
12-mth
Price Mkt Cap Target Performance (%)
S$ US$m S$ 3 mth 12 mth Rating
iFAST Corporation 0.94 187 1.26 6.8 21.3 BUY
Mapletree Commercial Trust
1.60 3,449 1.80 3.9 3.2 BUY
Singapore Airlines 11.15 9,868 12.00 3.9 4.2 BUY
SingPost 1.36 2,303 1.55 (4.9) (2.5) BUY Singtel 3.55 43,386 3.85 5.0 (4.6) BUY ST Engineering 3.39 7,917 4.10 4.6 (12.0) BUY Y Ventures Group 0.48 73.6 0.77 (18.0) N.A BUY
Source: DBS Group Research, Bloomberg Finance L.P. Closing
price as of 11 May 2018
Singapore’s Digital Transformation – Challengers versus Incumbents
Source: DBS Group Research
Page 1
Market Focus
Singapore Digital Transformation
Page 2
Singapore’s Digital Transformation
Sachin MITTAL Equity Analyst DBS Group Research [email protected]
Sue Lin LIM Equity Analyst DBS Group Research [email protected]
Andy SIM Equity Analyst DBS Group Research [email protected]
Paul YONG Equity Analyst DBS Group Research [email protected]
Derek TAN Equity Analyst DBS Group Research [email protected]
Alfie YEO Equity Analyst DBS Group Research [email protected]
Lee Keng LING Equity Analyst DBS Group Research [email protected]
Suvro SARKAR Equity Analyst DBS Group Research [email protected]
Rui Wen LIM Equity Analyst DBS Group Research [email protected]
Glenn NG Equity Analyst DBS Group Research [email protected]
Page 2

Market Focus
Singapore Digital Transformation
Page 3
Table of Contents
Digital Transformation in Singapore – Cherry-picking Proactive Leaders and Fast Followers
Digital Contribution to GDP ................................................................................................................. 10
Financial Services ............................................................................................................................. 10
Aviation Industry .............................................................................................................................. 22
Telecom Industry .............................................................................................................................. 27
Retail .............................................................................................................................................. 31
Transportation .................................................................................................................................. 36
Logistics Industry ............................................................................................................................. 38
Singapore Smart Nation ........................................................................................................................ 42
Strategic Government Projects .............................................................................................................. 42
Other Ongoing Smart Nation Projects ................................................................................................ 51
Appendix ............................................................................................................................................ 56
............................................................................................................................................................
Page 3

Market Focus
Singapore Digital Transformation
Page 4
Digital Transformation in Singapore – Cherry-picking Proactive Leaders and Fast Followers
Digital transformation initiatives in Singapore are all about embracing technology-driven disruption to stay ahead, while enabling nimble players to compete in the new arena. The aim is to create an industry-wide level playing field to better serve consumers in the long term.
Singapore’s Digital Transformation – Challengers versus Incumbents
Source: DBS Group Research
We have looked at the market share secured by the digital challengers in Singapore so far and the incumbents’ adaptiveness of the digital model to understand the playing field. We define the playing field as a function of technological capabilities and regulations, and it may favour either challengers or incumbents, depending on the swing of these two factors.
In our view, there is a level playing field across the financial, logistics, and aviation sectors, whereas the playing field is tilted in favour of the digital challengers in the retail and land transportation sectors.
High Low Incumbents’ adaptiveness of the digital model
Sh
are
of
Dig
ital C
halle
ng
ers
High
Low
Fast Followers
Pro-active leaders Reactive Players
Slow Movers
Financial Services
Aviation Telecommunications
Logistics
Retail
Land Transport
Page 4

Market Focus
Singapore Digital Transformation
Page 5
Financial Services
Singapore is home to around 210 FinTech firms, which raked in over US$100m in funding over the first three quarters of 2017.1 Wealth management is the most concentrated segment with over 41 companies, followed
by 32 in payments and 23 in blockchain/cryptocurrency. However, we have not seen much market share gained by these fintech firms in Singapore so far and we see a levelling of the playing field with regulatory and technological changes, which should encourage digitisation of banks in Singapore.
Source: DBS Group Research
Retail
Qoo10 and Lazada are e-commerce leaders in Singapore; Amazon entered the market in 2017.However, e-commerce accounted for around 3.9% of retail sales in Singapore in Feb 20182, still lower than
1http://FinTechnews.sg/wp-content/uploads/2017/11/Singapore-FinTech-Map-2017.png
2https://www.singstat.gov.sg/docs/default-source/default-document-library/news/press_releases/mrsfeb2018.pdf
3https://www.payvision.com/downloads/cross-border-ecommerce-in-asian-markets-singapore-and-malaysia.pdf
in many developed countries. Around 55% of e-commerce transactions in Singapore are cross-border3, it can be a challenge for incumbent retailers to carry a large range of products for the small Singapore market, unless they have scale in ASEAN.
FinTech – FinTech companies can offer app-based financial and non-financial products and leverage customer data from various businesses.
Regulations and technological changes to level the playing field – Banks are allowed to engage in permissible non-banking businesses, use public cloud services to cut costs and scale up, launch of unified standard for mobile payment, QR code and point of sale terminals.
2015
2018 Incumbent banks – Banks launching application programming interfaces (APIs) for third parties to transform into a platform, leveraging their customer base to embed banking services into e-commerce transactions, using public cloud services.
Page 5

Market Focus
Singapore Digital Transformation
Page 6
Source: DBS Group Research
Land Transportation
Almost half of point-to-point trips in the country are now served by ride-hailing players Grab and Uber*. The Land Transport Authority (LTA) made it mandatory for drivers of these ride-hailing companies to obtain a vocational license in 2017 for consumer safety but
consumers were already hooked on to Grab and Uber by then.
*Uber has entered into an agreement to sell itsSoutheast Asia operations, inclusive of Singapore, toGrab. The deal is currently under the review of theCompetition Commission of Singapore (CCS).
Incumbent retail players – Relatively slow to embrace an omni-channel presence, possibly due to the lack of scale and fear of cannibalising offline profits.
E-commerce’s popularity on therise – Qoo10 and Lazada haveentered the retail spheres, fromconsumer electronics and fashionto home supplies and groceries. Government initiatives aim to level the playing
field – The Retail Industry Digital Plan and 99%SME are some of the initiatives to help retailers go online. Budget 2018 proposes the introduction of goods and services tax (GST) on imported e-commerce services from 2020 onwards.
2018
Page 6

Market Focus
Singapore Digital Transformation
Page 7
Source: DBS Group Research
Aviation
Budget airlines such as AirAsia have altered distribution with a low-cost direct online channel to cross-sell ancillary services. The Air Transport Industry Transformation Map launched by the Civil Aviation Authority of Singapore (CAAS) in 2017 aims to achieve
real value-added growth of 16% from 2015 to 2020 and boost productivity by 3-4% per annum. Singapore Airlines launched a three-year transformation programme in 2017, which, among other things, will focus on a personalised end-to-end travel experience and productivity improvement through the deployment of autonomous systems to move passengers, baggage and cargo.
Incumbent taxi companies – Traditional taxi companies, such as ComfortDelGro, have moved into app-based services to complement their traditional service offering.
Ride-hailing apps with regional scale – App-based ride-hailing companies have managed to win a significant market share.
By the time regulator stepped in, new entrants were already successful– LTA stepped in in 2017, making vocational licenses mandatory for app-based drivers, and is mulling over an operating license for ride-hailing companies.
Page 7

Market Focus
Singapore Digital Transformation
Page 8
Source: DBS Group Research
Telecommunications
Competition has intensified with three new mobile virtual network operators (MVNOs) - Circles.Life, MyRepublic and Zero Mobile, and the expected launch by TPG in late-2018. The fourth mobile operator, TPG, would also benefit from jumping directly into the 4G network, as evident in its network rollout capex of only
S$200-300m. We expect TPG to secure around 7% revenue share of Singapore’s mobile market by 2022. The incumbents are investing in initiatives such as Internet of Things (IoT), cyber-security and digital advertising etc. to secure new revenue streams which will pay off gradually over next 3-4 years.
2018 Online distribution advantage – Low cost carriers enjoy advantage of lowest-cost direct online channel (around 100% of sales) and are also able to cross-sell more services.
Government and technology changes are levelling the playing field – In 2017, the Singapore government unveiled its plan to boost sector productivity by 3-4% per annum over 2015 to 2010, accelerating digitisation efforts in the sector. Investments in data analytics and the internet of things (IoT) to differentiate service offering and reduce operational costs.
Incumbent airlines – Adopting app-based service to complement traditional service, focusing on personalised end-to-end experience and productivity improvement.2015
Page 8

Market Focus
Singapore Digital Transformation
Page 9
Source: DBS Group Research
Logistics
The surge in online sales, consumer demand for multiple channel options to collect online purchases, and the entry of logistics start-ups such as Ninja Van
and aCommerce has challenged incumbents like SingPost to invest in automated last mile delivery solutions and follow an omni-channel approach for logistics services. SingPost had around 21% share of the last mile parcel delivery market in Singapore in 2017 and intends to raise its share going forward.
Source: DBS Group Research
2018
From telcos to smart communication providers – Existing telcos are repositioning as smart communication providers with investments in cloud technology, cyber-security, IoT, etc
New entrants not burdened by legacy revenues and networks – New entrants are not exposed to declining legacy revenue streams and are able to rollout network at much lower capex.
Regulator awarded a fourth mobile operator license in 2016 – The regulator’s granting of the fourth mobile operator license to TPG has ramped up competition for the incumbents.
2018 Start-ups exploiting opportunities in last-mile delivery – New entrant Ninja Van uses proprietary algorithms to plan its routes and manage its vehicle fleet. UrbanFox, another start-up, has introduced an Uber-like network of drivers with ratings to bid for last -mile deliveries.
Technological advances levelling the playing field – Technological advancements such as automated parcel sorting and self-service locker systems are narrowing the gap between challengers and incumbents. The regulator is facilitating the development of challengers with programmes such as Federated Lockers.
Incumbent logistics players have built regional scale – SingPost, has invested in (a) automated parcel sorting machines for rising volumes, (b) a network of lockers for pickups in Singapore, (c) regional warehouse and fulfilment capabilities in Asia, and (d) US companies with digitalsolutions, and is bringing thosesolutions to Asia.
2015
Page 9

Market Focus
Singapore Digital Transformation
Page 10
Digital Contribution to GDP
Singapore has much to gain from digital transformation. Singapore’s emerging digital economy has the potential to add over US$10b to Singapore’s
GDP by 2021 and increase the growth rate by 0.6% per annum. With this, around 60% of Singapore’s GDP is expected to be digitised by 2021, with growth in almost every industry driven by digitally enhanced offerings,
operations and relationships.4
Financial Services Singapore financial services’ playing field
Source: DBS Group Research
4https://news.microsoft.com/en-sg/2018/02/21/digital-transformation-contribute-us10-billion-singapore-gdp-2021/
2015 Present 2021
Banks not allowed in non-banking sector
Banks not permitted to use public cloud services
No unified mobile payment and point of sale (POS) terminal
Lack of framework to regulate FinTech firms
Banks allowed to enter non-banking sectors complementary to their core business
Use of cloud services permitted from a regulatory respective for banks
Unified mobile payment PayNow, unified QR code and unified POS terminal
Sandbox approach allows FinTech experiments
Banks embracing API architecture to transform into financial platform
Banks encouraged to share data with FinTech and other non-bank firms
National digital identity framework of the Smart Nation initiative to allow fully digital customer on-boarding for banks
Lower burden of cash management with drive toward cashless Singapore
Transition toward open banking, including ethical usage of data analytics and artificial intelligence and safeguarding of customer data
Page 10

Market Focus
Singapore Digital Transformation
Page 11
Source: DBS Group Research
The biggest obstacle for the FinTech revolution across the world has been the slow reaction of regulators, which have taken their time to come up with the necessary regulatory frameworks to provide a platform for tech disrupters while providing a level playing field
to banks as well. However, this has not been the case with Singapore. As early as August 2015, the Financial Technology & Innovation Group (FTIG) was formed within the Monetary Authority of Singapore (MAS) to drive the various Smart Financial Centre initiatives shown in the appendix section of the report.
FinTech – FinTech companies can offer app-based financial and non-financial products and leverage customer data from various businesses.
Regulations and technological changes to level the playing field – Banks are allowed to engage in permissible non-banking businesses, use public cloud services to cut costs and scale up, launch of unified standard for mobile payments, QR code and point of sale terminals.
Incumbent banks – Banks launching APIs for third parties to transform into a platform, leveraging their customer base to embed banking services into e-commerce transactions, using public cloud services.
2018
2015
Page 11
Market Focus
Singapore Digital Transformation
Page 12
Future of banking
Source: DBS Group Research
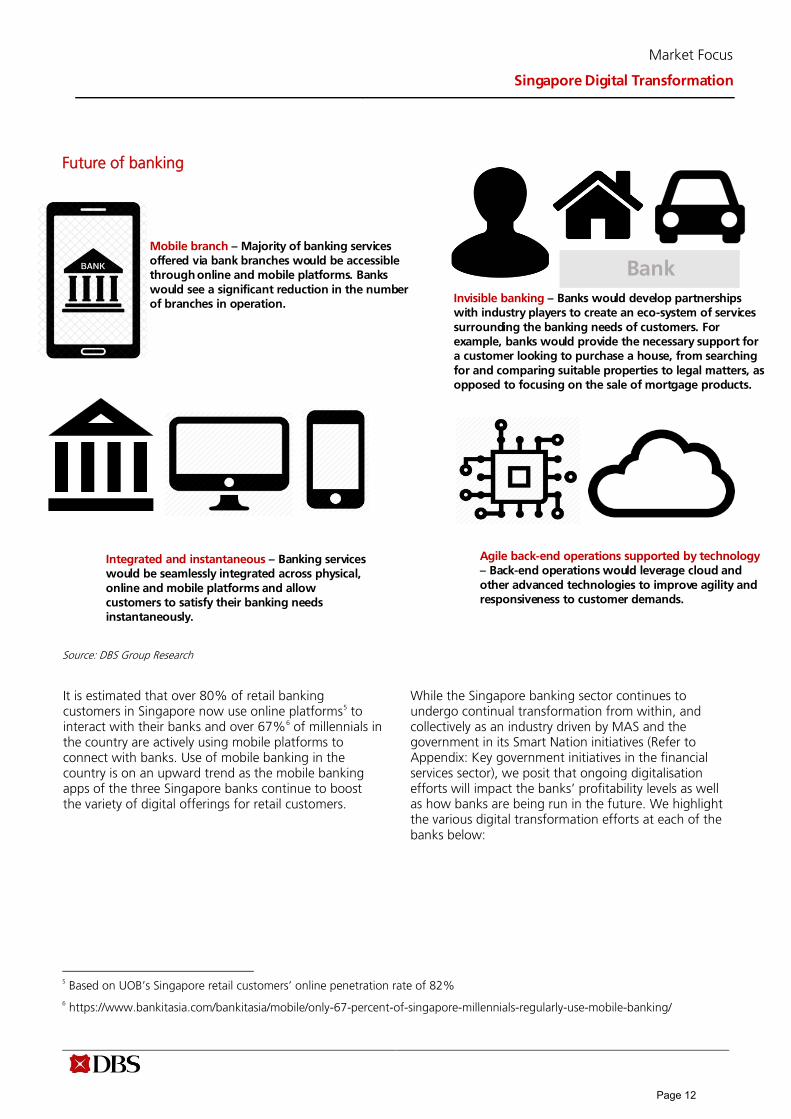
It is estimated that over 80% of retail banking customers in Singapore now use online platforms5 to interact with their banks and over 67%6 of millennials in the country are actively using mobile platforms to connect with banks. Use of mobile banking in the country is on an upward trend as the mobile banking apps of the three Singapore banks continue to boost the variety of digital offerings for retail customers.
While the Singapore banking sector continues to undergo continual transformation from within, and collectively as an industry driven by MAS and the government in its Smart Nation initiatives (Refer to Appendix: Key government initiatives in the financial services sector), we posit that ongoing digitalisation efforts will impact the banks’ profitability levels as well as how banks are being run in the future. We highlight the various digital transformation efforts at each of the banks below:
5 Based on UOB’s Singapore retail customers’ online penetration rate of 82%
6 https://www.bankitasia.com/bankitasia/mobile/only-67-percent-of-singapore-millennials-regularly-use-mobile-banking/
Mobile branch – Majority of banking services offered via bank branches would be accessible through online and mobile platforms. Banks would see a significant reduction in the number of branches in operation.
Bank Invisible banking – Banks would develop partnerships with industry players to create an eco-system of services surrounding the banking needs of customers. For example, banks would provide the necessary support for a customer looking to purchase a house, from searching for and comparing suitable properties to legal matters, as opposed to focusing on the sale of mortgage products.
Integrated and instantaneous – Banking services would be seamlessly integrated across physical, online and mobile platforms and allow customers to satisfy their banking needs instantaneously.
Agile back-end operations supported by technology – Back-end operations would leverage cloud andother advanced technologies to improve agility andresponsiveness to customer demands.
Page 12

Market Focus
Singapore Digital Transformation
Page 13
Digital transformation at Singapore Banks
Source: DBS Group Research
Excellence in mobile. All in all, Singapore banks have been proactive in the mobile banking space over the last five years, with the introduction of various mobile banking, mobile wallet and other lifestyle apps,
alongside improved functionality for both retail and corporate customers. We summarise the landscape of retail mobile banking apps offered by Singapore banks below:
Sophisticated mobile banking and mobile walletapps offered by Singapore banks
New and ongoing functionalities introduced
Continued investments in technology Re-engineering of processes from within Introduction of chatbots to deal with customer
queries Integration of robotic programs to automate
and/or speed up banking processes
Excellence in Mobile
Technology to support back-end operations
Continued growth in digital customers, volumes and revenues Branch network, teller and call centre headcounts optimisation Potential improvement in cost-to-income ratio
Results
Page 13

Market Focus
Singapore Digital Transformation
Page 14
Landscape of retail mobile banking apps offered by Singapore’s banks
DBS OCBC UOB
DBS digibank Mobile
Main mobile banking app: Check account balances, transfer money, pay bills
DBS PayLah!
Mobile wallet app: Send/receive money instantly and securely on phone
DBS Lifestyle
Lifestyle app: Use DBS Points and POSB Daily $ for instant savings, deals and other rewards
Home Connect
Calculate monthly repayments, step-by-step loan guide, etc.
DBS mTrading
DBS mobile trading app for trading in multiple markets
OCBC SG Mobile Banking
Main mobile banking app: Check account balances, transfer money, pay bills
OCBC Pay Anyone
Send money and make NETS QR purchases
UOB Mighty Singapore
Main mobile banking app, enables customers to manage finances, search and book restaurants, make contactless payments
Source: DBS Group Research
Page 14

Market Focus
Singapore Digital Transformation
Page 15
Scorecard of digital banking offerings
Basic offerings Account opening
Bank
Mobile App Online Banking Account Summary
Bill Payment New account opening
Account opening for existing customers
Definition Do they have
their own mobile banking app?
Do they have an online banking
platform?
Can customers check their
account balance online?
Can customers pay their bills
using the online banking
platform?
Can new customers open an account from
the online banking
platform?
Can existing customers open a
new account from the online
banking platform?
DBS
OCBC
UOB
Fund transfer
Bank
Interaccount Transfer
Interbank fund transfer
Instant Interbank transfer
Fund transfer to mobile no.
Cardless withdrawal
Telegraphic Transfer
Definition
Can customers transfer funds to accounts within the same bank?
Can customers transfer funds to
accounts of another bank?
Can the transfer be done
instantaneously?
Can customers transfer funds if
they provide mobile numbers
alone?
Can customers or recipients of
funds withdraw money from the
bank's ATM without a card?
Can customers perform wire
transfer from the online banking
platform?
DBS
OCBC
UOB
Security feature
Applications Special features
Bank One Time Password
Credit/Debit Card App
Loan App Investment Mobile wallet
Others Comment on "Others"
Definition
Does the bank send
the customers a one-time use only
password for every
transaction performed
?
This refers to complete
online application where there is no need to go to a branch for document
submissions.
This refers to complete
online application where there is no need to go to a branch for document
submissions.
Does the internet banking platform support
management of
investments?
Does the bank support payment for goods and
services using
electronic money
stored in mobile
phones?
DBS
OCBC Voice-powered, facial recognition for mobile banking
UOB
Source: Companies, DBS Group Research
Page 15

Market Focus
Singapore Digital Transformation
Page 16
Continued technology spend. Singapore banks have continuously invested in improving their respective digital capabilities and will continue to do so. DBS, in particular, has invested S$4.3b in technology in the last four years, of which S$1.7b relates to building for digital business (consumer and small and medium-sized enterprise, SME, business in Singapore and Hong Kong). On the other hand, OCBC invested 11.3% of total expenses in 2017 into technology, while UOB has spent S$1.2b in the last four years on improving their digital capabilities.
Growth in online customers and transactions to continue. Notably, the Singapore banks are at different stages in building their respective digital customer base as customers increasingly adopt digital transactions. We summarise their journeys thus far:
Deepening wallet share of digital customers. “Digital customers”7 refers to consumer and SME customers in Singapore and Hong Kong, comprising a total of 2.5m customers in 2017. Digital customers’ income increased 21% on-year in 2017, and was twice that of a traditional customer, with a higher return on equity and lower cost-to-income ratio. DBS also aims to grow digital channel share for various products and transactions in a bid to reduce current efforts in
targeted manual transacting processes.
Source: DBS Group Research
7A digital customer has (within the past 12 months) either: (i) made a product purchase or segment upgrade via a digital channel; (ii) done more than 50% of financial transactions via digital channels; (iii) done more than 50% of non-financial transactionsvia digital channels. (Consumer and SME, Singapore and Hong Kong)
2.2
2.5
0
0.5
1
1.5
2
2.5
3
2016 2017
Digital customers (m)
55%
63%
0%
10%
20%
30%
40%
50%
60%
70%
2016 2017
Contribution to total income from digital customers
Page 16

Market Focus
Singapore Digital Transformation
Page 17
Source: DBS Annual Report 2017
Increasing digital penetration – acquiring new customers. As part of the digital transformation journey, DBS has also grown the digital acquisition of customers and increased digital channel share. Digibank
India was also launched in 2016 as an extension of digital customer acquisition, and has acquired more than 1.8m customers since its launch.
35% 36%
55%58%
0%
10%
20%
30%
40%
50%
60%
70%
2016 2017
CIR
Cost-income ratio Digital customers
Cost-income ratio Traditiional
27% 27%
19% 18%
0%
5%
10%
15%
20%
25%
30%
2016 2017
ROE
Return on equity Digital customers
Return on equity Traditiional
84%
88%
82%
83%
84%
85%
86%
87%
88%
89%
2016 2017
Digital channel's share of customers' financial transactions (Consumer, SG
and HK)
36%
53%
0%
10%
20%
30%
40%
50%
60%
2016 2017
Digital channel's share of customers' financial transactions (SME, SG and
HK)
Page 17

Market Focus
Singapore Digital Transformation
Page 18
UOB
The online penetration rate for UOB Group’s retail customers was 54% in 2017, with Singapore retail customers’ online penetration at 82%. As at 31 December 2017, UOB has 1.6m (+9% y-o-y) digital customers (using personal internet banking), of which
0.8m are customers of UOB Mighty (+34% y-o-y), which debuted in November 2015. More than 50% of UOB Mighty customers actively use the app every month. UOB saw 40% y-o-y growth in digital financial transactions and 82% y-o-y growth for Mighty transactions.
43%
52%
0%
10%
20%
30%
40%
50%
60%
2016 2017
Channel's share of retail products sold digitally
64%
80%
0%
10%
20%
30%
40%
50%
60%
70%
80%
90%
2016 2017
Channel's share of SMEs acquired digitally in SG
25%
37%
0%
5%
10%
15%
20%
25%
30%
35%
40%
2016 2017
Channel's share of wealth customers acquired digitally
Page 18

Market Focus
Singapore Digital Transformation
Page 19
Source: UOB Annual Report 2017
OCBC
Between 2012 and 2016, OCBC saw a threefold increase in active digital customers, with digital customers having increased profitability by 2.1 times. Digital sales growth was also three times that of branches. All in all, digital revenue growth increased 8.6 times. In 2017, OCBC saw a 73% increase in business mobile banking customers as well as 14% increase in digital sales and fees for wealth products in Singapore for the emerging affluent segment.
Source: OCBC Annual Report 2017, OCBC Sell-Side Analyst Day Presentation 2017
Conclusion
Consumer perspective: Digital innovationsbring about convenience, efficiencies, newways of doing businesses for corporates inlong-run
Bank perspective: Optimisation/calibration ofinternal processes, possible cost-saving
Being digital is not a matter of who does itfirst, but is something that must be doneand will be the new normal for banking
50%
51%
54%
48%
49%
50%
51%
52%
53%
54%
55%
2015 2016 2017
Online penetration rate (retail customers) - Group
77%
81%
82%
74%
75%
76%
77%
78%
79%
80%
81%
82%
83%
2015 2016 2017
Online penetration rate (retail customers) - Singapore
45% 45%
54%
0%
10%
20%
30%
40%
50%
60%
2015 2016 2017
Mobile banking users as % of active online banking users (retail customers)
- Group
44%
52%
60%
0%
10%
20%
30%
40%
50%
60%
70%
2015 2016 2017
Online penetration rate for corporate/ SME clients - Group
Page 19

Market Focus
Singapore Digital Transformation
Page 20
iFAST – scaling up to be a key FinTech player
iFAST is an Internet-based investment products distribution platform with assets under administration of S$8.07 billion as at 31 March 2018. Starting out in 2000 in Singapore with Fundsupermart.com, a business-to-consumer (B2C) online unit trust distributor, iFAST has today evolved into a comprehensive wealth management platform with five key products – unit trusts, exchange-traded funds, bonds, stocks and insurance, catering to both business-to-business (B2B) and B2C customers. Its three biggest markets – Singapore, Hong Kong and Malaysia – are profitable and growing, while its China business is still in the initial
years of the build-up phase, and India is growing though still loss-making. Revenue is mainly generated from fees (platform fee, upfront fee and wrap fee) collected from fund houses, B2B and B2C customers.
Efforts over the last two to three years to broaden the range of products and services are beginning to bear fruit. iFAST is now in the sweet spot as the wealth management industry will increasingly become dependent on FinTech capabilities for future growth, leveraging on the power of the internet which empowers consumers, and the evolving regulations
which emphasize transparency.
iFAST business model
Source: DBS Group Research
Platform Fee
Upf ront Fee
Wrap Fee
Fund Houses
T railer Fee
iFASTB2B
B2B*
* financial
advisory companies
Platform Fee
Upfront Fee
B2C
Page 20

Market Focus
Singapore Digital Transformation
Page 21
ayondo – disruptor to traditional trading and asset management industry
ayondo provides social trading services and brokerage services to both B2C and B2B clients through its two proprietary platforms: a) WeTrade for social trading and b) TradeHub for self-directed trading. The twotransactional systems are connected via a securefinancial information exchange protocol (FIX)connection that is used to transmit market data, trades,orders and account status. ayondo’s business modeltaps on new developments in the financial industrybrought about by new technological advancements.The emergence of online brokerage services, especiallysocial trading, a fast-growing innovation, and growing
tech-savvy investors provide the backdrop for this highly scalable business to grow. Leveraging on the regulatory status of its white label partners to gain access to new markets enables the group to grow at a fast pace.
Its social trading arm is one of its key differentiators. Social trading, an emerging trend, combines new possibilities and technologies from the digital revolution. In addition, social trading addresses the market for self-directed investors searching for efficient ways to trade and share their experiences with friends and followers, as well as the market for investors looking for a modern investment alternative for actively managed funds.
ayondo’s transactional systems
Source: DBS Group Research
Followers ayondo
WeTrade (social trading) Web Interface
Top Traders
Self-Directed
ayondo
FIX Connection Web Interface
TradeHub (self-directed trading)
Page 21

Market Focus
Singapore Digital Transformation
Page 22
Aviation Industry
Budget airlines, such as AirAsia and Jetstar Asia, use a direct online channel to increase or cross-sell ancillaries and related products and services, such as preferred seats, meals, baggage allowance, or in-flight communication services. The direct online channel is usually the lowest cost channel and an efficient way to gather customer data. Companies that have not yet begun their digitisation journey are facing a competitive disadvantage as their forward-looking competitors
capitalise on new digital strategies and technology. The collection, storage and analysis of customer data, the adoption of IoT for predictive maintenance and the creation of an eco-system surrounding the travel needs of customers have jumped to the top on the list of priorities of major airline operators around the world. Aircraft maintenance and repairs are also shifting rapidly with the integration of technologies such as IoT,
robotics and 3D printing.
Singapore Aviation Services Playing Field
Source: Companies, DBS Group Research
8https://www.opengovasia.com/articles/towards-smart-nation-singapore-developments-in-2017-part-1
2015 2018 2021
Four commercial airlines (Singapore Airlines, SilkAir, Scoot, Jetstar Asia Airways) and one cargo airline (Singapore Airlines Cargo) in operation
Budget carriers within and outside Southeast Asia operating under a 100% online distribution model and Middle Eastern airlines are eroding industry margins
e-freight@Singapore>> paperlessfreight documentation
Industry-wide use of digital solutions>> IoT, robotics, big data and 3D printing in airline operations and maintenance
Personalised end-to-end travel experience for passengers and automated ground handling processes
Air Transport Industry Transformation Map aims to achieve real value-added growth of 16% from 2015 to 2020 and boost productivity by 3-4% per annum, in addition to creating more than 8,000 new jobs in the sector by 2025
8
Fully digital and predictive maintenance, repair and overhaul (MRO) of aircraft
Page 22

Market Focus
Singapore Digital Transformation
Page 23
Digital transformation is rapidly changing the way airlines
operate
2018 Online distribution advantage – Low cost carriers enjoy advantage of lowest-cost direct online channel (around 100% of sales) and are also able to cross-sell more services.
Government and technology changes are levelling the playing field – In 2017, the Singapore government unveiled its plan to boost sector productivity by 3-4% per annum over 2015 to 2010, accelerating digitisation efforts in the sector. Investments in data analytics and the internet of things (IoT) to differentiate service offering and reduce operational costs.
Incumbent airlines – Adopting app-based service to complement traditional service, focusing on personalised end-to-end experience and productivity improvement.2015
IoT maximises operational efficiency - With IoT technology, data can be pulled in from various aircraft systems to create operational dashboards to maximise operational efficiency and predictive maintenance.
3D printing revolutionised aviation MRO – 3D printed components are lighter in weight yet stronger.
Data Analytics to personalise travel experiences – Customer data gathered through loyalty programmes and partner sites are used to personalise the customer’s journey.
Robotics transforming the MRO industry – Facilitates automated airplane maintenance while reducing the need for labour.
Travel eco-system – Shift in focus from simply taking customers to their destination to enhancing the overall travel experience of customers. Airlines will partner with other players in the travel industry to augment the overall travel experience of customers.
Source: DBS Group Research
Page 23

Market Focus
Singapore Digital Transformation
Page 24
The next surge of digital transformation, led by IoT
technology, has already begun. With IoT sensors, data can
be pulled in from various aircraft systems to create
operational dashboards that allows airlines to maximise
fuel efficiency, optimise crew management, catering, load
balancing and on-board provisioning. As an example, Delta
Airlines has invested US$50m in radio-frequency
identification (RFID) bag tracking technology that allows
both travellers and the airline to move to real-time
tracking. Rather than relying on periodic scans on a bag’s
journey, the technology locks in the precise location of a
tagged bag.9
Data analytics driven by utilisation of advanced on-board
systems. With access to reliable data, airlines are becoming
more interested in data analytics for predictive
maintenance. According to PwC, the cost of maintenance-
related delays for airlines in the US in 2016 was around
US$0.5b and predictive maintenance solutions are
expected to predict 30-50% of maintenance-related delays
and cancellations, leading up to a 0.3-0.5% improvement
in on-time performance.10 Singapore Airlines, in
collaboration with Honeywell technologies, gathers data
from equipment including weather radars, navigation
systems and auxiliary power units to conduct predictive
maintenance.11
Additive manufacturing technology revolutionising the
aviation industry. The aviation industry is among the
primary advocates and driving forces behind the
developments in additive manufacturing technology (3D
printing). Airlines depend on 3D printing to alleviate supply
chain constraints, minimise interior cabin weight, limit
space required in warehouses and reduce the wastage of
materials that is prevalent in traditional manufacturing
processes. Unlike traditional manufacturing processes,
where material is removed to create a part, 3D printers
create parts from the base up, layer-by-layer, translating to
a reduction in the weight of components while making the
final products much stronger.12 BAE Systems received
approval from the European Aviation Safety Agency for its
additively manufactured window breather pipes used in
regional jetliners, which are 60% cheaper than pipes made
through traditional injection moulding.13
Using robotics for MRO tasks gaining ground. Over the
past decade, the notion of using robots for aircraft
inspections has increasingly become realistic, with engine
specialists looking to find ways of using the technology not
only to reach confined parts of an engine but also to
reduce the need for workers. Air France Industries and
KLM Engineering & Maintenance uses robotics to inspect
hail damage on fuselages using a 3D scanner, which takes
30 minutes per square metre, versus four to five hours for
manual scanning, while also being much more accurate.
Another application of robotics – using drones –is also
being explored as a potential way of performing aircraft
inspections. Among the most prominent early adopters of
the technology is UK-based low-cost carrier EasyJet, which
began trials of inspections using drones on its Airbus A320
fleet in 2014 at its main base at Luton Airport in the UK.14
9https://news.delta.com/delta-introduces-innovative-baggage-tracking-process-0
10https://www.pwc.com/us/en/industries/transportation-logistics/airlines-airports/predictive-maintenance.html
11https://aerospace.honeywell.com/en/press-release-listing/2018/february/singapore-airlines-group-selects-honeywell-to-improve-
operational-efficiency-and-reduce-downtime
12https://www.stratasysdirect.com/industries/aerospace/3d-printing-aircraft-interiors
13https://3dprintingindustry.com/news/7-key-improvements-3d-printing-brings-to-the-aerospace-industry-49823/
14https://www.flightglobal.com/news/articles/easyjet-to-roll-out-drone-inspections-from-2018-441652/
Page 24

Market Focus
Singapore Digital Transformation
Page 25
Digital winners in aviation
Singapore Airlines (SIA) started a three-year digital
transformation programme in May 2017. Among the
various initiatives that have been announced are a revenue
management system, which uses algorithms to forecast
demand for tickets, and a new digital wallet with virtual
KrisFlyer miles.
SIA adopted a new more centralised revenue management
and pricing structure in 2017, replacing an unusually
decentralised system in which too much focus had been
placed on local overseas offices. SIA also plans to launch
the world’s first blockchain-based digital wallet app for its
KrisFlyer frequent flyer loyalty programme in 2018. The
digital wallet will allow KrisFlyer members to use their
digital KrisFlyer miles for transactions at participating retail
merchants. SIA is currently signing up retail merchant
partners in the Singapore market to start with. The digital
wallet app will be enabled through blockchain technology,
using an SIA-owned private blockchain involving only
merchants and partners.
Digital transformation at Singapore Airlines
as addressing customers by their names, wishing
customers on their birthdays or making an apology for the
delay of a previous flight.
Singapore Airlines’ mobile app also strives to provide users
with a seamless travel experience. Users can make flight
bookings via the app and make payments via digital
wallets such as Samsung and Apple Pay. Singapore Airlines
partnership with Grab Taxi, one of the most popular ride-
hailing apps in Singapore, also allows customers to hail a
taxi to and from the airport directly via the Singapore
Airlines mobile app. The app can also be used to check in
for flights and create a mobile QR-based boarding pass.
Facilitates mobile-based flight booking and payment As an added service, cabs can be booked to/from the
airport before departure or arrival Gives access to digital magazines and newspapers 48
hours before and 24 hours after the flight Allows passengers expedited access to the flight,
allowing them to skip queues and board the flight usingthe QR code on the app
•Source: Company, DBS Group Research
Singapore Airlines has a long history of embracing
technology to optimise operations. In 2015, the carrier
entered in to an agreement with Rolls Royce to leverage
Rolls Royce’s data analytics capabilities to optimise fuel
efficiency of a number of the airline’s aircraft. The carrier
also entered in to an agreement with Honeywell, the US
based multinational, in 2016 to adopt predictive
maintenance and connected aircraft technologies in a bid
to drive maintenance costs lower.
Singapore Airlines has turned to technology to help
differentiate its services. For example, the carrier is
currently experimenting with the use of data analytics to
offer a personalised in-cabin experience to customers, such
App-based value-added services
Data analytics
Data analytics reduces maintenance costsand aircraft delays through predictivemaintenance
Facilitates personalised in-cabin experiencefor customers based on customers’ habits,preferences and travel patterns
Page 25

Market Focus
Singapore Digital Transformation
Page 26
Operational efficiencies generated through digitisation and
the ability to offer an augmented and a personalised travel
experience to customers could help Singapore Airlines
further sharpen its competitive edge and maintain
competitiveness in the hypercompetitive airline industry.
The carrier recently established partnerships with key
industry stakeholders in Singapore, including the Agency
for Science, Technology and Research (A*STAR), CAAS
and the Economic Development Board, to conduct
research and drive innovation in the airline industry. As
part of the initiative, Singapore Airlines will partner with
A*STAR to explore big data use cases in the airline
industry and enhance the carrier’s data analytics
capabilities. The partnership would also involve research
on the potential use cases of IoT, augmented reality (AV)
and virtual reality (VR) in aspects such as aircraft
maintenance.
Page 26

Market Focus
Singapore Digital Transformation
Page 27
Telecom Industry
The cannibalisation of high-margin voice and SMS revenues by over-the-top (OTT) services like WhatsApp,
coupled with the emergence of new entrants, is hurting
telcos. We estimate that, on average, around 35% of
Singapore telcos’ service revenues are at risk of declining
with the contraction of legacy services. Also of concern is
the entry into the market of TPG as the fourth mobile
operator and MVNOs like Circles.Life, Zero Mobile and
MyRepublic.
Telcos are facing the dual challenge of satisfying rising
consumer expectations for seamless connectivity through
fast, secure and reliable networks, while coping with
competition from players inside and outside the industry.
Against such a backdrop, telcos have increasingly looked
to digital transformation for some respite.
Singapore Telecom Services Playing Field
Source: Companies, DBS Group Research
Source: DBS Group Research
2015 2018 2021
Three mobile operators (Singtel, M1, StarHub)
Entry of TPG as the fourth mobile operator>> more competition for incumbents
Smart Nation Sensor Platform >> minor opportunities for incumbent telcos
Cyber-security >> meaningful opportunities for incumbent telcos
IoT solutions spanning across several industries >> gradual but meaningful opportunities for incumbent telcos
5G license and significant capex >> cause of concern for newer entrants with small balance sheet.
5G launch could be a trigger for consolidation in the industry, in our view
New entrants not burdened by legacy revenues and networks – New entrants are not exposed to declining legacy revenue streams and are able to rollout network at a much lower capex.
From telcos to smart communication providers – Existing telcos are repositioning as smart communication providers with investments in cloud technology, cyber-security, IoT etc.
2018
Regulator awarded a fourth mobile operator license in 2016 – The regulator’s granting of the fourth mobile operator license to TPG has ramped up competition for the incumbents.
Page 27

Market Focus
Singapore Digital Transformation
Page 28
Future of telecom operators in Singapore
providers are well placed to secure contracts from the Singapore
government for Smart Nation projects and contracts from
enterprises for digitisation projects.
Source: DBS Group Research
The telecom and technology industries are arguably also best
placed to reap maximum benefits from the acceleration of
digitisation in Singapore. Large-scale telecom and IT service
Digital winners in the telecom sector
Singtel leading innovations in the telco sector. Singtel, Singapore’s largest mobile network operator has clearly spelled out digital transformation as a priority. The telco announced its plans to invest in cyber-security, digital advertising and data analytics in
2013, much earlier than its peers. The carrier launched its My Singtel app as the first and only app in Singapore enabling subscribers to customise their mobile usage.
Customers
5G – Telcos would transition from 4G to small cell-based 5G networks. This would facilitate the growth of IoT, AR/VR, autonomous vehicles, etc.
Diversified streams of revenues – Telcos would leverage their core competencies to diversify into segments such as cyber-security, IoT solutions, digital advertising, etc, to compensate for declines in network revenues.
Digital touch points – Customers would have little to no physical interactions with operators. Services including customer registration, SIM/device purchases and customer care would be available through mobile platforms.
Internal Operations
Customisable mobile plans – The majority of mobile plans would offer customisation options to customers. E.g. customers would be able tochoose their own data, voice andSMS quotas for a fixed price.
Heavy use of analytics – Data analytics would play an integral role in telcos’ operations, helping in network deployments, up-sell and cross-sell of products, pre-emptive care and churn prevention, etc.
Page 28

Market Focus
Singapore Digital Transformation
Page 29
Digital transformation at Singtel15
Source: DBS Group Research
Cyber-security is a high-growth sector with the rollout of
Singapore’s Smart Nation project. Singtel has already
established a global cyber-security platform with the
acquisition of Trustwave, a leading US-based managed
security services provider. Coupled with existing
information and communications technology capabilities,
the carrier will be able to offer comprehensive solutions to
counter cyber-attacks on its users. Singapore’s Smart
15https://www.singtel.com/content/dam/singtel/investorRelations/factsheetsAndPresentation/2017/Singtel_Investor_Day_2017_-
_Consumer_Singapore.pdf
Nation programme aims to connect every aspect of life
including transportation, financial services,
telecommunication, etc., with the help of IoT and big data.
As a likely provider of network infrastructure facilitating
the programme, Singtel is in a strong position to monitor
and manage the programme’s cyber-security assets.
Digitalised touchpoints
My Singtel app allows customers to customisetheir plans and monitor usage. Is the onlycustomisable mobile plan in Singapore
Online Singtel shops integrated with physicaloutlet give customers the ability to make ordersonline for pick-up at the store
Launch of “Shirley”, an automated chatbot toresolve consumer complaints, and live chatfeature with customer care officers
Enhanced digital services
• Launch of SmartHome, SmartCar and Assured+offerings under Singtel’s Smart Living platform
• Providing customers with digital entertainmentservices such as Singtel music, Singtel Newsstandand Singtel OTT streaming
• Initiating mobile wallet service Singtel Dashwhich supports payments and money transfers
Digital revenue streams
Digital advertising – Amobee, Singtel’s global digital marketing arm offers marketers an end-to-end advertising and data management platform across all channels, formats and devices
Cyber-security offerings by Singtel protect users from cyber-threats and risks such as hackingthat arise in the converged IT landscape
Data analytics – DataSpark, Singtel’s advanced data analytics service provides consumerinsights from geolocation data
Page 29

Market Focus
Singapore Digital Transformation
Page 30
In 2016, Singtel launched Smart Living solutions designed
to help further Singapore’s ambitions to be a Smart
Nation. Smart Living focuses on three main areas: (i)
Home automation and safety – allowing seamless
connectivity and control of locks, cameras and appliances
in the homes of consumers; (ii) Health and elderly
monitoring (Assured+) – measuring the activities of the
elderly and tracking personal health data through
connected health devices like blood pressure monitors and
weighing scales; and (iii) Connected cars – providing
driving analytics, basic maintenance/diagnostics
information and receiving real-time information on traffic
conditions.
NetLink providing the foundation for Singapore’s Next
Gen NBN initiative. NetLink (NetLink NBN Trust) provides
the nationwide network for the Next Generation
Nationwide Broadband Network (Next Gen NBN), over
which ultra-high-speed internet access is delivered to
residential homes and non-residential premises throughout
Singapore. NetLink’s network consists of around
76,000km of fibre cable and is the only fibre network with
nationwide residential coverage in Singapore. The network
supports around 1.3m residential end-user connections,
approximately 38,500 non-residential end-user
connections and 357 non-building address point (NBAP)
connections across Singapore. In the NBAP segment,
NetLink is a lead partner in the development of new fibre-
based initiatives, including the Singapore government's
Smart Nation programme.16
Source: DBS Group Research
16http://www.netlinknbn.com/who_we_are.html
Only fibre network with nationwide residentialcoverage in Singapore
Passed 1.4m residential homes (substantially allresidential homes in Singapore)
Reached 1.3m residential homes (89.2% of theresidential homes in Singapore)
Non-residential
Independent nationwide network provider forretail service providers who do not have anestablished network
Deployed to 30,000 (substantially all non-residential buildings)
38,500 non-residential end-user connectionssupported
Residential
NBAP
Providing connections to any location in mainland Singaporethat does not have a physical address or assigned postal code,e.g. roadside points, bus stops, multi-storey car parks andtraffic lights
357 NBAP connections throughout mainland Singapore NetLink provides fibre connections for Phase 1 of the Smart
Nation Platform Project, for which around 100 new NBAPconnections are expected to be required
Page 30

Market Focus
Singapore Digital Transformation
Page 31
Retail
The retail industry in Singapore includes around 22,000
establishments, contributing about 1.4% of Singapore’s
GDP and employing around 3% of the total workforce.
The absence of GST on imported goods of S$400 or less
is highly attractive to Singaporeans. In February 2018, e-
commerce accounted for around 3.9% of retail sales in
Singapore,17 still lower than in many developed countries
due to the easy access to malls for leisure activities and
experiences like food & beverage (F&B), health and
beauty in Singapore.
However, Singaporeans are increasingly turning to online
sources on their smartphones to conduct pre-sale
research on products. E-commerce platforms such as
Lazada and Qoo10 have entered virtually all the retail
spheres, from consumer electronics and fashion to home
supplies and groceries. A survey by PWC revealed that
around 60% of Singaporeans use social media to read
reviews about products even while they are in physical
stores. 18 Hence, retailers lacking an online presence or
reviews will experience poor retail sales. Consumers
expect retailers to carry out an ongoing dialogue covering
the journey from pre- to post-purchase. This has become
a fundamental part of the buying experience.
Singapore Retail Playing Field
Source: DBS Group Research
A key challenge to adopt online or omnichannel
strategy is low profitability. Increasingly, larger chain
store retailers from electronic products to fashion
retailers, grocery retailers and department stores have
either online or omnichannel strategy. Traditional
electronic retailers include Courts, Challenger,
Epicentre, Harvey Norman, Nubox, iStudio, Best Denki;
fashion brand distributors and retailers include RSH
Limited, FJ Benjamin; leading department stores include
Robinson’s, Metro, and Isetan; and key grocery retailers
including Dairy Farm, NTUC FairPrice and Sheng Siong
all have an alternate online store offering click and
collect and delivery apart from operating physical
stores.
17 https://www.singstat.gov.sg/docs/default-source/default-document-library/news/press_releases/mrsfeb2018.pdf
18https://www.pwc.com/sg/en/publications/assets/total-retail-sea-2016.pdf
However, as some products are naturally low priced and
have low profitability, it becomes challenging for retailers
who sell online to fulfil delivery for a profit. As such, most
retailers (excluding large high priced electronic and
electrical goods) tend to use their stores’ profitability to
subsidise their online business’ fulfilment costs. Online to
many traditional retailers remains a small part of their
overall strategy due to difficulty to turn in a profit.
Profitability for selling low ticket items online for now will
still remain a challenge due to high fulfilment costs in
Singapore, until such time when the market is comfortable with paying for fulfilment.
2015 2018 2021 E-commerce only accounted for about
2.1% of retail sales in Singapore in
2015
According to the department of
statistics, online purchases accounted
for 3.9% of overall retail sales in
February 2018
The government intends to grow the e-
commerce share of retail receipts from
around 3% in 2016 to 10% by 2020
Government’s focus is on productivity
improvement, omni-channel retailing
and data analytics
Introduction of new GST from 2020
onwards on imported e-commerce
services
Page 31

Market Focus
Singapore Digital Transformation
Page 32
Below are some of the key e-commerce players in Singapore:
Qoo10 – Owned by Giosis Pte Ltd, Qoo10 is the most
visited online shopping platform in Singapore boasting
about 13.4m monthly site visits during 1Q1819, around 3m
higher than its closest competitor Lazada. Qoo10 operates
a B2C business model and has presence in Singapore,
Malaysia and Indonesia. The company recently sold off its
Japanese operations – which accounted for around 50%
of Giosis’s gross merchandise volume (GMV) – to ebay,
reportedly for around US$700m.20 With the sale, Qoo10
will increase its focus on developing its Singapore
operations, for which the company is expected to set aside
approximately 80% of its budget. The company reported a
GMV of US$1.2b in 2017 (+15% y-o-y) around 40% of
which was derived from Singapore (about US$480m).
Assuming the e-commerce market in Singapore was worth
approximately S$1.4b in 2017, based on estimates and
projections by Google and Temasek,21 this works out to
around a 34% market share for Qoo10. Qoo10 had a
registered user base of approximately 3m and an active
daily user base in Singapore of around 600,000 at the end
of 2017.22 Over 10m products are sold via the company’s
platform. Qoo10 imposes a commission on the price of
goods sold from sellers, which ranges from 7-12%.23
Assuming 6-10% commission on average, we estimate
that Qoo10 may have generated around US$29-48m in
revenues from Singapore in 2017. The company is
reportedly looking to list in 2019.
Source: Qoo10
Lazada - Although second in Singapore, Lazada is the
leader of e-commerce in Southeast Asia, present in
Malaysia, Indonesia, Philippines, Thailand and Vietnam.
Lazada was founded in 2011 by Rocket Internet, and
Alibaba acquired a controlling stake in Lazada and its
Southeast Asian operations in 2016. With over 300m
items available for sale online, Lazada offers a wide range
of products ranging from consumer electronics to
19 https://iprice.sg/insights/mapofecommerce/
20 http://www.businesstimes.com.sg/technology/qoo10-takes-e-commerce-fight-to-next-level-with-bulked-up-war-chest
21 https://www.techinasia.com/talk/overview-singapore-2017-state-ecommerce
22 http://www.asiaone.com/business/qoo10-is-ahead-in-its-game-rising-70-to-hit-average-of-144-million-traffic-in-q4-2017
23 https://www.qoo10.sg/gmkt.inc/cs/GuideDefault_Tip.aspx
household goods, toys, fashion, sports equipment and
groceries. Lazada commenced operations based on an
inventory model but started expanding its marketplace in
2014 and at present around 80% of its GMV comes from
its marketplace. Lazada also operates an in-house logistics
arm known as Lazada Express, which facilitates last-mile
delivery in collaboration with 75 logistics partners. For
sellers on its market place, Lazada encourages the
Page 32

Market Focus
Singapore Digital Transformation
Page 33
“Fulfilment by Lazada” model wherein sellers pre-stock
their inventory at Lazada’s warehouse. In 2017, the e-
retailer generated a GMV of US$1.1b from 8m customers
across the Southeast Asia region with around 60% of
GMV generated via its mobile app.24 Lazada boasts
approximately 10m monthly visitors from Singapore.
RedMart - Founded in 2011, RedMart is the leader in
online grocery shopping in Singapore and was acquired by
Alibaba’s Lazada in 2016. RedMart’s fulfilment and
technology platform facilitates the largest grocery item
selection in Singapore with an option for delivery within a
two-hour period. Presently the platform carries over
100,000 products with over 1,000 vendors. RedMart
generated S$97m (+18% y-o-y) in revenues in 2017,
despite posting a loss of S$10.1m in 2017 (mainly due to
accounting adjustments).25 The company generated after-
tax profit of S$47.7m in 2016, (a margin of approximately
57%). RedMart received around 1.4m monthly visitors
during 1Q18.
Source: DBS Group Research
24 https://www.lazada.com.ph/lazada-statistics/
25 https://www.businesstimes.com.sg/brunch/the-online-retail-gambit
Government initiatives aimed at levelling the playing field – The Retail Industry Digital Plan and 99%SME are some of the initiatives to help retailers go online. Budget 2018 proposes the Introduction of GST from 2020 onwards on imported e-commerce services.
Incumbent retail players – relatively slow to embrace an omni-channel presence possibly due to the lack of scale and fear of cannibalising offline profits.
E-commerce popularity on rise–Qoo10 and Lazada haveentered virtually all the retailspheres, from consumerelectronics and fashion tohome supplies and groceries.
2018
Page 33

Market Focus
Singapore Digital Transformation
Page 34
What does the future of retail look like?26
Source: DBS Group Research
Retail malls
Landlords’ curation of a mall’s content is crucial to ensure
success. With the rise of online shopping and consumer
preferences changing toward more “experiential”
spending, we see content within retail malls continuing to
evolve in order to chase the consumer dollar. While
consumers are expected to increase spending, most of this
money is pouring into “experiences” or services like F&B,
health and beauty which have been doing well recently,
while other retail trades are expected to remain resilient.
Therefore, mall operators have, over time, added more of
such elements into their malls to some success, but
26https://hbr.org/2017/01/a-study-of-46000-shoppers-shows-that-omnichannel-retailing-works
ongoing store closures and recent exits by retailers
suggests that the worst is not over.
Therefore, in our discussion with various landlords and
retailers, we found that most feel that an omni-channel
strategy is key for retailers to tackle the current onslaught
by online retailers, and we have seen cases where more
retailers are jumping on the bandwagon to boost their
online presence.
The winning formula in the next evolution of the retail
mall. We see divergence in the performance of retail malls
going forward. In addition to serving the immediate needs
of the population catchment living in the vicinity, the x-
Omni-channel presence and integration Retailers would be required to establish presence across online, mobile and physical channels allowing customers to satisfy their needs almost instantaneously. Customers using multiple channels often spend around 4-9% more than customers using single channels, according to a study published in Harvard Business Review. study published in Harvard Business
Store of the future Integrating technology with physical stores to improve productivity and augment the in-store shopping experience for customers. This could include technologies such as cashier-less exit, RFID tags, Bluetooth beacons, augmented/virtual reality etc.
Leveraging data to personalise the shopping experience of customers Established mechanisms to collect, store and analyse customer data gathered from multiple sources to offer personalised offers and discounts, experiences and tailored suggestions to customercustomers.
Page 34
Market Focus
Singapore Digital Transformation
Page 35
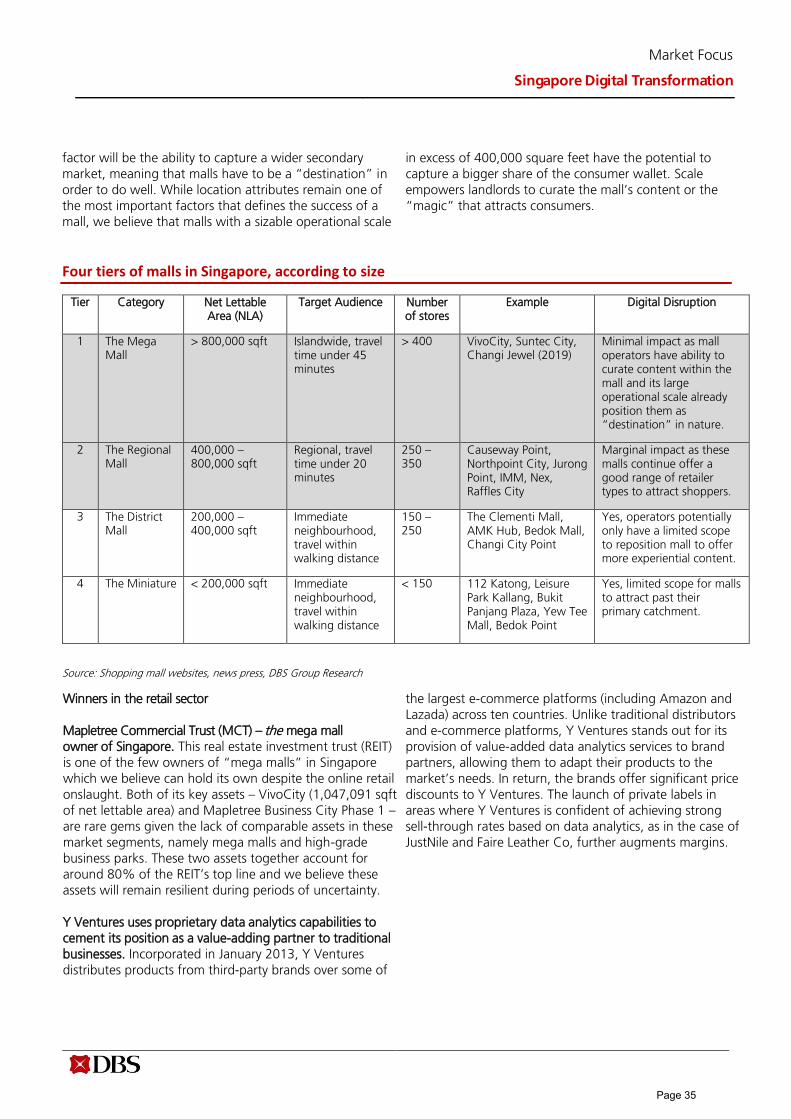
factor will be the ability to capture a wider secondary
market, meaning that malls have to be a “destination” in
order to do well. While location attributes remain one of
the most important factors that defines the success of a
mall, we believe that malls with a sizable operational scale
in excess of 400,000 square feet have the potential to
capture a bigger share of the consumer wallet. Scale
empowers landlords to curate the mall’s content or the
“magic” that attracts consumers.
Four tiers of malls in Singapore, according to size
Tier Category Net Lettable Area (NLA)
Target Audience Number of stores
Example Digital Disruption
1 The Mega Mall
> 800,000 sqft Islandwide, travel time under 45 minutes
> 400 VivoCity, Suntec City, Changi Jewel (2019)
Minimal impact as mall operators have ability to curate content within the mall and its large operational scale already position them as “destination” in nature.
2 The Regional Mall
400,000 – 800,000 sqft
Regional, travel time under 20 minutes
250 – 350
Causeway Point, Northpoint City, Jurong Point, IMM, Nex, Raffles City
Marginal impact as these malls continue offer a good range of retailer types to attract shoppers.
3 The District Mall
200,000 – 400,000 sqft
Immediate neighbourhood, travel within walking distance
150 – 250
The Clementi Mall, AMK Hub, Bedok Mall, Changi City Point
Yes, operators potentially only have a limited scope to reposition mall to offer more experiential content.
4 The Miniature < 200,000 sqft Immediate neighbourhood, travel within walking distance
< 150 112 Katong, Leisure Park Kallang, Bukit Panjang Plaza, Yew Tee Mall, Bedok Point
Yes, limited scope for malls to attract past their primary catchment.
Source: Shopping mall websites, news press, DBS Group Research
Winners in the retail sector
Mapletree Commercial Trust (MCT) – the mega mall
owner of Singapore. This real estate investment trust (REIT)
is one of the few owners of “mega malls” in Singapore
which we believe can hold its own despite the online retail
onslaught. Both of its key assets – VivoCity (1,047,091 sqft
of net lettable area) and Mapletree Business City Phase 1 –
are rare gems given the lack of comparable assets in these
market segments, namely mega malls and high-grade
business parks. These two assets together account for
around 80% of the REIT’s top line and we believe these
assets will remain resilient during periods of uncertainty.
Y Ventures uses proprietary data analytics capabilities to
cement its position as a value-adding partner to traditional
businesses. Incorporated in January 2013, Y Ventures
distributes products from third-party brands over some of
the largest e-commerce platforms (including Amazon and
Lazada) across ten countries. Unlike traditional distributors
and e-commerce platforms, Y Ventures stands out for its
provision of value-added data analytics services to brand
partners, allowing them to adapt their products to the
market’s needs. In return, the brands offer significant price
discounts to Y Ventures. The launch of private labels in
areas where Y Ventures is confident of achieving strong
sell-through rates based on data analytics, as in the case of
JustNile and Faire Leather Co, further augments margins.
Page 35

Market Focus
Singapore Digital Transformation
Page 36
Data Analytics is the Backbone of Y Ventures’ Profitable E-Commerce Business
Source: Company, DBS Group Research
Through its data analytics programme, Y Ventures
uncovered an opportunity within the consumer space.
Research indicated that consumers tend to be relatively
brand-agnostic for quality men’s leather products within a
given (undisclosed) price range. The company
subsequently partnered with traditional leather goods
company Tocco Toscano (“Toscano”) to launch Faire
Leather, leveraging on Y Ventures' unique specialisation in
online distribution and Toscano’s expertise in leather
craftsmanship.
Launching of a cross-border e-commerce platform. With a
population of around 650m, a growing middle class and
rising internet penetration, Southeast Asia is often
considered the next gold rush for e-commerce. In March
2018, Y Ventures signed a non-binding memorandum of
understanding with Singapore Post to collaborate on
developing a world-class e-commerce platform, named
AORA, with reliable last mile delivery services. With the
launch of AORA, Y Ventures plans to capitalise on the
opportunities offered by the growing cross-border e-
commerce market.
Transportation
Early investments in the development of public
infrastructure have allowed Singapore to build one of the
best transportation systems in the world. The smart
mobility project will augment this status and help
Singapore to develop an autonomous, demand-driven
public rail and bus system. The government has also
announced plans to invest over S$9b to upgrade public
bus and rail systems, with another S$20b to extend the
public transportation network from 2018 to 2023
Page 36

Market Focus
Singapore Digital Transformation
Page 37
27. The country’s rail network, which spans 170km, is
expected to grow to 360km by 203028 as a result, and by
2030, eight in 10 Singaporean households are expected to
live within 10 minutes of a train station.
However, the entry of ride-hailing companies like Uber*
and Grab has taken a toll on Singapore’s taxi industry.
Almost half of point-to-point trips in the country are now
served by private car hires facilitated by Uber and Grab,
the country’s most prominent ride-hailing apps.
*As at time of this writing, Uber has entered into an
agreement to sell its Southeast Asia operations, inclusive
of Singapore, to Grab. The deal is currently under the
review of the Competition Commission of Singapore
(CCS).
Transportation Sector Playing Field
Source: Companies, DBS Group Research
27https://www.businesstimes.com.sg/transport/singapore-budget-2018-fares-likely-to-rise-as-government-spends-more-to-improve-
public
28https://www.lta.gov.sg/content/ltaweb/en/public-transport/mrt-and-lrt-trains.html
29http://www.straitstimes.com/singapore/transport/south-east-asian-rivals-go-jek-and-grab-to-face-off-in-singapore-as-uber-exits
2015 2018 2021 MyTransport.sg and Datamall @MyTransport shares real-time traffic updates with the public and industry players.
Rising adoption of app-based ride-hailing companies Grab and Uber, which entered Singapore in 2013.
In 2016, The Land Transport Authority (LTA) told operators that their operating licence fee will rise from 0.1 % of gross revenue to 0.2 % in 2016, and then to 0.3 % in 2017. Uber and Grab do not pay any operating licence fees .
From 2017, drivers from ride-sourcing service operators such as Uber and Grab are required to obtain vocational licences with the grace period ending in/after June 2018. In March 2018, the government announced a review of private-hire car regulations, including the possible licensing of Grab and Uber.
In December 2017, ComfortDelGro announced its intention to acquire a 51% stake in Uber's car rental subsidiary, Lion City Holdings. The deal is under review by the Competition Commission of Singapore (CCS). In January 2018, Uber and Comfort pooled their private-hire cars and taxis under a common booking service called UberFlash.
In March 2018, Grab announced its acquisition of Uber’s business in Southeast Asia, subject to regulatory approval. Meanwhile, there is speculation that Go-Jek, a key ride-hailing
app in Indonesia may enter Singapore29
.
The GrabShuttle app is launched, powered by Beeline, a platform developed by the Government Technology Agency
(GovTech) in collaboration with LTA. Based on crowd-
sourcing, GrabShuttle allows the prebooking of seats (on 13, 23 or 40-seaters) along a list of fixed routes.
In February 2018, LTA awarded two contracts for trial public bus services based on real-time commuter demand and along dynamic routes, to American company Via Transportation Inc. (Via) and local start-up Ministry of Movement (SWAT).
According to the LTA, autonomous scheduled buses and autonomous on-demand shuttles will serve commuters in Punggol, Tengah and the Jurong Innovation District in Singapore from 2022.
Page 37

Market Focus
Singapore Digital Transformation
Page 38
Future of public transportation
Source: DBS Group Research, Land Transport Authority, Smart Nation and Digital Government Office
Logistics Industry
The logistics industry has long been a critical component
of the Singaporean economy, contributing ~7.4% to the
gross domestic product (GDP) in 2015. Singapore’s port is
one of the world’s busiest, making Singapore a key
logistics hub in Asia. The country was ranked the 5th best
logistics hub in the world in a World Bank study of 160
countries. Singapore has garnered the attention of major
e-commerce players such as Alibaba and Amazon as a
central hub for e-commerce logistics in Southeast Asia,
one of the fastest growing e-commerce regions in the
world. In particular, last-mile deliveries, which remain
challenging and costly (last-mile deliveries account for
~28% of the total logistics cost), have garnered the
interests of many operators amid growing e-commerce
activity and the failure of incumbents to meet customer
expectations. Players such as Ninja Van, aCommerce and
UrbanFox have entered to fill in gaps in last-mile deliveries
in Singapore and the rest of Southeast Asia.
Ninja Van offers last-mile delivery services to online
merchants such as Lazada, Groupon and Qoo10, has built
a strong presence in Singapore since its founding in 2014.
The start-up managed to secure series C funding of ~US$
87m to expand in the region and generated sales of
US$9.1m in 2016, more than twice of what it generated in
2015.
aCommerce, a Bangkok based e-commerce service
provider entered Singapore in 2016 and in November
2017 raised US$ 65m in series B funding. The start-up
provides a range of services from digital marketing, e-
commerce platform development, channel management,
order fulfilment & warehousing to delivery & logistics
services. As at November 2017, aCommerce has on
boarded 262 clients (Ex: L’Oreal, HP, LINE, and Groupon).
The company has recorded ~15,000 order dispatches per
day with 3.8m orders shipped out during the 12 months
ended 30 November 2017.
Regulators in Singapore are facilitating the growth of
challengers, for instance with its federated lockers
programme, which calls for the development of ~760
lockers around the country to facilitate parcel collection.
This should help start-ups operating in the last-mile
delivery space to further expand operations.
2022 2018-2019 2020
Trials on real-time demand driven public transportation systems
Satellite-based Electronic Road pricing system becomes operational removing the need for physical gantries
Deployment of autonomous vehicles for public transport
Page 38

Market Focus
Singapore Digital Transformation
Page 39
Singapore Logistics Sector Playing Field
Source: DBS Group Research
30https://www.imda.gov.sg/-/media/imda/files/about/media-releases/2017/annex-a---icm-innovations-help-logistics-sector-push-
new-boundaries-and-synergise-across-ecosystem.pdf?la=en
31https://www.mti.gov.sg/MTIInsights/SiteAssets/Pages/ITM-TransportandLogistics/Logistics.pdf
The logistics sector contributed ~7.4% to Singapore’s GDP and employed over 8% of the total workforce in 2015
30.
The Infocomm Media Development Authority (IMDA) tests its In-mall distribution (IMD) initiative, which aims to raise the efficiency of delivery trucks while enabling malls to extend their hours of delivery/acceptance.
IMDA to put federated lockers on trial to raise the efficiency of last-mile deliveries for parcel.
IMDA to launch “Airbnb for Cargo” to lower the cost of freight charges for shippers.
IMDA conducts a trial for Offsite Consolidation Centre (OCC) users and operators to better track their cargo across the supply chain.
Cargo owners and logistics service providers to have increased track-and-trace power across the entire supply chain to better identify problems. They can intervene in near real-time to address fulfilment delays, prevent damage during shipment and remove the need to hold excessive inventory. With monitored shipments, insurance costs for companies should fall due to a lower shipment failure risk.
The industry transformation is expected to achieve a value addition of SS$8.3bn and introduce 2,000 new professional, manager, executive and technician jobs by 2020
31.
2018 Start-ups exploiting opportunities in last mile delivery– New entrants Ninja Van uses proprietary algorithms to plan its routes and manage its vehicle fleets. UrbanFox, another startup, has introduced an Uber-like network of drivers with ratings to bid for last mile deliveries
Technological advances leveling the playing field – Technological advancements such as automated parcel sorting and self-service locker systems are narrowing the gap between challengers and incumbents. The regulator is facilitating the development of challengers with programs such as Federated Lockers.
Incumbent logistics players have built regional scale –Alibaba has taken a stake in Singpost who has invested in (a) automated parcel sortingmachine for rising volumes, (b)a network of lockers forpickups in Singapore, (c)regional warehouse andfulfillment capabilities in Asia,(d) US companies with digitalsolutions and is bringing thosesolutions to Asia.
2015
Source: Companies, DBS Group Research
Page 39

Market Focus
Singapore Digital Transformation
Page 40
Future of logistics
Source: Infocomm Media Development Authority (IMDA)
Digital winners in logistics
SingPost leverages on technology and partnerships to stay
ahead. SingPost has evolved to become a key logistics
service provider for e-commerce deliveries in the region.
SingPost, which generates ~60% of revenues from e-
commerce related services, invested S$182m in the
development of a regional e-commerce logistics hub in
November 2016, comprising warehousing space and a
fully automated parcel sorting system capable of handling
up to 100,000 parcels daily. The parcel sorting facility
automates the process of clustering parcels based on
postal codes, which was previously handled manually,
yielding significant improvements in delivery efficiencies. In
addition to the e-commerce logistics hub, SingPost also
operates POPStations (Pick Own Parcel Station) a system of
lockers that allows customers to collect, post and return
parcels around the clock, at ~153 locations in Singapore.
SingPost has also established strong alliances with Alibaba,
which has cumulatively invested ~S$500m in SingPost and
holds a 14.4% stake. Collaboration with Alibaba places
SingPost on a strong footing to capitalise on the growing
demand for e-commerce logistics. For instance, SingPost
recorded a 38% growth in international mail volumes in
3Q18, surpassing S$100m for the first time, owing to
higher volumes from the double eleven shopping event,
the biggest shopping festival in the world. SingPost has
also established a partnership with the Singapore-based Y
Ventures to jointly develop an e-commerce buying
platform focused on carrying out cross-border purchases
on behalf of consumers, consolidating deliveries and
logistics-related technology to enhance efficiency across
the vertical logistics chain.
SingPost is also keen to grow its clout as an Asian logistics
service provider. SingPost’s investments in Quantium
Solutions, a logistics service provider in Asia Pacific, and
Couriers Please, a last-mile delivery player in Australia,
allows SingPost to operate across the APAC region.
SingPost’s acquisition of the US-based Jagged Peak in
2015 also gave it access to proprietary technology
enabling logistics for high velocity consumer products,
which are gaining traction in Asia. We believe that
SingPost’s technological and regional expertise, growing
strengths in last-mile delivery and its partnerships with key
industry players will help it to capitalise on the growing e-
commerce logistics opportunities in the region.
Integration and automation– Integration among transport methods and warehousing coupled with automation of last-mile deliveries
Consolidation– Centralised consolidation centres to avoid unemployment of warehouses and trucks
Page 40

Market Focus
Singapore Digital Transformation
Page 41
SingPost leverages on technology and partnerships to stay ahead
Source: DBS Group Research
Automated Parcel Sorting technology capable of
handling 100,000 packages daily
POPStations to develop last-mile delivery
Acquisition of proprietary logistics technology for
high velocity consumer products via Jagged Peak
Technology Partnerships & Investments
Collaboration with Alibaba for e-commerce deliveries
Partnership with Y Ventures to develop a cross border
ecommerce platform
Investments in Quantium Solutions and Couriers
Please facilitating logistics operations in the APAC
region
Page 41

Page 42
* Projects classified as Strategic government projects which are of higher priority and urgency are highlighted in red. Source: Smart Natiion and Digital Government Office, DBS Group Research
Strategic Government Projects
1. National Digital Identity (NDI) frameworkThe NDI framework aims to equip every citizen in Singapore with a digital identity, moving away from the current analog, card-based National Registration Identity Card (NRIC) system. The system is expected to be in place by 2020 and would allow citizens, businesses and the government to transact online in a secure and a convenient manner. The system would leverage on the existing SingPass (or Singapore Personal Access) system, which currently has ~3.3m users. Several pilot projects are underway.
MyInfo– The digital data vault will contain thepersonal information of all Singaporean citizens,serving as a one-stop shop when validating theidentity of a Singaporean citizen. Details of allSingPass users are to be migrated on to the MyInfovault, which would improve efficiencies by allowingusers to pre-fill government forms, among otherthings. Currently, ~24 e-government services arelinked to the database and all 160 governmentservices are expected to be linked by the end of
2018. MyInfo data is also expected to be extended for private-sector use. As a pilot project, the government has allowed several banks including DBS, OCBC, United Overseas Bank (UOB), and Standard Chartered Bank to auto-fill forms of registered users for ~30 digital services via this service.
SingPass Mobile – The mobile phone application isexpected to be rolled out towards the second half of2018. The application would allow users to accessmany government e-services via their mobile phonesand eliminate the need for physical tokens or one-time passwords generated via text messages toaccess SingPass services. Users would also be able touse their biometrics, such as on fingerprint and irisscanners, to authenticate their identity via the app.
Digital Signatures– GovTech is said to be conductingtrials on the use of digital signatures andauthentication of documents in a paperlessenvironment.
Smart Nation Programme
Health
Smart Health Assist
Living
Smart HDB Framework
Mobility
Smart Transport
Smart Logistics
Services
E‐Payments
Moments of Life
Support Services
Smart Nation
Sensor Platform
National Digital
Identity Framework
Market Focus
Singapore Digital Transformation
businesses to enhance productivity and raise Singaporeans’ overall living standard. The programme centres on four key aspects.
Singapore Smart Nation
Singapore launched its Smart Nation programme in 2014 to integrate technology into daily lives and
Key Smart Nation projects*
Page 42

Market Focus
Singapore Digital Transformation
Page 43
Evolution of Singapore’s identity system
Source: DBS Group Research, Smart Nation and Digital Government Office
2018 2019-2022
Launch of SingPass mobile app with ability to authenticate identity for SingPass services via the app.
Extension of MyInfo database to private sector firms. In all, 160 government services will use MyInfo database.
National Digital identity platform operational. Multiple channels to authenticate identity.
Widespread adoption of digital IDs and digital signatures.
1965
National Registration Identity Cards issued replacing identity papers from the British era.
2003
Launch of SingPass service allowing registered users to access government services digitally and authenticate their identity via passwords.
2016
Beginning of the development of MyInfo, a centralised digital data vault containing citizens ‘personal information. Expected to be a one-stop shop for authenticating identity.
2017
Profiles of 3.3m SingPass users linked to MyInfo database.
MyInfo database extended for use by banks as a pilot project
Page 43

Market Focus
Singapore Digital Transformation
Page 44
Digital Identity schemes across the world
Singapore’s NDI framework is likely to take cues from existing digital identity schemes, one of the most advanced of which is in Estonia. The Estonia ID card (e-ID) is a cryptographically secure (supported by a backend technology similar to the blockchain), and allows Estonians to access a range of services including public, financial, healthcare and emergency services. The digital ID card functions as a driver’s licence, national health insurance card, identity confirmation for banking and healthcare services, and as a passport when travelling within the European Union (EU), among other things. With the digital identification, citizens are provided with two Personal Identification Numbers
(PIN) one of which can be used to authenticate a person’s identity and the other to digitally sign legal documents. According to the Estonian government, ~98% of Estonians have obtained e-IDs and have placed over 350m digital signatures cumulatively, greater than any country in the EU region.
Estonia has also extended the e-ID system to mobile platforms via Mobile ID and Smart ID services. Mobile ID requires the user to obtain a special SIM card embedded with the e-ID chip thereby converting the user’s mobile phone to an electronic ID. The more convenient Smart ID service, presented in the form of a mobile app, allows users to authenticate their identity and sign documents digitally simply by typing their PIN codes through the mobile application after a one-time registration process.
Estonia is home to one of the most advanced digital ID schemes in the world
Source: DBS Group Research
The digital ID scheme has allowed Estonia to digitise many
of its public services including filing taxes, voting, and documentation of its public healthcare system. For example, with the help of e-IDs, the country has adopted an e-court system, where citizens can lodge an initial case via a public portal, within an hour of which an initial hearing can be arranged. Estonia has also extended the digital ID scheme to citizens around the world, allowing anyone who wishes to establish an online business in
Estonia to apply for e-residency. With e-resident status, the individual is allowed to register and operate an online business in Estonia remotely, manage company fillings including the payment of taxes online and enter into contractual obligations by placing digital signatures. According to the government, more than 20,000 people in 138 countries have applied to gain e-residency status in Estonia.
Can be used to
Two PIN numbers are attached to each ID. PIN No. 01 – To authenticate identity PIN No. 02 – For digital signatures
PIN No. 01 – For digital signatures
Replaces
E-ID Estonia Driver’s licence
Passport when travelling in the
EU
National health insurance card
Authenticate identity for
financial services
Vote electronically
Access government services
Lodge complaints and access
security services
E-ID is alsoavailable in the
form ofMobile App (Smart ID)
SIM based Mobile ID
Page 44

Market Focus
Singapore Digital Transformation
Page 45
Another case in point is India’s Aadhaar card system, the largest digital ID scheme in the world with ~1.19b participants. Citizens are required to register their biometrics and provide personal information to register with the system. Once registered, citizens are provided with a 12-digit identification number which can be used to access a number of public and private services including tax filing, social welfare payments and personal banking services. Other less sophisticated digital identity verification systems include UK’s gov.uk Verify service, where citizens can register with private institutions that will verify the authenticity of the user’s online identity for the use of public and private services.
Potential beneficiaries of the NDI framework
Banks and financial institutions likely be biggest beneficiaries. The establishment of digital identities and a centralised database with banking users’ personal information will allow banks to adopt paperless documentation and fully digitise banking services including the opening of accounts. For example, India’s banks are capturing new customers through the Aadhaar digital identity system, which allows savings accounts to be opened via mobile devices. DBS India has managed to capture ~2m customers in the country despite having only 12 branches, by allowing users to register for bank accounts through their mobile phones.
Telcos, IT service providers to benefit from need for cyber-security, enterprise solutions. Telcos and IT service providers with strong cyber-security capabilities are likely to benefit from NDI’s requirement for robust cyber-security measures. The digital identity scheme would require both government agencies and private sector organisations gaining access to the digital identity databases to maintain strong cyber-security measures, driving demand for cyber-security solutions. IT service providers may also benefit from potential opportunities arising from the development of new digital enterprise solutions integrated with the NDI framework.
2. E-payments
The government is expected to develop a nationwide electronic payments system offering security and convenience to users. Adoption of e-payments would allow citizens and businesses to transact via online and mobile platforms easily and securely, reducing the usage of cash in Singapore society. Some projects underway:
Pay Now – A mobile-based peer-to-peer fundstransfer service allowing citizens to makepayments to registered users with just the mobilenumber or NRIC number of the recipient. Theservice is available to the registered internet andmobile banking customers of seven banks inSingapore. The government expects allgovernment agencies including the CentralProvident Fund (CPF) to start using the service in2018. The service has secured more than a millionregistrations since its launch in July 2017. Theservice is also expected to be extended tocorporations, allowing businesses to link theirbank accounts to their unique entity numbers tomake B2B payments.
Development of a universal QR code – TheMonetary Authority of Singapore (MAS) hasformed a task force to develop a standardised QRspecification for both domestic and internationalpayment schemes. The common QR code wouldfacilitate payments for different payment schemes,e-wallets and banks, and will primarily target smallshops and hawker centres.
The government also plans to roll out, by 2019,25,000 unified point-of-sale terminals, which willaccept all major cards, including those that arecontactless and embedded in smartphones.
The LTA expects to adopt a fully cashless paymentsystem for public transportation system by 2020.Accordingly, all public bus and train rides will bepaid with travel cards and top-ups performedwithout the use of physical cash.
Page 45

Market Focus
Singapore Digital Transformation
Page 46
MAS is also in the process of developing a set ofe-payment guidelines to protect small businessesand consumers.
National e-payment platform to be widely adopted by 2020
Source: DBS Group Research, KPMG, Smart Nation and Digital Government Office
National e-payment platforms across the world
Thailand recently introduced PromptPay in line with the national e-payment initiative, which aims to reduce the use of cash for government-related transactions such as tax payments and social welfare benefit claims. Much like Singapore’s PayNow, PromptPay is a mobile based peer-to-peer fund transfer service, that allows payments to registered users with just the recipient’s mobile number or identification number. The government also expects to install more than 550,000 electronic data capture and mobile point-of-sale terminals to boost the use of electronic cards.
India is also revamping its national payment infrastructure with the introduction of services such as the Unified Payment Interface (UPI), Aadhaarpay and Bharat QR code. UPI is an instant real-time payment system allowing users to transfer money using their Aadhaar unique identity number, mobile phone number or virtual payment address. The platform has gained immense popularity since its introduction in 2016, having recorded over 171.4m transactions by February 2018 according to the
2018 2019-2020
Development of a standardised QR code with unified payment acceptance
Rollout of 25,000 unified point-of-sales terminals
Entirely cashless public transport system by 2020
Fast and Secure Transfers (FAST) service launched in Singapore. FAST is an electronic funds transfer system that enables instantaneous transfers among registered users’ banks
2014
Development of PayNow, a mobile-based P2P payment platform developed on the FAST transfer network
2017 2016
60%
Cash is still used in six out of 10 consumer transactions in Singapore
PayNow to encompass government services and B2B payments
Page 46

Market Focus
Singapore Digital Transformation
Page 47
government32. Aadhaarpay also enables users to make cashless money transactions using Aadhaar Card and their fingerprints for biometric authentication. Bharat QR, launched in 2017, offers a universal QR code for inter-operable payment acceptance and supports all major payment solution providers including Visa, MasterCard, Amex, RuPay cards and UPI.
Potential beneficiaries of e-payments
Banks could benefit from higher fees with widespread e-payment adoption. Banks and financial service providers could benefit from greater transaction volumes and fees resulting from the widespread adoption of e-payment schemes. The increasing popularity of e-payments could also motivate small and medium-sized enterprises (SMEs), which predominantly use cash, to adopt banking services, bringing in more clients and revenue sources for banks. Banks would also be able to capitalise on fees with the expansion of the e-payment infrastructure for B2B payments.
Small retailers to benefit from P2P payments and universal QR codesAdoption of P2P mobile payments and universal QR codes could drive up the volume of cashless transactions for retailers, eliminating inefficiencies in dealing with cash such as theft, holding costs and security.
32https://gadgets.ndtv.com/apps/news/paytm-claims-the-lead-on-upi-payments-but-its-too-soon-to-call-a-winner-1819191
1. Smart Nation Sensor Platform
The Smart Nation Sensor Platform (SNSP) refers to the nationwide deployment of sensors and other Internet of things (IoT) devices to collect, store and analyse data in order tooptimise government services and security. All 110,000 lamp posts in Singapore are expected to carry sensors and form a nationwide sensor network by 2020. By 2022, the government expects to extend the sensor data collected via the nationwide sensor platform for the use of the public and businesses. Data from the sensors will be used for urban and operational planning and also for maintenance and to facilitate a prompt response to incidents where needed.
The programme would also include a range of initiatives from smart metering in residential areas to provide consumers with timely information of their utilities consumption, to the using of a video analytics platform to count vehicles on the road to better plan public transportation.
GovTech, the government agency responsible for the deployment of sensors, will build in standard connectivity and power sources into the lamp posts, after which the lamp posts would be equipped with different devices as required. The devices could be CCTVs or environmental or motion sensors. Under phase 1 of this programme, CCTV systems have been set up in public areas, while environmental sensors and connectivity infrastructure have been set up in Yuhua, the civic district, Orchard Road and a few other areas. GovTech is also working with private agencies to develop video analytics capabilities based on footage from CCTV cameras around the country.
Page 47

Market Focus
Singapore Digital Transformation
Page 48
Smart Nation sensor platform would connect all 110,000 lamp posts in Singapore
Source: DBS Group Research, Smart Nation and Digital Government Office
Smart sensor platforms elsewhere
Barcelona, a global pioneer in the adoption of smart city initiatives, uses IoT and sensors to maximise cost efficiencies in a range of public services. Over 1,100 lampposts in the city are equipped with LED lighting and sensors that activate only when movement is detected nearby. The lamp posts are also part of the city’s WiFi network, providing consistent, free Internet access throughout the city. Moreover, the sensors collect environmental data such as humidity, temperature and air quality, and relay this to city agencies and the public. According to the government, the smart lighting system has cut its energy bill by about ~US$37m annually.
Barcelona also boasts one of the most advanced waste collection systems in the world, with sensors on waste bins sending alerts to collection trucks when they are ready for collection. Data from waste bins is analyzed to provide drivers with the optimal route for collection. The city has also integrated IoT technology with its parks to remotely sense and control park irrigation and water levels in public fountains. Using sensors to monitor rain and humidity, park workers can determine how much irrigation each area needs. A system of electro-valves is then remotely deployed. The programme, implemented in 68% of public parks, has helped the city achieve a 25% increase in water conservation, and savings of approximately US$555,000 per year.
Barcelona’s integrated sensor network is relayed through Sentilo, a platform developed specifically for the city, and which is now open-source and available for use by other governments. Data captured through the sensors located across the city is managed and shared with citizens and city workers through this platform.
A number of cities in the US such as Boston and Chicago have also experimented with sensors on a range of public infrastructure including lamp posts and public benches. The sensors are primarily used to collect environmental data. The cities are also equipped with a network of CCTV cameras helping authorities to monitor and respond to incidences swiftly.
Potential beneficiaries
Telcos, IT service providers to benefit from analytics demand. Telecom operators, as the key providers of connectivity infrastructure for the programme, are integral to the success of the sensor platform. Telcos and IT service providers will benefit from potential demand for cloud services for the collection of data generated from the sensors and demand for data analytics solutions by government agencies and private enterprises. Deployment of a network of CCTV cameras is also likely to benefit IT service providers and start-ups with capabilities in video analytics.
2018-2019 2020
P hase 1 Trials – Deployment of CCTV cameras and
s ensors in Yuhua, the civic d istrict, Orchard Road, etc
Connected lamp post trials
All 110,000 lamp posts connected via sensors sensors
Data gathered from the sensor network extended for public use
TRIA
LS
2022
Page 48

Market Focus
Singapore Digital Transformation
Page 49
Makers of electronic devices, sensors could benefit from equipment demand. Importers and manufacturers of electronic devices such as CCTV cameras, sensory equipment and connectivity equipment are likely to benefit from potential government contracts for the deployment and maintenance of the sensor platform.
2. Smart Urban Mobility
With smart urban mobility initiatives, the government aims to create a data-driven public transportation system that responds to real-time demand and traffic data. Under the programme, LTA will roll out autonomous scheduling of public transportation based on real-time demand data and experiment on and develop guidelines for autonomous vehicles.
Trials are underway to establish a dynamically routed bus system that responds to real-time traffic needs. According to the LTA, customers can ask for pickups and drop-offs from designated bus stops within the operating area of the
trials and buses will be routed based on demand data. LTA has also handed out two contracts to private companies VIA and SWAT to develop a dynamic matching and routing algorithm to deploy buses in response to real-time commuter demand. LTA is conducting trials on autonomous vehicles on a test circuit at CleanTech Park and expects to utilise autonomous public transportation modes by 2022.
The development of a smart traffic congestion management system is also a key smart-mobility initiative. The government plans to upgrade the current Electronic Road Pricing System to a satellite-based model where motorists may have to pay based on the distance travelled in a congested zone rather than the current flat fee. A S$556m contract has been granted to a consortium comprising NCS Group and Mitsubishi Heavy Industries to develop the system, which is expected to be operational by 2020.
Page 49

Market Focus
Singapore Digital Transformation
Page 50
Evolution of Singapore’s smart transportation system
Source: DBS Group Research, Land Transport Authority, Smart Nation, and Digital Government Office
Smart mobility initiatives around the world
Helsinki, the capital of Finland, boasts one of the best public transportation systems in the world. The city council has long been a pioneer in the smart mobility space, experimenting with an on-demand public transportation system as early as 2013. The city introduced the Kutsuplus service in 2013, a public mini-bus service that lets riders choose the start and end points, and select if they wish to share the ride with another passenger. If the user wished to share a ride, an algorithm was used to determine the most direct route to get to the destination of every user. The service was priced at a premium to other means of public transport but at a discount to private taxis. After the initial research, the service was shut down due to the rising
cost of employing an adequate number of mini-buses to cater to surging demand.
In 2016, Helsinki’s city council and private firm MaaS introduced an app called Whim which seamlessly integrated all forms of public transportation in the city. Anyone with the app can enter a destination and a starting point and be presented with an array of public transport methods to reach the user’s destination. For example, this may involve a combination of the use of a public bike-sharing service, a public tram and a public bus system. Once confirmed, the app would pre-book all public transportation modes. The service also offers monthly transportation packages to suit the needs of users.
2022 2018-2019 2020
Trials on demand-driven public transportation systems
Satellite-based Electronic Road pricing system becomes operational
Deployment of autonomous vehicles for public transport
1998 2004 2011 2015 2017
Launch of Electronic Road Pricing System
Launch of i-Transport – a platform that collates data across sources for real-time traffic management
Launch of MyTransport.sg and Datamall @M yTransport to share real-time traffic updates with the public and industry players
Launch of Beeline, a platform for demand-driven, crowd-sourced bus services
Common Fleet Management system fully operational by the end of 2017. Timely bus arrivals and real-time updates on public buses made available to customers
Page 50

Market Focus
Singapore Digital Transformation
Page 51
Research on autonomous driving and experiments on the use of autonomous public transportation systems is also on the rise. Estonia, for example, has made it legal to test self-driven vehicles on all national and local roads in the country. Work is underway to create a full legal and cyber-risk management framework for using fully autonomous vehicles in regular road and traffic conditions. Oslo, Norway, is seeking suppliers to experiment with the use of autonomous vehicles to deliver on-demand transportation services to citizens.
Potential beneficiaries
Transportation providers likely to be among biggest beneficiaries. Demand-driven transportation schemes will ensure the efficient utilisation of vehicle fleets maintained by transportation service providers while optimising passenger loads per trip. Smart congestion management systems would also help transportation providers to minimise waiting times and improve fuel efficiencies. Government agencies’ support for autonomous vehicle testing can also help transportation service providers accelerate trials and development of autonomous fleets.
Transport tech providers likely to benefit from government contracts. Companies in the development and provision of transportation technologies are also likely to benefit from potential government contracts pertaining to the deployment transportation technologies. For example, a contract of S$556m was granted to a consortium comprising of NCS and Mitsubishi Heavy Industries in 2016 for the deployment of a satellite-based electronic road pricing system. In 2014, ST Electronics and Trapeze Switzerland secured a S$68m government contract for the deployment of the common fleet management system. Companies with exposure to demand-driven transportation technologies and autonomous vehicles are likely to benefit from similar government contracts in the future.
2. Moments of Life
The Moments of Life (MOL) initiative refers to the bundling of relevant government services, across different agencies, to support citizens at key moments of their lives such as marriage, child birth and the death of loved ones. As an initial step, GovTech is expected to launch an MOL app in mid-2018 to allow parents to register child births that happen at three designated government hospitals. Parents with young children can use the app to find pre-school facilities nearby, view information such as school fees and estimated vacancies, and even, indicate if they want to be waitlisted.
A number of governments around the world have successfully created mobile platforms to integrate key government services into the lives of citizens. In Hong Kong for example, the government maintains its own app store with more than 100 mobile applications for access to key public services such as for healthcare, defence and consumer rights.In Australia, the Queensland government has launched more than 20 mobile apps to provide easy access to essential government services. India also expects to launch a unified mobile application to provide citizens with access to major government services at the national and state levels, using Aadhaar-based authentication techniques to verify identity.
Other Ongoing Smart Nation Projects
1. Smart Health-Assist</bold>
Hospitals are already operating at close to full capacity in Singapore. Medical tourism and a rapidly ageing population will also continue to squeeze the country’s capacity for health care.
By 2030, there will be an estimated 900,000 elderly citizens in Singapore, or about one in five Singaporeans. The Pioneer Generation Package covers about 450,000 Singaporeans whereas there are c.1m Singaporeans between the ages of 45 and 64 who will reach retirement age in 10 to 20 years.
Page 51
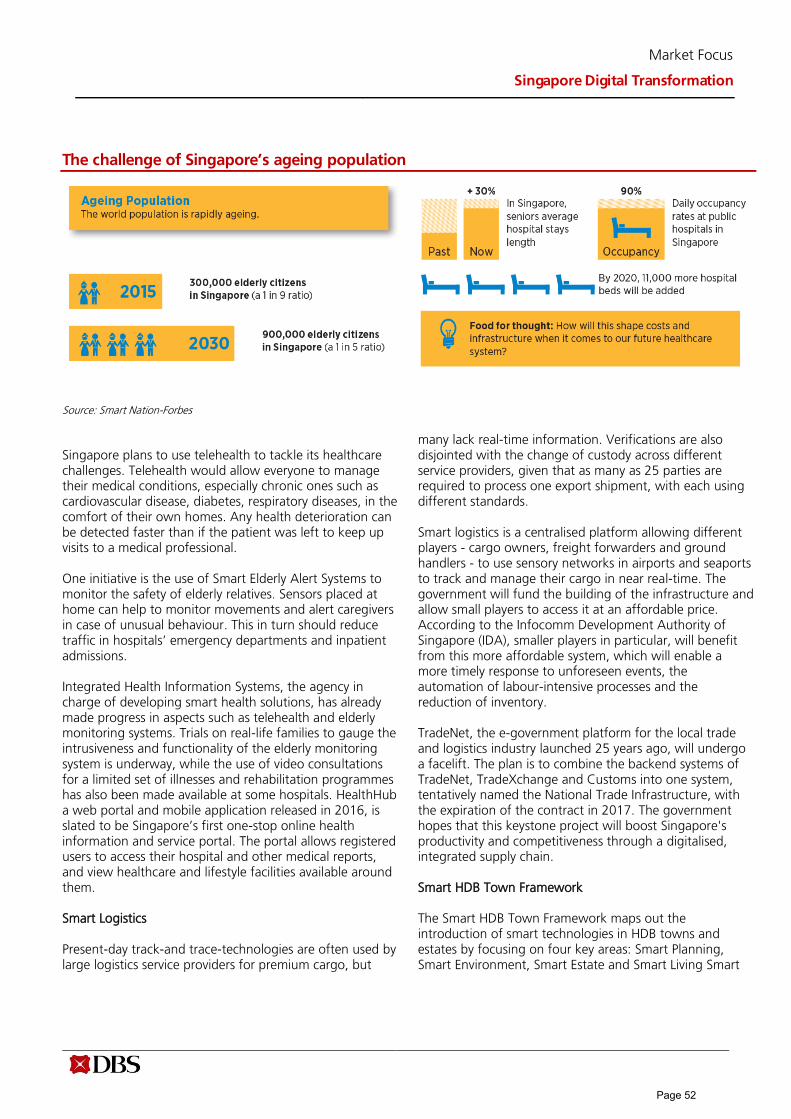
Market Focus
Singapore Digital Transformation
Page 52
The challenge of Singapore’s ageing population
Source: Smart Nation-Forbes
Singapore plans to use telehealth to tackle its healthcare challenges. Telehealth would allow everyone to manage their medical conditions, especially chronic ones such as cardiovascular disease, diabetes, respiratory diseases, in the comfort of their own homes. Any health deterioration can be detected faster than if the patient was left to keep up visits to a medical professional.
One initiative is the use of Smart Elderly Alert Systems to monitor the safety of elderly relatives. Sensors placed at home can help to monitor movements and alert caregivers in case of unusual behaviour. This in turn should reduce traffic in hospitals’ emergency departments and inpatient admissions.
Integrated Health Information Systems, the agency in charge of developing smart health solutions, has already made progress in aspects such as telehealth and elderly monitoring systems. Trials on real-life families to gauge the intrusiveness and functionality of the elderly monitoring system is underway, while the use of video consultations for a limited set of illnesses and rehabilitation programmes has also been made available at some hospitals. HealthHub a web portal and mobile application released in 2016, is slated to be Singapore’s first one-stop online health information and service portal. The portal allows registered users to access their hospital and other medical reports, and view healthcare and lifestyle facilities available around them.
Smart Logistics
Present-day track-and trace-technologies are often used by large logistics service providers for premium cargo, but
many lack real-time information. Verifications are also disjointed with the change of custody across different service providers, given that as many as 25 parties are required to process one export shipment, with each using different standards.
Smart logistics is a centralised platform allowing different players - cargo owners, freight forwarders and ground handlers - to use sensory networks in airports and seaports to track and manage their cargo in near real-time. The government will fund the building of the infrastructure and allow small players to access it at an affordable price. According to the Infocomm Development Authority of Singapore (IDA), smaller players in particular, will benefit from this more affordable system, which will enable a more timely response to unforeseen events, the automation of labour-intensive processes and the reduction of inventory.
TradeNet, the e-government platform for the local trade and logistics industry launched 25 years ago, will undergo a facelift. The plan is to combine the backend systems of TradeNet, TradeXchange and Customs into one system, tentatively named the National Trade Infrastructure, with the expiration of the contract in 2017. The government hopes that this keystone project will boost Singapore's productivity and competitiveness through a digitalised, integrated supply chain.
Smart HDB Town Framework
The Smart HDB Town Framework maps out the introduction of smart technologies in HDB towns and estates by focusing on four key areas: Smart Planning, Smart Environment, Smart Estate and Smart Living Smart
Page 52

Market Focus
Singapore Digital Transformation
Page 53
Planning. It refers to the use of computer simulations and data analytics to enable HDB to effectively plan and design its estates. This, for example, when assessing the effectiveness of various initiatives (e.g. LED lighting, solar energy, vertical greenery, rainwater harvesting, recycling, pneumatic waste collection), and making a decision on the best combination to achieve sustainability goals in a cost-effective way.
Smart Environment refers to the use of environmental data such as temperature or humidity captured through sensors to create a more pleasant environment. For example, fans in common areas can be triggered when certain thresholds of temperature and humidity are reached. The fan speed can be regulated to maximise comfort, while reducing energy consumption.
Smart Estate initiatives aims to analyse data to optimise maintenance cycles and pre-empt problems. This would allow maintenance staff to better understand the usage patterns of common amenities and resolve problems. For example, motion-detected lighting systems could reduce energy consumption by as much as 30% while sensors installed on the lamp posts could trigger warnings about replacements.
Smart Living refers to the integration of smart technology into daily living in housing estates. This includes smart
33https://www.stengg.com/en/newsroom/news-releases/st-engineering-to-showcase-diverse-and-smart-solutions-at-singapore-airshow-
2018/
meters to allow people to monitor their energy consumption on a real-time basis and control their electrical appliances remotely. Trials of smart-home solutions are being conducted at ~3,200 HDB homes in the Yuhua estate. HDB’s Northshore Residencies I and II, expected to be completed by 2020, will be fully equipped with the infrastructure needed to support such smart homes.
Potential beneficiaries of Smart Nation
ST Engineering is riding on the digitisation trend to grow its smart city business. ST Engineering (Singapore Technologies Engineering Ltd) is an integrated defence and engineering group with a global presence, specialising in the aerospace, electronics, land systems and marine sectors33. In recent years, the company has increasingly positioned itself to capitalise on growth from smart city and robotics markets, including the hospitality, healthcare, transportation and security industries. Digitisation of processes within these industries will be complementary to the adoption of ST Engineering’s smart city products. In terms of size, in 2017, the company’s revenues from smart-city markets were S$1bn, and it aims to more than double this by 2022. Leveraging on its track record in Singapore, ST Engineering is now targeting the global smart-city market.
Page 53

Market Focus
Singapore Digital Transformation
Page 54
ST Engineering’s Smart City Global Presence
Source: Company
Examples of ST Engineering’s smart-city developments:
i) In July 2017, ST Engineering acquired Aethon, aprovider of autonomous mobile robots (AMRs)which has deployed its AMRs in more than 200sites globally, including in 140 hospitals in the US.The acquisition has allowed ST Engineering todevelop new applications based on a provenrobotic solution for indoor applications for thehealthcare, industrial and hospitality sectors34. Forexample, by deploying the Aethon Tug robot tohotels, the laundry process can be reduced from aseven-step manual process to a three-stepautomated one, with the use of radio-frequencyidentification tagging.
ii) With the acquisition of a 51% stake in SPTelecommunications, ST Engineering now hasaccess to an extensive network of fibre optic
34http://www.businesstimes.com.sg/companies-markets/st-engineering-to-acquire-us-robotics-firm-aethon-for-us36m
35https://www.stengg.com/en/newsroom/news-releases/st-engineerings-electronics-arm-acquires-51-equity-stake-in-sp-
telecommunications-pte-ltd/
backhaul infrastructure and facilities in Singapore, enabling the company to move up the information and communications technology (ICT) value chain to provide connectivity and other bundled enterprise ICT services for smart city initiatives.35
iii) ST Engineering has assumed a strategic roletowards achieving Singapore’s Smart Mobility2030 vision of a smart transportation network.The company has been developing its autonomousvehicle (AV) capabilities and technologies forcommercial smart mobility applications from asearly as 2015, when it deployed the AutonomousPeople Mover in Singapore’s Gardens by the Bay.LTA and ST Engineering are also jointly developingautonomous buses and mobility on demandvehicles (MODVs) for Sentosa Island. Theautonomous buses will go on trial on JurongIsland at end-2018 and will undergo public road
Page 54

Market Focus
Singapore Digital Transformation
Page 55
trials by mid-202036while MODVs are expected to be deployed in 1Q1937.
iv) ST Engineering has also ventured into the satellitebusiness. After the success of its first satelliteTeLEOS-1, ST Engineering started building TeLEOS-2 (targeted for launch in 2022), Singapore’s firstsynthetic aperture radar-based imaging satellite,which will provide round-the-clock, all-weatherimaging to a wide range of industrial clients38.
v) ST Engineering is deploying the company’sexpertise in wireless smart sensor technology topower smart street lighting and efficient utilitiesmanagement in cities across China, Europe, Indiaand the US with the installation of 18m wirelesssmart sensors39.
vi) In 2017, ST Engineering launched Innosparks, an
engineering-based incubator programme enablingindividuals or startups to accelerate technologyinnovation from idea to market within 18 monthsor less. Once the individual or startup reaches thecommercial scaling stage, Innosparks will connectwith to ST Engineering’s Corporate VentureCapital unit (a US$150m open-ended fund)40.Theunit made its first investment in JanusTechnologies, a US-based endpoint cyber-securityprovider, which helped ST Electronics launch itsBlack Computer, an industry-first, hardware-basedcyber-security solution.41.
36https://www.stengg.com/en/newsroom/news-releases/st-engineering-drives-development-of-autonomous-vehicles-for-urban-mobility/
37https://www.stengg.com/en/newsroom/news-releases/on-demand-self-driving-shuttles-in-sentosa-at-the-touch-of-a-smartphone/
38https://www.channelnewsasia.com/news/singapore/st-electronics-to-build-2nd-singapore-made-earth-observation-sat-7608664
39http://sbr.com.sg/building-engineering/news/st-electronics-bags-smart-sensor-network-deal-worth-98m
40http://www.businesstimes.com.sg/companies-markets/st-engineering-sets-up-us150m-corporate-venture-capital-unit-opens-
innovation-lab
41http://sbr.com.sg/building-engineering/news/st-engineering-invests-78m-in-cybersecurity-firm-janus-technologies
Page 55

Market Focus
Singapore Digital Transformation
Page 56
Appendix
Key government initiatives in the financial services sector
Initiative Description How does each initiative help the financial sector
Example
Application Programming Interface (API) architecture
MAS’ drive towards an open API architecture, in line with the government’s Smart Nation objective, started as early as in 2016. An API is a set of formalised commands that allow software applications to talk to each other seamlessly.
APIs will enable banks to integrate their systems internally, and pave the way for seamless interaction with third parties to develop better products.
Since 2016, Citibank, DBS, OCBC, Standard Chartered, NETS as well as MAS have launched their own API developer portals.
Unified Point-of-Sale terminal (Unified POS)
This allows merchants to accept all payment modes including NETS, NETS FlashPay, Apple Pay, Android Pay, Samsung Pay, UOB Mighty Pay, EZ-Link, credit and debit cards, UOB Delight card and Passion card. This is in line with the government’s Smart Nation drive to accelerate the retail sector’s transition to electronic platforms.
According to the Dairy Farm, unified POS can reduce the time required at checkout counters by 20-30% (or 9-11 seconds) by integrating multiple payment modes into one system.
Pilot projects started in 2016. The Dairy Farm Singapore Group has partnered NETS and UOB to install 2,000 Unified POS payment terminals across the retailer’s 650 stores.
Singapore Regulatory Sandbox
In June 2016, MAS started the FinTech Regulatory Sandbox. Subsequently, the FinTech and Innovation Group released guidelines for a regulatory sandbox to encourage more experimentation in financial technology.
Enables product testing in a well-defined space and duration, with appropriate safeguards to contain the consequences of failure and maintain the overall safety and soundness of the financial system.
MAS has allowed initial coin offerings to be tested in the sandbox.
The first start-up to graduate from the MAS sandbox is PolicyPal in August 2017; it raised US$20m and has launched an insurance mobile app. Another example is Electrify, which helps electricity consumers find the best rates for themselves, and which raised US$30m in March 2018.
Cloud services for financial institutions
In July 2016, MAS issued new guidelines for financial institutions on outsourcing in general, including the use of cloud services.
A secure cloud infrastructure enables many fintech innovations, including banking-as-a-service (BaaS) platforms. This should better equip banks to compete with non-traditional players such as Google, Apple, PayPal and AliPay.
An early adopter of cloud technology is DBS, which established a cloud partnership with Amazon Web Services back in 2016 and plans to shift 50% of its computing workload to the public cloud by 2018.
MAS Looking Glass: its own fintech innovation lab
Looking Glass@MAS was set up in August 2016 within the MAS Building.
It aims to spur collaboration among MAS, financial institutions, start-ups and technologists.
Blockchain technology for clearing and
Project Ubin is a collaborative project with the industry to explore Distributed Ledger
DLT has demonstrated potential in making transactions and processes
Software prototypes for decentralised inter-bank payment and settlements with liquidity savings mechanisms were developed in
Page 56

Market Focus
Singapore Digital Transformation
Page 57
Initiative Description How does each initiative help the financial sector
Example
settlement of payments and securities
Technology (DLT). MAS’ eventual goal is to develop simpler to use and more efficient alternatives to today’s systems based on digital central-bank issued tokens.
more transparent, resilient and cheaper.
October 2017, in a project involving MAS, the Association of Banks in Singapore (ABS), five technology partners and 11 financial institutions.
Spin-off projects will focus on fixed income securities trading and settlement cycle through DLT and cross-border payments using central-bank digital currency.
Banks allowed to enter non-banking services
Since June 2017, banks have been allowed to conduct non-financial businesses that are related and complementary to their core financial businesses. This is subject to a cap of 10% of the bank’s capital funds to limit exposure.
Banks can leverage on their customer base to embed banking services in e-commerce transactions and cross-sell more services.
DBS launched an online marketplace for car buyers and sellers in August 2017 that also allows buyers to schedule loans and calculate car budgets.
In March 2018, UOB launched an online travel marketplace using Agoda and Expedia’s API, to target online travel spend.
PayNow - central addressing scheme for payments
In July 2017, ABS announced the launch of PayNow. PayNow allows payments using the recipient’s mobile number, national ID number, e-mail address, or any othersocial media address, withoutthe need for the recipient’sbank or bank accountnumber.
Banks can use PayNow to promote mobile payments services, facilitating convenience and efficiency of funds transfers.
PayNow Corporate is expected to be available to businesses by 2H2018, to facilitate B2C transactions.
Initially available at seven retail banks, namely Citibank, DBS/POSB, HSBC, Maybank, OCBC, Standard Chartered Bank and UOB, from April 2018, the list now also includes Bank of China and Industrial Bank of China.
Source: MAS, respective banks’ press releases, DBS Group Research
Page 57
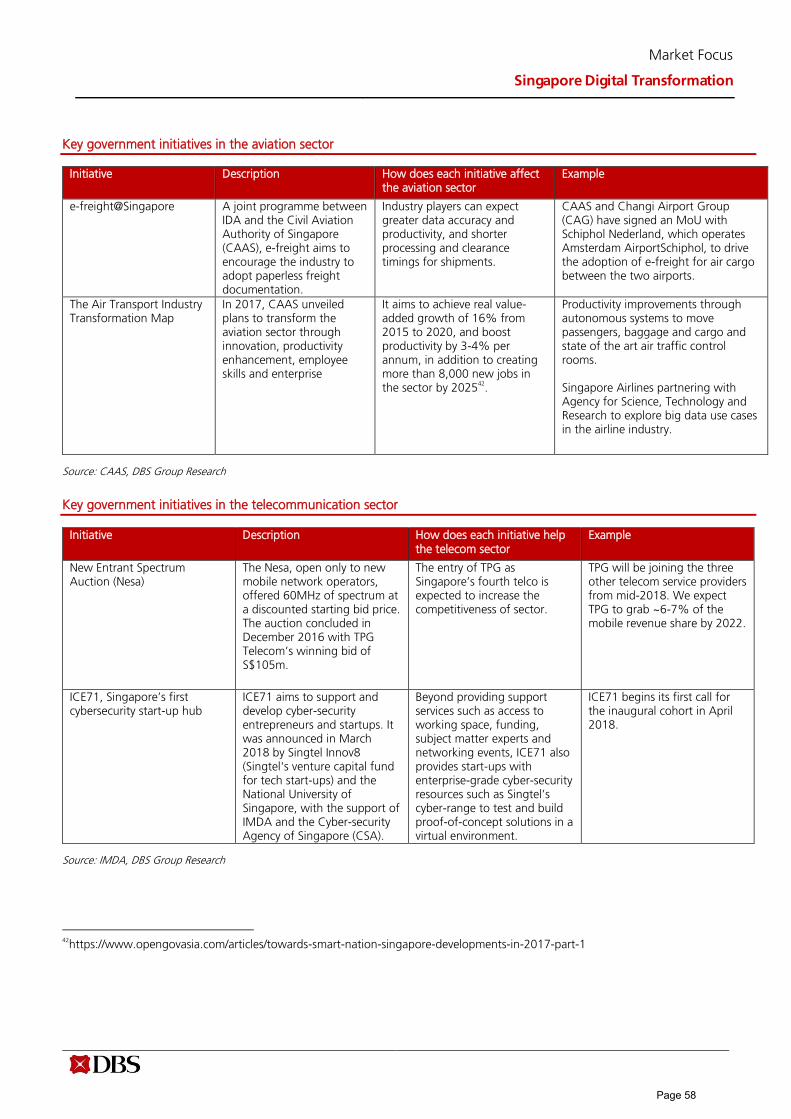
Market Focus
Singapore Digital Transformation
Page 58
Key government initiatives in the aviation sector
Source: CAAS, DBS Group Research
Key government initiatives in the telecommunication sector
Source: IMDA, DBS Group Research
42https://www.opengovasia.com/articles/towards-smart-nation-singapore-developments-in-2017-part-1
Initiative Description How does each initiative affect the aviation sector
Example
e-freight@Singapore A joint programme between IDA and the Civil Aviation Authority of Singapore (CAAS), e-freight aims to encourage the industry to adopt paperless freight documentation.
Industry players can expect greater data accuracy and productivity, and shorter processing and clearance timings for shipments.
CAAS and Changi Airport Group (CAG) have signed an MoU with Schiphol Nederland, which operates Amsterdam AirportSchiphol, to drive the adoption of e-freight for air cargo between the two airports.
The Air Transport Industry Transformation Map
In 2017, CAAS unveiled plans to transform the aviation sector through innovation, productivity enhancement, employee skills and enterprise
It aims to achieve real value-added growth of 16% from 2015 to 2020, and boost productivity by 3-4% per annum, in addition to creating more than 8,000 new jobs in the sector by 2025
42.
Productivity improvements through autonomous systems to move passengers, baggage and cargo and state of the art air traffic control rooms.
Singapore Airlines partnering with Agency for Science, Technology and Research to explore big data use cases in the airline industry.
Initiative Description How does each initiative help the telecom sector
Example
New Entrant Spectrum Auction (Nesa)
The Nesa, open only to new mobile network operators, offered 60MHz of spectrum at a discounted starting bid price. The auction concluded in December 2016 with TPG Telecom’s winning bid of S$105m.
The entry of TPG as Singapore’s fourth telco is expected to increase the competitiveness of sector.
TPG will be joining the three other telecom service providers from mid-2018. We expect TPG to grab ~6-7% of the mobile revenue share by 2022.
ICE71, Singapore’s first cybersecurity start-up hub
ICE71 aims to support and develop cyber-security entrepreneurs and startups. It was announced in March 2018 by Singtel Innov8 (Singtel's venture capital fund for tech start-ups) and the National University of Singapore, with the support of IMDA and the Cyber-security Agency of Singapore (CSA).
Beyond providing support services such as access to working space, funding, subject matter experts and networking events, ICE71 also provides start-ups with enterprise-grade cyber-security resources such as Singtel’s cyber-range to test and build proof-of-concept solutions in a virtual environment.
ICE71 begins its first call for the inaugural cohort in April 2018.
Page 58

Market Focus
Singapore Digital Transformation
Page 59
Key government initiatives in the retail sector
Initiative Description How does each initiative help the retail sector
Example
Budget 2018 Introduction of GST from 2020 onwards on imported e-commerce services.
An e-commerce tax could ease the competition for offline brick-and-mortar retailers due to the rising popularity of online shopping from China and other countries
Retail Industry Roadmap The roadmap focuses on productivity improvement measures such as storefront self-checkout and cash management, as well as the digitisation of backend operations.
The government projects a 1% average annual productivity growth rate for the retail industry from 2016-2021.
At supermarket chain Sheng Siong, hybrid self-checkout systems 27 out of its 47 stores are estimated to save 40% of its manpower costs. NTUC Fairprice has also revamped its online shopping app to enhance shoppers’ experience, and is using a new automated storage and retrieval system capable of handling four times more orders per day.
Retail Industry Digital Plan Launched in 2017 by IMDA and Spring Singapore, the plan aims to help retailers adopt multi-channel strategies, so shoppers can enjoy faster delivery lead-times from shops they are familiar with within a precinct.
The plan exploits new and advanced digital platforms like omni-channel retailing and digital marketing, allowing retailers to enhance their customer reach and the shopping experience. The aim is to grow the e-commerce share of total retail receipts from the current 3% to 10% by 2020.
Source: IMDA, DBS Group Research
Page 59

Market Focus
Singapore Digital Transformation
Page 60
Key government initiatives in the land transportation sector
Initiative Description How does each initiative help the transport sector
Example
Regulatory Framework and Standards for Intelligent Transport Systems (ITS)
ITS is a sophisticated traffic control system to maximise road network by monitoring traffic flow in Singapore. In February 2017, IDA allocated the 5.9 GHz frequency band for ITS.
ITS enables LTA in its development and deployment of initiatives such as self-driving or autonomous vehicles.
LTA is setting up two test centres to test autonomous vehicles in Jurong and one-north. It also has partnerships with: - the Energy Research Institute atNanyang Technological University(ERI@NTU) to develop and try outautonomous bus technology- ST Kinetics to develop and try outdriverless bus systems- Delphi and nuTonomy to conductautonomous mobility-on-demandtrials.
Expressway Monitoring Advisory System (Emas) by LTA
Emas is a computerised system that monitors traffic on Singapore's expressways.
It allows authorities to detect accidents and notifies motorists of adverse traffic conditions.
This promotes the adoption of emerging technologies such as robot assistants and RFID inventory management tools.
Green Link Determining (Glide) System
The system controls all traffic signals in Singapore as traffic flow changes. Responds by adjusting the green-light timings accordingly.
It allocates green-light timings for motorists and pedestrians based on demand.
Parking Guidance System (PGS) by LTA
It provides motorists with real-time parking availability information.
This allows motorists make better informed parking choices.
Examples include roadside electronic information panels positioned at key locations in Marina Centre, Orchard and HarbourFront, the Motoring Portal website and apps such as MyTransport.SG.
Source: LTA, DBS Group Research
43https://www.channelnewsasia.com/news/singapore/4-more-malls-to-adopt-new-model-of-delivery-management-7680930
Page 60

Market Focus
Singapore Digital Transformation
Page 61
Key government initiatives in the logistics sector
Initiative Description How does each initiative help the logistics sector
Example
In-mall distribution (IMD) This allows logistics service providers to book time slots to make deliveries. In-Mall Logistics Operators (IMO) stationed within the mall unloading bay receive deliveries from suppliers before making the last-mile delivery to retailers within the mall. The solution adopts a dock scheduling and queue management system developed by local firm Gurusoft.
It has reduced vehicle delivery parking time from an average of 24 minutes to just seven minutes
43. It allows internal
users to place purchase orders any time via the application and also lets mall personnel co-ordinate delivery timeslots with approved vendors. The system also analyses data, develop reports and sends alerts to IMOs, suppliers and retailers.
IMD is being extended to malls across the island after successful trials Tampines Mall and Bedok Mall in 2016 by IMDA and CapitaLand Mall Trust.
Federated lockers A delivery network of parcel lockers not tied to any single operator and which all couriers can use to deliver to customers. The pilot with 75 lockers is slated to go live in the second half of 2018.The plan is to have some 760 lockers around Singapore eventually.
It should improve the efficiency of last-mile delivery as duplication of efforts can be avoided if the recipient is not at home.
It should potentially benefit over 7,600 logistics service providers in Singapore.
SingPost’sPOPStations operate in a similar fashion to the federated lockers scheme although they are not open to other vendors yet. SingPost delivers the parcel to the POPStation and alerts the customer via text messages and e-mail.
Airbnb for cargo space Large shippers can sell unused cargo space at a discount to smaller shippers. IMDA has signed a memorandum of intent with locally based e-freight platform provider vCargo Cloud to create this platform.
The scheme potentially lowers the cost of freight charges for small shippers.
Offsite Consolidation Centres (OCC)
OCCS are places for mall delivery trucks that are not yet fully loaded to consolidate and sort their goods.
OCCs reduce the number of trucks going to the same destination and improves truck load utilization.
Source: IMDA, DBS Group Research
Page 61

Market Focus
Singapore Digital Transformation
Page 62
COMPANY GUIDES
Page 62
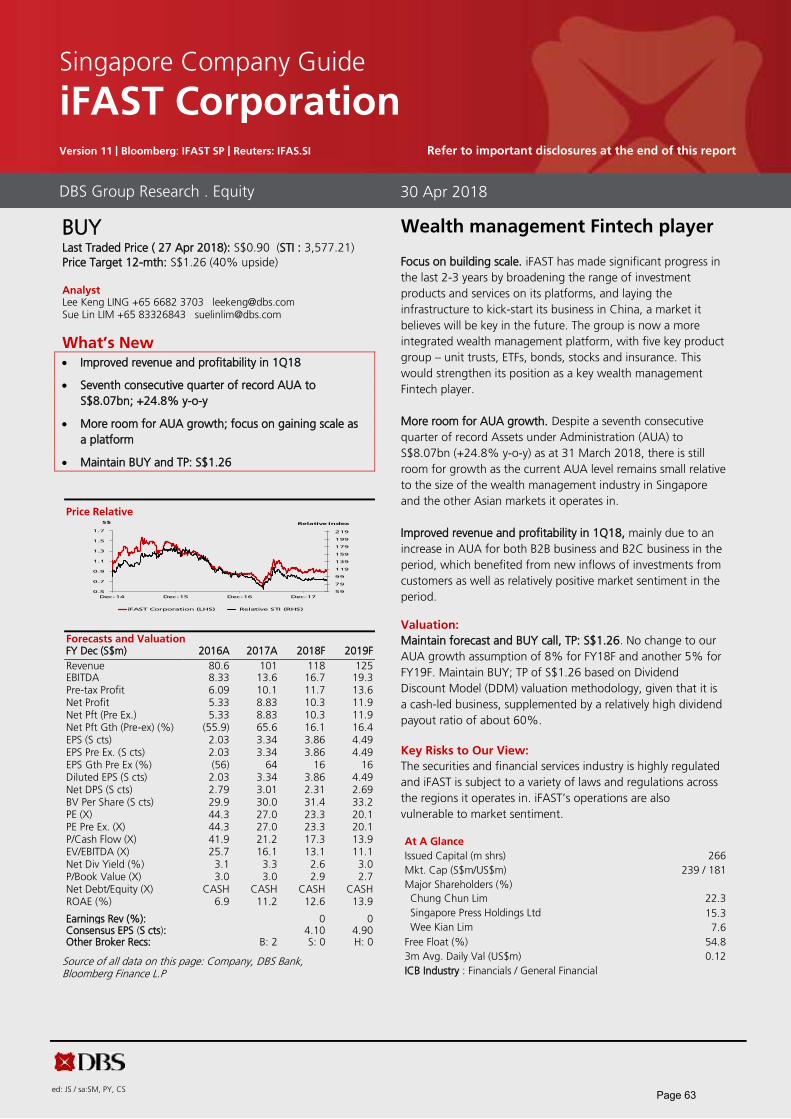
ed: JS / sa:SM, PY, CS
BUYLast Traded Price ( 27 Apr 2018): S$0.90 (STI : 3,577.21)
Price Target 12-mth: S$1.26 (40% upside)
Analyst Lee Keng LING +65 6682 3703 [email protected] Sue Lin LIM +65 83326843 [email protected]
What’s New • Improved revenue and profitability in 1Q18
• Seventh consecutive quarter of record AUA to
S$8.07bn; +24.8% y-o-y
• More room for AUA growth; focus on gaining scale as
a platform
• Maintain BUY and TP: S$1.26
Price Relative
Forecasts and Valuation FY Dec (S$m) 2016A 2017A 2018F 2019F
Revenue 80.6 101 118 125 EBITDA 8.33 13.6 16.7 19.3 Pre-tax Profit 6.09 10.1 11.7 13.6 Net Profit 5.33 8.83 10.3 11.9 Net Pft (Pre Ex.) 5.33 8.83 10.3 11.9 Net Pft Gth (Pre-ex) (%) (55.9) 65.6 16.1 16.4 EPS (S cts) 2.03 3.34 3.86 4.49 EPS Pre Ex. (S cts) 2.03 3.34 3.86 4.49 EPS Gth Pre Ex (%) (56) 64 16 16 Diluted EPS (S cts) 2.03 3.34 3.86 4.49 Net DPS (S cts) 2.79 3.01 2.31 2.69 BV Per Share (S cts) 29.9 30.0 31.4 33.2 PE (X) 44.3 27.0 23.3 20.1 PE Pre Ex. (X) 44.3 27.0 23.3 20.1 P/Cash Flow (X) 41.9 21.2 17.3 13.9 EV/EBITDA (X) 25.7 16.1 13.1 11.1 Net Div Yield (%) 3.1 3.3 2.6 3.0 P/Book Value (X) 3.0 3.0 2.9 2.7 Net Debt/Equity (X) CASH CASH CASH CASH ROAE (%) 6.9 11.2 12.6 13.9
Earnings Rev (%): 0 0 Consensus EPS (S cts): 4.10 4.90 Other Broker Recs: B: 2 S: 0 H: 0
Source of all data on this page: Company, DBS Bank, Bloomberg Finance L.P
Wealth management Fintech player
Focus on building scale. iFAST has made significant progress in
the last 2-3 years by broadening the range of investment
products and services on its platforms, and laying the
infrastructure to kick-start its business in China, a market it
believes will be key in the future. The group is now a more
integrated wealth management platform, with five key product
group – unit trusts, ETFs, bonds, stocks and insurance. This
would strengthen its position as a key wealth management
Fintech player.
More room for AUA growth. Despite a seventh consecutive
quarter of record Assets under Administration (AUA) to
S$8.07bn (+24.8% y-o-y) as at 31 March 2018, there is still
room for growth as the current AUA level remains small relative
to the size of the wealth management industry in Singapore
and the other Asian markets it operates in.
Improved revenue and profitability in 1Q18, mainly due to an
increase in AUA for both B2B business and B2C business in the
period, which benefited from new inflows of investments from
customers as well as relatively positive market sentiment in the
period.
Valuation:
Maintain forecast and BUY call, TP: S$1.26. No change to our
AUA growth assumption of 8% for FY18F and another 5% for
FY19F. Maintain BUY; TP of S$1.26 based on Dividend
Discount Model (DDM) valuation methodology, given that it is
a cash-led business, supplemented by a relatively high dividend
payout ratio of about 60%.
Key Risks to Our View:
The securities and financial services industry is highly regulated
and iFAST is subject to a variety of laws and regulations across
the regions it operates in. iFAST’s operations are also
vulnerable to market sentiment.
At A Glance
Issued Capital (m shrs) 266
Mkt. Cap (S$m/US$m) 239 / 181
Major Shareholders (%)
Chung Chun Lim 22.3
Singapore Press Holdings Ltd 15.3
Wee Kian Lim 7.6
Free Float (%) 54.8
3m Avg. Daily Val (US$m) 0.12
ICB Industry : Financials / General Financial
DBS Group Research . Equity 30 Apr 2018
Singapore Company Guide
iFAST Corporation Version 11 | Bloomberg: IFAST SP | Reuters: IFAS.SI Refer to important disclosures at the end of this report
59
79
99
119
139
159
179
199
219
0.5
0.7
0.9
1.1
1.3
1.5
1.7
Dec-14 Dec-15 Dec-16 Dec-17
Relative IndexS$
iFAST Corporation (LHS) Relative STI (RHS)
Page 63

Company Guide
iFAST Corporation
WHAT’S NEW
Record S$8.07bn AUA drove 53.6 % y-o-y increase in 1Q18 net profit
Improved revenue and profitability in 1Q18. 1Q18 results in
line. Both revenue and net profit in 1Q18 accounted for 26%
of our FY18F forecasts. On a y-o-y basis, revenue surged
40.1% to S$31.0m while net profit rose 53.6% to S$2.7m.
China is still loss-making. Excluding China, the group would
have registered net profit of S$3.9m. The improvement in
revenue and profitability was mainly due to an increase in
Assets under Administration (AUA) for both B2B business and
B2C business in the period, which benefited from new
inflows of investments from customers as well as relatively
positive market sentiment in the period. A higher first interim
dividend of 0.75Scts (vs 0.68Scts in 1Q17) for 1Q18 was
declared.
7th seventh consecutive quarter of record AUA. The group’s
AUA grew 24.8% y-o-y to reach a new record of $8.07bn as
at 31 March 2018, on its continuing efforts to widen the
range of investment products and services and strengthen the
financial technology (Fintech) capabilities of its platforms in
the various markets in recent years.
AUA geographical breakdown
1Q18 net revenue geographical breakdown
Net Revenue * AUA y-o-y S$m y-o-y chg growth (%)
Singapore 9.8 +21.5 +17.6 Hong Kong 3.4 +41.9 +32.6 Malaysia 1.1 +51.1 +44.3 China 0.17 +216.4 +561.2
TOTAL 14.4 +28.7
*Net revenue represents revenue earned by the group after commission
and fee paid or payable to third party financial advisers.
Singapore operation is still the major contributor to group
revenue. The net revenue from the Singapore operation was
up 21.5% y-o-y in 1Q18, mainly contributed by significant
increases in investment subscription amounts in unit trusts
(UTs), exchange-traded funds (ETFs) and stocks in the period.
Hong Kong operation continued its efforts to broaden the
range and depth of its investment products and services on its
platforms, with the launch of Fintech solutions division in
October 2017 and the launch of multi-products FSMOne
platform in November 2017 to include multiple products and
services such as UTs, bonds, stocks, ETFs and managed
portfolios (robo-advisory portfolios) via one account.
In Malaysia, the significant growth of UT business and AUA
contributed to an increase in net revenue of 51.1% y-o-y in
1Q18. The bond business and the robo-advisory portfolio
service launched in the second quarter of 2017 also
contributed to the increase in revenue in Malaysia, although
not significantly in the quarter.
China business still remains in the early stages of building the
iFAST brand among potential clients and investment
practitioners in China’s wealth management industry. For the
China onshore business, the China operation is working to
expand its network with existing B2B partners in the market.
For the China offshore business, it continues to help investors
in China invest internationally, especially through the group’s
presence in Hong Kong and Singapore.
More room for AUA growth; focus on gaining scale as a
platform. In the medium to long term, iFAST believes that
there is still a lot of room for growth in its AUA as the
amount remains small relative to the size of the wealth
management industry in Singapore and Asia. Going forward,
increasing focus will be channelled towards gaining scale as a
platform.
Maintain forecast and BUY call, TP: S$1.26. We maintain our
AUA growth assumption of 8% for FY18F and another 5%
for FY19F. The expected growth is on the back of the
broadening range and depth of investment products and
services. Maintain BUY, TP of S$1.26 based on Dividend
Discount Model (DDM) valuation methodology, given that it is
a cash-led business, supplemented by a relatively high
dividend payout ratio of about 60%.
Singapore,
66.5%
Hong Kong,
23.1%
Malaysia,
7.4%
Others, 3.0%
Singapore,
66.5%
Hong Kong,
23.1%
Malaysia,
7.4%
Others, 3.0%
Page 64

Company Guide
iFAST Corporation
Quarterly / Interim Income Statement (S$m)
FY Dec 1Q2017* 4Q2017 1Q2018 % chg yoy % chg qoq
Revenue 22.1 28.2 31.0 40.1 9.9
Cost of Goods Sold (10.9) (14.9) (16.6) 51.8 11.5
Gross Profit 11.2 13.3 14.4 28.7 8.1
Other Oper. (Exp)/Inc (9.0) (11.0) (11.6) 28.9 5.8
Operating Profit 2.17 2.35 2.78 28.1 18.7
Other Non Opg (Exp)/Inc 0.0 0.0 0.0 - -
Associates & JV Inc (0.1) 0.0 0.0 nm -
Net Interest (Exp)/Inc 0.20 0.20 0.23 12.8 15.1
Exceptional Gain/(Loss) 0.0 0.0 0.0 - -
Pre-tax Profit 2.04 2.53 2.99 46.4 18.2
Tax (0.3) (0.1) (0.3) 1.8 286.7
Minority Interest 0.0 0.0 0.0 - -
Net Profit 1.75 2.45 2.70 53.6 10.0
Net profit bef Except. 1.75 2.45 2.70 53.6 10.0
Margins (%)
Gross Margins 50.7 47.2 46.4
Opg Profit Margins 9.8 8.3 9.0
Net Profit Margins 7.9 8.7 8.7
*restated Source of all data: Company, DBS Bank
Page 65

Company Guide
iFAST Corporation
CRITICAL DATA POINTS TO WATCH
Critical Factors
Growth in AUA
AUA growth is the key driver to revenue. iFAST derives revenue
from Trailer Fees (paid by fund houses), Platform Fees (paid by
customers) and Wrap Fees (paid by advisor-assisted investors),
which are calculated at up to 0.9%, 0.5% and 0.2% per
annum of its average AUA respectively. AUA grew at a CAGR of
11.8% from FY11-17. We are expecting AUA to increase 8%
for FY18F and 5% for FY19F. As such, we are expecting
revenue growth of 16.5%/5.7% for FY18F/FY19F, on the back
of the broadening range and depth of investment products and
services.
Fruition of China operation
The China business was soft launched in March 2016 and has
been loss-making due to high operating expenses. As iFAST is
still in the early stages of building its brand among potential
clients and investment practitioners in China’s wealth
management industry, the outlook could be promising once
iFAST starts to reap the fruits of its labour in China.
Beneficiary of disruptive technology
iFAST’s business model offers 1) Integrated wealth management
platform, enabling investors to invest seamlessly in a variety of
investment products; 2) Internet-based model that is
unconstrained by a high-cost structure. iFAST is able to pass on
significant savings to consumers in the form of lower
commissions; and 3) Removal of contra-loss risk as its
stockbroking service works on a pre-funded basis. The launch of
FSMOne, which allows investment in multiple products
including bonds, unit trust, stocks and Exchange Traded Funds
(ETFs) via one account, further boosted its competitive edge,
and could be a threat to existing stockbrokers.
Scalability of business
iFAST’s scalable platform business model enables the group to
scale up without a proportionate increase in cost, once it
reaches a substantial scale. Recurring net revenue-to-AUA
exceeded operating expense-to-AUA in the last few years,
indicating that iFAST’s business has reached a substantial scale.
However, with its entry into China, we expect a reversal in
trend, at least in the next 1-2 years. Thereafter, recurring net
revenue-to-AUA should continue to exceed operating expense-
to-AUA. iFAST's business would be on a much stronger footing
once its China operation is up.
Average AUA (S$bn)
Business model
Recurring and non-recurring net revenue (S$m)
Net revenue and operating expenses as a ratio of average AUA
Source: Company, DBS Bank
5.646.1
7.588.19
8.6
0.0
1.2
2.5
3.7
5.0
6.2
7.4
8.7
2015A 2016A 2017A 2018F 2019F
Platform Fee
Upf ront Fee
Wrap Fee
Fund Houses
T railer Fee
iFASTB2B
B2B*
* financial
advisory companies
Platform Fee
Upfront Fee
B2C
4.36.9
12.8
28.825.3
15.9
21.825.2 26.3
31.6
36.7
41.5 40.7
49.5
58.962.3
0
10
20
30
40
50
60
70
2004 2005 2006 2007 2008 2009 2010 2011 2012 2013 2014 2015 2016 2017F2018F2019F
Recurring ne t revenue Non-recurring net revenue Net revenue (tota l)
S$m
0.00%
0.10%
0.20%
0.30%
0.40%
0.50%
0.60%
0.70%
0.80%
2011 2012 2013 2014 2015 2016 2017 2018F 2019F
Non-recurring net revenue/average AUA Opex/average AUA
Recurring net revenue/average AUA Net revenue/average AUA
Page 66

Company Guide
iFAST Corporation
Appendix 1: A look at Company's listed history – what drives its share price?
0.4
0.6
0.8
1.0
1.2
1.4
1.6
1.8
Listed on SGX mainboard on 11 Dec 2014 @ S$0.95
Add Bonds and ETFs to its platform
Acquisition of stockbroking firm in Hong Kong
Weak 1Q 2016 results - hit by negative market sentiment and high expenses
Another set of weak results (2Q 2016)
Launch of FSMOne, a single account for multiple products
Surge in 1Q 2017 results
Net earnings for FY 2016 down 56%
Admitted as member of SGX
Share price broke support; locked in a downtrend that lasted for one year Strong set
of 2Q17 results
FSMOne offers US stockbroking dervices
Page 67

Company Guide
iFAST Corporation
Balance Sheet:
Clean balance sheet. iFAST was debt-free as of December 2017, and
should remain in this position so long as the group does not engage
in any major M&A activities which require a certain amount of
gearing. Cash balance stood at S$30.9m as at December 2017. We
understand that iFAST continues to be on the lookout for M&A
opportunities to expand its business regionally. Cash flows from
operations are expected to remain healthy but this will be partly
offset by capex over FY18F-19F.
Share Price Drivers:
Obtaining operating leverage. Operating expense is high as the
group continues to push towards broadening the range and depth of
its products and services, especially in China. Operating expense-to-
AUA exceeds recurring net revenue-to-AUA now but we expect this
trend to reverse in the next 1-2 years.
Market dynamics. Any unfavourable factors or changes in the
economic, political and social conditions and/or the policies may
affect business. This could cause volatility in its revenues.
Inorganic growth is a wildcard. A clear route for inorganic growth is
via M&A. Potential targets would include wealth/fund management
houses that no longer wish to carry out direct distribution of their
own products as it usually involves cumbersome administrative work.
Key Risks:
Highly regulated industry. The securities and financial services
industry is highly regulated and iFAST is subject to a variety of laws
and regulations across the regions it operates in. Security breaches
are also a risk that could result in adverse publicity and damage to
reputation. iFAST’s operations are also vulnerable to market
sentiment.
Company Background
iFAST is an internet-based investment product distribution platform
which provides a comprehensive range of investment products and
services, to financial advisory firms, banks, financial institutions,
multinational companies, as well as retail and high-net-worth
investors in Asia. The group offers access to over 7,700 investment
products including funds, bonds and Singapore Government
Securities, stocks, Exchange Traded Funds (ETFs), as well as insurance
products, and services including robo-advisory portfolio management
services, research and investment seminars, financial technology
(fintech) solutions, and investment administration and transaction
services.
Leverage & Asset Turnover (x)
Capital Expenditure
ROE (%)
Forward PE Band (x)
PB Band (x)
Source: Company, DBS Bank
0.8
0.9
0.9
1.0
1.0
1.1
1.1
1.2
1.2
0.00
0.01
0.01
0.02
0.02
0.03
0.03
0.04
0.04
0.05
0.05
2015A 2016A 2017A 2018F 2019F
Gross Debt to Equity (LHS) Asset Turnover (RHS)
0.0
1.0
2.0
3.0
4.0
5.0
6.0
7.0
8.0
2015A 2016A 2017A 2018F 2019F
Capital Expenditure (-)
S$m
0.0%
2.0%
4.0%
6.0%
8.0%
10.0%
12.0%
14.0%
16.0%
2015A 2016A 2017A 2018F 2019F
Avg: 34.9x
+1sd: 48x
+2sd: 61x
-1sd: 21.9x
-2sd: 8.9x8.0
18.0
28.0
38.0
48.0
58.0
68.0
Dec-14 Dec-15 Dec-16 Dec-17
(x)
Avg: 3.75x
+1sd: 4.67x
+2sd: 5.59x
-1sd: 2.83x
-2sd: 1.91x1.7
2.2
2.7
3.2
3.7
4.2
4.7
5.2
5.7
6.2
Dec-14 Dec-15 Dec-16 Dec-17
(x)
Page 68

Company Guide
iFAST Corporation
Key Assumptions
FY Dec 2015A 2016A 2017A 2018F 2019F
Average AUA (S$bn) 5.64 6.10 7.58 8.19 8.60
Trailer fees (% of AUA) n.a. 0.59 0.59 0.59 0.59
Platform fees (% of AUA) n.a. 0.31 0.31 0.31 0.31
Wrap fees (% of AUA) n.a. 0.10 0.10 0.10 0.10
Segmental Breakdown
FY Dec 2015A 2016A 2017A 2018F 2019F
Net Revenues (S$m)
B2B business 28.6 28.4 34.0 41.3 43.6
B2C business 12.9 12.3 15.5 17.7 18.7
Total 41.5 41.5 41.5 41.5 41.5
Net Revenues (S$m) Recurring revenue 34.7 34.7 41.0 47.2 49.9
Non-recurring revenue 6.88 5.98 8.50 11.8 12.5
Total 41.5 41.5 41.5 41.5 41.5
Geographical breakdown (S$m) Geographical breakdown (S$m) Singapore 30.0 29.5 34.8 34.2 36.1
Hong Kong 9.6 8.7 10.8 19.5 20.6
Malaysia 1.9 2.3 3.5 3.5 3.7
China 0.0 0.2 0.4 1.8 1.9
Total 41.5 41.5 41.5 41.5 41.5
Income Statement (S$m)
FY Dec 2015A 2016A 2017A 2018F 2019F
Revenue 85.3 80.6 101 118 125
Cost of Goods Sold (43.8) (39.9) (51.7) (58.9) (62.3)
Gross Profit 41.5 40.7 49.5 58.9 62.3
Other Opng (Exp)/Inc (29.6) (35.3) (39.8) (47.0) (48.4)
Operating Profit 12.0 5.42 9.67 12.0 13.9
Other Non Opg (Exp)/Inc 0.0 0.0 0.0 0.0 0.0
Associates & JV Inc 0.0 (0.2) (0.3) (0.3) (0.3)
Net Interest (Exp)/Inc 0.80 0.84 0.74 0.05 0.05
Exceptional Gain/(Loss) 0.0 0.0 0.0 0.0 0.0
Pre-tax Profit 12.8 6.09 10.1 11.7 13.6
Tax (0.7) (0.8) (1.3) (1.5) (1.7)
Minority Interest 0.0 0.0 0.0 0.0 0.0
Preference Dividend 0.0 0.0 0.0 0.0 0.0
Net Profit 12.1 5.33 8.83 10.3 11.9
Net Profit before Except. 12.1 5.33 8.83 10.3 11.9
EBITDA 13.4 8.33 13.6 16.7 19.3
Growth
Revenue Gth (%) 8.9 (5.6) 25.5 16.5 5.7
EBITDA Gth (%) 36.9 (38.0) 63.2 22.6 15.5
Opg Profit Gth (%) 35.5 (54.8) 78.6 24.0 15.9
Net Profit Gth (Pre-ex) (%) 41.9 (55.9) 65.6 16.1 16.4
Margins & Ratio
Gross Margins (%) 48.7 50.5 48.9 50.0 50.0
Opg Profit Margin (%) 14.0 6.7 9.6 10.2 11.2
Net Profit Margin (%) 14.2 6.6 8.7 8.7 9.6
ROAE (%) 16.9 6.9 11.2 12.6 13.9
ROA (%) 14.0 5.7 9.0 9.8 10.7
ROCE (%) 17.9 7.9 12.0 12.6 13.9
Div Payout Ratio (%) 60.0 137.2 90.2 60.0 60.0
Net Interest Cover (x) NM NM NM NM NM
Source: Company, DBS Bank
Expect 8% growth in AUA for FY18F and 5% for FY19F
Dividend payout ratio
for FY17 of at least 60%
(excluding China
operation and
exceptional items), as
guided by
management. We have
assumed a sustainable
60% payout for
subsequent years
2017 earnings boosted by broadened investment products and services, besides benefitting from improved market sentiment
Page 69

Company Guide
iFAST Corporation
Quarterly / Interim Income Statement (S$m)
FY Dec 1Q2017 2Q2017 3Q2017 4Q2017 1Q2018
Revenue 22.1 24.7 26.2 28.2 31.0
Cost of Goods Sold (10.9) (12.7) (13.2) (14.9) (16.6)
Gross Profit 11.2 12.0 13.0 13.3 14.4
Other Oper. (Exp)/Inc (9.0) (9.4) (10.4) (11.0) (11.6)
Operating Profit 2.17 2.55 2.61 2.35 2.78
Other Non Opg (Exp)/Inc 0.0 0.0 0.0 0.0 0.0
Associates & JV Inc (0.1) (0.1) (0.1) 0.0 0.0
Net Interest (Exp)/Inc 0.20 0.16 0.18 0.20 0.23
Exceptional Gain/(Loss) 0.0 0.0 0.0 0.0 0.0
Pre-tax Profit 2.25 2.59 2.73 2.53 2.99
Tax (0.3) (0.4) (0.5) (0.1) (0.3)
Minority Interest 0.0 0.0 0.0 0.0 0.0
Net Profit 1.96 2.15 2.27 2.45 2.70
Net profit bef Except. 1.96 2.15 2.27 2.45 2.70
EBITDA 2.93 3.38 3.68 3.60 4.06
Growth
Revenue Gth (%) 2.6 11.6 6.4 7.4 9.9
EBITDA Gth (%) 39.2 15.4 8.6 (2.1) 12.8
Opg Profit Gth (%) 71.1 17.2 2.5 (10.1) 18.7
Net Profit Gth (Pre-ex) (%) 79.0 9.9 5.2 8.1 10.0
Margins
Gross Margins (%) 50.6 48.5 49.6 47.2 46.4
Opg Profit Margins (%) 9.8 10.3 9.9 8.3 9.0
Net Profit Margins (%) 8.9 8.7 8.6 8.7 8.7
Balance Sheet (S$m)
FY Dec 2015A 2016A 2017A 2018F 2019F
Net Fixed Assets 2.44 2.19 6.82 10.3 13.5
Invts in Associates & JVs 0.36 1.83 1.50 1.18 0.85
Other LT Assets 5.68 10.7 8.56 6.27 3.67
Cash & ST Invts 29.5 22.5 19.7 21.4 25.4
Inventory 32.0 32.1 32.1 32.1 32.1
Debtors 19.9 24.1 30.2 35.2 37.3
Other Current Assets 1.44 1.74 1.74 1.74 1.74
Total Assets 91.3 95.1 101 108 115
ST Debt 0.0 0.0 0.0 0.0 0.0
Creditor 13.8 15.5 19.5 22.7 24.0
Other Current Liab 0.65 0.51 1.26 1.46 1.70
LT Debt 0.0 0.0 0.0 0.0 0.0
Other LT Liabilities 0.24 0.50 0.50 0.50 0.50
Shareholder’s Equity 76.6 78.5 79.3 83.4 88.2
Minority Interests 0.0 0.15 0.15 0.15 0.15
Total Cap. & Liab. 91.3 95.1 101 108 115
Non-Cash Wkg. Capital 38.8 41.9 43.4 44.9 45.4
Net Cash/(Debt) 29.5 22.5 19.7 21.4 25.4
Debtors Turn (avg days) 82.8 99.6 98.0 101.4 106.1
Creditors Turn (avg days) 118.1 145.5 134.6 142.7 150.5
Inventory Turn (avg days) 232.8 317.5 247.0 217.4 207.0
Asset Turnover (x) 1.0 0.9 1.0 1.1 1.1
Current Ratio (x) 5.7 5.0 4.0 3.7 3.8
Quick Ratio (x) 3.4 2.9 2.4 2.3 2.4
Net Debt/Equity (X) CASH CASH CASH CASH CASH
Net Debt/Equity ex MI (X) CASH CASH CASH CASH CASH
Capex to Debt (%) N/A N/A N/A N/A N/A
Z-Score (X) 0.0 0.0 0.0 0.0 0.0
Source: Company, DBS Bank
Page 70

Company Guide
iFAST Corporation
Cash Flow Statement (S$m)
FY Dec 2015A 2016A 2017A 2018F 2019F
Pre-Tax Profit 12.8 6.09 10.1 11.7 13.6
Dep. & Amort. 1.48 3.07 4.24 4.99 5.67
Tax Paid (0.7) (0.5) (1.3) (1.5) (1.7)
Assoc. & JV Inc/(loss) 0.02 0.16 0.33 0.33 0.33
Chg in Wkg.Cap. (11.4) (3.0) (2.2) (1.8) (0.7)
Other Operating CF 11.9 (0.2) 0.0 0.0 0.0
Net Operating CF 14.2 5.63 11.2 13.8 17.2
Capital Exp.(net) (5.5) (6.7) (6.0) (6.0) (6.0)
Other Invts.(net) 0.0 2.54 0.0 0.0 0.0
Invts in Assoc. & JV 0.0 (2.7) 0.0 0.0 0.0
Div from Assoc & JV 0.0 0.0 0.0 0.0 0.0
Other Investing CF 0.0 0.06 0.0 0.0 0.0
Net Investing CF (5.5) (6.8) (6.0) (6.0) (6.0)
Div Paid (7.1) (7.3) (8.0) (6.2) (7.2)
Chg in Gross Debt 0.0 0.0 0.0 0.0 0.0
Capital Issues 2.97 2.41 0.0 0.0 0.0
Other Financing CF 0.0 (0.9) 0.0 0.0 0.0
Net Financing CF (4.1) (5.8) (8.0) (6.2) (7.2)
Currency Adjustments (0.1) 0.0 0.0 0.0 0.0
Chg in Cash 4.54 (7.1) (2.8) 1.64 4.05
Opg CFPS (S cts) 9.79 3.29 5.06 5.86 6.74
Free CFPS (S cts) 3.34 (0.4) 1.97 2.93 4.22
Source: Company, DBS Bank
Target Price & Ratings History
Source: DBS Bank
Analyst: Lee Keng LING
Sue Lin LIM
S.No.Date of
Report
Closing
Price
12-mth
Target
Price
Rat ing
1: 28 Apr 17 0.72 0.94 BUY
2: 31 Jul 17 1.07 1.26 BUY
3: 30 Oct 17 0.99 1.26 BUY
4: 15 Feb 18 0.91 1.26 BUY
Note : Share price and Target price are adjusted for corporate actions.
1
2
3
4
0.57
0.67
0.77
0.87
0.97
1.07
1.17
Apr-17 Jun-17 Aug-17 Oct-17 Dec-17 Feb-18 Apr-18
S$
Page 71

Company Guide
iFAST Corporation
DBS Bank recommendations are based an Absolute Total Return* Rating system, defined as follows:
STRONG BUY (>20% total return over the next 3 months, with identifiable share price catalysts within this time frame)
BUY (>15% total return over the next 12 months for small caps, >10% for large caps)
HOLD (-10% to +15% total return over the next 12 months for small caps, -10% to +10% for large caps)
FULLY VALUED (negative total return i.e. > -10% over the next 12 months)
SELL (negative total return of > -20% over the next 3 months, with identifiable catalysts within this time frame)
Share price appreciation + dividends
Completed Date: 30 Apr 2018 08:28:19 (SGT) Dissemination Date: 30 Apr 2018 09:21:51 (SGT)
Sources for all charts and tables are DBS Bank unless otherwise specified.
GENERAL DISCLOSURE/DISCLAIMER
This report is prepared by DBS Bank Ltd. This report is solely intended for the clients of DBS Bank Ltd, its respective connected and associated
corporations and affiliates only and no part of this document may be (i) copied, photocopied or duplicated in any form or by any means or (ii)
redistributed without the prior written consent of DBS Bank Ltd.
The research set out in this report is based on information obtained from sources believed to be reliable, but we (which collectively refers to DBS
Bank Ltd, its respective connected and associated corporations, affiliates and their respective directors, officers, employees and agents (collectively,
the “DBS Group”) have not conducted due diligence on any of the companies, verified any information or sources or taken into account any other
factors which we may consider to be relevant or appropriate in preparing the research. Accordingly, we do not make any representation or
warranty as to the accuracy, completeness or correctness of the research set out in this report. Opinions expressed are subject to change without
notice. This research is prepared for general circulation. Any recommendation contained in this document does not have regard to the specific
investment objectives, financial situation and the particular needs of any specific addressee. This document is for the information of addressees
only and is not to be taken in substitution for the exercise of judgement by addressees, who should obtain separate independent legal or financial
advice. The DBS Group accepts no liability whatsoever for any direct, indirect and/or consequential loss (including any claims for loss of profit)
arising from any use of and/or reliance upon this document and/or further communication given in relation to this document. This document is not
to be construed as an offer or a solicitation of an offer to buy or sell any securities. The DBS Group, along with its affiliates and/or persons
associated with any of them may from time to time have interests in the securities mentioned in this document. The DBS Group, may have
positions in, and may effect transactions in securities mentioned herein and may also perform or seek to perform broking, investment banking and
other banking services for these companies.
Any valuations, opinions, estimates, forecasts, ratings or risk assessments herein constitutes a judgment as of the date of this report, and there can
be no assurance that future results or events will be consistent with any such valuations, opinions, estimates, forecasts, ratings or risk assessments.
The information in this document is subject to change without notice, its accuracy is not guaranteed, it may be incomplete or condensed, it may
not contain all material information concerning the company (or companies) referred to in this report and the DBS Group is under no obligation to
update the information in this report.
This publication has not been reviewed or authorized by any regulatory authority in Singapore, Hong Kong or elsewhere. There is no planned
schedule or frequency for updating research publication relating to any issuer.
The valuations, opinions, estimates, forecasts, ratings or risk assessments described in this report were based upon a number of estimates and
assumptions and are inherently subject to significant uncertainties and contingencies. It can be expected that one or more of the estimates on
which the valuations, opinions, estimates, forecasts, ratings or risk assessments were based will not materialize or will vary significantly from actual
results. Therefore, the inclusion of the valuations, opinions, estimates, forecasts, ratings or risk assessments described herein IS NOT TO BE RELIED
UPON as a representation and/or warranty by the DBS Group (and/or any persons associated with the aforesaid entities), that:
(a) such valuations, opinions, estimates, forecasts, ratings or risk assessments or their underlying assumptions will be achieved, and
(b) there is any assurance that future results or events will be consistent with any such valuations, opinions, estimates, forecasts, ratings or risk
assessments stated therein.
Please contact the primary analyst for valuation methodologies and assumptions associated with the covered companies or price targets.
Any assumptions made in this report that refers to commodities, are for the purposes of making forecasts for the company (or companies)
mentioned herein. They are not to be construed as recommendations to trade in the physical commodity or in the futures contract relating to the
commodity referred to in this report.
Page 72
Company Guide
iFAST Corporation
DBSVUSA, a US-registered broker-dealer, does not have its own investment banking or research department, has not participated in any public
offering of securities as a manager or co-manager or in any other investment banking transaction in the past twelve months and does not engage
in market-making.
ANALYST CERTIFICATION
The research analyst(s) primarily responsible for the content of this research report, in part or in whole, certifies that the views about the
companies and their securities expressed in this report accurately reflect his/her personal views. The analyst(s) also certifies that no part of his/her
compensation was, is, or will be, directly or indirectly, related to specific recommendations or views expressed in the report. The research analyst (s)
primarily responsible for the content of this research report, in part or in whole, certifies that he or his associate1 does not serve as an officer of the
issuer or the new listing applicant (which includes in the case of a real estate investment trust, an officer of the management company of the real
estate investment trust; and in the case of any other entity, an officer or its equivalent counterparty of the entity who is responsible for the
management of the issuer or the new listing applicant) and the research analyst(s) primarily responsible for the content of this research report or
his associate does not have financial interests2 in relation to an issuer or a new listing applicant that the analyst reviews. DBS Group has
procedures in place to eliminate, avoid and manage any potential conflicts of interests that may arise in connection with the production of
research reports. The research analyst(s) responsible for this report operates as part of a separate and independent team to the investment
banking function of the DBS Group and procedures are in place to ensure that confidential information held by either the research or investment
banking function is handled appropriately. There is no direct link of DBS Group's compensation to any specific investment banking function of the
DBS Group.
COMPANY-SPECIFIC / REGULATORY DISCLOSURES
1. DBS Bank Ltd, DBS HK, DBS Vickers Securities (Singapore) Pte Ltd (''DBSVS''), DBSV HK or their subsidiaries and/or other affiliates do not
have a proprietary position in the securities recommended in this report as of 30 Mar 2018.
2. Neither DBS Bank Ltd, DBS HK nor DBSV HK market makes in equity securities of the issuer(s) or company(ies) mentioned in this Research
Report.
Compensation for investment banking services:
3. DBSVUSA does not have its own investment banking or research department, nor has it participated in any public offering of securities as a
manager or co-manager or in any other investment banking transaction in the past twelve months. Any US persons wishing to obtain further
information, including any clarification on disclosures in this disclaimer, or to effect a transaction in any security discussed in this document
should contact DBSVUSA exclusively.
Disclosure of previous investment recommendation produced:
4. DBS Bank Ltd, DBS Vickers Securities (Singapore) Pte Ltd (''DBSVS''), their subsidiaries and/or other affiliates may have published other
investment recommendations in respect of the same securities / instruments recommended in this research report during the preceding 12
months. Please contact the primary analyst listed in the first page of this report to view previous investment recommendations published by
DBS Bank Ltd, DBS Vickers Securities (Singapore) Pte Ltd (''DBSVS''), their subsidiaries and/or other affiliates in the preceding 12 months.
1 An associate is defined as (i) the spouse, or any minor child (natural or adopted) or minor step-child, of the analyst; (ii) the trustee of a trust of which the analyst, his spouse, minor child (natural or adopted) or minor step-child, is a beneficiary or discretionary object; or (iii) another person accustomed or obliged to act in accordance with the directions or instructions of the analyst.
2 Financial interest is defined as interests that are commonly known financial interest, such as investment in the securities in respect of an issuer or a new listing applicant, or financial accommodation arrangement between the issuer or the new listing applicant and the firm or analysis. This term does not include commercial lending conducted at arm's length, or investments in any collective investment scheme other than an issuer or new listing applicant notwithstanding the fact that the scheme has investments in securities in respect of an issuer or a new listing applicant.
Page 73

ed: JS / sa: SM, PY, CS
BUYLast Traded Price ( 24 Apr 2018): S$1.60 (STI : 3,584.56)
Price Target 12-mth: S$1.80 (13% upside and 5.8% yield)
(Prev S$1.75)
Analyst Mervin SONG, CFA +65 6682 3715 [email protected] Derek TAN +65 6682 3716 [email protected]
What’s New • 4Q18 DPU of 2.27 Scts above expectations
• VivoCity and MBC I continue to provide steady growth
with 4Q18 NPI for both assets rising 2% y-o-y
• Completion of AEIs, inbuilt rental escalations at MBC I
and additional bonus GFA for VivoCity to drive DPU
forward
Price Relative
Forecasts and Valuation FY Mar (S$m) 2017A 2018A 2019F 2020F
Gross Revenue 378 434 442 455 Net Property Inc 292 339 346 357 Total Return 211 568 248 255 Distribution Inc 227 260 266 273 EPU (S cts) 7.33 8.45 8.58 8.80 EPU Gth (%) (2) 15 2 3 DPU (S cts) 8.62 9.04 9.21 9.44 DPU Gth (%) 6 5 2 3 NAV per shr (S cts) 138 149 148 148 PE (X) 21.8 18.9 18.7 18.2 Distribution Yield (%) 5.4 5.7 5.8 5.9 P/NAV (x) 1.2 1.1 1.1 1.1 Aggregate Leverage (%) 36.4 34.6 34.7 34.9 ROAE (%) 6.3 5.9 5.8 6.0
DPU Chng (%): 5 4 Consensus DPU (S cts): 9.00 9.10 Other Broker Recs: B: 7 S: 1 H: 8
Source of all data on this page: Company, DBS Bank, Bloomberg Finance L.P
Still a winner
Confounding the critics. We maintain our BUY call on
Mapletree Commercial Trust (MCT) with a revised TP of S$1.80.
MCT’s detractors believe MCT is due for a derating given the
threat from e-commerce affecting earnings at its key asset
VivoCity. However, this ignores the capability of management
to undertake asset enhancement initiatives (AEIs) to partially
future proof the mall against competition from other malls and
the online space. Evidence of this value-add is 10-29% ROI that
will be achieved from recent/upcoming refurbishments as well
as the bonus 24,000 sqft of GFA MCT has obtained by adding a
library to the mall. We believe these proactive decisions will
underpin the 2% DPU CAGR over the coming two years.
Where we differ: Best in class. Consensus is in agreement that
MCT owns best in class retail/business park assets. However,
consensus’ TP of c.S$1.66 implies a P/Bk of 1.1x which we
believe is too low considering VivoCity is only valued at a cap
rate of 4.75%, higher than recent transactions at 2.6-4.2% for
arguably less dominant malls. We believe as MCT demonstrates
its ability to deliver consistent DPU growth, highlighting the
quality of its assets, the market will reward MCT with a P/Bk of
around 1.2x as implied by our TP of S$1.80.
Improving office and retail market. While investors near term
may be distracted by the rise in interest rates, we believe
improving Singapore office rents and retail sentiment/sales
should allay fears that MCT does not have levers to counter the
impact of higher interest rates. As investors acknowledge this
fact, we believe MCT’s share price can outperform.
Valuation:
On the back of better than expected 4Q18 results, we raised
our DCF-based TP to S$1.80 from S$1.75.
Key Risks to Our View:
A key risk to our positive view is a slowdown in retail sales
affecting VivoCity’s ability to increase rents and slower than
expected pick up in office/business park rents.
At A Glance Issued Capital (m shrs) 2,880
Mkt. Cap (S$m/US$m) 4,608 / 3,485
Major Shareholders (%)
Temasek Holdings Private Ltd 33.7
Schroders Plc 9.0
AIA Group Ltd 4.9
Free Float (%) 52.4
3m Avg. Daily Val (US$m) 7.5
ICB Industry : Financials / Real Estate Investment Trust
DBS Group Research . Equity 25 Apr 2018
Singapore Company Guide
Mapletree Commercial Trust Version 10 | Bloomberg: MCT SP | Reuters: MACT.SI Refer to important disclosures at the end of this report
89
109
129
149
169
189
209
1.1
1.2
1.3
1.4
1.5
1.6
1.7
1.8
1.9
Apr-14 Apr-15 Apr-16 Apr-17 Apr-18
Relative IndexS$
Mapletree Commercial Trust (LHS) Relative STI (RHS)
Page 74

Company Guide
Mapletree Commercial Trust
WHAT’S NEW
Surprises on the upside
(+) 4Q18 results exceed expectations
• MCT reported 4Q18 DPU of 2.27 Scts which was up
0.4% y-o-y. However, on a full year basis, DPU came
in at 9.04 Scts (+5% y-o-y) which exceeded our
estimate of 8.78 Scts.
• The outperformance was largely due to the fact we
had overestimated MCT’s overheads and units on
issue.
(+/-) Steady uplift in revenue and NPI
• Underlying 4Q18 revenue and NPI was largely in line,
rising by 1% y-o-y. The modest y-o-y growth was due
to the drag from PSA Building and Mapletree Anson
which reported 6% and 2% y-o-y declines in NPI. Both
buildings were impacted by higher vacancies with
occupancy at PSA Building dipping to 96.1% versus
98.3% in 4Q17 while Mapletree Anson saw
occupancies fall to 86.6% from 100% in 4Q17.
Nevertheless, the outlook for PSA Building and
Mapletree Anson remains bright with committed
occupancies at the 98.7% and 100% level
respectively.
• Meanwhile, NPI for MCT’s two key assets, VivoCity
and MBC I, both rose 2% y-o-y. VivoCity continues to
benefit from prior positive rental reversions. However,
we understand the property’s NPI could have been
higher if not for the disruption caused by the AEI
currently undertaken and some incoming tenants’ fit
out period. For MBC I, earnings remain underpinned
by the c.3% average annual rental escalations for the
majority of its leases.
• VivoCity’s committed occupancy was healthy at
99.8%. However, actual occupancy only came in at
93.1% which is mainly due to MCT now including the
extra 24,000 bonus GFA it received for adding a library
to the mall. MBC I is close to fully occupancy (99.4%
versus 99% in 4Q17).
• Bank of America Merrill Lynch HarbourFront (MLHF)
had a strong quarter, with 4Q18 NPI jumping 16% y-
o-y. This improvement is largely due to tenants
physically moving in with occupancy now at 100%
versus 79.2% in 4Q17, when a major tenant gave
back some space.
• Overall committed portfolio occupancy is at a healthy
99.5% which bodes well to future earnings, given
actual occupancy only stands at 96.1% at end 4Q18.
(+/-) Headline negative rental reversions belies the underlying
resilience
• During 4Q18, MCT delivered modest rental reversions
at VivoCity, with changes in fixed rents for the full year
higher by 1.5%, down from 2.3% for the first nine
months of FY18.
• For the office/business park segment, 8.7% negative
rental reversions were recorded for FY18 with the
office portfolio excluding MBC I being down 4.2%.
MBC itself would have recorded -11.4% rental
reversion for FY18. However, including the
replacement tenant for a pre-terminated lease, MBC
would have delivered positive 0.7% increase in rents,
with overall portfolio rental reversions swinging from -
2.1% to +0.6%.
• Furthermore, we note the negative rental reversions at
MBC I should not be a major concern given this only
represents a relatively small part of the overall portfolio
and a larger proportion of MBC’s earnings would
continue to benefit from the inbuilt annual rental
escalations.
• Heading into FY19, we understand 12.6% and 6% of
leases by gross rental income which are related to the
retail and office component respectively are due to
expire. Given VivoCity’s strong track record, we expect
majority of the leases to be renewed with potential
upside to rents for the office segment given the
upturn in office rents.
(-) Soft foot traffic and tenant sales
• 4Q18 foot traffic fell 2.2% y-o-y with the number of
visitors dipped 1.4% y-o-y to 55m for the whole of
FY18 due to the reduced number of events as VivoCity
in the prior year had events coinciding with its 10-year
anniversary.
• Tenant sales for FY18 rose 0.7% y-o-y, commendable
considering the soft retail backdrop. However, tenant
sales for the quarter ended on a weak note, falling
0.9% y-o-y in 4Q18 due to the disruptions in the mall
from AEIs and tenant fit outs.
• Occupancy costs was steady at around 20%.
(+) Compression in cap rates
• MCT reported a 5% increase in property values largely
due to the compression of cap rates across the
portfolio.
• VivoCity’s cap rate now stands at 4.75%, down from
5.15% previously. For MBC I, the office and business
park components are valued using 4.10% and 5.35%
Page 75

Company Guide
Mapletree Commercial Trust
cap rate, compared to 4.25% and 5.50% at end 31
March 2017.
• MCT’s other office properties saw 15-25 bps
compression in cap rates.
• On the back of higher property values, gearing fell to
34.5% from 36.3% at end December 2017 while net
asset value per unit rose to S$1.49 from S$1.38 at end
4Q17.
• Average all in cost of debt was steady at 2.75%
although up from 2.66% a year earlier.
• Approximately 79% of MCT’s debt are on fixed rates.
(+) Full benefits from high committed occupancies yet to flow
through with added boost from AEI’s at VivoCity
• Over the coming two years, we expect MCT to deliver
2% per annum growth in DPU.
• The steady increase in DPU ahead is underpinned by
the high 99.5% committed occupancy compared to
actual occupancy of 96.1% currently.
• Furthermore, we expect VivoCity to benefit from the
recently completed AEI which converted 9,200 sqft of
lower to higher yielding space on levels 1 and 2. ROI
on this AEI on a stabilised basis is 29%. This is on top
of the ongoing AEI which entails the addition of a
public library on level 3. We expect this to further
drive foot traffic to the mall. Finally, MCT is in the
process of extending Basement 1 by adding over
24,000 sqft of contiguous retail space which should
deliver a ROI of around 10%. This additional GFA was
given the Singapore authorities in conjunction with
VivoCity providing a public library at the mall.
(+) Raising DPU estimates by 3-5%
• On the back of better than expected 4Q18 results, we
raised our FY19-21F DPU by 3-5%.
• This also lifted our DCF-based TP to S$1.80 from
S$1.75.
Maintain BUY with revised TP of S$1.80
• Owing to more than 18% expected return over the
coming 12 months, we maintain our BUY call with a
revised TP of S$1.80.
• MCT remains one of our core long term S-REITs picks
given its ability to deliver steady growth in DPU as it
holds two best in class properties, VivoCity and MBC I.
Quarterly / Interim Income Statement (S$m)
FY Mar 4Q2017 3Q2018 4Q2018 % chg yoy % chg qoq
Gross revenue 108 110 109 1.3 (0.7)
Property expenses (24.3) (23.7) (24.6) 1.3 3.7
Net Property Income 83.3 86.0 84.3 1.2 (1.9)
Other Operating expenses (7.8) (8.0) (7.9) 1.8 (0.9)
Other Non Opg (Exp)/Inc (1.0) (0.6) 0.30 nm nm
Net Interest (Exp)/Inc (15.4) (16.3) (16.2) 5.3 (0.5)
Exceptional Gain/(Loss) 0.0 0.0 0.0 - -
Net Income 59.1 61.1 60.5 2.3 (1.0)
Tax 0.0 0.0 0.0 - -
Minority Interest 0.0 0.0 0.0 - -
Net Income after Tax 59.1 61.1 60.5 2.3 (1.0)
Total Return 194 61.1 385 97.8 529.8
Non-tax deductible Items (130) 5.38 (319) 145.5 nm
Net Inc available for Dist. 64.6 66.5 65.8 2.0 (0.9)
Ratio (%)
Net Prop Inc Margin 77.4 78.4 77.4
Dist. Payout Ratio 100.0 100.0 100.0
Source of all data: Company, DBS Bank
Page 76

Company Guide
Mapletree Commercial Trust
CRITICAL DATA POINTS TO WATCH
Critical Factors
VivoCity one of the top performing malls in Singapore. VivoCity
which contributes around 45% of MCT’s NPI is one of the top
performing malls in Singapore owing to its unique attribute of
being the only major mall in the southern half of Singapore, a
gateway to Sentosa Island, and having excellent connectivity via
highways and the subway. With around 55m visitors each year
and consistent delivery of tenant sales growth, Vivocity is one of
the go-to malls for prospective retailers. Having just passed its
10-year anniversary, the mall has matured and is no longer
delivering double digit earnings growth. However, we believe
MCT’s plans to “future and ecommerce proof” via the addition
of services, entertainment and lifestyle options and continue
tenant remixing should result in VivoCity delivering low single
digit rental reversions. Over the coming 12-24 months, the mall
should also benefit from the opening of the library which
should drive foot traffic, addition of over 24,000 sqft of GFA
and higher rents post the completion of various AEIs.
MBC I another crown jewel with inbuilt step-ups. Another key
asset for MCT is MBC I, a best in class office/business park
property which is only 10-15 minutes drive from Singapore’s
CBD. MBC I contributes c.30% to MCT’s NPI. An attractive
feature of the property is the fact that the majority of the leases
have annual rental escalations of around 3%. This provides the
REIT with an inbuilt organic earnings growth profile.
Furthermore, due to its choice location, nearby amenities and
the property offering discounted rents with Grade A office
specifications, we believe MBC I will remain a top choice for
prospective tenants seeking a decentralised location. This
ensures that occupancy for the property will remain high and
provides earnings resiliency to the REIT.
Recovery in spot office rents. Spot office rents have increased
8% from the lows in 1H17, reaching S$9.70 psf/mth at the end
of 1Q18, according to CBRE estimates. The increase is faster
than expected and if the pace continues, it is likely to exceed
our estimate of S$10.00 psf/mth by end 2018. Given over 50%
of MCT’s earnings are derived from its office/business park
properties, we believe MCT is well placed to benefit from the
expected multi-year upturn in office rents as new supply is
expected to be muted over the coming 3-4 years.
Potential acquisitions from the Sponsor. In the medium term,
there is potential for MCT to expand its portfolio by leveraging
on its Sponsor Mapletree Group. In particular, its Sponsor has
extended the first right of refusal over several properties
including MBC 2 and HarbourFront. Should MCT acquire these
properties and subject to the price paid, we believe MCT’s share
price will be re-rated given the enhancement to the quality of
the REIT’s portfolio and improved trading liquidity as any
acquisition will likely coincide with an equity raising.
Net Property Income and Margins (%)
Net Property Income and Margins (%)
Distribution Paid / Net Operating CF
Interest Cover (x)
Source: Company, DBS Bank
72.9%
74.9%
76.9%
78.9%
80.9%
82.9%
84.9%
0
50
100
150
200
250
300
350
400
2016A 2017A 2018A 2019F 2020F
S$ m
Net Property Income Net Property Income Margin %
73%
74%
75%
76%
77%
78%
79%
52
57
62
67
72
77
82
87
3Q20
16
4Q20
16
1Q20
17
2Q20
17
3Q20
17
4Q20
17
1Q20
18
2Q20
18
3Q20
18
4Q20
18
Net Property Income Net Property Income Margin %
0.3
0.4
0.5
0.6
0.7
0.8
0.9
1.0
2016A 2017A 2018A 2019F 2020F
(x)
4.65
4.70
4.75
4.80
4.85
4.90
4.95
5.00
5.05
5.10
2016A 2017A 2018A 2019F 2020F
(x)
Page 77

Company Guide
Mapletree Commercial Trust
Balance Sheet:
Gearing between 34-35% level. Following the recent uplift in
property valuations, MCT’s gearing has now settled at 34.5% as
at end 31 March 2018. This is within management’s
comfortable range of below 40% and the 45% regulatory cap.
Share Price Drivers:
Continued delivery of steady DPU growth. The market has been
concerned about MCT delivering consistent and steady DPU
ahead given the maturing of VivoCity and headwinds in the
retail sector such as ecommerce and large retail supply growth.
While acknowledging that VivoCity is unlikely to deliver double
digit increases in earnings, we believe MCT’s recent AEI and
addition of a library and resultant bonus 24,000 sqft of GFA
should not only build a moat around its current earnings but
drive foot traffic/tenant sales resulting in higher rents ahead.
Furthermore, the timely acquisition of MBC 1 in 2016, has not
only reduced VivoCity’s NPI contribution from around 65% to
45% but more importantly provided increased exposure to the
recoverying office/business park market. Thus, we believe MCT’s
best days are still ahead, and with steady DPU delivery, should
result in a re-rating.
Pure play Singapore REIT. With other large cap REITs potentially
expanding outside Singapore, MCT which is expected to remain
focused solely in Singapore for the foreseeable future. This may
attract investors who have a preference for S-REITs with 100%
exposure to Singapore.
Key Risks:
Weaker operational performance from VivoCity. The mall is
gradually phasing into a mature stage, with potential
slowdown in growth ahead. The timely acquisition of MBC I,
still a segment in high demand, plus management’s
continuous efforts to revamp VivoCity’s offerings, should
mitigate the slowdown at the portfolio level.
Competition from other landlords. While office rents/business
park rents are on an uptrend and MCT’s office and
business/park portoflio are close to fully occupied, there
remains competition from other buildings for MCT’s tenants.
Interest rate risk. Any increase in interest rates will result in
higher interest payments that the REIT has to make annually to
service its loans. Nevertheless, the risk is partially mitigated by
the fact that c.79% of MCT’s debts are on fixed rates.
Company Background
Mapletree Commercial Trust (MCT) is a real estate investment
trust that invests in income-producing office, business parks
and retail properties in Singapore. The majority of its earnings
are derived from VivoCity, one of the largest retail mall in
Singapore. In addition, the REIT has four other office and
business park properties including Mapletree Business City a
premier decentralised office/business park.
Aggregate Leverage (%)
ROE (%)
Distribution Yield (%)
PB Band (x)
Source: Company, DBS Bank
10.0%
15.0%
20.0%
25.0%
30.0%
35.0%
2016A 2017A 2018A 2019F 2020F
0.0%
1.0%
2.0%
3.0%
4.0%
5.0%
6.0%
2016A 2017A 2018A 2019F 2020F
Avg: 5.7%
+1sd: 6%
+2sd: 6.3%
-1sd: 5.4%
-2sd: 5.1%
4.3
4.8
5.3
5.8
6.3
6.8
2014 2015 2016 2017 2018
(%)
Avg: 1.09x
+1sd: 1.16x
+2sd: 1.23x
-1sd: 1.01x
-2sd: 0.94x
0.8
0.9
1.0
1.1
1.2
1.3
1.4
1.5
Apr-14 Apr-15 Apr-16 Apr-17 Apr-18
(x)
Page 78

Company Guide
Mapletree Commercial Trust
Income Statement (S$m)
FY Mar 2016A 2017A 2018A 2019F 2020F
Gross revenue 288 378 434 442 455
Property expenses (67.1) (85.4) (94.7) (95.5) (98.4)
Net Property Income 221 292 339 346 357
Other Operating expenses (21.6) (27.7) (31.6) (34.0) (34.3)
Other Non Opg (Exp)/Inc (4.7) (4.5) 1.62 0.0 0.0
Net Interest (Exp)/Inc (39.3) (53.7) (63.9) (64.4) (67.3)
Exceptional Gain/(Loss) 3.63 4.21 (1.6) 0.0 0.0
Net Income 159 211 243 248 255
Tax 0.0 0.0 0.0 0.0 0.0
Minority Interest 0.0 0.0 0.0 0.0 0.0
Preference Dividend 0.0 0.0 0.0 0.0 0.0
Net Income After Tax 159 211 243 248 255
Total Return 299 211 568 248 255
Non-tax deductible Items (126) (119) (307) 17.9 18.2
Net Inc available for Dist. 173 227 260 266 273
Growth & Ratio
Revenue Gth (%) 1.9 31.3 14.8 1.9 3.0
N Property Inc Gth (%) 4.3 32.4 15.9 2.2 3.0
Net Inc Gth (%) 1.9 32.6 15.6 1.9 3.0
Dist. Payout Ratio (%) 100.0 100.0 100.0 100.0 100.0
Net Prop Inc Margins (%) 76.7 77.4 78.2 78.4 78.4
Net Income Margins (%) 55.2 55.7 56.1 56.1 56.1
Dist to revenue (%) 59.9 60.2 60.1 60.2 60.1
Managers & Trustee’s fees to sales %)
7.5 7.3 7.3 7.7 7.5
ROAE (%) 5.9 6.3 5.9 5.8 6.0
ROA (%) 3.7 3.9 3.7 3.7 3.8
ROCE (%) 4.7 4.9 4.7 4.7 4.8
Int. Cover (x) 5.1 4.9 4.8 4.8 4.8
Source: Company, DBS Bank
Increase in earnings due to improved occupancies, additional GFA at VivoCity, recovery of the Singapore office market.
Page 79

Company Guide
Mapletree Commercial Trust
Quarterly / Interim Income Statement (S$m)
FY Mar 4Q2017 1Q2018 2Q2018 3Q2018 4Q2018
Gross revenue 108 108 107 110 109
Property expenses (24.3) (23.6) (22.8) (23.7) (24.6)
Net Property Income 83.3 84.2 84.4 86.0 84.3
Other Operating expenses (7.8) (7.9) (7.9) (8.0) (7.9)
Other Non Opg (Exp)/Inc (1.0) (0.6) 0.95 (0.6) 0.30
Net Interest (Exp)/Inc (15.4) (15.5) (15.9) (16.3) (16.2)
Exceptional Gain/(Loss) 0.0 0.0 0.0 0.0 0.0
Net Income 59.1 60.3 61.6 61.1 60.5
Tax 0.0 0.0 0.0 0.0 0.0
Minority Interest 0.0 0.0 0.0 0.0 0.0
Net Income after Tax 59.1 60.3 61.6 61.1 60.5
Total Return 194 60.3 61.6 61.1 385
Non-tax deductible Items (130) 4.11 3.13 5.38 (319)
Net Inc available for Dist. 64.6 64.4 64.7 66.5 65.8
Growth & Ratio
Revenue Gth (%) (1) 0 (1) 2 (1)
N Property Inc Gth (%) (1) 1 0 2 (2)
Net Inc Gth (%) (4) 2 2 (1) (1)
Net Prop Inc Margin (%) 77.4 78.1 78.7 78.4 77.4
Dist. Payout Ratio (%) 100.0 100.0 100.0 100.0 100.0
Balance Sheet (S$m)
FY Mar 2016A 2017A 2018A 2019F 2020F
Investment Properties 4,342 6,337 6,682 6,701 6,715
Other LT Assets 3.52 11.2 10.2 10.2 10.2
Cash & ST Invts 63.6 53.9 45.1 45.8 48.2
Inventory 0.0 0.0 0.0 0.0 0.0
Debtors 5.04 2.97 2.95 3.00 3.09
Other Current Assets 1.08 0.42 0.42 0.42 0.42
Total Assets 4,415 6,406 6,741 6,761 6,777
ST Debt 355 0.0 144 144 144
Creditor 51.8 71.5 83.2 84.0 86.5
Other Current Liab 5.15 0.39 0.15 0.15 0.15
LT Debt 1,197 2,330 2,186 2,205 2,218
Other LT Liabilities 42.8 46.6 44.7 44.7 44.7
Unit holders’ funds 2,764 3,957 4,283 4,283 4,283
Minority Interests 0.0 0.0 0.0 0.0 0.0
Total Funds & Liabilities 4,415 6,406 6,741 6,761 6,777
Non-Cash Wkg. Capital (50.8) (68.5) (80.0) (80.7) (83.1)
Net Cash/(Debt) (1,488) (2,276) (2,284) (2,303) (2,314)
Ratio
Current Ratio (x) 0.2 0.8 0.2 0.2 0.2
Quick Ratio (x) 0.2 0.8 0.2 0.2 0.2
Aggregate Leverage (%) 35.1 36.4 34.6 34.7 34.9
Z-Score (X) 1.3 1.3 1.4 1.4 1.4
Source: Company, DBS Bank
Decline in gearing due to asset revaluation gains
Page 80

Company Guide
Mapletree Commercial Trust
Cash Flow Statement (S$m)
FY Mar 2016A 2017A 2018A 2019F 2020F
Pre-Tax Income 159 211 243 248 255
Dep. & Amort. 0.0 0.0 0.0 0.0 0.0
Tax Paid 0.0 0.0 0.0 0.0 0.0
Associates &JV Inc/(Loss) 0.0 0.0 0.0 0.0 0.0
Chg in Wkg.Cap. 3.81 15.3 10.0 0.70 2.40
Other Operating CF 50.1 61.8 78.9 17.9 18.2
Net Operating CF 213 288 332 267 276
Net Invt in Properties (7.4) (1,853) (18.5) (19.0) (13.7)
Other Invts (net) 0.0 0.0 0.0 0.0 0.0
Invts in Assoc. & JV 0.0 0.0 0.0 0.0 0.0
Div from Assoc. & JVs 0.0 0.0 0.0 0.0 0.0
Other Investing CF 0.46 0.34 0.35 0.0 0.0
Net Investing CF (6.9) (1,853) (18.2) (19.0) (13.7)
Distribution Paid (157) (202) (260) (266) (273)
Chg in Gross Debt 0.0 777 0.0 19.0 13.7
New units issued 0.0 1,034 0.0 0.0 0.0
Other Financing CF (40.3) (53.7) (63.2) 0.0 0.0
Net Financing CF (197) 1,556 (323) (247) (260)
Currency Adjustments 0.0 0.0 0.0 0.0 0.0
Chg in Cash 8.72 (9.7) (8.8) 0.70 2.40
Operating CFPS (S cts) 9.81 9.48 11.2 9.20 9.43
Free CFPS (S cts) 9.64 (54.5) 10.9 8.56 9.04
Source: Company, DBS Bank
Target Price & Ratings History
Source: DBS Bank
Analyst: Mervin SONG, CFA
Derek TAN
S.No.Date of
Report
Closing
Price
12-mth
Target
Price
Rat ing
1: 26 Apr 17 1.59 1.62 BUY
2: 28 Jul 17 1.61 1.62 HOLD
3: 26 Oct 17 1.58 1.62 HOLD
4: 11 Dec 17 1.59 1.75 BUY
5: 19 Mar 18 1.58 1.75 BUY
Note : Share price and Target price are adjusted for corporate actions.
1
2
3
4
5
1.43
1.48
1.53
1.58
1.63
1.68
1.73
1.78
Apr-17 Jun-17 Aug-17 Oct-17 Dec-17 Feb-18 Apr-18
S$
Acquisition of MBC I
Page 81

Company Guide
Mapletree Commercial Trust
DBS Bank recommendations are based an Absolute Total Return* Rating system, defined as follows:
STRONG BUY (>20% total return over the next 3 months, with identifiable share price catalysts within this time frame)
BUY (>15% total return over the next 12 months for small caps, >10% for large caps)
HOLD (-10% to +15% total return over the next 12 months for small caps, -10% to +10% for large caps)
FULLY VALUED (negative total return i.e. > -10% over the next 12 months)
SELL (negative total return of > -20% over the next 3 months, with identifiable catalysts within this time frame)
Share price appreciation + dividends
Completed Date: 25 Apr 2018 08:10:56 (SGT) Dissemination Date: 25 Apr 2018 08:15:56 (SGT)
Sources for all charts and tables are DBS Bank unless otherwise specified.
GENERAL DISCLOSURE/DISCLAIMER
This report is prepared by DBS Bank Ltd. This report is solely intended for the clients of DBS Bank Ltd, its respective connected and associated
corporations and affiliates only and no part of this document may be (i) copied, photocopied or duplicated in any form or by any means or (ii)
redistributed without the prior written consent of DBS Bank Ltd.
The research set out in this report is based on information obtained from sources believed to be reliable, but we (which collectively refers to DBS
Bank Ltd, its respective connected and associated corporations, affiliates and their respective directors, officers, employees and agents (collectively,
the “DBS Group”) have not conducted due diligence on any of the companies, verified any information or sources or taken into account any other
factors which we may consider to be relevant or appropriate in preparing the research. Accordingly, we do not make any representation or
warranty as to the accuracy, completeness or correctness of the research set out in this report. Opinions expressed are subject to change without
notice. This research is prepared for general circulation. Any recommendation contained in this document does not have regard to the specific
investment objectives, financial situation and the particular needs of any specific addressee. This document is for the information of addressees
only and is not to be taken in substitution for the exercise of judgement by addressees, who should obtain separate independent legal or financial
advice. The DBS Group accepts no liability whatsoever for any direct, indirect and/or consequential loss (including any claims for loss of profit)
arising from any use of and/or reliance upon this document and/or further communication given in relation to this document. This document is not
to be construed as an offer or a solicitation of an offer to buy or sell any securities. The DBS Group, along with its affiliates and/or persons
associated with any of them may from time to time have interests in the securities mentioned in this document. The DBS Group, may have
positions in, and may effect transactions in securities mentioned herein and may also perform or seek to perform broking, investment banking and
other banking services for these companies.
Any valuations, opinions, estimates, forecasts, ratings or risk assessments herein constitutes a judgment as of the date of this report, and there can
be no assurance that future results or events will be consistent with any such valuations, opinions, estimates, forecasts, ratings or risk assessments.
The information in this document is subject to change without notice, its accuracy is not guaranteed, it may be incomplete or condensed, it may
not contain all material information concerning the company (or companies) referred to in this report and the DBS Group is under no obligation to
update the information in this report.
This publication has not been reviewed or authorized by any regulatory authority in Singapore, Hong Kong or elsewhere. There is no planned
schedule or frequency for updating research publication relating to any issuer.
The valuations, opinions, estimates, forecasts, ratings or risk assessments described in this report were based upon a number of estimates and
assumptions and are inherently subject to significant uncertainties and contingencies. It can be expected that one or more of the estimates on
which the valuations, opinions, estimates, forecasts, ratings or risk assessments were based will not materialize or will vary significantly from actual
results. Therefore, the inclusion of the valuations, opinions, estimates, forecasts, ratings or risk assessments described herein IS NOT TO BE RELIED
UPON as a representation and/or warranty by the DBS Group (and/or any persons associated with the aforesaid entities), that:
(a) such valuations, opinions, estimates, forecasts, ratings or risk assessments or their underlying assumptions will be achieved, and
(b) there is any assurance that future results or events will be consistent with any such valuations, opinions, estimates, forecasts, ratings or risk
assessments stated therein.
Please contact the primary analyst for valuation methodologies and assumptions associated with the covered companies or price targets.
Any assumptions made in this report that refers to commodities, are for the purposes of making forecasts for the company (or companies)
mentioned herein. They are not to be construed as recommendations to trade in the physical commodity or in the futures contract relating to the
commodity referred to in this report.
Page 82

Company Guide
Mapletree Commercial Trust
DBSVUSA, a US-registered broker-dealer, does not have its own investment banking or research department, has not participated in any public
offering of securities as a manager or co-manager or in any other investment banking transaction in the past twelve months and does not engage
in market-making.
ANALYST CERTIFICATION
The research analyst(s) primarily responsible for the content of this research report, in part or in whole, certifies that the views about the
companies and their securities expressed in this report accurately reflect his/her personal views. The analyst(s) also certifies that no part of his/her
compensation was, is, or will be, directly or indirectly, related to specific recommendations or views expressed in the report. The research analyst (s)
primarily responsible for the content of this research report, in part or in whole, certifies that he or his associate1 does not serve as an officer of the
issuer or the new listing applicant (which includes in the case of a real estate investment trust, an officer of the management company of the real
estate investment trust; and in the case of any other entity, an officer or its equivalent counterparty of the entity who is responsible for the
management of the issuer or the new listing applicant) and the research analyst(s) primarily responsible for the content of this research report or
his associate does not have financial interests2 in relation to an issuer or a new listing applicant that the analyst reviews. DBS Group has
procedures in place to eliminate, avoid and manage any potential conflicts of interests that may arise in connection with the production of
research reports. The research analyst(s) responsible for this report operates as part of a separate and independent team to the investment
banking function of the DBS Group and procedures are in place to ensure that confidential information held by either the research or investment
banking function is handled appropriately. There is no direct link of DBS Group's compensation to any specific investment banking function of the
DBS Group.
COMPANY-SPECIFIC / REGULATORY DISCLOSURES
1. DBS Bank Ltd, DBS HK, DBS Vickers Securities (Singapore) Pte Ltd (''DBSVS''), DBSV HK or their subsidiaries and/or other affiliates have a
proprietary position in Mapletree Commercial Trust recommended in this report as of 30 Mar 2018.
2. Neither DBS Bank Ltd, DBS HK nor DBSV HK market makes in equity securities of the issuer(s) or company(ies) mentioned in this Research
Report.
3. DBS Bank Ltd, DBS HK, DBSVS, DBSV HK, their subsidiaries and/or other affiliates have a net long position exceeding 0.5% of the total issued
share capital in Mapletree Commercial Trust recommended in this report as of 30 Mar 2018.
Compensation for investment banking services:
4. DBSVUSA does not have its own investment banking or research department, nor has it participated in any public offering of securities as a
manager or co-manager or in any other investment banking transaction in the past twelve months. Any US persons wishing to obtain further
information, including any clarification on disclosures in this disclaimer, or to effect a transaction in any security discussed in this document
should contact DBSVUSA exclusively.
Disclosure of previous investment recommendation produced:
5. DBS Bank Ltd, DBS Vickers Securities (Singapore) Pte Ltd (''DBSVS''), their subsidiaries and/or other affiliates may have published other
investment recommendations in respect of the same securities / instruments recommended in this research report during the preceding 12
months. Please contact the primary analyst listed in the first page of this report to view previous investment recommendations published by
DBS Bank Ltd, DBS Vickers Securities (Singapore) Pte Ltd (''DBSVS''), their subsidiaries and/or other affiliates in the preceding 12 months.
1 An associate is defined as (i) the spouse, or any minor child (natural or adopted) or minor step-child, of the analyst; (ii) the trustee of a trust of which the analyst, his spouse, minor child (natural or adopted) or minor step-child, is a beneficiary or discretionary object; or (iii) another person accustomed or obliged to act in accordance with the directions or instructions of the analyst.
2 Financial interest is defined as interests that are commonly known financial interest, such as investment in the securities in respect of an issuer or a new listing applicant, or financial accommodation arrangement between the issuer or the new listing applicant and the firm or analysis. This term does not include commercial lending conducted at arm's length, or investments in any collective investment scheme other than an issuer or new listing applicant notwithstanding the fact that the scheme has investments in securities in respect of an issuer or a new listing applicant.
Page 83
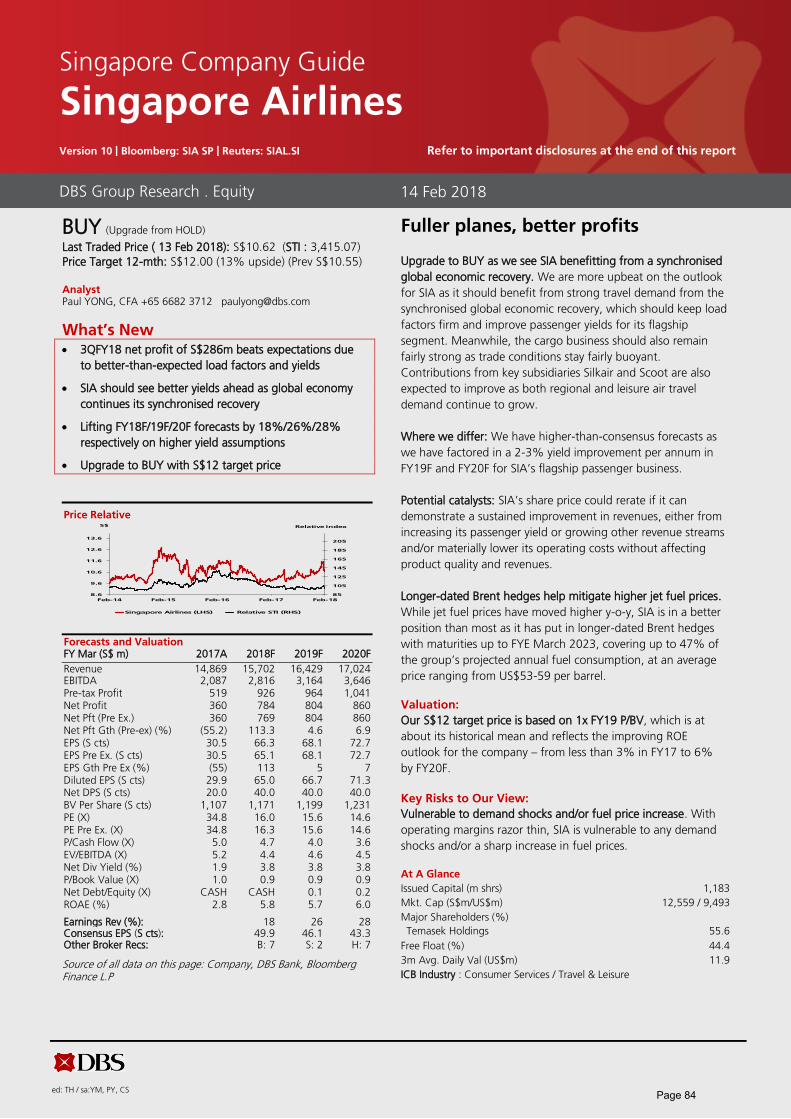
ed: TH / sa:YM, PY, CS
BUY (Upgrade from HOLD)
Last Traded Price ( 13 Feb 2018): S$10.62 (STI : 3,415.07)
Price Target 12-mth: S$12.00 (13% upside) (Prev S$10.55)
Analyst Paul YONG, CFA +65 6682 3712 [email protected]
What’s New 3QFY18 net profit of S$286m beats expectations due
to better-than-expected load factors and yields
SIA should see better yields ahead as global economy
continues its synchronised recovery
Lifting FY18F/19F/20F forecasts by 18%/26%/28%
respectively on higher yield assumptions
Upgrade to BUY with S$12 target price
Price Relative
Forecasts and Valuation FY Mar (S$ m) 2017A 2018F 2019F 2020F
Revenue 14,869 15,702 16,429 17,024 EBITDA 2,087 2,816 3,164 3,646 Pre-tax Profit 519 926 964 1,041 Net Profit 360 784 804 860 Net Pft (Pre Ex.) 360 769 804 860 Net Pft Gth (Pre-ex) (%) (55.2) 113.3 4.6 6.9 EPS (S cts) 30.5 66.3 68.1 72.7 EPS Pre Ex. (S cts) 30.5 65.1 68.1 72.7 EPS Gth Pre Ex (%) (55) 113 5 7 Diluted EPS (S cts) 29.9 65.0 66.7 71.3 Net DPS (S cts) 20.0 40.0 40.0 40.0 BV Per Share (S cts) 1,107 1,171 1,199 1,231 PE (X) 34.8 16.0 15.6 14.6 PE Pre Ex. (X) 34.8 16.3 15.6 14.6 P/Cash Flow (X) 5.0 4.7 4.0 3.6 EV/EBITDA (X) 5.2 4.4 4.6 4.5 Net Div Yield (%) 1.9 3.8 3.8 3.8 P/Book Value (X) 1.0 0.9 0.9 0.9 Net Debt/Equity (X) CASH CASH 0.1 0.2 ROAE (%) 2.8 5.8 5.7 6.0
Earnings Rev (%): 18 26 28 Consensus EPS (S cts): 49.9 46.1 43.3 Other Broker Recs: B: 7 S: 2 H: 7
Source of all data on this page: Company, DBS Bank, Bloomberg Finance L.P
Fuller planes, better profits
Upgrade to BUY as we see SIA benefitting from a synchronised
global economic recovery. We are more upbeat on the outlook
for SIA as it should benefit from strong travel demand from the
synchronised global economic recovery, which should keep load
factors firm and improve passenger yields for its flagship
segment. Meanwhile, the cargo business should also remain
fairly strong as trade conditions stay fairly buoyant.
Contributions from key subsidiaries Silkair and Scoot are also
expected to improve as both regional and leisure air travel
demand continue to grow.
Where we differ: We have higher-than-consensus forecasts as
we have factored in a 2-3% yield improvement per annum in
FY19F and FY20F for SIA’s flagship passenger business.
Potential catalysts: SIA’s share price could rerate if it can
demonstrate a sustained improvement in revenues, either from
increasing its passenger yield or growing other revenue streams
and/or materially lower its operating costs without affecting
product quality and revenues.
Longer-dated Brent hedges help mitigate higher jet fuel prices.
While jet fuel prices have moved higher y-o-y, SIA is in a better
position than most as it has put in longer-dated Brent hedges
with maturities up to FYE March 2023, covering up to 47% of
the group’s projected annual fuel consumption, at an average
price ranging from US$53-59 per barrel.
Valuation: Our S$12 target price is based on 1x FY19 P/BV, which is at
about its historical mean and reflects the improving ROE
outlook for the company – from less than 3% in FY17 to 6%
by FY20F.
Key Risks to Our View: Vulnerable to demand shocks and/or fuel price increase. With
operating margins razor thin, SIA is vulnerable to any demand
shocks and/or a sharp increase in fuel prices.
At A Glance Issued Capital (m shrs) 1,183
Mkt. Cap (S$m/US$m) 12,559 / 9,493
Major Shareholders (%)
Temasek Holdings 55.6
Free Float (%) 44.4
3m Avg. Daily Val (US$m) 11.9
ICB Industry : Consumer Services / Travel & Leisure
DBS Group Research . Equity 14 Feb 2018
Singapore Company Guide
Singapore Airlines Version 10 | Bloomberg: SIA SP | Reuters: SIAL.SI Refer to important disclosures at the end of this report
85
105
125
145
165
185
205
8.6
9.6
10.6
11.6
12.6
13.6
Feb-14 Feb-15 Feb-16 Feb-17 Feb-18
Relative IndexS$
Singapore Airlines (LHS) Relative STI (RHS)
Page 84

Company Guide
Singapore Airlines
WHAT’S NEW
3QFY18 earnings beat expectations on better-than-expected load factors and yields
3QFY18 profit jumps 62% y-o-y to S$286m. This was led by
a 12.5% y-o-y improvement in EBIT to S$329m, the absence
of a write-down of the Tigerair brand and trademark made
last year of S$79m, as well as improved contributions from
associates and joint ventures.
For 9M18, net profit grew by 43% y-o-y to S$711m, which is
ahead of our expectations. Revenue grew 5.7% y-o-y to
S$11.8bn.
Broad-based revenue growth in 3QFY18: There was a 6.1%
y-o-y increase in revenue to S$4.1bn on revenue
improvements in all business segments. At its flagship
segment, a 4.4% y-o-y growth in passenger carriage more
than offset a slight 1% decline in yield, which was better
than we had expected, as load factor improved by 2.6pts to
81.6%. Cargo revenue was also up by nearly 17% y-o-y on
4.4% higher carriage and 12.1% better yield.
Stronger contributions from most segments. EBIT
contributions from most of SIA’s key segments were better y-
o-y in 3QFY18 vs 3QFY17: S$155m vs S$151m for the
flagship segment, S$19m vs S$30m for Silkair, S$43m vs
S$29m for Scoot, S$88m vs S$53m for SIA Cargo, and
S$18m vs S$25m for SIA Engineering.
Quarterly / Interim Income Statement (S$m)
FY Mar 3Q2017 2Q2018 3Q2018 % chg yoy % chg qoq
Revenue 3,844 3,848 4,077 6.1 5.9
Cost of Goods Sold (3,551) (3,615) (3,747) 5.5 3.7
Gross Profit 293 233 329 12.5 41.6
Other Oper. (Exp)/Inc 0.0 0.0 0.0 - -
Operating Profit 293 233 329 12.5 41.6
Other Non Opg (Exp)/Inc (88.0) 7.40 5.60 nm (24.3)
Associates & JV Inc 15.3 (11.9) 21.2 38.6 (278.2)
Net Interest (Exp)/Inc 6.50 (5.5) (7.2) nm (30.9)
Exceptional Gain/(Loss) 0.0 0.0 0.0 - -
Pre-tax Profit 227 223 350 54.4 57.2
Tax (13.8) (22.8) (49.3) 257.2 116.2
Minority Interest (35.7) (9.9) (13.6) 61.9 37.4
Net Profit 177 190 286 61.5 50.7
Net profit bef Except. 177 190 286 61.5 50.7
EBITDA 615 651 783 27.4 20.3
Margins (%)
Gross Margins 7.6 6.0 8.1
Opg Profit Margins 7.6 6.0 8.1
Net Profit Margins 4.6 4.9 7.0
Source of all data: Company, DBS Bank
Page 85

Company Guide
Singapore Airlines
CRITICAL DATA POINTS TO WATCH
Critical Factors Modest growth for SIA’s flagship brand in the medium term.
SIA’s flagship passenger brand has not grown capacity in the
last three years, given the global economic malaise over the
same period. We expect passenger carriage growth for this
segment to continue to be relatively muted – assuming 0.4%
growth in FY18 and 1% growth in FY19.
Aside from its mature flagship brand, SIA has been investing
and growing other airline brands within its portfolio. These
include 1) its wholly owned regional arm Silkair, 2) Budget
Aviation Holdings – which consists of the merged Scoot and
Tigerair, and 3) investments in Virgin Australia, NokScoot and
Vistara, a joint venture with Tata Sons, and which is a full-
service airline in India.
SIA’s flagship passenger segment remains the main earnings
driver. SIA’s flagship brand has historically been its main profit
source. Over the last five years, in which SIA Cargo was loss-
making in four, SIA’s flagship brand accounted for 62-99% of
group EBIT. In FY17, the flagship brand contributed S$386m in
EBIT while SIA Engineering’s EBIT contribution was S$72m.
Meanwhile, Silkair, Scoot and Tigerair contributed an
aggregated EBIT of S$168m in FY17.
Load factors poised to remain high on strong travel demand
and modest capacity growth. We project SIA’s passenger load
factor to remain firm at 81% in the years ahead, compared to
81.4% for the first nine months of financial year-end March
2018 given the improving global economic outlook and modest
capacity increases planned for the flagship brand.
Yields should start to improve, while non-fuel costs are
managed down. Reflecting higher fuel costs and stronger
demand from a synchronised global economic recovery, we
project yields for SIA’s flagship segment to improve by c.3% in
FY19F and 2% in FY20F. At the same time, owning more of its
planes rather than leasing them, along with other cost
optimisation initiatives, should help lower non-fuel costs.
Jet fuel prices could be a threat. Jet fuel prices have rebounded
significantly since hitting lows in early 2016 and in recent weeks
surged to over US$82/bbl before sliding down to US$76/bbl
currently. We have assumed an average spot jet fuel price
(before hedging) of US$78/bbl in FY19F and US$82/bbl in
FY20F.
Available seat-km (m)
Passenger load factor
Passenger yield (cents/pkm)
Jet Fuel Price - US$ per barrel
US$/S$ exchange rate
Source: Company, DBS Bank
118367 117662 118133 119314 120507
0.0
17387.5
34775.0
52162.5
69550.0
86937.5
104325.0
121712.5
2016A 2017A 2018F 2019F 2020F
79.6 79 81 81 81
0.0
16.5
33.0
49.6
66.1
82.6
2016A 2017A 2018F 2019F 2020F
10.610.2 10.3 10.6 10.8
0.00
2.20
4.41
6.61
8.81
11.02
2016A 2017A 2018F 2019F 2020F
62.4 6067
7882
0.0
16.6
33.1
49.7
66.3
82.8
2016A 2017A 2018F 2019F 2020F
1.4 1.39 1.37 1.35 1.34
0.0
0.3
0.6
0.8
1.1
1.4
2016A 2017A 2018F 2019F 2020F
Page 86
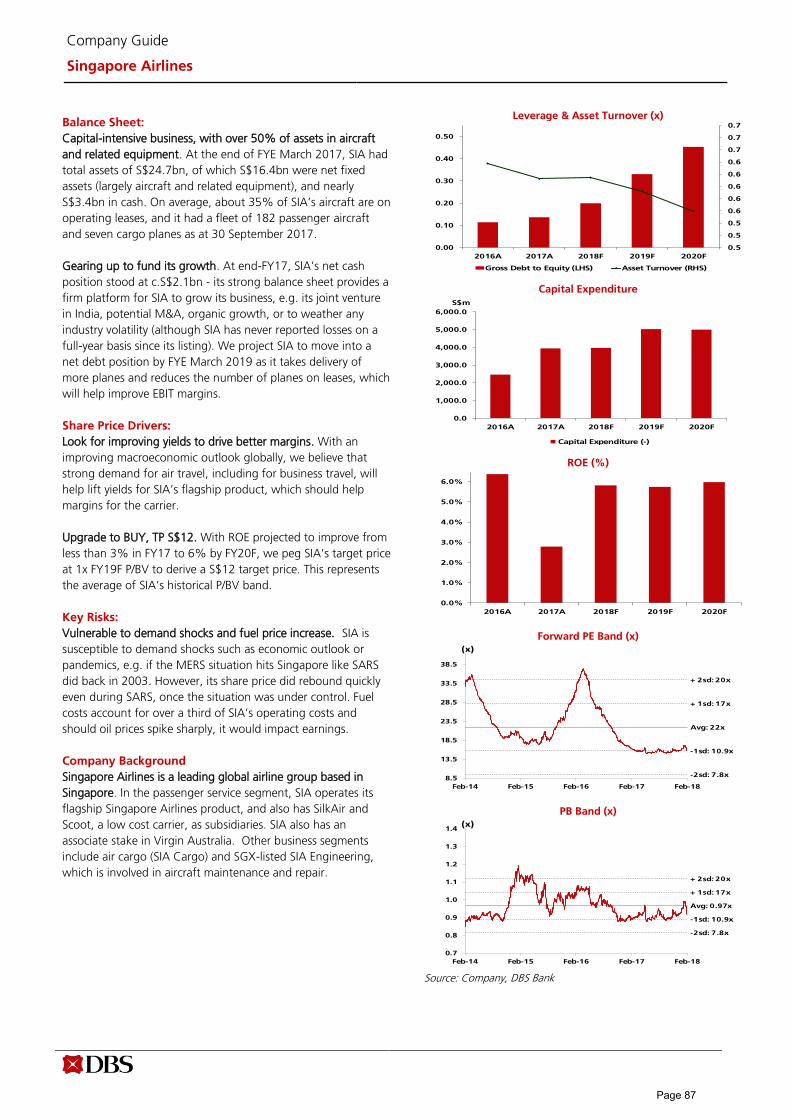
Company Guide
Singapore Airlines
Balance Sheet: Capital-intensive business, with over 50% of assets in aircraft
and related equipment. At the end of FYE March 2017, SIA had
total assets of S$24.7bn, of which S$16.4bn were net fixed
assets (largely aircraft and related equipment), and nearly
S$3.4bn in cash. On average, about 35% of SIA’s aircraft are on
operating leases, and it had a fleet of 182 passenger aircraft
and seven cargo planes as at 30 September 2017.
Gearing up to fund its growth. At end-FY17, SIA’s net cash
position stood at c.S$2.1bn - its strong balance sheet provides a
firm platform for SIA to grow its business, e.g. its joint venture
in India, potential M&A, organic growth, or to weather any
industry volatility (although SIA has never reported losses on a
full-year basis since its listing). We project SIA to move into a
net debt position by FYE March 2019 as it takes delivery of
more planes and reduces the number of planes on leases, which
will help improve EBIT margins.
Share Price Drivers: Look for improving yields to drive better margins. With an
improving macroeconomic outlook globally, we believe that
strong demand for air travel, including for business travel, will
help lift yields for SIA’s flagship product, which should help
margins for the carrier.
Upgrade to BUY, TP S$12. With ROE projected to improve from
less than 3% in FY17 to 6% by FY20F, we peg SIA’s target price
at 1x FY19F P/BV to derive a S$12 target price. This represents
the average of SIA’s historical P/BV band.
Key Risks: Vulnerable to demand shocks and fuel price increase. SIA is
susceptible to demand shocks such as economic outlook or
pandemics, e.g. if the MERS situation hits Singapore like SARS
did back in 2003. However, its share price did rebound quickly
even during SARS, once the situation was under control. Fuel
costs account for over a third of SIA’s operating costs and
should oil prices spike sharply, it would impact earnings.
Company Background Singapore Airlines is a leading global airline group based in
Singapore. In the passenger service segment, SIA operates its
flagship Singapore Airlines product, and also has SilkAir and
Scoot, a low cost carrier, as subsidiaries. SIA also has an
associate stake in Virgin Australia. Other business segments
include air cargo (SIA Cargo) and SGX-listed SIA Engineering,
which is involved in aircraft maintenance and repair.
Leverage & Asset Turnover (x)
Capital Expenditure
ROE (%)
Forward PE Band (x)
PB Band (x)
Source: Company, DBS Bank
0.5
0.5
0.5
0.6
0.6
0.6
0.6
0.6
0.7
0.7
0.7
0.00
0.10
0.20
0.30
0.40
0.50
2016A 2017A 2018F 2019F 2020F
Gross Debt to Equity (LHS) Asset Turnover (RHS)
0.0
1,000.0
2,000.0
3,000.0
4,000.0
5,000.0
6,000.0
2016A 2017A 2018F 2019F 2020F
Capital Expenditure (-)
S$m
0.0%
1.0%
2.0%
3.0%
4.0%
5.0%
6.0%
2016A 2017A 2018F 2019F 2020F
Avg: 22x
+ 1sd: 17x
+ 2sd: 20x
-1sd: 10.9x
-2sd: 7.8x8.5
13.5
18.5
23.5
28.5
33.5
38.5
Feb-14 Feb-15 Feb-16 Feb-17 Feb-18
(x)
Avg: 0.97x
+ 1sd: 17x
+ 2sd: 20x
-1sd: 10.9x
-2sd: 7.8x
0.7
0.8
0.9
1.0
1.1
1.2
1.3
1.4
Feb-14 Feb-15 Feb-16 Feb-17 Feb-18
(x)
Page 87

Company Guide
Singapore Airlines
Key Assumptions
FY Mar 2016A 2017A 2018F 2019F 2020F
Available seat-km (m) 118,367 117,662 118,133 119,314 120,507
Passenger load factor 79.6 79.0 81.0 81.0 81.0
Passenger yield (cents/pkm) 10.6 10.2 10.3 10.6 10.8
Jet Fuel Price - US$ per barrel 62.4 60.0 67.0 78.0 82.0
US$/S$ exchange rate 1.40 1.39 1.37 1.35 1.34
Segmental Breakdown FY Mar 2016A 2017A 2018F 2019F 2020F
Revenues (S$m) Airline Operations 14,812 14,403 15,240 15,962 16,557
SIA Engineering 1,114 1,104 1,094 1,107 1,107
Others 89.3 84.5 84.5 84.5 84.5
Eliminations (776) (723) (717) (725) (725)
Total 15,239 14,869 15,702 16,429 17,024
EBIT (S$m) Airline Operations 568 558 813 914 1,053
SIA Engineering 104 72.0 75.0 77.0 79.0
Others (2.1) 9.60 0.0 0.0 0.0
Eliminations 11.2 (16.5) 5.00 5.00 5.00
Total 670 639 888 991 1,132
EBIT Margins (%) Airline Operations 3.8 3.9 5.3 5.7 6.4
SIA Engineering 9.3 6.5 6.9 7.0 7.1
Others (2.4) 11.4 0.0 0.0 0.0
Total 4.4 4.3 5.7 6.0 6.6
Income Statement (S$m)
FY Mar 2016A 2017A 2018F 2019F 2020F
Revenue 15,229 14,869 15,702 16,429 17,024
Cost of Goods Sold (14,547) (14,246) (14,809) (15,433) (15,887)
Gross Profit 681 623 893 996 1,137
Other Opng (Exp)/Inc 0.0 0.0 0.0 0.0 0.0
Operating Profit 681 623 893 996 1,137
Other Non Opg (Exp)/Inc 259 (89.9) 10.0 0.0 0.0
Associates & JV Inc 11.7 (42.1) 15.0 25.0 30.0
Net Interest (Exp)/Inc 20.4 27.8 (7.2) (57.1) (126)
Exceptional Gain/(Loss) 0.0 0.0 15.0 0.0 0.0
Pre-tax Profit 972 519 926 964 1,041
Tax (121) (76.7) (100) (116) (135)
Minority Interest (47.4) (81.5) (42.0) (44.0) (46.0)
Preference Dividend 0.0 0.0 0.0 0.0 0.0
Net Profit 804 360 784 804 860
Net Profit before Except. 804 360 769 804 860
EBITDA 2,528 2,087 2,816 3,164 3,646
Growth Revenue Gth (%) (2.2) (2.4) 5.6 4.6 3.6
EBITDA Gth (%) 29.8 (17.5) 34.9 12.4 15.3
Opg Profit Gth (%) 66.4 (8.6) 43.4 11.5 14.1
Net Profit Gth (Pre-ex) (%) 141.3 (55.2) 113.3 4.6 6.9
Margins & Ratio Gross Margins (%) 4.5 4.2 5.7 6.1 6.7
Opg Profit Margin (%) 4.5 4.2 5.7 6.1 6.7
Net Profit Margin (%) 5.3 2.4 5.0 4.9 5.0
ROAE (%) 6.4 2.8 5.8 5.7 6.0
ROA (%) 3.4 1.5 3.1 2.9 2.8
ROCE (%) 3.4 2.9 4.1 4.1 4.2
Div Payout Ratio (%) 66.0 65.6 60.3 58.8 55.0
Net Interest Cover (x) NM NM 124.6 17.4 9.0
Source: Company, DBS Bank
Page 88

Company Guide
Singapore Airlines
Quarterly / Interim Income Statement (S$m)
FY Mar 3Q2017 4Q2017 1Q2018 2Q2018 3Q2018
Revenue 3,844 3,720 3,864 3,848 4,077
Cost of Goods Sold (3,551) (3,692) (3,583) (3,615) (3,747)
Gross Profit 293 27.6 281 233 329
Other Oper. (Exp)/Inc 0.0 0.0 0.0 0.0 0.0
Operating Profit 293 27.6 281 233 329
Other Non Opg (Exp)/Inc (88.0) (165) 9.80 7.40 5.60
Associates & JV Inc 15.3 1.20 0.80 (11.9) 21.2
Net Interest (Exp)/Inc 6.50 3.70 1.50 (5.5) (7.2)
Exceptional Gain/(Loss) 0.0 0.0 0.0 0.0 0.0
Pre-tax Profit 227 (132) 293 223 350
Tax (13.8) 5.70 (49.2) (22.8) (49.3)
Minority Interest (35.7) (11.9) (8.6) (9.9) (13.6)
Net Profit 177 (138) 235 190 286
Net profit bef Except. 177 (138) 235 190 286
EBITDA 615 266 702 651 783
Growth Revenue Gth (%) 5.3 (3.2) 3.9 (0.4) 5.9
EBITDA Gth (%) 27.5 (56.7) 163.9 (7.3) 20.3
Opg Profit Gth (%) 168.5 (90.6) 917.4 (17.2) 41.6
Net Profit Gth (Pre-ex) (%) 173.0 (178.0) (270.0) (19.2) 50.7
Margins Gross Margins (%) 7.6 0.7 7.3 6.0 8.1
Opg Profit Margins (%) 7.6 0.7 7.3 6.0 8.1
Net Profit Margins (%) 4.6 (3.7) 6.1 4.9 7.0
Balance Sheet (S$m) FY Mar 2016A 2017A 2018F 2019F 2020F
Net Fixed Assets 14,144 16,433 18,603 21,588 24,196
Invts in Associates & JVs 1,058 1,217 1,057 907 762
Other LT Assets 1,851 1,370 1,370 1,370 1,370
Cash & ST Invts 4,641 3,920 3,524 3,300 3,478
Inventory 182 178 188 197 204
Debtors 1,222 1,145 1,209 1,265 1,311
Other Current Assets 750 457 457 457 457
Total Assets 23,847 24,720 26,407 29,083 31,777
ST Debt 212 42.0 42.0 42.0 42.0
Creditor 2,899 3,296 3,481 3,642 3,774
Other Current Liab 3,376 2,951 2,820 2,915 3,000
LT Debt 1,283 1,795 2,795 4,795 6,795
Other LT Liabilities 2,943 3,167 3,010 3,054 3,098
Shareholder’s Equity 12,755 13,083 13,830 14,162 14,549
Minority Interests 378 387 429 473 519
Total Cap. & Liab. 23,847 24,720 26,407 29,083 31,777
Non-Cash Wkg. Capital (4,122) (4,467) (4,447) (4,639) (4,803)
Net Cash/(Debt) 3,145 2,084 687 (1,536) (3,359)
Debtors Turn (avg days) 32.5 29.0 27.4 27.5 27.6
Creditors Turn (avg days) 81.7 89.4 95.8 97.8 100.9
Inventory Turn (avg days) 5.4 5.2 5.2 5.3 5.5
Asset Turnover (x) 0.6 0.6 0.6 0.6 0.6
Current Ratio (x) 1.0 0.9 0.8 0.8 0.8
Quick Ratio (x) 0.9 0.8 0.7 0.7 0.7
Net Debt/Equity (X) CASH CASH CASH 0.1 0.2
Net Debt/Equity ex MI (X) CASH CASH CASH 0.1 0.2
Capex to Debt (%) 164.6 214.7 140.3 104.2 73.1
Z-Score (X) 2.2 2.0 1.9 1.7 1.6
Source: Company, DBS Bank
Page 89

Company Guide
Singapore Airlines
Cash Flow Statement (S$m)
FY Mar 2016A 2017A 2018F 2019F 2020F
Pre-Tax Profit 972 519 926 964 1,041
Dep. & Amort. 1,576 1,596 1,854 2,099 2,436
Tax Paid (40.9) (50.5) (322) (100) (116)
Assoc. & JV Inc/(loss) (11.7) 42.1 (15.0) (25.0) (30.0)
Chg in Wkg.Cap. 403 96.8 202 177 144
Other Operating CF 53.5 289 0.0 0.0 0.0
Net Operating CF 2,952 2,492 2,645 3,114 3,475
Capital Exp.(net) (2,462) (3,943) (3,980) (5,040) (5,000)
Other Invts.(net) (213) 629 0.0 0.0 0.0
Invts in Assoc. & JV (142) (159) 0.0 0.0 0.0
Div from Assoc & JV 116 124 175 175 175
Other Investing CF 0.10 406 0.0 0.0 0.0
Net Investing CF (2,700) (2,944) (3,805) (4,865) (4,825)
Div Paid (359) (559) (236) (473) (473)
Chg in Gross Debt (391) 218 1,000 2,000 2,000
Capital Issues 24.4 33.2 0.0 0.0 0.0
Other Financing CF 54.7 (43.3) 0.0 0.0 1.00
Net Financing CF (1,268) (184) 764 1,527 1,527
Currency Adjustments (54.7) 43.3 0.0 0.0 0.0
Chg in Cash (1,070) (592) (397) (223) 178
Opg CFPS (S cts) 216 203 207 249 282
Free CFPS (S cts) 41.5 (123) (113) (163) (129)
Source: Company, DBS Bank
Target Price & Ratings History
Source: DBS Bank
Analyst: Paul YONG, CFA
S.No.Date of
Report
Closing
Price
12-mth
Target
Price
Rat ing
1: 22 May 17 9.79 10.10 HOLD
2: 26 Jul 17 10.13 10.10 HOLD
3: 08 Nov 17 10.75 10.30 HOLD
4: 17 Dec 17 10.51 10.30 HOLD
5: 31 Jan 18 11.31 10.55 HOLD
Note : Share price and Target price are adjusted for corporate actions.
1
2
34
5
9.29
9.79
10.29
10.79
11.29
11.79
Feb-17 Apr-17 Jun-17 Aug-17 Oct-17 Dec-17 Feb-18
S$
Page 90

Company Guide
Singapore Airlines
DBS Bank recommendations are based an Absolute Total Return* Rating system, defined as follows:
STRONG BUY (>20% total return over the next 3 months, with identifiable share price catalysts within this time frame)
BUY (>15% total return over the next 12 months for small caps, >10% for large caps)
HOLD (-10% to +15% total return over the next 12 months for small caps, -10% to +10% for large caps)
FULLY VALUED (negative total return i.e. > -10% over the next 12 months)
SELL (negative total return of > -20% over the next 3 months, with identifiable catalysts within this time frame)
Share price appreciation + dividends
Completed Date: 14 Feb 2018 07:40:59 (SGT) Dissemination Date: 14 Feb 2018 09:23:57 (SGT)
Sources for all charts and tables are DBS Bank unless otherwise specified.
GENERAL DISCLOSURE/DISCLAIMER
This report is prepared by DBS Bank Ltd. This report is solely intended for the clients of DBS Bank Ltd, its respective connected and associated
corporations and affiliates only and no part of this document may be (i) copied, photocopied or duplicated in any form or by any means or (ii)
redistributed without the prior written consent of DBS Bank Ltd.
The research set out in this report is based on information obtained from sources believed to be reliable, but we (which collectively refers to DBS
Bank Ltd, its respective connected and associated corporations, affiliates and their respective directors, officers, employees and agents (collectively,
the “DBS Group”) have not conducted due diligence on any of the companies, verified any information or sources or taken into account any other
factors which we may consider to be relevant or appropriate in preparing the research. Accordingly, we do not make any representation or
warranty as to the accuracy, completeness or correctness of the research set out in this report. Opinions expressed are subject to change without
notice. This research is prepared for general circulation. Any recommendation contained in this document does not have regard to the specific
investment objectives, financial situation and the particular needs of any specific addressee. This document is for the information of addressees
only and is not to be taken in substitution for the exercise of judgement by addressees, who should obtain separate independent legal or financial
advice. The DBS Group accepts no liability whatsoever for any direct, indirect and/or consequential loss (including any claims for loss of profit)
arising from any use of and/or reliance upon this document and/or further communication given in relation to this document. This document is not
to be construed as an offer or a solicitation of an offer to buy or sell any securities. The DBS Group, along with its affiliates and/or persons
associated with any of them may from time to time have interests in the securities mentioned in this document. The DBS Group, may have
positions in, and may effect transactions in securities mentioned herein and may also perform or seek to perform broking, investment banking and
other banking services for these companies.
Any valuations, opinions, estimates, forecasts, ratings or risk assessments herein constitutes a judgment as of the date of this report, and there can
be no assurance that future results or events will be consistent with any such valuations, opinions, estimates, forecasts, ratings or risk assessments.
The information in this document is subject to change without notice, its accuracy is not guaranteed, it may be incomplete or condensed, it may
not contain all material information concerning the company (or companies) referred to in this report and the DBS Group is under no obligation to
update the information in this report.
This publication has not been reviewed or authorized by any regulatory authority in Singapore, Hong Kong or elsewhere. There is no planned
schedule or frequency for updating research publication relating to any issuer.
The valuations, opinions, estimates, forecasts, ratings or risk assessments described in this report were based upon a number of estimates and
assumptions and are inherently subject to significant uncertainties and contingencies. It can be expected that one or more of the estimates on
which the valuations, opinions, estimates, forecasts, ratings or risk assessments were based will not materialize or will vary significantly from actual
results. Therefore, the inclusion of the valuations, opinions, estimates, forecasts, ratings or risk assessments described herein IS NOT TO BE RELIED
UPON as a representation and/or warranty by the DBS Group (and/or any persons associated with the aforesaid entities), that:
(a) such valuations, opinions, estimates, forecasts, ratings or risk assessments or their underlying assumptions will be achieved, and
(b) there is any assurance that future results or events will be consistent with any such valuations, opinions, estimates, forecasts, ratings or risk
assessments stated therein.
Please contact the primary analyst for valuation methodologies and assumptions associated with the covered companies or price targets.
Any assumptions made in this report that refers to commodities, are for the purposes of making forecasts for the company (or companies)
mentioned herein. They are not to be construed as recommendations to trade in the physical commodity or in the futures contract relating to the
commodity referred to in this report.
Page 91

Company Guide
Singapore Airlines
DBSVUSA, a US-registered broker-dealer, does not have its own investment banking or research department, has not participated in any public
offering of securities as a manager or co-manager or in any other investment banking transaction in the past twelve months and does not engage
in market-making.
ANALYST CERTIFICATION
The research analyst(s) primarily responsible for the content of this research report, in part or in whole, certifies that the views about the
companies and their securities expressed in this report accurately reflect his/her personal views. The analyst(s) also certifies that no part of his/her
compensation was, is, or will be, directly or indirectly, related to specific recommendations or views expressed in the report. The research analyst (s)
primarily responsible for the content of this research report, in part or in whole, certifies that he or his associate1 does not serve as an officer of the
issuer or the new listing applicant (which includes in the case of a real estate investment trust, an officer of the management company of the real
estate investment trust; and in the case of any other entity, an officer or its equivalent counterparty of the entity who is responsible for the
management of the issuer or the new listing applicant) and the research analyst(s) primarily responsible for the content of this research report or
his associate does not have financial interests2 in relation to an issuer or a new listing applicant that the analyst reviews. DBS Group has
procedures in place to eliminate, avoid and manage any potential conflicts of interests that may arise in connection with the production of
research reports. The research analyst(s) responsible for this report operates as part of a separate and independent team to the investment
banking function of the DBS Group and procedures are in place to ensure that confidential information held by either the research or investment
banking function is handled appropriately. There is no direct link of DBS Group's compensation to any specific investment banking function of the
DBS Group.
COMPANY-SPECIFIC / REGULATORY DISCLOSURES
1. DBS Bank Ltd, DBS HK, DBS Vickers Securities (Singapore) Pte Ltd (''DBSVS''), DBSV HK or their subsidiaries and/or other affiliates have a
proprietary position in Singapore Airlines Limited recommended in this report as of 31 Jan 2018.
2. Neither DBS Bank Ltd, DBS HK nor DBSV HK market makes in equity securities of the issuer(s) or company(ies) mentioned in this Research
Report.
Compensation for investment banking services:
3. DBS Bank Ltd, DBS HK, DBSVS, DBSV HK, their subsidiaries and/or other affiliates of DBSVUSA have received compensation, within the past
12 months for investment banking services from Singapore Airlines Limited as of 31 Jan 2018.
4. DBS Bank Ltd, DBS HK, DBSVS, their subsidiaries and/or other affiliates of DBSVUSA have managed or co-managed a public offering of
securities for Singapore Airlines Limited in the past 12 months, as of 31 Jan 2018.
5. DBSVUSA does not have its own investment banking or research department, nor has it participated in any public offering of securities as a
manager or co-manager or in any other investment banking transaction in the past twelve months. Any US persons wishing to obtain further
information, including any clarification on disclosures in this disclaimer, or to effect a transaction in any security discussed in this document
should contact DBSVUSA exclusively.
Directorship/trustee interests:
6. Peter Seah Lim Huat, Chairman & Director of DBS Group Holdings, is a Director / Chairman of Singapore Airlines as of 31 Dec 2017
Disclosure of previous investment recommendation produced:
7. DBS Bank Ltd, DBS Vickers Securities (Singapore) Pte Ltd (''DBSVS''), their subsidiaries and/or other affiliates may have published other
investment recommendations in respect of the same securities / instruments recommended in this research report during the preceding 12
months. Please contact the primary analyst listed in the first page of this report to view previous investment recommendations published by
DBS Bank Ltd, DBS Vickers Securities (Singapore) Pte Ltd (''DBSVS''), their subsidiaries and/or other affiliates in the preceding 12 months.
1 An associate is defined as (i) the spouse, or any minor child (natural or adopted) or minor step-child, of the analyst; (ii) the trustee of a trust of which the analyst, his spouse, minor child (natural or adopted) or minor step-child, is a beneficiary or discretionary object; or (iii) another person accustomed or obliged to act in accordance with the directions or instructions of the analyst.
2 Financial interest is defined as interests that are commonly known financial interest, such as investment in the securities in respect of an issuer or a new listing applicant, or financial accommodation arrangement between the issuer or the new listing applicant and the firm or analysis. This term does not include commercial lending conducted at arm's length, or investments in any collective investment scheme other than an issuer or new listing applicant notwithstanding the fact that the scheme has investments in securities in respect of an issuer or a new listing applicant.
Page 92

ed: CK / sa YM, PY, CS
BUYLast Traded Price ( 11 May 2018): S$1.36 (STI : 3,570.17) Price Target 12-mth: S$1.55 (14% upside) (Prev S$1.61)
Analyst Rui Wen LIM +65 66823720 [email protected] Sachin MITTAL +65 66823699 [email protected]
What’s New • Clarity on terminal dues impact as international mail
margins affected
• Look forward to a better FY19F
• Declared final dividend of 2 Scts (total dividend of 3.5Scts, unchanged from last year)
• Maintain BUY, TP revised to S$1.55 on lower earnings
Price Relative
Forecasts and Valuation FY Mar (S$m) 2017A 2018A 2019F 2020F Revenue 1,348 1,464 1,581 1,700 EBITDA 202 199 227 248 Pre-tax Profit 55.0 146 163 184 Net Profit 33.4 126 130 147 Net Pft (Pre Ex.) 122 112 130 147 Net Pft Gth (Pre-ex) (%) (10.8) (8.3) 16.4 12.8 EPS (S cts) 1.52 5.59 5.75 6.49 EPS Pre Ex. (S cts) 5.57 4.94 5.75 6.49 EPS Gth Pre Ex (%) (12) (11) 16 13 Diluted EPS (S cts) 1.52 5.59 5.75 6.49 Net DPS (S cts) 3.50 3.50 4.00 4.00 BV Per Share (S cts) 62.0 62.0 63.7 66.2 PE (X) 89.2 24.3 23.6 21.0 PE Pre Ex. (X) 24.4 27.5 23.6 21.0 P/Cash Flow (X) 14.9 15.5 19.9 13.8 EV/EBITDA (X) 16.7 17.1 15.0 13.4 Net Div Yield (%) 2.6 2.6 2.9 2.9 P/Book Value (X) 2.2 2.2 2.1 2.1 Net Debt/Equity (X) CASH CASH CASH CASH ROAE (%) 2.6 9.2 9.2 10.0 Earnings Rev (%): (9) (4) Consensus EPS (S cts): 5.7 6.4 Other Broker Recs: B: 7 S: 2 H: 1
Source of all data on this page: Company, DBS Bank, Bloomberg Finance L.P
All eyes on postal segment
Postal operating profit is bottoming out, maintain BUY with revised TP of S$1.55. We believe that its postal operating profit, which forms the bulk of the group’s operating profit, is bottoming as (1) SPOST has placed in mitigating measures to counter the impact of introduction of terminal dues in 4Q18, and (2) international mail volume from eCommerce continues to accelerate. SPOST has also demonstrated strong execution by narrowing losses at TradeGlobal, which we project to achieve breakeven in FY20F. While competition is still intense in the logistics segment in Hong Kong, it should benefit from growth in Singapore. SPOST eCommerce-related revenue grew 27% y-o-y and now forms c.60% of total revenue. With c.3% yield with FY18-20F earnings CAGR of 14%, SingPost is a unique play on Ecommerce-logistics growth in Asia.
Where we differ: We maintain our positive view over the long-term growth outlook for SPOST. We believe that SPOST, being the dominant player locally with low cost of capital, is well-positioned to establish market leadership in Singapore’s fragmented eCommerce logistics sector (~20% market share in parcels). Our earnings estimates are above consensus currently.
Potential catalyst: In the near term, any turnaround at SPOST’s eCommerce and logistics segments would be a major catalyst for its share price. In the medium term, we believe the potential divestment of SPC mall could be a catalyst.
Valuation: Maintain BUY, TP of S$1.55. We use DCF valuation (WACC 6%, terminal growth rate 3%) to derive our TP of S$1.55. The stock offers a yield of c.3% at the current share price. Key Risks to Our View: Impact of higher terminal dues (increase in international small packets postage rates cannot negate rise in terminal dues) and further escalation of eCommerce losses could depress SPOST's bottom line in the medium term. The opening of Alibaba’s regional logistics hub also posts downside risk for SPOST.
At A Glance Issued Capital (m shrs) 2,263 Mkt. Cap (S$m/US$m) 3,077 / 2,303 Major Shareholders (%) Temasek Holdings Private Ltd 21.9 Alibaba Investment Ltd 14.5
Free Float (%) 63.6 3m Avg. Daily Val (US$m) 5.7 ICB Industry : Industrials / Industrial Transportation
DBS Group Research . Equity 14 May 2018
Singapore Company Guide
Singapore Post Version 6 | Bloomberg: SPOST SP | Reuters: SPOS.SI Refer to important disclosures at the end of this report
Page 93

Company Guide
Singapore Post
WHAT’S NEW
Mixed set of results; look towards a better 2019
Revenues continue to grow; underlying net profit declines on lower operating profits. Headline revenues continued to see healthy growth of 13.5% y-o-y to S$367.5m (-11.0% q-o-q as the last quarter saw peak demand) across all three segments. NPAT came in at S$20.5m, reversing from a loss last year. However, adjusting for gains on one-off and exceptional items, including S$12.7m fair value gains on investment properties, underlying net profit declined to S$15.3m (-28.6% y-o-y, -43.4% q-o-q). Notably, higher professional fees and lower gains on trade-related foreign exchange differences have also impacted operating profit for 4Q18 by c.S$9.4m.
More clarity as terminal dues impact kicked in during the quarter; possible bottoming out of postal operating profit. Postal segment revenues continued to see strong growth on the back of international mail volumes, coming in at S$161.7m (+18.2% y-o-y, -2.6% q-o-q). Changes in international terminal dues took place from Jan 2018 and impacted the margins for international mail as the industry went through a period of adjustment during the quarter, even as SPOST increased postage rates for international small packets previously. The quarter saw sharp decline in operating profit margins to 20.5% (4Q17: 26.9%, 3Q18: 24.2%) while operating profit declined to S$33.2m (-9.8% y-o-y, -17.2% q-o-q).
Mitigation measures put in place during the quarter as a result. According to management, several mitigating measures were put in place during the quarter, such as price increases in certain mail segments and geographies, as well as increase in bilateral negotiations with various entities. SPOST expects that the full extent of the measures will be seen progressively in the new few quarters.
Logistics segment saw better contributions from last-mile entities. Revenue grew 2.1% q-o-q and declined 9.2% y-o-y to S$157.9m as last-mile entities (Couriers Please, SP Parcels, Famous) saw better performance against revenue decline in Quantium Solutions. Operating profit improved to S$5.3m during the quarter (+103.8 y-o-y, +8.2% q-o-q). There continued to be competitive pressures for Quantium Solutions in Hong Kong which is likely to be sustained in the near future. The eCommerce Logistics Hub saw improved utilisation at its warehouse to 96% (3Q18: 87%).
eCommerce on track for improved performance. While the eCommerce segment’s operating losses widened from S$3.8m in 3Q18 to S$5.8m this quarter, the second consecutive quarter, revenue continues to grow to replace loss of two major customers a year ago. TradeGlobal continues to add customers
over the course of the year as it lost two major customers last year. Management has indicated that on a year-on-year basis, losses have narrowed and it is on track to execute the turnaround business plans for TradeGlobal.
SingPost Centre retail mall saw higher committed occupancy. Committed occupancy improved from 85.9% in 3Q18 to 95.6% in 4Q18. We estimate the mall to generate ~S$19m per annum (operating profit level) going forward.
Dividends unchanged from last year. SPOST has declared a final dividend of 2 Scts this quarter, bringing total dividends for full year to 3.5 Scts, unchanged from last year.
Outlook and recommendation
Postal remains key segment to watch. We believe that with the roll-out of the various mitigating measures, SPOST may see another one to two quarters of volatility in postal operating profit before it stabilises. For the full year, international mail revenues saw an accelerated growth of 37.4% (FY17: 17.4%) against an accelerated decline in domestic mail of 6.6% (FY17: 5.4%) and we forecast growth to continue at c.30% in FY19F against domestic mail’s declining revenue of c.9%.
A better FY19F. We expect gross margins to see an improvement from FY18 which was hit by (1) terminal dues impact without the full mitigating measures in place, (2) absence of one-off provisions for logistics segment in FY19F, and (3) narrowing eCommerce losses. In the meantime, we believe SPOST is continuing to drive cost leadership across its various entities and this is likely to translate into operational efficiencies.
Maintain BUY, revised TP of S$1.55. We maintain our BUY call on SPOST with revised TP of S$1.55 as we reduce our earnings for FY19F/20F by 9%/4%, reduce our operating margin assumptions for the postal segment and envisage operating breakeven for the eCommerce segment to be in FY20F instead of FY19F. The stock is currently trading at c.23x forward PE which is near -2SD of its 4-year mean (since the start of its business transformation), supported by c.3% yield with FY18-20F earnings CAGR of 14%.
Page 94

Company Guide
Singapore Post
Quarterly / Interim Income Statement (S$m)
FY Mar 4Q2017 3Q2018 4Q2018 % chg yoy % chg qoq
Revenue 324 413 368 13.5 (11.0)
Cost of Goods Sold (405) (382) (342) (15.6) (10.5)
Gross Profit (81.7) 30.3 25.2 nm (16.9)
Other Oper. (Exp)/Inc 16.1 16.8 16.0 (1.0) (5.0)
Operating Profit (65.6) 47.1 41.2 (162.8) (12.6)
Other Non Opg (Exp)/Inc 0.0 0.0 0.0 - -
Associates & JV Inc (1.9) 0.95 (6.2) (227.9) nm
Net Interest (Exp)/Inc (5.4) (3.1) (3.6) 33.8 (13.8)
Exceptional Gain/(Loss) 0.0 0.0 0.0 - -
Pre-tax Profit (72.8) 44.9 31.4 nm (30.1)
Tax 1.77 (2.9) (10.9) nm 269.5
Minority Interest 5.55 1.02 3.40 (38.7) 232.2
Net Profit (65.5) 43.0 24.0 nm (44.3)
Net profit bef Except. (65.5) 43.0 24.0 nm (44.3)
EBITDA (42.0) 63.1 50.1 nm (20.7)
Margins (%)
Gross Margins (25.2) 7.3 6.9
Opg Profit Margins (20.2) 11.4 11.2
Net Profit Margins (20.2) 10.4 6.5
Source of all data: Company, DBS Bank
Page 95

Company Guide
Singapore Post
CRITICAL DATA POINTS TO WATCH
Critical Factors Terminal dues impact kicked in, mail segment's profitability may be bottoming out. SPOST’s domestic mail volumes are declining, which is limiting the revenue performance of the mail segment. Though higher international mail volumes, due to cross-border eCommerce, is offsetting most of the decline, lower margins of international mail, compared to domestic mail, is causing margin compression in the segment. As a result, mail segment’s profitability has remained relatively stagnant. This is likely to continue over the next 12 months. However, should there be faster growth in cross-border eCommerce, following the completion of its eCommerce logistics hub, and this could provide some support to the mail segment’s profitability. Margin compression accelerated in FY17 and may have bottomed out in the last quarter at 20.5% as the impact of terminal dues kicked in. SPOST has embarked on mitigating measures due to the rise in terminal dues.
eCommerce segment turnaround. eCommerce operating income is a critical driver of SPOST’s share price (see Appendix 1). Operating losses rose in 3Q17 due to foreign acquisitions, TradeGlobal and Jagged Peak. Jagged Peak has lost a couple of key customers in the US, impacting revenue and profitability. In addition, labour shortages and higher wage costs have also impeded profit improvements. Due to the disappointing results, SPOST took a S$185m impairment on TradeGlobal in 4Q17. Ongoing cost concerns and revenue losses could also have a negative impact in the medium term. As seen during the year, we believe losses are narrowing on a y-o-y basis and turnaround is in place.
Logistics may continue to face headwinds due to competition. We note that SPOST’s logistics business is currently facing tight operating margins and intense competition in Hong Kong, and see this trend continuing in the short term. However, SPOST’s eCommerce logistics hub started its operations in November 2016 have seen healthy utilisation which has helped SPOST in terms of cost management through automation through periods of peak demand. Management has been keen to point out there will be limited immediate savings through the project, with synergies realised only with scaling up. SPOST has seen healthy utilisation for both its warehouse space (from 45% when it first started to 96% currently) and parcel-sorting machine (21% utilisation).
Singapore Post Centre (SPC) mall rentals to supplement earnings in FY18/19. The redeveloped SPC mall will have a net lettable area of ~176,500sqf. Full rental income contribution for the mall will kick in come FY19. We estimate the mall to generate ~S$19m per annum (operating profit level).
Sales growth
EBIT
EBIT margin
Source: Company, DBS Bank
Page 96

Company Guide
Singapore Post
Appendix 1: A look at Company's listed history – what drives its share price?
Operating income as critical factor Remarks Historically, operating income (excluding one-offs) has been useful to explain share price direction and movements.
While rental income would supplement earnings from FY18 with the completion of SPC mall’s redevelopment, we believe that going forward, ability to establish market leadership in Singapore’s eCommerce logistics sector and impending turnaround of SPOST’s eCommerce and logistics segments, would be the key catalysts for SPOST’s share price.
SPOST’s share price movement We note that SPOST’s businesses have undergone a transformation since 2013 as it embarks on diversification plans on top of its core mail business
Source: Bloomberg Finance L.P., DBS Bank
Page 97

Company Guide
Singapore Post
Balance Sheet: Conservative balance sheet management. Following a 3-year period of capex and acquisitions, SPOST is likely to see muted investments and M&A activity in FY18 with an emphasis on scaling up its existing businesses. The management has also revised its dividend policy to better reflect the transitional period the company is going through. At present, SPOST has relatively minimal net gearing, following the recent share issue to Alibaba. As a result, with a lower dividend payout, we are likely to see a stronger balance sheet for SPOST in the near term.
Share Price Drivers: Lower dividend payments weigh on share price. SPOST has revised its dividend policy from a stable dividend payment to one based on a payout ratio of 60-80% of earnings, paid quarterly. Management has cited ongoing investments in eCommerce and other growth projects as the reason for the change. Based on muted earnings growth in the next 12-18 months, we believe the dividend payment for FY19 could come close to 4 Scts as per our current projections.
Potential growth due to Alibaba. SPOST issued 107.55m new shares to Alibaba, as agreed in 2015 strategic partnership, increasing Alibaba’s SPOST holding to 14.41% for S$187m. Alibaba also acquired 34% in Quantium Solutions International (SPOST’s subsidiary), for S$86.2m in October 2016. Despite the delays, the investment indicates that SPOST’s strategic partnership with Alibaba is starting to move forward. This could indicate a potential improvement in SPOST's volumes due to Alibaba as the eCommerce platform looks to expand its regional presence.
Key Risks: Competition could hamper logistics growth. The logistics segment’s profit growth is dependent upon increasing volumes, and tough competition in the logistics segment due to international logistics players could potentially hamper logistics and profit growth in the near term.
Further escalation of eCommerce losses. The eCommerce segment is facing losses following the acquisitions of Jagged Peak and TradeGlobal. A further escalation of losses in these businesses could depress SPOST’s bottom line in the medium term.
Company Background Singapore Post Limited (SPOST) is the national postal service provider in Singapore. Besides providing domestic and international postal and courier services, the company also offers end-to-end eCommerce logistics solutions.
Leverage & Asset Turnover (x)
Capital Expenditure
ROE (%)
Forward PE Band (x)
PB Band (x)
Source: Company, DBS Bank
Page 98
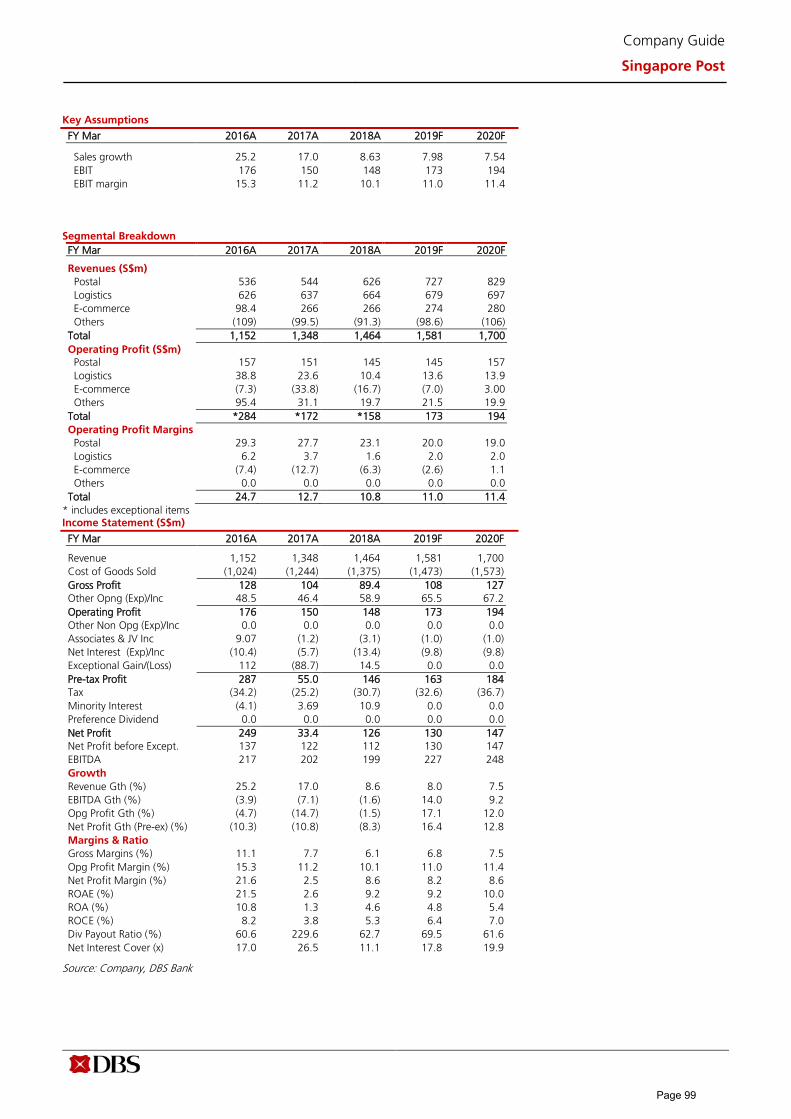
Company Guide
Singapore Post
Key Assumptions
FY Mar 2016A 2017A 2018A 2019F 2020F
Sales growth 25.2 17.0 8.63 7.98 7.54 EBIT 176 150 148 173 194 EBIT margin 15.3 11.2 10.1 11.0 11.4
Segmental Breakdown FY Mar 2016A 2017A 2018A 2019F 2020F
Revenues (S$m) Postal 536 544 626 727 829 Logistics 626 637 664 679 697 E-commerce 98.4 266 266 274 280 Others (109) (99.5) (91.3) (98.6) (106)
Total 1,152 1,348 1,464 1,581 1,700 Operating Profit (S$m)Postal 157 151 145 145 157 Logistics 38.8 23.6 10.4 13.6 13.9 E-commerce (7.3) (33.8) (16.7) (7.0) 3.00 Others 95.4 31.1 19.7 21.5 19.9
Total *284 *172 *158 173 194 Operating Profit Margins
Postal 29.3 27.7 23.1 20.0 19.0 Logistics 6.2 3.7 1.6 2.0 2.0 E-commerce (7.4) (12.7) (6.3) (2.6) 1.1 Others 0.0 0.0 0.0 0.0 0.0
Total 24.7 12.7 10.8 11.0 11.4 * includes exceptional itemsIncome Statement (S$m)
FY Mar 2016A 2017A 2018A 2019F 2020F
Revenue 1,152 1,348 1,464 1,581 1,700 Cost of Goods Sold (1,024) (1,244) (1,375) (1,473) (1,573) Gross Profit 128 104 89.4 108 127 Other Opng (Exp)/Inc 48.5 46.4 58.9 65.5 67.2 Operating Profit 176 150 148 173 194 Other Non Opg (Exp)/Inc 0.0 0.0 0.0 0.0 0.0 Associates & JV Inc 9.07 (1.2) (3.1) (1.0) (1.0) Net Interest (Exp)/Inc (10.4) (5.7) (13.4) (9.8) (9.8) Exceptional Gain/(Loss) 112 (88.7) 14.5 0.0 0.0 Pre-tax Profit 287 55.0 146 163 184 Tax (34.2) (25.2) (30.7) (32.6) (36.7) Minority Interest (4.1) 3.69 10.9 0.0 0.0 Preference Dividend 0.0 0.0 0.0 0.0 0.0 Net Profit 249 33.4 126 130 147 Net Profit before Except. 137 122 112 130 147 EBITDA 217 202 199 227 248 Growth Revenue Gth (%) 25.2 17.0 8.6 8.0 7.5 EBITDA Gth (%) (3.9) (7.1) (1.6) 14.0 9.2 Opg Profit Gth (%) (4.7) (14.7) (1.5) 17.1 12.0 Net Profit Gth (Pre-ex) (%) (10.3) (10.8) (8.3) 16.4 12.8 Margins & Ratio Gross Margins (%) 11.1 7.7 6.1 6.8 7.5 Opg Profit Margin (%) 15.3 11.2 10.1 11.0 11.4 Net Profit Margin (%) 21.6 2.5 8.6 8.2 8.6 ROAE (%) 21.5 2.6 9.2 9.2 10.0 ROA (%) 10.8 1.3 4.6 4.8 5.4 ROCE (%) 8.2 3.8 5.3 6.4 7.0 Div Payout Ratio (%) 60.6 229.6 62.7 69.5 61.6 Net Interest Cover (x) 17.0 26.5 11.1 17.8 19.9
Source: Company, DBS Bank
Page 99

Company Guide
Singapore Post
Quarterly / Interim Income Statement (S$m)
FY Mar 4Q2017 1Q2018 2Q2018 3Q2018 4Q2018
Revenue 324 354 355 413 368 Cost of Goods Sold (405) (328) (338) (382) (342) Gross Profit (81.7) 25.7 17.0 30.3 25.2 Other Oper. (Exp)/Inc 16.1 17.5 14.3 16.8 16.0 Operating Profit (65.6) 43.2 31.3 47.1 41.2 Other Non Opg (Exp)/Inc 0.0 0.0 0.0 0.0 0.0 Associates & JV Inc (1.9) (2.8) 4.92 0.95 (6.2) Net Interest (Exp)/Inc (5.4) (3.9) (2.8) (3.1) (3.6) Exceptional Gain/(Loss) 0.0 0.0 0.0 0.0 0.0 Pre-tax Profit (72.8) 36.5 33.3 44.9 31.4 Tax 1.77 (8.4) (8.5) (2.9) (10.9) Minority Interest 5.55 2.85 3.59 1.02 3.40 Net Profit (65.5) 31.0 28.5 43.0 24.0 Net profit bef Except. (65.5) 31.0 28.5 43.0 24.0 EBITDA (42.0) 55.1 51.3 63.1 50.1
Growth Revenue Gth (%) (12.4) 9.4 0.2 16.4 (11.0) EBITDA Gth (%) nm nm (6.9) 23.2 (20.7) Opg Profit Gth (%) (272.1) (165.9) (27.6) 50.7 (12.6) Net Profit Gth (Pre-ex) (%) (308.9) (147.3) (8.1) 51.1 (44.3) Margins Gross Margins (%) (25.2) 7.2 4.8 7.3 6.9 Opg Profit Margins (%) (20.2) 12.2 8.8 11.4 11.2 Net Profit Margins (%) (20.2) 8.7 8.0 10.4 6.5
Balance Sheet (S$m) FY Mar 2016A 2017A 2018A 2019F 2020F
Net Fixed Assets 517 566 532 538 544 Invts in Associates & JVs 146 118 115 114 113 Other LT Assets 1,384 1,426 1,451 1,451 1,451 Cash & ST Invts 127 367 314 318 391 Inventory 4.50 4.45 0.96 0.96 0.96 Debtors 210 199 272 233 251 Other Current Assets 26.2 37.6 40.0 40.0 40.0 Total Assets 2,416 2,717 2,725 2,695 2,791
ST Debt 71.1 149 23.5 23.5 23.5 Creditor 386 395 526 463 498 Other Current Liab 44.0 43.2 46.9 40.3 44.4 LT Debt 209 215 221 221 221 Other LT Liabilities 144 157 118 118 118 Shareholder’s Equity 1,550 1,706 1,750 1,789 1,846 Minority Interests 11.1 51.6 40.4 40.4 40.4 Total Cap. & Liab. 2,416 2,717 2,725 2,695 2,791
Non-Cash Wkg. Capital (189) (197) (260) (229) (251) Net Cash/(Debt) (154) 2.63 70.1 74.1 147 Debtors Turn (avg days) 59.3 55.4 58.7 58.3 52.0 Creditors Turn (avg days) 135.8 119.6 127.2 127.2 115.6 Inventory Turn (avg days) N/A N/A N/A N/A N/A Asset Turnover (x) 0.5 0.5 0.5 0.6 0.6 Current Ratio (x) 0.7 1.0 1.1 1.1 1.2 Quick Ratio (x) 0.7 1.0 1.0 1.0 1.1 Net Debt/Equity (X) 0.1 CASH CASH CASH CASH Net Debt/Equity ex MI (X) 0.1 CASH CASH CASH CASH Capex to Debt (%) 178.8 54.9 25.5 24.6 24.6 Z-Score (X) 3.0 2.7 2.8 2.8 2.9
Source: Company, DBS Bank
Includes exceptional items of S$8.6m
Reduced debt position in FY18
Page 100

Company Guide
Singapore Post
Cash Flow Statement (S$m)
FY Mar 2016A 2017A 2018A 2019F 2020F
Pre-Tax Profit 287 55.0 146 163 184 Dep. & Amort. 31.9 53.2 54.2 54.2 54.2 Tax Paid (30.6) (30.5) (31.2) (39.2) (32.6) Assoc. & JV Inc/(loss) (9.1) 1.18 3.10 1.00 1.00 Chg in Wkg.Cap. 3.52 9.73 58.4 (24.2) 17.3 Other Operating CF (152) 112 (32.5) 0.0 0.0 Net Operating CF 131 200 198 155 224 Capital Exp.(net) (501) (200) (62.1) (60.0) (60.0) Other Invts.(net) 0.0 0.0 0.0 0.0 0.0 Invts in Assoc. & JV 29.5 84.9 0.52 0.0 0.0 Div from Assoc & JV 2.17 2.58 0.93 0.0 0.0 Other Investing CF 12.5 22.7 11.9 0.0 0.0 Net Investing CF (457) (89.6) (48.8) (60.0) (60.0) Div Paid (167) (120) (45.4) (90.5) (90.5) Chg in Gross Debt 41.2 84.0 (119) 0.0 0.0 Capital Issues 17.4 190 0.0 0.0 0.0 Other Financing CF (23.5) (24.5) (37.8) 0.0 0.0 Net Financing CF (132) 130 (202) (90.5) (90.5) Currency Adjustments 0.0 0.0 0.0 0.0 0.0 Chg in Cash (458) 240 (52.6) 4.03 73.0 Opg CFPS (S cts) 5.94 8.69 6.18 7.90 9.11 Free CFPS (S cts) (17.2) 0.01 6.01 4.18 7.23
Source: Company, DBS Bank
Target Price & Ratings History
Source: DBS Bank Analyst: Rui Wen LIM
Sachin MITTAL
Expect capex to come down post completion of SPC Mall
Page 101

Company Guide
Singapore Post
DBS Bank recommendations are based an Absolute Total Return* Rating system, defined as follows:
STRONG BUY (>20% total return over the next 3 months, with identifiable share price catalysts within this time frame)
BUY (>15% total return over the next 12 months for small caps, >10% for large caps)
HOLD (-10% to +15% total return over the next 12 months for small caps, -10% to +10% for large caps)
FULLY VALUED (negative total return i.e. > -10% over the next 12 months)
SELL (negative total return of > -20% over the next 3 months, with identifiable catalysts within this time frame)
Share price appreciation + dividends
Completed Date: 14 May 2018 09:15:35 (SGT) Dissemination Date: 14 May 2018 09:44:42 (SGT)
Sources for all charts and tables are DBS Bank unless otherwise specified.
GENERAL DISCLOSURE/DISCLAIMER
This report is prepared by DBS Bank Ltd. This report is solely intended for the clients of DBS Bank Ltd, its respective connected and associated
corporations and affiliates only and no part of this document may be (i) copied, photocopied or duplicated in any form or by any means or (ii)
redistributed without the prior written consent of DBS Bank Ltd.
The research set out in this report is based on information obtained from sources believed to be reliable, but we (which collectively refers to DBS
Bank Ltd, its respective connected and associated corporations, affiliates and their respective directors, officers, employees and agents (collectively,
the “DBS Group”) have not conducted due diligence on any of the companies, verified any information or sources or taken into account any other
factors which we may consider to be relevant or appropriate in preparing the research. Accordingly, we do not make any representation or
warranty as to the accuracy, completeness or correctness of the research set out in this report. Opinions expressed are subject to change without
notice. This research is prepared for general circulation. Any recommendation contained in this document does not have regard to the specific
investment objectives, financial situation and the particular needs of any specific addressee. This document is for the information of addressees
only and is not to be taken in substitution for the exercise of judgement by addressees, who should obtain separate independent legal or financial
advice. The DBS Group accepts no liability whatsoever for any direct, indirect and/or consequential loss (including any claims for loss of profit)
arising from any use of and/or reliance upon this document and/or further communication given in relation to this document. This document is not
to be construed as an offer or a solicitation of an offer to buy or sell any securities. The DBS Group, along with its affiliates and/or persons
associated with any of them may from time to time have interests in the securities mentioned in this document. The DBS Group, may have
positions in, and may effect transactions in securities mentioned herein and may also perform or seek to perform broking, investment banking and
other banking services for these companies.
Any valuations, opinions, estimates, forecasts, ratings or risk assessments herein constitutes a judgment as of the date of this report, and there can
be no assurance that future results or events will be consistent with any such valuations, opinions, estimates, forecasts, ratings or risk assessments.
The information in this document is subject to change without notice, its accuracy is not guaranteed, it may be incomplete or condensed, it may
not contain all material information concerning the company (or companies) referred to in this report and the DBS Group is under no obligation to
update the information in this report.
This publication has not been reviewed or authorized by any regulatory authority in Singapore, Hong Kong or elsewhere. There is no planned
schedule or frequency for updating research publication relating to any issuer.
The valuations, opinions, estimates, forecasts, ratings or risk assessments described in this report were based upon a number of estimates and
assumptions and are inherently subject to significant uncertainties and contingencies. It can be expected that one or more of the estimates on
which the valuations, opinions, estimates, forecasts, ratings or risk assessments were based will not materialize or will vary significantly from actual
results. Therefore, the inclusion of the valuations, opinions, estimates, forecasts, ratings or risk assessments described herein IS NOT TO BE RELIED
UPON as a representation and/or warranty by the DBS Group (and/or any persons associated with the aforesaid entities), that:
(a) such valuations, opinions, estimates, forecasts, ratings or risk assessments or their underlying assumptions will be achieved, and
(b) there is any assurance that future results or events will be consistent with any such valuations, opinions, estimates, forecasts, ratings or risk
assessments stated therein.
Please contact the primary analyst for valuation methodologies and assumptions associated with the covered companies or price targets.
Any assumptions made in this report that refers to commodities, are for the purposes of making forecasts for the company (or companies)
mentioned herein. They are not to be construed as recommendations to trade in the physical commodity or in the futures contract relating to the
commodity referred to in this report.
Page 102

Company Guide
Singapore Post
DBSVUSA, a US-registered broker-dealer, does not have its own investment banking or research department, has not participated in any public
offering of securities as a manager or co-manager or in any other investment banking transaction in the past twelve months and does not engage
in market-making.
ANALYST CERTIFICATION
The research analyst(s) primarily responsible for the content of this research report, in part or in whole, certifies that the views about the
companies and their securities expressed in this report accurately reflect his/her personal views. The analyst(s) also certifies that no part of his/her
compensation was, is, or will be, directly or indirectly, related to specific recommendations or views expressed in the report. The research analyst (s)
primarily responsible for the content of this research report, in part or in whole, certifies that he or his associate1 does not serve as an officer of the
issuer or the new listing applicant (which includes in the case of a real estate investment trust, an officer of the management company of the real
estate investment trust; and in the case of any other entity, an officer or its equivalent counterparty of the entity who is responsible for the
management of the issuer or the new listing applicant) and the research analyst(s) primarily responsible for the content of this research report or
his associate does not have financial interests2 in relation to an issuer or a new listing applicant that the analyst reviews. DBS Group has
procedures in place to eliminate, avoid and manage any potential conflicts of interests that may arise in connection with the production of
research reports. The research analyst(s) responsible for this report operates as part of a separate and independent team to the investment
banking function of the DBS Group and procedures are in place to ensure that confidential information held by either the research or investment
banking function is handled appropriately. There is no direct link of DBS Group's compensation to any specific investment banking function of the
DBS Group.
COMPANY-SPECIFIC / REGULATORY DISCLOSURES
1. DBS Bank Ltd, DBS HK, DBS Vickers Securities (Singapore) Pte Ltd (''DBSVS''), DBSV HK or their subsidiaries and/or other affiliates have a
proprietary position in Singapore Post recommended in this report as of 30 Apr 2018.
2. Neither DBS Bank Ltd, DBS HK nor DBSV HK market makes in equity securities of the issuer(s) or company(ies) mentioned in this Research
Report.
Compensation for investment banking services:
3. DBSVUSA does not have its own investment banking or research department, nor has it participated in any public offering of securities as a
manager or co-manager or in any other investment banking transaction in the past twelve months. Any US persons wishing to obtain further
information, including any clarification on disclosures in this disclaimer, or to effect a transaction in any security discussed in this document
should contact DBSVUSA exclusively.
Disclosure of previous investment recommendation produced:
4. DBS Bank Ltd, DBS Vickers Securities (Singapore) Pte Ltd (''DBSVS''), their subsidiaries and/or other affiliates may have published other
investment recommendations in respect of the same securities / instruments recommended in this research report during the preceding 12
months. Please contact the primary analyst listed in the first page of this report to view previous investment recommendations published by
DBS Bank Ltd, DBS Vickers Securities (Singapore) Pte Ltd (''DBSVS''), their subsidiaries and/or other affiliates in the preceding 12 months.
1 An associate is defined as (i) the spouse, or any minor child (natural or adopted) or minor step-child, of the analyst; (ii) the trustee of a trust of which the analyst, his spouse, minor child (natural or adopted) or minor step-child, is a beneficiary or discretionary object; or (iii) another person accustomed or obliged to act in accordance with the directions or instructions of the analyst.
2 Financial interest is defined as interests that are commonly known financial interest, such as investment in the securities in respect of an issuer or a new listing applicant, or financial accommodation arrangement between the issuer or the new listing applicant and the firm or analysis. This term does not include commercial lending conducted at arm's length, or investments in any collective investment scheme other than an issuer or new listing applicant notwithstanding the fact that the scheme has investments in securities in respect of an issuer or a new listing applicant.
Page 103

Company Guide
Singapore Post
RESTRICTIONS ON DISTRIBUTION
General This report is not directed to, or intended for distribution to or use by, any person or entity who is a citizen or resident of or located in any locality, state, country or other jurisdiction where such distribution, publication, availability or use would be contrary to law or regulation.
Australia This report is being distributed in Australia by DBS Bank Ltd. (“DBS”) or DBS Vickers Securities (Singapore) Pte Ltd (“DBSVS”). DBS holds Australian Financial Services Licence no. 475946.
DBSVS is exempted from the requirement to hold an Australian Financial Services Licence under the Corporation Act 2001 (“CA”) in respect of financial services provided to the recipients. DBSVS is regulated by the Monetary Authority of Singapore under the laws of Singapore, which differ from Australian laws.
Distribution of this report is intended only for “wholesale investors” within the meaning of the CA.
Hong Kong This report has been prepared by a person(s) who is not licensed by the Hong Kong Securities and Futures Commission to carry on the regulated activity of advising on securities in Hong Kong pursuant to the Securities and Futures Ordinance (Chapter 571 of the Laws of Hong Kong). This report is being distributed in Hong Kong and is attributable to DBS Vickers Hong Kong Limited, a licensed corporation licensed by the Hong Kong Securities and Futures Commission to carry on the regulated activity of advising on securities pursuant to the Securities and Futures Ordinance (Chapter 571 of the Laws of Hong Kong).
For any query regarding the materials herein, please contact Paul Yong (CE. No. ASE988) at [email protected].
Indonesia This report is being distributed in Indonesia by PT DBS Vickers Sekuritas Indonesia.
Malaysia This report is distributed in Malaysia by AllianceDBS Research Sdn Bhd ("ADBSR"). Recipients of this report, received from ADBSR are to contact the undersigned at 603-2604 3333 in respect of any matters arising from or in connection with this report. In addition to the General Disclosure/Disclaimer found at the preceding page, recipients of this report are advised that ADBSR (the preparer of this report), its holding company Alliance Investment Bank Berhad, their respective connected and associated corporations, affiliates, their directors, officers, employees, agents and parties related or associated with any of them may have positions in, and may effect transactions in the securities mentioned herein and may also perform or seek to perform broking, investment banking/corporate advisory and other services for the subject companies. They may also have received compensation and/or seek to obtain compensation for broking, investment banking/corporate advisory and other services from the subject companies.
Wong Ming Tek, Executive Director, ADBSR
Singapore This report is distributed in Singapore by DBS Bank Ltd (Company Regn. No. 196800306E) or DBSVS (Company Regn No. 198600294G), both of which are Exempt Financial Advisers as defined in the Financial Advisers Act and regulated by the Monetary Authority of Singapore. DBS Bank Ltd and/or DBSVS, may distribute reports produced by its respective foreign entities, affiliates or other foreign research houses pursuant to an arrangement under Regulation 32C of the Financial Advisers Regulations. Where the report is distributed in Singapore to a person who is not an Accredited Investor, Expert Investor or an Institutional Investor, DBS Bank Ltd accepts legal responsibility for the contents of the report to such persons only to the extent required by law. Singapore recipients should contact DBS Bank Ltd at 6327 2288 for matters arising from, or in connection with the report.
Thailand This report is being distributed in Thailand by DBS Vickers Securities (Thailand) Co Ltd.
Page 104

Company Guide
Singapore Post
United Kingdom
This report is produced by DBS Bank Ltd which is regulated by the Monetary Authority of Singapore.
This report is disseminated in the United Kingdom by DBS Vickers Securities (UK) Ltd, ("DBSVUK"). DBSVUK is authorised and regulated by the Financial Conduct Authority in the United Kingdom.
In respect of the United Kingdom, this report is solely intended for the clients of DBSVUK, its respective connected and associated corporations and affiliates only and no part of this document may be (i) copied, photocopied or duplicated in any form or by any means or (ii) redistributed without the prior written consent of DBSVUK. This communication is directed at persons having professional experience in matters relating to investments. Any investment activity following from this communication will only be engaged in with such persons. Persons who do not have professional experience in matters relating to investments should not rely on this communication.
Dubai International Financial Centre
This research report is being distributed by DBS Bank Ltd., (DIFC Branch) having its office at PO Box 506538, 3rd Floor, Building 3, East Wing, Gate Precinct, Dubai International Financial Centre (DIFC), Dubai, United Arab Emirates. DBS Bank Ltd., (DIFC Branch) is regulated by The Dubai Financial Services Authority. This research report is intended only for professional clients (as defined in the DFSA rulebook) and no other person may act upon it.
United Arab Emirates
This report is provided by DBS Bank Ltd (Company Regn. No. 196800306E) which is an Exempt Financial Adviser as defined in the Financial Advisers Act and regulated by the Monetary Authority of Singapore. This report is for information purposes only and should not be relied upon or acted on by the recipient or considered as a solicitation or inducement to buy or sell any financial product. It does not constitute a personal recommendation or take into account the particular investment objectives, financial situation, or needs of individual clients. You should contact your relationship manager or investment adviser if you need advice on the merits of buying, selling or holding a particular investment. You should note that the information in this report may be out of date and it is not represented or warranted to be accurate, timely or complete. This report or any portion thereof may not be reprinted, sold or redistributed without our written consent.
United States This report was prepared by DBS Bank Ltd. DBSVUSA did not participate in its preparation. The research analyst(s) named on this report are not registered as research analysts with FINRA and are not associated persons of DBSVUSA. The research analyst(s) are not subject to FINRA Rule 2241 restrictions on analyst compensation, communications with a subject company, public appearances and trading securities held by a research analyst. This report is being distributed in the United States by DBSVUSA, which accepts responsibility for its contents. This report may only be distributed to Major U.S. Institutional Investors (as defined in SEC Rule 15a-6) and to such other institutional investors and qualified persons as DBSVUSA may authorize. Any U.S. person receiving this report who wishes to effect transactions in any securities referred to herein should contact DBSVUSA directly and not its affiliate.
Other jurisdictions
In any other jurisdictions, except if otherwise restricted by laws or regulations, this report is intended only for qualified, professional, institutional or sophisticated investors as defined in the laws and regulations of such jurisdictions.
Page 105

Company Guide
Singapore Post
DBS Regional Research Offices
HONG KONG DBS Vickers (Hong Kong) Ltd Contact: Paul Yong 18th Floor Man Yee Building 68 Des Voeux Road Central Central, Hong Kong Tel: 65 6878 8888 Fax: 65 65353 418 e-mail: [email protected] of the Stock Exchange of Hong Kong
MALAYSIA AllianceDBS Research Sdn Bhd Contact: Wong Ming Tek (128540 U) 19th Floor, Menara Multi-Purpose, Capital Square, 8 Jalan Munshi Abdullah 50100 Kuala Lumpur, Malaysia. Tel.: 603 2604 3333 Fax: 603 2604 3921 e-mail: [email protected]
SINGAPORE DBS Bank Ltd Contact: Janice Chua 12 Marina Boulevard, Marina Bay Financial Centre Tower 3 Singapore 018982 Tel: 65 6878 8888 Fax: 65 65353 418 e-mail: [email protected] Regn. No. 196800306E
INDONESIA PT DBS Vickers Sekuritas (Indonesia) Contact: Maynard Priajaya Arif DBS Bank Tower Ciputra World 1, 32/F Jl. Prof. Dr. Satrio Kav. 3-5 Jakarta 12940, Indonesia Tel: 62 21 3003 4900 Fax: 6221 3003 4943 e-mail: [email protected]
THAILAND DBS Vickers Securities (Thailand) Co Ltd Contact: Chanpen Sirithanarattanakul 989 Siam Piwat Tower Building, 9th, 14th-15th Floor Rama 1 Road, Pathumwan, Bangkok Thailand 10330 Tel. 66 2 857 7831 Fax: 66 2 658 1269 e-mail: [email protected] Regn. No 0105539127012Securities and Exchange Commission, Thailand
Page 106

ed: TH / sa PY, CS
BUYLast Traded Price ( 4 May 2018): S$3.50 (STI : 3,545.38)
Price Target 12-mth: S$3.85 (10% upside) (Prev S$4.30)
Analyst Sachin MITTAL +65 66823699 [email protected]
What’s New FY18F/19F earnings trimmed 5%/10% mainly due to
expected drop in Telkomsel’s contribution
Expect 4Q18F underlying profit of S$824m (-17% y-o-
y, -8% q-o-q) on 17 May due to weak Telkomsel &
Bharti
Maintain BUY with revised TP of S$3.85; core business
is trading at a 20-30% discount to its peers
Price Relative
Forecasts and Valuation FY Mar (S$m) 2017A 2018F 2019F 2020F
Revenue 16,711 17,609 18,209 18,763 EBITDA 8,017 7,567 7,716 8,300 Pre-tax Profit 5,364 6,795 4,863 5,284 Net Profit 3,853 5,494 3,540 3,795 Net Pft (Pre Ex.) 3,929 3,560 3,540 3,795 Net Pft Gth (Pre-ex) (%) 3.0 (9.4) (0.6) 7.2 EPS (S cts) 23.6 33.6 21.7 23.2 EPS Pre Ex. (S cts) 24.1 21.8 21.7 23.2 EPS Gth Pre Ex (%) 1 (9) (1) 7 Diluted EPS (S cts) 23.6 33.6 21.7 23.2 Net DPS (S cts) 17.5 20.5 17.6 17.5 BV Per Share (S cts) 173 189 190 196 PE (X) 14.8 10.4 16.1 15.1 PE Pre Ex. (X) 14.5 16.1 16.1 15.1 P/Cash Flow (X) 15.6 11.8 13.9 13.4 EV/EBITDA (X) 8.5 8.7 8.7 8.1 Net Div Yield (%) 5.0 5.9 5.0 5.0 P/Book Value (X) 2.0 1.9 1.8 1.8 Net Debt/Equity (X) 0.4 0.3 0.3 0.3 ROAE (%) 14.5 18.6 11.4 12.1
Earnings Rev (%): (5) (10) N/A Consensus EPS (S cts): 23.9 24.4 26.2 Other Broker Recs: B: 15 S: 0 H: 7
Source of all data on this page: Company, DBS Bank, Bloomberg Finance L.P
4Q18F preview; negatives in the price Offers 6% earnings CAGR over FY18-20F with a decent 5%
dividend yield. Singtel is a unique telco-tech play which is
beginning to reap the benefits of digital investments made 3-4
years ago and is ahead of its regional peers on digital
transformation efforts. However, we trim our FY18F/19F
earnings by 5%/10% mainly on the back of a potential drop in
contribution from Telkomsel which might lead to sluggish
4Q18F and 1Q19F results. Excluding the market cap of its
associates, Singtel’s core business is trading at only 5.7x FY19F
EV/EBITDA at ~20-30% discount to its regional and local peers.
Where we differ: Digital businesses should not be valued like a
telco business. Due to EBITDA losses incurred in the Digital Life!
and cyber security businesses, the market ascribes a negative
value to them. We argue that these businesses are worth
S$0.14 per share based on ~1x revenue multiple as scale is the
key for such businesses and Singtel has already shown the
capability to turn around a loss-making digital advertising
business into positive EBITDA territory.
Potential catalysts: Final DPS of 10.7 Scts and sequential
earnings growth from 2Q19F onwards. Singtel has a track
record of maintaining final DPS at 10.7 Scts, ex-dividend in early
August. Earnings to grow from 2Q19 onwards due to recovery
of Telkomsel and resumption of National Broadband Network
(NBN) migration fee in Australia.
Valuation: We use a sum-of-the-parts (SOTP) valuation for Singtel to
derive a target price of S$3.85 with a key change being sharply
lower valuation accounting for ~20% of our Singtel’s valuation
versus ~30% earlier.
Key Risks to Our View: Bear-case TP of S$3.20 if core and associates disappoint. If
core EBITDA were to decline 3% annually over FY18-20F due
to new mobile entrants (base case of 3% CAGR) and if Bharti’s
and Telkomsel’s market value were to drop 20% each, our fair
value could decline to S$3.20.
At A Glance Issued Capital (m shrs) 16,329
Mkt. Cap (S$m/US$m) 57,151 / 42,819
Major Shareholders (%)
Temasek Holdings 52.3
Free Float (%) 47.7
3m Avg. Daily Val (US$m) 65.6
ICB Industry : Telecommunications / Fixed Line Telecommunications
DBS Group Research . Equity 7 May 2018
Singapore Company Guide
Singtel Version 3 | Bloomberg: ST SP | Reuters: STEL.SI Refer to important disclosures at the end of this report
Page 107

Company Guide
Singtel
WHAT’S NEW
Telkomsel weakness
We trim Singtel’s FY18F/19F earnings by 5%/10%. This is
mainly on the back of a potential drop in contribution from
Telkomsel leading to potentially weak 4Q18F and 1Q19F
results.
Telkomsel has contributed ~30% of Singtel’s post-tax earnings
so far this year. The Indonesian telecom sector is suffering due
to mandatory SIM registration exercise and huge
cannibalisation of voice and SMS revenue by cheap data.
Telkomsel’s 1Q18 earnings (4Q18F for Singtel) were 15%
below our expectations as mobile revenue fell ~2% y-o-y
versus expectations of 2-3% growth. There are signs of
improved competition after the SIM card registration cut-off
date of 1 May 2018 as smaller players cannot continue to sell
cheap SIM cards. This will be positive for Telkomsel in the
longer term. However, the damage has been done and
industry repair will take some time. We have cut our
FY19F/20F earnings for Telkomsel by 20%/27% on the back of
slower industry revenue growth assumption.
Associate Pre-tax contributions (S$m)
FY17A FY18F FY19F FY20F
Telkomsel 1422 1,367 1,262 1,260
Bharti Airtel 580 262 253 602
AIS 420 450 534 569
Globe 288 248 255 287
NetLink 159 74 15 20
Others 72 50 57 64
Total 2,941 2,450 2,375 2,802
YoY Growth FY18F FY19F FY20F
Telkomsel -4% -8% 0%
Bharti Airtel -55% -3% 138%
AIS 7% 19% 7%
Globe -14% 3% 13%
NetLink -53% -79% 31%
Others -31% 13% 13%
Overall -17% -3% 18%
Source: DBS Bank for Telkomsel, SingPost and NetLink, DBS Vickers for
AIS, Consensus Blomberg estimates for Bharti, Globe and others
4Q18F Earnings Preview Currency S$m
FY MAR (m) 4Q17 3Q18 4Q18F YoY QoQ
Sales 4308 4603 4404 2% -4%
Cost of Goods Sold
-3061 -3391 -3167
Gross Profit 1247 1212 1237
Other Operating Income
61 81 25
Depreciation & Amortisation
-585 -586 -601 3% 3%
EBIT 723 707 661 -9% -6%
Interest Income 48
Interest Expense
-82 -81 -137
Share of Associates' or JV Income
720 553 505 -30% -9%
Exceptional Gains/(Losses)
-25 -8 11
Pretax Profit 1336 1171 1088
Tax -381 -290 -234
Minority Interests
8 8 -30
Net Profit 963.0 890.0 824 -14% -7%
Underlying profit
988.0 898.0 824 -17% -8%
Source: Company for past results, DBS Bank for 4Q18F
Core operating profit and associate contribution to hurt 4Q18F
results to be reported on 17 May. Potential 6% drop in EBIT
sequentially due to an absence of ~A$70m of NBN migration
fee in 4Q18F which was temporarily halted in November 2017.
Potential 9% drop in pre-tax associate contribution with
Telkomsel's contribution falling to ~S$300m in 4Q18F versus
S$330m in 3Q18 and Bharti's contribution falling to S$8m
versus S$38m in 3Q18 offset partially by rise in contribution
from Advance Info Service (AIS) Thailand.
Page 108

Company Guide
Singtel
Digital businesses should be valued separately on different
metrics. Due to EBITDA losses incurred in the Digital Life! and
cyber security businesses, the market ascribes a negative value
to them. We argue that these businesses are worth S$0.14 per
share based on ~1x revenue multiple as scale is the key for such
businesses and Singtel has already shown its capabilities by
turning around a loss-making digital advertising business into
positive EBITDA territory.
Valuation of Digital businesses
Digital business FY19F Rev (S$m) EV/EBITDA EV
Cyber security 648 1.46 948
Digital Life 1,356 0.98 1,322
2,270
Per share (S$) 0.14
Source: DBS Bank
Digital Life is worth S$1.3bn. We have valued Singtel’s Digital Life business at S$1.3bn using a mix of Singtel’s adtech acquisition prices and EV/Revenue multiples of recent industry acquisitions. To be conservative, we have used a 25% discount to account for any valuation premium for Singtel’s ad tech acquisition prices. Similarly, we apply a 25% discount to EV/revenue multiple of 1.31x for recent industry acquisitions in order to be conservative. Using the average value of the two methods, we have arrived at an enterprise value of S$1.3bn for Singtel’s Digital Life business.
Singtel cybersecurity business is worth ~S$1bn. We have valued Singtel’s cybersecurity business at S$948m using a mix of Trustwave acquisition price and Industry EV/Revenue
multiples. To be conservative, we have used a 25% discount to account for any valuation premium for Trustwave’s acquisition price. Similarly, we have used a 10% liquidity discount on the industry EV/revenue multiple of 2.51x to be conservative. Using the average value of the two methods, we have arrived at an enterprise value of S$948m for Singtel’s cybersecurity business.
Final DPS of 10.7 Scts is a potential catalyst. Singtel has a track record of maintaining its final DPS at 10.7 Scts and interim dividend of 6.8 Scts over the last three years. We think that Singtel is trying to maintain or enhance dividends and its earnings payout ratio of 70-75% has some room to increase in FY19F.
Sequential earnings growth from 2Q19F onwards could be another catalyst. Earnings are likely to grow from 2Q19 onwards due to recovery of Telkomsel and resumption of National Broadband Network (NBN) migration fee in Australia. Telkomsel is expected to stage a comeback in earnings as competition improves after the SIM card registration cut-off date of 1 May 2018. Besides, Singtel could also benefit from resumption of NBN migration fee of A$60-70m each quarter in Australia which was stopped by the regulator in November 2017 due to the technical issues but is expected to resume between June and August 2018.
Core business trading at 20-30% valuation discount versus local peers is hard to justify. The market is attaching a significant valuation discount to the core plus digital business of Singtel, possibly over concerns on the magnitude of losses in the digital segment in the past. This has resulted in Singtel’s core plus digital businesses trading at only 5.7x FY19F EV/EBITDA versus ~7x for M1 and ~9x for StarHub, despite having a much more resilient business model.
Singtel's Valuation Breakdown
Singtel's Valuation Value (S$ m) Per share (S$) Valuation Basis
Singapore core business 16,981 7x FY 19F EV/EBITDA based on regional average
Australia core business 20,412 7x FY 19F EV/EBITDA based on regional average
Digital Business 2,270
Net Debt -9,829
Equity value of the core business 29,817 1.69
Regional telco investments 2.12 Closing Share prices, 15x PE for Telkomsel assuming 10% y-o-y drop in earnings
Share value 3.85
Source: Company, DBS Bank
We have valued Singtel’s Singapore and Australia operations at FY19F EV/EBITDA valuations of 7x each. Valuations of regional associates: AIS and SingPost are based on our fair value estimates, while the valuation of Telkomsel is based on an FY19F PE (March YE) of 15x as we assume a 10% y-o-y drop in
Telkomsel’s earnings. We have used the current share prices to determine the carrying value of other associate holdings of Singtel.
Page 109

Company Guide
Singtel
Associates' valuation contribution based on the current market capitalisation
Associates Total shares Share price Exchange rate Stake Value (S$ m) Per Share (S$)
Airtel 3,997 395.00 50.50 40% 12,350 0.70
AIS 2,973 208.00 23.80 32% 8,263 0.47
Globe* 132 1540.00 38.90 47% 2,466 0.14
Singpost 2,273 1.33 1.00 22% 657 0.04
FY19F (Mar YE) Profit (Rpb)
FY19F PER Stake Value (S$ m)
Telkomsel 27,000 15 10,505 35% 13,494 0.77
Total 37,230
Holding company discount (5%) -1,861
Net investment holdings 35,368 2.12
Based on our estimates, Singtel’s core plus digital business is trading at ~28% valuation discount vs. regional peers. Source: DBS Bank, company
Singtel’s Core business is trading at a significant discount to regional peers
Source: DBS Bank, Reuters
5.7
12.9
6.9
8.6
6.6
4.4
13.011.8
6.9 6.9
9.4
5.1
Sin
gte
l Co
re
Sin
gte
l
M1
Star
Hu
b
Telk
om XL
Dig
i
Max
is
TM
Axi
ata
AIS
DTA
C
Forward EV/EBITDA
Page 110

Company Guide
Singtel
CRITICAL DATA POINTS TO WATCH
Critical Factors Associate pre-tax contribution to decline 3% in FY19F before rising
18% in FY20F. Going forward, we expect AIS and SingPost to
drive growth in FY19F partially offsetting weakness from Telkomsel
and Bharti. AIS benefits from benign competition in Thailand while
SingPost is likely to benefit from rising volume of e-commerce
international mail and parcels. Meanwhile, Telkomsel and Bharti are
facing earnings headwinds due to competitive pressures and
industry trends. Bharti is likely to see some decline in FY19F
earnings due to an aggressive Jio in India while Telkomsel is
burdened with continued reliance on legacy revenues. However,
Bharti could be the key growth driver in FY20F due to industry
consolidation in India.
Low single-digit EBITDA growth due to growth in Australia and
lower losses in Digital Life. We expect the core business of Singtel
(Singapore + Optus) to see low single-digit EBITDA growth in FY19F
similar to what we have seen in FY18 so far. Singtel could also
benefit from resumption of the NBN migration fee of A$ 60-70m
each quarter in Australia. The project was halted by the regulator in
November 2017 due to technical issues. However, NBN migration is
expected to resume between June and August 2018, resultantly
boosting Singtel’s EBITDA. In addition, Digital Life segment is
expected to make significant reductions on its EBITDA losses, which
should lift Singtel’s overall EBITDA.
Singapore Revenue (S$m)
Singapore EBITDA Margin (%)
Optus Revenue (A$m)
Optus EBITDA Margin (%)
Associate pre-tax earnings (S$m)
Source: Company, DBS Bank
Page 111

Company Guide
Singtel
Appendix 1: A look at Company's listed history – what drives its share price?
Associate profits are the most critical factor followed by the EBITDA. In the critical factor analysis, we conducted over the past ~10 years, Singtel's share price seems to follow Associate profits and EBITDA. Singtel’s share price change had a positive correlation of 0.20 with the associate profit and a positive correlation of 0.22 with EBITDA. The two factors are directly indicative of the profitability and cash flow generation of Singtel and are very important factors in understanding the overall health of the firm.
Share price vs associate profits
Share price vs EBITDA
Source: Company, DBS Bank
0
500
1000
1500
2000
2500
3000
3500
0.00
0.50
1.00
1.50
2.00
2.50
3.00
3.50
4.00
4.50
5.00
May04
May05
May06
May07
May08
May09
May10
May11
May12
May13
May14
May15
May16
S$ M
n
S$
Share price (LHS) Associate profits (RHS)
0
1,000
2,000
3,000
4,000
5,000
6,000
7,000
8,000
9,000
0.00
0.50
1.00
1.50
2.00
2.50
3.00
3.50
4.00
4.50
5.00
May04
May05
May06
May07
May08
May09
May10
May11
May12
May13
May14
May15
May16
S$ M
n
S$
Share price (LHS) EBITDA
Page 112

Company Guide
Singtel
Balance Sheet: Strong balance sheet. This is reflected in FY18F net debt-to-
EBITDA of only ~1.3x giving ample room to Singtel to invest in
new business opportunities and/or raise its earnings payout ratio
from 70-75% now. If Singtel were to leverage to 2x net debt-
to-EBITDA, it implies the company could borrow another S$5bn
if it wants to. In our view, Singtel should be able to sustain its
dividends at the current level even if earnings were to decline
due to any reason.
Share Price Drivers: Sequential growth in earnings from 2Q19F onwards. We see potential catalyst for earnings growth at Singtel from 2Q19 with the recovery of Telkomsel and resumption of NBN migration fees in Australia. Telkomsel could benefit from a benign competitive environment in Indonesia from 2Q18, with the end of the ongoing prepaid SIM registration period. Singtel could also benefit from resumption of NBN migration fee of AS60-70m each quarter in Australia which was stopped by the regulator in November 2017 due to the technical issues but is expected to resume between June and August 2018.
Final and interim dividends. Singtel has a track record of
maintaining final DPS at 10.7 Scts and interim dividend at 6.8
Scts over the last three years. We think that Singtel is trying to
maintain or enhance dividends and its earnings payout ratio of
70-75% has some room to increase in FY19F.
Key Risks: Bear-case valuation for Singtel is S$3.20. If core EBITDA were
to decline 3% each year over FY18-20F due to new mobile
entrants (base case of 3% CAGR) and if Bharti’s and
Telkomsel’s market value were to drop 20% each, our fair
value could decline to S$3.20.
Bull-case valuation for Singtel is S$4.40. In our bull case, we
have assumed core EBITDA to grow 6% each over FY18-20F
despite new mobile entrants in Singapore and Australia and if
Bharti’s market value were to increase 20% along with a 10%
growth in Telkomsel’s earnings for FY18F, our fair value could
rise to S$4.40.
Company Background Singtel is the largest telecom operator in Singapore and its
Australian subsidiary Optus is the second largest operator in
Australia. Singtel also has substantial stakes in telcos in the
region - Telkomsel in Indonesia, Bharti in India, AIS in Thailand
and Globe in Philippines.
Leverage & Asset Turnover (x)
Capital Expenditure
ROE (%)
Forward PE Band (x)
PB Band (x)
Source: Company, DBS Bank
Page 113

Company Guide
Singtel
Key Assumptions
FY Mar 2016A 2017A 2018F 2019F 2020F
Singapore Revenue (S$m) 7,663 7,927 8,497 8,823 9,190 Singapore EBITDA Margin (%)
28.5 27.9 25.9 26.7 26.7
Optus Revenue (A$m) 9,106 8,425 8,762 9,025 9,205
Optus EBITDA Margin (%) 30.4 0.0 0.0 0.0 0.0
Associate pre-tax earnings (S$m)
2,788 2,942 2,450 2,375 2,802
Income Statement (S$m)
FY Mar 2016A 2017A 2018F 2019F 2020F
Revenue 16,961 16,711 17,609 18,209 18,763
Cost of Goods Sold (12,097) (11,929) (12,719) (13,095) (13,491)
Gross Profit 4,864 4,782 4,891 5,114 5,272
Other Opng (Exp)/Inc (2,001) (2,024) (2,131) (2,295) (2,425)
Operating Profit 2,864 2,759 2,759 2,820 2,847
Other Non Opg (Exp)/Inc 44.0 77.4 0.0 0.0 0.0
Associates & JV Inc 2,788 2,942 2,450 2,375 2,802
Net Interest (Exp)/Inc (309) (337) (348) (332) (365)
Exceptional Gain/(Loss) 56.9 (76.6) 1,934 0.0 0.0
Pre-tax Profit 5,444 5,364 6,795 4,863 5,284
Tax (1,586) (1,533) (1,291) (1,313) (1,480)
Minority Interest 12.5 21.7 (10.0) (10.0) (10.0)
Preference Dividend 0.0 0.0 0.0 0.0 0.0
Net Profit 3,871 3,853 5,494 3,540 3,795
Net Profit before Except. 3,814 3,929 3,560 3,540 3,795
EBITDA 7,845 8,017 7,567 7,716 8,300
Growth Revenue Gth (%) (1.5) (1.5) 5.4 3.4 3.0
EBITDA Gth (%) 1.2 2.2 (5.6) 2.0 7.6
Opg Profit Gth (%) (2.2) (3.7) 0.0 2.2 0.9
Net Profit Gth (Pre-ex) (%) (0.6) 3.0 (9.4) (0.6) 7.2
Margins & Ratio Gross Margins (%) 28.7 28.6 27.8 28.1 28.1
Opg Profit Margin (%) 16.9 16.5 15.7 15.5 15.2
Net Profit Margin (%) 22.8 23.1 31.2 19.4 20.2
ROAE (%) 15.6 14.5 18.6 11.4 12.1
ROA (%) 9.0 8.4 10.9 6.7 6.9
ROCE (%) 5.5 4.9 5.1 4.5 4.4
Div Payout Ratio (%) 72.1 74.2 61.0 81.0 75.5
Net Interest Cover (x) 9.3 8.2 7.9 8.5 7.8
Source: Company, DBS Bank
Associate contributions to decline in FY19F before recovering in FY20F
Page 114

Company Guide
Singtel
Quarterly / Interim Income Statement (S$m)
FY Mar 3Q2017 4Q2017 1Q2018 2Q2018 3Q2018
Revenue 4,410 4,308 4,232 4,370 4,603
Cost of Goods Sold (3,236) (3,061) (3,036) (3,125) (3,391)
Gross Profit 1,174 1,247 1,197 1,245 1,212
Other Oper. (Exp)/Inc (515) (524) (499) (552) (505)
Operating Profit 659 723 698 693 707
Other Non Opg (Exp)/Inc 0.0 0.0 0.0 0.0 0.0
Associates & JV Inc 694 720 734 659 553
Net Interest (Exp)/Inc (41.0) (82.0) (87.8) (91.0) (81.0)
Exceptional Gain/(Loss) (3.0) (25.0) (28.5) 1,960 (8.0)
Pre-tax Profit 1,309 1,336 1,315 3,221 1,171
Tax (342) (381) (429) (338) (290)
Minority Interest 6.00 8.00 5.50 6.00 8.00
Net Profit 973 963 892 2,889 890
Net profit bef Except. 976 988 920 929 898
EBITDA 1,353 1,443 1,431 1,352 1,260
Growth Revenue Gth (%) 7.9 (2.3) (1.8) 3.3 5.3
EBITDA Gth (%) (4.8) 6.7 (0.8) (5.5) (6.8)
Opg Profit Gth (%) (3.7) 9.7 (3.5) (0.7) 2.0
Net Profit Gth (Pre-ex) (%) (0.3) 1.2 (6.9) 1.0 (3.3)
Margins Gross Margins (%) 26.6 28.9 28.3 28.5 26.3
Opg Profit Margins (%) 14.9 16.8 16.5 15.9 15.4
Net Profit Margins (%) 22.1 22.4 21.1 66.1 19.3
Balance Sheet (S$m) FY Mar 2016A 2017A 2018F 2019F 2020F
Net Fixed Assets 11,154 11,893 12,343 12,785 13,161
Invts in Associates & JVs 11,086 14,235 15,013 16,024 17,217
Other LT Assets 16,160 16,249 16,965 16,575 16,191
Cash & ST Invts 462 534 2,212 2,357 3,266
Inventory 320 352 371 384 395
Debtors 4,366 4,924 5,189 5,366 5,529
Other Current Assets 17.5 107 107 107 107
Total Assets 43,566 48,294 52,200 53,598 55,866
ST Debt 686 3,134 2,134 2,134 2,134
Creditor 4,597 4,922 5,187 5,364 5,527
Other Current Liab 1,257 1,216 2,211 2,233 2,400
LT Debt 9,255 8,052 9,052 10,052 11,052
Other LT Liabilities 2,768 2,756 2,756 2,756 2,756
Shareholder’s Equity 24,967 28,191 30,828 31,017 31,944
Minority Interests 35.7 22.4 32.4 42.4 52.4
Total Cap. & Liab. 43,566 48,294 52,200 53,598 55,864
Non-Cash Wkg. Capital (1,151) (755) (1,731) (1,740) (1,895)
Net Cash/(Debt) (9,479) (10,652) (8,974) (9,829) (9,920)
Debtors Turn (avg days) 88.8 101.5 104.8 105.8 106.0
Creditors Turn (avg days) 166.2 179.3 178.1 182.1 183.3
Inventory Turn (avg days) 11.2 12.7 12.7 13.0 13.1
Asset Turnover (x) 0.4 0.4 0.4 0.3 0.3
Current Ratio (x) 0.8 0.6 0.8 0.8 0.9
Quick Ratio (x) 0.7 0.6 0.8 0.8 0.9
Net Debt/Equity (X) 0.4 0.4 0.3 0.3 0.3
Net Debt/Equity ex MI (X) 0.4 0.4 0.3 0.3 0.3
Capex to Debt (%) 31.8 22.2 31.2 21.1 20.0
Z-Score (X) 3.3 3.0 2.9 2.8 2.8
Source: Company, DBS Bank
Strong cash position to drive dividends and investments
Page 115

Company Guide
Singtel
Cash Flow Statement (S$m)
FY Mar 2016A 2017A 2018F 2019F 2020F
Pre-Tax Profit 5,444 5,364 6,795 4,863 5,284
Dep. & Amort. 2,149 2,239 2,358 2,521 2,652
Tax Paid (658) (834) (296) (1,291) (1,313)
Assoc. & JV Inc/(loss) (2,788) (2,942) (2,450) (2,375) (2,802)
Chg in Wkg.Cap. (1,031) (492) (19.0) (12.7) (11.7)
Other Operating CF 182 323 (1,538) 414 450
Net Operating CF 3,297 3,659 4,850 4,119 4,259
Capital Exp.(net) (3,157) (2,488) (3,490) (2,572) (2,642)
Other Invts.(net) 42.7 40.4 0.0 0.0 0.0
Invts in Assoc. & JV (200) (2,410) 0.0 0.0 0.0
Div from Assoc & JV 1,351 1,656 1,407 1,364 1,609
Other Investing CF 574 26.1 2,165 0.0 0.0
Net Investing CF (1,389) (3,177) 82.3 (1,208) (1,033)
Div Paid (2,794) (2,821) (2,857) (3,351) (2,867)
Chg in Gross Debt 1,129 1,158 0.0 1,000 1,000
Capital Issues 0.0 1,602 0.0 0.0 0.0
Other Financing CF (378) (362) (396) (414) (450)
Net Financing CF (2,044) (422) (3,254) (2,766) (2,317)
Currency Adjustments 34.8 11.9 0.0 0.0 0.0
Chg in Cash (101) 72.0 1,678 146 909
Opg CFPS (S cts) 27.2 25.4 29.8 25.3 26.2
Free CFPS (S cts) 0.88 7.17 8.33 9.47 9.90
Source: Company, DBS Bank
Target Price & Ratings History
Source: DBS Bank
Analyst: Sachin MITTAL
Capex to remain stable
Page 116

Company Guide
Singtel
DBS Bank recommendations are based an Absolute Total Return* Rating system, defined as follows:
STRONG BUY (>20% total return over the next 3 months, with identifiable share price catalysts within this time frame)
BUY (>15% total return over the next 12 months for small caps, >10% for large caps)
HOLD (-10% to +15% total return over the next 12 months for small caps, -10% to +10% for large caps)
FULLY VALUED (negative total return i.e. > -10% over the next 12 months)
SELL (negative total return of > -20% over the next 3 months, with identifiable catalysts within this time frame)
Share price appreciation + dividends
Completed Date: 7 May 2018 08:12:45 (SGT) Dissemination Date: 7 May 2018 11:20:02 (SGT)
Sources for all charts and tables are DBS Bank unless otherwise specified.
GENERAL DISCLOSURE/DISCLAIMER
This report is prepared by DBS Bank Ltd. This report is solely intended for the clients of DBS Bank Ltd, its respective connected and associated
corporations and affiliates only and no part of this document may be (i) copied, photocopied or duplicated in any form or by any means or (ii)
redistributed without the prior written consent of DBS Bank Ltd.
The research set out in this report is based on information obtained from sources believed to be reliable, but we (which collectively refers to DBS
Bank Ltd, its respective connected and associated corporations, affiliates and their respective directors, officers, employees and agents (collectively,
the “DBS Group”) have not conducted due diligence on any of the companies, verified any information or sources or taken into account any other
factors which we may consider to be relevant or appropriate in preparing the research. Accordingly, we do not make any representation or
warranty as to the accuracy, completeness or correctness of the research set out in this report. Opinions expressed are subject to change without
notice. This research is prepared for general circulation. Any recommendation contained in this document does not have regard to the specific
investment objectives, financial situation and the particular needs of any specific addressee. This document is for the information of addressees
only and is not to be taken in substitution for the exercise of judgement by addressees, who should obtain separate independent legal or financial
advice. The DBS Group accepts no liability whatsoever for any direct, indirect and/or consequential loss (including any claims for loss of profit)
arising from any use of and/or reliance upon this document and/or further communication given in relation to this document. This document is not
to be construed as an offer or a solicitation of an offer to buy or sell any securities. The DBS Group, along with its affiliates and/or persons
associated with any of them may from time to time have interests in the securities mentioned in this document. The DBS Group, may have
positions in, and may effect transactions in securities mentioned herein and may also perform or seek to perform broking, investment banking and
other banking services for these companies.
Any valuations, opinions, estimates, forecasts, ratings or risk assessments herein constitutes a judgment as of the date of this report, and there can
be no assurance that future results or events will be consistent with any such valuations, opinions, estimates, forecasts, ratings or risk assessments.
The information in this document is subject to change without notice, its accuracy is not guaranteed, it may be incomplete or condensed, it may
not contain all material information concerning the company (or companies) referred to in this report and the DBS Group is under no obligation to
update the information in this report.
This publication has not been reviewed or authorized by any regulatory authority in Singapore, Hong Kong or elsewhere. There is no planned
schedule or frequency for updating research publication relating to any issuer.
The valuations, opinions, estimates, forecasts, ratings or risk assessments described in this report were based upon a number of estimates and
assumptions and are inherently subject to significant uncertainties and contingencies. It can be expected that one or more of the estimates on
which the valuations, opinions, estimates, forecasts, ratings or risk assessments were based will not materialize or will vary significantly from actual
results. Therefore, the inclusion of the valuations, opinions, estimates, forecasts, ratings or risk assessments described herein IS NOT TO BE RELIED
UPON as a representation and/or warranty by the DBS Group (and/or any persons associated with the aforesaid entities), that:
(a) such valuations, opinions, estimates, forecasts, ratings or risk assessments or their underlying assumptions will be achieved, and
(b) there is any assurance that future results or events will be consistent with any such valuations, opinions, estimates, forecasts, ratings or risk
assessments stated therein.
Please contact the primary analyst for valuation methodologies and assumptions associated with the covered companies or price targets.
Any assumptions made in this report that refers to commodities, are for the purposes of making forecasts for the company (or companies)
mentioned herein. They are not to be construed as recommendations to trade in the physical commodity or in the futures contract relating to the
commodity referred to in this report.
Page 117

Company Guide
Singtel
DBSVUSA, a US-registered broker-dealer, does not have its own investment banking or research department, has not participated in any public
offering of securities as a manager or co-manager or in any other investment banking transaction in the past twelve months and does not engage
in market-making.
ANALYST CERTIFICATION
The research analyst(s) primarily responsible for the content of this research report, in part or in whole, certifies that the views about the
companies and their securities expressed in this report accurately reflect his/her personal views. The analyst(s) also certifies that no part of his/her
compensation was, is, or will be, directly or indirectly, related to specific recommendations or views expressed in the report. The research analyst (s)
primarily responsible for the content of this research report, in part or in whole, certifies that he or his associate1 does not serve as an officer of the
issuer or the new listing applicant (which includes in the case of a real estate investment trust, an officer of the management company of the real
estate investment trust; and in the case of any other entity, an officer or its equivalent counterparty of the entity who is responsible for the
management of the issuer or the new listing applicant) and the research analyst(s) primarily responsible for the content of this research report or
his associate does not have financial interests2 in relation to an issuer or a new listing applicant that the analyst reviews. DBS Group has
procedures in place to eliminate, avoid and manage any potential conflicts of interests that may arise in connection with the production of
research reports. The research analyst(s) responsible for this report operates as part of a separate and independent team to the investment
banking function of the DBS Group and procedures are in place to ensure that confidential information held by either the research or investment
banking function is handled appropriately. There is no direct link of DBS Group's compensation to any specific investment banking function of the
DBS Group.
COMPANY-SPECIFIC / REGULATORY DISCLOSURES
1. DBS Bank Ltd, DBS HK, DBS Vickers Securities (Singapore) Pte Ltd (''DBSVS''), DBSV HK or their subsidiaries and/or other affiliates have a
proprietary position in Singtel, M1, StarHub, Singpost, NetLink NBN Trust, Advance Info Service, Total Access Communication recommended
in this report as of 30 Mar 2018.
2. Neither DBS Bank Ltd, DBS HK nor DBSV HK market makes in equity securities of the issuer(s) or company(ies) mentioned in this Research
Report.
3. DBS Bank Ltd, DBS HK, DBSVS, DBSV HK, their subsidiaries and/or other affiliates have a net long position exceeding 0.5% of the total issuedshare capital in DBS Bank Ltd, DBS HK, DBSVS, DBSV HK, their subsidiaries and/or other affiliates have a net long position exceeding 0.5% ofthe total issued share capital in M1, StarHub, NetLink NBN Trust recommended in this report as of 30 Mar 2018
4. DBS Bank Ltd, DBS HK, DBSVS, DBSVUSA, DBSV HK or their subsidiaries and/or other affiliates beneficially own a total of 1% of any class ofcommon equity securities of NetLink NBN Trust as of 30 Mar 2018.
Compensation for investment banking services:
5. DBS Bank Ltd, DBS HK, DBSVS, DBSV HK, their subsidiaries and/or other affiliates of DBSVUSA have received compensation, within the past
12 months for investment banking services from StarHub, NetLink NBN Trust, XL Axiata as of 30 Mar 2018
6. DBS Bank Ltd, DBS HK, DBSVS, their subsidiaries and/or other affiliates of DBSVUSA have managed or co-managed a public offering of
securities for StarHub, NetLink NBN Trust, XL Axiata in the past 12 months, as of 30 Mar 2018
7. DBSVUSA does not have its own investment banking or research department, nor has it participated in any public offering of securities as a
manager or co-manager or in any other investment banking transaction in the past twelve months. Any US persons wishing to obtain further
information, including any clarification on disclosures in this disclaimer, or to effect a transaction in any security discussed in this document
should contact DBSVUSA exclusively.
1 An associate is defined as (i) the spouse, or any minor child (natural or adopted) or minor step-child, of the analyst; (ii) the trustee of a trust of which the analyst, his spouse, minor child (natural or adopted) or minor step-child, is a beneficiary or discretionary object; or (iii) another person accustomed or obliged to act in accordance with the directions or instructions of the analyst.
2 Financial interest is defined as interests that are commonly known financial interest, such as investment in the securities in respect of an issuer or a new listing applicant, or financial accommodation arrangement between the issuer or the new listing applicant and the firm or analysis. This term does not include commercial lending conducted at arm's length, or investments in any collective investment scheme other than an issuer or new listing applicant notwithstanding the fact that the scheme has investments in securities in respect of an issuer or a new listing applicant.
Page 118

ed: JS / sa: PY, CS
• 1Q18 core net profit of US$122m (+23% y-o-y) in line,STE should be back on growth trajectory in FY18
• Orderbook remains at near peak level at S$13.4bn
• Aero engine workload seems to be trending higher
• Marine margins in FY18 could be weaker as delivery ofproblematic ConRo vessel is pushed back slightly
Price Relative
Forecasts and Valuation FY Dec (S$m) 2016A 2017A 2018F 2019F Revenue 6,684 6,619 6,876 7,255 EBITDA 904 857 893 956 Pre-tax Profit 591 623 658 715 Net Profit 485 512 530 576 Net Pft (Pre Ex.) 535 512 530 576 Net Pft Gth (Pre-ex) (%) 1.2 (4.4) 3.6 8.7 EPS (S cts) 15.5 16.4 17.0 18.5 EPS Pre Ex. (S cts) 17.1 16.4 17.0 18.5 EPS Gth Pre Ex (%) 0 (4) 4 9 Diluted EPS (S cts) 15.5 16.4 17.0 18.5 Net DPS (S cts) 15.0 15.0 15.5 16.0 BV Per Share (S cts) 69.9 71.7 73.7 76.7 PE (X) 21.8 20.7 20.0 18.4 PE Pre Ex. (X) 19.8 20.7 20.0 18.4 P/Cash Flow (X) 13.9 13.9 15.5 14.8 EV/EBITDA (X) 12.0 12.9 12.5 11.7 Net Div Yield (%) 4.4 4.4 4.6 4.7 P/Book Value (X) 4.9 4.7 4.6 4.4 Net Debt/Equity (X) 0.0 0.1 0.1 0.1 ROAE (%) 22.5 23.2 23.4 24.5 Earnings Rev (%): (2) 1 Consensus EPS (S cts): 17.7 19.1 Other Broker Recs: B: 14 S: 1 H: 1
Source of all data on this page: Company, DBS Bank, Bloomberg Finance L.P
Confidence in growth potential
BUY on multiple re-rating drivers ahead. ST Engineering’s (STE) recent share price retreat ex-final dividend payout is a good buying opportunity for patient investors. We like STE for a combination of factors: i) award of some of the larger contracts that STE is vying for (e.g. US Postal Service vehicle contract and US Marine Corps contract) are expected to be announced in 2018, providing potential upside catalysts if STE (and partners) are chosen; ii) improved visibility from STE’s target to more than double smart city revenues by 2022 and grow other segment revenues at 2-3x the global GDP growth rate; iii) Aerospace segment rebound, with margins improving this year on stronger CFM engine MRO demand, and in the longer-term, sizeable contribution expected from P2F programmes currently in ramp-up phase; iv) expected deliveries of the two problematic ConRo vessels in 2Q/3Q18 which should help shipbuilding turn profitable, though it is slightly delayed than expected. Meanwhile, dividend yield is around 4.5%, which should provide support to the stock price.
Where we differ: 1Q18 was a quiet quarter with no unexpected contract wins, and earnings are typically seasonally lower as well, which leads to some sell off in the market. But we think STE is at the cusp of a ‘next leg up’ in its growth story while trading at reasonable valuations (just below mean historical P/E), with a 4.5% dividend yield to boot, which makes it attractive.
Potential catalyst: Significant order wins, turnaround at US shipbuilding operations, and progress with smart city initiatives.
Valuation: Our TP of S$4.10 is based on a blended valuation framework, which factors in both earnings growth and long-term cash-generative nature of STE’s businesses.
Key Risks to Our View: A protracted slowdown in shipbuilding and execution hiccups at new business segments could derail earnings. Also, lack of action on the M&A front could lead to inefficient use of balance sheet and lower ROEs in the future.
At A Glance Issued Capital (m shrs) 3,120 Mkt. Cap (S$m/US$m) 10,578 / 7,917 Major Shareholders (%) Temasek Holdings Private Ltd (%) 50.7
Free Float (%) 49.3 3m Avg. Daily Val (US$m) 12.0 ICB Industry : Industrials / Aerospace & Defense
14 May 2018
Sin gapore Company Guide
ST Engineering Version 12 | Bloomberg: STE SP | Reuters: STEG.SI
DBS Group Research . Equity
BUYLast Traded Price ( 11 May 2018): S$3.39 (STI : 3,570.17) Price Target 12-mth: S$4.10 (21% upside)
Analyst Suvro Sarkar +65 81893144 [email protected] Glenn NG +65 6682 2657 [email protected]
What’s New
Refer to important disclosures at the end of this report
Page 119

Company Guide
ST Engineering
WHAT’S NEW
1Q18 core profits in line
Core PBT and net profit in line with expectations: Excluding the c.S$4.8m effect of a realised foreign currency translation loss on the dissolving of two US legal entities Dalfort LP and Dalfort GP, PBT was c.S$149m for the quarter, which was broadly in line with expectations. Reported PBT of S$144m was in line with expectations, representing 12% y-o-y growth on a restated basis (on adoption of new SFRS(I) rules), and accounting for roughly 22% of our full-year net profit estimates, which is in line with the usual seasonality. Revenues improved 9% y-o-y to S$1,647m. Core net profit (similarly excluding the Dalfort translation loss) came in at S$122m, which is almost 23% higher y-o-y, representing around 22% of our full-year net profit estimates.
Less visibility on sub-segment profit trends for now, owing to change in reporting from PBT to net profit. At the more detailed sub-segment level, ST Engineering seems to have shifted its reporting focus from profit before tax (PBT) to net profit (PATMI), which makes sub-segment comparison (for e.g. Aircraft Maintenance & Modification sub-segment withinthe Aerospace segment) in terms of historical trendschallenging this quarter. Q-o-q comparisons are also lessmeaningful due to the restatement of financials in line withSFRS(I) adoption and the lack of restated financials for 4Q17at this point.
Marine segment earnings recovery pushed back on ConRo delivery delay. While we had previously expected the two problematic ConRo vessels being built by ST Marine’s US shipyard operations to be delivered in 1Q18, thus relieving the shipbuilding sub-segment of additional provisions, we understand the first ConRo vessel is now scheduled for delivery at the end of 2Q18 and the second vessel should be delivered in 3Q18. To recap, these two vessels were the drag on the Marine segment’s shipbuilding operations; shipbuilding would have been profitable in 1Q18 if not for provisions on the ConRos.
PBT margins generally in line, save for a cyclical low in Electronics margins. Group PBT margins came in at 9% excluding the effect of the Dalfort translation loss. Segment-wise, PBT margins were generally in line with our full-year estimates, save for the Electronics segment which saw a weaker 1Q18 PBT margin of 8%, though the company has attributed this to seasonality affecting the sales mix, and they expect PBT margin to improve in subsequent quarters with a view towards achieving the usual 10% PBT margin for the full year.
Engine workload trend looks promising. Management said that ST Aerospace’s engine shops are experiencing high utilisation rates, with an uptick in shop visits felt since last year, which has continued into 2018. Problems with the new Airbus NEO and Boeing MAX aircraft variants have delayed their entry into service, pushing back the retirement of some older aircraft, which is positive for MRO work in general. Meanwhile heightened checks on the CFM56-7B engines following the Southwest aircraft explosion has boosted workload on that front.
Orderbook remains robust. Orderbook remained flat q-o-q at S$13.4bn which is near historical peak levels. Announced order wins of S$1.14bn from the Aerospace and Electronics segments in 1Q18 were in line with previous year’s amounts.
Net cash balance sheet; higher spend on growth projects (otherwise on dividends) would be positive. Balance sheet remains healthy; M&A or higher dividends would be a positive. On the back of strong OCF and minimal capex for the quarter, ST Engineering is now back in a net cash position (from 0.05x net gearing in 4Q17). We think higher spending on M&A (at a reasonable price of course) would be positive for ROE, otherwise higher dividend payout would be a plus point too.
Page 120
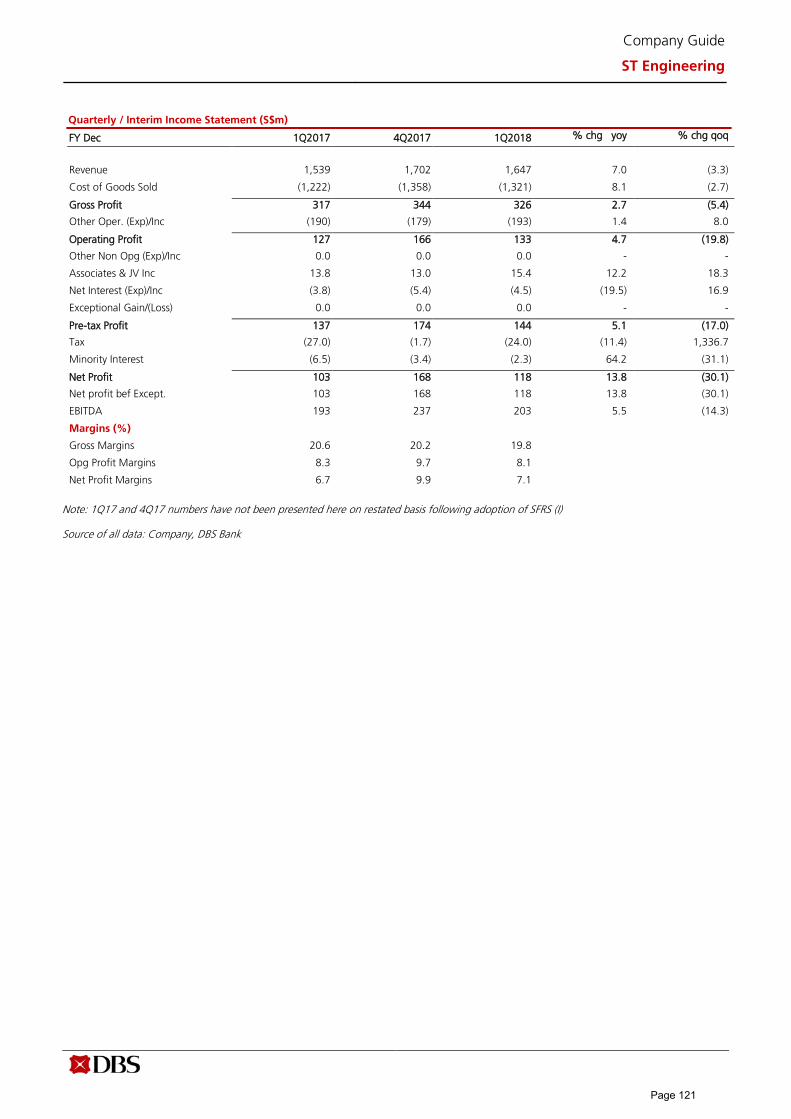
Company Guide
ST Engineering
Quarterly / Interim Income Statement (S$m)
FY Dec 1Q2017 4Q2017 1Q2018 % chg yoy % chg qoq
Revenue 1,539 1,702 1,647 7.0 (3.3)
Cost of Goods Sold (1,222) (1,358) (1,321) 8.1 (2.7)
Gross Profit 317 344 326 2.7 (5.4)
Other Oper. (Exp)/Inc (190) (179) (193) 1.4 8.0
Operating Profit 127 166 133 4.7 (19.8)
Other Non Opg (Exp)/Inc 0.0 0.0 0.0 - -
Associates & JV Inc 13.8 13.0 15.4 12.2 18.3
Net Interest (Exp)/Inc (3.8) (5.4) (4.5) (19.5) 16.9
Exceptional Gain/(Loss) 0.0 0.0 0.0 - -
Pre-tax Profit 137 174 144 5.1 (17.0)
Tax (27.0) (1.7) (24.0) (11.4) 1,336.7
Minority Interest (6.5) (3.4) (2.3) 64.2 (31.1)
Net Profit 103 168 118 13.8 (30.1)
Net profit bef Except. 103 168 118 13.8 (30.1)
EBITDA 193 237 203 5.5 (14.3)
Margins (%)
Gross Margins 20.6 20.2 19.8
Opg Profit Margins 8.3 9.7 8.1
Net Profit Margins 6.7 9.9 7.1
Note: 1Q17 and 4Q17 numbers have not been presented here on restated basis following adoption of SFRS (I)
Source of all data: Company, DBS Bank
Page 121

Company Guide
ST Engineering
CRITICAL DATA POINTS TO WATCH
Critical Factors Conglomerate with diverse interests in defense and commercial spheres. STE started out life as a defense contractor but has leveraged its technical knowhow over the years to penetrate the commercial market. It boasts multinational operations with a global presence in 23 countries and 41 cities, and hires more than 22,000 employees. The group has reduced its reliance on the defense sector over time from 57% of revenues in 2002 to the current 35%, with another c.33% from government agencies and the balance from commercial businesses.
STE could engage in M&A of distressed assets/companies. With a cash balance of c.S$1.3bn and a net cash balance sheet as of 1Q18, STE has a significant war chest at its disposal. One potential area of interest signaled by the company is in purchasing distressed ship repair operations to add on to STE’s existing ship repair business, which has maintained healthy margins.
Healthy orderbook drives visibility. As of end-1Q18, STE's orderbook stood at S$13.4bn, boosted by a large contract secured in 2017 for the construction of the Singapore Armed Forces’ next-generation Armoured Fighting Vehicles (AFVs), which we estimate to be worth ~S$1bn. The orderbook provides robust revenue visibility into FY18/19, with a roughly 1.9x book-to-bill ratio.
Move into new markets to boost Aerospace segment’s growth. Continued initiatives by ST Aerospace to broaden its capabilities should propel its growth in the longer term. These include a partnership with Airbus for passenger-to-freighter conversion of its A320/A321 and A330 jets, marking a diversification of its conversion portfolio; a continued expansion of its cabin interior service solutions business, particularly for VIP aircraft completions; and expansion of its mid-life aircraft leasing business.
Smart City initiatives should be a key long-term growth driver. Within Singapore’s Smart Nation framework, we estimate projects worth more than S$1bn in the near future, as the Singaporean government pushes for smart technology usage across the utility, healthcare, housing and transport spaces. STE is aiming to more than double its annual smart city revenues by 2022 from 2017 levels of about c.S$1bn. Globally, Frost & Sullivan and Technavio have both forecasted the global smart city market to be valued at c.US$1.5tr in 2020, from an implied c.US$600bn as of end-2015, representing a CAGR of about20%. This indicates a market that would be almost 3x as largeas, say, the global MRO market, with global sales of aboutUS$60-70bn per year (or US$300-350bn over a 5-year period).
FY17 revenue breakdown by segment (S$m)
FY17 PBT breakdown by segment
Net orderbook (S$bn)
Order wins (S$m)
Source: Company, DBS Bank
2,535
2,108
1,244
637 96
Aerospace Electronics Land Systems Marine Others
317.8
212.3
85.0
22.4 (14.3)
Aerospace Electronics Land Systems Marine Others
4.65.3 5.4
7.4
9.510.0 10.3
11.512.3 12.1
13.212.5
11.7 11.6
13.4 13.4
0.0
2.0
4.0
6.0
8.0
10.0
12.0
14.0
16.0
FY03 FY05 FY07 FY09 FY11 FY13 FY15 FY17
1.78
2.60
3.88
2.67
1.74
3.36 3.24
4.10
5.89
4.21 4.00
5.04 5.07
1.15
0.00
1.00
2.00
3.00
4.00
5.00
6.00
7.00
(S$bn)
Page 122

Company Guide
ST Engineering
Appendix 1: A look at ST Engineering's listed history – what drives its share price?
Valuation peaks coincide with order win levels
Source: Bloomberg Finance L.P., Company
Valuation peaks – summary of significant events at the time
2007 peak 2010 peak 2013 peak 2017 peak
- Positive outlook for MRO,strong aerospace margins- Land systems saw aturnaround in margins- Record orderbook levelsreached- Electronics and Marinegrowing steadily- Land systems touted tohave secured a S$1bndefence contract
- Contract for Terrex 8x8 ICVssecured- Estimated new defenceorders of close to S$2bnsecured- Aero margins continue toimprove as FedEx P2F projectturns profitable- Trend towards higher MROoutsourcing is encouraging- Global airline industrybeginning to recover
- Management guiding forhigher revenues/PBT in FY13- Orderbook reaches recordhigh of S$13bn- Singapore Navy contractsecured, estimated to beworth S$1.8bn- Strong aero contract wins in4Q12- Aerospace segment showinggross margin expansion
- Orderbook @ S$13.3bn as of 3Q17 -near all-time highs- SAF AFV contract secured earlier in theyear, which we think is worth ~S$1bn- Strong contract wins YTD (S$3.8bn)- Land systems turnaround post-disposalof loss-making Chinese subsidiariesseems to have taken a breather- Smart nation projects bode well forlong-term growth - smart city market sizeto be US$1.5 trillion by 2020 (Frost &Sullivan)
Source: Newswires, Company, DBS Bank
0
1
2
3
4
5
6
7
10
12
14
16
18
20
22
24
Jan
-05
Jun-
05
No
v-0
5
Ap
r-06
Sep
-06
Feb
-07
Jul-0
7
Dec
-07
May
-08
Oct
-08
Mar
-09
Au
g-0
9
Jan
-10
Jun-
10
No
v-1
0
Ap
r-11
Sep
-11
Feb
-12
Jul-1
2
Dec
-12
May
-13
Oct
-13
Mar
-14
Au
g-1
4
Jan
-15
Jun-
15
No
v-1
5
Ap
r-16
Sep
-16
Feb
-17
Jul-1
7
Dec
-17
May
-18
Annual order wins (S$m, RHS) Forward P/E (LHS) Share price (RHS)
(x) (S$/share)
Page 123

Company Guide
ST Engineering
Balance Sheet: Healthy balance sheet can drive M&A ambitions. STE has a strong net cash balance sheet. In recent years, STE has channeled cash into bonds and share buybacks to improve returns on capital. However, with a sizeable cash balance of c.S$1.3bn, there is ample ammunition to pursue M&A.
Dividend payout should remain steady. Strong operating cash flows provide support to a decent dividend yield of around 4.5% currently. We expect STE to pay around 15.5 Scts dividend per share in total for FY18 (slightly higher than FY17), equating to c.93% of our core profit estimate, and roughly in line with historical payout ratios.
Share Price Drivers: Strong order wins. Total announced order wins of S$5.07bn in FY17 matched FY16’s amount, and was a healthy number about 18% higher than the average order win level from FY11-FY15. Even higher levels of order win announcements in FY18 would help boost the share price.
Recovery in the Marine sector. The Marine sector is arguably facing the strongest industry headwinds on the commercial front, with low offshore oil & gas spending and muted ordering activity in conventional shipping, despite low orderbook. Cost overruns in the US exacerbate the situation. An industry recovery, as well as better productivity in the US, would provide more confidence in the medium-term earnings of the business.
Key Risks: Aerospace margins could come under pressure if execution of new market segment entry is poor. In the Aerospace segment, headwinds posed by lower work content and longer maintenance intervals at the traditional airframe and engine MRO businesses are to be countered by growth in new markets and businesses such as P2F conversion work on the Airbus 330 models and the ramp-up of new MRO facilities in China. Execution risk is therefore present.
Protracted slowdown in shipbuilding. The traditional shipping sector is just coming off major industry overcapacity, while the slide in oil prices also affects demand for offshore vessels. Visibility on demand recovery is low at this point.
Company Background ST Engineering (STE) is an integrated engineering group in the aerospace, electronics, land systems and marine sectors. The company has over the years diversified its businesses and geographies.
Leverage & Asset Turnover (x)
Capital Expenditure
ROE (%)
Forward PE Band (x)
PB Band (x)
Source: Company, DBS Bank
Page 124

Company Guide
ST Engineering
Segmental Breakdown FY Dec 2015A 2016A 2017A 2018F 2019F
Revenues (S$m) Aerospace 2,090 2,484 2,535 2,632 2,718 Electronics 1,709 1,885 2,108 2,361 2,477 Land Systems 1,396 1,305 1,244 1,217 1,413 Marine 958 841 637 572 551 Others 182 169 95.6 95.6 95.6 Total 6,335 6,684 6,619 6,876 7,255 PBT (S$m) Aerospace 291 300 318 325 347 Electronics 191 208 212 234 248 Land Systems 65.0 22.2 85.0 74.0 87.0 Marine 88.3 75.1 22.4 37.4 44.8 Others (4.6) (14.8) (14.3) (12.0) (12.0) Total 630 591 623 658 715 PBT Margins (%) Aerospace 13.9 12.1 12.5 12.3 12.8 Electronics 11.2 11.0 10.1 9.9 10.0 Land Systems 4.7 1.7 6.8 6.1 6.2 Marine 9.2 8.9 3.5 6.5 8.1 Others (2.5) (8.7) (15.0) (12.5) (12.5) Total 9.9 8.8 9.4 9.6 9.9
Income Statement (S$m)
FY Dec 2015A 2016A 2017A 2018F 2019F
Revenue 6,335 6,684 6,619 6,876 7,255 Cost of Goods Sold (5,053) (5,378) (5,296) (5,501) (5,804) Gross Profit 1,282 1,305 1,323 1,375 1,451 Other Opng (Exp)/Inc (694) (713) (732) (753) (771) Operating Profit 588 593 591 622 680 Other Non Opg (Exp)/Inc 0.0 0.0 0.0 0.0 0.0 Associates & JV Inc 58.3 63.8 49.3 50.3 51.3 Net Interest (Exp)/Inc (16.3) (15.1) (17.0) (15.2) (16.8) Exceptional Gain/(Loss) 0.0 (50.7) 0.0 0.0 0.0 Pre-tax Profit 630 591 623 658 715 Tax (98.7) (97.8) (87.9) (105) (114) Minority Interest (2.6) (8.4) (23.6) (22.1) (24.0) Preference Dividend 0.0 0.0 0.0 0.0 0.0 Net Profit 529 485 512 530 576 Net Profit before Except. 529 535 512 530 576 EBITDA 834 904 857 893 956 Growth Revenue Gth (%) (3.1) 5.5 (1.0) 3.9 5.5 EBITDA Gth (%) (0.2) 8.4 (5.1) 4.2 7.0 Opg Profit Gth (%) (3.2) 0.8 (0.3) 5.3 9.3 Net Profit Gth (Pre-ex) (%) (0.5) 1.2 (4.4) 3.6 8.7 Margins & Ratio Gross Margins (%) 20.2 19.5 20.0 20.0 20.0 Opg Profit Margin (%) 9.3 8.9 8.9 9.1 9.4 Net Profit Margin (%) 8.4 7.2 7.7 7.7 7.9 ROAE (%) 24.8 22.5 23.2 23.4 24.5 ROA (%) 6.4 5.9 6.1 6.2 6.6 ROCE (%) 10.6 10.6 10.6 10.6 11.3 Div Payout Ratio (%) 87.9 96.7 91.5 91.3 86.7 Net Interest Cover (x) 36.2 39.3 34.7 41.1 40.5
Source: Company, DBS Bank
Delivery of the SAF Armoured Fighting Vehicles beginning in 2019 should boost Land Systems’ revenues in FY19
Expecting some margin improvement on higher engine MRO demand
Page 125

Company Guide
ST Engineering
Quarterly / Interim Income Statement (S$m)
FY Dec 1Q2017 2Q2017 3Q2017 4Q2017 1Q2018
Revenue 1,539 1,756 1,622 1,702 1,647 Cost of Goods Sold (1,222) (1,434) (1,282) (1,358) (1,321) Gross Profit 317 322 340 344 326 Other Oper. (Exp)/Inc (190) (180) (184) (179) (193) Operating Profit 127 142 156 166 133 Other Non Opg (Exp)/Inc 0.0 0.0 0.0 0.0 0.0 Associates & JV Inc 13.8 11.7 10.9 13.0 15.4 Net Interest (Exp)/Inc (3.8) (3.8) (4.1) (5.4) (4.5) Exceptional Gain/(Loss) 0.0 0.0 0.0 0.0 0.0 Pre-tax Profit 137 150 163 174 144 Tax (27.0) (30.2) (29.0) (1.7) (24.0) Minority Interest (6.5) (8.1) (5.5) (3.4) (2.3) Net Profit 103 112 128 168 118 Net profit bef Except. 103 112 128 168 118 EBITDA 193 205 222 237 203
Growth Revenue Gth (%) (15.4) 14.1 (7.7) 5.0 (3.3) EBITDA Gth (%) (25.1) 6.5 8.1 6.9 (14.3) Opg Profit Gth (%) (25.8) 11.7 10.0 6.3 (19.8) Net Profit Gth (Pre-ex) (%) (39.3) 7.8 15.1 31.2 (30.1) Margins Gross Margins (%) 20.6 18.3 20.9 20.2 19.8 Opg Profit Margins (%) 8.3 8.1 9.6 9.7 8.1 Net Profit Margins (%) 6.7 6.4 7.9 9.9 7.1
Balance Sheet (S$m) FY Dec 2015A 2016A 2017A 2018F 2019F
Net Fixed Assets 1,709 1,670 1,719 1,799 1,874 Invts in Associates & JVs 462 406 448 469 490 Other LT Assets 1,208 1,477 1,581 1,581 1,581 Cash & ST Invts 1,134 1,094 999 944 904 Inventory 1,943 1,898 1,764 1,833 1,934 Debtors 1,320 1,458 1,646 1,710 1,804 Other Current Assets 394 363 315 315 315 Total Assets 8,169 8,365 8,473 8,649 8,902
ST Debt 195 116 326 326 326 Creditor 1,703 1,722 1,613 1,675 1,767 Other Current Liab 1,822 1,963 1,963 1,992 2,036 LT Debt 1,019 993 894 894 894 Other LT Liabilities 1,170 1,127 1,157 1,157 1,157 Shareholder’s Equity 2,132 2,182 2,240 2,302 2,394 Minority Interests 129 262 281 304 328 Total Cap. & Liab. 8,169 8,365 8,473 8,649 8,902
Non-Cash Wkg. Capital 132 34.0 150 190 249 Net Cash/(Debt) (79.3) (14.9) (221) (277) (316) Debtors Turn (avg days) 76.0 75.8 85.6 89.1 88.4 Creditors Turn (avg days) 126.4 121.8 119.8 113.6 112.6 Inventory Turn (avg days) 140.5 136.6 131.6 124.3 123.2 Asset Turnover (x) 0.8 0.8 0.8 0.8 0.8 Current Ratio (x) 1.3 1.3 1.2 1.2 1.2 Quick Ratio (x) 0.7 0.7 0.7 0.7 0.7 Net Debt/Equity (X) 0.0 0.0 0.1 0.1 0.1 Net Debt/Equity ex MI (X) 0.0 0.0 0.1 0.1 0.1 Capex to Debt (%) 22.5 22.6 22.3 24.6 24.6 Z-Score (X) 2.5 2.5 2.5 2.5 2.5
Source: Company, DBS Bank
Low gearing and a c.S$1bn cash balancegives ammunition forM&A and R&D investment
Page 126

Company Guide
ST Engineering
Cash Flow Statement (S$m)
FY Dec 2015A 2016A 2017A 2018F 2019F
Pre-Tax Profit 630 591 623 658 715 Dep. & Amort. 187 247 217 221 224 Tax Paid (111) (76.7) (91.7) (105) (114) Assoc. & JV Inc/(loss) (58.3) (63.8) (49.3) (50.3) (51.3) Chg in Wkg.Cap. (227) (13.4) (8.7) (40.1) (59.2) Other Operating CF 44.6 74.7 73.1 0.0 0.0 Net Operating CF 465 759 764 683 714 Capital Exp.(net) (273) (251) (273) (300) (300) Other Invts.(net) (264) 7.80 144 0.0 0.0 Invts in Assoc. & JV 0.27 (34.4) (85.8) (5.0) (5.0) Div from Assoc & JV 51.4 44.7 81.0 35.0 35.0 Other Investing CF 7.98 (34.4) (113) 0.0 0.0 Net Investing CF (477) (267) (246) (270) (270) Div Paid (498) (466) (468) (468) (484) Chg in Gross Debt 109 (29.3) 127 0.0 0.0 Capital Issues (75.9) 6.26 9.17 0.0 0.0 Other Financing CF (55.1) (52.4) (57.7) 0.0 0.0 Net Financing CF (520) (541) (389) (468) (484) Currency Adjustments 12.6 3.18 (34.3) 0.0 0.0 Chg in Cash (519) (46.6) 94.1 (55.8) (39.9) Opg CFPS (S cts) 22.3 24.7 24.7 23.1 24.8 Free CFPS (S cts) 6.20 16.3 15.7 12.3 13.3
Source: Company, DBS Bank
Target Price & Ratings History
Source: DBS Bank Analyst: Suvro Sarkar
Glenn NG
Page 127

Company Guide
ST Engineering
DBS Bank recommendations are based an Absolute Total Return* Rating system, defined as follows:
STRONG BUY (>20% total return over the next 3 months, with identifiable share price catalysts within this time frame)
BUY (>15% total return over the next 12 months for small caps, >10% for large caps)
HOLD (-10% to +15% total return over the next 12 months for small caps, -10% to +10% for large caps)
FULLY VALUED (negative total return i.e. > -10% over the next 12 months)
SELL (negative total return of > -20% over the next 3 months, with identifiable catalysts within this time frame)
Share price appreciation + dividends
Completed Date: 14 May 2018 07:51:48 (SGT) Dissemination Date: 14 May 2018 08:39:52 (SGT)
Sources for all charts and tables are DBS Bank unless otherwise specified.
GENERAL DISCLOSURE/DISCLAIMER
This report is prepared by DBS Bank Ltd. This report is solely intended for the clients of DBS Bank Ltd, its respective connected and associated
corporations and affiliates only and no part of this document may be (i) copied, photocopied or duplicated in any form or by any means or (ii)
redistributed without the prior written consent of DBS Bank Ltd.
The research set out in this report is based on information obtained from sources believed to be reliable, but we (which collectively refers to DBS
Bank Ltd, its respective connected and associated corporations, affiliates and their respective directors, officers, employees and agents (collectively,
the “DBS Group”) have not conducted due diligence on any of the companies, verified any information or sources or taken into account any other
factors which we may consider to be relevant or appropriate in preparing the research. Accordingly, we do not make any representation or
warranty as to the accuracy, completeness or correctness of the research set out in this report. Opinions expressed are subject to change without
notice. This research is prepared for general circulation. Any recommendation contained in this document does not have regard to the specific
investment objectives, financial situation and the particular needs of any specific addressee. This document is for the information of addressees
only and is not to be taken in substitution for the exercise of judgement by addressees, who should obtain separate independent legal or financial
advice. The DBS Group accepts no liability whatsoever for any direct, indirect and/or consequential loss (including any claims for loss of profit)
arising from any use of and/or reliance upon this document and/or further communication given in relation to this document. This document is not
to be construed as an offer or a solicitation of an offer to buy or sell any securities. The DBS Group, along with its affiliates and/or persons
associated with any of them may from time to time have interests in the securities mentioned in this document. The DBS Group, may have
positions in, and may effect transactions in securities mentioned herein and may also perform or seek to perform broking, investment banking and
other banking services for these companies.
Any valuations, opinions, estimates, forecasts, ratings or risk assessments herein constitutes a judgment as of the date of this report, and there can
be no assurance that future results or events will be consistent with any such valuations, opinions, estimates, forecasts, ratings or risk assessments.
The information in this document is subject to change without notice, its accuracy is not guaranteed, it may be incomplete or condensed, it may
not contain all material information concerning the company (or companies) referred to in this report and the DBS Group is under no obligation to
update the information in this report.
This publication has not been reviewed or authorized by any regulatory authority in Singapore, Hong Kong or elsewhere. There is no planned
schedule or frequency for updating research publication relating to any issuer.
The valuations, opinions, estimates, forecasts, ratings or risk assessments described in this report were based upon a number of estimates and
assumptions and are inherently subject to significant uncertainties and contingencies. It can be expected that one or more of the estimates on
which the valuations, opinions, estimates, forecasts, ratings or risk assessments were based will not materialize or will vary significantly from actual
results. Therefore, the inclusion of the valuations, opinions, estimates, forecasts, ratings or risk assessments described herein IS NOT TO BE RELIED
UPON as a representation and/or warranty by the DBS Group (and/or any persons associated with the aforesaid entities), that:
(a) such valuations, opinions, estimates, forecasts, ratings or risk assessments or their underlying assumptions will be achieved, and
(b) there is any assurance that future results or events will be consistent with any such valuations, opinions, estimates, forecasts, ratings or risk
assessments stated therein.
Please contact the primary analyst for valuation methodologies and assumptions associated with the covered companies or price targets.
Any assumptions made in this report that refers to commodities, are for the purposes of making forecasts for the company (or companies)
mentioned herein. They are not to be construed as recommendations to trade in the physical commodity or in the futures contract relating to the
commodity referred to in this report.
Page 128

Company Guide
ST Engineering
DBS Regional Research Offices
HONG KONG DBS Vickers (Hong Kong) Ltd Contact: Paul Yong 18th Floor Man Yee Building 68 Des Voeux Road Central Central, Hong Kong Tel: 65 6878 8888 Fax: 65 65353 418 e-mail: [email protected] of the Stock Exchange of Hong Kong
MALAYSIA AllianceDBS Research Sdn Bhd Contact: Wong Ming Tek (128540 U) 19th Floor, Menara Multi-Purpose, Capital Square, 8 Jalan Munshi Abdullah 50100 Kuala Lumpur, Malaysia. Tel.: 603 2604 3333 Fax: 603 2604 3921 e-mail: [email protected]
SINGAPORE DBS Bank Ltd Contact: Janice Chua 12 Marina Boulevard, Marina Bay Financial Centre Tower 3 Singapore 018982 Tel: 65 6878 8888 Fax: 65 65353 418 e-mail: [email protected] Regn. No. 196800306E
INDONESIA PT DBS Vickers Sekuritas (Indonesia) Contact: Maynard Priajaya Arif DBS Bank Tower Ciputra World 1, 32/F Jl. Prof. Dr. Satrio Kav. 3-5 Jakarta 12940, Indonesia Tel: 62 21 3003 4900 Fax: 6221 3003 4943 e-mail: [email protected]
THAILAND DBS Vickers Securities (Thailand) Co Ltd Contact: Chanpen Sirithanarattanakul 989 Siam Piwat Tower Building, 9th, 14th-15th Floor Rama 1 Road, Pathumwan, Bangkok Thailand 10330 Tel. 66 2 857 7831 Fax: 66 2 658 1269 e-mail: [email protected] Regn. No 0105539127012Securities and Exchange Commission, Thailand
Page 129

ed: TH / JC, PY, CS
BUY(Initiating Coverage)
Last Traded Price ( 27 Mar 2018): S$0.54 (STI : 3,439.35)
Price Target 12-mth: S$0.77 (44% upside)
Potential Catalyst: Earnings delivery, M&A, Shift to consignment model
Analyst Carmen Tay +65 6682 3719 [email protected] Sachin MITTAL +65 6682 3699 [email protected]
Price Relative
Forecasts and Valuation FY Dec (US$m) 2017A 2018F 2019F 2020F
Revenue 14.2 25.2 37.6 52.4 EBITDA 0.13 2.75 6.03 10.1 Pre-tax Profit (1.0) 2.54 5.84 9.91 Net Profit (0.9) 1.80 4.14 7.03 Net Pft (Pre Ex.) 0.08 1.80 4.14 7.03 EPS (S cts) (0.6) 1.15 2.64 4.49 EPS Pre Ex. (S cts) 0.05 1.15 2.64 4.49 EPS Gth (%) nm nm 130 70 EPS Gth Pre Ex (%) (95) 2,051 130 70 Diluted EPS (S cts) (0.6) 1.15 2.64 4.49 Net DPS (S cts) 0.39 0.23 0.53 0.90 BV Per Share (S cts) 3.98 4.80 6.92 10.5 PE (X) nm 46.5 20.3 11.9 PE Pre Ex. (X) 1000.1 46.5 20.3 11.9 P/Cash Flow (X) nm 53.9 56.8 21.6 EV/EBITDA (X) 628.6 30.5 13.9 8.2 Net Div Yield (%) 0.7 0.4 1.0 1.7 P/Book Value (X) 13.4 11.1 7.7 5.1 Net Debt/Equity (X) 0.0 CASH CASH CASH ROAE (%) (20.8) 26.5 45.1 51.5
Consensus EPS (S cts): 2.36 3.40 N/A Other Broker Recs: B: 0 S: 0 H: 1
ICB Industry : Technology ICB Sector: Software & Computer Services Principal Business: Y Ventures is a Singapore-founded data analytics driven e-commerce retailer and distributor
Source of all data on this page: Company, DBS Bank, Bloomberg Finance L.P.
At A Glance
Issued Capital (m shrs) 205 Mkt. Cap (S$m/US$m) 110 / 83.8 Major Shareholders (%) Yik Sen Low 34.7 Yik Jin Low 34.7 Prism Investment Ventures Ltd 11.1
Free Float (%) 19.6 3m Avg. Daily Val (US$m) 0.62
DBS Group Research . Equity 28 Mar 2018
Singapore Company Focus
Y Ventures Group Ltd Bloomberg: YVEN SP | Reuters: YVEN.SI Refer to important disclosures at the end of this report
Data-driven e-commerce player Early-stage yet profitable online distributor and retailer
with a differentiated business model
EBITDA projected to grow at 92% CAGR over FY18F-20F
Initiate coverage with BUY and TP of S$0.77, offeringpotential upside of c.44%
Proprietary data analytics capabilities cement its position as a
value-adding partner to traditional businesses. Y Ventures Group
(YVEN) distributes products from third-party brands over some of
the largest e-commerce platforms (including Amazon and Lazada)
across ten countries. Unlike traditional distributors & e-commerce
platforms, YVEN stands out for its provision of value-added data
analytics service to brand partners, allowing them to adapt their
products to the market needs. In return, the brands offer
significant price discounts to YVEN. The launch of private labels in
areas where YVEN is confident of achieving strong sell-through
rates based on analytics, as in the case of JustNile and Faire
Leather Co, further augments margins.
Multi-pronged approach to e-commerce driving 92% EBITDA
CAGR over FY18F-20F. Earnings growth should primarily be driven
by the (i) Expansion of YVEN’s brand partner network and product
range. R3 Asian Gems – a fund linked to the founder of V3/OSIM
group, will help to introduce new retail brands, strategic alliances
and possible acquisition targets, (ii) Replication of the Elsevier
partnership model to other book publishers and new product
categories, and (iii) Acceleration of private label projects, which
tend to have longer gestation periods but offer higher margins.
Cross-border purchase platform AORA could start contributing
from FY19F onwards, providing further upside. Due to limited
visibility, we have yet to factor this into our projections.
Valuation: Initiate with BUY and TP of S$0.77, based on 20x FY19F
EV/EBITDA, at a 15% discount to larger peers’ 23x due to YVEN’s
smaller scale. This translates to 3.2x FY19F EV/Sales vs peers’ 3.8x.
Our bear case valuation of S$0.47 suggests an attractive risk-
reward ratio at current levels.
Key Risks to Our View: (i) Execution and inventory obsolescence risk, (ii) Platform-specific
risks, (iii) Equity fund raising, and (iv) Concentration risk
62
112
162
212
262
312
0.1
0.2
0.3
0.4
0.5
0.6
0.7
0.8
Jul-17 Oct-17 Jan-18
Relative IndexS$
Y Ventures Group Ltd (LHS) Relative STI (RHS)
Page 130

Company Focus
Y Ventures Group Ltd
Company Background
Young, promising and already profitable. Leveraging on its proprietary data analytics platform, local e-commerce retailer and distributor YVEN has been profitable from the onset, which is rare among tech start-ups.
Incorporated in January 2013, the group has grown quickly over a relatively short span and currently markets over 5,500 SKUs of private label and third-party branded merchandise through 25 online marketplaces (including Amazon, eBay, Lazada, and Tokopedia) across ten countries.
YVEN's Online Marketplace Statistics
Source: Company, DBS Bank
YVEN's main value proposition lies in its ability to incorporate data analytics into the traditional e-commerce model, which helps optimise product and brand marketing efforts, and enhances sell-through rates. The company's strong sales performance (and profits) over FY14-17 demonstrates this.
Gross merchandising value more than doubled from c.S$6.2m in FY14 to c.$14.2m in FY17, with a steady earnings base of roughly US$1.5-16m p.a (FY15-16). Apart from one-off IPO and marketing expenses, property impairment charges and exchange losses, YVEN should have otherwise been profitable in FY17.
Pre-IPO Gross Merchandising Value vs PATMI (FY13-16)
Source: Company, DBS Bank
Unique proxy to the global e-commerce secular growth story. YVEN's Catalist Board listing in July 2017 breathed new life into SGX’s technology cluster, largely represented by manufacturing-related companies. Within this space, the group stands out for its proven data-driven approach to online retailing, and as a unique proxy to the fast-growing global e-commerce market.
Still in the early stages of growth, we believe that YVEN's SGX listing adds credibility and serves as a valuable aid to the group’s ongoing efforts to further expand its brand partner network and product portfolio. Its exponential growth potential and unique exposure (vs technology cluster peers) should continue to drive investor interest in the stock.
Over 70% of FY17 sales were from the US
Source: Company, DBS Bank
0.3
1.7 1.6
6.2 8.9
12.1
0.0
0.5
1.0
1.5
2.0
0.0
2.0
4.0
6.0
8.0
10.0
12.0
14.0
FY14 FY15 FY16
(US$
m)
(US$
m)
Adj. PATMI (RHS) Sales (LHS)12,000
Active Product Listings
5,500 25 SKUs Online Marketplaces
of on
Global Presence Online Marketplaces
USA
Europe
Taiwan
South Korea
Southeast Asia
India
Page 131

Company Focus
Y Ventures Group Ltd
Primarily derives revenue from e-commerce retail and distribution business. YVEN derives revenue from three key business segments, primarily: -
i. E-commerce retail and distribution (c.96.4% of FY17
sales),
ii. Logistics and freight forwarding services (c.3.5% of
FY17 sales), and
iii. Waste management services (c.0.1% of FY17 sales)
Comprising third-party brands and private label product sales, contributions from the e-commerce segment have grown quickly alongside YVEN's expanding product portfolio - from approximately 300 SKUs as at end-2014 to c.2,500 by end-2015 and over 5,500 currently, and continues to represent the bulk of the group’s consolidated revenues.
YVEN's inventories are mainly held in third-party warehouses managed by various third-party logistics companies and last-mile fulfilment service providers, but also provides logistics and freight forwarding services to third-party customers from time to time.
Through subsidiary Skap Waste Management, the group also provides waste management services (i.e. disposal of residential waste and secured disposal of sensitive documents and media containing confidential info, etc) in Singapore, but contributions remain small for now.
Bulk of Sales from Distribution of Third-party Products
Source: Company, DBS Bank
Stronghold in books a steady revenue source. The group first began its e-commerce journey by procuring used textbooks from Singapore and selling them on online marketplaces in the US. Leveraging on its proprietary data analytics software, the group identified significant untapped potential in online book retailing, as most publishers had extensive offline distribution channels but often lacked the necessary tools and expertise to develop an online presence. A substantial proportion of YVEN's purchases are from book publishers, particularly medical textbooks and reference materials from Elsevier Group.
Major Suppliers – Books Represent c.83% of Purchases
% of Total Purchases
Suppliers of Books FY14 FY15 FY16 FY17*
Elsevier Group 47.6 47.1 66.6
SR International 17.3 0.6 -
ChoiceTexts (Asia) 5.5 - -
Popular Book Company 5 4.4 0.4
CV Spectra Group 0.7 10.1 7.4
PT Buku Trading 0.5 5.1 8.4
Total: 76.6 67.3 82.8 82.8
*based on DBS estimates Source: Company, DBS Bank
YVEN's niche in online book retailing serves as a steady source of revenues – we estimate that c.80% of FY17 sales were derived from books - and has allowed the group to command superior gross margins of over 40% from FY14-17.
Upside from replication of successful partnership with Elsevier to other publishers and product categories. Following the recent onboarding of a leading academic publisher (similar to Elsevier), YVEN's online book sales are likely to remain on a steady growth trajectory but ongoing efforts to replicate its successful model to other product segments should see proportions shift in favour of the budding Home and Décor and FMCG categories. For FY18F, the company expects contributions from books to be closer to 65-70% vs average of c.77% over FY14-17.
Beyond Books; Other Product Categories Growing Quickly
E-commerce Sales for Third-party Brands (US$ m) *
Product Categories FY14 FY15 FY16 FY17 CAGR Books 5.2 6.2 9.6 10.8 27.3%
Others (Home/Décor, FMCG)
0.5 1.1 1.0 1.8 49.4%
*based on DBS estimates Source: Company, DBS Bank
Private label strategy taking shape. In addition to distributing merchandises under third-party brands, YVEN also sells OEM merchandises of home and décor products on online marketplaces through its private label, JustNile, which was launched in 2015. Examples of OEM merchandise sold through JustNile include wall clocks, mirrors and bathroom accessories.
Owing to longer gestation periods, private label sales growth of 16.1% CAGR over FY15-17 has lagged that of third-party brands (30.9% CAGR), but is set to accelerate going forward post the launch of Faire Leather, driving margin improvement.
A quick scan of JustNile’s virtual store on Amazon also shows that the bulk of its data-backed product selections have generated positive ratings and reviews.
93%83%
87%88%0%
10%
8%
8%
0.0
5.0
10.0
15.0
FY14 FY15 FY16 FY17
(US$
m)
Logistics and Freight Services Waste Management Services
E-commerce (Private Label) E-commerce (Third Party Brands)
Page 132

Company Focus
Y Ventures Group Ltd
Favourable Ratings for JustNile Products on Amazon
Source: Amazon
Synergistic collaborations with retail veterans a prelude of opportunities to come. We see the slew of collaborative opportunities that YVEN has been accorded with by industry veterans over the past year as a strong vote of confidence in YVEN's complementary retail-focused data analytics capabilities.
On 14 August 2017, a joint venture agreement was inked between YVEN and Toscano Pte Ltd to launch an online men’s leather goods label, Faire Leather Co. The group also raised S$1.2m in January 2018 from strategic investor, R3 Asian Gems – a fund linked to the founder of V3/OSIM group, Ron Sim.Both parties have also signed a non-binding memorandum ofunderstanding (MOU) in which R3 will help to introduce newretail brands, strategic alliances and possible acquisition targetsthat synergise with YVEN's longer-term growth objectives.
Most recently, on 2 March 2018, YVEN also entered into a non-binding MOU with Singapore Post Limited to explore a potential collaboration for the development of an e-commerce buying platform and logistics-related technology, among others.
Summary of Recent Collaborations
Date Partner Nature of Collaboration Aug-17 Toscano Joint venture for the business of
marketing, distribution and online retail of men’s leather accessories and related products through Faire Leather
Jan-18 R3 Asian Gems i) Subscribed to 2.4% of YVEN'senlarged share capital of 205mshares for S$1.2m.
ii) R3 to contribute its expertise,strategic advice and businesscontacts in the consumer retailmarket – particularly theintroduction of new retail brands,strategic alliances and acquisitiontargets to the group.
Mar-18 SingPost Non-binding MOU for the development of:
i) An e-commerce buying platform,AORA, which will focus on cross-border purchases andconsolidation of deliveries onbehalf of consumers, and
(ii) Logistics-related technology toenhance efficiency across thevertical logistics chain.
Source: Company, SGX announcements, DBS Bank
Page 133

Company Focus
Y Ventures Group Ltd
Business Model – Not Your Typical Distributor
Data Analytics is the Backbone of Y Ventures’ Profitable E-Commerce Business
Unlocking the power of data to forge win-win partnerships and sell better. The traditional business model does not enable brand owners to capitalise on valuable insights which may be obtained through the use of online distribution/retail channels.
YVEN's unique business model fills a vital gap in the retail space, and creates value. Its edge in data analytics allows the group to identify market opportunities and procure third-party branded merchandise (often direct from the source) at discounted prices – essentially volume discounts without substantial upfrontvolume commitments.
In turn, YVEN provides brand partners with ready access to its platform-agnostic distribution network, dedicated marketing efforts, profit-sharing and valuable data insights. We envision
such win-win partnerships to be popular with traditional retailers who have yet to establish an online presence.
The merits of YVEN's data-backed business model are reflected in its above-average margins vs traditional distributors, and profitability despite still being in the early stages of growth:
Net Margins FY14 FY15 FY16
Y Ventures (YVEN) 4.8% 18.8% 12.6%
FMCG Industry Average 3-10%
Electronics Industry Average 3-7%
Source: Company, Alliance Experts
“Pricing Intelligence and Product Marketing”
“Order Execution and Buyer Engagement”
“Demand Forecasting and Inventory Stocking”
Inventory
Planning Sales
Optimisation Fulfilment
Entire Sales Process Powered by Comprehensive Data Analytics Programme
“Merchandise Research and Procurement”
2 4
How? How? How? How?
3
Predictive modelling ofdemand and sales trendsacross products andchannels determineoptimal quantities tostock
Iterative analytics process torefine product specificationand develop optimalmerchandise range
Identification ofcollaborative opportunitieswith product manufacturersor OEMs
Optimising titles andkeywords when listingproducts to ensure optimalsearch ranking on onlinemarketplaces
Real-time pricingalgorithms based onanalysis of historical trendsand sellers’ behaviouralpatterns
Sentiment analysis on actualsales data and customerreviews
Proprietary data improvesrobustness of regressionmodel
Value-added insights furtherenhance product sourcingphase, driving further sales
Source: Company, DBS Bank
Product
Sourcing 1
Page 134

Company Focus
Y Ventures Group Ltd
Creating Value for Brand Partners: Case Study on Book Publishers
Examples of Value Creation Through Data Analytics
Source: Company, DBS Bank
Proven formula for successful long-term partnerships can be
applied to other segments. Supported by actionable data
insights, YVEN's ever-growing domain knowledge and value-
add to brand owners in this underserved category provide a
strong foundation for long-standing mutually beneficial
partnerships, and is evidenced by the former’s robust growth in
the high-margin book publishing category since its
incorporation in 2013.
The practical applications for YVEN's proprietary data insights
are multifaceted. Examples of value-added data-driven services
and strategies that the group has provided to/developed for
leading academic publishers in recent years include:
- Helping brand owners to squeeze out parallel importers
- Identifying genres where market gaps exist, i.e. Health
Care Delivery, Public Health, etc
- Taking advantage of real-time pricing opportunities to
maximise earnings potential
- Development of region-specific, omni-channel sales and
marketing strategies
Rather than a one-off success, we see vast potential for YVEN's
scalable technology, which can be readily customised and
applied to other product categories - driving sustainable, long-
term growth.
Finding Pricing Opportunities to Maximise Earnings
Price Scatter Plot:
Discount Percentile Mapping:
Source: Company, DBS Bank
Identification of Market
Opportunities
Formulation of Pricing Strategies
Development of Omni-channel
Strategy
Research across different brands to pinpoint market gaps where publishers can potentially grow their presence
Discover new pricing opportunities that publishers can take
advantage of based on market players’ pricing
range Through geospatial analysis to identify region-specific content
for underserved consumers
Page 135

Company Focus
Y Ventures Group Ltd
Successful Launch of Faire Leather Provides Further Validation
Incubating new brands; integrating data analytics with
traditional product development. Through its data
programme, YVEN uncovered an opportunity within the
consumer space - its research show that consumers tend to be
relatively brand-agnostic for quality men’s leather products
within a given (undisclosed) price range.
The group subsequently partnered with traditional leather
goods company Tocco Toscano (“Toscano”) to launch Faire
Leather Co. YVEN will own 51% of Faire Leather Co. and
Toscano the remaining 49%. The partnership aims to leverage
on YVEN's unique specialisation in online distribution and
Toscano’s expertise in leather craftsmanship.
Offering “functional luxury at a fair price”. Cutting out the
middle man, cost savings from Faire Leather’s direct-to-
consumer approach are passed on to consumers. Faire Leather
has privileged access to Toscano’s factory, which has also
produced for several luxury brands. This allows Faire Leather
to enjoy cost savings throughout the production process,
while providing assurance of product quality.
Kickstarter campaign a resounding success. Faire Leather used
crowdfunding platform Kickstarter as a test bed for the
viability of the Everyday Padfolio and Travel Briefcase, whose
features were crafted based on data gathered from in-depth
sentiment analyses.
To fund their production, a campaign was launched to raise
S$50,000 in November 2017. At the end of the campaign in
January 2018, Faire Leather had raised over S$406,000 – the
highest funded Kickstarter campaign ever launched in
Singapore.
Faire Leather: Travel Briefcase and Everyday Padfolio
Source: Faire Leather Co.
Utilising Data Analytics to Develop Faire Leather Co.
Source: Company, Amazon, DBS Bank
Everyday Padfolio Travel Briefcase
Product Philosophy: Polished Exteriors, Effortless Organisation
Quantitative Analysis
Qualitative Analysis
Page 136

Company Focus
Y Ventures Group Ltd
Industry Prospects
Cross-border B2C E-commerce Transaction Value to Near US$1tr Mark by 2020
Source: Accenture & AliResearch: Global Cross Border B2C e-Commerce Market 2020, DBS Bank
Explosive growth in online B2C cross-border transactions. Consultancy firm Accenture predicts that the total gross merchandising value (GMV) of cross-border and domestic e-commerce will grow at a 13.5% CAGR to reach US$3.4tr by 2020, as over 2bn individuals (c.60% of the global population) are expected to transact c.13.5% of their overall retail consumption online.
While B2C online transactions have been mainly domestic, the rise of m-commerce (mobile commerce) and advancements to logistics infrastructure and last-mile connectivity are set to grow cross-border transactions twice as fast. Poised to grow at a 27.2% CAGR, annual cross-border B2C transactions could deliver US$994bn in gross merchandising value by 2020, representing c.29.2% of the overall e-commerce pie.
Asia to Account for c.48% of Cross-border B2C Trade by 2020
Region (US$ bn)
2014 2020E CAGR% Asia Pacific 71 476 37.3%
Western Europe 73 217 19.9%
North America 67 177 17.6%
Latin America 6 53 43.8%
Mid-eastern Europe & Central Asia
13 45 23.0%
Middle East & Africa 5 26 31.6%
Total 235 994 27.2%
Source: Accenture & AliResearch, DBS Bank
Online marketplaces to play a bigger role. A study conducted by the Ecommerce Foundation estimated that global marketplaces such as Amazon and Alibaba will own c.39% of the global online retail market by 2020 vs 10-30% in 2015, depending on the country.
Largely untapped potential in Asia. Approximately 70-80% of YVEN's FY17 revenues were generated from online marketplaces in the US. Marketplaces in Europe and Asia accounted for the remaining 20-30%. While robust demand from US marketplaces have served as a steady source of revenue for the group, the rapidly-growing Asian e-commerce market also holds immense potential.
Accenture also believes that Asia alone could account for c.47.9% of global cross-border B2C trade by 2020, vsc.30.2% in 2014. The growing preference for e-commerce inAsia bodes well for YVEN, as the group has alreadyestablished networks with leading online marketplaces in theregion, which are ready for the ramp-up.
Upcoming “buy-for-me” platform a multi-million dollar opportunity. According to a report by Google and Temasek Holdings, Singapore’s e-commerce market will grow at least fivefold over a ten-year period to reach US$5.4bn by 2025. Approximately 55% are estimated to be cross-border transactions.
Assuming YVEN's collaboration with SingPost, AORA, materialises, and that it is able to command 5% of market share by 2025 with a 2% service fee on GMV, translates into potential fee revenue of over S$3m p.a.
0
200
400
600
800
1000
1200
2014 2015 2016E 2017E 2018E 2019E 2020E
(US$
m)
Asia Pacific Western Europe North America Latin America Mid-eastern Europe & Central Asia Middle East & Africa
235
994
Page 137

Company Focus
Y Ventures Group Ltd
Management and Strategy
Led by an experienced management team. YVEN is co-
founded and led by brothers Adam and Alex Low. Combined,
they hold a controlling c.71% stake in the company.
They each carry over 14 years of experience in e-commerce
distribution and data analytics, and together with the key
management team, have taken their expertise in the retail
arena to new heights – starting with the onboarding of
leading medical publishing house Elsevier Group to YVEN's
online distribution network in mid-2014.
The group has since expanded its client and product base to
over 5,500 SKUs across >20 brands, with a wider
geographical coverage.
Dividend policy. YVEN does not have a fixed dividend policy
but expects to pay dividends of at least 20% in FY18F.
Management Reporting Structure
Source: Company
Key Management Team
Source: Company, DBS Bank
Adam Low Executive Chairman and Managing Director
(Co-founder of YVEN)
- Oversees the logistics arm of the group, focusing on sourcing and
procurement, freight forwarding as well as waste management services
- Prior to founding the group, Adam spent six years with the Singapore Armed
Forces, primarily as a liaison officer with the Defence, Science and
Technology Agency
- Holds a Diploma in Electronics Engineering from Temasek Polytechnic
Alex Low Chief Executive Officer and Executive Director
(Co-founder of YVEN)
- Primarily responsible for the overall day-to-day management of the group,
including business strategy, online marketplace channel expansion, online
sales and technology department
- Graduated from University of Washington with a Bachelor of Science in
Applied and Computational Mathematics, also holds a Master in Business
Administration from Peking University
Chin Ngai Sung Chief Financial Officer - Responsible for all finance activities and accounting operations, reviewing
legal documents, liaising with external lawyers and providing financial
strategic planning, budgeting and forecasting
- Nearly two decades of experience in audit and finance. Prior to joining YVEN,
served as the Finance Director of Aardwolf Pestkare (Singapore) where he led
the financial and tax functions
Lim Poh Lian Freight Manager - Responsibilities include coordination, cross-border freight arrangements and
being a liaison with last-mile fulfilment companies
- Over 12 years of experience in the logistics industry and joined YVEN in 2012
Lim Li Jie Data Analytics Manager - Responsible for implementing, improving and managing the data analytics
capabilities of the group, with a focus on the book publishing product
category
- Obtained his Bachelor of Computing from the National University of
Singapore in 2004
Page 138

Company Focus
Y Ventures Group Ltd
Multi-pronged Approach to E-commerce
Source: Company
Ease of scale. YVEN's platform-agnostic data analytics
capabilities can be readily customised and applied across
product categories and geographies, which enables the
group to identify and capitalise on market gaps and lucrative
opportunities as they arise.
Ongoing investments in R&D should further enhance the
effectiveness of its data analytics programme. Coupled with
greater visibility and working capital post-IPO, YVEN
could easily replicate its success in books (Distribution) and
launch of Faire Leather (Retail), as it expands its geographical
coverage, brand partner network and product range.
Capitalising on new collaborative opportunities; OSIM could
be one. YVEN's SGX listing has helped open new doors for
the group. Per our conversations with management, it now
has over 100 brands on its waiting list. The majority are likely
to be traditional businesses which are still operating on a
smaller scale.
Given finite resources, not all will translate into actual
collaborative opportunities – at the onset. We believe that
priority will also be given to more established brands - but the
strong interest provides a glimpse into YVEN's long-term
growth potential.
V3 Group Brand Portfolio
Source: V3 Group Limited
Further, following R3’s investment in the company earlier this
year, we do not rule out a possible injection of selected
products under V3’s established GNC, TWG and OSIM brands
into YVEN's distribution portfolio. This could yield significant
benefits for YVEN from both an earnings and brand equity
perspective.
Adopting a consignment model could help unlock higher
scalability. YVEN's inventory-taking model allows the group
to maximise earnings potential per unit sale (i.e. higher
margins) but on the flip side, ties up capital.
Still in the early stages of growth, we opine that the adoption
of a consignment strategy which runs parallel to, and could
eventually replace the group’s existing inventory-taking
model. This would free up working capital toward higher-
margin segments and unlock higher scalability for the group,
allowing YVEN to expand quickly.
While we are comforted by YVEN's inroads into the
consignment market through its partnership with Taiwanese
brand, Footpure, we acknowledge that it could take time
before this strategy pans out on a larger scale.
Launch of new e-commerce projects such as the potential
collaboration with SingPost to develop a global cross-border
buying platform, AORA. Given the non-binding MoU, we
have yet to impute contributions from this project into our
forecasts.
Upside from M&A. In addition to organic growth, YVEN is
also on the lookout for strategic acquisitions or joint ventures
with synergistic parties, particularly distributors with strategic
alignments and investment in consumer product brands,
existing channel stores and overseas joint ventures.
Page 139

Company Focus
Y Ventures Group Ltd
Key Risks
Inherent risks in inventory-taking model. Compared to a consignment-based approach, an inventory-based model carries substantially higher sell-through risks. Weaker-than-expected sales also ties up capital, which could have otherwise been redeployed to higher-margin projects. YVEN also bears the risk of inventory obsolescence.
While there are clear risks to an inventory-based model, we believe that YVEN’s data analytics capabilities would help lower its sell-through risks substantially vs traditional distributors.
Possible equity fund raising to grow business. YVEN’s inventory-taking model entails upfront payments to brand partners, which ties up working capital. Apart from capital required to expand its product range, its AORA project which is still in the early stages of development, also requires further investment.
To grow its business and finance longer-term growth objectives, we believe that YVEN would likely have to re-tap the equity market. Conversely, inability to raise funds could impede growth.
AORA remains a wildcard. We estimate that YVEN has invested at least US$500,000 to develop the AORA platform. While the capabilities and skills that have been developed in the process are transferable, there is no guarantee that the platform will be commercially viable.
Platform-specific risks. YVEN is exposed to platform-related risks at both the data and sales level.
YVEN’s data analytics capabilities are based off public and proprietary data obtained from online marketplaces. Insights derived from these datasets help formulate the group’s product and pricing strategies. If these marketplaces choose to withhold such data from users later on, or if these data sets turn out to be erroneous, it could have an adverse impact on the group.
Additionally, YVEN is also susceptible to changes in commission rates charged by online marketplaces, which may have to be absorbed by the group.
Concentration risk. Approximately 80% of FY16 revenues were derived from the books publishing category. The Elsevier Group alone accounted for c.67% of YVEN’s purchases.
YVEN has benefited strongly from its entrenched relationship with Elsevier Group, which has translated to higher margins. Disruptions to their partnership could weigh heavily on the group’s profitability.
Page 140

Company Focus
Y Ventures Group Ltd
Key Assumptions
Segmental Breakdown FY Dec 2015A 2016A 2017A 2018F 2019F 2020F
Revenues (US$m) E-commerce retail and distribution
8.19 11.6 13.7 24.7 37.0 51.8
Logistics and freight forwarding services
0.21 0.09 0.01 0.02 0.02 0.02
Waste management services
0.48 0.44 0.49 0.52 0.54 0.57
Total 8.87 12.1 14.2 25.2 37.6 52.4
Source: Company, DBS Bank
Income Statement (US$m)
FY Dec 2015A 2016A 2017A 2018F 2019F 2020F
Revenue 8.87 12.1 14.2 25.2 37.6 52.4
Cost of Goods Sold (4.6) (6.8) (8.3) (15.1) (22.5) (31.4)
Gross Profit 4.31 5.32 5.94 10.1 15.0 21.0
Other Opng (Exp)/Inc (2.6) (3.6) (7.2) (7.8) (9.4) (11.3)
Operating Profit 1.96 1.94 0.01 2.56 5.85 9.93
Other Non Opg (Exp)/Inc 0.0 0.0 0.0 0.0 0.0 0.0
Associates & JV Inc 0.0 0.0 0.0 0.0 0.0 0.0
Net Interest (Exp)/Inc 0.0 0.0 0.0 0.0 0.0 0.0
Exceptional Gain/(Loss) 0.0 (0.1) (1.0) 0.0 0.0 0.0
Pre-tax Profit 1.94 1.84 (1.0) 2.54 5.84 9.91
Tax (0.2) (0.2) 0.0 (0.4) (1.0) (1.7)
Minority Interest (0.1) (0.1) 0.12 (0.3) (0.7) (1.2)
Preference Dividend 0.0 0.0 0.0 0.0 0.0 0.0
Net Profit 1.67 1.53 (0.9) 1.80 4.14 7.03
Net Profit before Except. 1.67 1.61 0.08 1.80 4.14 7.03
EBITDA 2.07 2.05 0.13 2.75 6.03 10.1
Growth
Revenue Gth (%) 43.6 36.5 17.4 77.3 49.0 39.5
EBITDA Gth (%) 321.3 (0.9) (93.6) 2,004.4 119.4 67.6
Opg Profit Gth (%) 385.7 (0.8) (99.7) 40,622.4 128.5 69.7
Net Profit Gth (Pre-ex) (%)
466.2 (3.6) (94.9) 2,105.2 129.5 69.9
Margins & Ratio
Gross Margins (%) 48.6 43.9 41.8 40.0 40.0 40.0
Opg Profit Margin (%) 22.1 16.1 0.0 10.2 15.6 19.0
Net Profit Margin (%) 18.8 12.6 (6.2) 7.2 11.0 13.4
ROAE (%) 71.7 55.7 (20.8) 26.5 45.1 51.5
ROA (%) 37.3 27.9 (11.2) 15.7 25.8 30.2
ROCE (%) 51.2 44.2 0.1 25.9 43.9 50.2
Div Payout Ratio (%) 6.5 158.8 N/A 20.0 20.0 20.0
Net Interest Cover (x) 93.9 85.0 0.3 132.2 317.8 568.4
Source: Company, DBS Bank
Margins Trend
-7.0%
-2.0%
3.0%
8.0%
13.0%
18.0%
2016A 2017A 2018F 2019F 2020F
Operating Margin % Net Income Margin %
Steady margin expansion as YVEN gains scale
Page 141

Company Focus
Y Ventures Group Ltd
Balance Sheet (US$m) FY Dec 2015A 2016A 2017A 2018F 2019F 2020F
Net Fixed Assets 1.57 1.52 1.34 1.37 1.46 1.61
Invts in Associates & JVs 0.0 0.0 0.0 0.0 0.0 0.0
Other LT Assets 0.0 0.0 0.21 0.44 0.37 0.30
Cash & ST Invts 0.73 0.94 0.88 1.58 2.00 4.16
Inventory 1.03 2.63 6.06 8.13 12.5 18.1
Debtors 0.85 0.82 1.20 1.71 2.54 3.55
Other Current Assets 0.90 0.0 0.0 0.0 0.0 0.0
Total Assets 5.08 5.91 9.70 13.2 18.9 27.7
ST Debt 0.03 0.03 0.04 0.04 0.04 0.04
Creditor 0.53 1.61 1.93 3.43 5.11 7.13
Other Current Liab 0.29 0.71 0.40 0.73 0.73 0.73
LT Debt 0.97 0.94 0.94 0.90 0.85 0.81
Other LT Liabilities 0.02 0.02 0.03 0.03 0.03 0.03
Shareholder’s Equity 3.13 2.36 6.08 7.52 10.8 16.5
Minority Interests 0.11 0.25 0.28 0.59 1.29 2.49
Total Cap. & Liab. 5.08 5.91 9.70 13.2 18.9 27.7
Non-Cash Wkg. Capital 1.96 1.13 4.93 5.67 9.22 13.8
Net Cash/(Debt) (0.3) 0.0 (0.1) 0.65 1.11 3.32
Debtors Turn (avg days) 28.9 25.1 26.0 21.1 20.6 21.2
Creditors Turn (avg days) 46.9 58.4 79.4 65.5 69.7 71.5
Inventory Turn (avg days) 89.0 100.0 194.8 173.4 168.5 178.6
Asset Turnover (x) 2.0 2.2 1.8 2.2 2.3 2.3
Current Ratio (x) 4.1 1.9 3.4 2.7 2.9 3.3
Quick Ratio (x) 1.9 0.7 0.9 0.8 0.8 1.0
Net Debt/Equity (X) 0.1 0.0 0.0 CASH CASH CASH
Net Debt/Equity ex MI (X) 0.1 0.0 0.0 CASH CASH CASH
Capex to Debt (%) 2.0 5.7 8.7 13.5 21.1 31.1
Source: Company, DBS Bank
Asset Breakdown Net Fixed Assets -10.7%
Assocs'/JVs -0.0%
Bank, Cash and Liquid
Assets -12.4%
Inventory -63.6%
Debtors -13.3%
Higher inventory levels as at end-FY17 reflects optimism over growth outlook
Page 142

Company Focus
Y Ventures Group Ltd
Cash Flow Statement (US$m)
FY Dec 2015A 2016A 2017A 2018F 2019F 2020F
Pre-Tax Profit 1.94 1.84 (1.0) 2.54 5.84 9.91
Dep. & Amort. 0.10 0.10 0.12 0.19 0.18 0.18
Tax Paid 0.0 0.0 0.0 (0.1) (1.0) (1.7)
Assoc. & JV Inc/(loss) 0.0 0.0 0.0 0.0 0.0 0.0
Chg in Wkg.Cap. (1.3) 0.65 (3.5) (1.1) (3.6) (4.5)
Other Operating CF 0.0 0.02 1.19 0.0 0.0 0.0
Net Operating CF 0.71 2.60 (3.2) 1.55 1.48 3.87
Capital Exp.(net) 0.0 (0.1) (0.1) (0.1) (0.2) (0.3)
Other Invts.(net) 0.0 0.0 0.0 0.0 0.0 0.0
Invts in Assoc. & JV 0.0 0.0 0.0 0.0 0.0 0.0
Div from Assoc & JV 0.0 0.0 0.0 0.0 0.0 0.0
Other Investing CF 0.0 0.0 (0.3) (0.3) 0.0 0.0
Net Investing CF 0.0 (0.1) (0.3) (0.5) (0.2) (0.3)
Div Paid (0.1) (2.4) (0.6) (0.4) (0.8) (1.4)
Chg in Gross Debt 0.0 0.0 0.0 (0.1) (0.1) (0.1)
Capital Issues 0.10 0.16 5.68 0.0 0.0 0.0
Other Financing CF (0.4) 0.0 (1.6) 0.0 0.0 0.0
Net Financing CF (0.5) (2.3) 3.46 (0.4) (0.9) (1.5)
Currency Adjustments 0.0 0.0 0.02 0.0 0.0 0.0
Chg in Cash 0.23 0.20 (0.1) 0.70 0.41 2.16
Opg CFPS (S cts) 1.32 1.28 0.22 1.68 3.21 5.37
Free CFPS (S cts) 0.45 1.67 (2.1) 0.91 0.82 2.31
Source: Company, DBS Bank
Capital Expenditure
0.0
0.1
0.1
0.2
0.2
0.3
0.3
2016A 2017A 2018F 2019F 2020F
Capital Expenditure (-)
US$m
Assumes 20% payout from FY18F
Page 143

Company Focus
Y Ventures Group Ltd
Valuation
Base-case valuation is S$0.77 per share. In our base case, we
assume an acceleration in sales growth across third-party and
private label products, but a moderation in margins vs FY16
levels due to the recent expansion of its team.
YVEN typically stocks what it can sell within a three-month
period. Given management’s conservative nature, the
significant c.130% increase in inventory levels at end-FY17
implies that efforts to grow its brand partner network and
product range are going according to plan, and signals its
rising confidence in sell-through rates for the years ahead.
Our revenue growth assumptions of 77% and 49% y-o-y for
FY18F and FY19F respectively, thus seem reasonable in our
view.
Substantial investments have been poured into the
development of the AORA platform alongside SingPost,
which could result in recurring fee income for the group. Due
to the lack of visibility, we have not factored in contributions
from this project which could yield revenues of at least
S$0.5m in its first full-year of launch.
Valuation based on 20x FY19F EV/EBITDA, at 15% discount
to larger peers’ average of 23x. Despite YVEN's high growth
profile, we favour an EV/EBITDA to EV/Sales valuation metric
for the company. We believe this better reflects the merits of
YVEN's data-driven approach, which underscores its steady
profit-generation ability, and is rare for an early-stage, high-
growth company.
Given its smaller scale, balanced against projected EBITDA
growth of c.92% CAGR over FY18F-20F, we see a multiple
of 20x as fair. This translates to FY19F EV/Sales of 3.2x,
which is also at a 15% discount to larger peers’ 3.8x.
Base-case Valuation (EV/EBITDA)
FY19 EBITDA of YVEN (US$m) 6.0
EV/EBITDA FY1 Peer Multiple 23.4
EV/EBITDA Valuation (15% Discount to Peers) 120.2
Outstanding Shares (m) 205
Implied share price (SG$) 0.77
Source: DBS Bank
Peer Comparables for YVEN (Based on Consensus Estimates)
Company Name
Exchange GICS Sub-Industry Name Price Close (LCL)
Market Cap (US$m)
Revenue (FY0, US$m)
P/E (FY0)
P/E (FY1)
EV/Sales (FY1)
EV/EBITDA (FY1)
Alibaba USA Internet Software & Services $ 192.6 482,547 22,994 56.6 36.4 12.6 29.0
Amadeus IT Spain Data Processing & Outsourced Services
€ 62.2 33,837 5,821 24.8 24.9 5.6 14.4
Amazon.com USA Internet & Direct Marketing Retail $ 1,591.0 770,215 177,866 348.9 191.2 3.4 29.3
ASOS UK Internet & Direct Marketing Retail GBP 7,514 8,772 2,487 103.8 76.9 2.5 36.7
Baozun USA Internet Software & Services $ 46.2 2,525 638 64.0 38.2 3.0 27.8
eBay USA Internet Software & Services $ 42.8 43,347 9,567 21.4 18.7 4.3 12.7
Groupon USA Internet & Direct Marketing Retail $ 4.6 2,555 2,844 41.4 23.0
Jumei International
USA Internet & Direct Marketing Retail $ 3.1 466 904 11.1
Overstock.com USA Internet & Direct Marketing Retail $ 48.5 1,214 1,800 0.6
Rakuten Japan Internet & Direct Marketing Retail ¥ 928.6 12,501 8,383 11.8 16.3 1.9 11.0
Shopify USA Internet Software & Services $ 146.3 14,655 673
Start Today Japan Internet & Direct Marketing Retail ¥ 2,714 7,937 686 52.1 37.7 8.3 24.7
Stitch Fix USA Internet & Direct Marketing Retail $ 21.8 2,114 977 1.5 35.4
Transcosmos Japan Data Processing & Outsourced Services
¥ 2,847 1,304 2,176 17.3 29.9 0.5 13.5
Wayfair USA Internet & Direct Marketing Retail $ 84.9 7,510 4,721 1.2
68.5 49.3 3.8 23.4
Y Ventures Singapore Internet & Direct Marketing Retail SGD 0.54 83 14 49.3 5.4 72.4
Source: ThomsonReuters, Company
Page 144

Company Focus
Y Ventures Group Ltd
Bull-case valuation of S$1.23 per share. Under our bull-case scenario, we assume that sales would be supercharged by the onboarding of reputed brand partners, i.e. the V3/OSIM group and adoption of a consignment strategy for selected categories, which offers higher scalability.
This would result in sales tracking closer to/outpacing inventory growth in FY18F/19F, to grow at 100%/60% y-o-y respectively. As higher scalability kicks in, EBITDA margins could improve to 15.9%/21.8% for FY18F/19F, vs 10.1%/16.9% under our base-case assumption. Similarly, we have not factored in any contributions from AORA.
Bull-case Valuation (EV/EBITDA)
FY19 EBITDA of Y Ventures (US$m) 9.6
EV/EBITDA FY1 Peer Multiple 23.4
EV/EBITDA Valuation (10% Discount to Peers) 192.1
Outstanding Shares (m) 205
Implied share price (SG$) 1.23
Source: DBS Bank
Bear-case valuation of S$0.47 per share. In our bear-case scenario, we assume lower inventory turnover, presumably on a longer gestation period for new products as YVEN continues to expand into new categories, and impute lower growth given upfront purchase requirements inherent in YVEN's inventory-taking model, which could constrain the group’s strong growth potential.
In this case, revenue growth for FY18F/19F would be more modest at 55%/45% respectively. Higher overheads and lower scale result in lower EBITDA of US$3.7m.
Bear-case Valuation (EV/EBITDA)
FY19 EBITDA of Y Ventures (US$m) 3.7
EV/EBITDA FY1 Peer Multiple 23.4
EV/EBITDA Valuation (10% Discount to Peers) 72.8
Outstanding Shares (m) 205
Implied share price (SG$) 0.47
Source: DBS Bank
Scenario Analysis
Source: DBS Bank
Sales (US$ m, FY17-20F)
Adj. EBITDA (US$ m, FY17-20F)
Page 145

Company Focus
Y Ventures Group Ltd
DBS Bank recommendations are based an Absolute Total Return* Rating system, defined as follows:
STRONG BUY (>20% total return over the next 3 months, with identifiable share price catalysts within this time frame)
BUY (>15% total return over the next 12 months for small caps, >10% for large caps)
HOLD (-10% to +15% total return over the next 12 months for small caps, -10% to +10% for large caps)
FULLY VALUED (negative total return i.e. > -10% over the next 12 months)
SELL (negative total return of > -20% over the next 3 months, with identifiable catalysts within this time frame)
Share price appreciation + dividends
Completed Date: 28 Mar 2018 11:00:27 (SGT) Dissemination Date: 28 Mar 2018 11:59:09 (SGT)
Sources for all charts and tables are DBS Bank unless otherwise specified.
GENERAL DISCLOSURE/DISCLAIMER
This report is prepared by DBS Bank Ltd. This report is solely intended for the clients of DBS Bank Ltd, its respective connected and associated
corporations and affiliates only and no part of this document may be (i) copied, photocopied or duplicated in any form or by any means or (ii)
redistributed without the prior written consent of DBS Bank Ltd.
The research set out in this report is based on information obtained from sources believed to be reliable, but we (which collectively refers to DBS
Bank Ltd, its respective connected and associated corporations, affiliates and their respective directors, officers, employees and agents (collectively,
the “DBS Group”) have not conducted due diligence on any of the companies, verified any information or sources or taken into account any other
factors which we may consider to be relevant or appropriate in preparing the research. Accordingly, we do not make any representation or
warranty as to the accuracy, completeness or correctness of the research set out in this report. Opinions expressed are subject to change without
notice. This research is prepared for general circulation. Any recommendation contained in this document does not have regard to the specific
investment objectives, financial situation and the particular needs of any specific addressee. This document is for the information of addressees
only and is not to be taken in substitution for the exercise of judgement by addressees, who should obtain separate independent legal or financial
advice. The DBS Group accepts no liability whatsoever for any direct, indirect and/or consequential loss (including any claims for loss of profit)
arising from any use of and/or reliance upon this document and/or further communication given in relation to this document. This document is not
to be construed as an offer or a solicitation of an offer to buy or sell any securities. The DBS Group, along with its affiliates and/or persons
associated with any of them may from time to time have interests in the securities mentioned in this document. The DBS Group, may have
positions in, and may effect transactions in securities mentioned herein and may also perform or seek to perform broking, investment banking and
other banking services for these companies.
Any valuations, opinions, estimates, forecasts, ratings or risk assessments herein constitutes a judgment as of the date of this report, and there can
be no assurance that future results or events will be consistent with any such valuations, opinions, estimates, forecasts, ratings or risk assessments.
The information in this document is subject to change without notice, its accuracy is not guaranteed, it may be incomplete or condensed, it may
not contain all material information concerning the company (or companies) referred to in this report and the DBS Group is under no obligation to
update the information in this report.
This publication has not been reviewed or authorized by any regulatory authority in Singapore, Hong Kong or elsewhere. There is no planned
schedule or frequency for updating research publication relating to any issuer.
The valuations, opinions, estimates, forecasts, ratings or risk assessments described in this report were based upon a number of estimates and
assumptions and are inherently subject to significant uncertainties and contingencies. It can be expected that one or more of the estimates on
which the valuations, opinions, estimates, forecasts, ratings or risk assessments were based will not materialize or will vary significantly from actual
results. Therefore, the inclusion of the valuations, opinions, estimates, forecasts, ratings or risk assessments described herein IS NOT TO BE RELIED
UPON as a representation and/or warranty by the DBS Group (and/or any persons associated with the aforesaid entities), that:
(a) such valuations, opinions, estimates, forecasts, ratings or risk assessments or their underlying assumptions will be achieved, and
(b) there is any assurance that future results or events will be consistent with any such valuations, opinions, estimates, forecasts, ratings or risk
assessments stated therein.
Please contact the primary analyst for valuation methodologies and assumptions associated with the covered companies or price targets.
Page 146
Company Focus
Y Ventures Group Ltd
Any assumptions made in this report that refers to commodities, are for the purposes of making forecasts for the company (or companies)
mentioned herein. They are not to be construed as recommendations to trade in the physical commodity or in the futures contract relating to the
commodity referred to in this report.
DBSVUSA, a US-registered broker-dealer, does not have its own investment banking or research department, has not participated in any public
offering of securities as a manager or co-manager or in any other investment banking transaction in the past twelve months and does not engage
in market-making.
ANALYST CERTIFICATION
The research analyst(s) primarily responsible for the content of this research report, in part or in whole, certifies that the views about the
companies and their securities expressed in this report accurately reflect his/her personal views. The analyst(s) also certifies that no part of his/her
compensation was, is, or will be, directly or indirectly, related to specific recommendations or views expressed in the report. The research analyst (s)
primarily responsible for the content of this research report, in part or in whole, certifies that he or his associate1 does not serve as an officer of the
issuer or the new listing applicant (which includes in the case of a real estate investment trust, an officer of the management company of the real
estate investment trust; and in the case of any other entity, an officer or its equivalent counterparty of the entity who is responsible for the
management of the issuer or the new listing applicant) and the research analyst(s) primarily responsible for the content of this research report or
his associate does not have financial interests2 in relation to an issuer or a new listing applicant that the analyst reviews. DBS Group has
procedures in place to eliminate, avoid and manage any potential conflicts of interests that may arise in connection with the production of
research reports. The research analyst(s) responsible for this report operates as part of a separate and independent team to the investment
banking function of the DBS Group and procedures are in place to ensure that confidential information held by either the research or investment
banking function is handled appropriately. There is no direct link of DBS Group's compensation to any specific investment banking function of the
DBS Group.
COMPANY-SPECIFIC / REGULATORY DISCLOSURES
1. DBS Bank Ltd, DBS HK, DBS Vickers Securities (Singapore) Pte Ltd (''DBSVS''), DBSV HK or their subsidiaries and/or other affiliates do not
have a proprietary position in the securities recommended in this report as of 28 Feb 2018.
2. Neither DBS Bank Ltd, DBS HK nor DBSV HK market makes in equity securities of the issuer(s) or company(ies) mentioned in this Research
Report.
Compensation for investment banking services:
3. DBS Bank Ltd, DBS HK, DBSVS, DBSV HK, their subsidiaries and/or other affiliates of DBSVUSA have received compensation, within the past
12 months for investment banking services from Alibaba Group as of 28 Feb 2018.
4. DBS Bank Ltd, DBS HK, DBSVS, their subsidiaries and/or other affiliates of DBSVUSA have managed or co-managed a public offering of
securities for Alibaba Group, in the past 12 months, as of 28 Feb 2018
5. DBSVUSA does not have its own investment banking or research department, nor has it participated in any public offering of securities as a
manager or co-manager or in any other investment banking transaction in the past twelve months. Any US persons wishing to obtain further
information, including any clarification on disclosures in this disclaimer, or to effect a transaction in any security discussed in this document
should contact DBSVUSA exclusively.
Disclosure of previous investment recommendation produced:
6. DBS Bank Ltd, DBS Vickers Securities (Singapore) Pte Ltd (''DBSVS''), their subsidiaries and/or other affiliates may have published other
investment recommendations in respect of the same securities / instruments recommended in this research report during the preceding 12
months. Please contact the primary analyst listed in the first page of this report to view previous investment recommendations published by
DBS Bank Ltd, DBS Vickers Securities (Singapore) Pte Ltd (''DBSVS''), their subsidiaries and/or other affiliates in the preceding 12 months.
1 An associate is defined as (i) the spouse, or any minor child (natural or adopted) or minor step-child, of the analyst; (ii) the trustee of a trust of which the analyst, his spouse, minor child (natural or adopted) or minor step-child, is a beneficiary or discretionary object; or (iii) another person accustomed or obliged to act in accordance with the directions or instructions of the analyst.
2 Financial interest is defined as interests that are commonly known financial interest, such as investment in the securities in respect of an issuer or a new listing applicant, or financial accommodation arrangement between the issuer or the new listing applicant and the firm or analysis. This term does not include commercial lending conducted at arm's length, or investments in any collective investment scheme other than an issuer or new listing applicant notwithstanding the fact that the scheme has investments in securities in respect of an issuer or a new listing applicant.
Page 147

ed: JS / sa:JC, PY, CS
The quarter all have been waiting for Positive trends expected for NIM, loan growth and
lower credit cost; typical seasonally strong quarter forwealth management; insurance is a wildcard
Sustained SIBOR/SOR rates will ensure NIM remains onan uptrend; lower credit cost back to pre-oil & gascrisis days is the trend going forward
BUY ratings maintained on OCBC and UOB; TPs raisedon higher NIM; entering a new era of higher ROEs
Singapore banks releasing 1Q18 results starting fromend April (DBS: 30 Apr, UOB: 3 May, OCBC: 7 May(GEH: 4 May))
The long awaited strong quarter. Net interest margin (NIM) and credit cost will be the focus this quarter. The sustained SIBOR uplift since 4Q17 should be well reflected in 1Q18’s NIM. With the woes from oil & gas non-performing loans (NPL) largely taken care off, banks should be booking significantly lower provisions y-o-y. Loan growth is expected to hover around 2% q-o-q while fee income should be seasonally stronger supported by wealth management. OCBC may experience some volatility in its insurance contribution because of the new accounting standard. All in, this is the long awaited strong set of quarterly results we have been waiting for. After going through several years of NIM compression and two years of NPL woes, the Singapore banks are ready to shine. Valuations are heading to +1SD of mean. MAS’ stance seals interest rate upcycle; room for
SOR/SIBOR to accelerate further. The Monetary Authority of Singapore (MAS) had on 13 April slightly increased the slope of the nominal effective exchange rate policy (SGD NEER) band to an appreciation pace. Our strategists do not expect a follow through with another tightening at the next review in Oct 2018. In this respect, expectations of a sustained upward trend for SOR/SIBOR should persist, which is positive for the banks. Taking this stance into consideration, we have lifted our NIM projections for FY18-19F by an additional 2-3bps resulting in earnings upgrades of c.4%. This is the basis to our higher TPs. BUYs maintained; TPs raised; heading to the next level.
We have BUYs on both OCBC and UOB with UOB as our preferred pick for 1) lower credit costs vs historical levels providing better earnings uplift, and 2) certainty of at least S$1.00 full year dividend. Our TP for UOB is raised to S$33.20. We continue to hope for higher dividends for OCBC. We have raised our TP for OCBC to S$15.30. Sustainable deliveries could push banks’ valuations closer to +1SD of the 10-year mean. Key risks. While all the stars appear aligned for the Singapore banks, there are a couple of risk factors. If SIBOR/SOR starts to decline, the NIM story will be out of the window (some degree of probability); slower than expected loan growth (small probability), and another upset in asset quality (low probability) could derail earnings upside.
STI : 3,570.02
Analyst Sue Lin LIM +65 83326843 [email protected]
Rui Wen LIM +65 66823720 [email protected]
Singapore Banks: NIM trends
No forecasts for DBS Source: Companies, DBS Bank
Singapore Banks: Loan growth
Source: Companies, DBS Bank
Singapore Banks: Credit costs
Source: Companies, DBS Bank
1.50%
1.60%
1.70%
1.80%
1.90%
2.00%
2.10%
2.20%
2.30%
1.00%
1.20%
1.40%
1.60%
1.80%
2.00%
2.20%
2.40%
2.60%
2008 2009 2010 2011 2012 2013 2014 2015 2016 2017 2018F
DBS OCBC UOB Average (RHS)
NIM (Banks) NIM (Average/Industry)
13.3%
1.0%
13.7%
24.1%
10.4%
19.5%
9.3%
0.0% 0.5%
8.0% 7.8%
1.4%
-1.3%
15.2%
6.2%
3.4%4.4%
2.9%1.8% 2.0%
3.2% 3.0%
-4.0%-2.0%0.0%2.0%4.0%6.0%8.0%10.0%12.0%14.0%16.0%18.0%
0.0%
4.0%
8.0%
12.0%
16.0%
20.0%
24.0%
28.0%
2008 2009 2010 2011 2012 2013 2014 2015 2016 2017 2018FLoan growth % GDP growth % (LHS)
GDP growth %Loan growth %
0.68%
0.97%
0.37%0.30%
0.23% 0.23% 0.24% 0.27%0.35% 0.35%
0.23%
0.00%
0.20%
0.40%
0.60%
0.80%
1.00%
0.00%
0.20%
0.40%
0.60%
0.80%
1.00%
1.20%
1.40%
2008 2009 2010 2011 2012 2013 2014 2015 2016 2017 2018F
DBS OCBC UOB Average
Provision charge-off rate (Banks) Provision charge-off rate (average)
DBS Group Research . Equity 26 Apr 2018
Singapore Industry Focus
Singapore BanksRefer to important disclosures at the end of this report
STOCKS
12-mth
Price Mkt Cap Target Price Performance (%)
S$ US$m S$ 3 mth 12 mth Rating
DBS 29.74 57,378 NA 9.6 56.8 NR OCBC Bank 13.76 43,308 15.30 3.0 42.0 BUY UOB 29.39 36,732 33.20 5.2 36.4 BUY
Source: DBS Bank, Bloomberg Finance L.P. Closing price as of 26 Apr 2018
Page 148

Industry Focus
Singapore Banks
Page 2
Reiterating our 2018 view; trends expected in 1Q18
A recovery year with greater conviction. In our 2018 Singapore Bank outlook report released on 23 Nov 2017, we highlighted three key trends to watch in 2018: 1) SIBOR rally will kick-start; NIM momentum should pick up, 2) pick up in loan growth, further supplementing top-line growth, and 3) NPL issues largely over, resulting in significantly lower credit costs. In 1Q18, we expect all these three trends to be visible.
NIM uplift story intact, should be clearly visible in 1Q18. With rate hikes almost a certainty in the coming quarters, the 3M SIBOR/SOR have broken out of their trading range, reaching their highest levels so far; currently at 1.5%. With a greater pass-through expected from the USD rates to SIBOR/SOR, the Singapore banks are almost surely to deliver higher NIM. The expected sustained rise in SIBOR should see the Singapore banks' NIM on a firmer rise in 2018.
Better than expected NIM uptrend; earnings raised. With the MAS’s stance on the SGD NEER announced on 13 April and expectations that the SGD would appreciate at a slower pace vs the USD, there will still be room for SOR/SIBOR to continue to rise. Our interest rate strategist expects SOR/SIBOR to surpass 2% by the end of the year. With greater certainty of this trend, taking into account some elements of competition and rise in funding costs outside Singapore operations, we have further raised our NIM forecast by 2-3bps on average. We now expect OCBC to see NIM improve by 8bps (from 6bps) to 1.73% (FY17: 1.65%) and UOB to see NIM improve by 9bps (from 6bps) to 1.86% (FY17: 1.77%). Our sensitivity analysis shows that every 25 bps rise in interest rates that reprices the S$, HK$ and US$ books collectively will lift NIM by an average of 3bps (UOB: +1bp; OCBC: +3bps) with a corresponding 2% increase (UOB:+1%; OCBC: +2%) in sector earnings.
Singapore: 3-month SIBOR, SOR and LIBOR; correlation has strengthened
Source: Bloomberg Finance L.P., DBS Bank
Singapore Banks: NIM and SIBOR quarterly trends; NIM gradually picking up since end-2016
Source: Companies, Bloomberg Finance L.P., DBS Bank
Singapore Banks: NIM forecasts; on an uptrend
Note: No forecasts for DBS Source: Companies, DBS Bank
First time in years, net interest income driven by both NIM and loan growth. The Singapore banks suffered from NIM compression during 2010-15, followed by several years of slow loan growth in 2015-16 with the slowest growth of 0% y-o-y in 2015. In 2017, loan growth picked up with a slightimprovement in NIM. In 2018, both NIM and loan growth willdrive net interest income.
Singapore Banks: NIM and loan growth
Note: No forecasts for DBS Source: Companies, DBS Bank
0.0
0.5
1.0
1.5
2.0
2.5
Jan-15 Apr-15 Jul-15 Oct-15 Jan-16 Apr-16 Jul-16 Oct-16 Jan-17 Apr-17 Jul-17 Oct-17 Jan-18 Apr-18
3m LIBOR 3m SIBOR 3m SOR Fed rate
%
1.45
1.50
1.55
1.60
1.65
1.70
1.75
1.80
1.85
1.90
-
0.50
1.00
1.50
2.00
2.50
3.00
1Q15
2Q15
3Q15
4Q15
1Q16
2Q16
3Q16
4Q16
1Q17
2Q17
3Q17
4Q17
3m SIBOR %
3M Sibor (LHS) DBS NIM UOB NIM OCBC NIM
Bank NIMs %
1.50%
1.60%
1.70%
1.80%
1.90%
2.00%
2.10%
2.20%
2.30%
1.00%
1.20%
1.40%
1.60%
1.80%
2.00%
2.20%
2.40%
2.60%
2008 2009 2010 2011 2012 2013 2014 2015 2016 2017 2018F
DBS OCBC UOB Average (RHS)
NIM (Banks) NIM (Average/Industry)
0.0
0.0
0.0
0.0
0.0
0.0
0.0
0.0
0.0
0.0
0.0
1.55%
1.60%
1.65%
1.70%
1.75%
1.80%
1.85%
2012 2013 2014 2015 2016 2017 2018F
NIM % Loan growth %
NIM % S$bn
Page 149

Industry Focus
Singapore Banks
Page 3
Sustained loan growth trends. Loan growth surprised on the upside in 2017 with banks generally guiding for 7-8% loan growth. The momentum is expected to continue in 2018, still driven by property-related (mainly domestic) as well as domestic and regional corporate loans. Sensitivity of loan growth to earnings is marginal (every 1 ppt increase in loan growth leads to only less than 1% impact on earnings). It would be more important to watch the impact of NIM on earnings.
Singapore Banks: Sustained loan growth trends in 2018
Note: No forecasts for DBS
Source: Companies, DBS Bank
Lower credit costs in 2018, a certainty. With NPL woes addressed in 2017, the banks should have a clean start in 2018 and credit costs should ease. We expect credit cost to drop by 12bps to 23bps (2017: 35bps). Based on our estimates, the through-the-cycle credit cost (2003-2016) stands at 35bps. With the implementation of IFRS9/SFAS109, banks are no longer allowed to buffer up general provisions. The SFAS109 requires banks to maintain a minimum of 1% collective impairment allowance and specific allowance to be set aside on a case-by-case basis (regulatory loss absorption reserves). The Expected Credit Loss (ECL) model includes more forward-looking information to assess credit quality of the bank’s underlying financial assets. With the current health operating environment and benign NPLs (now that the oil & gas issues have been sorted out), credit costs should reflect the pre-oil & gas crisis levels. The IFRS9/SFAS109 accounting rule will be tested in a crisis scenario.
Singapore Banks: Credit cost trends; tapering off sharply
Note: No forecasts for DBS
Source: Companies, DBS Bank
Seasonally strong fee income in 1Q18. 1Qs are typically strong for wealth management and market related activities. We expect fee income to be strong for the banks. OCBC may be an exception because of a change in accounting rules related to its insurance income contribution. While we expect Great Eastern Holdings (GEH) to post strong 1Q18 figures, its non-operational profit (from its non-par fund profit) could be stripped out and placed under other comprehensive income, under a new accounting rule (IFRS4 for insurance companies; which is equivalent to IFRS9 for banks).
Expenses would also be seasonally higher in 1Q. It is also typical that personnel costs are loaded in 1Q but the impact should not be too far away from the full year guidance. Cost-to-income ratio would benefit from higher revenues.
Capital – the last round of deduction for Basel III. We have reached the final year before the transitional period to fully loaded CET1. Banks have been well prepared for this. Over the past few years, the banks have been optimising capital utilisation and recalibrated their respective risk weighted assets. With clarity on the treatment of risk weighted assets for the Basel rules, banks started to raise dividends in 4Q17. Only OCBC did not raise dividends significantly, although we believe there is room to do so.
13.3%
1.0%
13.7%
24.1%
10.4%
19.5%
9.3%
0.0% 0.5%
8.0% 7.8%
1.4%
-1.3%
15.2%
6.2%
3.4%4.4%
2.9%1.8% 2.0%
3.2% 3.0%
-4.0%
-2.0%
0.0%
2.0%
4.0%
6.0%
8.0%
10.0%
12.0%
14.0%
16.0%
18.0%
0.0%
4.0%
8.0%
12.0%
16.0%
20.0%
24.0%
28.0%
2008 2009 2010 2011 2012 2013 2014 2015 2016 2017 2018F
Loan growth % GDP growth % (LHS)
GDP growth %Loan growth %
0.68%
0.97%
0.37%0.30%
0.23% 0.23% 0.24% 0.27%0.35% 0.35%
0.23%
0.00%
0.20%
0.40%
0.60%
0.80%
1.00%
0.00%
0.20%
0.40%
0.60%
0.80%
1.00%
1.20%
1.40%
2008 2009 2010 2011 2012 2013 2014 2015 2016 2017 2018F
DBS OCBC UOB Average
Provision charge-off rate (Banks) Provision charge-off rate (average)
Page 150

Industry Focus
Singapore Banks
Page 4
Valuation and recommendation
Back in the bull market zone. The last time we saw banks valuations at such levels was 10 years ago. In 2007, SIBOR hit a high of 3.5% while NIM averaged 2.1%. Loan growth was at double digits driven by the Integrated Resorts (IR) loans. Although NIM levels are lower now vs 10 years ago, we are nevertheless in a NIM uptrend era. With loan growth recovering, topline growth is a clear driver. Fee income has also changed structurally vs 10 years ago, with banks now relying more on wealth management income for growth. Expenses are well controlled and efficiency has improved, potentially bringing cost-to-income ratios to new lows. More importantly, credit costs are gradually shifting back to the pre-oil & gas NPL period. All these would seal expectations of strong 28% earnings growth for the banks in 2018 with ROEs heading to 11-12%. This clearly justifies higher valuations for the banks vs 5 years ago.
Singapore Banks: Earnings growth
Source: Bloomberg Finance L.P., Companies, DBS Bank
Trading slightly above10-year historical mean. The Singapore banks had a fantastic rally in 2017, starting from the first rate hike at end-2016. The banks have collectively appreciated by >30% over 2017, one of the best sector performances for theyear. Sustained momentum of NIM, loan growth and lowercredit costs with contained NPLs should lift valuations to atleast to mean P/BV multiples. For a further re-rating, wewould need to see stronger and sustainable revenue driversand a clear path for asset quality improvement.
Second best performer among ASEAN peers. Singapore banks emerged the second best performer vs its ASEAN peers, just after Malaysian banks. In our view, the rally for Singapore banks stems from improved expectations of better years ahead especially with the rate hike story intact and asset quality issues a thing of the past.
Singapore Banks: Rolling forward P/BV band (10-year)
Source: Bloomberg Finance L.P., Companies, DBS Bank
Singapore Banks: Rolling forward P/BV band vs ROE
Source: Bloomberg Finance L.P., Companies, DBS Bank
ASEAN Banks: YTD relative performance
Source: Bloomberg Finance L.P., Companies, DBS Bank
Prefer UOB. The stars are all aligned for UOB, hence our shift in preference to UOB now from OCBC. UOB’s key catalysts are clearly entrenched in its NIM and loan growth, but more importantly, lower credit cost after years of hoarding a 32 bps credit cost level be it rain or shine. UOB has also raised its dividends and S$1.00 full year DPS is expected to be sustainable. While we expect OCBC to do well in 1Q18, it might see some volatility in its insurance income arising from the new accounting standard and it is still awaiting a higher
-30.0%
-20.0%
-10.0%
0.0%
10.0%
20.0%
30.0%
40.0%
-30.0%
-10.0%
10.0%
30.0%
50.0%
2008 2009 2010 2011 2012 2013 2014 2015 2016 2017 2018F
DBS OCBC UOB Total
Mean, 1.29
+1SD, 1.57
+2SD, 1.85
-1SD, 1.02
-2SD, 0.74
0.5
0.7
0.9
1.1
1.3
1.5
1.7
1.9
2.1
2.3
06 07 08 09 10 11 12 13 14 15 16 17 18
PBV (X)
8
9
10
11
12
13
14
15
16
0.5
0.7
0.9
1.1
1.3
1.5
1.7
1.9
2.1
2.3
06 07 08 09 10 11 12 13 14 15 16 17 18
%x
P/B (LHS) ROE (RHS)
Malaysia, 9.8
Singapore, 4.9
Indonesia, 1.6
Thailand, -8.8
Philippines, -4.7
-15.0
-10.0
-5.0
0.0
5.0
10.0
15.0
Jan-18 Feb-18 Mar-18 Apr-18
Malaysia Singapore Indonesia Thailand Philippines
%
Page 151

Industry Focus
Singapore Banks
Page 5
dividend proposal. Elsewhere, we continue to wait for its decision on its insurance operations in Malaysia, where it is expected to lower its stake to 70% from 100%.
Key Risks
Relapse of oil & gas woes. While the banks have articulated that the oil & gas NPL issues are largely behind them, risks of these companies running out of cash flow as their funding instruments (bonds) mature remain a risk. We understand that most of these have been restructured or are undergoing restructuring, which means these accounts would have been
classified as NPLs. The remnants of these may still trickle into some NPL formation in 2018.
NIM and loan growth fail to deliver. We have been positive on NIM uplift and new loan growth. A disappointment in macro indicators could temper the better loan growth expectations. Although loan growth is less sensitive to earnings, sentiment of loan deceleration could dent top-line prospects. A slower-than-expected pass-through of Fed rate hikes to SIBOR/SOR could also derail the NIM uptrend. Competition in loan rates could be an added dent to NIM.
Singapore Banks: Peer comparison
Banking Group Market
cap Price
26 Apr
12-mthTargetPrice
Rating PE (x) CAGR PBV (x) ROE (%) Net div (%)
(US$bn) (S$/s) (S$/s) FY17A FY18F FY19F ^ (%) FY17A FY18F FY19F FY18F FY18F
DBS* 57,378 29.74 NA NR 17.5x 13.4x 11.9x 21.3 1.6x 1.6x 1.5x 12.0% 3.9% OCBC 43,308 13.76 15.30 BUY 14.0x 11.3x 10.3x 16.4 1.5x 1.4x 1.3x 12.8% 2.9% UOB 36,732 29.39 33.20 BUY 14.3x 11.7x 10.7x 15.6 1.4x 1.3x 1.2x 11.4% 3.4%
Weighted average 15.5x 12.3x 11.1x 1.5x 1.4x 1.3x 12.1% 3.5% Simple average 15.2x 12.2x 11.0x 1.5x 1.4x 1.3x 12.1% 3.4%
* Based on Bloomberg consensus
^ Refers to 2-year EPS CAGR for FY17-19F
Source: Companies, Bloomberg Finance L.P., DBS Bank
Page 152

ed: TH / sa: AS, JC, PY, CS
BUYLast Traded Price ( 26 Apr 2018): S$13.76 (STI : 3,570.02)
Price Target 12-mth: S$15.30 (11% upside) (Prev S$14.00)
Analyst Sue Lin LIM +65 83326843 [email protected] Rui Wen LIM +65 66823720 [email protected]
What’s New • NIM improvement across operations expected; credit
cost should be back to pre-oil & gas era
• Strong and sustainable non-interest income trends;
slight glitch in insurance contribution from new
accounting rules
• FY18-19F earnings raised by 4% each year on higher
NIM and lower credit costs
• Maintain BUY, TP lifted to S$15.30; a much anticipated
catalyst would be higher dividends
Price Relative
Forecasts and Valuation FY Dec (S$ m) 2017A 2018F 2019F 2020F
Pre-prov. Profit 5,498 6,556 7,199 7,741 Net Profit 4,106 5,079 5,561 5,969 Net Pft (Pre Ex.) 4,106 5,079 5,561 5,969 Net Pft Gth (Pre-ex) (%) 19.6 23.7 9.5 7.3 EPS (S cts) 98.2 121 133 143 EPS Pre Ex. (S cts) 98.2 121 133 143 EPS Gth Pre Ex (%) 17 24 9 7 Diluted EPS (S cts) 98.2 121 133 143 PE Pre Ex. (X) 14.0 11.3 10.3 9.6 Net DPS (S cts) 36.7 40.4 40.2 40.2 Div Yield (%) 2.7 2.9 2.9 2.9 ROAE Pre Ex. (%) 11.1 12.8 12.8 12.6 ROAE (%) 11.1 12.8 12.8 12.6 ROA (%) 1.0 1.1 1.2 1.2 BV Per Share (S cts) 909 990 1,083 1,185 P/Book Value (x) 1.5 1.4 1.3 1.2
Earnings Rev (%): 4 4 new Consensus EPS (S cts): 110.0 123.1 133.0
Other Broker Recs: B: 14 S: 0 H: 8
Source of all data on this page: Company, DBS Bank, Bloomberg Finance L.P.
Staying above the rest Staying positive; maintain BUY. NIM uptrend is a given in this
current operating environment. Management guided for 7-8%
loan growth for FY18. Wealth management and insurance
operations are holding up well, and will remain a key
differentiator of growth vs peers. However, a change in
accounting treatment for insurance income may cause a glitch in
earnings. We have only assumed that insurance income
contribution increases by 5% y-o-y. Management did guide that
credit costs should be back to pre-oil & gas levels which ranged
from 15-17bps over FY10-14; OCBC started providing for its oil &
gas exposure from as early as 3Q15. At this juncture, we have
conservatively assumed credit cost will hover around 21-22bps
over FY18-20F (previously assumed 26bps across FY18-20F).
Further earnings upside could be possible. What remains an
overhang would be the much anticipated higher dividend payout.
OCBC was the only bank that did not raise dividends in FY17.
Where we differ: Staying above the rest. We have tuned our
credit cost lower to 21-22bps; we believe this is where we could
differ significantly from consensus. Management indicated that
credit cost would remain benign in this current operating
environment and possibly reflect the pre-oil & gas crisis levels. Our
earnings forecasts remain above consensus after further raising
FY18-19F earnings by 4% each year largely on lower credit cost.
Potential catalyst: Sustained positive deliveries, minimal surprise in
insurance income trends, higher dividends. Asset quality issues are
a thing of the past. Lower-than-expected credit cost could further
boost earnings. In the meantime, sustained positive deliveries
from NIM and loan growth should support valuations. We remain
hopeful that the change in accounting rules would not dampen its
insurance income contribution too much. A much anticipated
catalyst would be higher dividends, which we think would be
announced as early as its 1H18 results.
Valuation:
Maintain BUY, TP raised to S$15.30. Our TP of S$15.30 (12.5%
ROE, 4% growth, 9.4% cost of equity) following our earnings
adjustments is equivalent to 1.5x FY18 BV, above its 10-year
mean P/BV multiple.
Key Risks to Our View:
Faltering NIM and non-interest income traction. Inability to see
revenue generation from improved NIM as well as better wealth
management and insurance income contribution could pose
downside to our earnings forecasts.
At A Glance Issued Capital (m shrs) 4,183
Mkt. Cap (S$m/US$m) 57,552 / 43,308
Major Shareholders (%)
Selat Pte Ltd 11.1
Free Float (%) 88.9
3m Avg. Daily Val (US$m) 64.6
ICB Industry : Financials / Banks
DBS Group Research . Equity 26 Apr 2018
Singapore Company Guide
OCBC Version 12 | Bloomberg: OCBC SP | Reuters: OCBC.SI Refer to important disclosures at the end of this report
87
107
127
147
167
187
207
6.7
7.7
8.7
9.7
10.7
11.7
12.7
13.7
14.7
Apr-14 Apr-15 Apr-16 Apr-17 Apr-18
Relative IndexS$
OCBC (LHS) Relative STI (RHS)
Page 153

Page 2
Company Guide
OCBC
WHAT’S NEW
Higher highs
Highlights:
Trends to watch in 1Q18. OCBC is expected to book an
improved quarter in 1Q18. Key trends to watch include:
(1) NIM improvement across locations of its operations.
Notable uplift should be seen in its Singapore operations,
followed by Malaysia and Hong Kong. OCBC-WHB
should see the gapping spread between its loan and
deposit pricing easing and would mean its HK
operational NIM should also improve. Contrary to peers,
OCBC has its Indonesian operations which is doing well
(expecting double-digit loan growth, stable asset quality).
(2) Strong loan growth across the region (vs deposit growth)
which could drive loan-to-deposit ratio higher could
further lift NIM. OCBC has guided for 7-8% loan growth
in FY18F.
(3) Strong quarter for non-interest income. Expect strong
treasury flows and sustained wealth management
income uptrend. We understand that assets under
management (AUM) should have easily surpassed
US$100bn (Dec 17: US$99bn). However, there might be
some volatility for its insurance income contribution.
While we expect Great Eastern Holdings (GEH) to post
strong 1Q18 figures, its non-operational profit (from its
non-par fund profit) could be stripped out and placed
under other comprehensive income, under a new
accounting rule (IFRS4 for insurance companies; which is
equivalent to IFRS9 for banks).
(4) Significantly lower provisions. OCBC did not guide for
any credit cost range. But if we were to assume that
credit cost should fall back to the pre-oil & gas crisis
levels, it could well dip below 20bps (OCBC’s credit cost
ranged from 15-17bps over FY10-14; OCBC started
providing for its oil & gas exposure from as early as
3Q15).
(5) Slightly higher (seasonal) costs in 1Q18.
Room for higher dividend payout. A much anticipated catalyst
would be higher dividends, which we think would be
announced as early as its 1H18 results. OCBC was the only
bank that did not raise dividends in FY17. Although its capital
ratios stack the lowest among peers currently, assuming
OCBC sticks to a minimum of its 40% payout on core
earnings and is comfortable with a minimum CET1 ratio of
12.5%, we believe there could be room for some dividend
upside from here. We have nevertheless assumed that
dividend per share would increase slightly to 40 Scts (FY17:
37 Scts) for now, with a corresponding 31% payout ratio
based on our FY18F earnings.
Earnings revision:
Raising NIM, lowering credit costs. With a sustained
SOR/SIBOR uptrend expected, we are now forecasting NIM to
accelerate by 8bps in FY18F (from 6bps) and 3bps in FY19F.
Our loan growth forecasts are largely in line with guidance,
hence no change to that. Management indicated that credit
cost should remain benign based on current operating
environment. Note that OCBC does not have a habit of
buffering up general provisions.
We had previously assumed that credit cost would decline
marginally to 26bps in FY18F from 27bps in FY17F. But
reassessing the current operating environment, our previous
assumption may be too high. We now expect credit cost to
hover around 21-22bps over FY18-20F (from 26bps across
FY18-20F previously).
All in, this led us to raise our FY18-19F earnings by 4% for
each year. We have introduced FY20F earnings estimates.
Note that OCBC’s pre-oil & gas crisis credit cost ranged from
15-17bps over FY10-14; OCBC started providing for its oil &
gas exposure from as early as 3Q15. There could be further
upside to our earnings forecasts should such trends revert.
Valuation and recommendation
Maintain BUY, TP raised to S$15.30. With our earnings
revisions, our TP is now raised to S$15.30. OCBC is currently
trading at 1.4x FY18F BV which is equivalent to the 10-year
mean P/BV, already above the 10-year mean P/BV of 1.3x.
Our revised TP is equivalent to 1.5x FY18F BV, above the 10-
year mean P/BV and is based on the Gordon Growth Model
assuming 12.5% ROE, 9.4% cost of equity and 4% growth.
Page 154

Company Guide
OCBC
CRITICAL DATA POINTS TO WATCH
Critical Factors
NIM uplift more visible in FY18. It is possible for the Fed rate hike
pass-through to eventually spill over to SIBOR, hence positively
repricing loans but the caveat to this is that competitive pressures
are there and credit spreads are unlikely to widen, therefore limiting
any significant positive impact on NIM. OCBC’s loan profile is largely
variable rate based 90%, with one-third prime-rate based, one-third
SIBOR based and 25% SOR based. Our sensitivity analysis implies
that for every 25-bp increase in SIBOR/SOR, HK$ and US$ loan rates
(collectively), OCBC’s NIM could rise by 2bps with an accompanying
1.4% impact on net profit, holding everything else constant. The
bonus to its NIM uplift could lie in its treasury operations, where in a
rising rate environment, there would be more opportunities to
rebalance its securities portfolio given the steepened yield curve.
Loan growth to pick up; guiding for 7-8% in FY18F. Management is
guiding for loan growth of 7-8% for FY18. Loan demand appears
apparent for Singapore companies investing abroad. Every 1-ppt rise
in loan growth leads to a 0.9% increase in net profit. We are
forecasting loan growth at 8% across FY18-20F.
Non-interest income drivers remain its key differentiator, especially
wealth management and insurance. OCBC differentiates itself from
peers when looking at its non-interest income composition. Its focus
is on growing its non-interest income franchise, especially its wealth
management business. Its insurance business, 87.75%-owned
subsidiary, Great Eastern Holdings (GEH), remains a dominant part of
its non-interest income. OCBC has no plans to sell its stake in GEH as
it remains complementary to its non-interest income franchise.
Management believes it is still logical and beneficial to keep the
insurance product manufacturing in-house. However, in view of the
need to meet regulatory requirements in Malaysia, GEH may look to
divest part of its operations in Malaysia. It is currently exploring
options to meet this requirement. GEH tends to exhibit earnings
volatility due to fluctuations of interest rates. It is best to track GEH’s
underlying business trends i.e. total weighted new sales and new
business embedded values. These metrics have been growing
robustly for GEH. Since the acquisition of Bank of Singapore in 2010,
its wealth management income has been growing steadily; and this
trend is expected to be sustainable. The acquisition of the wealth
and investment business of Barclays Bank in Singapore and Hong
Kong, completed in December 2016, added US$13bn to OCBC's
AUM. In May 2017, OCBC further acquired National Bank of
Australia’s wealth business in Singapore and Hong Kong.
Regionalisation is a key item on its agenda. Malaysia remains
OCBC’s second largest contributor. Its business proposition in
Malaysia has a track record of over 80 years and its added advantage
lies in its Islamic banking franchise. Management feels bullish about
its operations in Indonesia. While still a small contributor,
opportunities are aplenty for further growth. We see the wealth
management income line as the key indicator to watch for sustained
synergies in OCBC-Wing Hang.
Margin Trends
Gross Loan& Growth
Customer Deposit & Growth
Loan-to-Deposit Ratio Trend
Cost & Income Structure
Source: Company, DBS Bank
1.6%
1.6%
1.7%
1.7%
1.8%
1.8%
1.9%
1.9%
0
1,000
2,000
3,000
4,000
5,000
6,000
7,000
2016A 2017A 2018F 2019F 2020F
S$ m
Net Interest Income Net Interest Income Margin
0%
1%
2%
3%
4%
5%
6%
7%
8%
9%
10%
0
50,000
100,000
150,000
200,000
250,000
2016A 2017A 2018F 2019F 2020F
S$ m
Gross Loan (LHS) Gross Loan Growth (%) (YoY) (RHS)
0%
1%
2%
3%
4%
5%
6%
7%
8%
9%
10%
0
50,000
100,000
150,000
200,000
250,000
300,000
350,000
2016A 2017A 2018F 2019F 2020F
S$ m
Customer Deposits (LHS)
Customer Deposits Growth (%) (YoY) (RHS)
73%
75%
77%
79%
81%
83%
85%
87%
89%
91%
195,147
245,147
295,147
345,147
395,147
2016A 2017A 2018F 2019F 2020F
S$ bn
Loans Deposit Loan-to-Deposit Ratio (RHS)
36%
37%
38%
39%
40%
41%
42%
43%
44%
45%
46%
47%
0
2,000
4,000
6,000
8,000
10,000
12,000
2016A 2017A 2018F 2019F 2020F
S$ m
Net Interest Income Non-interest Income Cost-to-income Ratio
Page 155

Page 4
Company Guide
OCBC
Appendix 1: A look at Company's listed history – what drives its share price?
Interest rates as critical factor Remarks
Interest rates, particularly SIBOR, is linked to
loan pricing and hence NIM, which in turn
drives earnings and share price performance.
The Fed rate hikes which should lead to
SIBOR uplift was historically 60% correlated.
The relationship has somewhat broken down
since late 2016 due to the relative strength of
the SGD. Nevertheless, expectations of Fed
rate hikes, which are expected to pass
through to SIBOR does have a positive
correlation to banks’ share prices.
GEH’s earnings as critical factor Remarks
GEH’s profit contributes approximately 20-
25% of non-interest income, translating into
8-10% of OCBC’s net profit. While not being
directly correlated, GEH’s profits do indicate
OCBC’s overall non-interest income trends.
GEH also forms part of OCBC’s wealth
management offerings.
Share price movement (10-year historical trends)
Source: Bloomberg Finance L.P., DBS Bank
-
2.0
4.0
6.0
8.0
10.0
12.0
-
1.00
2.00
3.00
4.00
5.00
6.00
2002 2003 2004 2005 2006 2007 2008 2009 2010 2011 2012 2013 2014 2015 2016 2017
3M SIBOR (LHS) Fed funds rate (LHS) Share price (RHS)
% S$
-
50.0
100.0
150.0
200.0
250.0
300.0
Jan-0
9
Ap
r-09
Jul-09
Oct
-09
Jan-1
0
Ap
r-10
Jul-10
Oct
-10
Jan-1
1
Ap
r-11
Jul-11
Oct
-11
Jan-1
2
Ap
r-12
Jul-12
Oct
-12
Jan-1
3
Ap
r-13
Jul-13
Oct
-13
Jan-1
4
Ap
r-14
Jul-14
Oct
-14
Jan-1
5
Ap
r-15
Jul-15
Oct
-15
Jan-1
6
Ap
r-16
Jul-16
Oct
-16
Jan-1
7
Index = 100
Share price GE net profit
-
2.00
4.00
6.00
8.00
10.00
12.00
Dec
-07
Jun
-08
Dec
-08
Jun
-09
Dec
-09
Jun
-10
Dec
-10
Jun
-11
Dec
-11
Jun
-12
Dec
-12
Jun
-13
Dec
-13
Jun
-14
Dec
-14
Jun
-15
Dec
-15
Jun
-16
Dec
-16
Jun
-17
Dec
-17
Global Financial Crisis; plagued by rising provisions (loans and CDOs)
Recovery phase -OCBC's NPLs and credit cost tends to decline faster than peers in a recovery phase
Jan 2010: OCBC acquires ING Asia Private Bank (now Bank of Singapore)
2015 - Market starts to price in expectations of Fed rate hikes (which did not happen); SIBOR moved up ahead of Fed rate hike expectations. SIBOR popped from a low of 38bps to 65bps in Jan 2015; OCBC appears to have de-coupled from this; there was hardly any NIM movement
Jun 2011 ; Basel III rules announced; OCBC plagued by punitive capital deduction for its insurance subsidiary
Positive macro prospects; strong loan growth momentum
Apr 2016 - OCBC announcesacquisition of Barclays Wealth Management and Investments in HK and SG
Apr 2014 - OCBC announces acquisition of Wing Hang Bank, HK
Nov 2016 - Fed rate hike lift off; expectations of NIM uplift expounded
2Q15 - Oil & gas NPL woes begin; peak of provisions in 2Q-3Q16
Driven by low credit costs and benign NPL formation; positve trends from insurance and non-interest income
S$
Page 156

Company Guide
OCBC
Balance Sheet:
Asset quality concerns a thing of the past. OCBC’s NPL ratio
stood at 1.5% as at end-December 2017 largely from the oil &
gas segment (6% of total loans). We understand collaterals
have been written down to 30% of market value. Its credit cost
has stayed lower compared to peers. Despite concerns of an
unsustainably low credit cost level, OCBC has successfully
weathered through the storm as seen during several crises over
the past ten years.
Capital ratios remain strong. OCBC halted its scrip dividend in
2Q16. It had previously used the scrip dividend to help shore up
capital. Separately, while there are still some non-core assets the
bank can divest, these are not large and not an immediate
priority. There has been a continuous debate on whether OCBC
should divest its insurance business, GEH, as it is perceived to be
capital punitive once Basel III is fully enforced. But we believe
that without majority control of the business, integrating it as
part and parcel of its wealth management offerings would be
challenging.
Share Price Drivers:
Rising interest rates lift NIM and possibly better insurance
business revenues. Rising NIM and hence earnings will be key
drivers to share price. Barring volatility in its insurance
contribution due to accounting reasons, higher interest rates
bode well for its life insurance business to build longer-term
revenues. Successful credit costs and NPL containment could
provide an added catalyst. Ability to demonstrate these should
see the stock re-rate above its 5-year mean P/BV multiple.
Key Risks:
Inability to deliver NIM uplift. Expectations are rife that the
Singapore banks will deliver strong NIM trends following
sequential Fed rate hikes. Slower-than-expected SIBOR/SOR
pass-through could upset NIM uplift trends.
Asset quality trend reversal. Banks are already on a recovery
trend for their NPLs. A larger-than-expected NPL occurrence
could unwind expectations of credit cost and NPL declines,
posing risks to earnings.
Company Background
The OCBC Bank group of businesses comprises a family of
companies owned by Singapore's longest-established local
bank. Its banking business franchise includes OCBC Bank, Bank
OCBC NISP and Bank of Singapore, with branches in over 15
countries. OCBC has strategic stakes in other financial service
businesses operating under independent brands such as Great
Eastern, Bank of Singapore and Lion Global Investors.
Asset Quality
Capitalisation (%)
ROE (%)
Forward PE Band (x)
PB Band (x)
Source: Company, DBS Bank
0.0%
0.2%
0.4%
0.6%
0.8%
1.0%
1.2%
1.4%
1.6%
1.8%
2.0%
2016A 2017A 2018F 2019F 2020F
NPL Ratio Provision Charge-Off Rate
13.0%
14.0%
15.0%
16.0%
17.0%
18.0%
19.0%
20.0%
2016A 2017A 2018F 2019F 2020F
Tier-1 CAR Total CAR
0.0%
2.0%
4.0%
6.0%
8.0%
10.0%
12.0%
2016A 2017A 2018F 2019F 2020F
Avg: 10.1x
+1sd: 10.9x
+2sd: 11.6x
-1sd: 9.4x
-2sd: 8.7x
7.8
8.8
9.8
10.8
11.8
12.8
Apr-14 Apr-15 Apr-16 Apr-17 Apr-18
(x)
Avg: 1.21x
+1sd: 1.36x
+2sd: 1.52x
-1sd: 1.05x
-2sd: 0.9x
0.7
0.9
1.1
1.3
1.5
1.7
Apr-14 Apr-15 Apr-16 Apr-17 Apr-18
(x)
Page 157

Page 6
Company Guide
OCBC
Key Assumptions
FY Dec 2016A 2017A 2018F 2019F 2020F
Gross Loans Growth 4.3 7.8 7.9 7.7 7.8
Customer Deposits Growth 6.2 8.5 8.0 8.0 8.0
Yld. On Earnings Assets 2.8 2.8 2.8 2.9 2.9
Avg Cost Of Funds 1.2 1.2 1.2 1.2 1.2
Income Statement (S$ m)
FY Dec 2016A 2017A 2018F 2019F 2020F
Net Interest Income 5,052 5,423 6,567 7,253 7,839
Non-Interest Income 3,437 4,213 4,450 4,703 4,973
Operating Income 8,489 9,636 11,017 11,955 12,812
Operating Expenses (3,884) (4,138) (4,461) (4,756) (5,071)
Pre-provision Profit 4,605 5,498 6,556 7,199 7,741
Provisions (726) (671) (542) (585) (631)
Associates 396 389 397 405 413
Exceptionals 0 0 0 0 0
Pre-tax Profit 4,275 5,216 6,411 7,019 7,522
Taxation (629) (803) (963) (1,058) (1,128)
Minority Interests (173) (267) (328) (359) (385)
Preference Dividend (40) (40) (40) (40) (40)
Net Profit 3,433 4,106 5,079 5,561 5,969
Net Profit before Except. 3,433 4,106 5,079 5,561 5,969
Growth (%)
Net Interest Income Gth (2.6) 7.3 21.1 10.4 8.1
Net Profit Gth bef Except (10.2) 19.6 23.7 9.5 7.3
Margins, Costs & Efficiency (%)
Spread 1.6 1.6 1.6 1.6 1.7
Net Interest Margin 1.7 1.6 1.7 1.8 1.8
Cost-to-Income Ratio 45.8 42.9 40.5 39.8 39.6
Business Mix (%)
Net Int. Inc / Opg Inc. 59.5 56.3 59.6 60.7 61.2
Non-Int. Inc / Opg inc. 40.5 43.7 40.4 39.3 38.8
Fee Inc / Opg Income 19.3 20.3 18.9 18.7 18.6
Oth Non-Int Inc/Opg Inc 21.2 23.5 21.4 20.7 20.2
Profitability (%)
ROAE Pre Ex. 9.9 11.1 12.8 12.8 12.6
ROAE 9.9 11.1 12.8 12.8 12.6
ROA Pre Ex. 0.9 1.0 1.1 1.2 1.2
ROA 0.9 1.0 1.1 1.2 1.2
Source: Company, DBS Bank
Provisions to stay relatively benign
Sustainable uplift to NIM
Page 158

Company Guide
OCBC
Quarterly / Interim Income Statement (S$ m)
FY Dec 4Q2016 1Q2017 2Q2017 3Q2017 4Q2017
Net Interest Income 1,251 1,272 1,345 1,382 1,424
Non-Interest Income 926 977 1,053 978 1,205
Operating Income 2,177 2,249 2,398 2,360 2,629
Operating Expenses (1,005) (999) (1,019) (1,027) (1,093)
Pre-Provision Profit 1,172 1,250 1,379 1,333 1,536
Provisions (305) (168) (169) (156) (178)
Associates 82 114 119 127 28
Exceptionals 0 0 0 0 0
Pretax Profit 949 1,196 1,329 1,304 1,386
Taxation (114) (169) (185) (192) (257)
Minority Interests (46) (54) (61) (55) (96)
Net Profit 789 973 1,083 1,057 1,033
Growth (%)
Net Interest Income Gth 1.4 1.7 5.7 2.8 3.0
Net Profit Gth (16.3) 23.3 11.3 (2.4) (2.3)
Balance Sheet (S$ m)
FY Dec 2016A 2017A 2018F 2019F 2020F
Cash/Bank Balance 16,559 19,594 30,633 33,084 35,731
Government Securities 24,364 27,471 28,845 30,287 31,801
Inter Bank Assets 39,801 49,377 55,555 59,784 64,401
Total Net Loans & Advs. 216,830 234,141 252,524 271,743 292,730
Investment 23,157 25,329 30,303 32,609 35,128
Associates 2,415 2,352 2,749 3,153 3,566
Fixed Assets 4,572 4,281 4,419 4,562 4,708
Goodwill 5,473 5,160 5,160 5,160 5,160
Other Assets 14,740 13,306 15,151 16,305 17,564
Life Ass Fund Inv Assets 61,973 73,927 73,927 73,927 73,927
Total Assets 409,884 454,938 499,267 530,613 564,715
Customer Deposits 261,486 283,642 306,333 330,840 357,307
Inter Bank Deposits 10,740 7,485 23,968 25,216 26,736
Debts/Borrowings 19,947 32,235 32,235 32,235 32,235
Others 16,107 16,045 17,481 18,834 20,276
Minorities 2,635 2,768 3,096 3,455 3,840
Shareholders' Funds 37,007 39,008 42,398 46,278 50,565
Life Ass Fund Liabs 61,962 73,755 73,755 73,755 73,755
Total Liab& S/H’s Funds 409,884 454,938 499,267 530,613 564,715
Source: Company, DBS Bank
Higher taxation rate in 4Q17 dampened net profit
Loan growth sustainable at 7-8%
Page 159

Page 8
Company Guide
OCBC
Financial Stability Measures (%)
FY Dec 2016A 2017A 2018F 2019F 2020F
Balance Sheet Structure
Loan-to-Deposit Ratio 82.9 82.5 82.4 82.1 81.9
Net Loans / Total Assets 52.9 51.5 50.6 51.2 51.8
Investment / Total Assets 5.6 5.6 6.1 6.1 6.2
Cust . Dep./Int. Bear. Liab. 89.5 87.7 84.5 85.2 85.8
Interbank Dep / Int. Bear. 3.7 2.3 6.6 6.5 6.4
Asset Quality
NPL / Total Gross Loans 1.3 1.4 1.3 1.2 1.2
NPL / Total Assets 0.7 0.8 0.7 0.6 0.6
Loan Loss Reserve Coverage 102.7 77.7 91.7 105.4 111.3
Provision Charge-Off Rate 0.3 0.3 0.2 0.2 0.2
Capital Strength
Total CAR 17.1 17.2 18.0 18.6 20.0
Tier-1 CAR 14.7 13.9 16.1 16.8 17.5
Source: Company, DBS Bank
Target Price & Ratings History
Source: DBS Bank
Analyst: Sue Lin LIM
Rui Wen LIM
S.No.Date of
Report
Closing
Price
12-mth
Target
Price
Rat ing
1: 09 May 17 10.46 10.30 HOLD
2: 27 Jul 17 11.49 12.80 BUY
3: 20 Sep 17 11.01 12.80 BUY
4: 25 Oct 17 11.55 12.80 BUY
5: 26 Oct 17 11.57 13.50 BUY
6: 22 Nov 17 12.01 13.50 BUY
7: 04 Jan 18 12.95 14.00 BUY
8: 15 Feb 18 12.78 14.00 BUY
Note : Share price and Target price are adjusted for corporate actions.
1
2
3
45
67
8
9.22
10.22
11.22
12.22
13.22
14.22
Apr-17 Jun-17 Aug-17 Oct-17 Dec-17 Feb-18 Apr-18
S$
Credit costs back to pre-oil & gas levels
Page 160

ed: JS / sa: AS, JC, PY, CS
BUYLast Traded Price ( 26 Apr 2018): S$29.39 (STI : 3,570.02) Price Target 12-mth: S$33.20 (13% upside) (Prev S$29.50)
Analyst Sue Lin LIM +65 83326843 [email protected] Rui Wen LIM +65 66823720 [email protected]
What’s New • NIM and loans to drive topline growth; NIM uptrend clearly
in sight; loan growth at high single digit• Lower credit costs; no longer buffering general provisions;
expecting 25bps credit cost ahead• FY18-19F earnings raised by 4% each year on adjustments
to NIM, loan growth and provisions• Maintain BUY, TP raised to S$33.20 (1.5x FY18 BV);
dividends should be sustainable at S$1.00 per year
Price Relative
Forecasts and Valuation FY Dec (S$m) 2017A 2018F 2019F 2020F Pre-prov. Profit 4,824 5,445 5,963 6,394 Net Profit 3,280 3,986 4,384 4,712 Net Pft (Pre Ex.) 3,280 3,986 4,384 4,712 Net Pft Gth (Pre-ex) (%) 9.8 21.5 10.0 7.5 EPS (S cts) 208 253 278 299 EPS Pre Ex. (S cts) 208 253 278 299 EPS Gth Pre Ex (%) 10 22 10 7 Diluted EPS (S cts) 197 240 264 283 PE Pre Ex. (X) 14.1 11.6 10.6 9.8 Net DPS (S cts) 100.0 100.0 100.0 100 Div Yield (%) 3.4 3.4 3.4 3.4 ROAE Pre Ex. (%) 10.1 11.4 11.6 11.6 ROAE (%) 10.1 11.4 11.6 11.6 ROA (%) 1.0 1.1 1.2 1.2 BV Per Share (S cts) 2,151 2,304 2,483 2,681 P/Book Value (x) 1.4 1.3 1.2 1.1 Earnings Rev (%): 4 4 new Consensus EPS (S cts): 234 259 285 Other Broker Recs: B: 17 S: 1 H: 3
Source of all data on this page: Company, DBS Bank, Bloomberg Finance L.P.
All engines cranking
Getting more bullish; maintain BUY. This is the first time in a decade that all income items for the Singapore banks are positive. For UOB, NIM uptrend is clearly in sight. With expectations of an intact SOR/SIBOR uptrend, we are now forecasting NIM to accelerate by 9bps in FY18F (from 6bps) and 5bps in FY19F. Loan growth should also stand tall. With guidance at high single digit for FY18F, we have also raised our loan growth forecast to 8% (from 7%). With IFRS9/SFAS109, banks will no longer be able to continuously build up general provisions. In the case of UOB, this is a new positive. We now expect credit cost to hover around 25bps over FY18-20F (from 26-28bps previously). NPL issues should be a thing of the past with the last brunt of impairments and provisions done in 4Q17. Capital levels remain high and strong with fully loaded CET1 ratio at 14.7% as at Dec 17. Although scrip dividends will prevail, the shares would be issued without a discount. We believe a full year dividend of S$1.00 per share is sustainable and do not discount further upside from here.
Where we differ. Staying above consensus. Our earnings remain above consensus with a further boost from NIM, loan growth and lower provisions resulting in 4% p.a. earnings uplift for FY18-19F. Our TP is also at the higher end of consensus.
Potential catalyst: Sustained positive deliveries. Further improvement in NIM and more importantly, a pickup in loan growth due to the recovery of the property market should support earnings strongly. Lower credit cost is a new trend for UOB and should be viewed positively.
Valuation: Maintain BUY, TP raised further to S$33.20. Our revised TP of S$33.20 is based on the Gordon Growth Model (12% ROE, 4% growth and 9.5% cost of equity), equivalent to 1.5x FY18 P/BV, which is above its 10-year average P/BV multiple (1.4x BV).
Key Risks to Our View: Relapse in NIM and asset quality trends. A relapse in SIBOR movement could also pose risks to our NIM forecast. If NPL issues start to spread further from here, more specific provisions might be required.
At A Glance Issued Capital (m shrs) 1,661 Mkt. Cap (S$m/US$m) 48,813 / 36,732 Major Shareholders (%) Wee Investment Pte Ltd 7.7 Wah Hin & Co Pte Ltd 5.0
Free Float (%) 87.2 3m Avg. Daily Val (US$m) 67.0 ICB Industry : Financials / Banks
DBS Group Research . Equity 26 Apr 2018
Singapore Company Guide
UOB Version 14 | Bloomberg: UOB SP | Reuters: UOBH.SI Refer to important disclosures at the end of this report
80
100
120
140
160
180
200
220
15.1
17.1
19.1
21.1
23.1
25.1
27.1
29.1
31.1
Apr-14 Apr-15 Apr-16 Apr-17 Apr-18
Relative IndexS$
UOB (LHS) Relative STI (RHS)
Page 161

Company Guide
UOB
WHAT’S NEW
New norms
Highlights:
Trends to watch in 1Q18 results. This should be a strong quarter for UOB. This is first time in years that topline growth will be driven by both NIM and loan growth.
(1) NIM clearly on an uptrend following SOR/SIBOR spurtsobserved in 4Q17 (guidance of 5-10bps).
(2) Loan growth 1Q18 is expected to pick up, estimated at 2-3% y-o-y (FY18F loan growth guided at high single digit;FY17: 4.6%). UOB remains optimistic about Thailand andGreater China, as domestic loan growth continues to grow.
(3) Decent trends on fee income. While there is stronggrowth in wealth management, fee income should still belargely driven by loan-related fees.
(4) Cost-to-income ratio should hover around 44%. Witheffect from FY18, UOB will be netting attributable expensesdirectly against its related fees, in line with peers’ practices.This would reduce cost-to-income ratio from 45.5% in FY17to 43.7% on an adjusted basis. We are forecasting UOB’scost-to-income ratio to be at c.44% for FY18F.
(5) Credit cost at a new low. With the IFRS9/SFAS109 inplace, days of general provision buffers are over. Credit cost isguided at 20-25bps for FY18F.
(6) Stable NPLs from here. The worst is over for the oil & gasasset quality episode. UOB deems that it now has acomfortable level of allowances to meet the newrequirements after the reversal of S$0.6bn of generalprovisions. Going forward, UOB expects new NPL formationto be at S$300-400m a quarter.
Opportunities abound in the region. Specifically, UOB highlighted two key priorities: (1) boost fee income, and (2) tap connectivity flow. UOB has launched a new Financial Institution segment as it attempts to focus on sectors with high trade and connectivity flows as it continues to eye opportunities in the flow business, which will add to both loan and non-loan income.
High capital levels – possible outcomes. Compared to its peers, UOB may require a higher capital buffer as it relies more on asset growth. There remains a possibility for UOB to take on acquisitions in the near term as it seeks to optimise healthy returns on its capital.
Higher dividends are here to stay. The S$1.00 full year dividend per share is here to stay. Expect 40 S cts interim dividend in 1H18, with a combination of 40 S cts final plus 20 S cts special dividend in 2H18. Over time, this could normalise to 50 S cts per share for interim and final dividends. With ample capital buffer, further dividend upside is still possible. Management stated that it will be comfortable with CET1 of >12.5%. UOB’s fully loaded CET1 ratio as at end Dec 2017was at 14.7%.
Earnings revision
Raising NIM, loan growth and lowering credit costs. With a sustained SOR/SIBOR uptrend expected, we are now forecasting NIM to accelerate by 9bps in FY18F (from 6bps) and 5bps in FY19F. Loan growth should also stand tall. With guidance at high single digit for FY18F, we have also raised our loan growth assumption to 8% (from 7%). With IFRS9/SFAS109, banks will no longer be able to continuously build up general provisions. We now expect credit cost to hover around 25bps over FY18-20F (from 26-28bps previously). All in, this led us to raise our FY18-19F earnings by 4% for each year. We have introduced FY20F earnings estimates.
Valuation and recommendation:
Maintain BUY, TP raised to S$33.20. With our earnings revisions, our TP is now raised to S$33.20. UOB is currently trading at 1.4x FY18F BV which is equivalent to the 10-year mean P/BV, lagging peers which have exceeded mean levels. Our revised TP is equivalent to 1.5x FY18F BV, above the 10-year mean P/BV and is based on the Gordon Growth Model assuming 12% ROE, 9.5% cost of equity and 4% growth.
Page 162

Page 3
Company Guide
UOB
CRITICAL DATA POINTS TO WATCH
Critical Factors Improved loan growth and NIM. Our FY18-19F loan growth forecast is now tuned up closer to 8% in light of a better operating environment. We expect UOB’s NIM to rise by 9bps in FY18F and another 5bps in FY19F, taking into account some element of competition. Our sensitivity analysis indicates that for every additional 25 bps increase in SIBOR, UOB’s NIM will rise by 1bp, holding other variables constant, and this would lead to a further 1.1% uplift to earnings. We note that UOB’s S$ loan-to-deposit ratio remains the highest among peers and that itself could pressure S$ funding cost; S$ deposits forms close to half of UOB’s total deposit base.
Non-interest income driven more by loan activities. Contrary to peers, UOB’s non-interest income focuses more on loan activities, which is its core business. While there is increasing traction from wealth management income, it remains small vs peers. Fee income should be consumer-business driven from credit cards and private banking rather than from capital markets. UOB’s wealth management business continues to pick up albeit makes up a smaller proportion of non-interest income vs its peers.
Costs skewed to business growth. We expect operating expenses to stay high with costs skewed towards business expansion and technology which is required particularly for digital banking and cyber security. Other investments to further enhance regional operations are still ongoing but the increase should not be high. Cost-to-income ratio may ease with stronger revenue growth amid its tight cost control strategies despite having to invest to grow its business but the target is 40% over the longer term. We forecast a 44% cost-to-income ratio in FY18F.
Expect lower credit costs; reversal in trends with IFRS9. Compared to peers, UOB’s credit costs tend to hover at higher levels largely due to its conservative stance towards setting aside higher general provisions (1.2% of total loans). With IFRS9 implemented, banks will no longer be allowed to build general provision buffers. This is a new positive for UOB. Management is guiding for 20-25bps credit cost at the moment. We are assuming 25bps credit cost over FY18-20F (previously 26-28bps), which is at the higher end of guidance.
Regionalisation remains core to UOB’s strategy. UOB’s regionalisation agenda remains intact. The bank is relooking at its operations in Indonesia, given the current challenging operating environment. In Malaysia, growth remains cautious but asset quality is at a comfortable position. Its Thai operations remain small, while its Greater China operations are still smaller than peers. UOB has not been aggressively acquiring to add new revenue streams but has chosen to grow organically.
Margin Trends
Gross Loan& Growth
Customer Deposit & Growth
Loan-to-Deposit Ratio Trend
Cost & Income Structure
Source: Company, DBS Bank
1.6%
1.7%
1.7%
1.8%
1.8%
1.9%
1.9%
2.0%
2.0%
2.1%
0
1,000
2,000
3,000
4,000
5,000
6,000
7,000
2016A 2017A 2018F 2019F 2020F
S$ m
Net Interest Income Net Interest Income Margin
0%1%2%3%4%5%6%7%8%9%10%
0
50,000
100,000
150,000
200,000
250,000
2016A 2017A 2018F 2019F 2020F
S$ m
Gross Loan (LHS) Gross Loan Growth (%) (YoY) (RHS)
0%1%2%3%4%5%6%7%8%9%10%
0
50,000
100,000
150,000
200,000
250,000
300,000
2016A 2017A 2018F 2019F 2020F
S$ m
Customer Deposits (LHS)
Customer Deposits Growth (%) (YoY) (RHS)
76%
81%
86%
91%
96%
199,561
219,561
239,561
259,561
279,561
299,561
319,561
339,561
359,561
2016A 2017A 2018F 2019F 2020F
S$ bn
Loans Deposit Loan-to-Deposit Ratio (RHS)
40%
41%
42%
43%
44%
45%
46%
47%
0
2,000
4,000
6,000
8,000
10,000
12,000
2016A 2017A 2018F 2019F 2020F
S$ m
Net Interest Income Non-interest Income Cost-to-income Ratio
Page 163

Company Guide
UOB
Appendix 1: A look at Company's listed history – what drives its share price?
Interest rates as critical factor Remarks
Interest rates, particularly SIBOR, are linked to loan pricing and hence NIM, which in turn drives earnings and share price performance. The Fed rate hikes, which should lead to SIBOR uplift, has been 60% correlated historically. The relationship has somewhat broken down since late 2016 due to the relative strength of the SGD. Nevertheless, expectations of Fed rate hikes, which are expected to pass through to SIBOR, do have a positive correlation to banks’ share prices.
Property price index as critical factor Remarks
UOB has the largest proportion of its loans related to mortgages, at 27% of total loans. Inclusive of building and construction loans at another 23%, UOB’s total property-related loans make up 50% of total loans. Historically, UOB’s share price has been correlating well with the property price index. The deviation in 2017 is due to the stronger influence of interest rate movements (the critical factor highlighted above).
Share price movement (10-year historical trends)
Source: Bloomberg Finance L.P., DBS Bank
0
5
10
15
20
25
30
(2.0)
(1.0)
-
1.0
2.0
3.0
4.0
5.0
6.0
7.0
Jan-
04
Jan-
05
Jan-
06
Jan-
07
Jan-
08
Jan-
09
Jan-
10
Jan-
11
Jan-
12
Jan-
13
Jan-
14
Jan-
15
Jan-
16
Jan-
17
SGD%3M SIBOR 3M LIBORSOR Fed Fund RateUOB
-
50.0
100.0
150.0
200.0
250.0
Jan-
04
Jul-0
4
Jan-
05
Jul-0
5
Jan-
06
Jul-0
6
Jan-
07
Jul-0
7
Jan-
08
Jul-0
8
Jan-
09
Jul-0
9
Jan-
10
Jul-1
0
Jan-
11
Jul-1
1
Jan-
12
Jul-1
2
Jan-
13
Jul-1
3
Jan-
14
Jul-1
4
Jan-
15
Jul-1
5
Jan-
16
Jul-1
6
Jan-
17
Jul-1
7
Index = 100 Share price Property price index
-
5.00
10.00
15.00
20.00
25.00
30.00
Dec-
07
Jun-
08
Dec-
08
Jun-
09
Dec-
09
Jun-
10
Dec-
10
Jun-
11
Dec-
11
Jun-
12
Dec-
12
Jun-
13
Dec-
13
Jun-
14
Dec-
14
Jun-
15
Dec-
15
Jun-
16
Dec-
16
Jun-
17
Dec-
17
Global Financial Crisis; plagued by rising provisions (loans, European corporate exposures and CDOs)
Recovery phase -UOB's NPLs and credit cost tends to decline faster than peers in a recovery phase
Jan 2010: UOB disposes UOB Insurance; signs bancassurance arrangement with Prudential
2015 - Market starts to price in expectations of Fed rate hikes (which did not happen); SIBOR moved up ahead of Fed rate hike expectations. SIBOR popped from a low of 38bps to 65bps in Jan 2015; UOB appears to have de-coupled from this; there was hardly any NIM movement
Jun 2011 ; Basel III rules announced; limited impact to UOB due to its conservative capital buffers
2012: Unfolding its regional aspirations -ASEAN-centric
Apr 2014 - AFter OCBC acquires Wing Hang Bank, rumours were rife that UOB could expand into Greater China in a smiimar manner
Nov 2016 - Fed rate hike lift off; expectations of NIM uplift expounded
2Q15 - Oil & gas NPL woes begin; peak of provisions in 2Q-3Q16
4Q11: Contained its European corporate bond exposures
S$
Page 164

Page 5
Company Guide
UOB
Balance Sheet: Asset quality concerns are a thing of the past. UOB’s NPL ratio is higher vs peers, sitting at 1.8% as at end-Dec 2017. Issues pertaining to the oil & gas exposure have largely been taken care of. UOB’s exposure to oil & gas comprises 5% of total loans while other commodity segments make up another 3%. Collectively, these account for 8% of total loans. These accounts are mostly secured; hence the impact on P/L should be limited. UOB is the only bank that has disclosed that it has taken a 70-80% haircut to the value of its oil & gas collateral. Other commodity segments include metal, mining and agriculture. There is little concern on these.
Strong capital position. Its CET1 ratio’s comfort zone is >12.5%. We expect absolute DPS to be sustainable at S$1.00. UOB will likely keep its scrip dividend programme but new shares will be issued without a discount. The take-up of its scrip dividend has been relatively low. With its strong capital position (fully loaded CET1 ratio at 14.7% as at end Dec 2017), we would not discount a further uplift in dividends going forward.
Share Price Drivers: Strong property market recovery. The strong property market recovery would bode well for UOB’s share price as it is seen to be a proxy. UOB has the largest proportion of property-related loans vs peers.
Sustained NIM and loan growth prospects. With asset quality issues largely to be dealt with by end-FY17, all eyes are on topline growth. With a sustained SOR/SIBOR uptrend, NIM uplift is here to stay. Sustained strong loan growth also adds to a boost in net interest income.
Key Risks: NIM trend reversal. Hopes on NIM improvement could dissipate if SIBOR/SOR movements turn south from here. NIM movements are more sensitive to earnings compared to loan growth. If NIM trends stop improving, earnings growth would be at risk.
Asset quality upsets. While unlikely at this juncture, any NPL formation above the normal levels of S$300-400m could upset trends and raise provisions, which could lead to earnings disappointment.
Company Background UOB provides a wide range of financial services through its global network of branches, offices, subsidiaries and associates: personal financial services, private banking, commercial and corporate banking, investment banking, corporate finance, capital market activities, treasury services, futures broking, asset management, venture capital management, insurance and stockbroking services.
Asset Quality
Capitalisation (%)
ROE (%)
Forward PE Band (x)
PB Band (x)
Source: Company, DBS Bank
0.0%
0.2%
0.4%
0.6%
0.8%
1.0%
1.2%
1.4%
1.6%
1.8%
2.0%
2016A 2017A 2018F 2019F 2020F
NPL Ratio Provision Charge-Off Rate
12.0%
13.0%
14.0%
15.0%
16.0%
17.0%
18.0%
19.0%
2016A 2017A 2018F 2019F 2020F
Tier-1 CAR Total CAR
0.0%
2.0%
4.0%
6.0%
8.0%
10.0%
2016A 2017A 2018F 2019F 2020F
Avg: 10.5x
+1sd: 11.5x
+2sd: 12.6x
-1sd: 9.5x
-2sd: 8.5x
7.6
8.6
9.6
10.6
11.6
12.6
13.6
Apr-14 Apr-15 Apr-16 Apr-17 Apr-18
(x)
Avg: 1.17x
+1sd: 1.32x
+2sd: 1.47x
-1sd: 1.02x
-2sd: 0.87x
0.7
0.9
1.1
1.3
1.5
1.7
Apr-14 Apr-15 Apr-16 Apr-17 Apr-18
(x)
Page 165

Company Guide
UOB
Key Assumptions
FY Dec 2016A 2017A 2018F 2019F 2020F
Gross Loans Growth 8.8 4.6 7.5 7.0 6.7 Customer Deposits Growth 6.1 6.8 5.0 5.0 5.0 Yld. On Earnings Assets 2.8 2.9 3.0 3.0 3.1 Avg Cost Of Funds 1.2 1.2 1.2 1.2 1.2
Income Statement (S$m)
FY Dec 2016A 2017A 2018F 2019F 2020F
Net Interest Income 4,991 5,528 6,146 6,654 7,093 Non-Interest Income 3,071 3,323 3,523 3,741 3,974
Operating Income 8,061 8,851 9,669 10,395 11,067 Operating Expenses (3,696) (4,027) (4,224) (4,431) (4,673)
Pre-provision Profit 4,365 4,824 5,445 5,963 6,394 Provisions (593) (727) (621) (671) (715) Associates 6.00 110 130 142 152 Exceptionals 0.0 0.0 0.0 0.0 0.0
Pre-tax Profit 3,778 4,207 4,953 5,435 5,831 Taxation (669) (800) (842) (924) (991) Minority Interests (12.0) (16.0) (14.9) (16.3) (17.5) Preference Dividend (110) (110) (110) (110) (110)
Net Profit 2,986 3,280 3,986 4,384 4,712 Net Profit bef Except 2,987 3,281 3,986 4,384 4,712 Growth (%) Net Interest Income Gth 1.3 10.8 11.2 8.3 6.6 Net Profit Gth (3.6) 9.8 21.5 10.0 7.5
Margins, Costs & Efficiency (%) Spread 1.7 1.7 1.8 1.8 1.8 Net Interest Margin 1.7 1.8 1.9 1.9 1.9 Cost-to-Income Ratio 45.9 45.5 43.7 42.6 42.2
Business Mix (%) Net Int. Inc / Opg Inc. 61.9 62.5 63.6 64.0 64.1 Non-Int. Inc / Opg inc. 38.1 37.5 36.4 36.0 35.9 Fee Inc / Opg Income 24.0 24.4 23.8 23.7 23.8 Oth Non-Int Inc/Opg Inc 14.1 13.1 12.6 12.3 12.1
Profitability (%) ROAE Pre Ex. 10.1 10.1 11.4 11.6 11.6 ROAE 10.1 10.1 11.4 11.6 11.6 ROA Pre Ex. 0.9 1.0 1.1 1.2 1.2 ROA 0.9 1.0 1.1 1.2 1.2
Source: Company, DBS Bank
Lower provisions from FY18F in the absence of general provision buffers
NIM uptrend intact with rate hike expectations
Page 166

Page 7
Company Guide
UOB
Quarterly / Interim Income Statement (S$m)
FY Dec 4Q2016 1Q2017 2Q2017 3Q2017 4Q2017
Net Interest Income 1,276 1,303 1,355 1,408 1,460 Non-Interest Income 752 819 828 829 846
Operating Income 2,028 2,123 2,184 2,238 2,307 Operating Expenses (957) (957) (995) (973) (1,102)
Pre-Provision Profit 1,071 1,166 1,189 1,265 1,205 Provisions (131) (187) (180) (221) (140) Associates (21.0) 34.0 24.0 29.0 22.0 Exceptionals 0.0 0.0 0.0 0.0 0.0
Pretax Profit 919 1,013 1,033 1,073 1,087 Taxation (177) (203) (184) (187) (226) Minority Interests (3.0) (3.0) (4.0) (3.0) (6.0)
Net Profit 739 807 845 883 855
Growth (%) Net Interest Income Gth 3.7 2.1 4.0 3.9 3.7 Net Profit Gth (6.5) 9.2 4.8 4.4 (3.2)
Balance Sheet (S$m) FY Dec 2016A 2017A 2018F 2019F 2020F
Cash/Bank Balance 24,322 26,625 34,368 36,087 37,891 Government Securities 17,515 15,976 16,775 17,614 18,494 Inter Bank Assets 40,033 52,181 37,395 39,963 42,601 Total Net Loans & Advs. 221,734 232,212 249,298 266,422 284,006 Investment 14,767 13,039 14,319 15,268 16,245 Associates 1,109 1,194 1,324 1,466 1,618 Fixed Assets 2,990 1,971 1,823 1,667 1,667 Goodwill 4,151 4,142 4,142 4,142 4,142 Other Assets 13,407 11,252 19,944 21,314 22,720
Total Assets 340,028 358,592 379,387 403,942 429,385
Customer Deposits 255,314 272,765 286,403 300,723 315,760 Inter Bank Deposits 11,855 11,440 6,468 12,398 18,155 Debts/Borrowings 26,143 25,178 25,178 25,178 25,178 Others 13,674 12,172 21,874 23,353 24,854 Minorities 169 187 202 218 236 Shareholders' Funds 32,873 36,850 39,262 42,072 45,203
Total Liab& S/H’s Funds 340,028 358,592 379,387 403,942 429,385
Source: Company, DBS Bank
Dip in 4Q17 earnings from one last round of kitchen sinking for the oil & gas sector
Sustained 7-8% loan growth ahead
Page 167

Company Guide
UOB
Financial Stability Measures (%)
FY Dec 2016A 2017A 2018F 2019F 2020F
Balance Sheet Structure Loan-to-Deposit Ratio 86.8 85.1 87.0 88.6 89.9 Net Loans / Total Assets 65.2 64.8 65.7 66.0 66.1 Investment / Total Assets 4.3 3.6 3.8 3.8 3.8 Cust . Dep./Int. Bear. Liab. 87.0 88.2 90.0 88.9 87.9 Interbank Dep / Int. Bear. 4.0 3.7 2.0 3.7 5.1
Asset Quality NPL / Total Gross Loans 1.5 1.8 1.7 1.6 1.5 NPL / Total Assets 1.0 1.2 1.1 1.1 1.0 Loan Loss Reserve Coverage 118.0 90.6 101.3 114.5 129.4 Provision Charge-Off Rate 0.3 0.3 0.2 0.2 0.2
Capital Strength Total CAR 16.3 18.7 17.7 17.9 18.1 Tier-1 CAR 13.0 15.1 14.4 14.7 15.0
Source: Company, DBS Bank
Target Price & Ratings History
Source: DBS Bank
Analyst: Sue Lin LIM
Rui Wen LIM
S.No.Date of Report
Closing Price
12-mthTargetPrice
Rat ing
1: 28 Apr 17 21.80 22.70 BUY
2: 28 Jul 17 24.05 24.80 HOLD
3: 24 Oct 17 24.25 26.90 BUY
4: 03 Nov 17 24.77 27.50 BUY
5: 22 Nov 17 25.77 27.50 BUY
6: 04 Jan 18 27.02 29.50 BUY
7: 15 Feb 18 27.04 29.50 BUY
Note : Share price and Target price are adjusted for corporate actions.
1
2
3
45
6
7
20.39
22.39
24.39
26.39
28.39
30.39
Apr-17 Jun-17 Aug-17 Oct-17 Dec-17 Feb-18 Apr-18
S$
Strong capital levels could hint towards higher dividends
Page 168

Industry Focus
Singapore Banks
Page 6
DBS Bank recommendations are based an Absolute Total Return* Rating system, defined as follows:
STRONG BUY (>20% total return over the next 3 months, with identifiable share price catalysts within this time frame)
BUY (>15% total return over the next 12 months for small caps, >10% for large caps)
HOLD (-10% to +15% total return over the next 12 months for small caps, -10% to +10% for large caps)
FULLY VALUED (negative total return i.e. > -10% over the next 12 months)
SELL (negative total return of > -20% over the next 3 months, with identifiable catalysts within this time frame)
Share price appreciation + dividends
Completed Date: 26 Apr 2018 18:26:08 (SGT) Dissemination Date: 26 Apr 2018 18:43:20 (SGT)
Sources for all charts and tables are DBS Bank unless otherwise specified.
GENERAL DISCLOSURE/DISCLAIMER
This report is prepared by DBS Bank Ltd. This report is solely intended for the clients of DBS Bank Ltd, its respective connected and associated
corporations and affiliates only and no part of this document may be (i) copied, photocopied or duplicated in any form or by any means or (ii)
redistributed without the prior written consent of DBS Bank Ltd.
The research set out in this report is based on information obtained from sources believed to be reliable, but we (which collectively refers to DBS
Bank Ltd, its respective connected and associated corporations, affiliates and their respective directors, officers, employees and agents (collectively,
the “DBS Group”) have not conducted due diligence on any of the companies, verified any information or sources or taken into account any other
factors which we may consider to be relevant or appropriate in preparing the research. Accordingly, we do not make any representation or
warranty as to the accuracy, completeness or correctness of the research set out in this report. Opinions expressed are subject to change without
notice. This research is prepared for general circulation. Any recommendation contained in this document does not have regard to the specific
investment objectives, financial situation and the particular needs of any specific addressee. This document is for the information of addressees
only and is not to be taken in substitution for the exercise of judgement by addressees, who should obtain separate independent legal or financial
advice. The DBS Group accepts no liability whatsoever for any direct, indirect and/or consequential loss (including any claims for loss of profit)
arising from any use of and/or reliance upon this document and/or further communication given in relation to this document. This document is not
to be construed as an offer or a solicitation of an offer to buy or sell any securities. The DBS Group, along with its affiliates and/or persons
associated with any of them may from time to time have interests in the securities mentioned in this document. The DBS Group, may have
positions in, and may effect transactions in securities mentioned herein and may also perform or seek to perform broking, investment banking and
other banking services for these companies.
Any valuations, opinions, estimates, forecasts, ratings or risk assessments herein constitutes a judgment as of the date of this report, and there can
be no assurance that future results or events will be consistent with any such valuations, opinions, estimates, forecasts, ratings or risk assessments.
The information in this document is subject to change without notice, its accuracy is not guaranteed, it may be incomplete or condensed, it may
not contain all material information concerning the company (or companies) referred to in this report and the DBS Group is under no obligation to
update the information in this report.
This publication has not been reviewed or authorized by any regulatory authority in Singapore, Hong Kong or elsewhere. There is no planned
schedule or frequency for updating research publication relating to any issuer.
The valuations, opinions, estimates, forecasts, ratings or risk assessments described in this report were based upon a number of estimates and
assumptions and are inherently subject to significant uncertainties and contingencies. It can be expected that one or more of the estimates on
which the valuations, opinions, estimates, forecasts, ratings or risk assessments were based will not materialize or will vary significantly from actual
results. Therefore, the inclusion of the valuations, opinions, estimates, forecasts, ratings or risk assessments described herein IS NOT TO BE RELIED
UPON as a representation and/or warranty by the DBS Group (and/or any persons associated with the aforesaid entities), that:
(a) such valuations, opinions, estimates, forecasts, ratings or risk assessments or their underlying assumptions will be achieved, and
(b) there is any assurance that future results or events will be consistent with any such valuations, opinions, estimates, forecasts, ratings or risk
assessments stated therein.
Please contact the primary analyst for valuation methodologies and assumptions associated with the covered companies or price targets.
Any assumptions made in this report that refers to commodities, are for the purposes of making forecasts for the company (or companies)
mentioned herein. They are not to be construed as recommendations to trade in the physical commodity or in the futures contract relating to the
commodity referred to in this report.
Page 169

Industry Focus
Singapore Banks
Page 7
DBSVUSA, a US-registered broker-dealer, does not have its own investment banking or research department, has not participated in any public
offering of securities as a manager or co-manager or in any other investment banking transaction in the past twelve months and does not engage
in market-making.
ANALYST CERTIFICATION
The research analyst(s) primarily responsible for the content of this research report, in part or in whole, certifies that the views about the
companies and their securities expressed in this report accurately reflect his/her personal views. The analyst(s) also certifies that no part of his/her
compensation was, is, or will be, directly or indirectly, related to specific recommendations or views expressed in the report. The research analyst (s)
primarily responsible for the content of this research report, in part or in whole, certifies that he or his associate1 does not serve as an officer of the
issuer or the new listing applicant (which includes in the case of a real estate investment trust, an officer of the management company of the real
estate investment trust; and in the case of any other entity, an officer or its equivalent counterparty of the entity who is responsible for the
management of the issuer or the new listing applicant) and the research analyst(s) primarily responsible for the content of this research report or
his associate does not have financial interests2 in relation to an issuer or a new listing applicant that the analyst reviews. DBS Group has
procedures in place to eliminate, avoid and manage any potential conflicts of interests that may arise in connection with the production of
research reports. The research analyst(s) responsible for this report operates as part of a separate and independent team to the investment
banking function of the DBS Group and procedures are in place to ensure that confidential information held by either the research or investment
banking function is handled appropriately. There is no direct link of DBS Group's compensation to any specific investment banking function of the
DBS Group.
COMPANY-SPECIFIC / REGULATORY DISCLOSURES
1. DBS Bank Ltd, DBS HK, DBS Vickers Securities (Singapore) Pte Ltd (''DBSVS''), DBSV HK or their subsidiaries and/or other affiliates have a
proprietary position in OCBC and UOB recommended in this report as of 30 Mar 2018.
2. Neither DBS Bank Ltd, DBS HK nor DBSV HK market makes in equity securities of the issuer(s) or company(ies) mentioned in this Research
Report.
Compensation for investment banking services:
3. DBSVUSA does not have its own investment banking or research department, nor has it participated in any public offering of securities as a
manager or co-manager or in any other investment banking transaction in the past twelve months. Any US persons wishing to obtain further
information, including any clarification on disclosures in this disclaimer, or to effect a transaction in any security discussed in this document
should contact DBSVUSA exclusively.
Disclosure of previous investment recommendation produced:
4. DBS Bank Ltd, DBS Vickers Securities (Singapore) Pte Ltd (''DBSVS''), their subsidiaries and/or other affiliates may have published other
investment recommendations in respect of the same securities / instruments recommended in this research report during the preceding 12
months. Please contact the primary analyst listed in the first page of this report to view previous investment recommendations published by
DBS Bank Ltd, DBS Vickers Securities (Singapore) Pte Ltd (''DBSVS''), their subsidiaries and/or other affiliates in the preceding 12 months.
1 An associate is defined as (i) the spouse, or any minor child (natural or adopted) or minor step-child, of the analyst; (ii) the trustee of a trust of which the analyst, his spouse, minor child (natural or adopted) or minor step-child, is a beneficiary or discretionary object; or (iii) another person accustomed or obliged to act in accordance with the directions or instructions of the analyst.
2 Financial interest is defined as interests that are commonly known financial interest, such as investment in the securities in respect of an issuer or a new listing applicant, or financial accommodation arrangement between the issuer or the new listing applicant and the firm or analysis. This term does not include commercial lending conducted at arm's length, or investments in any collective investment scheme other than an issuer or new listing applicant notwithstanding the fact that the scheme has investments in securities in respect of an issuer or a new listing applicant.
Page 170

Market Focus
Singapore Digital Transformation
Page 63
DBS Bank recommendations are based an Absolute Total Return* Rating system, defined as follows:
STRONG BUY (>20% total return over the next 3 months, with identifiable share price catalysts within this time frame)
BUY (>15% total return over the next 12 months for small caps, >10% for large caps)
HOLD (-10% to +15% total return over the next 12 months for small caps, -10% to +10% for large caps)
FULLY VALUED (negative total return i.e. > -10% over the next 12 months)
SELL (negative total return of > -20% over the next 3 months, with identifiable catalysts within this time frame)
Share price appreciation + dividends
Completed Date: 15 May 2018 07:53:35 (SGT) Dissemination Date: 15 May 2018 09:06:20 (SGT)
Sources for all charts and tables are DBS Bank unless otherwise specified.
GENERAL DISCLOSURE/DISCLAIMER
This report is prepared by DBS Bank Ltd. This report is solely intended for the clients of DBS Bank Ltd, its respective connected and associated
corporations and affiliates only and no part of this document may be (i) copied, photocopied or duplicated in any form or by any means or (ii)
redistributed without the prior written consent of DBS Bank Ltd.
The research set out in this report is based on information obtained from sources believed to be reliable, but we (which collectively refers to DBS
Bank Ltd, its respective connected and associated corporations, affiliates and their respective directors, officers, employees and agents (collectively,
the “DBS Group”) have not conducted due diligence on any of the companies, verified any information or sources or taken into account any other
factors which we may consider to be relevant or appropriate in preparing the research. Accordingly, we do not make any representation or
warranty as to the accuracy, completeness or correctness of the research set out in this report. Opinions expressed are subject to change without
notice. This research is prepared for general circulation. Any recommendation contained in this document does not have regard to the specific
investment objectives, financial situation and the particular needs of any specific addressee. This document is for the information of addressees
only and is not to be taken in substitution for the exercise of judgement by addressees, who should obtain separate independent legal or financial
advice. The DBS Group accepts no liability whatsoever for any direct, indirect and/or consequential loss (including any claims for loss of profit)
arising from any use of and/or reliance upon this document and/or further communication given in relation to this document. This document is not
to be construed as an offer or a solicitation of an offer to buy or sell any securities. The DBS Group, along with its affiliates and/or persons
associated with any of them may from time to time have interests in the securities mentioned in this document. The DBS Group, may have
positions in, and may effect transactions in securities mentioned herein and may also perform or seek to perform broking, investment banking and
other banking services for these companies.
Any valuations, opinions, estimates, forecasts, ratings or risk assessments herein constitutes a judgment as of the date of this report, and there can
be no assurance that future results or events will be consistent with any such valuations, opinions, estimates, forecasts, ratings or risk assessments.
The information in this document is subject to change without notice, its accuracy is not guaranteed, it may be incomplete or condensed, it may
not contain all material information concerning the company (or companies) referred to in this report and the DBS Group is under no obligation to
update the information in this report.
This publication has not been reviewed or authorized by any regulatory authority in Singapore, Hong Kong or elsewhere. There is no planned
schedule or frequency for updating research publication relating to any issuer.
The valuations, opinions, estimates, forecasts, ratings or risk assessments described in this report were based upon a number of estimates and
assumptions and are inherently subject to significant uncertainties and contingencies. It can be expected that one or more of the estimates on
which the valuations, opinions, estimates, forecasts, ratings or risk assessments were based will not materialize or will vary significantly from actual
results. Therefore, the inclusion of the valuations, opinions, estimates, forecasts, ratings or risk assessments described herein IS NOT TO BE RELIED
UPON as a representation and/or warranty by the DBS Group (and/or any persons associated with the aforesaid entities), that:
(a) such valuations, opinions, estimates, forecasts, ratings or risk assessments or their underlying assumptions will be achieved, and
(b) there is any assurance that future results or events will be consistent with any such valuations, opinions, estimates, forecasts, ratings or risk
assessments stated therein.
Page 171

Market Focus
Singapore Digital Transformation
Page 64
Please contact the primary analyst for valuation methodologies and assumptions associated with the covered companies or price targets.
Any assumptions made in this report that refers to commodities, are for the purposes of making forecasts for the company (or companies)
mentioned herein. They are not to be construed as recommendations to trade in the physical commodity or in the futures contract relating to the
commodity referred to in this report.
DBSVUSA, a US-registered broker-dealer, does not have its own investment banking or research department, has not participated in any public
offering of securities as a manager or co-manager or in any other investment banking transaction in the past twelve months and does not engage
in market-making.
ANALYST CERTIFICATION
The research analyst(s) primarily responsible for the content of this research report, in part or in whole, certifies that the views about the
companies and their securities expressed in this report accurately reflect his/her personal views. The analyst(s) also certifies that no part of his/her
compensation was, is, or will be, directly or indirectly, related to specific recommendations or views expressed in the report. The research analyst (s)
primarily responsible for the content of this research report, in part or in whole, certifies that he or his associate1 does not serve as an officer of
the issuer or the new listing applicant (which includes in the case of a real estate investment trust, an officer of the management company of the
real estate investment trust; and in the case of any other entity, an officer or its equivalent counterparty of the entity who is responsible for the
management of the issuer or the new listing applicant) and the research analyst(s) primarily responsible for the content of this research report or
his associate does not have financial interests2 in relation to an issuer or a new listing applicant that the analyst reviews. DBS Group has
procedures in place to eliminate, avoid and manage any potential conflicts of interests that may arise in connection with the production of
research reports. The research analyst(s) responsible for this report operates as part of a separate and independent team to the investment
banking function of the DBS Group and procedures are in place to ensure that confidential information held by either the research or investment
banking function is handled appropriately. There is no direct link of DBS Group's compensation to any specific investment banking function of the
DBS Group.
COMPANY-SPECIFIC / REGULATORY DISCLOSURES
1 An associate is defined as (i) the spouse, or any minor child (natural or adopted) or minor step-child, of the analyst; (ii) the trustee of a trust of
which the analyst, his spouse, minor child (natural or adopted) or minor step-child, is a beneficiary or discretionary object; or (iii) another person accustomed or obliged to act in accordance with the directions or instructions of the analyst.
2 Financial interest is defined as interests that are commonly known financial interest, such as investment in the securities in respect of an issuer or
a new listing applicant, or financial accommodation arrangement between the issuer or the new listing applicant and the firm or analysis. This
term does not include commercial lending conducted at arm's length, or investments in any collective investment scheme other than an issuer or
new listing applicant notwithstanding the fact that the scheme has investments in securities in respect of an issuer or a new listing applicant.
Page 172
1. DBS Bank Ltd, DBS HK, DBS Vickers Securities (Singapore) Pte Ltd (''DBSVS''), DBSV HK or their subsidiaries and/or other affiliates have a
proprietary positions in the Mapletree Commercial Trust, Singapore Airlines Limited, Singapore Post, Singtel, ST Engineering, OCBC, UOB,
recommended in this report as of 30 Apr 2018.
2. Neither DBS Bank Ltd, DBS HK nor DBSV HK market makes in equity securities of the issuer(s) or company(ies) mentioned in this Research
Report.
3. DBS Bank Ltd, DBS HK, DBSVS, DBSV HK, their subsidiaries and/or other affiliates have a net long position exceeding 0.5% of the total issued
share capital in Mapletree Commercial Trust, recommended in this report as of 30 Apr 2018.
Compensation for investment banking services:
4. DBS Bank Ltd, DBS HK, DBSVS, DBSV HK, their subsidiaries and/or other affiliates of DBSVUSA have received compensation, within the past 12
months for investment banking services from Singapore Airlines Limited, as of 30 Apr 2018.
5. DBS Bank Ltd, DBS HK, DBSVS, their subsidiaries and/or other affiliates of DBSVUSA have managed or co-managed a public offering of
securities for Mapletree Commercial Trust, Singapore Airlines Limited, in the past 12 months, as of 30 Apr 2018.

Market Focus
Singapore Digital Transformation
Page 65
6. DBSVUSA does not have its own investment banking or research department, nor has it participated in any public offering of securities as a
manager or co-manager or in any other investment banking transaction in the past twelve months. Any US persons wishing to obtain further
information, including any clarification on disclosures in this disclaimer, or to effect a transaction in any security discussed in this document should
contact DBSVUSA exclusively.
Directorship/trustee interests:
7. Peter Seah Lim Huat, Chairman & Director of DBS Group Holdings, is a Director / Chairman of Singapore Airlines as of 31 Mar 2018.
8. Lim Sim Seng, a member of DBS Group Executive Committee, is a Independent non-executive director of ST Engineering as of 1 May 2018
Disclosure of previous investment recommendation produced:
9. DBS Bank Ltd, DBS Vickers Securities (Singapore) Pte Ltd (''DBSVS''), their subsidiaries and/or other affiliates may have published other
investment recommendations in respect of the same securities / instruments recommended in this research report during the preceding 12
months. Please contact the primary analyst listed in the first page of this report to view previous investment recommendations published by
DBS Bank Ltd, DBS Vickers Securities (Singapore) Pte Ltd (''DBSVS''), their subsidiaries and/or other affiliates in the preceding 12 months.
RESTRICTIONS ON DISTRIBUTION
General This report is not directed to, or intended for distribution to or use by, any person or entity who is a citizen or resident of or located in any locality, state, country or other jurisdiction where such distribution, publication, availability or use would be contrary to law or regulation.
Australia This report is being distributed in Australia by DBS Bank Ltd. (“DBS”) or DBS Vickers Securities (Singapore) Pte Ltd (“DBSVS”). DBS holds Australian Financial Services Licence no. 475946.
DBSVS is exempted from the requirement to hold an Australian Financial Services Licence under the Corporation Act 2001 (“CA”) in respect of financial services provided to the recipients. DBSVS is regulated by the Monetary Authority of Singapore under the laws of Singapore, which differ from Australian laws.
Distribution of this report is intended only for “wholesale investors” within the meaning of the CA.
Hong Kong This report has been prepared by a person(s) who is not licensed by the Hong Kong Securities and Futures Commission to carry on the regulated activity of advising on securities in Hong Kong pursuant to the Securities and Futures Ordinance (Chapter 571 of the Laws of Hong Kong). This report is being distributed in Hong Kong and is attributable to DBS Vickers Hong Kong Limited, a licensed corporation licensed by the Hong Kong Securities and Futures Commission to carry on the regulated activity of advising on securities pursuant to the Securities and Futures Ordinance (Chapter 571 of the Laws of Hong Kong).
For any query regarding the materials herein, please contact Paul Yong (CE. No. ASE988) at [email protected].
Indonesia This report is being distributed in Indonesia by PT DBS Vickers Sekuritas Indonesia.
Malaysia This report is distributed in Malaysia by AllianceDBS Research Sdn Bhd ("ADBSR"). Recipients of this report, received from ADBSR are to contact the undersigned at 603-2604 3333 in respect of any matters arising from or in connection with this report. In addition to the General Disclosure/Disclaimer found at the preceding page, recipients of this report are advised that ADBSR (the preparer of this report), its holding company Alliance Investment Bank Berhad, their respective connected and associated corporations, affiliates, their directors, officers, employees, agents and parties related or associated with any of them may have positions in, and may effect transactions in the securities mentioned herein and may also perform or seek to perform broking, investment banking/corporate advisory and other services for the subject companies. They may also have received compensation and/or seek to obtain compensation for broking, investment banking/corporate advisory and other services from the subject companies.
Wong Ming Tek, Executive Director, ADBSR
Page 173

Market Focus
Singapore Digital Transformation
Page 66
Singapore This report is distributed in Singapore by DBS Bank Ltd (Company Regn. No. 196800306E) or DBSVS (Company Regn No. 198600294G), both of which are Exempt Financial Advisers as defined in the Financial Advisers Act and regulated by the Monetary Authority of Singapore. DBS Bank Ltd and/or DBSVS, may distribute reports produced by its respective foreign entities, affiliates or other foreign research houses pursuant to an arrangement under Regulation 32C of the Financial Advisers Regulations. Where the report is distributed in Singapore to a person who is not an Accredited Investor, Expert Investor or an Institutional Investor, DBS Bank Ltd accepts legal responsibility for the contents of the report to such persons only to the extent required by law. Singapore recipients should contact DBS Bank Ltd at 6327 2288 for matters arising from, or in connection with the report.
Thailand This report is being distributed in Thailand by DBS Vickers Securities (Thailand) Co Ltd.
United Kingdom
This report is produced by DBS Bank Ltd which is regulated by the Monetary Authority of Singapore.
This report is disseminated in the United Kingdom by DBS Vickers Securities (UK) Ltd, ("DBSVUK"). DBSVUK is authorised and regulated by the Financial Conduct Authority in the United Kingdom.
In respect of the United Kingdom, this report is solely intended for the clients of DBSVUK, its respective connected and associated corporations and affiliates only and no part of this document may be (i) copied, photocopied or duplicated in any form or by any means or (ii) redistributed without the prior written consent of DBSVUK. This communication is directed at persons having professional experience in matters relating to investments. Any investment activity following from this communication will only be engaged in with such persons. Persons who do not have professional experience in matters relating to investments should not rely on this communication.
Dubai International Financial Centre
This research report is being distributed by DBS Bank Ltd., (DIFC Branch) having its office at PO Box 506538, 3rd Floor, Building 3, East Wing, Gate Precinct, Dubai International Financial Centre (DIFC), Dubai, United Arab Emirates. DBS Bank Ltd., (DIFC Branch) is regulated by The Dubai Financial Services Authority. This research report is intended only for professional clients (as defined in the DFSA rulebook) and no other person may act upon it.
United Arab Emirates
This report is provided by DBS Bank Ltd (Company Regn. No. 196800306E) which is an Exempt Financial Adviser as defined in the Financial Advisers Act and regulated by the Monetary Authority of Singapore. This report is for information purposes only and should not be relied upon or acted on by the recipient or considered as a solicitation or inducement to buy or sell any financial product. It does not constitute a personal recommendation or take into account the particular investment objectives, financial situation, or needs of individual clients. You should contact your relationship manager or investment adviser if you need advice on the merits of buying, selling or holding a particular investment. You should note that the information in this report may be out of date and it is not represented or warranted to be accurate, timely or complete. This report or any portion thereof may not be reprinted, sold or redistributed without our written consent.
United States This report was prepared by DBS Bank Ltd. DBSVUSA did not participate in its preparation. The research analyst(s) named on this report are not registered as research analysts with FINRA and are not associated persons of DBSVUSA. The research analyst(s) are not subject to FINRA Rule 2241 restrictions on analyst compensation, communications with a subject company, public appearances and trading securities held by a research analyst. This report is being distributed in the United States by DBSVUSA, which accepts responsibility for its contents. This report may only be distributed to Major U.S. Institutional Investors (as defined in SEC Rule 15a-6) and to such other institutional investors and qualified persons as DBSVUSA may authorize. Any U.S. person receiving this report who wishes to effect transactions in any securities referred to herein should contact DBSVUSA directly and not its affiliate.
Other jurisdictions
In any other jurisdictions, except if otherwise restricted by laws or regulations, this report is intended only for qualified, professional, institutional or sophisticated investors as defined in the laws and regulations of such jurisdictions.
Page 174

Market Focus
Singapore Digital Transformation
Page 67
DBS Regional Research Offices
HONG KONG DBS Vickers (Hong Kong) Ltd Contact: Paul Yong 18th Floor Man Yee Building 68 Des Voeux Road Central Central, Hong Kong Tel: 65 6878 8888 Fax: 65 65353 418 e-mail: [email protected] of the Stock Exchange of Hong Kong
MALAYSIA AllianceDBS Research Sdn Bhd Contact: Wong Ming Tek (128540 U) 19th Floor, Menara Multi-Purpose, Capital Square, 8 Jalan Munshi Abdullah 50100 Kuala Lumpur, Malaysia. Tel.: 603 2604 3333 Fax: 603 2604 3921 e-mail: [email protected]
SINGAPORE DBS Bank Ltd Contact: Janice Chua 12 Marina Boulevard, Marina Bay Financial Centre Tower 3 Singapore 018982 Tel: 65 6878 8888 Fax: 65 65353 418 e-mail: [email protected] Regn. No. 196800306E
INDONESIA PT DBS Vickers Sekuritas (Indonesia) Contact: Maynard Priajaya Arif DBS Bank Tower Ciputra World 1, 32/F Jl. Prof. Dr. Satrio Kav. 3-5 Jakarta 12940, Indonesia Tel: 62 21 3003 4900 Fax: 6221 3003 4943 e-mail: [email protected]
THAILAND DBS Vickers Securities (Thailand) Co Ltd Contact: Chanpen Sirithanarattanakul 989 Siam Piwat Tower Building, 9th, 14th-15th Floor Rama 1 Road, Pathumwan, Bangkok Thailand 10330 Tel. 66 2 857 7831 Fax: 66 2 658 1269 e-mail: [email protected] Regn. No 0105539127012Securities and Exchange Commission, Thailand
Page 175


