Embed Size (px)
Citation preview

ARTICLE IN PRESS
0030-3992/$ - se
doi:10.1016/j.op
�CorrespondE-mail addr
Optics & Laser Technology 38 (2006) 558–564
www.elsevier.com/locate/optlastec
Simulation of nonlinear optical absorption in ZnSe:Co2+ crystals
Z. Mierczyka, A. Majchrowskib, K. Ozgac, A. Slezakc, I.V. Kitykd,�
aInstitute of Optoelectronics, Military University of Technology, Kaliskiego 2, 00-908 Warsaw, PolandbInstitue of Applied Physics, Military University of Technology, Kaliskiego 2, 00-908 Warsaw, Poland
cDepartment of Biology and Biophysics, Technical University of Czestochowa, Al. Armii Krajowej 17/19, PL-42201, Czestochowa, PolanddInstitute of Physics, Academy J.Dlugosz in Czestochowa, Al. Armii Krajowej 13/15, Czestochowa, Poland
Received 4 June 2004; received in revised form 24 November 2004; accepted 30 November 2004
Available online 23 January 2005
Abstract
The paper presents theoretical approach to simulation of nonlinear optical absorption in zinc selenide crystals doped with cobalt
(II) ions (ZnSe:Co2+), which was reported by us earlier (Opt. Laser Technology, V. 35, (2003), 169). We used ZnSe:Co2+ crystals as
saturable absorbers for generation of giant-pulse eye-safe laser radiation. It was found that minimal optical losses (maximal final
transmission) occurred for ZnSe samples containing 1.6� 1019 cm�3 of Co2+ ions. Band structure and photoinduced molecular
dynamics simulations were performed to explain the parabolic dependence of optical losses versus Co2+ concentration. The
minimum was shown to be the result of photoinduced anharmonic electron–phonon interaction.
r 2005 Elsevier Ltd. All rights reserved.
Keywords: Nonlinear optical absorber; ZnSe–Co crystals; Saturable absorber
1. Introduction
Recently, crystalline nonlinear optical absorberscontaining U2+ or Co2+ ions arose much of interestdue to their potential applications as saturable absorbersin ‘‘eye-safe’’ laser generation near 1.5 mm [1–5]. Wehave shown that ZnSe:Co2+ single crystals can be usedas materials for modulator in generation of ‘‘eye-safe’’giant-pulses (t ¼ 30 ns; output energy 8mJ) laser radia-tion at 1535 nm with KIGRE QE-7S erbium glass rod.Bridgman technique was used to grow ZnSe:Co2+
crystals from graphite crucibles under argon ambientatmosphere (5MPa). The details of the technology weredescribed by Demianiuk [6]. As-grown transparentcrystals had diameter and length of 10 and 60mm,respectively. Co2+ ions concentration in ZnSe:Co2+
samples was calculated by means of optical measure-ments, which are given in Ref. [5]. In our recent article[1] we have given the experimental details. The main
e front matter r 2005 Elsevier Ltd. All rights reserved.
tlastec.2004.11.018
ing author.
ess: [email protected] (I.V. Kityk).
goal of the present article consists in theoreticalsimulations of the observed dependences. For thesimulations we use band structure calculations, mole-cular dynamics simulations taking of the photoinducedelectron–phonon (EP) anharmonic interactions intoaccount.
2. Main experimental results
In this section the principal experimental resultsconcerning the investigated crystals are given. Thedistribution of Co2+ ions in ZnSe:Co2+ ingots provedto be very non-uniform along the growth direction,changing from 1.3� 1019 cm�3 in the initial part of thecrystal up to 2.7� 1019 cm�3 at the end part of thecrystal. Absorption spectra of ZnSe:Co2+ samples weremeasured. Broad absorption band at 1500–2100 nm wasinvestigated from the point of view of nonlinearabsorption in ZnSe:Co2+. The changes of light trans-mission versus the laser probe power were investigated.In Fig. 1 the results of transmission changes versus the

ARTICLE IN PRESS
0.00.4
0.5
0.6
0.7
0.8
0.9
1.0
0.1 0.2 0.3 0.4 0.5
ENERGY DENSITY [J/cm2]
TR
AN
SM
ISS
ION
CO
EF
FIC
IEN
T
0.6 0.7 0.8 0.9
F-N-AF-N-BF-N-CEXP-A
EXP-B
EXP-C
1.0 1.1 1.2
Fig. 1. Changes of transmission of ZnSe:Co2+ samples under 1535 nm laser radiation.
Table 1
Principal experimental parameters
Starting transmission 61.4% 57.0% 41.7%
Absorption cross-section sGSA ¼ 6:5� 10�19 cm2 sGSA ¼ 6:5� 10�19 cm2 sGSA ¼ 6:5� 10�19 cm2
sESA ¼ 0:5� 10�19 cm2 sESA ¼ 0:5� 10�19 cm2 sESA ¼ 0:5� 10�19 cm2
Coefficient of non-active losses a ¼ 2:2� 10�3 cm�1 a ¼ 0:2� 10�3 cm�1 a ¼ 2:7� 10�3 cm�1
Concentration of absorption centers N0 ¼ 1:3� 1019 cm�3 N0 ¼ 1:6� 1019 cm�3 N0 ¼ 2:7� 1019 cm�3
Saturation energy ES ¼ 0:1 J=cm2ES ¼ 0:1 J=cm2
ES ¼ 0:1 J=cm2
Z. Mierczyk et al. / Optics & Laser Technology 38 (2006) 558–564 559
laser beam power at 1535 nm for three ZnSe:Co2+
samples having different Co2+ concentrations arepresented.
Experimental results (EXP) are compared withFrantz–Nodvik dependence (F–N) [1]:
AFconcentration of Co2þ ionsF1:3� 1019 cm�3;
BFconcentration ofCo2þ ionsF1:6� 1019 cm�3;
CFconcentrationofCo2þ ionsF2:8� 1019 cm�3:
A distinct minimum of optical losses (maximal transmis-sion) occurs for ZnSe:Co2+ samples with concentrationof Co2+ ions equal to 1.6� 1019 cm�3. In the presentpaper we perform band structure simulation to explainthis nonlinear dependence of optical losses versusconcentration of Co2+ ions in ZnSe:Co2+ crystals.
Several additional important results are given inTable 1.
3. Norm-conserving self-consistent pseudopotential
approach
For microscopic simulations of the absorption versusthe concentration and external pump optical power
density we have used the method of norm-conservingpseudopotential [7] together with the appropriatemolecular dynamics simulations similarly to the methodpresented in [8].
We first estimated the band energy structure of theZnSe crystallites for different concentrations of Co2+.As the principal approach we have applied the norm-conserving non-local pseudopotential method outlinedin Ref. [7].
Starting pseudo-wavefunctions were built using aprocedure proposed in Ref. [9] for a non-local norm-conserving pseudopotential. The total energy wasexpressed within a local density functional approxima-tion with respect to the charge density rðrÞ:
U ½rðrÞ� ¼ T ½rðrÞ� þ Vn�e½rðrÞ� þ V e�e½rðrÞ� þ V e�c½rðrÞ�;(1)
where
rðrÞ ¼Xb;l
jCðl; r;bÞj2: (2)
Here the kinetic charge density functional T ½rðrÞ� iscalculated within a Thomas–Fermi free electron approx-imation, Vn2e½rðrÞ� reflects electron–nuclear Coulomb-like interaction which was chosen in the form described
ARTICLE IN PRESSZ. Mierczyk et al. / Optics & Laser Technology 38 (2006) 558–564560
in Ref. [9]. In Eq. (1) we also included screenedpotentials V e2e½rðrÞ� and V e2c½rðrÞ�; corresponding toelectron–electron and exchange–correlation interaction,respectively. In the case of the local disturbance by theCo ions we consider at least 35 additional highlylocalized d-orbitals. A nonlinear extrapolation proce-dure was carried out in order to calculate the fittingcoefficients of the corresponding pseudo-wavefunctions,as well as the derivative pseudopotentials, in a formconvenient for analytical evaluations of secular equationmatrix elements, particularly
Cðl; r; bÞ ¼X
n
abnrn expb�aðl;bÞn rnc; (3)
where b denotes atom kind, l is the correspondingangular momentum, n determines the level of precisionof the nonlinear fitting procedure and can vary from 1 to5. The coefficients ab and aðl;bÞn are fitting coefficientscalculated during the nonlinear fitting procedure. Theprecision of the fit was, in the best case, 0.03H.
The pseudopotential was chosen in the followingform:
V ðb;lÞps ¼X3i¼1
½Abi þ r2A
biþ3 expð�aðl;bÞl r2Þ�; (4)
where Ai; Aiþ3; aðl;bÞl are fitting coefficients.
The technique for calculation of matrix elements isdescribed in detail in Ref. [9]. We solved the followingsecular equation corresponding to a pseudopotentialgiven by (4):
jj½h2ðkþGnÞ
2=2m� EðkÞ�dn;n0 þXa
VaðG0n �GnÞ
SaðG0n �GnÞjj ¼ 0; ð5Þ
where EðkÞ is the eigenenergy for a k-point in theBrillouin zone, G0n; Gn are wavevectors of interactingbase plane waves. A structural form-factor which takesinto account Co impurities were built following thevalues of the impurity concentration and assuminghomogeneous space distribution. Varying the Co2+
content we have changed the corresponding weightingfactor,
SbðG0n �GÞ ¼ gðbÞ=ONa
Xexpð�iðG0n �GnÞsbÞ: (6)
Here gðbÞ is a weighting factor associated with theconcentration of the Co ions. A similar superposition ofdifferent structural fragments disturbing the perfectcrystals has been just successfully applied to binarysolid alloys, glasses and organic materials [10–12].Moreover, this approach was sufficient for differentdisordered materials and partially ordered solids like theSiC nanocrystallites investigated in [8].
We choose a plane wave basis set consisting of258–360 plane waves to achieve eigenenergy conver-gence of 0.023 eV.
The solutions of the secular equation set (Eq. (5)) wasobtained using a modified Jacobi method. Additional(250–290 ) plane waves from an extended base wereincluded into our calculations within the framework of aLowdin perturbation procedure. A Fourier transform ofthe pseudopotential has taken the form
V aðG0n �GnÞ ¼ 1=O
ZV aðrÞ exp½�iðG
0n �GnÞr�: (7)
Electron screening effects were introduced using aparameterized expression in the following form:
mxc ¼ �0:6193=rs � 0:14392=ð1þ 1:0529 r1=2s þ 0:3334 rsÞ
f1þ ½ð0:526r1=2s þ 0:3334rsÞ=ð3ð1þ 1:0529r1=2s
þ 0:3334rsÞÞ�g for rs41; ð8Þ
mxc ¼ �0:6193=rss þ 0:031 lnðrsÞ � 0:0583 for rso1;
(9)
where rs ¼ ½3=ð4prÞ�1=3 with r being electron density.The first terms in Eqs. (8) and (9) correspond to astandard Gaspar–Kohn–Sham exchange potential.
The special Chadhi–Cohen point method wasapplied for calculation of electron charge densitydistribution. Diagonalization procedure was carriedout at special weighting points for each structuralcluster.
Acceleration of the iteration convergence wasachieved by transferring 75% of the ðm� 1Þth iterationresult to the mth iteration. The following condition wastaken as the criterion for self-consistency:
jðrm � rm�1Þ=rmjo�: (10)
We assumed a level of calculation error (�) better than0.10%. In order to verify how the results of the energyband calculations depend on the choice of the cobaltconcentration we carried out additional calculationsfor the perfect ZnSe crystalline phases. The level ofagreement with previously undertaken calculationsof the electron density of states within a framework ofLMTO or pseudoptential methods was equal to about0.3 eV. However, the main drawback of all one-electroncalculations consists in an underestimation of the bandgap values. For this reason self-energy correctionrenormalization was carried out during the bandstructure calculations.
The effective potential can be presented as a super-position of long-range ZnSe crystalline regions and localCo2+ disturbances:
V ðGÞ ¼1
O
� �BZ
ZZZnSe
VZnSeðrÞ expð�iGrÞd3r
þ1
OZnSe
� � ZZnSe2Co
VZnSe2CoðrÞ
expð�iGrÞd3r; ð11Þ

ARTICLE IN PRESSZ. Mierczyk et al. / Optics & Laser Technology 38 (2006) 558–564 561
where G corresponds to the effective plane-wavevectorswithin the first BZ; gZnSe2Co and gZnSe correspond to theweighting factors associated to the concentrations ofcobalt and pure ZnSe clusters. VZnSe2CoðrÞ and VZnSeðrÞ
are potentials corresponding to the doped and un-dopedstates, respectively.
In order to accelerate the convergence procedure fordetermining the eigenvalues, we modified the norm-conserving PP wavefunctions through their orthogona-lization to the LCAO wavefunctions as introduced inRef. [12].
As a result, the total energy deviation in relation tothe energy cutoff and the Perdew–Alder screeningparameter was stabilized to 0.22 eV.
4. Molecular dynamics geometry optimization
4.1. Methods of molecular dynamics simulation
The starting total energy minimization was carriedout within the framework of the LDA pseudopotentialmethod. However in Refs. [10,11] we have shown thatthis minimization is not sufficient for total energyminimization of particular molecular clusters, especiallyin the case of the bulk symmetry breaking at theinterfaces. Such a situation is more typical for highlydisordered materials such as glasses or organic materi-als. In this case, it is necessary to carry out additionaltotal energy minimization of the clusters using thederivative of the potentials on the boundaries separatingparticular cluster and long-range crystalline potentials.The total energy of the compositions was evaluated as astatistic sum renormalized by an appropriate Boltzmannweighting factor.
To carry out the geometry optimization, we used themolecular dynamics technique described in Ref. [8]. Thisapproach has relatively quick convergence with respectto the sizes of the base sets and make it possible to varycontinuously the intra-, as well as inter-cluster distances.
In the case of the partially disordered cluster, weapply a variation procedure based on the Greenfunction, well established for glasses, to build thestructure of the ZnSe Co2+-doped background . As aconsequence it should be considered Co-containingcluster up to the three coordination sphere.
We found that in order to achieve moleculardynamics geometry convergence, it was necessary totake into account from 2 to 3 such layers depending onthe concentration of the Co.
We were able, in this way, to restrict significantly ourbasic structural supercell and to enhance precision andquickness in solving of the corresponding secularequation during the band energy calculations. Ourestimations have shown that renormalization saves from12 to 14% of the calculation time for each calculated
point in the extended BZ and ensures higher precision indetermining eigenenergy value (up to 3–7%):
Pi ¼ expð�Ui=kBTÞ=X
j
ð�Uj=kBTjÞ; (12)
where Uj is the optimized total energy for the jthsupercell configuration obtained as a result of geometryoptimization at temperature Tj and kB is the Boltzmannconstant. Using this factor, temperature-dependentrenormalization was carried out.
5. Photoinduced simulation
5.1. Calculation of the photoinduced saturated absorption
On the basis of the ZnSe–Co2+ structural optimiza-tion, we were able to predict the behavior of thephotoinduced saturated absorption taking the kineticsof the band occupation into account. The calculationswere done both for the pure electronic system as well asthe photoinduced electrostricted and piezoinduced EPanharmonicity. During the calculations we have takeninto account both linear traditional absorption as wellthe two-photon absorption. Accuracy of the calculationswas detetrmined by accuracy of transition dipolemoments evaluations and do not exceed 20%.
5.2. Modeling of the kinetic of photocarriers
Due to the high level of pump density, whenestimating the evolution of the corresponding levels,we focus first on the evolution of the ground molecularN1 level. For convenience, the corresponding set ofkinetic equations is presented in a form
dN1=dt ¼ �B12rN1 � B12B23r2N1 þ A31N3 þ A41N4;
dN3=dt ¼ �B13rN3 þ B12B23r2N1 þ A34N3 þ A31N3;
dN4=dt ¼ �B14rN1 � B12A34B23r2N1 þ A31N3 þ A41N4:
ð13Þ
A and B are used to indicate the spontaneous andoptically induced Einstein coefficients between therespective levels.
For convenience, the equation for N1 can bepresented in the form
dN1=dt ¼ �gI2N1 þ aN4: (14)
In this case we include linear absorption as abackground independent on the external light, andassumed that trapping from the EP sublevels was veryfast and complete. At the beginning we did not,therefore, consider the metastable states due to EPlevels. The solution for this equation takes the form:
N1 ¼ aN=ðbþ aÞ þ bN=ðbþ aÞ expð�ðbþ aÞtÞ; (15)

ARTICLE IN PRESSZ. Mierczyk et al. / Optics & Laser Technology 38 (2006) 558–564562
where N1 þN4 ¼ N and b ¼ gI2: Initially, we consid-ered pure electronic and EP states as simply super-imposed, and only afterwards took into accountcontribution of the secondary piezoelectric and electro-stricted effects.
We would emphasize that in the following analysiswe do not take into consideration the complicatedstructure of the effective levels 3 and 4 (in particular, thecontribution of levels with a relatively longer lifetime).The expression for the N1 level, which is the basisfor this process, can be written as follows:
N1 ¼ �N1ð0Þ expð�B12rÞt: (16)
And the level of the particular population is expressedin the form
N1 ¼ ðA31N3 � A41N4Þ=ðB12B23r2N1 þ A31N3 � A41N4Þ
þ B12B23r2N1=ðB12B23r2N1 þ A34N3 � A41N4Þ
exp½�ðB12B23r2N1 þ A31N3 � A41N4Þt�: ð17Þ
In Fig. 2 the changes of the electrostatic chargedensity distribution of the considered Co-containingcluster without inclusion of the photoinduced EPinteractions are presented. One can clearly see that inthis case the changes of the charge density in bothdirections indicated by different colors are different,however the asymmetry of the photoinduced chargedensity distribution remains almost the same. Now wewill consider the consequences of including the photo-induced EP anharmonicity.
When the hyperfine EP structure of the intermediatelevels is included, one would expect the appearance of atleast four sub-band levels in the corresponding kineticdependences. Our model is, therefore, in agreement withthe real model which is based on photoinducedtransparency as it exists immediately after the end of
Fig. 2. 3D-charge photoinduced charge density redistribution in the
cluster without inclusion of EP interactions.
the pumping pulse action. Any discrepancies increasewith a rise in the intensity of pumping light. From theseequations, one can also understand that the time delayto the maxima is caused by the hyperfine structure of theEV levels.
The qualitative estimations based on a simplifiedmolecular dynamics approach suggest the possibilitythat several maxima may occur in the picosecond time-delay range of the TPA. So we have taken into accountalso the photoexcited two-photon states. Howeverour estimations have shown that their contribution isbelow 6%.
In order to investigate the possible role played by EPcontributions, we carried out calculations for a base setrenormalized by electron subsystems. Second derivativesof the electrostatic cluster potential with respect to givennormal coordinates were calculated numerically withprecision up to 0.0021H for the main chemical bonds.These calculations were used to determine the forceconstants. The eigenenergy of the kth phonon mode isexpressed as
OkðukÞ ¼ 2Ok0ðuk þ12Þ; (18)
where Ok0 ¼ ðh=2pÞðf k=mkÞ1=2=2 is the zero-point motion
energy and nk ¼ 0; 1; 2; . . . is the vibration quantumnumber associated with the following wave function:
CkðQkÞ ¼ ð2Ok0=pÞ1=4ð2nk=nk!Þ
�1=2 expð�Ok0Q2kÞHv
½ð2Ok0Þ1=2Qk�; ð19Þ
where HnðxÞ is the Hermite polynomial. The harmonicphonon wavefunctions obtained serve as a basis for thenext calculations of EP interactions.
The EP interaction potential was calculated in anonlinear approximation:
V e2phðriÞ ¼ e2Xms
M1=2ms ½Zmsðrs � umsÞjrs � umsj
�1=3
�Xm0s0
Zm0s0 ðrs0 � um0s0 Þjrs0 � um0s0 j�3�; ð20Þ
where Mms and eZms are the effective ionic mass andcharge, the corresponding ions are numbered by m ands; respectively. The ums;m0s0 vector is the relativedisplacement of two ions from their equilibrium posi-tions rs and rs0 : The probability of a one-phonontransition is equal to
W ðOkÞ ¼ 4h
2p
� ��2c�3H�1g�1ðriÞðE � OkÞ
2BðOkÞ; (21)
where Z and x are the lower and upper electron MOenergy levels, respectively; H is the sum of the Z and xlevels widths, E is the energy of the UV photoinducingbeam, Ok denotes the kth vibration energy and gðriÞ isthe degeneration factor of the corresponding electronenergy levels.
ARTICLE IN PRESS
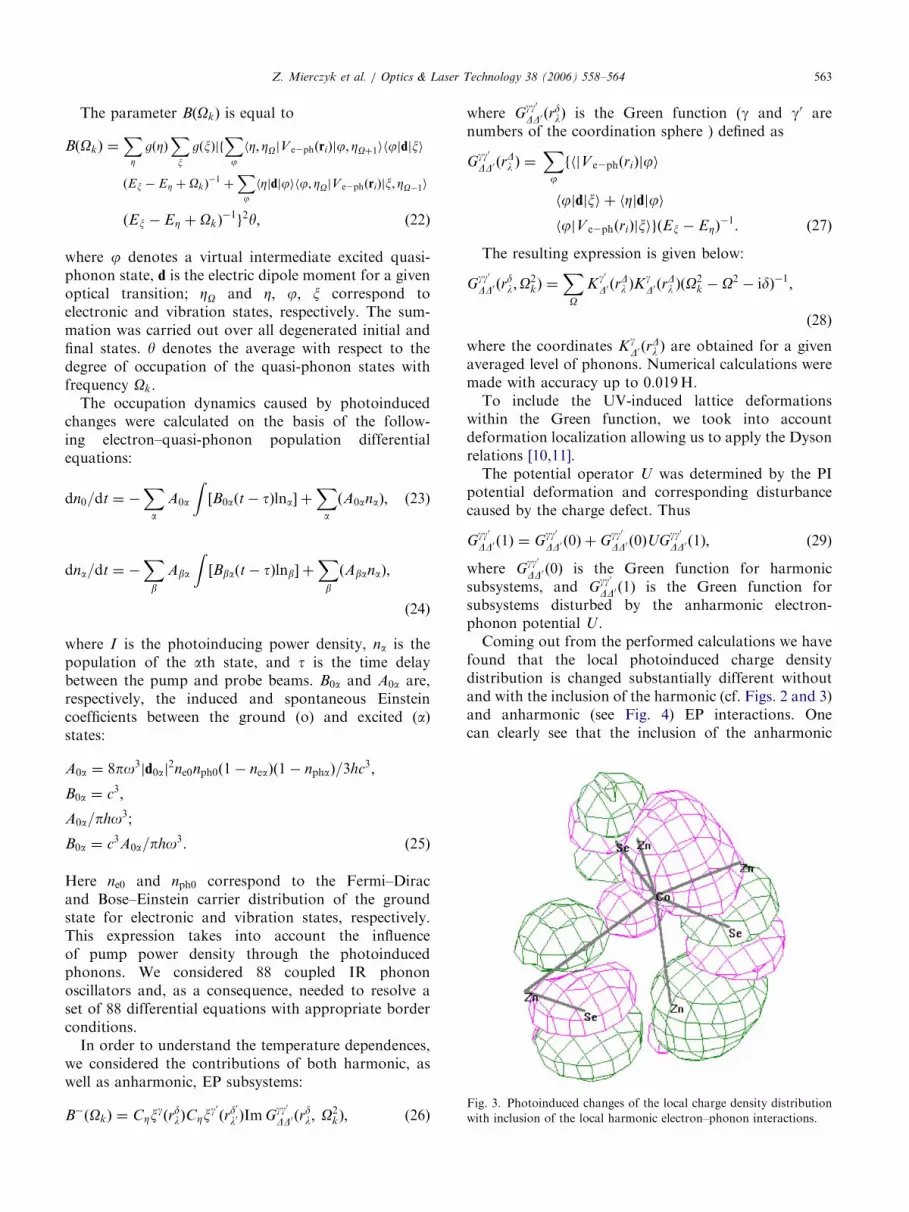
Fig. 3. Photoinduced changes of the local charge density distribution
with inclusion of the local harmonic electron–phonon interactions.
Z. Mierczyk et al. / Optics & Laser Technology 38 (2006) 558–564 563
The parameter BðOkÞ is equal to
BðOkÞ ¼XZ
gðZÞXx
gðxÞjfXj
hZ; ZOjV e2phðriÞjj; ZOþ1ihjjdjxi
ðEx � EZ þ OkÞ�1þXj
hZjdjjihj; ZOjV e2phðriÞjx; ZO�1i
ðEx � EZ þ OkÞ�1g2y; ð22Þ
where j denotes a virtual intermediate excited quasi-phonon state, d is the electric dipole moment for a givenoptical transition; ZO and Z; j; x correspond toelectronic and vibration states, respectively. The sum-mation was carried out over all degenerated initial andfinal states. y denotes the average with respect to thedegree of occupation of the quasi-phonon states withfrequency Ok:
The occupation dynamics caused by photoinducedchanges were calculated on the basis of the follow-ing electron–quasi-phonon population differentialequations:
dn0=dt ¼ �Xa
A0a
Z½B0aðt� tÞlna� þ
Xa
ðA0anaÞ; (23)
dna=dt ¼ �Xb
Aba
Z½Bbaðt� tÞlnb� þ
Xb
ðAbanaÞ;
(24)
where I is the photoinducing power density, na is thepopulation of the ath state, and t is the time delaybetween the pump and probe beams. B0a and A0a are,respectively, the induced and spontaneous Einsteincoefficients between the ground (o) and excited (a)states:
A0a ¼ 8po3jd0aj2ne0nph0ð1� neaÞð1� nphaÞ=3hc3;
B0a ¼ c3;
A0a=pho3;
B0a ¼ c3A0a=pho3: ð25Þ
Here ne0 and nph0 correspond to the Fermi–Diracand Bose–Einstein carrier distribution of the groundstate for electronic and vibration states, respectively.This expression takes into account the influenceof pump power density through the photoinducedphonons. We considered 88 coupled IR phononoscillators and, as a consequence, needed to resolve aset of 88 differential equations with appropriate borderconditions.
In order to understand the temperature dependences,we considered the contributions of both harmonic, aswell as anharmonic, EP subsystems:
B�ðOkÞ ¼ CZxgðrdlÞCZx
g0ðrd0
l0 ÞImGgg0
DD0 ðrdl; O
2kÞ; (26)
where Ggg0
DD0 ðrdlÞ is the Green function (g and g0 are
numbers of the coordination sphere ) defined as
Ggg0
DD0 ðrDl Þ ¼
Xj
fhjV e2phðriÞjji
hjjdjxi þ hZjdjji
hjjV e2phðriÞjxigðEx � EZÞ�1: ð27Þ
The resulting expression is given below:
Ggg0
DD0 ðrdl;O
2kÞ ¼
XO
Kg0
D0 ðrDl ÞK
gD0 ðr
Dl ÞðO
2k � O2 � id�1;
(28)
where the coordinates KgD0 ðr
Dl Þ are obtained for a given
averaged level of phonons. Numerical calculations weremade with accuracy up to 0.019H.
To include the UV-induced lattice deformationswithin the Green function, we took into accountdeformation localization allowing us to apply the Dysonrelations [10,11].
The potential operator U was determined by the PIpotential deformation and corresponding disturbancecaused by the charge defect. Thus
Ggg0
DD0 ð1Þ ¼ Ggg0
DD0 ð0Þ þ Ggg0
DD0 ð0ÞUGgg0
DD0 ð1Þ; (29)
where Ggg0
DD0 ð0Þ is the Green function for harmonicsubsystems, and G
gg0
DD0 ð1Þ is the Green function forsubsystems disturbed by the anharmonic electron-phonon potential U :
Coming out from the performed calculations we havefound that the local photoinduced charge densitydistribution is changed substantially different withoutand with the inclusion of the harmonic (cf. Figs. 2 and 3)and anharmonic (see Fig. 4) EP interactions. Onecan clearly see that the inclusion of the anharmonic

ARTICLE IN PRESS
Fig. 4. Photoinduced changes of the electrostatic potential with
inclusion of the anharmonic EPI.
Fig. 5. Theoretically simulated dependences of the absorption in the
ZnSe–Co2+ crystalline systems versus Co content and pump power of
the source laser. The content data should be multiplied by 1017.
Z. Mierczyk et al. / Optics & Laser Technology 38 (2006) 558–564564
EP sub-systems leads to substantial re-building of thelocal photoinduced charge density. Such re-buildingcause also a shift of the equilibrium atom positions. Thepresented calculations are given at pump density powerabout 1GW/cm2, however the general tendency issimilar for the other power densities.
Finally in Fig. 5 we have presented the behavior of theabsorption calculated by an approach described aboveversus the pump power and content of the Co2+. Morecrucial seems to be an existence of the minimum inabsorption, which is shifted versus pump power.
We have evaluated that the value of the minimum isshifted from 2.1 to 1.4� 1019 cm�3. It is necessary toemphasize that the neglecting of the EP anharmonicphotoinduced contribution leads to vanishing of the
minima observed in the Fig. 5. At the same time theexperimental data (see Table 1) clearly show theexistence of the minimum in the content dependences.Increasing the pump power densities this minimum maybe a bit shifted. Some discrepancies between theexperimental and theoretical data may indicate on thenon-adequate modeling of the processes, howeverprincipally the occurrence of the minimum is unam-biguously associated with the photoinduced anharmonicEP interactions.
6. Conclusions
Using molecular dynamics and band structure simu-lations with inclusion of the photoinduced EP anhar-monicity we have revealed theoretically existence of theminimum in absorption, which is shifted versus pumppower. We have evaluated that the value of theminimum is shifted from 2.1 to 1.4� 1019 cm�3. It isnecessary to emphasize that the neglecting of the EPanharmonic photoinduced contribution leads to vanish-ing of the minima observed experimentally. Somediscrepancies between the experimental and theoreticalabsolute values may indicate on the non-adequatemodeling of the processes observed, however principallythe occurrence of the minimum is unambiguouslyassociated with the photoinduced anharmonic EPinteractions.
Acknowledgments
This work was supported by Polish State Committeeon Science—project No. 0 T00A 013 22.
References
[1] Mierczyk Z, Majchrowski A, Kityk IV, Gruhn W. Opt Laser
Technol V 2003;35:169.
[2] Burshtein Z, Shimony Y, Feldman R, Krupkin V, Glushko A,
Galun E. Opt Mater V 2001;15:285.
[3] Birnbaum M, Camargo MB, Lee S, Unlu F, Stultz RD. OSA
TOPS, vol. 10, Advanced Solid State Lasers; 1997. p. 148.
[4] Go"ab S, Mierczyk Z, Ryba-Romanowski W. Phys Stat Sol A
2000;179:463.
[5] Stultz RD, Camargo MD, Birnbaum M. OSA Proceedings on
Advanced Solid-State Lasers, vol. 24; 1995; p. 460.
[6] Demianiuk M. Mater Res Bull 1990;25:337.
[7] Bachelet GB, Hamann DR, Schluter M. Phys Rev B 1982;26:
4199.
[8] Kityk IV. Semicond Sci Technol V 2003;18:1001.
[9] Kityk IV, Kasperczyk J, Andrievskii BV. Phys Lett V 1996;
216A:161.
[10] Kityk IV. Comput Mater Sci V 2003;27:342.
[11] Kityk IV. Mater Lett V 2003;57:342.
[12] Kaddouri H, Benet S, Charar S, Makowska-Janusik M, Tadenac
JC, Kityk IV. Phys Rev B 2000;62:17108.


